10,000 Matching Annotations
  1. Nov 2024
    1. eLife Assessment

      This important study compares the cortical projections to primary motor and sensory areas originating from the ipsilateral and contralateral hemispheres. They find that, while there is substantial symmetry between the two hemispheres regarding the areas sending projections to these primary cortical areas, contra-hemispheric projections had more inputs from layer 6 neurons than ipsi-projecting ones. The evidence is convincing and most of the conclusions are supported by rigorous analyses.

    2. Reviewer #1 (Public review):

      Weiler, Teichert, and Margrie systematically analyzed long-range cortical connectivity, using a retrograde viral tracing strategy to identify layer and region-specific cortical projections onto the primary visual, primary somatosensory, and primary motor cortices. Their analysis revealed several hundred thousand inputs into each region, with inputs originating from almost all cortical regions but dominated in number by connections within cortical sub-networks (e.g. anatomical modules). Generally, the relative areal distribution of contralateral inputs followed the distribution of corresponding ipsilateral inputs. The largest proportion of inputs originated from layer 6a cells, and this layer 6 dominance was more pronounced for contralateral than ipsilateral inputs, which suggests that these connections provide predominantly feedback inputs. The hierarchical organization of input regions was similar between ipsi- and contralateral regions, except for within-module connections, where ipsilateral connections were much more feed-forward than contralateral. These results contrast earlier studies which suggested that contralateral inputs only come from the same region (e.g. V1 to V1) and from L2/3 neurons. Thus, these results provide valuable data supporting a view of interhemispheric connectivity in which layer 6 neurons play an important role in providing modulatory feedback.

      The conclusions of this paper are mostly well-supported by the data and analysis, but additional consideration of possible experimental biases is needed.

      Further discussion or analysis is needed about possible biases in uptake efficiency for different cell types. Is it possible that the nuclear retro-AAV has a tropism for layer 6 axons? Quantitative comparisons with results obtained with alternative methods such as rabies virus (Yao et al., 2023) or anterograde tracing (Harris et al., 2019) may be helpful for this.

      Quantitative analysis of the injection sites should be included to account for possible biases. For example, L6 neurons are known to be the main target of contralateral inputs into the visual cortex (Yao et al., 2023). Thus, if the injections are biased towards or against layer 6 neurons, this may change the layer distribution of retrogradely labeled input cells. Comparison across biological replicates may help reveal sensitivity to particular characteristics of the injections.

      The possibility of labeling axons of passage within the white matter should be addressed. This could potentially lead to false positive connections, contributing to the broad connectivity from most cortical regions that were observed.

    3. Reviewer #2 (Public review):

      Summary:

      Weiler et al use retrograde tracers, two-photon tomography, and automatic cell detection to provide a detailed quantitative description of the laminar and area sources of ipsi- and contralateral cortico-cortical inputs to two primary sensory areas and a primary motor area. They found considerable bilateral symmetry in the areas providing cortico-cortical inputs. However, although the same regions in both hemispheres tended to supply inputs, a larger proportion of inputs from contralateral areas originated from deeper layers (L5 and L6).

      Strengths:

      The study applies state-of-the-art anatomical methods, and the data is very effectively presented and carefully analyzed. The results provide many novel insights into the similarities and differences of inputs from the two hemispheres. While over the past decade there have been many studies quantitively and comprehensively describing cortico-cortical connections, by directly comparing inputs from the ipsi and contralateral hemispheres, this study fills in an important gap in the field. It should be of great utility and an important reference for future studies on inter-hemispheric interactions.

      Weaknesses:

      Overall, I do not find any major weakness in the analyses or their interpretation. However, one must keep in mind that the study only analyses inputs projecting to three areas. This is not an inherent flaw of the study; however, it warrants caution when extrapolating the results to callosal projections terminating in other areas. As inputs to two primary sensory areas and one is the primary motor cortex are studied, some of the conclusions could potentially be different for inputs terminating in high-order sensory and motor areas. Given that primary areas were injected, there are few instances of feedforward connections sampled in the ipsilateral hemisphere. The study finds that while ipsi-projections from the visual cortex to the barrel cortex are feedforward given its fILN values, those from the contralateral visual cortex are feedback instead. One is left to wonder whether this is due to the cross-modal nature of these particular inputs and whether the same rule (that contralateral inputs consistently exhibit feedback characteristics regardless of the hierarchical relationship of their ipsilateral counterparts with the target area,) would also apply to feedforward inputs within the same sensory cortices.

      Another issue that is left unexplored is that, in the current analyses the barrel and primary visual cortex are analyzed as a uniform structure. It is well established that both the laminar sources of callosal inputs and their terminations differ in the monocular and binocular areas of the visual cortex (border with V2L). Similarly, callosal projections differ when terminating the border of S1 (a row of whiskers), and then in other parts of S1. Thus, some of the conclusions regarding the laminar sources of callosal inputs might depend on whether one is analyzing inputs terminating or originating in these border regions.

      Finally, while the paper emphasizes that projections from L6 "dominate" intra and contralateral cortico-cortical inputs, the data shows a more nuanced scenario. While it is true that the areas for which L6 neurons are the most common source of cortico-cortical projections are the most abundant, the picture becomes less clear when considering the number of neurons sending these connections. In fact, inputs from L2/3 and L5 combined are more abundant than those from L6 (Figure 3B), challenging the view that projections from L6 dominate ipsi- and contralateral projecting cortico-cortical inputs.

    1. eLife Assessment

      This manuscript provides important structural insights into the recognition and degradation of the host tRNA methyltransferase TRMT1 by SARS-CoV-2 protease nsp5 (Mpro). The data provide compelling support for the main conclusions of the authors. These results will be of interest to researchers studying structures, substrate recognition and specificity of viral proteases and their action on cellular targets.

    2. Reviewer #1 (Public review):

      D'Oliviera et al. have demonstrated cleavage of human TRMT1 by the SARS-CoV-2 main protease in vitro. Following, they solved the structure of Mpro (Nsp5)-C145A bound to TRMT1 substrate peptide, revealing binding conformation distinct from most viral substrates. Overall, this work enhances our understanding of substrate specificity for a key drug target of CoV2. The paper is well-written and the data is clearly presented. It complements the companion article by demonstrating interaction between Mpro and TRMT1, as well as TRMT1 cleavage under isolated conditions in vitro. They show that cleaved TRMT1 has reduced tRNA binding affinity, linking a functional consequence to TRMT1 cleavage by MPro. Importantly, the revelation for flexible substrate binding of Nsp5 is fundamental for understanding Nsp5 as a drug target. Trmt1 cleavage assays by Mpro revealed similar kinetics for TRMT1 cleavage as compared to nsp8/9 viral polyprotein cleavage site. They purify TRMT1-Q350K, in which there is a mutation in the predicted cleavage consensus sequence, and confirm that it is resistant to cleavage by recombinant Mpro. I am unable to comment critically on the structural analyses as it is outside of my expertise. Overall, I think that these findings are important for confirming TRMT1 as a substrate of Mpro, defining substrate binding and cleavage parameters for an important drug target of SARS-CoV-2, and may be of interest to researchers studying RNA modifications.

    3. Reviewer #2 (Public review):

      Summary:

      The manuscript 'Recognition and Cleavage of Human tRNA Methyltransferase TRMT1 by the SARS-CoV-2 Main Protease' from Angel D'Oliviera et al., uncovers that TRMT1 can be cleaved by SARS-CoV-2 main protease (Mpro) and defines the structural basis of TRMT1 recognition by Mpro. They use both recombinant TRMT1 and Mpro as well as endogenous TRMT1 from HEK293T cell lysates to convincingly show cleavage of TRMT1 by the SARS-CoV-2 protease. Using in vitro assays, the authors demonstrate that TRMT1 cleavage by Mpro blocks its enzymatic activity leading to hypomodification of RNA. To understand how Mpro recognizes TRMT1, they solved a co-crystal structure of Mpro bound to a peptide derived from the predicted cleavage site of TRMT1. This structure revealed important protein-protein interfaces and highlights the importance of the conserved Q530 for cleavage by Mpro. They then compare their structure with previous X-ray crystal structures of Mpro bound to substrate peptides derived from the viral polyprotein and propose the concept of two distinct binding conformations to Mpro: P3´-out and P3´-in conformations (here P3´ stands for the third residue downstream of the cleavage site). It remains unknown what is the physiological role of these two binding conformations on Mpro function, but the authors established that Mpro has dramatically different cleavage efficiencies for three distinct substrates. In an effort to rationalize this observation, a series of mutations in Mpro's active site and the substrate peptide were tested but unexpectedly had no significant impact on cleavage efficiency. While molecular dynamic simulations further confirmed the propensity of certain substrates to adopt the P3´-out or P3´-in conformation, it did not provide additional insights into the dramatic differences in cleavage efficiencies between substrates. This led the authors to propose that the discrimination of Mpro for preferred substrates might occur at a later stage of catalysis after binding of the peptide. Overall, this work will be of interest to biologists studying proteases and substrate recognition by enzymes and RNA modifications as well as help efforts to target Mpro with peptide-like drugs.

      Strengths:

      • The authors' statements are well supported by their data, and they used relevant controls when needed. Indeed, they used the Mpro C145A inactive variant to unambiguously show that the TRMT1 cleavage detected in vitro is solely due to Mpro's activity. Moreover, they used two distinct polyclonal antibodies to probe TRMT1 cleavage.<br /> • They demonstrate the impact of TRMT1 cleavage on RNA modification by quantifying both its activity and binding to RNA.<br /> • Their 1.9 Å crystal structure is of high quality and increases the confidence in the reported protein-protein contacts seen between TRMT1-derived peptide and Mpro.<br /> • Their extensive in vitro kinetic assay was performed in ideal conditions although it is sometimes unclear how many replicates were performed.<br /> • They convincingly show how Mpro cleavage is conserved among most but not all mammalian TRMT1 bringing an interesting evolutionary perspective on virus-host interactions.<br /> • The authors test multiple hypotheses to rationalize the preference of Mpro for certain substrates.<br /> • While this reviewer is not able to comment on the rigor of the MD simulations, the interpretations made by the authors seem reasonable and convincing.<br /> • The concept of two binding conformations (P3´-out or P3´-in) for the substrate in the active site of Mpro is significant and can guide drug design.

      Weaknesses:

      • The two polyclonal antibodies used by the authors seem to have strong non-specific binding to proteins other than TRMT1 but did not impact the author's conclusions or statements. This is a limitation of the commercially available antibodies for TRMT1.<br /> • Despite the reasonable efforts of the authors, it remains unknown why Mpro shows higher cleavage efficiency for the nsp4/5 sequence compared to TRMT1 or nsp8/9 sequences. This is a challenging problem that will take substantially more effort by several labs to decipher mechanistically.<br /> • The peptide cleavage kinetic assay used by the authors relies on a peptide labelled with a fluorophore (MCA) on the N-terminus and a quencher (Dpn) on the C-terminus. This design allows high-throughput measurements compatible with plate readers and is a robust and convenient tool. Nevertheless, the authors did not control for the impact of the labels (MCA and Dpn) on the activity of Mpro. While in most cases the introduced fluorophore/quencher do not impact activity, sometimes it can.<br /> • An unanswered question not addressed by the authors is if the peptides undergo conformational changes upon Mpro binding or if they are pre-organized to adopt the P3´-out and P3´-in conformations. This might require substantially more work outside the scope of this immediate article.

    4. Reviewer #3 (Public review):

      Summary:

      In this manuscript, the authors have used a combination of enzymatic, crystallographic, and in silico approaches to provide compelling evidence for substrate selectivity of SARS-CoV-2 Mpro for human TRMT1.

      Strengths:

      In my opinion, the authors came close to achieving their intended aim of demonstrating the structural and biochemical basis of Mpro catalysis and cleavage of human TRMT1 protein. The revised version of the manuscript has addressed most of the questions I had posed in my earlier review.

      Weaknesses:

      Although several new hypotheses are generated from the Mpro structural data, the manuscript falls a bit short of testing them in functional assays, which would have solidified the conclusions the authors have drawn.

    5. Author response:

      The following is the authors’ response to the current reviews.

      Public Reviews:

      Reviewer #1 (Public review):

      D'Oliviera et al. have demonstrated cleavage of human TRMT1 by the SARS-CoV-2 main protease in vitro. Following, they solved the structure of Mpro (Nsp5)-C145A bound to TRMT1 substrate peptide, revealing binding conformation distinct from most viral substrates. Overall, this work enhances our understanding of substrate specificity for a key drug target of CoV2. The paper is well-written and the data is clearly presented. It complements the companion article by demonstrating interaction between Mpro and TRMT1, as well as TRMT1 cleavage under isolated conditions in vitro. They show that cleaved TRMT1 has reduced tRNA binding affinity, linking a functional consequence to TRMT1 cleavage by MPro. Importantly, the revelation for flexible substrate binding of Nsp5 is fundamental for understanding Nsp5 as a drug target. Trmt1 cleavage assays by Mpro revealed similar kinetics for TRMT1 cleavage as compared to nsp8/9 viral polyprotein cleavage site. They purify TRMT1-Q350K, in which there is a mutation in the predicted cleavage consensus sequence, and confirm that it is resistant to cleavage by recombinant Mpro. I am unable to comment critically on the structural analyses as it is outside of my expertise. Overall, I think that these findings are important for confirming TRMT1 as a substrate of Mpro, defining substrate binding and cleavage parameters for an important drug target of SARS-CoV-2, and may be of interest to researchers studying RNA modifications.

      We thank the reviewer for their positive assessment and summary of our work in this paper!

      Reviewer #2 (Public review):

      Summary:

      The manuscript 'Recognition and Cleavage of Human tRNA Methyltransferase TRMT1 by the SARS-CoV-2 Main Protease' from Angel D'Oliviera et al., uncovers that TRMT1 can be cleaved by SARS-CoV-2 main protease (Mpro) and defines the structural basis of TRMT1 recognition by Mpro. They use both recombinant TRMT1 and Mpro as well as endogenous TRMT1 from HEK293T cell lysates to convincingly show cleavage of TRMT1 by the SARS-CoV-2 protease. Using in vitro assays, the authors demonstrate that TRMT1 cleavage by Mpro blocks its enzymatic activity leading to hypomodification of RNA. To understand how Mpro recognizes TRMT1, they solved a co-crystal structure of Mpro bound to a peptide derived from the predicted cleavage site of TRMT1. This structure revealed important protein-protein interfaces and highlights the importance of the conserved Q530 for cleavage by Mpro. They then compare their structure with previous X-ray crystal structures of Mpro bound to substrate peptides derived from the viral polyprotein and propose the concept of two distinct binding conformations to Mpro: P3´-out and P3´-in conformations (here P3´ stands for the third residue downstream of the cleavage site). It remains unknown what is the physiological role of these two binding conformations on Mpro function, but the authors established that Mpro has dramatically different cleavage efficiencies for three distinct substrates. In an effort to rationalize this observation, a series of mutations in Mpro's active site and the substrate peptide were tested but unexpectedly had no significant impact on cleavage efficiency. While molecular dynamic simulations further confirmed the propensity of certain substrates to adopt the P3´-out or P3´-in conformation, it did not provide additional insights into the dramatic differences in cleavage efficiencies between substrates. This led the authors to propose that the discrimination of Mpro for preferred substrates might occur at a later stage of catalysis after binding of the peptide. Overall, this work will be of interest to biologists studying proteases and substrate recognition by enzymes and RNA modifications as well as help efforts to target Mpro with peptide-like drugs.

      We thank the reviewer for this thorough and accurate summary of our work in this manuscript.

      Strengths:

      • The authors' statements are well supported by their data, and they used relevant controls when needed. Indeed, they used the Mpro C145A inactive variant to unambiguously show that the TRMT1 cleavage detected in vitro is solely due to Mpro's activity. Moreover, they used two distinct polyclonal antibodies to probe TRMT1 cleavage.

      • They demonstrate the impact of TRMT1 cleavage on RNA modification by quantifying both its activity and binding to RNA.

      • Their 1.9 Å crystal structure is of high quality and increases the confidence in the reported protein-protein contacts seen between TRMT1-derived peptide and Mpro.

      • Their extensive in vitro kinetic assay was performed in ideal conditions although it is sometimes unclear how many replicates were performed.

      • They convincingly show how Mpro cleavage is conserved among most but not all mammalian TRMT1 bringing an interesting evolutionary perspective on virus-host interactions.

      • The authors test multiple hypotheses to rationalize the preference of Mpro for certain substrates.

      • While this reviewer is not able to comment on the rigor of the MD simulations, the interpretations made by the authors seem reasonable and convincing.

      • The concept of two binding conformations (P3´-out or P3´-in) for the substrate in the active site of Mpro is significant and can guide drug design.

      We thank the reviewer for these positive assessments of manuscript strengths!

      Weaknesses:

      • The two polyclonal antibodies used by the authors seem to have strong non-specific binding to proteins other than TRMT1 but did not impact the author's conclusions or statements. This is a limitation of the commercially available antibodies for TRMT1.

      Yes, there are some levels of non-specific binding for all of the TRMT1 antibodies we have tested (this limitation of commercially available TRMT1 antibodies is also observed and noted by Zhang et al), but we agree that this does not impact the overall conclusions and that by using multiple different antibodies to show the same effects, we can have high confidence in the Western blot analysis and interpretation.

      • Despite the reasonable efforts of the authors, it remains unknown why Mpro shows higher cleavage efficiency for the nsp4/5 sequence compared to TRMT1 or nsp8/9 sequences. This is a challenging problem that will take substantially more effort by several labs to decipher mechanistically.

      True! To our knowledge and despite significant past efforts of many research groups studying similar coronavirus proteases (e.g. SARS-CoV-1 Mpro) a clear understanding of the detailed mechanistic relationship between cleavage sequence and cleavage kinetics remains mostly undefined. This is a great and important problem for mechanistic and computational groups with deep interests in proteases to tackle in the future! To highlight these and similar open questions, we have added a short paragraph to the Discussion section (second from the last paragraph).

      • The peptide cleavage kinetic assay used by the authors relies on a peptide labelled with a fluorophore (MCA) on the N-terminus and a quencher (Dpn) on the C-terminus. This design allows high-throughput measurements compatible with plate readers and is a robust and convenient tool. Nevertheless, the authors did not control for the impact of the labels (MCA and Dpn) on the activity of Mpro. While in most cases the introduced fluorophore/quencher do not impact activity, sometimes it can.

      Yes, we agree that it is possible the MCA and Dnp labels could have effects on the measured cleavage rates. These fluorophore/quencher peptide cleavage assays are the standard assays used by many labs in the protease field to study diverse proteases and diverse cleavage targets. When other labs have compared cleavage kinetic parameters measured with fluorophore/quencher-based peptide cleavage assays versus HPLC-based peptide cleavage assays, these are often found to be quite similar (e.g. Lee, J., Worrall, L.J., Vuckovic, M. et al. Crystallographic structure of wild-type SARS-CoV-2 main protease acyl-enzyme intermediate with physiological C-terminal autoprocessing site. Nat Commun 11, 5877 (2020). https://doi.org/10.1038/s41467-020-19662-4), although there are also examples where differences arise. In any case, we agree there could be some effects on the cleavage kinetics introduced by the fluorophore and/or quencher groups. However, our main focus in this paper is to show how a sequence in the human tRNA-modifying enzyme TRMT1 is cleaved by Mpro (and in this revision we have also added new data to show the functional effects of cleavage on TRMT1 activity); it will take significant future work to fully dissect the detailed relationships between peptide sequence, including the quantitative effects of fluorophore/quencher labels, and protease-directed cleavage kinetics. Based on our work in this paper and many past studies of similar proteases, understanding how peptide sequence or conformation relates to cleavage efficiency is a longer-term and very challenging problem that we view as beyond the scope of this work. We have added a brief section elaborating on this in the Discussion.

      • An unanswered question not addressed by the authors is if the peptides undergo conformational changes upon Mpro binding or if they are pre-organized to adopt the P3´-out and P3´-in conformations. This might require substantially more work outside the scope of this immediate article.

      We agree this is unanswered; we considered additional MD experiments to address this, but ultimately decided that since both of these sequences are cleaved in the context of much larger polypeptides (FL TRMT1 or the viral polypeptide), any simple analysis to assess the possibility of pre-organization and relate this preferred binding conformation to cleavage kinetics would be difficult to interpret in a biologically meaningful way. We think this and similar questions about how pre-organization of peptides or amino acid sequences in the polypeptides might influence protease binding and cleavage activity are interesting and important future questions for protease-focused groups in this field.

      Reviewer #3 (Public review):

      Summary:

      In this manuscript, the authors have used a combination of enzymatic, crystallographic, and in silico approaches to provide compelling evidence for substrate selectivity of SARS-CoV-2 Mpro for human TRMT1.

      Strengths:

      In my opinion, the authors came close to achieving their intended aim of demonstrating the structural and biochemical basis of Mpro catalysis and cleavage of human TRMT1 protein. The revised version of the manuscript has addressed most of the questions I had posed in my earlier review.

      We thank the reviewer for their positive assessment of this work, and we are glad to hear the manuscript revisions were helpful in addressing the first round of reviews and questions.

      Weaknesses:

      Although several new hypotheses are generated from the Mpro structural data, the manuscript falls a bit short of testing them in functional assays, which would have solidified the conclusions the authors have drawn.

      Toward showing some of the functional effects of TRMT1 cleavage, in this revised version of the manuscript we have added new data and a new results section (‘Cleavage of TRMT1 results in complete loss of tRNA m2,2G modification activity and reduced tRNA binding in vitro’) showing that cleavage of TRMT1 results in reduced tRNA binding to TRMT1 (Figure 2D) and the complete loss of TRMT1-mediated tRNA modification activity in vitro (Figure 2C). This complements the in-cell data presented by Zhang et al showing that cleavage of TRMT1 in SARS-CoV-2 infected human cells results in the reduction of m2,2G modification levels. We think these data are a strong addition to this paper that broadens the impacts of our reported results more directly into the RNA modifications field.

      In terms of showing the further, downstream biological effects of TRMT1 cleavage and/or the specific impacts of TRMT1 cleavage on SARS-CoV-2 propagation and replication, while we agree further functional assays could absolutely heighten the overall impact, we view the main focus of our paper as showing how TRMT1 is recognized and cleaved by Mpro at the structural level and characterizing the biochemistry of the TRMT1-Mpro interaction and the effects of cleavage on TRMT1 tRNA-modifying activity. Zhang et al present some cellular data suggesting that loss of TRMT1 and/or TRMT1 cleavage during infection is actually detrimental to SARS-CoV-2 replication and infectivity. However, a full understanding of how TRMT1-mediated m2,2G modification of tRNA impacts viral translation, whether TRMT1 plays other roles during the viral life cycle, or whether TRMT1 cleavage (even if not important for viral fitness) contributes to cellular phenotypes during infection, will take a significant amount of future cell biology and virology work to unravel. Indeed, our understanding is that characterizing some of the endogenous cleavage targets for the HIV protease and determining the downstream biological effects and impacts on HIV infection took well over a decade. We hope that the biochemical and structural characterization of the Mpro-TRMT1 interaction presented in our paper will provide the necessary fundamental groundwork and impetus for future virology and cellular biochemistry studies to further investigate the biological roles of TRMT1 cleavage by SARS-CoV-2 Mpro.

      ---

      The following is the authors’ response to the original reviews.

      eLife Assessment:

      This manuscript provides important structural insights into the recognition and degradation of the host tRNA methyltransferase by SARS-CoV-2 protease nsp5 (Mpro). The data convincingly support the main conclusions of the paper. These results will be of interest to researchers studying structures and substrate recognition and specificity of viral proteases.

      We thank the eLife editors and reviewers for handling this manuscript and the overall positive assessment of our work.

      In this revised version of the manuscript we have included significant, new experimental data with recombinant purified, catalytically active TRMT1 that directly shows cleavage of TRMT1 reduces its tRNA binding affinity (by gel shift assays) and results in the complete loss of tRNA modifying activity in vitro (by radiolabel-based methyltransferase assays). Because these added experiments provide new information about how Mpro-mediated cleavage specifically impacts TRMT1 tRNA binding and m2,2G modification activity, and thus new information about the functional effects of loss of the TRMT1 Zn finger domain, we would strongly suggest adding that “this work may be of interest to researchers studying RNA modifications”, or a similar phrase, in the eLife assessment.

      Please find below our point-by-point response to each of the reviewer comments, which outlines additional changes to the manuscript.

      Public Reviews:

      Reviewer #1 (Public Review):

      D'Oliviera et al. have demonstrated cleavage of human TRMT1 by the SARS-CoV-2 main protease in vitro. Following this, they solved the structure of Mpro-C145A bound to TRMT1 substrate peptide, revealing binding conformation distinct from most viral substrates. Overall, this work enhances our understanding of substrate specificity for a key drug target of CoV2. The paper is well-written and the data is clearly presented. It complements the companion article by demonstrating the interaction between Mpro and TRMT1 and TRMT1 cleavage under isolated conditions in vitro. Importantly, the revelation of flexible substrate binding of Nsp5 is fundamental for understanding Nsp5 as a drug target. Trmt1 cleavage assays revealed similar kinetics for TRMT1 cleavage as compared to the nsp8/9 viral polyprotein cleavage site, however, it would have been more rigorous for the authors to independently reproduce the kinetics reported for nsp8/9 using their specific experimental conditions. The finding that murine TRMT1 lacks a conserved consensus sequence is interesting, but is not experimentally tested here and is reported elsewhere. I am unable to comment critically on the structural analyses as it is outside of my expertise. Overall, I think that these findings are important for confirming TRMT1 as a substrate of Mpro and defining substrate binding and cleavage parameters for an important drug target of SARS-CoV-2.

      We thank the reviewer for their positive assessment and summary of our work in this paper!

      We absolutely agree that comparing to nsp8/9 cleavage kinetics measured in our own hands would be more rigorous here, and we have carried out these measurements in triplicate under the same conditions as were used to measure all the other peptide cleavage kinetics in this manuscript. Figures 5A & B (as well as Table S3 and Dataset S2) have been updated with our new nsp8/9 kinetic data (kcat = 0.019 +/- 0.002 s-1 and KM = 40 +/- 7.5 µM). As expected, our newly measured nsp8/9 kinetic parameters are very similar to those that we had previously cited from MacDonald et al (kcat = 0.013 +/- 0.001 s-1, KM = 36 +/- 6.0 µM), and show that Mpro-mediated TRMT1 peptide cleavage has similar proteolysis kinetics to the nsp8/9 viral polypeptide cleavage site.

      We have also purified full-length human TRMT1 Q530K, which is the key change in the cleavage consensus sequence that likely makes murine TRMT1 resistant to Mpro-mediated cleavage. In in vitro cleavage assays we find that indeed TRMT1 Q530K is entirely resistant to cleavage by recombinant Mpro and we have added this data to the manuscript in Figure 6D. These findings are consistent with previously cited data from Lu et al, which suggest mouse and hamster TRMT1 are not cleaved in HEK293T cells expressing Mpro.

      With the addition of the TRMT1 Q530K mutant data, we decided to move the evolutionary analysis together with this kinetic data to a new section in the Results. We think these additions and changes make the paper stronger and clearer, and thank the reviewer for these suggestions!

      Reviewer #2 (Public Review):

      Summary:

      The manuscript 'Recognition and Cleavage of Human tRNA Methyltransferase TRMT1 by the SARS-CoV-2 Main Protease' from Angel D'Oliviera et al., uncovers that TRMT1 can be cleaved by SARS-CoV-2 main protease (Mpro) and defines the structural basis of TRMT1 recognition by Mpro. They use both recombinant TRMT1 and Mpro as well as endogenous TRMT1 from HEK293T cell lysates to convincingly show cleavage of TRMT1 by the SARS-CoV-2 protease. To understand how Mpro recognizes TRMT1, they solved a co-crystal structure of Mpro bound to a peptide derived from the predicted cleavage site of TRMT1. This structure revealed important protein-protein interfaces and highlights the importance of the conserved Q530 for cleavage by Mpro. They then compared their structure with previous X-ray crystal structures of Mpro bound to substrate peptides derived from the viral polyprotein and proposed the concept of two distinct binding conformations to Mpro: P3´-out and P3´-in conformations (here P3´ stands for the third residue downstream of the cleavage site). It remains unknown what is the physiological role of these two binding conformations on Mpro function, but the authors established that Mpro has dramatically different cleavage efficiencies for three distinct substrates. In an effort to rationalize this observation, a series of mutations in Mpro's active site and the substrate peptide were tested but unexpectedly had no significant impact on cleavage efficiency. While molecular dynamic simulations further confirmed the propensity of certain substrates to adopt the P3´-out or P3´-in conformation, they did not provide additional insights into the dramatic differences in cleavage efficiencies between substrates. This led the authors to propose that the discrimination of Mpro for preferred substrates might occur at a later stage of catalysis after binding of the peptide. Overall, this work will be of interest to biologists studying proteases and substrate recognition by enzymes as well as help efforts to target Mpro with peptide-like drugs.<br />

      We thank the reviewer for this thorough and accurate summary of our work in this manuscript.

      Strengths:

      • The authors' statements are well supported by their data, and they used relevant controls when needed. Indeed, they used the Mpro C145A inactive variant to unambiguously show that the TRMT1 cleavage detected in vitro is solely due to Mpro's activity. Moreover, they used two distinct polyclonal antibodies to probe TRMT1 cleavage.

      • Their 1.9 Å crystal structure is of high quality and increases the confidence in the reported protein-protein contacts seen between TRMT1-derived peptide and Mpro.

      • Their extensive in vitro kinetic assay was performed in ideal conditions although it is unclear how many replicates were performed.

      • The authors test multiple hypotheses to rationalize the preference of Mpro for certain substrates.

      • While this reviewer is not able to comment on the rigor of the MD simulations, the interpretations made by the authors seem reasonable and convincing.

      • The concept of two binding conformations (P3´-out or P3´-in) for the substrate in the active site of Mpro is significant and can guide drug design.

      We thank the reviewer for these positive assessments of manuscript strengths!

      Weaknesses:

      • While the authors convincingly show that TRMT1 is cleaved by Mpro, the exact cleavage site was never confirmed experimentally. It is most likely that the predicted site is the main cleavage site as proposed by the authors (region 527-534). Nevertheless, in Fig 1C (first lane from the right) there are two bands clearly observed for the cleavage product containing the MT Domain. If the predicted site was the only cleavage site recognized by Mpro, then a single band for the MT domain would be expected. This observation suggests that there might be two cleavage sites for Mpro in TRMT1. Indeed, residues RFQANP (550-555) in TRMT1 might be a secondary weaker cleavage site for Mpro, which would explain the two observed bands in Fig 1C. A mass spectrometry analysis of the cleaved products would clarify this.

      We agree with the reviewer that based on the originally presented data it is possible there could be an additional Mpro-targeted cleavage site in TRMT1 beyond the 527-534 region that we validated through peptide cleavage assays of the TRMT1 526-536 peptide. Because it may be difficult to unambiguously identify and differentiate other putative cleavage sites that are nearby to 527-534 (e.g. the suggested possibility of 550-555) by mass spectrometry, we instead carried out additional in vitro cleavage assays with purified FL TRMT1 Q530K. Mutation of the invariant P1 Gln residue in the cleavage sequence is expected to prevent cleavage at this site, and allow us to probe whether there are other sites in TRMT1 that can be cleaved by Mpro (and if so, more straightforwardly identify them by mass spectrometry). We compared cleavage of purified WT FL TRMT1 and FL TRMT1 Q530K with recombinant Mpro in in vitro cleavage assays and found that TRMT1 Q530K is not cleaved by Mpro over the course of a 2h cleavage reaction. In these experiments, we also saw clear cleavage of WT FL TRMT1 over the course of 2h into only a single detectable band. Together, both of these pieces of data strongly suggest that the 527-534 region is the only Mpro-targeted cleavage site in TRMT1 (if there was an additional cleavage site, we should have seen some amount of cleavage in the Q530K mutant, but we do not). Overall, we feel that the updated WT and Q530K experiments clearly demonstrate that there is only one Mpro-mediated cleavage site in human TRMT1, which also is consistent with experiments in Zhang et al showing that Q530N mutations also block TRMT1 cleavage by co-expressed Mpro in human cells.

      The updated WT and Q530K cleavage assays have been added to the manuscript in Figure 6D.

      • A control is missing in Fig 1D. Since the authors use western blots to show the gradual degradation of endogenous TRMT1, a control with a protein that does not change in abundance over the course of the measurement is important. This is required to show that the differences in intensity of TRMT1 by western blotting are not due to loading differences etc.

      Yes, we agree this is an important control and have repeated these experiments and blotted for TRMT1 and GAPDH as a loading control. The updated Western blots are now shown in Figure 2B, and show the same result as the older data.

      • The two polyclonal antibodies used by the authors seem to have strong non-specific binding to proteins other than TRMT1 but did not impact the author's conclusions. This is a limitation of the commercially available antibodies for TRMT1, and unless the authors select a new monoclonal antibody specific to TRMT1 (costly and lengthy process), this limitation seems out of their control.

      Yes, there are some levels of non-specific binding for all of the TRMT1 antibodies we have tested (this limitation of commercially available TRMT1 antibodies is also observed and noted by Zhang et al), but we agree that this does not impact the overall conclusions and that by using multiple different antibodies to show the same effects, we can have high confidence in the Western blot analysis and interpretation.

      • The recombinantly purified TRMT1 seems to have some non-negligible impurities (extra bands in Fig 1C). This does not impact the conclusions of the authors but might be relevant to readers interested in working with TRMT1 for biochemical, structural, or other purposes.

      Yes, our initial isolations of recombinant TRMT1 for the first version of this paper produced smaller amounts of TRMT1 with some impurities; we agree that these do not impact the conclusions of the cleavage experiments. However, since our first submission, we have optimized our purification protocols for TRMT1 and are now able to obtain larger quantities of higher purity recombinant human TRMT1 from bacterial cells and we have used this material for the TRMT1 activity and tRNA binding assays added in this revision; we have also included updates to the expression and purification section for recombinant TRMT1. We hope that these improvements will be helpful to readers interested in working on TRMT1.

      • Despite the reasonable efforts of the authors, it remains unknown why Mpro shows higher cleavage efficiency for the nsp4/5 sequence compared to TRMT1 or nsp8/9 sequences.

      True! To our knowledge and despite significant past efforts of many research groups studying similar coronavirus proteases (e.g. SARS-CoV-1 Mpro) a clear understanding of the detailed mechanistic relationship between cleavage sequence and cleavage kinetics remains mostly undefined. This is a great and important problem for mechanistic and computational groups with deep interests in proteases to tackle in the future! To highlight these and similar open questions, we have added a short paragraph to the Discussion section (second from the last paragraph).

      • The peptide cleavage kinetic assay used by the authors relies on a peptide labelled with a fluorophore (MCA) on the N-terminus and a quencher (Dpn) on the C-terminus. This design allows high-throughput measurements compatible with plate readers and is a robust and convenient tool. Nevertheless, the authors did not control for the impact of the labels (MCA and Dpn) on the activity of Mpro. It is possible that the differences in cleavage efficiencies between peptides are due to unexpected conformational changes in the peptide upon labelling. Moreover, the TRMT1 peptide has an E at the N-terminus and an R at the C-terminus (while the nsp4/5 peptide has an S and M, respectively). It is possible that these two terminal residues form a salt bridge in the TRMT1 peptide that might constrain the conformation of the peptide and thus reduce its accessibility and cleavage by Mpro. Enzymatic assays in the absence of labels and MD simulations with the bona fide peptides (including the labels) used in the kinetic measurements are needed to prove that the cleavage efficiencies are not biased by the fluorescence assay.

      These fluorophore/quencher peptide cleavage assays are the standard assays used by many labs in the protease field to study diverse proteases and diverse cleavage targets. When other labs have compared cleavage kinetic parameters measured with fluorophore/quencher-based peptide cleavage assays versus HPLC-based peptide cleavage assays, these are often found to be quite similar (e.g. Lee, J., Worrall, L.J., Vuckovic, M. et al. Crystallographic structure of wild-type SARS-CoV-2 main protease acyl-enzyme intermediate with physiological C-terminal autoprocessing site. Nat Commun 11, 5877 (2020). https://doi.org/10.1038/s41467-020-19662-4), although there are also examples where differences arise. In any case, we agree there could be some effects on the cleavage kinetics introduced by the fluorophore and/or quencher groups or sequence-specific conformational preferences of the peptides. However, because our main focus in this paper is to show how a sequence in the human tRNA-modifying enzyme TRMT1 is cleaved by Mpro (and in this revision we have also added new data to show the functional effects of cleavage on TRMT1 activity), and the broad focus of our lab is understanding the mechanisms controlling the function and activity of RNA-modifying enzymes, we will leave it to other labs focused more specifically on protease biochemistry to fully dissect the detailed relationships between peptide sequence and conformation to protease-directed cleavage kinetics. As discussed above, based on our work in this paper and many past studies of similar proteases, understanding how sequence relates to cleavage efficiency is a longer-term and very challenging problem that we view as beyond the scope of this work. As noted above, we have added a brief section explaining this in the Discussion.

      • The authors used A431S variant in TRMT1-derived peptide to disrupt the P3´-in conformation. While this reviewer agrees with the rationale behind A431S design, it is important to confirm experimentally that the mutation disrupted the P3´-in conformation in favor of the P3´-out conformer. The authors could use their MD simulations to determine if the TRMT1 A431S variant favors the P3´-out conformation.

      Thank you for this suggestion; we agree and have carried out the suggested MD simulations with TRMT1 A531S peptides bound to Mpro. Surprisingly, these simulations suggest that the A531S peptide can still readily adopt the P3’-in conformation by orienting the Ser sidechain in a different way as compared to its positioning in the Mpro-nsp4/5 structure. Since this somewhat changes our interpretation of the results of the A531S kinetic experiments, we have rewritten this section of the manuscript by: (a) removing the ‘TRMT1 mutations predicted to alter peptide binding conformation have little effect on cleavage kinetics’ section in the Results, (b) instead adding several sentences talking about the A531S mutation to the previous section of the results, and including this mutation as another example of how mutations to either Mpro or TRMT1 residues that might be expected to impact cleavage kinetics do not in fact affect cleavage rates, and finally (c) adding the new MD simulation results to the A531S kinetic data in Figure S5 in the Supporting Information. We thank the reviewer for suggesting this important follow-up simulation!

      • An unanswered question not addressed by the authors is if the peptides undergo conformational changes upon Mpro binding or if they are pre-organized to adopt the P3´-out and P3´-in conformations.

      We agree this is unanswered; we considered additional MD experiments to address this, but ultimately decided that since both of these sequences are cleaved in the context of much larger polypeptides (FL TRMT1 or the viral polypeptide), any simple analysis to assess the possibility of pre-organization and relate this preferred binding conformation to cleavage kinetics would be difficult to interpret in a biologically meaningful way. We think this and similar questions about how pre-organization of peptides or amino acid sequences in the polypeptides might influence protease binding and cleavage activity are interesting and important future questions for protease-focused groups in this field.

      • While the authors describe at great length the hydrogen bonds involved in the substrate recognition by Mpro, they occluded to highlight important stacking interactions in this interface. For instance, Phe533 from TRMT1 stacks with Met49 while L529 from TRMT1 packs against His41 of Mpro. Both hydrogen bonding and stacking interactions seem important for TRMT1-derived peptide recognition by Mpro.

      Thank you for these suggestions toward additional structural analysis. We have added a short description of L529 packing in the S2 pocket to the main text and Figure S3B. We have also added a short description of F533 packing in the S3’ pocket to the main text and Figure S3C.

      Reviewer #3 (Public Review):

      Summary:

      In this manuscript, the authors have used a combination of enzymatic, crystallographic, and in silico approaches to provide compelling evidence for substrate selectivity of SARS-CoV-2 Mpro for human TRMT1.

      Strengths:

      In my opinion, the authors came close to achieving their intended aim of demonstrating the structural and biochemical basis of Mpro catalysis and cleavage of human TRMT1 protein. The combination of orthogonal approaches is highly commendable.

      We thank the reviewer for their positive assessment of this work!

      Weaknesses:

      It would have been of high scientific impact if the consequences of TRMT1 cleavage by Mpro on cellular metabolism were provided. Furthermore, assays to investigate the effect of inhibition of this Mpro activity on SARS-CoV-2 propagation and infection would have been extremely useful in providing insights into host- SARS-CoV-2 interactions.

      Toward showing some of the consequences of TRMT1 cleavage, in this revised version of the manuscript we have added new data and a new results section (‘Cleavage of TRMT1 results in complete loss of tRNA m2,2G modification activity and reduced tRNA binding in vitro’) showing that cleavage of TRMT1 results in reduced tRNA binding to TRMT1 (Figure 2D) and the complete loss of TRMT1-mediated tRNA modification activity in vitro (Figure 2C). This complements the in-cell data presented by Zhang et al showing that cleavage of TRMT1 in SARS-CoV-2 infected human cells results in the reduction of m2,2G modification levels. We think these data are a strong addition to this paper that broadens the impacts of our reported results more directly into the RNA modifications field.

      In terms of showing the further, downstream biological effects of TRMT1 cleavage and/or the specific impacts of TRMT1 cleavage on SARS-CoV-2 propagation and replication, while we agree this would absolutely heighten the overall impact, we view the main focus of our paper as showing how TRMT1 is recognized and cleaved by Mpro at the structural level and characterizing the biochemistry of the TRMT1-Mpro interaction and the effects of cleavage on TRMT1 tRNA-modifying activity. Zhang et al present some cellular data suggesting that loss of TRMT1 and/or TRMT1 cleavage during infection is actually detrimental to SARS-CoV-2 replication and infectivity. However, a full understanding of how TRMT1-mediated m2,2G modification of tRNA impacts viral translation, whether TRMT1 plays other roles during the viral life cycle, or whether TRMT1 cleavage (even if not important for viral fitness) contributes to cellular phenotypes during infection, will take a significant amount of future cell biology and virology work to unravel. Indeed, our understanding is that characterizing some of the endogenous cleavage targets for the HIV protease and determining the downstream biological effects and impacts on HIV infection took well over a decade. We hope that the biochemical and structural characterization of the Mpro-TRMT1 interaction presented in our paper will provide the necessary fundamental groundwork and impetus for future virology and cellular biochemistry studies to further investigate the biological roles of TRMT1 cleavage by SARS-CoV-2 Mpro.

      Recommendations for the authors:

      Reviewer #1 (Recommendations For The Authors):

      Please list Mpro alias Nsp5 in the Abstract and Introduction, as this is the nomenclature used in the companion article.

      OK, we have made these changes.

      Reviewer #2 (Recommendations For The Authors):

      In addition to the points mentioned in the public review, this reviewer encourages the authors to address the following points:

      • Citation 14 is important for this work since the authors used multiple structures from that earlier study for comparison. Citation 14 seems outdated since it refers to a preprint that has been published since then in Nat Comm. The authors should cite the peer-reviewed work https://pubmed.ncbi.nlm.nih.gov/35729165/

      Thank you, we have updated this reference.

      • The description of the hydrogen bonds is tedious to read. The authors could instead classify them into two groups. Hydrogen bonds between main chain backbones or hydrogen bonds between side chains. For instance, they mention the contact between Mpro Glu166-TRMT1 Arg528. This can lead to confusion that a salt bridge is formed while these two residues interact only via their main chain backbones. Indeed, the side chain of R528 is exposed to the solvent.

      OK, we have taken this suggestion and tried to simplify and clarify this portion of the text (along with the accompanying structure Figure 3 showing key hydrogen bonds; see below).

      • For Figure 2, please label the residues of the peptide with the TRMT1 numbering. This will help the reader to follow the text while looking at the figure.

      OK we have added the TRMT1 numbering to what is now Figure 3A, and labeled key TRMT1 residues in Figures 3B, C, and D.

      • Fig 2B is important but crowded. The authors could use two panels to show two different views of this interface.

      Thank you for this suggestion, we have split B (now C and D in Figure 3) into two panels, rotated 90 degrees from one another, with each view showing a different subset of TRMT1-Mpro interactions. These updated panels are less crowded, and will hopefully be much clearer to readers.

      • For increased clarity, the authors could color P3´-out in orange and P3´-in teal in Fig 3D.

      OK, we have made this change.

      • Please proofread the method section. There should be a space between values and their units. For example, 20mM HEPES should be 20 mM HEPES.

      Thank you, we have corrected these formatting errors in the methods section of the revised version of the manuscript.

      • The authors did not identify the mechanism for the higher efficiency of nsp4/5 cleavage despite testing several mutants and MD simulations. Did the author consider changes in the network of water molecules that might be identified in the MD simulations?

      We did look at the positioning of waters in nsp4/5 vs nsp8/9 vs TRMT1 MD simulations. In the nsp4/5 simulation we do see a slightly higher density of water molecules positioned at approximately reasonable attack angles for substrate hydrolysis. If we consider water molecules with an attack angle on the scissile amide of 82 – 96 degrees and an attack distance of 4 Å or closer, the probabilities for these conditions in the simulations are: nsp4/5 – 19%, nsp8/9 – 9%, TRMT1 – 6%. More water positioned at reasonable attack positions for nsp4/5 might be consistent with its higher cleavage efficiency, but: (a) these are relatively small differences in water positioning across these 3 Mpro-substrate simulations that would not be enough to clearly explain the large differences in observed kinetics, and (b) hydrolysis happens in the later steps of the catalytic cycle, so to accurately capture this we would likely need to simulate reaction intermediates formed after initial attack of the active site Cys.

      We very much appreciate the reviewer’s enthusiasm in pushing us to understand the mechanistic basis for Mpro-directed cleavage efficiencies, and we would have absolutely loved to figure this out! (As it appears to be a long-standing question in the field!) But as discussed above and in the manuscript, we think that it will take a detailed dissection of different steps in the catalytic cycle to understand where and how this selectivity arises. We will leave it to research groups focused more exclusively on the details of protease biochemistry and simulations of reactive intermediates to take up these significant and long-term challenges!

      • In the PDB deposition, Y154 from chain B should be fixed.

      • In the PDB deposition, some added glycerols seem to conflict. Although this is not important for the biological work discussed in this study, the authors should check if glycerol 403 in chain A and 402, 403 in chain B are properly modeled. Does the density justify placing a glycerol there?

      • In the PDB deposition, there are over 51 RSRZ outliers. The authors should double-check if they cannot fix them with additional refinements. While such outliers in poorly defined linkers are understandable, this is unexpected for well-defined regions in the map.

      We have made a number of updates to our PDB deposition to address the above three points. (1) We have reexamined and tweaked the loop region at Y154 chain B; this region of the structure has relatively poorly defined electron density, but we now have a model where Y154 is no longer a Ramachandran outlier. The PDB model is now free of any Ramachandran outliers. (2) We have reexamined each of the modeled glycerol molecules and removed one of these (GOL 402), which had a weaker fit to the electron density. The remaining two glycerols appear to be well-modeled (omit maps leaving out each glycerol show strong Fo-Fc density that clearly looks like a glycerol in shape, adding each glycerol back into the model decreases Rwork and Rfree, and the refined 2Fo-Fc map fits well to the modeled glycerols). (3) We agree there are a large number of RSRZ outliers in this structure. We have reexamined many of these, and come to the same conclusion as for our original deposition: that most of these result from residues where there is clear enough density for placing the backbone into the map, but very poor density for the sidechain. Modeling different sidechain positions for the RSRZ outliers we reexamined did not appreciably improve the model fit or change their RSRZ outlier status. For example, Y154 in chains A and B remain some of the worst RSRZ outliers; while the density for these loop regions is generally not very good, it is clear that the backbone atoms of Y154 can be modeled into the structure, but there is very very weak density for the sidechain. We tried modeling alternative and/or multiple sidechain conformations for Y154, but this did not significantly reduce the size of the RSRZ outlier. In short, while we could remove some of these residues or truncate the sidechain where the sidechain density is very poor to lower the total number of RSRZ outliers, we think the best model is one where we leave these residues built into the structure and accept the higher number of RSRZ outliers. Importantly, none of the significant RSRZ outliers are key residues of biological interest that would affect our interpretation of the structure and/or TRMT1-Mpro biochemistry.

      We have deposited a new, re-refined PDB model (9DW6) that incorporates these changes and supersedes our old PDB entry (8D35). We have updated the manuscript with the new PDB ID. We thank the reviewer for these suggestions that improved the overall structural model.

      Reviewer #3 (Recommendations For The Authors):

      The crystal structure entry in the PDB should mention the Cys-to-Ala substitution in Mpro.

      Thank you, we have made this change

      Fig 2A and 2B: Can the authors highlight the Gln520-Ala531 peptide bind with a different color, please? It gets lost in panel B.

      Yes, we have made significant revisions to what is now Figure 3, and have highlighted the scissile peptide bond atoms in orange in each of these panels. Thank you for this suggestion, we agree it helps readers to orient themselves within the structure.

      "Importantly, the identified Mpro-targeted residues in human TRMT1 are conserved in the human population (i.e. no missense polymorphisms), showing that human TRMT1 can be recognized and cleaved by SARS-CoV-2 Mpro." Is TRMT1 prone to a high frequency of missense polymorphisms? If so, then this point makes sense. If not, it is not clear if this really informs on any biologically relevant mechanism.

      Given (i) that primate TRMT1 was previously identified under positive selection (i.e. rapid evolution) in an evolutionary screen (Cariou et al PNAS 2022) and (ii) that our study is mostly in vitro, we thought it was important to, first, make sure that this sequence of TRMT1 used in functional assays is not specific to a reference sequence that we tested in vitro, but is actually the sequence of TRMT1 in the human population. Further, we were also looking for whether some variations in the Mpro cleavage site of TRMT1 were possibly present in some humans (could these be linked with severe COVID or susceptibility, for example?).

      Overall, this statement aims to anchor our in vitro results to the TRMT1 sequences actually present in humans. However, we agree this does not inform “biologically relevant mechanism”. We therefore took out the “Importantly” that was probably misleading.

      "TRMT1 engages the Mpro active site in a distinct binding conformation."

      This is reported as an observation with little analysis. What is the structural basis of this conformational difference between the bound peptides? Why are the psi angles different? Is there a steric factor that is different between these peptide chains? This section can be substantially improved in detail from its current state.

      See our related answer to the next comment below.

      "Molecular dynamics simulations suggest kinetic discrimination happens during later steps of Mpro-catalyzed substrate cleavage." This section could have partly addressed my previous comment. It is not clear why there is such a large difference in the psi-angle. With access to several peptide-bound structures, the authors should derive and provide insights into the underlying fundamental principles. After all, this is a major point of discovery in their investigation.

      We agree that it is not entirely clear why TRMT1 seems to favor the P3’-in conformation when binding to Mpro. The only other known peptide-bound structure that adopts a similar P2’ psi angle is nsp6/7, but there are not clear sequence, steric, or interaction features that distinguish TRMT1 and nsp6/7 from the other 6 peptide-Mpro structures that favor a P3’-out conformation with larger P2’ psi angle. In particular, the identity of the P1’ and P3’ residues, which would probably be expected to have the largest impact on this conformation, have no clear commonality in TRMT1 and nsp6/7 that give hints about why these adopt this unique conformation. As we describe in the discussion section of the manuscript, and has been observed by many other studies of Mpro, the protease active site is very plastic and able to accommodate a diverse range of sequences surrounding the invariant P1 Gln. Furthermore, while the crystal structures of TRMT1 and other nsp cleavage sequences bound to Mpro show a single peptide conformation in the active site, our MD simulations suggest that both P3’-in and P3’-out type conformations are present in solution for TRMT1, nsp4/5, and nsp8/9, just with different populations. It is very likely that there is a delicate energetic balance between these conformations that may depend subtly on multiple sequence features of the peptide and how they interact with each other and the flexible Mpro active site. As with our replies to questions from Reviewer 2 above about deciphering the underlying principles that connect peptide sequence to cleavage efficiency, we expect that dissecting the detailed links between sequence and binding conformation will be a long-term challenge for mechanistic and biocomputational groups focused on viral protease enzymes; systematic mutation of all residues in the cleavage sequence to multiple different amino acid identities followed by structure determination either experimentally and/or computationally will likely be required to uncover the key sequence or steric properties and interactions that underly and drive favored peptide binding conformations.

      To highlight these questions as significant and difficult future challenges toward understanding the fundamental principles underlying SARS-CoV Mpro proteolysis, we have added an additional paragraph (second from the last paragraph) in the discussion section.

      This work can be taken to a whole new level if the authors were to provide insights into how TRMT1 degradation by Mpro affects host cell biology and how the inhibition of this activity affects CoV biology.

      We certainly agree that showing the biological effects of TRMT1 degradation on host cell biology and/or viral biology could raise the impact of this work. But as discussed in more detail above in our response to the weakness listed in Reviewer 3’s public review, we see the main focus of this work as showing the biochemical and structural basis for TRMT1 recognition and cleavage by SARS-CoV-2 Mpro, and directly showing the immediate effects of this cleavage on the TRMT1-tRNA interaction and modification activity. As was the case with other viral proteases, like the HIV-1 protease, understanding the potentially diverse and nuanced downstream biological effects of host protein cleavage and its impacts on cellular phenotypes or viral fitness could take many years of careful cell biology and virology work. We hope that our paper provides the key first steps to viral biology labs taking on this significant but important challenge for TRMT1!

    1. Author response:

      The following is the authors’ response to the original reviews.

      eLife Assessment

      This study has uncovered some important initial findings about cellular responses to aneuploidy through analysis of gene expression in a set of donated human embryos. While the study's findings are in general solid, some experiments lack statistical power due to small sample sizes. The authors should try to get much more insight with their data highlighting the novel findings.

      We thank the editor for considering our manuscript for publication at elife, and for the helpful and thorough reviews of our work. Based on the suggestions of the reviewers, we have carried out additional experiments, expanded the sample size and reanalyzed the data. This has resulted in a thoroughly revised manuscript and much improved work, which we are convinced meets the requirements to be published as a version of record. Of note, the experiments for the revision required the support by 2 additional researchers from our lab which are now coauthors.

      These are the main changes made to the initial manuscript:

      (1) The RNA-seq data (Figures 1+2) is now FDR corrected and been reanalyzed. This has not affected the initial observations on the activation of p53 and apoptosis in aneuploid human embryos, as well as that the transcriptomic changes are driven by gene dosage effects. 

      (2) We have included the transcriptome analysis of reversine-treated embryos in the supplementary data.

      (3) For validation of novel findings such as the presence of DNA-damage and the expression of DRAM1 in aneuploid embryos, we now include the stainings of 30 human blastocysts (Figure 3o-t). We found absence of DNA-damage in aneuploid embryos and that DRAM1 is increased in the TE but not the ICM of aneuploid embryos. 

      (4) We re-analyzed the co-expression of CASP8/HSP70 in reversine-embryos as suggested by reviewer 1 and found that both proteins tend to be co-expressed. 

      (5) We have added a new analysis of NANOG expression (Figure 4a,b) of the embryos used in Figure 3o-t and have found retention of NANOG protein in both the TE and ICM.

      (6) We have added 6 euploid and 4 aneuploid embryos to Figure 4l-s, which support the conclusions on the absence of autophagy activation in the ICM and failure of PrE formation in aneuploid embryos.

      (7) We have significantly changed the layout of the figures, revised the supplementary tables, added source data files and rewritten the discussion.

      Regarding the sample size of the study, it is important to emphasize that human embryos are ethically sensitive material and that those with the specific genetic content we used in this study are rare, limiting our ability to expand the sample size. For the revision, we have added 40 human blastocysts to our initial 85 embryos. Compared to similar and high-quality studies using human embryos, our study shows a relatively large sample size (n=125): Victor et al. 2021: 30 human blastocysts for immunostainings1; Martin et al. 2023: 14 human blastocysts2; Martin et al. 2024: 64 human blastocysts3; Domingo-Muelas et al. 2023: 23 human blastocysts4.              

      Public Reviews:

      Reviewer#1(PublicReview):

      This study investigated an important question in human reproduction: why most fully aneuploid embryos is incompatible with normal fetal development. Specifically, the authors investigated the cellular responses to aneuploidy through analysis of gene expression in a set of donated human blastocysts. The samples included uniform aneuploid embryos of meiotic origin and mosaic aneuploid embryos from the SAC inhibitor reversine treatment. The authors relied mainly on low-input RNA sequencing and immunofluorescence staining. Pathway analysis with RNA-seq data of trophectoderm cells suggested activation of p53 and possibly apoptosis, and this cellular signature appeared to be stronger in TE cells with a higher degree of aneuploidy. Immunostaining also found some evidence of apoptosis, increased expression of HSP70 and autophagy in some aneuploid cells. With combinational OCT4 and GATA4 as lineage markers, it appeared that aneuploidy could alter the second lineage segregation and primitive endoderm formation in particular.

      Although this study is largely descriptive, it generated valuable RNA-seq data from a set of aneuploid TE cells with known karyotypes. Immunostaining results in general were consistent with findings in mouse embryos and human gastruloids.

      We thank the reviewer for the thorough evaluation of our manuscript. We have implemented most of the suggestions, which have further strengthened the original findings.

      While there is a scarcity of human embryo materials for research, the lack of single cell level data limits further extension of the presented data on the consequences of mosaic embryos.  

      We did not include single cell RNA-seq data of mosaic human embryos in our study because we focused on embryos diagnosed with complex meiotic abnormalities. Our hypothesis was that the cellular consequences of aneuploidy would be strongest in this type of aneuploidies and most evident to identify and would allow us to provide a basis for the mechanisms of elimination of aneuploid cells in human embryos. In the manuscript (lines 596-626) we acknowledge the limitations of the extrapolation of our results to mosaic embryos.

      A major concern is that the gene list used for pathway analysis is not FDR controlled. It is also unclear how the many plots generated with the "supervised approach" were actually performed. 

      We agree with the concerns about the fact that our differential expression gene list was not FDR but p-value ranked. We followed the suggestion of the reviewer and revised the RNAseq analysis and focused primarily on pathway analysis. We have also added the comparison between aneuploid and reversine treated embryos to the supplementary data and expanded the analysis of high dosage and low dosage embryos. Importantly, the new analysis has not changed the original finding that aneuploid embryos show hallmarks of p53 activation and apoptosis, and that these effects are gene dosage dependent. The manuscript now includes two completely revised and new figures 1 and 2.

      Since we discarded the data generated from our previous approach, we do not use the term supervised approach anymore.

      The authors also appear to have ignored the possibility that high-dosage group could have a higher mitotic defect.

      This is indeed a possibility. In the discussion (lines 504-508) we have now incorporated the notion that the high dosage embryos could have higher mitotic defects, although our data cannot provide any evidence for this. Of note, the gene expression data shows that all aneuploid embryos (including low dosage and reversine embryos) equally show an enrichment for mitotic spindle pathway genes.

      Assuming a fully aneuploid embryo, why do only some cells display p53 and autophagy marker? 

      This is a very good question, on which we can only speculate, but the answer likely lies in the diversity across cells of the same embryo.

      Even in genetically homogenous tissues and cell cultures, individual cells can exhibit different levels of stress responses, such as p53 activation and apoptosis. This variation may be influenced by the local cellular environment, stochastic gene expression, or differences in cell cycle stages. Other studies on fully aneuploid human embryos could also not detect apoptotic responses in every cell1,3.

      For instance, p53 activation differs even between cells that have a similar number of DNA breaks, and this activation is influenced by both cell-intrinsic factors and previous exposure to DNA damage5.

      Cell cycle tightly regulates the response of cells to different stressors. For instance, cells in G1 or S-phase might be more sensitive to apoptosis signals6, while those in G2/M might escape this response temporarily7.  Autophagy is more induced in G1 and S phases, with reduced activity in G2 and M phases8.

      Individual cells may also have different levels of success in the activation of the compensatory pathways, including the unfolded protein response, autophagy, or changes in metabolism, resulting in some cells adapting better than others.

      The expression of p53 and the sensitivity to apoptosis could also be influenced by epigenetic differences between cells, which may alter their transcriptional response to aneuploidy. Even in a genetically identical population, cells can have different epigenetic landscapes, leading to heterogeneous gene expression patterns.

      The conclusion about proteotoxic stress was largely based on staining of HSP70. It appears from Figure 3 d,h that the same cells exhibited increased HSP70 and CASP8 staining. Since HSP70 is known to have anti-apoptotic effect, could the increased expression of Hsp70 be an anti-apoptotic response?

      Our conclusion about proteotoxic stress was not solely based on HSP70 expression. We also stained for LC3B and p62, which are markers for autophagy and when highly expressed indirectly point towards underlying proteotoxic stress in the cells. 

      We reanalyzed the imaging of the stainings in the reversine-treated embryos, and found that the same cells were positive for both HSP70 and CASP8 staining while the minority was single positive (shown now in Figure 3k,l). 

      HSP70 does indeed not only unfold misfolded and aggregated proteins but does also have a function during cell survival and apoptosis9. HSP70 has been for instance found to inhibit the cleavage of Bid through active CASP8 within the extrinsic apoptosis pathway10. It is thus possible that it temporarily plays this role, and we have acknowledged this in the discussion (lines 623-626). On the other hand, the evidence points at an active apoptosis in the TE, with concomitant cell loss, so if HSP70 is indeed having an anti-apoptotic effect, it is having a limited impact.

      Reviewer #2 (Public Review): 

      A high fraction of cells in early embryos carry aneuploid karyotypes, yet even chromosomally mosaic human blastocysts can implant and lead to healthy newborns with diploid karyotypes. Previous studies in other models have shown that genotoxic and proteotoxic stresses arising from aneuploidy lead to the activation of the p53 pathway and autophagy, which helps eliminate cells with aberrant karyotypes. These observations have been here evaluated and confirmed in human blastocysts. The study also demonstrates that the second lineage and formation of primitive endoderm are particularly impaired by aneuploidy.

      This is a timely and potentially important study. Aneuploidy is common in early embryos and has a negative impact on their development, but the reasons behind this are poorly understood. Furthermore, how mosaic aneuploid embryos with a fraction of euploidy greater than 50 % can undergo healthy development remains a mystery. Most of our current information comes from studies on murine embryos, making a substantial study on human embryos of great importance. However, there are only very few new findings or insights provided by this study. Some of the previous findings were reproduced, but it is difficult to say whether this is a real finding, or whether it is a consequence of a low sample number. The authors could get much more insight with their data.

      We thank the reviewer for the thorough evaluation of our manuscript and the valuable suggestions made in the private recommendations. We have expanded the sample size and have carried out additional experiments that have significantly improved the manuscript.

      Recommendations for the authors:

      Reviewer #1 (Recommendations For The Authors):

      (1) Instead of using cut off to generate a list, the authors could just rank the entire detected transcriptome for GSEA. This method fits better the authors' intentions of "primarily focused on pathway analysis." The cut-off value "-log10(p-value)<0.05" is not correct. As we can see from the PCA plot, one would not expect many cut off defined DEGs at all. The most obvious transcriptome change is dosage dependent, as the authors cleared showed with InferCNV.

      We thank the reviewer for this suggestion and agree that this was an important concern of the study. We have entirely revised the RNA-seq analysis based on the proposed approach (Figure 1 and 2, Supplementary Figure 1). Also, we have included the analysis of aneuploid versus reversine treated embryos, which has allowed us to determine the differences between naturally occurring chromosomal abnormalities and those that are induced using reversine (Supplementary Figure 1). 

      We first performed differential gene expression analysis using DESEq2 with a cut-off value for significantly differentially expressed genes of | log2FC | > 1 and an FDR < 0.05. Based on the PCAs and the low number of differentially expressed genes for all comparisons, besides high dosage versus euploid embryos, we focussed primarily on pathway analysis. 

      For that, based on the reviewer’s suggestion, we generated a ranked gene list using the GSEA software (version 4.2.2, MSigDatabase) based on the normalized count matrix of the whole transcriptome that was detected after differential gene expression. The ranked gene list was then subjected to the run GSEA function, and we searched the Hallmark and C2 library for significantly enriched pathways. Thus, we could generate normalized enrichment scores, allowing us to predict whether a pathway is activated or suppressed. The details of the new analysis are described in the Material and Methods section (lines 220-232). Significance was determined using a cut-off value of 25% FDR. This cut-off is proposed in the user guide of the GSEA (https://www.gsea-msigdb.org/gsea/doc/GSEAUserGuideTEXT.htm) especially for incoherent gene expression datasets, as suggested by our PCAs, which allows for hypothesis driven validation of the dataset. 

      Indeed, we found that the most important transcriptome changes are aneuploidy dosage dependent. High dosage embryos show signatures of cellular unfitness, while low-dosage embryos still seem to activate survival pathways (lines 349-364). 

      This new analysis did not only increase robustness of our results but also introduced novel findings, which pave the road for future studies. 

      The validity of our findings is supported by recent work by the Zernicka-Goetz lab. We found that hypoxia is upregulated in low dosage human aneuploid TE cells. In line with our data, the Zernicka-Goetz lab found in a mouse model of low degree chromosomal abnormalities that hypoxia inducible factor 1A (HIF1A) promotes survival of extraembryonic aneuploid cells by reducing levels of DNA damage11.

      (2) It would be very helpful if the authors could perform co-staining of multiple stress markers to better understand the origins of apoptosis and autophagy cells. In Fig 3d and 3h, it seems that the same reversine treated embryo was stained with CASP8, LC3B and HSP70. Is there any correlation between CASP8 and HSP70 at the single cell level? Is there any correlation between p53 and LC3B as the authors suggested, possibly through DRAM1?

      We decided to use the complex aneuploid embryos that were left at our facility for the validation of novel findings such as upregulation of DRAM1 and presence and consequences of DNA damage in aneuploid embryos. As suggested by the editor and the other reviewer we also added embryos to existing datasets to increase the sample size where necessary. Therefore, we did not include other co-staining’s of multiple stress markers.

      Following the reviewer’s suggestion, we reanalyzed the existing stainings and evaluated whether there is a correlation between CASP8 and HSP70 at the single cell level. The reversine-treated embryos were the only embryo group that was co-stained for both CASP8 and HSP70. We quantified the percentage of cells that were single or double positive for CASP8 and HSP70 and found a higher proportion of double positive cells than to single positives. Therefore, we concluded that there is indeed a correlation between both proteins at the single cell level in reversine-treated embryos and included this data in Figure 3k,l. 

      During the experiments for the revision, we found that the DRAM1 protein was upregulated in the cytoplasm of TE cells but not in the ICM of aneuploid embryos (Figure 3s,t), which validates the findings of the gene expression analysis. This data also supports our findings that autophagy is active in aneuploid TE cells while not significantly increased in aneuploid pluripotent ICM cells. Unfortunately, we could not stain LC3B and DRAM1 in the same embryo because the antibodies were raised in the same species.

      (3) While " the possibilities for functional studies and lineage tracing experiments in human embryos are very limited," the authors can leverage in silico modelling (ie, PMID: 28700688) to address the roles of aneuploidy in blastocyst formation and development. Is there any selfregulating mechanism underlying the ratios of PrE and EPI? Is apoptosis of ICM cells a natural process during PrE formation (PMID: 18725515)?

      It is a very interesting proposal to use in silico modelling to address the roles of aneuploidy during human blastocyst formation and lineage segregation. Although this type of analysis would yield very important insights, we are not able to address this point of the revision due to lack of expertise for this type of analysis in our group, requiring setting up a collaboration with experts in this field.  In the discussion we proposed that future studies can leverage our data to be carried out in silico modelling and cited the proposed article (lines 608-610).

      On the second part of the question, we would like to discuss the differences between mouse and human embryo studies. Parts of this were included in the discussion on the possible mechanisms of PrE elimination. 

      Is there a self-regulating mechanism for EPI/PrE formation?

      To extrapolate the knowledge on mouse development to human it is important to bear in mind that (1) human embryos are outbred, as compared to inbred super-fertile laboratory mouse strains and (2) the embryos are donated to research by subfertile couples, which could compromise the EPI/PrE ratios. For instance, Chousal and colleagues found that poor quality blastocysts have a reduced number of PrE cells12. In human embryos the proportion EPI and PrE cells is indeed highly variable (20%-60%) and while the number of EPI cells does not increase between dpf6 and 7, the number of PrE cells does grow13. We found a similar variable number of EPI and PrE in our study on the lineage segregation mechanisms in good quality human embryos, with an absolute number of EPI of 12.1±6.5 cells and 8.4±3.44 PrE cells14.

      By comparison, in late mouse blastocysts, the ratio EPI/PrE cells is consistent (2/3)15. Overall, self-regulating mechanisms in the human embryo are not yet studied in detail due to the lack of possible functional testing.

      Is apoptosis a natural process during PrE formation?

      Yes, in mice apoptosis is a natural process during PrE formation to eliminate misallocated cells of the inner cell mass through cell competition16,17. Yet, in the human embryo there is no evidence of such mechanisms. Although apoptosis is present even in human blastocysts of good quality18, the origin of such apoptotic cells is now still shown, although suboptimal culture conditions are known to increase cellular fragmentation19. Conversely, our data and that of others1,2 supports the notion that the pluripotent inner cell mass in human embryos is more resistant to apoptosis than the trophectoderm, even in karyotypically aberrant cells. 

      (4) The "count tables generated from the raw data files" could not be found in the source data files.

      This slipped to our attention, we have added now the count tables to the source data files. Our apologies.

      (5) Citations on aneuploidy literature were not done in a fully scholarly manner. It appears that authors selectively cite previous papers that are in support of their hypothesis but left out those with alternative conclusions.

      We apologize if we missed any literature that contradicts our findings, it is not intentional. We would be grateful if the reviewer could provide such references. 

      In the manuscript we describe the alignment and differences of key findings with several studies (listed below) and the limitations of our study are extensively described in lines 596626.

      Our findings align with other work on these aspects:

      - RNA-sequencing data2,20–26

      - Gene dosage effects drive the transcriptome of the aneuploid human embryo27,28

      - Aneuploid cells are cleared by sustained proteotoxic stress followed by p53 activation, autophagy and eventually apoptosis29–37.

      - p53 is active in constitutional aneuploid cells38

      - The ICM is less sensitive to apoptosis1,2

      Our findings differ with other work on these points:

      - p53 activation is independent from DNA-damage39

      - p53 is active in constitutional aneuploid cells40,41

      - Apoptosis is only present in the aneuploid TE of aneuploid cells in the embryo29,30,42    

      Reviewer #2 (Recommendations For The Authors):

      Comments:

      (1) The main problem is that there is no substantial novelty. The authors look at previously identified factors affected by chromosome gains and losses, but none of the new one from their analysis. Anything what could be potentially novel is not carefully analyzed (e.g. the difference between reversine-treated and aneuploid samples, or new potential candidates) or explained. This is really a pity.

      In the revision, we have further elaborated on the DNA damage aspect by staining for DNA double-stranded breaks and have validated DRAM1 as an activated downstream effector of p53. We have also added the analyses of the gene-expression of the reversine-treated embryos.

      (2) Some of the general statements on aneuploidy are confusing and often borderline generalized. E.g. introduction line 106: "If this (proteotoxic stress) remains unresolved by the activation of autophagy..." I am not aware of any publication suggesting that autophagy resolves proteotoxic stress in aneuploid cells. Citations that replication stress causes DNA damage in aneuploid cells are wrong. This link was first shown by Passerini et al. in 2016. etc.

      We have clarified these statements in the introduction and added the proposed citations on replication stress that causes DNA damage in aneuploid cells (lines 95-108).

      (3) In the figures the authors show a representative image of aneuploid and diploid embryos. Given the aneuploid embryos have widely different karyotypes, it would be important to clarify which of the embryos has been actually shown. Similarly, in the heat maps it is not clear which line is which embryo. This would be very useful.

      We added the karyotypes of the aneuploid embryos to the images in figure 3 and 4. Since the heatmaps were removed from the figures we added the karyotypes to the PCAs in all figures.

      (4) The authors constantly state that aneuploid embryo accumulate more DNA damage, which is supported by some of their observations, e.g. the DNA damage response is upregulated. It would be great if they would validated this statements with testing some markers for DNA damage.

      We agree with the reviewer that this was an important point and addressing it has revealed that our initial assumption was incorrect and has provided new interesting findings. From the revised RNA-seq analysis, we found only one pathway (DNA damage response TP53) to be activated in all aneuploid embryos (Fig.1e). The ATM pathway was also activated specifically in high-dosage embryos. Following this, we set to test if DNA damage was indeed increased in aneuploid embryos by staining for DNA double strand breaks with gH2AX. 

      First, we investigated the gH2AX expression in 5dpf embryos in which we induced DNAdamage with Bleomycin. We compared 6 untreated versus 6 Bleomycin treated human embryos (Fig. 3m) and found that gH2AX foci were rarely present in the untreated embryos and that all cells of the treated embryos showed a pan-nuclear gH2AX staining. 

      Second, we compared the presence of gH2AX foci in the TE (NANOG negative cells), ICM (NANOG positive cells) and the whole embryo of 7 euploid versus 11 aneuploid embryos. Interestingly, we found no differences in the number of gH2AX foci or pan-nuclear gH2AX nuclei between euploid and aneuploid embryos (Fig 3o). When dividing our aneuploid embryos into high and low dosage embryos we could also not account for differences. Our data now suggests that complex aneuploid human embryonic cells of meiotic origin do not contain more DNA-double strand breaks, precluding DNA-damage as the source of p53 activation. Last, in our previous experiment we found that phosphorylated S15p53 is increased in aneuploid embryos, supporting an active p53 pathway as suggested by our transcriptomic data. Since we could not find DNA-damage in aneuploid human embryos we speculate that p53 is phosphorylated on Serine15 through metabolic stress as suggested by Jones and colleagues43. We also argue that proteotoxic stress might induce p53 expression as proposed by Singla and colleagues29.

      (5) The source of embryos is only partially described in a figure legend. This should be expanded and described in the Materials and Methods section. The embryos are named, but this is nowhere explained. One can only assume that T is for trisomy and M is for monosomy.

      We have divided the embryos into different experimental series (Experiment 1-4). This is now described in the Material and methods section (lines 157-175). Also, we have added the experiment number of each embryo to the supplementary tables and to the source data. The abbreviation for T = Trisomy and M= Monosomy was initially introduced in the last paragraph of the figure legend of figure 4.  We now added it to every panel.

      (6) Recent works from non-embryonic cells suggest that the cellular response to monosomy is different than the response to trisomy. Did the authors try to test this possible difference? For example, one could compare embryos M174/21, M2/19 and M17 with T2/10, T10/22 and T1/15/18/22.

      We thank the reviewer for pointing this out. Our RNA-seq. dataset consisted of three embryos that contained trisomies only and four embryos that contained monosomies only. When reanalyzing our data we found different transcriptomic responses between monosomic only and trisomic only cells. Compared to euploid cells, monosomy only cells activate mainly the p53pathway and protein secretion while translation, DNA replication, cell cycle G1/S, DNA synthesis and processing of DNA double strand breaks were inhibited. Trisomy only cells show activated oxidative phosphorylation, ribosome and translation while protein secretion, apoptosis and cell cycle are inhibited. These differences were confirmed by testing transcriptomic differences between trisomic versus monosomic cells. Our results are similar to studies on human embryos20,26 and other monosomic and trisomic cell lines44,45. However, the interpretation of these results is very limited by the small sample size and the comparison of monosomies and trisomies of different chromosomes. Thus, we decided to keep this analysis out of the manuscript.

      Author response image 1.

      On the protein level, next to the small sample size, our results were also limited by the fact that not all embryos were stained with the same combinations of antibodies. LC3B was the only protein for which all embryos were immunostained. Thus, other protein data could not be re-analyzed due to even lower sample sizes. 

      Below we have separated the LC3B puncta per cell counts into euploid, trisomies only, monosomies only and all other aneuploid embryos. We performed a Kruskal Wallis test with multiple comparisons. It is worth noticing that the difference between euploid and monosomies only (and those that contained both) was statistically significant, while the difference between euploid vs trisomies only and trisomies only vs monosomies only was not statistically significant. These differences contradict the studies on monosomic cell lines that found that proteotoxic stress and autophagy are not present and specific to trisomic cell lines. Here we also decided to keep this specific protein expression analysis out of the manuscript due to the above-mentioned limitations.

      Author response image 2.

      (7) Line 329: "a trisomy 12 meiotic chromosomal abnormality in one reversine-treated embryo." What does it mean? Why meiotic chromosomal abnormality when the reversine treatment was administered 4 days after fertilization? In the discussion, the authors state "presumed meiotic," but this should be discussed and described more clearly.
      Since reversine induces mitotic abnormalities of different types leading to chromosomally mosaic embryos, we could not identify these induced abnormalities using inferCNV on the RNAseq of TE biopsies of said embryos. However, we were not aware of the karyotype of the embryos that were used for these experiments, as they were thawed after they had been cryopreserved at day 3 of development and had not been subjected to genetic testing.  This makes it possible that some of those embryos we used for the reversine experiments in fact carried endogenously acquired meiotic and mitotic chromosomal abnormalities. Since we are only able to detect by inferCNV aneuploidies homogeneously present in the majority of the cells of the sequenced biopsy, we only picked up this trisomy 12.  It is possible that this was not a meiotic abnormality but a miotic one originating at the first cleavage and present at a high percentage of cells in the blastocyst. At any rate, the exact origin of this aneuploidy has no further implications for the results of the study. We clarified this in the manuscript (lines 310-315).

      (8) Line 422: "The gene expression profiles suggest that the accumulation of autophagic proteins in aneuploid embryos is caused by increased autophagic flux due to differential expression of the p53 target gene DNA Damage Regulated Autophagy Modulator-1 (DRAM1), rather than by inhibition of autophagy (Supplementary Table 2)." This is highly speculative, as the authors do not have any evidence to support this statement.

      To validate this finding we have now stained 7 euploid and 11 aneuploid embryos with a DRAM1 antibody. We found DRAM1 protein to be significantly enriched in the cytoplasm of TE cells but not in the ICM of aneuploid embryos when comparing with euploid embryos (Fig. 3s,t). This data is consistent with the finding that autophagy is increased in the TE and not the ICM of aneuploid human embryos. (Fig 4l-o). Potential implications of DRAM1 expression have been mentioned in the discussion.

      (9) The figure legends are confusing. They are mixed up with the methods and some key information are missing.

      We revised all figure legends accordingly and removed the experimental set-up figures from the manuscript to reduce any confusion. The methods section was revised and expanded.

      (10) In Figure 1, what is the difference between "activated" and "deregulated"?

      Since we analyzed our RNA-seq dataset with the method proposed by reviewer 1 we now generated normalized enrichment scores. The terms activated and deregulated are thus not present anymore.  

      (11) The p62 images are not really clear. There might be more puncta (not obvious, though), but the staining intensity seems lower in the representative images.  

      We do not agree with the reviewer that there might be more p62 puncta (purple), however, we agree that it was not clearly visible from the pictures. Below we show an example of the counting mask (in green) of the aneuploid embryo from figure 3i, where one can clearly appreciate that all the puncta are captured by the counting mask. In this case, the software counted 1704 puncta. To further clarify, we now added a zoom of a randomly chose ROI of the p62 staining’s to figure 3i.

      Author response image 3.

      (12) The authors claim that there are differences between lineages in response to aneuploidy, such as autophagy not being activated in the OCT4+ lineage, etc. However, the differences are very small and based on a small number of embryos. It is difficult to draw far-reaching conclusions based on a small number of experiments (Fig. 4n-r). The authors also claim in the Abstract that they demonstrated "clear differences with previous findings in the mouse", which are however difficult to identify in the text.

      We agree with the reviewer that our conclusions on figures 4l-o were based on a small number of embryos. We have increased as much as possible the sample size. This is challenging due to the constrictions in accessing human embryos, and especially the limited number of embryos with meiotic complex aneuploidy. We have performed immunostainings for LC3B, OCT4 and GATA4 of six additional euploid and four additional aneuploid human embryos. This did not change our overall findings that aneuploid embryos upregulate autophagy in the TE rather than the ICM (Figure 4l-o). After the inclusion of additional embryos, we removed our speculation from the manuscript that autophagy is present in ICM cells of already differentiated cells towards EPI/PrE.

      We have rephrased the abstract to state that we highlight a few differences with previous findings in the mouse. Here we focused especially on the different transcriptomic response of reversine treated embryos, that aneuploid mouse embryos do not seem to suffer from lineage segregation errors and that the ICM of aneuploid human embryos lacks apoptosis while aneuploid mouse embryos show elimination from the EPI. Likewise, we highlighted the similar stress responses and that we could give novel insights into p53 mediated autophagy and apoptosis activation through DRAM1 in aneuploid TE cells but not the ICM.  

      (13) The text needs thorough editing - long sentences, typos, and grammar errors are frequent. Punctuation is largely missing.

      We have revised the text.

      References

      (1) Victor, A. R. et al. One hundred mosaic embryos transferred prospectively in a single clinic: exploring when and why they result in healthy pregnancies. Fertil Steril 111, 280–293 (2019).

      (2) Martin, A. et al. Mosaic results after preimplantation genetic testing for aneuploidy may be accompanied by changes in global gene expression. Front Mol Biosci 10, 264 (2023).

      (3) Martín, Á. et al. Trophectoderm cells of human mosaic embryos display increased apoptotic levels and impaired differentiation capacity: a molecular clue regarding their reproductive fate? Human Reproduction 39, 709–723 (2024).

      (4) Domingo-Muelas, A. et al. Human embryo live imaging reveals nuclear DNA shedding during blastocyst expansion and biopsy. Cell 186, 3166-3181.e18 (2023).

      (5) Loewer, A., Karanam, K., Mock, C. & Lahav, G. The p53 response in single cells is linearly correlated to the number of DNA breaks without a distinct threshold. BMC Biol 11, 1–13 (2013).

      (6) Kim, H., Watanabe, S., Kitamatsu, M., Watanabe, K. & Ohtsuki, T. Cell cycle dependence of apoptosis photo-triggered using peptide-photosensitizer conjugate. Scientific Reports 2020 10:1 10, 1–8 (2020).

      (7) Pollak, N. et al. Cell cycle progression and transmitotic apoptosis resistance promote escape from extrinsic apoptosis. J Cell Sci 134, (2021).

      (8) Neufeld, T. P. Autophagy and cell growth--the yin and yang of nutrient responses. J Cell Sci 125, 2359–2368 (2012).

      (9) Lanneau, D. et al. Heat shock proteins: essential proteins for apoptosis regulation. J Cell Mol Med 12, 743 (2008).

      (10) Gabai, V. L., Mabuchi, K., Mosser, D. D. & Sherman, M. Y. Hsp72 and Stress Kinase cjun N-Terminal Kinase Regulate the Bid-Dependent Pathway in Tumor Necrosis Factor-Induced Apoptosis. Mol Cell Biol 22, 3415 (2002).

      (11) Sanchez-Vasquez, E., Bronner, M. E. & Zernicka-Goetz, M. HIF1A contributes to the survival of aneuploid and mosaic pre-implantation embryos. bioRxiv 2023.09.04.556218 (2023) doi:10.1101/2023.09.04.556218.

      (12) Chousal, J. N. et al. Molecular profiling of human blastocysts reveals primitive endoderm defects among embryos of decreased implantation potential. Cell Rep 43, (2024).

      (13) Corujo-Simon, E., Radley, A. H. & Nichols, J. Evidence implicating sequential commitment of the founder lineages in the human blastocyst by order of hypoblast gene activation. Development (Cambridge) 150, (2023).

      (14) Regin, M. et al. Lineage segregation in human pre-implantation embryos is specified by YAP1 and TEAD1. Human Reproduction 38, 1484–1498 (2023).

      (15) Saiz, N., Williams, K. M., Seshan, V. E. & Hadjantonakis, A. K. Asynchronous fate decisions by single cells collectively ensure consistent lineage composition in the mouse blastocyst. Nature Communications 2016 7:1 7, 1–14 (2016).

      (16) Plusa, B., Piliszek, A., Frankenberg, S., Artus, J. & Hadjantonakis, A. K. Distinct sequential cell behaviours direct primitive endoderm formation in the mouse blastocyst. Development 135, 3081–3091 (2008).

      (17) Hashimoto, M. & Sasaki, H. Epiblast Formation by TEAD-YAP-Dependent Expression of Pluripotency Factors and Competitive Elimination of Unspecified Cells. Dev Cell 50, 139-154.e5 (2019).

      (18) Hardy, K. Apoptosis in the human embryo. Rev Reprod 4, 125–134 (1999).

      (19) Ramos-Ibeas, P. et al. Embryo responses to stress induced by assisted reproductive technologies. Mol Reprod Dev 86, 1292–1306 (2019).

      (20) Licciardi, F. et al. Human blastocysts of normal and abnormal karyotypes display distinct transcriptome profiles. Sci Rep 8, 1–9 (2018).

      (21) Maxwell, S. M. et al. Investigation of Global Gene Expression of Human Blastocysts Diagnosed as Mosaic using Next-generation Sequencing. Reproductive Sciences 1–11 (2022) doi:10.1007/s43032-022-00899-x.

      (22) Groff, A. F. et al. RNA-seq as a tool for evaluating human embryo competence. Genome Res 29, 1705–1718 (2019).

      (23) Starostik, M. R., Sosin, O. A. & McCoy, R. C. Single-cell analysis of human embryos reveals diverse patterns of aneuploidy and mosaicism. Genome Res 30, 814–826 (2020).

      (24) Vera-Rodriguez, M., Chavez, S. L., Rubio, C., Pera, R. A. R. & Simon, C. Prediction model for aneuploidy in early human embryo development revealed by single-cell analysis. Nat Commun 6, 7601 (2015).

      (25) Sanchez-Ribas, I. et al. Transcriptomic behavior of genes associated with chromosome 21 aneuploidies in early embryo development. Fertil Steril 111, 991-1001.e2 (2019).

      (26) Fuchs Weizman, N. et al. Towards Improving Embryo Prioritization: Parallel Next Generation Sequencing of DNA and RNA from a Single Trophectoderm Biopsy. Sci Rep 9, 1–11 (2019).

      (27) Fernandez Gallardo, E. et al. A multi-omics genome-and-transcriptome single-cell atlas of human preimplantation embryogenesis reveals the cellular and molecular impact of chromosome instability. bioRxiv 2023.03.08.530586 (2023) doi:10.1101/2023.03.08.530586.

      (28) Dürrbaum, M. & Storchová, Z. Effects of aneuploidy on gene expression: implications for cancer. FEBS J 283, 791–802 (2016).

      (29) Singla, S., Iwamoto-Stohl, L. K., Zhu, M. & Zernicka-Goetz, M. Autophagy-mediated apoptosis eliminates aneuploid cells in a mouse model of chromosome mosaicism. Nat Commun 11, 1–15 (2020).

      (30) Bolton, H. et al. Mouse model of chromosome mosaicism reveals lineage-specific depletion of aneuploid cells and normal developmental potential. Nat Commun 7, 1– 12 (2016).

      (31) Ohashi, A. et al. Aneuploidy generates proteotoxic stress and DNA damage concurrently with p53-mediated post-mitotic apoptosis in SAC-impaired cells. Nat Commun 6, 1–16 (2015).

      (32) Santaguida, S. & Amon, A. Short- and long-term effects of chromosome missegregation and aneuploidy. Nature Reviews Molecular Cell Biology vol. 16 473–485 Preprint at https://doi.org/10.1038/nrm4025 (2015).

      (33) Santaguida, S., Vasile, E., White, E. & Amon, A. Aneuploidy-induced cellular stresses limit autophagic degradation. Genes Dev 29, 2010–2021 (2015).

      (34) Chunduri, N. K. & Storchová, Z. The diverse consequences of aneuploidy. Nature Cell Biology 2019 21:1 21, 54–62 (2019).

      (35) Dürrbaum, M. et al. Unique features of the transcriptional response to model aneuploidy in human cells. BMC Genomics 15, 139 (2014).

      (36) Pan, J.-A., Ullman, E., Dou, Z. & Zong, W.-X. Inhibition of protein degradation induces apoptosis through a microtubule-associated protein 1 light chain 3-mediated activation of caspase-8 at intracellular membranes. Mol Cell Biol 31, 3158–70 (2011).

      (37) Stingele, S. et al. Global analysis of genome, transcriptome and proteome reveals the response to aneuploidy in human cells. Mol Syst Biol 8, 608 (2012).

      (38) Tang, Y.-C., Williams, B. R., Siegel, J. J. & Amon, A. Identification of aneuploidyselective antiproliferation compounds. Cell 144, 499–512 (2011).

      (39) Janssen, A., Van Der Burg, M., Szuhai, K., Kops, G. J. P. L. & Medema, R. H. Chromosome segregation errors as a cause of DNA damage and structural chromosome aberrations. Science 333, 1895–1898 (2011).

      (40) Li, M. et al. The ATM-p53 pathway suppresses aneuploidy-induced tumorigenesis. Proc Natl Acad Sci U S A 107, 14188–14193 (2010).

      (41) Thompson, S. L. & Compton, D. A. Proliferation of aneuploid human cells is limited by a p53-dependent mechanism. J Cell Biol 188, 369–381 (2010).

      (42) Yang, M. et al. Depletion of aneuploid cells in human embryos and gastruloids. Nat Cell Biol 23, 314–321 (2021).

      (43) Jones, R. G. et al. AMP-activated protein kinase induces a p53-dependent metabolic checkpoint. Mol Cell 18, 283–293 (2005).

      (44) Chunduri, N. K., Barthel, K. & Storchova, Z. Consequences of Chromosome Loss: Why Do Cells Need Each Chromosome Twice? Cells 2022, Vol. 11, Page 1530 11, 1530 (2022).

      (45) Krivega, M., Stiefel, C. M. & Storchova, Z. Consequences of chromosome gain: A new view on trisomy syndromes. American Journal of Human Genetics vol. 109 2126–2140 Preprint at https://doi.org/10.1016/j.ajhg.2022.10.014 (2022).

    2. eLife Assessment

      This study provides valuable insights into the cellular responses to complex aneuploidy in human preimplantation embryos. The evidence supporting the claims of the authors is now convincing after addressing previous concerns. This work will be of interest to embryologists, geneticists and scholars working on reproductive medicine by increasing our understanding of how human embryos respond to chromosomal abnormalities.

    3. Reviewer #2 (Public review):

      A high fraction of cells in early embryos carry aneuploid karyotypes, yet even chromosomally mosaic human blastocysts can implant and lead to healthy newborns with diploid karyotypes. Previous studies in other models have shown that genotoxic and proteotoxic stresses arising from aneuploidy lead to the activation of the p53 pathway and autophagy, which helps eliminate cells with aberrant karyotypes. These observations have been here evaluated and confirmed in human blastocysts. The study also demonstrates that the second lineage and formation of primitive endoderm are particularly impaired by aneuploidy.

      Comments on revisions:

      The authors have addressed the critical issues sufficiently. In particular, they improved the data analysis and added additional data from embryonal samples.
    4. Reviewer #3 (Public review):

      This study provides valuable insights into the cellular responses to complex aneuploidy in human preimplantation embryos. The authors have significantly expanded their sample size and conducted additional analysis and experiments to address previous concerns. The revised manuscript presents stronger evidence for gene dosage-dependent effects of aneuploidy on stress responses and lineage segregation. Overall, the findings contribute important knowledge to our understanding of how human embryos respond to chromosomal abnormalities.

      Overall, the revision has substantially improved the manuscript and addressed the major concerns raised in the initial review.

    1. eLife Assessment

      This work introduces an important new method for depleting ribosomal RNA from bacterial single-cell RNA sequencing libraries, demonstrating its applicability for studying heterogeneity in microbial biofilms. The findings provide convincing evidence for a distinct subpopulation of cells at the biofilm base that upregulates PdeI expression. Future studies exploring the functional relationship between PdeI and c-di-GMP levels, along with the roles of co-expressed genes within the same cluster, could further enhance the depth and impact of these conclusions.

    2. Reviewer #1 (Public review):

      Summary:

      In this manuscript, Yan and colleagues introduce a modification to the previously published PETRI-seq bacterial single cell protocol to include a ribosomal depletion step based on a DNA probe set that selectively hybridizes with ribosome-derived (rRNA) cDNA fragments. They show that their modification of the PETRI-seq protocol increases the fraction of informative non-rRNA reads from ~4-10% to 54-92%. The authors apply their protocol to investigating heterogeneity in a biofilm model of E. coli, and convincingly show how their technology can detect minority subpopulations within a complex community.
      Strengths:

      The method the authors propose is a straightforward and inexpensive modification of an established split-pool single cell RNA-seq protocol that greatly increases its utility, and should be of interest to a wide community working in the field of bacterial single cell RNA-seq.
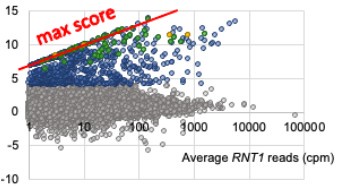
      Comments on revised version:

      The reviewers have responded thoughtfully and comprehensively to all of my comments. I believe the details of the protocol are now much easier to understand, and the text and methods have been significantly clarified. I have no further comments.

    3. Reviewer #2 (Public review):

      Summary:

      This work introduces a new method of depleting the ribosomal reads from the single-cell RNA sequencing library prepared with one of the prokaryotic scRNA-seq techniques, PETRI-seq. The advance is very useful since it allows broader access to the technology by lowering the cost of sequencing. It also allows more transcript recovery with fewer sequencing reads. The authors demonstrate the utility and performance of the method for three different model species and find a subpopulation of cells in the E.coli biofilm that express a protein, PdeI, which causes elevated c-di-GMP levels. These cells were shown to be in a state that promotes persister formation in response to ampicillin treatment.

      Strengths:

      The introduced rRNA depletion method is highly efficient, with the depletion for E.coli resulting in over 90% of reads containing mRNA. The method is ready to use with existing PETRI-seq libraries which is a large advantage, given that no other rRNA depletion methods were published for split-pool bacterial scRNA-seq methods. Therefore, the value of the method for the field is high. There is also evidence that a small number of cells at the bottom of a static biofilm express PdeI which is causing the elevated c-di-GMP levels that are associated with persister formation. This finding highlights the potentially complex role of PdeI in regulation of c-di-GMP levels and persister formation in microbial biofilms.

      Comments on revised version:

      The authors edited the manuscript thoroughly in response to the comments, including both performing new experiments and showing more data and information. Most of the major points raised between both reviewers were addressed. The authors explained the seeming contradiction between c-di-GMP levels and PdeI expression.

    4. Author response:

      The following is the authors’ response to the previous reviews.

      eLife Assessment

      This work presents an important method for depleting ribosomal RNA from bacterial single-cell RNA sequencing libraries, enabling the study of cellular heterogeneity within microbial biofilms. The approach convincingly identifies a small subpopulation of cells at the biofilm's base with upregulated PdeI expression, offering invaluable insights into the biology of bacterial biofilms and the formation of persister cells. Further integrated analysis of gene interactions within these datasets could deepen our understanding of biofilm dynamics and resilience.

      Thank you for your valuable feedback and for recognizing the importance of our method for depleting ribosomal RNA from bacterial single-cell RNA sequencing libraries. We are pleased that our approach has convincingly identified a small subpopulation of cells at the base of the biofilm with upregulated PdeI expression, providing significant insights into the biology of bacterial biofilms and the formation of persister cells.

      We acknowledge your suggestion for a more comprehensive analysis of multiple genes and their interactions. While we conducted a broad analysis across the transcriptome, our decision to focus on the heterogeneously expressed gene PdeI was primarily informed by its critical role in biofilm biology. In addition to PdeI, we investigated other marker genes and noted that lptE and sstT exhibited potential associations with persister cells. However, our interaction analysis revealed that LptE and SstT did not demonstrate significant relationships with c-di-GMP and PdeI based on current knowledge. This insight led us to concentrate on PdeI, given its direct relevance to biofilm formation and its close connection to the c-di-GMP signaling pathway.

      We fully agree that other marker genes may also have important regulatory roles in different aspects of biofilm dynamics. Thus, we plan to explore the expression patterns and potential functions of these genes in our future research. Specifically, we intend to conduct more extensive gene network analyses to uncover the complex regulatory mechanisms involved in biofilm formation and resilience.

      Public Reviews:

      Reviewer #1 (Public review):

      Summary:

      In this manuscript, Yan and colleagues introduce a modification to the previously published PETRI-seq bacterial single cell protocol to include a ribosomal depletion step based on a DNA probe set that selectively hybridizes with ribosome-derived (rRNA) cDNA fragments. They show that their modification of the PETRI-seq protocol increases the fraction of informative non-rRNA reads from ~4-10% to 54-92%. The authors apply their protocol to investigating heterogeneity in a biofilm model of E. coli, and convincingly show how their technology can detect minority subpopulations within a complex community.

      Strengths:

      The method the authors propose is a straightforward and inexpensive modification of an established split-pool single cell RNA-seq protocol that greatly increases its utility, and should be of interest to a wide community working in the field of bacterial single cell RNA-seq.

      We sincerely thank the reviewer for their thoughtful and positive evaluation of our work. We appreciate the recognition of our modification to the PETRI-seq bacterial single-cell RNA sequencing protocol by incorporating a ribosomal depletion step. The significant increase in the fraction of informative non-rRNA reads, as noted in the reviewer’s summary, underscores the effectiveness of our method in enhancing the utility of the PETRI-seq approach. We are also encouraged by the reviewer's acknowledgment of our ability to detect minority subpopulations within complex biofilm communities. Our team is committed to further validating and optimizing this method, and we believe that RiboD-PETRI will contribute meaningfully to the field of bacterial single-cell transcriptomics. We hope this innovative approach will facilitate new discoveries in microbial ecology and biofilm research.

      Reviewer #2 (Public review):

      Summary:

      This work introduces a new method of depleting the ribosomal reads from the single-cell RNA sequencing library prepared with one of the prokaryotic scRNA-seq techniques, PETRI-seq. The advance is very useful since it allows broader access to the technology by lowering the cost of sequencing. It also allows more transcript recovery with fewer sequencing reads. The authors demonstrate the utility and performance of the method for three different model species and find a subpopulation of cells in the E.coli biofilm that express a protein, PdeI, which causes elevated c-di-GMP levels. These cells were shown to be in a state that promotes persister formation in response to ampicillin treatment.

      Strengths:

      The introduced rRNA depletion method is highly efficient, with the depletion for E.coli resulting in over 90% of reads containing mRNA. The method is ready to use with existing PETRI-seq libraries which is a large advantage, given that no other rRNA depletion methods were published for split-pool bacterial scRNA-seq methods. Therefore, the value of the method for the field is high. There is also evidence that a small number of cells at the bottom of a static biofilm express PdeI which is causing the elevated c-di-GMP levels that are associated with persister formation. This finding highlights the potentially complex role of PdeI in regulation of c-di-GMP levels and persister formation in microbial biofilms.

      Weaknesses:

      Given many current methods that also introduce different techniques for ribosomal RNA depletion in bacterial single-cell RNA sequencing, it is unclear what is the place and role of RiboD-PETRI. The efficiency of rRNA depletion varies greatly between species for the majority of the available methods, so it is not easy to select the best fitting technique for a specific application.

      Thank you for your insightful comments regarding the place and role of RiboD-PETRI in the landscape of ribosomal RNA depletion techniques for bacterial single-cell RNA sequencing. We appreciate the opportunity to address your concerns and clarify the significance of our method.

      We acknowledge that the field of rRNA depletion in bacterial single-cell RNA sequencing is diverse, with many methods offering different approaches. We also recognize the challenge of selecting the best technique for a specific application, given the variability in rRNA depletion efficiency across species for many available methods. In light of these considerations, we believe RiboD-PETRI occupies a distinct and valuable niche in this landscape due to following reasons: 1) Low-input compatibility: Our method is specifically tailored for the low-input requirements of single-cell RNA sequencing, maintaining high efficiency even with limited starting material. This makes RiboD-PETRI particularly suitable for single-cell studies where sample quantity is often a limiting factor. 2) Equipment-free protocol: One of the unique advantages of RiboD-PETRI is that it can be conducted in any lab without the need for specialized equipment. This accessibility ensures that a wide range of researchers can implement our method, regardless of their laboratory setup. 3) Broad species coverage: Through comprehensive probe design targeting highly conserved regions of bacterial rRNA, RiboD-PETRI offers a robust solution for samples involving multiple bacterial species or complex microbial communities. This approach aims to provide consistent performance across diverse taxa, addressing the variability issue you mentioned. 4) Versatility and compatibility: RiboD-PETRI is designed to be compatible with various downstream single-cell RNA sequencing protocols, enhancing its utility in different experimental setups and research contexts.

      In conclusion, RiboD-PETRI's unique combination of low-input compatibility, equipment-free protocol, broad species coverage, and versatility positions it as a robust and accessible option in the landscape of rRNA depletion methods for bacterial single-cell RNA sequencing. We are committed to further validating and improving our method to ensure its valuable contribution to the field and to provide researchers with a reliable tool for their diverse experimental needs.

      Despite transcriptome-wide coverage, the authors focused on the role of a single heterogeneously expressed gene, PdeI. A more integrated analysis of multiple genes and\or interactions between them using these data could reveal more insights into the biofilm biology.

      Thank you for your valuable feedback. We understand your suggestion for a more comprehensive analysis of multiple genes and their interactions. While we indeed conducted a broad analysis across the transcriptome, our decision to focus on the heterogeneously expressed gene PdeI was primarily based on its crucial role in biofilm biology. Beyond PdeI, we also conducted overexpression experiments on several other marker genes and examined their phenotypes. Notably, the lptE and sstT genes showed potential associations with persister cells. We performed an interaction analysis, which revealed that LptE and SstT did not show significant relationships with c-di-GMP and PdeI based on current knowledge. This finding led us to concentrate our attention on PdeI. Given PdeI's direct relevance to biofilm formation and its close connection to the c-di-GMP signaling pathway, we believed that an in-depth study of PdeI was most likely to reveal key biological mechanisms.

      We fully agree with your point that other marker genes may play regulatory roles in different aspects. The expression patterns and potential functions of these genes will be an important direction in our future research. In our future work, we plan to conduct more extensive gene network analyses to uncover the complex regulatory mechanisms of biofilm formation.

      Author response image 1.

      The proportion of persister cells in the partially maker genes and empty vector control groups. Following induction of expression with 0.002% arabinose for 2 hours, a persister counting assay was conducted on the strains using 150 μg/ml ampicillin.

      The authors should also present the UMIs capture metrics for RiboD-PETRI method for all cells passing initial quality filter (>=15 UMIs/cell) both in the text and in the figures. Selection of the top few cells with higher UMI count may introduce biological biases in the analysis (the top 5% of cells could represent a distinct subpopulation with very high gene expression due to a biological process). For single-cell RNA sequencing, showing the statistics for a 'top' group of cells creates confusion and inflates the perceived resolution, especially when used to compare to other methods (e.g. the parent method PETRI-seq itself).

      Thank you for your valuable feedback regarding the presentation of UMI capture metrics for the RiboD-PETRI method. We appreciate your concern about potential biological biases and the importance of comprehensive data representation in single-cell RNA sequencing analysis. We have now included the UMI capture metrics for all cells passing the initial quality filter (≥15 UMIs/cell) for the RiboD-PETRI method. This information has been added to both the main text and the relevant figures, providing a more complete picture of our method's performance across the entire range of captured cells. These revisions strengthen our manuscript and provide readers with a more complete understanding of the RiboD-PETRI method in the context of single-cell RNA sequencing.

      Recommendations for the authors:

      Reviewer #1 (Recommendations for the authors):

      The reviewers have responded thoughtfully and comprehensively to all of my comments. I believe the details of the protocol are now much easier to understand, and the text and methods have been significantly clarified. I have no further comments.

      Reviewer #2 (Recommendations for the authors):

      The authors edited the manuscript thoroughly in response to the comments, including both performing new experiments and showing more data and information. Most of the major points raised between both reviewers were addressed. The authors explained the seeming contradiction between c-di-GMP levels and PdeI expression. Despite these improvements, a few issues remain:

      - Despite now depositing the data and analysis files to GEO, the access is embargoed and the reviewer token was not provided to evaluate the shared data and accessory files.

      Please note that although the data and analysis files have been deposited to GEO, access is currently embargoed. To evaluate the shared data and accessory files, you will need a reviewer token, which appears to have not been provided.

      To gain access, please follow these steps:

      Visit the GEO accession page at: https://www.ncbi.nlm.nih.gov/geo/query/acc.cgi?acc=GSE260458

      In the designated field, enter the reviewer token: ehipgqiohhcvjev

      - Despite now discussing performance metrics for RiboD-PETRI method for all cells passing initial quality filter (>=15 UMIs/cell) in the text, the authors continued to also include the statistics for top 1000 cells, 5,000 cells and so on. Critically, Figure 2A-B is still showing the UMI and gene distributions per cell only for these select groups of cells. The intent to focus on these metrics is not quite clear, as selection of the top few cells with higher UMI count may introduce biological biases in the analysis (what if the top 5% of cells are unusual because they represent a distinct subpopulation with very high gene expression due to a biological process). I understand the desire to demonstrate the performance of the method by highlighting a few select 'best' cells, however, for single-cell RNA sequencing showing the statistics for a 'top' group of cells is not appropriate and creates confusion, especially when used to compare to other methods (e.g. the parent method PETRI-seq itself).

      We appreciate your insightful feedback regarding our presentation of the RiboD-PETRI method's performance metrics. We acknowledge the concerns you've raised and agree that our current approach requires refinement. We have revised our analysis to prominently feature metrics for all cells that pass the initial quality filter (≥15 UMIs/cell) (Fig. 2A, Fig. 3A, Supplementary Fig. 1A, B and Supplementary Fig. 2A, G). This approach provides a more representative view of the method's performance across the entire dataset, avoiding potential biases introduced by focusing solely on top-performing cells.​

      We recognize that selecting only the top cells based on UMI counts can indeed introduce biological biases, as these cells may represent distinct subpopulations with unique biological processes rather than typical cellular states. To address this, we have clearly stated the potential for bias when highlighting select 'best' cells. We also provided context for why these high-performing cells are shown, explaining that they demonstrate the upper limits of the method's capabilities (lines 139). In addition, when comparing RiboD-PETRI to other methods, including the parent PETRI-seq, we ensured that comparisons are made using consistent criteria across all methods.

      By implementing these changes, we aim to provide a more accurate, unbiased, and comprehensive representation of the RiboD-PETRI method's performance while maintaining scientific rigor and transparency. We appreciate your critical feedback, as it helps us improve the quality and reliability of our research presentation.

      - Line 151 " The findings reveal that our sequencing saturation is 100% (Fig. S1B, C)" - I suggest the authors revisit this calculation as this parameter is typically very challenging to get above 95-96%. The sequencing saturation should be calculated from the statistics of alignment themselves, i.e. the parameter calculated by Cell Ranger as described here https://kb.10xgenomics.com/hc/en-us/articles/115003646912-How-is-sequencing-saturation-calculated :

      "The web_summary.html output from cellranger count includes a metric called "Sequencing Saturation". This metric quantifies the fraction of reads originating from an already-observed UMI. More specifically, this is the fraction of confidently mapped, valid cell-barcode, valid UMI reads that are non-unique (match an existing cell-barcode, UMI, gene combination).

      The formula for calculating this metric is as follows:

      Sequencing Saturation = 1 - (n_deduped_reads / n_reads)

      where

      n_deduped_reads = Number of unique (valid cell-barcode, valid UMI, gene) combinations among confidently mapped reads.

      n_reads = Total number of confidently mapped, valid cell-barcode, valid UMI reads.

      Note that the numerator of the fraction is n_deduped_reads, not the non-unique reads that are mentioned in the definition. n_deduped_reads is a degree of uniqueness, not a degree of duplication/saturation. Therefore we take the complement of (n_deduped_reads / n_reads) to measure saturation."

      We appreciate your insightful comment regarding our sequencing saturation calculation. The sequencing saturation algorithm we initially employed was based on the methodology used in the BacDrop study (PMID: PMC10014032, https://pmc.ncbi.nlm.nih.gov/articles/PMC10014032/).

      We acknowledge the importance of using standardized and widely accepted methods for calculating sequencing saturation. As per your suggestion, we have recalculated our sequencing saturation using the method described by 10x Genomics. Given the differences between RiboD-PETRI and 10x Genomics datasets, we have adapted the calculation as follows:

      · n_deduped_reads: We used the number of UMIs as a measure of unique reads.

      · n_reads: We used the total number of confidently mapped reads.

      After applying this adapted calculation method, we found that our sequencing saturation ranges from 92.16% to 93.51%. This range aligns more closely with typical expectations for sequencing saturation in single-cell RNA sequencing experiments, suggesting that we have captured a substantial portion of the transcript diversity in our samples. We also updated Figure S1 to reflect these recalculated sequencing saturation values. We will also provide a detailed description of our calculation method in the methods section to ensure transparency and reproducibility. It's important to note that this saturation calculation method was originally designed for 10× Genomics data. While we've adapted it for our study, we acknowledge that its applicability to our specific experimental setup may be limited.

      We thank you for bringing this important point to our attention. This recalculation not only improves the accuracy of our reported results but also aligns our methodology more closely with established standards in the field. We believe these revisions strengthen the overall quality and reliability of our study.

      - Further, this calculated saturation should be taken into account when comparing the performance of the method in terms of retrieving diverse transcripts from cells. I.e., if the RiboD-Petri dataset was subsampled to the same saturation as the original PETRI-seq dataset was obtained with, would the median UMIs/cell for all cells above filter be comparable? In other words, does rRNA depletion just decreases the cost to sequence to saturation, or does it provide UMI capture benefits at a comparable saturation?

      We appreciate your insightful question regarding the comparison of method performance in terms of transcript retrieval diversity and the impact of saturation. To address your concerns, we conducted an additional analysis comparing the RiboD-PETRI and original PETRI-seq datasets at equivalent saturation levels besides our original analysis with equivalent sequencing depth.

      With equivalent sequencing depth, RiboD-PETRI demonstrates a significantly enhanced Unique Molecular Identifier (UMI) counts detection rate compared to PETRI-seq alone (Fig. 1C). This method recovered approximately 20175 cells (92.6% recovery rate) with ≥ 15 UMIs per cell with a median UMI count of 42 per cell, which was significantly higher than PETRI-seq's recovery rate of 17.9% with a median UMI count of 20 per cell (Figure S1A, B), indicating the number of detected mRNA per cell increased prominently.

      When we subsampled the RiboD-PETRI dataset to match the saturation level of the original PETRI-seq dataset (i.e., equalizing the n_deduped_reads/n_reads ratio), we found that the median UMIs/cell for all cells above the filter threshold was higher in the RiboD-PETRI dataset compared to the original PETRI-seq (as shown in Author response image 2). This observation can be primarily attributed to the introduction of the rRNA depletion step in the RiboD-PETRI method. ​Our analysis suggests that rRNA depletion not only reduces the cost of sequencing to saturation but also provides additional benefits in UMI capture efficiency at comparable saturation levels.​The rRNA depletion step effectively reduces the proportion of rRNA-derived reads in the sequencing output. Consequently, at equivalent saturation levels, this leads to a relative increase in the number of n_deduped_reads corresponding to mRNA transcripts. This shift in read composition enhances the capture of informative UMIs, resulting in improved transcript diversity and detection.

      In conclusion, our findings indicate that the rRNA depletion step in RiboD-PETRI offers dual advantages: it decreases the cost to sequence to saturation and provides enhanced UMI capture benefits at comparable saturation levels, ultimately leading to more efficient and informative single-cell transcriptome profiling.

      Author response image 2.

      At almost the same sequencing saturation (64% and 67%), the number of cells exceeding the screening criteria (≥15 UMIs ) and the median number of UMIs in cells in Ribod-PETRI and PETRI-seq data of exponential period E. coli (3h).

      - smRandom-seq and BaSSSh-seq need to also be discussed since these newer methods are also demonstrating rRNA depletion techniques. (https://doi.org/10.1038/s41467-023-40137-9 and https://doi.org/10.1101/2024.06.28.601229)

      Thank you for your valuable feedback. We appreciate the opportunity to discuss our method, RiboD-PETRI, in the context of other recent advances in bacterial RNA sequencing techniques, particularly smRandom-seq and BaSSSh-seq.

      RiboD-PETRI employs a Ribosomal RNA-derived cDNA Depletion (RiboD) protocol. This method uses probe primers that span all regions of the bacterial rRNA sequence, with the 3'-end complementary to rRNA-derived cDNA and the 5'-end complementary to a biotin-labeled universal primer. After hybridization, Streptavidin magnetic beads are used to eliminate the hybridized rRNA-derived cDNA, leaving mRNA-derived cDNA in the supernatant. smRandom-seq utilizes a CRISPR-based rRNA depletion technique. This method is designed for high-throughput single-microbe RNA sequencing and has been shown to reduce the rRNA proportion from 83% to 32%, effectively increasing the mRNA proportion four times (from 16% to 63%). While specific details about BaSSSh-seq's rRNA depletion technique are not provided in the available information, it is described as employing a rational probe design for efficient rRNA depletion. This technique aims to minimize the loss of mRNA during the depletion process, ensuring a more accurate representation of the transcriptome.

      RiboD-PETRI demonstrates significant enhancement in rRNA-derived cDNA depletion across both gram-negative and gram-positive bacterial species. It increases the mRNA ratio from 8.2% to 81% for E. coli in exponential phase, from 10% to 92% for S. aureus in stationary phase, and from 3.9% to 54% for C. crescentus in exponential phase. smRandom-seq shows high species specificity (99%), a minor doublet rate (1.6%), and a reduced rRNA percentage (32%). These metrics indicate its efficiency in single-microbe RNA sequencing. While specific performance metrics for BaSSSh-seq are not provided in the available information, its rational probe design approach suggests a focus on maintaining mRNA integrity during the depletion process.

      RiboD-PETRI is described as a cost-effective ($0.0049 per cell), equipment-free, and high-throughput solution for bacterial scRNA-seq. This makes it an attractive option for researchers with budget constraints. While specific cost information is not provided, the efficiency of smRandom-seq is noted to be affected by the overwhelming quantity of rRNAs (>80% of mapped reads). The CRISPR-based depletion technique likely adds to the complexity and cost of the method. Cost and accessibility information for BaSSSh-seq is not provided in the available data, making a direct comparison difficult.

      All three methods represent significant advancements in bacterial RNA sequencing, each offering unique approaches to the challenge of rRNA depletion. RiboD-PETRI stands out for its cost-effectiveness and demonstrated success in complex systems like biofilms. Its ability to significantly increase mRNA ratios across different bacterial species and growth phases is particularly noteworthy. smRandom-seq's CRISPR-based approach offers high specificity and efficiency, which could be advantageous in certain research contexts, particularly where single-microbe resolution is crucial. However, the complexity of the CRISPR system might impact its accessibility and cost-effectiveness. BaSSSh-seq's focus on minimizing mRNA loss during depletion could be beneficial for studies requiring highly accurate transcriptome representations, although more detailed performance data would be needed for a comprehensive comparison. The choice between these methods would depend on specific research needs. RiboD-PETRI's cost-effectiveness and proven application in biofilm studies make it particularly suitable for complex bacterial community analyses. smRandom-seq might be preferred for studies requiring high-throughput single-cell resolution. BaSSSh-seq could be the method of choice when preserving the integrity of the mRNA profile is paramount.

      In conclusion, while all three methods offer valuable solutions for rRNA depletion in bacterial RNA sequencing, RiboD-PETRI's combination of efficiency, cost-effectiveness, and demonstrated application in complex biological systems positions it as a highly competitive option in the field of bacterial transcriptomics.

      We have revised our discussion in the manuscript according to the above analysis (lines 116-119)

      - Ctrl and Delta-Delta abbreviations are used in main text but not defined there (lines 107-110).

      Thank you for your valuable feedback. We have now defined the abbreviations "Ctrl" and "Delta-Delta" in the main text for clarity.

      - The utility of Figs 2E and 3E is questionable - the same information can be conveyed in text.

      Thank you for your thoughtful observation regarding Figures 2E and 3E. We appreciate your feedback and would like to address the concerns you've raised.

      While we acknowledge that some of the information in these figures could be conveyed textually, we believe that their visual representation offers several advantages. Figures 2E and 3E provide a comprehensive visual overview of the pathway enrichment analysis for marker genes, which may be more easily digestible than a textual description. This analysis was conducted in response to another reviewer's request, demonstrating our commitment to addressing diverse perspectives in our research.

      These figures allow for a systematic interpretation of gene expression data, revealing complex interactions between genes and their involvement in biological pathways that might be less apparent in a text-only format. Visual representations can make complex data more accessible to readers with different learning styles or those who prefer graphical summaries. Additionally, including such figures is consistent with standard practices in our field, facilitating comparison with other studies. We believe that the pathway enrichment analysis results presented in these figures provide valuable insights that merit inclusion as visual elements.​ However, we are open to discussing alternative ways to present this information if you have specific suggestions for improvement.

    1. Author response:

      Reviewer #1 (Public review):

      Summary:

      This work investigated the role of CXXC-finger protein 1 (CXXC1) in regulatory T cells. CXXC1-bound genomic regions largely overlap with Foxp3-bound regions and regions with H3K4me3 histone modifications in Treg cells. CXXC1 and Foxp3 interact with each other, as shown by co-immunoprecipitation. Mice with Treg-specific CXXC1 knockout (KO) succumb to lymphoproliferative diseases between 3 to 4 weeks of age, similar to Foxp3 KO mice. Although the immune suppression function of CXXC1 KO Treg is comparable to WT Treg in an in vitro assay, these KO Tregs failed to suppress autoimmune diseases such as EAE and colitis in Treg transfer models in vivo. This is partly due to the diminished survival of the KO Tregs after transfer. CXXC1 KO Tregs do not have an altered DNA methylation pattern; instead, they display weakened H3K4me3 modifications within the broad H3K4me3 domains, which contain a set of Treg signature genes. These results suggest that CXXC1 and Foxp3 collaborate to regulate Treg homeostasis and function by promoting Treg signature gene expression through maintaining H3K4me3 modification.

      Strengths:

      Epigenetic regulation of Treg cells has been a constantly evolving area of research. The current study revealed CXXC1 as a previously unidentified epigenetic regulator of Tregs. The strong phenotype of the knockout mouse supports the critical role CXXC1 plays in Treg cells. Mechanistically, the link between CXXC1 and the maintenance of broad H3K4me3 domains is also a novel finding.

      Weaknesses:

      (1) It is not clear why the authors chose to compare H3K4me3 and H3K27me3 enriched genomic regions. There are other histone modifications associated with transcription activation or repression. Please provide justification.

      Thank you for highlighting this important point. We prioritized H3K4me3 and H3K27me3 because they are well-established markers of transcriptional activation and repression, respectively. These modifications provide a robust framework for investigating the dynamic interplay of chromatin states in Treg cells, particularly in regulating the balance between activation and suppression of key genes. While histone acetylation, such as H3K27ac, is linked to enhancer activity and transcriptional elongation, our focus was on promoter-level regulation, where H3K4me3 and H3K27me3 are most relevant. Although other histone modifications could provide additional insights, we chose to focus on these two to maintain clarity and feasibility in our analysis. We are happy to further elaborate on this rationale in the manuscript if necessary.

      (2) It is not clear what separates Clusters 1 and 3 in Figure 1C. It seems they share the same features.

      We apologize for not clarifying these clusters clearly. Cluster 1 and 3 are both H3K4me3 only group, with H3K4me3 enrichment and gene expression levels being higher in Cluster 1. At first, we divided the promoters into four categories because we wanted to try to classify them into four categories: H3K4me3 only, H3K27me3 only, H3K4me3-H3K27me3 co-occupied, and None. However, in actual classification, we could not distinguish H3K4me3-H3K27me3 co-occupied group. Instead, we had two categories of H3K4me3 only, with cluster 1 having a higher enrichment level for H3K4me3 and gene expression levels.

      (3) The claim, "These observations support the hypothesis that FOXP3 primarily functions as an activator by promoting H3K4me3 deposition in Treg cells." (line 344), seems to be a bit of an overstatement. Foxp3 certainly can promote transcription in ways other than promoting H3K3me3 deposition, and it also can repress gene transcription without affecting H3K27me3 deposition. Therefore, it is not justified to claim that promoting H3K4me3 deposition is Foxp3's primary function.

      We appreciate the reviewer’s thoughtful observation regarding our claim about FOXP3’s role in promoting H3K4me3 deposition. We acknowledge that FOXP3 is a multifunctional transcription factor with diverse mechanisms of action, including transcriptional activation independent of H3K4me3 deposition and transcriptional repression that does not necessarily involve H3K27me3 deposition.

      Our intention was not to imply that promoting H3K4me3 deposition is the exclusive or predominant function of FOXP3 but rather to highlight that this mechanism contributes significantly to its role in regulating Treg cell function. We agree that our wording may have overstated this point, and we will revise the text to provide a more nuanced interpretation. Specifically, we will clarify that our observations suggest FOXP3 can facilitate transcriptional activation, in part, by promoting H3K4me3 deposition, but this does not preclude its other regulatory mechanisms.

      (4) For the in vitro suppression assay in Figure S4C, and the Treg transfer EAE and colitis experiments in Figure 4, the Tregs should be isolated from Cxxc1 fl/fl x Foxp3 cre/wt female heterozygous mice instead of Cxxc1 fl/fl x Foxp3 cre/cre (or cre/Y) mice. Tregs from the homozygous KO mice are already activated by the lymphoproliferative environment and could have vastly different gene expression patterns and homeostatic features compared to resting Tregs. Therefore, it's not a fair comparison between these activated KO Tregs and resting WT Tregs.

      Thank you for this insightful comment and for pointing out the potential confounding effects associated with using Treg cells from homozygous Foxp3Cre/Cre (or Cre/Y) Cxxc1fl/fl mice. We agree that using Treg cells from _Foxp3_Cre/+ _Cxxc1_fl/fl (referred to as “het-KO”) and their littermate _Foxp3_Cre/+ _Cxxc1_fl/+ (referred to as “het-WT”) female mice would provide a more balanced comparison, as these Treg cells are less likely to be influenced by the activated lymphoproliferative environment present in homozygous KO mice.

      To address this concern, we will perform additional experiments using Treg cells isolated from _Foxp3_Cre/+ _Cxxc1_fl/fl (“het-KO”) and their littermate _Foxp3_Cre/+ _Cxxc1_fl/+ (“het-WT”) female mice. We will update the manuscript with these new data to provide a more accurate assessment of the impact of CXXC1 deficiency on Treg cell function.

      (5) The manuscript didn't provide a potential mechanism for how CXXC1 strengthens broad H3K4me3-modified genomic regions. The authors should perform Foxp3 ChIP-seq or Cut-n-Taq with WT and Cxxc1 cKO Tregs to determine whether CXXC1 deletion changes Foxp3's binding pattern in Treg cells.

      Thank you for your insightful comments and valuable suggestions. We greatly appreciate your recommendation to explore the potential mechanism by which CXXC1 enhances broad H3K4me3-modified genomic regions.

      In response, we plan to conduct CUT&Tag experiments for Foxp3 in both WT and Cxxc1 cKO Treg cells.

      Reviewer #2 (Public review):

      FOXP3 has been known to form diverse complexes with different transcription factors and enzymes responsible for epigenetic modifications, but how extracellular signals timely regulate FOXP3 complex dynamics remains to be fully understood. Histone H3K4 tri-methylation (H3K4me3) and CXXC finger protein 1 (CXXC1), which is required to regulate H3K4me3, also remain to be fully investigated in Treg cells. Here, Meng et al. performed a comprehensive analysis of H3K4me3 CUT&Tag assay on Treg cells and a comparison of the dataset with the FOXP3 ChIP-seq dataset revealed that FOXP3 could facilitate the regulation of target genes by promoting H3K4me3 deposition.

      Moreover, CXXC1-FOXP3 interaction is required for this regulation. They found that specific knockdown of Cxxc1 in Treg leads to spontaneous severe multi-organ inflammation in mice and that Cxxc1-deficient Treg exhibits enhanced activation and impaired suppression activity. In addition, they have also found that CXXC1 shares several binding sites with FOXP3 especially on Treg signature gene loci, which are necessary for maintaining homeostasis and identity of Treg cells.

      The findings of the current study are pretty intriguing, and it would be great if the authors could fully address the following comments to support these interesting findings.

      Major points:

      (1) There is insufficient evidence in the first part of the Results to support the conclusion that "FOXP3 functions as an activator by promoting H3K4Me3 deposition in Treg cells". The authors should compare the results for H3K4Me3 in FOXP3-negative conventional T cells to demonstrate that at these promoter loci, FOXP3 promotes H3K4Me3 deposition.

      We appreciate the reviewer’s critical observation regarding our claim about FOXP3’s role in promoting H3K4me3 deposition. We acknowledge that FOXP3 is a multifunctional transcription factor with diverse mechanisms of action, including transcriptional activation independent of H3K4me3 deposition and transcriptional repression that does not necessarily involve H3K27me3 deposition.

      Our intention was not to imply that promoting H3K4me3 deposition is the exclusive or predominant function of FOXP3 but rather to highlight that this mechanism contributes significantly to its role in regulating Treg cell function. We agree that our wording may have overstated this point, and we will revise the text to provide a more nuanced interpretation. Specifically, we will clarify that our observations suggest FOXP3 can facilitate transcriptional activation, in part, by promoting H3K4me3 deposition, but this does not preclude its other regulatory mechanisms.

      We will compare H3K4me3 levels at the promoter loci of interest between FOXP3-negative conventional T cells and FOXP3-positive regulatory T cells. This comparison will help elucidate whether FOXP3 directly promotes H3K4me3 deposition at these loci.

      (2) In Figure 3 F&G, the activation status and IFNγ production should be analyzed in Treg cells and Tconv cells separately rather than in total CD4+ T cells. Moreover, are there changes in autoantibodies and IgG and IgE levels in the serum of cKO mice?

      We appreciate the reviewer’s constructive feedback on the analyses presented in Figures 3F and 3G and the additional suggestion to investigate autoantibodies and serum immunoglobulin levels.

      Regarding Figures 3F and 3G, we agree that separating Treg cells and Tconv cells for analysis of activation status and IFN-γ production would provide a more precise understanding of the cellular dynamics in Cxxc1 cKO mice.

      To address this, we will reanalyze the data to examine Treg and Tconv cells independently and include these results in the revised manuscript.

      As for the changes in autoantibodies and serum IgG and IgE levels, we acknowledge that these parameters are important indicators of systemic immune dysregulation.

      We will now measure serum autoantibodies and immunoglobulin levels in Cxxc1 cKO mice and WT controls.

      (3) Why did Cxxc1-deficient Treg cells not show impaired suppression than WT Treg during in vitro suppression assay, despite the reduced expression of Treg cell suppression assay -associated markers at the transcriptional level demonstrated in both scRNA-seq and bulk RNA-seq?

      Thank you for your thoughtful question. We appreciate your interest in understanding the apparent discrepancy between the reduced expression of Treg-associated suppression markers at the transcriptional level and the lack of impaired suppression observed in the in vitro suppression assay.

      There are several potential explanations for this observation:

      (1) Functional Redundancy: Treg cell suppression is a complex, multi-faceted process involving various effector mechanisms such as cytokine production (e.g., IL-10, TGF-β), cell-cell contact, and metabolic regulation. Thus, even though the transcriptional signature of suppression-associated genes is altered, compensatory mechanisms may still allow Cxxc1-deficient Treg cells to retain functional suppression capacity under these specific in vitro conditions.

      (2) In Vitro Assay Limitations: The in vitro suppression assay is a simplified model of Treg function that may not capture all the complexities of Treg-mediated suppression in vivo. While we observed altered gene expression in Cxxc1-deficient Treg cells, this might not directly translate to a functional defect under the specific conditions of the assay. In vivo, additional factors such as cytokine milieu, cell-cell interactions, and tissue-specific environments may be required for full suppression, which could be missing in the in vitro assay.

      (4) Is there a disease in which Cxxc1 is expressed at low levels or absent in Treg cells? Is the same immunodeficiency phenotype present in patients as in mice?

      Thank you for your insightful question regarding the role of CXXC1 in Treg cells and its potential link to human disease. To our knowledge, no specific human disease has been identified where CXXC1 is expressed at low levels or absent specifically in Treg cells. There is currently no direct evidence of an immunodeficiency phenotype in human patients that parallels the one observed in Cxxc1-deficient mice.

      Reviewer #3 (Public review):

      In the report entitled "CXXC-finger protein 1 associates with FOXP3 to stabilize homeostasis and suppressive functions of regulatory T cells", the authors demonstrated that Cxxc1-deletion in Treg cells leads to the development of severe inflammatory disease with impaired suppressive function. Mechanistically, CXXC1 interacts with Foxp3 and regulates the expression of key Treg signature genes by modulating H3K4me3 deposition. Their findings are interesting and significant. However, there are several concerns regarding their analysis and conclusions.

      Major concerns:

      (1) Despite cKO mice showing an increase in Treg cells in the lymph nodes and Cxxc1-deficient Treg cells having normal suppressive function, the majority of cKO mice died within a month. What causes cKO mice to die from severe inflammation?

      Considering the results of Figures 4 and 5, a decrease in Treg cell population due to their reduced proliferative capacity may be one of the causes. It would be informative to analyze the population of tissue Treg cells.

      We thank the reviewer for this insightful comment and acknowledge the importance of understanding the causes of severe inflammation and early mortality in cKO mice. Based on our data and previous studies, we propose the following explanations:

      (1) Reduced Treg Proliferative Capacity: As shown in Figure 5I, the decreased proportion of FOXP3+Ki67+ Treg cells in cKO mice likely reflects impaired proliferative capacity, which may limit the expansion of functional Treg cells in response to inflammatory cues, particularly in peripheral tissues where active suppression is required.

      (2) Altered Treg Function and Activation: Cxxc1-deficient Treg cells exhibit increased expression of activation markers (Il2ra, Cd69) and pro-inflammatory genes (Ifng, Tbx21). This suggests a functional dysregulation that may impair their ability to suppress inflammation effectively, despite their presence in lymphoid organs.

      (3) Tissue Treg Populations: Although our study focuses on lymph node-resident Treg cells, tissue-resident Treg cells play a crucial role in maintaining local immune homeostasis. It is plausible that Cxxc1 deficiency compromises the accumulation or functionality of tissue Treg cells, contributing to uncontrolled inflammation in non-lymphoid organs. Unfortunately, we currently lack data on tissue Treg populations, which limits our ability to directly address this hypothesis.

      Regarding the suggestion to analyze tissue Treg populations, we agree that this would be an important next step in understanding the cause of the severe inflammation and early mortality in Cxxc1-deficient mice.

      We plan to perform detailed analyses of Treg cell populations in various tissues, including the gut, lung, and liver, to determine if there are specific defects in tissue-resident Treg cells that could contribute to the observed phenotype.

      (2) In Figure 5B, scRNA-seq analysis indicated that Mki67+ Treg subset are comparable between WT and Cxxc1-deficient Treg cells. On the other hand, FACS analysis demonstrated that Cxxc1-deficient Treg shows less Ki-67 expression compared to WT in Figure 5I. The authors should explain this discrepancy.

      Thank you for pointing out the apparent discrepancy between the scRNA-seq and FACS analyses regarding Ki-67 expression in Cxxc1-deficient Treg cells.

      In Figure 5B, the scRNA-seq analysis identified the Mki67+ Treg subset as comparable between WT and Cxxc1-deficient Treg cells. This finding reflects the overall proportion of cells expressing Mki67 transcripts within the Treg population. In contrast, the FACS analysis in Figure 5I specifically measures Ki-67 protein levels, revealing reduced expression in Cxxc1-deficient Treg cells compared to WT.

      To address this discrepancy more comprehensively, we will further analyze the scRNA-seq data to directly compare Mki67 mRNA expression levels between WT and Cxxc1-deficient Treg cells.

      In addition, the authors concluded on line 441 that CXXC1 plays a crucial role in maintaining Treg cell stability. However, there appears to be no data on Treg stability. Which data represent the Treg stability?

      We appreciate the reviewer’s observation and recognize that our wording may have been overly conclusive. Our data primarily highlight the impact of Cxxc1 deficiency on Treg cell homeostasis and transcriptional regulation, rather than providing direct evidence for Treg cell stability. Specifically, the downregulation of Treg-specific suppressive genes (Nt5e, Il10, Pdcd1) and the upregulation of pro-inflammatory markers (Gzmb, Ifng, Tbx21) indicate a shift in functional states. While these findings may suggest an indirect disruption in the maintenance of suppressive phenotypes, they do not constitute a direct measure of Treg cell stability.

      To address the reviewer’s concern, we will revise our conclusion to more accurately state that our data support a role for CXXC1 in maintaining Treg cell homeostasis and functional balance, without overextending claims about Treg cell stability. Thank you for bringing this to our attention, as it will help us improve the clarity and precision of our manuscript.

      (3) The authors found that Cxxc1-deficient Treg cells exhibit weaker H3K4me3 signals compared to WT in Figure 7. This result suggests that Cxxc1 regulates H3K4me3 modification via H3K4 methyltransferases in Treg cells. The authors should clarify which H3K4 methyltransferases contribute to the modulation of H3K4me3 deposition by Cxxc1 in Treg cells.

      Thank you for pointing out the need to clarify the role of H3K4 methyltransferases in the modulation of H3K4me3 deposition by CXXC1 in Treg cells.

      In our study, we found that Cxxc1-deficient Treg cells exhibit reduced H3K4me3 levels, as shown in Figure 7. CXXC1 has been previously reported to function as a non-catalytic component of the Set1/COMPASS complex, which contains H3K4 methyltransferases such as SETD1A and SETD1B. These methyltransferases are the primary enzymes responsible for H3K4 trimethylation.

      References:

      (1) Lee J.H., Skalnik D.G. CpG-binding protein (CXXC finger protein 1) is a component of the mammalian Set1 histone H3-Lys4 methyltransferase complex, the analogue of the yeast Set1/COMPASS complex. J. Biol. Chem. 2005; 280:41725–41731.

      (2). J. P. Thomson, P. J. Skene, J. Selfridge, T. Clouaire, J. Guy, S. Webb, A. R. W. Kerr, A. Deaton, R. Andrews, K. D. James, D. J. Turner, R. Illingworth, A. Bird, CpG islands influence chromatin structure via the CpG-binding protein Cfp1. Nature 464, 1082–1086 (2010).

      (3) Shilatifard, A. 2012. The COMPASS family of histone H3K4 methylases: mechanisms of regulation in development and disease pathogenesis. Annu. Rev. Biochem. 81:65–95.

      (4) Brown D.A., Di Cerbo V., Feldmann A., Ahn J., Ito S., Blackledge N.P., Nakayama M., McClellan M., Dimitrova E., Turberfield A.H. et al. The SET1 complex selects actively transcribed target genes via multivalent interaction with CpG Island chromatin. Cell Rep. 2017; 20:2313–2327.

      Furthermore, it would be important to investigate whether Cxxc1-deletion alters Foxp3 binding to target genes.

      Thank you for this important suggestion regarding the impact of Cxxc1 deletion on FOXP3 binding to target genes. We agree that understanding whether Cxxc1 deficiency affects FOXP3’s ability to bind to its target genes would provide valuable insight into the regulatory role of CXXC1 in Treg cell function.

      To address this, we plan to perform CUT&Tag experiments to assess FOXP3 binding profiles in Cxxc1-deficient versus wild-type Treg cells. These experiments will allow us to determine if Cxxc1 loss disrupts FOXP3’s occupancy at key regulatory sites, which may contribute to the observed functional impairments in Treg cells.

      (4) In Figure 7, the authors concluded that CXXC1 promotes Treg cell homeostasis and function by preserving the H3K4me3 modification since Cxxc1-deficient Treg cells show lower H3K4me3 densities at the key Treg signature genes. Are these Cxxc1-deficient Treg cells derived from mosaic mice? If Cxxc1-deficient Treg cells are derived from cKO mice, the gene expression and H3K4me3 modification status are inconsistent because scRNA-seq analysis indicated that expression of these Treg signature genes was increased in Cxxc1-deficient Treg cells compared to WT (Figure 5F and G).

      Thank you for the insightful comment. To clarify, the Cxxc1-deficient Treg cells analyzed for H3K4me3 modification in Figure 7 were indeed derived from Cxxc1 conditional knockout (cKO) mice, not mosaic mice.

      The scRNA-seq analysis presented in Figures 5F and G revealed an upregulation of Treg signature genes in Cxxc1-deficient Treg cells. This finding suggests that the loss of Cxxc1 drives these cells toward a pro-inflammatory, activated state, underscoring the pivotal role of CXXC1 in maintaining Treg cell homeostasis and suppressive function.

      Regarding the apparent discrepancy between the reduced H3K4me3 levels and the increased expression of these genes, it is important to note that H3K4me3 primarily functions as an epigenetic mark that facilitates chromatin accessibility and transcriptional regulation, acting as an upstream modulator of gene expression. However, gene expression levels are also influenced by downstream compensatory mechanisms and complex inflammatory environments. In this context, the reduction in H3K4me3 likely reflects the direct role of CXXC1 in epigenetic regulation, whereas the upregulation of gene expression in Cxxc1-deficient Treg cells may result as a side effect of the inflammatory environment.

      To further substantiate our findings, we performed RNA-seq analysis on Treg cells from Foxp3_Cre/+ _Cxxc1_fl/fl (“het-KO”) and their littermate _Foxp3_Cre/+ _Cxxc1_fl/+ (“het-WT”) female mice, as presented in Figure S6C. This analysis revealed a notable reduction in the expression of key Treg signature genes, including _Icos, Ctla4, Tnfrsf18, and Nt5e, in het-KO Treg cells. Importantly, the observed changes in gene expression were consistent with the altered H3K4me3 modification status, further supporting the epigenetic regulatory role of CXXC1. These results further emphasize the critical role of CXXC1 promotes Treg cell homeostasis and function by preserving the H3K4me3 modification.

    2. eLife Assessment

      This study presents important findings on the role of CXXC-finger protein 1 in regulatory T cell gene regulation and function. The evidence supporting the authors' claims is solid, with mostly state-of-the-art technology, although the inclusion of more mechanistic insights would have strengthened the study. The work will be of relevance to immunologists interested in regulatory T cell biology and autoimmunity.

    3. Reviewer #1 (Public review):

      Summary:

      This work investigated the role of CXXC-finger protein 1 (CXXC1) in regulatory T cells. CXXC1-bound genomic regions largely overlap with Foxp3-bound regions and regions with H3K4me3 histone modifications in Treg cells. CXXC1 and Foxp3 interact with each other, as shown by co-immunoprecipitation. Mice with Treg-specific CXXC1 knockout (KO) succumb to lymphoproliferative diseases between 3 to 4 weeks of age, similar to Foxp3 KO mice. Although the immune suppression function of CXXC1 KO Treg is comparable to WT Treg in an in vitro assay, these KO Tregs failed to suppress autoimmune diseases such as EAE and colitis in Treg transfer models in vivo. This is partly due to the diminished survival of the KO Tregs after transfer. CXXC1 KO Tregs do not have an altered DNA methylation pattern; instead, they display weakened H3K4me3 modifications within the broad H3K4me3 domains, which contain a set of Treg signature genes. These results suggest that CXXC1 and Foxp3 collaborate to regulate Treg homeostasis and function by promoting Treg signature gene expression through maintaining H3K4me3 modification.

      Strengths:

      Epigenetic regulation of Treg cells has been a constantly evolving area of research. The current study revealed CXXC1 as a previously unidentified epigenetic regulator of Tregs. The strong phenotype of the knockout mouse supports the critical role CXXC1 plays in Treg cells. Mechanistically, the link between CXXC1 and the maintenance of broad H3K4me3 domains is also a novel finding.

      Weaknesses:

      (1) It is not clear why the authors chose to compare H3K4me3 and H3K27me3 enriched genomic regions. There are other histone modifications associated with transcription activation or repression. Please provide justification.

      (2) It is not clear what separates Clusters 1 and 3 in Figure 1C. It seems they share the same features.

      (3) The claim, "These observations support the hypothesis that FOXP3 primarily functions as an activator by promoting H3K4me3 deposition in Treg cells." (line 344), seems to be a bit of an overstatement. Foxp3 certainly can promote transcription in ways other than promoting H3K3me3 deposition, and it also can repress gene transcription without affecting H3K27me3 deposition. Therefore, it is not justified to claim that promoting H3K4me3 deposition is Foxp3's primary function.

      (4) For the in vitro suppression assay in Figure S4C, and the Treg transfer EAE and colitis experiments in Figure 4, the Tregs should be isolated from Cxxc1 fl/fl x Foxp3 cre/wt female heterozygous mice instead of Cxxc1 fl/fl x Foxp3 cre/cre (or cre/Y) mice. Tregs from the homozygous KO mice are already activated by the lymphoproliferative environment and could have vastly different gene expression patterns and homeostatic features compared to resting Tregs. Therefore, it's not a fair comparison between these activated KO Tregs and resting WT Tregs.

      (5) The manuscript didn't provide a potential mechanism for how CXXC1 strengthens broad H3K4me3-modified genomic regions. The authors should perform Foxp3 ChIP-seq or Cut-n-Taq with WT and Cxxc1 cKO Tregs to determine whether CXXC1 deletion changes Foxp3's binding pattern in Treg cells.

    4. Reviewer #2 (Public review):

      FOXP3 has been known to form diverse complexes with different transcription factors and enzymes responsible for epigenetic modifications, but how extracellular signals timely regulate FOXP3 complex dynamics remains to be fully understood. Histone H3K4 tri-methylation (H3K4me3) and CXXC finger protein 1 (CXXC1), which is required to regulate H3K4me3, also remain to be fully investigated in Treg cells. Here, Meng et al. performed a comprehensive analysis of H3K4me3 CUT&Tag assay on Treg cells and a comparison of the dataset with the FOXP3 ChIP-seq dataset revealed that FOXP3 could facilitate the regulation of target genes by promoting H3K4me3 deposition.

      Moreover, CXXC1-FOXP3 interaction is required for this regulation. They found that specific knockdown of Cxxc1 in Treg leads to spontaneous severe multi-organ inflammation in mice and that Cxxc1-deficient Treg exhibits enhanced activation and impaired suppression activity. In addition, they have also found that CXXC1 shares several binding sites with FOXP3 especially on Treg signature gene loci, which are necessary for maintaining homeostasis and identity of Treg cells.

      The findings of the current study are pretty intriguing, and it would be great if the authors could fully address the following comments to support these interesting findings.

      Major points:

      (1) There is insufficient evidence in the first part of the Results to support the conclusion that "FOXP3 functions as an activator by promoting H3K4Me3 deposition in Treg cells". The authors should compare the results for H3K4Me3 in FOXP3-negative conventional T cells to demonstrate that at these promoter loci, FOXP3 promotes H3K4Me3 deposition.

      (2) In Figure 3 F&G, the activation status and IFNγ production should be analyzed in Treg cells and Tconv cells separately rather than in total CD4+ T cells. Moreover, are there changes in autoantibodies and IgG and IgE levels in the serum of cKO mice?

      (3) Why did Cxxc1-deficient Treg cells not show impaired suppression than WT Treg during in vitro suppression assay, despite the reduced expression of Treg cell suppression assay -associated markers at the transcriptional level demonstrated in both scRNA-seq and bulk RNA-seq?

      (4) Is there a disease in which Cxxc1 is expressed at low levels or absent in Treg cells? Is the same immunodeficiency phenotype present in patients as in mice?

    5. Reviewer #3 (Public review):

      In the report entitled "CXXC-finger protein 1 associates with FOXP3 to stabilize homeostasis and suppressive functions of regulatory T cells", the authors demonstrated that Cxxc1-deletion in Treg cells leads to the development of severe inflammatory disease with impaired suppressive function. Mechanistically, CXXC1 interacts with Foxp3 and regulates the expression of key Treg signature genes by modulating H3K4me3 deposition. Their findings are interesting and significant. However, there are several concerns regarding their analysis and conclusions.

      Major concerns:

      (1) Despite cKO mice showing an increase in Treg cells in the lymph nodes and Cxxc1-deficient Treg cells having normal suppressive function, the majority of cKO mice died within a month. What causes cKO mice to die from severe inflammation?

      Considering the results of Figures 4 and 5, a decrease in Treg cell population due to their reduced proliferative capacity may be one of the causes. It would be informative to analyze the population of tissue Treg cells.

      (2) In Figure 5B, scRNA-seq analysis indicated that Mki67+ Treg subset are comparable between WT and Cxxc1-deficient Treg cells. On the other hand, FACS analysis demonstrated that Cxxc1-deficient Treg shows less Ki-67 expression compared to WT in Figure 5I. The authors should explain this discrepancy.

      In addition, the authors concluded on line 441 that CXXC1 plays a crucial role in maintaining Treg cell stability. However, there appears to be no data on Treg stability. Which data represent the Treg stability?

      (3) The authors found that Cxxc1-deficient Treg cells exhibit weaker H3K4me3 signals compared to WT in Figure 7. This result suggests that Cxxc1 regulates H3K4me3 modification via H3K4 methyltransferases in Treg cells. The authors should clarify which H3K4 methyltransferases contribute to the modulation of H3K4me3 deposition by Cxxc1 in Treg cells.

      Furthermore, it would be important to investigate whether Cxxc1-deletion alters Foxp3 binding to target genes.

      (4) In Figure 7, the authors concluded that CXXC1 promotes Treg cell homeostasis and function by preserving the H3K4me3 modification since Cxxc1-deficient Treg cells show lower H3K4me3 densities at the key Treg signature genes. Are these Cxxc1-deficient Treg cells derived from mosaic mice? If Cxxc1-deficient Treg cells are derived from cKO mice, the gene expression and H3K4me3 modification status are inconsistent because scRNA-seq analysis indicated that expression of these Treg signature genes was increased in Cxxc1-deficient Treg cells compared to WT (Figure 5F and G).

    1. Author response:

      The following is the authors’ response to the original reviews.

      Public Reviews: 

      Reviewer #1 (Public Review): 

      Summary: 

      The manuscript by Rowell et al aims to identify differences in TCR recombination and selection between foetal and adult thymus in mice. Authors sequenced the unpaired bulk TCR repertoire in foetal and adult mice thymi and studied both TCRB and TCRa characteristics in the double positive (DP, CD4+CD8+) and single positive (SP4 CD4+CD8CD3+ and SP8 CD4-CD8+CD3+) populations. They identified age-related differences in TCRa and TCRB segment usage, including a preferential bias toward 3'TRAV and 5' TRAJ rearrangements in foetal cells compared to adults who had a larger perveance for 5'TRAV segments. By depleting the thymocyte population in adult thymi using hydrocortisone, the authors demonstrated that the repertoire became more foetal like, they therefore argue that the preferential 5'TRAV rearrangements in adults may be resulting from prolonged/progressive TCRa rearrangements in the adult thymocytes. In line with previous studies, Authors demonstrate that the foetal TCR repertoire was less diverse, less evenly distributed and had fewer non-template insertions while containing more clonal expansions. In addition, the authors claim that changes in V-J usage and CDR1 and CDR2 in the DP vs SP repertoires indicated that positive selection of foetal thymocytes are less dependent on interactions with the MHC. 

      Strengths: 

      Overall, the manuscript provides an extensive analysis of the foetal and adult TCR repertoire in the thymus, resulting in new insights in T cell development in foetal and adult thymi. 

      Weaknesses: 

      Three major concerns arise:

      (1) the authors have analysed TCR repertoires of only 4 foetal and 4 adult mice, considering the high spread the study may have been underpowered. 

      Given the concerns of the reviewer we have sequenced more libraries and added more data to include repertoires from 7 embryos and 6 young adults (biological replicates from different sorts). We believe that including more replicates has indeed strengthened our study. 

      Our experimental approach was to sequence TCR transcripts, and in studies using RNA-sequencing of inbred mice, often only 3 individuals (biological replicates) are sequenced.

      Our study sequenced from 7 foetal thymuses (generating TCRα and TCRβ repertoires from 4 FACS-sorted cell populations); 6 adult thymuses (generating TCRα and TCRβ repertoires from 4 FACS-sorted cell populations); and 5 adult thymuses from hydrocortisone-treated mice (generating TCRα and TCRβ repertoires from FACS-sorted CD3lo and CD3hi DP populations). We thus analysed 124 distinct repertoires from different populations and libraries, and many tens of thousands of unique sequences.  

      (2) Gating strategies are missing and 

      We have included gating strategies for cell-sorting as SFig7 and SFig8.

      (3) the manuscript is very technical and clearly aimed for a highly specialised audience with expertise in both thymocyte development and TCR analysis. Authors are recommended to provide schematics of the TCR rearrangements/their findings and include a summary conclusions/implications of their findings at the end of each results section rather than waiting till the discussion. This will help the reader to interpret their findings while reading the results. 

      We have modified the manuscript to include a more general introductory paragraph (page 3) to introduce the reader to the topic and we have included brief summaries of the findings at the end of each result section (pages 7,9,10,12,13,15).

      Reviewer #2 (Public Review): 

      Summary: 

      The authors comprehensively assess differences in the TCRB and TCRA repertoires in the fetal and adult mouse thymus by deep sequencing of sorted cell populations. For TCRB and

      TCRA they observed biased gene segment usage and less diversity in fetal thymocytes. The TCRB repertoire was less evenly distributed and displayed more evidence of clonal expansions and repertoire sharing among individuals in fetal thymocytes. In both fetal and adult thymocytes they show skewing of V segment (CDR1-2) repertoires in CD4 and CD8 as compared to DP thymocytes, which they attribute to MHC-I vs MHC-II restriction during positive selection. However the authors assess these effects to be weaker in fetal thymocytes, suggesting weaker MHC-restriction. They conclude that in multiple respects fetal repertoires are distinct from and more innate-like than adult. 

      Strengths: 

      The analyses of the F18.5 and adult thymic repertoires are comprehensive with respect to the cell populations analyzed and the diversity of approaches used to characterize the repertoires. Because repertoires were analyzed in pre- and post-selection thymocyte subsets, the data offer the potential to assess repertoire selection at different developmental stages. The analysis of repertoire selection in fetal thymocytes may be unique. 

      Weaknesses: 

      (1) Problematic experimental design and some lack of familiarity with prior work have resulted in highly problematic interpretations of the data, particularly for TCRA repertoire development. 

      The authors note fetal but not adult thymocytes to be biased towards usage of 3' V segments and 5'J segments. It should be noted that these basic observations were made 20 years ago using PCR approaches (Pasqual et al., J.Exp.Med. 196:1163 (2002)), and even earlier by others.

      We have cited this manuscript (Introduction, page 5) which used PCR of genomic DNA to investigate some TCRα VJ rearrangements in foetal and adult thymus. In contrast, our study uses next generation sequencing of transcripts to investigate all possible combinations of TCRα and TCRβ VJ combinations in different sorted thymocyte populations ex vivo. The greater sensitivity of this more modern technology has thus enabled us to detect many more TCRαVJ rearrangements than the 2002 study, and to conclude on basis of stringent statistical testing that the foetal repertoire is enriched for 3’V to 5’J combinations (Fig. 4). 

      The authors also note that in fetal thymus this bias persists after positive selection, and it can be reproduced in adults during recovery from hydrocortisone treatment. The authors conclude that there are fewer rounds of sequential TCRA rearrangements in the fetal thymus, perhaps due to less time spent in the DP compartment in fetus versus adult. However, the repertoire difference noted by the authors does not require such an explanation. What the authors are analyzing in the fetus is the leading edge of a synchronous wave of TCRA rearrangements, whereas what they are analyzing in adults is the unsynchronized steady state distribution. It is certainly true, as has been shown previously, that the earliest TCRA rearrangements use 3' TRAV and 5'TRAJ segments. But analysis of adult thymocytes has shown that the progression from use of 3' TRAV and 5' TRAJ to use of 5' TRAV and 3' TRAJ takes several days (Carico et al., Cell Rep. 19:2157 (2017)). The same kinetics, imposed on fetal development, would put development of a more complete TCRA repertoire at or shortly after birth. In fact, Pasqual showed exactly this type of progression from F18 through D1 after birth, and could reproduce the progression by placing F16 thymic lobes in FTOC. It is not appropriate to compare a single snapshot of a synchronized process in early fetal thymocytes to the unsynchronized steady state situation in adults. In fact, the authors' own data support this contention, because when they synchronize adult thymocytes by using hydroxycortisone, they can replicate the fetal distribution. Along these lines, the fact that positive selection of fetal thymocytes using 3' TRAV and 5' TRAJ segments occurs within 2 days of thymocyte entry into the DP compartment does not mean that DP development in the fetus is intrinsically rapid and restricted to 2 days. It simply means that thymocytes bearing an early rearranging TCR can be positively selected shortly after TCR expression. The expectation would be that those DP thymocytes that had not undergone early positive selection using a 3' TRAV and a 5' TRAJ would remain longer in the DP compartment and continue the progression of TCRA rearrangements, with the potential for selection several days later using more 5'TRAV and 3'TRAJ. 

      We agree with this summary provided by the reviewer which corresponds closely to the points we made ourselves in the manuscript. Indeed, we discuss the synchronization and kinetics of first wave of T-cell development in Results page 13 and Discussion page 17, which was the rationale for the hydrocortisone experiment.  We have also discussed findings from Carico et al 2017 in this context (see pages 13, 16, 17).  

      (2) The authors note 3' V and 5'J biases for TCRB in fetal thymocytes. The previously outlined concerns about interpreting TCRA repertoire development do not directly apply here. But it would be appropriate to note that by deep sequencing, Sethna (PNAS 114:2253 (2017)) identified skewed usage of some of the same TRBV gene segments in fetal versus adult.  It should also be noted that Sethna did not detect significantly skewed usage of TRBJ  segments. Regardless, one might question whether the skewed usage of TRBJ segments detected here should be characterized as relating to chromosomal location. There are two logical ways one can think about chromosomal location of TRBJ segments - one being TRBJ1 cluster vs TRBJ2 cluster, the other being 5' to 3' within each cluster. The variation reported here does not obviously fit either pattern. Is there a statistically significant difference in aggregate use of the two clusters? There is certainly no clear pattern of use 5' to 3' across each cluster. 

      We have included a statistical comparison of the aggregate TRBJ use between the J1 cluster and the J2 cluster (see SFig5) and Results page 9. 

      (3) The authors show that biases in TCRA and TCRB V and J gene usage between fetal and adult thymocytes are mostly conserved between pre- and post-selection thymocytes (Fig 2). In striking contrast, TCRA and TCRB combinatorial repertoires show strong biases preselection that are largely erased in post-selection thymocytes (Fig 3). This apparent discrepancy is not addressed, but interpretation is challenging. 

      I think the reviewer is referring to heatmaps for individual gene segment usage shown in Figure 2 in comparison to combinatorial usage shown in Figure 4. There is not a discrepancy in the data, but rather the differences between these two figures lie in the way in which the comparisons are made and visualised.  The heatmaps in Figure 2A-D show mean proportional usage of each individual gene segment for each cell type in the two life stages, clustered by Euclidian distance. This visualisation clearly shows bias in foetal 3’ TRAV usage and 5’TRAJ usage (looking at areas of red, which have higher usage), with less pronounced enrichment for TRBV and TRBJ.  The heatmaps also show differences in intensity between different cell populations in each life-stage. 

      In contrast, in Figure 4 the tiles show combinations with statistically significant (P<0.05) differences in mean counts for each VJ combination in each cell type between 7 foetal and 6 adult repertoires by Student’s t-test, after correcting for False discovery rate (FDR) due to multiple combinations.  It is the case, that there are fewer significant differences in proportional combinatorial VxJ use between foetal and adult repertoires after selection. We find this an interesting finding and have expanded our discussion of this aspect of the data (page 10).  More than half of the significant differences persist after repertoire selection, and the reduction in each individual SP population, of course in part reflects the lineage divergence.

      (4) The observation that there is a higher proportion of nonproductive TCRB rearrangements in fetal thymus compared to adult is challenging to interpret, given that the results are based upon RNA sequencing so are unlikely to reflect the ratio in genomic DNA due to processes like NMD.

      We have added two sentences to explain that transcripts of non-productive rearrangements are eliminated by nonsense-mediated decay (NMD), but some non-productive transcripts are detected in many studies of TCR repertoire sequencing, and we have cited three studies from different groups that document this (see Results, page 10-11). We have not commented on how the increase in non-productive TCR rearrangements in the foetal populations (in comparison to adult) relates to rearrangements in genomic DNA or NMD.   We have likewise not commented on the possible significance or biological role of nonproductive TCR transcripts, but simply reported our findings.

      (5) An intriguing and paradoxical finding is that fetal DP, CD4 and CD8 thymocytes all display greater sharing of TCRB CDR3 sequences among individuals than do adults (Fig 5DE), whereas DP and CD8 thymocytes are shown to display greater CDR3 amino acid triplet motif sharing in adults (with a similar trend in CD4). 

      As foetal DP, CD4SP and CD8SP TCRbeta repertoires have fewer non-template insertions and lower means CDR3 length, they are expected to share more CDR3 repertoires than their adult counterparts.  However, in the case of CDR3 amino acid triplet motifs (k-mers) what is being analysed is the sharing of each possible individual k-mer. If k-mers are shared more in the adult for some populations, but CDR3 repertoires are shared more in the foetus, we think it means that some k-mers appear in many different CDR3 sequences in the adult, so that they are over-represented in multiple different CDR3s (presumably due to selection processes, although we agree that this is just an assumption).  

      The authors attribute high amino acid triplet sharing to the result of selection of recurrent motifs by contact with pMHC during positive selection. But this interpretation seems highly problematic because the difference between fetal and adult thymocytes is dramatic even in unfractionated DP thymocytes, the vast majority of which have not yet undergone positive selection. How then to explain the differences in CDR3 sharing visualized by the different approaches? 

      The TCRβ repertoire has been selected in the adult DP population through the process of β-selection, which is believed to involve immune synapse formation and MHC-interactions (Allam et al 2021,10.1083/jcb.201908108). We have now included this reference in the introduction to make this clear (page 4). However, we agree with the reviewer’s comments that it is challenging to explain the k-mer analysis and that we have not been able to actually show that increased k-mer sharing in the adult is a direct consequence of increased positive selection: it was our interpretation of this seemingly paradoxical finding.  For clarity, we have therefore removed the k-mer analyses from the manuscript.

      (6) The authors conclude that there is less MHC restriction in fetal thymocytes, based on measures of repertoire divergence from DP to CD4 and CD8 populations (Fig. 6). But the authors point to no evidence of this in analysis of TRBV usage, either by PC or heatmap analyses (A,B,D). The argument seems to rest on PC analysis of TRAV usage (Fig S6), despite the fact that dramatic differences in the SP4 and SP8 repertoires are readily apparent in the fetal thymocyte heatmaps. The data do not appear to be robust enough to provide strong support for the authors' conclusion. 

      We have written the text very carefully so as not to make the claim too strong, stating in the abstract: “In foetus we identified less influence of MHC-restriction on α-chain and β-chain combinatorial VxJ usage and CDR1xCDR2 (V region) usage in SP compared to adult, indicating weaker impact of MHC-restriction on the foetal TCR repertoire.” We are not saying that MHC-restriction does not impact VJ gene usage in foetal repertoires, but rather that it has less influence (particularly when compared to life-stage).  Evidence for this comes from:  [1] Heatmaps in Fig2A-D which show that all repertoires cluster first by life-stage ahead of cell type; [2] Fig3A and B: PCA of adult and foetal TCRβ VXJ combinations: All repertoires cluster by life-stage on PC1.  PC2 separates adult repertoires by cell type (adult SP8 are positive on PC2 while adult SP4 are negative on PC2, and DP cells are between them) but for foetal repertoires the SP8 and SP4 are highly dispersed with some SP4 cells falling on positive side of PC2.  Only foetal DP repertoires cluster tightly. [3] Fig6A-C: PCA of β−chain CDR1xCDR2 (corresponding to Vβ gene segment usage) again shows the same pattern.  Adult repertoires separate by cell type on PC2, (SP8 positive on PC2, SP4 negative on PC2, with DP in between), but foetal SP8 repertoires are much more dispersed.  [5] SFig6J-K: PCA of α−chain CDR1xCDR2 (Vα usage) frequency distributions: adult repertoires cluster together and are separated by cell type on PC2 (SP4 positive, SP8 negative), but foetal populations are highly dispersed and fail to cluster by cell type on either axis. [6] We have additionally added new PCA analyses to explore differences in MHC-restriction between foetal and adult SP populations.  This is shown in the new Figure 7. We reasoned that in a PCA that included foetal and adult repertoires together, the foetal repertoires might not segregate by SP cell type (MHC-restriction) because of their overall bias towards particular VJ combinations, which would mean that effectively the PCA would be imposing adult MHC restriction on the foetal repertoires.  We therefore carried out PCA in which we analysed the adult repertoires separately from the foetal repertoires.  As expected for adult repertoires, PCA separated SP4 repertoires from SP8 repertoires on PC1 in each comparison (β-chain VxJ (Fig. 7B), α-chain VxJ (Fig. 7F), β-chain CDR1xCDR2 (V region) (Fig. 7H) and α-chain CDR1xCDR2 (V region) (Fig. 7L)). In contrast, for foetal TCRα repertoires (α-chain VxJ and α-chain CDR1xCDR2 (V region)), PCA failed to separate SP4 from SP8 repertoires on PC1 or PC2, so we did not detect impact of MHC-restriction on foetal TCRβ repertoires (Fig. 7E and K).  For foetal TCRβ repertoires, PCA separated SP4 β-chain VxJ from SP8 on PC2, accounting for only 11.1% of variance (Fig. 7A) (in contrast to the 44.2% of variance accounted for by MHC-restriction in adult β-chain VxJ PCA (Fig. 7B)). Thus, in adult repertoires ~4-fold more of the variance in β-chain VxJ usage can be accounted for by MHC-restriction than in foetal repertoires. PCA of foetal β-chain CDR1xCDR2 (V region) separated SP4 from SP8 on PC1, accounting for 28.8% of variance, whereas in PCA of adult β-chain CDR1xCDR2, MHCrestriction accounted for 56.1% (>2-foldmore than in foetus).  Thus, even when we  considered only V-region usage alone, we detected a stronger influence of MHC-restriction on the TCRβ repertoire in adult compared to foetal thymus.  

      Reviewer #3 (Public Review): 

      Summary:

      This study provides a comparison of TCR gene segment usage between foetal and adult thymus.

      Strengths:

      Interesting computational analyses was performed to find interesting differences in TCR gene usage within unpaired TCRa and TCRb chains between foetal and adult thymus.  

      Weaknesses:

      This study was significantly lacking insight and interpretation into what the data analysed actually means for the biology. The dataset discussed in the paper is from only two experiments. One comparing foetal and adult thymi from 4 mice per group and another which involved hydrocortisone treatment. The paper uses TCR sequencing methodology that sequences each TCR alpha and beta chains in an unpaired way, meaning that the true identity of the TCR heterodimer is lost. This also has the added problem of overestimating clonality, and underestimating diversity.
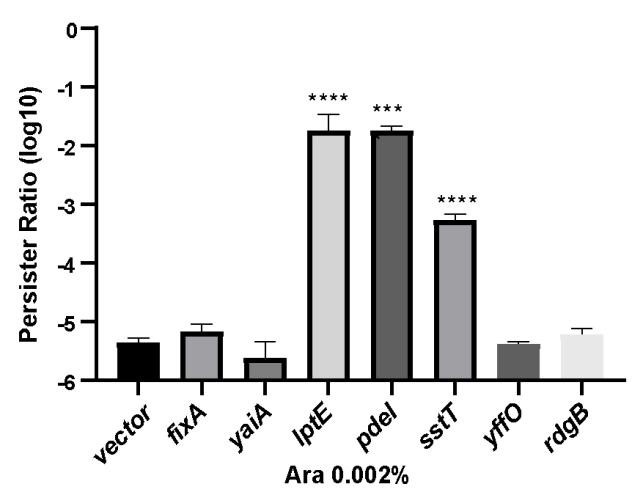
      We have discussed the limitations and benefits of our approach of sequencing TCRβ and TCRα repertoires separately in the Discussion (page 19).  This approach allows the analysis of thousands of sequences from different cell types and different individuals at relatively low cost. We have made no claims in our manuscript about overall diversity or pairing, and given that each chain’s gene locus rearranges at a different time point in development, we believe it is of interest to consider the repertoires individually within this context.

      Limited detail in the methods sections also limits the ability for readers to properly interpret the dataset. What sex of mice were used? Are there any sex differences? What were the animal ethics approvals for the study?

      We have included this information in the Methods (page 19).  Both sexes were used and we found no sex differences, although that was not the focus of our study. All animal experimentation in the UK is carried out under UK Home Office Regulations (following ethical review). This is included in the Methods (page 19).  

      Recommendations for the authors:  

      Reviewer #1 (Recommendations For The Authors): 

      Major points: 

      - Group sizes are very small (4 foetal and 4 adult mice). Considering the spread in TCR analysis (eg fig 1 B-H, Sup figures 2-4), the study is likely underpowered as it often looks like one mouse prevents or supports a statistical difference. Authors should therefore consider increasing the group size. 

      We have sequenced more libraries and included more data, from 7 foetal and 6 young adult animals (biological replicates).  

      - The authors should include a gating strategy for their sorted cells. This is essential to verify the quality of their findings. 

      We have added this to the Methods and SFig7 and SFig8.

      Authors should include a summary sentence at the end of each result section which interprets the main finding. Furthermore, the manuscript would greatly benefit from a schematic figure of their main findings, particularly with regards to the rearrangements and selection differences in foetal and adult thymi. 

      We have added a summary sentence to the end of each results section.

      - Authors should be more careful with their claim that MHC has less of an effect foetal TCR selection. Authors demonstrated that there is a difference in VJ recombination between the foetal and adult TCR repertoire, skewing the foetal TCR repertoire to certain variable and junctional segments. Since both CDR1 and CDR2 are encoded by the variable gene, this is likely to affect their ability to interact with the MHC during positive selection. Have Authors considered whether the selection process is actually a bystander effect of the differences in the rearrangement process? One way to support the authors claim is to demonstrate that mice with an alternative MHC background, have similar foetal/adult gene rearrangements but a different TCR repertoire in the SP populations. 

      Time and resources have prevented us from repeating our experiments in another strain of inbred mice.  However, we note that a previous PCR study that showed 3’TRAV to 5’TRAJ bias in foetal repertoires was carried out in BALB/c mice (Pasqual JEM 2002). We have added this point to the Discussion (page 17). 

      - (supplementary) tables have not been provided. 

      Supplementary Tables were uploaded with the submission.  STables 1 and 2 show antibodies used for cell sorts and STable 3 primers used.

      Moderate points: 

      - The loading plots in Figure 3 onward are visually strong. Authors could consider including an V and J (separate) loading plots for Figure 3 E, F and G to demonstrate preferential V and J usage. 

      We have included additional loading plots in Figure 7 for the new PCA we have added (see Fig. 7C, D,I and J).

      - "the proportion of non-productive rearrangements was higher in the foetal SP8 population than adults (Fig 5A)" Authors should explain how non-productive TCRs end up in SP populations as they need to pass positive and negative selection which both require interactions between the TCR and the MHC. 

      As we used RNA sequencing in our study, we did not comment on how the increase in nonproductive TCRbeta rearrangements in the foetal populations (in comparison to adult) relates to rearrangements in genomic DNA or to nonsense-mediated decay (NMD) that is believed to down-regulate transcripts of non-productively rearranged TCR.  We have not commented on the possible significance or biological role of non-productive TCR transcripts, but simply reported our findings. 

      - Authors have studied CDR3 sequential amino acid triplets (k-mers). However, CDR3 regions are longer than 3 amino acids in length, hence authors should provide 1) an overview/comparison of the identified k-mers in foetal or adult thymocytes 2) explain how different k-mers relate to each other, eg whether they are expressed in the same TCR. Have authors considered using alternative programs to identify CDR3 motifs that are based on the full CDR3amino acid sequence, eg TCRdist provides motifs and indicated which amino acids are germline encoded or inserted. 

      In light of this comment from this reviewer and also comments from Reviewer 2, we have removed the comparison of k-mers from the manuscript.  Please see response to point 5 of Reviewer 2.  

      - The term "innate-like" is confusing as it implies that foetal cells are not antigen specific.

      However, once in the circulation, foetal cells will respond in an antigen-specific manner.

      Hence authors should use another term. 

      We have removed the term “innate-like” from the abstract and the first time we used it in the first paragraph of the Discussion. However, the second time we used the term, we are actually taking it from the manuscript we cited (Beaudin et al 2016) and in this case we left it in. We agree that foetal cells are likely to respond in an antigen-specific manner. 

      - To support their hypothesis in the discussion "However, as TCRd gene segments are nested.... so that 5' TRAV segments are not favoured" can authors confirm that there are indeed less yd T cells in the foetal repertoire? 

      We have removed this section from the discussion, because although it is interesting, it is highly speculative, and the manuscript is already quite complicated to interpret.

      Minor points: 

      - The authors may find the publication by De Greef 2021 PNAS of interest to identify TRBD segments 

      - Authors need to clarify that they mean CDR3-beta in the sentence "The mean predicted CDR3 length.... compared to young adult" 

      We have included new data in the manuscript to show that mean CDR3 length is lower in all foetal populations of beta (Fig5C) and alpha (SFig5C) and clarified which we are referring to in the text. 

      - Authors should bring the section "During TCRb gene rearrangement, these segments.... Initiating the sequence of rearrangements" forward and include a schematic." Forward to figure 2 and provide the reader with a visual schematic of the foetal vs adult recombination events. 

      - Discussion: "The first wave of foetal abT-cells that leave the thymus... tolerant to both self and maternal MHC/antigens". Have Authors considered the alternative hypothesis published by Thomas 2019 in Curr Opin System Biol that the observed bias could potentially provide better protection against childhood pathogens? 

      We have indeed considered this, as stated in the first paragraph of the Discussion “The first wave of foetal αβT-cells that leave the thymus must provide early protection against infection in the neonatal animal”. We have now cited the Thomas 2019 study.

      - Discussion: Authors should rephrase the sentence "The transition from DP to SP cell in the foetus.... From DN3 to SP cell may be slower" as it is unclear what the authors mean. 

      We have rephrased this (see page 17)

      - Discussion "TRAV and TRAJ Array" do authors mean "TRAV and TRAJ area"? 

      We did indeed mean array (as in series of gene segments) but we have changed the wording for clarity (page 14).

      - Methods, Fluorescence activated cell sorting: can authors clarify whether they stained, sorted and sequenced the full thymus and /or specify how many cells were included. Can authors also explain why foetal and adult cells were treated differently (eg the volume of master mix)? 

      - Methods Fluorescence activated cell sorting authors should specify what they mean with "mastermix of either 1:50 (foetal thymus) or 1:100 (adult thymus)". Does this mean all antibodies in the foetal mastermix were 1:50 and all antibodies in the adult master mix were 1:100? If so, why were different concentrations used and why were antibodies not individually titrated before use?  

      We have clarified the methods and antibodies used are listed with clones in supplementary tables.

      Figures: 

      - Several figures did not fit on the page and therefore missed the top or side 

      - Figure 1A: missing a label on the Y axis

      This is visible

      - Figure 2A-D: please indicate the 5' and 3' terminus in each graph. The cell type legend should include two separate colours for the two DP populations. 

      We have added 5’ and 3’ labels.  The two DP populations are clearly labelled.

      - Figure 4: please indicate the 5' and 3' terminus in each graph. 

      We have added 5’ and 3’ labels.   

      - Figure 5C: y axis should read mean CDR3B length (aa), Figure 5D and E: y axis should read Jaccard Index CDR3B, Figure 5 F and G: y axis should read Jaccard index CDR3B k-mers. Same comment for Sup Fig 5 but then CDR3a. 

      We have added these labels for both Figure 5 and Supplementary Figure 6 (was SFig5 previously).

      - Figure 6C top label should read CDR1B x CDR2B with highest contribution 

      We have added this label.

      - Figure 7: please indicate the 5' and 3' terminus in each graph. 

      We have added 5’ and 3’ labels.  This is now Figure 8, as we have added new analyses (new Figure 7).

      - Supplementary Figure 1-4 are missing a colour legend next to the graphs.

      We have added the legends in.  

      Reviewer #2 (Recommendations For The Authors): 

      (1) The authors need to provide better support for the notion that the fetal thymus produces ab T cells with properties and functions that are distinct from adult T cells. There are several  ways they might provide a more meaningful assessment: (1) They could analyze the fetal repertoire at multiple time points. (2) They could compare instead the steady state distributions in early postnatal and adult thymus samples. (3) They could compare the peripheral T cell repertoires in the first week of life versus adult. This last approach would allow them to draw the most impactful conclusion. 

      We appreciate these suggestions.  Sadly, it is beyond our budget for the current manuscript and beyond the scope of our current study that we believe provides interesting new information.

      (2) Fig S2D shows TRBJ1-4 in black lettering meant to indicate no significant difference whereas the figure shows use of this gene segment to be elevated in adult. I believe TRBJ1-4 should be in blue lettering.

      This is now coloured correctly.

      (3) The figure call out on p11 (Fig5I-J) should be H-I.

      This is now corrected.

      (4) Please indicate in the main text that Jaccard analysis in Fig 5 D-E is for TCRB.

      This is now corrected.

      (5) The analysis of usage of TCRB CDR1xCDR2 combinations in Fig6D is said to "reflect the bias observed in their TRBV gene usage (Fig 2C)". Isn't it the case that every TRBV gene presents a distinct CDR1xCDR2 combination, meaning that there is no difference between TRBV usage and TRBV CDR1xCDR2 usage? If so, please make this clearer.

      Yes, this is the case, we have made this clearer in the text.

      Reviewer #3 (Recommendations For The Authors): 

      In general, although there is lots of interesting analyses that can be done with these large datasets, I feel as though the authors did not fully interpret the real meaning and significance of many of these results. Whilst there were some speculation on why a foetal repertoire might be different to those of adults in the discussion sections, the rationale for each individual analyses was not clearly explained. I would suggest that the rationale and a thorough explanation of each analyses be added to the results section, including a finishing sentence on what it means. 

      We have added short summaries to each results section to make the points we are making clearer.

      The authors did not mention how many cells were sorted for from each thymus for sequencing. Was the cell number normalised between each population? As this might have an influence on various downstream measurements of diversity, evenness and clonality, if there is a sampling issue. 

      This is explained in the methods.  We used sampling to allow comparisons between repertoires of different sizes, and this is also explained in the methods.

      The authors should include the cell sorting profiles and example flow cytometry plots, including gating strategies and the post sort purity of each sorted population. 

      We have included sorting strategies in the methods (SFig7 and SFig8).

      I think the manuscript could also be improved if there were some basic characterisation of foetal vs. adult thymus development. How many thymocytes are in a foetal vs adult thymus at the timepoints chosen? 

      I think there were some interesting findings in this paper. Given that overall, the foetal thymus appeared to be less diverse than that of the adult, one question I thought would be interesting to discuss was the overlap between the two repertoires. Is the foetal thymus simply a sub-fraction of the adult repertoire or is it totally distinct with no overlapping sequences? 

      Our analyses indicate that the repertoires are actually different. This is evident in Fig4 and in PCA loading plots shown in Fig, 3C and new Fig. 7C, D, I and J.

      I think that some of the interpretation in the results section may be a bit vague. "When we compaired by thymocyte population, each adult population clustered together, with adult SP4 separating from adult SP8 on PC2 and DP cells scoring in between, suggesting that PC2 might correspond to MHC restriction of the adult populations." - whilst I think I know what the authors mean, I do believe that this could be explained in clearer detail and more explicit. SP4 and SP8 are known to be positively selected in the thymus on distinct MHC class I and MHC class II molecules for example. 

      We have tried to clarify the text describing that PCA and additionally added a new Figure (new Fig. &) to compare the influence of MHC-restriction on the TCR repertoire in foetal and adult thymus.

      In the methods section, the age and sex of mice used were not explained at all. What was used in the experiment? Are there any sex differences? 

      Age and sex of mice is given in the methods.  We have not detected sex differences.

      This is a huge omission from the manuscript. In general, I don't believe the methods section has described the analysis in sufficient detail for replication. All analysis code and data should be publicly accessible and be in a format that allows for the reader to replicate the figures in the paper upon running the code. Perhaps even allowing them to run their own TCR datasets.  Overall, I think the manuscript needs some rewriting to include additional details and deeper interpretation of each individual analyses. 

      Sequencing data files will be made publicly available on UCL Research Data Repository.

    2. eLife Assessment

      This important manuscript provides an extensive and convincing analysis of the foetal and adult TCR repertoire in the mouse thymus. A potential implication of the work is that the earliest appearing T cells during ontogeny may have properties that are fundamentally distinct from those appearing later in life. The study will be of interest to immunologists concerned with T cell development and TCR repertoires.

    3. Reviewer #1 (Public review):

      Summary:

      The manuscript by Rowell et al aims to identify differences in TCR recombination and selection between foetal and adult thymus in mice. Authors sequenced the unpaired bulk TCR repertoire in foetal and adult mice thymi and studied both TCRB and TCRa characteristics in the double negative (DN, CD4-CD8-) and single positive (SP4 CD4+CD8- and SP8 CD4-CD8+) populations. They identified age-related differences in TCRa and TCRB segment usage, including a preferential bias toward 3'TRAV and 5' TRAJ rearrangements in foetal cells compared to adults who had a larger perveance for 5'TRAV segments. By depleting the thymocyte population in adult thymi using hydrocortisone, the authors demonstrated that the repertoire became more foetal like, they, therefore, argue that the preferential 5'TRAV rearrangements in adults may be resulting from prolonged/progressive TCRa rearrangements in the adult thymocytes. In line with previous studies, Authors demonstrate that the foetal TCR repertoire was less diverse, less evenly distributed and had fewer non-template insertions while containing more clonal expansions. In addition, the authors claim that changes in V-J usage and CDR1 and CDR2 in the DN vs SP repertoires indicated that positive selection of foetal thymocytes are less dependent on interactions with the MHC.

      Strengths:

      Overall, the manuscript provides an extensive analysis of the foetal and adult TCR repertoire in the thymus, resulting in new insights in T cell development in foetal and adult thymi.

      Weaknesses:

      Three major concerns arise:<br /> (1) the authors have analysed TCR repertoires of only 4 foetal and 4 adult mice, considering the high spread the study may have been underpowered.

      - The sample size was increased in the revised version

      (2) Gating strategies are missing and

      - These have now been provided in the revised version

      (3) The manuscript is very technical and clearly aimed for a highly specialised audience with expertise in both thymocyte development and TCR analysis. Considering eLife is a scientific journal with a broader readership, Authors are recommended to provide schematics of the TCR rearrangements/their findings and include a summary of conclusions/implications of their findings at the end of each results section rather than waiting till the discussion. This will help the reader to interpret their findings while reading the results.

      - These have now been included in the revised version

    4. Reviewer #2 (Public review):

      Summary:

      The authors comprehensively assess differences in the TCRB and TCRA repertoires in the fetal and adult mouse thymus by deep sequencing of sorted cell populations. For TCRB and TCRA they observed biased gene segment usage, less diversity, and greater repertoire sharing among individuals in fetal thymocytes. The TCRB repertoire was less evenly distributed and displayed more evidence of clonal expansions in fetal thymocytes. Both fetal and adult thymocytes demonstrated repertoire skewing in CD4 and CD8 as compared to DP thymocytes, which was attributed to MHC-I- vs MHC-II-restriction during positive selection. Effects of MHC-restriction were notably weaker in fetal thymocytes. The authors conclude that in multiple respects fetal repertoires are distinct from adult repertoires.

      Strengths:

      The analyses of the F18.5 and adult thymic repertoires are comprehensive with respect to the cell populations analyzed and the diversity of statistical approaches used to characterize the repertoires. Because repertoires were analyzed in pre- and post-selection thymocyte subsets, the data allowed assessment of repertoire selection at different developmental stages. Intriguing differences between fetus and adult are identified.

      Weaknesses:

      Some of the repertoire characteristics reported are already fairly well documented in the literature. Moreover, an unaddressed limitation of the study is that fetal thymocytes were analyzed at single time-point in their development. As a result, at least some of the conclusions about the fetal repertoire may be viewed not as general conclusions, but rather, due to the synchronous development of fetal thymocytes, as pertaining to the one day of fetal/early neonatal development assayed. Statements suggesting that (1) "progressive TCRa rearrangements occur less frequently in foetal DP cells" (Abstract), (2) "One possible explanation for this bias is that in the foetus progressive rounds of TCRa rearrangement are less common than in young adult" (Discussion), and (3) "Overall, the differences between the foetal and adult thymus TCR repertoires are consistent with the foetal thymus producing abT-cells ... with preference for particular gene segment usage" (Discussion), are oversimplified and potentially misleading.

    1. eLife assessment

      In this important study, the authors found, with the use of statistical methods, that compound heterozygous rare deletion variants affecting the kinase-domain of non-receptor tyrosine kinase TNK2/ACK1 and PTK6/BRK are associated with human systemic lupus erythematosus (SLE). The authors use a convincing mouse experimental model and human-induced pluripotent stem cell (hiPSC)-derived macrophages to clarify cause-effect relationships and the cellular basis of nephritis. With the identification of new SLE-related genes, this manuscript improves our understanding of human SLE pathogenesis.

    2. Reviewer #1 (Public Review):

      The authors report compound heterozygous deleterious variants in the kinase domains of the non-receptor tyrosine kinases (NRTK) TNK2/ACK1 in familial SLE. They suggest that ACK1 and BRK deficiencies are associated with human SLE and impair efferocytosis.

      The experiments in this revision showing that a weekly injection of ACK1 or BRK inhibitors induced various kinds of lupus-related autoantibodies in BALB/c supported the pivotal role of ACK1/BRK in systemic autoimmunity, although treated mice failed to demonstrate the full picture of lupus.

    3. Reviewer #2 (Public Review):

      In this manuscript, the authors revealed that genetic deficiencies of ACK1 and BRK are associated with human SLE. First, the authors found that compound heterozygous deleterious variants in the kinase domains of the non-receptor tyrosine kinases (NRTK) TNK2/ACK1 in one multiplex family and PTK6/BRK in another family. Then, by an experimental blockade of ACK1 or BRK in a mouse SLE model, they found an increase in glomerular IgG deposits and circulating autoantibodies. Furthermore, they reported that ACK and BRK variants from the SLE patients impaired the MERTK-mediated anti-inflammatory response to apoptotic cells in human induced pluripotent stem cells (hiPSC)-derived macrophages. This work identified new SLE-associated ACK and BRK variants and a role for the NRTK TNK2/ACK1 and PTK6/BRK in efferocytosis, providing a new molecular and cellular mechanism of SLE pathogenesis.

    4. Author response:

      The following is the authors’ response to the original reviews.

      Public Reviews:

      Reviewer #1 (Public Review):

      Summary:

      The authors report compound heterozygous deleterious variants in the kinase domains of the non-receptor tyrosine kinases (NRTK) TNK2/ACK1 in familial SLE. They suggest that ACK1 and BRK deficiencies are associated with human SLE and impair efferocytosis.

      Strengths: 

      The identification of similar mutations in non-receptor tyrosine kinases (NRTKs) in two different families with familial SLE is a significant finding in human disease. Furthermore, the paper provides a detailed analysis of the molecular mechanisms behind the impairment of efferocytosis caused by mutations in ACK1 and BRK.

      Weaknesses: 

      A critical point in this paper is whether the loss of function of ACK1 or BRK contributes to the onset of familial SLE. The authors emphasize that inhibitors of ACK1/BRK worsened IgG deposition in the kidneys in a pristane-induced SLE model, which contributes not to the onset but to the exacerbation of SLE, thus only partially supporting their claim.

      The evidence supporting that the loss of function of ACK1 or BRK contributes to the onset of SLE in the patients from the 2 families mostly relies on the genetic analysis. As the reviewer states, the observation that inhibitors of ACK1/BRK worsened IgG deposition in the kidneys in a pristane-induced SLE model supports the genetic evidence.

      To further address the possible role of ACK1 or BRK variants in the onset of autoimmunity in vivo, we treated wild-type (WT) BALB/cByJ female mice with inhibitors in the absence of pristane.

      The results indicated that mice that had received a weekly injection of ACK1 or BRK inhibitors developed a large array of serum anti-nuclear IgG antibodies, including but not limited to autoantibodies associated with SLE such as anti-histones, anti-chromatin, anti U1-snRNP, anti-SSA, and anti-Ku in comparison to the control group inhibitor treated mice (Revised Fig 3A). However, they did not develop glomerular deposit of IgG after 12 weeks of treatment, in contrast to mice that have received Pristane (Revised Fig. 3B,C, Figure 3-figure supplement 1).

      These additional data suggests that inhibition of ACK1 and BRK stimulates the production of serum autoantibodies, which strengthen the claim that ACK1 and BRK kinase deficiency contribute to autoimmunity in BALB/cByJ.

      Reviewer #2 (Public Review):

      Summary: 

      In this manuscript, the authors revealed that genetic deficiencies of ACK1 and BRK are associated with human SLE. First, the authors found that compound heterozygous deleterious variants in the kinase domains of the non-receptor tyrosine kinases (NRTK) TNK2/ACK1 in one multiplex family and PTK6/BRK in another family. Then, by an experimental blockade of ACK1 or BRK in a mouse SLE model, they found an increase in glomerular IgG deposits and circulating autoantibodies. Furthermore, they reported that ACK and BRK variants from the SLE patients impaired the MERTK-mediated anti-inflammatory response to apoptotic cells in human induced pluripotent stem cells (hiPSC)-derived macrophages. This work identified new SLE-associated ACK and BRK variants and a role for the NRTK TNK2/ACK1 and PTK6/BRK in efferocytosis, providing a new molecular and cellular mechanism of SLE pathogenesis.

      Strengths: 

      This work identified new SLE-associated ACK and BRK variants and a role for the NRTK TNK2/ACK1 and PTK6/BRK in efferocytosis, providing a new molecular and cellular mechanism of SLE pathogenesis.

      Weaknesses: 

      Although the manuscript is well-organized and clearly stated, there are some points below that should be considered:

      In this study, the authors used forward genetic analyses to identify novel gene mutations that may cause SLE, combined with GWAS studies of SLE. To further explore the importance of these variants, haplotype analysis of two candidate genes could be performed, to observe the evolution and selection relationship of candidate genes in the population (UK 1000 biobank, for example). 

      To investigate whether ACK1/TNK2 or BRK/PTK6 were subject to selection, we gathered data using different metrics quantifying negative selection in the human genome. We collected the f parameter from SnIPRE1, lofTool2, and evoTol3, as well as intraspecies metrics from RVIS4, LOEUF5, and pLI6 (including pRec). We also used our in-house CoNeS metric7. None of these indicators suggest that the genes are under strong negative selection (Revised Figure 2-figure supplement 2). This is consistent with the deficiency being recessive. We also tested the variants with a MAF greater than 0.005. We found them to be neutral. We therefore did not test whether they were associated with any phenotype in the UK Biobank.

      Although the authors focused on SLE and macrophage efferocytosis in their studies, direct evidence of how macrophage efferocytosis significantly affects SLE is lacking. This point should at least be explicitly introduced and discussed by citing appropriate literature.

      We provide a more detailed description of the role of macrophage efferocytosis in autoimmunity and SLE in the revised manuscript. Specifically, we state (in the results section, paragraph: ACK1 and BRK kinase domain variants may lose the ability to link MERTK to RAC1, AKT and STAT3 activation for efferocytosis): “NRTKs such as ACK1 8 and PTK2/FAK 9 are also downstream targets of the TAM family receptor MERTK which is expressed on macrophages and controls the anti-inflammatory engulfment of apoptotic cells, a process known as efferocytosis 10-12. Efferocytosis allows for the clearance of apoptotic cells before they undergo necrosis and release intracellular inflammatory molecules, and simultaneously leads to increased production of anti-inflammatory molecules (TGFb, IL-10, and PGE2) and a decreased secretion of proinflammatory cytokines (TNF-alpha, IL-1b, IL-6) 10-14. In line with these findings, mice deficient in molecular components used by macrophages to efficiently perform efferocytosis, such as MFG-E8, MERTK, TIM4, and C1q, develop phenotypes associated with autoimmunity10,11,14-27. Furthermore, defects in efferocytosis are also observed in patients with SLE and glomerulonephritis14,28-31.“

      It is still not clear how the target molecules identified in this paper may influence macrophage efferocytosis. More direct evidence should be established. 

      Our studies show that wt -but not variants- of ACK1 and BRK are activated by MERTK, a key receptor that mediates the recognition of apoptotic cells. Our studies also show that wt -but not variants- activate RAC1 which is necessary for engulfment and phosphorylate AKT and STAT3 which are involved in the anti-inflammatory response to PtdSer recognition.

      The TAM family receptor MERTK mediates recognition of PtdSer on apoptotic cells via GAS6 and Protein S 10,15,32 leading to their engulfment, which involves activation of RAC1 for actin reorganization and the formation of a phagocytic cup 9,33. Using IP kinase assays we show that MERTK and GAS6 can activate the kinase activity of wild-type ACK1 8 or BRK but not of the patient’s ACK1 or BRK variant alleles (Figure 4D). To further support the role of ACK1 and BRK downstream from PtdSer recognition and uptake of apoptotic cells, we show that reference ACK1 and BRK alleles, in contrast to the patient variant alleles, can activate RAC1 to generate RAC-GTP which is necessary for engulfment 9,33 (Figure 4C).

      PtdSer recognition also typically stimulates an anti-inflammatory process mediated in part via AKT 34 and STAT3 and their target genes such as SOCS3 35-41 and results in the inhibition of LPS-mediated production of inflammatory mediators such as TNF and IL-1b, and the production of cytokines such as IL-10, TGFb 11,25-27,42. Consistent with this literature and the findings of the paper, we show that reference ACK1 and BRK, unlike the patient’s variant alleles, can phosphorylate AKT and STAT3 (Figure 4A, B). The role of ACK1 and BRK in these signaling pathways is further supported by our transcriptomics data comparing the response of controls, patients, and inhibitor-treated iPSC-derived macrophages to apoptotic thymocytes by RNA-seq. Specifically, we show Transcriptional repressors including the AKT targets ATF3, TGIF1, NFIL3, and KLF4, the STAT3 targets SOCS3 and DUSP5, as well as CEBPD and the inhibitor of E-BOX DNA Binding ID3 were among the top-ten genes which expression is induced by apoptotic cells in WT macrophages (Figure 4F), but this regulation was lost in mutant and inhibitor-treated macrophages (Figure 4F).

      For some transcriptional repressors mentioned in their studies, the authors should check whether there is clear experimental evidence. If not, it is recommended to supplement the experimental verifications for clarity.

      Transcriptional repressors including the AKT targets ATF3, TGIF1, NFIL3, and KLF4, the STAT3 targets SOCS3 and DUSP5, as well as CEBPD and the inhibitor of E-BOX DNA Binding ID3 were among the top-ten genes which expression is induced by apoptotic cells in WT macrophages (Figure 4F), but this regulation was lost in mutant and inhibitor-treated macrophages (Figure 4F).

      In the manuscript we cited published evidence, to the best of our knowledge, for the role of these genes in the regulation of inflammatory responses. Specifically we state: “ATF3, TGIF1, NFIL3, and KLF4 are involved in the negative regulation of inflammation in macrophages 35-38, SOCS3 is an inhibitor of the macrophage inflammatory response and DUSP5 is a negative regulator of ERK activation 39,40,43. These data suggest that the kinase domain of ACK1 and BRK contribute to the macrophage anti-inflammatory gene expression program driven by apoptotic cells.”

      In Figures 4C and 4D, it is seen that the usage of inhibitors causes cytoskeletal changes, however this reviewer would not have expected such large change. Did the authors check whether the cells die after heavy treatment by the inhibitors?

      We carefully examine the viability of Isogenic WT, BRK and ACK1 mutant macrophages (left panel) and of WT macrophages treated with ACK1 or BRK inhibitors and we did not observed changes in viability (Figure 4-figure supplement 2).

      Recommendations for the authors:

      Reviewer #1 (Recommendations For The Authors):

      A crucial step in the development of SLE is the production of autoantibodies. It is shown in Figure 2F that inhibitors of ACK1/BRK enhanced the production of autoantibodies against histones and SSA in a pristane-induced SLE model, which is a significant result that could support the authors' claim. Strangely, this autoantigen panel does not include double-stranded DNA, RNP, or Sm, which should be presented regarding antibody production.

      We thank the reviewer for this comment. In the revised manuscript (Revised Figure 3 – Supplement 1) we added the remainder of the autoantibody panel, which includes double-stranded DNA, RNP, and Sm autoantibody levels. We also added the results for serum IgG autoantibody levels in BALB/cByJ mice treated for three months with DMSO, ACK1, or BRK inhibitors but did not receive a pristane injection (Revised Figure 3A). This data shows that mice which received ACK1 or BRK inhibitors had increased serum IgG autoantibodies in comparison to DMSO treated controls.

      Additionally, if there is information that inhibitors of ACK1/BRK promote the differentiation of follicular helper T cells, memory B cells, and plasma cells in a pristane-induced SLE model, it could be considered indirect evidence supporting the authors' claims.

      These are not available at present to the best of our knowledge.

      Reviewer #2 (Recommendations For The Authors):

      Minor points:

      * In the literature, unpaired t-tests and ordinary one-way ANOVA (Tukey's multiple comparisons test) were used for statistical analysis, which requires data to be normally distributed. This part of the proposal is reflected in the text, and the non-conforming results need to be statistically analyzed using the non-parametric test of graphpad prism.

      We would like to thank the reviewer for pointing out this oversight. In the revised manuscript, for all applicable datasets, we tested whether the data was normally distributed using a Shapiro-Wilk normality test. For datasets that were normally distributed statistical significance was determined by a Student t test or ordinary one-way ANOVA with Tukey’s multiple comparisons test depending on the number of conditions being compared and the experimental setup. In contrast, for datasets that were not normally distributed statistical significance was determined using a Mann-Whitney, Kruskal-Wallis multiple comparisons tests, or Wilcoxon matched-pairs signed rank test depending on the experimental setup. P values below 0.05 were considered significant for all statistical tests.

      The authors used different methods to represent the level of significant difference. Therefore, it is suggested that the significance level should be expressed by letters. 

      As suggested by the reviewer, in the revised manuscript we have designated the significance level throughout all figures using letters (p, or q values).

      For RNA-seq, more information should be provided in the paper. For example, the correlation between sample biological replicates, the total number of differentially expressed genes, and randomly selected genes for qRT-PCR results verification.

      We would like to thank the reviewer for pointing out this oversight. In the revised manuscript we provided more information regarding the RNA-seq dataset, including a Principal Component Analysis (PCA) showing correlation between sample replicates (Revised Figure 4-figure supplement 1A), as well as a table indicating the number of upregulated and downregulated genes between relevant datasets (Revised Figure 4-figure supplement 1B).

      The results of the RNA-seq analysis indicated that ACK1 and BRK contribute to the macrophage anti-inflammatory gene expression program driven by apoptotic cells. MERTK-dependent anti-inflammatory program elicited by apoptotic cells on macrophages is best evidenced by the reduction of LPS-mediated production of inflammatory mediators such as TNF or IL1b 25-27,34,44. Therefore, to validate the RNA-seq results in a functional manner we tested the decrease of LPS-induced production of TNF and IL1b by apoptotic cells in isogenic WT, ACK1 deficient, and BRK deficient macrophages. Consistent with the RNA-seq data, the functional assays indicated that ACK1 and BRK kinase activities are required for the decrease of TNF and IL1b production induced by LPS in response to apoptotic cells (Revised Figure 4H,I).

      The raw data files for the RNA-seq analysis have been deposited in the NCBI Gene Expression Omnibus under accession number GEO: GSE118730.

      The authors did not have the formats for some of the citations correct. This should be fixed. 

      References were reformatted.

      (1) Eilertson, K. E., Booth, J. G. & Bustamante, C. D. SnIPRE: selection inference using a Poisson random effects model. PLoS Comput Biol 8, e1002806 (2012). https://doi.org:10.1371/journal.pcbi.1002806

      (2) Fadista, J., Oskolkov, N., Hansson, O. & Groop, L. LoFtool: a gene intolerance score based on loss-of-function variants in 60 706 individuals. Bioinformatics 33, 471-474 (2017). https://doi.org:10.1093/bioinformatics/btv602

      (3) Rackham, O. J., Shihab, H. A., Johnson, M. R. & Petretto, E. EvoTol: a protein-sequence based evolutionary intolerance framework for disease-gene prioritization. Nucleic Acids Res 43, e33 (2015). https://doi.org:10.1093/nar/gku1322

      (4) Petrovski, S., Wang, Q., Heinzen, E. L., Allen, A. S. & Goldstein, D. B. Genic intolerance to functional variation and the interpretation of personal genomes. PLoS Genet 9, e1003709 (2013). https://doi.org:10.1371/journal.pgen.1003709

      (5) Karczewski, K. J. et al. The mutational constraint spectrum quantified from variation in 141,456 humans. Nature 581, 434-443 (2020). https://doi.org:10.1038/s41586-020-2308-7

      (6) Lek, M. et al. Analysis of protein-coding genetic variation in 60,706 humans. Nature 536, 285-291 (2016). https://doi.org:10.1038/nature19057

      (7) Rapaport, F. et al. Negative selection on human genes underlying inborn errors depends on disease outcome and both the mode and mechanism of inheritance. Proc Natl Acad Sci U S A 118 (2021). https://doi.org:10.1073/pnas.2001248118

      (8) Mahajan, N. P., Whang, Y. E., Mohler, J. L. & Earp, H. S. Activated tyrosine kinase Ack1 promotes prostate tumorigenesis: role of Ack1 in polyubiquitination of tumor suppressor Wwox. Cancer Res 65, 10514-10523 (2005). https://doi.org:10.1158/0008-5472.CAN-05-1127

      (9) Wu, Y., Singh, S., Georgescu, M. M. & Birge, R. B. A role for Mer tyrosine kinase in alphavbeta5 integrin-mediated phagocytosis of apoptotic cells. J Cell Sci 118, 539-553 (2005). https://doi.org:10.1242/jcs.01632

      (10) Scott, R. S. et al. Phagocytosis and clearance of apoptotic cells is mediated by MER. Nature 411, 207-211 (2001). https://doi.org:10.1038/35075603

      (11) Henson, P. M. & Bratton, D. L. Antiinflammatory effects of apoptotic cells. J Clin Invest 123, 2773-2774 (2013). https://doi.org:10.1172/JCI69344

      (12) Henson, P. M. Cell Removal: Efferocytosis. Annu Rev Cell Dev Biol 33, 127-144 (2017). https://doi.org:10.1146/annurev-cellbio-111315-125315

      (13) deCathelineau, A. M. & Henson, P. M. The final step in programmed cell death: phagocytes carry apoptotic cells to the grave. Essays Biochem 39, 105-117 (2003). https://doi.org:10.1042/bse0390105

      (14) Nagata, S. Apoptosis and Clearance of Apoptotic Cells. Annu Rev Immunol 36, 489-517 (2018). https://doi.org:10.1146/annurev-immunol-042617-053010

      (15) Cohen, P. L. et al. Delayed apoptotic cell clearance and lupus-like autoimmunity in mice lacking the c-mer membrane tyrosine kinase. J Exp Med 196, 135-140 (2002). https://doi.org:10.1084/jem.20012094

      (16) Hanayama, R. et al. Autoimmune disease and impaired uptake of apoptotic cells in MFG-E8-deficient mice. Science 304, 1147-1150 (2004). https://doi.org:10.1126/science.1094359

      (17) Miyanishi, M., Segawa, K. & Nagata, S. Synergistic effect of Tim4 and MFG-E8 null mutations on the development of autoimmunity. Int Immunol 24, 551-559 (2012). https://doi.org:10.1093/intimm/dxs064

      (18) Colonna, L., Parry, G. C., Panicker, S. & Elkon, K. B. Uncoupling complement C1s activation from C1q binding in apoptotic cell phagocytosis and immunosuppressive capacity. Clin Immunol 163, 84-90 (2016). https://doi.org:10.1016/j.clim.2015.12.017

      (19) Nagata, S., Hanayama, R. & Kawane, K. Autoimmunity and the clearance of dead cells. Cell 140, 619-630 (2010). https://doi.org:10.1016/j.cell.2010.02.014

      (20) Kimani, S. G. et al. Contribution of Defective PS Recognition and Efferocytosis to Chronic Inflammation and Autoimmunity. Front Immunol 5, 566 (2014). https://doi.org:10.3389/fimmu.2014.00566

      (21) Hanayama, R., Tanaka, M., Miwa, K., Shinohara, A., Iwamatsu, A. & Nagata, S. Identification of a factor that links apoptotic cells to phagocytes. Nature 417, 182-187 (2002). https://doi.org:10.1038/417182a

      (22) Kawano, M. & Nagata, S. Lupus-like autoimmune disease caused by a lack of Xkr8, a caspase-dependent phospholipid scramblase. Proc Natl Acad Sci U S A 115, 2132-2137 (2018). https://doi.org:10.1073/pnas.1720732115

      (23) Watanabe-Fukunaga, R., Brannan, C. I., Copeland, N. G., Jenkins, N. A. & Nagata, S. Lymphoproliferation disorder in mice explained by defects in Fas antigen that mediates apoptosis. Nature 356, 314-317 (1992). https://doi.org:10.1038/356314a0

      (24) Singer, G. G., Carrera, A. C., Marshak-Rothstein, A., Martinez, C. & Abbas, A. K. Apoptosis, Fas and systemic autoimmunity: the MRL-lpr/lpr model. Current opinion in immunology 6, 913-920 (1994).

      (25) Cvetanovic, M. & Ucker, D. S. Innate immune discrimination of apoptotic cells: repression of proinflammatory macrophage transcription is coupled directly to specific recognition. J Immunol 172, 880-889 (2004). https://doi.org:10.4049/jimmunol.172.2.880

      (26) Fadok, V. A., Bratton, D. L., Konowal, A., Freed, P. W., Westcott, J. Y. & Henson, P. M. Macrophages that have ingested apoptotic cells in vitro inhibit proinflammatory cytokine production through autocrine/paracrine mechanisms involving TGF-beta, PGE2, and PAF. J Clin Invest 101, 890-898 (1998). https://doi.org:10.1172/JCI1112

      (27) Voll, R. E., Herrmann, M., Roth, E. A., Stach, C., Kalden, J. R. & Girkontaite, I. Immunosuppressive effects of apoptotic cells. Nature 390, 350-351 (1997). https://doi.org:10.1038/37022

      (28) Herrmann, M., Voll, R. E., Zoller, O. M., Hagenhofer, M., Ponner, B. B. & Kalden, J. R. Impaired phagocytosis of apoptotic cell material by monocyte-derived macrophages from patients with systemic lupus erythematosus. Arthritis Rheum 41, 1241-1250 (1998). https://doi.org:10.1002/1529-0131(199807)41:7<1241::AID-ART15>3.0.CO;2-H

      (29) Baumann, I. et al. Impaired uptake of apoptotic cells into tingible body macrophages in germinal centers of patients with systemic lupus erythematosus. Arthritis Rheum 46, 191-201 (2002). https://doi.org:10.1002/1529-0131(200201)46:1<191::AID-ART10027>3.0.CO;2-K

      (30) Schrijvers, D. M., De Meyer, G. R. Y., Kockx, M. M., Herman, A. G. & Martinet, W. Phagocytosis of apoptotic cells by macrophages is impaired in atherosclerosis. Arterioscl Throm Vas 25, 1256-1261 (2005). https://doi.org:10.1161/01.ATV.0000166517.18801.a7

      (31) Morioka, S., Maueroder, C. & Ravichandran, K. S. Living on the Edge: Efferocytosis at the Interface of Homeostasis and Pathology. Immunity 50, 1149-1162 (2019). https://doi.org:10.1016/j.immuni.2019.04.018

      (32) Seitz, H. M., Camenisch, T. D., Lemke, G., Earp, H. S. & Matsushima, G. K. Macrophages and dendritic cells use different Axl/Mertk/Tyro3 receptors in clearance of apoptotic cells. J Immunol 178, 5635-5642 (2007). https://doi.org:10.4049/jimmunol.178.9.5635

      (33) Mao, Y. & Finnemann, S. C. Regulation of phagocytosis by Rho GTPases. Small GTPases 6, 89-99 (2015). https://doi.org:10.4161/21541248.2014.989785

      (34) Sen, P. et al. Apoptotic cells induce Mer tyrosine kinase-dependent blockade of NF-kappaB activation in dendritic cells. Blood 109, 653-660 (2007). https://doi.org:10.1182/blood-2006-04-017368

      (35) Vergadi, E., Ieronymaki, E., Lyroni, K., Vaporidi, K. & Tsatsanis, C. Akt Signaling Pathway in Macrophage Activation and M1/M2 Polarization. J Immunol 198, 1006-1014 (2017). https://doi.org:10.4049/jimmunol.1601515

      (36) Byles, V. et al. The TSC-mTOR pathway regulates macrophage polarization. Nat Commun 4, 2834 (2013). https://doi.org:10.1038/ncomms3834

      (37) Liao, X. et al. Kruppel-like factor 4 regulates macrophage polarization. J Clin Invest 121, 2736-2749 (2011). https://doi.org:10.1172/JCI45444

      (38) Roberts, A. W., Lee, B. L., Deguine, J., John, S., Shlomchik, M. J. & Barton, G. M. Tissue-Resident Macrophages Are Locally Programmed for Silent Clearance of Apoptotic Cells. Immunity 47, 913-927 e916 (2017). https://doi.org:10.1016/j.immuni.2017.10.006

      (39) Matsukawa, A. et al. Stat3 in resident macrophages as a repressor protein of inflammatory response. J Immunol 175, 3354-3359 (2005).

      (40) Sica, A. & Mantovani, A. Macrophage plasticity and polarization: in vivo veritas. J Clin Invest 122, 787-795 (2012). https://doi.org:10.1172/JCI59643

      (41) Yi, Z., Li, L., Matsushima, G. K., Earp, H. S., Wang, B. & Tisch, R. A novel role for c-Src and STAT3 in apoptotic cell-mediated MerTK-dependent immunoregulation of dendritic cells. Blood 114, 3191-3198 (2009). https://doi.org:10.1182/blood-2009-03-207522

      (42) Rothlin, C. V., Carrera-Silva, E. A., Bosurgi, L. & Ghosh, S. TAM receptor signaling in immune homeostasis. Annu Rev Immunol 33, 355-391 (2015). https://doi.org:10.1146/annurev-immunol-032414-112103

      (43) Seo, H. et al. Dual-specificity phosphatase 5 acts as an anti-inflammatory regulator by inhibiting the ERK and NF-kappaB signaling pathways. Sci Rep 7, 17348 (2017). https://doi.org:10.1038/s41598-017-17591-9

      (44) Camenisch, T. D., Koller, B. H., Earp, H. S. & Matsushima, G. K. A novel receptor tyrosine kinase, Mer, inhibits TNF-alpha production and lipopolysaccharide-induced endotoxic shock. J Immunol 162, 3498-3503 (1999).

    1. eLife Assessment

      This is an important work and it correlates capsid stability with mutations that promote heparan sulfate binding. The data is solid, but there is a need for further analysis and experiments to support the claims and to propose a more detailed mechanism that could explain how these mutations altered capsid stability.

    2. Reviewer #1 (Public Review):

      This article is interesting because the phenotype of the virus with mutations that alter the affinity of HS has been associated with how the viral particle interacts with HS and, thus, with binding and entry. However, the data in this manuscript is compelling and strongly suggests that the mutation that increases the affinity of HS alters capsid stability. To my knowledge, this is the first evidence that such mutation causes capsid destabilization. Furthermore, the idea that this mutation increases infectivity in cell lines by also using a pH-independent route and that, in vivo, this mutation attenuates the virus is very novel. Last year Wa-Chu's lab proposed that encephalopathic Alphaviruses produce capsids with different sizes and that this helps to attenuate highly pathogenic viruses (which might not be the case for non encepahlopatic Alphavirsues). However, they did not demonstrate whether these alterations attenuate the virus and if the altered morphology affects capsid stability. Therefore, this manuscript is fundamental as it contributes to understanding how the assembly/disassembly mechanism can be used to attenuate a virus. Furthermore, it is possible this mechanism could not be restricted to viruses that belong to the Picornaviridae family and opens a new door to understanding viral attenuation in other icosahedral viruses.

    3. Reviewer #3 (Public Review):

      Heparan Sulphate is a general association factor in the extracellular matrix which assists in host cell entry for a multitude of viral and bacterial pathogens by concentrating them in the vicinity of cellular membranes. The neurotropic picornavirus, EV-71 utilizes a protein receptor SCARB-2, in conjunction with Heparan Sulfate, in order to enter cells through the endo-lysosomal pathway. The uncoating and release of viral genome requires both receptor binding and late endosomal pH conditions. The authors have attempted to address a seeming contradiction in the in vitro and in vivo infectivity of strain MP4 variants of EV-71. One of the cell culture adapted strains MP4-L97R/E167G has stronger association with HS, which translates to higher infectivity in cell culture models; however, viral virulence is significantly lower in animal models.

      Using an elegant and methodical set of experiments, the authors have probed the steps in the cellular entry pathway of MP4 and its L97R/E167G variant. Their experiments strongly suggest a difference in capsid uncoating mechanisms in the variant, with the L97R/E167G variant being significantly less robust and prone to destabilize earlier in the pathway. While this confers an advantage in terms of cell culture based infectivity, it is posited that the particles will not survive the gastric pH intact, which compromises virulence in the animal model. While the cell culture based uncoating experiments somewhat support this hypothesis, the main weakness of this work is a lack of explanation for the mechanism(s) of capsid destabilization conferred by overall increased positive charge. The structural bioinformatics study in the supplementary section does not explain how receptor binding, pocket factor expulsion, subunit interactions and low pH based capsid dynamics may be influenced by the mutations. Capsid destabilization could be an outcome in alteration of any or all of these processes. It is also unclear whether it is suggested that all mutations enhancing the net positive charge of VP1, or any other structural protein, will cause capsid destabilization by similar pathways. A clearer analysis of the influence of overall charge alterations, or individual mutations, on subunit interaction or particle conformation is needed. The enhancement in cell culture infectivity of the L97R/E167G variant under elevated endosomal pH is also unclear and requires further experimentation.

      It has been suggested earlier that increased HS binding in vivo results in virus "trapping" and decreased infectivity. This may still be a major reason for reduced infectivity in vivo, in addition to the capsid destabilization as proposed in this work.

    4. Reviewer #4 (Public Review):

      In this work, Tee et al. study the implications of Heparan Sulfate (HS) binding mutations observed on the Enterovirus A71 (EV-A71) capsid. HS-binding mutations are observed for several virus infections and are often presumed to be a cell culture adaptation. However, in the case of EV-A71, the presence of HS-binding mutations in clinical samples and the contradictory findings in animal studies have made the clinical relevance of HS-binding a subject of debate. Therefore, to better understand the role of HS-binding in EV-A71, the authors use a mouse-adapted EV-A71 variant (MP4) and compare it to a cell-adapted strong HS-binder (MP4-97R/167G). Using these two variants, the authors show that the strong HS-binder does not require acidification for uncoating and genome release. Furthermore, it is demonstrated that the capsid stability of the HS-binding variant is compromised, resulting in pH-independent uncoating. Overall, this study provides new insights demonstrating that seemingly beneficial mutations increasing viral replication may be counterbalanced by other unintended consequences.

      Strengths:

      The thoroughness of the experiments performed to demonstrate that the HS-binding phenotype results in pH-independent entry and capsid destabilisation is worth highlighting. In this regard, the authors have explored viral entry using a range of approaches involving lysosomotropic drugs, viral binding assays, and neutral red-labelled viruses coupled with diverse techniques such as FISH, RNAscope, and transient expression of constitutively active molecules to inhibit parts of the viral cycle. In my opinion, this is necessary to rule out the other downstream effects of the lysomotropic drugs and to confirm the role of the HS-binding mutation in the entry phase. The use of in silico analysis coupled with negative staining electron microscopy and environmental challenge assays is notable. Finally, the demonstration of some of the work using a human-relevant strain is commendable.

      Weaknesses:

      A major weakness in this study is the focus on using a mouse-adapted EV-A71 strain (MP4). In the introduction, it is argued that HS-binding mutations are controversial due to their occurrence in cell culture. However, due to host limitations, mice are not the natural hosts for EV-A71 and thus, the same argument can be made for a mouse-adapted strain. It is not clear how different this strain is from circulating EV-A71 strains and the relevance of these findings to the human situation is questionable. This is particularly made evident in the discussion where it is highlighted that HS-binding variants (VP1-145G/Q mutants) have been associated with severe neurological cases while the same variants show attenuated phenotypes in mice and monkeys. This contrast between clinical data and animal studies should be highlighted in the introduction, rather than later in the discussion, as currently the in vivo animal studies are presented as the optimal situation and may lead to misconstrued conclusions from the results.

      An important consideration is that the results are based primarily on image analysis. The inclusion of RT-qPCR and/or plaque assays as supplementary data will help strengthen the findings. Moreover, there are suggestions of an intermediate binder having a different phenotype. As this intermediate binder is the clinical phenotype, data on the entry of this intermediate binder will be valuable.

      Another weakness in the study is the lack of contextualization of the results to current EV-A71 literature. For instance, SCARB2 is referred to as the internalization receptor but a recent study has shown that SCARB2 is not required for internalization (https://doi.org/10.1128%2Fjvi.02042-21). The findings from this study are consistent with the localization of SCARB2 in the lysosomal membranes. Furthermore, the same study has highlighted host sulfation as a key factor in EV-A71 entry. Post-translational sulfation introduces negatively charged residues on host proteins including HS and SCARB2. This increases the binding of HS-binding strains to these proteins. In this regard, the reduced infectivity upon soluble SCARB2 treatment may simply be due to enhanced binding rather than capsid opening as suggested in the results. Therefore, additional experiments (e.g. nSEM following soluble SCARB2 treatment) must be performed to support the conclusion of capsid opening, due to inherent instability, upon SCARB2 binding.

      In addition to the above, other existing literature on EV-A71 pathogenesis using organoids contradicts some of the explanations of differential phenotype in clinical observations versus mice models. In the introduction, it is suggested that reduced neurovirulence of HS-binding strains is due to binding to the vascular endothelia. However, the correlation of clinical severity to viremia (https://doi.org/10.1186/1471-2334-14-417) and the association of HS-binding mutants to clinical disease counteract this suggestion. Similarly, viral infection in human organoids with EV-A71 results in as low as 0.4% of the cells being infected (https://doi.org/10.1038/s41564-023-01339-5). In this case, if viral binding to (ubiquitously expressed) HS results in viral trapping then the HS-binding mutants should show lowered infectivity in organoid models rather than the observed higher infectivity (https://doi.org/10.3389/fmicb.2023.1045587, https://doi.org/10.1038/s41426-018-0077-2). Finally, EV-A71 release has also been shown to occur in exosomes (https://doi.org/10.1093%2Finfdis%2Fjiaa174) which effectively provides a protective lipid membrane. These recent findings must be incorporated into the article and will help better contextualize their findings.

      Overall, the authors present new findings with convincing methodology. The manuscript can be improved in the contextualization of the findings and highlighting the weakness in translating these findings to resolve the debate surrounding the relevance of HS-binding phenotype. The inclusion of additional experiments and data recommended to the authors will also help strengthen the manuscript.

    5. Author Response:

      Reviewer #4 (Public Review):

      In this work, Tee et al. study the implications of Heparan Sulfate (HS) binding mutations observed on the Enterovirus A71 (EV-A71) capsid. HS-binding mutations are observed for several virus infections and are often presumed to be a cell culture adaptation. However, in the case of EV-A71, the presence of HS-binding mutations in clinical samples and the contradictory findings in animal studies have made the clinical relevance of HS-binding a subject of debate. Therefore, to better understand the role of HS-binding in EV-A71, the authors use a mouse-adapted EV-A71 variant (MP4) and compare it to a cell-adapted strong HS-binder (MP4-97R/167G). Using these two variants, the authors show that the strong HS-binder does not require acidification for uncoating and genome release. Furthermore, it is demonstrated that the capsid stability of the HS-binding variant is compromised, resulting in pH-independent uncoating. Overall, this study provides new insights demonstrating that seemingly beneficial mutations increasing viral replication may be counterbalanced by other unintended consequences.

      Strengths:

      The thoroughness of the experiments performed to demonstrate that the HS-binding phenotype results in pH-independent entry and capsid destabilisation is worth highlighting. In this regard, the authors have explored viral entry using a range of approaches involving lysosomotropic drugs, viral binding assays, and neutral red-labelled viruses coupled with diverse techniques such as FISH, RNAscope, and transient expression of constitutively active molecules to inhibit parts of the viral cycle. In my opinion, this is necessary to rule out the other downstream effects of the lysomotropic drugs and to confirm the role of the HS-binding mutation in the entry phase. The use of in silico analysis coupled with negative staining electron microscopy and environmental challenge assays is notable. Finally, the demonstration of some of the work using a human-relevant strain is commendable.

      We appreciate the reviewer recognition of the significance of our study and the precious advises.

      Weaknesses:

      A major weakness in this study is the focus on using a mouse-adapted EV-A71 strain (MP4). In the introduction, it is argued that HS-binding mutations are controversial due to their occurrence in cell culture. However, due to host limitations, mice are not the natural hosts for EV-A71 and thus, the same argument can be made for a mouse-adapted strain. It is not clear how different this strain is from circulating EV-A71 strains and the relevance of these findings to the human situation is questionable. This is particularly made evident in the discussion where it is highlighted that HS-binding variants (VP1-145G/Q mutants) have been associated with severe neurological cases while the same variants show attenuated phenotypes in mice and monkeys. This contrast between clinical data and animal studies should be highlighted in the introduction, rather than later in the discussion, as currently the in vivo animal studies are presented as the optimal situation and may lead to misconstrued conclusions from the results.

      As requested by the reviewer, we included new experiments performed with a clinical strain isolated in an immunosuppressed patient (Cordey et al., 2012). We compared the sensitivity of this human strain harboring or not the VP1 L97R and E167G mutations to HCQ and confirmed that the similar differential sensitivity to HCQ was observed as with the MP4 variant. This result is presented as a new supplementary figure (Figure 6-figure supplement 1) and is described in the result section of the revised manuscript (Page 7, lines 251).

      Page 7, lines 251: To determine if our observations are applicable to human strains, we examined the sensitivity of a closely related clinical strain. This strain was isolated from the respiratory tract of an immunosuppressed patient with a disseminated EV-A71 infection27. Additionally, we tested a strong HS-binding derivative that harbors the same VP1-L97R and E167G mutations as our MP4 double mutant. Notably, this human clinical strain shares 98.3% amino acid similarity with the MP4 variant used in this study and exhibits similar HS-binding phenotypes28. As shown in Figure 6-figure supplement 1, the original human strain was inhibited by HCQ, whereas the double mutant exhibited insensitivity to the drug.

      We also added the comment about discrepancy between clinical data and animal studies in the introduction as requested (page 2, lines 69-76): However, epidemiological surveillance of human EV-A71 infections19-21 and experimental evidence from 2D human fetal intestinal models22, human airway organoids23 and air-liquid interface cultures24 suggest that HS binding may enhance viral replication and virulence in humans. In addition, recent research has shown that EV-A71 can be released and transmitted via cellular extrusions25 or exosomes26, potentially preventing viral trapping of HS-binding strains in the circulation. Further studies are required to evaluate the true impact of HS-binding mutations on the spread and virulence of EV-A71 in both animal models and humans.

      An important consideration is that the results are based primarily on image analysis. The inclusion of RT-qPCR and/or plaque assays as supplementary data will help strengthen the findings.

      We have performed RT-qPCR to confirm the immunostaining data and included them in the supplementary data (Figure 1-figure supplement 1E). Reference to these data is made in the result section [Page 4, lines 114-116: These results were confirmed by viral load quantification with real-time RT-PCR (Figure 1-figure supplement 1E).]

      Moreover, there are suggestions of an intermediate binder having a different phenotype. As this intermediate binder is the clinical phenotype, data on the entry of this intermediate binder will be valuable.

      While we agree with reviewer that the single mutant is an intermediate binder and exhibits a clinical phenotype, we made the decision to work with variants that display clear phenotypes, selecting MP4 and the double mutant, as the latter is fully attenuated in both immunocompetent and immunosuppressed mice (Weng et al., 2023). Additionally, we performed an experiment using HCQ, where we observed an intermediate effect with the single mutant. This further confirmed our decision to proceed with MP4 and the double mutant for all experiments. The data supporting this are shown in Author response image 1, which we are sharing exclusively with the reviewer.

      Author response image 1.

      Differential sensitivity of MP4, MP4-97R and MP4-97R167G to Lysosomotropic drugs

      Another weakness in the study is the lack of contextualization of the results to current EV-A71 literature. For instance, SCARB2 is referred to as the internalization receptor but a recent study has shown that SCARB2 is not required for internalization (https://doi.org/10.1128%2Fjvi.02042-21). The findings from this study are consistent with the localization of SCARB2 in the lysosomal membranes. Furthermore, the same study has highlighted host sulfation as a key factor in EV-A71 entry. Post-translational sulfation introduces negatively charged residues on host proteins including HS and SCARB2. This increases the binding of HS-binding strains to these proteins. In this regard, the reduced infectivity upon soluble SCARB2 treatment may simply be due to enhanced binding rather than capsid opening as suggested in the results. Therefore, additional experiments (e.g. nSEM following soluble SCARB2 treatment) must be performed to support the conclusion of capsid opening, due to inherent instability, upon SCARB2 binding.

      We apologize for not citing this relevant literature excluding the role of SCARB2 in viral attachment. We have now included these references in the revised version of the manuscript. (Page 2, lines 54-56: “Since SCARB2 is mostly localized on endosomal and lysosomal membrane and sparsely on plasma membrane3,5, it seems to play only a minor role in EV-A71 cell attachment6,7.

      We thank the reviewer for mentioning the possibility that the sulfation of SCARB2 may enhance its binding to the mutated virus compared to the wild-type virus, potentially explaining the selective competitive inhibition of this variant by soluble SCARB2 produced in mammalian cells. To investigate this hypothesis, we performed nsEM imaging of the double mutant incubated with soluble SCARB2 and we observed an increase in the proportion of empty capsids in the presence of soluble SCARB2 (4% versus 0.7%), supporting our original findings that the inactivation is indeed associated with capsid opening. The results are included in the revised manuscript in Figure 5-figure supplement 4 and described on Page 7, lines 243-245: “However, the double mutant exhibited a ~5-fold increase in empty capsid percentage after treatment with sSCARB2 (Figure 5-figure supplement 4), consistent with the functional data above.”

      In addition to the above, other existing literature on EV-A71 pathogenesis using organoids contradicts some of the explanations of differential phenotype in clinical observations versus mice models. In the introduction, it is suggested that reduced neurovirulence of HS-binding strains is due to binding to the vascular endothelia. However, the correlation of clinical severity to viremia (https://doi.org/10.1186/1471-2334-14-417) and the association of HS-binding mutants to clinical disease counteract this suggestion. Similarly, viral infection in human organoids with EV-A71 results in as low as 0.4% of the cells being infected (https://doi.org/10.1038/s41564-023-01339-5). In this case, if viral binding to (ubiquitously expressed) HS results in viral trapping then the HS-binding mutants should show lowered infectivity in organoid models rather than the observed higher infectivity (https://doi.org/10.3389/fmicb.2023.1045587, https://doi.org/10.1038/s41426-018-0077-2). Finally, EV-A71 release has also been shown to occur in exosomes (https://doi.org/10.1093%2Finfdis%2Fjiaa174) which effectively provides a protective lipid membrane. These recent findings must be incorporated into the article and will help better contextualize their findings.

      We appreciate the reviewer thoughtful comments. We do not believe that the correlation between clinical severity and viremia contradicts the viral trapping hypothesis. For strains that do not bind to HS, the absence of viral trapping could indeed lead to higher viral concentrations in the bloodstream, potentially increasing neurovirulence. However, we agree with the reviewer that other observations in humans, along with experimental data from more relevant models such as organoids, challenge the trapping hypothesis. We are grateful for the suggested citations and have incorporated these references in the introduction, where we discuss this point in more detail

      Page 2, lines 69-76: “However, epidemiological surveillance of human EV-A71 infections19-21 and experimental evidence from 2D human fetal intestinal models22, human airway organoids23 and air-liquid interface cultures24 suggest that HS binding may enhance viral replication and virulence in humans. In addition, recent research has shown that EV-A71 can be released and transmitted via cellular extrusions25 or exosomes26, potentially preventing viral trapping of HS-binding strains in the circulation. Further studies are required to evaluate the true impact of HS-binding mutations on the spread and virulence of EV-A71 in both animal models and humans.”

      Overall, the authors present new findings with convincing methodology. The manuscript can be improved in the contextualization of the findings and highlighting the weakness in translating these findings to resolve the debate surrounding the relevance of HS-binding phenotype. The inclusion of additional experiments and data recommended to the authors will also help strengthen the manuscript.<br />

    1. eLife Assessment

      This manuscript makes an important contribution to the understanding of protein-protein interaction (PPI) networks by challenging the widely held assumption that their degree distributions uniformly follow a power law. The authors present convincing evidence that biases in study design, such as data aggregation and selective research focus, may contribute to the appearance of power-law-like distributions. While the power law assumption has already been questioned in network biology, the methodological rigor and correction procedures introduced here are valuable for advancing our understanding of PPI network structure.

    2. Reviewer #1 (Public Review):

      This manuscript was previously reviewed and this earlier evaluation resulted in two conflicting assessments. I fully endorse the favourable opinion of former Reviewer 1 and find most negative comments of former Reviewer 2 inappropriate.

      This work is absolutely necessary. Even though the authors find it difficult to be fully assertive in the end, their ground work in trying to demonstrate the existence of bias in PPI data is undeniably valuable. Other authors have tried before to show the limitation of unequivocally assigning the degree distribution to a power law but these doubts have had a weak impact. This new study is a great opportunity to discuss further a concern for a simplistic view of PPI network topology. The recent contribution of Broido & Clauset was definitely one to bounce on. The approach of this new manuscript is compelling. Dividing the study in several parts, each reflecting an attempt to bring out commonly used shortcuts in PPI network analyses, makes sense.

      Surprisingly, the authors do not refer to the endless controversy of labeling hubs as party or date, which is another manifestation of the interpretative bias of PPI data.

      The only worthy point prompted by former Reviewer 2 is the effect of spoke expansion. In their response, the authors suggest that it would probably extend questioning and even if it is considered as future work, it could be mentioned in the main manuscript.

      In the end, this submission is an invitation to constructively rethink the analysis of PPI networks and it feeds the discussion on modelling degree distributions that should not be considered as a solved issue.

    3. Reviewer #2 (Public Review):

      Many naturally occurring networks are assumed to have a power-law (PL) degree distribution. This assumption has certainly been widely held in the field of protein interactomes (PPIs), although important studies around 2010 have conclusively shown that many of these PL distributions are either the result of data mis-handling or of sloppy statistical procedures (see e.g. Porter and Stumpf in Science around 2014, which I would advise the authors to cite). The value of the present study is to introduce a new mechanism, experiment bias, to explain the appearance of such distributions in the PPI case, and in particular to show how correcting empirically for this mechanism can lead to a reappraisal of which proteins are genuine hubs in these networks. The claims are well supported by empirical evidence and some theoretical analysis. Overall, this is a worthwhile contribution although its significance is somewhat dented by the fact that the PL enthusiasm of many had already been tempered by the studies mentioned above.

    4. Reviewer #3 (Public Review):

      I would like to congratulate the authors to an impressive piece of work highlighting important real and potential biases, which may lead to power-law distributed node degrees in protein-protein interaction networks.<br /> This manuscript is easy to follow and very well written manuscript.<br /> I truly enjoyed the concise and convincing scientific presentation.<br /> Even if some of the concerns have already been discussed or raised in the past, the manuscript assesses potential biases in PPIs in a rigorous manner.

      I deem the following observations highly relevant to be communicated to the community again:<br /> (1) PL-like distributions emerge by aggregation of data sets alone.<br /> (2) Research interest in itself is PL-distributed and drives PL-like properties in PPI networks<br /> (3) Bait usage is a major driver of PL-like behaviour.<br /> (4) Accounting for biases changes the biological interpretation of the networks<br /> (5) Simulation studies further corroborate these findings.

    5. Author Response:

      eLife Assessment

      This manuscript makes an important contribution to the understanding of protein-protein interaction (PPI) networks by challenging the widely held assumption that their degree distributions uniformly follow a power law. The authors present convincing evidence that biases in study design, such as data aggregation and selective research focus, may contribute to the appearance of power-law-like distributions. While the power law assumption has already been questioned in network biology, the methodological rigor and correction procedures introduced here are valuable for advancing our understanding of PPI network structure.

      Thanks for this assessment which perfectly reflects our study.

      Reviewer #1 (Public Review):

      This manuscript was previously reviewed and this earlier evaluation resulted in two conflicting assessments. I fully endorse the favourable opinion of former Reviewer 1 and find most negative comments of former Reviewer 2 inappropriate.

      This work is absolutely necessary. Even though the authors find it difficult to be fully assertive in the end, their ground work in trying to demonstrate the existence of bias in PPI data is undeniably valuable. Other authors have tried before to show the limitation of unequivocally assigning the degree distribution to a power law but these doubts have had a weak impact. This new study is a great opportunity to discuss further a concern for a simplistic view of PPI network topology. The recent contribution of Broido & Clauset was definitely one to bounce on. The approach of this new manuscript is compelling. Dividing the study in several parts, each reflecting an attempt to bring out commonly used shortcuts in PPI network analyses, makes sense.

      Surprisingly, the authors do not refer to the endless controversy of labeling hubs as party or date, which is another manifestation of the interpretative bias of PPI data.

      This is a good point. In particular, it may be interesting if hub nodes that emerge from considering only prey interactions differ regarding party and date nodes. We now refer to this distinction in the Discussion:

      “[...] Further work will be needed to establish if true hub proteins exist in the PPI network and what their role is. For instance, it was previously claimed (Han et al., 2004) – and controversially discussed (Agarwal et al., 2010) – that the correlation of gene expression values between hub nodes with their interaction partners follows a bimodal distribution, leading to the distinction of party (high correlation) and date (low correlation) hubs. In the future, it would be interesting to study if the ratio of party and date hubs changes when considering prey degree only.”

      The only worthy point prompted by former Reviewer 2 is the effect of spoke expansion. In their response, the authors suggest that it would probably extend questioning and even if it is considered as future work, it could be mentioned in the main manuscript.

      Thank you for this comment. We agree that considering different expansion methods is an interesting research question regarding its effect on the PL property. We have added the following sentences to the Discussion to highlight the opportunity for future work:

      “[...] An additional complexity arising in AP-MS studies is that more than two interaction partners can be detected. These -ary interactions are commonly transformed into binary interactions using either the spoke model, which reports all interactions with the bait protein (as used by IntAct, for example), or the matrix expansion model, which reports all pairwise interactions. Both expansion models can, in principle, introduce false positives and it would be interesting to consider the effect of expansion model choice on the PL property in future work.”

      In the end, this submission is an invitation to constructively rethink the analysis of PPI networks and it feeds the discussion on modelling degree distributions that should not be considered as a solved issue.

      Reviewer #2 (Public Review):

      Many naturally occurring networks are assumed to have a power-law (PL) degree distribution. This assumption has certainly been widely held in the field of protein interactomes (PPIs), although important studies around 2010 have conclusively shown that many of these PL distributions are either the result of data mis-handling or of sloppy statistical procedures (see e.g. Porter and Stumpf in Science around 2014, which I would advise the authors to cite). The value of the present study is to introduce a new mechanism, experiment bias, to explain the appearance of such distributions in the PPI case, and in particular to show how correcting empirically for this mechanism can lead to a reappraisal of which proteins are genuine hubs in these networks. The claims are well supported by empirical evidence and some theoretical analysis. Overall, this is a worthwhile contribution and, while its significance is somewhat dented by the fact that the PL enthusiasm of many had already been tempered by the studies mentioned above,

      Thanks a lot for your constructive feedback. We now cite the work by Porter and Stumpf and have addressed your specific recommendations as detailed below.

      Reviewer #3 (Public Review):

      I would like to congratulate the authors to an impressive piece of work highlighting important real and potential biases, which may lead to power-law distributed node degrees in protein-protein interaction networks. This manuscript is easy to follow and very well written manuscript. I truly enjoyed the concise and convincing scientific presentation. Even if some of the concerns have already been discussed or raised in the past, the manuscript assesses potential biases in PPIs in a rigorous manner.

      I deem the following observations highly relevant to be communicated to the community again:

      (1) PL-like distributions emerge by aggregation of data sets alone.

      (2) Research interest in itself is PL-distributed and drives PL-like properties in PPI networks

      (3) Bait usage is a major driver of PL-like behaviour.

      (4) Accounting for biases changes the biological interpretation of the networks

      (5) Simulation studies further corroborate these findings.

      Thank you for this positive assessment of our work.

    1. eLife Assessment

      This study is important, with the potential to greatly impact future research on the evolution of chemical defense mechanisms in animals. The authors present compelling evidence for the presence of low quantities of alkaloids in amphibians previously thought to lack these toxins. They then integrate these findings with existing literature to propose a four-phase scenario for the evolution of chemical defense in alkaloid-containing poison frogs, emphasizing the role of passive accumulation mechanisms.

    2. Reviewer #1 (Public review):

      This is a very relevant study, with the potential of having high impact on future research on the evolution of chemical defense mechanisms in animals. The authors present a substantial number of new and surprising experimental results, i.e., the presence in low quantities of alkaloids in amphibians previously deemed to lack these toxins. These data are then combined with literature data to weave the importance of passive accumulation mechanisms into a 4-phases scenario of the evolution of chemical defense in alkaloid-containing poison frogs.

      In general, the new data presented in the manuscript are of high quality and high scientific interest, the suggested scenario compelling, and the discussion thorough. Also, the revised version of the manuscript has been carefully prepared with a high quality of illustrations. UI did not detect typos in the text

      Understanding that the majority of dendrobatid frogs, including species considered undefended, can contain low quantities of alkaloids in their skin provides an entirely new perspective to our understanding of how the amazing specializations of poison frogs evolved. Although only few non-dendrobatids were included in the alkaloid screening, some of these also included minor quantities of alkaloids, and the capacity of passive alkaloid accumulation may therefore characterize numerous other frog clades, or even amphibians in general.

      The overall quality of the work is exceptional. The authors also have done a fantastic job restructuring the manuscript in response to my initial comments, and it is now very clear which new hypotheses are presented and which testable predictions for future studies derive from these hypotheses. This study will be highly influential in informing and guiding future research on toxicity, alkaloid sequestration and resistance, and evolution of aposematism.

    3. Reviewer #2 (Public review):

      Summary:

      This was a well-executed and well-written paper. The authors have provided important new datasets that expand on previous investigations substantially. The discovery that changes in diet are not so closely correlated with the presence of alkaloids (based on the expanded sampling of non-defended species) is important, in my opinion.

      Strengths:

      Provision of several new expanded datasets using cutting edge technology and sampling a wide range of species that had not been sampled previously. A conceptually important paper that provides evidence for the importance of intermediate stages in the evolution of chemical defense and aposematism.

      Weaknesses:

      There were some aspects of the paper that I thought could be revised. One thing I was struck by is lack of discussion of the potentially negative effects of toxin accumulation, and how this might play out in terms of different levels of toxicity in different species. Further, are there aspects of ecology or evolutionary history that might make some species less vulnerable to the accumulation of toxins than others? This could be another factor that strongly influences the ultimate trajectory of a species in terms of being well-defended. I think the authors did a good job in terms of describing mechanistic factors that could affect toxicity (e.g. potential molecular mechanisms), but did not make much of an attempt to describe potential ecological factors that could impact trajectories of the evolution of toxicity. This may have been done on purpose (to avoid being too speculative), but I think it would be worth some consideration.

      In the discussion, the authors make the claim that poison frogs don't (seem to) suffer from eating alkaloids. I don't think this claim has been properly tested (the cited references don't adequately address it). To do so would require an experimental approach, ideally obtained data on both lifespan and lifetime reproductive success.

      Update: Revised version: The authors carefully addressed the comments and suggestions on the first draft of the manuscript. In my opinion, these revisions were sufficient and the authors have adequately addressed the previously noted weaknesses in the manuscript.

    4. Author response:

      The following is the authors’ response to the original reviews.

      Public Reviews:

      Reviewing editor:

      The biological significance of the results presented in this manuscript is the potential absence of active sequestration mechanisms in certain species, leading to variation in their ability to transport and store specific compounds, such as alkaloids. The concept of passive accumulation is introduced as an evolutionary intermediate between toxin consumption and sequestration.

      I agree with the reviewers' comments on the limitations of the current manuscript. Additionally, I'd like to raise a point about combining data from LC/MS and GC/MS as these techniques have different sensitivities. GC-MS excels in annotation, allowing for confident identification of detected compounds. However, it may have limitations in the number of extractable substances. Conversely, LC-MS/MS offers a broader range of detectable substances, but annotation can be more challenging. While methods to bridge this gap exist, the current approach might not fully account for the potential influence of the analysis equipment on the observed differences in alkaloid numbers between the Texas and Panama samples analyzed by LC-MS/MS. To address this, consider including data from both methods (if possible) to gain a more comprehensive understanding of the alkaloid profiles. Alternatively, analyzing the Texas and Panama samples with GC-MS could be considered for a more focused comparison with the other samples.

      Thank you for the suggestion. Unfortunately, we do not have GC-MS data for the Texas and Panama samples. While the strength of these two datasets is that they present two independent lines of data corroborating that “undefended” frogs have detectable alkaloid levels, we have more explicitly made clear for readers that the datasets should not be compared directly. We reviewed the text to check that we carefully acknowledge in the manuscript the higher sensitivity of our LC-MS assay, and we added more detail about the differences between the two assay types (section 4d): “The UHPLC-HESI-MSMS pipeline used on the samples from Panama and Texas allows for higher sensitivity to detect a broader array of compounds compared to our GC-MS methods, but has lower retention-time resolution and produces less reliable structural predictions. Furthermore, due to the lack of liquid-chromatography-derived references for poison-frog alkaloids, precise alkaloid annotations from the UHPLC-HESI-MSMS dataset could not be obtained. Therefore, the UHPLC-HESI-MSMS and GC-MS datasets are not directly comparable, and UHPLC-HESI-MSMS data are not included in Fig. 2”. We have also revised the asterisk accompanying the table to further reinforce that alkaloid numbers between the two assay types should not be compared. It now states: “Note that the UHPLC-HESI-MS/MS and GC-MS assays differed in both instrument and analytical pipeline, so “Alkaloid Number” values from the two assay types should not be compared to each other directly”. We further point out differences between the two assay types in section 2b: “Similarly, the analysis of UHPLC-HESI-MS/MS data was untargeted, and thus enables a broader survey of chemistry compared to that from prior GC-MS studies.”

      Finally, we point out that the output from the analytical pipeline for UHPLC-HESI-MSMS annotates compounds as “alkaloids,” using broader criteria than the targeted GC-MS component of our study. In an effort to make the datasets more comparable, at least conceptually, we now include an assessment of which alkaloids identified by UHPLC-HESI-MSMS match known molecular formulae and structural classes in frogs (see Table S6 and revised text on lines 335-343 and 410-415.

      Reviewer #1 (Public Review):

      This is a very relevant study, clearly with the potential of having a high impact on future research on the evolution of chemical defense mechanisms in animals. The authors present a substantial number of new and surprising experimental results, i.e., the presence in low quantities of alkaloids in amphibians previously deemed to lack these toxins. These data are then combined with literature data to weave the importance of passive accumulation mechanisms into a 4-phases scenario of the evolution of chemical defense in alkaloid-containing poison frogs.

      In general, the new data presented in the manuscript are of high quality and high scientific interest, the suggested scenario compelling, and the discussion thorough. Also, the manuscript has been carefully prepared with a high quality of illustrations and very few typos in the text. Understanding that the majority of dendrobatid frogs, including species considered undefended, can contain low quantities of alkaloids in their skin provides an entirely new perspective to our understanding of how the amazing specializations of poison frogs evolved. Although only a few non-dendrobatids were included in the GCMS alkaloid screening, some of these also included minor quantities of alkaloids, and the capacity of passive alkaloid accumulation may therefore characterize numerous other frog clades, or even amphibians in general.

      Thank you for the kind evaluation.

      While the overall quality of the work is exceptional, major changes in the structure of the submitted manuscript are necessary to make it easier for readers to disentangle scope, hypotheses, evidence and newly developed theories.

      Based on reviewer comments, we revised the manuscript structure substantially to make the different aspects of the paper more readily identifiable to readers. Specifically we moved the content of Figure 2 into a new section in the introduction. We also added more introductory text to better introduce the main ideas of the new model and to summarize the scope and aim of the paper. We reorganized the result section headings and moved Figure 1 (now Fig. 3) down into section 2c.

      Reviewer #2 (Public Review):

      Summary:

      This was a well-executed and well-written paper. The authors have provided important new datasets that expand on previous investigations substantially. The discovery that changes in diet are not so closely correlated with the presence of alkaloids (based on the expanded sampling of non-defended species) is important, in my opinion.

      Strengths:

      Provision of several new expanded datasets using cutting edge technology and sampling a wide range of species that had not been sampled previously. A conceptually important paper that provides evidence for the importance of intermediate stages in the evolution of chemical defense and aposematism.

      Thank you for kind comments.

      Weaknesses:

      There were some aspects of the paper that I thought could be revised. One thing I was struck by is the lack of discussion of the potentially negative effects of toxin accumulation, and how this might play out in terms of different levels of toxicity in different species.

      Thank you for the suggestion. We now explicitly address the possible negative effects of toxin accumulation and how costs may play out with respect to varying levels of chemical defense among different organisms, including poison frogs. We note early on that, “short-term alkaloid feeding experiments (e.g., Daly et al., 1994; Sanchez et al., 2019) demonstrate that both defended and undefended dendrobatids can survive the immediate effects of alkaloid intake, although the degree of resistance and the alkaloids that different species can resist vary'' (section 2c), and we address the sparse literature suggesting some species-level variation in alkaloid resistance in frogs. Later, we make the point that, “origins of chemical defenses are also shaped by the cost of resisting and accumulating toxins, which can change over evolutionary time as animals adapt to novel relationships with toxins” (section 2d). We broadly discuss costs of target-site resistance, a common mode of molecular resistance in poison frogs and other animals, and compensatory molecular adaptations that offset the costs. We also discuss examples from the literature of negative effects of high levels of resistance and toxin accumulation that are not completely offset. We also note that to the best of our knowledge, potential lifetime fitness costs to alkaloid consumption by dendrobatids have not been evaluated.

      Further, are there aspects of ecology or evolutionary history that might make some species less vulnerable to the accumulation of toxins than others? This could be another factor that strongly influences the ultimate trajectory of a species in terms of being well-defended. I think the authors did a good job in terms of describing mechanistic factors that could affect toxicity (e.g. potential molecular mechanisms) but did not make much of an attempt to describe potential ecological factors that could impact trajectories of the evolution of toxicity. This may have been done on purpose (to avoid being too speculative), but I think it would be worth some consideration.

      We agree that other factors can influence the trajectory of chemical defense. We incorporated these ideas into the new section 2d, which provides a somewhat brief overview of ecological factors that could influence the origins of chemical defense, the physiological costs of toxin resistance and accumulation, and some of the possible eco-evo factors that shape chemical defense once it evolves.

      In the discussion, the authors make the claim that poison frogs don't (seem to) suffer from eating alkaloids. I don't think this claim has been properly tested (the cited references don't adequately address it). To do so would require an experimental approach, ideally obtained data on both lifespan and lifetime reproductive success.

      We agree with the reviewer that more data are necessary to make this broad claim, which we have removed. We revised this to state: “regardless, it is clear that all or nearly all dendrobatid poison frogs consume alkaloid-containing arthropods as part of their regular diet” (section 2c). We then expand on this statement with data from short-term experimental work that support the notion that at least some dendrobatids are resistant (i.e., can survive) the immediate effects of alkaloids. We also point out later in the manuscript that, “as far as we are aware, the possible lifetime fitness costs (e.g., in reproductive success) of alkaloid consumption in dendrobatids have not been measured” (section 2d).

      Recommendations for the authors:

      Reviewer #1 (Recommendations For The Authors):

      While in general I am very open to "unorthodox" ways to write a manuscript (i.e., differing from the standard structure intro-methods-results-discussion) I feel there is much room for improvement in this case. When reading the manuscript line by line, I was several times totally uncertain about the scope and content of the original data in the manuscript. It is too often unclear which of the outlined theories are new and why they are presented, which hypotheses were tested and why, which data were newly obtained, which technological improvements led to the novel and surprising results, and why no alternative hypotheses are tested. I feel the authors need to fundamentally reconsider the structure of the manuscript - which does not mean everything needs to be rewritten, but some major reshuffling of paragraphs from one section to the other may already lead to substantial improvement. I will in the following list (not ordered by priority) different issues that I encountered, without always providing a specific suggestion for improvement - please come up with an improved structure that removes these issues in one way or the other!

      Thank you for the suggestions. We did our best to improve the structure of the paper. Specifically, we substantially revised the introduction to provide a clearer background of the ideas leading up to the new evolutionary model. We moved most of what was previously figure 2 (now Fig. 1) into an earlier part of the introduction in the main text. We moved what was previously figure 1 (now Fig. 3) to much later in the discussion (section 2c). We attempted to clarify and separate throughout the text the new data from existing data. Please see our responses below for additional details.

      Line 42-45: Please provide a reference on this statement on traversing adaptive landscapes.

      We added the following reference: Martin, CH and PC Wainwright. 2013. Multiple fitness peaks on the adaptive landscape drive adaptive radiation in the wild. Science 339: 208-211. https://doi.org/10.1126/science.1227710

      Line 50: Why are these phases "likely" to occur? - no evidence is presented for this hypothesized high likelihood. Presenting this scenario already in the second paragraph of the intro is very weird. Are these really the only possible phases? Wouldn't it be possible to come up with totally different scenarios? In my opinion, this specific four-phase scenario should be more clearly labelled as a novel theory presented in this paper, and perhaps it should come much later in the introduction.

      Thank you for the suggestion. We moved this paragraph down into a new subsection of the introduction. We also revised the language to clarify that the model is a new evolutionary theory based on new and existing ideas.

      Line 51: Here you use for the first time the term "elimination". While it is intuitively clear what is meant by it, there still could be different meanings. The alkaloids could simply be passively excreted, or they could be actively biochemically decomposed. Later in the Discussion the authors imply that elimination requires some kind of metabolic process, but this perhaps should be made clearer already in the introduction.

      We now spend more time in the introduction describing pharmacokinetics as well as the terms we used (including elimination), which are slightly modified from terms in pharmacokinetics.

      Figure 1. I have major concerns about this figure. I found the figure very confusing, and the authors really need to reconsider and modify (simplify) it. The figure caption starts with "Major processes involved..." as if this was established textbook knowledge rather than a totally hypothetical illustration of how different factors (sequestration, elimination....) can lead to defended or undefended phenotypes. Only later on in the caption it becomes clear this is just a suggestion/hypothesis/model: "we hypothesize...".

      We revised the figure (now Fig. 3) and its legend. It now starts with the following text: “Hypothesized physiological processes that interact to determine the defense phenotype.” We also simplify the figure by removing two lines and recoding the table (see comment below).

      Secondly, the way the graph is drawn suggests some kind of experimental result where specific evolutionary pathways lead to very specific degrees of "defendedness", recognizable by the points on the right axis stacked very precisely one above the other. Do you really want to imply that you want to suggest such a specific model, where particular accumulation/intake/elimination rates lead to exactly these outcomes? Also, wouldn't it be possible to somewhat simplify the categories in the table? Again, why so specific, is there any experimental evidence for it? Why sometimes 1 plus, 2 plus, 3 plus? Wouldn't it be better to just suggest categories such as strong, weak and absent?

      We simplified the figure by removing the secondary (dashed) passive accumulation and active sequestration lines. We also changed the + signs to “low,” “med,” or “high” and tried to simplify the text in the figure and in the legend.

      Line 101-103: "We propose ..." Here, as the concluding statement of the introduction, the authors suggest a very general hypothesis which seems rather disconnected from the four-phase model and from the experimental results. Here, at the latest, I would have expected to learn (1) what the overall scope of the paper is, (2) which kind of approaches were followed and which novel experimental results will be presented in the following, and (3) how the experimental results will be used to derive a new theory / novel. Again, it is obvious that the scope of the paper is broader than testing just a single and narrow hypothesis, but rather to support and develop a broader theory and evolutionary model, but this should be clear to readers once they arrive at this line.

      Thank you for the suggestion. We added a paragraph to the end of the first section of the introduction that outlines the content of the rest of the paper. We also reorganized some of the subheadings to make the flow of ideas and the source of data in each subsection clearer. We split up and moved what was previously in section 2a into parts of the introduction and discussion. We moved the results text about diet and the discussion about resistance to section 2a, to better provide data and discussion of phases 1 and 2.

      Figure 2. My opinion on this figure is much less strong than on Fig. 1. However, the authors may want to reconsider whether it really makes sense to here show all the historical trees and theories (which are not really systematically reviewed in the text) or if they maybe wish to go on with panel D only (the most recent tree and scenario which is also used to consistently for further discussion in the manuscript).

      We moved the content from Fig. 2A–C to the main text (now section 1b) and narrowed the focus of Fig. 2 (now Fig. 1) to what was previously panel 2D.

      Results and Discussion: The whole section on phases 1 to 2 is not based on any new results. This is OK (as I said, I have no problems with "unorthodox" manuscript structure) but it should be clearer to readers why this is presented here and what it represents. A new theory? A recapitulation of textbook knowledge? Something necessary to later understand the experimental results?

      We split up and moved what was previously in section 2a into parts of the introduction and discussion. Now, section 2a still focuses on phases 1 and 2 but presents the diet data from our study (phase 1) and a review of known resistance mechanisms (phase 2; previously in the discussion section).

      Line 168. Here we have arrived at the "core" of the paper, that is, the actual experimental results. Surprisingly, you find alkaloids in dendrobatids usually considered "undefended". This is great, surprising and of high importance. However, I am missing at least some technical/methodological discussion about this finding, except for the statement that it was based on GCMS. Why have previous studies not detected these alkaloids? Did you use particularly sensitive GCMS instruments? Did you look more in depth than it was done in previous studies? Can you totally exclude these contaminations/artefacts?

      We added the following paragraph to section 2b: “The large number of structures that we identified is in part due to the way we reviewed GC-MS data: in addition to searching for alkaloids with known fragmentation patterns, we also searched for anything that could qualify as an alkaloid mass spectrometrically but that may not match a previously known structure in a reference database. Similarly, the analysis of UHPLC-HESI-MS/MS data was untargeted, and thus enables a broader survey of chemistry compared to that from prior GC-MS studies. Structural annotations in our UHPLC-HESI-MS/MS analysis were made using CANOPUS, a deep neural network that is able to classify unknown metabolites based on MS/MS fragmentation patterns, with 99.7% accuracy in cross-validation (Dührkop et al., 2021).” We also moved the paragraph on contamination from the methods section into section 2b.

      Line 169. This sentence (and several others in the subsequent paragraphs) do a poor job in explaining the taxon and specimen sampling. The particular sentence in this line is unclear: Did you include 27 species of dendrobatids AND IN ADDITION representatives of the main undefended clades, or did these 27 species INCLUDE representatives of the main undefended clades?

      We now present a brief overview of sampling in the last paragraph of the introduction (section 1c). We clarified sampling of the species: “In total we surveyed 104 animals representing 32 species of Neotropical frogs including 28 dendrobatid species, two bufonids, one leptodactylid, and one eleutherodactylid (see Methods). Each of the major undefended clades in Dendrobatidae (Fig. 1, Table 1) is represented in our dataset, with a total of 14 undefended dendrobatid species surveyed.” We also reviewed and clarified similar language in other places in the text (e.g., section 2b).

      Line 177. "undefended lineages" - of dendrobatids or of frogs in general? Given that you also include non-dendrobatids.

      Dendrobatids. The sentence now reads “Overall, we detected alkaloids in skins from 13 of 14 undefended dendrobatid species included in our study, although often with less diversity and relatively lower quantities than in defended lineages (Fig. 2, Table 1, Table S3, Table S4).”

      Line 188: "defe" should probably changed to "defended"?

      Corrected.

      Table 1. The taxon sampling clearly focuses on dendrobatids, with only a few other taxa. This is fine, however, it does not allow to test the hypothesis that something "special" predisposes dendrobatids to passive accumulation and alkaloid resistance. For this, a wider taxon sampling of other frog families would have been necessary to have a larger number of "control" data. Again, this is fine for the purpose of the study and is discussed later (line 399) but only very briefly. I feel it should be mentioned earlier on.

      Thank you for the suggestion. We now address this point earlier in the manuscript so that readers will not have the impression that there are sufficient data to infer that dendrobatids are predisposed to passive accumulation. We propose several phylogenetic alternatives, making it clear that determining the number and timing of origins of passive accumulation is not possible with our data (section 2c), ultimately noting that “discriminating a single origin [of passive accumulation] – no matter the timing – from multiple ones would require better phylogenetic resolution and more extensive alkaloid surveys, as we only assessed four non-dendrobatid species”.

      Reviewer #2 (Recommendations For The Authors):

      P2L60 - The description of figure 1 is somewhat confusing, as it first focuses on the graph in the bottom panel, then moves to describing aspects of the table (top panel), then back to the graph. I think it might make more sense to describe these two panels separately and in order.

      Thank you for the suggestion. We revised the figure (now Fig. 3) and its legend for clarity.

      P3L94 - Saying that three transitions makes this group "ideal" for studying complex phenotypic transitions is a bit hyperbolic, in my opinion. I suggest toning down this description.

      Thank you for the suggestion. We changed “ideal” to “suitable.”

      P3L101 - "We propose that changes in toxin metabolism through selection on mechanisms of toxin resistance likely play a major role in the evolution of acquired chemical defenses." This hypothesis appears to be a combination of earlier ideas, with a somewhat different emphasis. The authors acknowledge this and go through some of the earlier ideas, in the legend of figure 2. I would have preferred to see more discussion of this (particularly with reference to the history of the idea in reference to poison frogs) in the main body of the text.

      Thank you for the suggestion. We now more extensively discuss these prior studies in the introduction (section 1b and 1c). We also revised this figure (now Fig. 1) to focus on what was previously figure 2 panel D.

      P3L102 - Figure 2 - the phrase "Resistance to consuming some alkaloids" seems inappropriate - perhaps "Resistance to alkaloid poisoning after consumption" (or something similar) would be more accurate?

      We changed this to “Low alkaloid resistance”.

      P4L153 - "Accumulation of alkaloids in skin glands could help to prevent alkaloids from reaching their targets". This could be true, but why would skin glands be a preferred location of sequestration to avoid toxicity? The authors should explain why such glands would be particularly likely to serve as places of sequestration.

      Thank you for pointing out this ambiguity. We decided to remove our discussion of sequestration into skin glands, because it is challenging to discuss this process in toxin resistance without too much speculation.

      P4L154 - "Although direct evidence is lacking, some poison frogs may biotransform alkaloids into less toxic forms until they can be eliminated from the body, e.g., using cytochrome p450s". This would seem to contradict the argument of this process being a precursor to accumulating effective toxins.

      We agree that these processes seem contradictory. However, a few papers are starting to suggest that metabolic detoxification may be initially useful for lineages that eventually evolve toxin sequestration. This is because detoxification or elimination (clearance) of toxins allows increased intake of toxins. Because there is some delay in the removal of toxins from an animal’s body, increased consumption ultimately leads to higher toxin exposure and possible toxin diffusion into various body cavities, which can increase selective pressure to evolve other kinds of resistance mechanisms. This pattern was shown in an experiment with toxin-resistant fruit flies (Douglas et al., 2022). Many toxin-sequestering species still metabolize some toxins even if they sequester the majority – as we argue, the defense phenotype is the result of a balance among intake, elimination, and accumulation, all of which can interact simultaneously. In poison frogs specifically there is some evidence that p450s are upregulated after toxin consumption (Caty et al. 2019). One possible prediction is that the type of resistance that an animal has changes as toxin sequestration evolves. We talk a bit more about these patterns in section 2e.

      P5L186 - Table 1 legend - change "defe" to "defended"

      Corrected.

      P12L414 - "do not appear to suffer substantially from doing so as it is part of their regular diet". I don't think this claim has been properly tested, as of yet. It would require looking at the effects of a diet with and without toxins over the lifespan of the frogs, and the impact of that difference on both survival and fertility.

      Reviewer 1 also made this important observation, which we address above.

      P12L432 - "for toxin-resistant organisms, there is little cost to accumulating a toxin, yet there may be benefits in doing so." Yet toxin resistance may itself be a continuous trait, so there may be a cost that depends on the degree of toxin resistance. I don't see why the authors are proposing toxin resistance as a discrete trait when their main point is that toxin accumulation is not.

      We agree and removed this statement.

    1. eLife Assessment

      Utilizing transgenic lineage tracing techniques and tissue clearing-based advanced imaging and three-dimensional slices reconstruction, the authors comprehensively mapped the distribution atlas of NFATc1+ and PDGFR-α+ cells in dental and periodontal mesenchyme and tracked their in vivo fate trajectories. This important work extends our understanding of NFATc1+ and PDGFR-α+ cells in dental and periodontal mesenchyme homeostasis, and should provide impact on clinical application and investigation. The strength of this work is compelling in employing CRISPR/Cas9-mediated gene editing to generate two dual recombination systems, and mapped gNFATc1+ and PDGFR-α+cells residing in dental and periodontal mesenchyme, their capacity for progeny cell generation, and their inclusive, exclusive and hierarchical relations in homeostasis, generating a spatiotemporal atlas of these skeletal stem cell population.

    2. Reviewer #1 (Public review):

      Summary:

      Utilizing transgenic lineage tracing techniques and tissue clearing-based advanced imaging and three-dimensional slices reconstruction, the authors comprehensively mapped the distribution atlas of NFATc1+ and PDGFR-α+ cells in dental and periodontal mesenchyme and tracked their in vivo trajectories. This important work expands our understanding of both single and double positive NFATc1 and PDGFR-α cells in maintaining dental and periodontal mesenchyme homeostasis, and will provide impact on clinical application and investigation. The strength of this work is convincing, as it employed CRISPR/Cas9-mediated gene editing to generate two dual recombination systems, and mapped gNFATc1+ and PDGFR-α+ cells residing in dental and periodontal mesenchyme, their capacity for progeny cell generation, and their inclusive, exclusive and hierarchical relations in homeostasis, generating a spatiotemporal atlas of these skeletal stem cell population.

      This work has theoretical or practical implications in the periodontal field. The methods, data and analyses support the claims.

      Comments on revised version:

      The authors have addressed my main concerns.

    3. Author response:

      The following is the authors’ response to the original reviews.

      Public Reviews:

      Reviewer #1 (Public Review):

      In this study, Yang et al. investigated the locations and hierarchies of NFATc1+ and PDGFRα+ cells in dental and periodontal mesenchyme. By combining intersectional and exclusive reporters, they attempted to distinguish among NFATc1+PDGFRα+, NFATc1+PDGFRα-, and NFATc1- PDGFRα+ cells. Using tissue clearing and serial section-based 3D reconstruction, they mapped the distribution atlas of these cell populations. Through DTA-induced ablation of PDGFRα+ cells, they demonstrated the crucial role of PDGFRα+ cells in the formation of the odontoblast cell layer and periodontal components.

      Thank you for your valuable comments and suggestions, which have greatly enhanced the quality of this research article. The manuscript has been significantly revised in accordance with the reviewers’ comments. All necessary experimental conditions and required data have been included, and all the questions and considerations have been well-addressed in the revised manuscript and supporting information.

      Main issues:

      (1) The authors did not quantify the contribution of PDGFRα+ cells or NFATc1+ cells to dental and periodontal lineages in PDGFRαCreER; Nfatc1DreER; LGRT mice. Zsgreen+ cells represented PDGFRα+ cells and their lineages. Tomato+ cells represented NFATc1+ cells and their lineages. Tomato+Zsgreen+ cells represented NFATc1+PDGFRα+ cells and their lineages. Conducting immunostaining experiments with lineage markers is essential to determine the physiological contributions of these cells to dental and periodontal homeostasis.

      Thanks for your question, we are sorry for the insufficient statement. Figure S9 provided statistical analysis of the number of PDGFR-α+ cells, NFATc1+ cells, and PDGFR-α+&NFATc1+ cells in the dental pulp and periodontal ligament (PDL). The results allow for a clear comparison of the contributions of single-positive and double-positive cells to both tissues. Additionally, the tracing results showed whether these three cell populations have the capacity to produce progeny cells. We further supplemented the analysis with immunofluorescence results of double-positive cells to identify their cell types, selecting AlphaV as the marker for mesenchymal stem cells (MSCs) and CD45 as the marker for hematopoietic cells. This part is further discussed in the manuscript as below:

      Page 14-15 in the revised manuscript, “To identify the population of PDGFR-α+ and NFATc1+ co-expressing cells in the pulp and periodontal ligament (PDL), we generated Pdgfr-aCreER; Nfatc1DreER; R26-LSL-RSR-tdT-DTR (LRTD) mice... Strong tdTomato signals were detected in both the PDL (Figure S22B) and pulp (Figure S22C). With respect to the MSC-specific marker AlphaV, we observed AlphaV+tdTomato+ cells in both regions. Additionally, CD45+ (hematopoietic marker) tdTomato+ cells were also present in these areas (Figure S22B, C). These findings suggest that the population of PDGFR-α+ and NFATc1+ co-expressing cells is heterogeneous.”

      (2) The authors attempted to use PDGFRαCreER; Nfatc1DreER;IR1 mice to illustrate the hierarchies of NFATc1+ and PDGFRα+ cells. According to the principle of the IR1 reporter, it requires sequential induction of PDGFRα-CreER and Nfatc1-DreER to investigate their genetic relationship. Upon induction by tamoxifen, NFATc1+PDGFRα- cells and NFATc1-PDGFRα+ cells were labeled by Tomato and Zsgreen, respectively. However, the reporter expression of NFATc1+PDGFRα+ cells was uncertain, most likely random. Therefore, the hierarchical relationship of NFATc1+ and PDGFRα+ cells cannot be reliably determined from PDGFRαCreER; Nfatc1DreER; IR1 mice.

      Thank you for your question. We have supplemented the control group (Pdgfr-αCreER; IR1) experimental data (Figure 8). By comparing the results of Pdgfr-αCreER; Nfatc1DreER; LGRT tracing assays, we confirmed that the expression pattern and range of PDGFR-a+ cells in pulp and PDL of Pdgfr-αCreER; IR1 mice are consistent with those observed in Pdgfr-αCreER; Nfatc1DreER; LGRT mice (Figure 6), and the same applies to NFATc1+ cells. All of our experimental results have been repeated multiple times. In addition, the IR1 system was initially developed by Professor Bin Zhou's lab and was validated for feasibility and stability in a paper published in Nature Medicine in 2017 (https://doi.org/10.1038/nm.4437). Moreover, Professor Zhou Bo O's team applied IR1 dual recombinases for bone lineage tracing in 2021 published in Cell Stem Cell, which also confirmed its feasibility and stability. (DOI: 10.1016/j.stem.2021.08.010)

      Reviewer #2 (Public Review):

      Summary:

      Yang et al. present an article investigating the spatiotemporal atlas of NFATc1+ and PDGFR-α+ cells within the dental and periodontal mesenchyme. The study explores their capacity for progeny cell generation and their relationships - both inclusive and hierarchical - under homeostatic conditions. Utilizing the Cre/loxP-Dre/Rox system to construct tool mice, combined with tissue transparency and continuous tissue slicing for 3D reconstruction, the researchers effectively mapped the distribution of NFATc1+ and PDGFR-α+ cells. Additionally, in conjunction with DTA mice, the study provides preliminary validation of the impact of PDGFR-α+ cells on dental pulp and periodontal tissues. Primarily, this study offers an in-situ distribution atlas for NFATc1+ and PDGFR-α+ cells but provides limited information regarding their origin, fate differentiation, and functionality.

      We would like to thank the reviewer for setting a high value on our study. Given many constructive suggestions, the manuscript has been revised to improve the quantity of this study. All the necessary discussions have also been added, and all the questions and concerns have been well-addressed in the revised manuscript. The point-to-point reply to the comments is listed below:

      Strengths:

      (1) Tissue transparency techniques and continuous tissue slicing for 3D reconstruction, combined with transgenic mice, provide high-quality images and rich, reliable data.

      (2) The Cre/loxP and Dre/Rox systems used by the researchers are powerful and innovative.

      (3) The IR1 lineage tracing model is significantly important for investigating cellular differentiation pathways.

      (4) This study provides effective spatial distribution information of NFATc1+/PDGFR-α+ cell populations in the dental and periodontal tissues of adult mice.

      Weaknesses:

      (1) In the functional experiment section, the investigation into the role of NFATc1+/PDGFR-α+ cell populations is somewhat lacking.

      Thank you so much for your comments and suggestions. We have supplemented the analysis with immunofluorescence results of double-positive cells to identify NFATc1+&PDGFR-α+ cell populations, selecting AlphaV as the marker for mesenchymal stem cells (MSCs) and CD45 as the marker for hematopoietic cells. This part was shown as below:

      Page 14-15 in the revised manuscript, “To identify the population of PDGFR-α+ and NFATc1+ co-expressing cells in the pulp and periodontal ligament (PDL), we generated Pdgfr-aCreER; Nfatc1DreER; R26-LSL-RSR-tdT-DTR (LRTD) mice… Strong tdTomato signals were detected in both the PDL (Figure S22B) and pulp (Figure S22C). With respect to the MSC-specific marker AlphaV, we observed AlphaV+tdTomato+ cells in both regions. Additionally, CD45+ (hematopoietic marker) tdTomato+ cells were also present in these areas (Figure S22B, C). These findings suggested that the population of PDGFR-a+ and NFATc1+ co-expressing cells is heterogeneous.”

      We also supplemented the discussion regarding the role of PDGFR-α+ population on page 17. Its potential role in pulp and periodontal formation had been suggested as well.    

      Page 17 in the revised manuscript, “After ablating PDGFR-α+ cells, we observed damage to the odontoblast layer and shrinkage of the pulp core in dental pulp tissue, indicating that PDGFR-α+ cells contribute to the composition of dental pulp tissue, particularly the odontoblast layer (Figure. 9C, D). In the periodontal ligament, we noted a reduction and destruction of collagen fibers, suggesting a role for PDGFR-α+ cells in periodontal tissue structure (Figure. 9E, F).”

      (2) The author mentions that 3D reconstruction of consecutive tissue slices can provide more detailed information on cell distribution, so what is the significance of using tissue-clearing techniques in this article?

      Thank you for your insightful comment, and we are sorry for the insufficient statement here. In our study, the utilization of tissue clearing techniques was to address some of the shortcomings associated with the 3D reconstruction of consecutive tissue slices, such as the compromised integrity of samples due to section layering, leading to discontinuities along the z-axis and potential loss of positive signals (Fig. S5, S13). Additionally, unavoidable tissue damage during the sectioning process may result in the loss of some information. As one of the most advanced imaging technologies currently available, tissue clearing/imaging allows for direct observation of the spatial location and relationships of fluorescently labeled cells within the intact tissue, which is more persuasive. Also, evolving beyond the analysis of structural and molecular biology of selected tissue sections, and expanding the focus to entire organs and organisms, is a trend in the development of the biomedical field (Nat Methods. 2024 Jul;21(7):1153-1165; Nat Commun. 2024 Feb 26;15(1):1764). Admittedly, no method is flawless; thus, our employment of two advanced imaging approaches aims to answer questions regarding the spatial positioning and relationships of PDGFR-α single-positive, NFATc1 single-positive cells, and PDGFR-α+ NFATc1+ cells from multiple perspectives. This is done to enhance the credibility and persuasiveness of our results.

      We greatly appreciate your suggestion, which have significantly complemented the content of our article. The corresponding statements have been added in the revised manuscript as below:

      Page 6 in the revised manuscript, “As one of the most advanced imaging technologies currently available, tissue clearing/imaging allows for direct observation of the spatial location and relationships of fluorescently labeled cells within the intact tissue. Therefore, according to the existing SUMIC tissue deep clearing (TC) methods, we modified and improved a rapid and efficient procedure, which enable rapid single-cell resolution and quantitative panoptic 3D light-sheet imaging.”

      (3) After reading the entire article, it is confusing whether the purpose of the article is to explore the distribution and function of NFATc1+/PDGFR-α+ cells in teeth and periodontal tissues, or to compare the differences between tissue clearing techniques and 3D reconstruction of continuous histological slices using NFATc1+/PDGFR-α+ cells?

      We sincerely appreciate your question and apologize for any ambiguous descriptions.

      The purpose of our study is to map the atlas of NFATc1+/ PDGFR-α+ inclusive, exclusive and hierarchical distribution in dental and periodontal mesenchyme. Under this premise, the two advanced imaging techniques were merely employed as means to elucidate this issue Indeed, in the previous manuscript, we did overemphasize the comparison and description of the differences between tissue clearing techniques and 3D reconstruction of continuous slices, which led to unnecessary misunderstandings for which we are deeply apologetic. Consequently, in this version of the manuscript, we have diminished the descriptions comparing their advantages and disadvantages, focusing instead on exploring the importance of NFATc1+/PDGFR-α+ cells. We appreciate your suggestions once again.

      Page 6 in the revised manuscript, “These two 3D-reconstruction and imaging technologies complement each other to jointly address the spatial positioning and hierarchical relationships of PDGFR-α+, NFATc1+, and PDGFR-α+ NFATc1+ cells from multiple perspectives.”

      (4) The researchers did not provide a clear definition of the cell types of NFATc1+/PDGFR-α+ cells in teeth and periodontal tissues.

      Thanks for your suggestions. We discovered through cell ablation experiments that the removal of PDGFR-α+ cells resulted in the destruction of the odontoblast layer in the dental pulp, shrinkage of the pulp core, and disruption of collagen fibers in the periodontal ligament. Combined with the results from lineage tracing, we conclude that PDGFR-α+ cells primarily constitute the mesenchymal cells that form the supporting tissues in both the dental pulp and periodontal ligament (Part 4.1). Through immunofluorescence staining, AlphaV was as the marker for mesenchymal stem cells (MSCs) and CD45 as the marker for hematopoietic cells, we observed that the double-positive cell population was a heterogeneous group, containing both mesenchymal stem cells (MSC) and hematopoietic cells (Part 4.2).

      (5) In studies related to long bones, the author defines the NFATc1+/PDGFR-α+ cell population as SSCs, which as a stem cell group should play an important role in tooth development or injury repair. However, the distribution patterns and functions of the NFATc1+/PDGFR-α+ cell population in these two conditions have not been discussed in this study.

      Thanks for your suggestions. The NFATc1+/PDGFR-α+ cell population was identified as playing an important role in tissue regeneration, especially in oral and maxillofacial tissues. Our research primarily focuses on the identification of NFATc1+ and PDGFR-α+ cells within dental and periodontal mesenchyme, highlighting their contribution to tissue homeostasis and regeneration. Although the NFATc1+/PDGFR-α+ cells were characterized in the context of other tissue types, their detailed role in tooth development and injury repair remains an area for further exploration.

      This part was further discussed on page 17-18 in the revised manuscript, “Cell ablation and immunofluorescence staining experiments further characterized the types and functions of PDGFR-α+/PDGFR-α+&NFATc1+ populations. After ablating PDGFR-α+ cells, we observed damage to the odontoblast layer and shrinkage of the pulp core in dental pulp tissue, indicating that PDGFR-α+ cells contribute to the composition of dental pulp tissue, particularly the odontoblast layer (Figure. 9C, D). In the periodontal ligament, we noted a reduction and destruction of collagen fibers, suggesting a role for PDGFR-α+ cells in periodontal tissue structure (Figure. 9E, F). Previous results confirmed the presence of double-positive cells in both dental pulp and periodontal tissues and provided insights into their hierarchical relationships in the periodontal ligament (Figure. 8). To further investigate the double-positive cell population, we developed an inducible dual-editing enzyme reporter system to label these cells with tdTomato signals. Using AlphaV as a marker for mesenchymal stem cells (MSCs) and CD45 for hematopoietic cells, we found that double-positive cells included components of both MSCs and hematopoietic cells (Figure S22B, C), indicating a heterogeneous population. Further experiments are necessary to determine whether the predominant role in this co-positive MSC population is played by PDGFR-α+ or NFATc1+ and to clarify the specific functions of these cells in the future.”

      Reviewer #3 (Public Review):

      Summary:

      This groundbreaking study provided the most advanced transgenic lineage tracing and advanced imaging techniques in deciphering dental/periodontal mesenchyme cells. In this study, authors utilized CRISPR/Cas9-mediated transgenic lineage tracing techniques to concurrently demonstrate the inclusive, exclusive, and hierarchical distributions of NFATc1+ and PDGFR-α+ cells and their lineage commitment in dental and periodontal mesenchyme.

      Strengths:

      In cooperating with tissue clearing-based advanced imaging and three-dimensional slices reconstruction, the distribution and hierarchical relationship of NFATc1+ and PDGFR-α+ cells and progeny cells plainly emerged, which undoubtedly broadens our understanding of their in vivo fate trajectories in craniomaxillofacial tissue. Also, the experiment design is comprehensive and well-executed, and the results are convincing and compelling.

      Weaknesses:

      Minor modifications could be made to the paper, including more details on the advantages of the methodology used by the authors in this study, compared to other studies.

      Thanks for your constructive comments and advice on how to improve the quality of this research article. We have thoroughly and carefully corrected the manuscript based on your suggestion, and all the necessary data have been added to support our claims. Meanwhile, all the questions and concerns have been well-addressed in the revised manuscript and the revised supplementary information. Thus, we believe that the quality of this paper has been significantly enhanced. We thank you again for your great efforts.

      Recommendations For The Authors:

      Reviewer #1 (Recommendations For The Authors):

      (1) Line 134, the authors categorized the reporter systems into three types: intersectional reporters, exclusive reporters, and nested reporters. However, Figure 1A does not depict the nested reporters.

      Thanks for your helpful recommendation to improve the quality of this manuscript, and we are sorry for the mistake. In this revised manuscript, we have modified the content of Figure 1A, as displayed below:

      (2) Line 238, the authors mentioned that NFATc1 is expressed in the mandible and periodontal tissues based on their previous sequencing analyses. It would be better to cite the related reference or display the expression of NFATc1 in the Supplemental Figures.

      Thanks for your suggestions. We sincerely apologize for the typo that occurred during the writing process and have revised the original text to on page 9:

      “The previous sequencing analyses have reported the expression of NFATc1 in mandible and periodontal tissues20. (DOI: 10.1177/00220345221074356)”

      (3) Line 264, the figure callout "Figure 5E" does not exist, and the figure legends of Figure 5 contain the same error.

      We greatly appreciate your rigor and diligence, and we have corrected this error.

      (4) Line 280, the figure callout "Figure S12" is incorrect.

      Thank you for your efforts, and we are sorry for our negligence. The corresponding descriptions have been amended as below:

      Page 10 in the revised manuscript, “Consistent with the quantification of TC-based imaging results (Figure S9), the number of PDGFR-α+ cells and NFATc1+ cells were significantly higher than that in pulse group.”

      (5) Line 301, the figure callout "Figure 4" is erroneous.

      Thank you for your efforts, and we are sorry for our negligence. The corresponding descriptions have been amended as below:

      Page 11 in the revised manuscript, “After 11 days tracing, the number of PDGFR-α+ & NFATc1+ cells and PDGFR-α+NFATc1+ cells increased significantly (Figure 7)…”

      (6) Line 306, the sentence "Our previous study identified the presence of NFATc1+ cells in the cranium by single-cell sequencing (unpublished data)" could be improved by referencing specific data or findings.

      Thanks for your suggestions, and we are sorry for our negligence. The corresponding citation have been amended as below:

      Page 11 in the revised manuscript, “As a part of craniomaxillofacial hard tissue, we also intended to explore whether the presence of NFATc1+ and PDGFR-α+ cells in cranial bone tissue/suture is different from dental and periodontal tissue (our previous study has identified the presence of NFATc1+ cells in the cranium by single-cell sequencing28”

      (7) Line 341, the statement "Moreover, no PDGFR-α+ cells were detected in the Nfatc1DreER; IR1 group," needs further explanation or context.

      Thanks for your suggestions. The corresponding descriptions have been amended as below:

      Page 13 in the revised manuscript,  “Moreover, since the recombinase recognition sites are interleaved (loxP–rox–loxP–rox), recombination by one system will naturally remove a recognition site of the other system, rendering its reporter gene inactive for further recombination. The results showed no tdTomato+ cells or ZsGreen+ cells were detected in the Pdgfr-αCreER; IR1 or Nfatc1DreER; IR1 group respectively demonstrating the feasibility and accuracy of the IR1 system.”

      (8) Several statements in this text were duplicated. For instance, lines 365 to 376 are identical to lines 497 to 508. This redundancy should be addressed to improve the manuscript's clarity and conciseness.

      We greatly appreciate your suggestions, and we are sorry for the misunderstanding we may have caused. We have revised and integrated the entire Results 4 section (including lines 365 to 376 of the original manuscript) into the Discussion section to avoid unnecessary redundancy and misunderstandings. This adjustment also emphasizes that the goal of using two imaging techniques is to draw more credible conclusions from multiple perspectives, thereby mitigating the shortcomings of relying solely on existing advanced imaging methods. The revised content are as follows:

      Page 18 in the revised manuscript, “TC-based advanced imaging procedure can clearly visualize its 3D structure, reconstruct the whole across latitudes, and understand the spatial position and expression of each structure, which could avoid the bias of traditional single-layer slicing may cause, and provides a more intuitive and objective description of the existing situation. However, our results demonstrated TC still has some limitations…”

      Page 19 in the revised manuscript, “The 3D sections reconstruction results, however, effectively addressed the issue of weak tdTomato signal and provide a clearer visualization of the distribution of ZsGreen and tdTomato signals. For example, the tdTomato signal in the root pump, which was almost completely unobservable by TC-based imaging, can be clearly seen using confocal imaging and 3D reconstruction (Figure 3C-D, Figure 6C-D, and Figure S4, Figure S12). However, compared to TC, the quality of 3D reconstruction of sections still relies on the angle and quality of the sections, with the section angle having a significant impact on the reconstruction outcome. In addition, because the slice itself has a certain thickness (10 μM in this study), which leads to the appearance of discontinuous in the final reconstructed image, and the aesthetics and accuracy could be affected to a certain extent. Also, unavoidable tissue damage during the sectioning process may result in the loss of some information. Therefore, a variety of different information could be obtained through two different imaging technologies, which prompt us to use the advanced experimental procedure according to the actual purpose.”

      Reviewer #2 (Recommendations For The Authors):

      (1) It should be further highlighted in the article what cell type the NFATc1+/PDGFR-α+ cells should be defined as in teeth and periodontal tissues.

      Thank you so much for your suggestions. We have supplemented the analysis with immunofluorescence results of double-positive cells to identify NFATc1+&PDGFR-α+ cell populations, selecting AlphaV as the marker for mesenchymal stem cells (MSCs) and CD45 as the marker for hematopoietic cells.

      This part was on page 14-15 in the revised manuscript, “To identify the population of PDGFR-α+ and NFATc1+ co-expressing cells in the pulp and periodontal ligament (PDL), we generated Pdgfr-aCreER; Nfatc1DreER; R26-LSL-RSR-tdT-DTR (LRTD) mice… Strong tdTomato signals were detected in both the PDL (Figure S22B) and pulp (Figure S22C). With respect to the MSC-specific marker AlphaV, we observed AlphaV+tdTomato+ cells in both regions. Additionally, CD45+ (hematopoietic marker) tdTomato+ cells were also present in these areas (Figure S22B, C). These findings suggested that the population of PDGFR-a+ and NFATc1+ co-expressing cells is heterogeneous.”

      We also supplemented the discussion regarding the role of  PDGFR-α+ population on page 17. Its potential role in pulp and periodontal formation had been suggested as well:

      Page 17 in the revised manuscript: “After ablating PDGFR-α+ cells, we observed damage to the odontoblast layer and shrinkage of the pulp core in dental pulp tissue, indicating that PDGFR-α+ cells contribute to the composition of dental pulp tissue, particularly the odontoblast layer (Figure. 9C, D). In the periodontal ligament, we noted a reduction and destruction of collagen fibers, suggesting a role for PDGFR-α+ cells in periodontal tissue structure (Figure. 9E, F).”

      (2) The authors are advised to supplement the description of the cellular origin and the differentiation trajectory of NFATc1+/PDGFR-α+ cells in teeth and periodontal tissues.

      Thank you for your suggestion. Our study currently focused more on mapping the distribution atlas of NFATc1+PDGFRα+, NFATc1+PDGFRα-, and NFATc1-PDGFRα+ cells in adult homeostatic mice. In the next step, we plan to explore the differentiation trajectory of NFATc1+/PDGFRα+ cells during development using single-cell sequencing and other methods.

      (3) It is recommended to add figure labels to Figure 1B to facilitate reader comprehension.

      Thank you for your valuable suggestion to improve the quality of this manuscript. We have modified Figure 1B in the revised manuscript as follows:

      (4) Why compare 3D images from tissue clearing with 3D reconstructions of confocal imaging after consecutive tissue slicing?

      Thanks for your important and helpful comments to improve the quality of this manuscript, and we are sorry for the insufficient statement.

      The original intention of comparing the two methods was to is to draw more credible conclusions from multiple perspectives, thereby minimizing the limitations inherent in the singular use of current advanced imaging techniques. Indeed, the description in the previous manuscript could lead to misunderstandings among readers. Therefore, in the revised manuscript, we have modified and integrated the content of Results 4 section into the Discussion section to eliminate unnecessary verbosity and potential confusion.

      Page 18 in the revised manuscript, “TC-based advanced imaging procedure can clearly visualize its 3D structure, reconstruct the whole across latitudes, and understand the spatial position and expression of each structure, which could avoid the bias of traditional single-layer slicing may cause, and provides a more intuitive and objective description of the existing situation. However, our results demonstrated TC still has some limitations…”

      Page 19 in the revised manuscript, “The 3D sections reconstruction results, however, effectively addressed the issue of weak tdTomato signal and provide a clearer visualization of the distribution of Zsgreen and tdTomato signals. For example, the td-tomato signal in the root pump, which was almost completely unobservable by TC-based imaging, can be clearly seen using confocal imaging and 3D reconstruction (Figure 3C-D, Figure 6C-D, and Figure S4, Figure S12). However, compared to TC, the quality of 3D reconstruction of sections still relies on the angle and quality of the sections, with the section angle having a significant impact on the reconstruction outcome. In addition, because the slice itself has a certain thickness (10 μM in this study), which leads to the appearance of discontinuous in the final reconstructed image, and the aesthetics and accuracy could be affected to a certain extent. Also, unavoidable tissue damage during the sectioning process may result in the loss of some information. Therefore, a variety of different information could be obtained through two different imaging technologies, which prompt us to use the advanced experimental procedure according to the actual purpose.”

      (5) The experimental results section does not specify the age of the mice used, which lacks clarity for the reader and makes it difficult to determine at what developmental stage the observed distribution of NFATc1+/PDGFR-α+ cells occurs.

      Thank you for your suggestion. I apologize for overlooking this point. I only displayed the age of the mice in some of the figures. All the transgenic mice discussed in this article are adults around 12-14 weeks. I have added the specific weeks of age in the main text.

      (6) What is the rationale behind selecting day 1, day 3, and day 5 as the experimental time points in Figure 2B?

      Thanks for your questions. 48 hours after injection, TAM can be metabolized in the body and converted into 4-OHT, which then distributes thoroughly to various tissue systems through the bloodstream. Therefore, we chose to administer a booster dose 48 hours after the initial injection to ensure timely replenishment and achieve high labeling efficiency. This drug administration scheme has already been validated for feasibility in our preliminary studies.

      (7) In Figure 2E, why is there a large area of red signal visible in the tooth enamel?

      Thanks for your valuable comments and advice on how to improve the quality of this research article and our future work. As we discussed in the main text, the existing TC-based imaging techniques cannot meet the requirements for capturing as conspicuous tdTomato signals as ZsGreen, which may due to: 1) the editing efficiency of the DNA recombinase-mediated lineage-tracing system has limitations; 2) the lower presence of NFATc1+ cells in the region-of-interest (ROI) ensures weak signals of tdTomato; 3) the TC method as described may result in poor penetration of td-tomato fluorescence signals. Therefore, to clearly display the NFATc1+ cells in the ROI (periodontal ligament, pulp, and alveolar bone) as much as possible, we increased the intensity of excitation fluorescence of 561-channel of the Lightsheet fluorescence microscopy, which led to a large area of unrelated red signal in non-target areas (tooth enamel). In future work, we will further improve the TC procedure to shorten the sample processing time, and developing other transgenic mice to address this issue. Thanks again.

      (8) In the text at Line 249, the author notes that PDGFRα+ cells are widely distributed, and NFATc1+ cells are primarily located in the pulp horns. What is the relevance of their distribution to their function?

      Thank you very much for your suggestion. We found that PDGFRα+ cells are widely distributed in dental pulp tissue. Combined with the results from subsequent cell ablation experiments, it revealed that PDGFRα+ cells contribute to the formation of the odontoblast layer and the pulp core. In our supplementary data, we discovered through immunofluorescence staining that double-positive cells co-expressed AlphaV in the dental pulp, indicating that they possessed MSC components. We need to further investigate the relationship between their distribution and function in the future.

      (9) In Line 301 of the text, there is a mislabeling of Figure 4. Please verify this carefully throughout the document.

      Thank you for your efforts, and we are sorry for our negligence. We have made the necessary corrections and have meticulously reviewed the entire manuscript to ensure that there were no similar mistakes. The corresponding descriptions have been amended as below:

      Page 11 in the revised manuscript, “After 11 days tracing, the number of PDGFR-α+ & NFATc1+ cells and PDGFR-α+NFATc1+ cells increased significantly (Figure 7)…”

      (10) Between Lines 323 to 325, the author states: "the wider range of PDGFR-α+ cells than NFATc1+ cells were observed, which laid the foundation for our conjecture that NFATc1+ cells may contribute as subpopulation of PDGFR-α+ cells." This statement is inaccurate.

      Thank you for your suggestions. We apologize for the inaccuracies in our description and have made corrections in the original text.

      Page 12 in the revised manuscript, “the wider range of PDGFR-α+ cells than NFATc1+ cells were observed, we speculate that there may be a hierarchical relationship between the two.”

      (11) The author is advised to combine the use of single-cell sequencing data for cell trajectory analysis to corroborate the differentiation relationships between NFATc1+/PDGFR-α+ cells, discussing their specific origins and final differentiation fates.

      Thank you for your suggestion; it is very meaningful to us and will be the focus of our future research work.

      (12) In the Results 4 section, the comparison between tissue clearing imaging and 3D reconstruction of consecutive tissue slices could be discussed in the discussion section.

      We greatly appreciate your suggestions. We have revised and integrated the entire Results 4 section into the Discussion section to avoid unnecessary redundancy and misunderstandings. This adjustment also emphasizes that the goal of using two imaging techniques is to draw more credible conclusions from multiple perspectives, thereby mitigating the shortcomings of relying solely on existing advanced imaging methods. The revised content are as follows:

      Page 18 in the revised manuscript, “TC-based advanced imaging procedure can clearly visualize its 3D structure, reconstruct the whole across latitudes, and understand the spatial position and expression of each structure, which could avoid the bias of traditional single-layer slicing may cause, and provides a more intuitive and objective description of the existing situation. However, our results demonstrated TC still has some limitations…”

      Page 19 in the revised manuscript, “The 3D sections reconstruction results, however, effectively addressed the issue of weak tdTomato signal and provide a clearer visualization of the distribution of Zsgreen and tdTomato signals. For example, the td-tomato signal in the root pump, which was almost completely unobservable by TC-based imaging, can be clearly seen using confocal imaging and 3D reconstruction (Figure 3C-D, Figure 6C-D, and Figure S4, Figure S12). However, compared to TC, the quality of 3D reconstruction of sections still relies on the angle and quality of the sections, with the section angle having a significant impact on the reconstruction outcome. In addition, because the slice itself has a certain thickness (10 μM in this study), which leads to the appearance of discontinuous in the final reconstructed image, and the aesthetics and accuracy could be affected to a certain extent. Also, unavoidable tissue damage during the sectioning process may result in the loss of some information. Therefore, a variety of different information could be obtained through two different imaging technologies, which prompt us to use the advanced experimental procedure according to the actual purpose.”

      (13) The article only demonstrates the impact of removing PDGFR-α+ cells on the dental pulp and periodontal tissues of adult mice. What would be the impact of removing NFATc1α cells on teeth and periodontal tissues?

      Thank you for your suggestions. Our lab had been investigating the role of NFATc1+ cells in PDL and dental pulp tissues which is currently submitted to another journal. So please forgive me for not being able to present the data. The ablation assays showed that NFATc1+ cells may be involved in the formation of the odontoblast layer in dental pulp and in promoting osteogenic differentiation in the periodontal ligament.

      (14) The effects of removing PDGFR-α+ cells on the teeth and periodontal tissues of adult mice are shown in the article. What would be the impact on teeth and periodontal tissues if PDGFR-α cells were removed during early development?

      Thank you for your question. Our current research has not yet focused on the impact of PDGFR-α+ cells on the formation of periodontal ligaments and dental pulp tissue during the developmental stage. In our literature search, we found articles indicating that PDGFR-α was expressed at all stages of tooth development, and that PDGFR-α signaling was crucial for regulating the growth of the tooth apex and the proper extension of the palatal shelves during palatal fusion. Disruption of PDGFRα signaling interferes with apex growth and the critical extension of palatal shelves during craniofacial development. In the future, we would like to focus on the role of PDGFR-α cells during teeth development.

      (15) If the data on the skull are not presented in this paper, it is suggested not to overly describe it in the results section, or to include related skull data in supplementary figures.

      We appreciate your attention to detail and your suggestions for improving the clarity and presentation of our work. The corresponding results of cranium and cranial sutures region were shown in Video S7-9 in the revised manuscript.

      Reviewer #3 (Recommendations For The Authors):

      We sincerely appreciate your thorough review and positive feedback on our manuscript. In accordance with your recommendations, all the questions and concerns have been well-addressed in the revised manuscript. We believe these revisions further enhance the clarity and quality of our work. The point-to-point reply to the comments is listed below:

      (1) In line 181, the author claimed that "we modified and improved a rapid and efficient procedure...this ultrafast clearing technique could minimize the impact on transgenic mice." However, there is no mention in the main text of the amount of time required for other methods. How can the "rapid" element of your improved method be reflected? The author should briefly list a few other studies and discuss them.

      Thanks for your important and helpful comments, and we are sorry for the insufficient statement. In recent years, a variety of tissue clearing methods have emerged. Here is a summary of the methods and durations used for hard tissue clearing as published in several authoritative journals:

      Author response table 1.

      In comparison, our approach requires only approximately two days, thereby minimizing the potential damage to the tissue itself. Additionally, the study employs transgenic mice mediated by lineage tracing, and the shorter processing time also serves to reduce the impact on the fluorescence of the positive cells to a minimum.

      (2) In Figure S6, the author mentioned the use of another 3D reconstruction method-DICOM-3D. What is the advantage of this methodology? Is the conclusion drawn the same as the previous approaches? The author should propose corresponding discussions in this section.

      We sincerely appreciate your comments. The purpose of employing DICOM-3D reconstruction for the serial section images is to validate the constructed results obtained by Imaris. This method is based on sequential 2D DICOM images and utilizes 3D reconstruction and visualization technology to generate a stereoscopic 3D image with intuitive effects. Compared to Imaris reconstruction, this method offers a more straightforward and time-efficient approach. Regardless of the different reconstruction methods employed in this study, the ultimate goal remains consistent, which is to jointly address the spatial positioning and hierarchical relationships of PDGFR-α+, NFATc1+, and PDGFR-α+NFATc1+ cells from multiple perspectives, to enhance the credibility and persuasiveness of our results. We have also included the corresponding description in the revised manuscript as follows:

      Page 8-9 in the revised manuscript, “To enhance the comprehensive and accurate display of the reconstruction results and to mitigate the potential errors that may arise from relying on single reconstruction method, we employed an alternative 3D reconstruction method—DICOM-3D. This method is based on sequential 2D DICOM images and utilizes 3D reconstruction and visualization technology to generate a stereoscopic 3D image with intuitive effects, which was a comparatively straightforward and highly efficient approach. We transformed the serial IF images into DICOM format and subsequently reconstruct it, and the same conclusion can be drawn, namely, PDGFR-α+ cells almost constituted the whole structure of pulp and PDL, with NFATc1+ cells as subpopulation (Figure S6).

      (3) Line 292: Why was the tdTomato signal in confocal-based reconstruction more conspicuous than the TC procedure? Some descriptions would be beneficial for readers' understanding.

      Thank you very much for your comments. We hypothesize that the current light-sheet systems have inherent limitations in capturing tdTomato signals of intact tissue, which become more evident in tissues with inherently low fluorescence strengths (in this work, due to the limitations of editing efficiency in DNA recombinase mediated lineage-tracing system, which guaranteed weaker tdTomato signal compared to ZsGreen). In contrast, traditional confocal imaging techniques do not encounter such issues. The corresponding descriptions in the revised manuscript are shown as follows:

      Page 11 in the revised manuscript, “We hypothesize that the current light-sheet systems for intact tissue-imaging have inherent limitations in capturing tdTomato signals, which become more evident in tissues with inherently low fluorescence strengths (in this work, due to the limitations of editing efficiency in DNA recombinase mediated lineage-tracing system, which guaranteed weaker tdTomato signal compared to ZsGreen). In contrast, traditional confocal imaging techniques do not encounter such issues.”

      (4) Part 2.2, line 305: What is the purpose of analyzing the cranium and cranial sutures region through TC technology?

      Thank you for your comments. There are three main purposes of this part of the experiment. First, our research group has long been committed to studying the distribution and role of NFATc1+ SSCs in a variety of hard tissues, and our previous study has identified the presence of NFATc1+ cells in the cranium by single-cell sequencing. Therefore, in this work, we also intend to investigated the spatiotemporal atlas of NFATc1+ and PDGFR-α+ cells in cranium and cranial sutures region based on transgenic lineage tracing techniques. Second, as a part of craniomaxillofacial hard tissue, we intended to explore whether the presence of NFATc1+ and PDGFR-α+ cells in cranial bone tissue/suture is different from dental and periodontal tissue; In addition, the results in Video S7-9 further demonstrated that our improved tissue clearing procedure in this work is universal for a variety of hard tissues, which lay a foundation for our future researches.

      Page 11 in the revised manuscript, “As a part of craniomaxillofacial hard tissue, we also intended to explore whether the presence of NFATc1+ and PDGFR-α+ cells in cranial bone tissue/suture is different from dental and periodontal tissue (our previous study has identified the presence of NFATc1+ cells in the cranium by single-cell sequencing28”

      (5) Some images before & after the tissue-clearing procedure need to be provided in the supplemental file.

      Thanks for your important and helpful comments to improve the quality of this manuscript. We have included the corresponding description and photographs in the main text and the supplemental file as follows:

      Page 7 in the revised manuscript, “As shown in Figure S1A-B, we recorded bright-field images of the maxilla before and after clearing, and our procedure achieved high transparency of the whole tissue. On this basis, whole-tissue imaging can be achieved, with the observation of different cell type distribution in spatial 3D structure.”

      (6) In part 5, line 394, the author investigated the consequences of the ablation of PDGFR-α+ cells in dental pulp and periodontal mesenchymal tissues, but some research objectives and mechanisms need to be discussed here, regarding: "why choosing to ablation PDGFR-α+ cells instead of NFATc1+ cells? Was the hierarchical relationship between PDGFR-α+ cells and NFATc1+ cells considered during the experimental design?", etc.

      Thank you very much for your suggestion, it has been very helpful. We chose PDGFR-α+ cells as the subject for the cell ablation experiments based on the results from the previous lineage tracing and hierarchical relationship studies. We have included the corresponding description and photographs in the main text and the supplemental file as follows:

      Page 13 in the revised manuscript, “The results from the aforementioned lineage tracing experiments showed that PDGFR-α+ cells constitute a significant component of both dental pulp and periodontal tissues. Additionally, the hierarchical relationship experiments revealed that a portion of NFATc1+ cells in the periodontal ligament derives from PDGFR-α+ progenitor cells. Therefore, investigating the role of PDGFRα+ cells in dental pulp and periodontal tissues has become more urgent.”

      (7) Some claims in the main text were lack of literature citation, such as in lines 207 and 234.

      Thank you very much for your comments. We are deeply sorry for the mistakes. We have added the relevant references at the appropriate locations in the main text as follows:

      (1) line 207 of previous manuscript (page 8, line 206 in the revised manuscript): We sincerely apologize for the typo that occurred during the writing process and have revised the original text to: which was consistent with RNA-sequencing results in the previous study20. (DOI: 10.1177/00220345221074356)

      (2) line 234 of previous manuscript (page 9, line 234 in the revised manuscript): “we employed an alternative 3D reconstruction method—DICOM-3D27.” (DOI: 10.1177/09544119211020148)

      (8) What were the specific reasons for the conspicuous tdTomato signal in the reconstructed images obtained by traditional serial section-based confocal imaging, which were not as evident in TC imaging?

      Thank you very much for your comments. Traditional sectioning and subsequent confocal imaging can clearly display fluorescence signals on a single plane (Figure 3B, Figure 6B, Figure S3, S8, S11, S16, S19), therefore, after 3D reconstruction of multiple planes, it will still have a high resolution (Figure 3, 4, 7, 8). However, for TC imaging, the current light-sheet systems have inherent limitations in capturing tdTomato signals of intact tissue, which become more evident in tissues with inherently low fluorescence strengths (in this work, due to the limitations of editing efficiency in DNA recombinase mediated lineage-tracing system, which guaranteed weaker tdTomato signal compared to ZsGreen). In contrast, traditional confocal imaging techniques do not encounter such issues.

      (9) In tissue clearing techniques, do the chemical reagents and procedures used affect the signal intensity of tdTomato and Zsgreen?

      We appreciate your helpful comment. In this work, we modified and improved a rapid and efficient tissue deep clearing (TC) procedure based the existing SUMIC method, and  (Nature Cardiovascular Research, 2024, 3, 474–491; Cell, 2023, 186, 382-397.e24.). These researches have confirmed that the chemical reagents used in this method do not affect the inherent fluorescence signal of transgenic animals. With our improvements, we minimized the sample processing time as much as possible to avoid any potential adverse effects. The results in Figure 2, Figure 5, and Figure S1 indicated that after TC procedure, the tissue exhibit significant ZsGreen signals and certain tdTomato signals, which sufficiently support our conclusions.

      (10) How did you address the issue of sample integrity and discontinuities in the z-axis caused by the stratification of slices in your reconstructions?

      We greatly appreciate your comments. Currently, reconstruction techniques based on continuous sectioning cannot fully eliminate the discontinuities in the z-axis. Therefore, it is for this reason that we need to compensate for this deficiency by imaging the whole tissue through TC procedure. These two 3D-reconstruction and imaging technologies complement each other to jointly address the spatial positioning and hierarchical relationships of PDGFR-α+, NFATc1+, and PDGFR-α+NFATc1+ cells from multiple perspectives. Additionally, this deficiency can be minimized by improving the technical skills, reducing section thickness, and to minimize tissue loss during sectioning, which is our future research endeavors.

      (11) In Figure 2B, the schematic representation of the operational principle "Cre-loxp/Dre-loxp" does not correspond to the genotype "CreER/DreER". Please correct it.

      Thanks for your important comments. We are sincerely sorry for the mistake. We have modified Figure 2B in the revised manuscript as below:

      (12) Line 450, the specific distribution and differences of PDGFR-α+, NFATc1+, and PDGFR-α+&NFATc1+ cells in pulp and periodontal tissues need to be further described and explained.

      Thank you for your question. We have described this part on page 16 in the revised manuscript, “In PDL tissue, pulse data demonstrated widespread and abundant expression of PDGFR-α single-positive cells as well as NFATc1 single-positive cells, with no significant alteration in expression pattern or quantity after lineage tracing. Consequently, we conclude that in periodontal ligament and dental pulp tissues, PDGFR-α single-positive and NFATc1 single-positive cells primarily label intrinsic periodontal mesenchyme in PDL. Conversely, PDGFR-α+&NFATc1+ cells exhibited a more confined localization in PDL. The tracing data clearly illustrated that PDGFR-α+&NFATc1+ cells successfully gave rise to numerous progenies, which become predominant constituents within the periodontal ligament. In pulp tissue, the distribution of PDGFR-α single-positive cells was similar as that in PDL, primarily labeled odontoblast cell layer and there was not a significant increase in ZsGreen signal after tracing assay.”

      (13) In Figure S9, the sparse presence of NFATc1+ cells in pulp and periodontal tissue raises questions about the plasticity and differentiation potential of these cells. The author should include relevant discussions in this section.

      Thanks for your suggestion. Considering the plasticity and differentiation potential of NFATc1+ cells, we conducted immunofluorescence staining and found that the PDGFR-α+&NFATc1+ cell lineage in dental pulp and periodontal tissues represents a heterogeneous population. This population includes non-terminally differentiated mesenchymal stem cells (MSCs) as well as hematopoietic cells, indicating significant heterogeneity. We have also added this part of the discussion on page 17 of the manuscript.

      Page 17 in the revised manuscript, “Cell ablation and immunofluorescence staining experiments further characterized the types and functions of PDGFR-α+/PDGFR-α+&NFATc1+ populations. After ablating PDGFR-α+ cells, we observed damage to the odontoblast layer and shrinkage of the pulp core in dental pulp tissue, indicating that PDGFR-α+ cells contribute to the composition of dental pulp tissue, particularly the odontoblast layer (Figure. 9C, D). In the periodontal ligament, we noted a reduction and destruction of collagen fibers, suggesting a role for PDGFR-α+ cells in periodontal tissue structure (Figure. 9E, F). Previous results confirmed the presence of double-positive cells in both dental pulp and periodontal tissues and provided insights into their hierarchical relationships in the periodontal ligament (Figure. 8). To further investigate the double-positive cell population, we developed an inducible dual-editing enzyme reporter system to label these cells with tdTomato signals. Using AlphaV as a marker for mesenchymal stem cells (MSCs) and CD45 for hematopoietic cells, we found that double-positive cells included components of both MSCs and hematopoietic cells (Figure S22B, C), indicating a heterogeneous population. Further experiments are necessary to determine whether the predominant role in this co-positive MSC population is played by PDGFR-α+ or NFATc1+ and to clarify the specific functions of these cells in the future.”

      (14) Part 3, line 351, the authors were unable to confirm the hierarchical relationship between PDGFR-α+ and NFATc1+ cells in the dental pulp region. Could this be due to limitations in experimental design or technical methods? Have you considered other factors that might explain these results?

      Thank you for your question. We believe that the possible reason was that PDGFR-α+ cells were a widely distributed constitutive component of dental pulp tissue, while NFATc1+ cells had a more limited expression range, resulting in a significant difference between the two. Therefore, we were unable to calculate the differences. In the future, we could further investigate the hierarchical relationship between the two by increasing the sample size or through in vitro experiments such as immunoprecipitation.

    1. eLife Assessment

      This study presents an important new bioinformatics tool for normalizing gene copy number from metagenomic assemblies and applies it to gain functional insights into the loss of microbial diversity during conditions of stress. The inclusion of extensive computational validation makes this a compelling study that raises intriguing new hypotheses regarding the impact of disease states on the gut microbiome. This paper will likely be of broad interest to researchers studying the role of complex microbial communities in host health and disease.

    2. Reviewer #1 (Public review):

      In this work, Veseli et al. present a computational framework to infer the functional diversity of microbiomes in relation to microbial diversity directly from metagenomic data. The framework reconstructs metabolic modules form metagenomes and calculates the per-population copy number of each module, resulting in the proportion of microbes in the sample carrying certain genes. They applied this framework to a dataset of gut microbiomes from 109 inflammatory bowel disease (IBD) patients, 78 patients with other gastrointestinal conditions, and 229 healthy controls. The found that the microbiomes of IBD patients were enriched in a high fraction of metabolic pathways, including biosynthesis pathways such as those for amino acids, vitamins, nucleotides, and lipids. Hence, they had higher metabolic independence compared with healthy controls. To an extent, the authors also found a pathway enrichment suggesting higher metabolic independence in patients with gastrointestinal conditions other than IBD indicating this could be a signal for a general loss in host health. Finally, a machine learning classifier using high metabolic independence in microbiomes could predict IBD with good accuracy. Overall, this is an interesting and well-written article and presents a novel workflow that enables a comprehensive characterization of microbiome cohorts.

      Comments on revisions:

      I believe that after the second round of revisions, the Reviewers sufficiently addressed the comments and improved the manuscript. Open questions have been answered. I have no further comments.

    3. Reviewer #2 (Public review):

      This study builds upon the team's recent discovery that antibiotic treatment and other disturbances favours the persistence of bacteria with genomes that encode complete modules for the synthesis of essential metabolites (Watson et al. 2023). Veseli and collaborators now provide an in-depth analysis of metabolic pathway completeness within microbiomes, finding strong evidence for an enrichment of bacteria with high metabolic independence in the microbiomes associated with IBD and other gastrointestinal disorders. Importantly, this study provides a new open-source software to facilitate the reconstruction of metabolic pathways, estimate their completeness and normalize their results according to species diversity. Finally, this study also shows that metabolic independence of microbial communities can be used as a marker of dysbiosis. The function-based health index proposed here is more robust to individual's lifestyles and geographic origin than previously proposed methods based on bacterial taxonomy.

      The implications of this study have the potential to spur a paradigm shift in the field. It shows that certain bacterial taxa that have been consistently associated with disease might not be harmful to their host as previously thought. These bacteria seem to be the only species that are able to survive in a stressed gut environment. They might even be important to rebuild a healthy microbiome (although the authors are careful in not making this speculation).

      This paper provides an in-depth discussion of the results, and limitations are clearly addressed throughout the manuscript (see also the supplementary files for an in-depth assessment of the robustness of the methods). Some of the potential limitations relate to the use of large publicly available datasets, where sample processing and the definition of healthy status varies between studies. The authors have recognised these issues and their results were robust to analyses performed at a per-cohort basis. The potential limitations therefore are unlikely to have affected the conclusions of this study.

      Overall, this is manuscript is a magnificent contribution to the field, likely to inspire many other studies to come.

      Comments on revisions:

      The authors have performed a detailed assessment of the accuracy and robustness of their new methods, and included an informative session comparing their new approach with existing ones. The new analyses have strengthened the manuscript, and the results support the biological interpretations of the study.<br /> I commend the authors for the effort and the excellent research.

    4. Reviewer #3 (Public review):

      The major strength of this manuscript is the "anvi-estimate-metabolism' tool, which is already accessible online, extensively documented, and potentially broadly useful to microbial ecologists. Inclusion of extensive benchmarking and validation on simulated metagenomes has further increased confidence in this approach. Further, the conceptual insights raise interesting hypotheses that could be pursued in follow-on experimental work.

      Comments on revisions:

      Thank you for the very thorough response and congratulations!

    5. Author response:

      The following is the authors’ response to the original reviews.

      Response to Public Reviewer Comments:

      Reviewer 1:

      In this work, Veseli et al. present a computational framework to infer the functional diversity of microbiomes in relation to microbial diversity directly from metagenomic data. The framework reconstructs metabolic modules from metagenomes and calculates the per-population copy number of each module, resulting in the proportion of microbes in the sample carrying certain genes. They applied this framework to a dataset of gut microbiomes from 109 inflammatory bowel disease (IBD) patients, 78 patients with other gastrointestinal conditions, and 229 healthy controls. They found that the microbiomes of IBD patients were enriched in a high fraction of metabolic pathways, including biosynthesis pathways such as those for amino acids, vitamins, nucleotides, and lipids. Hence, they had higher metabolic independence compared with healthy controls. To an extent, the authors also found a pathway enrichment suggesting higher metabolic independence in patients with gastrointestinal conditions other than IBD indicating this could be a signal for a general loss in host health. Finally, a machine learning classifier using high metabolic independence in microbiomes could predict IBD with good accuracy. Overall, this is an interesting and well-written article and presents a novel workflow that enables a comprehensive characterization of microbiome cohorts.

      We thank the reviewer for their interest in our study, their summary of its findings, and their kind words about the manuscript quality.

      Reviewer 2:

      This study builds upon the team's recent discovery that antibiotic treatment and other disturbances favour the persistence of bacteria with genomes that encode complete modules for the synthesis of essential metabolites (Watson et al. 2023). Veseli and collaborators now provide an in-depth analysis of metabolic pathway completeness within microbiomes, finding strong evidence for an enrichment of bacteria with high metabolic independence in the microbiomes associated with IBD and other gastrointestinal disorders. Importantly, this study provides new open-source software to facilitate the reconstruction of metabolic pathways, estimate their completeness and normalize their results according to species diversity. Finally, this study also shows that the metabolic independence of microbial communities can be used as a marker of dysbiosis. The function-based health index proposed here is more robust to individuals' lifestyles and geographic origin than previously proposed methods based on bacterial taxonomy.

      The implications of this study have the potential to spur a paradigm shift in the field. It shows that certain bacterial taxa that have been consistently associated with disease might not be harmful to their host as previously thought. These bacteria seem to be the only species that are able to survive in a stressed gut environment. They might even be important to rebuild a healthy microbiome (although the authors are careful not to make this speculation).

      This paper provides an in-depth discussion of the results, and limitations are clearly addressed throughout the manuscript. Some of the potential limitations relate to the use of large publicly available datasets, where sample processing and the definition of healthy status varies between studies. The authors have recognised these issues and their results were robust to analyses performed on a per-cohort basis. These potential limitations, therefore, are unlikely to have affected the conclusions of this study.

      Overall, this manuscript is a magnificent contribution to the field, likely to inspire many other studies to come.

      We thank the reviewer for their endorsement of our study and their precision regarding the evaluation of its strengths. We also appreciate their high expectations for its impact in the field.

      Reviewer 3:

      The major strength of this manuscript is the "anvi-estimate-metabolism' tool, which is already accessible online, extensively documented, and potentially broadly useful to microbial ecologists.

      We thank the reviewer for their recognition of the computational advances in this study. We also thank the reviewer for their suggestions that we have addressed below, which allowed us to strengthen our manuscript.

      However, the context for this tool and its validation is lacking in the current version of the manuscript. It is unclear whether similar tools exist; if so, it would help to benchmark this new tool against prior methods.

      The reviewer brings up a very good point about the lack of context for the `anvi-estimate-metabolism` program. While our efforts that led to the emergence of this software included detailed benchmarking efforts, a formal assessment of its performance and accuracy was indeed lacking. We are thankful for our reviewer to point this out, which motivated us to perform additional analyses to address such concerns. Our revision contains a new, 34-page long supplementary information file (Supplementary File 2) that includes a section titled “Comparison of anvi-estimate-metabolism to existing tools for metabolism reconstruction”. The text therein describes the landscape of currently available software for metabolism reconstruction and describes the features that make `anvi-estimate-metabolism` unique – namely, (1) its implementation of metrics that make it suitable for metagenome-level analyses (i.e., pathway copy number and stepwise interpretation of pathway definitions) and (2) its ability to process user-defined metabolic pathways rather than exclusively relying on KEGG. As described in that section, there is currently no other tool that can compute copy numbers of metabolic pathways from metagenomic data. Hence, it is not quite possible to benchmark the copy number methodology used in our study against prior methods; however, our benchmarking of this functionality with synthetic genomes and metagenomes (described later in this document) does provide necessary quantitative insights into its accuracy and efficiency.

      While comparison of the copy number calculations to other tools was not possible due to the unique nature of this functionality, it was possible to benchmark our gene function annotation methodology against existing tools that also annotate genes with KEGG KOfams, which is a step commonly used by various tools that aim to estimate metabolic potential in genomes and metagenomes. In the anvi’o software ecosystem the annotation of genes for metabolic reconstruction is implemented in `anvi-run-kegg-kofams`, and represents a step that is required by `anvi-estimate-metabolism`. As our comparisons were quite extensive and involved additional researchers, we described them in another study which we titled “Adaptive adjustment of significance thresholds produces large gains in microbial gene annotations and metabolic insights” (doi:10.1101/2024.07.03.601779) that is now cited from within our revision in the appropriate context. Briefly, our comparison of anvi’o, Kofamscan, and MicrobeAnnotator using 396 publicly-available bacterial genomes from 11 families demonstrated that `anvi-run-kegg-kofams` is able to identify an average of 12.8% more KO annotations per genome than the other tools, especially in families commonly found in the gut environment (Figure 1). Furthermore, anvi’o recovered the highest proportion of annotations that were independently validated using eggNOG-mapper. Our comparisons also showed that annotations from anvi’o yield at least 11.6% more complete metabolic modules than Kofamscan or MicrobeAnnotator, including the identification of butyrate biosynthesis in Lachnospiraceae genomes at rates similar to manual identification of this pathway in this clade (Figure 2a). Overall, our findings that are now described extensively in DOI:10.1101/2024.07.03.601779 show that our method captures high-quality annotations for accurate downstream metabolism estimates.

      We hope these new data help increase the reviewer’s confidence in our results.

      Simulated datasets could be used to validate the approach and test its robustness to different levels of bacterial richness, genome sizes, and annotation level.

      We thank the reviewer for this suggestion. It was an extremely useful exercise that not only helped us elucidate the nuances of our approach, but also enabled us to further highlight its strengths in our manuscript. We created simulated datasets including a total of 409 synthetic metagenomes that we used to test the robustness of our approach to different genome sizes, community sizes, and levels of diversity. Overall, our tests with these synthetic metagenomes demonstrated that our approach of computing PPCN values to summarize the metabolic capacity within a metagenomic community is accurate and robust to differences in all three critical variables. Most of these variables were weakly correlated between PPCN or PPCN accuracy, and the few correlations that were stronger in fact further supported our original hypothesis that we generated from our comparisons of healthy and IBD gut metagenomes. The methods and results of our validation efforts are explained in detail in our new Supplementary File 2 (see the section titled “Validation of per-population copy number (PPCN) approach on simulated metagenomic data”), but we copy here the subsection that summarizes our findings for the reviewer’s convenience:

      Overall impact on the comparison between healthy and IBD gut metagenomes

      “In summary, our validation strategy revealed good accuracy at estimating metagenome-level metabolic capacity relative to our genome-level knowledge in the simulated data. While it often underestimated average genomic completeness by ignoring partial copies of metabolic pathways and often overestimated average genomic copy number due to the effect of pathway complementarity between different community members, the magnitude of error was overall limited in range and the error distributions were centered at or near 0. Furthermore, we observed these broad error trends in all cases we tested, and therefore we expect that they would also apply to both sample groups in our comparative analysis. Thus, we next considered how the PPCN approach might have influenced our analyses that considered metagenomes from healthy individuals and from those who have IBD – two groups that differed from one another with respect to some of the variables considered in our tests.

      Most of the correlations between PPCN or PPCN accuracy and sample parameters were weak, yet significant (Table 1). They showed that community size and diversity level have limited influence on the PPCN calculation, while genome size does not influence its accuracy. The only exception was the moderate correlation between PPCN and genome size, particularly for the subset of IBD-enriched pathways. It was a negative correlation with the proportion of small genomes in a metagenome, indicating that PPCN values for these pathways are larger when there are more large genomes in the community and suggesting that these pathways tend to occur frequently in larger genomes. This is in line with our observation that IBD communities contain more large genomes and therefore confirms our interpretation that the populations surviving in the IBD gut microbiome are those with the genomic space to encode more metabolic capacities.

      If we consider even the weak correlations, two of those relationships indicate that our approach would be more accurate for IBD metagenomes than for healthy metagenomes. For instance, PPCN accuracy was slightly higher for smaller communities (as in IBD samples), with a weakly positive correlation between PPCN error and community size. It was also slightly more accurate for less diverse communities (as in IBD samples), with a weakly positive correlation between PPCN error and number of phyla. The only opposing trend was the weakly positive correlation between PPCN error and proportion of smaller genomes, which favors higher accuracy in communities with smaller genomes (as in healthy samples). Given that our analysis focuses on the pathways enriched in IBD samples, an overall higher accuracy in IBD samples would increase the confidence in our enrichment results.

      We also examined the accuracy of our method to predict the number of populations within a metagenome based on the distribution and frequency of single-copy core genes (i.e., the denominator in the calculation of PPCN). Our benchmarks show that the estimates are overall accurate, where most errors reflect a negligible amount of underestimations of the actual number of populations. Errors occurred more frequently for the realistic synthetic assemblies generated from simulated short read data than for the ideal synthetic assemblies generated from the combination of genomic contigs. The correlations between estimation accuracy and sample parameters indicated that the population estimates are more accurate for smaller communities and communities with more large genomes, as in IBD samples (Table 2). Thus, this method is more likely to underestimate the community size in healthy samples, and these errors could lead to overestimation of PPCN in healthy samples relative to IBD samples. Thus, the enrichment of a given pathway in the IBD samples would have to overcome its relative overestimation in the healthy sample group, making it more likely that we identified pathways that were truly enriched in the IBD communities.

      Overall, the consideration of our simulations in the context of healthy vs IBD metagenomes suggest that slight biases in our estimates as a function of unequal diversity with sample groups should have driven PPCN calculations towards a conclusion that is opposite of our observations under neutral conditions. Thus, clear differences between healthy vs IBD metagenomes that overcome these biases suggest that    biology, and not potential bioinformatics artifacts, is the primary driver of our observations.”

      Accordingly, we have added the following sentence summarizing the validation results to our paper:

      “Our validation of this method on simulated metagenomic data demonstrated that it is accurate in capturing metagenome-level metabolic capacity relative to genome-level metabolic capacity estimated from the same data (Supplementary File 2, Supplementary Table 6).”

      Early in this process of validation, we identified and fixed two minor bugs in our codebase. The bugs did not affect the results of our paper and therefore did not warrant a re-analysis of our data. The first bug, which is detailed in the Github issue https://github.com/merenlab/anvio/issues/2231 and fixed in the pull request https://github.com/merenlab/anvio/pull/2235, led to the overestimation of the number of microbial populations in a metagenome when the metagenome contains both Bacteria and Archaea. None of the gut metagenomes analyzed in our paper contained archaeal populations, so this bug did not affect our community size estimates.

      The second bug, which is detailed in the Github issue https://github.com/merenlab/anvio/issues/2217 and fixed in the pull request https://github.com/merenlab/anvio/pull/2218, caused inflation of stepwise copy numbers for a specific type of metabolic pathway in which the definition contained an inner parenthetical clause. This bug affected only 3 pathways in the KEGG MODULE database we used for our analysis, M00083, M00144, and M00149. It is worth noting that one of those pathways, M00083, was identified as an IBD-enriched module in our analysis. However, the copy number inflation resulting from this bug would have occurred equivalently in both the healthy and IBD sample groups and thus should not have impacted our comparative analysis.

      Regardless, we are grateful for the suggestion to validate our approach since it enabled us to identify and eliminate these minor issues.

      The concept of metabolic independence was intriguing, although it also raises some concerns about the overinterpretation of metagenomic data. As mentioned by the authors, IBD is associated with taxonomic shifts that could confound the copy number estimates that are the primary focus of this analysis. It is unclear if the current results can be explained by IBD-associated shifts in taxonomic composition and/or average genome size. The level of prior knowledge varies a lot between taxa; especially for the IBD-associated gamma-Proteobacteria.

      The reviewer brings up an important point, and we are thankful for the opportunity to clarify the impact of taxonomy on our analysis. Though IBD has been associated with taxonomic shifts in the gut microbiome, a major problem with such associations is that the taxonomic signal is extremely variable, leading to inconsistency in the observed shifts across different studies (doi:https://doi.org/10.3390/pathogens8030126). Indeed, one of the most comprehensive prior studies into this topic demonstrated that inter-individual variation is the largest contributor to all multi-omic measurements aiming to differentiate between the gut microbiome of individuals with IBD from that of healthy individuals, including taxonomy (doi:10.1038/s41586-019-1237-9). We therefore took a different approach to study this question that is independent of taxonomy, by focusing on metabolic potential estimated directly from metagenomes to elucidate an ecological explanation behind the reduced diversity of the IBD gut microbiome, which studies of taxonomic composition alone are not able to provide. Furthermore, the variability inherent to taxonomic profiles of the gut microbiome makes it unlikely that taxonomic shifts could confound our analysis, especially given our large sample set encompassing a variety of individuals with different origins, ages, and genders.

      We agree with the reviewer that our level of prior knowledge varies substantially across taxa. Regardless, the only prior knowledge with any bearing on our ability to estimate metabolic capacity in a taxonomy-independent manner is the extent of sequence diversity captured by our annotation models for the enzymes used in metabolic pathways. During our analysis, we had observed that metagenomes in the healthy group had fewer gene annotations than those in the IBD group and we therefore shared the reviewer’s concern about potential annotation bias, whereby less-studied genomes are not always incorporated into the Hidden Markov Models for annotating KEGG Orthologs, perhaps making it more likely for us to miss annotations in these genomes (and leading to lower completeness scores for metabolic pathways in the healthy samples). Our annotation method partially addresses this limitation by taking a second look at any unannotated genes and mindfully relaxing the bit score similarity thresholds to capture annotations for any genes that are slightly too different from reference sequences for annotation with default thresholds. As mentioned previously, our recent preprint demonstrates the efficacy of this strategy (doi:10.1101/2024.07.03.601779). To further address this concern, we also investigated the extent of distant homology in these metagenomes using AGNOSTOS (doi:https://doi.org/10.7554/eLife.67667), which showed a higher proportion of unknown genes in the healthy metagenomes and suggested that a substantial portion of the unannotated genes are not distant homologs of known enzymes that we failed to annotate due to lack of prior knowledge about them, but rather are completely novel functions. To describe these results, we added the following paragraph and two accompanying figures (Supplementary Figure 4g-h) to the section “Differential annotation efficiency between IBD and Healthy samples” in Supplementary File 1:

      “To understand the potential origins of the reduced annotation rate in healthy metagenomes, we ran AGNOSTOS (Vanni et al. 2022) to classify known and unknown genes within the healthy and IBD sample groups. AGNOSTOS clusters genes to contextualize them within an extensive reference dataset and then categorizes each gene as ‘known’ (has homology to genes annotated with Pfam domains of known function), ‘genomic unknown’ (has homology to genes in genomic reference databases that do not have known functional domains), or ‘environmental unknown’ (has homology to genes from metagenomes or MAGs that do not have known functional domains). The resulting classifications confirm that healthy metagenomes contain fewer ‘known’ genes than metagenomes in the IBD sample group – the proportion of ‘known’ genes classified by AGNOSTOS is about 3.0% less in the healthy metagenomes than in the IBD sample group, which is similar to the ~3.5% decrease in the proportion of ‘unannotated’ genes observed by simply counting the number of genes with at least one functional annotation (Supplementary Figure 4g-h, Supplementary Table 1e). Furthermore, the majority of the unannotated genes in either sample group were categorized by AGNOSTOS as ‘genomic unknown’ (Supplementary Figure 4g), suggesting that the unannotated sequences are genes without biochemically-characterized functions currently associated with them and are thus legitimately lacking a functional annotation in our analysis, rather than representing distant homologs of known protein families that we failed to annotate. Based upon the classifications, a systematic technical bias is unlikely driving the annotation discrepancy between the sample groups.”

      Furthermore, we have already discussed this limitation and its implications in our manuscript (see section “Key biosynthetic pathways are enriched in microbial populations from IBD samples”). To further clarify that our approach is independent of taxonomy, we have now also amended the following statement in our introduction:

      “Here we implemented a high-throughput, taxonomy-independent strategy to estimate metabolic capabilities of microbial communities directly from metagenomes and investigate whether the enrichment of populations with high metabolic independence predicts IBD in the human gut.”

      Finally, the reviewer is also correct that genome size is a part of the equation, as genome size and level of metabolic capacity are inextricable. In fact, we observed this in our analysis, as already stated in our paper:

      “HMI genomes were on average substantially larger (3.8 Mbp) than non-HMI genomes (2.9 Mbp) and encoded more genes (3,634 vs. 2,683 genes, respectively)”

      Since larger genomes have the space to encode more functional capacity, it follows that having higher metabolic independence would require a microbe to have a larger genome. The validation of our method on simulated metagenomic data supported this idea by demonstrating that the IBD-enriched metabolic pathways are commonly identified in large genomes. The validation also proved that genome size does not influence the accuracy of our approach (Supplementary File 2).

      It can be difficult to distinguish genes for biosynthesis and catabolism just from the KEGG module names and the new normalization tool proposed herein markedly affects the results relative to more traditional analyses.

      We agree with the reviewer that KEGG module names do not clearly indicate the presence of biosynthetic genes of interest. That said, KEGG is a commonly-used and extensively-curated resource, and many biologists (including ourselves) trust their categorization of genes into pathways. We hope that readers who are interested in specific genes within our results would make use of our publicly-available datasets (which include gene annotations) to conduct a targeted analysis based on their expertise and research question.

      However, we would like to respectfully note that the ability to distinguish the genes within each KEGG module may not be very useful to most readers, and is unlikely to have a meaningful impact in our findings. As the reviewer most likely appreciates, the presence of individual genes in isolation can be insufficient to indicate biosynthetic capacity, considering that 1) most biosynthetic pathways involve several biochemical conversions requiring a series of enzymes, 2) enzymes are often multi-functional rather than exclusive to one pathway, and 3) different organisms in a community may utilize enzymes encoded by different genes to perform the same or similar biochemical reaction in a pathway. We therefore made the choice to analyze metabolic capacity at the pathway level, because this would better reflect the biosynthetic abilities encoded by the multiple microbial populations within each metagenome.

      The reviewer also suggests that our novel normalization method affects our results, yet we believe that this normalization strategy is one of the strengths of our study in comparison to ‘more traditional analyses’ as it enables an appropriate comparison between metagenomes describing microbial communities of dramatically different degrees of richness. Indeed, we suspect that the lack of normalization in more traditional analyses may be one reason why prior analyses have so far failed to uncover any mechanistic explanation for the loss of diversity in the IBD gut microbiome. We hope that our validation efforts were sufficiently convincing in demonstrating the suitability of our approach, and copy here a particularly illuminating section of the validation results that we have added to Supplementary Information File 2:

      “As expected, we observed a significant positive correlation between metagenomic copy number (the numerator of PPCN) and community size in each group, likely driven by the increase in the copy number of core metabolic pathways in larger communities (Supplementary Figure 18). Interestingly, this correlation was much stronger for the subset of IBD-enriched pathways (0.49 <= R <= 0.67) than for all modules (0.12 <= R <=0.13).

      “However, the correlation was much weaker and often nonsignificant for the normalized PPCN data in both groups of modules (all modules: 0.01 < R < 0.04, enriched modules: 0.04 < R < 0.09, Supplementary Table 6b, Supplementary Figure 19), which demonstrates the suitability of our normalization method to remove the effect of community size in comparisons of metagenome-level metabolic capacity.”

      As such, it seems safer to view the current analysis as hypothesis-generating, requiring additional data to assess the degree to which metabolic dependencies are linked to IBD.

      We certainly agree with the reviewer that our study, similar to the vast majority of studies published every year, is a hypothesis-generating work. Any idea proposed in any scientific study in life sciences will certainly benefit from additional data analyses, and therefore we respectfully do not accept this as a valid criticism of our work. The inception of this study is linked to an earlier work that hypothesized high metabolic independence as a determinant of microbial fitness in stressed gut communities (doi:10.1186/s13059-023-02924-x), which lacked validation on larger sets of data. Our study tests this original hypothesis using a large number of metagenomes, and lends further support for it with approaches that are now better validated. Furthermore, there are other studies that agree with our interpretation of the data (doi:10.1101/2023.02.17.528570, doi:10.1038/s41540-021-00178-6), and we look forward to more computational and/or experimental work in the future to generate more evidence to evaluate these insights further.

      Response to Recommendations for the Authors

      Reviewer 1:

      My main comments include:

      - From the results reported in lines 178-185, it seems that metabolic pathways in general were enriched in IBD microbiomes, not specifically biosynthetic pathways. Can we really say then that the signal is specific for biosynthesis capabilities?

      We apologize for the confusion here. When we read the text again, we ourselves were confused with our phrasing.

      The reviewer is correct that a similar proportion of both biosynthetic and non-biosynthetic pathways had elevated per-population copy number (PPCN) values in the IBD samples. However, the low microbial diversity associated with IBD and the on average larger genome size of individual populations contributes to this relative enrichment of the majority of metabolic modules. To remove this bias and identify specific modules whose enrichment was highly conserved across microbial populations associated with IBD, we implemented two criteria: 1) we selected modules that passed a high statistical significance threshold in our enrichment test (Wilcoxon Rank Sum Test, FDR-adjusted p-value < 2e-10), and 2) we accounted for effect size by ranking these modules according to the difference between their median PPCN in IBD samples and their median PPCN in healthy samples, and keeping only those in the top 50% (which translated to an effect size threshold of > 0.12).

      This analysis revealed a set of metabolic modules that were consistently and highly significantly enriched in microbial communities associated with IBD. The majority of these metabolic modules encode biosynthesis pathways. Our use of the terms “elevated”, “enriched”, and “significantly enriched” in the previous version of the text was confusing to the reader. We thank the reviewer for pointing this out, and we hope that our revision of the text clarifies the analysis strategy and observations:

      “To gain insight into potential metabolic determinants of microbial survival in the IBD gut environment, we assessed the distribution of metabolic modules within samples from each group (IBD and healthy) with and without using PPCN normalization. Without normalizing, module copy numbers were overall higher in healthy samples (Figure 2a) and modules exhibited weak differential occurrence between cohorts (Figure 2b, 2c, Supplementary Figure 3). The application of PPCN reversed this trend, and most metabolic modules were elevated in IBD (Supplementary Figure 5). This observation is influenced by two independent aspects of the healthy and IBD microbiota. The first one is the increased representation of microbial organisms with smaller genomes in healthy individuals (Watson et al. 2023), which increases the likelihood that the overall copy number of a given metabolic module is below the actual number of populations. In contrast, one of the hallmarks of the IBD microbiota is the generally increased representation of organisms with larger genomes (Watson et al. 2023). The second aspect is that the generally higher diversity of microbes in healthy individuals increases the denominator of the PPCN. This results in a greater reduction in the PPCN of metabolic modules that are not shared across all members of the diverse gut microbial populations in health.

      To go beyond this general trend and identify modules that were highly conserved in the IBD group, we first selected those that passed a relatively high statistical significance threshold in our enrichment test (Wilcoxon Rank Sum Test, FDR-adjusted p-value < 2e-10). We then accounted for effect size by ranking these modules according to the difference between their median PPCN in IBD samples and their median PPCN in healthy samples, and keeping only those in the top 50% (which translated to an effect size threshold of > 0.12). This stringent filtering revealed a set of 33 metabolic modules that were significantly enriched in metagenomes obtained from individuals diagnosed with IBD (Figure 2d, 2e), 17 of which matched the modules that were associated with high metabolic independence previously (Watson et al. 2023) (Figure 2f). This result suggests that the PPCN normalization is an important step in comparative analyses of metabolisms between samples with different levels of microbial diversity.”

      Lines 178-185 from our original submission have been removed to avoid further confusion. These results can be found in Supplementary File 1 (section “Module enrichment without consideration of effect size leads to nonspecific results”).

      It is not entirely clear to me what is meant by PPCN normalization. Normalize the number of copy numbers to the overall number of genes?

      The idea behind using per-population copy number (PPCN) is to normalize the prevalence of each metabolic module found in an environment with the number of microbial populations within the same sample. PPCN achieves this by dividing the pathway copy numbers by the number of microbial populations in a given metagenome, which we estimate from the frequency of bacterial single-copy core genes. We have updated the description of the per-population copy number (PPCN) calculation to clarify its use:

      “Briefly, the PPCN estimates the proportion of microbes in a community with a particular metabolic capacity (Figure 1, Supplementary Figure 2) by normalizing observed metabolic module copy numbers with the ‘number of microbial populations in a given metagenome’, which we estimate using the single-copy core genes (SCGs) without relying on the reconstruction of individual genomes.”

      We also note that the equation for PPCN is shown in Figure 1.

      It is also not clear to me how the classifier predicts stress on microbiomes rather than dysbiosis.

      The reviewer asks an interesting question since it is true that we could also use the term “dysbiosis” rather than “stress”. Yet we refrained from the use of dysbiosis as it is considered a poorly-defined term to describe an altered microbiome often associated with a specific disease (doi:https://doi.org/10.3390/microorganisms10030578), such as IBD, relative to another poorly-defined state, “healthy microbiome” (doi:https://doi.org/10.1002/phar.2731). We do consider that stress is not necessarily a term that is less vague than dysbiosis, yet it has the advantage of being more common in studies of ecology compared to dysbiosis. Our relatively neutral stance towards which term to use has shifted dramatically due to one critical observation in our study: the identical patterns of enrichment of HMI microbes in individuals diagnosed with IBD as well as in healthy individuals treated with antibiotics. We appreciate that the observed changes in the antibiotics case can also fulfill the definition of “dysbiosis”, but the term “stress response” more accurately describes what the classifier identifies in our opinion.

      What is the advantage of using the estimate-metabolism pipeline presented in this article over workflows such as those using genome-scale models, which are repeatedly cited and discussed?

      Genome-scale models are often appropriate for a big-picture view of metabolism, and especially when the capability to perform quantitative simulations like flux-balance analysis is needed. For our investigation, we wanted a more specific and descriptive summary of metabolic capacity, so we focused on individual KEGG modules, which qualitatively describe subsets of the vast metabolic network with pathway names that all readers can understand, rather than working with an abstract model of the entire network. Furthermore, genome-scale models would have prevented us from assessing the redundancy (copy number) of metabolic pathways, as these networks usually focus on the presence-absence of gene annotations for enzymes in the network rather than the copy number of these annotations. The copy number metric has been critical for our analyses, considering that we are focusing on metabolic capacity at the community level and require the ability to normalize this metabolic capacity by the size of the community described by each metagenome. Finally, assessing a discrete set of metabolic pathways yielded a corresponding set of features that we used to create the machine learning classifier, whereas data from genome-scale models would not be as easily transferable into classifier features.

      Minor comments:

      Figure 2d and e are mentioned in the text before Figure 2a.

      We thank the reviewer for catching this. We have rewritten the section as follows to put the figure references in numerical order:

      !To gain insight into potential metabolic determinants of microbial survival in the IBD gut environment, we assessed the distribution of metabolic modules within samples from each group (IBD and healthy) with and without using PPCN normalization. Without normalizing, module copy numbers were overall higher in healthy samples (Figure 2a) and modules exhibited weak differential occurrence between cohorts (Figure 2b, 2c, Supplementary Figure 3). After the application of PPCN, most metabolic modules were elevated in IBD (Supplementary Figure 5). This observation is a product of two independent aspects of the healthy and IBD microbiota. The first one is the increased representation of microbial organisms with smaller genomes in healthy individuals (Watson et al. 2023), which increases the likelihood that the overall copy number of a given metabolic module is below the actual number of populations. In contrast, one of the hallmarks of the IBD microbiota is the generally increased representation of organisms with larger genomes (Watson et al. 2023). The second aspect is that the generally higher diversity of microbes in healthy individuals increases the denominator of the PPCN due to the higher number of populations detected in these samples. This results in a greater reduction in the PPCN of metabolic modules that are not shared across all members of the diverse gut microbial populations in health. To go beyond this general trend and identify modules that were highly conserved in the IBD group, we first selected those that passed a relatively high statistical significance threshold in our enrichment test (Wilcoxon Rank Sum Test, FDR-adjusted p-value <2e-10). We then accounted for effect size by ranking these modules according to the difference between their median PPCN in IBD samples and their median PPCN in healthy samples, and keeping only those in the top 50% (which translated to an effect size threshold of > 0.12). This stringent filtering revealed a set of 33 metabolic modules that were significantly enriched in metagenomes obtained from individuals diagnosed with IBD (Figure 2d, 2e), 17 of which matched the modules that were associated with high metabolic independence previously (Watson et al. 2023) (Figure 2f). This result suggests that the PPCN normalization is an important step in comparative analyses of metabolisms between samples with different levels of microbial diversity.!

      How much preparation is needed for users that want to apply the estimate-metabolism pipeline to their own datasets? From the documentation at anvi'o, it still seems like a significant effort.

      We thank the reviewer for this important question. The use of anvi-estimate-metabolism is simple, but the concept it makes available and the means it offers its users to interact with their data are not basic, thus its use requires some effort. Anvi’o provides users with the ability to directly interact with their data at each step of the analysis to have full control over the analysis and to make informed decisions on the way. In comparison to pre-defined analysis pipelines that often require no additional input from the user, this approach requires some level of involvement of the user throughout the process – namely, they must run a few programs in series rather than running just one pipeline command that quietly handles everything on their behalf. The most basic workflow for using `anvi-estimate-metabolism` is quite straightforward and requires four simple steps following the installation of anvi’o: 1. Run the program `anvi-setup-kegg-data` to download the KEGG data. 2. Convert the assembly FASTA file into an anvi’o-compatible database format with gene calls by running `anvi-gen-contigs-database`. 3. Annotate genes with KOs with the program `anvi-run-kegg-kofams`. 4. Get module completeness scores and copy numbers by running `anvi-estimate-metabolism`. In addition, we provide simple tutorials (such as the one at https://anvio.org/tutorials/fmt-mag-metabolism/) and reproducible bioinformatics workflows online (including for this study at https://merenlab.org/data/ibd-gut-metabolism/) which helps early career researchers to apply similar strategies to their own datasets. We are happy to report that we have been using this tool in our undergraduate education, and observed that students with no background in computation were able to apply it to their questions without any trouble.

      Reviewer 2:

      Congratulations on this great work, the manuscript is a pleasure to read. Minor questions that the authors might want to clarify:

      L 275: Why use reference genomes from the GTDB (for only 3 phyla) instead of using MAGs reconstructed from the data? I understand that assemblies based on individual samples would probably not yield enough complete MAGs, but I would expect that co-binning the assemblies for the entire dataset would.

      We thank the reviewer for their kind words. We certainly agree that metagenome assembled genomes (MAGs) reconstructed directly from the assemblies would by nature represent the populations in these communities better than reference genomes. However, one of our aims in this study was to avoid the often error-prone and time-consuming step of reconstructing MAGs. Most automatic binning algorithms inevitably make mistakes, and especially for metabolism estimation, low quality MAGs can introduce a bias in the analysis. At the same time the manual curation of each bin to remove any contamination would require a substantial effort and make the workflow less accessible for others to use. As an example, in our previous work (doi:10.1186/s13059-023-02924-x), careful refinement of MAGs from just two co-assemblies took two months. Here, we developed the PPCN workflow as a more scalable, assembly-level analysis to avoid the need for binning in the first place.

      To supplement and confirm the metagenome-level results, we decided to run a genome-level analysis. We used the GTDB since it represents the most comprehensive, dereplicated collection of reference genomes across the tree of life. We chose those 3 phyla in particular because of their ecological relevance in the human gut environment. Bacteroidetes and

      Firmicutes together represent the majority (up to ~90%) of the populations in healthy individuals (doi:10.1038/nature07540), and Proteobacteria represent the next most abundant phylum on average (2% ± 10%) (doi:10.1371/journal.pone.0206484).

      L 403: Should the Franzosa and Papa papers be referenced as numbers?

      Thanks for pointing this out. The rogue numerical citation was actually an artifact of the submission and was corrected to a long-format citation in the online version of the manuscript on the eLife website.

      Reviewer 3:

      The lack of any experimental validation contributes to the tentative nature of the conclusions that can be drawn at this time. Numerous studies have looked at the metabolism of gut bacterial species during in vitro growth, which could be mined to test if the in silico predictions of metabolism can be supported. Alternatively, the authors could isolate key strains of interest and study them in culture or in mouse models of IBD.

      We appreciate these suggestions and agree with the reviewer that experimental validation is important. However, we do not agree that either the use of mouse models or the isolation of individual microbial strains would be an appropriate experimental test in this case. The use of humanized gnotobiotic mice has critical limitations (see doi:10.1016/j.cell.2019.12.025 and references within the section on “human microbiota-associated murine models”). As it is not possible to establish a mouse model whose gut microbiota fully reflect the human gut microbiome, such an approach would neither be appropriate to validate our findings, nor would it have been possible to produce the insights we have gained based on environmental data. We are not sure how exactly a mouse model, even when ignoring the well established limitations, could improve or validate a comprehensive analysis of a large “environmental” datasets that resulted in highly significant signals.

      We are also not sure that we understand how the reviewer believes that the isolation of individual strains would aid in validating our findings. While we appreciate that not all relevant genes are captured by the available annotation routines and that some genes may be misannotated, the large dataset used here renders these concerns negligible. Isolating a small subset of bacterial populations would hardly lead to a representative sample and testing their metabolic capacities in vitro would not improve the reliability of our analysis.

      Boilerplate suggestions as vague as “isolate key strains of interest” or “experiment in mouse models of IBD” do not add or retract anything from our findings. Our findings and hypotheses are well supported by our data and extensive analyses.

      Line 9 - not sure this approach is hypothesis testing in the traditional sense, you might reword.

      Hypothesis testing occurs when one makes an observation, develops an hypothesis that explains the observation, and then gathers and analyzes data to investigate whether additional data support or disprove the hypothesis. We are not convinced a reword is necessary.

      Line 40 - the lack of consistent differences in IBD and healthy individuals does not mean that the microbiome doesn't impact disease. It's important to consider all the mechanistic studies in animal models and other systems.

      Our study does not claim that microbiome has no impact on the course of disease.

      Line 50 - this seemed out of place and undercuts the current findings. Upon checking Ref. 31, the analysis seems distinct enough to not mention in the introduction.

      We disagree. Ref 31 uses genome-scale metabolic models to identify the loss of cross-feeding interactions in the gut microbiome of individuals with IBD, which is another way of saying that the microbes in IBD no longer rely on their community for metabolic exchange – in other words, they are metabolically independent. This is an independent observation that is parallel to our results and confirms our analysis; hence, it is important to keep in our introduction.

      Line 55 - Ref. 32 looked at FMT, which should be explicitly stated here.

      The reviewer’s suggestion is not helpful. Ref 32 has a significant focus on IBD as it compares a total of 300 MAGs generated from individuals with IBD to 264 MAGs from healthy individuals and shows differences in metabolic enrichment between healthy and IBD samples independent of taxonomy, thus setting the stage for our current work. What model has been used to generate the initial insights that led to the IBD-related conclusion in Ref 32 has no significance in this context.

      Lines 92-107 - this text is out of place in the Results section and reads more like a review article. Please trim it down and move it to the introduction.

      We would like to draw the reviewer’s attention to the fact that this is a “Result and Discussion” section. In this specific case it is important for readers to appreciate the context for our new tool, as the reviewer commented in the public review. We kindly disagree with the reviewer’s suggestion to remove this text as that would diminish the context.

      Line 107 - is "selection" the word you meant to use?

      If the frequency of a given metabolic module remains the same or increases despite the decreasing diversity of the microbial community, it is conceivable to assume that its enrichment indicates the presence of a selective process to which the module responds. It is indeed the word we meant to use.

      Line 110 - this is the first mention of this new method, need to add it to the abstract and introduction.

      The reviewer must have overlooked the text passages in which we mention the strategy we developed within the abstract:

      “Here, we tested this hypothesis on a large scale, by developing a software framework to quantify the enrichment of microbial metabolisms in complex metagenomes as a function of microbial diversity.”

      And in the last paragraph of the introduction:

      “Here we implemented a high-throughput, taxonomy-independent strategy to estimate metabolic capabilities of microbial communities directly from metagenomes…”

      Figure 1 - a nice summary, but no data is shown to support the validity of this model. Consider shrinking the cartoon and adding validation with simulated datasets.

      We hope we have addressed this recommendation with the extensive validation efforts summarized above.

      Line 134 - need to state the FDR and effect size cutoffs used.

      We have reworded this sentence as follows to clarify which thresholds were used:

      “We identified significantly enriched modules using an FDR-adjusted p-value threshold of p < 2e-10 and an effect size threshold of > 0.12 from a Wilcoxon Rank Sum Test comparing IBD and healthy samples.”

      I'm also concerned about the simple comparison of IBD to healthy without adjusting for confounders like study, geographical location, age, sex, drug use, diet, etc. More text is needed to explain the nature of these data, how much metadata is available, and which other variables distinguish IBD from healthy.

      The reviewer is correct that there is a large amount of interindividual variation between samples due to host and environmental factors. However, the lack of adjusting for confounders was intentional, and in fact one of the critical strengths of our study. We observe a clear signal between healthy individuals and individuals diagnosed with IBD, despite the amount of interindividual variation in our diverse set of samples from 13 different studies (details of which are summarized in Supplementary Table 1). The clear increase in predicted metabolic capacity that we consistently observe in IBD patients using both metagenomes and genomes across diverse cohorts points to metabolic independence as a high-level trend that is predictive of microbial prevalence in stressed gut environments irrespective of host factors.

      Line 145 - calling PPCN normalization an "essential step" is a huge claim and requires a lot more data to back it up. Might be best to qualify this statement.

      We hope we have addressed this recommendation with our validation efforts. Supplementary Figures 18 and 19 in particular show evidence for the necessity of the normalization step. It is indeed an essential step if the purpose is to compare metabolic enrichment between cohorts of highly different microbial diversity.

      Figure 2a - the use of a 1:1 trend line seems potentially misleading. I would replace it with a best-fit line.

      Our purpose here was not to show the best fit. Instead, the 1:1 trend line separates the modules based on their relative abundance distribution between healthy individuals and individuals diagnosed with IBD. If the module is to the left of the line, it has a higher median copy number in healthy individuals and if the module is to the right, it has a higher median copy number in individuals with IBD. The line also helps to demonstrate the shift that occurs between the unnormalized data in Figure 2a. Without the normalization, more modules occur to the left of the

      1/1 line as a result of the higher raw copy numbers in healthy metagenomes which simply contain more microbial populations. With the normalization (Figure 2d), more modules fall on the right side of the 1/1 line due to higher PPCN values. A best-fit line would not serve well for these purposes.

      The text should be revised to state that this analysis actually did find many significant differences and to discuss whether they were the same modules identified in Figure 2d.

      We apologize for the confusion and thank the reviewer for bringing this issue to our attention. As mentioned above, the disparate levels of microbial diversity between healthy individuals and individuals with IBD resulted in much larger copy numbers of metabolic modules in healthy samples reflecting the often much larger communities. Hence, we ran statistical tests only on normalized (PPCN) data. The p-values associated with each module in Figure 2a, as well as the colors of each point, are based on the PPCN data in Figure 2d. We aimed to improve the clarity of the visual comparison between normalized and unnormalized results by identifying the same set of IBD-enriched modules in plots a-c and plots d-f.

      That being said, the reviewer’s comment made us realize the potential for confusion when using the normalized data’s statistical results in Figure 2a that otherwise shows results from unnormalized data. We have now run the same statistical test on the unnormalized (raw copy number) data and re-generated Figure 2a with the new FDR-adjusted p-values and points colored based on the statistical tests using unnormalized data. We’ve also removed the arrow connecting to Figure 2b (since we no longer show the same set of IBD-enriched modules in Figures 2a and 2b), and added a dashed line to indicate the effect size threshold (similar to the one in Figure 2d). We have updated the legend for Figure 2a-d to reflect these changes:

      When we used the same p-value threshold (p < 2e-10) as before and also filtered for an effect size larger than the mean (the same strategy used to set our effect size threshold for the normalized data), there are 10 modules that are significantly enriched based on the unnormalized data. Of course, it is difficult to gauge the relevance of these 10 modules to microbial fitness in the IBD gut environment since their raw copy numbers do not tell us anything about the relative proportion of community members that harbor these modules. Therefore, we are reluctant to add these modules to the results text. For the record, only 3 of those modules were also significantly enriched based on the normalized PPCN values: M00010 (Citrate cycle, first carbon oxidation), M00053 (Pyrimidine deoxyribonucleotide biosynthesis), and M00121 (Heme biosynthesis).

      Figure 2c,f - these panels raise a lot of concerns given that the choice of method inverts the trend. Without additional data/validation, it's hard to know which method is right.

      We hope we have addressed this recommendation with the extensive validation efforts summarized above. Inversion of the trend is an expected outcome, because the raw copy numbers of most metabolic modules are much lower in the IBD sample group due to lower community sizes.

      Line 167 - Need to take the KEGG names with a grain of salt, just because it says "biosynthesis" doesn't mean that the pathway goes in that direction in your bacterium of interest.

      We believe the reviewer is under a misapprehension regarding the general reversibility of KEGG metabolic modules, or indeed of metabolic pathways. Most metabolic pathways have one or several (practically) irreversible reactions. To demonstrate this for the 33 IBD-enriched modules, we evaluated their reversibility based upon their corresponding KEGG Pathway Maps, which indicate reaction reversibility via double-sided arrows. Aside from the signature modules M00705 and M00627, in 26 out of 31 pathway modules one or more irreversible reactions render these pathways one-directional. Indeed, on average the majority (54%) of the reactions in a given module are irreversible. When focusing on the 23 “biosynthesis” modules, 22 out of 23 (96%) modules have at least one irreversible reaction, and on average 64% of a given module’s reactions are irreversible. These data (which can be accessed at doi:10.6084/m9.figshare.27203226 for the reviewer’s convenience) challenge the reviewer’s notion that pathway directionality is free to change arbitrarily, since the presence of even one irreversible reaction effectively blocks the flux in the opposing direction. Thus, “biosynthesis” is indeed a meaningful term in KEGG module names.

      That said, KEGG Pathway Maps, though highly curated, are likely not the final word on whether a given reaction in a metabolic pathway can be considered reversible or irreversible in each microbial population and under all conditions. And our analysis, like many others that rely on metagenomic data, does not consider the environmental conditions in the gut such as temperature or metabolite concentrations that might influence the Gibbs free energy and thus the directionality of these reactions in vivo. However, even assuming general reversibility of metabolic pathways, this would not invalidate the fact that these microbes have the metabolic capacity to synthesize the respective molecules. In other words, the potential reversibility of pathways is irrelevant to our analysis since we are describing metabolic potential. The lac operon in E. coli might only be expressed in the absence of glucose, but E. coli always has the capability to degrade lactose regardless of whether that pathway is active. Thus, our overall conclusion that gut microbes associated with IBD are metabolically self-sufficient (encoding the enzymatic capability to synthesize certain key metabolites) remains valid irrespective of fixed or flexible pathway directionality.

      It's also important to be careful not to conflate KEGG modules (small subsets of a pathway) with the actual metabolic pathway. It's possible to have a module change in abundance while not altering the full pathway. Inspection of the individual genes could help in this respect - are they rate-limiting steps for biosynthesis or catabolism?

      The reviewer is absolutely correct that KEGG modules do not necessarily represent full pathways. We have updated the language in our manuscript to explicitly refer to “modules” rather than “pathways” whenever appropriate, to restrict the scope of the analysis to metabolic modules rather than full pathways.

      That said, we do not see how “inspection of individual genes” would improve our analysis. The strength of looking at complete modules rather than individual genes is that we can gain conclusive insights into a certain metabolic capacity. Of course, no pathway or module stands alone. However, the enrichment of metabolic modules does conclusively indicate that these modules are beneficial under the given conditions, such as stress caused by inflammation or antibiotic use. Whether a certain step in a module or pathway is rate limiting is completely irrelevant for this analysis.

      Line 177 - I'm not a big fan of the HMI acronym. Is there a LMI group? It seems simplistic to lump all of metabolism into dependent or independent, which in reality will differ depending on the specific substrate, the growth condition, and the strain.

      While we are sorry that our study failed to provide the reviewer with a term they could be a fan of, their input did not change our view that HMI, an acronym we have adapted from a previously peer-reviewed study (doi:10.1186/s13059-023-02924-x), is a powerfully simplistic means to describe a phenomenon we observe and demonstrate in multiple different ways with our extensive analyses. The argument that HMI or LMI status will differ given the growth condition, substrate availability, or strain differences is not helping this case either: our analyses cut across a large number of humans and naturally occurring microbial systems in their guts that are exposed to largely variable ‘growth conditions’ and ‘substrates’ and composed of many strain variants of similar populations. Yet, we observe a clear role for HMI despite all these differences. Perhaps it is because HMI simply describes a higher metabolic capacity based on a defined subset of largely biosynthetic pathways that we observe to be consistently enriched in a large dataset covering a large variety of host, environmental and diet factors and indicates that a population has a higher metabolic capacity to not rely on ecosystem services. We show in our analysis that in the inflamed gut these capacities are indeed required, which is why HMI populations are enriched in IBD samples. HMI has no relation to any of the constraints mentioned by the reviewer, which is one of the major strengths of this metric.

      Line 198 - It seems like a big assumption to state that efflux and drug resistance are unrelated to biosynthesis, as they could be genetically or even phenotypically linked.

      We agree with the reviewer and are thankful for their input. We have weakened the assertion in this statement.

      “These capacities may provide an advantage since antibiotics are a common treatment for IBDs (Nitzan et al. 2016), but are not necessarily related to the systematic enrichment of biosynthesis modules that likely provide resilience to general environmental stress rather than to a specific stressor such as antibiotics.”

      Lines 202-218 - I'd suggest removing this paragraph. The "non-IBD" data introduces even more complications to the meta-analysis and seems irrelevant to the current study.

      We thank the reviewer for this suggestion. Non-IBD data is important, but its relevance to the primary aims of the study is indeed negligible. We now have moved this paragraph to Supplementary File 1 (under the section “‘Non-IBD’ samples are intermediate to IBD and healthy samples”).

      The health gradient is particularly problematic, putting cancer closer to healthy than IBD.

      We took the reviewer’s advice and have swapped the order of the studies in Supplementary Figure 6 to place the cancer samples from Feng et al. closer to the IBD samples, on the other side of the non-IBD samples from the IBD studies.

      Lines 235-257 - should trim this down and move to the discussion.

      As mentioned above, we have opted for a “Results and Discussion format” for our manuscript, so we believe this discussion is in the correct place. We find it important to clearly highlight the limitations and potential biases of our work and trimming this text would take away from that goal.

      Figure 3 - panels are out of order. Need to put the current panel D below current panel C. Also, relabel panel letters to go top to bottom (the bottom panel should be D). Could change current panel 3D to a violin plot to match current 3C.

      We have updated Figure 3 by converting panel A into a new supplementary figure (Supplementary Figure 8), moving panels C and D below panel B, and relabeling the panels accordingly.

      Figure 3B - this panel was incredibly useful and quite surprising to me in many respects. I would have assumed that the Bacteroides would be in the "HMI" bin. Is this a function of the specific strains included here? Was B. theta or B. fragilis included?

      The reviewer makes an excellent observation that has been keeping us awake at night, yet somehow was not appropriately discussed in the text until their input. We are very thankful for their attention to detail here.

      It is indeed true that Bacteroides genomes are often detected with increased abundance in individuals with IBD and likely have a survival advantage in the IBD gut environment, Bacteroides fragilis and Bacteroides thetaiotaomicron being some of the most dominant residents of the IBD gut. Their non-HMI status is not a function of which strains were included, since all taxa here are represented by the representative genomes available in the publicly available Genome Taxonomy Database. Their non-HMI status comes from the fact that they have HMI scores of around 24 to 26, which fall slightly below the threshold score of 26.4 that we used to classify genomes as HMI. This threshold is back-calculated from the metabolic completion requirement of at least 80% average completion of all 33 metabolic modules that are significantly enriched in IBD. So these genomes are right there at the edge, but not quite over it.

      Thanks to this comment by our reviewer, we started wondering whether we should follow a more ‘literature-driven’ approach to set the threshold for HMI, rather than the 80% cutoff, and in fact attempted to lower the HMI score threshold to see if we could include more of the IBD-associated Bacteroides in the HMI bin. Author response table 1 below shows the relevant subset of our new Supplementary Table 3h, which describes the data from our tests on different thresholds.

      Author response table 1.

      Number and proportion of Bacteroides genomes classified as HMI at each HMI score threshold. There were 20 total Bacteroides genomes in the set of 338 gut microbes identified from the GTDB. The HMI score is computed by adding the percent completeness of all 33 IBD-enriched KEGG modules. The full table can be viewed in Supplementary Table 3h.

      Lowering the threshold to 24.75, which corresponds to an average of 75% completeness in the 33 IBD-enriched modules, enabled the classification of 6 Bacteroides genomes as HMI, including B. fragilis, B. intestinalis, B. theta, and B. faecis. However, it also identified several microbes that are not IBD-associated as HMI, including 75 genomes from the Lachnospiraceae family and 18 genomes from the Ruminococcaceae family. In the latter family, several Faecalibacterium genomes, including 10 representatives of Faecalibacterium prausnitzii, were considered HMI using this threshold. These microbes are empirically known to decrease in abundance during inflammatory gastrointestinal conditions (doi:10.3390/microorganisms8040573, doi:10.1093/femsre/fuad039), and therefore these genomes should not be considered HMI – at least not under the working definition of HMI used in our study. To avoid including such a large number of obvious false positives in the HMI bin, we decided to maintain a higher threshold despite the exclusion of Bacteroides genomes.

      This outcome demonstrates that our reductionist approach does not successfully capture every microbial population that is associated with IBD. Nevertheless, and in our opinion very surprisingly, the metric does capture a very large proportion of genomes with increased detection and abundance in IBD samples, as demonstrated by the peaks of detection/abundance that match to HMI status Author response image 1.

      Author response image 1.

      Screenshots of Figure 3 that demonstrate the overlapping signal between HMI status and genome detection/abundance in IBD.

      Furthermore, the violin plots in Figure 3B (formerly Figure 3C) clearly reflect the increased representation of HMI populations in IBD metagenomes. Although our classification method is imperfect, it still demonstrates the predictive power of metabolic competencies in identifying which microbes will survive in stressful gut environments. To ensure that readers recognize the crude nature of this classification strategy and the possibility that high metabolic independence can be achieved in different ways, we have added the following sentences to the relevant section of our manuscript:

      “Given the number of ways a genome can pass or fail this threshold, this arbitrary cut-off has significant shortcomings, which was demonstrated by the fact that several species in the Bacteroides group were not classified as HMI despite their frequent dominance of the gut microbiome of individuals with IBD (Saitoh et al. 2002; Wexler 2007; Vineis et al. 2016) (Supplementary File 1). That said, the genomes that were classified as HMI by this approach were consistently higher in their detection and abundance in IBD samples (Figure 3a). It is likely that there are multiple ways to have high metabolic independence which are not fully captured by the 33 IBD-enriched metabolic modules identified in this study.”

      We have also included a discussion of these findings in Supplementary Information File 1 (see section “Examining the impact of different HMI score thresholds on genome-level results”).

      This panel also makes it clear that many of these modules are widespread in all genomes and thus unlikely to meaningfully differ in the microbiome. It would be interesting to use this type of analysis to identify a subset of KEGG modules with high variability between strains.

      The figure makes it ‘look like’ many of these modules are widespread in all genomes and thus unlikely to meaningfully differ in the microbiome, but our quantitative analyses clearly demonstrate that these modules indeed differ meaningfully between microbiomes of healthy individuals and those diagnosed with IBD. For instance, the classifier that we built relying exclusively upon these modules’ PPCN values was able to reliably distinguish between the healthy and IBD sample groups in our dataset. The fact that the differentiating signal does not rely on rare metabolic or signature modules is what makes the classifier powerful enough to differentiate between “healthy” and “stressed” microbiomes in 86% of cases. Modules that are by nature less common could not serve this purpose. That said, we do agree with the reviewer that it might be interesting to study variability of KEGG modules as a function of variability between strains. This does not fall into the scope of this work, but we hope to assist others with the technical aspects of such work.

      Considering the entirety of the exchange in this section, perhaps there is a broader discussion to be had around this topic. In retrospect, not being able to perfectly split microbes into two groups that completely recapitulate their enrichment in healthy or IBD samples by a crude metric and an arbitrary threshold is not surprising at all. What is surprising is that such a crude metric in fact works for the vast majority of microbes and predicts their increased presence in the IBD gut by only considering their genetic make up. In some respects, we believe that the inability of this cutoff to propose a perfect classifier is similar to the limited power of metabolic independence concept and the classes of HMI or LMI to capture and fully explain microbial fitness in health and disease. What is again surprising here is that these almost offensively simple classes do capture more than what one would expect. We can envision a few ways to implement a more sophisticated HMI/LMI classifier, and it is certainly an important task that is achievable. However, we are hopeful that this technical work can also be done better by others in our field, and that step forward, along with further scrutinizing the relevance of HMI/LMI classes to understand metabolic factors that contribute to the biodiversity of stressful environments, will have to remain as future work.

      We thank the reviewer again for their comment here and pushing us to think more carefully and address the oddity regarding the poor representation of Bacteroides as HMI by our cutoff.

      Given that a lot of the gaps are in the Firmicutes, this panel also makes me more concerned about annotation bias. How many of these gaps are real?

      Analyses relying on gene annotations all suffer equally from the potential for missannotation or missing annotations, which primarily result from limitations in our reference databases for functional data. For instance, the Hidden Markov models for microbial genes in the KEGG Ortholog database are generated from a curated set of gene sequences primarily originating from cultivable microorganisms and particularly from commonly-used model organisms; hence, they do not capture the full extent of sequence diversity observed in populations that are less well-represented in reference databases – a category which includes several Firmicutes, as the reviewer points out. For KEGG KOfams in particular, the precomputed bit score thresholds for distinguishing between ‘good’ and ‘bad’ matches to a given model are often too stringent to enable annotation of genes that are just slightly too divergent from the set of known sequences, thus resulting in missing annotations. Based on our experience with these sorts of issues, we implemented a heuristic that reduces the number of missing annotations for KOs and captures significantly more homologs than other state-of-the-art approaches, as described in doi:10.1101/2024.07.03.601779. We refer the reviewer to our response to the related public comment about annotation bias above, which includes additional details about our investigations of annotation bias in our data. In comparison to the current standard, the heuristic we implemented improves functional annotation results. However, neither our nor any other bioinformatic study that relies on functional gene annotation can exclude the potential for annotation bias.

      Figure 3B plotting issues - need to use the full names of the modules; for example, M00844 is "arginine biosynthesis, ornithine => arginine", which changes the interpretation. Need a key for the heatmap on the figure. The tree is difficult to see, needs a darker font.

      We have darkened the lines of the tree and dendrogram, and added a legend for the heatmap gradient (see new version of Figure 3 above). Unfortunately, we could not fit the full names of the modules into the figure due to space constraints. However, the full module name and other relevant information can be found in Supplementary Table 2a, and the matrix of pathway completeness scores in these genomes (e.g., the values plotted in the heatmap) can be found in Supplementary Table 3b. We are not sure what the reviewer refers to when stating that “for example, M00844 is "arginine biosynthesis, ornithine => arginine", which changes the interpretation”. There is no ambiguity regarding the identity of KEGG module M00844, which is arginine biosynthesis from ornithine.

      Line 321 - more justification for the 80% cutoff is needed along with a sensitivity analysis to see if this choice matters for the key results.

      Inspired by this comment, and the one above regarding the classification of Bacteroides genomes, we tested several HMI score thresholds ranging from 75% to 85% average completeness of the 33 IBD-enriched modules. For each threshold, we computed all the key statistics reported in this section of our paper, including the statistical tests. We found that the choice of HMI score threshold does not influence the overall conclusions drawn in this section of our manuscript. Author response table 2 below shows the relevant subset of our new Supplementary Table 3h, which describes the results for each threshold:

      Author response table 2.

      Key genome-level results at each HMI score threshold. The HMI score is computed by adding the percent completeness of all 33 IBD-enriched KEGG modules. WRS – Wilcoxon Rank Sum test; KW – Kruskal-Wallis test. The full table can be viewed in Supplementary Table 3h

      We’ve summarized these findings in a new section of Supplementary File 1 entitled “Examining the impact of different HMI score thresholds on genome-level results”. We copy below the relevant text for the reviewer’s convenience:

      “Determining the HMI status of a given genome required us to set a threshold for the HMI score above which a genome would be considered to have high metabolic independence. We tested several different thresholds by varying the average percent completeness of the 33 IBD-enriched metabolic modules that we expected from the

      ‘HMI’ genomes from ≥ 75% (corresponding to an HMI score of ≥ 24.75) to ≥ 85% (corresponding to an HMI score of ≥ 28.05). For each threshold, we computed the same statistics and ran the same statistical tests as those reported in our main manuscript to assess the impact of these thresholds on the results (Supplementary Table 3h). At the highest threshold we tested (HMI score ≥ 28.05), a small proportion of the reference genomes (7%, or n = 24) were classified as HMI, so we did not test higher thresholds.

      We found that the results from comparing HMI genomes to non-HMI genomes are similar regardless of which HMI score threshold is used to classify genomes into either group. No matter which HMI score threshold was used, the mean genome size and mean number of genes were higher for HMI genomes than for non-HMI genomes. On average, the HMI genomes were about 1 Mb larger and had 1,032 more gene calls than non-HMI genomes. We ran two Wilcoxon Rank Sum statistical tests to assess the following null hypotheses: (1) HMI genomes do not have higher detection in IBD samples than non-HMI genomes, and (2) HMI genomes do not have higher detection in healthy samples than non-HMI genomes. For both tests, the p-values decreased (grew more significant) as the HMI score threshold decreased due to the inclusion of more genomes in the HMI bin. The first test for higher detection of HMI genomes than non-HMI genomes in IBD samples yielded p-values less than α = 0.05 at all HMI score thresholds. The second test for higher detection of HMI genomes than non-HMI genomes in healthy samples yielded p-values less than α = 0.05 for the three lowest HMI score thresholds (HMI score ≥ 24.75, ≥ 25.08, or ≥ 25.41). However, irrespective of significance threshold and HMI score threshold, there was always far stronger evidence to reject the first null hypothesis than the second, given that the p-value for the first test in IBD samples was 1 to 5 orders of magnitude lower (more significant) than the p-value for the second test in healthy samples.

      IBD samples harbored a significantly higher fraction of genomes classified as HMI than healthy or non-IBD samples, regardless of HMI score threshold (p < 1e-15, Kruskal-Wallis Rank Sum test). The p-values for this test increased (grew less significant) as the HMI score threshold decreased. This suggests that, at higher thresholds, relatively more genomes drop out of the HMI fraction in healthy/non-IBD samples than in IBD samples, thereby leading to larger differences and more significant p-values. Consequently, the HMI scores of genomes detected in IBD samples must be higher than the HMI scores of genomes detected in the other sample groups – indeed, the average HMI score of genomes detected within at least one IBD sample is 24.75, while the average score of genomes detected within at least one healthy sample is 22.78. Within a given sample, the mean HMI score of genomes detected within that sample is higher for the IBD group than in the healthy group: the average per-sample mean HMI score is 25.14 across IBD samples compared to the average of 23.00 across healthy samples.”

      Lines 357 and 454 - I would remove the discussion of the "gut environment" which isn't really addressed here. The observed trends could just as easily relate to microbial interactions or the effects of diet and pharmaceuticals. Perhaps the issue is the vague nature of this term, which I read to imply changes in the mammalian host. Given the level of evidence, I'd opt to keep the options open and discuss what additional data would help resolve these questions.

      We are in complete agreement with the reviewer that microbial interactions are likely an important driver of our observations. In healthy communities, microbial cross-feeding enables microbes with lower metabolic independence to establish and increase microbial diversity. Which is exactly why we are stating that “Community-level signal translates to individual microbial populations and provides insights into the microbial ecology of stressed gut environments”.

      Diet or usage of prescription drugs on the other hand, as discussed previously, likely varies substantially over the various cohorts investigated, and is thus not a driver of the observed trends. Instead, HMI works as a high level indicator that is not influenced by these variable host habits.

      Lines 354-394 - Could remove or dramatically trim down this text. Too much discussion for a results section.

      We kindly remind the reviewer that our manuscript is written following a “Results and Discussion” format. This section provides necessary context and justification for our classifier implementation, so we have left it as-is.

      Lines 395-441 - This section raised a lot of issues and could be qualified or even removed. The model was trained on modules that were IBD-associated in the same dataset, so it's not surprising that it worked. An independent test set would be required to see if this model has any broader utility.

      The point that we selected the IBD-enriched modules as features should not raise any concerns, as these modules would have emerged as the most important (ie, most highly weighted) features in our model even if we had included all modules in our training data. This is because machine learning classifiers by design pick out the features that best distinguish between classes, and the 33 IBD-associated modules are a selective subset of these (if they were not, they would not have been significantly enriched in the IBD sample group). That said, a carefully conducted feature selection process prior to model training is a standard best-practice in machine learning; thus, if anything, this should be interpreted as a point of confidence rather than a concern. Furthermore, we evaluated our model using cross-validation, a standard practice in the machine learning field that assesses the stability of model performance by training and testing the model on different subsets of the data. This effort established that the model is robust across different inputs as demonstrated by the per-fold confusion matrix and the ROC curve. These are all standard approaches in machine learning to quantify the model tradeoff between bias and variance. As for the independent test set, we went far and beyond, and applied our model to the antibiotic time-series dataset described later in this section, which, in our opinion, and likely also in the opinion of many experts, serves as one of the most convincing ways to test the utility of any model. Classification results here show that our hypothesis concerning the relevance of metabolic independence to microbial survival in stressed gut environments applies beyond the IBD case and includes antibiotic use, which is indeed a stronger validation for this hypothesis than any test we could have done on other IBD-related datasets. Regardless, we agree that any ‘broader’ utility of our model, such as its applications in clinical settings for diagnostic purposes, is something we certainly can not make strong claims about without more data. We have therefore qualified this section by adding the following sentence:

      “Determining whether such a model has broader utility as a diagnostic tool requires further research and validation; however, these results demonstrate the potential of HMI as an accessible diagnostic marker of IBD.”

      The application to the antibiotic intervention data raises additional concerns, as the model will predict IBD (labeled "stress" in Figure 5) where none exists.

      We apologize for this misunderstanding. The label “stress” actually means stress, not IBD. The figure the reviewer is referring to demonstrates that metabolic modules enriched in the gut microbiome of IBD patients are also temporarily enriched in the gut microbiome of healthy individuals treated with antibiotics for the duration of the treatment. While the classifier uses PPCN values for 33 metabolic modules enriched in microbiomes of IBD patients, it does not mean that this enrichment is exclusive to IBD. The classifier will distinguish between metagenomes in which the PPCN values for those 33 metabolic modules is higher and metagenomes in which the PPCN values are lower. Hence, our analysis demonstrates that during antibiotic usage in healthy individuals, the PPCN values of these 33 metabolic modules spike in a similar fashion to how they would in the gut community of a person with IBD. This points to a more general trend of high metabolic independence as a factor supporting microbial survival in conditions of stress; that is, the increase in metabolic independence is not specific to the IBD condition but rather a more generic ecological response to perturbations in the gut microbial community. We have clarified this point with the following addition to the paragraph summarizing these results:

      “All pre-treatment samples were classified as ‘healthy’ followed by a decline in the proportion of ‘healthy’ samples to a minimum 8 days post-treatment, and a gradual increase until 180 days post treatment, when over 90% of samples were classified as ‘healthy’ (Figure 5, Supplementary Table 4b). In other words, the increase in the HMI metric serves as an indicator of stress in the gut microbiome, regardless of whether that stress arises from the IBD condition or the application of antibiotics. These observations support the role of HMI as an ecological driver of microbial resilience during gut stress caused by a variety of environmental perturbations and demonstrate its diagnostic power in reflecting gut microbiome state.”

      We’ve also added the following sentence to the end of the legend for Figure 5:

      “Samples classified as ‘healthy’ by the model were considered to have ‘no stress’ (blue), while samples classified as ‘IBD’ were considered to be under ‘stress’ (red).”

      Figure S5A - should probably split this into 2 graphs since different data is analyzed.

      It is true that different sets of modules are used in either half of the figure; however, there is a significant amount of overlap between the sets (17 modules), which is why there are lines connecting the points for the same module as described in the figure legend. We are using this figure to make the point that the median PPCN value of each module increases, in both sets of modules, from the healthy sample group to the IBD sample group. Therefore, we believe the current presentation is appropriate.

      Figure S6A – this shows a substantial study effect and raises concerns about reproducibility.

      We examined potential batch effects in Supplementary Information File 1 (see section “Considerations of Batch Effect”), and found that any study effect was minor and overcome by the signal between groups:

      “The similar distribution of the median normalized copy number for each of the 33 IBD-enriched metabolic modules (summarized across all samples within a given study), across all studies within a given sample group (Supplementary Figure 6b), confirms that the sample group explains more of the trend than the study of origin.”

      Furthermore, within Supplementary Figure 6a, there is a clear increase between the non-IBD controls from Franzosa et al. 2018 and the IBD samples from the same study, as well as between the non-IBD controls from Schirmir et al. 2018 and the IBD samples from that study. As there is no study effect influencing those two comparisons, this reinforces the evidence that there is a true increase in the normalized copy numbers of these modules when comparing samples from more healthy individuals to those from less healthy individuals.

      Figure S7B - check numbers, which I think should sum to 33.

      The numbers should not sum to 33. In this test to determine whether the two largest studies had excessive influence on the identity of the IBD-enriched modules, we repeated our strategy to obtain 33 IBD-enriched modules (those with the 33 smallest p-values from the statistical test) from each set of samples – either (1) samples from Le Chatelier et al. 2013 and Vineis et al. 2016, or (2) samples that are not from those two studies. The 2 sets, containing 33 modules each, gives us a total of 66 IBD-enriched modules. By comparing those two sets, we found that 20 modules were present in both sets – hence the value of 20 in the center of the Venn Diagram. In each set, 13 modules were unique – hence the value of 13 on either side. 13 + 13 + 2*20 = 66 total modules.

      We again thank our reviewers for their time and interest, and invaluable input.

    1. eLife Assessment

      This important paper shows that the acquisition and expression of Pavlovian conditioned responding are lawfully related to temporal characteristics of an animal's conditioning experience. It showcases a rigorous experimental design, several different approaches to data analysis, careful consideration of prior literature, and a thorough introduction. The evidence supporting the conclusions is strong and convincing. The paper will have a general appeal to those interested in the behavioral and neural analysis of Pavlovian conditioning.

    2. Joint Public Review:

      The subject area will have general appeal to those interested in the study of Pavlovian conditioning. The paper is important, showcasing a rigorous experimental design, several different approaches to data analysis, careful consideration of prior literature, and a thorough introduction. The results indicate that the rate of Pavlovian learning is determined by the ratio of reward rate during cue to the overall reward rate, and that the asymptotic response rate is determined by the reward rate during cue. These findings provide context to many conflicting recent results on this topic and are supported by strong/convincing evidence.

      It is additionally claimed that the parameter that governs the acquisition and asymptote of responding in rats is exactly the same as that which governs the acquisition and asymptote of responding in the Gibbon and Balsam (1981) study that used pigeons as experimental subjects; and that the rates of responding during the inter-trial interval and the cue are proportional to the corresponding reward rates with the same proportionality constant. In both of these respects, there are several points that stand in need of clarification - at present, the strength of the evidence in support of these claims is solid. More generally, there are some points that could clarify aspects of rate estimation theory and, thereby, increase the rating of the paper from important to fundamental. These points range from analytical to conceptual and are presented below.

      ANALYTICAL

      (1) A key claim made here is that the same relationship (including the same parameter) describes data from pigeons by Gibbon and Balsam (1981; Figure 1) and the rats in this study (Figure 3). The evidence for this claim, as presented here, is not as strong as it could be. This is because the measure used for identifying trials to criterion in Figure 1 appears to differ from any of the criteria used in Figure 3, and the exact measure used for identifying trials to criterion influences the interpretation of Figure 3***. To make the claim that the quantitative relationship is one and the same in the Gibbon-Balsam and present datasets, one would need to use the same measure of learning on both datasets and show that the resultant plots are statistically indistinguishable, rather than simply plotting the dots from both data sets and spotlighting their visual similarity. In terms of their visual characteristics, it is worth noting that the plots are in log-log axis and, as such, slight visual changes can mean a big difference in actual numbers. For instance, between Figure 3B and 3C, the highest information group moves up only "slightly" on the y-axis but the difference is a factor of 5 in the real numbers. Thus, in order to support the strong claim that the quantitative relationships obtained in the Gibbon-Balsam and present datasets are identical, a more rigorous approach is needed for the comparisons.

      ***The measure of acquisition in Figure 3A is based on a previously established metric, whereas the measure in Figure 3B employs the relatively novel nDKL measure that is argued to be a better and theoretically based metric. Surprisingly, when r and r2 values are converted to the same metric across analyses, it appears that this new metric (Figure 3B) does well but not as well as the approach in Figure 3A. This raises questions about why a theoretically derived measure might not be performing as well on this analysis, and whether the more effective measure is either more reliable or tapping into some aspect of the processes that underlie acquisition that is not accounted for by the nDKL metric.

      (2) Another interesting claim here is that the rates of responding during ITI and the cue are proportional to the corresponding reward rates with the same proportionality constant. This too requires more quantification and conceptual explanation. For quantification, it would be more convincing to calculate the regression slope for the ITI data and the cue data separately and then show that the corresponding slopes are not statistically distinguishable from each other. Conceptually, it is not clear why the data used to test the ITI proportionality came from the last 5 conditioning sessions. What were the decision criteria used to decide on averaging the final 5 sessions as terminal responses for the analyses in Figure 5? Was this based on consistency with previous work, or based on the greatest number of sessions where stable data for all animals could be extracted?

      If the model is that animals produce response rates during the ITI (a period with no possible rewards) based on the overall rate of rewards in the context, wouldn't it be better to test this before the cue learning has occurred? Before cue learning, the animals would presumably only have attributed rewards in the context to the context and thus, produce overall response rates in proportion to the contextual reward rate. After cue learning, the animals could technically know that the rate of rewards during ITI is zero. Why wouldn't it be better to test the plotted relationship for ITI before cue learning has occurred? Further, based on Figure 1, it seems that the overall ITI response rate reduces considerably with cue learning. What is the expected ITI response rate prior to learning based on the authors' conceptual model? Why does this rate differ from pre and post-cue learning? Finally, if the authors' conceptual framework predicts that ITI response rate after cue learning should be proportional to contextual reward rate, why should the cue response rate be proportional to the cue reward rate instead of the cue reward rate plus the contextual reward rate?

      (3) There is a disconnect between the gradual nature of learning shown in Figures 7 and 8 and the information-theoretic model proposed by the authors. To the extent that we understand the model, the animals should simply learn the association once the evidence crosses a threshold (nDKL > threshold) and then produce behavior in proportion to the expected reward rate. If so, why should there be a gradual component of learning as shown in these figures? In terms of the proportional response rule to the rate of rewards, why is it changing as animals go from 10% to 90% of peak response? The manuscript would be greatly strengthened if these results were explained within the authors' conceptual framework. If these results are not anticipated by the authors' conceptual framework, this should be explicitly stated in the manuscript.

      (4) Page 27, Procedure, final sentence: The magazine responding during the ITI is defined as the 20 s period immediately before CS onset. The range of ITI values (Table 1) always starts as low as 15 s in all 14 groups. Even in the case of an ITI on a trial that was exactly 20 s, this would also mean that the start of this period overlaps with the termination of the CS from the previous trial and delivery (and presumably consumption) of a pellet. It should be indicated whether the definition of the ITI period was modified on trials where the preceding ITI was < 20 s, and if any other criteria were used to define the ITI. Were the rats exposed to the reinforcers/pellets in their home cage prior to acquisition?

      (5) For all the analyses, the exact models that were fit and the software used should be provided. For example, it is not necessarily clear to the reader (particularly in the absence of degrees of freedom) that the model discussed in Figure 3 fits on the individual subject data points or the group medians. Similarly, in Figure 6 there is no indication of whether a single regression model was fit to all the plotted data or whether tests of different slopes for each of the conditions were compared. With regards to the statistics in Figure 6, depending on how this was run, it is also a potential problem that the analyses do not correct for the potentially highly correlated multiple measurements from the same subjects, i.e. each rat provides 4 data points which are very unlikely to be independent observations.

      CONCEPTUAL

      (1) We take the point that where traditional theories (e.g., Rescorla-Wagner) and rate estimation theory (RET) both explain some phenomenon, the explanation in terms of RET may be preferred as it will be grounded in aspects of an animal's experience rather than a hypothetical construct. However, like traditional theories, RET does not explain a range of phenomena - notably, those that require some sort of expectancy/representation as part of their explanation. This being said, traditional theories have been incorporated within models that have the representational power to explain a broader array of phenomena, which makes me wonder: Can rate estimation be incorporated in models that have representational power; and, if so, what might this look like? Alternatively, do the authors intend to claim that expectancy and/or representation - which follow from probabilistic theories in the RW mould - are unnecessary for explanations of animal behaviour?***

      ***If the authors choose to reply to these points, they should consider taking advantage of an "Ideas and Speculation" subsection within the Discussion that is supported by eLife [ https://elifesciences.org/inside-elife/e3e52a93/elife-latest-including-ideas-and-speculation-in-elife-papers ].

      (2) The discussion of Rescorla's (1967) and Kamin's (1968) findings needs some elaboration. These findings are already taken to mean that the target CS in each design is not informative about the occurrence of the US - hence, learning about this CS fails. In the case of blocking, we also know that changes in the rate of reinforcement across the shift from stage 1 to stage 2 of the protocol can produce unblocking. Perhaps more interesting from a rate estimation perspective, unblocking can also be achieved in a protocol that maintains the rate of reinforcement while varying the sensory properties of the US (Wagner). How does rate estimation theory account for these findings and/or the demonstrations of trans-reinforcer blocking (Pearce-Ganesan)? Are there other ways that the rate estimation account can be distinguished from traditional explanations of blocking and contingency effects? If so, these would be worth citing in the discussion. More generally, if one is going to highlight seminal findings (such as those by Rescorla and Kamin) that can be explained by rate estimation, it would be appropriate to acknowledge findings that challenge the theory - even if only to note that the theory, in its present form, is not all-encompassing. For example, it appears to me that the theory should not predict one-trial overshadowing or the overtraining reversal effect - both of which are amenable to discussion in terms of rates. I assume that the signature characteristics of latent inhibition and extinction would also pose a challenge to rate estimation theory, just as they pose a challenge to Rescorla-Wagner and other probability-based theories. Is this correct?

    3. Author response:

      ANALYTICAL

      (1) Figure 3 shows that the relationship between learning rate and informativeness for our rats was very similar to that shown with pigeons by Gibbon and Balsam (1981). We used multiple criteria to establish the number of trials to learn in our data, with the goal of demonstrating that the correspondence between the data sets was robust. To establish that they are effectively the same does require using an equivalent decision criterion for our data as was used for Gibbon and Balsam’s data. However, the criterion they used—at least one peck at the response key on at least 3 out of 4 consecutive trials—cannot be sensibly applied to our magazine entry data because rats make magazine entries during the inter-trial interval (whereas pigeons do not peck at the response key in the inter-trial interval). Therefore, evidence for conditioning in our paradigm must involve comparison between the response rate during CS and the baseline response rate. There are two ways one could adapt the Gibbon and Balsam criterion to our data. One way is to use a non-parametric signed rank test for evidence that the CS response rate exceeds the pre-CS response rate, and adopting a statistical criterion equivalent to Gibbon and Balsam’s 3-out-of-4 consecutive trials (p<.3125). The second method estimates the nDkl for the criterion used by Gibbon and Balsam. This could be done by assuming there are no responses in the inter-trial interval and a response probability of at least 0.75 during the CS (their criterion). This would correspond to an nDkl of 2.2 (odds ratio 27:1). The obtained nDkl could then be applied to our data to identify when the distribution of CS response rates has diverged by an equivalent amount from the distribution of pre-CS response rates.

      (2) A single regression line, as shown in Figure 6, is the simplest possible model of the relationship between response rate and reinforcement rate and it explains approximately 80% of the variance in response rate. Fixing the log-log slope at 1 yields the maximally simple model. (This regression is done in the logarithmic domain to satisfy the homoscedasticity assumption.) When transformed into the linear domain, this model assumes a truly scalar relation (linear, intercept at the origin) and assumes the same scale factor and the same scalar variability in response rates for both sets of data (ITI and CS). Our plot supports such a model. Its simplicity is its own motivation (Occam’s razor).

      If regression lines are fitted to the CS and ITI data separately, there is a small increase in explained variance (R2 = 0.82). We leave it to further research to determine whether such a complex model, with 4 parameters, is required. However, we do not think the present data warrant comparing the simplest possible model, with one parameter, to any more complex model for the following reasons:

      · When a brain—or any other machine—maps an observed (input) rate to a rate it produces (output rate), there is always an implicit scalar. In the special case where the produced rate equals the observed rate, the implicit scalar has value 1. Thus, there cannot be a simpler model than the one we propose, which is, in and of itself, interesting.

      · The present case is an intuitively accessible example of why the MDL (Minimum Description Length) approach to model complexity (Barron, Rissanen, & Yu, 1998; Grünwald, Myung, & Pitt, 2005; Rissanen, 1999) can yield a very different conclusion from the conclusion reached using the Bayesian Information Criterion (BIC) approach. The MDL approach measures the complexity of a model when given N data specified with precision of B bits per datum by computing (or approximating) the sum of the maximum-likelihoods of the model’s fits to all possible sets of N data with B precision per datum. The greater the sum over the maximum likelihoods, the more complex the model, that is, the greater its measured wiggle room, it’s capacity to fit data. Recall that von Neuman remarked to Fermi that with 4 parameters he could fit an elephant. His deeper point was that multi-parameter models bring neither insight nor predictive power; they explain only post-hoc, after one has adjusted their parameters in the light of the data. For realistic data sets like ours, the sums of maximum likelihoods are finite but astronomical. However, just as the Sterling approximation allows one to work with astronomical factorials, it has proved possible to develop readily computable approximations to these sums, which can be used to take model complexity into account when comparing models. Proponents of the MDL approach point out that the BIC is inadequate because models with the same number of parameters can have very different amounts of wiggle room. A standard illustration of this point is the contrast between logarithmic model and power-function model. Log regressions must be concave; whereas power function regressions can be concave, linear, or convex—yet they have the same number of parameters (one or two, depending on whether one counts the scale parameter that is always implicit). The MDL approach captures this difference in complexity because it measures wiggle room; the BIC approach does not, because it only counts parameters.

      · In the present case, one is comparing a model with no pivot and no vertical displacement at the boundary between the black dots and the red dots (the 1-parameter unilinear model) to a bilinear model that allows both a change in slope and a vertical displacement for both lines. The 4-parameter model is superior if we use the BIC to take model complexity into account. However, 4-parameter has ludicrously more wiggle room. It will provide excellent fits—high maximum likelihood—to data sets in which the red points have slope > 1, slope 0, or slope < 0 and in which it is also true that the intercept for the red points lies well below or well above the black points (non-overlap in the marginal distribution of the red and black data). The 1-parameter model, on the other hand, will provide terrible fits to all such data (very low maximum likelihoods). Thus, we believe the BIC does not properly capture the immense actual difference in the complexity between the 1-parameter model (unilinear with slope 1) to the 4-parameter model (bilinear with neither the slope nor the intercept fixed in the linear domain).

      · In any event, because the pivot (change in slope between black and red data sets), if any, is small and likewise for the displacement (vertical change), it suffices for now to know that the variance captured by the 1-parameter model is only marginally improved by adding three more parameters. Researchers using the properly corrected measured rate of head poking to measure the rate of reinforcement a subject expects can therefore assume that they have an approximately scalar measure of the subject’s expectation. Given our data, they won’t be far wrong even near the extremes of the values commonly used for rates of reinforcement. That is a major advance in current thinking, with strong implications for formal models of associative learning. It implies that the performance function that maps from the neurobiological realization of the subject’s expectation is not an unknown function. On the contrary, it’s the simplest possible function, the scalar function. That is a powerful constraint on brain-behavior linkage hypotheses, such as the many hypothesized relations between mesolimbic dopamine activity and the expectation that drives responding in Pavlovian conditioning (Berridge, 2012; Jeong et al., 2022; Y.  Niv, Daw, Joel, & Dayan, 2007; Y. Niv & Schoenbaum, 2008).

      The data in Figure 6 are taken from the last 5 sessions of training. The exact number of sessions was somewhat arbitrary but was chosen to meet two goals: (1) to capture asymptotic responding, which is why we restricted this to the end of the training, and (2) to obtain a sufficiently large sample of data to estimate reliably each rat’s response rate. We have checked what the data look like using the last 10 sessions, and can confirm it makes very little difference to the results.<br /> Finally, as noted by the reviews, the relationship between the contextual rate of reinforcement and ITI responding should also be evident if we had measured context responding prior to introducing the CS. However, there was no period in our experiment when rats were given unsignalled reinforcement (such as is done during “magazine training” in some experiments). Therefore, we could not measure responding based on contextual conditioning prior to the introduction of the CS. This is a question for future experiments that use an extended period of magazine training or “poor positive” protocols in which there are reinforcements during the ITIs as well as during the CSs. The learning rate equation has been shown to predict reinforcements to acquisition in the poor-positive case (Balsam, Fairhurst, & Gallistel, 2006).

      (3) One of us (CRG) has earlier suggested that responding appears abruptly when the accumulated evidence that the CS reinforcement rate is greater than the contextual rate exceeds a decision threshold (C.R.  Gallistel, Balsam, & Fairhurst, 2004). The new more extensive data require a more nuanced view. Evidence about the manner in which responding changes over the course of training is to some extent dependent on the analytic method used to track those changes. We presented two different approaches. The approach shown in Figures 7 and 8, extending on that developed by Harris (2022), assumes a monotonic increase in response rate and uses the slope of the cumulative response rate to identify when responding exceeds particular milestones (percentiles of the asymptotic response rate). This analysis suggests a steady rise in responding over trials. Within our theoretical model, this might reflect an increase in the animal’s certainty about the CS reinforcement rate with accumulated evidence from each trial. While this method should be able to distinguish between a gradual change and a single abrupt change in responding (Harris, 2022) it may not distinguish between a gradual change and multiple step-like changes in responding and cannot account for decreases in response rate.<br /> The other analytic method we used relies on the information theoretic measure of divergence, the nDkl (Gallistel & Latham, 2023), to identify each point of change (up or down) in the response record. With that method, we discern three trends. First, the onset tends to be abrupt in that the initial step up is often large (an increase in response rate by 50% or more of the difference between its initial value and its terminal value is common and there are instances where the initial step is to the terminal rate or higher). Second, there is marked within-subject variability in the response rate, characterised by large steps up and down in the parsed response rates following the initial step up, but this variability tends to decrease with further training (there tend to be fewer and smaller steps in both the ITI response rates and the CS response rate as training progresses). Third, the overall trend, seen most clearly when one averages across subjects within groups is to a moderately higher rate of responding later in training than after the initial rise. We think that the first tendency reflects an underlying decision process whose latency is controlled by diminishing uncertainty about the two reinforcement rates and hence about their ratio. We think that decreasing uncertainty about the true values of the estimated rates of reinforcement is also likely to be an important part of the explanation for the second tendency (decreasing within-subject variation in response rates). It is less clear whether diminishing uncertainty can explain the trend toward a somewhat greater difference in the two response rates as conditioning progresses. It is perhaps worth noting that the distribution of the estimates of the informativeness ratio is likely to be heavy tailed and have peculiar properties (as witness, for example, the distribution of the ratio of two gamma distributions with arbitrary shape and scale parameters) but we are unable at this time to propound an explanation of the third trend.

      (4) There is an error in the description provided in the text. The pre-CS period used to measure the ITI responding was 10 s rather than 20 s. There was always at least a 5-s gap between the end of the previous trial and the start of the pre-CS period.

      (5) Details about model fitting will be added in a revision. The question about fitting a single model or multiple models to the data in Figure 6 is addressed in response 2 above. In Figure 6, each rat provides 2 behavioural data points (ITI response rate and CS response rate) and 2 values for reinforcement rate (1/C and 1/T). There is a weak but significant correlation between the ITI and CS response rates (r = 0.28, p < 0.01; log transformed to correct for heteroscedasticity). By design, there is no correlation between the log reinforcement rates (r = 0.06, p = .404).

      CONCEPTUAL

      (1) It is important for the field to realize that the RW model cannot be used to explain the results of Rescorla’s (Rescorla, 1966; Rescorla, 1968, 1969) contingency-not-pairing experiments, despite what was claimed by Rescorla and Wagner (Rescorla & Wagner, 1972; Wagner & Rescorla, 1972) and has subsequently been claimed in many modelling papers and in most textbooks and reviews (Dayan & Niv, 2008; Y. Niv & Montague, 2008). Rescorla programmed reinforcements with a Poisson process. The defining property of a Poisson process is its flat hazard function; the reinforcements were equally likely at every moment in time when the process was running. This makes it impossible to say when non-reinforcements occurred and, a fortiori, to count them. The non-reinforcements are causal events in RW algorithm and subsequent versions of it. Their effects on associative strength are essential to the explanations proffered by these models. Non-reinforcements—failures to occur, updates when reinforcement is set to 0, hence also the lambda parameter—can have causal efficacy only when the successes may be predicted to occur at specified times (during “trials”). When reinforcements are programmed by a Poisson process, there are no such times. Attempts to apply the RW formula to reinforcement learning soon foundered on this problem (Gibbon, 1981; Gibbon, Berryman, & Thompson, 1974; Hallam, Grahame, & Miller, 1992; L.J. Hammond, 1980; L. J. Hammond & Paynter, 1983; Scott & Platt, 1985). The enduring popularity of the delta-rule updating equation in reinforcement learning depends on “big-concept” papers that don’t fit models to real data and discretize time into states while claiming to be real-time models (Y. Niv, 2009; Y. Niv, Daw, & Dayan, 2005).

      The information-theoretic approach to associative learning, which sometimes historically travels as RET (rate estimation theory), is unabashedly and inescapably representational. It assumes a temporal map and arithmetic machinery capable in principle of implementing any implementable computation. In short, it assumes a Turing-complete brain. It assumes that whatever the material basis of memory may be, it must make sense to ask of it how many bits can be stored in a given volume of material. This question is seldom posed in associative models of learning, nor by neurobiologists committed to the hypothesis that the Hebbian synapse is the material basis of memory. Many—including the new Nobelist, Geoffrey Hinton— would agree that the question makes no sense. When you assume that brains learn by rewiring themselves rather than by acquiring and storing information, it makes no sense.

      When a subject learns a rate of reinforcement, it bases its behavior on that expectation, and it alters its behavior when that expectation is disappointed. Subjects also learn probabilities when they are defined. They base some aspects of their behavior on those expectations, making computationally sophisticated use of their representation of the uncertainties (Balci, Freestone, & Gallistel, 2009; Chan & Harris, 2019; J. A. Harris, 2019; J.A. Harris & Andrew, 2017; J. A. Harris & Bouton, 2020; J. A. Harris, Kwok, & Gottlieb, 2019; Kheifets, Freestone, & Gallistel, 2017; Kheifets & Gallistel, 2012; Mallea, Schulhof, Gallistel, & Balsam, 2024 in press).

      (2) Rate estimation theory is oblivious to the temporal order in which experience with different predictors occurs. The matrix computation finds the additive solution, if it exists, to the data so far observed, on the assumption that predicted rates have remained the same. This is the stationarity assumption, which is implicit in a rate computation and was made explicit in the formulation of RET (C.R. Gallistel, 1990). When the additive solution does not exist, the RET algorithm treats the compound of two predictors as a third predictor, and computes the additive solution to the 3-predictor problem. Because it is oblivious to the order in which the data have been acquired, it predicts one-trial overshadowing and retroactive blocking and unblocking (C.R. Gallistel, 1990 pp 439 & 452-455).

      The RET algorithm is but one component of the information-theoretic model of associative learning (aka, TATAL, The Analytic Theory of Associative Learning Wilkes & Gallistel, 2016)). It solves the assignment-of-credit problem, not the change-detection problem. Because rates of reinforcement do sometimes change, the stationarity assumption, which is essential to the RET algorithm, must be tested when each new reinforcement occurs and when the interval since the last reinforcement has become longer than would be expected or the number of reinforcements has become significantly fewer than would be expected given the current estimate of the probability of reinforcement (C. R. Gallistel, Krishan, Liu, Miller, & Latham, 2014). In the information-theoretic approach to associative learning, detecting non-stationarity is done by an information-theoretic change-detecting algorithm. The algorithm correctly predicts that omitted reinforcements to extinction will be a constant (C.R. Gallistel, 2024 under review; Gibbon, Farrell, Locurto, Duncan, & Terrace, 1980). To put the prediction another way, unreinforced trials to extinction will increase in proportional to the trials/reinforcement during training (C.R. Gallistel, 2012; Wilkes & Gallistel, 2016). In other words, it predicts the best and most systematic data on the partial reinforcement extinction effect (PREE) known to us. The profound challenge to neo-Hullian delta-rule updating models that is posed by the PREE has been recognized for the better part of a century. To the best of our knowledge, no other formalized model of associative learning has overcome this challenge (Dayan & Niv, 2008; Mellgren, 2012). Explaining extinction algorithmically is straightforward when one adopts an information-theoretic perspective, because computing reinforcement-by-reinforcement the Kullback-Leibler divergence in a sequence of earlier rate (or probability!) estimates from the most recent estimate and multiplying the vector of divergences by the vector of effective sample sizes (C. R. Gallistel & Latham, 2022) detects and localized changes in rates and probabilities of reinforcement (C.R. Gallistel, 2024 under review). The computation presupposes the existence of a temporal map, a time-stamped record of past events. This supposition is strongly resisted by neuroscience-oriented reinforcement-learning modelers, who try to substitute the assumption of decaying eligibility traces.

      The very interesting Pearce-Ganesan findings (Ganesan & Pearce, 1988) are not predicted by RET, but nor do they run counter its predictions. RET has nothing to say about how subjects categorize appetitive reinforcements; nor, at this time, does the information-theoretic approach to an understanding of associative have anything to say about that.

      The same is not true for the Betts, Brandon & Wagner results (Betts, Brandon, & Wagner, 1996). They pretrained a blocking cue that predicted a painful paraorbital shock to one eye of a rabbit. This cue elicited an anticipatory blink in the threatened eye. It also potentiated the startle reflex made to a loud noise in one ear. A new cue that was then introduced, which always occurred in compound with the pretrained blocking cue. In one group, the painful shock continued to be delivered to the same eye as before; in another group, it was delivered to the skin around the other eye. In the group that continued to receive the shock to the same eye, the old cue effectively blocked conditioning of the new cue for both the eyeblink and the potentiated startle response. However, in the group for which the location of the shock changed to the other eye, the old cue did not block conditioning of the eyeblink response to the new cue but did block conditioning of the startle response to the new cue. The information-theoretic analysis of associative learning focusses on the encoding of measurable predictive temporal relationships, rather than on general and, to our mind, vague notions like CS processing and US processing. A painful shock elicits fear in a rabbit no matter where on the body surface it is experienced, because fear is a reaction to a very broad category of dangers, and fear potentiates the startle reflex regardless of the threat that causes fear. Once that prediction of such a threat is encoded; redundant cues will not be encoded that same way because the RET algorithm blocks the encoding of redundant predictions. A painful shock near an eye elicits a blink of the threatened eye as well as the fear that potentiates the startle. An appropriate encoding for the eye blink must specify the location of the threat. RET will attribute prediction of the threat to the new eye to the new cue—and not to the old cue, the pretrained blocker— while continuing to attribute to the old cue the prediction of a fear-causing threat, because the change in location does not alter that prediction. Therefore, the new cue will be encoded as predicting the new location of the threat to the eye, but not as predicting the large category non-specific threats that elicit fear and the potentiation of the startle, because that prediction remains valid. Changing that prediction would violate the stationarity assumption; predictive relations do not change unless the data imply that they must have changed. Unless we have made a slip in our logic, this would seem to explain Betts et al’s (1996) results. It does so with no free parameters, unlike AESOP, which has a notoriously large number of free parameters.

      Balci, F., Freestone, D., & Gallistel, C. R. (2009). Risk assessment in man and mouse. Proceedings of the National Academy of Science U S A, 106(7), 2459-2463. doi:10.1073/pnas.0812709106

      Balsam, P. D., Fairhurst, S., & Gallistel, C. R. (2006). Pavlovian contingencies and temporal information. Journal of Experimental Psychology: Animal Behavior Processes, 32, 284-294.

      Barron, A., Rissanen, J., & Yu, B. (1998). The minimum description length principle in coding and modeling. IEEE Transactions on Information Theory, 44(6), 2743-2760.

      Berridge, K. C. (2012). From prediction error to incentive salience: Mesolimbic computation of reward motivation. European Journal of Neuroscience.

      Betts, S. L., Brandon, S. E., & Wagner, A. R. (1996). Dissociation of the blocking of conditioned eyeblink and conditioned fear following a shift in US locus. Animal Learning and Behavior, 24(4), 459-470.

      Chan, C. K. J., & Harris, J. A. (2019). The partial reinforcement extinction effect: The proportion of trials reinforced during conditioning predicts the number of trials to extinction. Journal of Experimental Psychology: Animal Learning and Cognition, 45(1). doi:http://dx.doi.org/10.1037/xan0000190

      Dayan, P., & Niv, Y. (2008). Reinforcement learning: The good, the bad and the ugly. Current Opinion in Neurobiology, 18(2), 185-196.

      Gallistel, C. R. (1990). The organization of learning. Cambridge, MA: Bradford Books/MIT Press.

      Gallistel, C. R. (2012). Extinction from a rationalist perspective. Behav Processes, 90, 66-88. doi:10.1016/j.beproc.2012.02.008

      Gallistel, C. R. (2024 under review). Reconceptualized associative learning. Perspectives on Behavioral Science (Special Issue for SQAB 2024).

      Gallistel, C. R., Balsam, P. D., & Fairhurst, S. (2004). The learning curve: Implications of a quantitative analysis. Proceedings of the National Academy of Sciences, 101(36), 13124-13131.

      Gallistel, C. R., Krishan, M., Liu, Y., Miller, R. R., & Latham, P. E. (2014). The perception of probability. Psychological Review, 121, 96-123. doi:10.1037/a0035232

      Gallistel, C. R., & Latham, P. E. (2022). Bringing Bayes and Shannon to the Study of Behavioral and Neurobiological Timing. Timing & Time Perception. timing & TIME Perception, 1-61. doi:10.1163/22134468-bja10069

      Ganesan, R., & Pearce, J. M. (1988). Effect of changing the unconditioned stimulus on appetitive blocking. Journal of Experimental Psychology: Animal Behavior Processes, 14, 280-291.

      Gibbon, J. (1981). The contingency problem in autoshaping. In C. M. Locurto, H. S. Terrace, & J. Gibbon (Eds.), Autoshaping and conditioning theory (pp. 285-308). New York: Academic.

      Gibbon, J., & Balsam, P. (1981). Spreading association in time. In C. M. Locurto, H. S. Terrace, & J. Gibbon (Eds.), Autoshaping and conditioning theory (pp. 219-253). New York: Academic Press.

      Gibbon, J., Berryman, R., & Thompson, R. L. (1974). Contingency spaces and measures in classical and instrumental conditioning. Journal of the Experimental Analysis of Behavior, 21(3), 585-605. doi: 10.1901/jeab.1974.21-585

      Gibbon, J., Farrell, L., Locurto, C. M., Duncan, H. J., & Terrace, H. S. (1980). Partial reinforcement in autoshaping with pigeons. Animal Learning and Behavior, 8, 45–59. doi:doi.org/10.3758/BF03209729

      Grünwald, P. D., Myung, I. J., & Pitt, M. A. (2005). Advances in minimum description length: theory and applications. Cambridge, MA: MIT Press.

      Hallam, S. C., Grahame, N. J., & Miller, R. R. (1992). Exploring the edges of Pavlovian contingency space: An assessment of contignency theory and its various metrics. Learning and Motivation, 23, 225-249.

      Hammond, L. J. (1980). The effect of contingency upon the appetitive conditioning of free operant behavior. Journal of  the Experimental Analysis of Behavior, 34, 297-304. doi:10.1901/jeab.1980.34-297

      Hammond, L. J., & Paynter, W. E. (1983). Probabilistic contingency theories of animal conditioning: A critical analysis. Learning and Motivation, 14, 527-550. doi:10.1016/0023-9690(83)90031-0

      Harris, J. A. (2019). The importance of trials. Journal of Experimental Psychology: Animal Learning and Cognition, 45(4).

      Harris, J. A. (2022). The learning curve, revisited. Journal of Experimental Psychology: Animal Learning and Cognition, 48, 265-280.

      Harris, J. A., & Andrew, B. J. (2017). Time, Trials and Extinction. Journal of Experimental Psychology: Animal Learning and Cognition, 43(1), 15-29.

      Harris, J. A., & Bouton, M. E. (2020). Pavlovian conditioning under partial reinforcement: The effects of non-reinforced trials versus cumulative CS duration. The Journal of Experimental Psychology: Animal Learning & Cognition, 46, 256-272.

      Harris, J. A., Kwok, D. W. S., & Gottlieb, D. A. (2019). The partial reinforcement extinction effect depends on learning about nonreinforced trials rather than reinforcement rate. Journal of Experimental Psychology: Animal Behavior Learning and Cognition, 45(4). doi:10.1037/xan0000220

      Jeong, H., Taylor, A., Floeder, J. R., Lohmann, M., Mihalas, S., Wu, B., . . . Namboodiri, V. M. K. (2022). Mesolimbic dopamine release conveys causal associations. Science. doi:10.1126/science.abq6740

      Kheifets, A., Freestone, D., & Gallistel, C. R. (2017). Theoretical Implications of Quantitative Properties of Interval Timing and Probability Estimation in Mouse and Rat. Journal of the Experimental Analysis of Behavior, 108(1), 39-72. doi:doi.org/10.1002/jeab.261

      Kheifets, A., & Gallistel, C. R. (2012). Mice take calculated risks. Proceedings of the National Academy of Science, 109, 8776-8779. doi:doi.org/10.1073/pnas.1205131109

      Mallea, J., Schulhof, A., Gallistel, C. R., & Balsam, P. D. (2024 in press). Both probability and rate of reinforcement can affect the acquisition and maintenance of conditioned responses. Journal of Experimental Psychology: Animal Learning and Cognition.

      Mellgren, R. (2012). Partial reinforcement extinction effect. In N. M. Seel (Ed.), Encyclopedia of the Sciences of Learning. Boston, MA: Springer.

      Niv, Y. (2009). Reinforcement learning in the brain. Journal of Mathematical Psychology, 53, 139-154.

      Niv, Y., Daw, N. D., & Dayan, P. (2005). How fast to work: response vigor, motivation and tonic dopamine. In Y. Weiss, B. Schölkopf, & J. R. Platt (Eds.), NIPS 18 (pp. 1019–1026). Cambridge, MA: MIT Press.

      Niv, Y., Daw, N. D., Joel, D., & Dayan, P. (2007). Tonic dopamine: Opportunity costs and the control of response vigor. Psychopharmacology, 191(3), 507-520.

      Niv, Y., & Montague, P. R. (2008). Theoretical and empirical studies of learning. In  (., eds), pp. , Academic Press. In P. W. e. a. Glimcher (Ed.), Neuroeconomics: Decision-Making and the Brain (pp. 329–349). New York: Academic Press.

      Niv, Y., & Schoenbaum, G. (2008). Dialogues on prediction errors. Trends in Cognitive Sciences, 12(7), 265-272. doi:10.1016/j.tics.2008.03.006

      Rescorla, R. A. (1966). Predictability and the number of pairings in Pavlovian fear conditioning. Psychonomic Science, 4, 383-384.

      Rescorla, R. A. (1968). Probability of shock in the presence and absence of CS in fear conditioning. Journal of Comparative and Physiological Psychology, 66(1), 1-5. doi:10.1037/h0025984

      Rescorla, R. A. (1969). Conditioned inhibition of fear resulting from negative CS-US contingencies. Journal of Comparative and Physiological Psychology, 67, 504-509.

      Rescorla, R. A., & Wagner, A. R. (1972). A theory of Pavlovian conditioning: Variations in the effectiveness of reinforcement and nonreinforcement. In A. H. Black & W. F. Prokasy (Eds.), Classical conditioning II (pp. 64-99). New York: Appleton-Century-Crofts.

      Rissanen, J. (1999). Hypothesis selection and testing by the MDL principle. The Computer Journal, 42, 260–269. doi:10.1093/comjnl/42.4.260

      Scott, G. K., & Platt, J. R. (1985). Model of response-reinforcement contingency. Journal of  Experimental Psychology: Animal Behavior Processes, 11(2), 152-171.

      Wagner, A. R., & Rescorla, R. A. (1972). Inhibition in Pavlovian conditioning: Appllication of a theory. In R. A. Boakes & S. Halliday (Eds.), Inhibition and learning. New York: Academic.

      Wilkes, J. T., & Gallistel, C. R. (2016). Information Theory, Memory, Prediction, and Timing in Associative Learning (original long version).

    1. eLife Assessment

      This important study addresses how 3' splice site choice is modulated by the conserved spliceosome-associated protein Fyv6. The authors provide compelling evidence that Fyv6 functions to enable selection of 3' splice sites distal to a branch point and in doing so antagonizes more proximal, suboptimal 3' splice sites.

    2. Reviewer #1 (Public Review):

      Summary:

      A key challenge at the second chemical step of splicing is the identification of the 3' splice site of an intron. This requires recruitment of factors dedicated to the second chemical step of splicing and exclusion of factors dedicated to the first chemical step of splicing. Through the highest resolution cyroEM structure of the spliceosome to-date, the authors show the binding site for Fyv6, a factor dedicated to the second chemical step of splicing, is mutually exclusive with the binding site for a distinct factor dedicated to the first chemical step of splicing, highlighting that splicing factors bind to the spliceosome at a specific stage not only by recognizing features specific to that stage but also by competing with factors that bind at other stages. The authors further reveal that Fyv6 functions at the second chemical step to promote selection of 3' splice sites distal to a branch point and thereby discriminate against proximal, suboptimal 3' splice site. Lastly, the authors show by cyroEM that Fyv6 physically interacts with the RNA helicase Prp22 and by genetics Fyv6 functionally interacts with this factor, implicating Fyv6 in 3'SS proofreading and mRNA release from the spliceosome. The evidence for this study is robust, with the inclusion of genomics, reporter assays, genetics, and cyroEM. Further, the data overall justify the conclusions, which will be of broad interest.

      Strengths:

      (1) The resolution of the cryoEM structure of Fyv6-bound spliceosomes at the second chemical step of splicing is exceptional (2.3 Angstroms at the catalytic core; 3.0-3.7 Angstroms at the periphery), providing the best view of this spliceosomal intermediate in particular and the core of the spliceosome in general.<br /> (2) The authors observe by cryoEM three distinct states of this spliceosome, each distinguished from the next by progressive loss of protein factors and/or RNA residues. The authors appropriately refrain from overinterpreting these states as reflecting distinct states in the splicing cycle, as too many cyroEM studies are prone to do, and instead interpret these observations to suggest interdependencies of binding. For example, when Fyv6, Slu7, and Prp18 are not observed, neither are the first and second residues of the intron, which otherwise interact, suggesting an interdependence between 3' splice site docking on the 5' splice site and binding of these second step factors to the spliceosome.<br /> (3) Conclusions are supported from multiple angles.<br /> (4) The interaction between Fyv6 and Syf1, revealed by the cyroEM structure, was shown to account for the temperature-sensitive phenotypes of a fyv6 deletion, through a truncation analysis.<br /> (5) Splicing changes were observed in vivo both by indirect copper reporter assays and directly by RT-PCR.<br /> (6) Changes observed by RNA-seq are validated by RT-PCR.<br /> (7) The authors go beyond simply observing a general shift to proximal 3'SS usage in the fyv6 deletion by RNA-seq by experimentally varying branch point to 3' splice site distance experimentally in a reporter and demonstrating in a controlled system that Fyv6 promotes distal 3' splice sites.<br /> (8) The importance of the Fyv6-Syf1 interaction for 3'SS recognition is demonstrated by truncations of both Fyv6 and of Syf1.<br /> (9) In general, the study was executed thoroughly and presented clearly.

      Comments on revisions:

      The authors have satisfactorily addressed the comments.

    3. Reviewer #2 (Public Review):

      In this manuscript, Senn, Lipinski, and colleagues report on the structure and function of the conserved spliceosomal protein Fyv6. Pre-mRNA splicing is a critical gene expression step that occurs in two steps, branching and exon ligation. Fyv6 had been recently identified by the Hoskins' lab as a factor that aids exon ligation (Lipinski et al., 2023), yet the mechanistic basis for Fyv6 function was less clear. Here, the authors combine yeast genetics, transcriptomics, biochemical assays, and structural biology to reveal the function of Fyv6. Specifically, they describe that Fyv6 promotes the usage of distal 3'SSs by stabilizing a network of interactions that include the RNA helicase PRP22 and the spliceosome subunit SYF1. They discuss a generalizible mechanism for splice site proofreading by spliceosomsal RNA helicases that could be modulated by other, regulatory splicing factors.

      This is a very high quality study, which expertly combines various approaches to provide new insights into the regulation of 3'SS choice, docking, and undocking. The cryo-EM data is also of excellent quality, which substantially extends on previous yeast P complex structures. This is also supported by the authors use of the latest data analysis tools (Relion-5, AlphaFold2 multimer predictions, Modelangelo). The authors re-evaluate published EM densities of yeast spliceosome complexes (B*, C,C*,P) for the presence or absence of Fyv6, substantiate Fyv6 as a 2nd step specific factor, confirm it as the homolog of the human protein FAM192A, and provide a model for how Fyv6 may fit into the splicing pathway. The biochemical experiments on probing the splicing effects of BP to 3'SS distances after Fyv6 KO, genetic experiments to probe Fyv6 and Syf1 domains, and the suppressor screening add substantially to the study and are well executed. The manuscript is clearly written and we particularly appreciated the nuanced discussions, for example for an alternative model by which Prp22 influences 3'SS undocking. The research findings will be of great interest to the pre-mRNA splicing community.

      Comments on revisions:

      I'm satisfied with the changes.

    4. Reviewer #3 (Public Review):

      In this manuscript the authors expand their initial identification of Fyv6 as a protein involved in the second step of pre-mRNA splicing to investigate the transcriptome-wide impact of Fyv6 on splicing and gain a deeper understanding of the mechanism of Fyv6 action.

      They first use deep sequencing of transcripts in cells depleted of Fyv6 together with Upf1 (to limit loss of mis-spliced transcripts) to identify broad changes in the transcriptome due to loss of Fyv6. This includes both changes in overall gene expression, that are not deeply discussed, as well as alterations in choice of 3' splice sites - which is the focus of the rest of the manuscript

      They next provide the highest resolution structure of the post-catalytic spliceosome to date; providing unparalleled insight into details of the active site and peripheral components that haven't been well characterized previously.

      Using this structure they identify functionally critical interactions of Fyv6 with Syf1 but not Prp22, Prp8 and Slu7. Finally, a suppressor screen additionally provides extensive new information regarding functional interactions between these second step factors.

      Overall this manuscript reports new and essential information regarding molecular interactions within the spliceosome that determine the use of the 3' splice site. It would be helpful, especially to the non-expert, to summarize these in a table, figure or schematic in the discussion.

      Comments on revisions:

      I'm satisfied with the changes made in the revision.

    5. Author response:

      The following is the authors’ response to the original reviews.

      eLife Assessment

      This important study addresses how 3' splice site choice is modulated by the conserved spliceosome-associated protein Fyv6. The authors provide compelling evidence Fyv6 functions to enable selection of 3' splice sites distal to a branch point and in doing so antagonizes more proximal, suboptimal 3' splice sites. The study would be improved through a more nuanced discussion of alternative possibilities and models, for instance in discussing the phenotypic impact of Fyv6 deletion.

      We thank the editors and reviewers for their supportive comments and assessment of this manuscript. We have improved the discussion at several points as suggested by the reviewers to include discussion of alternative possibilities.

      Public Reviews:

      Reviewer #1 (Public Review):

      Summary:

      A key challenge at the second chemical step of splicing is the identification of the 3' splice site of an intron. This requires recruitment of factors dedicated to the second chemical step of splicing and exclusion of factors dedicated to the first chemical step of splicing. Through the highest resolution cyroEM structure of the spliceosome to-date, the authors show the binding site for Fyv6, a factor dedicated to the second chemical step of splicing, is mutually exclusive with the binding site for a distinct factor dedicated to the first chemical step of splicing, highlighting that splicing factors bind to the spliceosome at a specific stage not only by recognizing features specific to that stage but also by competing with factors that bind at other stages. The authors further reveal that Fyv6 functions at the second chemical step to promote selection of 3' splice sites distal to a branch point and thereby discriminate against proximal, suboptimal 3' splice site. Lastly, the authors show by cyroEM that Fyv6 physically interacts with the RNA helicase Prp22 and by genetics Fyv6 functionally interacts with this factor, implicating Fyv6 in 3'SS proofreading and mRNA release from the spliceosome. The evidence for this study is robust, with the inclusion of genomics, reporter assays, genetics, and cyroEM. Further, the data overall justify the conclusions, which will be of broad interest.

      Strengths:

      (1) The resolution of the cryoEM structure of Fyv6-bound spliceosomes at the second chemical step of splicing is exceptional (2.3 Angstroms at the catalytic core; 3.0-3.7 Angstroms at the periphery), providing the best view of this spliceosomal intermediate in particular and the core of the spliceosome in general.

      (2) The authors observe by cryoEM three distinct states of this spliceosome, each distinguished from the next by progressive loss of protein factors and/or RNA residues. The authors appropriately refrain from overinterpreting these states as reflecting distinct states in the splicing cycle, as too many cyroEM studies are prone to do, and instead interpret these observations to suggest interdependencies of binding. For example, when Fyv6, Slu7, and Prp18 are not observed, neither are the first and second residues of the intron, which otherwise interact, suggesting an interdependence between 3' splice site docking on the 5' splice site and binding of these second step factors to the spliceosome.

      (3) Conclusions are supported from multiple angles.

      (4) The interaction between Fyv6 and Syf1, revealed by the cyroEM structure, was shown to account for the temperature-sensitive phenotypes of a fyv6 deletion, through a truncation analysis.

      (5) Splicing changes were observed in vivo both by indirect copper reporter assays and directly by RT-PCR.

      (6) Changes observed by RNA-seq are validated by RT-PCR.

      (7) The authors go beyond simply observing a general shift to proximal 3'SS usage in the fyv6 deletion by RNA-seq by experimentally varying branch point to 3' splice site distance experimentally in a reporter and demonstrating in a controlled system that Fyv6 promotes distal 3' splice sites.

      (8) The importance of the Fyv6-Syf1 interaction for 3'SS recognition is demonstrated by truncations of both Fyv6 and of Syf1.

      (9) In general, the study was executed thoroughly and presented clearly.

      We thank the reviewer for their recognition of the strengths of our multi-faceted approach that led to highly supported conclusions.

      Weaknesses:

      (1) Despite the authors restraint in interpreting the three states of the spliceosome observed by cyroEM as sequential intermediates along the splicing pathway, it would be helpful to the general reader to explicitly acknowledge the alternative possibility that the difference states simply reflect decomposition from one intermediate during isolation of the complex (i.e., the loss of protein is an in vitro artifact, if an informative one).

      We thank the reviewer for noticing our restraint in interpreting these structures, and we agree that the scenario described by the reviewer is a possibility. We have now explicitly mentioned this in the Discussion on lines 755-757.

      (2) The authors acknowledge that for prp8 suppressors of the fyv6 deletion, suppression may be indirect, as originally proposed by the Query and Konarska labs - that is, that defects in the second step conformation of the spliceosome can be indirectly suppressed by compensating, destabilizing mutations in the first step spliceosome. Whereas some of the other suppressors of the fyv6 deletion can be interpreted as impacting directly the second step spliceosome (e.g., because the gene product is only present in the second step conformation), it seems that many more suppressors beyond prp8 mutants, especially those corresponding to bulky substitutions, which would more likely destabilize than stabilize, could similarly act indirectly by destabilization of first step conformation. The authors should acknowledge this where appropriate (e.g., for factors like Prp8 that are present in both first and second step conformations).

      We agree that this is also a possibility and have now included this on lines 480-486.

      Reviewer #2 (Public Review):

      In this manuscript, Senn, Lipinski, and colleagues report on the structure and function of the conserved spliceosomal protein Fyv6. Pre-mRNA splicing is a critical gene expression step that occurs in two steps, branching and exon ligation. Fyv6 had been recently identified by the Hoskins' lab as a factor that aids exon ligation (Lipinski et al., 2023), yet the mechanistic basis for Fyv6 function was less clear. Here, the authors combine yeast genetics, transcriptomics, biochemical assays, and structural biology to reveal the function of Fyv6. Specifically, they describe that Fyv6 promotes the usage of distal 3'SSs by stabilizing a network of interactions that include the RNA helicase PRP22 and the spliceosome subunit SYF1. They discuss a generalizible mechanism for splice site proofreading by spliceosomsal RNA helicases that could be modulated by other, regulatory splicing factors.

      This is a very high quality study, which expertly combines various approaches to provide new insights into the regulation of 3'SS choice, docking, and undocking. The cryo-EM data is also of excellent quality, which substantially extends on previous yeast P complex structures. This is also supported by the authors use of the latest data analysis tools (Relion-5, AlphaFold2 multimer predictions, Modelangelo). The authors re-evaluate published EM densities of yeast spliceosome complexes (B*, C,C*,P) for the presence or absence of Fyv6, substantiate Fyv6 as a 2nd step specific factor, confirm it as the homolog of the human protein FAM192A, and provide a model for how Fyv6 may fit into the splicing pathway. The biochemical experiments on probing the splicing effects of BP to 3'SS distances after Fyv6 KO, genetic experiments to probe Fyv6 and Syf1 domains, and the suppressor screening add substantially to the study and are well executed. The manuscript is clearly written and we particularly appreciated the nuanced discussions, for example for an alternative model by which Prp22 influences 3'SS undocking. The research findings will be of great interest to the pre-mRNA splicing community.

      We thank the reviewer for their positive comments on our manuscript.

      We have only few comments to improve an already strong manuscript.

      Comments:

      (1) Can the authors comment on how they justify K+ ion positions in their models (e.g. the K+ ion bridging G-1 and G+1 nucleotides)? How do they discriminate e.g. in the 'G-1 and G+1' case K+ from water?

      The assignment of K+ at this position is justified by both longer coordination distances and relatively high cryo-EM density compared to structured water molecules in the same vicinity. We have added a panel to figure3-figure supplement 4C to show the density for the G-1/G+1 bridging K+ ion and to show the adjacent density for putative water molecules which coordinate the ion. The K+ ion density is larger and has stronger signal than the adjacent water molecules. The coordination distances are also longer than would be expected for a Mg2+. For these reasons and because K+ was present in the purification buffer, we modelled the density as K+.

      (2) The authors comment on Yju2 and Fyv6 assignments in all yeast structures except for the ILS. Can the authors comment on if they have also looked into the assignment of Yju2 in the yeast ILS structure in the same manner? While it is possible that Fyv6 could dissociate and Yju2 reassociate at the P to ILS transition, this would merit a closer look given that in the yeast P complex Yju2 had been misassigned previously.

      We thank the reviewer for pointing out this very interesting topic! We have used ModelAngelo to analyze the S. cerevisiae ILS structure for support of density assignment as Yju2 (and not Fyv6). This analysis supports the assignment as Yju2 in this structure and we have no evidence to doubt its presence in those particular purified spliceosomes. We have updated Figure 4- figure supplement 1B accordingly.

      That being said, we do think that this issue should be studied more carefully in the future. The S. cerevisiae ILS structure (5Y88) was determined by purifying spliceosome complexes with a TAP-tag on Yju2. So the conclusion that Yju2 is part of the ILS spliceosome involves some circular logic: Yju2 is part of ILS spliceosome complexes because it is present in ILS complexes purified with Yju2. We also note that Yju2 was absent in ILS complexes recently determined from metazoans by the Plaschka group.  We have added some additional nuance to the Discussion to raise this important mechanistic point at lines 711-718.

      (3) For accessibility to a general reader, figures 1c, d, e, 2a, b, would benefit from additional headings or labels, to immediately convey what is being displayed. It is also not clear to us if Fig 1e might fit better in the supplement and be instead replaced by Supplementary Figure 1a (wt) , b (delta upf1), and a new c (delta fyv6) and new d (delta upf1, delta fyv6). This may allow the reader to better follow the rationale of the authors' use of the Fyv6/Upf1 double deletion.

      We thank the reviewer for the suggestion and have updated Figures 1 C-E to include additional information in the headings and labels. We have not changed the labels in Figures 2A, B but have added additional clarifying language to the legend.

      In terms of rearranging the figures, we thank the reviewer for the suggestion but have decided that the figures are best left in their current ordering.

      (4) The authors carefully interpret the various suppressor mutants, yet to a general reader the authors may wish to focus this section on only the most critical mutants for a better flow of the text.

      We thank the reviewer for this suggestion. While this section of the manuscript does contain (to quote Reviewer #3) “extensive new information regarding functional interactions”, it was a bit long. We have reduced this section of the manuscript by ~200 words for a more focused presentation for general readers.

      Reviewer #3 (Public Review):

      In this manuscript the authors expand their initial identification of Fyv6 as a protein involved in the second step of pre-mRNA splicing to investigate the transcriptome-wide impact of Fyv6 on splicing and gain a deeper understanding of the mechanism of Fyv6 action.

      They first use deep sequencing of transcripts in cells depleted of Fyv6 together with Upf1 (to limit loss of mis-spliced transcripts) to identify broad changes in the transcriptome due to loss of Fyv6. This includes both changes in overall gene expression, that are not deeply discussed, as well as alterations in choice of 3' splice sites - which is the focus of the rest of the manuscript

      They next provide the highest resolution structure of the post-catalytic spliceosome to date; providing unparalleled insight into details of the active site and peripheral components that haven't been well characterized previously.

      Using this structure they identify functionally critical interactions of Fyv6 with Syf1 but not Prp22, Prp8 and Slu7. Finally, a suppressor screen additionally provides extensive new information regarding functional interactions between these second step factors.

      Overall this manuscript reports new and essential information regarding molecular interactions within the spliceosome that determine the use of the 3' splice site. It would be helpful, especially to the non-expert, to summarize these in a table, figure or schematic in the discussion.

      We thank the reviewer for the positive comments and suggestions. We did include a summary figure in panel 7H. However, it was a bit buried. To highlight the summary figure more clearly, we have moved panel 7H to its own figure (Fig. 8).

      Recommendations for the authors:

      Reviewer #1 (Recommendations For The Authors):

      (1) The resolution of some panels is poor, nearly illegible (e.g., Supp Fig 1A, B).

      The resolution of panels in supplemental figure 1 has been increased. However, this may be an artifact of the PDF conversion process. We will pay attention to this during the publication process.

      (2) Panel S6B: 6HYU is a structure of DHX8, not DDX8

      We have corrected DDX8 to DHX8 in Supplemental Fig. S6D and associated figure legend.

      (3) The result that Syf1 truncations can suppress the Fyv6 deletion is impressive. The subsequent discussion seems muddled. A discussion of Fyv6 binding at the first step, instead of Yju2, doesn't seem relevant here (though worthy of consideration in the discussion), given that the starting mutation is the Fyv6 deletion. Further, conjuring rebinding of Yju2 based on the data in the paper seems unnecessarily speculative (assumes that biochemical state III is on pathway), unless I am unaware of some other evidence for such rebinding. Instead, a simpler explanation would seem to be that in the absence of Fyv6, Syf1 inappropriately binds Yju2 instead at the second step and that deletion of the common Fyv6/Yju2 binding site on Syf1 suppresses this defect. In this case, the ts phenotype of the Fyv6 deletion would result from inappropriate binding of Yju2, and the splicing defect would be due to loss of Fyv6 activity. Alternatively, especially considering the work of the labs of Query and Konarska, the authors should consider the possibility that i) the Fyv6 deletion destabilizes the second step conformation, shifting an equilibrium to the first step conformation, and that ii) the Syf1 truncation destabilizes binding of Yju2, thereby restoring the equilibrium. In this case the ts phenotype of the Fyv6 deletion is due to a disturbed equilibrium and the splicing defect is due to the failure of Fyv6 to function at the second step.

      We believe the reviewer is specifically referencing the final paragraph of this Results section (the paragraph that comes just before the section “Mutations in many different splicing factors…”). In retrospect, we agree that our discussion was convoluted. In particular, we emphasized rebinding of Yju2 based on its presence in the cryo-EM structure of the yeast ILS complex. However, given some uncertainties about whether or not Yju2 is a bona fide ILS component (as discussed above). We don’t think it is appropriate to over-emphasize rebinding of Yju2 and have decided to incorporate the elegant mechanisms proposed by the reviewer. This paragraph has now been edited accordingly (lines 386-395).

      (4) The authors imply they have performed biochemical studies, which I think is misleading. Of course, RT-PCR and primer extension assays for example are performed in vitro, but these are an analysis of RNA events that occurred in vivo. In my view a higher threshold should be used for defining "biochemistry". To me "biochemistry" would imply that the authors have, for example, investigated 3' splice site usage in splicing extracts of the fyv6 deletion or engaged in an analysis of the Syf1-Fyv6 interaction involving the expression of the interacting domains in bacteria followed by a binding analysis in the test tube.

      We disagree with the reviewer on this point. Biochemistry is defined as the “branch of sciences concerned with the chemical substances, reactions, and physico chemical processes which occur within living organisms; biological or physical chemistry.” (Oxford English Dictionary). Biochemical studies are not defined by whether or not they take place in vitro, in vivo, or even in silico. Indeed, much of the history of biochemistry (especially in studies of metabolism, for example) involved experiments occurring in vivo that reported on the molecular properties and mechanisms of biological processes. We think many of our experiments fall into this category including our structure/function analysis of splicing factors and the use of the ACT1-CUP1 reporter substrate.

      (5) The monovalents are shown; inositol phosphate is shown; is the binding of Prp22 to RNA shown?

      We have added a panel to Figure 3-figure supplement 4D showing density for the 3' exon within Prp22.

      (6) The authors invoke undocking of the 3'SS in the P complex. Where is the 3'SS in the ILS? The author's model predicts: undocked.

      In all ILS structures to date, the 3′ SS is undocked, in agreement with this prediction. We have now noted this observation in line 760.

      (7) Would be helpful to show fyv6 deletion in Fig 1b.

      We have included growth data for an additional fyv6 deletion strain (in a cup1Δ background) in Figure 1b. The results are quite similar to the upf1_Δ_ background except with slightly worse growth at 23°C.

      Reviewer #2 (Recommendations For The Authors):

      Minor comments

      (1) Fig.3b is the arrow indicating the right rotation?

      This typo has been fixed.

      (2) Fig.4b, panel H is annotated, which should read 'F'.

      This typo has been fixed.

      (3) Line 178: "Finally, we analyzed the sequence features of the alternative 3ʹ SS activated by loss of Fyv6." We would suggest 'used after' instead of 'activated by'.

      We have replaced ‘activated by’ with ‘with increased use after’.

      (4) In Line 544, the authors speculate on a Slu7 requirement for 3'SS docking and on 3'SS docking maintenance. In the results section (Line 265) they however only mention the latter possibility. These statements should be consistent.

      We thank the reviewer for pointing this out. We have added a reference to docking maintenance to the results section at line 325.

      (5) Line 476: "Unexpectedly, Prp22 I1133R was actually deleterious when Fyv6 was present for this reporter." We suggest removing "actually".

      We have removed ‘actually’.

      (6) The authors describe the observed changes in splicing events in absolute numbers (e.g. in Fig 1c). To better assess for the reader whether these numbers reflect large or small effects of Fyv6 in defining mRNA isoforms, it would be more useful to state these as percent changes of total events or to provide a reference number for how many introns are spliced in S.c. See for example the statements in Lines 132 and 145.

      We have added a percentage at line 138 that indicates ~20% of introns in yeast showed splicing changes.

      Reviewer #3 (Recommendations For The Authors):

      Do the authors have a proposed explanation for the observed DGE in non-intron containing genes in the Fyv6 depleted cells?

      The simplest explanation is that this is an indirect effect due to splicing changes occurring in other genes (such as transcription factors, ribosomal protein genes, etc..). It is possible that this can be further dissected in the future using shorter-term knockdown of Fyv6 using Anchors Away or AID-tagging. However, that is beyond the scope of the current manuscript, and we do not wish to comment on these non-intron containing genes further at present.

      Figure 2A - What is going on with the events that show no FAnS value under one condition (i.e. are up against the X or Y axis)? These are of interest as most on the Y- axis are blue.

      The events along one of the axes denote alternative splice sites that are only detected under one condition (either when Fyv6 is present or when it is absent). At this stage, we do not wish to interpret these events further since most have a relatively low number of reads overall.

    1. eLife Assessment

      This study reports single-cell RNA sequencing results of lung adenocarcinoma, comparing 4 treatment-naive and 5 post-neoadjuvant chemotherapy tumor samples. Of interest is the delineation of two macrophage subtypes: Anti-mac cells (CD45+CD11b+CD86+) and Pro-mac cells (CD45+CD11b+ARG+), with the proportion of Pro-mac/pro-tumorigenic cells significantly increasing in LUAD tissues after neoadjuvant chemotherapy. In terms of significance, the findings might be useful. However issues remain after the revision with lengthy descriptive clustering type analysis, insufficient statistical support, and inefficient figure presentation. As it stands, the level of supportive evidence is inadequate.

    2. Reviewer #1 (Public review):

      Summary:

      This study reports single-cell RNA sequencing results of lung adenocarcinoma, comparing 4 treatment-naive and 5 post-neoadjuvant chemotherapy tumor samples.<br /> The authors claim that there are metabolic reprogramming in tumor cells as well as stromal and immune cells after chemotherapy.<br /> The most significant findings are in the macrophages that there are more pro-tumorigenic cells after chemotherapy, i.e. CD45+CD11b+ARG+ cells. In the treatment-naive samples, more anti-tumorigenic CD45+CD11b+CD86+ macrophages are found. They sorted each population and performed functional analyses.

      Strengths:

      Comparison of the treatment-naive and post-chemotherapy samples of lung adenocarcinoma.

      Weaknesses:

      After the revision, issues remain with lengthy descriptive clustering type analysis, insufficient statistical support, and inefficient figure presentation.

    3. Author response:

      The following is the authors’ response to the original reviews.

      Public Reviews:

      Reviewer #1 (Public Review):

      Summary:

      This study reports single-cell RNA sequencing results of lung adenocarcinoma, comparing 4 treatment-naive and 5 post-neoadjuvant chemotherapy tumor samples.<br /> The authors claim that there are metabolic reprogramming in tumor cells as well as stromal and immune cells after chemotherapy.

      The most significant findings are in the macrophages that there are more pro-tumorigenic cells after chemotherapy, i.e. CD45+CD11b+ARG+ cells. In the treatment-naive samples, more anti-tumorigenic CD45+CD11b+CD86+ macrophages are found. They sorted each population and performed functional analyses.

      Strengths:

      Comparison of the treatment-naive and post-chemotherapy samples of lung adenocarcinoma.

      Weaknesses:

      (1) Lengthy descriptive clustering analysis, with indistinct direct comparisons between the treatment-naive and the post-chemotherapy samples.

      Thank you for your detailed review and valuable feedback. We have simplified the descriptive clustering analysis by removing redundant parts and retaining only the key content relevant to our findings. This should help readers to more easily grasp and focus on the main results.

      (2) No statistical analysis was performed for the comparison.

      We appreciate your constructive feedback and are committed to improving our research methodology and reporting to enhance the scientific rigor of our studies.

      (3) Difficult to match data to the text.

      Thank you for your feedback. We understand that there were difficulties in matching the data to the text. We have reviewed the manuscript carefully to ensure that all data points are clearly linked to the corresponding sections in the text.

      (4) ARG1 is a cytosolic enzyme that can be detected by intracellular staining after fixation. It is unclear how the staining and sorting was performed to measure function of sorted cells.

      We apologize for the error caused by miscommunication within our research team. We are currently using both ARG1 and CD206 antibodies in our studies. Due to a communication error, the technician mistakenly assumed ARG1 was another name for CD206 (MRC1), resulting in the incorrect labeling of CD206 as ARG1 in our experimental records. In reality, we used the CD206 antibody, which is consistent with the same surface marker shown in figure 6e. We have made corrections in the manuscript and experimental figures. Thank you for pointing this out, and we regret any misunderstanding this may have caused.

      Reviewer #2 (Public Review):

      In this study, Huang et al. performed a scRNA-seq analysis of lung adenocarcinoma (LUAD) specimens from 9 human patients, including 5 who received neoadjuvant chemotherapy (NCT), and 4 without treatment (control). The new data was produced using 10 × Genomics technology and comprises 83622 cells, of which 50055 and 33567 cells were derived from the NCT and control groups, respectively. Data was processed via R Seurat package, and various downstream analyses were conducted, including CNV, GSVA, functional enrichment, cell-cell interaction, and pseudotime trajectory analyses. Additionally, the authors performed several experiments for in vitro and in vivo validation of their findings, such as immunohistochemistry, immunofluorescence, flow cytometry, and animal experiments.

      The study extensively discusses the heterogeneity of cell populations in LUAD, comparing the samples with and without chemotherapy. However, there are several shortcomings that diminish the quality of this paper:

      • The number of cells included in the dataset is limited, and the number of patients from different groups is low, which may reduce the attractiveness of the dataset for other researchers to reuse. Additionally, there is no metadata on patients' clinical characteristics, such as age, sex, history of smoking, etc., which would be valuable for future studies.

      Thank you for your insightful feedback. We recognize that the limited number of cells and the small number of patients from different groups in our dataset may affect its appeal for reuse by other researchers. Additionally, we acknowledge the absence of metadata on patients' clinical characteristics, such as age, sex, and smoking history, which would indeed be valuable for future studies. We have compiled statistics on the patient's metadata and other information in the Supplementary Table 2.

      We appreciate your suggestions and will consider incorporating these aspects in future research to enhance the dataset's utility and attractiveness.

      • Several crucial details about the data analysis are missing: How many PCs were used for reduction? Which versions of Seurat/inferCNV/other packages were used? Why monocle2 was used and not monocle3 or other packages? Also, the authors use R version 3.6.1, and the current version is 4.3.2.

      Thank you for your detailed review and valuable suggestions. Below are our responses to the points you raised:

      Principal Components (PCs) Used for Reduction: We used the first 20 principal components (PCs) for dimensionality reduction. This choice was based on preliminary tests showing that 20 PCs captured the major variation in our data effectively.

      Versions of Packages: The versions of the packages used are as follows:

      Seurat: Version 4.0.1

      inferCNV: Version 1.18.1

      monocle2: Version 2.14.0

      Choice of monocle2 over monocle3 or Other Packages: We chose monocle2 because it performed better on our specific dataset, and its algorithms suited our research needs. Additionally, we are more familiar with the functionalities and outputs of monocle2, which allowed us to better interpret and apply the results.

      R Version: We used R version 3.6.1 at the beginning of our study to ensure consistency and reproducibility throughout the analysis. Although the current version of R is 4.3.2, we maintained the same version throughout our research. We will consider upgrading to the latest version of R and re-testing for compatibility and performance in future studies.

      We appreciate your attention to these details and will include this information in the revised manuscript.

      • It seems that the authors may lack a fundamental understanding of scRNA-seq data processing and the functions of Seurat. For instance, they state, 'Next, we classified cell types through dimensional reduction and unsupervised clustering via the Seurat package.' However, dimensional reduction and unsupervised clustering are not methods for cell classification. Typically, cell types are classified using marker genes or other established methods.

      Thank you for your insightful comments. We appreciate your guidance on the proper understanding and application of scRNA-seq data processing and the functions of Seurat.

      You are correct in noting that dimensional reduction and unsupervised clustering are not methods for cell classification. We apologize for the confusion in our original statement. What we intended to convey was that we performed dimensional reduction and unsupervised clustering using the Seurat package as preliminary steps in our analysis. Following these steps, we classified cell types based on established marker genes.

      "Therefore, to identify subclusters within each of these nine major cell types, we performed principal component analysis" (Line 127). Principal component analysis is a method for dimensionality reduction, not cell clustering.

      The authors did not mention the normalization or scaling of the data, which are crucial steps in scRNA-seq data preprocessing.

      Thank you for your insightful comments. We apologize for any confusion caused by our description in the manuscript. You are correct that principal component analysis (PCA) is primarily a method for dimensionality reduction rather than cell clustering. To clarify, we used PCA to reduce the dimensionality of our single-cell RNA-seq (scRNA-seq) data, which is a preliminary step before clustering the cells.

      In the revised manuscript, we have provided a more detailed description of our data preprocessing pipeline, including the normalization and scaling steps that are indeed crucial for scRNA-seq data analysis. Specifically, we performed the following steps:

      Normalization: We normalized the gene expression data to account for differences in sequencing depth and other technical variations.

      Scaling: We scaled the normalized data to ensure that each gene contributes equally to the PCA, which mitigates the effect of highly variable genes dominating the analysis.

      Following these preprocessing steps, we conducted PCA to reduce the dimensionality of the data, which facilitated the subsequent clustering of cells into subclusters.

      We hope this addresses your concerns, and we appreciate your valuable feedback that helped us improve the clarity and accuracy of our manuscript.

      • Numerous style and grammar mistakes are present in the main text. For instance, certain sections of the methods are written in the present tense, suggesting that parts of a protocol were copied without text editing. Furthermore, some sections of the introduction are written in the past tense when the present tense would be more suitable. Clusters are inconsistently referred to by numbers or cell types, leading to confusion. Additionally, the authors frequently use the term "evolution" when describing trajectory analysis, which may not be appropriate. Overall, significant revisions to the main text are required.

      Thank you for your detailed review and valuable feedback on our manuscript. We highly appreciate your suggestions and have made the following revisions to address the issues you pointed out:

      Tense Consistency: We have thoroughly reviewed and corrected the use of tenses throughout the manuscript. The Methods section now consistently uses the past tense, while the Introduction section uses the present tense where appropriate, ensuring coherence and consistency.

      Cluster Naming Consistency: We have standardized the naming conventions for clusters, consistently using either numbers or cell types to avoid any confusion.

      Appropriate Terminology: We have reviewed our use of the term "evolution" in the context of trajectory analysis. Where necessary, we have replaced it with more accurate terms such as "trajectory progression" or "developmental pathway" to better convey the intended meaning.

      • Some figures are not mentioned in order or are not referenced in the text at all, such as Figure 5l (where it is also unclear how the authors selected the root cells). Additionally, many figures have text that is too small to be read without zooming in. Overall, the quality of the figures is inconsistent and sometimes very poor.

      Thank you for your detailed review and valuable feedback on our manuscript. We have addressed the issues you raised as follows:

      Unreferenced Figures in the Text:

      We acknowledge the oversight regarding Figure 5l not being mentioned in the text. In the revised version, we will ensure that all figures are properly referenced and discussed within the relevant sections of the manuscript.

      Text Size in Figures:

      We understand the difficulty in reading small text within the figures. We will redesign all figures to ensure that text and annotations are legible at normal viewing sizes. This will involve increasing the resolution and text size in all figures to enhance readability.

      Inconsistent Quality of Figures:

      To address the inconsistency in figure quality, we will standardize the formatting of all figures and ensure they meet a high standard of clarity and presentation. This will improve the overall visual quality and professionalism of the manuscript.

      The results section lacks clarity on several points:<br /> • The authors state that "myofibroblasts exclusively originated from the control group". However, pathways up-regulated in myofibroblasts (such as glycolysis) were enhanced after chemotherapy, as indicated by GSVA score. Similarly, why are some clusters of TAMs from the control group associated with pathways enriched in chemotherapy group?

      Thank you for your insightful comments and questions regarding our manuscript. We appreciate the opportunity to clarify these points.

      Regarding the statement that "myofibroblasts exclusively originated from the control group," we acknowledge the confusion and would like to provide a more detailed explanation. While the initial identification indicated that myofibroblasts were predominantly found in the control group, subsequent analyses, including the Gene Set Variation Analysis (GSVA), revealed that certain pathways up-regulated in myofibroblasts, such as glycolysis, were indeed enhanced following chemotherapy. This suggests that chemotherapy may induce or enhance specific functional states in these cells that are not initially apparent from their origin alone.

      Similarly, the observation that some clusters of Tumor-Associated Macrophages (TAMs) from the control group are associated with pathways enriched in the chemotherapy group can be explained by the dynamic nature of cellular responses to treatment. TAMs, like other immune cells, can exhibit plasticity and adapt to the tumor microenvironment altered by chemotherapy. This plasticity may result in the activation of pathways typically associated with a chemotherapy response, even in cells originating from the control group.

      We will revise the manuscript to better articulate these findings and include additional data to support our explanations. This will help clarify the observed discrepancies and provide a more comprehensive understanding of the cellular dynamics in response to chemotherapy.

      • Further explanation is necessary regarding the distinctions between malignant and non-malignant cells, as well as regarding the upregulation of metabolism-related pathways in fibroblasts from the NCT group. Additionally, clarification is needed regarding why certain TAMs from the control group are associated with pathways enriched in the chemotherapy group.

      Thank you for your detailed review and for highlighting the areas that require further clarification. We appreciate the opportunity to provide additional explanations and improve our manuscript.

      We recognize the need to more clearly differentiate between malignant and non-malignant cells in our manuscript. We will include additional details on the criteria and markers used to distinguish these cell types. Specifically, we will elaborate on the molecular and phenotypic characteristics that were used to identify malignant cells, such as specific genetic mutations, aberrant signaling pathways, and distinct cell surface markers, as opposed to those used for identifying non-malignant cells.

      As mentioned above, the association of certain TAMs from the control group with pathways enriched in the chemotherapy group can be attributed to the inherent plasticity and adaptability of TAMs. We will provide a more detailed explanation of how TAMs can exhibit different functional states based on microenvironmental cues. This will include a discussion on the potential pre-existing heterogeneity within TAM populations and how even in the absence of direct chemotherapy exposure, some TAMs may display pathway activities similar to those seen in the chemotherapy group due to microenvironmental influences or intrinsic properties.

      • In the section titled 'Chemo-driven Pro-mac and Anti-mac Metabolic Reprogramming Exerted Diametrically Opposite Effects on Tumor Cells': The markers selected to characterize the anti- and pro-macrophages are commonly employed for describing M1 or M2 polarization. It is uncertain whether this new classification into anti- and pro-macrophages is necessary. Additionally, it should be noted that pro-macrophages are anti-inflammatory, while anti-macrophages are pro-inflammatory, which could lead to confusion. M2 macrophages are already recognized for their role in stimulating tumor relapse after chemotherapy.

      Thank you for your feedback. We appreciate the opportunity to clarify the rationale behind our terminology and the focus on functional phenotypic changes in macrophages before and after chemotherapy.

      Our intention in introducing the terms "pro-macrophages" and "anti-macrophages" was to highlight the distinct functional phenotypic changes in macrophages observed before and after chemotherapy. These terms were chosen to emphasize the functional roles these macrophages play in the tumor microenvironment in response to chemotherapy, rather than strictly adhering to the conventional M1/M2 polarization paradigm.

      We acknowledge that M2 macrophages are well-documented in stimulating tumor relapse after chemotherapy. Our use of "pro-macrophages" is intended to build on this established knowledge by providing a more nuanced understanding of their role in the post-chemotherapy tumor microenvironment. Similarly, "anti-macrophages" highlight the macrophages' role in mounting an anti-tumor response.

      • The authors suggest that there is "reprogramming of CD8+ cytotoxic cells" following chemotherapy (Line 409). It remains unclear whether they imply the reprogramming of other CD8+ T cells into cytotoxic cells. While it is indicated that cytotoxic cells from the control group differ from those in the NCT group and that NCT cytotoxic T cells exhibit higher cytotoxicity, the authors did not assess the expression of NK and NK-like T cell markers (aside from NKG7), which may possess greater cytotoxic potential than CD8+ cytotoxic cells. This could also elucidate why cytotoxic cells from the NCT and control groups are positioned on separate branches in trajectory analysis. Overall, with 22.5k T cells in the dataset, only 3 subtypes were identified, suggesting a need for improved cell annotations by the authors.

      Thank you for your valuable feedback regarding the classification and characterization of CD8+ cytotoxic cells following chemotherapy, and the need for improved cell annotations.

      We appreciate your point on the potential ambiguity around the "reprogramming of CD8+ cytotoxic cells" post-chemotherapy. In our study, we observed that CD8+ T cells from the control and NCT groups differ significantly in their cytotoxic profiles, with the NCT group's cytotoxic T cells displaying enhanced cytotoxicity. However, we did not imply the reprogramming of other CD8+ T cells into cytotoxic cells. Instead, our findings suggest a shift in the functional state of existing CD8+ cytotoxic cells, driven by chemotherapy, which aligns with the upregulation of genes associated with cytotoxic functions.

      We acknowledge that the expression of NK and NK-like T cell markers (apart from NKG7) was not comprehensively assessed. We agree that these markers may possess greater cytotoxic potential and could elucidate the separation observed in the trajectory analysis between cytotoxic cells from the NCT and control groups. This distinction may be attributed to differential cytotoxic potentials and functional states induced by chemotherapy.

      Furthermore, with 22,530 T cells in the dataset, only three subtypes were initially identified. We recognize the need for more refined cell annotations to capture the full spectrum of T cell diversity. This could involve a deeper analysis of additional markers to distinguish between various cytotoxic populations, including NK and NK-like T cells, and their respective roles in the tumor microenvironment post-chemotherapy.

      Recommendations for the authors:

      Reviewer #1 (Recommendations For The Authors):

      I would recommend simplifying the manuscript and focusing on the differences between the treatment-naive and post-chemotherapy samples.

      Thank you for your valuable feedback on our manuscript. We greatly appreciate your suggestions and have carefully considered the proposed modifications.

      Upon re-evaluating our manuscript, we believe that the current structure and content most effectively convey our research findings. Our study aims to not only compare the treatment-naive and post-chemotherapy samples but also to highlight several important secondary findings that are integral to the overall research.

      Nevertheless, we understand your recommendation to simplify the manuscript. To address this, we have made some subtle adjustments to improve the readability and conciseness of the text. Additionally, we have included a section in the discussion that more explicitly highlights the differences between the treatment-naive and post-chemotherapy samples.

      IRB number for the human sample collection as well as animal experiments need to be provided.

      Thank you for your thorough review and for highlighting the need for the inclusion of the IRB number for the human sample collection and animal experiments.

      We apologize for this oversight and appreciate your attention to this important detail. The Institutional Review Board (IRB) approval number for the human sample collection is [B2019-436].

      This number has been added to the Methods section of our revised manuscript to ensure compliance with ethical standards and to provide transparency for our research.

      I put a question on the macrophage sorting experiment in the public review. Please clarify how the ARG1 staining was achieved with the preservation of cell viability.

      We apologize for the error caused by miscommunication within our research team. We are currently using both ARG1 and CD206 antibodies in our studies. Due to a communication error, the technician mistakenly assumed ARG1 was another name for CD206 (MRC1), resulting in the incorrect labeling of CD206 as ARG1 in our 0experimental records. In reality, we used the CD206 antibody, which is consistent with the same surface marker shown in figure 6e. We have made corrections in the manuscript and experimental figures. Thank you for pointing this out, and we regret any misunderstanding this may have caused.

      Reviewer #2 (Recommendations For The Authors):

      Minor comments:

      • Line 65- "Chemotherapy drugs, however, are very toxic and are prone to invalid". Line 75-77: "This heterogeneity in the TME includes the differences between tumor cells and tumor cells and the differences between various stromal cells and immune cells. Actively exploring the changes of multiple cells in the TME of LUAD after chemotherapy may finally find an excellent way to overcome chemotherapy resistance for LUAD." Please rewrite these parts.

      Thank you for your valuable comment. We have revised the manuscript according to your suggestion:

      Original (Line 65): "Chemotherapy drugs, however, are very toxic and are prone to invalid." Revised: "However, chemotherapy drugs are highly toxic and can often become ineffective."

      Original (Line 75-77): "This heterogeneity in the TME includes the differences between tumor cells and tumor cells and the differences between various stromal cells and immune cells. Actively exploring the changes of multiple cells in the TME of LUAD after chemotherapy may finally find an excellent way to overcome chemotherapy resistance for LUAD."

      Revised: "The heterogeneity within the tumor microenvironment (TME) encompasses not only the variations between different tumor cells but also among various stromal and immune cell types. Investigating the dynamic changes in multiple cell populations within the TME of LUAD following chemotherapy may provide crucial insights into overcoming chemotherapy resistance in LUAD."

      • Line 87: "The internal processes of the cells respectively drive immune cells and cancer cells to obtain glucose and glutamine preferentially."-> The internal metabolic changes in the cells drive...

      Thank you for your valuable comment. We have revised the manuscript according to your suggestion:

      Original (Line 87): "The internal processes of the cells respectively drive immune cells and cancer cells to obtain glucose and glutamine preferentially."

      Revised: "The internal metabolic changes in the cells drive immune cells and cancer cells to preferentially obtain glucose and glutamine."

      • Line 93: "an essential feature that affects the effect of chemotherapy"-> an essential feature that affects chemotherapy.

      Thank you for your valuable comment. We have revised the manuscript according to your suggestion:

      Original (Line 93): "Metabolic reprogramming in various cell types in the tumor microenvironment after undergoing chemotherapy may be an essential feature that affects the effect of chemotherapy."

      Revised: "Metabolic reprogramming in various cell types in the tumor microenvironment after undergoing chemotherapy may be an essential feature that affects chemotherapy."

      • Line 84: What do the immune cells depend on glucose for?

      Thank you for your valuable comment. We have revised the manuscript according to your suggestion:

      Original (Line 84): "However, recent studies have shown that tumor-infiltrating immune cells depend on glucose and immune cells especially macrophages consume more glucose than malignant cells."

      Revised: "However, recent studies have shown that tumor-infiltrating immune cells rely on glucose for their energy needs and functionality, with immune cells, particularly macrophages, consuming more glucose than malignant cells."

      • Line 223: "According to previous research, myofibroblast has been described"-> myofibroblasts have been described.

      Thank you for your valuable comment. We have revised the manuscript according to your suggestion:

      Original (Line 223): "According to previous research, myofibroblast has been described as a cancer-associated fibroblast that participated in extensive tissue remodeling, angiogenesis, and tumor progression."

      Revised: "According to previous research, myofibroblasts have been described as cancer-associated fibroblasts that participate in extensive tissue remodeling, angiogenesis, and tumor progression."

      • Line 239: "Considering the essential fibroblasts"-> Considering the essential role of fibroblasts.

      Thank you for your valuable comment. We have revised the manuscript according to your suggestion:

      Original (Line 239): "Considering the essential fibroblasts and their complicated function in shaping the tumor microenvironment..."

      Revised: "Considering the essential role of fibroblasts and their complicated function in shaping the tumor microenvironment..."

      • Line 251: "Further in vitro studies were required to elucidate these notable fibroblasts' potential function..." -> are required.

      Thank you for your valuable comments. We have revised the manuscript according to your suggestions:

      Original (Line 251): "Further in vitro studies were required to elucidate these notable fibroblasts' potential function..."

      Revised: "Further in vitro studies are required to elucidate these notable fibroblasts' potential function..."

      • Line 309: "Interestingly, we found that two subtypes, Anti-mac and Mix, can be converted to Pro-mac through pseudotime time analysis." -> via trajectory analysis we found that two subtypes...

      Thank you for your valuable comments. We have revised the manuscript according to your suggestions:

      Original (Line 309): "Interestingly, we found that two subtypes, Anti-mac and Mix, can be converted to Pro-mac through pseudotime time analysis."

      Revised: "Interestingly, via trajectory analysis we found that two subtypes, Anti-mac and Mix, can be converted to Pro-mac."

      • Line 458: "the interactions between malignant and macrophages"-> the interactions between malignant cells and macrophages.

      Thank you for your valuable comments. We have revised the manuscript according to your suggestions:

      Original (Line 458): "the interactions between malignant and macrophages"

      Revised: "the interactions between malignant cells and macrophages."

      • Line 486: "The 5-year survival rate is still gloomy" -> The 5-year survival rate is still low.

      Thank you for your valuable comments. We have revised the manuscript according to your suggestions:

      Original (Line 486): "The 5-year survival rate is still gloomy."

      Revised: "The 5-year survival rate is still low."

      • Line 491: "More and more efforts are devoted to targeted metabolism to overcome chemoresistance" -> More efforts are devoted to target cell metabolism...

      Thank you for your valuable comments. We have revised the manuscript according to your suggestions:

      Original (Line 491): "More and more efforts are devoted to targeted metabolism to overcome chemoresistance."

      Revised: "More efforts are devoted to targeting cell metabolism to overcome chemoresistance."

      • Line 594: "Repeat the above steps twice" -> This procedure was repeated twice.

      Thank you for your valuable comments. We have revised the manuscript according to your suggestions:

      Original (Line 594): "Repeat the above steps twice."

      Revised: "This procedure was repeated twice."

      • Line 620: How were the new potential markers verified? List the exact genes and experiments or a reference to a Figure.

      Thank you for your valuable comments. We have provided detailed information on how the new potential markers were verified, including the exact genes involved and the specific experiments conducted. A reference to the relevant Figure has also been added to the manuscript.

      • Line 637: Which immune cells were used as a background in CNV analysis? All immune cells or just T cells?

      Thank you for your valuable comments. In this study, all immune cells were used as background control cells.

      • Line 658: in a single cell

      Thank you for your valuable comments. We have revised the manuscript according to your suggestions.

      • Line 672: "a variety of environmental factors potentially affect" -> potentially affects/ may potentially affect.

      Thank you for your valuable comments. We have revised the manuscript according to your suggestions:

      Original (Line 672): "a variety of environmental factors potentially affect"

      Revised: "A variety of environmental factors may potentially affect"

      • Line 683: Which metabolites were tested?

      The metabolites tested included those related to glycolysis and oxidative phosphorylation (OXPHOS), such as glucose and various metabolites indicative of mitochondrial activity. The contents of these metabolites were analyzed to verify consistency with gene expression levels as mentioned in the analysis of metabolic pathways section.

      • Line 718: Required or acquired?

      The correct term should be "acquired" in the context of discussing drug resistance in tumor cells. The sentence likely refers to the "acquired drug resistance" of tumor cells, which is a common challenge in chemotherapy.

      • Line 726: What are the A549 cells?

      A549 cells are a human lung adenocarcinoma cell line commonly used in cancer research, particularly for studying lung cancer. In this study, A549 cells were used in animal experiments, mixed with tumor-associated macrophages (TAMs), and implanted into nude mice to study tumor formation and progression.

      • Line 631: "we set the following cut-off thresholds to reveal the marker genes of each cluster: adjusted P-value <0.01 and multiple changes >0.5." What metric is "multiple changes"? Commonly used measures are adjuster P-value and average Log2FC.

      Thank you for your valuable comment. We have revised the manuscript according to your suggestion. The term "multiple changes" was indeed a misstatement. The correct metric should be "log2 fold change (Log2FC)," which is a commonly used measure in gene expression studies. We have updated the manuscript to reflect this, using "adjusted P-value <0.01 and average Log2FC > 0.5" instead of "multiple changes > 0.5."

      • Figure 1f: "Samplied" -> Samples. What do the numbers on the left side of each column mean?

      Thank you for your valuable comment. The term "Samplied" was indeed a typographical error and has been corrected to "Samples". The numbers on the left side of each column likely represent cluster IDs or sample identifiers corresponding to the different patient samples or clusters analyzed in the study. We have clearly labeled these numbers in the figure to avoid any confusion.

      • Figure 2b: Please add a scale.

      Thank you for your valuable comment. We agree that adding a scale bar is crucial for accurately interpreting the size of the cells or structures shown in the figure. We have now included an appropriate scale bar during the figure preparation stage to provide this reference.

      • Figure 3d/4c: What is the matrix_27/3 metric? Is it average expression?

      Thank you for your valuable comment. The term "matrix_27/3" refers to a specific metric used in our analysis. This metric indeed represents the average expression levels of genes within a particular subset of the dataset. We will clarify this in the figure legend and the methods section to ensure that readers have a clear understanding of what the metric represents. Additionally, we will make sure that all such metrics are consistently and accurately described throughout the manuscript.

      • Figure 6e: Why CD206 staining is shown instead of ARG if ARG was chosen as the main gene for classification of Pro-macrophages?

      We apologize for the confusion regarding the use of CD206 staining in Figure 6e. This issue arose due to a miscommunication within our research team. While ARG1 was initially intended as the primary marker for Pro-macrophages, the technician mistakenly assumed ARG1 was another name for CD206 (MRC1), leading to the incorrect labeling of CD206 as ARG1 in our experimental records. In actuality, CD206 was used for the staining, which is consistent with the surface marker shown in Figure 6e. We have corrected this error in the manuscript and updated the experimental figures accordingly. We sincerely apologize for any misunderstanding this may have caused and appreciate the reviewer for bringing this to our attention.

      • Figures 6h and k: Please explain why do NCT Anti-macrophages show higher glucose and lactate uptake than the Anti-macrophages from the control group, while the size of tumors is the lowest in NCT Anti-macrophages in vivo?

      Thank you for your insightful comment. The observation that NCT Anti-macrophages exhibit higher glucose and lactate uptake while the tumor size is lowest could be attributed to the metabolic reprogramming induced by chemotherapy. It is possible that the enhanced metabolic activity in Anti-macrophages, characterized by increased glucose and lactate uptake, is linked to a more aggressive anti-tumor response in the NCT group. This heightened metabolic activity could reflect an increased energy demand necessary for sustaining enhanced immune functions, ultimately contributing to the reduction in tumor size. We will expand upon this explanation in the revised manuscript to provide a clearer interpretation of these findings.

      • The supplementary Table 1 needs a better legend/more explanation.

      Thank you for your valuable feedback. We have revised the legend for Supplementary Table 1 to provide a more detailed explanation of its contents.

      • No tSNE plot showing epithelial cells colored by patient, which may be important for observation of cell heterogeneity, especially in the epithelial cell population.

      Thank you for pointing this out. We agree that a tSNE plot showing epithelial cells colored by patient would be valuable for observing cell heterogeneity within the epithelial population.

      • Several acronyms not explained in the text (for example GSVA, NMF).

      Thank you for bringing this to our attention. We have ensured that all acronyms, including GSVA (Gene Set Variation Analysis) and NMF (Non-negative Matrix Factorization), are clearly defined in the text at their first mention.

      • Availability of data and material section: Please describe "other experimental data" in more detail.

      Thank you for your suggestion. We have expanded the "Availability of Data and Material" section to provide a more detailed description of the "other experimental data" referenced. This will include specific types of data generated, their formats, and 10how they can be accessed by other researchers. This clarification will enhance transparency and facilitate the reuse of our data by the research community.

    1. eLife Assessment

      This useful study examined the associations of a healthy lifestyle with comprehensive and organ-specific biological ages defined using common blood biomarkers and body measures. Its large sample size, longitudinal design, and robust statistical analysis provide solid support for the findings, which will be of interest to epidemiologists and clinicians.

    2. Reviewer #1 (Public review):

      Summary:

      This study examined the associations of healthy lifestyles with comprehensive and organ-specific biological ages. It emphasized the importance of lifestyle factors in determining biological ages, which were using common blood biomarkers and body measures.

      Strengths:

      The data were from a large cohort study and defined comprehensive and six-specified BA.

      Weaknesses highlighted previously:

      (1) Since only 8.5% of participants from the CMEC were included in the study, has any section bias happened?

      (2) The author should specify the efficiency of FFQ. How FFQ can genuinely reflect the actual intake? Moreover, how was the aMED calculated in your study?

      (3) HLI (range) and HLI (category) should be clearly defined.

      (4) The rationale of comprehensive and specific BA construction should be clearly defined and discussed. For example, can cardiopulmonary BA be reflected only by using cardiopulmonary status? I do not think so.

      (5) The lifestyle index is defined based on an equal-weight approach, but this does not reflect reality and can not fully answer the research questions it raises.

      Comments on the revised version:

      The author answered most of the questions raised. However, since wine is the most important component of aMED, removing wine or alcohol may result in biased estimates. In addition, The authors acknowledge the limitations of this approach, namely that some biomarkers may not fully capture the complete aging process of the system; this weakness is particularly remarkable in organ-specific BA. The authors emphasize that it is cost-effective and easy to implement. However, the results associated with organ-specific BA may not be credible because they do not fully reflect the state of a particular organ. It is recommended that these shortcomings and the applicability of the results should be discussed in the text.

    3. Author response:

      The following is the authors’ response to the original reviews.

      eLife Assessment

      This useful study examined the associations of a healthy lifestyle with comprehensive and organ-specific biological ages defined using common blood biomarkers and body measures. Its large sample size, longitudinal design, and robust statistical analysis provide solid support for the findings, which will be of interest to epidemiologists and clinicians.

      Thank you very much for your thoughtful review of our manuscript. Your valuable comments have greatly helped us improve our manuscript. We have carefully considered all the comments and suggestions made by the reviewers and have revised them to address each point. Below, we provide detailed responses to each of the reviewers' comments. Please note that the line numbers mentioned in the following responses correspond to the line numbers in the clean version of the manuscript.

      Public Reviews:

      Reviewer #1 (Public Review):

      Summary:

      This study was to examine the associations of a healthy lifestyle with comprehensive and organ-specific biological ages. It emphasized the importance of lifestyle factors in biological ages, which were defined using common blood biomarkers and body measures.

      Strengths:

      The data were from a large cohort study and defined comprehensive and six-specified biological ages.

      Weaknesses:

      (1) Since only 8.5% of participants from the CMEC (China Multi-Ethnic Cohort Study) were included in the study, has any section bias happened?

      Thank you for your valuable question. We understand the concern regarding the potential selection bias due to only 8.5% of participants being included in the study. The baseline survey of China Multi-Ethnic Cohort Study (CMEC) employed a rigorous multi-stage stratified cluster sampling method and the repeat survey reevaluated approximately 10% of baseline participants through community-based cluster random sampling. Therefore, the sample of the repeat survey is representative. The second reason for the loss of sample size was the availability of biomarkers for BA calculation. We have compared characteristic of the overall population, the population included in and excluded from this study. Most characteristics were similar, but participants included in this study showed better in some health-related variables, one potential reason is healthier individuals were more likely to complete the follow-up survey. In conclusion, we believe that the impact of selection bias is limited.

      Author response table 1.

      Baseline characteristics of participants included and not included in the study

      BA, biological age; BMI, body mass index; CVD, cardiovascular disease; HLI, healthy lifestyle indicator.

      1 Data are presented as median (25th, 75th percentile) for continuous variables and count (percentage) for categorical variables.

      2 For HLI, "healthy" corresponds to a score of 4-5.

      3 Information on each validated BA has been reported. BA acceleration is the difference between each BA and CA in the same survey.

      (2) The authors should specify the efficiency of FFQ. How can FFQ genuinely reflect the actual intake? Moreover, how was the aMED calculated?

      Thank you for the comments and questions. We appreciate the opportunity to clarify these aspects of our study. For the first question, we evaluated the FFQ's reproducibility and validity by conducting repeated FFQs and 24-hour dietary recalls at the baseline survey. Intraclass correlation coefficients (ICC) for reproducibility ranged from 0.15 for fresh vegetables to 0.67 for alcohol, while deattenuated Spearman rank correlations for validity ranged from 0.10 for soybean products to 0.66 for rice. More details are provided in our previous study (Lancet Reg Health West Pac, 2021). We have added the corresponding content in both the main text and the supplementary materials.

      Methods, Page 8, lines 145-146: “The FFQ's reproducibility and validity were evaluated by conducting repeated FFQs and 24-hour dietary recalls.”

      Supplementary methods, Dietary assessment: “We evaluated the FFQ's reproducibility and validity by conducting repeated FFQs and 24-hour dietary recalls. Intraclass correlation coefficients for reproducibility ranged from 0.15 for fresh vegetables to 0.67 for alcohol, while deattenuated Spearman rank correlations for validity ranged from 0.10 for soybean products to 0.66 for rice.”

      For the second question, we apologize for any confusion. To avoid taking up too much space in the main text, we decided not to include the detailed aMED calculation (as described in Circulation, 2009) there and instead placed it in the supplementary materials:

      “Our calculated aMED score incorporates eight components: vegetables, legumes, fruits, whole grains, fish, the ratio of monounsaturated fatty acids (MUFA) to saturated fatty acids (SFA), red and processed meats, and alcohol. Each component's consumption was divided into sex-specific quintiles. Scores ranging from 1 to 5 were assigned based on quintile rankings to each component, except for red and processed meats and alcohol, for which the scoring was inverted. The alcohol criteria for the aMED was defined as moderate consumption. Since the healthy lifestyle index (HLI) already contained a drinking component, we removed the drinking item in the aMED, which had a score range of 7-35 with a higher score reflecting better adherence to the overall Mediterranean dietary pattern. We defined individuals with aMED scores ≥ population median as healthy diets.”

      Reference:

      (1) Xiao X, Qin Z, Lv X, Dai Y, Ciren Z, Yangla Y, et al. Dietary patterns and cardiometabolic risks in diverse less-developed ethnic minority regions: results from the China Multi-Ethnic Cohort (CMEC) Study. Lancet Reg Health West Pac. 2021;15:100252. doi: 10.1016/j.lanwpc.2021.100252.

      (2) Fung TT, Rexrode KM, Mantzoros CS, Manson JE, Willett WC, Hu FB. Mediterranean diet and incidence of and mortality from coronary heart disease and stroke in women. Circulation. 2009;119(8):1093-100. doi: 10.1161/circulationaha.108.816736.

      (3) HLI (range) and HLI (category) should be clearly defined.

      Thank you for the comment. We have added the definition of HLI (range) and HLI (category) in the methods section:

      Methods P9 lines 165-170: “The HLI was calculated by directly adding up the five lifestyle scores, ranging from 0-5, with a higher score representing an overall healthier lifestyle, denoted as HLI (range) in the following text. We then transformed HLI into a dichotomous variable in this study, denoted as HLI (category), where a score of 4-5 for HLI was considered a healthy lifestyle, and a score of 0-3 was considered an unfavorable lifestyle that could be improved.”

      (4) The comprehensive rationale and each specific BA construction should be clearly defined and discussed. For example, can cardiopulmonary BA be reflected only by using cardiopulmonary status? I do not think so.

      Thank you for the opportunity to clarify. We constructed the comprehensive BA based on all the available biochemical data from the CMEC study, selecting aging-related markers (J Gerontol A Biol Sci Med Sci, 2021), and further construct organ-specific BAs based on these selected biomarkers. The KDM algorithm does not specify biomarker types but requires them to be correlated with chronological age (CA) (Ageing Dev, 2006). Existing studies typically construct BA based on available biomarker, we included 15 biomarkers in this study, which could be considered comprehensive and extensive compared to previous research (J Transl Med. 2023; J Am Heart Assoc. 2024; Nat Cardiovasc Res. 2024). For how the biomarkers for each organ-specific BAs were selected, we categorized biomarkers primarily based on their relevance to the structure and function of each organ system according to the classification in previous studies (Nat Med, 2023; Cell Rep, 2022). Since the biomarkers we used came from clinical-lab data sets, they were categorized based on the clinical interpretation of blood chemistry tests following the methods outlined in the two referenced papers (Nat Med, 2023; Cell Rep, 2022). We only used biomarkers directly related to each specific system to minimize overlap between the indicators used for different BAs, thereby preserving the distinctiveness of organ-specific BAs. We acknowledge the limitations of this approach that a few biomarkers may not fully capture the complete aging process of a system, and certain indicators may be missing due to data constraints. However, the multi-organ BAs we constructed are cost-effective, easy to implement, and have been validated, making them valuable despite the limitations.

      Reference:

      (1) Verschoor CP, Belsky DW, Ma J, Cohen AA, Griffith LE, Raina P. Comparing Biological Age Estimates Using Domain-Specific Measures From the Canadian Longitudinal Study on Aging. J Gerontol A Biol Sci Med Sci. 2021;76(2):187-94. doi: 10.1093/gerona/glaa151.

      (2) Klemera P, Doubal S. A new approach to the concept and computation of biological age. Mech Ageing Dev. 2006;127(3):240-8. doi: 10.1016/j.mad.2005.10.004

      (3) Zhang R, Wu M, Zhang W, Liu X, Pu J, Wei T, et al. Association between life's essential 8 and biological ageing among US adults. J Transl Med. 2023;21(1):622. doi: 10.1186/s12967-023-04495-8.

      (4) Forrester SN, Baek J, Hou L, Roger V, Kiefe CI. A Comparison of 5 Measures of Accelerated Biological Aging and Their Association With Incident Cardiovascular Disease: The CARDIA Study. J Am Heart Assoc. 2024;13(8):e032847. doi: 10.1161/jaha.123.032847.

      (5) Jiang M, Tian S, Liu S, Wang Y, Guo X, Huang T, Lin X, Belsky DW, Baccarelli AA, Gao X. Accelerated biological aging elevates the risk of cardiometabolic multimorbidity and mortality. Nat Cardiovasc Res. 2024;3(3):332-42. doi: 10.1038/s44161-024-00438-8.

      (6) Tian YE, Cropley V, Maier AB, Lautenschlager NT, Breakspear M, Zalesky A. Heterogeneous aging across multiple organ systems and prediction of chronic disease and mortality. Nat Med. 2023;29(5):1221-31. doi: 10.1038/s41591-023-02296-6.

      (7) Nie C, Li Y, Li R, Yan Y, Zhang D, Li T, et al. Distinct biological ages of organs and systems identified from a multi-omics study. Cell Rep. 2022;38(10):110459. doi: 10.1016/j.celrep.2022.110459.

      (5) The lifestyle index is defined based on an equal-weight approach, but this does not reflect reality and cannot fully answer the research questions it raises.

      Thank you very much for your valuable suggestion. We used equal weight healthy lifestyle index (HLI) partly to facilitate comparisons with other studies. The equal-weight approach to construct the HLI is commonly used in current research (Bmj, 2021; Diabetes Care. 2022; Arch Gerontol Geriatr. 2022). The equal-weight HLI can demonstrate the average benefit of adopting each additional healthy lifestyle and avoid assumptions about the relative importance of different behaviors, which may vary depending on the population. To further clarify the importance of each lifestyle factor, we conducted quantile G-computation analysis, which can reflect the weight differences between lifestyle factors (PLoS Med, 2020; Clin Epigenetics, 2022).

      Reference:

      (1) Zhang YB, Chen C, Pan XF, Guo J, Li Y, Franco OH, Liu G, Pan A. Associations of healthy lifestyle and socioeconomic status with mortality and incident cardiovascular disease: two prospective cohort studies. Bmj. 2021;373:n604. doi: 10.1136/bmj.n604.

      (2) Han H, Cao Y, Feng C, Zheng Y, Dhana K, Zhu S, Shang C, Yuan C, Zong G. Association of a Healthy Lifestyle With All-Cause and Cause-Specific Mortality Among Individuals With Type 2 Diabetes: A Prospective Study in UK Biobank. Diabetes Care. 2022;45(2):319-29. doi: 10.2337/dc21-1512.

      (3) Jin S, Li C, Cao X, Chen C, Ye Z, Liu Z. Association of lifestyle with mortality and the mediating role of aging among older adults in China. Arch Gerontol Geriatr. 2022;98:104559. doi: 10.1016/j.archger.2021.104559.

      (4) Chudasama YV, Khunti K, Gillies CL, Dhalwani NN, Davies MJ, Yates T, Zaccardi F. Healthy lifestyle and life expectancy in people with multimorbidity in the UK Biobank: A longitudinal cohort study. PLoS Med. 2020;17(9):e1003332. doi: 10.1371/journal.pmed.1003332.

      (5) Kim K, Zheng Y, Joyce BT, Jiang H, Greenland P, Jacobs DR, Jr., et al. Relative contributions of six lifestyle- and health-related exposures to epigenetic aging: the Coronary Artery Risk Development in Young Adults (CARDIA) Study. Clin Epigenetics. 2022;14(1):85. doi: 10.1186/s13148-022-01304-9.

      Reviewer #2 (Public Review):

      This interesting study focuses on the association between lifestyle factors and comprehensive and organ-specific biological aging in a multi-ethnic cohort from Southwest China. It stands out for its large sample size, longitudinal design, and robust statistical analysis.

      Some issues deserve clarification to enhance this paper:

      (1) How were the biochemical indicators for organ-specific biological ages chosen, and are these indicators appropriate? Additionally, a more detailed description of the multi-organ biological ages should be provided to help understand the distribution and characteristics of BAs.

      We thank you for raising this point. As explained in our response to the fourth question from the first reviewer, we constructed the comprehensive BA b ased on all the available biochemical data from the CMEC study, selecting aging-related markers (J Gerontol A Biol Sci Med Sci, 2021), and further construct organ-specific BAs based on these selected biomarkers. The KDM algorithm does not specify biomarker types but requires them to be correlated with chronological age (CA) (Ageing Dev, 2006). Existing studies typically construct BA based on available biomarker, we included 15 biomarkers in this study, which could be considered comprehensive and extensive compared to previous research (J Transl Med. 2023; J Am Heart Assoc. 2024; Nat Cardiovasc Res. 2024). For how   the biomarkers for each organ-specific BAs were selected, we categorized biomarkers primarily based on their relevance to the structure and function of each organ system according to the classification in previous studies (Nat Med, 2023; Cell Rep, 2022). Since the biomarkers we used came from clinical-lab data sets, they were categorized based on the clinical interpretation of blood chemistry tests (Nat Med, 2023). We only used biomarkers directly related to each specific system to minimize overlap between the indicators used for different BAs, thereby preserving the distinctiveness of organ-specific BAs.

      We have added a descriptive table for the comprehensive and organ systems BAs in the supplementary materials to provide a more detailed understanding of the distribution and characteristics of BAs:

      Author response table 2.

      Description of BA and BA acceleration1

      BA, biological age

      1 Data are presented as mean (standard deviation).

      (2) The authors categorized the HLI score into a dichotomous variable, which may cause a loss of information. How did the authors address this potential issue?

      Thank you for raising this concern. We categorized each lifestyle factor into a binary variable based on relevant guidelines and studies, which recommend assigning a score of 1 if the guideline or study recommendations are met (Bmj, 2021; J Am Heart Assoc, 2023). While dichotomization may lead to some loss of information, it allows for a clearer interpretation and comparison of adherence to ideal healthy lifestyle behaviors. Another advantage of this treatment is that it allows for easy comparison with other studies. We categorized the HLI score into a dichotomous variable to enhance the practical relevance of the results (J Gerontol A Biol Sci Med Sci, 2021). Additionally, we conducted analyses using the continuous HLI score to ensure that our findings were robust, and the results were consistent with those obtained using the dichotomous HLI.

      Reference:

      (1) Verschoor CP, Belsky DW, Ma J, Cohen AA, Griffith LE, Raina P. Comparing Biological Age Estimates Using Domain-Specific Measures From the Canadian Longitudinal Study on Aging. J Gerontol A Biol Sci Med Sci. 2021;76(2):187-94. doi: 10.1093/gerona/glaa151.

      (2) Klemera P, Doubal S. A new approach to the concept and computation of biological age. Mech Ageing Dev. 2006;127(3):240-8. doi: 10.1016/j.mad.2005.10.004

      (3) Zhang R, Wu M, Zhang W, Liu X, Pu J, Wei T, et al. Association between life's essential 8 and biological ageing among US adults. J Transl Med. 2023;21(1):622. doi: 10.1186/s12967-023-04495-8.

      (4) Forrester SN, Baek J, Hou L, Roger V, Kiefe CI. A Comparison of 5 Measures of Accelerated Biological Aging and Their Association With Incident Cardiovascular Disease: The CARDIA Study. J Am Heart Assoc. 2024;13(8):e032847. doi: 10.1161/jaha.123.032847.

      (5) Jiang M, Tian S, Liu S, Wang Y, Guo X, Huang T, Lin X, Belsky DW, Baccarelli AA, Gao X. Accelerated biological aging elevates the risk of cardiometabolic multimorbidity and mortality. Nat Cardiovasc Res. 2024;3(3):332-42. doi: 10.1038/s44161-024-00438-8.

      (6) Tian YE, Cropley V, Maier AB, Lautenschlager NT, Breakspear M, Zalesky A. Heterogeneous aging across multiple organ systems and prediction of chronic disease and mortality. Nat Med. 2023;29(5):1221-31. doi: 10.1038/s41591-023-02296-6.

      (7) Nie C, Li Y, Li R, Yan Y, Zhang D, Li T, et al. Distinct biological ages of organs and systems identified from a multi-omics study. Cell Rep. 2022;38(10):110459. doi: 10.1016/j.celrep.2022.110459.

      (3) Because lifestyle data are self-reported, they may suffer from recall bias. This issue needs to be addressed in the limitations section.

      Thank you for your valuable suggestion. We acknowledge that the use of self-reported lifestyle data in our study may introduce recall bias, potentially affecting the accuracy of the information collected. We have added the following statement to the limitations section of our manuscript:

      Discussion, Page 22, lines 463-464: “Fifth, assessment of lifestyle factors was based on self-reported data collected through questionnaires, which may be subject to recall bias.”

      (4) It should be clarified whether the adjusted CA is the baseline value of CA. Additionally, why did the authors choose models with additional adjustments for time-invariant variables as their primary analysis? This approach does not align with standard FEM analysis (Lines 261-263).

      Thank you for the opportunity to clarify. We have changed the sentence to “baseline CA”. For the second question, in a standard fixed effects model (FEM), only time-varying variables are typically included. However, to enhance the flexibility of our models and account for potential variations in the association of time-invariant variables with CA, as has been commonly done in previous studies, we additionally adjusted for time-invariant variables and the baseline value of CA (BMC Med Res Methodol, 2024; Am J Clin Nutr, 2020). Moreover, sensitivity analyses using the standard FEM were conducted in this study, and robust results were obtained.

      Reference:

      (1) Tang D, Hu Y, Zhang N, Xiao X, Zhao X. Change analysis for intermediate disease markers in nutritional epidemiology: a causal inference perspective. BMC Med Res Methodol. 2024;24(1):49. doi: 10.1186/s12874-024-02167-9.

      (2) Trichia E, Luben R, Khaw KT, Wareham NJ, Imamura F, Forouhi NG. The associations of longitudinal changes in consumption of total and types of dairy products and markers of metabolic risk and adiposity: findings from the European Investigation into Cancer and Nutrition (EPIC)-Norfolk study, United Kingdom. Am J Clin Nutr. 2020;111(5):1018-26. doi: 10.1093/ajcn/nqz335.

      (5) How is the relative contribution calculated in the QGC analysis? The relative contribution of some lifestyle factors is not shown in Figure 2 and the supplementary figures, such as Supplementary Figure 7. These omissions should be explained.

      Thanks for the questions. The QGC obtains causal relationships and estimates weights for each component, which has been widely used in epidemiological research. More details about QGC can be found in the supplementary methods. The reason some results are not displayed is that we assumed all healthy lifestyle changes would have a protective effect on BA acceleration. However, the effect size of some lifestyle factors did not align with this assumption and lacked statistical significance. Because positive and negative weights were calculated separately in QGC, with all positive weights summing to 1 and all negative weights summing to 1, these factors would have had large positive weights. To avoid potential misunderstandings, we chose not to include these results in the figures. We have added explanations to the figure legends where applicable:

      “The blue bars represent results that are statistically significant in the FEM analysis, while the gray bars represent results in the FEM analysis that were not found to be statistically significant and positive weights were not shown.”

      Recommendations for the authors:

      Reviewer #2 (Recommendations For The Authors):

      To enhance this paper, some issues deserve clarification:

      (1) How were the biochemical indicators for organ-specific biological ages chosen, and are these indicators appropriate? Additionally, please provide a more detailed description of the multi-organ biological ages to help understand BAs' the distribution and characteristics.

      (2) The authors categorized the HLI score into a dichotomous variable, which may cause a loss of information. How did the authors address this potential issue?

      (3) Because lifestyle data are self-reported, they may suffer from recall bias. This issue needs to be addressed in the limitations section.

      (4) Lines 261-263: Please clarify if the adjusted CA is the baseline value of CA. Additionally, why did you choose models with additional adjustments for time-invariant variables as your primary analysis? This approach does not align with standard FEM analysis.

      (5) How is the relative contribution calculated in the QGC analysis? The relative contribution of some lifestyle factors is not shown in Figure 2 and the supplementary figures, such as Supplementary Figure 7. Please explain these omissions.

      The above five issues overlap with those raised by Reviewer #2 (Public Review). Please refer to the responses provided earlier.

      Minor revision:

      Line 50: The expression "which factors" should be changed to "which lifestyle factor."

      Thank you for the suggestion. As suggested, we have used “which lifestyle factor” instead.

      Lines 91-92: "Aging exhibits variations across and with individuals" appears to be a clerical error. According to the context, it should be "Aging exhibits variations across and within individuals."

      We thank the reviewer for the correction. We have updated the text to read:

      “Aging exhibits variations across and within individuals.”

      Line 154: The authors mentioned "Considering previous studies" but lacked references. Please add the appropriate citations.

      Thank you for pointing this out. We apologize for the oversight. We have now added the appropriate citations to support the statement "Considering previous studies" in the revised manuscript.

      Lines 170-171: "regular exercise ("12 times/week", "3-5 times/week," or "daily or almost every day")"; the first item in parentheses should be "1-2 times/week"? Please verify and correct if necessary. Additionally, check the entire text carefully to avoid confusion caused by clerical errors.

      Thank you for your careful review. We have changed the sentence to "1-2 times/week." We have thoroughly checked the entire manuscript to ensure that no other clerical errors remain.

      Clarifications for Table 1:

      i. The expression "HLI=0" is difficult to understand. Please provide a more straightforward explanation or rephrase it.

      Thank you for your feedback. We have removed the confusing expression and provided a clearer explanation in the table legend for better understanding:

      “For HLI (category), "healthy" corresponds to a score of 4-5, while "unfavorable" corresponds to a score of 0-3.”

      ii. The baseline age is presented as an integer, but the follow-up age is not. Please clarify this discrepancy.

      Thank you for pointing out this discrepancy. We calculated the precise chronological age based on based on participants' survey dates and birth dates for the biological age calculations. Initially, the table presented age as integers, but we have now updated it to show the precise ages.

    1. eLife Assessment

      This fundamental, clearly written, and timely manuscript links the timing of ART with the kinetics of total and intact proviral HIV DNA. The conclusions are interesting and novel, and the importance of the work is high because the focus is on African women and clade C virus, both of which are understudied in the HIV reservoir field. The strength of the evidence is compelling. Overall, this work will be of very high interest to scientists and clinicians in the HIV cure/persistence fields.

    2. Reviewer #1 (Public review):

      The authors sought to determine the impact of early antiretroviral treatment on the size, composition, and decay of the HIV latent reservoir. This reservoir represents the source of viral rebound upon treatment interruption and therefore constitutes the greatest challenge to achieving an HIV cure. A particular strength of this study is that it reports on reservoir characteristics in African women, a significantly understudied population, of whom some have initiated treatment within days of acute HIV diagnosis. With the use of highly sensitive and current technologies, including digital droplet PCR and near full-length genome next-generation sequencing, the authors generated a valuable dataset for investigation of proviral dynamics in women initiating early treatment compared to those initiating treatment in chronic infection. The authors confirm previous reports that early antiretroviral treatment restricts reservoir size, but further show that this restriction extends to defective viral genomes, where late treatment initiation was associated with a greater frequency of defective genomes. Furthermore, an additional strength of this study is the longitudinal comparison of viral dynamics post-treatment, wherein early treatment was shown to be associated with a more rapid rate of decay in proviral genomes, regardless of intactness, over a period of one year post-treatment. While it is indicated that intact genomes were not detected after one year following early treatment initiation, sampling depth is noted as a limitation of the study by the authors, and caution should thus be taken with interpretation where sequence numbers are low. Defective genomes are more abundant than intact genomes and are therefore more likely to be sampled. Early treatment was also associated with reduced proviral diversity and fewer instances of polymorphisms associated with cytotoxic T-lymphocyte immune selection. This is expected given that rapid evolution and extensive immune selection are synonymous with HIV infection in the absence of treatment, yet points to an additional benefit of early treatment in the context of immune therapies to restrict the reservoir.

      This is one of the first studies to report the mapping of longitudinal intactness of proviral genomes in the globally dominant subtype C. The data and findings from this study therefore represent a much-needed resource in furthering our understanding of HIV persistence and informing broadly impactful cure strategies. The analysis on clonal expansion of proviral genomes may be limited by higher sequence homogeneity in hyperacute infection i.e., cells with different proviral integration sites may have a higher likelihood of containing identical genomes compared to chronic infection.

      Overall, these data demonstrate the distinct benefits of early treatment initiation at reducing the barrier to a functional cure for HIV, not only by restricting viral abundance and diversity but also potentially through the preservation of immune function and limiting immune escape. It therefore provides clues to curative strategies even in settings where early diagnosis and treatment may be unlikely.

    3. Reviewer #2 (Public review):

      HIV infection is characterized by viral integration into permissive host cells - an event that occurs very early in viral-host encounter. This constitutes the HIV proviral reservoir and is a feature of HIV infection that provides the greatest challenge for eradicating HIV-1 infection once an individual is infected.

      This study looks at how starting HIV treatment very early after infection, which substantially reduces the peak viral load detectable (compared to untreated infection), affects the amount and characteristics of the viral reservoir. The authors studied 35 women in South Africa who were at high risk of getting HIV. Some of these women started HIV treatment very soon after getting infected, while others started later. This study is well-designed and has as its focus a very well characterized cohort. Comparison groups are appropriately selected to address proviral DNA characterization and dynamics in the context of acute and chronic treated HIV-1. The amount of HIV and various characteristics of the genetic makeup of the virus (intact/defective proviral genome) was evaluated over one year of treatment. Methods employed for proviral DNA characterization are state-of-the-art and provide in-depth insights into the reservoir in peripheral blood.

      While starting treatment early didn't reduce the amount of HIV DNA at the outset, it did lead to a gradual decrease in total HIV DNA quantity over time. In contrast, those who started treatment later didn't see much change in this parameter. Starting treatment early led to a faster decrease in intact provirus (a measure of replication-competence), compared to starting treatment later. Additionally, early treatment reduced genetic diversity of the viral DNA and resulted in fewer immune escape variants within intact genomes. This suggests that collectively having a smaller intact replication-competent reservoir, less viral variability, and less opportunity for virus to evade the immune system - are all features that are likely to facilitate more effective clearance of viral reservoir, especially when combined with other intervention strategies.

      Major strengths of the study include the cohort of very early treated persons with HIV and the depth of study. These are important findings, particularly as the study was conducted in HIV-1 subtype C infected women (more cure studies have focussed on men and with subtype B infection)- and in populations most affected by HIV and in need of HIV cure interventions. This is highly relevant because it cannot be assumed that any interventions employed for reducing/clearing the HIV reservoir would perform similarly in men and women or across different populations. Other factors also deserve consideration and include age, and environment (e.g. other comorbidities and coinfections).

    4. Author response:

      The following is the authors’ response to the previous reviews.

      Public Reviews:

      Reviewer #1:

      (1) Given that this is one of the first studies to report the mapping of longitudinal intactness of proviral genomes in the globally dominant subtype C, the manuscript would benefit from placing these findings in the context of what has been reported in other populations, for example, how decay rates of intact and defective genomes compare with that of other subtypes where known.  

      Most published studies are from men living with HIV-1 subtype B and the studies are not from the hyperacute infection phase and therefore a direct head-to-head comparison with the FRESH study is difficult.  However, we can cite/highlight and contrast our study with a few a few examples from acute infection studies as follows.

      a. Peluso et. al., JCI, 2020, showed that in Caucasian men (SCOPE study), with subtype B infection, initiating ART during chronic infection virus intact genomes decayed at a rate of 15.7% per year, while defective genomes decayed at a rate of 4% per year.  In our study we showed that in chronic treated participants genomes decreased at a rate of 25% (intact) and 3% (defective) per month for the first 6 months of treatment.

      b. White et. al., PNAS, 2021, demonstrated that in a cohort of African, white and mixed-race American men treated during acute infection, the rate of decay of intact viral genomes in the first phase of decay was <0.3 logs copies in the first 2-3 weeks following ART initiation. In the FRESH cohort our data from acute treated participants shows a comparable decay rate of 0.31 log copies per month for virus intact genomes.

      c. A study in Thailand (Leyre et. al., 2020, Science Translational Medicine), of predominantly HIV-1 CRF01-AE subtype compared HIV-reservoir levels in participants starting ART at the earliest stages of acute HIV infection (in the RV254/SEARCH 010 cohort) and participants initiating ART during chronic infection (in SEARCH 011 and RV304/SEARCH 013 cohorts). In keeping with our study, they showed that the frequency of infected cells with integrated HIV DNA remained stable in participants who initiated ART during chronic infection, while there was a sharp decay in these infected cells in all acutely treated individuals during the first 12 weeks of therapy.  Rates of decay were not provided and therefore a direct comparison with our data from the FRESH cohort is not possible.

      d. A study by Bruner et. al., Nat. Med. 2016, described the composition of proviral populations in acute treated (within 100 days) and chronic treated (>180 days), predominantly male subtype B cohort. In comparison to the FRESH chronic treated group, they showed that in chronic treated infection 98% (87% in FRESH) of viral genomes were defective, 80% (60% in FRESH) had large internal deletions and 14% (31% in FRESH) were hypermutated.  In acute treated 93% (48% in FRESH) were defective and 35% (7% in FRESH) were hypermutated.  The differences frequency of hypermutations could be explained by the differences in timing of infection specifically in the acute treated groups where FRESH participants initiate ART at a median of 1 day after infection.  It is also possible that sex- or race-based differences in immunological factors that impact the reservoir may play a role.  

      This study also showed that large deletions are non-random and occur at hotspots in the HIV-1 genome. The design of the subtype B IPDA assay (Bruner et. al., Nature, 2019) is based on optimal discrimination between intact and deleted sequences - obtained with a 5′ amplicon in the Ψ region and a 3′ amplicon in Envelope. This suggest that Envelope is a hotspot for large while deletions in Ψ is the site of frequent small deletions and is included in larger 5′ deletions. In the FRESH cohort of HIV-1 subtype C, genome deletions were most frequently observed between Integrase and Envelope relative to Gag (p<0.0001–0.001).

      e. In 2017, Heiner et. al., in Cell Rep, also described genetic characteristics of the latent HIV-1 reservoir in 3 acute treated and 3 chronic treated male study participants with subtype B HIV.  Their data was similar to Bruner et. al. above showing proportions of intact proviruses in participants who initiated therapy during acute/early infection at 6% (94% defective) and chronic infection at 3% (97% defective). In contrast the frequencies in FRESH in acute treated were 52% intact and 48% defective and in chronic infection were 13% intact and 87% defective.  These differences could be attributed to the timing of treatment initiation where in the aforementioned study early treatment ranged from 0.6-3.4 months after infection.

      (2) Indeed, in the abstract, the authors indicate that treatment was initiated before the peak. The use of the term 'peak' viremia in the hyperacute-treated group could perhaps be replaced with 'highest recorded viral load'. The statistical comparison of this measure in the two groups is perhaps more relevant with regards to viral burden over time or area under the curve viral load as these are previously reported as correlates of reservoir size.

      We have edited the manuscript text to describe the term peak viraemia in hyperacute treated participants more clearly (lines 443-444). We have now performed an analysis of area under the curve to compare viral burden in the two study groups and found associations with proviral DNA levels after one year. This has been added to the results section (lines 162-163).

      Reviewer #2:

      (1) Other factors also deserve consideration and include age, and environment (e.g. other comorbidities and coinfections.)

      We agree that these factors could play a role however participants in this study were of similar age (18-23), and information on co-morbidities and coinfections are not known.

      Reviewer #3:

      (1) The word reservoir should not be used to describe proviral DNA soon after ART initiation. It is generally agreed upon that there is still HIV DNA from actively infected cells (phase 1 & 2 decay of RNA) during the first 6-12 months of ART. Only after a full year of uninterrupted ART is it really safe to label intact proviral HIV DNA as an approximation of the reservoir. This should be amended throughout.

      We agree and where appropriate have amended the use of the word reservoir to only refer to the proviral load after full viral suppression, i.e., undetectable viral load.

      (2) All raw, individualized data should be made available for modelers and statisticians. It would be very nice to see the RNA and DNA data presented in a supplementary figure by an individual to get a better grasp of intra-host kinetics.

      We will make all relevant data available and accessible to interested parties on request. We have now added a section on data availability (lines 489-491).

      (3) The legend of Supplementary Figure 2 should list when samples were taken.

      The data in this figure represents an overall analysis of all sequences available for each participant at all time points.  This has now been explained more clearly in the figure legend.

      Recommendations for The Authors:

      Reviewer #1:

      (1) It is recommended that the introduction includes information to set the scene regarding what is currently reported on the composition of the reservoir for those not in the immediate field of study i.e., the reported percentage of defective genomes and in which settings/populations genome intactness has been mapped, as this remains an area of limited information.

      We have now included summary of other reported findings in the field in the introduction (lines 89-92, 9498) and discussion (lines 345-350).  A more detailed overview has been provided in the response to public reviews.

      (2) It may be beneficial to state in the main text of the paper what the purpose of the Raltegravir was and that it was only administered post-suppression. Looking at Table 1, only the hyperacute treatment group received Raltegravir and this could be seen as a confounder as it is an integrase inhibitor. Therefore, this should be explained.

      Once Raltegravir became available in South Africa, all new acute infections in the study cohort had an intensified 4-drug regimen that included Raltegravir.  A more detailed explanation has now been included in the methods section (lines 435-437).

      (3) Can the authors explain why the viral measures at 6 months post-ART are not shown for chronictreated individuals in Figure 1 or reported on in the text?

      The 6 months post-ART time point has been added to Figure 1.

      (4) Can the authors indicate in the discussion, how the breakdown of proviral composition compares to subtype B as reported in the literature, for example, are the common sites of deletion similar, or is the frequency of hypermutation similar?

      Added to discussion (lines 345-350).

      (5) Do the numbers above the bars in Figure 3 represent the number of sampled genomes? If so, this should be stated.

      Yes, the numbers above the bars represent the number of sampled genomes. This has been added to the Figure 3 legend.

      (6) In the section starting on line 141, the introduction implies a comparison with immunological features, yet what is being compared are markers of clinical disease progression rather than immune responses. This should be clarified/corrected.

      This has been corrected (line 153).

      (7) Line 170 uses the term 'immediately' following infection, however, was this not 1 -3 days after?

      We have changed the word “immediately” to “1-3 days post-detection” (line 181).

      (8) Can the sampling time-points for the two groups be given for the longitudinal sequencing analysis?

      The sequencing time points for each group is depicted in Figure 2.

      (9) Line 183 indicates that intact genomes contributed 65% of the total sequence pool, yet it's given as 35% in the paragraph above. Should this be defective genomes?

      Yes, this was a typographical error.  Now corrected to read “defective genomes” (line 193).

      (10) The section on decay kinetics of intact and defective genomes seems to overlap with the section above and would flow better if merged.

      Well noted, however we choose to keep these sections separate.

      (11) Some references in the text are given in writing instead of numbering.

      This has been corrected.

      (12) In the clonal expansion results section, can it be indicated between which two time-points expansion was measured?

      This analysis was performed with all sequences available for each participant at all time points.  We have added this explanation to the respective Figure legend.

      Reviewer #2:

      (1) The statement on line 384 "Our data showed that early ART...preserves innate immune factors" - what innate immune factors are being referred to?

      We have removed this statement.

      (2) HLA genotyping methods are not included in the Methods section

      Now included and referenced (lines 481-483).

      (3) Are CD4:CD8 ratios available for the cohorts? This could be another informative clinical parameter to analyse in relation to HIV-1 proviral load after 1 year of ART – as done for the other variables (peak VL, and the CD4 measures).

      Yes, CD4:CD8 ratios are available. We performed the recommended analysis but found no associations with HIV-1 proviral load after 1 year of ART. We have added this to the results section (lines 163-164).

      (4) Reference formatting: Paragraph starting at line 247 (Contribution of clonal expansion...) - the two references in this paragraph are not cited according to the numbering system as for the rest of the manuscript. The Lui et al, 2020 reference is missing from the reference list - so will change all the numbering throughout.

      This has been corrected.

      Reviewer #3:

      (1) To allow comparison to past work. I suggest changing decay using % to half-life. I would also mention the multiple studies looking at total and intact HIV DNA decay rates in the intro.

      We do not have enough data points to get a good estimate of the half-life and therefor report decay as percentage per month for the first 6 months. 

      (2) Line 73: variability is the wrong word as inter-individual variability is remarkably low. I think the authors mean "difference" between intact and total.

      We have changed the word variability to difference as suggested.

      (3) Line 297: I am personally not convinced that there is data that definitively shows total HIV DNA impacting the pathophysiology of infection. All of this work is deeply confounded by the impact of past viremia. The authors should talk about this in more detail or eliminate this sentence.

      We have reworded the statement to read “Total HIV-1 DNA is an important biomarker of clinical outcomes.” (Lines 308-309).

      (4) Line 317; There is no target cell limitation for reservoir cells. The vast majority of CD4+ T cells during suppressive ART are uninfected. The mechanism listing the number of reservoir cells is necessarily not target cell limitation.

      We agree. The statement this refers to has been reworded as follows: “Considering, that the majority of CD4 T cells remain uninfected it is likely that this does not represent a higher number of target cells, and this warrants further investigation.” (lines 325-326).

      (5) Line 322: Some people in the field bristle at the concept of total HIV DNA being part of the reservoir as defective viruses do not contribute to viremia. Please consider rephrasing. 

      We acknowledge that there are deferring opinions regarding total HIV DNA being part of the reservoir as defective viruses do not contribute to viremia, however defective HIV proviruses may contribute to persistent immune dysfunction and T cell exhaustion that are associated comorbidities and adverse clinical outcomes in people living with HIV.  We have explained in the text that total HIV-DNA does not distinguish between replication-competent and -defective viruses that contribute to the viral reservoir.

      (6) Line 339: The under-sampling statement is an understatement. The degree of under-sampling is massive and biases estimates of clonality and sensitivity for intact HIV. Please see and consider citing work by Dan Reeves on this subject.

      We agree and have cited work by Dan Reeves (line 358).

      (7) Line 351: This is not a head-to-head comparison of biphasic decay as the Siliciano group's work (and others) does not start to consider HIV decay until one year after ART. I think it is important to not consider what happens during the first year of ART to be reservoir decay necessarily.

      Well noted.

      (8) Line 366-371: This section is underwritten. In nearly all PWH studies to date, observed reservoirs are highly clonal.

      We agree that observed reservoirs are highly clonal but have not added anything further to this section.

      (9) It would be nice to have some background in the intro & discussion about whether there is any a priori reason that clade C reservoirs, or reservoirs in South African women, might differ (or not) from clade B reservoirs observed in different study participants.

      We have now added this to the introduction (lines 94-103).

      (10) Line 248: This sentence is likely not accurate. It is probable that most of the reservoir is sustained by the proliferation of infected CD4+ T cells. 50% is a low estimate due to under-sampling leading to false singleton samples. Moreover, singletons can also be part of former clones that have contracted, which is a natural outcome for CD4+ T cells responding to antigens &/or exhibiting homeostasis. The data as reported is fine but more complex ecologic methods are needed to truly probe the clonal structure of the reservoir given severe under sampling.

      Well noted.

    1. eLife Assessment

      This important study shows that Toxoplasma gondii uses paracrine mechanisms, in addition to cell-intrinsic methods, to evade the host immune system, with MYR1 playing a key role in transporting effector molecules into host cells. The authors present convincing evidence that in vivo, MYR1-deficient parasites can be rescued by wild-type parasites, revealing a limitation in pooled CRISPR screens, where such paracrine effects may obscure the identification of key parasite pathways involved in immune evasion

    2. Reviewer #1 (Public review):

      Previous studies have highlighted some of these paracrine activities of Toxoplasma - and Rasogi et al (mBio, 2020) used a single cell sequencing approach of cells infected in vitro with the WT or MYR KO parasites - and one of their conclusions was that MYR-1 dependent paracrine activities counteract ROP-dependent processes. Similarly, Chen et al (JEM 2020) highlighted that a particular rhoptry protein (ROP16) could be injected into uninfected macrophages and move them to an anti-inflammatory state that might benefit the parasite.

      Caveats around immunity and as yet no insight into how this works. In Fig 2 there is a marked defect in the ability of the parasites to expand at day 2 and day 5. Together, these data sets suggest that this paracrine effect mediated by MYR-1 works early - well before the development of adaptive responses.

      Comments on revisions:

      The authors have provided their perspective on the original review. There were some previous comments that revolved around whether some of the early changes were masked by pooling data sets where they have reiterated that it is not statistically different. Would have been nice to have seen out addressed by having experiments that were appropriately powered. But it's their call.

    3. Reviewer #2 (Public review):

      Summary:

      In this manuscript by Torelli et al., the authors propose that the major function of MYR1 and MYR1-dependent secreted proteins is to contribute to parasite survival in a paracrine manner rather than to protect parasites from cell-autonomous immune response. The authors conclude that these paracrine effects rescue ∆MYR1 or knockouts of MYR1-dependent effectors within pooled in vivo CRISPR screens.

      Strengths:

      The authors raised a more general concern that pooled CRISPR screens (not only in Toxoplasma but also other microbes or cancers) would miss important genes by "paracrine masking effect". Although there is no doubt that pooled CRISPR screens (especially in vivo CRISPR screens) are powerful techniques, I think this topic could be of interest to those fields and researchers.

      Weaknesses:

      In this version, the reviewer is not entirely convinced of the 'paracrine masking effect' because the in vivo experiments should include appropriate controls (see major point 2) in the first submission.

      After the revision, although no experiments were added, this reviewer considered that the points have been sufficiently discussed and commented on.

    4. Author response:

      The following is the authors’ response to the original reviews.

      We thank the reviewers for their time and thoughtful comments on our manuscript. 

      We realised a preliminary version of Figure 2 was initially submitted, which we are replacing now with a novel version. Differences between the two figures are : 1) The schematic in Figure 2a was replaced with a new one in line with that of Figure 3a; 2) in Figure 2c details about the statistical analysis were removed from the legend and one datapoint that was erroneously removed at day 5 for the ΔMYR1-Luc condition was included. Regardless, these changes do not affect the results and the conclusions initially drawn.

      Public Reviews:

      Reviewer #1 (Public review): 

      Previous studies have highlighted some of these paracrine activities of Toxoplasma - and Rasogi et al (mBio, 2020) used a single cell sequencing approach of cells infected in vitro with the WT or MYR KO parasites - and one of their conclusions was that MYR-1 dependent paracrine activities counteract ROP-dependent processes.

      Similarly, Chen et al (JEM 2020) highlighted that a particular rhoptry protein (ROP16) could be injected into uninfected macrophages and move them to an anti-inflammatory state that might benefit the parasite. 

      We are aware of both these studies, where the injection of rhoptry proteins into cells that the parasite does not invade alters the host transcriptional profile establishing a permissive environment. However, here we propose a different paracrine effect that goes beyond the injected/uninfected cell. Specifically, we propose that one or more MYR1-dependent effectors alter the cytokine secretion profile of infected cells, which leads to overall changes in the immune response such as cell types recruited to the site of infection, or the activation state. 

      There are caveats around immunity and as yet no insight into how this works. In Figure 2 there is a marked defect in the ability of the parasites to expand at day 2 and day 5. Together, these data sets suggest that this paracrine effect mediated by MYR-1 works early - well before the development of adaptive responses. 

      Yes, we also hypothesise an early effect based on the data. Growth continues until day 5 at least, and then plateaus towards day 7, which makes us believe that the effect takes place within the first 5 days. We agree with the reviewer that the MYR1-mediated rescue acts before the involvement of the adaptive immune response, which is supported by our results obtained in Rag2-/- mice shown in Figure 3e. 

      Reviewer #2 (Public review): 

      Summary: 

      In this manuscript by Torelli et al., the authors propose that the major function of MYR1 and MYR1-dependent secreted proteins is to contribute to parasite survival in a paracrine manner rather than to protect parasites from cell-autonomous immune response. The authors conclude that these paracrine effects rescue ∆MYR1 or knockouts of MYR1-dependent effectors within pooled in vivo CRISPR screens. 

      Strengths: 

      The authors raised a more general concern that pooled CRISPR screens (not only in Toxoplasma but also other microbes or cancers) would miss important genes by "paracrine masking effect". Although there is no doubt that pooled CRISPR screens (especially in vivo CRISPR screens) are powerful techniques, I think this topic could be of interest to those fields and researchers. 

      Weaknesses: 

      In this version, the reviewer is not entirely convinced of the 'paracrine masking effect' because the in vivo experiments should include appropriate controls (see major point 2). 

      (1) It is convincing that co-infection of WT and ∆MYR1 parasites could rescue the growth of ∆MYR1 in mice shown by in vivo luciferase imaging. Also, this is consistent with ∆MYR1 parasites showing no in vivo fitness defect in the in vivo CRISPR screens conducted by several groups. Meanwhile, it has been reported previously and shown in this manuscript that ∆MYR1 parasites have an in vitro growth defect; however, ∆MYR1 parasites show no in vitro fitness defect the in vitro pooled CRISPR screen. The authors show that the competition defect of ∆MYR1 parasites cannot be rescued by co-infection with WT parasites in Figure 1c, which might indicate that no paracrine rescue occurred in an in vitro environment. The authors seem not to mention these discrepancies between in vitro CRISPR screens and in vitro competition assays. Why do ∆MYR1 parasites possess neutral in vitro fitness scores in in vitro CRISPR screens? Could the authors describe a reasonable hypothesis? 

      The reviewer raises a very interesting point, which at this stage, we cannot fully explain. A technical explanation could be that the relatively small growth defect detected for clean KOs, is not well represented in the CRISPR screens due to the variability of guides, where smaller differences in growth are not reliably captured and hidden within the noise of the assays. Another technical explanation may be median-centering: if the majority of KOs in the pool have a small growth defect, median centering would push these towards a zero. We have observed and reported this phenomenon in Young et al., 2019 for libraries containing a larger fraction of genes with a negative fitness score. In the library used here focusing on secreted proteins, we have not observed a strong trend to negative fitness scores, but cannot exclude smaller shifts. Because we have no solid base to favour any of the above mentioned explanations, we have decided to not speculate too much on this in the manuscript. However, we wanted to show all the data as the difference between these results may not be technical, but biological, which could inform future studies or results by us and others.  

      (2) The authors developed a mixed infection assay with an inoculum containing a 20:80 ratio of ΔMYR1-Luc parasites with either WT parasites or ΔMYR1 mutants not expressing luciferase, showing that the in vivo growth defect of ∆MYR1 parasites is rescued by the presence of WT parasites. Since this experiment lacks appropriate controls, interpretation could be difficult. Is this phenomenon specific to MYR1? If a co-inoculum of ∆GRA12-Luc with either WT parasites or GRA12 parasites not expressing luciferase is included, the data could be appropriately interpreted. 

      We are not quite sure what appropriate controls the reviewer refers to. We show here in Figures 3c and 3f that increasing parasite load by co-infecting mice with ∆MYR1 parasites is not sufficient to rescue ∆MYR1-Luc parasite growth. Co-infection with WT parasites, however, does result in increased ∆MYR1-Luc parasitaemia at day 7 p.i., indicating that MYR1 competence is required for the in vivo trans-rescue we describe. As ∆GRA12 parasites have a very strong cell-autonomous restriction in vitro and severe growth defect in vivo (Torelli et al., BioRxiv), these parasites would be rapidly depleted, which is also observed in all CRISPR screens from various laboratories. Therefore we do not think that co-infection with GRA12-deficient parasites would be an informative experiment here. We do speculate that mutant parasites for other proteins required for export (i.e. MYR 2, 3, 4, ROP17) could also be trans-rescued in addition to mutants for other MYR-dependent proteins such as GRA24 and GRA28, which remodel cytokine secretion and could individually, or synergistically, affect host cell immunity. Dissecting which Toxoplasma factor/s and host cytokine signalling pathways drive this trans-rescue effect is highly interesting, but beyond the scope of this manuscript. Here, we focused on the basic concept that an individual mutant can be rescued in trans in vivo, which we think is of importance beyond the field of Toxoplasma research. 

      (3) In the Discussion part, the authors argue that the rescue phenotype of mixed infection is not due to co-infection of host cells (lines 307-310). This data is important to support the authors' paracrine hypothesis and should be shown in the main figure.

      We understand the reviewer’s concern for rescue by co-infection of the same cell, but we largely exclude this hypothesis as Toxoplasma cell-autonomous effectors, such as GRA12 and ROP18, would also be rescued if that were to happen on a larger scale. We previously performed an in vivo experiment to assess co-infection rates of peritoneal exudate cells (PECs) by imaging using infection doses comparable to those used in the trans-rescue experiments. The total infection rate of PECs was 2.3%, so the overall number of infected cells per image was low, and not suitable for publication purposes. We tried to capture more cells using FACS analysis, however, PECs are highly autofluorescent in the yellow/green channels, which prevented us from drawing adequate conclusions using our GFP and mCherry strains. Because we see no rescue of GRA12 or ROP18 in CRISPR screens, and the overall in vivo co-infection rates were very low as observed by imaging, we did not think that generating strains expressing different fluorochromes compatible with standard FACS analysis, and then performing more in vivo experiments was best use of resources at the time. 

      (4) In the Discussion part, the authors assume that the rescue phenotype is the result of multiple MYR1-dependent effectors. I admit that this hypothesis could be possible since a recently published paper described the concerted action of numerous MYR1-dependent or independent effectors contributing to the hypermigration of infected cells (Ten Hoeve et al., mBio, 2024). I think this paragraph would be kind of overstated since the authors did not test any of the candidate effectors. Since the authors possess ∆IST parasites, they can test whether IST is involved in the "paracrine masking effect" or not to support their claim. 

      MYR1 deletion impairs the export of multiple Toxoplasma effectors into the host cell, including GRA16, GRA24, GRA28, HCE1/TEEGR etc, many of which can influence cytokine levels. As such, we speculate that it is a combination of multiple effector proteins that are responsible for the trans-rescue. As stated above, which parasite effectors, host cell types and cytokines are involved in the phenotype we describe are part of ongoing and future studies. Here, we wanted to focus on the key message, that in in vivo CRISPR screens, paracrine rescue of individual mutants can occur. While we will test IST mutants, it is probably not the top candidate as it only prevents upregulation of ISGs after exposure to IFN-γ, but has probably no role in already stimulated cells. As we still observe strong rescue past day 3, when IFN-γ levels are already elevated (Nishiyama 2020 Parasitol Int), IST probably plays no dominant role. 

      Recommendations for the authors:

      Reviewer #1 (Recommendations for the authors): 

      (1) Figure 1 - it's not obvious what concentration of IFN-gamma is being used in these assays (sorry if this is stated somewhere else). 

      All in vitro experiments were performed with 100 U/ml IFN-γ as stated in the Material & Methods section, however added this information in the figure legend of Figure 1.

      (2) Figure 3 This reviewer wonders if earlier differences are buried in the data sets. In Figure 3b it looks like there are early differences but this is lost in the collated data analysis in 3c. An early difference is quite apparent in Figure 2. 

      We agree with the reviewer that a difference is visible at day 3 and 5 in Figure 3b, however differences between experimental groups became statistically significant only at day 7 in Figure 3c (N = 4 biological replicates). We cannot compare results between Figure 3c and Figure 2c as the latter reports 100% WT or ΔMYR1 infections and not 20:80 mixes.

      (3) The authors conclude from their in vitro studies that MYR-1 is not required for in vitro growth in IFN-g activated macrophages. Given that the WT parasites still rescue MYR KO parasites in RAG mice it does imply that this paracrine effect would impact early innate responses. Since RAG mice do have a strong ILC/NK cell response that leads to the local production of IFN-g it would seem like a reasonable candidate. Do the authors know if the MYR KO have improved growth in the absence of IFN-g in vivo? This could be done using KO mice or with IFN-g neutralization. 

      MYR1 displayed a neutral score in CRISPR screens in IFN-γ KO mice (Tachibana et al Cell Reports 2023), suggesting that lack of IFN-γ does not specifically improve MYR1 mutant growth compared to other mutants in a pool. We believe that the rescue is rather driven by other cytokines that have been shown to be altered in a MYR1 dependent manner (i.e CCL2, IL-6, IL-12). But as laid out before, this is subject of future studies.  

      This is a submission that might benefit from a graphical model of how the authors view this system working. 

      We agree with the reviewer and we added a graphical model to the manuscript. 

      Reviewer #2 (Recommendations for the authors): 

      The authors previously published a study that combines CRISPR screens in Toxoplasma and host transcriptome by scRNA-seq (Butterworth et al., Cell Host Microbe 2023). I think the authors possess transcriptome of ∆MYR1-infected HFFs. Although I understand this screen is conducted in in-vitro culture and human fibroblasts, are there any differentially expressed genes or pathways that could explain the paracrine rescue phenomenon described in this manuscript?

      We thank the reviewer for this insightful comment, which is however hard to address.  Thousands of host cell genes within multiple pathways are affected by MYR1 deletion (Naor et al. mBio 2018; Butterworth et al. Cell Host Microbe 2023). Therefore the PerturbSeq dataset is not helpful to pinpoint specific immune mechanisms of rescue, and is speculative without any experimentation to back it up. However, we added a sentence in line 350 of the discussion to highlight known MYR1-related effects on immune-related pathways. “Individual MYR-related effectors that may be responsible for the paracrine rescue have not been investigated here and we hypothesise that the phenotype is likely the concerted result of multiple effectors that affect cytokine secretion. For example, previous studies showed that both GRA18 and GRA28 can induce release of CCL22 from infected cells (He 2018 eLife; Rudzki 2021 mBio), while GRA16 and HCE1/TEEGR impair NF-kB signalling and the potential release of pro-inflammatory cytokines such as IL-6, IL-1β and TNF (Seo 2020 Int J Mol Sci; Braun 2019 Nat Microbiol). Regardless of the effector(s), our results highlight an important novel function of MYR1-dependent effectors by establishing a supportive environment in trans for Toxoplasma growth within the peritoneum.”

    1. eLife Assessment

      This study presents a valuable finding on a potential signaling pathway responsible for the direct effects of nicotine on intestinal stem cell growth and tumorigenesis. The evidence supporting the claims of the authors is solid. This research will be of interest to medical biologists specializing in intestinal tumors.

    2. Reviewer #1 (Public review):

      In their manuscript, authors Isotani et al used in vivo and ex vivo models to show that nicotine could promote stemness and tumorigenicity in murine model. The authors further provided data supporting that the effects of nicotine on stem cell proliferation and tumor initiation were mediated by the Hippo-YAP/TAZ and Notch signal pathway.

      The major strength of this study is the using a set of tools, including Lgr5 reporter mice (Lgr5-EGFP-IRES-CreERT2 mice), stem cell-specific Apc knockout mice (Lgr5CreER Apcfl/fl mice), organoids derived from these mice and chemical compounds (agonists and antagonists) to demonstrate nicotine affects stem cells rather than Paneth cells, leading to increased intestinal stemness and tumorigenicity. Whereas, all models are restricted to mice, lacking analysis of human samples or human intestinal organoids to prove the human relevance of these findings.

      Overall, the presented results support their conclusions. A previous study reported that nicotine acts through the α2β4 nAChR to enhance Wnt production by Paneth cells, which subsequently affects ISCs. In contrast, this manuscript demonstrated that nicotine directly promotes ISCs through α7-nAChR, independent of Paneth cells. Therefore, this manuscript offers novel insights into the mechanism of nicotine's effects on the mouse intestine.

    3. Reviewer #2 (Public review):

      Summary:

      The manuscript by Isotani et al characterizes the hyperproliferation of intestinal stem cells (ISCs) induced by nicotine treatment in vivo. Employing a range of small molecule inhibitors, the authors systematically investigated potential receptors and downstream pathways associated with nicotine-induced phenotypes through in vitro organoid experiments. Notably, the study specifically highlights a signaling cascade involving α7-nAChR/PKC/YAP/TAZ/Notch as a key driver of nicotine-induced stem cell hyperproliferation. Utilizing a Lgr5CreER Apcfl/fl mouse model, the authors extend their findings to propose a potential role of nicotine in stem cell tumorgenesis. The study posits that Notch signaling is essential during this process.

      Strengths and Weaknesses:

      One noteworthy research highlight in this study is the indication, as shown in Figure 2 and S2, that the trophic effect of nicotine on ISC expansion is independent of Paneth cells. In the Discussion section, the authors propose that this independence may be attributed to distinct expression patterns of nAChRs in different cell types. To further substantiate these findings, the authors provided qPCR analysis of nAchRs in ISCs and Paneth cells from isolated whole small intestine, indicating that α7-nAChR uniquely responds to nicotine treatment among various nAChRs. The authors further strengthen the clinical relevance of the study by exploring human scRNA-seq dataset, in which α7-nAChR is indeed also expressed in human ISCs and Paneth cells.

      As shown in the same result section, the effect of nicotine on ISC organoid formation appears to be independent of CHIR99021, a Wnt activator. In the Lgr5CreER Apcfl/fl mouse model, it is known that APC loss results in a constitutive stabilization of β-catenin, thus the hyperproliferation of ISCs by nicotine treatment in this mouse model is likely beyond Wnt activation. The authors have included such discussion.

      In Figure 4, the authors investigate ISC organoid formation with a pan-PKC inhibitor, revealing that PKC inhibition blocks nicotine-induced ISC expansion. It's noteworthy that PKC inhibitors have historically been used successfully to isolate and maintain stem cells by promoting self-renewal. Therefore, it is surprising to observe no or reversal effect on ISCs in this context. The authors have now included an additional PKC inhibitor Sotrastaurin to confirm the role of PKC in nicotine-induced ISC expansion.

      Overall, the manuscript has provided sufficient experimental evidence to address my concerns and also significantly enhanced its quality.

    4. Author response:

      The following is the authors’ response to the previous reviews.

      Public Reviews:

      Reviewer #1 (Public Review):

      Strengths and weaknesses:

      Although the revised manuscript has significantly improved in the quality of pictures, there seems to be still a discrepancy in Figure 2A: quantification result suggested that NIC (1um) treatment increased the number of colonies from 300 to around 450 (1.5 folds), whereas representative picture shown that the difference was 3 to 12 living organoids (4 folds).

      As reviewer points out, the selected picture was not representative image of “control” group in Figure2A. We replaced it by the new representative image in this revised version.

      Recommendations for the authors:

      Reviewer #2 (Recommendations for the authors):

      A minor point to be corrected:

      Please consider removing "In consistent with this notion", which is repetitive with "Similarly".

      " NIC is supposed to activate Wnt signaling via Hippo-YAP/TAZ and Notch signaling. In consistent with this notion. Similarly, the expression of target proteins (Sox9, TCF4 and, C-myc)..."

      We corrected it according to the reviewer’s suggestion.

    1. eLife Assessment

      This valuable study highlights how the diversity of the malaria parasite population diminishes following the initiation of effective control interventions but quickly rebounds as control wanes. The data presented is convincing and the work shows how genetic studies could be used to monitor changes in disease transmission.

    2. Reviewer #2 (Public review):

      In this manuscript, Tiedje and colleagues longitudinally track changes in parasite numbers across four time points as a way of assessing the effect of malaria control interventions in Ghana. Some of the study results have been reported previously, and in this publication, the authors focus on age-stratification of the results. Malaria prevalence was lower in all age groups after IRS. Follow-up with SMC, however, maintained lower parasite prevalence in the targeted age group but not the population as a whole. Additionally, they observe that diversity measures rebound more slowly than prevalence measures. This adds to a growing literature that demonstrates the relevance of asymptomatic reservoirs.

      Strengths:

      Overall, I found these results clear, convincing, and well-presented. There is growing interest in developing an expanded toolkit for genomic epidemiology in malaria, and detecting changes in transmission intensity is one major application. As the authors summarize, there is no one-size-fits-all approach, and the Bayesian MOIvar estimate developed here has the potential to complement currently used methods, particularly in regions with high diversity/transmission. I find its extension to a calculation of absolute parasite numbers appealing as this could serve as both a conceptually straightforward and biologically meaningful metric.

      Weaknesses:

      While I understand the conceptual importance of distinguishing among parasite prevalence, mean MOI, and absolute parasite number, I am not fully convinced by this manuscript's implementation of "census population size". The authors reference the population genetic literature, but within the context of that field, "census population size" refers to the total population size (which, if not formally counted, can be extrapolated) as opposed to "effective population" size, which accounts for a multitude of demographic factors. There is often interesting biology to be gleaned from the magnitude of difference between N and Ne. In this manuscript, however, "census population size" is used to describe the number of distinct parasites detected within a sample, not a population. As a result, the counts do not have an immediate population genetic interpretation and cannot be directly compared to Ne. This doesn't negate their usefulness but does complicate the use of a standard population genetic term. In contrast, I think that sample parasite count will be most useful in an epidemiological context, where the total number of sampled parasites can be contrasted with other metrics to help us better understand how parasites are divided across hosts, space and time. However, for this use, I find it problematic that the metric does not appear to correct for variations in participant number. For instance, in this study, participant numbers especially varied across time for 1-5 year-olds (N=356, 216, 405, and 354 in 2012, 2014, 2015, and 2017 respectively). This sample size variability is accounted for with other metrics like mean MOI. In sum, while the manuscript opens up an interesting discussion, I'm left with an incomplete understanding of the robustness and interpretability of the new proposed metric.

    3. Reviewer #3 (Public review):

      Summary:

      The manuscript coins a term "the census population size" which they define from the diversity of malaria parasites observed in the human community. They use it to explore changes in parasite diversity in more than 2000 people in Ghana following different control interventions.

      Strengths:

      This is a good demonstration of how genetic information can be used to augment routinely recorded epidemiological and entomological data to understand the dynamics of malaria and how it is controlled. The genetic information does add to our understanding, though by how much is currently unclear (in this setting it says the same thing as age stratified parasite prevalence), and its relevance moving forward will depend on the practicalities and cost of the data collection and analysis. Nevertheless, this is a great dataset with good analysis and a good attempt to understand more about what is going on in the parasite population.

      Weaknesses:

      None

    4. Author response:

      The following is the authors’ response to the previous reviews.

      Public Reviews: 

      Reviewer #1 (Public Review): 

      Tiedje et al. investigated the transient impact of indoor residual spraying (IRS) followed by seasonal malaria chemoprevention (SMC) on the plasmodium falciparum parasite population in a high transmission setting. The parasite population was characterized by sequencing the highly variable DBL$\alpha$ tag as a proxy for var genes, a method known as varcoding. Varcoding presents a unique opportunity due to the extraordinary diversity observed as well as the extremely low overlap of repertoires between parasite strains. The authors also present a new Bayesian approach to estimating individual multiplicity of infection (MOI) from the measured DBL$\alpha$ repertoire, addressing some of the potential shortcomings of the approach that have been previously discussed. The authors also present a new epidemiological endpoint, the so-called "census population size", to evaluate the impact of interventions. This study provides a nice example of how varcoding technology can be leveraged, as well as the importance of using diverse genetic markers for characterizing populations, especially in the context of high transmission. The data are robust and clearly show the transient impact of IRS in a high transmission setting, however, some aspects of the analysis are confusing.

      (1) Approaching MOI estimation with a Bayesian framework is a well-received addition to the varcoding methodology that helps to address the uncertainty associated with not knowing the true repertoire size. It's unfortunate that while the authors clearly explored the ability to estimate the population MOI distribution, they opted to use only MAP estimates. Embracing the Bayesian methodology fully would have been interesting, as the posterior distribution of population MOI could have been better explored. 

      We thank the reviewer for appreciating the extension of var_coding we present here. We believe the comment on maximum _a posteriori (MAP) refers to the way we obtained population-level MOI from the individual MOI estimates. We would like to note that reliance on MAP was only one of two approaches we described, although we then presented only MAP.  Having calculated both, we did not observe major differences between the two, for this data set.  Nonetheless, we revised the manuscript to include the result based on the mixture distribution which considers all the individual MOI distributions in the Figure supplement 6.

      (2) The "census population size" endpoint has unclear utility. It is defined as the sum of MOI across measured samples, making it sensitive to the total number of samples collected and genotyped. This means that the values are not comparable outside of this study, and are only roughly comparable between strata in the context of prevalence where we understand that approximately the same number of samples were collected. In contrast, mean MOI would be insensitive to differences in sample size, why was this not explored? It's also unclear in what way this is a "census". While the sample size is certainly large, it is nowhere near a complete enumeration of the parasite population in question, as evidenced by the extremely low level of pairwise type sharing in the observed data. 

      We consider the quantity a census in that it is a total enumeration or count of infections in a given population sample and over a given time period. In this sense, it gives us a tangible notion of the size of the parasite population, in an ecological sense, distinct from the formal effective population size used in population genetics. Given the low overlap between var repertoires of parasites (as observed in monoclonal infections), the population size we have calculated translates to a diversity of strains or repertoires.  But our focus here is in a measure of population size itself.  The distinction between population size in terms of infection counts and effective population size from population genetics has been made before for pathogens (see for example Bedford et al. for the seasonal influenza virus and for the measles virus (Bedford et al., 2011)), and it is also clear in the ecological literature for non-pathogen populations (Palstra and Fraser, 2012). 

      We completely agree with the dependence of our quantity on sample size. We used it for comparisons across time of samples of the same depth, to describe the large population size characteristic of high transmission which persists across the IRS intervention. Of course, one would like to be able to use this quantity across studies that differ in sampling depth and the reviewer makes an insightful and useful suggestion.  It is true that we can use mean MOI, and indeed there is a simple map between our population size and mean MOI (as we just need to divide or multiply by sample size, respectively) (Table supplement 7).  We can go further, as with mean MOI we can presumably extrapolate to the full sample size of the host population, or to the population size of another sample in another location. What is needed for this purpose is a stable mean MOI relative to sample size.  We can show that indeed in our study mean MOI is stable in that way, by subsampling to different depths our original sample (Figure supplement 8 in the revised manuscript). We now include in the revision discussion of this point, which allows an extrapolation of the census population size to the whole population of hosts in the local area.

      We have also clarified the time denominator: Given the typical duration of infection, we expect our population size to be representative of a per-generation measure_._

      (3) The extraordinary diversity of DBL$\alpha$ presents challenges to analyzing the data. The authors explore the variability in repertoire richness and frequency over the course of the study, noting that richness rapidly declined following IRS and later rebounded, while the frequency of rare types increased, and then later declined back to baseline levels. The authors attribute this to fundamental changes in population structure. While there may have been some changes to the population, the observed differences in richness as well as frequency before and after IRS may also be compatible with simply sampling fewer cases, and thus fewer DBL$\alpha$ sequences. The shift back to frequency and richness that is similar to pre-IRS also coincides with a similar total number of samples collected. The authors explore this to some degree with their survival analysis, demonstrating that a substantial number of rare sequences did not persist between timepoints and that rarer sequences had a higher probability of dropping out. This might also be explained by the extreme stochasticity of the highly diverse DBL$\alpha$, especially for rare sequences that are observed only once, rather than any fundamental shifts in the population structure.

      We thank the reviewer raising this question which led us to consider whether the change in the number of DBLα types over the course of the study (and intervention) follows from simply sampling fewer P. falciparum cases. We interpreted this question as basically meaning that one can predict the former from the latter in a simple way, and that therefore, tracking the changes in DBLα type diversity would be unnecessary.  A simple map would be for example a linear relationship (a given proportion of DBLα types lost given genomes lost), and even more trivially, a linear loss with a slope of one (same proportion).  Note, however, that for such expectations, one needs to rely on some knowledge of strain structure and gene composition. In particular, we would need to assume a complete lack of overlap and no gene repeats in a given genome. We have previously shown that immune selection leads to selection for minimum overlap and distinct genes in repertoires at high transmission (see for example (He et al., 2018)) for theoretical and empirical evidence of both patterns). Also, since the size of the gene pool is very large, even random repertoires would lead to limited overlap (even though the empirical overlap is even smaller than that expected at random (Day et al., 2017)). Despite these conservators, we cannot a priori assume a pattern of complete non-overlap and distinct genes, and ignore plausible complexities introduced by the gene frequency distribution.  

      To examine this insightful question, we simulated the loss of a given proportion of genomes from baseline in 2012 and examined the resulting loss of DBLα types. We specifically cumulated the loss of infections in individuals until it reached a given proportion (we can do this on the basis of the estimated individual MOI values). We repeated this procedure 500 times for each proportion, as the random selection of individual infection to be removed, introduces some variation. Figure 2 below shows that the relationship is nonlinear, and that one quantity is not a simple proportion of the other.  For example, the loss of half the genomes does not result in the loss of half the DBLα types. 

      Author response image 1.

      Non-linear relationship between the loss of DBLα types and the loss of a given proportion of genomes. The graph shows that the removal of parasite genomes from the population through intervention does not lead to the loss of the same proportion of DBLα types, as the initial removal of genomes involves the loss of rare DBLα types mostly whereas common DBLα types persist until a high proportion of genomes are lost. The survey data (pink dots) used for this subsampling analysis was sampled at the end of wet/high transmission season in Oct 2012 from Bongo District from northern Ghana. We used the Bayesian formulation of the _var_coding method proposed in this work to calculate the multiplicity of infection of each isolate to further obtain the total number of genomes. The randomized surveys (black dots) were obtained based on “curveball algorithm” (Strona et al., 2014) which keep isolate lengths and type frequency distribution.

      We also investigated whether the resulting pattern changed significantly if we randomized the composition of the isolates.  We performed such randomization with the “curveball algorithm” (Strona et al., 2014). This algorithm randomizes the presence-absence matrix with rows corresponding to the isolates and columns, to the different DBLα types; importantly, it preserves the DBLα type frequency and the length of isolates. We generated 500 randomizations and repeated the simulated loss of genomes as above. The data presented in Figure 2 above show that the pattern is similar to that obtained for the empirical data presented in this study in Ghana. We interpret this to mean that the number of genes is so large, that the reduced overlap relative to random due to immune selection (see (Day et al., 2017)) does not play a key role in this specific pattern. 

      Reviewer #2 (Public Review):  

      In this manuscript, Tiedje and colleagues longitudinally track changes in parasite numbers across four time points as a way of assessing the effect of malaria control interventions in Ghana. Some of the study results have been reported previously, and in this publication, the authors focus on age-stratification of the results. Malaria prevalence was lower in all age groups after IRS. Follow-up with SMC, however, maintained lower parasite prevalence in the targeted age group but not the population as a whole. Additionally, they observe that diversity measures rebounds more slowly than prevalence measures. Overall, I found these results clear, convincing, and well-presented. They add to a growing literature that demonstrates the relevance of asymptomatic reservoirs.  There is growing interest in developing an expanded toolkit for genomic epidemiology in malaria, and detecting changes in transmission intensity is one major application. As the authors summarize, there is no one-size-fits-all approach, and the Bayesian MOIvar estimate developed here has the potential to complement currently used methods. I find its extension to a calculation of absolute parasite numbers appealing as this could serve as both a conceptually straightforward and biologically meaningful metric. However, I am not fully convinced the current implementation will be applied meaningfully across additional studies. 

      (1) I find the term "census population size" problematic as the groups being analyzed (hosts grouped by age at a single time point) do not delineate distinct parasite populations. Separate parasite lineages are not moving through time within these host bins. Rather, there is a single parasite population that is stochastically divided across hosts at each time point. I find this distinction important for interpreting the results and remaining mindful that the 2,000 samples at each time point comprise a subsample of the true population. Instead of "census population size", I suggest simplifying it to "census count" or "parasite lineage count".  It would be fascinating to use the obtained results to model absolute parasite numbers at the whole population level (taking into account, for instance, the age structure of the population), and I do hope this group takes that on at some point even if it remains outside the scope of this paper. Such work could enable calculations of absolute---rather than relative---fitness and help us further understand parasite distributions across hosts.

      Lineages moving exclusively through a given type of host or “patch”  are not a necessary requirement for enumerating the size of the total infections in such subset.  It is true that what we have is a single parasite population, but we are enumerating for the season the respective size in host classes (children and adults). This is akin to enumerating subsets of a population in ecological settings where one has multiple habitat patches, with individuals able to move across patches.

      Remaining mindful that the count is relative to sample size is an important point. Please see our response to comment (2) of reviewer 1, also for the choice of terminology. We prefer not to adopt “census count” as a census in our mind is a count, and we are not clear on the concept of lineage for these highly recombinant parasites.  Also, census population size has been adopted already in the literature for both pathogens and non-pathogens, to make a distinction with the notion of effective population size in population genetics (see our response to reviewer 1) and is consistent with our usage as outlined in the introduction. 

      Thank you for the comment on an absolute number which would extrapolate to the whole host population.  Please see again our response to comment (2) of reviewer 1, on how we can use mean MOI for this purpose once the sampling is sufficient for this quantity to become constant/stable with sampling effort.

      (2) I'm uncertain how to contextualize the diversity results without taking into account the total number of samples analyzed in each group. Because of this, I would like a further explanation as to why the authors consider absolute parasite count more relevant than the combined MOI distribution itself (which would have sample count as a denominator). It seems to me that the "per host" component is needed to compare across age groups and time points---let alone different studies.

      Again, thank you for the insightful comment. We provide this number as a separate quantity and not a distribution, although it is clearly related to the mean MOI of such distribution. It gives a tangible sense for the actual infection count (different from prevalence) from the perspective of the parasite population in the ecological sense. The “per host” notion which enables an extrapolation to any host population size for the purpose of a complete count, or for comparison with another study site, has been discussed in the above responses for reviewer 1 and now in the revision of the discussion.

      (3) Thinking about the applicability of this approach to other studies, I would be interested in a larger treatment of how overlapping DBLα repertoires would impact MOIvar estimates. Is there a definable upper bound above which the method is unreliable? Alternatively, can repertoire overlap be incorporated into the MOI estimator? 

      This is a very good point and one we now discuss further in our revision. There is no predefined upper bound one can present a priori. Intuitively, the approach to estimate MOI would appear to breakdown as overlap moves away from extremely low values, and therefore for locations with low transmission intensity.  Interestingly, we have observed that this is not the case in our paper by Labbe et al. (Labbé et al., 2023) where we used model simulations in a gradient of three transmission intensities, from high to low values. The original _var_coding method performed well across the gradient. This robustness may arise from a nonlinear and fast transition from low to high overlap that is accompanied by MOI changing rapidly from primarily multiclonal (MOI > 1) to monoclonal (MOI = 1). This matter clearly needs to be investigated further, including ways to extend the estimation to explicitly include the distribution of overlap.

      Smaller comments:

      - Figure 1 provides confidence intervals for the prevalence estimates, but these aren't carried through on the other plots (and Figure 5 has lost CIs for both metrics). The relationship between prevalence and diversity is one of the interesting points in this paper, and it would be helpful to have CIs for both metrics when they are directly compared. 

      Based on the reviewer’s advice we have revised both Figure 4 and Figure 5, to include the missing uncertainty intervals. The specific approach for each quantity is described in the corresponding caption.

      Reviewer #3 (Public Review): 

      Summary: 

      The manuscript coins a term "the census population size" which they define from the diversity of malaria parasites observed in the human community. They use it to explore changes in parasite diversity in more than 2000 people in Ghana following different control interventions. 

      Strengths: 

      This is a good demonstration of how genetic information can be used to augment routinely recorded epidemiological and entomological data to understand the dynamics of malaria and how it is controlled. The genetic information does add to our understanding, though by how much is currently unclear (in this setting it says the same thing as age-stratified parasite prevalence), and its relevance moving forward will depend on the practicalities and cost of the data collection and analysis. Nevertheless, this is a great dataset with good analysis and a good attempt to understand more about what is going on in the parasite population. 

      Census population size is complementary to parasite prevalence where the former gives a measure of the “parasite population size”, and the latter describes the “proportion of infected hosts”.  The reason we see similar trends for the “genetic information” (i.e., census population size) and “age-specific parasite prevalence” is because we identify all samples for var_coding based on the microscopy (i.e., all microscopy positive _P. falciparum isolates). But what is more relevant here is the relative percentage change in parasite prevalence and census population size following the IRS intervention. To make this point clearer in the revised manuscript we have updated Figure 4 and included additional panels plotting this percentage change from the 2012 baseline, for both census population size and prevalence (Figure 4EF). Overall, we see a greater percentage change in 2014 (and 2015), relative to the 2012 baseline, for census parasite population size vs. parasite prevalence (Figure 4EF) as a consequence of the significant changes in distributions of MOI following the IRS intervention (Figure 3). As discussed in the Results following the deployment of IRS in 2014 census population size decreased by 72.5% relative to the 2012 baseline survey (pre-IRS) whereas parasite prevalence only decreased by 54.5%. 

      With respect to the reviewer’s comment on “practicalities and cost”, var_coding has been used to successfully amplify _P. falciparum DNA collected as DBS that have been stored for more than 5-years from both clinical and lower density asymptomatic infection, without the additional step and added cost of sWGA ($8 to $32 USD per isolates, for costing estimates see (LaVerriere et al., 2022; Tessema et al., 2020)), which is currently required by other molecular surveillance methods (Jacob et al., 2021; LaVerriere et al., 2022; Oyola et al., 2016). _Var_coding involves a single PCR per isolate using degenerate primers, where a large number of isolates can be multiplexed into a single pool for amplicon sequencing.  Thus, the overall costs for incorporating molecular surveillance with _var_coding are mainly driven by the number of PCRs/clean-ups, the number samples indexed per sequencing run, and the NGS technology used (discussed in more detail in our publication Ghansah et al. (Ghansah et al., 2023)). Previous work has shown that _var_coding can be use both locally and globally for molecular surveillance, without the need to be customized or updated, thus it can be fairly easily deployed in malaria endemic regions (Chen et al., 2011; Day et al., 2017; Rougeron et al., 2017; Ruybal-Pesántez et al., 2022, 2021; Tonkin-Hill et al., 2021).

      Weaknesses: 

      Overall the manuscript is well-written and generally comprehensively explained. Some terms could be clarified to help the reader and I had some issues with a section of the methods and some of the more definitive statements given the evidence supporting them. 

      Thank you for the overall positive assessment. On addressing the “issues with a section of the methods” and “some of the more definitive statements given the evidence supporting them”, it is impossible to do so however, without an explicit indication of which methods and statements the reviewer is referring to. Hopefully, the answers to the detailed comments and questions of reviewers 1 and 2 address any methodological concerns (i.e., in the Materials and Methods and Results). To the issue of “definitive statements”, etc. we are unable to respond without further information.

      Recommendations For The Authors:

      Reviewer #1 (Recommendations For The Authors):

      Line 273: there is a reference to a figure which supports the empirical distribution of repertoire given MOI = 1, but the figure does not appear to exist.

      We now included the correct figure for the repertoire size distribution as Figure supplement 3 (previously published in Labbé et al (Labbé et al., 2023)). This figure was accidently forgotten when the manuscript was submitted for review, we thank the reviewer for bringing this to our attention.

      Line 299: while this likely makes little difference, an insignificant result from a Kolmogorov-Smirnov test doesn't tell you if the distributions are the same, it only means there is not enough evidence to determine they are different (i.e. fail to reject the null). Also, what does the "mean MOI difference" column in supplementary table 3 mean? 

      The mean MOI difference is the difference in the mean value between the pairwise comparison of the true population-level MOI distribution, that of the population-level MOI estimates from either pooling the maximum a posteriori (MAP) estimates per individual host or the mixture distribution, or that of the population-level MOI estimates from different prior choices. This is now clarified as requested in the Table supplements 3 - 6. 

      Figure 4: how are the confidence intervals for the estimated number of var repertoires calculated? Also should include horizontal error bars for prevalence measures.

      The confidence intervals were calculated based on a bootstrap approach. We re-sampled 10,000 replicates from the original population-level MOI distribution with replacement. Each resampled replicate is the same size as the original sample. We then derive the 95% CI based on the distribution of the mean MOI of those resampled replicates. This is now clarified as requested in the Figure 4 caption (as well as Table supplement 7 footnotes). In addition, we have also updated Figure 4AB and have included the 95% CI for all measures for clarity. 

      Reviewer #2 (Recommendations For The Authors): 

      -  I would like to see a plot like Supplemental Figure 8 for the upsA DBLα repertoire size. 

      The upsA repertoire size for each survey and by age group has now been provided as requested in Figure supplement 5AB. 

      -  Supplemental Table 2 is cut off in the pdf. 

      We have now resolved this issue so that the Table supplement 2 is no longer cut off.  

      Reviewer #3 (Recommendations For The Authors): 

      The manuscript terms the phrase "census population size". To me, the census is all about the number of individuals, not necessarily their diversity. I appreciate that there is no simple term for this, and I imagine the authors have considered many alternatives, but could it be clearer to say the "genetic census population size"? For example, I found the short title not particularly descriptive "Impact of IRS and SMC on census population size", which certainly didn't make me think of parasite diversity.

      Please see our response to comment (2) of reviewer 1. We prefer not to add “genetic” to the phrase as the distinction from effective population size from population genetics is important, and the quantity we are after is an ecological one. 

      The authors do not currently say much about the potential biases in the genetic data and how this might influence results. It seems likely that because (i) patients with sub-microscopic parasitaemia were not sampled and (ii) because a moderate number of (likely low density) samples failed to generate genetic data, that the observed MOI is an overestimate. I'd be interested to hear the authors' thoughts about how this could be overcome or taken into account in the future. 

      We thank the reviewer for this this comment and agree that this is an interesting area for further consideration. However, based on research from the Day Lab that is currently under review (Tan et al. 2024, under review), the estimated MOI using the Bayesian approach is likely not an “overestimate” but rather an “underestimate”. In this research by Tan et al. (2024) isolate MOI was estimated and compared using different initial whole blood volumes (e.g., 1, 10, 50, 100 uL) for the gDNA extraction. Using _var_coding and comparing these different volumes it was found that MOI was significantly “underestimated” when small blood volumes were used for the gDNA extraction, i.e., there was a ~3-fold increase in median MOI between 1μL and 100μL blood. Ultimately these findings will allow us to make computational corrections so that more accurate estimates of MOI can be obtained from the DBS in the future.

      The authors do not make much of LLIN use and for me, this can explain some of the trends. The first survey was conducted soon after a mass distribution whereas the last was done at least a year after (when fewer people would have been using the nets which are older and less effective). We have also seen a rise in pyrethroid resistance in the mosquito populations of the area which could further diminish the LLIN activity. This difference in LLIN efficacy between the first and last survey could explain similar prevalence, yet lower diversity (in Figures 4B/5). However, it also might mean that statements such as Line 478 "This is indicative of a loss of immunity during IRS which may relate to the observed loss of var richness, especially the many rare types" need to be tapered as the higher prevalence observed in this age group could be caused by lower LLIN efficacy at the time of the last survey, not loss of immunity (though both could be true).  

      We thank the reviewer for this question and agree that (i) LLIN usage and (ii) pyrethroid resistance are important factors to consider. 

      (i) Over the course of this study self-reported LLIN usage the previous night remained high across all age groups in each of the surveys (≥ 83.5%), in fact more participants reported sleeping under an LLIN in 2017 (96.8%) following the discontinuation of IRS compared to the 2012 baseline survey (89.1%). This increase in LLIN usage in 2017 is likely a result of several factors including a rebound in the local vector population making LLINs necessary again, increased community education and/or awareness on the importance of using LLINs, among others. Information on the LLINs (i.e., PermaNet 2.0, Olyset, or DawaPlus 2.0) distributed and participant reported usage the previous night has now been included in the Materials and Methods as requested by the reviewer.

      (ii) As to the reviewer’s question on increased in pyrethroid resistance in Ghana over the study period, research undertaken by our entomology collaborators (Noguchi Memorial Insftute for Medical Research: Profs. S. Dadzie and M. Appawu; and Navrongo Health Research Centre:  Dr. V. Asoala) has shown that pyrethroid resistance is a major problem across the country, including the Upper East Region. Preliminary studies from Bongo District (2013 - 2015), were undertaken to monitor for mutations in the voltage gated sodium channel gene that have been associated with knockdown resistance to pyrethroids and DDT in West Africa (kdr-w). Through this analysis the homozygote resistance kdr-w allele (RR) was found in 90% of An. gambiae s.s. samples tested from Bongo, providing evidence of high pyrethroid resistance in Bongo District dating back to 2013, i.e., prior to the IRS intervention (S. Dadzie, M. Appawu, personal communication). Although we do not have data in Bongo District on kdr-w from 2017 (i.e., post-IRS), we can hypothesize that pyrethroid resistance likely did not decline in the area, given the widespread deployment and use of LLINs.

      Thus, given this information that (i) self-reported LLIN usage remained high in all surveys (≥ 83.5%), and that (ii) there was evidence of high pyrethroid resistance in 2013 (i.e., kdr-w (RR) _~_90%), the rebound in prevalence observed for the older age groups (i.e., adolescents and adults) in 2017 is therefore best explained by a loss of immunity.

      I must confess I got a little lost with some of the Bayesian model section methods and the figure supplements. Line 272 reads "The measurement error is simply the repertoire size distribution, that is, the distribution of the number of non-upsA DBLα types sequenced given MOI = 1, which is empirically available (Figure supplement 3)." This does not appear correct as this figure is measuring kl divergence. If this is not a mistake in graph ordering please consider explaining the rationale for why this graph is being used to justify your point. 

      We now included the correct figure for the repertoire size distribution as Figure supplement 3 (previously published in Labbé et al (Labbé et al., 2023)). This figure was accidently forgotten when the manuscript was submitted for review, we thank the reviewer for bringing our attention to this matter. We hope that the inclusion of this Figure as well as a more detailed description of the Bayesian approach helps to makes this section in the Materials and Methods clearer for the reader. 

      I was somewhat surprised that the choice of prior for estimating the MOI distribution at the population level did not make much difference. To me, the negative binomial distribution makes much more sense. I was left wondering, as you are only measuring MOI in positive individuals, whether you used zero truncated Poisson and zero truncated negative binomial distributions, and if not, whether this was a cause of a lack of difference between uniform and other priors. 

      Thank you for the relevant question. We have indeed considered different priors and the robustness of our  estimates to this choice and have now better described this in the text. We focused on individuals who had a confirmed microscopic asymptomatic P. falciparum infection for our MOI estimation, as median P. falciparum densities were overall low in this population during each survey (i.e., median ≤ 520 parasites/µL, see Table supplement 1). Thus, we used either a uniform prior excluding zero or a zero truncated negative binomial distribution when exploring the impact of priors on the final population-level MOI distribution.  A uniform prior and a zero-truncated negative binomial distribution with parameters within the range typical of high-transmission endemic regions (higher mean MOI with tails around higher MOI values) produce similar MOI  estimates at both the individual and population level. However, when setting the parameter range of the zero-truncated negative binomial to be of those in low transmission endemic regions where the empirical MOI distribution centers around mono-clonal infections with the majority of MOI = 1 or 2 (mean MOI » 1.5, no tail around higher MOI values), the final population-level MOI distribution does deviate more from that assuming the aforementioned prior and parameter choices. The final individual- and population-level MOI estimates are not sensitive to the specifics of the prior MOI distribution as long as this distribution captures the tail around higher MOI values with above-zero probability.   

      The high MOI in children <5yrs in 2017 (immediately after SMC) is very interesting. Any thoughts on how/why? 

      This result indicates that although the prevalence of asymptomatic P. falciparum infections remained significantly lower for the younger children targeted by SMC in 2017 compared 2012, they still carried multiclonal infections, as the reviewer has pointed out (Figure 3B). Importantly this upward shift in the MOI distributions (and median MOI) was observed in all age groups in 2017, not just the younger children, and provides evidence that transmission intensity in Bongo has rebounded in 2017, 32-months a er the discontinuation of IRS.  This increase in MOI for younger children at first glance may seem to be surprising, but instead likely shows the limitations of SMC to clear and/or supress the establishment of newly acquired infections, particularly at the end of the transmission season following the final cycle of SMC (i.e., end of September 2017 in Bongo District; NMEP/GHS, personal communication) when the posttreatment prophylactic effects of SMC would have waned (Chotsiri et al., 2022).  

      Line 521 in the penultimate paragraph says "we have analysed only low density...." should this not be "moderate" density, as low density infections might not be detected? The density range itself is not reported in the manuscript so could be added. 

      In Table supplement 1 we have provided the median, including the inter-quartile range, across each survey by age group. For the revision we have now provided the density min-max range, as requested by the reviewer. Finally, we have revised the statement in the discussion so that it now reads “….we have analysed low- to moderate-density, chronic asymptomatic infections (see Table supplement 1)……”.   

      Data availability - From the text the full breakdown of the epidemiological survey does not appear to be available, just a summary of defined age bounds in the SI. Provision of these data (with associated covariates such as parasite density and host characteristics linked to genetic samples) would facilitate more in-depth secondary analyses. 

      To address this question, we have updated the “Data availability statement” section with the following statement: “All data associated with this study are available in the main text, the Supporting Information, or upon reasonable request for research purposes to the corresponding author, Prof. Karen Day (karen.day@unimelb.edu.au).”  

      REFERENCES

      Bedford T, Cobey S, Pascual M. 2011. Strength and tempo of selection revealed in viral gene genealogies. BMC Evol Biol 11. doi:10.1186/1471-2148-11-220

      Chen DS, Barry AE, Leliwa-Sytek A, Smith T-AA, Peterson I, Brown SM, Migot-Nabias F, Deloron P, Kortok MM, Marsh K, Daily JP, Ndiaye D, Sarr O, Mboup S, Day KP. 2011. A molecular epidemiological study of var gene diversity to characterize the reservoir of Plasmodium falciparum in humans in Africa. PLoS One 6:e16629. doi:10.1371/journal.pone.0016629

      Chotsiri P, White NJ, Tarning J. 2022. Pharmacokinetic considerations in seasonal malaria chemoprevention. Trends Parasitol. doi:10.1016/j.pt.2022.05.003

      Day KP, Artzy-Randrup Y, Tiedje KE, Rougeron V, Chen DS, Rask TS, Rorick MM, Migot-Nabias F, Deloron P, Luty AJF, Pascual M. 2017. Evidence of Strain Structure in Plasmodium falciparum Var Gene Repertoires in Children from Gabon, West Africa. PNAS 114:E4103–E4111. doi:10.1073/pnas.1613018114

      Ghansah A, Tiedje KE, Argyropoulos DC, Onwona CO, Deed SL, Labbé F, Oduro AR, Koram KA, Pascual M, Day KP. 2023. Comparison of molecular surveillance methods to assess changes in the population genetics of Plasmodium falciparum in high transmission. Fron9ers in Parasitology 2:1067966. doi: 10.3389/fpara.2023.1067966

      He Q, Pilosof S, Tiedje KE, Ruybal-Pesántez S, Artzy-Randrup Y, Baskerville EB, Day KP, Pascual M. 2018. Networks of genetic similarity reveal non-neutral processes shape strain structure in Plasmodium falciparum. Nat Commun 9:1817. doi:10.1038/s41467-018-04219-3

      Jacob CG, Thuy-nhien N, Mayxay M, Maude RJ, Quang HH, Hongvanthong B, Park N, Goodwin S, Ringwald P, Chindavongsa K, Newton P, Ashley E. 2021. Genetic surveillance in the Greater Mekong subregion and South Asia to support malaria control and elimination. Elife 10:1–22.

      Labbé F, He Q, Zhan Q, Tiedje KE, Argyropoulos DC, Tan MH, Ghansah A, Day KP, Pascual M. 2023. Neutral vs . non-neutral genetic footprints of Plasmodium falciparum multiclonal infections. PLoS Comput Biol 19:e1010816. doi:doi.org/10.1101/2022.06.27.497801

      LaVerriere E, Schwabl P, Carrasquilla M, Taylor AR, Johnson ZM, Shieh M, Panchal R, Straub TJ, Kuzma R, Watson S, Buckee CO, Andrade CM, Portugal S, Crompton PD, Traore B, Rayner JC, Corredor V, James K, Cox H, Early AM, MacInnis BL, Neafsey DE. 2022. Design and implementation of multiplexed amplicon sequencing panels to serve genomic epidemiology of infectious disease: A malaria case study. Mol Ecol Resour 2285–2303. doi:10.1111/1755-0998.13622

      Oyola SO, Ariani C V., Hamilton WL, Kekre M, Amenga-Etego LN, Ghansah A, Rutledge GG, Redmond S, Manske M, Jyothi D, Jacob CG, Ogo TD, Rockeg K, Newbold CI, Berriman M, Kwiatkowski DP. 2016. Whole genome sequencing of Plasmodium falciparum from dried blood spots using selecFve whole genome amplification. Malar J 15:1–12. doi:10.1186/s12936-016-1641-7

      Palstra FP, Fraser DJ. 2012. Effective/census population size ratio estimation: A compendium and appraisal. Ecol Evol 2:2357–2365. doi:10.1002/ece3.329

      Rougeron V, Tiedje KE, Chen DS, Rask TS, Gamboa D, Maestre A, Musset L, Legrand E, Noya O, Yalcindag E, Renaud F, Prugnolle F, Day KP. 2017. Evolutionary structure of Plasmodium falciparum major variant surface antigen genes in South America : Implications for epidemic transmission and surveillance. Ecol Evol 7:9376–9390. doi:10.1002/ece3.3425

      Ruybal-Pesántez S, Sáenz FE, Deed S, Johnson EK, Larremore DB, Vera-Arias CA, Tiedje KE, Day KP. 2021. Clinical malaria incidence following an outbreak in Ecuador was predominantly associated with Plasmodium falciparum with recombinant variant antigen gene repertoires. medRxiv.

      Ruybal-Pesántez S, Tiedje KE, Pilosof S, Tonkin-Hill G, He Q, Rask TS, Amenga-Etego L, Oduro AR, Koram KA, Pascual M, Day KP. 2022. Age-specific patterns of DBLa var diversity can explain why residents of high malaria transmission areas remain susceptible to Plasmodium falciparum blood stage infection throughout life. Int J Parasitol 20:721–731.

      Strona G, Nappo D, Boccacci F, Fagorini S, San-Miguel-Ayanz J. 2014. A fast and unbiased procedure to randomize ecological binary matrices with fixed row and column totals. Nat Commun 5. doi:10.1038/ncomms5114

      Tessema SK, Hathaway NJ, Teyssier NB, Murphy M, Chen A, Aydemir O, Duarte EM, Simone W, Colborn J, Saute F, Crawford E, Aide P, Bailey JA, Greenhouse B. 2020. Sensitive, highly multiplexed sequencing of microhaplotypes from the Plasmodium falciparum heterozygome. Journal of Infec9ous Diseases 225:1227–1237.

      Tonkin-Hill G, Ruybal-Pesántez S, Tiedje KE, Rougeron V, Duffy MF, Zakeri S, Pumpaibool T, Harnyuganakorn P, Branch OH, Ruiz-Mesıa L, Rask TS, Prugnolle F, Papenfuss AT, Chan Y, Day KP. 2021. Evolutionary analyses of the major variant surface antigen-encoding genes reveal population structure of Plasmodium falciparum within and between continents. PLoS Genet 7:e1009269. doi:10.1371/journal.pgen.1009269

    1. eLife Assessment

      This valuable study reports multi-scale molecular dynamics simulations to investigate a class of highly potent antibodies that simultaneously engage with the HIV-1 Envelope trimer and the viral membrane. The work provides insights into how broadly neutralizing antibodies associate with lipids proximal to membrane-associated epitopes to drive neutralization. After extensive revision, the level of evidence is considered solid, although a quantitative assessment of the underlying energetics remain difficult to obtain.

    2. Reviewer #1 (Public review):

      Previous experimental studies demonstrated that membrane association drives avidity for several potent broadly HIV-neutralizing antibodies and its loss dramatically reduces neutralization. In this study, the authors present a tour de force analysis of molecular dynamics (MD) simulations that demonstrate how several HIV-neutralizing membrane-proximal external region (MPER)-targeting antibodies associate with a model lipid bilayer.

      First, the authors compared how three MPER antibodies, 4E10, PGZL1, and 10E8, associated with model membranes, constructed with two lipid compositions similar to native viral membranes. They found that the related antibodies 4E10 and PGZL1 strongly associate with a phospholipid near heavy chain loop 1, consistent with prior crystallographic studies. They also discovered that a previously unappreciated framework region between loops 2-3 in the 4E10/PGZL1 heavy chain contributes to membrane association. Simulations of 10E8, an antibody from a different lineage, revealed several differences from published X-ray structures. Namely, a phosphatidylcholine binding site was offset and includes significant interaction with a nearby framework region. The revised manuscript demonstrates that these lipid interactions are robust to alterations in membrane composition and rigidity. However, it does not address the reverse-that phospholipids known experimentally not to associate with these antibodies (if any such lipids exist) also fail to interact in MD simulations.

      Next, the authors simulate another MPER-targeting antibody, LN01, with a model HIV membrane either containing or missing an MPER antigen fragment within. Of note, LN01 inserts more deeply into the membrane when the MPER antigen is present, supporting an energy balance between the lowest energy conformations of LN01, MPER, and the complex. These simulations recapitulate lipid binding interactions solved in published crystallographic studies but also lead to the discovery of a novel lipid binding site the authors term the "Loading Site", which could guide future experiments with this antibody.

      The authors next established course-grained (CG) MD simulations of the various antibodies with model membranes to study membrane embedding. These simulations facilitated greater sampling of different initial antibody geometries relative to membrane. These CG simulations , which cannot resolve atomistic interactions, are nonetheless compelling because negative controls (ab 13h11, BSA) that should not associate with membrane indeed sample significantly less membrane.

      Distinct geometries derived from CG simulations were then used to initialize all-atom MD simulations to study insertion in finer detail (e.g., phospholipid association), which largely recapitulate their earlier results, albeit with more unbiased sampling. The multiscale model of an initial CG study with broad geometric sampling, followed by all-atom MD, provides a generalized framework for such simulations.

      Finally, the authors construct velocity pulling simulations to estimate the energetics of antibody membrane embedding. Using the multiscale modelling workflow to achieve greater geometric sampling, they demonstrate that their model reliably predicts lower association energetics for known mutations in 4E10 that disrupt lipid binding. However, the model does have limitations: namely, its ability to predict more subtle changes along a lineage-intermediate mutations that reduce lipid binding are indistinguishable from mutations that completely ablate lipid association. Thus, while large/binary differences in lipid affinity might be predictable, the use of this method as a generative model are likely more limited.

      The MD simulations conducted throughout are rigorous and the analysis are extensive, creative, and biologically inspired. Overall, these analyses provide an important mechanistic characterization of how broadly neutralizing antibodies associate with lipids proximal to membrane-associated epitopes to drive neutralization.

    3. Reviewer #2 (Public review):

      In this study, Maillie et al. have carried out a set of multiscale molecular dynamics simulations to investigate the interactions between the viral membrane and four broadly neutralizing antibodies that target the membrane proximal exposed region (MPER) of the HIV-1 envelope trimer. The simulation recapitulated in several cases the binding sites of lipid head groups that were observed experimentally by X-ray crystallography, as well as some new binding sites. These binding sites were further validated using a structural bioinformatics approach. Finally, steered molecular dynamics was used to measure the binding strength between the membrane and variants of the 4E10 and PGZL1 antibodies.

      The use of multiscale MD simulations allows for a detailed exploration of the system at different time and length scales. The combination of MD simulations and structural bioinformatics provides a comprehensive approach to validate the identified binding sites. Finally, the steered MD simulations offer quantitative insights into the binding strength between the membrane and bnAbs.

      While the simulations and analyses provide qualitative insights into the binding interactions, they do not offer a quantitative assessment of energetics. The coarse-grained simulations exhibit artifacts and thus require careful analysis.

      This study contributes to a deeper understanding of the molecular mechanisms underlying bnAb recognition of the HIV-1 envelope. The insights gained from this work could inform the design of more potent and broadly neutralizing antibodies.

    4. Author response:

      The following is the authors’ response to the original reviews.

      Public Reviews:

      Reviewer #1 (Public Review):

      Previous experimental studies demonstrated that membrane association drives avidity for several potent broadly HIV-neutralizing antibodies and its loss dramatically reduces neutralization. In this study, the authors present a tour de force analysis of molecular dynamics (MD) simulations that demonstrate how several HIV-neutralizing membrane-proximal external region (MPER)-targeting antibodies associate with a model lipid bilayer.

      First, the authors compared how three MPER antibodies, 4E10, PGZL1, and 10E8, associated with model membranes, constructed with a lipid composition similar to the native virion. They found that the related antibodies 4E10 and PGZL1 strongly associate with a phospholipid near heavy chain loop 1, consistent with prior crystallographic studies. They also discovered that a previously unappreciated framework region between loops 2-3 in the 4E10/PGZL1 heavy chain contributes to membrane association. Simulations of 10E8, an antibody from a different lineage, revealed several differences from published X-ray structures. Namely, a phosphatidylcholine binding site was offset and includes significant interaction with a nearby framework region.

      Next, the authors simulate another MPER-targeting antibody, LN01, with a model HIV membrane either containing or missing an MPER antigen fragment within. Of note, LN01 inserts more deeply into the membrane when the MPER antigen is present, supporting an energy balance between the lowest energy conformations of LN01, MPER, and the complex. Additional contacts and conformational restraints imposed by ectodomain regions of the envelope glycoprotein, however, remain unaddressed-the size of such simulations likely runs into technical limitations including sampling and compute time.

      The authors next established course-grained (CG) MD simulations of the various antibodies with model membranes to study membrane embedding. These simulations facilitated greater sampling of different initial antibody geometries relative to membrane. Distinct geometries derived from CG simulations were then used to initialize all-atom MD simulations to study insertion in finer detail (e.g., phospholipid association), which largely recapitulate their earlier results, albeit with more unbiased sampling. The multiscale model of an initial CG study with broad geometric sampling, followed by all-atom MD, provides a generalized framework for such simulations.

      Finally, the authors construct velocity pulling simulations to estimate the energetics of antibody membrane embedding. Using the multiscale modelling workflow to achieve greater geometric sampling, they demonstrate that their model reliably predicts lower association energetics for known mutations in 4E10 that disrupt lipid binding. However, the model does have limitations: namely, its ability to predict more subtle changes along a lineage-intermediate mutations that reduce lipid binding are indistinguishable from mutations that completely ablate lipid association. Thus, while large/binary differences in lipid affinity might be predictable, the use of this method as a generative model are likely more limited.

      The MD simulations conducted throughout are rigorous and the analysis are extensive. However, given the large amount of data presented within the manuscript, the text would benefit from clearer subsections that delineate discrete mechanistic discoveries, particularly for experimentalists interested in antibody discovery and design. One area the paper does not address involves the polyreactivity associated with membrane binding antibodies-MD simulations and/or pulling velocity experiments with model membranes of different compositions, with and without model antigens, would be needed. Finally, given the challenges in initializing these simulations and their limitations, the text regarding their generalized use for discovery, rather than mechanism, could be toned down.

      Overall, these analyses provide an important mechanistic characterization of how broadly neutralizing antibodies associate with lipids proximal to membrane-associated epitopes to drive neutralization.

      Reviewer #2 (Public Review):

      In this study, Maillie et al. have carried out a set of multiscale molecular dynamics simulations to investigate the interactions between the viral membrane and four broadly neutralizing antibodies that target the membrane proximal exposed region (MPER) of the HIV-1 envelope trimer. The simulation recapitulated in several cases the binding sites of lipid head groups that were observed experimentally by X-ray crystallography, as well as some new binding sites. These binding sites were further validated using a structural bioinformatics approach. Finally, steered molecular dynamics was used to measure the binding strength between the membrane and variants of the 4E10 and PGZL1 antibodies.

      The conclusions from the paper are mostly well supported by the simulations, however, they remain very descriptive and the key findings should be better described and validated. In particular:

      It has been shown that the lipid composition of HIV membrane is rich in cholesterol [1], which accounts for almost 50% molar ratio. The authors use a very different composition and should therefore provide a reference. It has been shown for 4E10 that the change in lipid composition affects dynamics of the binding. The robustness of the results to changes of the lipid composition should also be reported.

      The real advantage of the multiscale approach (coarse grained (CG) simulation followed by a back-mapped all atom simulation) remains unclear. In most cases, the binding mode in the CG simulations seem to be an artifact.

      The results reported in this study should be better compared to available experimental data. For example how does the approach angle compare to cryo-EM structure of the bnAbs engaging with the MPER region, e.g. [2-3]? How do these results from this study compare to previous molecular dynamics studies, e.g.[4-5]?

      References<br /> (1) Brügger, Britta, et al. "The HIV lipidome: a raft with an unusual composition." Proceedings of the National Academy of Sciences 103.8 (2006): 2641-2646.<br /> (2) Rantalainen, Kimmo, et al. "HIV-1 envelope and MPER antibody structures in lipid assemblies." Cell Reports 31.4 (2020).<br /> (3) Yang, Shuang, et al. "Dynamic HIV-1 spike motion creates vulnerability for its membrane-bound tripod to antibody attack." Nature Communications 13.1 (2022): 6393.<br /> (4) Carravilla, Pablo, et al. "The bilayer collective properties govern the interaction of an HIV-1 antibody with the viral membrane." Biophysical Journal 118.1 (2020): 44-56.<br /> (5) Pinto, Dora, et al. "Structural basis for broad HIV-1 neutralization by the MPER-specific human broadly neutralizing antibody LN01." Cell host & microbe 26.5 (2019): 623-637.

      Considering reviewer suggestions, we slightly reorganized the results section into specific sub-sections with headings and changed the order in which key results were presented to allow the subsequent analysis more accessible for readers.  Supplemental materials were redistributed into eLife format, having each supplemental item grouped to a corresponding main figure. Many slightly detail modifications were made to figures (mostly supplemental items) without changing their character, such as clearer axes labels or revised annotations within panels.

      The major additions within the results sections based on the reviews were:

      (1) An expanded the comparison between our simulation analyses to previous simulations and to existing cryo-EM structural evidence for MPER antibodies’ membrane orientation the context of full-length antigen, resulting in new supplemental figure panels.

      (2) New atomistic simulations of 10E8, PGZL1, and 4E10 evaluating the phospholipid binding predictions in a different lipid composition more closely modeling HIV membranes.

      Minor edits to the analyses and interpretations include:

      (1) Outlining the geometric components contributing to variance in substates after clustering the atomistic 10E8, 4E10, and PGZL1 simulations.

      (2) Better defining the variance and durability of membrane interactions within and across systems in the coarse grain methods section.

      (3) Removed interpretations in the original results sections regarding polyreactivity and energetics for MPER bnAbs that were not explicitly supported by data.   

      (4) More context of the prevenance of bnAb loop geometries in structural informatics section

      (5) Rationale for the choice of the continuous helix MPER-TM conformation in LN01-antigen conformations, and citations to previous gp41 TM simulations.

      (6) Removed language on the novelty of the coarse grain and steered pulling simulations as newly developed approaches; tempering the potential discriminating power and applications of those approaches, in light of their limitations.

      The discussion was revised to provide more novel context of the results within the field, including discussing direct relevance of the simulation methods for evaluating immune tolerance mechanisms and into antibody engineering.   We have shared custom scripts used for molecular dynamics analysis on github (https://github.com/cmaillie98/mper_bnAbs.git) and uploaded trajectories to a public repository hosted on Zenodo (https://zenodo.org/records/13830877).

      Recommendations for the authors:

      Below, I provide an extensive list of minor edits associated with the text and figures for the authors to consider. I provide these with the hope of increasing the accessibility of the manuscript to broader audiences but leave changes to the discretion of the authors.

      Text/clarity

      Figure 1 main text

      The main text discussing Figure 1 is disorganized, making the analysis difficult to follow. I would suggest the following: moving the sentence, "4E10 and PG2L1 are structurally homologous" immediately after the paragraph discussing the simulation initiation. Then, add a sentence that directly compares their experimental affinity, neutralization, and polyreactivity of 4E10 and PG2L1 (later, an unintroduced idea pops up, "These patterns may in part explain 4E10's greater polyreactivity"). Next, lead into the discussion of the MD simulation data with something to the effect of: "Given these similarities, we first compared mechanisms of membrane insertion between 4E10 and PG2L1 to bolster confidence in our predictions". Later, the sentence "Across 4E10 and PGZL1 simulations, the bound lipid phosphates"

      We thank the reviewer for the suggestion and we have restructured the beginning of the results to implement this style: to first introduce then discuss the comparative PGZL1 & 4E10 results, i.e. Figure 1 plus associated supplements.

      In the background and the introduction text leading up to Figure 1, CDR-H3 is discussed at length, however, the first figure focuses almost entirely on how CDR-H1 coordinates a lipid phosphate headgroup. Are there experimental mutations in this loop that do not affect affinity (e.g., to a soluble gp41 peptide), but do affect neutralization (like the WAWA mutation for CDR-H3, discussed later)?

      We have altered the Introduction (para 2) and Results (4E10/PGZL1 sub-section) to give more balanced discussion of CDRs H1 & H3.  That includes referencing experimental data addressing the reviewer’s question; a PGZL1 clone H4K3 where mutations to CDRH1 were introduced and shown have minimal impact on affinity to MPER peptide via ELISA and BLI, but those mutant bnAbs had significantly reduced neutralization efficacy (PMC6879610).

      The sentence "These phospholipid binding events were highly stable, typically persisting for hundreds of nanoseconds" should be moved down to immediately precede, "[However], in a PGZL1 simulation, we observed a". This would be a good place for a paragraph break following, "Thus, these bnABs constitutively", since this block of text is very long.

      Similarly, the sentence and parts of the section, "Likewise, the interactions coordinating the lipid phosphate oxygens at CDR-H1" more appropriately belongs immediately before or after the sentence, "Our simulations uncover the CDR-lipid interactions that are the most feasible".

      Thank you for the detailed guidance in reorganizing the Figure 1 results.  We followed the advice to directly compare 4E10 and PGZL1 results separately from 10E8, moving those sections of text appropriately.  New paragraph breaks were added to improve accessibility and flow of concepts throughout the Results.

      In the sentence, "our simulations uncover CDR-lipid interactions that are the most feasible and biologically relevant in the context of a full [HIV] lipid bilayer... validation to which of the many possible ions" à have you confidently determined lipid binding and positioning outside of the site validated in figure 1? Which site(s) are these referencing? The next two sentences then introduce two new ideas on the loop backbone stability then lead into lipid exchange, which is a bit jarring.

      We have adjusted the language concerning the putative ions/lipids electron density across the many PGZL1 and 4E10 crystal structures, and additionally make the explicit point that we confidently determined the lack of lipid binding outside of the site focused on in Figure 1.

      “… both bnAbs showed strong hotspots for a lipid phosphate bound within the CDR-H1 loops, with minimal phospholipid or cholesterol ordering around the proteins elsewhere.  The simulated lipid phosphates bound within CDR-H1 have exceptional overlap with electron densities and atomic details of modelled headgroups from respective lipid-soaked co-crystal structures…”

      Figure 2 main text

      "We similarly investigated bnAb 10E8" - Please make this a separate subheader, the block text is very long up to this point.

      Thank you for the suggestion. We introduced a sub-header to separate work on 10E8 all-atom simulations.

      "we observed a POPC complexed with... modelled as headgroup phosphoglycerol anions..." - please cite the references within the text.

      Thank you for pointing out this missing reference, we added the appropriate reference.

      "One striking and novel observation" - please remove the phrase "striking" throughout, for following best practices in scientific writing (PMC10212555)-this is generally well-done throughout.

      We removed “striking” from our text per your suggestion.

      "This CDR-L1 site highlights... (>500 fold) across HIV strains" - How much do R29 and Y32 also contribute to antigen binding and the conformation of this loop? These mutants also decreased Kd by approximately 20X, and based on the co-crystal structure with the TM antigen (PDB: 4XCC), seem to play a more direct role in antigen contact. Additionally, these residues should be highlighted on a figure, otherwise it's difficult to understand why they are important for membrane association.

      We thank the reviewer for deep engagement to these supporting experimental details.  The R29A+Y32A 10E8 mutant referenced in the text showed only 4-fold Kd increase, a modest change for an SPR binding experiment.  Whereas R29E+Y32E 10E8 mutant resulted in 40x Kd increase, the “20x” the reviewer refers to.  Both 10E8 mutants showed similar drastically reduced breadth and potency of over 2 orders of magnitude on average.

      These mutated CDR-L1 residues are not directly involved in antigen contact and adopt the same loop helix conformation when antigen is bound.  A minor impact on antigen binding affinity could be due altering pre-organization of CDR loops upon losing interactions from the Tyr & Arg sidechains - particularly Tyr31 in contact with CDR-H3.

      As per the suggestion, clearer annotated figure panel denoting these sidechains has been added to Figure 2-Figure Supplement 1 for 10E8 analysis.

      "Structural searches querying... identified between 10^5 and 2*10^6..." - why is this value represented as such a large range? Does this depend on the parameters used for analysis? Please clarify.

      Additionally, how prevalent are any random loop conformations compared to the ones you searched? It's otherwise difficult to attribute number of occurrences within the 2 A cutoff to biological significance, as this number is not put in context.

      We appreciate the reviewers comment to contextualize the range and relative frequency of the bnAb loop conformations.   RMSD and length of loop are the key parameters, which can be controlled by searching reference loops of similar length.  The main point of the backbone-level searching is simply to imply the bnAb loops are not particularly rare when comparing loops of similar length.   

      We did as was suggested and added comparison to random loops of the same length to the main text, including a new Supplementary Table 4.   

      “…identified between 105 to 2∙106 geometrically similar sub-segments within natural proteins (<2 Å RMSD)40, reflecting they are relatively prevalent (not rare) in the protein universe, comparing well with frequency of other surface loops of similar length in antibodies (Supplementary Table 3).”

      "We next examined the geometries" could start after its own new subheading. Moreover, while there's an emphasis on tilt for neutralization, there is not a figure clearly modelling the proposed Env tilt compared to the relatively planar bilayer. It would be helpful to have an additional panel somewhere that shows the orientation of the antibody (e.g., a representative pose) in the simulations relative to an appropriately curved membrane, Env, the binding conformation of the antibody to Env, and apo Env, given the tilting observed in PMID: 32348769 and theorized in PMC5338832. What additional conformational changes or tilting need to occur between the antibodies and Env to accomplish binding to their respective epitopes?

      Thank you for outlining an interesting element to consider in our analysis of a multi-step binding mechanism for MPER antibodies. We added additional figure panels in the supplement to outline the similarities and differences between our simulations and Fabs with the inferred membranes in cryo-EM experiments of full-length HIV Env.  The simulated Fabs’ angles are very similar with only minor tilting to match the cryo-EM antibody-membrane geometries. 

      We added Figure 1-figure supplement 1A & Figure 2-figure supplement 2A, and alter to text to reflect this:

      “The primary difference is Env-bound Fabs in cryo-EM adopt slightly more shallow approach angles (~15_°_) relative to the bilayer normal.  The simulated bnAbs in isolation prefer orientations slightly more upright, but presenting CDRs at approximately the same depth and orientation.  Thus, these bnAbs appear pre-disposed in their membrane surface conformations, needing only a minor tilt to form the membrane-antibody-antigen neutralization complex.”   

      Env tilt dynamics and membrane curvature of natural virions may reconcile some of these differences.  Recent in situ tomography of Full-length Env in pseudo-virions corroborates our approximation of flat bilayers over the short length scales around Env.

      The sentence "we next examined the geometries" mentions "potential energy cost, if any, for reorienting...". However, there's no further discussions of geometry or energy cost within this section. Please rephrase, or move this figure to main and increase discussion associated with the various conformational ensembles, their geometry, and their phospholipid association.

      As the reviewer highlights, the unbiased simulations and our analysis do not explicitly evaluate energetics.  We removed this phrase, and now only allude to the minimal energy barrier between the similar geometric conformations, relative to the tilting & access requirements for antigen binding mechanism.

      “The apparent barrier for re-orientation is likely much less energetically constraining than shielding glycans and accessibility of MPER”

      ".. describing the spectrum of surface-bound conformations" cites the wrong figure.

      Thank you for noticing this error; we correct the figure reference to (Figure 2-figure supplement 4).

      Please comment on the significance of how global clustering (Fig. S5A-C) was similar for 4E10 and PGZL1, but different for 10E8 (e.g., blue, orange, and yellow clusters for 4E10 and PHZL1 versus cyan, red, and green clusters for 10E8). As the cyan cluster seems to be much closer in Euclidian space to the 4E10/PGZL1 clusters, it might warrant additional analysis. What do these clusters represent in terms of structure/conformation? How do these clusters differ in membrane insertion as in (A)?

      We are grateful you identify analysis in the geometric clustering section that may be of interest to other readers. We have added additional supplementary table (Table 2) to detail the CDR loop membrane insertion and global Fab angles which describe each cluster, to demonstrate their similarities and differences.  We also better describe how global clustering was similar for 4E10 and PGZL1, but different for 10E8 in the relevant results section<br /> The cyan cluster is not close in structure to 4E10/PGZL1 clusters.  We note the original figure panel had an error.  The updated Figure 2-supplement 4B shows the correct Euclidian distance hierarchy with an early split between 4e10/pgzl1 and 10e8 clusters.

      Figure 3 main text

      The start of this section, "We next studied bnAb LN01...", is a good place for a new subheader.

      We have added an additional subheader here: Antigen influence on membrane bound conformations and lipid binding sites for LN01

      There should be a sentence in the main text defining the replicate setup and production MD run time. Is the apo and complex based on a published structure? How do you embed the MPER? Is the apo structure docked to membrane like in 4E10? The MD setup could also be better delineated within the methods.

      The first two paragraphs in this section have been updated to clarify the relevant simulations configuration and Fab membrane docking prediction details. 

      The procedure was the same for predicting an initial membrane insertion, albeit now we use the LN01-TM complex and the calculation will account for the membrane burial of the the TM domain and MPER fragment.  As mentioned, LN01 is predicted as inserted with CDR loops insert similarly with or without the TM-MPER fragment.  The geometry differs from PGZL1/4E10 and 10E8, denoted by the text.

      Please comment on the oligomerization state of the antigen used in the MD simulation: how does the simulation differ from a crossed MPER as observed in an MPER antibody-bound Env cryo-EM structure (PMID: 32348769), a three-helix bundle (PMC7210310), or single transmembrane helix (PMC6121722)? How does the model MPER monomer embed in the membrane compared to simulations with a trimeric MPER (PMC6035291, PMID: 33882664)-namely, key arginine residues such as R696?

      We thank the reviewer for pointing out critical underlying rationale for modeling this TM-MPER-LN01 complex which we have corrected in the revised draft. The range of potential conformations and display of MPER based on TM domain organization could easily be its own paper – we in fact have a manuscript in preparation on the topic.  

      The updated text expands the rationale for choosing the monomeric uninterrupted helix form of the MPER-TM model antigen (para 1 of LN01 section). The alternative conformations we did not to explore are called out, with references provided by the reviewer.

      The discussion qualified that the MPER presentation is likely oversimplified here, noting MPER display in the full-length Env trimer will vary in different conformational states or membrane environments. However, the only cryo-EM structures of full-length ENV with TM domains resolved have this continuous helix MPER-TM conformation – seen both within crossing TM dimers or dissociated TM monomers.

      Are there additional analyses that can validate the dynamics of the MPER monomer in the membrane and relative to LN01? Such as key contacts you would expect to maintain over the duration of the MD simulation?

      We also increased description of this TM domain’s behavior, dynamics (tilt, orientation, Arg696 snorkeling, and complex w LN01) to provide a clearer picture of the simulation results – which aligns with past MD of the gp41 TM domain as a monomer (para 2 of LN01 section).  As well, we noted key LN01-MPER contacts that were maintained.

      How does the model MPER modulate membrane properties like lipid density and lipid proximities near LN01?

      We checked and didn’t notice differences for the types of lipids (chol, etc) proximal to the MPER-TM or the CDR loops versus the bulk lipid bilayer distributions.  Due to the already long & detailed nature of this manuscript, we elect not to include discussion on this topic.

      Supplemental figure 1H-I would be better positioned as a figure 3-associated supplemental figure.

      We rearranged to follow the eLife format and have paired supplemental panels with their most relevant main figures.

      Figure 3F/H reference a "loading site" but this site is defined much later in the text, which was confusing.

      Thank you for pointing out this source of confusion, we rearranged our discussion to reflect the order in which we present data in figures.

      What evidence suggests that lipids "quickly exchange from the Loading site into the X-ray site by diffusion"? I do not gather this from Figure S1H/I.

      We have rearranged the loading side and x-ray site RMSD maps in Figure 3-Figure supplement 1 to better illustrate how a lipid exchanges between these sites.

      Figure 4 main text

      The authors assert that in the CG simulations, restraints, "[maintain] Fab tertiary and quaternary structure". However, backbone RMSD does not directly assert this claim-an additional analysis of the key interfacial residues between chains, or geometric analysis between the chains, would better support this claim.

      Thank you for pointing this point.  We rephrased to add that the major sidechain contacts between heavy and light chain persist, in addition to backbone RMSD, to describe how these Fabs maintain the fold stably in CG representation. 

      In several cases, CG models sample and then dissociate from the membrane. In the text, the authors mention, "course-grained models can distinguishing unfavorable and favorable membrane-bound conformations". Is there a particular orientation that causes/favors membrane association and dissociation? This analysis could look at conformations immediately preceding association and dissociation to give clues as to what orientation(s) favor each state.

      Thank you for suggesting this interesting analysis.  Clustering analysis of associated states are presented in Figure 5, Figure 5-Figure Supplement 1, and Figure 6, which show all CDR and framework loop directed insertion.  This feature is currently described in the main text.  

      We did not find strong correlation of specific orientations as “pre-dissociation” states or ineffective non-inserting “scanning” events.  We revised the key sentence to reflect the major take away – that non-CDR alternative conformations did not insert and most of those having CDRs inserted in a different manner than all-atom simulations also were prone to dissociate:

      “Given that non-CDR directed and alternative CDR-embedded orientations readily dissociate, we conclude that course-grained models can distinguish unfavorable and favorable membrane-bound conformations to an extent that provides utility for characterizing antibody-bilayer interaction mechanisms.”

      Figure 6 main text

      "For 4E10, trajectories initiated from all three geometries..." only two geometries are shown for each antibody. Please include all three on the plot.

      The plots include markers for all three geometries for 4E10, highlighted in stars or with letters on the density plots of angles sampled (Figure 6B,C)

      "Aligning a full-length IgG... unlikely that two Fabs simultaneously..." Are there theoretical conformations in which two Fabs could simultaneously associate with membrane? If this was physiological or could be designed rationally, could an antibody benefit further from avidity?

      Our modeling suggests the theoretical conformations having two Fabs on the membrane are infeasible.  It’s even less likely multiple Env antigens could be engaged by one IgG.  We have revised the text to express this more clearly.

      Figure 7 main text

      "An intermediate... showed a modest reduction in affinity..." what affinity does PGZL1 have for this antigen?

      The preceding sentence for this information: “Mature PGZL1 has relatively high affinity to the MPER epitope peptide (Kd = 10 nM) and demonstrates great breadth and potency, neutralizing 84% of a 130 strain panel “

      Figures

      Figure 1

      It would be helpful to have an additional panel at the top of this figure further zoomed out showing the orientation of the antibody (e.g., a representative pose) in the simulations relative to an appropriately curved membrane, Env, the binding conformation of the antibody to Env, and apo Env, given the tilting observed in PMID: 32348769 and theorized in PMC5338832. What additional conformational changes or tilting need to occur between the antibodies and Env to accomplish binding to their respective epitopes?

      Thank you for the suggestion to include this analysis.  We have added to the text reflecting this information, as well as making new supplemental panels for 4E10 and 10E8 that we compare simulated 4E10 and 10E8 Fab conformations to cryoEM density maps with Fabs bound to full-length HIV Env. Figure 1-figure supplement 1A & Figure 2-figure supplement 2A

      In Figure 1, space permitting, it would be helpful to annotate the distances between the phosphates and side chains (similarly, for Figure S1A).

      To avoid the overloading the Main figure panels with text, those relevant distances are listed in the methods sections.  Those distances are used to define the “bound” lipid phosphate state.  Generally, we note the interactions are within hydrogen bonding distance.

      Annotating "Replicate 1" and "Replicate 2" on the left side of Figure 1C/D would make this figure immediately intuitive.

      We have added these labels.

      Figure caption 1C: Please clarify the threshold/definition of a contact used to binarize "bound" versus "unbound" (for example, "mean distance cutoff of 2A between the phosphate oxygen and the COM of CDR-H1") [on further reading of the methods section, this criterion is quite involved and might benefit from: a sentence that includes "see methods"]. Additionally, C could use a sentence explaining the bar such as in E, "Phosphate binding is mapped to above each MD trajectory" Please define FR-H3 in the figure caption for E/F.

      We have added these details to the figure caption.

      Because Figure 1 is aggregated simulation time, it would be helpful to also represent the data as individual replicates or incorporate this information to calculate standard deviations/statistics (e.g., 1 microsecond max using the replicates to compute a standard deviation).

      We believe the current quantification & display of data via sharing all trajectories is sufficient to convey the major point for how often each CDR-phosholipid binding site it occupied.  Further tracking and statistics of inter-atomic distances will likely be too tedious & add minimal value. There is some dynamics of the phosphate oxygens between the polar within the CDR site but our “bound” state definitions sufficiently describe the key participating interactions are made.

      Figure 2

      For A, it would be helpful to annotate the yellow and blue mesh on the figure itself.

      We have defined the orange phosphate and blue choline densities.

      Also, where are R29 and Y32 relative to this site? In the X-ray panels, Y38 is not shown, and the box delineating the zoom-in is almost imperceptible.

      Thank you for this suggestion to include those amino acids which are referenced in the text as critical sites where mutation impacts function. To clarify, Y32 is the pdb numbering for residue Y38 in IMGT numbering. We have added a panel to Figure 2-Figure Supplement 1 having a cartoon graphic of 10E8 loop groove with sidechains & annotating R29 and Y38, staying consistent with out use of IMGT numbering in the manuscript.

      Figure 3

      It might read clearer to have "LN01+MPER-TM" and "LN01-Apo" in the middle of A/B and C/D, respectively, and a dotted line delineating the left and right side of the figure panels.

      We have added these details to the figure for clarity for readers.

      It would be helpful to show some critical interactions that are discussed in the text, such as the salt bridge with K31, by labeling these on the figure (e.g., in E-H).

      We drafted figure panels with dashed lines to indicate those key interactions.  However, they became almost imperceptible and overloaded with annotations that distracted from the overall details.  For K31, the interaction occurs in LN01 crystal structures readers can refer to.

      Why are axes cut off for J?

      We corrected this.

      Please re-define K/L plots as in Figure 1, and explain abbreviations.

      We updated the figure caption to reflect these changes.

      Figure 4

      The caption for panel A states that the Fab begins in solvent 1-2 nm above the bilayer, but the main text states 0.5-2 nm.

      We have reconciled this difference and listed the correct distances: 0.5-2nm.

      Please label the y-axis as "Replicate" for relevant figure panels so that they are more immediately interpretable.

      This label has been added.

      A legend with "membrane-associated" and "non-associated" within the figure would be helpful. Additionally, the average percent membrane associated, with a standard deviation, should be shown (Similar to 1C, albeit with the statistics).

      This legend has been added.  We also added the additional statistical metrics requested to strengthen our analysis.

      The text references "10, 14, and 12 extended insertion events" for the three antibody-based simulations. How do you define "extended insertion events"? Would breaking this into average insertion time and standard deviation better highlight the association differences between MPER antibodies and controls, in addition to the variability due to difference random initialization?

      We thank the reviewer for the insightful suggestion on how to better organize quantitative analysis to support the method. Supplemental Table 3 includes these numbers.

      Figure 5

      The analysis in Fig. S6C could be included here as a main figure.

      The drafted revised figure adding S6C to Figure 5 made for too much information.  Likewise, putting this panel S6C separated it from the parent clustering data of S6B, so we decided to keep these figures separated.  The S6 figure is now Figure 5-figure supplement 1.

      Figure 6

      Please annotate membrane insertion on E as %.

      These are phosphate binding RMSD/occupancy vs time.  The panels are now too small to annotate by %.  The qualitative presentation is sufficient at this stage.  The quantitative % are listed in-line within text when relevant to support assertions made. 

      Please use the figure caption to explain why certain clusters (e.g., 10E8 cluster A, artifact, Fig. S6E) are not included in panel E.

      We have added this information in the figure caption.

      Figure 7

      Please show all points on the box and whisker plots (panels E and F), and perform appropriate statistical tests to see if means are significantly different (these are mentioned in the text, but should be annotated on the graph and mentioned within the figure caption).

      We have changed these plots to show all data points along with relevant statistical comparisons. The figure captions describe unpaired t-test statistical tests used.

      Figure S1

      G, H, and I do not belong here-they should be moved to accompany their relevant text section, which associates with Figure 3. It would be helpful to associate this with Figure 3 in the eLife format, "Figure 3-Supplemental Figure 1" or its equivalent.

      It's very difficult to distinguish the green and blue circles on panel G.

      We darkened the shading and added outline for better visualization

      Subfigure I is missing a caption, could be included with H: "(H,I) Additional replicates for LN01+TM (H) and LN01 (I)".

      We corrected this as suggested.

      Why is H only 3 simulations and not 4? Does it not have a lipid in the x-ray site? Also, the caption states "(top, green)" and "(bottom, cyan)", but the green vs. cyan figures are organized on the left and right. Additional labels within the figure would help make this more intuitive.

      If the point of H and I is to illustrate that POPC exchanges between the X-ray and loading sites, this is unclear from the figure. Consider clarifying these figures.

      Thank you for describing the confusion in this figure, we have added labels to clarify.

      Figure S2 (panels split between revised Figure 4 associated figure supplements)

      The LN01 figures should likely follow later so that they can associate with Figure 3, despite being a similar analysis.

      We corrected supplements to eLife format so supplements are associated with relevant main figures.

      Figure S3 (panels split between revised Figure 1 & 2 associated figure supplements)

      As hydrophobicity is discussed as a driving factor for residue insertion, it would be helpful to have a rolling hydrophobicity chart underneath each plot to make this claim obvious.

      We prefer the current format, due to the worry of having too much information in these already data-rich panels.  As well, residues are not apolar but are deeply inserted.

      Figure S4 (panels split between revised Figure 1 & 2 associated figure supplements)

      It would be helpful to label the relevant loops on these figures.

      We have labeled loops for clarity.

      Do any of these loops have minor contacts with Env in the structure?

      The 4E10 and PGZL1 CDRH-1 loop does not directly contact bound MPER peptides bound in crystal structures. 

      FRL-3 and CDR-H1 in 10E8 do not contact the MPER peptide antigen component based on x-ray crystal structures.

      Do motif contacts with lipid involve minor contacts with additional loops other than those displayed in this figure?

      The phosphate-loop interactions in motifs used as query bait here are mediated solely by the backbone and side chain interactions of the loops displayed. We visually inspected most matches and did not see any “consensus” additional peripheral interactions common across each potential instance in the unrelated proteins.  The supplied Supplemental Table 2 contains the information if a reader wanted to conduct a detailed search. 

      Why is there such a difference between the loop conformation adopted in the X-ray structure and that in the MD simulation, and why does this lead to the large observed differences in ligand-binding structure matches?

      We thank the reviewer for carefully noting our error in labeling of CDR loop and framework region input queries. We revised the labeling to clarify the issue.

      The is minimal structural difference between the loops in x-ray and MD.

      Figure S5 (Figure 2-Figure supplement 4)

      This figure is not colorblind friendly-it would be helpful to change to such a pallet as the data are interesting, but uninterpretable to some.

      We have left this figure the same.

      "Susbstates" - "Substates"

      Corrected, thank you.

      Panel B is uninterpretable-please break the axis so that the Euclidian distances can be represented accurately but the histograms can be interpreted.

      We have adjusted axis for this plot to better illustrate the cluster thresholds.

      The clusters in D-H should be analyzed in greater depth. What is the structural relevance of these clusters other than differences in phospholipid occupancy in (I)? Snapshots of representative poses for each cluster could help clarify these differences.

      We have adjusted the text to describe the geometric differences in each of those clusters that result in the different exceptionally lower propensities for forming the key phospholipid interaction.  

      The figure caption should make it clear that 3 μS of aggregate simulation time is being used here instead of 4 μS to start with unique tilt initializations. E.g., "unique starting membrane-bound conformations (0 degrees, -15 degrees, 15 degrees initialization relative to the docked pose)". Further, why was the particular 0-degree replicate chosen while the other was thrown out? Or was this information averaged? Why is the full 4 μS then used for D-I?

      We thank the reviewer for noting these details.  We didn’t want to bias the differential between 10E8 and 4E10/PGZL1 by including the replicate simulations.  The analysis was mainly intended to achieve more coarse resolution distinction between 10E8 and the similar PGZL1/4E10.  

      In the subsequent clustering of individual bnAb simulation groups, the replicate 0 degree simulations had sufficiently different geometric sampling and unique lipid binding behavior that we though it should be used (4 us total) to achieve finer conformational resolution for each bnAb.

      Figure S6 (now Figure 5-Figure Supplement 1)

      Please label the CDRs in C and provide a color key like in other figures. Also, please label the y-axes. This figure could move to main below 5B with the clusters "A,B,C" labeled on 5B.

      We have added the axes labels and color key legend.  We retained a minimal CDR loop labeling scheme for the more throughput interaction profiles here where colored sections in the residue axes denote CDR loop regions.

      Figure S7 (Figure 7 Figure Supplement 1)

      Panels A and B would likely read better if swapped.

      We have swapped these panels for a better flow.

      For panel C, please display mean and standard deviation, and compare these values with an appropriate statistical test.

      This is already displayed in main figure, we have removed it from supplement.

      For E and F, please clarify from which trajectory(s) you are extracting this conformation from. Are these the global mean/representative poses? How do they compare to other geometrically distinct clusters?

      The requested information was added to supplemental figure caption.  These are frames from 2 distinct time points selected phosphate bound frames from 0-degree tilt replicates for both 4E10 and 10E8, representing at least 2 distinct macroscopic substates differing in global light chain and heavy chain orientation towards the membrane. 

      Table S2 (now Supplementary Table 3)

      Please add details for the 13h11 simulation.

      Additionally, please add average contact time and their standard deviation to the table, rather than just the aggregated total time. This will highlight the variability associated with the random initializations of each simulation.

      We have added the details for 13h11 and the requested analysis (average aggregated time +/- standard deviation and average time per association event +- standard deviation) to supplement our summary statistics for this method.

      Reviewer #2 (Recommendations For The Authors):

      (1) The structure of the manuscript should be improved. For example, almost half of the introduction (three paragraphs) summarize the results. I found it hard to navigate all the data and specific interactions described in the result section. Furthermore, the claims at the end of several sections seem unsupported. Especially for the generalization of the approach. This should be moved to the discussion section. The discussion is pretty general and does not provide much context to the results presented in this study.

      We have significantly reorganized the results section to improve the flow of the manuscript and accessibility for readers, especially the first sections of all-atom simulations. We also removed claims not directly supported by data from our results, and expanded on some of these concepts in the discussion to make some more novel context to the result.

      (2) The author should cite more rigorously previous work and refrain from using the term "develop" to describe the simple use of a well established method. E.g. Several studies have investigated membrane protein interactions e.g. [1], membrane protein-bilayer self-assembly [2], steered molecular dynamics [3], etc.

      Thank you for identifying relevant work for the simulations that set precedent for our novel application to antibody-membrane interactions.  We have removed language about development of simulation methods from the text and now better reference the precedent simulation methods used here.

      (3) Have the authors considered estimating the PMF by combining the steered MD simulation through the application of Jarzynski's equality?

      We performed from preliminary PMFs for Fab-membrane binding, but saw it was taking upward of 40 us to reach convergence.  Steered simulations focus on a key lipid may be easier.

      Although PMFs are beyond the scope of this work, we added proposals & allusion to their utility as the next steps for more rigorous quantification of fab-membrane interactions.

      Minor

      (4) The term "integrative modeling" is usually used for computational pipelines which incorporate experimental data. Multiscale modeling would be more appropriate for this study.

      We altered descriptions throughout the manuscript to reflect this comment.

      (5) Units to report the force in the steered molecular dynamics are incorrect. They should be 98.

      We changed axes and results to correctly report this unit.

      (6) Labels for axes of several graphs are not missing.

      We added labels to all axes of graphs, except for a few where stacked labels can be easily interpreted to save space and reduce complexity in figures.

      (7) Figure 3 K & L is this really < 1% of total? The term "total" should also be clarified.

      Thank you for pointing this out, we changed the % labels to be correct with axes from 0-100%. We clarified total in the figure caption.

      (8) The font size in figures should be uniformized.

      This suggestion has been applied

      (9) Time needed for steered MD should be reported in CPUh and not hours (page 17).

      We removed comments on explicit time measurements for our simulations.

      (10) Version of Martini force field is missing in methods section

      We used Martini 2.6 and added this to the methods.

      References

      (1) Prunotto, Alessio, et al. "Molecular bases of the membrane association mechanism potentiating antibiotic resistance by New Delhi metallo-β-lactamase 1." ACS infectious diseases 6.10 (2020): 2719-2731.

      (2) Scott, Kathryn A., et al. "Coarse-grained MD simulations of membrane protein-bilayer self-assembly." Structure 16.4 (2008): 621-630.

      (3) Izrailev, S., et al. "Computational molecular dynamics: challenges, methods, ideas. Chapter 1. Steered molecular dynamics." (1997).

    1. eLife Assessment

      This valuable study characterizes the molecular signatures and function of a type of enteric neuron (IPAN) in the mouse colon, identifying molecular markers (Cdh6 and Cdh8) for these cells. A battery of solid experimental findings suggest data from other species are likely translatable to mice, bridging the abundant literature from humans and other mammals into this experimentally tractable animal model, but the data establishing the role of Cdh6 in synapses among IPANs and in cell-cell contacts with non-neuronal cells is incomplete. This work will be of interest to scientists studying the motor control of the colon and more generally the enteric neuromuscular system.

    2. Reviewer #1 (Public review):

      Summary:

      In their manuscript, Gomez-Frittelli and colleagues characterize the expression of cadherin6 (and -8) in colonic IPANs of mice. Moreover, they found that these cdh6-expressing IPANs are capable of initiating colonic motor complexes in the distal colon, but not proximal and midcolon. They support their claim by morphological, electrophysiological, optogenetic, and pharmacological experiments.

      Strengths:

      The work is very impressive and involves several genetic models and state-of-the-art physiological setups including respective controls. It is a very well-written manuscript that truly contributes to our understanding of GI-motility and its anatomical and physiological basis. The authors were able to convincingly answer their research questions with a wide range of methods without overselling their results.

      Weaknesses:

      The authors put quite some emphasis on stating that cdh6 is a synaptic protein (in the title and throughout the text), which interacts in a homophilic fashion. They deduct that cdh6 might be involved in IPAN-IPAN synapses (line 247ff.). However, Cdh6 does not only interact in synapses and is expressed by non-neuronal cells as well (see e.g., expression in the proximal tubuli of the kidney). Moreover, cdh6 does not only build homodimers, but also heterodimers with Chd9 as well as Cdh7, -10, and -14 (see e.g., Shimoyama et al. 2000, DOI: 10.1042/0264-6021:3490159). It would therefore be interesting to assess the expression pattern of cdh6-proteins using immunostainings in combination with synaptic markers to substantiate the authors' claim or at least add the possibility of cell-cell-interactions other than synapses to the discussion. Additionally, an immunostaining of cdh6 would confirm if the expression of tdTomato in smooth muscle cells of the cdh6-creERT model is valid or a leaky expression (false positive).

    3. Reviewer #2 (Public review):

      Summary:

      Intrinsic primary afferent neurons are an interesting population of enteric neurons that transduce stimuli from the mucosa, initiate reflexive neurocircuitry involved in motor and secretory functions, and modulate gut immune responses. The morphology, neurochemical coding, and electrophysiological properties of these cells have been relatively well described in a long literature dating back to the late 1800's but questions remain regarding their roles in enteric neurocircuitry, potential subsets with unique functions, and contributions to disease. Here, the authors provide RNAscope, immunolabeling, electrophysiological, and organ function data characterizing IPANs in mice and suggest that Cdh6 is an additional marker of these cells.

      Strengths:

      This paper would likely be of interest to a focused enteric neuroscience audience and increase information regarding the properties of IPANs in mice. These data are useful and suggest that prior data from studies of IPANs in other species are likely translatable to mice.

      Weaknesses:

      The advance presented here beyond what is already known is minimal. Some of the core conclusions are overstated and there are multiple other major issues that limit enthusiasm. Key control experiments are lacking and data do not specifically address the properties of the proposed Cdh6+ population.

      Major weaknesses:

      (1) The novelty of this study is relatively low. The main point of novelty suggests an additional marker of IPANs (Cdh6) that would add to the known list of markers for these cells. How useful this would be is unclear. Other main findings basically confirm that IPANs in mice display the same classical characteristics that have been known for many years from studies in guinea pigs, rats, mice and humans.

      (2) Some of the main conclusions of this study are overstated and claims of priority are made that are not true. For example, the authors state in lines 27-28 of the abstract that their findings provide the "first demonstration of selective activation of a single neurochemical and functional class of enteric neurons". This is certainly not true since Gould et al (AJP-GIL 2019) expressed ChR2 in nitrergic enteric neurons and showed that activating those cells disrupted CMC activity. In fact, prior work by the authors themselves (Hibberd et al Gastro 2018) showed that activating calretinin neurons with ChR2 evoked motor responses. Work by other groups has used chemogenetics and optogenetics to show the effects of activating multiple other classes of neurons in the gut.

      (3) Critical controls are needed to support the optogenetic experiments. Control experiments are needed to show that ChR2 expression a) does not change the baseline properties of the neurons, b) that stimulation with the chosen intensity of light elicits physiologically relevant responses in those neurons, and c) that stimulation via ChR2 elicits comparable responses in IPANs in the different gut regions focused on here.

      (4) The electrophysiological characterization of mouse IPANs is useful but this is a basic characterization of any IPAN and really says nothing specifically about Cdh6+ neurons. The electrophysiological characterization was also only done in a small fraction of colonic IPANs, and it is not clear if these represent cell properties in the distal colon or proximal colon, and whether these properties might be extrapolated to IPANs in the different regions. Similarly, blocking IH with ZD7288 affects all IPANs and does not add specific information regarding the role of the proposed Cdh6+ subtype.

      (5) Why SMP IPANs were not included in the analysis of Cdh6 expression is a little puzzling. IPANs are present in the SMP of the small intestine and colon, and it would be useful to know if this proposed marker is also present in these cells.

      (6) The emphasis on IH being a rhythmicity indicator seems a bit premature. There is no evidence to suggest that IH and IT are rhythm-generating currents in the ENS.

      (7) As the authors point out in the introduction and discuss later on, Type II Cadherins such as Cdh6 bind homophillically to the same cadherin at both pre- and post-synapse. The apparent enrichment of Cdh6 in IPANs would suggest extensive expression in synaptic terminals that would also suggest extensive IPAN-IPAN connections unless other subtypes of neurons express this protein. Such synaptic connections are not typical of IPANs and raise the question of whether or not IPANs actually express the functional protein and if so, what might be its role. Not having this information limits the usefulness of this as a proposed marker.

      (8) Experiments shown in Figures 6J and K use a tethered pellet to drive motor responses. By definition, these are not CMCs as stated by the authors.

      (9) The data from the optogenetic experiments are difficult to understand. How would stimulating IPANs in the distal colon generate retrograde CMCs and stimulating IPANs in the proximal colon do nothing? Additional characterization of the Cdh6+ population of cells is needed to understand the mechanisms underlying these effects.

    4. Author response:

      Public Reviews:

      Reviewer #1 (Public review):

      Summary:

      In their manuscript, Gomez-Frittelli and colleagues characterize the expression of cadherin6 (and -8) in colonic IPANs of mice. Moreover, they found that these cdh6-expressing IPANs are capable of initiating colonic motor complexes in the distal colon, but not proximal and midcolon. They support their claim by morphological, electrophysiological, optogenetic, and pharmacological experiments.

      Strengths:

      The work is very impressive and involves several genetic models and state-of-the-art physiological setups including respective controls. It is a very well-written manuscript that truly contributes to our understanding of GI-motility and its anatomical and physiological basis. The authors were able to convincingly answer their research questions with a wide range of methods without overselling their results.

      We greatly appreciate the reviewer’s time, careful reading and support of our study.

      Weaknesses:

      The authors put quite some emphasis on stating that cdh6 is a synaptic protein (in the title and throughout the text), which interacts in a homophilic fashion. They deduct that cdh6 might be involved in IPAN-IPAN synapses (line 247ff.). However, Cdh6 does not only interact in synapses and is expressed by non-neuronal cells as well (see e.g., expression in the proximal tubuli of the kidney). Moreover, cdh6 does not only build homodimers, but also heterodimers with Chd9 as well as Cdh7, -10, and -14 (see e.g., Shimoyama et al. 2000, DOI: 10.1042/0264-6021:3490159). It would therefore be interesting to assess the expression pattern of cdh6-proteins using immunostainings in combination with synaptic markers to substantiate the authors' claim or at least add the possibility of cell-cell-interactions other than synapses to the discussion. Additionally, an immunostaining of cdh6 would confirm if the expression of tdTomato in smooth muscle cells of the cdh6-creERT model is valid or a leaky expression (false positive).

      We agree with the reviewer that Cdh6 could be mediating some other cell-cell interaction besides synapses between IPANs, and will include more on this in the discussion. Cdh6 primarily forms homodimers but, as the reviewer points out, has been known to also form heterodimers with some other cadherins. We performed RNAscope in the colonic myenteric plexus with Cdh7 and found no expression (data not shown). Cdh10 is suggested to have very low expression (Drokhlyansky et al., 2020), possibly in putative secretomotor vasodilator neurons, and Cdh14 has not been assayed in any RNAseq screens. We attempted to visualize Cdh6 protein via antibody staining (Duan et al., 2018) but our efforts did not result in sufficient signal or resolution to identify synapses in the ENS, which remain broadly challenging to assay. Similarly, immunostaining with Cdh6 antibody was unable to confirm Cdh6 protein in tdT-expressing muscle cells, or by RNAscope. We will address these caveats in the discussion section.

      (1) E. Drokhlyansky, C. S. Smillie, N. V. Wittenberghe, M. Ericsson, G. K. Griffin, G. Eraslan, D. Dionne, M. S. Cuoco, M. N. Goder-Reiser, T. Sharova, O. Kuksenko, A. J. Aguirre, G. M. Boland, D. Graham, O. Rozenblatt-Rosen, R. J. Xavier, A. Regev, The Human and Mouse Enteric Nervous System at Single-Cell Resolution. Cell 182, 1606-1622.e23 (2020).

      (2) X. Duan, A. Krishnaswamy, M. A. Laboulaye, J. Liu, Y.-R. Peng, M. Yamagata, K. Toma, J. R. Sanes, Cadherin Combinations Recruit Dendrites of Distinct Retinal Neurons to a Shared Interneuronal Scaffold. Neuron 99, 1145-1154.e6 (2018).

      Reviewer #2 (Public review):

      Summary:

      Intrinsic primary afferent neurons are an interesting population of enteric neurons that transduce stimuli from the mucosa, initiate reflexive neurocircuitry involved in motor and secretory functions, and modulate gut immune responses. The morphology, neurochemical coding, and electrophysiological properties of these cells have been relatively well described in a long literature dating back to the late 1800's but questions remain regarding their roles in enteric neurocircuitry, potential subsets with unique functions, and contributions to disease. Here, the authors provide RNAscope, immunolabeling, electrophysiological, and organ function data characterizing IPANs in mice and suggest that Cdh6 is an additional marker of these cells.

      Strengths:

      This paper would likely be of interest to a focused enteric neuroscience audience and increase information regarding the properties of IPANs in mice. These data are useful and suggest that prior data from studies of IPANs in other species are likely translatable to mice.

      We appreciate the reviewer’s support of our study and insightful critiques for its improvement.

      Weaknesses:

      The advance presented here beyond what is already known is minimal. Some of the core conclusions are overstated and there are multiple other major issues that limit enthusiasm. Key control experiments are lacking and data do not specifically address the properties of the proposed Cdh6+ population.

      Major weaknesses:

      (1) The novelty of this study is relatively low. The main point of novelty suggests an additional marker of IPANs (Cdh6) that would add to the known list of markers for these cells. How useful this would be is unclear. Other main findings basically confirm that IPANs in mice display the same classical characteristics that have been known for many years from studies in guinea pigs, rats, mice and humans.

      We appreciate the already existing markers for IPANs in the ENS and the existing literature characterizing these neurons. The primary intent of this study was to use these well established characteristics of IPANs in both mice and other species to characterize Cdh6-expressing neurons in the mouse myenteric plexus and confirm their classification as IPANs.

      (2) Some of the main conclusions of this study are overstated and claims of priority are made that are not true. For example, the authors state in lines 27-28 of the abstract that their findings provide the "first demonstration of selective activation of a single neurochemical and functional class of enteric neurons". This is certainly not true since Gould et al (AJP-GIL 2019) expressed ChR2 in nitrergic enteric neurons and showed that activating those cells disrupted CMC activity. In fact, prior work by the authors themselves (Hibberd et al., Gastro 2018) showed that activating calretinin neurons with ChR2 evoked motor responses. Work by other groups has used chemogenetics and optogenetics to show the effects of activating multiple other classes of neurons in the gut.

      We believe our phrasing in this sentence was misleading. Whilst single neurochemical classes of enteric neurons have been manipulated to alter gut functions, all such instances to date do not represent manipulation of a single functional class of enteric neurons. In the given examples, NOS and calretinin are each expressed to varying degrees across putative motor neurons, interneurons and IPANs. In contrast, Chd6 is restricted to IPANs and therefore this study is the first optogenetic investigation of enteric neurons from a single putative functional class. We will alter this segment in the revised manuscript to emphasize this point and differentiate this study from those previous.

      (3) Critical controls are needed to support the optogenetic experiments. Control experiments are needed to show that ChR2 expression a) does not change the baseline properties of the neurons, b) that stimulation with the chosen intensity of light elicits physiologically relevant responses in those neurons, and c) that stimulation via ChR2 elicits comparable responses in IPANs in the different gut regions focused on here.

      We completely agree controls are essential. However, our paper is not the first to express ChR2 in enteric neurons. Authors of our paper have shown in Hibberd et al. 2018 that expression of ChR2 in a heterogeneous population of myenteric neurons did not change network properties of the myenteric plexus. This was demonstrated in the lack of change in control CMC characteristics in mice expressing ChR2 under basal conditions (without blue light exposure). Regarding question (b), that it should be shown that stimulation with the chosen intensity of light elicits physiologically relevant responses in those neurons. We show the restricted expression of ChR2 in IPANs and that motor responses (to blue light) are blocked by selective nerve conduction blockade.

      Regarding question (c), that our study should demonstrate that stimulation via ChR2 elicits comparable responses in IPANs in the different gut regions. We would not expect each region of the gut to behave comparably. This is because the different gut regions (i.e. proximal, mid, distal) are very different anatomically, as is anatomy of the myenteric plexus and myenteric ganglia between each region, including the density of IPANs within each ganglia, in addition to the presence of different patterns of electrical and mechanical activity [Spencer et al., 2020]. Hence, it is difficult to expect that between regions stimulation of ChR2 should induce similar physiological responses. The motor output we record in our study (CMCs) is a unified motor program that involves the temporal coordination of hundreds of thousands of enteric neurons and a complex neural circuit that we have previously characterized [Spencer et al., 2018]. But, never has any study until now been able to selectively stimulate a single functional class of enteric neurons (with light) to avoid indiscriminate activation of other classes of neurons.

      (1) T. J. Hibberd, J. Feng, J. Luo, P. Yang, V. K. Samineni, R. W. Gereau, N. Kelley, H. Hu, N. J. Spencer, Optogenetic Induction of Colonic Motility in Mice. Gastroenterology 155, 514-528.e6 (2018).

      (2) N. J. Spencer, L. Travis, L. Wiklendt, T. J. Hibberd, M. Costa, P. Dinning, H. Hu, Diversity of neurogenic smooth muscle electrical rhythmicity in mouse proximal colon. American Journal of Physiology-Gastrointestinal and Liver Physiology 318, G244–G253 (2020).

      (3) N. J. Spencer, T. J. Hibberd, L. Travis, L. Wiklendt, M. Costa, H. Hu, S. J. Brookes, D. A. Wattchow, P. G. Dinning, D. J. Keating, J. Sorensen, Identification of a Rhythmic Firing Pattern in the Enteric Nervous System That Generates Rhythmic Electrical Activity in Smooth Muscle. J. Neurosci. 38, 5507–5522 (2018).

      (4) The electrophysiological characterization of mouse IPANs is useful but this is a basic characterization of any IPAN and really says nothing specifically about Cdh6+ neurons. The electrophysiological characterization was also only done in a small fraction of colonic IPANs, and it is not clear if these represent cell properties in the distal colon or proximal colon, and whether these properties might be extrapolated to IPANs in the different regions. Similarly, blocking IH with ZD7288 affects all IPANs and does not add specific information regarding the role of the proposed Cdh6+ subtype.

      Our electrophysiological characterization was guided to be within a subset of Cdh6+ neurons by Hb9:GFP expression. As in the prior comment (1) above, we used these experiments to confirm classification of Cdh6+ (Hb9:GFP+) neurons in the distal colon as IPANs. We will clarify that these experiments were performed in the distal colon and agree that we cannot extrapolate that these properties are also representative of IPANs in the proximal colon. We apologize that this was confusing. Finally, we agree with the reviewer that ZD7288 affects all IPANs in the ENS and will clarify this in the text.

      (5) Why SMP IPANs were not included in the analysis of Cdh6 expression is a little puzzling. IPANs are present in the SMP of the small intestine and colon, and it would be useful to know if this proposed marker is also present in these cells.

      We agree with the reviewer. In addition to characterizing Cdh6 in the myenteric plexus, it would be interesting to query if sensory neurons located within the SMP also express Cdh6. Our preliminary data (n=2) show ~6-12% tdT/Hu neurons in Cdh6-tdT ileum and colon (data not shown). We will add a sentence to the discussion.

      (6) The emphasis on IH being a rhythmicity indicator seems a bit premature. There is no evidence to suggest that IH and IT are rhythm-generating currents in the ENS.

      Regarding the statement there is no evidence to suggest that IH and IT are rhythm-generating currents in the ENS. We agree with the reviewer that evidence of rhythm generation by IH and IT in the ENS has not been explicitly confirmed. We are confident the reviewer agrees that an absence of evidence is not evidence of absence, although the presence of IH has been well described in enteric neurons. We will modify the text in the results to indicate more clearly that IH and IT are known to participate in rhythm generation in thalamocortical circuits, though their roles in the ENS remain unknown. Our discussion of the potential role of IH or IT in rhythm generation or oscillatory firing of the ENS is constrained to speculation in the discussion section of the text.

      (7) As the authors point out in the introduction and discuss later on, Type II Cadherins such as Cdh6 bind homophillically to the same cadherin at both pre- and post-synapse. The apparent enrichment of Cdh6 in IPANs would suggest extensive expression in synaptic terminals that would also suggest extensive IPAN-IPAN connections unless other subtypes of neurons express this protein. Such synaptic connections are not typical of IPANs and raise the question of whether or not IPANs actually express the functional protein and if so, what might be its role. Not having this information limits the usefulness of this as a proposed marker.

      We agree with the reviewer that the proposed IPAN-IPAN connection is novel although it has been proposed before (Kunze et al., 1993). As detailed in our response to Reviewer #1, we attempted to confirm Cdh6 protein expression, but were unsuccessful, due to insufficient signal and resolution. We therefore discuss potential IPAN interconnectivity in the discussion, in the context of contrasting literature.

      (1) W. A. A. Kunze, J. B. Furness, J. C. Bornstein, Simultaneous intracellular recordings from enteric neurons reveal that myenteric ah neurons transmit via slow excitatory postsynaptic potentials. Neuroscience 55, 685–694 (1993).

      (8) Experiments shown in Figures 6J and K use a tethered pellet to drive motor responses. By definition, these are not CMCs as stated by the authors.

      The reviewer makes a valid criticism as to the terminology, since tethered pellet experiments do not record propagation. We believe the periodic bouts of propulsive force on the pellet is triggered by the same activity underlying the CMC. In our experience, these activities have similar periodicity, force and identical pharmacological properties. Consistent with this, we also tested full colons (n = 2) set up for typical CMC recordings by multiple force transducers, finding that CMCs were abolished by ZD7288, similar to fixed pellet recordings (data not shown).

      (9) The data from the optogenetic experiments are difficult to understand. How would stimulating IPANs in the distal colon generate retrograde CMCs and stimulating IPANs in the proximal colon do nothing? Additional characterization of the Cdh6+ population of cells is needed to understand the mechanisms underlying these effects.

      We agree that the different optogenetic responses in the proximal and distal colon are challenging to interpret, but perhaps not surprising in the wider context. It is not only possible that the different optogenetic responses in this study reflect regional differences in the Chd6+ neuronal populations, but also differences in neural circuits within these gut regions. A study some time ago by the authors showed that electrical stimulation of the proximal mouse colon was unable to evoke a retrograde (aborally) propagating CMC (Spencer, Bywater, 2002), but stimulation of the distal colon was readily able to. We concluded that at the oral lesion site there is a preferential bias of descending inhibitory nerve projections, since the ascending excitatory pathways have been cut off. In contrast, stimulation of the distal colon was readily able to activate an ascending excitatory neural pathway, and hence induce the complex CMC circuits required to generate an orally propagating CMC. Indeed, other recent studies have added to a growing body of evidence for significant differences in the behaviors and neural circuits of the two regions (Li et al., 2019, Costa et al., 2021a, Costa et al., 2021b, Nestor-Kalinoski et al., 2022). We will expand this discussion.

      (1) N. J. Spencer, R. A. Bywater, Enteric nerve stimulation evokes a premature colonic migrating motor complex in mouse. Neurogastroenterology & Motility 14, 657–665 (2002).

      (2) Li Z, Hao MM, Van den Haute C, Baekelandt V, Boesmans W, Vanden Berghe P (2019) Regional complexity in enteric neuron wiring reflects diversity of motility patterns in the mouse large intestine. Elife 8.

      (3). Costa M, Keightley LJ, Hibberd TJ, Wiklendt L, Dinning PG, Brookes SJ, Spencer NJ (2021a) Motor patterns in the proximal and distal mouse colon which underlie formation and propulsion of feces. Neurogastroenterol Motil e14098.

      (4) Costa M, Keightley LJ, Hibberd TJ, Wiklendt L, Smolilo DJ, Dinning PG, Brookes SJ, Spencer NJ (2021b) Characterization of alternating neurogenic motor patterns in mouse colon. Neurogastroenterol Motil 33:e14047.

      (5) Nestor-Kalinoski A, Smith-Edwards KM, Meerschaert K, Margiotta JF, Rajwa B, Davis BM, Howard MJ (2022) Unique Neural Circuit Connectivity of Mouse Proximal, Middle, and Distal Colon Defines Regional Colonic Motor Patterns. Cell Mol Gastroenterol Hepatol 13:309-337.e303.

    1. eLife Assessment

      This important study reports on a basis for neurabin-mediated specification of substrate choice by protein phosphatase-1. The data from the comprehensive approach using structural, biochemical, and computational methods are compelling, but the role of the crucial tryptophan residue in the recognition motif can be further tested to strengthen the main argument. This paper is broadly relevant to those investigating various cellular signaling cascades that entail phosphorylation as the main mechanism.

    2. Reviewer #1 (Public review):

      Summary:

      In this manuscript the Treisman and colleagues address the question of how protein phosphatase 1 (PP1) regulatory subunits (or PP1-interacting protein (PIPs)) confer specificity on the PP1 catalytic subunit which by itself possesses little substrate specificity. In prior work the authors showed that the PIP Phactrs confers specificity by remodelling a hydrophobic groove immediately adjacent to the PP1 catalytic site through residues within the RVxF- ø ø -R-W string of Phactrs. Specifically, the residues proximal and including the 'W' of the RVxF- ø ø -R-W string remodel the hydrophobic groove. Other residues of the RVxF- ø ø -R-W string (i.e. the RVxF- ø ø -R) are not involved in this remodelling.

      The authors suggest that the RVxF- ø ø -R-W string is a conserved feature of many PIPs including PNUTS, Neurabin/spinophilin and R15A. However, from a sequence and structural perspective, only the RVxF- ø ø -R- is conserved. The W is not conserved in most and in the R15A structure (PDB:7NZM) the Trp side chain points away from the hydrophobic channel - this could be a questionable interpretation due to model-building into the low-resolution cryo-EM map (4 A).

      In this paper, the authors convincingly show that Neurabin confers substrate specificity through interactions of its PDZ domain with the PDZ domain-binding motif (PBM) of 4E-BP. They show the PBM motif is required for Neurabin to increase PP1 activity towards 4E-BP and a synthetic peptide modelled on 4E-BP and also a synthetic peptide based on IRSp53 with a PBM added. The PBM of 4E-BP1 confers high affinity binding to the Neurabin PDZ domain. A crystal structure of a PP1-4E-BP1 fusion with Neurabin shows that the PBM of 4E-BP interacts with the PDZ domain of Neurabin. No interactions of 4E-BP and the catalytic site of PP1 are observed. Cell biology work showed that Neurabin-PP1 regulates the TOR signalling pathway by dephosphorylating 4E-BPs.

      Strengths:

      This work demonstrates convincingly using a variety of cell biology, proteomics, biophysics and structural biology that the PP1 interacting protein Neurabin confers specificity on PP1 through an interaction of its PDZ domain with a PDZ-binding motif of 4E-BP1 proteins. Remodelling of the hydrophobic groove of the PP1 catalytic subunit is not involved in Neurabin-dependent substrate specificity, in contrast to how Phactrs confers specificity on PP1. The active site of the Neurabin/PP1 complex does not recognise residues in the vicinity of the phospho-residue, thus allowing for multiple phospho-sites on 4E-BP to be dephosphorylated by Neurabin/PP1. This contrasts with substrate specificity conferred by the Phactrs PIP that confers specificity of Phactrs/PP1 towards its substrates in a sequence-specific context by remodelling the hydrophobic groove immediately adjacent to the catalytic. The structural and biochemical insights are used to explore the role of Neurabin/PP1 in dephosphorylation 4E-BPs in vivo, showing that Neurabin/PP1 regulates the TOR signalling pathway, specifically mTORC1-dependent translational control.

      Weaknesses:

      The only weakness is the suggestion that a conserved RVxF- ø ø -R-W string exists in PIPs. The 'W' is not conserved in sequence and 3 dimensions in most of the PIPs discussed in this manuscript. The lack of conservation of the W would be consistent with the finding based on multiple PP1-PIP structures that apart from Phactrs, no other PIP appears to remodel the PP1 hydrophobic channel.

    3. Reviewer #2 (Public review):

      This manuscript explores the molecular mechanisms that are involved in substrate recognition by the PP1 phosphatase. The authors previously showed that the PP1 interacting protein (PPI), PhactrI, conferred substrate specificity by remodelling the PP1 hydrophobic substrate groove. In this work, the authors aimed to understand the key determinant of how other PIPs, Neurabin and Spinophilin, mediate substrate recognition.

      The authors generated a few PP1-PIP fusion constructs, undertook TMT phosphoproteomics and validated their method using PP1-Phactr1/2/3/4 fusion constructs. Using this method, the authors identified phsophorylation sites controlled by PP1-Neurabin and focussed their work on 4E-BP1, thereby linking PP1-Neurabin to mTORC1 signalling. Upon validating that PP1-Neurabin dephosphorylates 4E-BP1, they determined that 4E-BP1 PBM binds to the PDZ domain of Neurabin with an affinity that was greater than 30-fold as compared to other substrates. PP1-Neurabin dephosphorylated 4E-BP1WT and IRSp53WT with a catalytic efficiency much greater than PP1 alone. However, PP1-Neurabin bound to 4E-BP1 and IRSp53 mutants lacking the Neurabin PDZ domain with a catalytic efficiency lesser than that observed with 4E-BP1WT. These results indicate the involvement of the PDZ domain in facilitating substrate recruitment by PP1-Neurabin. Interestingly, PP1-Phactr1 dephosphorylation of 4E-BP1 phenocopies PP1 alone, while PP1-Phactr1 dephosphorylates IRSp53 to a much higher extent than PP1 alone. These results highlight the importance of the PDZ domain and also shed light on how different PP1-PIP holoenzymes mediate substrate recognition using distinct mechanisms. The authors also show that the remodelling of the hydrophobic PP1 substrate groove which is essential for substrate recognition by PP1-Phactr1, was not required by PP1-Neurabin. Additionally, the authors also resolved the structure of a PP1-4E-BP1 fusion with the PDZ-containing C-terminal of Neurabin and observed that the Neurabin/PP1-4E-BP1 complex structure was oriented at 21{degree sign} to that in the unliganded Spinophilin/PP1 complex (resolved by Ragusa et al., 2010) owing to a slight bend in the C-terminal section that connects it to the RVxF-ΦΦ-R-W string. Since no interaction was observed with the remodelled PP1-Neurabin hydrophobic groove, the authors utilised AlphaFold3 to further answer this. They observed a high confidence of interaction between the groove and phosphorylated substrate and a low confidence of interaction between the groove and unphosphorylated substrate, thereby suggesting that the hydrophobic groove remodelling is not involved in PP1-Neurabin recognition and dephosphorylation of 4E-BP1.

      In this work, the authors provide novel insights into how Neurabin depends on the interaction between its PDZ domain and PBM domains of potential substrates to mediate its recruitment by PP1. Additionally, they uncover a novel PP1-Neurabin substrate, 4E-BP1. They systematically employ phosphoproteomics, biochemical, and structural methods to investigate substrate specificity in a robust fashion. Furthermore, the authors also compare the interactions between PP1-Neurabin to 4E-BP1 and IRSp53 (PP1-Phactr1 substrate) with PP1-Phactr1, to showcase the specificity of the mode of action employed by these complexes in mediating substrate specificity. The authors employ an innovative PP1-PIP fusion strategy previously explored by Oberoi et al., 2016 and the authors themselves in Fedoryshchak et al., 2020. Although this method, allows for a more controlled investigation of the interactions between PP1-PIPs and its substrates, this methodology may not fully recapitulate the interactions that may occur in a physiological setting. This could potentially be overcome by studying the interactions of the full proteins using classical biochemical approaches in cell lines. Furthermore, the authors have substantially characterised the importance of the PDZ domain using their fusion constructs, however, I believe that further exploration into either structural or AlphaFold3 modelling of PBM domain substrate mutants, or a Neurabin PDZ-domain mutant might further strengthen this claim. Overall, the paper makes a substantial contribution to understanding substrate recognition and specificity in PP1-PIP complexes. The study's innovative methods, biological relevance, and mechanistic insights are strengths, but whether this mechanism occurs in a physiological context is unclear.

    4. Reviewer #3 (Public review):

      Protein Phosphatase 1 (PP1), a vital member of the PPP superfamily, drives most cellular serine/threonine dephosphorylation. Despite PP1's low intrinsic sequence preference, its substrate specificity is finely tuned by over 200 PP1-interacting proteins (PIPs), which employ short linear motifs (SLIMs) to bind specific PP1 surface regions. By targeting PP1 to cellular sites, modifying substrate grooves, or altering surface electrostatics, PIPs influence substrate specificity. Although many PIP-PP1-substrate interactions remain uncharacterized, the Phactr family of PIPs uniquely imposes sequence specificity at dephosphorylation sites through a conserved "RVxF-ΦΦ-R-W" motif. In Phactr1-PP1, this motif forms a hydrophobic pocket that favors substrates with hydrophobic residues at +4/+5 in acidic contexts (the "LLD motif"), a specificity that endures even in PP1-Phactr1 fusions. Neurabin/Spinophilin remodel PP1's hydrophobic groove in distinct ways, creating unique holoenzyme surfaces, though the impact on substrate specificity remains underexplored. This study investigates Neurabin/Spinophilin specificity via PDZ domain-driven interactions, showing that Neurabin/PP1 specificity is governed more by PDZ domain interactions than by substrate sequence, unlike Phactr1/PP1.

      A significant strength of this work is the use of PP1-PIP fusion proteins to effectively model intact PP1•PIP holoenzymes by replicating the interactions that remodel the PP1 interface and confer site-specific substrate specificity. When combined with proteomic analyses to assess phospho-site depletion in mammalian cells, these fusions offer critical insights into holoenzyme specificity, revealing new candidate substrates for Neurabin and Spinophilin. The studies present compelling evidence that the PDZ domain of PP1-Neurabin directs its specificity, with the remodelled PP1 hydrophobic groove interactions having minimal impact. This mechanism is supported by structural analysis of the PP1-4E-BP1 substrate fusion bound to a Neurabin construct, highlighting the 4E-BP1/PDZ interaction. This work delivers crucial insights into PP1-PIP holoenzyme function, combining biochemical, proteomic, and structural approaches. It validates the PP1-PIP fusion protein model as a powerful tool, suggesting it may extend to studying additional holoenzymes. While an extremely useful model, it must be considered unlikely the PP1-PIP fusions fully recapitulate the specificity and regulation of the holoenzyme.

    5. Author response:

      We are very pleased to see these positive reviews of our preprint.

      Reviewers 1 and 3 raise issues around PIP-PP1 interactions.

      (1) Role of the “RVxF-ΦΦ-R-W string”

      Most PIPs interact with the globular PP1 catalytic core through short linear interaction motifs (SLiMs) and Choy et al (PNAS 2014) previously showed that many PIPs interact with PP1 through conserved trio of SLiMs, RVxF-ΦΦ-R, which is also present in the Phactrs.

      Previous structural analysis showed the trajectory of the PPP1R15A/B, Neurabin/Spinphilin (PPP1R9A/B), and PNUTS (PPP1R10) PIPs across the PP1 surface encompasses not only the RVxF-ΦΦ-R trio, but also additional sequences C-terminal to it (Chen et al, eLife, 2015). This extended trajectory is maintained in the Phactr1-PP1 complex (Fedoryshchak et al, eLife (2020). Based on structural alignment we proposed the existence of an additional hydrophobic “W” SLiM that interacts with the PP1 residues I133 and Y134.

      The extended “RVxF-ΦΦ-R-W” interaction brings sequences C-terminal to the “W” SLiM into the vicinity of the hydrophobic groove that adjoins the PP1 catalytic centre. In the Phactr1/PP1 complex, these sequences remodel the groove, generating a novel pocket that facilitates sequence-specific substrate recognition.

      This raises the possibility that sequences C-terminal to the extended “RVxF-ΦΦ-R-W string” in the other complexes also confer sequence-specific substrate recognition, and our study aims to test this hypothesis. Indeed, the hydrophobic groove structures of the Neurabin/Spinophilin/PP1 and Phactr1/PP1 complexes differ significantly (Ragusa et al, 2010; see Fedoryshchak et al 2020, Fig2 FigSupp1).

      (2) Orientation of the W side chain

      Reviewer 1 points out that in the substrate-bound PP1/PPP1R15A/Actin/eIF2 pre-dephosphorylation complex the W sidechain is inverted with respect to its orientation in  PP1-PPP1R15B complex (Yan et al, NSMB 2021). The authors proposed that this may reflect the role of actin in assembly of the quaternary complex. This does not necessarily invalidate the notion that sequences C-terminal to the “W” motif might play a role in actin-independent substrate recognition, and we therefore consider our inclusion of the R15A/B fusions in our analysis to be reasonable.

      (3) Conservation of W

      The motif ‘W’ does not mandate tryptophan - Phactrs and PPP1R15A/B indeed have W at this position but Neurabin/spinophilin contain VDP, which makes similar interactions. Similarly the _“_RVxF” motifs in Phactr1, Neurabin/Spinophilin, PPP1R15A/B and PNUTS are LIRF, KIKF, KV(R/T)F and TVTW respectively.

      In our revision, we will present comparisons of the differentially remodelled/modified PP1 hydrophobic groove in the various complexes, discuss the different orientations of the tryptophan in the previously published PPP1R15A/PP1 and PPP1R15B/PP1 structures. We will also address the other issues raised by the referees.

    1. eLife Assessment

      This solid paper reports on the use of artificial intelligence to assess bone marrow adipose tissue in the skull. The method employing MRI is novel and that approach allows for the identification of genetic loci that regulate this trait as well as others using data from the UK biobank. Overall this is an important contribution although the authors should consider several points: 1-validation of the T1-weighted MRI signal intensity; 2-further discussion of the sex differences; and 3-cross-trait linkage disequilibrium score regression (LDSC) for osteoporosis, Parkinson's disease, and cognitive function.

    2. Reviewer #1 (Public review):

      The authors of this study developed a method to quantify calvarial bone marrow from MRI head scans, enabling the study of its composition in large datasets of adults, usually collected to study the brain. Bone marrow intensity can be semi-quantitatively measured in T1-weighted MRI scans due to the greater signal intensity of fat than watery red marrow. This is an ingenious use of the MRI-produced information for other important phenotypes, such as bone structure and marrow content. Different head types were tested for complying with the model, which is notable.

      The model was also successfully validated using several publicly available MRI resources - real data - in (1) a dataset consisting of 30 individuals that were scanned 10 times each at 3-day intervals, and (2) the monozygotic (MZ) twin data from the Human Connectome Project cohort. Then the authors applied this validated method to head-MRI scans from the UK Biobank (n=33,042) to extract information on the spatial distribution of bone marrow adiposity (BMA) in the calvaria, allowing a GWAS to identify associated genes.

      The authors revealed high heritability and identified 41 genetic loci significantly associated with the BMA trait, including six sex-specific loci. Of note, statistics estimate that 99% of BMA trait-influencing variants are shared with BMD (497 of 500 variants), which may mean these results demonstrate the biological relevance to bone health. Some of the BMA genes were found related to the Wnt pathway, including WNT16, WNT4, NXN; this is a "positive control", since the Wnt/β-catenin signaling pathway was suggested as an important determinant of BMA. Also, associations in genes (BMP4, DLX5, LGR4, LRP4, SFRP4) that are known to specifically influence adiposity, are encouraging. Integrating mapped genes with bone marrow single-cell RNA-seq data revealed patterns of adipogenic lineage differentiation and lipid loading.

      The study also investigated the genetic overlap between BMA and twelve (or 13) "brain and body" traits and identified significant genetic correlations with BMI, cognitive ability, and Parkinson's disease.

      In sum, since MRI head scans present a hitherto unexplored opportunity to address unresolved aspects of bone marrow biology, this study is both timely and innovative.

      There are, however, some assumptions, findings, and their interpretation, which require more critical focus.

      Sex-specificity is well described and studied here. Men have higher BMA than women, but post-menopausal women catch up in the BMA values. The authors believe that calvarial marrow has a number of features that make it particularly well-suited to the study of BMA process - which is clinically important in other bone sites. It has a simple "sandwiched" structure that they are able to model. This is true only to some extent: a condition called "Hyperostosis frontalis interna", of unknown etiology (described by Smith & Hemphill in 1956) - is characterized by irregular overgrowth of the inner table of the frontal bone (symmetric/bilateral). Although not of clinical significance, typically benign, studies report a prevalence of 12%; However, it's most common in postmenopausal women - where prevalences up to 49% in women over the age of 65 - have been reported. Thus, sexual dimorphism is obvious and the effect of estrogen is likely shared with whichever bone - and marrow - age-related pathology. So, for women not using HRT, this new layer of the bone might interfere with the calvarial BMA readings and in turn, affect the BMA-related analyses. The authors suspect that the effect of BMA on BMD may be biased in women; they should comment on those "with low BMD and high BMA" given that hyperostosis frontalis might be an issue. A strong effect of SNPs in the ESR1 chromosomal region might be akin to the above concern.

      Then, there is a perfect overlap of the BMA SNPs that are shared with BMD (497 of 500 variants), which may prove a "face validity" of the MRI-derived BMA. However, the BMD in the study was heel-derived eBMD - which is a good proxy for osteoporosis and is mostly driven by trabecular bone. Thus, there might be a concern that the BMA metrics capture some trabecular BMD.

      Next, integrating mapped genes with existing bone marrow single-cell RNA-sequencing data revealed patterns of adipogenic lineage differentiation and lipid loading. The problem here is that the scRNAseq studies of the Bone Marrow niche are overwhelmingly mouse. The authors might wish to justify why they are relevant to humans (in the absence of the human-specific scRNAseq).

      For genetic correlation analysis, the authors selected 7 body and 6 brain traits. The latter traits reflect cognition (general cognitive ability and educational attainment) and brain-related disorders. This selection might seem arbitrary. The interpretation of genetic correlation with cognitive ability, education, and Parkinson's disease was attributed to the recently discovered vascular channels that link calvarial bone marrow to the meninges. This is a fascinating hypothesis, which requires functional proof. However, there might be simpler explanations. Thus, the diploe and the inner table of the calvarium are drained by the same veins as the dura. From the anatomy textbook, we know that diploic veins connect the pericranial and endocranial venous system through the skull.

    3. Reviewer #2 (Public review):

      Summary:

      This study develops a new artificial intelligence method for high-throughput analysis of skull bone marrow from MRI data, which may be useful for large-scale biological analyses. Using this method, the authors then attempt to estimate skull bone marrow adiposity (BMA) using T1-weighted signal intensity from MRI scans of ~33,000 people, followed by genome-wide association analysis; however, the approach is inadequate because T1-weighted signal intensity is not validated for measurement of bone marrow adiposity. If it could be validated, the study would be an important advance in understanding of bone marrow adiposity and skeletal biology.

      Strengths:

      This paper is well-written, and the figures are nicely presented. The neural network method used for analysing skull bone marrow is innovative, and the authors validate this through several approaches. Therefore, the authors have achieved the aim of developing a method for large-scale analysis of skull bone marrow from MRI data.

      The GWAS is reasonably well-powered and addresses potential ethnicity differences, with one GWAS done across white males and females, and a separate GWAS in non-white participants. The methodology also conforms to common GWAS standards, including for mapping genetic variants to candidate genes. Moreover, the study further investigates the biological roles of these genes by analysing their expression in single-cell RNA sequencing data.

      Weaknesses:

      The fundamental weakness is that T1-weighted MRI signal intensity (T1W) is used as an estimate of BMA, but it has never been validated for this. The authors show that this T1W parameter measures something that is heritable and can be compared between subjects, but they don't show that it actually measures (or even estimates) calvarial BMA. There is an attempt to do so by comparing the T1W parameter with data from quantitative T1 images: the authors show a reasonable correlation with some of the quantitative T1 image data. However, this still does not show that the parameter is measuring BMA; it could be measuring some other biological characteristic, but this remains unclear. So, there is a need to validate the T1W parameter against an established measure of BMA, such as the bone marrow fat-fraction or proton density fat fraction measured from multi-echo MRI analysis.

      Without validating this BMA measurement method, it is not possible to interpret the GWAS or other findings reported in the study.

      A less critical weakness is that the GWAS has been done only on a single cohort, without replicating the findings in a follow-up cohort. For example, the authors could repeat their analysis on the remaining ~50,000 UK Biobank imaging participants for whom MRI data is now available. However, this would be pointless without knowing what biological characteristic(s) the T1W parameter is actually reflecting.

    4. Reviewer #3 (Public review):

      Summary:

      This manuscript, "Estimating bone marrow adiposity from head MRI and identifying its genetic 2 architecture", brings together the groups of Drs. Kaufmann and Hughes in a tour de force work to develop an artificial neural network that localizes calvaria bone marrow in T1-weighted MRI head scans, with the goal of studying its composition in several large MRI datasets, and to model sex-dimorphic age trajectories, including the effect of menopause.

      Strengths:

      Bone marrow adiposity is a very active tissue with far-reaching implications for tissue crosstalk and human health than we had initially recognized. Although MRI has been used to measure BM, studies such as the one by these two groups are still lacking whereas very large datasets are analyzed using advanced AI machine learning tools coupled with genetic studies and a specific pathology. The groups had to develop new methods and new AI machine-learning tools for the imaging analyses.

      Weaknesses:

      Some aspects of the work that authors could add additional clarification.

      (1) Imaging Limitations: The authors provide an excellent overview and references supporting the use of MRI as a method for assessing marrow fat, particularly with some specific modifications. However, MRI images can be affected by various factors, including the presence of other tissues as well as specific MRI settings, which are much harder to precisely control when using different datasets.

      (2) The specific density of cranial bones as it relates to the types of bone marrow: Cranial bones are extremely dense structures, which naturally interfere with MRI imaging. While it is thought that cranial bones have mostly "red bone marrow", this is only true for a short time in humans. How sensitive is their system in differentiating between red and yellow BM?

      (3) Both items above are further complicated by aging, but aging is not a linear event as we have learned. There are specific bursts of aging in humans around the age of 45 and early 60s. How do the system and model predict or incorporate these peaks of aging? It seems from the data shown that aging is reflected more as a linear phenomenon. Is this because additional aging datasets are needed?

      (4) The authors describe in richness of detail their AI learning programming and how it extracted the data from datasets. The authors also show some important correlations with specific genes, SNPs. What is not clear is how conditions such as anemia for example. An expected finding would be that patients with chronic anemia have lower bone marrow (BM) signal intensity on MRI scans than healthy people. This is because the signal intensity of BM depends on the fat-to-cell ratio in the tissue. Furthermore, patients with a host of musculoskeletal disorders ranging from osteopenia to osteoporosis, sarcopenia, and osteosarcopenia will also have altered MRI scans. When using such large datasets how did the authors control or exclude these pathological conditions, or were all these conditions likely present?

      (5) Some of the genes and SNPs although significant showed very small correlations. What is their likely physiological significance?

      (6) The authors could use this excellent manuscript to expand their discussion to include the need for studies like theirs to be also complemented by multi-OMICS studies that will include proteomics and lipidomics of BM, bones, and muscles.

    5. Author response:

      We thank the reviewers for their constructive reviews, we are working on a response and revised manuscript which we will submit when complete.

    1. eLife Assessment

      The authors use a multidisciplinary approach to provide a useful link between Beta-alanine and S. Typhimurium (STM) infection and virulence. The work shows how Beta-alanine synthesis mediates zinc homeostasis regulation, possibly contributing to virulence. However, the work is incomplete and requires additional data to firmly establish the connection between Beta-alanine synthesis and zinc homeostasis. Measuring the source and zinc content of STM in vivo and examining mechanisms in human clinical strains and other serovars would be essential.

    2. Reviewer #1 (Public review):

      Summary:

      Ma, Yang et al. report a new investigation aimed at elucidating one of the key nutrients S. Typhimurium (STM) utilizes with the nutrient-poor intracellular niche within the macrophage, focusing on the amino acid beta-alanine. From these data, the authors report that beta-alanine plays an important role in mediating STM infection and virulence. The authors employ a multidisciplinary approach that includes some mouse studies and ultimately propose a mechanism by which panD, involved in B-Ala synthesis, mediates the regulation of zinc homeostasis in Salmonella. The impact of this work is questionable. There are already many studies reporting Salmonella-effector interactions, and while this adds to that knowledge it is not a significant advance over previous studies. While the authors are investigating an interesting question, the work has two important weaknesses; if addressed, the conclusions of this work and broader relevance to bacterial pathogenesis would be enhanced.

      Strengths:

      This reviewer appreciates the multidisciplinary nature of the work. The overall presentation of the figure graphics are clear and organized.

      Weaknesses:

      First, this study is very light on mechanistic investigations, even though a mechanism is proposed. Zinc homeostasis in cells, and roles in bacteria infections, are complex processes with many players. The authors have not thoroughly investigated the mechanisms underlying the roles of B-Ala and panD in impacting STM infection such that other factors cannot be ruled out. Defining the cellular content of Zn2+ STM in vivo would be one such route. With further mechanistic studies, the possibility cannot be ruled out that the authors have simply deleted two important genes and seen an infection defect - this may not relate directly to Zn2+ acquisition.

      Second, the authors hint at their newly described mechanism/pathway being important for disease and possibly a target for therapeutics. This claim is not justified given that they have employed a single STM strain, which was isolated from chickens and is not even a clinical isolate. The authors could enhance the impact of their findings and relevance to human disease by demonstrating it occurs in human clinical isolates and possibly other serovars. Further, the use of mouse macrophage as a model, and mice, have limited translatability to human STM infections.

    3. Reviewer #2 (Public review):

      Summary:

      Salmonella exploits host- and bacteria-derived β-alanine to efficiently replicate in host macrophages and cause systemic disease. β-alanine executes this by increasing the expression of zinc transporter genes and therefore the uptake of zinc by intracellular Salmonella.

      Strengths:

      The experiments designed are thorough and the claims made are directly related to the outcome of the experiments. No overreaching claims were made.

      Weaknesses:

      A little deeper insight was expected, particularly towards the mechanistic aspects. For example, zinc transport was found to be the cause of the b-alanine-mediated effect on Salmonella intracellular replication. It would have been very interesting to see which are the governing factors that may get activated or inhibited due to Zn accumulation that supports such intracellular replication.

    4. Reviewer #3 (Public review):

      Summary:

      Salmonella is interesting due to its life within a compact compartment, which we call SCV or Salmonella containing vacuole in the field of Salmonella. SCV is a tight-fitting vacuole where the acquisition of nutrients is a key factor by Salmonella. The authors among many nutrients, focussed on beta-alanine. It is also known from many other studies that Salmonella requires beta-alanine. The authors have done in vitro RAW macrophage infection assays and In vivo mouse infection assays to see the life of Salmonella in the presence of beta-alanine. They concluded by comprehending that beta-alanine modulates the expression of many genes including zinc transporters which are required for pathogenesis.

      Strengths:

      This study made a couple of knockouts in Salmonella and did a transcriptomic investigation to understand the global gene expression pattern.

      Weaknesses:

      The following questions are unanswered:

      (1) It is not clear how the exogenous beta-alanine is taken up by macrophages.

      (2) It is not clear how the Beta-alanine from the cytosol of the macrophage enters the SCV.

      (3) It is not clear how the beta-alanine from SCV enters the bacterial cytosol.

      (4) There is no clarity on the utilization of exogenous beta-alanine of the host and the de novo synthesis of beta-alanine by panD of Salmonella.

    5. Author response:

      Public Reviews:

      Reviewer #1 (Public review):

      Summary:

      Ma, Yang et al. report a new investigation aimed at elucidating one of the key nutrients S. Typhimurium (STM) utilizes with the nutrient-poor intracellular niche within the macrophage, focusing on the amino acid beta-alanine. From these data, the authors report that beta-alanine plays an important role in mediating STM infection and virulence. The authors employ a multidisciplinary approach that includes some mouse studies and ultimately propose a mechanism by which panD, involved in B-Ala synthesis, mediates the regulation of zinc homeostasis in Salmonella. The impact of this work is questionable. There are already many studies reporting Salmonella-effector interactions, and while this adds to that knowledge it is not a significant advance over previous studies. While the authors are investigating an interesting question, the work has two important weaknesses; if addressed, the conclusions of this work and broader relevance to bacterial pathogenesis would be enhanced.

      Strengths:

      This reviewer appreciates the multidisciplinary nature of the work. The overall presentation of the figure graphics are clear and organized.

      Weaknesses:

      First, this study is very light on mechanistic investigations, even though a mechanism is proposed. Zinc homeostasis in cells, and roles in bacteria infections, are complex processes with many players. The authors have not thoroughly investigated the mechanisms underlying the roles of B-Ala and panD in impacting STM infection such that other factors cannot be ruled out. Defining the cellular content of Zn2+ STM in vivo would be one such route. With further mechanistic studies, the possibility cannot be ruled out that the authors have simply deleted two important genes and seen an infection defect - this may not relate directly to Zn2+ acquisition.

      Thank you for your patient and thoughtful reading as well as the constructive comments and advice about our manuscript. We will revise the manuscript based on your comments and suggestions.

      You are right that this work have not thoroughly investigated the mechanisms underlying the roles of β-Ala, panD and zinc in impacting Salmonella infection. We will perform additional experiments to detect the content of zinc during Salmonella infection in vivo and in vitro, according to your suggestions.

      We agree that other unknown mechanism(s) are also involved in the virulence regulation by β-Ala in Salmonella, as our results showed that the double mutant Δ_panD_Δ_znuA_ (cannot synthesis of β-Ala and uptake of zinc) is more attenuated than the single mutant Δ_znuA_ (Figure 5D), suggesting that the contribution of β-Ala to the virulence of Salmonella is partially dependent on zinc acquisition_._ We will reword the related description throughout the manuscript for clarity.

      Second, the authors hint at their newly described mechanism/pathway being important for disease and possibly a target for therapeutics. This claim is not justified given that they have employed a single STM strain, which was isolated from chickens and is not even a clinical isolate. The authors could enhance the impact of their findings and relevance to human disease by demonstrating it occurs in human clinical isolates and possibly other serovars. Further, the use of mouse macrophage as a model, and mice, have limited translatability to human STM infections.

      We thank your comments and advice regarding our manuscript and are delighted to accept them.

      You are right that our current findings are relatively limited and not sufficient for disease therapeutics. We will reword the related description throughout the manuscript. Based on this comment, we will also use Salmonella Typhi and human macrophages to perform additional experiments to extend our findings. Salmonella Typhi is a human-limited Salmonella serovar and the cause of typhoid fever, a severe lethal systemic disease. Salmonella Typhimurium (STM) cause systemic disease in mice, which is similar to the symptoms of typhoid fever in human and has been widely used to explore the pathogenesis of Salmonella.

      Reviewer #2 (Public review):

      Summary:

      Salmonella exploits host- and bacteria-derived β-alanine to efficiently replicate in host macrophages and cause systemic disease. β-alanine executes this by increasing the expression of zinc transporter genes and therefore the uptake of zinc by intracellular Salmonella

      Strengths:

      The experiments designed are thorough and the claims made are directly related to the outcome of the experiments. No overreaching claims were made.

      Weaknesses:

      A little deeper insight was expected, particularly towards the mechanistic aspects. For example, zinc transport was found to be the cause of the b-alanine-mediated effect on Salmonella intracellular replication. It would have been very interesting to see which are the governing factors that may get activated or inhibited due to Zn accumulation that supports such intracellular replication.

      We appreciate your review and advice. We will design and perform additional experiments to further investigate the mechanisms by which β-Ala, panD and zinc influence Salmonella infection, according to your suggestions. For example, we will detect the content of zinc during Salmonella infection in vivo and in vitro.

      Reviewer #3 (Public review):

      Summary:

      Salmonella is interesting due to its life within a compact compartment, which we call SCV or Salmonella containing vacuole in the field of Salmonella. SCV is a tight-fitting vacuole where the acquisition of nutrients is a key factor by Salmonella. The authors among many nutrients, focussed on beta-alanine. It is also known from many other studies that Salmonella requires beta-alanine. The authors have done in vitro RAW macrophage infection assays and In vivo mouse infection assays to see the life of Salmonella in the presence of beta-alanine. They concluded by comprehending that beta-alanine modulates the expression of many genes including zinc transporters which are required for pathogenesis.

      Strengths:

      This study made a couple of knockouts in Salmonella and did a transcriptomic investigation to understand the global gene expression pattern.

      Weaknesses:

      The following questions are unanswered:

      (1) It is not clear how the exogenous beta-alanine is taken up by macrophages.

      We thank the reviewer for the question. It is reported that β-alanine is delivered to eukaryotic cells through TauT (SLC6A6) and PAT1 (SLC36A1) transporters (Am J Physiol Cell Physiol. 2020 Apr 1;318(4):C777-C786; Br J Pharmacol 161: 589 –600, 2010; Biochim Biophys Acta 1194: 44 –52, 1994). We will add this information in the revised manuscript.

      (2) It is not clear how the Beta-alanine from the cytosol of the macrophage enters the SCV.

      Thank you for pointing it out. You are right that the above question is not clear. We will do our best to achieve this issue, via reviewing literature, designing and performing additional experiments.

      (3) It is not clear how the beta-alanine from SCV enters the bacterial cytosol.

      Thank you for the question. We have attempted to find the transporter of β-alanine in Salmonella, but we found that the CycA transporter transports β-alanine  in Escherichia coli but not in Salmonella, despite Salmonella is the closely related species of E. coli.

      According to your suggestion, we will perform additional experiments to verify whether BasC is involved in the transport of β-alanine into Salmonella cytosol.

      (4) There is no clarity on the utilization of exogenous beta-alanine of the host and the de novo synthesis of beta-alanine by panD of Salmonella.

      Thank you for the question. Our results showed that β-alanine concentrations were downregulated in the Salmonella-infected RAW264.7 cells, and the replication of Salmonella in RAW264.7 cells was significantly increased with the addition of β-alanine to the culture medium (RPMI) of RAW264.7 cells, implying that intracellular Salmonella use host-derived β-alanine for growth. Unfortunately, we have not found the transporter of exogenous β-alanine into Salmonella cytosol. We will perform additional experiments to verify whether BasC is involved in the transport of β-alanine into Salmonella cytosol, or search for other transporters that are responsible for the uptake of β-alanine into Salmonella.

      Upon confirming the β-alanine transporter in Salmonella, we will compare the intracellular replication and virulence between WT and the transporter mutant strain, via cell and mice infection assays. If the replication ability and virulence of the mutant strain decreases relative to WT, suggesting that Salmonella uptakes the exogenous beta-alanine of the host to enhance intracellular replication and its virulence in mice.

      We have found that the replication of Salmonella panD mutant in macrophages and the virulence in mice were significantly decreased relative to WT, suggesting that the de novo synthesis of β-alanine is important for Salmonella intracellular replication and virulence_. To further confirm that both uptake of host-derived β-alanine and de novo synthesis of β-alanine are critical for the full virulence of _Salmonella, we will generate the double mutant of panD and β-alanine transporter gene. If the replication ability and virulence of the double mutant decreases compared with each of the single mutant, suggesting that Salmonella both utilizes the exogenous beta-alanine of the host and de novo synthesis of β-alanine for full virulence.

    1. eLife Assessment

      This article reports a useful set of findings on how electrophysiological response properties of neurons correlate with their position in the brain. The evidence currently remains incomplete, with reviewers making specific suggestions for how clustering needs to be redone. The manuscript would also benefit from a more focused presentation of results and the removal of incorrect claims about recording biases.

    2. Reviewer #1 (Public review):

      Summary:

      The paper by Tolossa et al. presents classification studies that aim to predict the anatomical location of a neuron from the statistics of its in-vivo firing pattern. They study two types of statistics (ISI distribution, PSTH) and try to predict the location at different resolutions (region, subregion, cortical layer).

      Strengths:

      This paper provides a systematic quantification of the single-neuron firing vs location relationship.

      The quality of the classification setup seems high.

      The paper uncovers that, at the single neuron level, the firing pattern of a neuron carries some information on the neuron's anatomical location, although the predictive accuracy is not high enough to rely on this relationship in most cases.

      Weaknesses:

      As the authors mention in the Discussion, it is not clear whether the observed differences in firing are epiphenomenal. If the anatomical location information is useful to the neuron, to what extent can this be inferred from the vicinity of the synaptic site, based on the neurotransmitter and neuromodulator identities? Why would the neuron need to dynamically update its prediction of the anatomical location of its pre-synaptic partner based on activity when that location is static, and if that information is genetically encoded in synaptic proteins, etc (e.g., the type of the synaptic site)? Note that the neuron does not need to classify all possible locations to guess the location of its pre-synaptic partner because it may only receive input from a subset of locations. If an argument on activity-based estimation being more advantageous to the neuron than synaptic site-based estimation cannot be made, I believe limiting the scope of the paper (e.g., in the Introduction) to an epiphenomenal observation and its quantification will improve the scientific quality.Life Assessment

      This article reports a useful set of findings on how electrophysiological response properties of neurons correlate with their position in the brain. The evidence currently remains incomplete, with reviewers making specific suggestions for how clustering needs to be redone. The manuscript would also benefit from a more focused presentation of results and the removal of incorrect claims about recording biases.

    3. Reviewer #2 (Public review):

      Summary:

      In this manuscript, Tolossa et al. analyze Inter-spike intervals from various freely available datasets from the Allen Institute and from a dataset from Steinmetz et al. They show that they can modestly decode between gross brain regions (Visual vs. Hippocampus vs. Thalamus), and modestly separate sub-areas within brain regions (DG vs. CA1 or various visual brain areas).

      Strengths:

      The paper is reasonably well written, and the definitions are quite well done. For example, the authors clearly explained transductive vs. inductive inference in their decoders. E.g., transductive learning allows the decoder to learn features from each animal, whereas inductive inference focuses on withheld animals and prioritizes the learning of generalizable features.

      Weaknesses:

      However, even with some of these positive aspects, I still found the manuscript to be a laundry list of results, where some results are overly explained and not particularly compelling or interesting, whereas interesting results are not strongly described or emphasized. The overall problem is that the study is not cohesive, and the authors need to either come up with a tool or demonstrate a scientific finding. The current version attempts to split the middle and thus is not as impactful as it could be.

    4. Author response:

      Reviewer #1 (Public review):

      Summary:

      The paper by Tolossa et al. presents classification studies that aim to predict the anatomical location of a neuron from the statistics of its in-vivo firing pattern. They study two types of statistics (ISI distribution, PSTH) and try to predict the location at different resolutions (region, subregion, cortical layer).

      Strengths:

      This paper provides a systematic quantification of the single-neuron firing vs location relationship.

      The quality of the classification setup seems high.

      The paper uncovers that, at the single neuron level, the firing pattern of a neuron carries some information on the neuron's anatomical location, although the predictive accuracy is not high enough to rely on this relationship in most cases.

      Thank you for your thoughtful feedback. The level of predictive accuracy offered by our current approach, while far above chance, is insufficient for electrode localization in most cases. Although, we speculate that our results represent a lower limit on possible performance—future improvements are almost certain as larger datasets are generated, more diverse features of neural activity are employed, and more advanced ML tools are implemented. We note that the current performance indicates a far more reliable embedding of anatomy in spiking than precedented by the modest statistical significance previously described in the literature. It would have been impossible to achieve this without the tremendous resources provided by the Allen Institute. In our revision, we will clarify that major performance improvements are both possible and probable.

      Weaknesses:

      As the authors mention in the Discussion, it is not clear whether the observed differences in firing are epiphenomenal. If the anatomical location information is useful to the neuron, to what extent can this be inferred from the vicinity of the synaptic site, based on the neurotransmitter and neuromodulator identities? Why would the neuron need to dynamically update its prediction of the anatomical location of its pre-synaptic partner based on activity when that location is static, and if that information is genetically encoded in synaptic proteins, etc (e.g., the type of the synaptic site)? Note that the neuron does not need to classify all possible locations to guess the location of its pre-synaptic partner because it may only receive input from a subset of locations.  If an argument on activity-based estimation being more advantageous to the neuron than synaptic site-based estimation cannot be made, I believe limiting the scope of the paper (e.g., in the Introduction) to an epiphenomenal observation and its quantification will improve the scientific quality.

      Summarily, in response to the two reviewers, we will minimize our discussion of this question in the revision. However, given that our results are either epiphenomenal or functional, we feel that it is important to indicate these possibilities, even if this indication is succinct and conservative.

      In pursuit of a more concise revision, we will not expand our discussion to accommodate this interesting conversation with the reviewer, but we are excited to briefly offer our perspective here.

      Regarding the epiphenomenal nature of our observations: this is a complex question that would be challenging but not impossible to validate experimentally. It has been previously established that neurons, especially those that integrate inputs from a variety of regions and are involved in diverse functions, could benefit from mechanisms for dynamically parsing inputs (Gutig, Sompolinsky 2006). Neurotransmitter and neuromodulator identities may indeed convey some information about presynaptic neuron location (e.g., NE may originate from the locus coeruleus). However, hypothetically, the binding of a neurotransmitter only bears on the postsynaptic neuron via ionic current, or second messenger activity. Postsynaptic neurons do not consume or otherwise endocytose the neurotransmitter, thus the ability of a neuron to “know” the presynaptic identity is a function of induced postsynaptic activity. Certainly, there are multiple streams of information that can provide insight into anatomical location all taking the ultimate form of neural activity and membrane dynamics. This would be broadly consistent with (for example) reward prediction error which is evident in dopamine release, firing rates, spiking patterns, and oscillatory rhythms.

      We could imagine a possible role for the embedding of location in spiking patterns. It is important to note that many neurons in neighboring areas share common neurotransmitters (e.g., glutamate, GABA). Neurons receiving input from multiple regions with similar neurotransmitter profiles could benefit from additional information in the spiking patterns for distinguishing input sources, especially for multimodal integration. For instance, an inferior parietal lobule neuron or microcircuit could be downstream from both auditory cortex (listening) and Broca’s area (speaking). Imagine an individual is in a crowded coffee shop waiting for their drink order to be called while speaking to their friend. In this scenario, it may be important to recognize region-specific activity and thus selectively attend to it. Thus, it is unlikely that neurons actively update a “location prediction,” but rather that location-related information is passively embedded in spike patterning and this might be dynamically leveraged in computation. We emphasize that this is a simplified conceptual example and not a hypothesis that we test in the paper. This conversation, however, is a wonderful example of the thought experiments that we hope will grow from this type of work.

      Reviewer #2 (Public review):

      Summary:

      In this manuscript, Tolossa et al. analyze Inter-spike intervals from various freely available datasets from the Allen Institute and from a dataset from Steinmetz et al. They show that they can modestly decode between gross brain regions (Visual vs. Hippocampus vs. Thalamus), and modestly separate sub-areas within brain regions (DG vs. CA1 or various visual brain areas).

      Strengths:

      The paper is reasonably well written, and the definitions are quite well done. For example, the authors clearly explained transductive vs. inductive inference in their decoders. E.g., transductive learning allows the decoder to learn features from each animal, whereas inductive inference focuses on withheld animals and prioritizes the learning of generalizable features.

      Thank you!

      Weaknesses:

      However, even with some of these positive aspects, I still found the manuscript to be a laundry list of results, where some results are overly explained and not particularly compelling or interesting, whereas interesting results are not strongly described or emphasized. The overall problem is that the study is not cohesive, and the authors need to either come up with a tool or demonstrate a scientific finding. The current version attempts to split the middle and thus is not as impactful as it could be

      In our revision, we will endeavor to present our results in line with your suggestions. Thank you for the careful and thorough feedback that will improve the readability of our manuscript. We strove to be complete in establishing the logic leading to our ultimate finding—that a robust code for anatomical location can be extracted from single neuron spike trains, but not from more traditional descriptions of neural activity. Our detection of this code, albeit not perfect in performance, is, in most cases, both far above chance levels and is robust to animal identity and laboratory of origin. Our presentation of these results is cohesive in as much as we sequentially establish a series of results that build towards a concluding set of experiments. We start by establishing a baseline via standard measurements and then explore more challenging problems through more complex models that build toward our final test.  Based on your feedback, we will contract and expand elements of this sequence.

      While our findings raise the possibility of developing a computational tool for electrode localization, pending additional features and/or datasets, our current focus is on establishing the neurobiological principle of anatomical embedding in spike trains. The purpose of briefly mentioning a possible application is that we hope to encourage those engaged in machine-learning on multi-modal neural data that this problem is tractable, yet still open. Based on your feedback, we will clarify that the focus of our current work is not an introduction of a new tool.

    1. eLife Assessment

      This valuable study clarifies the mechanism by which the kinesin-10 motor protein, chromosome-associated kinesin, Kid (KIF22), enables chromosome movement during mitosis, demonstrating that human and Xenopus Kid proteins function as processive, homodimeric kinesins capable of processive microtubule plus-end motility. The convincing work highlights that Kid can recruit and transport duplex DNA along microtubules via its conserved C-terminal DNA binding domain, revising our understanding of chromokinesins' role in chromosome motility during mitosis. Although the data are robust, the manuscript would benefit from some editing for clarity.

    2. Reviewer #1 (Public review):

      Summary:

      Mitotic kinesins carry out crucial roles in intracellular motility and mitotic spindle organization. Although many mitotic kinesins have been extensively studied, a few conserved mitotic motors remain poorly explored, including chromosome-associated kinesins. Here, Furusaki et al reconstitute recombinant chromosome-associated kinesin or chromokinesin (Kid) and reveal processive plus-end motility along microtubules. The authors purify multiple versions of Kid, revealing dimeric organization and their processive microtubule plus-ended motility which depends on their conserved motor domains, neck linkers, and coiled-coil regions. The study reveals for the first time that KID can recruit and transport duplex DNA along microtubules using its conserved C-terminal DNA binding domain. The work provides crucial revised thinking about the mechanisms of Chromokinesins mitosis as physical processive motors that mobilize chromosomes towards the microtubule plus ends in early metaphase.

      Strengths:

      The authors reconstitute multiple chromosome-associated kinesin (KID) orthologs from Xenopus and humans with microtubules and determine their oligomerization. The study shows how coiled-coil and neck linker regions of KID are essential for its function as its deletion leads to non-processive motility. CHimeras placing the KID coiled-coil and neck linker on the KIF1A motor domain led to the production of a processive recombinant motor supporting the compatibility of their motility mechanisms. The KID c-terminal tail binds and transports only double-stranded DNA and its deletion or single-stranded DNA leads to defects in this activity.

      Weaknesses:

      A minor weakness in the studies is that they do not resolve the mechanisms of KID in binding large duplex DNA molecules or condensed chromatin. The authors suggest a model in which KID forms multimers along large chromosomes that lead to their transport, but this model was not directly tested.

    3. Reviewer #2 (Public review):

      Summary:

      Previous work in the field highlighted the role of the kinesin-10 motor protein Kid (KIF22) in the polar ejection force during prometaphase. However, the biochemical and biophysical properties of Kid that enabled it to serve in this role were unclear. The authors demonstrate that human and xenopus Kid proteins are processive kinesins that function as homodimeric molecules. The data are solid and support the findings although the text could use some editing to improve clarity.

      Strengths:

      A highlight of the work is the reconstitution of DNA transport in vitro.

      A second highlight is the demonstration that the monomer vs dimer state is dependent on protein concentration.

      Weaknesses:

      The authors make several assumptions of the monomer vs dimer state of various Kid constructs without verifying the protein state using e.g. size exclusion chromatography and/or nanophotometry. They also make statements about monomer-to-dimer transitions on the microtubule without showing or quantifying the data.

      The discussion needs to better put the work into context regarding the ability of non-processive motors to work in teams (formerly thought to be the case for Kid) and how their findings on Kid change this prevailing view in the case of polar ejection force.

      The authors also do not mention previous work on kinesins with non-conventional neck linker/neck coil regions that have been shown to move processively. Their work on Kid needs to be put into this context.

    4. Author response:

      Public Reviews: 

      Reviewer #1 (Public review): 

      Summary: 

      Mitotic kinesins carry out crucial roles in intracellular motility and mitotic spindle organization. Although many mitotic kinesins have been extensively studied, a few conserved mitotic motors remain poorly explored, including chromosome-associated kinesins. Here, Furusaki et al reconstitute recombinant chromosome-associated kinesin or chromokinesin (Kid) and reveal processive plus-end motility along microtubules. The authors purify multiple versions of Kid, revealing dimeric organization and their processive microtubule plus-ended motility which depends on their conserved motor domains, neck linkers, and coiled-coil regions. The study reveals for the first time that KID can recruit and transport duplex DNA along microtubules using its conserved C-terminal DNA binding domain. The work provides crucial revised thinking about the mechanisms of Chromokinesins mitosis as physical processive motors that mobilize chromosomes towards the microtubule plus ends in early metaphase. 

      Strengths: 

      The authors reconstitute multiple chromosome-associated kinesin (KID) orthologs from Xenopus and humans with microtubules and determine their oligomerization. The study shows how coiled-coil and neck linker regions of KID are essential for its function as its deletion leads to non-processive motility. CHimeras placing the KID coiled-coil and neck linker on the KIF1A motor domain led to the production of a processive recombinant motor supporting the compatibility of their motility mechanisms. The KID c-terminal tail binds and transports only double-stranded DNA and its deletion or single-stranded DNA leads to defects in this activity.

      Thank you very much.

      Weaknesses: 

      A minor weakness in the studies is that they do not resolve the mechanisms of KID in binding large duplex DNA molecules or condensed chromatin. The authors suggest a model in which KID forms multimers along large chromosomes that lead to their transport, but this model was not directly tested. 

      Thank you very much for your suggestion.

      We will attempt to observe the movement of longer dsDNA and/or DNA-bead complexes and compare their motility with that of a single KID motor to elucidate the cooperativity of the motor protein.

      Reviewer #2 (Public review): 

      Summary: 

      Previous work in the field highlighted the role of the kinesin-10 motor protein Kid (KIF22) in the polar ejection force during prometaphase. However, the biochemical and biophysical properties of Kid that enabled it to serve in this role were unclear. The authors demonstrate that human and xenopus Kid proteins are processive kinesins that function as homodimeric molecules. The data are solid and support the findings although the text could use some editing to improve clarity. 

      Strengths: 

      A highlight of the work is the reconstitution of DNA transport in vitro. 

      A second highlight is the demonstration that the monomer vs dimer state is dependent on protein concentration. 

      Thank you very much.

      Weaknesses: 

      The authors make several assumptions of the monomer vs dimer state of various Kid constructs without verifying the protein state using e.g. size exclusion chromatography and/or nanophotometry. They also make statements about monomer-to-dimer transitions on the microtubule without showing or quantifying the data. 

      As reviewer suggests, the monomer-to-dimer transitions on the microtubule is a speculation. What we can measure in our hands are (1) monomer and dimer ratio in the solution and (2) particle movement on microtubules. At the pmol/L condition, Kid is monomeric in solution but exhibits processive movement on microtubules. Dimerization is generally required for the processivity. Therefore, we suggest Kid forms a dimer on microtubules.

      To show that Kid forms a dimer on microtubules, we will perform photobleaching assays and measure the fluorescent intensities of each particle on microtubules to determine their oligomeric state.

      The discussion needs to better put the work into context regarding the ability of non-processive motors to work in teams (formerly thought to be the case for Kid) and how their findings on Kid change this prevailing view in the case of polar ejection force. 

      We will look for the example of non-processive motors and include them in the Discussion and Citation. As described by this reviewer, Kid was originally thought to be a non-processive motor. We hope that our current work would change that view.  

      The authors also do not mention previous work on kinesins with non-conventional neck linker/neck coil regions that have been shown to move processively. Their work on Kid needs to be put into this context.

      We have thought that most kinesins, belonging to the cargo-transport classes, have conserved neck linker domain and neck coil domains, with Kid being exception. We will search for more citations, including non-transport classes of kinesins, and re-write the Discussion.

    1. eLife Assessment

      This valuable study uses the analysis of connectomic and transcriptomic datasets to survey the anatomy and connectivity of neurosecretory cells in the Drosophila brain. While the connectivity analyses are convincing, the anatomical and functional data provided to verify cell type identity and paracrine signaling is incomplete. Once these aspects are improved, this study would be of interest to neuroscientists working on hormonal signaling in Drosophila and other animals.

    2. Reviewer #1 (Public review):

      Summary:

      The study by McKim et al seeks to provide a comprehensive description of the connectivity of neurosecretory cells (NSCs) using a high-resolution electron microscopy dataset of the fly brain and several single-cell RNA seq transcriptomic datasets from the brain and peripheral tissues of the fly. They use connectomic analyses to identify discrete functional subgroups of NSCs and describe both the broad architecture of the synaptic inputs to these subgroups as well as some of the specific inputs including from chemosensory pathways. They then demonstrate that NSCs have very few traditional presynapses consistent with their known function as providing paracrine release of neuropeptides. Acknowledging that EM datasets can't account for paracrine release, the authors use several scRNAseq datasets to explore signaling between NSCs and characterize widespread patterns of neuropeptide receptor expression across the brain and several body tissues. The thoroughness of this study allows it to largely achieve it's goal and provides a useful resource for anyone studying neurohormonal signaling.

      Strengths:

      The strengths of this study are the thorough nature of the approach and the integration of several large-scale datasets to address short-comings of individual datasets. The study also acknowledges the limitations that are inherent to studying hormonal signaling and provides interpretations within the the context of these limitations.

      Weaknesses:

      Overall, the framing of this paper needs to be shifted from statements of what was done to what was found. Each subsection, and the narrative within each, is framed on topics such as "synaptic output pathways from NSC" when there are clear and impactful findings such as "NSCs have sparse synaptic output". Framing the manuscript in this way allows the reader to identify broad takeaways that are applicable to other model system. Otherwise, the manuscript risks being encyclopedic in nature. An overall synthesis of the results would help provide the larger context within which this study falls.

      The cartoon schematic in Figure 5A (which is adapted from a 2020 review) has an error. This schematic depicts uniglomerular projection neurons of the antennal lobe projecting directly to the lateral horn (without synapsing in the mushroom bodies) and multiglomerular projection neurons projecting to the mushroom bodies and then lateral horn. This should be reversed (uniglomerular PNs synapse in the calyx and then further project to the LH and multiglomerular PNs project along the mlACT directly to the LH) and is nicely depicted in a Strutz et al 2014 publication in eLife.

    3. Reviewer #2 (Public review):

      Summary:

      The authors aim to provide a comprehensive description of the neurosecretory network in the adult Drosophila brain. They sought to assign and verify the types of 80 neurosecretory cells (NSCs) found in the publicly available FlyWire female brain connectome. They then describe the organization of synaptic inputs and outputs across NSC types and outline circuits by which olfaction may regulate NSCs, and by which Corazon-producing NSCs may regulate flight behavior. Leveraging existing transcriptomic data, they also describe the hormone and receptor expressions in the NSCs and suggest putative paracrine signaling between NSCs. Taken together, these analyses provide a framework for future experiments, which may demonstrate whether and how NSCs, and the circuits to which they belong, may shape physiological function or animal behavior.

      Strengths:

      This study uses the FlyWire female brain connectome (Dorkenwald et al. 2023) to assign putative cell types to the 80 neurosecretory cells (NSCs) based on clustering of synaptic connectivity and morphological features. The authors then verify type assignments for selected populations by matching cluster sizes to anatomical localization and cell counts using immunohistochemistry of neuropeptide expression and markers with known co-expression.

      The authors compare their findings to previous work describing the synaptic connectivity of the neurosecretory network in larval Drosophila (Huckesfeld et al., 2021), finding that there are some differences between these developmental stages. Direct comparisons between adults and larvae are made possible through direct comparison in Table 1, as well as the authors' choice to adopt similar (or equivalent) analyses and data visualizations in the present paper's figures.

      The authors extract core themes in NSC synaptic connectivity that speak to their function: different NSC types are downstream of shared presynaptic outputs, suggesting the possibility of joint or coordinated activation, depending on upstream activity. NSCs receive some but not all modalities of sensory input. NSCs have more synaptic inputs than outputs, suggesting they predominantly influence neuronal and whole-body physiology through paracrine and endocrine signaling.

      The authors outline synaptic pathways by which olfactory inputs may influence NSC activity and by which Corazon-releasing NSCs may regulate flight. These analyses provide a basis for future experiments, which may demonstrate whether and how such circuits shape physiological function or animal behavior.

      The authors extract expression patterns of neuropeptides and receptors across NSC cell types from existing transcriptomic data (Davie et al., 2018) and present the hypothesis that NSCs could be interconnected via paracrine signaling. The authors also catalog hormone receptor expression across tissues, drawing from the Fly Cell Atlas (Li et al., 2022).

      Weaknesses:

      The clustering of NSCs by their presynaptic inputs and morphological features, along with corroboration with their anatomical locations, distinguished some, but not all cell types. The authors attempt to distinguish cell types using additional methodologies: immunohistochemistry (Figure 2), retrograde trans-synaptic labeling, and characterization of dense core vesicle characteristics in the FlyWire dataset (Figure 1, Supplement 1). However, these corroborating experiments often lacked experimental replicates, were not rigorously quantified, and/or were presented as singular images from individual animals or even individual cells of interest. The assignments of DH44 and DMS types remain particularly unconvincing.

      The authors present connectivity diagrams for visualization of putative paracrine signaling between NSCs based on their peptide and receptor expression patterns. These transcriptomic data alone are inadequate for drawing these conclusions, and these connectivity diagrams are untested hypotheses rather than results. The authors do discuss this in the Discussion section.

    4. Reviewer #3 (Public review):

      Summary:

      The manuscript presents an ambitious and comprehensive synaptic connectome of neurosecretory cells (NSC) in the Drosophila brain, which highlights the neural circuits underlying hormonal regulation of physiology and behaviour. The authors use EM-based connectomics, retrograde tracing, and previously characterised single-cell transcriptomic data. The goal was to map the inputs to and outputs from NSCs, revealing novel interactions between sensory, motor, and neurosecretory systems. The results are of great value for the field of neuroendocrinology, with implications for understanding how hormonal signals integrate with brain function to coordinate physiology.

      The manuscript is well-written and provides novel insights into the neurosecretory connectome in the adult Drosophila brain. Some, additional behavioural experiments will significantly strengthen the conclusions.

      Strengths:

      (1) Rigorous anatomical analysis<br /> (2) Novel insights on the wiring logic of the neurosecretory cells.

      Weaknesses:

      (1) Functional validation of findings would greatly improve the manuscript.

    1. eLife Assessment

      The study describes a valuable new technology in the field of targeted protein degradation that allows identification of E3-ubiquitin ligases that target a protein of interest. The presented data are convincing, however, additional work will be needed to optimize for high-throughput evaluation. This technology will therefore serve the community in the initial stages of developing targeted protein degraders.

    2. Reviewer #1 (Public review):

      Summary:

      PROTACs are heterobifunctional molecules that utilize the Ubiquitin Proteasome System to selectively degrade target proteins within cells. Upon introduction to the cells, PROTACs capture the activity of the E3 ubiquitin ligases for ubiquitination of the targeted protein, leading to its subsequent degradation by the proteasome. The main benefit of PROTAC technology is that it expands the "druggable proteome" and provides numerous possibilities for therapeutic use. However, there are also some difficulties, including the one addressed in this manuscript: identifying suitable target-E3 ligase pairs for successful degradation. Currently, only a few out of about 600 E3 ligases are used to develop PROTAC compounds, which creates the need to identify other E3 ligases that could be used in PROTAC synthesis. Testing the efficacy of PROTAC compounds has been limited to empirical tests, leading to lengthy and often failure-prone processes. This manuscript addressed the need for faster and more reliable assays to identify the compatible pairs of E3 ligases-target proteins. The authors propose using the RiPA assay, which depends on rapamycin-induced dimerization of FKBP12 protein with FRB domain. The PROTAC technology is advancing rapidly, making this manuscript both timely and essential. The RiPA assay might be useful in identifying novel E3 ligases that could be utilized in PROTAC technology. Additionally, it could be used at the initial stages of PROTAC development, looking for the best E3 ligase for the specific target.

      The authors described an elegant assay that is scalable, easy-to-use and applicable to a wide range of cellular models. This method allows for the quantitative validation of the degradation efficacy of a given pair of E3 ligase-target protein, using luciferase activity as a measure. Importantly, the assay also enables the measurement of kinetics in living cells, enhancing its practicality.

      Strengths:

      (1) The authors have addressed the crucial needs that arise during PROTAC development. In the introduction, they nicely describe the advantages and disadvantages of the PROTAC technology and explain why such an assay is needed.

      (2) The study includes essential controls in experiments (important for generating new assay), such as using the FRB vector without E3 ligase as a negative control, testing different linkers (which may influence the efficacy of the degradation), and creating and testing K-less vectors to exclude the possibility of luciferase or FKBP12 ubiquitination instead of WDR5 (the target protein). Additionally, the position of the luc in the FKBP12 vector and the position of VHL in the FRB vector are tested. Different E3 ligases are tested using previously identified target proteins, confirming the assay's utility and accuracy.

      (3) The study identified a "new" E3 ligase that is suitable for PROTAC technology (FBXL).

      Weaknesses:

      It is not clear how feasible it would be to adapt the assay for high-throughput screens.

      Comments on revisions:

      The authors have addressed my previous concerns and made changes to the manuscript, resulting in a well-written paper.

    3. Reviewer #2 (Public review):

      Summary:

      Adhikari and colleagues developed a new technique, rapamycin-induced proximity assay (RiPA), to identify E3-ubiquitin (ub) ligases of a protein target, aiming at identifying additional E3 ligases that could be targeted for PROTAC generation or ligases that may degrade a protein target. The study is timely, as expanding the landscape of E3-ub ligases for developing targeted degraders is a primary direction in the field.

      Strengths:

      (1) The study's strength lies in its practical application of the FRB:FKBP12 system. This system is used to identify E3-ub ligases that would degrade a target of interest, as evidenced by the reduction in luminescence upon the addition of rapamycin. This approach effectively mimics the potential action of a PROTAC.

      Weaknesses:

      (1) While the technique shows promise, its application in a discovery setting, particularly for high-throughput or unbiased E3-ub ligase identification, may pose challenges. The authors now discuss these potential difficulties providing a more comprehensive understanding of RiPA's limitations.

      (2) While RiPA will help identify E3 ligases, PROTAC design would still be empirical. The authors provide some discussion of this limitation.

      Comments on revisions:

      I thank the authors for addressing my prior concerns. I would recommend that individual replicate values are plotted in all the mean -/+ s.d or sem graphs.

    4. Author response:

      The following is the authors’ response to the original reviews.

      First of all, we would like to thank the reviewers for their very constructive comments, which helped us to improve the manuscript! In response to the raised issues, we have performed new experiments and made necessary changes on the manuscript.

      eLife Assessment

      The study describes a valuable new technology in the field of targeted protein degradation that allows identification of E3-ubiquitin ligases that target a protein of interest. The presented data are convincing, however, it is unclear whether the proposed system can be successfully used in high throughput applications. This technology will serve the community in the initial stages of developing targeted protein degraders.

      We thank the eLife editors for the positive assessment and have clarified the scalability of our system for high throughput applications in the revised manuscript (see our response to both reviewer’s comment on weakness point 1).

      Reviewer #1 (Public Review):

      Summary:

      PROTACs are heterobifunctional molecules that utilize the Ubiquitin Proteasome System to selectively degrade target proteins within cells. Upon introduction to the cells, PROTACs capture the activity of the E3 ubiquitin ligases for ubiquitination of the targeted protein, leading to its subsequent degradation by the proteasome. The main benefit of PROTAC technology is that it expands the "druggable proteome" and provides numerous possibilities for therapeutic use. However, there are also some difficulties, including the one addressed in this manuscript: identifying suitable target-E3 ligase pairs for successful degradation. Currently, only a few out of about 600 E3 ligases are used to develop PROTAC compounds, which creates the need to identify other E3 ligases that could be used in PROTAC synthesis. Testing the efficacy of PROTAC compounds has been limited to empirical tests, leading to lengthy and often failure-prone processes. This manuscript addressed the need for faster and more reliable assays to identify the compatible pairs of E3 ligases-target proteins. The authors propose using the RiPA assay, which depends on rapamycin-induced dimerization of FKBP12 protein with FRB domain. The PROTAC technology is advancing rapidly, making this manuscript both timely and essential. The RiPA assay might be useful in identifying novel E3 ligases that could be utilized in PROTAC technology. Additionally, it could be used at the initial stages of PROTAC development, looking for the best E3 ligase for the specific target.

      The authors described an elegant assay that is scalable, easy-to-use, and applicable to a wide range of cellular models. This method allows for the quantitative validation of the degradation efficacy of a given pair of E3 ligase-target proteins, using luciferase activity as a measure. Importantly, the assay also enables the measurement of kinetics in living cells, enhancing its practicality.

      Strengths:

      (1) The authors have addressed the crucial needs that arise during PROTAC development. In the introduction, they nicely describe the advantages and disadvantages of the PROTAC technology and explain why such an assay is needed.

      (2) The study includes essential controls in experiments (important for generating new assay), such as using the FRB vector without E3 ligase as a negative control, testing different linkers (which may influence the efficacy of the degradation), and creating and testing K-less vectors to exclude the possibility of luciferase or FKBP12 ubiquitination instead of WDR5 (the target protein). Additionally, the position of the luc in the FKBP12 vector and the position of VHL in the FRB vector are tested. Different E3 ligases are tested using previously identified target proteins, confirming the assay's utility and accuracy.

      (3) The study identified a "new" E3 ligase that is suitable for PROTAC technology (FBXL).

      We greatly appreciate the reviewer’s positive feedback on our work. To evaluate our system further, in our revised manuscript we have conducted additional analysis on KRASG12D degradation via VHL and CRBN within our K-less system. Consistent with previous findings of VHL-harnessing PROTACs, our assay demonstrated that VHL mediated efficient degradation of KRASG12D while CRBN induced only a minor effect. This new data is presented in Figure 2 - figure supplement 1C of the revised manuscript.

      Weaknesses:

      · It is not clear how feasible it would be to adapt the assay for high-throughput screens.

      The design of our study is a well-based assay. It is therefore possible but not realistic to evaluate all 600 and more human E3 ligases. Nonetheless, if interested in all E3 ligases, our assay could be adapted for pooled experimental strategies, as demonstrated in Poirson, J., Cho, H., Dhillon, A. et al., Nature 628, 878–886 (2024).

      Our system offers several advantages over pooled screens, including the generation of more quantitative data and faster testing of selected candidates. Pooled screens, by contrast, require more time due to the necessity of next-generation sequencing and bioinformatics analysis. Moreover, in response to the reviewers comment, we have included a schematic in the revised manuscript (Figure 4 - figure supplement 1A) that outlines the assay duration and hands-on time for target and E3 ligase candidates.

      · In some experiments, the efficacy of WDR5 degradation tested by immunoblotting appears to be lower than luciferase activity (e.g., Figure 2G and H).

      We concur with the reviewer that in some instances, the degradation observed via immunoblotting appears lower than that indicated by luciferase activity. Thus, we have quantified the western and added it to the respective blots. This discrepancy may result from the non-linearity of western blots.

      Reviewer #2 (Public Review):

      Summary:

      Adhikari and colleagues developed a new technique, rapamycin-induced proximity assay (RiPA), to identify E3-ubiquitin (ub) ligases of a protein target, aiming at identifying additional E3 ligases that could be targeted for PROTAC generation or ligases that may degrade a protein target. The study is timely, as expanding the landscape of E3-ub ligases for developing targeted degraders is a primary direction in the field.

      Strengths:

      The study's strength lies in its practical application of the FRB:FKBP12 system. This system is used to identify E3-ub ligases that would degrade a target of interest, as evidenced by the reduction in luminescence upon the addition of rapamycin. This approach effectively mimics the potential action of a PROTAC.

      We are delighted with this assessment of our work by the reviewer. To evaluate our system further, in our revised manuscript we have conducted additional analysis on KRASG12D degradation via VHL and CRBN within our K-less system. Consistent with previous findings of VHL-harnessing PROTACs, our assay demonstrated that VHL mediated efficient degradation of KRASG12D while CRBN induced only a minor effect. This new data is presented in Figure 2 - figure supplement 1C of the revised manuscript.

      Weaknesses:

      (1) While the technique shows promise, its application in a discovery setting, particularly for high-throughput or unbiased E3-ub ligase identification, may pose challenges. The authors should provide more detailed insights into these potential difficulties to foster a more comprehensive understanding of RiPA's limitations.

      The design of our study is well-based assay . It is therefore possible but not realistic to evaluate all 600 and more human E3 ligases. Nonetheless, if interested in all E3 ligases, our assay could be adapted for pooled experimental strategies, as demonstrated in Poirson, J., Cho, H., Dhillon, A. et al., Nature 628, 878–886 (2024).

      Our system offers several advantages over pooled screens, including the generation of more quantitative data and faster testing of selected candidates. Pooled screens, by contrast, require more time due to the necessity of next-generation sequencing and bioinformatics analysis. Moreover, in response to the reviewers comment, we have included a schematic in the revised manuscript (Figure 4 - figure supplement 1A) that outlines the assay duration and hands-on time for target and E3 ligase candidates.

      We also added the following sentences to the Limitations of the study section of the revised manuscript (line 322-326): “While our system offers easy testing of different tagging approaches and due to its simple workflow facilitates the rapid characterization of novel E3 ligases across multiple targets, it is currently not optimized for high-throughput evaluation of all 600+ E3 ligases. Achieving such scale would necessitate further adaptations, including the incorporation of pooled experimental strategies.”

      (2) While RiPA will help identify E3 ligases, PROTAC design would still be empirical. The authors should discuss this limitation. Could the technology be applied to molecular glue generation?

      We agree with the reviewer that our assay rationalizes the choice of E3 ligases but that PROTAC design (“linkerology”) is still mostly empirical. To address this, we included the following line in the Limitations of the study section of our initial manuscript (line 327-330): “Conversely, it is also conceivable that an E3 ligase that can efficiently decrease the levels of a particular target in the RiPA setting may be less suitable for PROTACs, since PROTACs that mimic the steric interaction of the target/E3 pair may not be easily identified in the chemical space.”

      Regarding molecular glues, our assay could also be instrumental in identifying suitable E3 ligases for a target protein prior to screening for molecular glues, provided that the screening system specifically screens E3 ligase and target pairs. However, as most molecular glue screens are currently agnostic to specific E3 ligases or targets, our system may not be applicable in those cases. We have elaborated on this in the discussion section of the revised manuscript (line 271-274): “We envision that this setting will be valuable for identifying the most suitable E3 ligase candidates for PROTACs aimed at specific proteins, and for guiding E3 ligase selection when screening for molecular glues targeting specific E3 ligase and protein pairs.”

      (3) Controls to verify the intended mechanism of action are missing, such as using a proteasome inhibitor or VHL inhibitors/siRNA to verify on-target effects. Verification of the target E3 ligase complex after rapamycin addition via orthogonal approaches, such as IP, should be considered.

      We thank the reviewer for the comment. Particularly VHL siRNA is not beneficial in this setup, as we overexpress the E3 ligase rather than relying on endogenous protein.

      To verify mechanism of action, we performed additional experiments in the presence of proteosomal inhibitor MG132 and neddylation inhibitor MLN4924 with target KRASG12D and E3 ligase VHL. The results is shown in Figure 2H of the revised manuscript.

      Minor concern:

      The graphs in Figure 1E are missing.

      We thank the reviewer for pointing this out. We corrected the figure in the revised manuscript.

      Reviewer #1 (Recommendations For The Authors):

      •  Optionally, the authors could add control experiments with Aurora B and Crb vectors (there shouldn't be any degradation) and experiments confirming that the degradation occurs via the proteasome. For example, the addition of proteasome inhibitors (such as bortezomib) should decrease the efficiency of the target degradation and confirm that targets are degraded via the proteasome system.

      Regarding Aurora-B degradation, as far as we know, there are no specific Aurora-B PROTACs reported. Thus, there is no definitive evidence that CRBN could not degrade Aurora-B. Nevertheless, we performed assays with Aurora-B and VHL, CRBN, or FRB, and observed more effective degradation of Aurora-B by VHL than CRBN. This data is now included in Figure 2 - figure supplement 1B of the revised manuscript.

      • It would also be helpful to provide a possible explanation for why the ratio 1:1 of vectors did not induce the degradation (regarding Figure 1D).

      We believe the lack of degradation with 1:1 vector ratio is due to the differential expression levels of endogenous FKBP12 and mTOR in HEK293 cells. According to Human Protein Atlas, the normalized protein-coding transcripts per million (nTPM) for FKBP12 and mTOR in HEK293 cells are 160 and 24 respectively, indicating that FKBP12 is expressed at levels approximately 6.7 times higher than mTOR. This disparity likely limits the heterodimerization of exclusively fusion proteins upon rapamycin addition. To increase the likelihood of FKBP12 and FRB fusion protein dimerization, we used a higher ratio of the FRB component during transfection, considering the higher endogenous expression of FKBP12.

      • It would be helpful to add more explanation for the data in Figure 1F, including whether there is a difference between vectors with different positions of VHL and FRB and why the FRB-VHL vector is less expressed without rapamycin.

      We thank the reviewer for the comment. Regarding the vector orientations of VHL/FRB and WDR5/Luc/FKBP12, we have consistently observed different migration behaviors for WDR5 and VHL constructs, despite their same molecular weights. This observation aligns with literature reports where differential running behavior is noted when FRB or FKBP12 (or their mutants) are tagged to the N- or C-terminus of a protein (Bondeson, D.P., Mullin-Bernstein, Z., Oliver, S. et al. Nat Commun 13, 5495 (2022); Mabe, S., Nagamune, T. & Kawahara, M. Sci Rep 4, 6127 (2014)). We have now included the following explanation in the figure legend of Figure 1F of the revised manuscript: “WDR5 and VHL fusion proteins tagged at the N- and C-terminal show different migration behaviors despite having same molecular weight.”

      Additionally, the stabilizing effect of rapamycin on FRB (or its mutants), FRB fusion proteins, and FRB-containing proteins has been documented (Stankunas, K., Bayle, J.H., Havranek, J.J. et al. ChemBioChem, 8(10), 1162-1169 (2007); Stankunas, K., Bayle, J.H., Gestwicki J.E. et al. Mol Cell, 12(6), 1615–1624 (2003); Zhang, C., Cui, M., Cui, Y. et al. J. Vis. Exp. (150), e59656 (2019)). We believe that the degree of stabilization by rapamycin could differ between N- and C-terminal FRB fusion proteins.

      • Finally, the mistake in Figure 2G (where the lanes are wrongly labelled, BRBN-FRB and FRB) should be corrected. Also please correct the graph in Figure 1E (there seems to be a problem with bars for 1:100). There are some typos, such as in lines 38, 277, and 288.

      Thank you for bringing this to our attention. We have corrected all the mentioned errors.

    1. eLife Assessment

      This important study identifies the "H-state" as a potential conformational marker distinguishing amyloidogenic from non-amyloidogenic light chains, addressing a critical problem in protein misfolding and amyloidosis. By combining advanced techniques such as small-angle X-ray scattering, molecular dynamics simulations, and H-D exchange mass spectrometry, the authors provide convincing evidence for their novel findings. However, incomplete experimental descriptions, limitations in SAXS data interpretation, and the way HDX MS data is presented affect the strength and generalizability of the conclusions. Strengthening these aspects would enhance the impact of this work for researchers in amyloidosis and protein misfolding.

    2. Reviewer #1 (Public review):

      The study investigates light chains (LCs) using three distinct approaches, with a focus on identifying a conformational fingerprint to differentiate amyloidogenic light chains from multiple myeloma light chains. The study's major contribution is the identification of a low-populated "H state," which the authors propose as a unique marker for AL-LCs. While this finding is promising, the review highlights several strengths and weaknesses. Strengths include the valuable contribution of identifying the H state and the use of multiple approaches, which provide a comprehensive understanding of LC structural dynamics. However, the study suffers from weaknesses, particularly in the interpretation of SAXS data, lack of clarity in presentation, and methodological inconsistencies. Critical concerns include high error margins between SAXS profiles and MD fits, unclear validation of oligomeric species in SAXS measurements, and insufficient quantitative cross-validation between experimental (HDX) and computational data (MD). This reviewer calls for major revisions including clearer definitions, improved methodology, and additional validation, to strengthen the conclusions.

    3. Reviewer #2 (Public review):

      Summary:

      This well-written manuscript addresses an important but recalcitrant problem - the molecular mechanism of protein misfolding in Ig light chain (LC) amyloidosis (AL), a major life-threatening form of systemic human amyloidosis. The authors use expertly recorded and analyzed small-angle X-ray scattering (SAXS) data as a restraint for molecular dynamics simulations (called M&M) and to explore six patient-based LC proteins. The authors report that a highly populated "H-state" determined computationally, wherein the two domains in an LC molecule acquire a straight rather than bent conformation, is what distinguishes AL from non-AL LCs. They then use H-D exchange mass spectrometry to verify this conclusion. If confirmed, this is a novel and interesting finding with potentially important translational implications.

      Strengths:

      Expertly recorded and analyzed SAXS data combined with clever M&M simulations lead to a novel and interesting conclusion.

      Regardless of whether or not the CL-CL domain interface is destabilized in AL LCs explored in this (Figure 6) and other studies, stabilization of this interface is an excellent idea that may help protect at least a subset of AL LCs from misfolding in amyloid. This idea increases the potential impact of this interesting study.

      Weaknesses:

      The HDX analysis could be strengthened.

    4. Reviewer #3 (Public review):

      Summary:

      This study identifies confirmational fingerprints of amylodogenic light chains, that set them apart from the non-amylodogenic ones.

      Strengths:

      The research employs a comprehensive combination of structural and dynamic analysis techniques, providing evidence that conformational dynamics at VL-CL interface and structural expansion are distinguished features of amylodogenic LCs.

      Weaknesses:

      The sample size is limited, which may affect the generalizability of the findings. Additionally, the study could benefit from deeper analysis of specific mutations driving this unique conformation to further strengthen therapeutic relevance.

    1. eLife Assessment

      This study provides valuable insights into the host's variable susceptibility to Mycobacterium tuberculosis, using a novel collection of wild-derived inbred mouse lines from diverse geographic locations, along with immunological and single-cell transcriptomic analyses. While the data are convincing, a deeper mechanistic investigation into neutrophil subset functions would have further enhanced the study. This work will interest microbiologists and immunologists in the TB field.

    2. Reviewer #1 (Public review):

      Summary:

      This study investigated the heterogeneous responses to Mycobacterium tuberculosis (Mtb) in 19 wild-derived inbred mouse strains collected from various geographic locations. The goal of this study is to identify novel mechanisms that regulate host susceptibility to Mtb infection. Using the genetically resistant C57BL/6 mouse strain as the control, they successfully identified a few mouse strains that revealed higher bacterial burdens in the lung, implicating increased susceptibility in those mouse strains. Furthermore, using flow cytometry analysis, they discovered strong correlations between CFU and various immune cell types, including T cells and B cells. The higher neutrophil numbers correlated with significantly higher CFU in some of the newly identified susceptible mouse strains. Interestingly, MANB and MANC mice exhibited comparable numbers of neutrophils but showed drastically different bacterial burdens. The authors then focused on the neutrophil heterogeneity and utilized a single-cell RNA-seq approach, which led to identifying distinct neutrophil subsets in various mouse strains, including C57BL/6, MANA, MANB, and MANC. Pathway analysis on neutrophils in susceptible MANC strain revealed a highly activated and glycolytic phenotype, implicating a possible mechanism that may contribute to the susceptible phenotype. Lastly, the authors found that a small group of neutrophil-specific genes are expressed across many other cell types in the MANC strain.

      Strengths:

      This manuscript has many strengths.

      (1) Utilizing and characterizing novel mouse strains that complement the current widely used mouse models in the field of TB. Many of those mouse strains will be novel tools for studying host responses to Mtb infection.

      (2) The study revealed very unique biology of neutrophils during Mtb infection. It has been well-established that high numbers of neutrophils correlate with high bacterial burden in mice. However, this work uncovered that some mouse strains could be resistant to infection even with high numbers of neutrophils in the lung, indicating the diverse functions of neutrophils. This information is important.

      Weaknesses:

      The weaknesses of the manuscript are that the work is relatively descriptive. It is unclear whether the neutrophil subsets are indeed functionally different. While single-cell RNA seq did provide some clues at transcription levels, functional and mechanistic investigations are lacking. Similarly, it is unclear how highly activated and glycolytic neutrophils in MANC strain contribute to its susceptibility.

    3. Reviewer #2 (Public review):

      Summary:

      These studies investigate the phenotypic variability and roles of neutrophils in tuberculosis (TB) susceptibility by using a diverse collection of wild-derived inbred mouse lines. The authors aimed to identify new phenotypes during Mycobacterium tuberculosis infection by developing, infecting, and phenotyping 19 genetically diverse wild-derived inbred mouse lines originating from different geographic regions in North America and South America. The investigators achieved their main goals, which were to show that increasing genetic diversity increases the phenotypic spectrum observed in response to aerosolized M. tuberculosis, and further to provide insights into immune and/or inflammatory correlates of pulmonary TB. Briefly, investigators infected wild-derived mice with aerosolized M. tuberculosis and assessed early infection control at 21 days post-infection. The time point was specifically selected to correspond to the period after infection when acquired immunity and antigen-specific responses manifest strongly, and also early susceptibility (morbidity and mortality) due to M. tuberculosis infection has been observed in other highly susceptible wild-derived mouse strains, some Collaborative Cross inbred strains, and approximately 30% of individuals in the Diversity Outbred mouse population. Here, the investigators normalized bacterial burden across mice based on inoculum dose and determined the percent of immune cells using flow cytometry, primarily focused on macrophages, neutrophils, CD4 T cells, CD8 T cells, and B cells in the lungs. They also used single-cell RNA sequencing to identify neutrophil subpopulations and immune phenotypes, elegantly supplemented with in vitro macrophage infections and antibody depletion assays to confirm immune cell contributions to susceptibility. The main results from this study confirm that mouse strains show considerable variability to M. tuberculosis susceptibility. Authors observed that enhanced infection control correlated with higher percentages of CD4 and CD8 T cells, and B cells, but not necessarily with the percentage of interferon-gamma (IFN-γ) producing cells. High levels of neutrophils and immature neutrophils (band cells) were associated with increased susceptibility, and the mouse strain with the most neutrophils, the MANC line, exhibited a transcriptional signature indicative of a highly activated state, and containing potentially tissue-destructive, mediators that could contribute to the strain's increased susceptibility and be leveraged to understand how neutrophils drive lung tissue damage, cavitation, and granuloma necrosis in pulmonary TB.

      Strengths:

      The strengths are addressing a critically important consideration in the tuberculosis field - mouse model(s) of the human disease, and taking advantage of the novel phenotypes observed to determine potential mechanisms. Notable strengths include,

      (1) Innovative generation and use of mouse models: Developing wild-derived inbred mice from diverse geographic locations is innovative, and this approach expands the range of phenotypic responses observed during M. tuberculosis infection. Additionally, the authors have deposited strains at The Jackson Laboratory making these valuable resources available to the scientific community.

      (2) Potential for translational research: The findings have implications for human pulmonary TB, particularly the discovery of neutrophil-associated susceptibility in primary infection and/or neutrophil-mediated disease progression that could both inform the development of therapeutic targets and also be used to test the effectiveness of such therapies.

      (3) Comprehensive experimental design: The investigators use many complementary approaches including in vivo M. tuberculosis infection, in vitro macrophage studies, neutrophil depletion experiments, flow cytometry, and a number of data mining, machine learning, and imaging to produce robust and comprehensive analyses of the wild-derives d strains and neutrophil subpopulations in 3 weeks after M. tuberculosis infection.

      Weaknesses:

      The manuscript and studies have considerable strengths and very few weaknesses. One minor consideration is that phenotyping is limited to a single limited-time point; however, this time point was carefully selected and has a strong biological rationale provided by investigators. This potential weakness does not diminish the overall findings, exciting results, or conclusions.

    1. eLife Assessment

      The manuscript by Guo and colleagues reports valuable findings about the inhibitory activity of caffeic acid phenethyl ester (CAPE) against TcdB, a key toxin produced by Clostridioides difficile. C. difficile infections are a major public health concern, and this manuscript provides interesting data on toxin inhibition by CAPE, a potentially promising therapeutic alternative for this disease. The strength of the evidence to support the conclusions is solid, with some concerns about the moderate effects on the mouse infection model and direct binding assays of CAPE to the toxin.

    2. Reviewer #1 (Public review):

      Summary:

      In this manuscript, Guo and colleagues used a cell rounding assay to screen a library of compounds for inhibition of TcdB, an important toxin produced by Clostridioides difficile. Caffeic acid and derivatives were identified as promising leads, and caffeic acid phenethyl ester (CAPE) was further investigated.

      Strengths:

      Considering the high morbidity rate associated with C. difficile infections (CDI), this manuscript presents valuable research in the investigation of novel therapeutics to combat this pressing issue. Given the rising antibiotic resistance in CDI, the significance of this work is particularly noteworthy. The authors employed a robust set of methods and confirmatory tests, which strengthened the validity of the findings. The explanations provided are clear, and the scientific rationale behind the results is well-articulated. The manuscript is extremely well-written and organized. There is a clear flow in the description of the experiments performed. Also, the authors have investigated the effects of CAPE on TcdB in careful detail and reported compelling evidence that this is a meaningful and potentially useful metabolite for further studies.

      Weaknesses:

      This is really a manuscript about CAPE, not caffeic acid, and the title should reflect that. Also, a few details are missing from the description of the experiments. The authors should carefully revise the manuscript to ascertain that all details that could affect the interpretation of their results are presented clearly. Just as an example, the authors state in the results section that TcdB was incubated with compounds and then added to cells. Was there a wash step in between? Could compound carryover affect how the cells reacted independently from TcdB? This is just an example of how the authors should be careful with descriptions of their experimental procedures. Lastly, authors should be careful when drawing conclusions from the analysis of microbiota composition data. Ascribing causality to correlational relationships is a recurring issue in the microbiome field. Therefore, I suggest authors carefully revise the manuscript and tone down some statements about the impact of CAPE treatment on the gut microbiota.

    3. Reviewer #2 (Public review):

      Summary:

      This work is towards the development of nonantibiotic treatment for C. difficile. The authors screened a chemical library for activity against the C. difficile toxin TcdB, and found a group of compounds with antitoxin activity. Caffeic acid derivatives were highly represented within this group of antitoxin compounds, and the remaining portion of this work involves defining the mechanism of action of caffeic acid phenethyl ester (CAPE) and testing CAPE in mouse C. difficile infection model. The authors conclude CAPE attenuates C. difficile disease by limiting toxin activity and increasing microbial diversity during C. difficile infection.

      Strengths/ Weaknesses:

      The strategy employed by the authors is sound although not necessarily novel. A compound that can target multiple steps in the pathogenies of C. difficile would be an exciting finding. However, the data presented does not convincingly demonstrate that CAPE attenuates C. difficile disease and the mechanism of action of CAPE is not convincingly defined. The following points highlight the rationale for my evaluation.

      (1) The toxin exposure in tissue culture seems brief (Figure 1). Do longer incubation times between the toxin and cells still show CAPE prevents toxin activity?

      (2) The conclusion that CAPE has antitoxin activity during infection would be strengthened if the mouse was pretreated with CAPE before toxin injections (Figure 1D).

      (3) CAPE does not bind to TcdB with high affinity as shown by SPR (Figure 4). A higher affinity may be necessary to inhibit TcdB during infection. The GTD binds with millimolar affinity and does not show saturable binding. Is the GTD the binding site for CAPE? Autoprocessing is also affected by CAPE indicating CAPE is binding non-GTD sites on TcdB.

      (4) In the infection model, CAPE does not statistically significantly attenuate weight loss during C. difficile infection (Figure 6). I recognize that weight loss is an indirect measure of C. difficile disease but histopathology also does not show substantial disease alleviation (see below).

      (5) In the infection model (Figure 6), the histopathology analysis shows substantial improvement in edema but limited improvement in cellular infiltration and epithelial damage. Histopathology is probably the most critical parameter in this model and a compound with disease-modifying effects should provide substantial improvements.

      (6) The reduction in C. difficile colonization is interesting. It is unclear if this is due to antitoxin activity and/or due to CAPE modifying the gut microbiota and metabolites (Figure 6). To interpret these data, a control is needed that has CAPE treatment without C. difficile infection or infection with an atoxicogenic strain.

      (7) Similar to the CAPE data, the melatonin data does not display potent antitoxin activity and the mouse model experiment shows marginal improvement in the histopathological analysis (Figure 9). Using 100 µg/ml of melatonin (~ 400 micromolar) to inactivate TcdB in cell culture seems high. Can that level be achieved in the gut?

      (8) The following parameters should be considered and would aid in the interpretation of this work. Does CAPE directly affect the growth of C. difficile? Does CAPE affect the secretion of TcdB from C. difficile? Does CAPE alter the sporulation and germination of C. diffcile?

    4. Reviewer #3 (Public review):

      Summary:

      The study is well written, and the results are solid and well demonstrated. It shows a field that can be explored for the treatment of CDI

      Strengths:

      The results are really good, and the CAPE shows a good and promising alternative for treating CDI. The methodology and results are well presented, with tables and figures that corroborate them. It is solid work and very promising.

      Weaknesses:

      Some references are too old or missing.

    1. eLife Assessment

      This important study uses Mendelian Randomisation to show that early life phenotypes (i.e. onset of age at menarche and age at first birth) have an influence on a multitude of health outcomes later in life. The provided empirical evidence supporting the antagonistic pleiotropy theory is solid. However, some additional analyses and a more comprehensive discussion of the findings are needed to make the study stronger.

    2. Reviewer #1 (Public review):

      Summary:

      The present study aims to associate reproduction with age-related disease as support of the antagonistic pleiotorpy hypothesis of ageing, predominantly using Mendelian Randomization. The authors found evidence that early-life reproductive success is associated with advanced ageing.

      Strengths:

      Large sample size. Many analyses.

      Weaknesses:

      There are some errors in the methodology, that require revisions.

      In particular, the main conclusions drawn by the authors refer to the Mendelian Randomization analyses. However, the authors made a few errors here that need to be reconsidered:

      (1) Many of the outcomes investigated by the authors are continuous outcomes, while the authors report odds ratios. This is not correct and should be revised.

      (2) Some of the odds ratios (for example the one for osteoporosis) are really small, while still reaching the level of statistical significance. After some checking, I found the GWAS data used to generate these MR estimates were processed by the program BOLT-LLM. This program is a linear mixed model program, which requires the transformation of the beta estimates to be useful for dichotomous outcomes. The authors should check the manual of BOLT-LLM and recalculate the beta estimates of the SNP-outcome associations prior to the Mendelian Randomization analyses. This should be checked for all outcomes as it doesn't apply to all.

      (3) The authors should follow the MR-Strobe guidelines for presentation.

      (4) The authors should report data in the text with a 95% confidence interval.

      (5) The authors should consider correction for multiple testing.

    3. Reviewer #2 (Public review):

      Summary:

      The authors present an interesting paper where they test the antagonistic pleiotropy theory. Based on this theory they hypothesize that genetic variants associated with later onset of age at menarche and age at first birth have a positive causal effect on a multitude of health outcomes later in life, such as epigenetic aging and prevalence of chronic diseases. Using a mendelian randomization and colocalization approach, the authors show that SNPs associated with later age at menarche are associated with delayed aging measurements, such as slower epigenetic aging and reduced facial aging, and a lower risk of chronic diseases, such as type 2 diabetes and hypertension. Moreover, they identified 128 fertility-related SNPs that are associated with age-related outcomes and they identified BMI as a mediating factor for disease risk, discussing this finding in the context of evolutionary theory.

      Strengths:

      The major strength of this manuscript is that it addresses the antagonistic pleiotropy theory in aging. Aging theories are not frequently empirically tested although this is highly necessary. The work is therefore relevant for the aging field as well as beyond this field, as the antagonistic pleiotropy theory addresses the link between fitness (early life health and reproduction) and aging.

      Points that have to be clarified/addressed:

      (1) The antagonistic pleiotropy is an evolutionary theory pointing to the possibility that mutations that are beneficial for fitness (early life health and reproduction) may be detrimental later in life. As it concerns an evolutionary process and the authors focus on contemporary data from a single generation, more context is necessary on how this theory is accurately testable. For example, why and how much natural variation is there for fitness outcomes in humans? How do genetic risk score distributions of the exposure data look like? Also, how can the authors distinguish in their data between the antagonistic pleiotropy theory and the disposable soma theory, which considers a trade-off between investment in reproduction and somatic maintenance and can be used to derive similar hypotheses? There is just a very brief mention of the disposable soma theory in lines 196-198.

      (2) The antagonistic pleiotropy theory, used to derive the hypothesis, does not necessarily distinguish between male and female fitness. Would the authors expect that their results extrapolate to males as well? And can they test that?

      (3) There is no statistical analyses section providing the exact equations that are tested. Hence it's not clear how many tests were performed and if correction for multiple testing is necessary. It is also not clear what type of analyses have been done and why they have been done. For example in the section starting at line 47, Odds Ratios are presented, indicating that logistic regression analyses have been performed. As it's not clear how the outcomes are defined (genotype or phenotype, cross-sectional or longitudinal, etc.) it's also not clear why logistic regression analysis was used for the analyses.

      (4) Mendelian Randomization is an important part of the analyses done in the manuscript. It is not clear to what extent the MR assumptions are met, how the assumptions were tested, and if/what sensitivity analyses are performed; e.g. reverse MR, biological knowledge of the studied traits, etc. Can the authors explain to what extent the genetic instruments represent their targets (applicable expression/protein levels) well?

      (5) It is not clear what reference genome is used and if or what imputation panel is used. It is also not clear what QC steps are applied to the genotype data in order to construct the genetic instruments of MR.

      (6) A code availability statement is missing. It is understandable that data cannot always be shared, but code should be openly accessible.

    1. eLife Assessment

      This basic research study presents useful data concerning the menstrual fluid composition and its potential for endometriosis biomarker research. However, despite solid bioinformatics analyses, the choice of markers used to separate or identify the different cell types needs to be justified and the results better discussed in relation to current knowledge of the pathophysiology of endometriosis.

    2. Reviewer #1 (Public review):

      Summary:

      The characteristics of endometrium health are an increasing topic in women's health issues, especially in the context of endometriosis. In this respect, having access to information is hampered by the inaccessibility of the uterine tissue. The authors propose here using the menstrual fluid (easily accessible by non-invasive methods) as an access door towards getting relevant information.

      Overall, the paper is divided into two parts:<br /> (1) The comparison between menstrual fluid samples and biopsies of the endometrium.<br /> 2) As a proof of concept, the authors then compared 11 controls and 7 endometriosis cases in this way, from different severity stages.

      Strengths:

      In Figure 1, general features of the 15 samples are presented (volume/number of cells/hematopoietic cells - cd45 labeling). The authors then used single-cell RNA-seq to characterize the different samples. Through having access to endometrium biopsies, they were able to compare the profiles obtained.

      In the MF samples from the second part of the paper - aiming at comparing endometriosis and controls - one question is raised about the effect of culture. The authors compared freshly isolated and cultured tissues (ex vivo vs in vitro) by bulk RNA seq. Biases induced by the culture procedure were identified. Deconvolution was applied to strengthen this observation, with an important increase of seemingly stromal and unknown cells, especially in the unsorted cells and the CD45+ cells.

      Interestingly, since the authors got successive samples from the same donor, they could evaluate the consistency of the samples and reveal indeed an overall stability of the molecular profile of the samples in a given patient.

      The authors then attempted - quite originally - to characterize biomarkers in two major cell compartments that they studied - CD45- (stromal-like) and CD45+ (immune cells).

      Weaknesses:

      A potential problem is the justification of the a priori mix of cell types of three different phenotypes (CD45+, CD45- EPCAM+, and CD45- EPCAM-) from each patient before moving to the scRNAseq. It is not clear to me why this has been done, I guess that using directly the samples would supposedly bias the result. But in this case, why is it supposed that three categories are enough (immune cells, epithelial cells, and stromal cells)? I suppose that other markers could characterize other subtypes of the cells, and take into account the possibility of other cell types, for instance, connected to pain sensitivity, such as neuron precursor. Hence, the justification of the organized mixes should be much more detailed in my opinion.

      It is a bit unclear to me when the biopsies were collected in the cycle of the donor patients.

      The description of these markers that are deregulated is presented as a list, and connected with existing publications, which could rather be presented in discussion than in the results. The authors do tend to demonstrate that the Menstrual Fluid is a good proxy to analyse the endometrium health status of the women affected with endometriosis.

      The identification of MTRNR2L1 seems to be a major discovery of the paper, as well as in a lesser measure HBG2, and it is a bit strange why these putative markers were not emphasized in the abstract. HBG2 was certainly identified previously in endometriosis endothelial cells but seems extremely variable from one sample to another - Geo profile (GDS3060, GDS3060 / 213515_x_at (inist.fr)).

      Overall, the transcriptome analysis is a bit shallow, with no effort made to try to find potential transcription factors or miRNA that could activate/inhibit a series of modified genes; it could be relevant to identify such master genes or master regulators through bioinformatics analyses and wet-lab validations, to understand better the cascade of events.

      Another issue that was overlooked is the presence of 'stem-cells' in the MF obtained. Since endometriosis is supposed to occur from the implantation of uterine stem cells, this category could be a major topic of scrutiny, in terms of quantity in the MF, as well as in terms of their specific molecular properties.

    3. Reviewer #2 (Public review):

      Summary:

      The authors provided further evidence that menstrual fluid (MF) can be used as a non-invasive source of endometrial tissue for studying its normal physiological state and when it is abnormal such as in endometriosis. Single-cell RNA sequencing confirmed the presence of the major cell types -blood and tissue immune cells and endometrial stromal, epithelial, and vascular cells. The major new finding was that interindividual variation for the blood immune cells was minimal between multiple MF samples from an individual. A comparison between the ex vivo MF gene profile and cultured MF showed the expected attachment and culture of stromal (and a small number of epithelial) cells, but the immune cells failed to attach. Several differentially expressed genes between controls and endometriosis were suggested as potential biomarkers of the disease, however, these were a mitochondrial pseudogene and a hemoglobin subunit, both very unlikely related to endometriosis pathogenesis.

      Strengths:

      The Spearman correlation analysis between the control MF gene profiles of multiple samples from the same individual and its graphic presentation provided strong evidence that there is little variation between MF samples. Together with another study which showed similar findings for endometrial stem cells and a number of proteins in MF supernatant, this important data shows MF as a promising biofluid for pathology testing.

      The bioinformatic analyses conducted by bioinformatic and computational experts are a major strength of the manuscript and in particular the comparison between MF and endometrial biopsy data obtained from published scRNAseq studies. This is an important finding, particularly if comparisons included late secretory and early proliferative stage biopsy tissue which would be most similar to shedding menstrual endometrium.

      The inclusion of workflows in the Figures for the various studies and the use of symbols in the various panels is very helpful for the reader.

      MF cell suspensions were enriched for stromal and epithelial cells to enable a detailed bioinformatic analysis of their respective gene profiles

      Weaknesses:

      Two patient cohorts from different institutions were used in the study and somewhat different methods were used to extract the cellular fraction from these cohorts for further study: (1) sample dilution and differential filtration to separate blood-derived immune cells from endometrial tissue then dissociated into single cells and separated into CD45+, CD45-EpCAM+ and CD45-EpCAM- cells, and (2) gradient density separation to generate unsorted, CD45+, CD45- and putative mesenchymal stem cells (MSC) CD45-CD105+ which were also cultured. In addition, questions on pelvic pain and proven fertility would have addressed the 2 key symptoms of endometriosis.

      The use of CD105 to purify MSC from MF rather than well-characterised markers of clonogenic, self-renewing, and mesodermal differentiating endometrial MSC such as CD146+PDGFRB+ or SUSD2 (both mentioned in references 22 and 23) is a weakness. The ISCT markers are not specific and are also found on stromal fibroblasts of many tissues (Phinney and Sensebe Cytotherapy 2013; Demu et al Acta Haematologica 2016).<br /> The UMAPs generated from the scRNAseq were at low resolution and more individual immune and endometrial cell types have previously been identified and reported in MF. More comparisons with these studies would also have enhanced the Discussion.

      It was not always possible to work out how the data was reported in the gene expression tables (Supplementary Tables 2, 4-10) as they were not in adjusted P value order and sometimes positive log2 fold change values appeared amongst the negative log2FC. In some comparisons described, the adj P values were not significant but were described as up or down-regulated in the text.

      The 2 DEGs highlighted in the endometriosis and control arm of the study appear as poor choices from many others that could have been chosen as MTRNR2L1 is a mitochondrial pseudogene and HBG2 is a hemoglobin subunit. Neither are likely indicators of endometriosis pathogenesis.

      The manuscript format and organisation could be improved by reducing the discussion in the Results section and providing a more in-depth Discussion. More references need to be included in the Discussion and other work in the MF analysis field that supports - or not - the authors' findings or at least puts them into context, and should be included and referenced.

      The potential to use MF as a non-invasive source of endometrial tissue for potential diagnosis is a very important avenue of research that is currently in its infancy and could have a major impact in the endometriosis research arena.

    1. eLife Assessment

      This important work combines self-report, neural and physiology data to examine the efficacy and mechanisms of counter conditioning versus extinction in reducing re-emergence of conditioned threat responses and show that this appears to rely on the nucleus accumbens rather than the ventromedial prefrontal cortex. These findings are supported by convincing evidence, though some areas could benefit from added clarity and a few targeted refinements and justifications of analytical choices. Results will be of interest to researchers across multiple subfields, including neuroscientists, cognitive theory researchers, and clinicians, particularly those with an interest in clinical applications in trauma therapies.

    2. Reviewer #1 (Public review):

      The authors attempted to replicate previous work showing that counterconditioning leads to more persistent reduction of threat responses, relative to extinction. They also aimed to examine the neural mechanisms underlying counterconditioning and extinction. They achieved both of these aims and were able to provide some additional information, such as how counterconditioning impacts memory consolidation. Having a better understanding of which neural networks are engaged during counterconditioning may provide novel pharmacological targets to aid in therapies for traumatic memories. It will be interesting to follow up by examining the impact of varying amounts of time between acquisition and counterconditioning phases, to enhance replicability to real-world therapeutic settings.

      Major strengths

      • This paper is very well written and attempts to comprehensively assess multiple aspects of counterconditioning and extinction processes. For instance, the addition of memory retrieval tests is not core to the primary hypotheses but provides additional mechanistic information on how episodic memory is impacted by counterconditioning. This methodical approach is commonly seen in animal literature, but less so in human studies.

      • The Group x Cs-type x Phase repeated measure statistical tests with 'differentials' as outcome variables are quite complex, however, the authors have generally done a good job of teasing out significant F test findings with post hoc tests and presenting the data well visually. It is reassuring that there is a convergence between self-report data on arousal and valence and the pupil dilation response. Skin conductance is a notoriously challenging modality, so it is not too concerning that this was placed in the supplementary materials. Neural responses also occurred in logical regions with regard to reward learning.

      • Strong methodology with regards to neuroimaging analysis, and physiological measures.

      • The authors are very clear on documenting where there were discrepancies from their pre-registration and providing valid rationales for why.

      Major Weaknesses

      • The statistics showing that counterconditioning prevents differential spontaneous recovery are the weakest p values of the paper (and using one-tailed tests, although this is valid due to directions being pre-hypothesised). This may be due to a relatively small number of participants and some variability in responses. It is difficult to see how many people were included in the final PDR and neuroimaging analyses, with exclusions not clearly documented. Based on Figure 3, there are relatively small numbers in the PDR analyses (n=14 and n=12 in counterconditioning and extinction, respectively). Of these, each group had 4 people with differential PDR results in the opposing direction to the group mean. This perhaps warrants mention as the reported effects may not hold in a subgroup of individuals, which could have clinical implications.

    3. Reviewer #2 (Public review):

      Summary:

      The present study sets out to examine the impact of counterconditioning (CC) and extinction on conditioned threat responses in humans, particularly looking at neural mechanisms involved in threat memory suppression. By combining behavioral, physiological, and neuroimaging (fMRI) data, the authors aim to provide a clear picture of how CC might engage unique neural circuits and coding dynamics, potentially offering a more robust reduction in threat responses compared to traditional extinction.

      Strengths:

      One major strength of this work lies in its thoughtful and unique design - integrating subjective, physiological, and neuroimaging measures to capture the variouse aspects of counterconditioning (CC) in humans. Additionally, the study is centered on a well-motivated hypothesis and the findings have the potential to improve the current understanding of pathways associated with emotional and cognitive control.

      The data presentation is systematic, and the results on behavioral and physiological measures fit well with the hypothesized outcomes. The neuroimaging results also provide strong support for distinct neural mechanisms underlying CC versus extinction.

      Weaknesses:

      Overall, this study is a well-conducted and thought-provoking investigation into counterconditioning, with strong potential to advance our understanding of threat modulation mechanisms. Two main weaknesses concern the scope and decisions regarding analysis choices. First, while the findings are solid, the topic of counterconditioning is relatively niche and may have limited appeal to a broader audience. Expanding the discussion to connect counterconditioning more explicitly to widely studied frameworks in emotional regulation or cognitive control would enhance the paper's accessibility and relevance to a wider range of readers. This broader framing could also underscore the generalizability and broader significance of the results. In addition, detailed steps in the statistical procedures and analysis parameters seem to be missing. This makes it challenging for readers to interpret the results in light of potential limitations given the data modality and/or analysis choices.

    4. Reviewer #3 (Public review):

      Summary:

      In this manuscript, Wirz et al use neuroimaging (fMRI) to show that counterconditioning produces a longer lasting reduction in fear conditioning relative to extinction and appears to rely on the nucleus accumbens rather than the ventromedial prefrontal cortex. These important findings are supported by convincing evidence and will be of interest to researchers across multiple subfields, including neuroscientists, cognitive theory researchers, and clinicians.

      In large part, the authors achieved their aims of giving a qualitative assessment of the behavioural mechanisms of counterconditioning versus extinction, as well as investigating the brain mechanisms. The results support their conclusions and give interesting insights into the psychological and neurobiological mechanisms of the processes that underlie the unlearning, or counteracting, of threat conditioning.

      Strengths:

      * Mostly clearly written with interesting psychological insights<br /> * Excellent behavioural design, well-controlled and tests for a number of different psychological phenomena (e.g. extinction, recovery, reinstatement, etc).<br /> * Very interesting results regarding the neural mechanisms of each process.<br /> * Good acknowledgement of the limitations of the study.

      Weaknesses:

      * I think the acquisition data belongs in the main figure, so the reader can discern whether or not there are directional differences prior to CC and extinction training that could account for the differences observed. This is particularly important for the valence data which appears to differ at baseline (supplemental figure 2C).<br /> * I was confused in several sections about the chronology of what was done and when. For instance, it appears that individuals went through re-extinction, but this is just called extinction in places.<br /> * I was also confused about the data in Figure 3. It appears that the CC group maintained differential pupil dilation during CC, whereas extinction participants didn't, and the authors suggest that this is indicative of the anticipation of reward. Do reward-associated cues typically cause pupil dilation? Is this a general arousal response? If so, does this mean that the CSs become equally arousing over time for the CC group whereas the opposite occurs for the extinction group (i.e. Figure 3, bottom graphs)? It is then further confusing as to why the CC group lose differential responding on the spontaneous recovery test. I'm not sure this was adequately addressed.<br /> * I am not sure that the memories tested were truly episodic<br /> * Twice as many female participants than males<br /> * No explanation as to why shocks were varied in intensity and how (psuedo-randomly?)

    1. eLife Assessment

      This valuable study examines the activity and function of dorsomedial striatal neurons in the estimation of time. The authors examine striatal activity as a function of time as well as the impact of optogenetic striatal manipulation on the animal's ability to estimate a time interval, providing solid evidence for their claims. The study could be further strengthened with a more rigorous characterization of activity and a stronger connection between their proposed model and the experimental data. The work will be of interest to neuroscientists examining how striatum contributes to behavior.

    2. Reviewer #1 (Public review):

      Summary:

      In this work, the authors examine the activity and function of D1 and D2 MSNs in dorsomedial striatum (DMS) during an interval timing task. In this task, animals must first nosepoke into a cued port on the left or right; if not rewarded after 6 seconds, they must switch to the other port. Thus, this task requires animals to estimate if at least 6 seconds have passed after the first nosepoke. After verifying that animals estimate the passage of 6 seconds, the authors examine striatal activity during this interval. They report that D1-MSNs tend to decrease activity, while D2-MSNs increase activity, throughout this interval. They suggest that this activity follows a drift-diffusion model, in which activity increases (or decreases) to a threshold after which a decision is made. The authors next report that optogenetically inhibiting D1 or D2 MSNs, or pharmacologically blocking D1 and D2 receptors, increased the average wait time. This suggests that both D1 and D2 neurons contribute to the estimate of time, with a decrease in their activity corresponding to a decrease in the rate of 'drift' in their drift-diffusion model. Lastly, the authors examine MSN activity while pharmacologically inhibiting D1 or D2 receptors. The authors observe most recorded MSNs neurons decrease their activity over the interval, with the rate decreasing with D1/D2 receptor inhibition.

      Major strengths:

      The study employs a wide range of techniques - including animal behavioral training, electrophysiology, optogenetic manipulation, pharmacological manipulations, and computational modeling. The question posed by the authors - how striatal activity contributes to interval timing - is of importance to the field and has been the focus of many studies and labs. This paper contributes to that line of work by investigating whether D1 and D2 neurons have similar activity patterns during the timed interval, as might be expected based on prior work based on striatal manipulations. However, the authors find that D1 and D2 neurons have distinct activity patterns. They then provide a decision-making model that is consistent with all results. The data within the paper is presented very clearly, and the authors have done a nice job presenting the data in a transparent manner (e.g., showing individual cells and animals). Overall, the manuscript is relatively easy to read and clear, with sufficient detail given in most places regarding the experimental paradigm or analyses used.

      Major weaknesses:

      The results are based on a relatively small dataset (tens of cells).

      Impact:

      The task and data presented by the authors are very intriguing, and there are many groups interested in how striatal activity contributes to the neural perception of time. The authors perform a wide variety of experiments and analysis to examine how DMS activity influences time perception during an interval-timing task, allowing for insight into this process.

    3. Reviewer #2 (Public review):

      This study found that D1-MSNs and D2-MSNs have opposing dynamics during interval timing in a mouse-optimized interval timing task. Further optogenetic and pharmacologic inhibition of either D1 or D2 MSNs increased response time. This study provides useful experimental evidence in the coding of time in striatum. However, there are some major weaknesses in this study.

      (1) Regarding the data in Figure S3, The variance within each mouse was too big, the authors need to figure out and explain what caused the large variance within the same mouse, or the authors need to increase the sample size.<br /> (2) Regarding the results in Figure 3 C and D, Figure 6 H and Figure 7 D, what is the sample size? From the single data points in the figures, it seems that the authors were using the number of cells to do statistical tests and plot the figures. For example, Figure 3 C, if the authors use n= 32 D2 MSNs and n= 41D1 MSNs to do the statistical test, it could make small difference to be statistically significant. The authors should use the number of mice to do the statistical tests.<br /> (3) Regarding the results in Figure 5, what is the reason for the increase in the response times? The authors should plot the position track during intervals (0-6 s) with or without optogenetic or pharmacologic inhibition. The authors can check Figure 3, 5, and 6 in paper https://doi.org/10.1016/j.cell.2016.06.032 for reference to analyze the data.

    4. Reviewer #3 (Public review):

      Summary:

      The cognitive striatum, also known as the dorsomedial striatum, receives input from brain regions involved in high-level cognition and plays a crucial role in processing cognitive information. However, despite its importance, the extent to which different projection pathways of the striatum contribute to this information processing remains unclear. In this paper, Bruce et al. conducted a study using various causal and correlational techniques to investigate how these pathways collectively contribute to interval timing in mice. Their results were consistent with previous research, showing that the direct and indirect striatal pathways perform opposing roles in processing elapsed time. Based on their findings, the authors proposed a revised computational model in which two separate accumulators track evidence for elapsed time in opposing directions. These results have significant implications for understanding the neural mechanisms underlying cognitive impairment in neurological and psychiatric disorders, as disruptions in the balance between direct and indirect pathway activity are commonly observed in such conditions.

      Strengths:

      The authors employed a well-established approach to study interval timing and employed optogenetic tagging to observe the behavior of specific cell types in the striatum. Additionally, the authors utilized two complementary techniques to assess the impact of manipulating the activity of these pathways on behavior. Finally, the authors utilized their experimental findings to enhance the theoretical comprehension of interval timing using a computational model.

      Weaknesses:

      The behavioral task used in this study is best suited for investigating elapsed time perception rather than interval timing. Timing bisection tasks are often employed to study interval timing in humans and animals. Given the systemic delivery of pharmacological interventions, it is difficult to conclude that the effects are specific to the dorsomedial striatum. Future studies should use the local infusion of drugs into the dorsomedial striatum.

    5. Author response:

      The following is the authors’ response to the previous reviews.

      Public Reviews: 

      Reviewer #1 (Public Review): 

      Summary: 

      In this work, the authors examine the activity and function of D1 and D2 MSNs in dorsomedial striatum (DMS) during an interval timing task. In this task, animals must first nose poke into a cued port on the left or right; if not rewarded after 6 seconds, they must switch to the other port. Thus, this task requires animals to estimate if at least 6 seconds have passed after the first nose poke. After verifying that animals estimate the passage of 6 seconds, the authors examine striatal activity during this interval. They report that D1-MSNs tend to decrease activity, while D2MSNs increase activity, throughout this interval. They suggest that this activity follows a driftdiffusion model, in which activity increases (or decreases) to a threshold after which a decision is made. The authors next report that optogenetically inhibiting D1 or D2 MSNs, or pharmacologically blocking D1 and D2 receptors, increased the average wait time. This suggests that both D1 and D2 neurons contribute to the estimate of time, with a decrease in their activity corresponding to a decrease in the rate of 'drift' in their drift-diffusion model. Lastly, the authors examine MSN activity while pharmacologically inhibiting D1 or D2 receptors. The authors observe most recorded MSNs neurons decrease their activity over the interval, with the rate decreasing with D1/D2 receptor inhibition. 

      We appreciate the careful read by this reviewer. 

      Major strengths: 

      The study employs a wide range of techniques - including animal behavioral training, electrophysiology, optogenetic manipulation, pharmacological manipulations, and computational modeling. The question posed by the authors - how striatal activity contributes to interval timing - is of importance to the field and has been the focus of many studies and labs. This paper contributes to that line of work by investigating whether D1 and D2 neurons have similar activity patterns during the timed interval, as might be expected based on prior work based on striatal manipulations. However, the authors find that D1 and D2 neurons have distinct activity patterns. They then provide a decision-making model that is consistent with all results. The data within the paper is presented very clearly, and the authors have done a nice job presenting the data in a transparent manner (e.g., showing individual cells and animals). Overall, the manuscript is relatively easy to read and clear, with sufficient detail given in most places regarding the experimental paradigm or analyses used. 

      We are glad that our main points come clearly through.

      Major weaknesses: 

      One weakness to me is the impact of identifying whether D1 and D2 had similar or different activity patterns. Does observing increasing/decreasing activity in D2 versus D1, or different activity patterns in D1 and D2, support one model of interval timing over another, or does it further support a more specific idea of how DMS contributes to interval timing? 

      This is a great point - we were not clear.  We observe distinct patterns of D2 and D1-MSN activity, but that disrupting either D2-MSNs or D1-MSNs led to increased response time.  The model that this supports is that D2-MSNs and D1-MSN ensemble activity represents temporal evidence.  This is a very specific model that can be rigorously tested in future work.  We have now made this very clear in the abstract (Page 2). 

      “We found that D2-MSNs and D1-MSNs exhibited distinct dynamics over temporal intervals as quantified by principal component analyses and trial-by-trial generalized linear models. MSN recordings helped construct and constrain a fourparameter drift-diffusion computational model in which MSN ensemble activity represented the accumulation of temporal evidence. This model predicted that disrupting either D2-MSNs or D1-MSNs would increase interval timing response times and alter MSN firing. In line with this prediction, we found that optogenetic inhibition or pharmacological disruption of either D2-MSNs or D1-MSNs increased interval timing response times.”

      And in the results on Page 18:  

      “Because both D2-MSNs and D1-MSNs accumulate temporal evidence, disrupting either MSN type in the model changed the slope. The results were obtained by simultaneously decreasing the drift rate D (equivalent to lengthening the neurons’ integration time constant) and lowering the level of network noise 𝝈: D = 𝟎. 𝟏𝟐𝟗, 𝝈 = 𝟎. 𝟎𝟒𝟑 for D2-MSNs in Fig 4A (in red; changes in noise had to accompany changes in drift rate to preserve switch response time variance. See Methods); and 𝑫 = 𝟎. 𝟏𝟐𝟐, 𝝈 = 𝟎. 𝟎𝟒𝟑 for D1-MSNs in Fig 4B (in blue). The model predicted that disrupting either D2-MSNs or D1-MSNs would increase switch response times (Fig 4C and Fig 4D) and would shift MSN dynamics.” 

      And in the discussion (Page 30): 

      “Striatal MSNs are critical for temporal control of action (Emmons et al., 2017; Gouvea et al., 2015; Mello et al., 2015). Three broad models have been proposed for how striatal MSN ensembles represent time: 1) the striatal beat frequency model, in which MSNs encode temporal information based on neuronal synchrony (Matell and Meck, 2004); 2) the distributed coding model, in which time is represented by the state of the network (Paton and Buonomano, 2018); and 3) the DDM, in which neuronal activity monotonically drifts toward a threshold after which responses are initiated (Emmons et al., 2017; Simen et al., 2011; Wang et al., 2018). While our data do not formally resolve these possibilities, our results show that D2-MSNs and D1MSNs exhibit opposing changes in firing rate dynamics in PC1 over the interval. Past work by our group and others has demonstrated that PC1 dynamics can scale over multiple intervals to represent time (Emmons et al., 2020, 2017; Gouvea et al., 2015; Mello et al., 2015; Wang et al., 2018). We find that low-parameter DDMs account for interval timing behavior with both intact and disrupted striatal D2- and D1-MSNs. While other models can capture interval timing behavior and account for MSN neuronal activity, our model does so parsimoniously with relatively few parameters (Matell and Meck, 2004; Paton and Buonomano, 2018; Simen et al., 2011). We and others have shown previously that ramping activity scales to multiple intervals, and DDMs can be readily adapted by changing the drift rate (Emmons et al., 2017; Gouvea et al., 2015; Mello et al., 2015; Simen et al., 2011). Interestingly, decoding performance was high early in the interval; indeed, animals may have been focused on this initial interval (Balci and Gallistel, 2006) in making temporal comparisons and deciding whether to switch response nosepokes.”

      Regarding the reviewer’s specific question – it is not clear why D1-MSNs and D2-MSNs have opposing patterns of activity, as integration of temporal evidence can certainly be achieved increasing or decreasing firing rates alone. These patterns have been seen in motor control. Prefrontal neurons, which control striatal ramping, also ramp up and down. We have now included a paragraph on Page 30 explicitly discussing these ideas; however, future experiments will be required to investigate the source of the divergent patterns of activity among D2-MSNs and D1-MSNs.   

      “D2-MSNs and D1-MSNs play complementary roles in movement. For instance, stimulating D1-MSNs facilitates movement, whereas stimulating D2-MSNs impairs movement (Kravitz et al., 2010). Both populations have been shown to have complementary patterns of activity during movements with MSNs firing at different phases of action initiation and selection (Tecuapetla et al., 2016). Further dissection of action selection programs reveals that opposing patterns of activation among D2MSNs and D1-MSNs suppress and guide actions, respectively, in the dorsolateral striatum (Cruz et al., 2022). A particular advantage of interval timing is that it captures a cognitive behavior within a single dimension — time. When projected along the temporal dimension, it was surprising that D2-MSNs and D1-MSNs had opposing patterns of activity. Ramping activity in the prefrontal cortex can increase or decrease; and prefrontal neurons project to and control striatal ramping activity (Emmons et al., 2020, 2017; Wang et al., 2018).  It is possible that differences in D2MSNs and D1-MSNs reflect differences in cortical ramping, which may themselves reflect more complex integrative or accumulatory processes. Further experiments are required to investigate these differences. Past pharmacological work from our group and others has shown that disrupting D2- or D1-MSNs slows timing (De Corte et al., 2019b; Drew et al., 2007, 2003; Stutt et al., 2024) and are in agreement with pharmacological and optogenetic results in this manuscript. Computational modeling predicted that disrupting either D2-MSNs or D1-MSNs increased selfreported estimates of time, which was supported by both optogenetic and pharmacological experiments.”

      I found the results presented in Figures 2 and 3 to be a little confusing or misleading. In Figure 2, the authors appear to claim that D1 neurons decrease their activity over the time interval while D2 neurons increase activity. The authors use this result to suggest that D1/D2 activity patterns are different. In Figure 3, a different analysis is done, and this time D2 neurons do not significantly increase their activity with time, conflicting with Figure 2. While in both figures, there is a significant difference between the mean slopes across the population, the secondary effect of positive/negative slope for D2/D1 neurons changes. I find this especially confusing as the authors refer back to the positive/negative slope for D2/D1 neurons result throughout the rest of the text.  

      We were not clear.  First, we attempted to quantify these differences based on PCA and slope.  We have rephrased our characterization of these differences by changing text on (Page 9) to: 

      “These PETHs revealed that for the 6-second interval immediately after trial start, many putative D2-MSN neurons appeared to ramp up while many putative D1-MSNs appeared to ramp down. For 32 putative D2-MSNs average PETH activity increased over the 6-second interval immediately after trial start, whereas for 41 putative D1-MSNs, average PETH activity decreased. Accordingly, D2-MSNs and D1-MSNs had differences in activity early in the interval (0-5 seconds; F = 4.5, p = 0.04 accounting for variance between mice) but not late in the interval (5-6 seconds; F = 1.9, p = 0.17 accounting for variance between mice). Examination of a longer interval of 10 seconds before to 18 seconds after trial start revealed the greatest separation in D2-MSN and D1-MSN dynamics during the 6-second interval after trial start (Fig S2). Strikingly, these data suggest that D2-MSNs and D1-MSNs might display distinct dynamics during interval timing.” 

      We have rephrased our discussion on PCA to quantify differences in Fig 2G-H using data-driven methods (Page 12): 

      “To quantify differences between D2-MSNs vs D1-MSNs in Fig 2G-H, we turned to principal component analysis (PCA), a data-driven tool to capture the diversity of neuronal activity (Kim et al., 2017a). Work by our group and others has uniformly identified PC1 as a linear component among corticostriatal neuronal ensembles during interval timing (Bruce et al., 2021; Emmons et al., 2020, 2019, 2017; Kim et al., 2017a; Narayanan et al., 2013; Narayanan and Laubach, 2009; Parker et al., 2014; Wang et al., 2018). We analyzed PCA calculated from all D2-MSN and D1MSN PETHs over the 6-second interval immediately after trial start. PCA identified time-dependent ramping activity as PC1 (Fig 3A), a key temporal signal that explained 54% of variance among tagged MSNs (Fig 3B; variance for PC1 p = 0.009 vs 46 (44-49)% for any pattern of PC1 variance derived from random data; Narayanan, 2016). Consistent with population averages from Fig 2G&H, D2-MSNs and D1-MSNs had opposite patterns of activity with negative PC1 scores for D2MSNs and positive PC1 scores for D1-MSNs (Fig 3C; PC1 for D2-MSNs: -3.4 (-4.6 – 2.5); PC1 for D1-MSNs: 2.8 (-2.8 – 4.9); F = 8.8, p = 0.004 accounting for variance between mice (Fig S3A); Cohen’s d = 0.7; power = 0.80; no reliable effect of sex (F = 0.44, p = 0.51) or switching direction (F = 1.73, p = 0.19)).”

      And finally, we directly investigate the heart of the reviewer’s question by explicitly comparing PC1 scores – a data-driven analysis of neuronal patterns that explain the least variance – and show that they are less than 0 for D2-MSNs (i.e., negatively correlated with a down-ramping pattern, or ramping up), and greater than 0 for D1MSNs (i.e., positively correlated with an up-ramping pattern): 

      “Importantly, PC1 scores for D2-MSNs were significantly less than 0 (signrank D2MSN PC1 scores vs 0: p = 0.02), implying that because PC1 ramps down, D2-MSNs tended to ramp up. Conversely, PC1 scores for D1-MSNs were significantly greater than 0 (signrank D1-MSN PC1 scores vs 0: p = 0.05), implying that D1-MSNs tended to ramp down.  Thus, analysis of PC1 in Fig 3A-C suggested that D2-MSNs (Fig 2G) and D1-MSNs (Fig 2H) had opposing ramping dynamics.”

      We interpret these data on Page 16: 

      “Our analysis of average activity (Fig 2G-H) and PC1 (Fig 3A-C) suggested that D2MSNs and D1-MSNs might have opposing dynamics. However, past computational models of interval timing have relied on drift-diffusion dynamics that increases over the interval and accumulates evidence over time (Nguyen et al., 2020; Simen et al., 2011).”

      The reviewer mentions our analysis of ‘mean slopes across the population’ -which we clarify as trial-by-trial slope analysis, which is distinct from the population averages in 2G-H and 3A-C.  We have now made this clear (Page 12). 

      “To interrogate these dynamics at a trial-by-trial level, we calculated the linear slope of D2-MSN and D1-MSN activity over the first 6 seconds of each trial using generalized linear modeling (GLM) of effects of time in the interval vs trial-by-trial firing rate (Latimer et al., 2015).  Note that this analysis focuses on each trial rather than population averages in Fig 2G-H and Fig 3A-C.”

      Finally, as the reviewer suggests, we have removed the term ‘slope’ from the rest of the paper, as the increasing/decreasing comes from averages and analyses of PC1.  We have removed all discussion of ‘opposing’ slope or ‘increasing/decreasing’ slope. 

      It is a bit unclear to me how the authors chose the parameters for the model, and how well the model explains behavior is quantified. It seems that the authors didn't perform cross-validation across trials (i.e., they chose parameters that explained behavior across all trials combined, rather than choosing parameters from a subset of trials and determining whether those parameters are robust enough to explain behavior on held-out trials). I think this would increase the robustness of the result. 

      In addition, it remains a bit unclear to me how the authors changed the specific parameters they did to model the optogenetic manipulation. It seems these parameters were chosen because they fit the manipulation data. This makes me wonder if this model is flexible enough that there is almost always a set of parameters that would explain any experimental result; in other words, I'm not sure this model has high explanatory power. 

      We are glad the reviewer raised these points.  First, we have now included a complete exploration of the parameter space, exactly as the reviewer recommends.  These are described in the methods (Page 41): 

      “Selection of DDMs parameters. Our goal was to build DDMs with dynamics that produce “response times” according to the observed distribution of mice switch times. The selection of parameter values in Fig 4 was done in three steps. First, we fit the distribution of the mice behavioral data with a Gamma distribution and found its fitting values for shape 𝜶𝑴 and rate 𝜷𝑴 (Table S2 and Fig S8; R2 Data vs Gamma ≥ 𝟎. 𝟗𝟒). We recognized that the mean 𝝁𝑴 and the coefficient of variation 𝑪𝑽𝑴 are directly related to the shape and rate of the Gamma distribution by formulas 𝝁𝑴 \= 𝜶𝑴/𝜷𝑴 and 𝑪𝑽𝑴 \= 𝟏/√𝜶𝑴.  Next, we fixed parameters 𝑭 and 𝒃 in DDM (e.g., for D2-MSNs: 𝑭 = 𝟏, 𝒃 = 𝟎. 𝟓𝟐) and simulated the DDM for a range of values for 𝑫 and 𝝈. For each pair (𝑫, 𝝈), one computational “experiment” generated 500 response times with mean 𝝁 and coefficient of variation 𝑪𝑽. We repeated the “experiment” 10 times and took the group median of 𝝁 and 𝑪𝑽 to obtain the simulation-based statistical measures 𝝁𝑺 and 𝑪𝑽𝑺. Last, we plotted 𝑬𝝁 \= |(𝝁𝑺 − 𝝁𝑴)/𝝁𝑴| and 𝑬𝒄𝒗 \= |𝑪𝑽𝑺 − 𝑪𝑽𝑴|, the respective relative error and the absolute error to data (Fig S7). We considered that parameter values (𝑫, 𝝈) provided a good DDM fit of mice behavioral data whenever  𝑬𝝁 ≤ 𝟎. 𝟎𝟓    and 𝑬𝒄𝒗

      And included a new Fig S7 which shows the parameter space: 

      These new data clearly comment on the parameter space of our model. 

      Finally, the reviewer mentions cross-validation.  We did this at length on our model and data fits.  We used 10-fold cross-validation as fitlm needs enough data for the individual fits.  We found that the fit was extremely stable – i.e, we ended up with standard deviations in R2<0.004 for all comparisons.  Thus, we added the following point to the methods on Page 41:  

      “10-fold cross-validation revealed highly stable fits between gamma, models and data.”

      Lastly, the results are based on a relatively small dataset (tens of cells). 

      This is an important point.  Although it is a small optogenetically-tagged dataset, we have adequate statistical power and large effect sizes, which we now detail in the text on Page 12:

      “Consistent with population averages from Fig 2G&H, D2-MSNs and D1-MSNs had opposite patterns of activity with negative PC1 scores for D2-MSNs and positive PC1 scores for D1-MSNs (Fig 3C; PC1 for D2-MSNs: -3.4 (-4.6 – 2.5); PC1 for D1MSNs: 2.8 (-2.8 – 4.9); F = 8.8, p = 0.004 accounting for variance between mice (Fig S3A); Cohen’s d = 0.7; power = 0.80; no reliable effect of sex (F = 0.44, p = 0.51) or switching direction (F = 1.73, p = 0.19)).”

      And:  

      “GLM analysis also demonstrated that D2-MSNs had significantly different slopes (0.01 spikes/second (-0.10 – 0.10)), which were distinct from D1-MSNs (-0.20 (-0.47– 0.06; Fig 3D; F = 8.9, p = 0.004 accounting for variance between mice (Fig S3B); Cohen’s d = 0.8; power = 0.98; no reliable effect of sex (F = 0.02, p = 0.88) or switching direction (F = 1.72, p = 0.19)).”

      And we have included the reviewers point as a limitation on Page 33:  

      “Second, although we had adequate statistical power and medium-to-large effect sizes, optogenetic tagging is low-yield, and it is possible that recording more of these neurons would afford greater opportunity to identify more robust results and alternative coding schemes, such as neuronal synchrony.”

      Impact: 

      The task and data presented by the authors are very intriguing, and there are many groups interested in how striatal activity contributes to the neural perception of time. The authors perform a wide variety of experiments and analysis to examine how DMS activity influences time perception during an interval-timing task, allowing for insight into this process. However, the significance of the key finding -- that D1 and D2 activity is distinct across time -- remains somewhat ambiguous to me. 

      Again, we are glad that the reviewer appreciated our main point, and we very much appreciate the additional points about interpretation, model parameters, and statistical power. If there is any way we can clarify the text further we are happy to do so.  

      Reviewer #2 (Public Review):  

      (1) Regarding the results in Figure 2 and Figure 5: for the heatmaps in Fig.2F and Fig.2E, the overall activity pattern of D1 and D2 MSNs looks very similar, both D1 and D2 MSNs contains neurons showing decreasing or increasing activity during interval timing. And the optogenetic and pharmacologic inhibition of either D1 or D2 MSNs resulted in similar behavior outcomes. To me, the D1 and D2 MSN activities were more complementary than opposing. 

      This is a great point. In our last revision, R3 suggested that complementary means opposing – and suggested we change the title to reflect this.  Our original title was ‘Complementary cognitive roles for D2-MSNs and D1-MSNs during interval timing’ – and we have changed the title back to this. We have clarified what we meant by complementary in the abstract (Page 2):

      “Together, our findings demonstrate that D2-MSNs and D1-MSNs had opposing dynamics yet played complementary cognitive roles, implying that striatal direct and indirect pathways work together to shape temporal control of action.”

      And on Page 30: 

      “These data, when combined with our model predictions, demonstrate that despite opposing dynamics,  D2-MSNs and D1-MSN contribute complementary temporal evidence to controlling actions in time.”

      If the authors want to emphasize the opposing side of D1 and D2 MSNs, then the manipulation experiments need to be re-designed, since the average activity of D2 MSNs increased, while D1 MSNs decreased during interval timing, instead of using inhibitory manipulations in both pathways, the authors should use inhibitory manipulation in D2-MSNs, while using optogenetic or pharmacology to activate D1-MSNs. In this way, the authors can demonstrate the opposing role of D1 and D2 MSNs and the functions of increased activity in D2-MSNs and decreased activity in D1-MSNs. 

      These are great ideas, which we agree with.  We would like to emphasize the complementary nature as noted in our original title, and not the opposing side of D1/D2 MSNs. The experiments proposed by reviewer are certainly worth doing, but would likely be quite complex to find the right stimulation parameters to affect timing without affecting movement – and we have now included them as an important limitation / future direction (Page 33):

      “Fifth, we did not deliver stimulation to the striatum because our pilot experiments triggered movement artifacts or task-specific dyskinesias (Kravitz et al., 2010). Future stimulation approaches carefully titrated to striatal physiology may affect interval timing without affecting movement.”

      (2) Regarding the results in Figure 3 C and D, Figure 6 H and Figure 7 D, what is the sample size? From the single data points in the figures, it seems that the authors were using the number of cells to do statistical tests and plot the figures. For example, Figure 3 C, if the authors use n= 32 D2 MSNs and n= 41D1 MSNs to do the statistical test, it could make a small difference to be statistically significant. The authors should use the number of mice to do the statistical tests. 

      These are important points that were discussed at length in the prior review.  First, for the sample size, we now have detailed in our Table 1: 

      Second, we have detailed our statistical approach which explicitly deals with repeated observations of neurons across mice (Page 43):

      “Statistics. All data and statistical approaches were reviewed by the Biostatistics, Epidemiology, and Research Design Core (BERD) at the Institute for Clinical and Translational Sciences (ICTS) at the University of Iowa. All code and data are made available at http://narayanan.lab.uiowa.edu/article/datasets. We used the median to measure central tendency and the interquartile range to measure spread. We used Wilcoxon nonparametric tests to compare behavior between experimental conditions and Cohen’s d to calculate effect size. Analyses of putative single-unit activity and basic physiological properties were carried out using custom routines for MATLAB. For all neuronal analyses, variability between animals was accounted for using generalized linear-mixed effects models and incorporating a random effect for each mouse into the model, which allows us to account for inherent betweenmouse variability. We used fitglme in MATLAB and verified main effects using lmer in R. We accounted for variability between MSNs in pharmacological datasets in which we could match MSNs between saline, D2 blockade, and D1 blockade. P values < 0.05 were interpreted as significant.”   

      We have formally reviewed this approach with professional biostatisticians at the University of Iowa.

      Finally, we note that we do have adequate statistical power for analysis of Fig 3C and D:  we have adequate statistical power and large effect sizes, which we now detail in the text on Page 12:

      “Consistent with population averages from Fig 2G&H, D2-MSNs and D1-MSNs had opposite patterns of activity with negative PC1 scores for D2-MSNs and positive PC1 scores for D1-MSNs (Fig 3C; PC1 for D2-MSNs: -3.4 (-4.6 – 2.5); PC1 for D1MSNs: 2.8 (-2.8 – 4.9); F = 8.8, p = 0.004 accounting for variance between mice (Fig S3A); Cohen’s d = 0.7; power = 0.80; no reliable effect of sex (F = 0.44, p = 0.51) or switching direction (F = 1.73, p = 0.19)).”

      And, on Page 12:  

      “GLM analysis also demonstrated that D2-MSNs had significantly different slopes (0.01 spikes/second (-0.10 – 0.10)), which were distinct from D1-MSNs (-0.20 (-0.47– 0.06; Fig 3D; F = 8.9, p = 0.004 accounting for variance between mice (Fig S3B); Cohen’s d = 0.8; power = 0.98; no reliable effect of sex (F = 0.02, p = 0.88) or switching direction (F = 1.72, p = 0.19)).”

      And we have included the reviewers point as a limitation on Page 33: 

      “Second, although we had adequate statistical power and medium-to-large effect sizes, optogenetic tagging is low-yield, and it is possible that recording more of these neurons would afford greater opportunity to identify more robust results and alternative coding schemes, such as neuronal synchrony.”

      (3) Regarding the results in Figure 5, wly at is the reason for the increase in the response times? The authors should plot the position track during intervals (0-6 s) with or without optogenetic or pharmacologic inhibition. The authors can check Figures 3, 5, and 6 in the paper https://doi.org/10.1016/j.cell.2016.06.032 for reference to analyze the data. 

      These are key points, and we are glad the reviewer raised them.  Our interpretation is that response time increases – without reliable changes in other task-specific movements such as nosepoke reaction time or traversal time (Fig S9).  This was lacking in our prior manuscript, and we are glad the reviewer raised it.  We have now added this to Page 30

      “Our interpretation is that because the activity of D2-MSN and D1-MSN ensembles represents the accumulation evidence, pharmacological/optogenetic disruption of D2-MSN/D1-MSN activity slows this accumulation process, leading to slower interval timing-response times (Fig 5) without changing other task-specific movements (Fig S9).  These results provide new insight into how opposing patterns of striatal MSN activity control behavior in similar ways and show that they play a complementary role in elementary cognitive operations.”

      Regarding the tracking of velocity, we unfortunately do not have this information reliably across all conditions. This citation is a beautiful landmark paper, and we are working on collecting this information in our new datasets going forward.  We have included this as a major limitation (Page 34): 

      “Still, future work combining motion tracking/accelerometry with neuronal ensemble recording and optogenetics and including bisection tasks may further unravel timing vs. movement in MSN dynamics (Robbe, 2023; Tecuapetla et al., 2016).”

      Once again, we are appreciative of the thoughtful points raised by this reviewer.  

      Reviewer #3 (Public Review): 

      Summary: 

      The cognitive striatum, also known as the dorsomedial striatum, receives input from brain regions involved in high-level cognition and plays a crucial role in processing cognitive information. However, despite its importance, the extent to which different projection pathways of the striatum contribute to this information processing remains unclear. In this paper, Bruce et al. conducted a study using various causal and correlational techniques to investigate how these pathways collectively contribute to interval timing in mice. Their results were consistent with previous research, showing that the direct and indirect striatal pathways perform opposing roles in processing elapsed time. Based on their findings, the authors proposed a revised computational model in which two separate accumulators track evidence for elapsed time in opposing directions. These results have significant implications for understanding the neural mechanisms underlying cognitive impairment in neurological and psychiatric disorders, as disruptions in the balance between direct and indirect pathway activity are commonly observed in such conditions. 

      Strengths: 

      The authors employed a well-established approach to study interval timing and employed optogenetic tagging to observe the behavior of specific cell types in the striatum. Additionally, the authors utilized two complementary techniques to assess the impact of manipulating the activity of these pathways on behavior. Finally, the authors utilized their experimental findings to enhance the theoretical comprehension of interval timing using a computational model. 

      We very much appreciate the considered read and comments by the reviewer, and recognition of the breadth of techniques in this manuscript. 

      Weaknesses: 

      The behavioral task used in this study is best suited for investigating elapsed time perception, rather than interval timing. Timing bisection tasks are often employed to study interval timing in humans and animals. In the optogenetic experiment, the laser was kept on for too long (18 seconds) at high power (12 mW). This has been shown to cause adverse effects on population activity (for example, through heating the tissue) that are not necessarily related to their function during the task epochs. Given the systemic delivery of pharmacological interventions, it is difficult to conclude that the effects are specific to the dorsomedial striatum. Future studies should use the local infusion of drugs into the dorsomedial striatum. 

      These are important points.  We agree with them completely and have now included responses to them.  First, bisection tasks certainly have advantages – we have justified our approach in the discussion (Page 32):

      “Our task version has been used extensively to study interval timing in mice and humans (Balci et al., 2008; Bruce et al., 2021; Stutt et al., 2024; Tosun et al., 2016; Weber et al., 2023). However, temporal bisection tasks, in which animals hold during a temporal cue and respond at different locations depending on cue length, have advantages in studying how animals time an interval because animals are not moving while estimating cue duration (Paton and Buonomano, 2018; Robbe, 2023; Soares et al., 2016). Our interval timing task version – in which mice switch between two response nosepokes to indicate their interval estimate has elapsed – has been used extensively in rodent models of neurodegenerative disease (Larson et al., 2022; Weber et al., 2024, 2023; Zhang et al., 2021), as well as in humans (Stutt et al., 2024). This version of interval timing involves motor timing, which engages executive function and has more translational relevance for human diseases than perceptual timing or bisection tasks (Brown, 2006; Farajzadeh and Sanayei, 2024; Nombela et al., 2016; Singh et al., 2021).  Furthermore, because many therapeutics targeting dopamine receptors are used clinically, these findings help describe how dopaminergic drugs might affect cognitive function and dysfunction. Future studies of D2-MSNs and D1-MSNs in temporal bisection and other timing tasks may further clarify the relative roles of D2- and D1-MSNs in interval timing and time estimation.”

      Second – we have included an explicit control that has the same laser that is on for the same epoch as in the experimental animal – and find no effects.  This is now detailed in the methods: (Page 37): 

      “To control for heating and nonspecific effects of optogenetics, we performed control experiments in mice without opsins using identical laser parameters in D2-cre or D1-cre mice (Fig S6).”

      And in the results (Page 21): 

      “To control for heating and nonspecific effects of optogenetics, we performed control experiments in D2-cre mice without opsins using identical laser parameters; we found no reliable effects for opsin-negative controls (Fig S6).”

      And on Page 21:

      “As with D2-MSNs, we found no reliable effects with opsin-negative controls in D1MSNs (Fig S6).”

      We have now detailed these results in Figure S6:

      Regarding focal pharmacology, we performed this experiment with focal infusion of D1/D2 antagonists in our prior work, which we have now cited (Page 4):

      “Similar behavioral effects were found with systemic (Stutt et al., 2024) or focal infusion of D2 or D1 antagonists locally within the dorsomedial striatum (De Corte et al., 2019a).”

      Comments on revised version: 

      Thank you for the comprehensive revisions. Most of my (addressable) concerns were addressed. The current version of your manuscript appears significantly improved. 

      Once again, we appreciate the reviewer’s constructive and insightful comments and careful review of our manuscript.  Their comments have been extremely helpful.

    1. eLife Assessment

      This important study presents interesting results aimed at explaining the effects of a human mutation on the mitochondrial import protein TIMM50 on mitochondrial function and neuronal excitability. While the evidence supporting the conclusions is convincing, the mechanisms driving changes in the levels of certain proteins within and outside the mitochondria (such as certain ion channels) remain unexplained. This paper will be of interest to scientists in the mitochondria field.

    2. Reviewer #1 (Public review):

      Mitochondria are essential organelles consisting in mammalian cells of about 1500 different proteins. Most of those are synthesized in the cytosol as precursor proteins, imported into mitochondria, and sorted into one of the four sub-mitochondrial compartments. The TIM23 complex, which is embedded in the mitochondrial inner membrane, facilitates the import of proteins that harbor Mitochondrial Targeting Sequence (MTS) at their N-terminus. Such proteins are sorted mainly to the mitochondrial matrix while some sub-groups are destined also to the inner membrane or the intermembrane space. TIMM50 (Tim50 in yeast) is an essential component of the TIM23 complex and mutations in this protein were reported to cause several diseases.

      Summary:

      In the current study, the authors analyzed the impact of TIMM50 mutations on the mitochondrial proteome in both patients' cells and mouse neurons. They provide compelling evidence for several surprising and highly interesting observations: (i) TIMM50 mutations affect the steady-state levels of only a portion of the putative TIMM50 substrates, (ii) such mutations result in increased electrical activity in mice neurons and in reduced levels of some potassium ion channels in the plasma membrane. These findings shed new light on mitochondrial biogenesis in mammalian cells and hint at an unexpected link between mitochondria and ion channels at the plasma membrane.

      Strengths:

      The authors used both cells from patients and neurons from mice to investigate the impact of mutations in TIMM50 on mitochondrial proteome and function.

      Comments on revisions:

      The authors addressed all my concerns regarding the original submission.

    3. Reviewer #2 (Public review):

      Summary:

      Mitochondria import hundreds of precursor proteins from the cytosol. The TOM and TIM23 complexes facilitate the import on the matrix-targeting pathway of mitochondria. In yeast, Tim50 is a critical and essential subunit of the TIM23 complex that mediates the transition of precursors from the outer to the inner membrane. The human Tim50 homolog TIMM50 is highly similar in structure and a comparable function of Tim50 and TIMM50 was proven by several biochemical and genetic studies in the past.

      In this study, the authors characterize human cells which express lower levels or mutated versions of TIMM50. They found that in these TIMM50-depletion cells, the levels of other TIM23 core subunits are also diminished but many mitochondrial proteins are unaffected. Moreover, they observed alterations in the electrical activity and the levels of potassium channels in neuronal cells of TIMM50-deficient mice. They propose that these changes explain the pathology of patients who often suffer from epilepsy.

      Strengths:

      The paper is written by experts in the field, and it is very clear. The experiments are of high quality and sufficiently well-controlled. The study is interesting for a broad readership.

      Weaknesses:

      The authors show that even upon low levels of Tim50, mitochondrial proteins are not considerably depleted. However, it remains somewhat unclear why this is. TIMM50 and the TIM23 complex might not be rate-limiting for the biogenesis of mitochondrial proteins. Alternatively, the import defect is compensated indirectly, for example by a reduced growth of cells. It will be interesting to study the physiological consequences of TIMM50-depletion in more depth in the future.

    4. Author response:

      The following is the authors’ response to the original reviews.

      We thank the reviewers and editor for their positive view and constructive valuable comments on the manuscript.  Following we address the suggestions of the reviewers.

      Reviewer #1 (Public Review):

      (1) It will be interesting to monitor the levels of another MIM insertase namely, OXA1. This will help to understand whether some of the observed changes in levels of OXPHOS subunits are related to alterations in the amounts of this insertase.

      OXA1 was not detected in the untargeted mass spectrometry analysis, most likely due to the fact that it is a polytopic membrane protein, spanning the membrane five times (1,2). Consequently, we measured OXA1 levels with immunoblotting, comparing patient fibroblast cells to the HC. No significant change in OXA1 steady state levels was observed.

      These results are now displayed (Fig. S3B and C) and discussed in the revised manuscript.

      Figure 3: How do the authors explain that although TIMM17 and TIMM23 were found to be significantly reduced by Western analysis they were not detected as such by the Mass Spec. method?

      The untargeted mass spectrometry in the current study failed to detect the presence of TIMM17 for both, patient fibroblasts and mice neurons, while TIMM23 was detected only for mice neurons and a decrease was observed for this protein but was not significant. This is most likely due to the fact that TIMM17 and TIMM23 are both polytopic membrane proteins, spanning the membrane four times, which makes it difficult to extract them in quantities suitable for MS detection (2,3).

      (2) How do the authors explain the higher levels of some proteins in the TIMM50 mutated cells?

      The levels of fully functional TIM23 complex are deceased in patients' fibroblasts. Therefore, the mechanism by which the steady state level of some TIM23 substrate proteins is increased, can only be explained relying on events that occur outside the mitochondria. This could include increase in transcription, translation or post translation modifications, all of which may increase their steady state level albite the decrease in the steady state level of the import complex.

      (3) Can the authors elaborate on why mutated cells are impaired in their ability to switch their energetic emphasis to glycolysis when needed?

      Cellular regulation of the metabolic switch to glycolysis occurs via two known pathways: 1) Activation of AMP-activated protein kinase (AMPK) by increased levels of AMP/ADP (4). 2) Inhibition of pyruvate dehydrogenase (PDH) complexes by pyruvate dehydrogenase kinases (PDK) (5). Therefore, changes in the steady state levels of any of these regulators could push the cells towards anaerobic energy production, when needed. In our model systems, we did not observe changes in any of the AMPK, PDH or PDK subunits that were detected in our untargeted mass spectrometry analysis (see volcano plots below, no PDK subunits were detected in patient fibroblasts). Although this doesn’t directly explain why the cells have an impaired ability to switch their energetic emphasis, it does possibly explain why the switch did not occur de facto.

      Author response image 1.

      Reviewer #2 (Public Review):

      (1) The authors claim in the abstract, the introduction, and the discussion that TIMM50 and the TIM23 translocase might not be relevant for mitochondrial protein import in mammals. This is misleading and certainly wrong!!!

      Indeed, it was not in our intention to claim that the TIM23 complex might not be relevant. We have now rewritten the relevant parts to convey the correct message:

      Abstract –

      Line 25 - “Strikingly, TIMM50 deficiency had no impact on the steady state levels of most of its putative substrates, suggesting that even low levels of a functional TIM23 complex are sufficient to maintain the majority of complex-dependent mitochondrial proteome.”

      Introduction –

      Line 87 - Surprisingly, functional and physiological analysis points to the possibility that low levels of TIM23 complex core subunits (TIMM50, TIMM17 and TIMM23) are sufficient for maintaining steady-state levels of most presequence-containing proteins. However, the reduced TIM23CORE component levels do affect some critical mitochondrial properties and neuronal activity.

      Discussion –

      Line 339 – “…surprising, as normal TIM23 complex levels are suggested to be indispensable for the translocation of presequence-containing mitochondrial proteins…”

      Line 344 – “…it is possible that unlike what occurs in yeast, normal levels of mammalian TIMM50 and TIM23 complex are mainly essential for maintaining the steady state levels of intricate complexes/assemblies.”

      Line 396 – “In summary, our results suggest that even low levels of TIMM50 and TIM23CORE components suffice in maintaining the majority of mitochondrial matrix and inner membrane proteome. Nevertheless, reductions in TIMM50 levels led to a decrease of many OXPHOS and MRP complex subunits, which indicates that normal TIMM50 levels might be mainly essential for maintaining the steady state levels and assembly of intricate complex proteins.”

      Reviewer #1 (Recommendations For The Authors):

      (1) Lines 25-26: The authors write "Strikingly, TIMM50 deficiency had no impact on the steady state levels of most of its substrates". Since the current data challenges the definition of some proteins as substrates of TIMM50, I suggest using the term "putative substrates".

      Changed as suggested

      (2) Line 27: It is not clear whether the wording "general import role of TIM23" it refers to the TIM23 protein or the TIM23 complex. This should be clarified.

      Clarified. It now states "TIM23 complex".

      (3) Line 72: should be "and plays".

      Changed as suggested.

      (4) It will be helpful to include in Figure 1 a small scheme of TIMM50 and to indicate in which domain the T252M mutation is located.

      We predicted the AlphaFold human TIMM50 structure and indicated the mutation site and the different TIMM50 domains. The structure is included in Fig. 1A.

      (5) I suggest labelling the "Y" axis in Fig. 1B as "Protein level (% of control)".

      Changed as suggested in Fig. 1C (previously Fig. 1B) and in Fig. 2C.

      (6) Line 179: since the authors tested here only about 10 mitochondrial proteins (out of 1500), I think that the word "many" should be replaced by "several representative" resulting in "steady state levels of several representative mitochondrial proteins".

      Changed as requested.

      (7) Line 208: correct typo.

      Typo was corrected.

      (8) Figure 4 is partially redundant as its data is part of Figure 3. The authors can consider combining these two figures. Accordingly, large parts of the legend of Figure 4 are repeating information in the legend to Figure 3 and can refer to it.

      We revamped Figures 3 and 4. Figure 3 now shows the analysis of fibroblasts proteomics while Figure 4 focuses on neurons proteomics. We also modified the legend of Figure 4.

      Reviewer #2 (Recommendations For The Authors):

      (1) Abstract: 'Strikingly, TIMM50 deficiency had no impact on the steady state levels of most of its substrates, challenging the currently accepted import dogma of the essential general import role of TIM23 and suggesting that fully functioning TIM23 complex is not essential for maintaining the steady state level of the majority of mitochondrial proteins'. This sentence needs to be rephrased. The data do not challenge any dogma! The authors only show that lower levels of functional TIM23 are sufficient.

      We have rewritten all the relevant sentences as suggested (details are also mentioned in response to reviewer 2 public review point 1)

      (2) Introduction: 'Surprisingly, functional and physiological analysis points to the possibility that TIMM50 and a fully functional TIM23 complex are not essential for maintaining steady-state levels of most presequence-containing proteins'. This again needs to be rephrased.

      Rewritten as suggested (details mentioned in response to reviewer 2 public review point 1)

      (3) Discussion: 'In summary, our results challenge the main dogma that TIMM50 is essential for maintaining the mitochondrial matrix and inner membrane proteome, as steady state level of most mitochondrial matrix and inner membrane proteins did not change in either patient fibroblasts or mouse neurons following a significant decrease in TIMM50 levels.' This again needs to be rephrased.

      Rewritten as suggested (details mentioned in response to reviewer 2 public review point 1)

      (4) The analysis of the proteomics experiment should be improved. The authors show in Figures 3 and 4 several times the same volcano plots in which different groups of proteins are indicated. It would be good to add (a) a principal component analysis to show that the replicates from the mutant samples are consistently different from the controls, (b) a correlation plot that compares the log-fold-change of P1 to that of P2 to show which of the proteins are consistently changed in P1 and P2 and (c) a GO term analysis to show in an unbiased way whether mitochondrial proteins are particular affected upon TIMM50 depletion.

      Figures 3 and 4 have been changed to avoid redundancy. Figure 3 now focuses on fibroblasts proteomics (with additional analysis), while Figure 4 focuses on neurons proteomics. PCA analysis was added in Fig S1, showing that the proteomics replicates of both patients (P1 and P2) are consistently different than the healthy control (HC) replicates. Correlation plots were added in Figure 3C and D, showing high correlation of the downregulated and upregulated mitochondrial proteins between P1 and P2. These plots further highlight that MIM proteins are more affected than matrix proteins and that the OXPHOS and MRP systems comprise the majority of significantly downregulated proteins in both patients. GO term analysis was performed for all the detected proteins that got significantly downregulated in both patients. The GO term analysis is displayed in Figure S3A, and shows that mitochondrial proteins, mainly of the OXPHOS and MRP machineries, are particularly affected.

      (5) Figure 1. The figure shows the levels of TIM and TOM subunits in two mutant samples. The quantifications suggest that the levels of TIMM21, TOMM40, and mtHsp60 are not affected. However, from the figure, it seems that there are increased levels of TIMM21 and reduced levels of TOMM40 and mtHsp60. Unfortunately, in the figure most of the signals are overexposed. Since this is a central element of the study, it would be good to load dilutions of the samples to make sure that the signals are indeed in the linear range and do scale with the amounts of samples loaded.

      The representative WB panels display the Actin loading control of the representative TIMM50 repeat (the top panel). However, each protein was tested separately, at least three times, and was normalized to its own Actin loading control.

      (6) Figure 2B. All panels are shown in color except the panel for TIMM17B which is grayscale. This should be changed to make them look equal.

      All the western blot panels were changed to grayscale.

      (7) Discussion: 'Despite being involved in the import of the majority of the mitochondrial proteome, no study thus far characterized the effects of TIMM50 deficiency on the entire mitochondrial proteome.' This sentence is not correct as proteomic data were published previously, for example for Trypanosomes (PMID: 34517757) and human cells (PMID: 38828998).

      We have corrected the statement to “Despite being involved in the import of the majority of the mitochondrial proteome, little is known about the effects of TIMM50 deficiency on the entire mitochondrial proteome.”

      (8) A recent study on a very similar topic was published by Diana Stojanovki's group that needs to be cited: PMID: 38828998. The results of this comprehensive study also need to be discussed!!!

      We have added the following in the discussion:

      Line 362 – “These observations are similar to the recent analysis of patient-derived fibroblasts which demonstrated that TIMM50 mutations lead to severe deficiency in the level of TIMM50 protein (6,7). Notably, this decrease in TIMM50 was accompanied with a decrease in the level of other two core subunits, TIMM23 and TIMM17. However, unexpectedly, proteomics analysis in our study and that conducted by Crameri et al., 2024 indicate that steady state levels of most TIM23-dependent proteins are not affected despite a drastic decrease in the levels of the TIM23CORE complex (7). The most affected proteins constitute of intricate complexes, such as OXPHOS and MRP machineries. Thus, both these studies indicate a surprising possibility that even reduced levels of the TIM23CORE components are sufficient for maintaining the steady state levels of most presequence containing substrates.

      (1) Homberg B, Rehling P, Cruz-Zaragoza LD. The multifaceted mitochondrial OXA insertase. Trends Cell Biol. 2023;33(9):765–72.

      (2) Carroll J, Altman MC, Fearnley IM, Walker JE. Identification of membrane proteins by tandem mass spectrometry of protein ions. Proc Natl Acad Sci U S A. 2007;104(36):14330–5.

      (3) Ting SY, Schilke BA, Hayashi M, Craig EA. Architecture of the TIM23 inner mitochondrial translocon and interactions with the matrix import motor. J Biol Chem [Internet]. 2014;289(41):28689–96. Available from: http://dx.doi.org/10.1074/jbc.M114.588152

      (4) Trefts E, Shaw RJ. AMPK: restoring metabolic homeostasis over space and time. Mol Cell [Internet]. 2021;81(18):3677–90. Available from: https://doi.org/10.1016/j.molcel.2021.08.015

      (5) Zhang S, Hulver MW, McMillan RP, Cline MA, Gilbert ER. The pivotal role of pyruvate dehydrogenase kinases in metabolic flexibility. Nutr Metab. 2014;11(1):1–9.

      (6) Reyes A, Melchionda L, Burlina A, Robinson AJ, Ghezzi D, Zeviani M.  Mutations in TIMM50 compromise cell survival in OxPhos‐dependent metabolic conditions . EMBO Mol Med. 2018;

      (7) Crameri JJ, Palmer CS, Stait T, Jackson TD, Lynch M, Sinclair A, et al. Reduced Protein Import via TIM23 SORT Drives Disease Pathology in TIMM50-Associated Mitochondrial Disease. Mol Cell Biol [Internet]. 2024;0(0):1–19. Available from: https://doi.org/10.1080/10985549.2024.2353652

    1. eLife Assessment

      This important study advances our understanding of how FGF13 variants confer seizure susceptibility. By acting in a set of inhibitory interneurons, FGF13 regulates synaptic transmission and excitability. The data presented here are convincing and combine cell type-specific knockouts and electrophysiology, complemented by histology/RNA studies. Collectively, this research will be of interest to a wide audience, particularly those involved in the study of epilepsy, inhibitory neurons, and ion channels.

    2. Reviewer #2 (Public review):

      Summary

      The authors address three primary questions:<br /> (1) how FGF13 variants confer seizure susceptibility,<br /> (2) the specific cell types involved, and<br /> (3) the underlying mechanisms, particularly regarding Nav dysfunction.

      They use different Cre drivers to generate cell type-specific knockouts (KOs). First, using Nestin-Cre to create a whole-brain Fgf13 KO, they observed spontaneous seizures and premature death. While KO of Fgf13 in excitatory neurons does not lead to spontaneous seizures, KO in inhibitory neurons recapitulates the seizures and premature death observed in the Nestin-Cre KO. They further narrow down the critical cell type to MGE-derived interneurons (INs), demonstrating that MGE-neuron-specific KO partially reproduces the observed phenotypes. "All interneuron" KOs exhibit deficits in synaptic transmission and interneuron excitability, not seen in excitatory neuron-specific KOs. Finally, they rescue the defects in the interneuron-specific KO by expressing specific Fgf13 isoforms. This is an elegant and important study adding to our knowledge of mechanisms that contribute to seizures.

      Strengths<br /> • The study provides much-needed cell type-specific KO models.<br /> • The authors use appropriate Cre lines and characterize the phenotypes of the different KOs.<br /> • The metabolomic analysis complements the rest of the data effectively.<br /> • The study confirms and extends previous research using improved approaches (KO lines vs. in vitro KD or antibody infusion).<br /> • The methods and analyses are robust and well-executed.

      Weaknesses

      • One weakness lies in the use of the Nkx2.1 line (instead of Nkx2.1CreER) in the paper. As a result, some answers to key questions are incomplete. For instance, it remains unclear whether the observed effects are due to Chandelier cells or NGFCs, potentially both MGE and CGE derived, explaining why Nkx2.1 alone does not fully replicate the overall inhibitory KO. Using Nkx2.1CreER could have helped address the cell specificity. With the Nkx2.1 line used in the paper, the answer is partial.<br /> • While the mechanism behind the reduced inhibitory drive in the IN-specific KO is suggested to be presynaptic, the chosen method does not allow them to exactly identify the mechanisms (spontaneous vs mEPSC/mIPSC), and whether it is a loss of inhibitory synapses (potentially axo-axonic) or release probability.

      General Assessment

      The general conclusions of this paper are supported by data. As it is, the claim that "these results enhance our understanding of the molecular mechanisms that drive the pathogenesis of Fgf13-related seizures" is partially supported. A more cautious term may be more appropriate, as the study shows the mechanism is not Nav-mediated and suggests alternative mechanisms without unambiguously identifying them. The conclusion that the findings "expand our understanding of FGF13 functions in different neuron subsets" is supported, although somewhat overstated, as the work is not conclusive about the exact neuron subtypes. However, it does indeed show differential functions for specific neuronal classes, which is a significant result.

      Impact and Utility

      This paper is undoubtedly valuable. Understanding that excitatory neurons are not the primary contributors to the observed phenotypes is crucial. The finding that the effects are not MGE-unique is also important. This work provides a solid foundation for further research and will be a useful resource for future studies.

    3. Reviewer #3 (Public review):

      Summary:

      The authors aimed to determine the mechanism by which seizures emerge in Developmental and Epileptic Encephalopathies caused by variants in the gene FGF13. Loss of FGF13 in excitatory neurons had no effect on seizure phenotype as compared to loss of FGF13 in GABAergic interneurons, which in contrast caused a dramatic proseizure phenotype and early death in these animals. They were able to show that Fgf13 ablation and consequent loss of FGF13-S and FGF13-VY reduced overall inhibitory input from Fgf13-expressing interneurons onto hippocampal pyramidal neurons. This was shown to occur not via disruption to voltage gated sodium channels but rather by reducing potassium currents and action potential repolarisation in these interneurons.

      Strengths:

      The authors employed multiple well validated, novel mouse lines with FGF13 knocked out in specific cell types including all neurons, all excitatory cells, all GABAergic interneurons, or a subset of MGE-derived interneurons, including axo-axonic chandelier cells. The phenotypes of each of these four mouse lines were carefully characterised to reveal clear differences with the most fundamental being that Interneuron-targeted deletion of FGF13 led to perinatal mortality associated with extensive seizures and impaired the hippocampal inhibitory/excitatory balance while deletion of FGF13 in excitatory neurons caused no detectable seizures and no survival deficits.<br /> The authors made excellent use of western blotting and in situ hybridisation of the different FGF13 isoforms to determine which isoforms are expressed in which cell types, with FGF3-S predominantly in excitatory neurons and FGF13-VY and FGF13-V predominantly in GABAergic neurons.

      The authors performed highly detailed electrophysiological analysis of excitatory neurons and GABAergic interneurons with FGF13 deficits using whole-cell patch clamp. This enabled them to show that FGF13 removal did not affect voltage-gated sodium channels in interneurons, but rather reduced the action of potassium channels, with the resultant effect of making it more likely that interneurons enter depolarisation block. These findings were strengthened by the demonstration that viral re-expression of different Fgf13 splice isoforms could partially rescue deficits in interneuron action potential output and restore K+ channel current size.

      Additionally, the discussion was nuanced, and demonstrated how the current findings resolved previous apparent contradictions in the field involving the function of FGF13.

      These findings will have a significant impact on our understanding of how FGF13 causes seizures and death in DEEs, and the action of different FGF13 isoforms within different neuronal cell types, particularly GABAergic interneurons.

      Comments on revisions:

      I appreciate the author's responses to the previous round of reviews. All my comments have been addressed. Congratulations on an excellent body of work.

    4. Author response:

      The following is the authors’ response to the original reviews.

      Public Reviews: 

      Reviewer #1 (Public Review): 

      Summary: 

      A subset of fibroblast growth factor (FGF) proteins (FGF11-FGF14; often referred to as fibroblast growth factor homologous factors because they are not thought to be secreted and do not seem to act as growth factors) have been implicated in modulating neuronal excitability, however, the exact mechanisms are unclear. In part, this is because it is unclear how different FGF isoforms alter ion channel activity in different neuronal populations. In this study, the authors explore the role of FGF 13 in epilepsy using a variety of FGF13 knock-out mouse models, including several targeted cell-type specific conditional knockout mouse lines. The study is intriguing as it indicates that FGF13 plays an especially important role in inhibitory neurons. Furthermore, although FGF13 has been studied as a regulator of neuronal voltage-gated sodium channels, the authors present data indicating that FGF13 knockout in inhibitory neurons induces seizures not by altering sodium current properties but by reducing voltage-gated potassium currents in inhibitory neurons. While intriguing, the data are incomplete in several aspects and thus the mechanisms by which various FGF13 variants induce Developmental and Epileptic Encephalopathies are not resolved by the data presented. 

      Strengths: 

      A major strength is the array of techniques used to assess the mice and the electrical activity of the neurons. 

      The multiple mouse knock-out models utilized are a strength, clearly demonstrating that FGF13 expression in inhibitory neurons, and possibly specific sub-populations of inhibitory neurons, is critically important. 

      The data on the increased sensitivity to febrile seizures in KO mice are very nice, provide clear evidence for regulation of excitability in inhibitory neurons by FGF13. 

      The Gad2Fgf13-KO mice indicated that several Fgf13 splice variants may be expressed in inhibitory neurons and suggest that the Fgf13-VY splice variants may have previously unrecognized specific roles in regulating neuronal excitability. 

      The data on males and females from the various KO mice lines indicates a clear gene dosage effect for this X-linked gene. 

      The unbiased metabolomic analysis supports the assertion that Fgf13 expression in inhibitory neurons is important in regulating seizure susceptibility. 

      Weaknesses: 

      The knockout approach can be powerful but also has distinct limitations. Multiple missense mutations in FGF13-S have been identified. The knockout models employed here are not appropriate for understanding how these missense variants lead to altered neuronal excitability. While the data show that complete loss of Fgf13 from excitatory forebrain neurons is not sufficient to induce seizure susceptibility, it does not rule out that specific variants (e.g., R11C) might alter the excitability of forebrain neurons. The missense variants may alter excitatory and/or inhibitory neuron excitability in distinct ways from a full FGF13 knockout. 

      We agree with this overall interpretation of our data and have updated our language in the Discussion to make the distinction between mechanisms attributable to a knockout compared to a missense variant. We note, however, that the proposed mechanism by which missense variants (e.g., R11C) drive seizures is through loss of long-term inactivation in excitatory neurons and our excitatory knockout model shows loss of long-term inactivation in excitatory neurons. Thus, our knockout model demonstrates that the mechanism(s) by which the missense variants alter neuronal excitability in excitatory neurons must exclude long-term inactivation, thereby providing some clarity regarding the proposed mechanism for those missense variants.

      The electrophysiological experiments are intriguing but not comprehensive enough to support all of the conclusions regarding how FGF13 modulates neuronal excitability. 

      We agree and have updated the language in our Discussion to clarify speculation from conclusions that are directly supported by data.

      Another concern is the use of different ages of neurons for different experiments. For example, sodium currents in Figures 2 and 5 (and Supplemental Figures 2 and 7) are recorded from cultured neurons, which may have very different properties (including changes in sodium channel complexes) from neurons in vivo that drive the development of seizure activity. 

      We agree and acknowledge the important differences between neurons examined in culture and in vivo, yet the in vitro vs in vivo preparations were necessitated by the specific experiments. While these differences are important, previous gene profiling studies comparing primary hippocampal neurons with developing mouse hippocampus have found that although gene expression is accelerated in vitro, gene expression profiles in vitro and in vivo are similar (PMID: 11438693). Moreover, the relative immaturity of the cultured neurons is balanced at least in part because the in vivo experiments were performed on very young animals (~P12), which also have relatively immature neurons. Thus, we predict that sodium channel complexes studied in vitro are informative for the in vivo aspects of this investigation.

      Reviewer #2 (Public Review): 

      Summary: 

      The authors address three primary questions: 

      (1) how FGF13 variants confer seizure susceptibility, 

      (2) the specific cell types involved, and 

      (3) the underlying mechanisms, particularly regarding Nav dysfunction. 

      They use different Cre drivers to generate cell type-specific knockouts (KOs). First, using Nestin-Cre to create a whole-brain Fgf13 KO, they observed spontaneous seizures and premature death. While KO of Fgf13 in excitatory neurons does not lead to spontaneous seizures, KO in inhibitory neurons recapitulates the seizures and premature death observed in the Nestin-Cre KO. They further narrow down the critical cell type to MGE-derived interneurons (INs), demonstrating that MGE-neuron-specific KO partially reproduces the observed phenotypes. "All interneuron" KOs exhibit deficits in synaptic transmission and interneuron excitability, not seen in excitatory neuron-specific KOs. Finally, they rescue the defects in the interneuron-specific KO by expressing specific Fgf13 isoforms. This is an elegant and important study adding to our knowledge of mechanisms that contribute to seizures. 

      Strengths 

      • The study provides much-needed cell type-specific KO models. 

      • The authors use appropriate Cre lines and characterize the phenotypes of the different KOs. 

      • The metabolomic analysis complements the rest of the data effectively. 

      • The study confirms and extends previous research using improved approaches (KO lines vs. in vitro KD or antibody infusion). 

      • The methods and analyses are robust and well-executed. 

      Weaknesses 

      • One weakness lies in the use of the Nkx2.1 line (instead of Nkx2.1CreER) in the paper. As a result, some answers to key questions are incomplete. For instance, it remains unclear whether the observed effects are due to Chandelier cells or NGFCs, potentially both MGE and CGE derived, explaining why Nkx2.1 alone does not fully replicate the overall inhibitory KO. Using Nkx2.1CreER could have helped address the cell specificity. With the Nkx2.1 line used in the paper, the answer is partial. 

      We agree that while our data is consistent with the possibility of a role for Fgf13 in chandelier function, the current Cre driver does not provide sufficient direct evidence. We performed preliminary experiments (unpublished) using a Nkx2.1CreER driver, with late embryonic induction with a tamoxifen dosage validated for sparse labeling of chandelier cells (30846310). While we successfully replicated sparse labeling of neocortical chandelier cells (using a Cre-dependent Ai9 reporter), we were unable to determine if there was a significant loss of FGF13 as measured by immunohistochemistry since FGF13+ cells are only a small subset of the already sparse cells. Because multiple snRNA-seq studies identified Fgf13 as a marker for chandelier cells, we speculated—now more carefully circumspect—about the role of chandelier cells vs NGFCs.

      • While the mechanism behind the reduced inhibitory drive in the IN-specific KO is suggested to be presynaptic, the chosen method does not allow them to exactly identify the mechanisms (spontaneous vs mEPSC/mIPSC), and whether it is a loss of inhibitory synapses (potentially axo-axonic) or release probability. 

      We agree that this is an important limitation of our work, and that we are unable to identify the exact mechanism behind the reduced inhibitory drive. We are continuing to explore this question in a follow-up study.

      • Some supporting data (e.g. Supplemental Figure 7 and 8) appear to come from only one (or two) WT and one (or two) KO mice. Supplementary data, like main data, should come from at least three mice in total to be considered complete/solid (even if the statistical analysis is done with cells). 

      All panels in the manuscript, including supplementary data, except supplementary 7D and 8A, have N(mouse)≥3. Time limitations (graduating student) prevented us from obtaining a larger N. Because those supplementary data are not critical for supporting our conclusions, we removed them.

      General Assessment 

      The general conclusions of this paper are supported by data. As it is, the claim that "these results enhance our understanding of the molecular mechanisms that drive the pathogenesis of Fgf13-related seizures" is partially supported. A more cautious term may be more appropriate, as the study shows the mechanism is not Nav-mediated and suggests alternative mechanisms without unambiguously identifying them. The conclusion that the findings "expand our understanding of FGF13 functions in different neuron subsets" is supported, although somewhat overstated, as the work is not conclusive about the exact neuron subtypes. However, it does indeed show differential functions for specific neuronal classes, which is a significant result. 

      Impact and Utility 

      This paper is undoubtedly valuable. Understanding that excitatory neurons are not the primary contributors to the observed phenotypes is crucial. The finding that the effects are not MGE-unique is also important. This work provides a solid foundation for further research and will be a useful resource for future studies. 

      Reviewer #3 (Public Review): 

      Summary: 

      The authors aimed to determine the mechanism by which seizures emerge in Developmental and Epileptic Encephalopathies caused by variants in the gene FGF13. Loss of FGF13 in excitatory neurons had no effect on seizure phenotype as compared to the loss of FGF13 in GABAergic interneurons, which in contrast caused a dramatic proseizure phenotype and early death in these animals. They were able to show that Fgf13 ablation and consequent loss of FGF13-S and FGF13-VY reduced overall inhibitory input from Fgf13-expressing interneurons onto hippocampal pyramidal neurons. This was shown to occur not via disruption to voltage-gated sodium channels but rather by reducing potassium currents and action potential repolarisation in these interneurons. 

      Strengths: 

      The authors employed multiple well-validated, novel mouse lines with FGF13 knocked out in specific cell types including all neurons, all excitatory cells, all GABAergic interneurons, or a subset of MGE-derived interneurons, including axo-axonic chandelier cells. The phenotypes of each of these four mouse lines were carefully characterised to reveal clear differences with the most fundamental being that Interneuron-targeted deletion of FGF13 led to perinatal mortality associated with extensive seizures and impaired the hippocampal inhibitory/excitatory balance while deletion of FGF13 in excitatory neurons caused no detectable seizures and no survival deficits. 

      The authors made excellent use of western blotting and in situ hybridisation of the different FGF13 isoforms to determine which isoforms are expressed in which cell types, with FGF3-S predominantly in excitatory neurons and FGF13-VY and FGF13-V predominantly in GABAergic neurons. 

      The authors performed a highly detailed electrophysiological analysis of excitatory neurons and GABAergic interneurons with FGF13 deficits using whole-cell patch clamp. This enabled them to show that FGF13 removal did not affect voltage-gated sodium channels in interneurons, but rather reduced the action of potassium channels, with the resultant effect of making it more likely that interneurons enter depolarisation block. These findings were strengthened by the demonstration that viral re-expression of different Fgf13 splice isoforms could partially rescue deficits in interneuron action potential output and restore K+ channel current size. 

      Additionally, the discussion was nuanced and demonstrated how the current findings resolved previous apparent contradictions in the field involving the function of FGF13. 

      These findings will have a significant impact on our understanding of how FGF13 causes seizures and death in DEEs, and the action of different FGF13 isoforms within different neuronal cell types, particularly GABAergic interneurons. 

      Recommendations for the authors:

      Reviewer #1 (Recommendations For The Authors): 

      The limitations of the KO model should be fully discussed in the discussion. It should be clear that knocking out FGF13 does not provide insight into how missense mutations such as R11C may alter excitatory and/or inhibitory neuron excitability. 

      We agree with this overall interpretation of our data and have updated our language in the Discussion to make the distinction between mechanisms attributable to a knockout compared to a missense variant. We note, however, that the proposed mechanism by which missense variants (e.g., R11C) drive seizures is through loss of long-term inactivation in excitatory neurons and our excitatory knockout model shows loss of long-term inactivation in excitatory neurons. Thus, our knockout model demonstrates that the mechanism(s) by which the missense variants alter neuronal excitability in excitatory neurons must exclude long-term inactivation, thereby providing some clarity regarding the proposed mechanism for those missense variants.

      It is important to know what sodium channel isoforms are expressed in the cultured neurons used in the experiments for Figures 2 and 5. Are Nav1.1, Nav1.2, Nav1.3, and Nav1.6 expressed at appropriate levels in the cultures? 

      We agree it is important to know that the sodium channel isoforms expressed in our hippocampal neurons are expressed at physiologically relevant levels, for further validation of our primary culture system. We have added RT-qPCR data from our hippocampal neuron cultures (Supplemental Figure 2B) showing the relative levels of SCN1A, SCN2A, SCN3A, and SCN8A, which are similar to the relative levels of voltage-gated sodium channel isoforms found in rodent and human forebrain in early development (Figure 1 in PMID: 35031483).

      The electrophysiological experiments are intriguing but limited. One, it would be helpful to report if there were any changes in resting membrane potential for the cells reported in Figure 5. It is also inappropriate to unequivocally state that "Nav currents were not significantly affected by Fgf13 knockout in Gad2Fghf13 KO neurons" as only a sampling of properties was investigated. Recovery from inactivation and persistent current amplitudes were not evaluated. Furthermore, while it looks like long-term inactivation is not altered, only one specific protocol was used and currents measured from cultured neurons may not be fully representative of neuronal properties in vivo. 

      We agree that we performed a selective analysis of Nav currents—selected because those are the major parameters that have been associated with FGF13 modulation. Because we did not observe significant differences in NaV currents, we therefore hypothesized that FGF13 affected other currents, as previously observed, and consequently assessed potassium currents, for which we did observe a difference. Further, we note that our sodium current and potassium current results are consistent with, and supportive of, our action potential data in which we find no deficit in AP initiation, but rather a deficit in AP repolarization. We revised the text to reflect the more limited analysis of Nav currents. Regarding long-term inactivation, we also agree that measurements in cultured neurons may not fully represent neuronal properties in vivo; however, we note that regulation of long-term inactivation by FGF13 has previously been assessed only in cultured cells (and not in neurons). Thus, our protocols were designed to query that modulation previously reported.

      The first sentence of the results section is misleading: "To determine how FGF13 variants contribute to seizure disorders, we developed genetic mouse models that eliminate Fgf13 in specific neuronal cell types." The knockouts do not target specific splice isoforms and do not help determine how missense variants contribute to DEE. This should be modified to reflect better what is actually being tested. 

      We agree and have revised our text to state that our goal was to assess how FGF13 contributes to neuronal excitability and thereby accurately reflect the cell type-specific, but not isoform specific, targeting.

      Reviewer #2 (Recommendations For The Authors): 

      • The sentence in the introduction stating "an unusual example of differential expression of an alternatively spliced neuronal gene in excitatory vs. inhibitor neurons" is factually incorrect, especially for transcripts regulating intrinsic properties like FGF13. Refer to PMID: 31451803 for more details and consider rephrasing this statement. 

      We updated our text to reflect the similarity of Fgf13’s cell type-specific alternative splicing to other genes known to control synaptic interactions and neuronal architecture and added the suggested reference.

      • Consistency is needed in the manuscript regarding the term "BASEscope" or "basescope"; the correct version is "BaseScope." 

      We corrected the text accordingly.

      • In the discussion, the term "reduced overall inhibitory drive" might be more appropriate than "input." 

      We updated the text accordingly.

      • The authors should refer to the Fgf13 data in the database from Furlanis et al., which complements their findings: https://scheiffele-splice.scicore.unibas.ch/

      We agree and now incorporate this reference.

      • The phrase "Fgf13 silencing in Nkx2.1 expressing neurons" should be clarified to include the use of CreER, which was crucial and effectively resulted in the labeling of a different subtype of interneurons, see PMID: 23180771. 

      We agree and have updated our text accordingly.

      • Be more cautious when discussing the role of FGF13 in chandelier function; while it seems probable, the current Cre driver used provides no direct evidence. 

      We agree (as noted above) that while our data are consistent with the possibility of a role for Fgf13 in chandelier function, the current Cre driver used is insufficient to offer direct evidence and therefore updated our text in the discussion.

      • The gene dosage effect is interesting, it would be interesting to explore it further in the future. 

      We agree. Because our data suggest that seizures result from loss of inhibitory neuron input, we hypothesize that the gene dosage effect derives from further loss of inhibitory neuron input and thus more hyperexcitability.

      • Another critical aspect not addressed here and of interest for the future is the distinction between the role of FGF13 in interneuron development versus general maintenance. Using Nkx2.1CreER could have helped address both cell specificity and developmental roles. 

      We agree that there may be an interesting distinction between the role of Fgf13 in development versus general maintenance. We have piloted an Nkx2.1-CreER targeted deletion of Fgf13 from cortical interneurons but have been unsuccessful with significant deletion of Fgf13, likely because the Nkx2.1-CreER strategy targets only a sparse subset of interneurons and FGF13 is expressed in only a subset of total interneurons. Thus, use of the Nkxs.1-CreER strategy is challenging. We are looking for ways to optimize.

      Reviewer #3 (Recommendations For The Authors): 

      This was a truly fabulous paper, with an exceptional quantity of beautiful data. I would like to congratulate the authors on their superb work. 

      In the discussion, the authors correctly draw attention to the fact that the clear pro-seizure phenotype they see when FGF13 was knocked out more specifically in a subset of interneurons including chandelier cells, adds to our understanding of the role of FGF13 in chandelier cells. More than that though, given that FGF13 is reducing excitability in these cells AND this results in a strong pro-seizure phenotype, they may want to postulate that this lends further weight to the argument that chandeliers cells are likely powerful regulators of network excitability despite suggestions in the field that they could potentially have a proexcitatory function (see Szabadics et al. Science 2006). 

      We agree this is interesting and have elaborated on our discussion of chandelier cells to include this point while also addressing the important caveats noted by reviewer 2.

      A minor point: 

      On page 26 the sentence: 

      "Here, we were able to assess FGF13-S and FGF13-VY, chosen because they are most abundantly expressed isoforms in the adult mouse brain, but the inability to rescue electrophysiological consequences completely with either isoform alone leaves open the possibility that other isoforms (e.g., FGF13-U, FGF13-V, and FGF13-VY) also make critical contributions." Should the last "FGF13-VY" be removed? 

      We thank the reviewer for noticing the error and have updated the text accordingly.

    1. eLife Assessment

      This useful study reports how neuronal activity in the prefrontal cortex maps time intervals during which animals wait to reach a reward, with this mapping remaining consistent across days. While most claims are supported by solid evidence, the study could have benefitted from an improved experimental design to more clearly disambiguate correlations between neuronal patterns and not only time but also stereotypical behaviors and restraint from impulsive decisions. This study will be of particular interest to neuroscientists focused on decision-making and motor control.

    2. Reviewer #1 (Public review):

      Summary:

      This paper investigates the neural population activity patterns of the medial frontal cortex in rats performing a nose poking timing task using in vivo calcium imaging. The results showed neurons that were active at the beginning and end of the nose poking and neurons that formed sequential patterns of activation that covaried with the timed interval during nose poking on a trial-by-trial basis. The former were not stable across sessions, while the latter tended to remain stable over weeks. The analysis of incorrect trials suggests the shorter non-rewarded intervals were due to errors in the scaling of the sequential pattern of activity.

      Strengths:

      This study measured stable signals using in vivo calcium imaging during experimental sessions that were separated by many days in animals performing a nose poking timing task. The correlation analysis on the activation profile to separate the cells in the three groups was effective and the functional dissociation between beginning and end, and duration cells was revealing. The analysis on the stability of decoding of both the nose poking state and poking time was very informative. Hence, this study dissected a neural population that formed sequential patterns of activation that encoded timed intervals.

      Weaknesses:

      It is not clear whether animals had enough simultaneously recorded cells to perform the analyzes of Figures 2-4. In fact, rat 3 had 18 responsive neurons which probably is not enough to get robust neural sequences for the trial-by-trial analysis and the correct and incorrect trial analysis. In addition, the analysis of behavioral errors could be improved. The analysis in Figure 4A could be replaced by a detailed analysis on the speed, and the geometry of neural population trajectories for correct and incorrect trials. In the case of Figure 4G is not clear why the density of errors formed two clusters instead of having a linear relation with the produce duration. I would be recommendable to compute the scaling factor on neuronal population trajectories and single cell activity or the computation of the center of mass to test the type III errors.

      Due to the slow time resolution of calcium imaging, it is difficult to perform robust analysis on ramping activity. Therefore, I recommend downplaying the conclusion that: "Together, our data suggest that sequential activity might be a more relevant coding regime than the ramping activity in representing time under physiological conditions."

      Comments on revisions:

      The authors responded properly to my initial comments. However, I have three additional recommendations for the reviewed manuscript.

      First, the paper urgently needs proofreading by a professional English editor. Second, Figure 4 must be divided in 2, it has too many panels and the resolution of the figure is low. Finally, please consider that what is called scaling factor in Figure 4G should be called something like neural sequence position index. A scaling factor in the timing literature implies that the pattern of activation of a cell contracts or expands according to the timed interval.

    3. Reviewer #2 (Public review):

      In this manuscript, Li and collaborators set out to investigate the neuronal mechanisms underlying "subjective time estimation" in rats. For this purpose, they conducted calcium imaging in the prefrontal cortex of water-restricted rats that were required to perform an action (nose-poking) for a short duration to obtain drops of water. The authors provided evidence that animals progressively improved in performing their task. They subsequently analyzed the calcium imaging activity of neurons and identify start, duration, and stop cells associated with the nose poke. Specifically, they focused on duration cells and demonstrated that these cells served as a good proxy for timing on a trial-by-trial basis, scaling their pattern of actvity in accordance with changes in behavioral performance. In summary, as stated in the title, the authors claim to provide mechanistic insights into subjective time estimation in rats, a function they deem important for various cognitive conditions.

      This study aligns with a wide range of studies in system neuroscience that presume that rodents solve timing tasks through an explicit internal estimation of duration, underpinned by neuronal representations of time. Within this framework, the authors performed complex and challenging experiments, along with advanced data analysis, which undoubtedly merits acknowledgement. However, the question of time perception is a challenging one, and caution should be exercised when applying abstract ideas derived from human cognition to animals. Studying so-called time perception in rats has significant shortcomings because, whether acknowledged or not, rats do not passively estimate time in their heads. They are constantly in motion. Moreover, rats do not perform the task for the sake of estimating time but to obtain their rewards are they water restricted. Their behavior will therefore reflect their motivation and urgency to obtain rewards. Unfortunately, it appears that the authors are not aware of these shortcomings. These alternative processes (motivation, sensorimotor dynamics) that occur during task performance are likely to influence neuronal activity. Consequently, my review will be rather critical. It is not however intended to be dismissive. I acknowledge that the authors may have been influenced by numerous published studies that already draw similar conclusions. Unfortunately, all the data presented in this study can be explained without invoking the concept of time estimation. Therefore, I hope the authors will find my comments constructive and understand that as scientists, we cannot ignore alternative interpretations, even if they conflict with our a priori philosophical stance (e.g., duration can be explicitly estimated by reading neuronal representation of time) and anthropomorphic assumptions (e.g., rats estimate time as humans do). While space is limited in a review, if the authors are interested, they can refer to a lengthy review I recently published on this topic, which demonstrates that my criticism is supported by a wide range of timing experiments across species (Robbe, 2023). In addition to this major conceptual issue that casts doubt on most of the conclusions of the study, there are also several major statistical issues.

      Main Concerns

      (1) The authors used a task in which rats must poke for a minimal amount of time (300 ms and then 1500 ms) to be able to obtain a drop of water delivered a few centimeters right below the nosepoke. They claim that their task is a time estimation task. However, they forget that they work with thirsty rats that are eager to get water sooner than later (there is a reason why they start by a short duration!). This task is mainly probing the animals ability to wait (that is impulse control) rather than time estimation per se. Second, the task does not require to estimate precise time because there appear to be no penalties when the nosepokes are too short or when they exceed. So it will be unclear if the variation in nosepoke reflects motivational changes rather than time estimation changes. The fact that this behavioral task is a poor assay for time estimation and rather reflects impulse control is shown by the tendency of animals to perform nose-pokes that are too short, the very slow improvement in their performance (Figure 1, with most of the mice making short responses), and the huge variability. Not only do the behavioral data not support the claim of the authors in terms of what the animals are actually doing (estimating time), but this also completely annihilates the interpretation of the Ca++ imaging data, which can be explained by motivational factors (changes in neuronal activity occurring while the animals nose poke may reflect a growing sens of urgency to check if water is available).

      (2) A second issue is that the authors seem to assume that rats are perfectly immobile and perform like some kind of robots that would initiate nose pokes, maintain them, and remove them in a very discretized manner. However, in this kind of task, rats are constantly moving from the reward magazine to the nose poke. They also move while nose-poking (either their body or their mouth), and when they come out of the nose poke, they immediately move toward the reward spout. Thus, there is a continuous stream of movements, including fidgeting, that will covary with timing. Numerous studies have shown that sensorimotor dynamics influence neural activity, even in the prefrontal cortex. Therefore, the authors cannot rule out that what the records reflect are movements (and the scaling of movement) rather than underlying processes of time estimation (some kind of timer). Concretely, start cells could represent the ending of the movement going from the water spout to the nosepoke, and end cells could be neurons that initiate (if one can really isolate any initiation, which I doubt) the movement from the nosepoke to the water spout. Duration cells could reflect fidgeting or orofacial movements combined with an increasing urgency to leave the nose pokes.

      (3) The statistics should be rethought for both the behavioral and neuronal data. They should be conducted separately for all the rats, as there is likely interindividual variability in the impulsivity of the animals.

      (4) The fact that neuronal activity reflects an integration of movement and motivational factors rather than some abstract timing appears to be well compatible with the analysis conducted on the error trials (Figure 4), considering that the sensorimotor and motivational dynamics will rescale with the durations of the nose poke.

      (5) The authors should mention upfront in the main text (result section) the temporal resolution allowed by their Ca+ probe and discuss whether it is fast enough in regard of behavioral dynamics occurring in the task.

      Comments on the revised version

      I have read the revised version of the manuscript and the rebuttal letter. My major concern was that the task used is not a time estimation task but primarily taps into impulse control and that animals are not immobile during the nose-poking epoch. I provided factual evidence for this (the animal's timing performance is poor and, on average, animals struggle to wait long enough), and I pointed to a review that discusses the results of many studies congruent with the importance of movement/motivation, not only in constraining the timing of reward-oriented actions during so-called time estimation tasks but also in powerfully modulating neuronal activity.

      The authors' responses to my comments are puzzling and unconvincing. First, on the one hand, they acknowledge in their rebuttal letter the difficulty of demonstrating a neuronal representation of explicit internal estimation of time. Then, they seem to imply that this issue is beyond the scope of their study and focus in the rebuttal on whether the neuronal activity they report shows signs of being sensitive to movement and motivation, which they claim is independent of movement and motivation. This leads the authors to make no major changes in their manuscript. Their title, abstract, introduction, and discussion are largely unchanged and do not reflect the possibility that there are major confounding factors in so-called time estimation (rodents are not disembodied passive information processors) that may well explain some of the neuronal patterns. Evidently, the dismissive treatment by the authors is not satisfying. I will briefly restate my comments and reply to their responses and their new figure, which not only is unconvincing but raises new questions.

      My comments were primarily focused on the behavioral task. The authors replied: "Studying the neural representation of any internal state may suffer from the same ambiguity [by ambiguity they meant that it is difficult to know if animals are explicitly estimating time]. With all due respect, however, we would like to limit our response to the scope of our results. According to the reviewer, two alternative interpretations of the task-related sequential activity exist." The authors imply that my comments are beyond the scope of their study. That is not true. My comments were targeted at the behavior of the animals, behavior they rely on to title their study: "Stable sequential dynamics in prefrontal cortex represents a subjective estimation of time." When I question whether the task and behavioral data presented are congruent with "subjective estimation of time," my comments are not beyond the scope of the study-they directly tackle the main point of the authors. Other researchers will read the title and abstract of this manuscript and conclude: "Here is a paper that provides evidence of a mechanism for animals estimating duration internally (because subjective time perception is assumed to be different from using clocks)." Still, there is a large body of literature showing that the behavior of animals in such tasks can be entirely explained without invoking subjective time perception and internal representation. How can the authors acknowledge that they can't be sure that mice are estimating time and then have such an affirmative title and abstract?

      In my opinion, science is not just about forcing ideas (often reflecting philosophical preconceptions) on data and dismissing those who disagree. It is about discussing alternative possibilities fairly and being humble. In their revised version, I see no effort by the authors to investigate the importance of movement and motivation during their task or seriously engage with this idea. It's much easier to dismiss my comments as being beyond the scope of their results. According to the authors, it seems that movements and motivations play no role in the task. Still, the animals are water-restricted, and during the task, they will display decreased motivation (due to increased satiety), and their history of rewarded vs. non-rewarded trials will affect their behavior. This is one of the most robust effects seen across all behavioral studies. Moreover, the animals are constantly moving. Maybe the authors used a special breed of mice that behave like some kind of robots? I acknowledge that this is not easy to investigate, but if the authors did not use high-quality video recording or an experimental paradigm that allows disentangling motivational confounds, then they should refrain from using big words such as subjective time estimation and discuss alternative representations by acknowledging the studies that do find that movement and motivation are present during reward-based timing tasks and do in fact modulate neuronal activity, even in associative brain regions.

      To sustain their claim that what they reported is movement-independent, the authors provided a supplementary figure in which they correlated neuronal activity and head movement tracked using DeepLabCut. I have to say that I was particularly surprised by this figure. First, in the original manuscript, there was absolutely no mention of video recording. Now it appears in the methods section, but the description is very short. There is no information on how these video recordings were made. The quality of the images provided in Figure S2 is far from reassuring. It is unclear whether the temporal and spatial resolution would be good enough to make meaningful correlations. Fast head/orofacial movements that occur during nose-poking can be on the order of 20 Hz. To be tracked, this would require at least a 40 Hz sampling rate. But no sampling information is provided. The authors should explain how they synchronized behavioral and neuronal data acquisition. Could the authors share behavioral videos of the 5 sessions shown in Figure S2 so we can judge the behavior of the animals, the quality of the video, and the possibility of making correlations?

      Figure S2A-F: I am not sure why the authors correlated nose-poking duration (time estimation) and the duration between upper and lower nose-pokes (reward-oriented movement). It is not relevant to the issue I raised. Without any information about video acquisition frame rate, the y-axis legend (frame) is not very informative. Still, in Figure S2A-F, Rat 5 shows a clear increase in nose-poke duration, which is congruent with decreased impulsivity. Is the time coding different in this rat compared to other rats? There are some similar trends in other animals (Rat 1 and maybe Rat 3), but what is surprising is the huge variability (big downward deflections in the nose-poke duration). I would not be surprised if those deflections occurred after a long pause in activity. Could the authors plot trial time instead of trial number? How do the authors explain such a huge deflection if the animals are estimating time?

      Regarding Figure S2H: I don't see how it addresses my concern. My concern is that some of the Ca activity recorded during nose-poking reflects head movements. The authors need to show if they can detect head movement during nose-poking. Aligning the Ca data relative to head movement should give the same result as when aligning the data relative to the time at which the animals pull out of the upper nose-poke.

      Minor comments:

      In their introduction, the authors wrote: "While these findings [correlates of time perception] provide strong evidence for a neural mechanism of time coding in the brain, true causal evidence at single-cell resolution remains beyond reach due to technical limitations. Although inhibiting certain brain regions (such as medial prefrontal cortex, mPFC,22) led to disruption in the performance of the timing task, it is difficult to attribute the effect specifically to the ramping or sequential activity patterns seen in those regions as other processes may be involved. Lacking direct experimental evidence, one potential way of testing the causal involvement of 'time codes' in time estimation function is to examine their correlation at a finer resolution."<br /> This statement is inaccurate at two levels. First, very good causal evidence has been obtained on this topic (see Monteiro et al., 2023, Nature Neuroscience), and see my News & Views on the strengths and weaknesses of this paper. Second, their proposal is inaccurate. Looking at a finer correlation will still be a correlative approach, and the authors will not be able to disentangle motor/motivation confounds.

    4. Author response:

      The following is the authors’ response to the original reviews.

      eLife Assessment 

      This useful study reports how neuronal activity in the prefrontal cortex maps time intervals during which animals have to wait until reaching a reward and how this mapping is preserved across days. However, the evidence supporting the claims is incomplete as these sequential neuronal patterns do not necessarily represent time but instead may be correlated with stereotypical behavior and restraint from impulsive decision, which would require further controls (e.g. behavioral analysis) to clarify the main message. The study will be of interest to neuroscientists interested in decision making and motor control.

      We thank the editors and reviewers for the constructive comments. In light of the questions mentioned by the reviewers, we have performed additional analyses in our revision, particularly aiming to address issues related to single-cell scalability, and effects of motivation and movement. We believe these additional data will greatly improve the rigor and clarity of our study. We are grateful for the review process of eLife.

      Public Reviews:

      Reviewer #1 (Public Review): 

      Summary:

      This paper investigates the neural population activity patterns of the medial frontal cortex in rats performing a nose poking timing task using in vivo calcium imaging. The results showed neurons that were active at the beginning and end of the nose poking and neurons that formed sequential patterns of activation that covaried with the timed interval during nose poking on a trial-by-trial basis. The former were not stable across sessions, while the latter tended to remain stable over weeks. The analysis on incorrect trials suggests the shorter non-rewarded intervals were due to errors in the scaling of the sequential pattern of activity.

      Strengths:

      This study measured stable signals using in vivo calcium imaging during experimental sessions that were separated by many days in animals performing a nose poking timing task. The correlation analysis on the activation profile to separate the cells in the three groups was effective and the functional dissociation between beginning and end, and duration cells was revealing. The analysis on the stability of decoding of both the nose poking state and poking time was very informative. Hence, this study dissected a neural population that formed sequential patterns of activation that encoded timed intervals. 

      We thank the reviewer for the positive comments.

      Weaknesses:

      It is not clear whether animals had enough simultaneously recorded cells to perform the analyzes of Figures 2-4. In fact, rat 3 had 18 responsive neurons which probably is not enough to get robust neural sequences for the trial-by-trial analysis and the correct and incorrect trial analysis. 

      We thank the reviewer for the comment. Our imaging data generally yielded 50-150 cells in each session. The 18 neurons mentioned by the reviewer are from the duration cell category. We have now provided the number of imaged cells from each rat in the new Supplementary figure 1D. In addition, we have plotted the duration cells’ sequential activity of individual trials for each rat in new Supplementary figure 1B and 1C. These data demonstrate robust sequential activities from the duration cells.

      In addition, the analysis of behavioral errors could be improved. The analysis in Figure 4A could be replaced by a detailed analysis on the speed, and the geometry of neural population trajectories for correct and incorrect trials.

      We thank the reviewer for the suggestions. We have now performed analyses of the neural population trajectories as the reviewer suggested. We have calculated the neural population trajectories using the first two principal components of the neural activities during nose poke events. While both correct and incorrect trials show similar shapes of the trajectories, correct trials show more expanded paths, with longer lengths on average. These new results are now updated in Figure 4. Since type I or type II errors would likely generate trajectories not following the general direction which is different from our observations, these results are consistent with our conclusion that scaling errors contribute to the incorrect behavior timing in these rats.

      In the case of Figure 4G is not clear why the density of errors formed two clusters instead of having a linear relation with the produce duration. I would be recommendable to compute the scaling factor on neuronal population trajectories and single cell activity or the computation of the center of mass to test the type III errors. 

      To clarify the original Figure 4G, the correct trials tended to show positive time estimation errors while the incorrect trials showed negative time estimation errors. We believe that the polarity switch between these two types suggests a possible use of this neural mechanism to time the action of the rats.

      In addition, we have performed the analysis suggested by the reviewer in our revision. We calculated two types of scaling factors. On individual cell level, we computed the peak position of individual trials to the expected positions from averaged template. And on neural population level, we searched for a scaling multiplier to resample the calcium activity data and minimized the differences between scaled activity and the expected template. Using these two factors, we found that correct trials show significantly larger scaling compared to incorrect trials, consistent with our original interpretation that behavior errors are primarily correlated with scaling errors in the neural activities (type III error). These new results are now incorporated in Figure 4 and we have also updated the main text for the descriptions.

      Due to the slow time resolution of calcium imaging, it is difficult to perform robust analysis on ramping activity. Therefore, I recommend downplaying the conclusion that: "Together, our data suggest that sequential activity might be a more relevant coding regime than the ramping activity in representing time under physiological conditions." 

      We agree with the reviewer, and have now modified this sentence in the abstract.

      Reviewer #2 (Public Review):

      In this manuscript, Li and collaborators set out to investigate the neuronal mechanisms underlying "subjective time estimation" in rats. For this purpose, they conducted calcium imaging in the prefrontal cortex of water-restricted rats that were required to perform an action (nosepoking) for a short duration to obtain drops of water. The authors provided evidence that animals progressively improved in performing their task. They subsequently analyzed the calcium imaging activity of neurons and identify start, duration, and stop cells associated with the nose poke. Specifically, they focused on duration cells and demonstrated that these cells served as a good proxy for timing on a trial-by-trial basis, scaling their pattern of actvity in accordance with changes in behavioral performance. In summary, as stated in the title, the authors claim to provide mechanistic insights into subjective time estimation in rats, a function they deem important for various cognitive conditions.

      This study aligns with a wide range of studies in system neuroscience that presume that rodents solve timing tasks through an explicit internal estimation of duration, underpinned by neuronal representations of time. Within this framework, the authors performed complex and challenging experiments, along with advanced data analysis, which undoubtedly merits acknowledgement. However, the question of time perception is a challenging one, and caution should be exercised when applying abstract ideas derived from human cognition to animals. Studying so-called time perception in rats has significant shortcomings because, whether acknowledged or not, rats do not passively estimate time in their heads. They are constantly in motion. Moreover, rats do not perform the task for the sake of estimating time but to obtain their rewards are they water restricted. Their behavior will therefore reflects their motivation and urgency to obtain rewards. Unfortunately, it appears that the authors are not aware of these shortcomings. These alternative processes (motivation, sensorimotor dynamics) that occur during task performance are likely to influence neuronal activity. Consequently, my review will be rather critical. It is not however intended to be dismissive. I acknowledge that the authors may have been influenced by numerous published studies that already draw similar conclusions. Unfortunately, all the data presented in this study can be explained without invoking the concept of time estimation. Therefore, I hope the authors will find my comments constructive and understand that as scientists, we cannot ignore alternative interpretations, even if they conflict with our a priori philosophical stance (e.g., duration can be explicitly estimated by reading neuronal representation of time) and anthropomorphic assumptions (e.g., rats estimate time as humans do). While space is limited in a review, if the authors are interested, they can refer to a lengthy review I recently published on this topic, which demonstrates that my criticism is supported by a wide range of timing experiments across species (Robbe, 2023). In addition to this major conceptual issue that cast doubt on most of the conclusions of the study, there are also several major statistical issues.

      Main Concerns

      (1) The authors used a task in which rats must poke for a minimal amount of time (300 ms and then 1500 ms) to be able to obtain a drop of water delivered a few centimeters right below the nosepoke. They claim that their task is a time estimation task. However, they forget that they work with thirsty rats that are eager to get water sooner than later (there is a reason why they start by a short duration!). This task is mainly probing the animals ability to wait (that is impulse control) rather than time estimation per se. Second, the task does not require to estimate precisely time because there appear to be no penalties when the nosepokes are too short or when they exceed. So it will be unclear if the variation in nosepoke reflects motivational changes rather than time estimation changes. The fact that this behavioral task is a poor assay for time estimation and rather reflects impulse control is shown by the tendency of animals to perform nose-pokes that are too short, the very slow improvement in their performance (Figure 1, with most of the mice making short responses), and the huge variability. Not only do the behavioral data not support the claim of the authors in terms of what the animals are actually doing (estimating time), but this also completely annhilates the interpretation of the Ca++ imaging data, which can be explained by motivational factors (changes in neuronal activity occurring while the animals nose poke may reflect a growing sens of urgency to check if water is available). 

      We would like to respond to the reviewer’s comments 1, 2 and 4 together, since they all focus on the same issue. We thank the reviewer for the very thoughtful comments and for sharing his detailed reasoning from a recently published review (Robbe, 2023). A lot of discussions go beyond the scope of this study, and we agree that whether there is an explicit representation of time (an internal clock) in the brain is a difficult question to be answer, particularly by using animal behaviors. In fact, even with fully conscious humans and elaborated task design, we think it is still questionable to clearly dissociate the neural substrate of “timing” from “motor”. In the end, it may as well be that as the reviewer cited from Bergson’sarticle, the experience of time cannot be measured.

      Studying the neural representation of any internal state may suffer from the same ambiguity. With all due respect, however, we would like to limit our response to the scope of our results. According to the reviewer, two alternative interpretations of the task-related sequential activity exist: 1, duration cells may represent fidgeting or orofacial movements and 2, duration cells may represent motivation or motion plan of the rats. To test the first alternative interpretation, we have now performed a more comprehensive analysis of the behavior data at all the limbs and visible body parts of the experimental rats during nose poke and analyzed its periodicity among different trials. We found that the coding cells (including duration, start and end cells) activities were not modulated by these motions, arguing against this possibility. These data are now included in the new Supp. Figure 2, and we have added corresponding texts in the manuscript.

      Regarding the second alternative interpretation, we think our data in the original Figure 4G argues against it. In this graph, we plotted the decoding error of time using the duration cells’ activity against the actual duration of the trials. If the sequential activity of durations cells only represents motivation, then the errors should be linearly modulated by trial durations. The unimodal distribution we observed (Figure 4G and see graph below for a re-plot without signs) suggests that the scaling factor of the sequential activity represents information related to time. And the fact that this unimodal distribution centered at the time threshold of the task provides strong evidence for the active use of scaling factor for time estimation.

      In order to further test the relationship to motivation, we have measured the time interval between exiting nose poke to the start of licking water reward as an independent measurement of motivation for each trial. We found that this reward-seeking time was positively correlated with the trial durations, suggesting that the durations were correlated with motivation to some degree. And when we scaled the activities of the duration cells by this reward-seeking time, we found that the patterns of the sequential activities were largely diminished, and showed a significantly lower peak entropy compared to the same activities scaled by trial durations. The remaining sequential pattern may be due to the correlation between trial durations and motivation (Supp. Figure 2), and the sequential pattern reflects timing more prominently. These analyses provide further evidence that the sequential activities were not coding motivations. These data are included in Figure 2F, 2K and supp. Figure 3 in revised manuscript.

      Author response image 1.

      Regarding whether the scaling sequential activity we report represents behavioral timing or true time estimation, we did not have evidence on this point. However, a previous study has shown that PFC silencing led to disruption of the mouse’s timing behavior without affecting the execution of the task (PMID: 24367075), arguing against the behavior timing interpretation. The main surprising finding of our present study is that these duration cells are different from the start and end cells

      in terms of their coding stability. Thus, future studies dissecting the anatomical microcircuit of these duration cells may provide further clues regarding whether they are connected with reward-related or motion-related brain regions. This may help partially resolve the “time” vs.

      “motor” debate the reviewer mentioned.

      (2) A second issue is that the authors seem to assume that rats are perfectly immobile and perform like some kind of robots that would initiate nose pokes, maintain them, and remove them in a very discretized manner. However, in this kind of task, rats are constantly moving from the reward magazine to the nose poke. They also move while nose-poking (either their body or their mouth), and when they come out of the nose poke, they immediately move toward the reward spout. Thus, there is a continuous stream of movements, including fidgeting, that will covary with timing. Numerous studies have shown that sensorimotor dynamics influence neural activity, even in the prefrontal cortex. Therefore, the authors cannot rule out that what the records reflect are movements (and the scaling of movement) rather than underlying processes of time estimation (some kind of timer). Concretely, start cells could represent the ending of the movement going from the water spout to the nosepoke, and end cells could be neurons that initiate (if one can really isolate any initiation, which I doubt) the movement from the nosepoke to the water spout. Duration cells could reflect fidgeting or orofacial movements combined with an increasing urgency to leave the nose pokes.

      (3) The statistics should be rethought for both the behavioral and neuronal data. They should be conducted separately for all the rats, as there is likely interindividual variability in the impulsivity of the animals.

      We thank the reviewer for the comment, yet we are not quite sure what specifically was asked by the reviewer. It appears that the reviewer requires we conduct our analysis using each rat individually. In our revised manuscript, we have conducted and reported analyses with individual rat in the original Figure 1C, Figure 2C, G, K, Figure 4F.

      (4) The fact that neuronal activity reflects an integration of movement and motivational factors rather than some abstract timing appears to be well compatible with the analysis conducted on the error trials (Figure 4), considering that the sensorimotor and motivational dynamics will rescale with the durations of the nose poke. 

      (5) The authors should mention upfront in the main text (result section) the temporal resolution allowed by their Ca+ probe and discuss whether it is fast enough in regard of behavioral dynamics occurring in the task. 

      We thank the reviewer for the suggestion. We have originally mentioned the caveat of calcium imaging in the interpretation of our results. We have now incorporated more texts for this purpose during our revision. In terms of behavioral dynamics (start and end of nose poke in this case), we think calcium imaging could provide sufficient kinetics. However, the more refined dynamics related to the reproducibility of the sequential activity or the precise representation of individual cells on the scaled duration may be benefited from improved time resolution.

      Recommendations for the authors:  

      Reviewer #1 (Recommendations For The Authors): 

      (1) Please refer explicitly to the three types of cells in the abstract. 

      We have now modified the abstract as suggested during revision.

      (2) Please refer to the work of Betancourt et al., 2023 Cell Reports, where a trial-by-trail analysis on the correlation between neural trajectory dynamics in MPC and timing behavior is reported. In that same paper the stability of neural sequences across task parameters is reported. 

      We have now cited and discussed the study in the discussion section of the revised manuscript.

      (3) Please state the number of studied animals at the beginning of the results section. 

      We have now provided this information as requested. The numbers of rats are also plotted in Figure 1D for each analysis.

      (4) Why do the middle and right panels of Figure 2E show duration cells. 

      Figure 2E was intended to show examples of duration cells’ activity. We included different examples of cells that peak at different points in the scaled duration. We believe these multiple examples would give the readers a straight forward impression of these cells’ activity patterns.

      (5) Which behavioral sessions of Figure 1B were analyzed further.

      We have now labeled the analyzed sessions in Figure 1B with red color in the revised manuscript.

      (6) In Figure 3A-C please increase the time before the beginning of the trial in order to visualize properly the activation patterns of the start cells.

      We thank the reviewer for the suggestion and have now modified the figure accordingly in the revised manuscript.

      (7) Please state what could be the behavioral and functional effect of the ablation of the cortical tissue on top of mPFC.

      We thank the reviewer for the question. In our experience, mice with lens implanted in the mPFC did not show observable difference with mice without surgery in the acquisition of the task and the distribution of the nose-poke durations. In our dataset, rats with the lens implantation showed similar nose-poking behavior as those without lens implantation (Figure 1B). Thus, it seems that the effect of ablation, if any, was quite limited, in the scope of our task.

    1. eLife Assessment:

      This study presents valuable findings that add to our understanding of cortical astrocytes, which respond to synaptic activity with calcium release in subcellular domains that can proceed to larger calcium waves. The proposed concept of a spatial "threshold" is based on solid evidence from in vivo and ex vivo imaging data and the use of mutant mice. Details of the specific threshold must be taken with caution and are necessarily incomplete, but may be supported by additional experiments with higher resolution in space and time in the future.

    2. Reviewer #2 (Public review):

      Summary

      Lines et al investigate the integration of sensory-evoked calcium signals in astrocytes of the primary somatosensory cortex in anesthetized mice. More precisely, their goal is to better characterize the mechanisms that govern the emergence of whole-cell events in astrocytes, here referred to as calcium surges. As a single astrocyte communicates with hundreds of thousands of synapses simultaneously, understanding the spatial and temporal integration of calcium signals in astrocytes and the mechanisms governing these phenomena is of tremendous importance to deepen our understanding of signal processing in the central nervous system. In line with previous reports in the field, the authors find that most signals originate in the arborization of astrocytes, occasionally leading to somatic and whole-cell events. On average, the latter occur following domain activity closer to the soma, suggesting a centripetal propagation of signals leading to somatic events. Moreover, they observe that the distance from the soma to active domains increases with time after somatic events, suggesting a potential centrifugal propagation of signals post-somatic activity. The results suggest that most calcium surges depend on the expression of IP3R2, the main calcium channel in astrocytes, located at the membrane of the endoplasmic reticulum. Finally, they report a correlation between the percentage of active domains in the astrocyte "arbor", the emergence of a somatic event, and the frequency of slow inward currents from neighboring neurons. The main claim of this manuscript is that there would be a spatial threshold inherent to astrocytes of ~23% of domain activation above which a calcium surge is observed. Although the study provides data and concepts that are important for the glia field, the conclusions seem a little too assertive and general with respect to what can be deduced from the data and methods used.

      Strengths

      The major strength of this study is the experimental approach that allowed the authors to obtain numerous and informative calcium recordings in vivo in the somatosensory cortex in mice in response to sensory stimuli as well as in situ. Notably, they developed an interesting approach to modulate the percentage of active domains in the astrocyte arborization by varying the intensity of peripheral stimulation (its amplitude, frequency, or duration). The question investigated is important as the mechanisms governing signal integration in astrocytes and its effect on neighboring cells are poorly understood.

      Weaknesses

      The major weakness of the manuscript is the method used to analyze and quantify calcium activity, which mostly relies on the analysis of averaged data and overlooks the variability of the signals measured. As a result, the main claims from the manuscript seem to be incompletely supported by the data.

      Although the revised version includes more discussion on the experiments that could be done to extend the results from this study, more discussion would be needed to clarify the limitations on what can be deduced from the proposed experimental and analytical design. Notably, the analysis pipeline seems biased by the assumption of the existence of a spatial threshold dictating the emergence of global calcium events in astrocytes. Although there is a clear linear correlation between the percentage of active somas and the percentage of active domains in the arborization (Figure 2 panel F), concluding on the existence of an inherent threshold of domain activity is not completely supported by the data (see e.g. Figure 2 panel F or Figure 4 panel E). It would probably be more accurate to report that most somatic events occur when the percentage of arbor domains being active is above 21-24% (95% confidence interval of the reported threshold). Thus, some of the conclusions from the manuscript, such as p.14 l.34-35 " spatial threshold of domains that needs to be reached in order to lead to soma activation", seem a bit too assertive as some astrocytes did display soma activation with a much smaller percentage of active domains or on the contrary, no somatic event despite domain activity way above the threshold. Similarly, as Figure 6 demonstrates a strong effect of IP3R2 knock-out on somatic activation but reports a non-zero probability of soma activity in IP3R2 -/- mice (panel F), the conclusion that IP3R2 are necessary to trigger an astrocytic calcium surge seems a bit too strong. Finally, the results reported in Figure 7 demonstrate the existence of a strong correlation between SICs, the percentage of active astrocyte domains on, and somatic activation, so that the conclusion "These results indicate that spatial threshold of the astrocyte calcium surge has a functional impact on gliotransmission" (l.4&-48 page 13) also seems a bit too assertive.

    3. Reviewer #3 (Public Review):

      Summary:

      The study aims to elucidate the spatial dynamics of subcellular astrocytic calcium signaling. Specifically, they elucidate how subdomain activity above a certain spatial threshold (~23% of domains being active) heralds a calcium surge that also affects the astrocytic soma. Moreover, they demonstrate that processes on average are included earlier than the soma and that IP3R2 is necessary for calcium surges to occur. Finally, they associate calcium surges with slow inward currents.

      The revised manuscript is improved compared to the first iteration. While some concerns have been addressed, my main critique pertaining to ROI approach/sampled area, statistical analyses and anesthesia are in my view still important caveats of the study that I think should have been even more clearly addressed in the manuscript.

      Strengths:<br /> The study addresses an interesting topic that is only partially understood. The study uses multiple methods including in vivo two-photon microscopy, acute brain slices, electrophysiology, pharmacology, and knockout models. The conclusions are strengthened by the same findings in both in vivo anesthetized mice and in brain slices.

      Weaknesses:

      The method that has been used to quantify astrocytic calcium signals only analyzes what seems to be a small proportion of the total astrocytic domain on the example micrographs, where a structure is visible in the SR101 channel (see for instance Reeves et al. J. Neurosci. 2011, demonstrating to what extent SR101 outlines an astrocyte). This would potentially heavily bias the results: from the example illustrations presented it is clear that the calcium increases in what is putatively the same astrocyte goes well beyond what is outlined with automatically placed small ROIs. The smallest astrocytic processes are an order of magnitude smaller than the resolution of optical imaging and would not be outlined by either SR101 or with the segmentation method judged by the ROIs presented in the figures. Completely ignoring these very large parts of the spatial domain of an astrocyte, in particular when making claims about a spatial threshold, seems inappropriate. Several recent methods published use pixel-by-pixel event-based approaches to define calcium signals. The data should have been analyzed using such a method within a complete astrocyte spatial domain in addition to the analyses presented. Also, the authors do not discuss how two-dimensional sampling of calcium signals from an astrocyte that has processes in three dimensions (see Bindocci et al, Science 2017) may affect the results: if subdomain activation is not homogeneously distributed in the three-dimensional space within the astrocyte territory, the assumptions and findings between a correlation between subdomain activation and somatic activation may be affected.

      Authors reply: In order to reduce noise from individual pixels, we chose to segment astrocyte arborizations into domains of several pixels. As pointed out previously, including pixels outside of the SR101-positive territory runs the risk of including a pixel that may be from a neighboring cell or mostly comprised of extracellular space, and we chose the conservative approach to avoid this source of error. We agree that the results have limitations from being acquired in 2D instead of 3D, but it is likely to assume the 3D astrocyte is homogeneously distributed and that the 2D plane is representative of the whole astrocyte. Indeed, no dimensional effects were reported in Bindocci et al, Science 2017. We have included a paragraph in the discussion to address this limitation in our study on P15, L23-27:<br /> "The investigation of the spatial threshold could be improved in the future in a number of ways. One being the use of state-of-the-art imaging in 3D(Bindocci et al., 2017). While the original publication using 3D imaging to study astrocyte physiology does not necessarily imply that there would be different calcium dynamics in one axis over another, the three-dimensional examination of the spatial threshold could refine the findings we present here.

      Comments on revisions: It is good that 3D imaging aspects are mentioned as a limitation, and I agree that Bindocci et al. do not necessarily suggest that results in this manuscript would have been different if also the third spatial dimension was included in the analyses. However, the way I see it, the added analyses and text changes throughtout still do not adequately address my concern pertaining to basing a spatial threshold on a fraction of the astrocyte territory.

      The study uses a heaviside step function to define a spatial 'threshold' for somata either being included or not in a calcium signal. However, Fig 4E and 5D showing how the method separates the signal provide little understanding for the reader. The most informative figure that could support the main finding of the study, namely a ~23% spatial threshold for astrocyte calcium surges reaching the soma, is Fig. 4G, showing the relationship between the percentage of arborizations active and the soma calcium signal. A similar plot should have been presented in Fig 5 as well. Looking at this distribution, though, it is not clear why ~23% would be a clear threshold to separate soma involvement, one can only speculate how the threshold for a soma event would influence this number. Even if the analyses in Fig. 4H and the fact that the same threshold appears in two experimental paradigms strengthen the case, the results would have been more convincing if several types of statistical modeling describing the continuous distribution of values presented in Fig. 4E (in addition to the heaviside step function) were presented.

      Authors reply: We agree with the reviewer and have added to the paper a discussion for our justification on the use of the Heaviside step function, and have included this in the methods section. We chose the Heaviside step function to represent the on/off situation that we observed in the data that suggested a threshold in the biology. We agree with the reviewer that Fig. 4G is informative and demonstrates that under 23% most of the soma fluorescence values are clustered at baseline. We agree that a different statistical model describing the data would be more convincing and confirmed the spatial threshold with the use of a confidence interval in the text and supported the use of percent domains active for this threshold over other properties such as spatial or temporal clustering using a general linear model. P18-19, L34-2:<br /> "Heaviside step function<br /> The Heaviside step function below in equation 4 is used to mathematically model the transition from one state to the next and has been used in simple integrate and fire models (Bueno-Orovio et al., 2008; Gerstner, 2000).<br /> 𝐻(𝑎) ∶=<br /> 0, 𝑎 < 𝑎T<br /> {<br /> 1, 𝑎 {greater than or equal to} 𝑎T<br /> (4)<br /> The Heaviside step function 𝐻(𝑎) is zero everywhere before the threshold area (𝑎T) and one everywhere afterwards. From the data shown in Figure 4E where each point (𝑆(𝑎)) is an individual astrocyte response with its percent area (𝑎) domains active and if the soma was active or not denoted by a 1 or 0 respectively. To determine 𝑎T in our data we iteratively subtracted 𝐻(𝑎) from 𝑆(𝑎) for all possible values of 𝑎T to create an error term over 𝑎. The area of the minimum of that error term was denoted the threshold area.

      Comments on revisions: Even with the added explanations, I am still not sure that the data show a specific threshold, or that the statistical model enforce a threshold onto the data. The data in Fig. 4G does not in my view clearly show a clear threshold as suggested. The analyses are strengthened with an added statistical modeling, however, the details of the modeling is not presented in the manuscript as far as I can see. As a bare minimum the statistical packages/tools used, the model details and goodness of fit as residual plots must be shown/commented.

      The description of methods should have been considerably more thorough throughout. For instance which temperature the acute slice experiments were performed at, and whether slices were prepared in ice-cold solution, are crucial to know as these parameters heavily influence both astrocyte morphology and signaling. Moreover, no monitoring of physiological parameters (oxygen level, CO2, arterial blood gas analyses, temperature etc) of the in vivo anesthetized mice is mentioned. These aspects are critical to control for when working with acute in vivo two-photon microscopy of mice; the physiological parameters rapidly decay within a few hours with anesthesia and following surgery.

      Authors reply: We have increased the thoroughness of our methods section. Especially including that body temperature and respiration were indeed monitored throughout anesthesia.

      Comments on revisions: Bath temperature for slice experiments, or cutting conditions are still not reported. For the in vivo experiments, it must be commented that this level of physiological monitoring for acute in vivo brain physiology experiments (self breathing, no control of O2/CO2) is barely adequate and could represent a considerable caveat of the study.

    4. Author response:

      The following is the authors’ response to the original reviews.

      eLife Assessment

      Building on their own prior work, the authors present valuable findings that add to our understanding of cortical astrocytes, which respond to synaptic activity with calcium release in subcellular domains that can proceed to larger calcium waves. The proposed concept of a spatial "threshold" is based on solid evidence from in vivo and ex vivo imaging data and the use of mutant mice. However, details of the specific threshold should be taken with caution and appear incomplete unless supported by additional experiments with higher resolution in space and time.

      We thank the reviewers and editors for the positive assessment of our work as containing valuable findings that add to our understanding of cortical astrocytes. We also appreciate their positive appraisal of the proposed concept of a spatial threshold supported by solid evidence. 

      Regarding their specific comments, we truly appreciate them because they have helped to clarify issues and to improve the study. Point-by-point responses to these comments are provided below. Regarding the general comment on the spatial and temporal resolution of our study, we would like to clarify that the spatial and temporal resolution used in the current study (i.e., 2 - 5 Hz framerate using a 25x objective with 1.7x digital zoom with pixels on the order of 1 µm2) is within the norm in the field, does not compromise the results, nor diminish the main conceptual advancement of the study, namely the existence of a spatial threshold for astrocyte calcium surge. 

      We respect the thoughtfulness of the reviewers and editors towards improving the paper.

      Public Reviews:

      Reviewer #1 (Public Review):

      Lines et al., provide evidence for a sequence of events in vivo in adult anesthetized mice that begin with a footshock driving activation of neural projections into layer 2/3 somatosensory cortex, which in turn triggers a rise in calcium in astrocytes within "domains" of their "arbor". The authors segment the astrocyte morphology based on SR101 signal and show that the timing of "arbor" Ca2+ activation precedes somatic activation and that somatic activation only occurs if at least {greater than or equal to}22.6% of the total segmented astrocyte "arbor" area is active. Thus, the authors frame this {greater than or equal to}22.6% activation as a spatial property (spatial threshold) with certain temporal characteristics - i.e., must occur before soma and global activation. The authors then elaborate on this spatial threshold by providing evidence for its intrinsic nature - is not set by the level of neuronal stimulus and is dependent on whether IP3R2, which drives Ca2+ release from the endoplasmic reticulum (ER) in astrocytes, is expressed. Lastly, the authors suggest a potential physiologic role for this spatial threshold by showing ex vivo how exogenous activation of layer 2/3 astrocytes by ATP application can gate glutamate gliotransmission to layer 2/3 cortical neurons - with a strong correlation between the number of active astrocyte Ca2+ domains and the slow inward current (SIC) frequency recorded from nearby neurons as a readout of glutamatergic gliotransmission. This is interesting and would potentially be of great interest to readers within and outside the glia research community, especially in how the authors have tried to systematically deconstruct some of the steps underlying signal integration and propagation in astrocytes. Many of the conclusions posited by the authors are potentially important but we think their approach needs experimental/analytical refinement and elaboration.

      We thank the reviewer for her/his positive appraisal and comments that has helped us to improve the study. In response to their insights, we aim to address the key points raised below:

      (1) Sequence of Events: We acknowledge the reviewer's interest in our findings regarding the sequence of events. We have provided a more detailed description of the methods and results to clarify the spatiotemporal relationships between domain activation and spatiotemporal clustering, to centripetal and centrifugal calcium propagation in relation to soma activation.

      (2) Spatial Threshold: The reviewer accurately identifies our characterization of a spatial threshold (≥22.6% activation) with temporal characteristics as a crucial aspect of our study. We have expanded upon this concept by offering a clearer illustration of how this threshold relates to somatic and global activation.

      (3) Intrinsic Nature of Spatial Threshold: The reviewer's insightful observation regarding the inherent quality of the spatial threshold, regardless of its dependence on neuronal stimuli is noteworthy. We have provided additional details to substantiate this claim, shedding more light on the fundamental nature of this phenomenon.

      (4) Physiological Implications: The reviewer rightly highlights the potential physiological significance of our findings, particularly in relation to gliotransmission in cortical neurons. We have enhanced our discussion by elaborating on the implications of these observations.

      The primary issue for us, and which we would encourage the authors to address, relates to the low spatialtemporal resolution of their approach. This issue does not necessarily compromise the concept of a spatial threshold, but more refined observations and analyses are likely to provide more reliable quantitative parameters and a more comprehensive view of the mode of Ca2+ signal integration in astrocytes. 

      We agree with the reviewer that our spatial-temporal resolution (2 – 5 Hz framerate using a 25x objective and 1.7x digital zoom with pixels on the order of 1 µm) does not compromise the proposed concept of the existence of a spatial threshold for the intracellular calcium expansion.

      For this reason, and because their observations might be perceived as both a conceptual and numerical standard in the field, we believe that the authors should proceed with both experimental and analytical refinement. Notably, we have difficulty with the reported mean delays of astrocyte Ca2+ elevations upon sensory stimulation. The 11s delay for response onset in "arbor" and 13s in the soma are extremely long, and we do not think they represent a true physiologic latency for astrocyte responses to the sensory activity. Indeed, such delays appear to be slower even than those reported in the initial studies of sensory stimulation in anesthetized mice with limited spatial-temporal resolution (Wang et al. Nat Neurosci., 2006) - not to say of more recent and refined ones in awake mice (Stobart et al. Neuron, 2018) that identified even sub-second astrocyte Ca2+ responses, largely preserved in IP3R2KO mice. Thus, we are inclined to believe that the slowness of responses reported here is an indicator of experimental/analytical issues. There can be several explanations of such slowness that the authors may want to consider for improving their approach: (a) The authors apparently use low zoom imaging for acquiring signals from several astrocytes present in the FOV: do all of these astrocytes respond homogeneously in terms of delay from sensory stimulus? Perhaps some are faster responders than others and only this population is directly activated by the stimulus. Others could be slower in activation because they respond secondarily to stimuli. In this case, the authors could focus their analysis specifically on the "fast-responding population". (b) By focusing on individual astrocytes and using higher zoom, the authors could unmask more subtle Ca2+ elevations that precede those reported in the current manuscript. These signals have been reported to occur mainly in regions of the astrocyte that are GCaMP6-positive but SR101-negative and constitute a large percentage of its volume (Bindocci et al., 2017). By restricting analysis to the SR101-positive part of the astrocyte, the authors might miss the fastest components of the astrocyte Ca2+ response likely representing the primary signals triggered by synaptic activity. It would be important if they could identify such signals in their records, and establish if none/few/many of them propagate to the SR-101-positive part of the astrocyte. In other words, if there is only a single spatial threshold, the one the authors reported, or two or more of them along the path of signal propagation towards the cell soma that leads eventually to the transformation of the signal into a global astrocyte Ca2+ surge. 

      We thank the reviewer for these excellent and important comments. The qualm with the mean delays of astrocyte activation is indeed a result of averaging together astrocyte responses to a 20 second stimulus. Indeed, astrocyte responses are heterogeneous and many astrocytes respond much quicker, as can be seen in example traces in Figs. 1D, 1G, and 3C. Indeed, with any biological system variability exists, however here we take the averaged responses in order to identify a general property of astrocyte calcium dynamics: the existence of the concept of a spatial threshold for astrocyte calcium surge. We have now included a paragraph in the Discussion section on this subject on P15, L16-22:

      “We were able to discover this general phenomenon of astrocyte physiology through the use of a novel computational tool that allowed us to combine almost 1000 astrocyte responses. Variation is rife in biological systems, and there are sure to be eccentricities within astrocyte calcium responses. Here, we focused on grouped data to better understand what appears to be an intrinsic property of astrocyte physiology. We used different statistical examinations and tested our hypothesis in vivo and in situ, and all these methods together provide a more complete picture of the existence of a spatial threshold for astrocyte calcium surge.“

      The specialized work of Stobart et al. 2018, was focused more on the fast activation of microdomain subpopulations than the induction of later somatic activation. Indeed, Stobart et al. 2018 and Wang et al. 2006 also found that somatic responses of astrocytes were delayed in the range of seconds. Importantly, Wang et al., 2006 describe that the activation of astrocytes is frequency dependent, that is, the higher the frequency, the faster and higher the activation. In the present, work we stimulated at just 2 Hz to better investigate the spatial threshold. Excitingly, the results showed by Stobart et al., 2018 agree with ours, Rupprecht et al. 2024 and Fedotova et al. 2023, that there is a sequence of activation from the domains to the somas, which could be due to the time that is required for the summation of the initial microdomain signal to reach a threshold capable to activate the soma. These above referenced studies have many similarities with our own but are different in the underlying scientific question that led to diverging methodology, however we want to stress that we agree with the reviewers that our methods provide sufficient evidence for the cell-scale scientific phenomenon that we are studying, which is the spatial threshold for astrocyte calcium surge. Finally, we have included an additional figure (new Figure 5) that only looks at the calcium dynamics of early responding cells and found no significant difference in the spatial threshold in this population compared to our original quantification.

      In this context, there is another concept that we encourage the authors to better clarify: whether the spatial threshold that they describe is constituted by the enlargement of a continuous wavefront of Ca2+ elevation, e.g. in a single process, that eventually reaches 22.6% of the segmented astrocyte, or can it also be

      constituted by several distinct Ca2+ elevations occurring in separate domains of the arbor, but overall totaling 22.6% of the segmented surface? Mechanistically, the latter would suggest the presence of a general excitability threshold of the astrocyte, whereas the former would identify a driving force threshold for the centripetal wavefront. In light of the above points, we think the authors should use caution in presenting and interpreting the experiments in which they use SIC as a readout. Their results might lead some readers to bluntly interpret the 22.6% spatial threshold as the threshold required for the astrocyte to evoke gliotransmitter release. Indeed, SIC are robust signals recorded somatically from a single neuron and likely integrate activation of many synapses all belonging to that neuron. On the other hand, an astrocyte impinges in a myriad of synapses belonging to several distinct neurons. In our opinion, it is quite possible that more local gliotransmission occurs at lower Ca2+ signal thresholds (see above) that may not be efficiently detected by using SIC as a readout; a more sensitive approach, such as the use of a gliotransmitter sensor expressed all along the astrocyte plasma-membrane could be tested to this aim.  

      The reviewer raised an excellent point. Whether the spatial threshold of 22.6% occur in the segmented astrocyte or may be reached occurring in separate domains of the arbor, is an important question and we address this by the inclusion of a novel analysis shown in the new figure (new Figure 5) in the revised version of the manuscript. In this new analysis, we demonstrate that the average distance between domain activation is not significantly different between subthreshold activity and the activity that precedes or follows the suprathreshold cellular activation. In contrast, we do find a significant difference in the average time between domain activation between subthreshold activity and activity that precedes and follows suprathreshold activation. We go further with a generalized linear model to show that percent area of active domains and temporal clustering is related to soma activation and not spatial clustering. This suggests that domain activation doesn’t need to be spatially clustered together to induce soma activation and subsequent calcium surge, but more importantly, domain activation must be over the spatial threshold and occur within a timeframe. This has been added to the Results on P10, L2-40:

      “Our results demonstrate the relationship between the percentage of active domains and soma activation and subsequent calcium surge. Next, we were interested in the spatiotemporal properties of domain activity leading up to and during calcium surge. Because we imaged groups of astrocytes, we were able to constrain our analyses to fast responders (onset < median population onset) in order to evaluate astrocytes that were more likely to respond to neuronal-evoked sensory stimulation and not nearby astrocyte activation (Figure 5A). In this population the spatial threshold was 23.8% within the 95% confidence intervals of [21.2%, 24.0%]. First, we created temporal maps, where each domain is labeled as its onset relative to soma activation, of individual astrocyte calcium responses to study the spatiotemporal profile of astrocyte calcium surge (Bindocci et al., 2017; Rupprecht et al., 2024) (Figure 5B). Using temporal maps, we quantified the spatial clustering of responding domains by measuring the average distance between active domains. We found that the average distance between active domains in subthreshold astrocyte responses were not significantly different from pre-soma suprathreshold activity (16.3 ± 0.4 µm in No-soma cells versus 16.2 ± 0.3 µm in Pre-soma cells, p = 0.75; n = 286 No-soma vs n = 326 Pre-soma, 30 populations and 3 animals; Figure 5C). Following soma activation, astrocyte calcium surge was marked with no significant change in the average distance between active domains (16.0 ± 0.3 µm in Post-soma cells versus 16.3 ± 0.4 µm in No-soma cells, p = 0.57 and 16.2 ± 0.3 µm in Presoma cells, p = 0.31; n = 326 soma active and n = 286 no soma active, 30 populations and 3 animals; Figure 5C). Taken together this suggests that on average domain activation happens in a nonlocal fashion that may illustrate the underlying nonlocal activation of nearby synaptic activity. Next, we interrogated the temporal patterning of domain activation by quantifying the average time between domain responses, and found that the average time between domain responses was significantly decreased in pre-soma suprathreshold activity compared to subthreshold activities without subsequent soma activation (9.4 ± 0.3 s in No-soma cells versus 4.4 ± 0.2 s in Pre-soma cells, p < 0.001; n = 326 soma active vs n = 286 not soma active, 30 populations and 3 animals; Figure 5D). The average time between domain activation was even less after the soma became active during calcium surge (2.1 ± 0.1 s in Post-soma versus 9.4 ± 0.3 s in No-Soma cells, p < 0.001 and 4.4 ± 0.1 s in Pre-soma cells, p < 0.001; n = 326 soma active and n = 286 not soma active, 30 populations and 3 animals; Figure 5D). This corroborates our findings in Figure S2 and highlights the difference in temporal profiles between subthreshold activity and astrocyte calcium surge. 

      We then tested the contribution of each of our three variables describing domain activation (percent area, average distance and time) to elicit soma activation by creating a general linear model. We found that overall, there was a significant relationship between these variables and the soma response (p = 5.5e-114), with the percent area having the largest effect (p = 3.5e-70) followed by the average time (p = 3.6e-7), and average distance having no significant effect (p = 0.12). Taken together this suggests that the overall spatial clustering of active domains has no effect on soma activation, and the percent area of active domains within a constrained time window having the largest effect.”

      Regarding comments on SIC, we fully agree with the reviewer. In the revised version of the manuscript, we have included text in the discussion to ensure the correct interpretation of the results, i.e., the observed 22.6% spatial threshold for the SIC does not necessarily indicate an intrinsic property of gliotransmitter release; rather, since SICs have been shown to be calcium-dependent, it is not surprising that their presence, monitored at the whole-cell soma, matches the threshold for the intracellular calcium extension. We have added to the Discussion P16, L15-30:

      “Astrocyte calcium activity induces multiple downstream signaling cascades, such as the release of gliotransmitters (Araque et al., 2014; de Ceglia et al., 2023). Using patch-clamp recordings of a single nearby neuron we showed that a nearby population of astrocyte calcium surge is also correlated to the increase in slow inward currents (SICs), previously demonstrated to be dependent on astrocytic vesicular release of glutamate (Araque et al., 2000; Durkee et al., 2019; Fellin et al., 2004). The increase of SICs we observed from patching a single neuron is likely the integration of gliotransmitter release onto synapses from a group of nearby astrocytes. Indeed, subthreshold astrocyte calcium increases alone can trigger activity in contacted dendrites (Di Castro et al., 2011). An exciting avenue of future research would be to observe the impact of a single astrocyte calcium surge on nearby neurons (Refaeli and Goshen, 2022). How many neurons would be affected, and would this singular event be observable through patch clamp from a single neuron? The output of astrocyte calcium surge is equally important to network communication as the labeling of astrocyte calcium surge, as it identifies a biologically relevant effect onto nearby neurons. Many downstream signaling mechanisms may be activated following astrocyte calcium surge, and the effect of locally concentrated domain activity vs astrocyte calcium surge should be studied further on different astrocyte outputs.”

      Additional considerations are that the authors propose an event sequence as follows: stimulus - synaptic drive to L2/3 - arbor activation - spatial threshold - soma activation - post soma activation - gliotransmission. This seems reminiscent of the sequence underlying neuronal spike propagation - from dendrite to soma to axon, and the resulting vesicular release. However, there is no consensus within the glial field about an analogous framework for astrocytes. Thus, "arbor activation", "soma activation", and "post soma activation" are not established `terms-of-art´. Similarly, the way the authors use the term "domain" contrasts with how others have (Agarwal et al., 2017; Shigetomi et al., 2013; Di Castro et al., 2011; Grosche et al., 1999) and may produce some confusion. The authors could adopt a more flexible nomenclature or clarify that their terms do not have a defined structural-functional basis, being just constructs that they justifiably adapted to deal with the spatial complexity of astrocytes in line with their past studies (Lines et al., 2020; Lines et al., 2021).

      We agree there is no consensus within the glial field about this event sequence. One major difference between this sequence of events and neuronal spike propagation is directionality from dendrite to soma to axon. It is unknown whether directionality of the calcium signal exists in astrocytes. However, our finding in Figure 5E suggests a directionality of centripetal propagation from the arborization to the soma to elicit calcium surge that leads to centrifugal propagation. In the Results on P10-11, L41-8:

      “Recent work studying astrocyte integration has suggested a centripetal model of astrocyte calcium, where more distal regions of the astrocyte arborization become active initially and activation flows towards the soma (Fedotova et al., 2023; Rupprecht et al., 2024). Here, we confirm this finding, where activated domains located distal from the soma respond sooner than domains more proximal to the soma (linear correlation: p < 0.05, R2 = 0.67; n = 30 populations, 3 animals; Figure 4E). Next, we build upon this result to also demonstrate that following soma activation, astrocyte calcium surge propagates outward in a centrifugal pattern, where domains proximal to the soma become active prior to distal domains (linear correlation: p < 0.01, R2 = 0.89; n = 30 populations, 3 animals; Figure 4E). Together these results detail that intracellular astrocyte calcium follows a centripetal model until the soma is activated leading to a calcium surge that flows centrifugally. This suggests that astrocytes have the capabilities to integrate the nearby local synaptic population, and if this activity exceeds the spatial threshold then it leads to a whole-cell response that spreads outward.” 

      And in the Discussion P15, L3-15:

      “Close examinations of the calcium surge uncovered distinct propagations whether before or after soma activation. Firstly, our analysis found that temporal clustering changed before and after calcium surge, with both being above subthreshold activity, and that this characteristic was absent when assessing spatial clustering. When comparing the percent area, spatial and temporal clustering of active domains using a GLM, we found that the percent area was the most significant parameter describing a threshold to soma activation. We then compared the delay of domain activation and its distance from the soma, and recreated previous results that suggest a centripetal model of astrocytic calcium responses from the distal arborizations to the soma (Fedotova et al., 2023; Rupprecht et al., 2023). Here, we went a step further and discovered that soma activation switches this directionality for astrocytic calcium surge to propagate outward in a centrifugal manner away from the soma. Taken together, these results demonstrate the integrative potential of astrocyte calcium responses and characterize further the astrocyte calcium surge to relay this other parts of the astrocyte.”

      The term “microdomain” is used in the references above to define distal subcellular domains in contact with synapses, and in order to dissociate from this term we adopt the nomenclature “domain” to define all subcellular domains in the astrocyte arborization. These items have been discussed and clarified in the revised version of the manuscript on P5, L17-19:

      “The concept of domain to define all subcellular domains in the astrocyte arborization should not be confused with the concept of microdomain, that usually refers to the distal subcellular domains in contact with synapses.”

      Our previous points suggest that the paper would be significantly strengthened by new experimental observations focusing on single astrocytes and using acquisitions at higher spatial and temporal resolution. If the authors will not pursue this option, we encourage them to at least improve their analysis, and at the same time recognize in the text some limitations of their experimental approach as discussed above. We indicate here several levels of possible analytical refinement.

      We believe our spatial (25x objective and 1.7x digital zoom with pixels on the order of 1µm) and temporal (2 – 5 Hz framerate) resolution is within the range used in the glial field. In any case the existence of a spatial threshold for astrocyte calcium surge is not compromised with the use of this imaging resolution.

      The first relates to the selection of astrocytes being analyzed, and the need to focus on a much narrower subpopulation than (for example) 987 astrocytes used for the core data. This selection would take into greater consideration the aspects of structure and latency. With the structural and latency-based criteria for selection, the number of astrocytes to analyze might be reduced by 10-fold or more, making our second analytical recommendation much more feasible.

      We agree that individual differences exist, however, establishing a general concept requires the sampling of many astrocytes. Nevertheless, we have included a new figure (new Figure 5) that analyzes early responders.

      For structure-based selection - Genetically-encoded Ca2+ indicators such as GCaMP6 are in principle expressed throughout an astrocyte, even in regions that are not labelled by SR101. Moreover, astrocytes form independent 3D territories, so one can safely assume that the GCaMP6 signal within an astrocyte volume belongs to that specific astrocyte (this is particularly evident if the neighboring astrocytes are GCaMP6negative). Therefore, authors could extend their analysis of Ca2+ signals in individual astrocytes to the regions that are SR101-negative and try to better integrate fast signals in their spatial threshold concept. Even if they decided to be conservative on their methods, and stick to the astrocyte segmentation based on the SR-101 signal, they should acknowledge that SR101 dye staining quality can vary considerably between individual astrocytes within a FOV - some astrocytes will have much greater structural visibility in the distal processes than others. This means that some astrocytes may have segmented domains extending more distally than others and we think that authors should privilege such astrocytes for analysis. However, cases like the representative astrocytes shown in Figure 4A or Figure S1B, have segmented domains localized only to proximal processes near the soma. Accordingly, given the reported timing differences between "arbor" and "soma" activation, one might expect there to be comparable timing differences between domains that are distal vs proximal to the soma as well. Fast signals in peripheral regions of astrocytes in contact with synapses are largely IP3R2-independent (Stobart et al., 2018). However, the quality of SR101 staining has implications for interpreting the IP3R2 KO data. There is evidence IP3R2 KO may preferentially impact activity near the soma (Srinivasan et al., 2015). Thus, astrocytes with insufficient staining - visible only in the soma and proximal domains - might show a biased effect for IP3R2 KO. While not necessarily disrupting the core conclusions made by the authors based on their analysis of SR101-segmented astrocytes, we think results would be strengthened if astrocytes with sufficient SR101 staining - i.e. more consistent with previous reports of L2/3 astrocyte area (Lanjakornsiripan et al., 2018) - were only included. This could be achieved by using max or cumulative projections of individual astrocytes in combination with SR101 staining to construct more holistic structural maps (Bindocci et al., 2017).

      We agree with the ideas concerning SR101, and indeed there could be variability in the origins of the astrocyte calcium signal. Astrocyte territory boundaries can be difficult to discern when both astrocytes express GCaMP6. Also, SR101-negative domains could encapsulate an area that is only partially that of astrocyte territory, including also extracellular space. Here we take a conservative approach to constrain ROIs to SR101positive astrocyte territory outlines without invading neighboring cells or extracellular space in order to reduce error in the estimate of a spatial threshold. The effect of IP3R2 KO preferentially impacting activity near the soma is interesting, and in line with our conclusions. We agree that the findings from SR101-negative pixels would not necessarily disrupt the core conclusions of the study, and the additional analysis suggested would further strengthen results. We have since included on the limitations of the study in the Discussion P15, L3137:

      “In this study, we chose to limit our examinations of calcium activity that was within the bounds determined by SR101 staining. Much work has shown that astrocyte territories are more akin to sponge-like morphology with small microdomains making up the end feet of their distal arborizations (Baldwin et al., 2024). Here, we took a conservative approach to not incorporate these fine morphological processes and only take SR101-postive pixels for analysis in order to reduce the possible error of including a neighboring astrocyte or extracellular space in our analyses. Much work can be done to extend these results.”

      For latency-based selection - The authors record calcium activity within a FOV containing at least 20+ astrocytes over a period of 60s, during which a 2Hz hindpaw stimulation at 2mA is applied for 20s. As discussed above, presumably some astrocytes in a FOV are the first to respond to the stimulus series, while others likely respond with longer latency to the stimulus. For the shorter-latency responders <3s, it is easier to attribute their calcium increases as "following the sensory information" projecting to L2/3. In other cases, when "arbor" responses occur at 10s or later, only after 20 stimulus events (at 2Hz), it is likely they are being activated by a more complex and recurrent circuit containing several rounds of neuron-glia crosstalk etc., which would be mechanistically distinct from astrocytes responding earlier. We suggest that authors focus more on the shorter latency response astrocytes, as they are more likely to have activity corresponding to the stimulus itself.

      We agree that different times of astrocyte calcium increases may be due to different mechanisms outside of the astrocyte. We believe the spatial threshold will be intrinsic to these external variables; yet we believe that longer latency responses are physiological and may carry important information to determining the astrocyte calcium responses. Indeed, we have performed the spatial threshold analysis on early responders (first half of responding cells), and found the spatial threshold in that population (23.8%) is within the 95% confidence interval [21.2%, 24.0%]. Additionally, the slow responders were also within the confidence interval (22.6%).

      The second level of analysis refinement we suggest relates specifically to the issue of propagation and timing for the activity within "arbor", "soma" and "post-soma". Currently, the authors use an ROI-based approach that segments the "arbor" into domains. We suggest that this approach could be supplemented by a more robust temporal analysis. This could for example involve starting with temporal maps that take pixels above a certain amplitude and plot their timing relative to the stimulus-onset, or (better) the first active pixel of the astrocyte. This type of approach has become increasingly used (Bindocci et al., 2017; Wang et al., 2019; Ruprecht et al., 2022) and we think its use can greatly help clarify both the proposed sequence and better characterize the spatial threshold. We think this analysis should specifically address several important points:

      We agree that the creation of temporal maps from our own data would be interesting, and we provide the results of the suggested analysis within the new figure (new Figure 5) in the revised version of the manuscript. In this analysis we show that subthreshold, pre-soma and post-soma dynamics are significantly different in time. These added results of including temporal maps strengthen our claim of a spatial threshold, by quantifying the distinct temporal and spatial dynamics of domain activation before and after the spatial threshold is met (i.e. soma activation), and highlights differences in subthreshold and suprathreshold activity.

      (1) Where/when does the astrocyte activation begin? Understanding the beginning is very important, particularly because another potential spatial threshold - preceding the one the authors describe in the paper - could gate the initial activation of more distal processes, as discussed above. This sequentially earlier spatial threshold could (for example) rely on microdomain interaction with synaptic elements and (in contrast) be IP3R2 independent (Srinivasan et al., 2015, Stobart et al., 2018). We would be interested to know whether, in a subset of astrocytes that meet the structure and latency criteria proposed above and can produce global activation, there is an initial local GCaMP6f response of a minimal size that must occur before propagation towards the soma begins. The data associated with varying stimulus parameters could potentially be useful here and reveal stimulus intensity/duration-dependent differences.

      This is a very important point. It is difficult to pinpoint the beginning of the signal, which is why we rely on the average of responses. The additional analysis we provide based on temporal maps (new Figure 5) shows a very interesting result in that there is no significant difference between the spatial clustering of, or average distance between, activated domains in subthreshold and pre-soma suprathreshold activity. This result, along with the General Linear Model, suggests that there is not another subcellular potential spatial threshold, as the activity is the same. Instead, the main difference between activity in the domains that leads to soma activation or not is the overall percentage of domains active and not necessarily how that spatial activity is organized. We have also added this point in the Discussion section to highlight the importance of this result. P15, L3-8:

      “Close examinations of the calcium surge uncovered distinct propagations whether before or after soma activation. Firstly, our analysis found that temporal clustering changed before and after calcium surge, with both being above subthreshold activity, and that this characteristic was absent when assessing spatial clustering. When comparing the percent area, spatial and temporal clustering of active domains using a GLM, we found that the percent area was the most significant parameter describing a threshold to soma activation.”

      (2) Whether the propagation in the authors' experimental model is centripetal? This is implied throughout the manuscript but never shown. We think establishing whether (or not) the calcium dynamics are centripetal is important because it would clarify whether spatially adjacent domains within the "arbor" need to be sequentially active before reaching the threshold and then reaching the soma. More broadly, visualizing propagation will help to better visualize summation, which is presumably how the threshold is first reached (and overcome).

      The alternative hypothesis of a general excitability threshold, as discussed above, would be challenged here and possibly rejected, thereby clarifying the nature of the Ca2+ process that needs to reach a threshold for further expansion to the soma and other parts of the astrocyte.

      We agree that our view is centripetal when considering activity leading up to soma activation. Indeed, we have found arborization activity precedes soma activity (Figure 3), soma activity appears to rely on the percent area of domain activity (Figure 4), and pre-soma domain activity comes online earlier in domains distal from the soma (new Figure 5). However, whether this is intrinsic or due to the fact that synapses are more likely to occur in the periphery requires further studies. Our new results in the new Figure 5 demonstrating that subthreshold activity has a spatial organization that is not significantly different than pre-soma activity in suprathreshold cases argues in favor of a general excitability threshold hypothesis. However, we do not see these hypotheses as mutually exclusive. Excitingly, we have also found that following soma activation, calcium surge appears to follow a centrifugal propagation. We have since added the topic of a centripetal-centrifugal experimental model to the Discussion P15, L8-15:

      “We then compared the delay of domain activation and its distance from the soma, and recreated previous results that suggest a centripetal model of astrocytic calcium responses from the distal arborizations to the soma (Fedotova et al., 2023; Rupprecht et al., 2024). Here, we went a step further and discovered that soma activation switches this directionality for astrocytic calcium surge to propagate outward in a centrifugal manner away from the soma. Taken together, these results demonstrate the integrative potential of astrocyte calcium responses and characterize further the astrocyte calcium surge to relay this other parts of the astrocyte.”

      (3) In complement to the previous point: we understand that the spatial threshold does not per se have a location, but is there some spatial logic underlying the organization of active domains before the soma response occurs? One can easily imagine multiple scenarios of sparse heterogeneous GCaMP6f signal distributions that correspond to {greater than or equal to}22.6% of the arborization, but that would not be expected to trigger soma activation. For example, the diagram in Figure 4C showing the astrocyte response to 2Hz stim (which lacks a soma response) underscores this point. It looks like it has {greater than or equal to}22.6% activation that is sparsely localized throughout the arborization. If an alternative spatial distribution for this activity occurred, such that it localized primarily to a specific process within the arbor, would it be more likely to trigger a soma response?

      This is an interesting point and our new spatiotemporal analysis found in the new figure (new Figure 5) aims to shed some light on this and is answered above. To our knowledge, there is no mechanism in astrocytes to impose directionality on calcium propagation, like rectifying voltage-gated sodium channels in neuronal voltage propagation. We found that the delay of domain activation compared to soma onset is significantly correlated to the distance from the soma (new Figure 5E). In addition, spatial clustering is not significantly different compared in pre-soma vs. non responders or post-soma. Together this suggests that centripetal propagation may be occurring throughout the entire cell and not in a local clustered way. Our findings also suggest that following soma activation astrocyte calcium surge follows a mostly centrifugal pattern (new Figure 5E).

      (4) Does "pre-soma" activation predict the location and onset time of "post-soma" activation? For example, are arbor domains that were part of the "pre-soma" response the first to exhibit GCaMP6f signal in the "post-soma" response?

      Please see above comments.

      Reviewer #2 (Public Review):

      Lines et al investigated the integration of calcium signals in astrocytes of the primary somatosensory cortex. Their goal was to better characterize the mechanisms that govern the spatial characteristics of calcium signals in astrocytes. In line with previous reports in the field, they found that most events originated and stayed localized within microdomains in distal astrocyte processes, occasionally coinciding with larger events in the soma, referred to as calcium surges. As a single astrocyte communicates with hundreds of thousands of synapses simultaneously, understanding the spatial integration of calcium signals in astrocytes and the mechanisms governing the latter is of tremendous importance to deepen our understanding of signal processing in the central nervous system. The authors thus aimed to unveil the properties governing the emergence of calcium surges. The main claim of this manuscript is that there would be a spatial threshold of ~23% of microdomain activation above which a calcium surge, i.e. a calcium signal that spreads to the soma, is observed. Although the study provides data that is highly valuable for the community, the conclusions of the current version of the manuscript seem a little too assertive and general compared with what can be deduced from the data and methods used.

      The major strength of this study is the experimental approach that allowed the authors to obtain numerous and informative calcium recordings in vivo in the somatosensory cortex in mice in response to sensory stimuli as well as in situ. Notably, they developed an interesting approach to modulating the number of active domains in peripheral astrocyte processes by varying the intensity of peripheral stimulation (its amplitude, frequency, or duration).

      We thank the reviewer for their kind and thoughtful review of our study.

      The major weakness of the manuscript is the method used to analyze and quantify calcium activity, which mostly relies on the analysis of averaged data and overlooks the variability of the signals measured. As a result, the main claims from the manuscript seem to be incompletely supported by the data. The choice of the use of a custom-made semi-automatic ROI-based calcium event detection algorithm rather than established state-of-the-art software, such as the event-based calcium event detection software AQuA (DOI: 10.1038/s41593-019-0492-2), is insufficiently discussed and may bias the analysis. Some references on this matter include: Semyanov et al, Nature Rev Neuro, 2020 (DOI: 10.1038/s41583-020-0361-8); Covelo et al 2022, J Mol Neurosci (DOI: 10.1007/s12031-022-02006-w) & Wang et al, 2019, Nat Neuroscience (DOI: 10.1038/s41593-019-0492-2). Moreover, the ROIs used to quantify calcium activity are based on structural imaging of astrocytes, which may not be functionally relevant.

      Unfortunately, there is no general consensus for calcium analysis in the astrocyte or neuronal field, and many groups use custom made software made in lab or custom software such as GECIquant, STARDUST, AQuA or AQuA2. While AQuA is an event-based calcium event detection software, it may be that not including inactive domains that are SR101 positive could underestimate the spatial threshold for calcium surge. Our data is not based on the functional events but is based on calcium with structural constraints within a single astrocyte. This is crucial to properly determine the ratio of active vs inactive pixels within a single astrocyte.

      For the reasons listed above, the manuscript would probably benefit from some rephrasing of the conclusions and a discussion highlighting the advantages and limitations of the methodological approach. The question investigated by this study is of great importance in the field of neuroscience as the mechanisms dictating the spatio-temporal properties of calcium signals in astrocytes are poorly characterized, yet are essential to understand their involvement in the modulation of signal integration within neural circuits.

      We thank the reviewer for their suggestions to benefit the conclusions and discussion. We have now included a paragraph outlining the limitations of the study in the Discussion P15, L23-37:

      “The investigation of the spatial threshold could be improved in the future in a number of ways. One being the use of state-of-the-art imaging in 3D(Bindocci et al., 2017). While the original publication using 3D imaging to study astrocyte physiology does not necessarily imply that there would be different calcium dynamics in one axis over another, the three-dimensional examination of the spatial threshold could refine the findings we present here. To better control the system, mice imaged here were under anesthesia, and this is a method that has been used to characterize many foundational physiological results in the field (Hubel and Wiesel, 1962; Mountcastle et al., 1957). However, assessing the spatial threshold in awake freely moving animals would be the next logical step. In this study, we chose to limit our examinations of calcium activity that was within the bounds determined by SR101 staining. Much work has shown that astrocyte territories are more akin to sponge-like morphology with small microdomains making up the end feet of their distal arborizations (Baldwin et al., 2024). Here, we took a conservative approach to not incorporate these fine morphological processes and only take SR101-postive pixels for analysis in order to reduce the possible error of including a neighboring astrocyte or extracellular space in our analyses. Much work can be done to extend these results.”

      Reviewer #3 (Public Review):

      Summary:

      The study aims to elucidate the spatial dynamics of subcellular astrocytic calcium signaling. Specifically, they elucidate how subdomain activity above a certain spatial threshold (~23% of domains being active) heralds a calcium surge that also affects the astrocytic soma. Moreover, they demonstrate that processes on average are included earlier than the soma and that IP3R2 is necessary for calcium surges to occur. Finally, they associate calcium surges with slow inward currents. Strengths:

      The study addresses an interesting topic that is only partially understood. The study uses multiple methods including in vivo two-photon microscopy, acute brain slices, electrophysiology, pharmacology, and knockout models. The conclusions are strengthened by the same findings in both in vivo anesthetized mice and in brain slices.

      We thank the reviewer for the positive assessment of the study and his/her comments.

      Weaknesses:

      The method that has been used to quantify astrocytic calcium signals only analyzes what seems to be a small proportion of the total astrocytic domain on the example micrographs, where a structure is visible in the SR101 channel (see for instance Reeves et al. J. Neurosci. 2011, demonstrating to what extent SR101 outlines an astrocyte). This would potentially heavily bias the results: from the example illustrations presented it is clear that the calcium increases in what is putatively the same astrocyte goes well beyond what is outlined with automatically placed small ROIs. The smallest astrocytic processes are an order of magnitude smaller than the resolution of optical imaging and would not be outlined by either SR101 or with the segmentation method judged by the ROIs presented in the figures. Completely ignoring these very large parts of the spatial domain of an astrocyte, in particular when making claims about a spatial threshold, seems inappropriate. Several recent methods published use pixel-by-pixel event-based approaches to define calcium signals. The data should have been analyzed using such a method within a complete astrocyte spatial domain in addition to the analyses presented. Also, the authors do not discuss how two-dimensional sampling of calcium signals from an astrocyte that has processes in three dimensions (see Bindocci et al, Science 2017) may affect the results: if subdomain activation is not homogeneously distributed in the three-dimensional space within the astrocyte territory, the assumptions and findings between a correlation between subdomain activation and somatic activation may be affected.

      In order to reduce noise from individual pixels, we chose to segment astrocyte arborizations into domains of several pixels. As pointed out previously, including pixels outside of the SR101-positive territory runs the risk of including a pixel that may be from a neighboring cell or mostly comprised of extracellular space, and we chose the conservative approach to avoid this source of error. We agree that the results have limitations from being acquired in 2D instead of 3D, but it is likely to assume the 3D astrocyte is homogeneously distributed and that the 2D plane is representative of the whole astrocyte. Indeed, no dimensional effects were reported in Bindocci et al, Science 2017. We have included a paragraph in the discussion to address this limitation in our study on P15, L23-27:

      “The investigation of the spatial threshold could be improved in the future in a number of ways. One being the use of state-of-the-art imaging in 3D(Bindocci et al., 2017). While the original publication using 3D imaging to study astrocyte physiology does not necessarily imply that there would be different calcium dynamics in one axis over another, the three-dimensional examination of the spatial threshold could refine the findings we present here.”

      The experiments are performed either in anesthetized mice, or in slices. The study would have come across as much more solid and interesting if at least a small set of experiments were performed also in awake mice (for instance during spontaneous behavior), given the profound effect of anesthesia on astrocytic calcium signaling and the highly invasive nature of preparing acute brain slices. The authors mention the caveat of studying anesthetized mice but claim that the intracellular machinery should remain the same. This explanation appears a bit dismissive as the response of an astrocyte not only depends on the internal machinery of the astrocyte, but also on how the astrocyte is stimulated: for instance synaptic stimulation or sensory input likely would be dependent on brain state and concurrent neuromodulatory signaling which is absent in both experimental paradigms. The discussion would have been more balanced if these aspects were dealt with more thoroughly.

      Yes, we agree that this is a limitation, and we acknowledge this is in the Discussion P15, L27-31:

      “To better control the system, mice imaged here were under anesthesia, and this is a method that has been used to characterize many foundational physiological results in the field (Hubel and Wiesel, 1962; Mountcastle et al., 1957). However, assessing the spatial threshold in awake freely moving animals would be the next logical step.”

      The study uses a heaviside step function to define a spatial 'threshold' for somata either being included or not in a calcium signal. However, Fig 4E and 5D showing how the method separates the signal provide little understanding for the reader. The most informative figure that could support the main finding of the study, namely a ~23% spatial threshold for astrocyte calcium surges reaching the soma, is Fig. 4G, showing the relationship between the percentage of arborizations active and the soma calcium signal. A similar plot should have been presented in Fig 5 as well. Looking at this distribution, though, it is not clear why ~23% would be a clear threshold to separate soma involvement, one can only speculate how the threshold for a soma event would influence this number. Even if the analyses in Fig. 4H and the fact that the same threshold appears in two experimental paradigms strengthen the case, the results would have been more convincing if several types of statistical modeling describing the continuous distribution of values presented in Fig. 4E (in addition to the heaviside step function) were presented.

      We agree with the reviewer and have added to the paper a discussion for our justification on the use of the Heaviside step function, and have included this in the methods section. We chose the Heaviside step function to represent the on/off situation that we observed in the data that suggested a threshold in the biology. We agree with the reviewer that Fig. 4G is informative and demonstrates that under 23% most of the soma fluorescence values are clustered at baseline. We agree that a different statistical model describing the data would be more convincing and confirmed the spatial threshold with the use of a confidence interval in the text and supported the use of percent domains active for this threshold over other properties such as spatial or temporal clustering using a general linear model. P18-19, L34-2:

      “Heaviside step function

      The Heaviside step function below in equation 4 is used to mathematically model the transition from one state to the next and has been used in simple integrate and fire models (Bueno-Orovio et al., 2008; Gerstner, 2000).

      The Heaviside step function 𝐻(𝑎) is zero everywhere before the threshold area (𝑎 ) and one everywhere afterwards. From the data shown in Figure 4E where each point (𝑆(𝑎)) is an individual astrocyte response with its percent area (𝑎) domains active and if the soma was active or not denoted by a 1 or 0 respectively. To determine 𝑎 in our data we iteratively subtracted 𝐻(𝑎) from  𝑆(𝑎) for all possible values of 𝑎 to create an error term over 𝑎. The area of the minimum of that error term was denoted the threshold area.”

      The description of methods should have been considerably more thorough throughout. For instance which temperature the acute slice experiments were performed at, and whether slices were prepared in ice-cold solution, are crucial to know as these parameters heavily influence both astrocyte morphology and signaling. Moreover, no monitoring of physiological parameters (oxygen level, CO2, arterial blood gas analyses, temperature etc) of the in vivo anesthetized mice is mentioned. These aspects are critical to control for when working with acute in vivo two-photon microscopy of mice; the physiological parameters rapidly decay within a few hours with anesthesia and following surgery.

      We have increased the thoroughness of our methods section. Especially including that body temperature and respiration were indeed monitored throughout anesthesia.

      Recommendations for the authors:  

      Reviewer #1 (Recommendations For The Authors):

      (1) We think it would improve the paper if the authors provided a frame-by-frame example over (for example) 10-15 frames showing the spatiotemporal evolution of responses, where each frame represents 1s or 2s. This could be included with the temporal maps we proposed above.

      We agree that this is a useful example and have included it in our new figure (new Figure 5, specifically see Figure 5A) that uses temporal maps to analyze the spatiotemporal properties of calcium dynamics (Figure 5B).

      (2) Concerning the evidence in the present manuscript, we are not clear on what "populations" means. Can the authors clarify in methods? It is our understanding that 987 astrocytes from 30 populations from 3 mice were the source for the core data in the paper. What are the 30 populations, and how were the 987 astrocytes distributed across the populations? Are they roughly 10 FOVs per mouse? If so, please clarify roughly how far apart FOVs from the same mouse were, and how much delay between stim protocol application there was when a FOV was changed to a new FOV. Also, if for example, the 10th FOV from mouse 1 "saw" 9 rounds of stimulation before recording the response to the 10th stim round. To this point, was there any indication of response differences in populations that were recorded earlier vs later in the experimental sequence for each mouse?

      Descriptions of data will be included with the uploaded datasets following acceptance.

      (3) The description of the results on page 6 is a bit confusing for us. In lines 1-4, are the authors saying that 57.7% of astrocytes in a FOV exhibited responses within their soma and arborization, while 15.1% had responses only in arborization? If so, this is not clear to us from Figure 2C, where we count ~25 astrocytes in the FOV, maybe 8 or 9 astrocytes with activity in the arborization + soma (after stimulation), and 8 or 9 astrocytes with responses only in arborization. Is there something we do not understand, or is the second panel simply not representative of the group data?

      Figure 2D is representative of the group data and does indeed show 57.7% of the population responds within the soma and arborization, and a 15.1% of astrocytes with responses in only their arborizations. It is unable to observe in this image whether arborizations are active or just increases in one or a few domains, as may not be enough activity to be detected when sampling over the entire arborization.

      (4) In the second part of page 6 - when the authors apply linear regression - are they saying that there is a linear relationship between the amount (area) of activity measured in the arborization versus the soma, where populations of astrocytes with 50% activation of the arborization also tend to have 50% activation in their somas? If so, then this is not apparent by the map provided in Figure 2C, where it looks like soma activation (within the subpopulation) is 100% irrespective of the apparent activity in the arborization. This needs to be clarified. If not, and what they mean is that the probability of finding an active soma is related to the amount of activation within the arborization, this needs to be stated more clearly.

      When testing the linear relationship between somas active vs arborizations active, we find a significant linear correlation (p < 0.001, R2 = 0.90).

      (5) In the experiments where stimulation duration, frequency, and intensity were varied to determine the percentage of domains that were on, it would be helpful to better understand the protocol in terms of sequence. In the methods it seems that hindpaw stimulation intensity was first pseudo-randomly varied at 2Hz for 10s, followed by pseudorandomly varied stimulation frequency and then pseudo-randomly varied duration - both at 2mA for 10s. Is this correct?

      We have since updated the methods section to better describe the experimental protocol.

      (6) In Figure 3E the alignment of the "arbor" to the somatic response is a bit misleading. The signals being averaged for the "arbor" are composed of temporally heterogeneous sources (from distal and proximal domains) and when averaged will produce an artificially slow rise time. In contrast, the averaged somatic signals are composed of much more homogenous sources (arising from a more singular event) and therefore have a sharp rise time. It would make more sense to align their kinetics relative to the stimulus onset. It would also make more sense to compare the somatic response of astrocytes to the "arbor" of astrocytes which respond rapidly vs slowly to the foot-shock.

      Aligning the responses to the stimulus onset would exacerbate the artificially slow rise time for the soma and arborization as not all cells come online at the same time from stimulus onset.

      Reviewer #2 (Recommendations For The Authors):

      Data availability

      It seems that the data is not shared on a public repository, while it appears to be necessary according to eLife's general principles (see https://elife-rp.msubmit.net/html/eliferp_author_instructions.html#dataavailability).

      We will upload raw data to a repository upon acceptance of the manuscript.

      Data analysis

      - Why did the authors choose the heaviside step function to characterize conditions for somatic event initiation? It seems that this approach is averaging very heterogeneous data (some cells do not display somatic events even with ~50% domains active while some display somatic events with < 5 it seems).

      Please see discussion to variability in the responses to the public reviews. We have since included more discussion on the use of the Heaviside step function in the Methods section.  

      - Averaging of the data. It seems that the approach chosen to quantify calcium activity overlooks the variability of the signals measured ("Astrocyte calcium quantifications were averaged over all astrocytes of a single video and these values were used in statistical testing.", l.22-23, page 15). What is the variability of the measured features between different astrocytes? Between different animals? To what extent does this averaging strategy overlook the variability of the signals/how much information do we expect to lose? The manuscript would probably benefit from a more advanced statistical approach to analyze the data.

      Is it possible to extract information from the data that would indicate mechanisms allowing somatic activity when the percentage of domain activation was lower than the threshold? How about the opposite (i.e when no global event was triggered even when the percentage of domain activation was high)?

      We are indeed combining the responses from many different diverse astrocyte responses, and we see this as a strength of the paper. Variation is a hallmark of biology, and we have added this to the discussion. In the rare cases where astrocyte somas do not come online when the percent of arborizations is over threshold, or the opposite when somas activate with little domain activation, we would say this is most likely due to imaging 2D instead of the entire 3D cell. We have also added this into our discussion.

      - Here are a few suggestions for additional analysis that might be of interest to the community:

      - Measuring calcium activity in domains depending on their distance from the soma. This would allow us to better understand the spatial integration of the signals and notably answer the following question: Does the emergence of somatic events depend on the spatial distribution of active domains? (and does a smaller domain-soma distance facilitate the emergence of a calcium surge with a lower percentage of active domains?) These measurements could be visualized with plots of xy position of the domains (domain-soma distance) = f(time) with a colormap reflecting dF/F0, for example, at different times pre- and post-somatic events. Instead of DF/F0, these plots could also display the correlation between domain activities.

      We have performed this analysis, and it is now in the new figure (new Figure 5).

      - Adding temporality to the data analysis. It seems that calcium activity is "concatenated" during the whole duration prior to the somatic event (pre-soma) and after (post-soma). However, it is unclear how long the domains remained active and how many domains were still active at the onset of the somatic event. Adding a finer temporal analysis might help answer questions such as the potential need for some degree of synchronization of domain activity to trigger calcium surges.

      It could notably be interesting to measure the level of synchrony of events as a function of their distance from the soma and to analyze how it correlates with the properties of the somatic event.

      We have now included temporal analysis of astrocyte calcium surge in our new figure (new Figure 5). While we did see examples of spatially clustered domain activation in our data, those examples usually included other non-clustered domain activities and when including all of the active domains within an astrocytes arborization, we found no difference between the distance between activated domains before and after soma activation, even when comparing to subthreshold domain activity.

      Experiments

      - Would it be possible to apply different levels of stimulation to a given cell in order to discriminate whether the "no-soma" cells can display somatic events when neuronal activity is enhanced?

      Increased sensory stimulation does increase soma activity (Please see Lines et al., Nature Communications, 2020). An example of increased stimulation leading to somatic activation where it was not present in lower stimuli can be seen in Figure 4A-C.

      - Why choose a stimulation of 2 mA, 2 Hz for 20 sec in the experiments on IP3R2-/- mice?

      Has the same set of various stimulation protocols featured in Figure 4 been applied to IP3R2-/- mice? If so, were more domains activated as stimulation intensity (amplitude; duration, or frequency) increased? Could it trigger somatic events? This information seems necessary to be able to assert that calcium surges rely on the IP3R2 pathway.

      These experiments were not performed.

      -  Adding intermediary values of ATP pulse duration to Figure 6 (e.g. 50 ms and 75 ms) might strengthen the claim that the linear increase of SIC frequency with ATP application duration is only observed above the ~23% threshold.

      Agreed, however these experiments were not performed.

      Minor corrections to the text and figures.

      Methods

      The reader might benefit from a little more detail regarding the analysis of calcium signals. Notably, what was the duration of the calcium recordings? Was it constant across the different conditions tested in the study? Was it different in slice experiments versus in vivo experiments? What were the durations of the pre- and post- soma recordings and their variability? Was the calcium activity normalized for each astrocyte or animal? If not, why not consider normalizing the post-stimulation activity with pre-stimulation baseline activity?

      Similarly, some information on the stimulation protocol seems to be lacking: what was the frequency and intensity of the stimulus in the experiments where stimulus duration varied? Concurrently, what were the duration and intensity when frequency varied? What were the duration and frequency when the intensity varied?

      It might be beneficial to add further information on the algorithm of the Calsee software. What is it performing? How was it tested? Why is it referred to as "semi"-automatic, i.e. what might the user be needing to do manually? The segmentation seems to be omitting some branches connecting distal ROIs to the soma (see e.g. Fig S1.E). How would this influence the analysis and results?

      Results

      - Some assessments in the manuscript seem a bit too assertive/general compared to what can be deduced from the evidence presented in the figures. It could be beneficial to the reader to rephrase the latter. Some examples are listed below:

      - "These results indicate that astrocyte responses occurred initially in the arborizations, which is consistent with the idea that synapses are likely to be accessed at the astrocyte arborization ", l.11-12 page 7. The fact that the time to peak is lower in the arborization does not necessarily mean that signals initiate there. It could be because the kinetics/pathways in those compartments are different or there could be a dilution effect in the soma. Indeed, an influx of the same amount of calcium ions in the soma vs in a small domain will not correspond to the same DF/F0 in those compartments and might thus remain undetected in the soma.

      - "Using transgenic IP3R2-/- mice, we found that the activation of type-2 IP3 receptors is necessary for the generation of astrocyte calcium surge" (page 4, line 1-2), "present data further demonstrate that IP3R2 are necessary for the propagation of astrocyte calcium surge." (l. 18-19 page 13) -> As discussed above, the evidence does not seem to be strong enough to assert that IP3R2 is necessary to trigger somatic events. The results indicate that the IP3R2 pathway seems to facilitate the emergence of somatic events. As astrocytes differ strongly in terms of morphology and expression profiles depending on physiological conditions, the conclusions of this study might only apply to the specific experimental conditions used: region studied, age of the animal, type of sensory stimuli performed, and so on.

      - "These results indicate that spatial threshold of the astrocyte calcium surge has a functional impact on gliotransmission, which have important consequences on the spatial extension of the astrocyte-neuron communication and synaptic regulation", l.41-48 page 11. Figure 6 seems to indicate a correlation between the proportion of astrocyte domains activated and the frequency of SICs. The data seems insufficient to conclude that there is a causal relationship between calcium surge in the astrocyte and gliotransmission or SIC frequency.

      -" These results indicate that, on average, subcellular calcium events located in astrocyte arborizations are related to soma activation.", page 6 l 15-16. It may be more informative to specify the correlation measured: i.e the larger the arborization activity, the larger the percentage of active somas.

      Figures

      Figure 2: Adding more details in the figure legend explaining how the different parameters are calculated might be useful to the reader. Notably, what does soma active (%) refer to?

      Figure 3: Could it be possible to add individual traces of calcium activity in the soma and arborization of individual cells to provide a glimpse of the variability of the signals measured?

      Fig4. B-C: Could it be possible to add in the legend information on the timeline between stimulation and calcium signal recording? (and the duration of the latter).

      Fig4 D-E: Why is the maximum number of active domains in panel D ~50-60% but goes up to ~100% in panel E? Could it be that plotting SEM rather than STD might misrepresent the variability in the percentage of active domains for each stimulus property?

      Fig4F: It seems that the threshold changes with the frequency of the stimulus: e.g. at 10 Hz, the threshold seems larger than 22.6%. What would that mean?

      Fig4G: - Why do some data points display a soma amplitude < 0 DF/F0 ?

      - Why choose a sigmoid fit? What are the statistics associated to the fit? Is it in accordance with the threshold of 23%? Would a linear fit provide a good fit?

      Fig5F: - It seems that a few IP3R2-/- astrocytes displayed somatic events? If so, it might be interesting to mention this in the discussion section and to speculate on why that might be. - It seems that panel 5F displays the average percentage of somas that got activated rather than the probability of somatic events.

      - Is it possible that the effect seen in domains vs arborization is due to statistical effects (as n=2450 vs 112)?

      Fig S1: Panel D legend: double labeling of the radius used for each plot might be useful, notably for colorblind readers as the colors might be hard to see.

      Discussion

      - The discussion section might benefit from a discussion on the similitude between the data presented here and previous reports that reported similar results, i.e that most calcium signals in astrocytes were located in the distal processes, forming microdomains that rarely propagated to the soma. These include Bindocci et al 2017 Science (DOI:10.1126/science.aai8185) and Georgiou et al, Science Advances, 2022 (DOI: 10.1126/sciadv.abe5371).

      Thank you for the suggestions. We have now changed portions of the Methods, Results  and Discussion sections.

      Reviewer #3 (Recommendations For The Authors):

      The text could potentially be improved somewhat.

      Thank you.

    1. Author response:

      The following is the authors’ response to the original reviews.

      Public Reviews:

      Reviewer #1 (Public Review):

      Summary:

      There is a long-standing idea that choices influence evaluation: options we choose are re-evaluated to be better than they were before the choice. There has been some debate about this finding, and the authors developed several novel methods for detecting these re-evaluations in task designs where options are repeatedly presented against several alternatives. Using these novel methods the authors clearly demonstrate this re-evaluation phenomenon in several existing datasets.

      Strengths:

      The paper is well-written and the figures are clear. The authors provided evidence for the behaviour effect using several techniques and generated surrogate data (where the ground truth is known) to demonstrate the robustness of their methods.

      Weaknesses:

      The description of the results of the fMRI analysis in the text is not complete: weakening the claim that their re-evaluation algorithm better reveals neural valuation processes.

      We appreciate the reviewer’s comment regarding the incomplete account of the fMRI results. In response, we implemented Reviewer #2's suggestion to run additional GLM models for a clearer interpretation of our findings. We also took this opportunity to apply updated preprocessing to the fMRI data and revise the GLM models, making them both simpler and more comprehensive. The results section is thus substantially revised, now including a new main figure and several supplemental figures that more clearly present our fMRI findings. Additionally, we have uploaded the statistical maps to NeuroVault, allowing readers to explore the full maps interactively rather than relying solely on the static images in the paper. The new analyses strengthen our original conclusion: dynamic values (previously referred to as revalued values, following the reviewer’s suggestion) better explain BOLD activity in the ventromedial prefrontal cortex, a region consistently associated with valuation, than static values (values reported prior to the choice phase in the auction procedure).

      Reviewer #2 (Public Review):

      Summary:

      Zylberberg and colleagues show that food choice outcomes and BOLD signal in the vmPFC are better explained by algorithms that update subjective values during the sequence of choices compared to algorithms based on static values acquired before the decision phase. This study presents a valuable means of reducing the apparent stochasticity of choices in common laboratory experiment designs. The evidence supporting the claims of the authors is solid, although currently limited to choices between food items because no other goods were examined. The work will be of interest to researchers examining decision-making across various social and biological sciences.

      Strengths:

      The paper analyses multiple food choice datasets to check the robustness of its findings in that domain.

      The paper presents simulations and robustness checks to back up its core claims.

      Weaknesses:

      To avoid potential misunderstandings of their work, I think it would be useful for the authors to clarify their statements and implications regarding the utility of item ratings/bids (e-values) in explaining choice behavior. Currently, the paper emphasizes that e-values have limited power to predict choices without explicitly stating the likely reason for this limitation given its own results or pointing out that this limitation is not unique to e-values and would apply to choice outcomes or any other preference elicitation measure too. The core of the paper rests on the argument that the subjective values of the food items are not stored as a relatively constant value, but instead are constructed at the time of choice based on the individual's current state. That is, a food's subjective value is a dynamic creation, and any measure of subjective value will become less accurate with time or new inputs (see Figure 3 regarding choice outcomes, for example). The e-values will change with time, choice deliberation, or other experiences to reflect the change in subjective value. Indeed, most previous studies of choice-induced preference change, including those cited in this manuscript, use multiple elicitations of e-values to detect these changes. It is important to clearly state that this paper provides no data on whether e-values are more or less limited than any other measure of eliciting subjective value. Rather, the paper shows that a static estimate of a food's subjective value at a single point in time has limited power to predict future choices. Thus, a more accurate label for the e-values would be static values because stationarity is the key assumption rather than the means by which the values are elicited or inferred.

      Thank you for this helpful comment. We changed the terminology following the reviewer’s suggestion. The “explicit” values (e-values or ve) are now called “static” values (s-values or vs). Accordingly, we also changed the “Reval” values (r-values or vr) to “dynamic” values (d-values or vd).

      We also address the reviewer's more general point about the utility of item ratings/bids (s-values) and whether our results are likely to hold with other ways of eliciting subjective values. We added a new sub-section in Discussion addressing this and other limitations of our study. To address the reviewer’s point, we write:

      “One limitation of our study is that we only examined tasks in which static values were elicited from explicit reports of the value of food items. It remains to be determined if other ways of eliciting subjective values (e.g., Jensen and Miller, 2010) would lead to similar results. We think so, as the analysis of trials with identical item pairs (Fig. 3) and the difference between forward and backward Reval (Fig. 7) are inconsistent with the notion that values are static, regardless of their precise value. It also remains to be determined if our results will generalize to non-food items whose value is less sensitive to satiety and other dynamic bodily states. Perceptual decisions also exhibit sequential dependencies, and it remains to be explored whether these can be explained as a process of value construction, similar to what we propose here for the food-choice task (Gupta et al., 2024; Cho et al., 2002; Zylberberg et al., 2018; Abrahamyan et al., 2016).”

      There is a puzzling discrepancy between the fits of a DDM using e-values in Figure 1 versus Figure 5. In Figure 1, the DDM using e-values provides a rather good fit to the empirical data, while in Figure 5 its match to the same empirical data appears to be substantially worse. I suspect that this is because the value difference on the x-axis in Figure 1 is based on the e-values, while in Figure 5 it is based on the r-values from the Reval algorithm. However, the computation of the value difference measure on the two x-axes is not explicitly described in the figures or methods section and these details should be added to the manuscript. If my guess is correct, then I think it is misleading to plot the DDM fit to e-values against choice and RT curves derived from r-values. Comparing Figures 1 and 5, it seems that changing the axes creates an artificial impression that the DDM using e-values is much worse than the one fit using r-values.

      We agree with the reviewer that this way of presenting the DDM fits could be misleading. In the previous version of the manuscript, we included the two fits in the same figure panel to make it clear that the sensitivity (slope) of the choice function is greater when we fit the data using the r-values (now d-values) than when we fit them using the e-values (now s-values). In the revised version of Figure 5, we include the data points already shown in Figure 1, so that each DDM fit is shown with their corresponding data points. Thus we avoid giving the false impression that the DDM model fit using the s-values is much worse than the one fit using the d-values. This said, the fit is indeed worse, as we now show with the formal model comparison suggested by the reviewer (next comment).

      Relatedly, do model comparison metrics favor a DDM using r-values over one using e-values in any of the datasets tested? Such tests, which use the full distribution of response times without dividing the continuum of decision difficulty into arbitrary hard and easy bins, would be more convincing than the tests of RT differences between the categorical divisions of hard versus easy.

      We now include the model comparison suggested by the reviewer. The comparison shows that the DDM model using dynamic values explains the choice and response time data better than one using static values. One potential caveat of this comparison, which explains why we did not include it in the original version of the manuscript, is that the d-values are obtained from a fit to the choice data, which could bias the subsequent DDM comparison. We control for this in three ways: (1) by calculating the difference in Bayesian Information Criterion (BIC) between the models, penalizing the DDM model that uses the d-values for the additional parameter (δ); (2) by comparing the difference in BIC against simulations of a model in which the choice and RT data were obtained assuming static values; this analysis shows that if values were static, the DDM using static values would be favored in the comparison despite having one fewer parameter; (3) ignoring the DDM fit to the choices in the model comparison, and just comparing how well the two models explain the RTs; this comparison is unbiased because the δ values are fit only to the choice data, not the RTs. These analyses are now included in Figure 5 and Figure 5–Figure supplement 2.

      Revaluation and reduction in the imprecision of subjective value representations during (or after) a choice are not mutually exclusive. The fact that applying Reval in the forward trial order leads to lower deviance than applying it in the backwards order (Figure 7) suggests that revaluation does occur. It doesn't tell us if there is also a reduction in imprecision. A comparison of backwards Reval versus no Reval would indicate whether there is a reduction in imprecision in addition to revaluation. Model comparison metrics and plots of the deviance from the logistic regression fit using e-values against backward and forward Reval models would be useful to show the relative improvement for both forms of Reval.

      We agree with the reviewer that the occurrence of revaluation does not preclude other factors from affecting valuation. Following the reviewer’s suggestion we added a panel to Figure 6 (new panel B), in which we show the change in the deviance from the logistic regression fits between Reval (forward direction) and no-Reval. The figure clearly shows that the difference in deviance for the data is much larger than that obtained from simulations of choice data generated from the logistic fits to the static values (shown in red).

      Interestingly, we also observe that the deviance obtained after applying Reval in the backward direction is lower than that obtained using the s-values. We added a panel to figure 7 showing this (Fig. 7B). This observation, however, does not imply that there are factors affecting valuation besides revaluation (e.g.,”reduction in imprecision”). Indeed, as we now show in a new panel in Figure 11 (panel F), the same effect (lower deviance for backward Reval than no-Reval) is observed in simulations of the ceDDM.

      Besides the new figure panels (Fig. 6B, 7B, 11F), we mention in Discussion (new subsection, “Limitations...”, paragraph #2) the possibility that there are other non-dynamic contributions to the reduction in deviance for Backward Reval compared to no-Reval:

      “Another limitation of our study is that, in one of the datasets we analyzed (Sepulveda et al. 2020), applying Reval in the forward direction was no better than applying it in the backward direction (Fig. 10). We speculate that this failure is related to idiosyncrasies of the experimental design, in particular, the use of alternating blocks of trials with different instructions (select preferred vs. select non-preferred). More importantly, Reval applied in the backward direction led to a significant reduction in deviance relative to that obtained using the static values. This reduction was also observed in the ceDDM, suggesting that the effect may be explained by the changes in valuation during deliberation. However, we cannot discard a contribution from other, non-dynamic changes in valuation between the rating and choice phase including contextual effects (Lichtenstein and Slovic, 2006), stochastic variability in explicit value reporting (Polania et al., 2019), and the limited range of numerical scales used to report value.”

      Did the analyses of BOLD activity shown in Figure 9 orthogonalize between the various e-valueand r-value-based regressors? I assume they were not because the idea was to let the two types of regressors compete for variance, but orthogonalization is common in fMRI analyses so it would be good to clarify that this was not used in this case. Assuming no orthogonalization, the unique variance for the r-value of the chosen option in a model that also includes the e-value of the chosen option is the delta term that distinguishes the r and e-values. The delta term is a scaled count of how often the food item was chosen and rejected in previous trials. It would be useful to know if the vmPFC BOLD activity correlates directly with this count or the entire r-value (e-value + delta). That is easily tested using two additional models that include only the r-value or only the delta term for each trial.

      We did not orthogonalize the static value and dynamic value regressors. We have included this detail in the revised methods. We thank the reviewer for the suggestion to run additional models to improve our ability to interpret our findings. We have substantially revised all fMRI-related sections of the paper. We took this opportunity to apply standardized and reproducible preprocessing steps implemented in fmriprep, present whole-brain corrected maps on a reconstructed surface of a template brain, and include links to the full statistical maps for the reader to navigate the full map, rather than rely on the static image in the figures. We implemented four models in total: model 1 includes both static value (Vs) obtained during the auction procedure prior to the choice phase and dynamic value (Vd) output by the revaluation algorithm (similar to the model presented in the first submission); model 2 includes only delta = Vd - Vs; model 3 includes only Vs; model 4 includes only Vd. All models included the same confound and nuisance regressors. We found that Vd was positively related to BOLD in vmPFC when accounting for Vs, correcting for familywise error rate at the whole brain level. Interestingly, the relationship between delta and vmPFC BOLD did not survive whole-brain correction and the effect size of the relationship between Vd and vmPFC bold in model 4 was larger than the effect size of the relationship between Vs and vmPFC bold in model 3 and survived correction at the whole brain level encompassing more of the vmPFC. Together, these findings bolster our claim that Vd better accounts for BOLD variability in vmPFC, a brain region reliably linked to valuation.

      Please confirm that the correlation coefficients shown in Figure 11 B are autocorrelations in the MCMC chains at various lags. If this interpretation is incorrect, please give more detail on how these coefficients were computed and what they represent.

      We added a paragraph in Methods explaining how we compute the correlations in Figure 11B (last paragraph of the sub-section “Correlated-evidence DDM” in Methods):

      “The correlations in Fig. 11B were generated using the best-fitting parameters for each participant to simulate 100,000 Markov chains. We generate Markov chain samples independently for the left and right items over a 1-second period. To illustrate noise correlations, the simulations assume that the static value of both the left and right items is zero. We then and for each of the Markov chains (𝑥). Pearson's𝑥 correlation is computed between these 𝑡 calculate the difference in dynamic value ( ) between the left and right items at each time (𝑡) differences at time zero, 𝑥𝑖(𝑡 = 0), and at time 𝑥𝑖(𝑡 = τ), for different time lags τ. Correlations were calculated independently for each participant. Each trace in Fig. 11B represents a different participant.”

      The paper presents the ceDDM as a proof-of-principle type model that can reproduce certain features of the empirical data. There are other plausible modifications to bounded evidence accumulation (BEA) models that may also reproduce these features as well or better than the ceDDM. For example, a DDM in which the starting point bias is a function of how often the two items were chosen or rejected in previous trials. My point is not that I think other BEA models would be better than the ceDDM, but rather that we don't know because the tests have not been run. Naturally, no paper can test all potential models and I am not suggesting that this paper should compare the ceDDM to other BEA processes. However, it should clearly state what we can and cannot conclude from the results it presents.

      Indeed, the ceDDM should be interpreted as a proof-of-principle model, which shows that drifting values can explain many of our results. It is definitely wrong in the details, and we are open to the possibility that a different way of introducing sequential dependencies between decisions may lead to a better match to the experimental data. We now mention this in a new subsection of Discussion, “Limitations...” paragraph #3:

      “Finally, we emphasize that the ceDDM should be interpreted as a proof-of-principle model used to illustrate how stochastic fluctuations in item desirability can explain many of our results. We chose to model value changes following an MCMC process. However, other stochastic processes or other ways of introducing sequential dependencies (e.g., variability in the starting point of evidence accumulation) may also explain the behavioral observations. Furthermore, there likely are other ways to induce changes in the value of items other than through past decisions. For example, attentional manipulations or other experiences (e.g., actual food consumption) may change one's preference for an item. The current version of the ceDDM does not allow for these influences on value, but we see no fundamental limitation to incorporating them in future instantiations of the model.”

      This work has important practical implications for many studies in the decision sciences that seek to understand how various factors influence choice outcomes. By better accounting for the context-specific nature of value construction, studies can gain more precise estimates of the effects of treatments of interest on decision processes.

      Thank you!

      That said, there are limitations to the generalizability of these findings that should be noted.

      These limitations stem from the fact that the paper only analyzes choices between food items and the outcomes of the choices are not realized until the end of the study (i.e., participants do not eat the chosen item before making the next choice). This creates at least two important limitations. First, preferences over food items may be particularly sensitive to mindsets/bodily states. We don't yet know how large the choice deltas may be for other types of goods whose value is less sensitive to satiety and other dynamic bodily states. Second, the somewhat artificial situation of making numerous choices between different pairs of items without receiving or consuming anything may eliminate potential decreases in the preference for the chosen item that would occur in the wild outside the lab setting. It seems quite probable that in many real-world decisions, the value of a chosen good is reduced in future choices because the individual does not need or want multiples of that item. Naturally, this depends on the durability of the good and the time between choices. A decrease in the value of chosen goods is still an example of dynamic value construction, but I don't see how such a decrease could be produced by the ceDDM.

      These are all great points. The question of how generalizable our results are to other domains is wide open. We do have preliminary evidence suggesting that in a perceptual decision-making task with two relevant dimensions (motion and color; Kang, Loffler et al. eLife 2021), the dimension that was most informative to resolve preference in the past is prioritized in future decisions. We believe that a similar process underlies the apparent change in value in value-based decisions. We decided not to include this experiment in the manuscript, as it would make the paper much longer and the experimental designs are very different. Exploring the question of generality is a matter for future studies.

      We also agree that food consumption is likely to change the value of the items. For example, after eating something salty we are likely to want something to drink. We mention in the revised manuscript that time, choice deliberation, attentional allocation and other experiences (including food consumption) are likely to change the value of the alternatives and thus affect future choices and valuations.

      The ceDDM captures only sequential dependencies that can be attributed to values that undergo diffusion-type changes during deliberation. While the ceDDM captures many of the experimental observations, the value of an item may change for reasons not captured by the ceDDM. For example, food consumption is likely to change the value of items (e.g., wanting something to drink after eating something salty). The reviewer is correct that the current version of ceDDM could not account for these changes in value. However, we see no fundamental limitation to extending the ceDDM to account for them.

      We discuss these issues in a new subsection in Discussion (“Limitations...” paragraph #3).

      Recommendations for the authors:

      Reviewer #1 (Recommendations For The Authors):

      Summary

      The authors address assumptions of bounded accumulation of evidence for value-based decision-making. They provide convincing evidence that subjects drift in their subjective preferences across time and demonstrate valuable methods to detect these drifts in certain task designs.

      My specific comments are intended to assist the authors with making the paper as clear as possible. My only major concern is with the reporting of the fMRI results.

      Thank you, please see our responses above for a description of the changes we made to the fMRI analyses.

      Specific comments

      - In the intro, I would ask the authors to consider the idea that things like slow drift in vigilance/motivation or faster drifts in spatial attention could also generate serial dependencies in perceptual tasks. I think the argument that these effects are larger in value-based tasks is reasonable, but the authors go a bit too far (in my opinion) arguing that similar effects do not exist *at all* in perceptual decision-making.

      We added a sentence in the Discussion (new section on Limitations, paragraph #1) mentioning some of the literature on sequential dependencies in perceptual tasks and asking whether there might be a common explanation for such dependencies for perceptual and value-based decisions. We tried including this in the Introduction, but we thought it disrupted the flow too much.

      - Figure 1: would it not be more clear to swap the order of panels A and B? Since B comes first in the task?

      We agree, we swapped the order of panels A and B.

      - Figure 2: the label 'simulations' might be better as 'e-value simulations'

      Yes, we changed the label ‘simulations’ to ‘simulations with s-values’ (we changed the term explicit value to static value, following a suggestion by Reviewer #2).

      - For the results related to Figure 2, some citations related to gaps between "stated versus revealed preferences" seem appropriate.

      We added a few relevant citations where we explain the results related to Figure 2.

      - Figure 3: in addition to a decrease in match preferences over the session, it would be nice to look at other features of the task which might have varied over the session. e.g. were earlier trials more likely to be predicted by e-value?

      We do see a trend in this direction, but the effect is not significant. The following figure shows the consistency of the choices with the stated values, as a function of the |∆value|, for the first half (blue) and the second half (red) of the trials. The x-axis discretizes the absolute value of the difference in static value between the left and right items, binned in 17 bins of approximately equal number of trials.

      Author response image 1.

      The slope is shallower for the second half, but a logistic regression model revealed that the difference is not significant:

      ,

      where Ilate is an indicator variable that takes a value of 1 for the second half of the trials and zero otherwise.

      As expected from the figure β2 was negative (-0.15) but the effect was not significant (p-value =0.32, likelihood ratio test).

      We feel we do not have much to say about this result, which may be due to lack of statistical power, so we would rather not include this analysis in the revised manuscript.

      It is worth noting that if we repeat the analysis using the dynamic values obtained from Reval instead of the static values, the consistency is overall much greater and little difference is observed between the first and second halves of the experiment:

      Author response image 2.

      - The e-value DDM fit in Figure 1C/D goes through the points pretty well, but the e-value fits in 5A do not because of a mismatch with the axis. The x-axis needs to say whether the value difference is the e-value or the r-value. Also, it seems only fair to plot the DDM for the r-value on a plot with the x-axis being the e-value.

      Thank you for this comment, we have now changed Figure 5A, such that both sets of data points are shown (data grouped by both e-values and by r-values). We agree that the previous version made it seem as if the fits were worse for the DDM fit to the e-values. The fits are indeed worse, as revealed by a new DDM model comparison (Figure 5–Figure supplement 2), but the effect is more subtle than the previous version of the figure implied.

      - How is Figure 5B "model free" empirical support? The fact that the r-value model gives better separation of the RTs on easy and hard trials doesn't seem "model-free" and also it isn't clear how this directly relates to being a better model. It seems that just showing a box-plot of the R2 for the RT of the two models would be better?

      We agree that “model free” may not be the best expression, since the r-values (now d-values) are derived from a model (Reval). Our intention was to make clear that because Reval only depends on the choices, the relationship between RT and ∆vdynamic is a prediction. We no longer use the term, model free, in the caption. We tried to clarify the point in Results, where we explain this figure panel. We have also included a new model comparison (Figure 5–Figure supplement 2), showing that the DDM model fit to the d-values explains choice and RT better than one fit to the s-values.

      This said, we do consider the separation in RTs between easy and hard trials to be a valid metric to compare the accuracy of the static and dynamic values. The key assumption is that there is a monotonically decreasing relationship between value difference, ∆v, and response time. The monotonic relationship does not need to hold for individual trials (due to the noisiness of the RTs) but should hold if one were to average a large enough number of trials for each value of ∆v.

      Under this assumption, the more truthful a value representation is (i.e., the closer the value we infer is to the true subjective value of the item on a given trial, assuming one exists), the greater the difference in RTs between trials judged to be difficult and those considered easy. To illustrate this with an extreme case, if an experimenter’s valuation of the items is very inaccurate (e.g., done randomly), then on average there will be no difference between easy and difficult RTs as determined by this scoring.

      - Line 189: Are the stats associated with Eq 7, was the model fit subject by subject? Combining subjects? A mixed-effects model? Why not show a scatter plot of the coefficients of Δvₑ and Δvᵣ (1 point/subject).

      The model was not fit separately for each subject. Instead, we concatenated trials from all subjects, allowing each subject to have a different bias term (β0,i ).

      We have now replaced it with the analysis suggested by the reviewer. We fit the logistic regression model independently for each participant. The scatter plot suggested by the reviewer is shown in Figure 5–Figure supplement 1. Error bars indicate the s.e. of the regression coefficients:

      It can be seen that the result is consistent with what we reported before: βd is significantly positive for all participants, while βs is not.

      - I think Figure S1 should be a main figure.

      Thank you for this suggestion, we have now included the former Figure S1 as an additional panel in Figure 5.

      - Fig 9 figure and text (line 259) don't exactly match. In the text it says that the BOLD correlated with vᵣ and not vₑ, but the caption says there were correlations with vᵣ after controlling for vₑ. Is there really nothing in the brain that correlated with vₑ? This seems hard to believe given how correlated the two estimates are. In the methods, 8 regressors are described. A more detailed description of the results is needed.

      Thank you for pointing out the inconsistency in our portrayal of the results in the main text and in the figure caption. We have substantially revised all fMRI methods, re-ran fMRI data preprocessing and implemented new, simpler, and more comprehensive GLM models following Reviewer #2's suggestion. Consequently, we have replaced Figure 9, added Figure 9 — Figure Supplement 1, and uploaded all maps to NeuroVault. These new models and maps allow for a clearer interpretation of our findings. More details about the fMRI analyses in the methods and results are included in the revision. We took care to use similar language in the main text and in the figure captions to convey the results and interpretation. The new analyses strengthen our original conclusion: dynamic values better explain BOLD activity in the ventromedial prefrontal cortex, a region consistently associated with valuation, than static values.

      - It's great that the authors reanalyzed existing datasets (fig 10). I think the ΔRT plots are the least clear way to show that _reval_ is better. Why not a figure like Figure 6a and Figure 7 for the existing datasets?

      We agree with the reviewer. We have replaced Fig. 10 with a more detailed version. For each dataset, we show the ΔRT plots, but we also show figures equivalent to Fig. 6a, Fig. 7a, and the new Fig. 6b (Deviance with and without Reval).

      Reviewer #2 (Recommendations For The Authors):

      I assume that the data and analysis code will be made publicly and openly available once the version of record is established.

      Yes, the data and analysis code is now available at: https://github.com/arielzylberberg/Reval_eLife_2024

      We added a Data Availability statement to the manuscript.

    2. eLife Assessment

      This important study addresses key assumptions underlying current models of the formation of value-based decisions. The authors provide convincing evidence that the subjective values human participants assign to items change across sequences of multiple decisions. They establish methods to detect these changes in frequently used behavioral task designs.

    3. Reviewer #1 (Public review):

      Summary:

      There is a long-standing idea that choices influence evaluation: options we choose are re-evaluated to be better than they were before the choice. There has been some debate about this finding, and the authors developed several novel methods for detecting these re-evaluations in task designs where options are repeatedly presented against several alternatives. Using these novel methods the authors clearly demonstrate this re-evaluation phenomenon in several existing datasets and show that estimations of dynamic valuation correlate with neural activity in prefrontal cortex.

      Strengths:

      The paper is well-written and figures are clear. The authors provided evidence for the behaviour effect using several techniques and generated surrogate data (where the ground truth is known) to demonstrate the robustness of their methods. The author avoid over-selling the work, with a lucid description of limitations, and potential for further exploration of the work, in the discussion.

      Comments on revisions:

      The authors did a good job responding to the comments.

    4. Reviewer #2 (Public review):

      Zylberberg and colleagues show that food choice outcomes and BOLD signal in the vmPFC are better explained by algorithms that update subjective values during the sequence of choices compared to algorithms based on static values acquired before the decision phase. This study presents a valuable means of reducing the apparent stochasticity of choices in common laboratory experiment designs. The evidence supporting the claims of the authors is solid, although currently limited to choices between food items because no other goods were examined. The work will be of interest to researchers examining decision making across various social and biological sciences.

      Comments on revisions:

      We thank the authors for carefully addressing our concerns about the first version of the manuscript. The manuscript text and contributions are now much more clear and convincing.

    1. Reviewer #1 (Public review):

      Summary:

      The authors investigated if/how distractor suppression derived from statistical learning may be implemented in early visual cortex. While in a scanner, participants conducted a standard additional singleton task in which one location more frequently contained a salient distractor. The results showed that activity in EVC was suppressed for the location of the salient distractor as well as for neighbouring neutral locations. This suppression was not stimulus specific - meaning it occurred equally for distractors, targets and neutral items - and it was even present in trials in which the search display was omitted. Generally, the paper was clear, the experiment was well-designed, and the data are interesting. Nevertheless, I do have several concerns mostly regarding the interpretation of the results.

      (1) My biggest concern with the study is regarding the interpretation of some of the results. Specifically, regarding the dynamics of the suppression. I appreciate that there are some limitations with what you might be able to say here given the method but I do feel as if you have committed to a single interpretation where others might still be at play. Below I've listed a few alternatives to consider.

      (a) Sustained Suppression. I was wondering if there is anything in your results that would speak for or against the suppression being task specific. That is, is it possible that people are just suppressing the HPDL throughout the entire experiment (i.e., also through ITI, breaks, etc., rather than just before and during the search). Since the suppression does not seem volitional, I wonder if participants might apply a blanket suppression to HPDL until they learn otherwise. Since your localiser comes after the task you might be able to see hints of sustained suppression in the HPDL during these trials.

      (b) Enhancement followed by suppression. Another alternative that wasn't discussed would be an initial transient enhancement of the HPDL which might be brought on by the placeholders followed by more sustained suppression through the search task. Of course, on the whole this would look like suppression, but this still seems like it would hold different implications compared to simply "proactive suppression". This would be something like search and destroy however could be on the location level before the actual onset of the search display.

      (2) I was also considering whether your effects might be at least partially attributable to priming type effects. This would be on the spatial (not feature) level as it is clear that the distractors are switching colours. Basically, is it possible that on trial n participants see the HPDL with the distractor in it and then on trial n+1 they suppress that location. This would be something distinct from the statistical learning framework and from the repetition suppression discussion you have already included. To test for this, you could look at the trials that follow omission or trials. If there is no suppression or less suppression on these trials it would seem fair to conclude that the suppression is at least in part due to the previous trial.

    2. eLife Assessment

      This well-written report uses functional neuroimaging in human observers to provide convincing evidence that activity in the early visual cortex is suppressed at locations that are frequently occupied by a task-irrelevant but salient item. This suppression appears to be general to any kind of stimulus, and also occurs in advance of any item actually appearing. The work in its present form will be valuable to those examining attention, perception, learning and prediction, but with a few additional analyses could more informatively rule out potential alternative hypotheses. Further discussion of the mechanistic implications could clarify further the broad extent of its significance.

    3. Reviewer #2 (Public review):

      The authors of this work set out to test ideas about how observers learn to ignore irrelevant visual information. Specifically, they used fMRI to scan participants who performed a visual search task. The task was designed in such a way that highly salient but irrelevant search items were more likely to appear at a given spatial location. With a region-of-interest approach, the authors found that activity in visual cortex that selectively responds to that location was generally suppressed, in response to all stimuli (search targets, salient distractors, or neutral items), as well as in the absence of an anticipated stimulus.

      Strengths of the study include: A well-written and well-argued manuscript; clever application of a region of interest approach to fMRI design, which allows articulating clear tests of different hypotheses; careful application of follow-up analyses to rule out alternative, strategy-based accounts of the findings; tests of the robustness of the findings to detailed analysis parameters such as ROI size; and exclusion of the role of regional baseline differences in BOLD responses.

      The report might be enhanced by analyses (perhaps in a surface space) that distinguish amongst the multiple "early" retinotopic visual areas that are analysed in the aggregate here. Furthermore, the study could benefit from an analysis that tests the correlation over observers between the magnitude of their behavioural effects and their neural responses.

      The study provides an advance over previous studies, which identified enhancement or suppression in visual cortex as a function of search target/distractor predictability, but in less spatially-specific way. It also speaks to open questions about whether such suppression/enhancement is observed only in response to the arrival of visual information, or instead is preparatory, favouring the latter view. The theoretical advance is moderate, in that it is largely congruent with previous frameworks, rather than strongly excluding an opposing view or providing a major step change in our understanding of how distractor suppression unfolds.

    4. Author response:

      We thank the editor and the reviewers for the positive evaluation of our manuscript and the thoughtful comments. Below we provide a provisional reply to the reviewers’ comments, which we will address in more detail in the revised manuscript.

      Reviewer 1 highlights three important alternative interpretations of our results: (1) sustained suppression, (2) enhancement followed by suppression, and (3) priming. We believe that these alternatives need to be addressed to improve the conclusions we can draw from the available data.

      (1) Sustained suppression: As outlined by R1, it is possible that participants suppressed the HPDL throughout the entire experiment, instead of proactively instantiating suppression on each trial. While possible, we believe that this account is unlikely to explain the present results, given the utilized analysis approach, a voxel-wise GLM fit to the BOLD data per run (see Materials and Methods for details). Specifically, we derived parameter estimates from this GLM per location to estimate the relative suppression. Sustained suppression would modulate BOLD responses throughout the run, i.e. also during the implicit baseline period used to estimate the contrast parameter estimates. Hence, a sustained suppression should not result in a differential modulation between locations, as the BOLD response at the HPDL during the baseline period would be equally suppressed as during the trial. We will discuss this important aspect in the revised manuscript.

      (2) Enhancement followed by suppression: R1 correctly points out that BOLD data, given the poor temporal resolution, do not allow for the detection of potential transient enhancements at the HPDL followed by a later and more pronounced suppression (akin to “search and destroy”). We agree with this assessment. However, we would also argue that a transient enhancement followed by sustained suppression before search onset constitutes proactive suppression in line with our interpretation, because suppression would still arise proactively (i.e., before search and hence distractor onset). Whether brief enhancement precedes suppression cannot be elucidated by our data, but we believe that it constitutes an interesting avenue for future studies using time-resolved and spatially specific recording methods. We will address this important addition in the updated manuscript.

      (3) Priming: It is possible that participants particularly suppress locations which on previous trials contained a distractor. This account constitutes a different perspective than statistical learning integrating across many trials. We believe that it is likely that both accounts contribute to the observed effect to some degree, as both the distant (but often repeated) and the most recent past should inform our priors. Indeed, arguably recent trials should be particularly informative for our predictions as natural environments vary across time, and hence the statistical learning system should remain sensitive to potential changes in the environment. In short, we agree with R1 that the n-1 trial may impact suppression, and therefore charting the potential contributions of this type of priming compared to statistical learning is a relevant addition to the manuscript. We will perform the suggested analysis; however, we also note that dividing trials based on the n-1 trial will significantly reduce the reliability of the parameter estimates (e.g. only ~1/3 of trials follow omissions).

      Reviewer 2 had two valuable suggestions to advance the inferences we can draw from the available data. In particular, R2 proposed two additional analyses, which we will consider during revision.

      First, R2 suggests separating the utilized early visual cortex (EVC) ROI mask into the three retinotopic areas comprising EVC (V1, V2, V3) and to perform the key analyses in surface space for each ROI separately. We agree that exploring distractor suppression across V1, V2 and V3 separately is an interesting extension to our results. Our reasoning to combine early visual areas into one mask was two-fold: First, we did not have an a priori reason to expected distinct neural suppression between these early ROIs. Therefore, we did not acquire retinotopy data to reliably separate V1, V2 and V3, instead opting to increase the number of search task trials. The lack of retinotopy data naturally limits the reliability of the resulting cortical segmentation. However, we believe that separating EVC into its constituent areas using anatomical data is nonetheless a promising addition to our primary analyses. Therefore, during revision we will explore the main suppression analyses split into V1, V2, and V3.

      Second, R2 highlights that behavioral facilitation and neural suppression could be correlated across participants. The rationale is that should neural suppression in EVC relate to the facilitation of behavioral responses, we may expect a positive relationship between neural suppression at the HPDL and RTs across participants. We agree with R2’s suggestion and will perform the analysis accordingly. However, we note that any results should be interpreted with caution, as the present sample size of n=28 is small for an across participant correlation analysis involving neural and behavioral difference scores.

      In summary, we believe that addressing the reviewers' suggestions will substantially improve our manuscript, particularly regarding the interpretation and scope of our findings.

    1. eLife Assessment

      The study describes a useful tool for assessing microglia morphology in a variety of experimental conditions. The MorphoCellSorter provides a solid platform for ranking microglia to reflect their morphology continuum and may offer new insight into changes in morphology associated with injury or disease. While the study provides an alternative approach to existing methods for measuring microglia morphology, the functional significance of measured morphological changes remains unclear.

    2. Joint Public Review:

      In the microglia research community, it is accepted that microglia change their shape both gradually and acutely along a continuum that is influenced by external factors both in their microenvironments and in circulation. Ideally, a given morphological state reflects a functional state that provides insight into a microglia's role in physiological and pathological conditions. The current manuscript introduces MorphoCellSorter, an open-source tool designed for automated morphometric analysis of microglia. This method adds to the many programs and platforms available to assess the characteristics of microglial morphology; however, MorphoCellSorter is unique in that it uses Andrew's plotting to rank populations of cells together (in control and experimental groups) and presents "big picture" views of how entire populations of microglia alter under different conditions. Notably, MorphoCellSorter is versatile, as it can be used across a wide array of imaging techniques and equipment. For example, the authors use MorphoCellSorter on images of fixed and live tissues representing different biological contexts such as embryonic stages, Alzheimer's disease models, stroke, and primary cell cultures.

      This manuscript outlines a strategy for efficiently ranking microglia beyond the classical homeostatic vs. active morphological states. The outcome offers only a minor improvement over the already available strategies that have the same challenge: how to interpret the ranking functionally.

      Strengths and Weaknesses:

      (1) The authors offer an alternative perspective on microglia morphology, exploring the option to rank microglia instead of categorizing them with means of clusterings like k-means, which should better reflect the concept of a microglia morphology continuum. They demonstrate that these ranked representations of morphology can be illustrated using histograms across the entire population, allowing the identification of potential shifts between experimental groups. Although the idea of using Andrews curves is innovative, the distance between ranked morphologies is challenging to measure, raising the question of whether the authors oversimplify the problem. Also, the discussion about the pipeline's uniqueness does not go into the details of alternative models. The introduction remains weak in outlining the limitations of current methods (L90). Acknowledging this limitation will be necessary.

      (2) The manuscript suffers from several overstatements and simplifications, which need to be resolved. For example:

      a) L40: The authors talk about "accurately ranked cells". Based on their results, the term "accuracy" is still unclear in this context.

      b) L50: Microglial processes are not necessarily evenly distributed in the healthy brain. Depending on their embedded environment, they can have longer process extensions (e.g., frontal cortex versus cerebellum).

      c) L69: The term "metabolic challenge" is very broad, ranging from glycolysis/FAO switches to ATP-mediated morphological adaptations, and it needs further clarification about the author's intended meaning.

      d) L75: Is morphology truly "easy" to obtain?

      e) L80: The sentence structure implies that clustering or artificial intelligence (AI) are parameters, which is incorrect. Furthermore, the authors should clarify the term "AI" in their intended context of morphological analysis.

      f) L390f: An assumption is made that the contralateral hemisphere is a non-pathological condition. How confident are the authors about this statement? The brain is still exposed to a pathological condition, which does not stop at one brain hemisphere.

      (3) Methodological questions:

      a) L299: An inversion operation was applied to specific parameters. The description needs to clarify the necessity of this since the PCA does not require it.

      b) Different biological samples have been collected across different species (rat, mouse) and disease conditions (stroke, Alzheimer's disease).<br /> Sex is a relevant component in microglia morphology. At first glance, information on sex is missing for several of the samples. The authors should always refer to Table 1 in their manuscript to avoid this confusion. Furthermore, how many biological animals have been analyzed? It would be beneficial for the study to compare different sexes and see how accurate Andrew's ranking would be in ranking differences between males and females. If they have a rationale for choosing one sex, this should be explained.<br /> In the methodology, the slice thickness has been given in a range. Is there a particular reason for this variability? Also, the slice thickness is inadequate to cover the entire microglia morphology. How do the authors include this limitation of their strategy? Did the authors define a cut-off for incomplete microglia?

      c) The manuscript outlines that the authors have used different preprocessing pipelines, which is great for being transparent about this process. Yet, it would be relevant to provide a rationale for the different imaging processing and segmentation pipelines and platform usages (Supplementary Figure 7). For example, it is not clear why the Z maximum projection is performed at the end for the Alzheimer's Disease model, while it's done at the beginning of the others. The same holds through for cropping, filter values, etc. Would it be possible to analyze the images with the same pipelines and compare whether a specific pipeline should be preferable to others? On a note, Matlab is not open-access.<br /> This also includes combining the different animals to see which insights could be gained using the proposed pipelines.

      d) L227: Performing manual thresholding isn't ideal because it implies the preprocessing could be improved. Additionally, it is important to consider that morphology may vary depending on the thresholding parameters. Comparing different acquisitions that have been binarized using different criteria could introduce biases.

      e) Parameter choices:

      L375: When using k-means clustering, it is good practice to determine the number of clusters (k) using silhouette or elbow scores. Simply selecting a value of k based on its previous usage in the literature is not rigorous, as the optimal number of clusters depends on the specific data structure. If they are seeking a more objective clustering approach, they could also consider employing other unsupervised techniques, (e.g. HDBSCAN) (L403f).

      L373: A rationale for the choice of the 20 non-dimensional parameters as well as a detailed explanation of their computation such as the skeleton process ratio is missing. Also, how strongly correlated are those parameters, and how might this correlation bias the data outcomes? Differences between circularity and roundness factors are not coming across and require further clarification. One is applied to the soma and the other to the cell, but why is neither circularity nor loudness factor applied to both?

      f) PCA analysis:

      The authors spend a lot of text to describe the basic principles of PCA. PCA is mathematically well-described and does not require such depth in the description and would be sufficient with references. Furthermore, there are the following points that require attention:

      L321: PC1 is the most important part of the data could be an incorrect statement because the highest dispersion could be noise, which would not be the most relevant part of the data. Therefore, the term "important" has to be clarified.

      L323: As before, it's not given that the first two components hold all the information.

      L327 and L331 contain mistakes in the nomenclature: Mix up of "wi" should be "wn" because "i" does not refer to anything. The same for "phi i = arctan(yn/wn)" should be "phi n".

      L348: Spearman's correlation measures monotonic correlation, not linear correlation. Either the authors used Pearson Correlation for linearity or Spearman correlation for monotonic. This needs to be clarified to avoid misunderstandings.

      g) If the authors find no morphological alteration, how can they ensure that the algorithm is sensitive enough to detect them? When morphologies are similar, it's harder to spot differences. In cases where morphological differences are more apparent, like stroke, classification is more straightforward.

      h) Minor aspects:

      {section sign} % notation requires to include (weight/volume) annotation.

      {section sign} Citation/source of the different mouse lines should be included in the method sections (e.g. L117).

      {section sign} L125: The length of the single housing should be specified to ensure no variability in this context.

      {section sign} L673: Typo to the reference to the figure.

    3. Author response:

      Joint Public Review:

      In the microglia research community, it is accepted that microglia change their shape both gradually and acutely along a continuum that is influenced by external factors both in their microenvironments and in circulation. Ideally, a given morphological state reflects a functional state that provides insight into a microglia's role in physiological and pathological conditions. The current manuscript introduces MorphoCellSorter, an open-source tool designed for automated morphometric analysis of microglia. This method adds to the many programs and platforms available to assess the characteristics of microglial morphology; however, MorphoCellSorter is unique in that it uses Andrew's plotting to rank populations of cells together (in control and experimental groups) and presents "big picture" views of how entire populations of microglia alter under different conditions. Notably, MorphoCellSorter is versatile, as it can be used across a wide array of imaging techniques and equipment. For example, the authors use MorphoCellSorter on images of fixed and live tissues representing different biological contexts such as embryonic stages, Alzheimer's disease models, stroke, and primary cell cultures.

      This manuscript outlines a strategy for efficiently ranking microglia beyond the classical homeostatic vs. active morphological states. The outcome offers only a minor improvement over the already available strategies that have the same challenge: how to interpret the ranking functionally.

      We would like to thank the reviewers for their careful reading and constructive comments and questions. While MorphoCellSorter currently does not rank cells functionally based on their morphology, its broad range of application, ease of use and capacity to handle large datasets provide a solid foundation. Combined with advances in single-cell transcriptomics, MorphoCellSorter could potentially enable the future prediction of cell functions based on morphology.

      Strengths and Weaknesses:

      (1) The authors offer an alternative perspective on microglia morphology, exploring the option to rank microglia instead of categorizing them with means of clusterings like k-means, which should better reflect the concept of a microglia morphology continuum. They demonstrate that these ranked representations of morphology can be illustrated using histograms across the entire population, allowing the identification of potential shifts between experimental groups. Although the idea of using Andrews curves is innovative, the distance between ranked morphologies is challenging to measure, raising the question of whether the authors oversimplify the problem. 

      We have access to the distance between cells through the Andrew’s score of each cell. However, the challenge is that these distances are relative values and specific to each dataset. While we believe that these distances could provide valuable information, we have not yet determined the most effective way to represent and utilize this data in a meaningful manner.

      Also, the discussion about the pipeline's uniqueness does not go into the details of alternative models.The introduction remains weak in outlining the limitations of current methods (L90). Acknowledging this limitation will be necessary.

      Thank you for these insightful comments. The discussion about alternative methods was already present in the discussion L586-598 but to answer the request of the reviewers, we have revised the introduction and discussion sections to more clearly address the limitations of current methods, as well as discussed the uniqueness of the pipeline. Additionally, we have reorganized Figure 1 to more effectively highlight the main caveats associated with clustering, the primary method currently in use.

      (2) The manuscript suffers from several overstatements and simplifications, which need to be resolved. For example:

      a) L40: The authors talk about "accurately ranked cells". Based on their results, the term "accuracy" is still unclear in this context.

      Thank you for this comment. Our use of the term "accurately" was intended to convey that the ranking was correct based on comparison with human experts, though we agree that it may have been overstated. We have removed "accurately" and propose to replace it with "properly" to better reflect the intended meaning.

      b) L50: Microglial processes are not necessarily evenly distributed in the healthy brain. Depending on their embedded environment, they can have longer process extensions (e.g., frontal cortex versus cerebellum).

      Thank you for raising this point to our attention. We removed evenly to be more inclusive on the various morphologies of microglia cells in this introductory sentence

      c) L69: The term "metabolic challenge" is very broad, ranging from glycolysis/FAO switches to ATP-mediated morphological adaptations, and it needs further clarification about the author's intended meaning.

      Thank you for this comment, indeed we clarified to specify that we were talking about the metabolic challenge triggered by ischemia and added a reference as well.

      d) L75: Is morphology truly "easy" to obtain? 

      Yes, it is in comparison to other parameters such as transcripts or metabolism, but we understand the point made by the reviewer and we found another way of writing it.  As an alternative we propose: “morphology is an indicator accessible through…”

      e) L80: The sentence structure implies that clustering or artificial intelligence (AI) are parameters, which is incorrect. Furthermore, the authors should clarify the term "AI" in their intended context of morphological analysis.

      We apologize for this confusing writing, we reformulated the sentence as follows: “Artificial intelligence (AI) approaches such as machine learning have also been used to categorize morphologies (Leyh et al., 2021)”.

      f) L390f: An assumption is made that the contralateral hemisphere is a non-pathological condition. How confident are the authors about this statement? The brain is still exposed to a pathological condition, which does not stop at one brain hemisphere.

      We did not say that the contralateral is non-pathological but that the microglial cells have a non-pathological morphology which is slightly different. The contralateral side in ischemic experiments is classically used as a control (Rutkai et al 2022). Although It has been reported that differences in transcript levels can be found between sham operated animals and contralateral hemisphere in tMCAO mice (Filippenkov et al 2022) https://doi.org/10.3390/ijms23137308 showing that indeed the contralateral side is in a different state that sham controls, no report have been made on differences in term of morphology.

      We have removed “non-pathological” to avoid misinterpretations

      g) Methodological questions:

      a) L299: An inversion operation was applied to specific parameters. The description needs to clarify the necessity of this since the PCA does not require it.

      Indeed, we are sorry for this lack of explanation. Some morphological indexes rank cells from the least to the most ramified, while others rank them in the opposite order. By inverting certain parameters, we can standardize the ranking direction across all parameters, simplifying data interpretation. This clarification has been added to the revised manuscript as follows:

      “Lacunarity, roundness factor, convex hull radii ratio, processes cell areas ratio and skeleton processes ratio were subjected to an inversion operation in order to homogenize the parameters before conducting the PCA: indeed, some parameters rank cells from the least to the most ramified, while others rank them in the opposite order. By inverting certain parameters, we can standardize the ranking direction across all parameters, thus simplifying data interpretation.”

      b) Different biological samples have been collected across different species (rat, mouse) and disease conditions (stroke, Alzheimer's disease). Sex is a relevant component in microglia morphology. At first glance, information on sex is missing for several of the samples. The authors should always refer to Table 1 in their manuscript to avoid this confusion. Furthermore, how many biological animals have been analyzed? It would be beneficial for the study to compare different sexes and see how accurate Andrew's ranking would be in ranking differences between males and females. If they have a rationale for choosing one sex, this should be explained.

      As reported in the literature, we acknowledge the presence of sex differences in microglial cell morphology. Due to ethical considerations and our commitment to reducing animal use, we did not conduct dedicated experiments specifically for developing MorphoCellSorter. Instead, we relied on existing brain sections provided by collaborators, which were already prepared and included tissue from only one sex—either female or male—except in the case of newborn pups, whose sex is not easily determined. Consequently, we were unable to evaluate whether MorphoCellSorter is sensitive enough to detect morphological differences in microglia attributable to sex. Although assessing this aspect is feasible, we are uncertain if it would yield additional insights relevant to MorphoCellSorter’s design and intended applications.

      To address this, we have included additional references in Table 1 of the revised manuscript and clearly indicated the sex of the animals from which each dataset was obtained.

      c) In the methodology, the slice thickness has been given in a range. Is there a particular reason for this variability? 

      We could not spot any range in the text, we usually used 30µm thick sections in order to have entire or close to entire microglia cells.

      Although the thickness of the sections was identical for all the sections of a given dataset, only the plans containing the cells of interest were selected during the imaging for both of the ischemic stroke model. This explains why depending on how the cell is distributed in Z the range of the plans acquired vary.

      Also, the slice thickness is inadequate to cover the entire microglia morphology. How do the authors include this limitation of their strategy? Did the authors define a cut-off for incomplete microglia? 

      We found that 30 µm sections provide an effective balance, capturing entire or nearly entire microglial cells (consistent with what we observe in vivo) while allowing sufficient antibody penetration to ensure strong signal quality, even at the section's center. In our segmentation process, we excluded microglia located near the section edges (i.e., cells with processes visible on the first or last plane of image acquisition, as well as those close to the field of view’s boundary). Although our analysis pipeline should also function with thicker sections (>30 µm), we confirmed that thinner sections (15 µm or less) are inadequate for detecting morphological differences, as tested initially on the AD model. Segmented, incomplete microglia lack the necessary structural information to accurately reflect morphological differences thus impairing the detection of existing morphological differences.

      c) The manuscript outlines that the authors have used different preprocessing pipelines, which is great for being transparent about this process. Yet, it would be relevant to provide a rationale for the different imaging processing and segmentation pipelines and platform usages (Supplementary Figure 7). For example, it is not clear why the Z maximum projection is performed at the end for the Alzheimer's Disease model, while it's done at the beginning of the others.

      The same holds through for cropping, filter values, etc. Would it be possible to analyze the images with the same pipelines and compare whether a specific pipeline should be preferable to others?

      The pre-processing steps depend on the quality of the images in each dataset. For example, in the AD dataset, images acquired with a wide-field microscope were considerably noisier compared to those obtained via confocal microscopy. In this case, reducing noise plane-by-plane was more effective than applying noise reduction on a Z-projection, as we would typically do for confocal images. Given that accurate segmentation is essential for reliable analysis in MorphoCellSorter, we chose to tailor the segmentation approach for each dataset individually. We recommend future users of MorphoCellSorter take a similar approach. This clarification has been added to the discussion.

      On a note, Matlab is not open-access, 

      This is correct. We are currently translating this Matlab script in Python, this will be available soon on Github. 

      https://github.com/Pascuallab/MorphCellSorter.

      This also includes combining the different animals to see which insights could be gained using the proposed pipelines.

      Because of what we have been explaining earlier, having a common segmentation process for very diverse types of acquisitions (magnification, resolution and type of images) is not optimal in terms of segmentation and accuracy in the analysis. Although we could feed MorphoCellSorter with all this data from a unique segmentation pipeline, the results might be very difficult to interprete.

      d) L227: Performing manual thresholding isn't ideal because it implies the preprocessing could be improved. Additionally, it is important to consider that morphology may vary depending on the thresholding parameters. Comparing different acquisitions that have been binarized using different criteria could introduce biases.

      As noted earlier, segmentation is not the main focus of this paper, and we leave it to users to select the segmentation method best suited to their datasets. Although, we acknowledge that automated thresholding would be in theory ideal, we were confronted toimage acquisitions that were notuniform, even within the same sample. For instance, in ischemic brain samples, lipofuscin from cell death introduces background noise that can artificially impact threshold levels. We tested global and local algorithms to automatically binarize the cells but these approaches resulted often on imperfect and not optimized segmentation for every cell. In our experience, manually adjusting the threshold provides a more accurate, reliable, and comparable selection of cellular elements, even though it introduces some subjectivity. To ensure consistency in segmentation, we recommend that the same person performs the analysis across all conditions. This clarification has been added to the discussion.

      e) Parameter choices: L375: When using k-means clustering, it is good practice to determine the number of clusters (k) using silhouette or elbow scores. Simply selecting a value of k based on its previous usage in the literature is not rigorous, as the optimal number of clusters depends on the specific data structure. If they are seeking a more objective clustering approach, they could also consider employing other unsupervised techniques, (e.g. HDBSCAN) (L403f).

      We do agree with the referee’s comment but the purpose of the k-mean we used was just to illustrate the fact that the clusters generated are artificial and do not correspond to the reality of the continuum of microglia morphology. In the course of the study we used the elbow score to determine the k means but this did not work well because no clear elbow was visible in some datasets (probably because of the continuum of microglia morphologies). Anyway, using whatever k value will not change the problem that those clusters are quite artificial and that the boundaries of those clusters are quite arbitrary whatever the way k is determined manually or mathematically.

      L373: A rationale for the choice of the 20 non-dimensional parameters as well as a detailed explanation of their computation such as the skeleton process ratio is missing. Also, how strongly correlated are those parameters, and how might this correlation bias the data outcomes?

      Thank you for raising this point. There is no specific rationale beyond our goal of being as exhaustive as possible, incorporating most of the parameters found in the literature, as well as some additional ones that we believed could provide a more thorough description of microglial morphology.

      Indeed, some of these parameters are correlated. Initially, we considered this might be problematic, but we quickly found that these correlations essentially act as factors that help assign more weight to certain parameters, reflecting their likely greater importance in a given dataset. Rather than being a limitation, the correlated parameters actually enhance the ranking. We tested removing some of these parameters in earlier versions of MorphoCellSorter, and found that doing so reduced the accuracy of the tool.

      Differences between circularity and roundness factors are not coming across and require further clarification. 

      These are two distinct ways of characterizing morphological complexity, and we borrowed these parameters and kept the name from the existing literature, not necessarily in the context of microglia. In our case, these parameters are used to describe the overall shape of the cell. The advantage of using different metrics to calculate similar parameters is that, depending on the dataset, one method may be better suited to capture specific morphological features of a given dataset. MorphoCellSorter selects the parameter that best explains the greatest dispersion in the data, allowing for a more accurate characterization of the morphology.

      One is applied to the soma and the other to the cell, but why is neither circularity nor loudness factor applied to both?

      None of the parameters concern the cell body by itself. The cell body is always relative to another metric(s). Because these parameters and what they represent does not seem to be  very clear we will add a graphic representation of the type of measurements and measure they provide in the revised version of the manuscript.

      f) PCA analysis:

      The authors spend a lot of text to describe the basic principles of PCA. PCA is mathematically well-described and does not require such depth in the description and would be sufficient with references.

      Thank you for this comment indeed the description of PCA may be too exhaustive, we will simplify the text. 

      Furthermore, there are the following points that require attention:

      L321: PC1 is the most important part of the data could be an incorrect statement because the highest dispersion could be noise, which would not be the most relevant part of the data. Therefore, the term "important" has to be clarified.

      We are not sure in the case of segmented images the noise would represent most of the data, as by doing segmentation we also remove most of the noise, but maybe the reviewer is concerned about another type of noise? Nonetheless, we thank the reviewer for his comment and we propose the following change, that should solve this potential issue.

      “_PC_1 is the direction in which data is most dispersed.”

      L323: As before, it's not given that the first two components hold all the information.

      Thank you for this comment we modified this statement as follows: “The two first components represent most of the information (about 70%), hence we can consider the plan PC_1, PC_2 as the principal plan reducing the dataset to a two dimensional space”

      L327 and L331 contain mistakes in the nomenclature: Mix up of "wi" should be "wn" because "i" does not refer to anything. The same for "phi i = arctan(yn/wn)" should be "phi n".

      Thanks a lot for these comments. We have made the changes in the text as proposed by the reviewer.

      L348: Spearman's correlation measures monotonic correlation, not linear correlation. Either the authors used Pearson Correlation for linearity or Spearman correlation for monotonic. This needs to be clarified to avoid misunderstandings.

      Sorry for the misunderstanding, we did use Spearman correlation which is monotonic, we thus changed linear by monotonic in the text. Thanks a lot for the careful reading.

      g) If the authors find no morphological alteration, how can they ensure that the algorithm is sensitive enough to detect them? When morphologies are similar, it's harder to spot differences. In cases where morphological differences are more apparent, like stroke, classification is more straightforward.

      We are not entirely sure we fully understand the reviewer's comment. When data are similar or nearly identical, MorphoCellSorter performs comparably to human experts (see Table 1). However, the advantage of using MorphoCellSorter is that it ranks cells do.much faster while achieving accuracy similar to that of human experts AND gives them a value on an axis (andrews score), which a human expert certainly can't. For example, in the case of mouse embryos, MorphoCellSorter’s ranking was as accurate as that made by human experts. Based on this ranking, the distributions were similar, suggesting that the morphologies are generally consistent across samples.

      The algorithm itself does not detect anything—it simply ranks cells according to the provided parameters. Therefore, it is unlikely that sensitivity is an issue; the algorithm ranks the cells based on existing data. The most critical factor in the analysis is the segmentation step, which is not the focus of our paper. However, the more accurate the segmentation, the more distinct the parameters will be if actual differences exist. Thus, sensitivity concerns are more related to the quality of image acquisition or the segmentation process rather than the ranking itself. Once MorphoCellSorter receives the parameters, it ranks the cells accordingly. When cells are very similar, the ranking process becomes more complex, as reflected in the correlation values comparing expert rankings to those from MorphoCellSorter (Table 1). 

      Moreover, MorphoCellSorter does not only provide a ranking: the morphological indexes automatically computed offer useful information to compare the cells’ morphology between groups.

      h) Minor aspects:

      % notation requires to include (weight/volume) annotation.

      This has been done in the revised version of the manuscript

      Citation/source of the different mouse lines should be included in the method sections (e.g. L117).

      The reference of the mouse line has been added (RRID:IMSR_JAX:005582) to the revised version of the manuscript.

      L125: The length of the single housing should be specified to ensure no variability in this context.

      The mice were kept 24h00 individually, this is now stated in the text

      L673: Typo to the reference to the figure.

      This has been corrected, thank you for your thoughtful reading.

    1. eLife Assessment

      This important work advances our understanding of CHMP5's role in regulating osteogenesis through its impact on cellular senescence. The evidence supporting the conclusion is mostly convincing, although including additional experiments and discussions would further strengthen the study. This paper holds potential interest for skeletal biologists who study the pathogenesis of age-associated skeletal disorders.

    2. Reviewer #1 (Public review):

      Summary:

      The manuscript presents a significant and rigorous investigation into the role of CHMP5 in regulating bone formation and cellular senescence. The study provides compelling evidence that CHMP5 is essential for maintaining endolysosomal function and controlling mitochondrial ROS levels, thereby preventing the senescence of skeletal progenitor cells.

      Strengths:

      The authors demonstrate that the deletion of Chmp5 results in endolysosomal dysfunction, elevated mitochondrial ROS, and ultimately enhanced bone formation through both autonomous and paracrine mechanisms. The innovative use of senolytic drugs to ameliorate musculoskeletal abnormalities in Chmp5-deficient mice is a novel and critical finding, suggesting potential therapeutic strategies for musculoskeletal disorders linked to endolysosomal dysfunction.

      Weaknesses:

      The manuscript requires a deeper discussion or exploration of CHMP5's roles and a more refined analysis of senolytic drug specificity and effects. This would greatly enhance the comprehensiveness and clarity of the manuscript.

    3. Reviewer #2 (Public review):

      Summary:

      The authors try to show the importance of CHMP5 for skeletal development.

      Strengths:

      The findings of this manuscript are interesting. The mouse phenotypes are well done and are of interest to a broader (bone) field.

      Weaknesses:

      The mechanistic insights are mediocre, and the cellular senescence aspect poor.

      In total, it has not been shown that there are actual senescent cells that are reduced after D+Q-treatment. These statements need to be scaled back substantially.

    4. Reviewer #3 (Public review):

      Summary:

      In this study, Zhang et al. reported that CHMP5 restricts bone formation by controlling endolysosome-mitochondrion-mediated cell senescence. The effects of CHMP5 on osteoclastic bone resorption and bone turnover have been reported previously (PMID: 26195726), in which study the aberrant bone phenotype was observed in the CHMP5-ctsk-CKO mouse model, using the same mouse model, Zhang et al., report a novel role of CHMP5 on osteogenesis through affecting cell senescence. Overall, it is an interesting study and provides new insights in the field of cell senescence and bone.

      Strengths:

      Analyzed the bone phenotype OF CHMP5-periskeletal progenitor-CKO mouse model and found the novel role of senescent cells on osteogenesis and migration.

      Weaknesses:

      (1) There are a lot of papers that have reported that senescence impairs osteogenesis of skeletal stem cells. In this study, the author claimed that Chmp5 deficiency induces skeletal progennitor cell senescence and enhanced osteogenesis. Can the authors explain the controversial results?

      (2) Co-culture of Chmp5-KO periskeletal progenitors with WT ones should be conducted to detect the migration and osteogenesis of WT cells in response to Chmp5-KO-induced senescent cells. In addition, the co-culture of WT periskeletal progenitors with senescent cells induced by H2O2, radiation, or from aged mice would provide more information.

      (3) Many EVs were secreted from Chmp5-deleted periskeletal progenitors, compared to the rarely detected EVs around WT cells. Since EVs of BMSCs or osteoprogenitors show strong effects of promoting osteogenesis, did the EVs contribute to the enhanced osteogenesis induced by Chmp5-defeciency?

      (4) EVs secreted from senescent cells propagate senescence and impair osteogenesis, why do EVs secreted from senescent cells induced by Chmp5-defeciency have opposite effects on osteogenesis?

      (5) The Chmp5-ctsk mice show accelerated aging-related phenotypes, such as hair loss and joint stiffness. Did Ctsk also label cells in hair follicles or joint tissue?

      (6) Fifteen proteins were found to increase and five proteins to decrease in the cell supernatant of Chmp5Ctsk periskeletal progenitors. How about SASP factors in the secretory profile?

      (7) D+Q treatment mitigates musculoskeletal pathologies in Chmp5 conditional knockout mice. In the previously published paper (CHMP5 controls bone turnover rates by dampening NF-κB activity in osteoclasts), inhibition of osteoclastic bone resorption rescues the aberrant bone phenotype of the Chmp5 conditional knockout mice. Whether the effects of D+Q on bone overgrowth is because of the inhibition of bone resorption?

      (8) The role of VPS4A in cell senescence should be measured to support the conclusion that CHMP5 regulates osteogenesis by affecting cell senescence.

      (9) Cell senescence with markers, such as p21 and H2AX, co-stained with GFP should be performed in the mouse models to indicate the effects of Chmp5 on cell senescence in vivo.

      (10) ADTC5 cell as osteochondromas cells line, is not a good cell model of periskeletal progenitors. Maybe primary periskeletal progenitor cell is a better choice.

    5. Author response:

      Reviewer #1 (Public review): 

      Summary: 

      The manuscript presents a significant and rigorous investigation into the role of CHMP5 in regulating bone formation and cellular senescence. The study provides compelling evidence that CHMP5 is essential for maintaining endolysosomal function and controlling mitochondrial ROS levels, thereby preventing the senescence of skeletal progenitor cells. 

      Strengths: 

      The authors demonstrate that the deletion of Chmp5 results in endolysosomal dysfunction, elevated mitochondrial ROS, and ultimately enhanced bone formation through both autonomous and paracrine mechanisms. The innovative use of senolytic drugs to ameliorate musculoskeletal abnormalities in Chmp5-deficient mice is a novel and critical finding, suggesting potential therapeutic strategies for musculoskeletal disorders linked to endolysosomal dysfunction. 

      Weaknesses: 

      The manuscript requires a deeper discussion or exploration of CHMP5's roles and a more refined analysis of senolytic drug specificity and effects. This would greatly enhance the comprehensiveness and clarity of the manuscript. 

      We thank the reviewer for these insightful comments. The tissue-specific roles of CHMP5 and the specificity of quercetin and dasatinib treatments in Chmp5-deficient mice will be further discussed and clarified in the revised manuscript. 

      Reviewer #2 (Public review): 

      Summary: 

      The authors try to show the importance of CHMP5 for skeletal development. 

      Strengths: 

      The findings of this manuscript are interesting. The mouse phenotypes are well done and are of interest to a broader (bone) field. 

      Weaknesses: 

      The mechanistic insights are mediocre, and the cellular senescence aspect poor. 

      In total, it has not been shown that there are actual senescent cells that are reduced after D+Q-treatment. These statements need to be scaled back substantially. 

      We thank the reviewer for these suggestive comments. Although multiple hallmarks of cell senescence were shown in CHMP5-deficient skeletal progenitors, we will detect and add additional markers of cell senescence in the revised manuscript. 

      In addition, the effects and specificity of the Q+D treatment will be further discussed and clarified with the revision.

      Reviewer #3 (Public review): 

      Summary: 

      In this study, Zhang et al. reported that CHMP5 restricts bone formation by controlling endolysosome-mitochondrion-mediated cell senescence. The effects of CHMP5 on osteoclastic bone resorption and bone turnover have been reported previously (PMID: 26195726), in which study the aberrant bone phenotype was observed in the CHMP5ctsk-CKO mouse model, using the same mouse model, Zhang et al., report a novel role of CHMP5 on osteogenesis through affecting cell senescence. Overall, it is an interesting study and provides new insights in the field of cell senescence and bone. 

      Strengths: 

      Analyzed the bone phenotype OF CHMP5-periskeletal progenitor-CKO mouse model and found the novel role of senescent cells on osteogenesis and migration. 

      Weaknesses: 

      (1) There are a lot of papers that have reported that senescence impairs osteogenesis of skeletal stem cells. In this study, the author claimed that Chmp5 deficiency induces skeletal progennitor cell senescence and enhanced osteogenesis. Can the authors explain the controversial results? 

      Different skeletal stem cell populations in time and space have been identified and reported. This study shows that Chmp5 deficiency in periskeletal and endosteal skeletal progenitors causes cell senescence and aberrant bone formation. Although cell senescence during aging can impair osteogenesis of certain skeletal stem cells, which contributes to diseases with low bone mass such as osteoporosis, aging can also increase heterotopic mineralization/calcification in musculoskeletal soft tissues such as ligaments and tendons, which is consistent with our results in this study. These reflect out-of-order musculoskeletal mineralization during aging. We will expand the discussion and clarify the results of CHMP5-regulated cell senescence in osteogenesis in the revised manuscript.

      (2) Co-culture of Chmp5-KO periskeletal progenitors with WT ones should be conducted to detect the migration and osteogenesis of WT cells in response to Chmp5-KO-induced senescent cells. In addition, the co-culture of WT periskeletal progenitors with senescent cells induced by H2O2, radiation, or from aged mice would provide more information.

      Increased osteogenesis of WT skeletal progenitors in the periskeletal lesion was shown to be a paracrine mechanism of abnormal bone formation in Chmp5Ctsk mice. The coculture experiment will help confirm the effect of Chmp5-deficient skeletal progenitors on the osteogenesis of neighboring WT skeletal progenitors.

      Notably, the cause and outcome of cell senescence are highly heterogeneous, and different causes of cell senescence can cause significantly different outcomes. Although the coculture of WT periskeletal progenitors with senescent cells induced by H2O2, radiation, or from aged mice would be very interesting, these are beyond the scope of the current study.

      (3) Many EVs were secreted from Chmp5-deleted periskeletal progenitors, compared to the rarely detected EVs around WT cells. Since EVs of BMSCs or osteoprogenitors show strong effects of promoting osteogenesis, did the EVs contribute to the enhanced osteogenesis induced by Chmp5-defeciency? 

      The WT skeletal progenitor cells from Chmp5Ctsk mice have an increased capacity of osteogenesis compared to the corresponding cells from control animals, suggesting that the EVs of the Chmp5-deleted periskeletal progenitors could promote osteogenesis of the WT skeletal progenitors, which represents a paracrine mechanism of abnormal bone formation in Chmp5 deficient animals. We will discuss and clarify these results in the revised manuscript.

      (4) EVs secreted from senescent cells propagate senescence and impair osteogenesis, why do EVs secreted from senescent cells induced by Chmp5-defeciency have opposite effects on osteogenesis? 

      The question is similar to comment #1. The functional heterogeneity of cellular senescence will be discussed in further detail and clarified in the revised manuscript.

      (5) The Chmp5-ctsk mice show accelerated aging-related phenotypes, such as hair loss and joint stiffness. Did Ctsk also label cells in hair follicles or joint tissue? 

      This is an interesting question. Although we did not check the expression of CHMP5 in hair follicles, which is outside the scope of the present study, the result in Fig. 1E showed the expression of CHMP5 in joint ligaments. Notably, abnormal periskeletal bone formation occurs predominantly at the joint ligament insertion site in Chmp5Ctsk mice, which will be elucidated and discussed in the revised manuscript.

      (6) Fifteen proteins were found to increase and five proteins to decrease in the cell supernatant of Chmp5Ctsk periskeletal progenitors. How about SASP factors in the secretory profile? 

      As mentioned above, the SASP phenotype and related factors of senescent cells could be highly heterogeneous depending on inducers, cell types, and timing of senescence. Most of the proteins we identified in the secretome analysis have previously been reported in the secretory profile of osteoblasts. Although we were also interested in the change of some common SASP factors, such as inflammatory cytokines, the experiment did not detect these factors because of their small molecular weights and the technical limitations of mass spec analysis. 

      (7) D+Q treatment mitigates musculoskeletal pathologies in Chmp5 conditional knockout mice. In the previously published paper (CHMP5 controls bone turnover rates by dampening NF-κB activity in osteoclasts), inhibition of osteoclastic bone resorption rescues the aberrant bone phenotype of the Chmp5 conditional knockout mice. Whether the effects of D+Q on bone overgrowth is because of the inhibition of bone resorption? 

      Although in Chmp5Ctsk mice we cannot exclude the effect of D+Q on osteoclasts, the effect of D+Q on osteoblast lineage cells, which is the focus of the current study, was verified in Chmp5Dmp1 mice. We will expand the discussion and make these results clearer with the revision.

      (8) The role of VPS4A in cell senescence should be measured to support the conclusion that CHMP5 regulates osteogenesis by affecting cell senescence. 

      We agree that additional experiments examining the role of VPS4A in cell senescence will provide more mechanistic insights. The focus of the current study is to report that CHMP5 restricts abnormal bone formation by preventing endolysosome-mitochondrion-mediated cell senescence. The roles of VPS4A in cell senescence and skeletal biology will be explored in separate studies.

      (9) Cell senescence with markers, such as p21 and H2AX, co-stained with GFP should be performed in the mouse models to indicate the effects of Chmp5 on cell senescence in vivo. 

      We will examine additional markers of cell senescence, as the reviewers suggest, in the revised manuscript.

      (10) ADTC5 cell as osteochondromas cells line, is not a good cell model of periskeletal progenitors. Maybe primary periskeletal progenitor cell is a better choice. 

      We were aware that ATDC5 cells are typically used as a chondrocyte progenitor cell line. However, our previous study showed that ATDC5 cells could also be used as a reasonable cell model for periskeletal progenitors. Furthermore, the corresponding results from primary periskeletal progenitors were shown. We will further clarify this in the revision.

      In general, the comments of these reviewers will help clarify our results and further strengthen our conclusion. We will address these comments and questions point to point in more detail in the revised manuscript.

    1. eLife Assessment

      In this potentially valuable computational study, the authors conducted atomistic and coarse-grained simulations to probe the temperature-dependent phase behaviors of ELF3, a disordered component of the evening complex in plant. The results aim to highlight the role of polyQ tracts in modulating the temperature sensitivity. The level of evidence is considered incomplete, due to the lack of systematic calibration of the coarse-grained model and limited statistical uncertainty analysis, especially considering the relatively subtle nature of the differences due to temperature change.

    2. Reviewer #1 (Public review):

      Summary:

      This manuscript explores the role of the Evening Complex (EC), specifically focusing on ELF3, a disordered protein component of the EC, and its temperature-dependent phase behavior. The study highlights the role of polyQ tracts in modulating temperature-sensitive condensate formation and provides a combination of computational approaches, including REST2 simulations and coarse-grained Martini simulations, to investigate how polyQ tract length and sequence context influence this behavior.

      Strengths:

      The study addresses a key question in plant biology - how temperature influences circadian clock-mediated growth regulation through protein phase behavior. The manuscript introduces the novel finding that polyQ tract length modulates the temperature-dependent formation of helices and condensates.

      Weaknesses:

      (1) Coarse-Grained Simulation Results Not Supported by Data:<br /> The results presented in Figure 6A of the manuscript do not seem to show a clear trend in the number of clusters formed as a function of polyQ tract length. This is particularly evident in the comparison between 0Q and 7Q polyQ lengths, which display statistically similar values in terms of the number of clusters. The lack of distinction between these values raises questions about the sensitivity of the coarse-grained simulations to polyQ tract length, which the authors claim as a key modulator of condensate formation. This discrepancy weakens the argument that polyQ length directly impacts the clustering behavior in the simulations.<br /> Suggested Analysis:<br /> - A more detailed statistical analysis should be performed to assess whether the observed differences between polyQ lengths are significant. This could involve hypothesis testing or the use of error bars in the graphs to better communicate the variability in the data.<br /> - Additionally, the authors should examine whether there are other features, such as cluster shape or internal structure, that might differentiate between different polyQ lengths, even if the total number of clusters is similar.

      (2) Inconsistency in Cluster Size Across Temperatures (Figure 6B):<br /> The results in Figure 6B show a striking difference in the size of the largest cluster between temperatures of 290K and 300K. This abrupt shift in behavior lacks a clear mechanistic explanation. Typically, phase transitions driven by temperature are more gradual, unless there is some underlying structural or chemical shift that the authors have not accounted for. Without a clear explanation, this sudden change in behavior reduces confidence in the simulation results.<br /> Suggested Analysis:<br /> - The authors should explore possible explanations for the dramatic difference in cluster size between 290K and 300K. For example, they could investigate whether specific interactions (such as the breaking or formation of hydrogen bonds or hydrophobic contacts) might explain the behavior at higher temperatures.<br /> - It is important to check whether the coarse-grained simulation model has been adequately parameterized and scaled for accurate temperature dependence. Atomistic simulations of monomers and dimers with varying polyQ tract lengths could be used to fine-tune the coarse-grained model, ensuring it accurately reflects molecular behavior. The gross estimate of a 10% scaling factor might be insufficient and could lead to inaccurate representations of cluster formation.

      (3) Scaling of Coarse-Grained Model with Atomistic Simulations:<br /> As mentioned, the coarse-grained model used in the study may not have been properly scaled against atomistic data. A simple scaling factor of 10% may not be appropriate for accurately capturing the behavior of polyQ tracts across different lengths, especially considering their sensitivity to subtle changes in temperature. Without rigorous validation against atomistic simulations, the coarse-grained model's predictions could be skewed.<br /> Suggested Analysis:

      (4) To address this, the authors should compare the coarse-grained model with atomistic simulations of monomeric and dimeric forms of ELF3 with different polyQ tract lengths. By comparing key structural parameters (e.g., radius of gyration, contact maps, and clustering propensity), the authors could adjust the coarse-grained model to more accurately reflect the atomistic behavior. The authors have wealth of atomistic simulation data that could afford such benchmarking and identification of scaling factor<br /> o Additionally, the authors should investigate whether the assumed scaling factor of 10% is appropriate for each polyQ length or whether it needs to be refined based on specific properties, such as the number of hydrophobic interactions or secondary structure stability.

      (5) Lack of Analysis for Liquid-Like Behavior in Phase Separation:<br /> The simulations presented in the manuscript do not analyze the liquid-like behavior of ELF3 condensates, which is a key characteristic of liquid-liquid phase separation (LLPS). In LLPS systems, condensates are often dynamic, with chains exchanging between clusters, indicating liquid-like rather than solid-like behavior. The authors fail to probe this crucial aspect, which is necessary to support the claim that ELF3 undergoes phase separation.<br /> Suggested Analysis:<br /> - The authors should conduct additional analyses to probe the liquid-like nature of the clusters formed by ELF3. One approach would be to analyze the dynamics of chain exchange between clusters, measuring how frequently chains leave one cluster and join another over time. This analysis would reveal whether the condensates behave as liquid-like, dynamic structures or more static, solid-like aggregates.<br /> - Additionally, the temperature dependence of these exchange dynamics should be investigated. In true liquid-liquid phase separation, the rate of chain exchange is often sensitive to temperature. Observing how this rate changes between 290K and 300K, for instance, could help explain the abrupt shift in cluster size seen in Figure 6B.<br /> - The authors should also analyze whether the internal structures of the condensates are consistent with a liquid-like phase. For example, radial distribution functions and contact lifetimes could be calculated to reveal whether the clusters exhibit liquid-like organization.

      (6) Lack of justification of polydispersity of polyQ:<br /> The authors don't provide any rationale for choice of different copies of polyQ used in the manuscript for their chain-growth simulation studies. It will be more apt if it can be motivated via some precedent experimental observations.

      (7) Lack of initiative to connect to Experiments:<br /> While the computational models and simulations provide robust theoretical insights, the absence of direct experimental validation weakens the overall impact of the manuscript. For example, experimental data on how specific mutations in the polyQ tract influence ELF3 behavior in vivo would significantly bolster the authors' claims. The manuscript would benefit from either citing existing experimental studies that corroborate these findings or from suggesting future experimental directions.

    3. Reviewer #2 (Public review):

      Summary:

      The authors aimed to explore how a key protein in the circadian clock of plants, ELF3, responds to temperature changes by forming molecular condensates. They focused on understanding the role of a specific region of the protein, a polyQ tract, in promoting temperature-sensitive structural changes and regulating the formation of condensates. Through a series of computational simulations, they sought to uncover the molecular basis for ELF3's temperature responsiveness and its broader implications for plant growth and adaptation to environmental conditions.

      Strengths:

      The study's strength lies in its focus on an important biological question: how plants sense and respond to temperature changes at the molecular level. The authors employed a variety of computational techniques, including coarse-grained simulations, to explore the role of specific molecular features in this process. These methods provide a multi-scale view of protein behavior and offer valuable insights into how molecular structures may influence biological function.

      Weaknesses:

      However, there are notable weaknesses in the evidence provided. While the authors present trends in molecular changes, such as shifts in helical propensity and the formation of condensates, these results seem subtle and are not strongly substantiated by statistical analysis. The lack of error bars in the figures makes it difficult to distinguish between meaningful signals and potential noise in the data. Furthermore, the temperature-sensitive behavior appears to be influenced more by chain length than by sequence-specific effects of the polyQ region, raising questions about whether the findings truly capture the molecular mechanisms responsible for temperature sensing. Additionally, some simulations, particularly those related to the formation of condensates, do not appear fully converged, which casts further doubt on the robustness of the results.

      Additional Context for Readers:

      Readers should interpret the results with caution, especially regarding the molecular mechanisms proposed for temperature sensing. While the study presents interesting trends, the evidence is not definitive, and the findings may be more reflective of general protein behavior (such as the effect of chain length on condensate formation) than specific sequence-driven responses to temperature. Further experimental studies and more converged simulations will be necessary to fully understand the role of ELF3 in temperature regulation.

    4. Author response:

      We sincerely thank the reviewers for their constructive feedback and the editor for facilitating this thorough review. We found the suggestions insightful and valuable for refining our manuscript.  We would like to clarify a few points in an initial response before presenting the fully updated manuscript. First of all, we would like to emphasize the multi-scale nature of our approach, where we derived insights from both atomistic and coarse-grained simulations. Reviewers focused mostly on the coarse-grained simulations, the drawbacks of which we are aware and were a strong motivation for starting with the atomistic approach. Reviewer 1 mentioned a lack of a proposed mechanism for the increased condensate forming propensity at 300K vs. 290K, and we feel we had clearly pointed to the aromatic contacts as a mechanism for this, but we will make sure to clarify this further in the revision. Furthermore, reviewer 1 was critical of our use of the 10% adjustment to Martini protein-water interactions, which has previously been thoroughly presented and assessed in the literature (see for example Tesei et al JCTC 2022). Furthermore, for our specific system we were encouraged by the favorable comparison of our Martini simulations to the atomistic simulations, e.g. for radius of gyration, contact propensity, and solvent accessibility. We will make sure to emphasize this more clearly in the revision. Finally, we are grateful for the feedback from both reviewers and will use their comments as a guide to incorporate additional analyses and extended simulations to strengthen our conclusions in an upcoming revision.

    1. eLife Assessment

      This important study identifies species- and sex-specific neuronal cell types and gene expression in the medial preoptic area (MPOA) to help understand the evolutionary divergence of social behaviors. The evidence from single-nucleus RNA sequencing and immunostaining is convincing and suggests that cellular differences in the MPOA may contribute to behavioral variations such as mating and parental care that are apparent in two closely related deer mouse species. These rich observations provide an entry point for future hypothesis-driven experiments to demonstrate a causal role for these populations in sex- or species-variable behaviors in vertebrates. These data will be a resource that is of value to behavioral neuroscientists.

    2. Reviewer #1 (Public review):

      (1) Summary of the Paper:

      This paper by Chen et al. examines the cellular composition and gene expression of the hypothalamic medial preoptic area (MPOA) in two closely related deer mouse species (P. maniculatus and P. polionotus) that exhibit distinct social behaviors. Through single-nucleus RNA sequencing (snRNA-seq), Chen et al., identify sex- and species-specific neuronal cell types that likely contribute to differences in mating and parental care. By comparing monogamous and promiscuous species, the study provides insights into how neuronal diversity and gene expression changes in the MPOA might underlie the evolution of social behaviors.

      (2) Strengths of the Paper:

      The paper excels in several areas. First, the data presentation is clear and well-organized, making the complex findings easy to follow. The writing is straightforward and highly accessible, which enhances the overall readability. The experimental design is innovative, particularly in how they combined samples from different species into the same dataset and then used post-hoc identification to distinguish cell types by species. This dramatically controls for potential batch effects in my opinion. Additionally, the authors contextualize their findings within the framework of previously published studies on Mus musculus, providing a strong comparative analysis that enhances the significance of their work.

      3) Weaknesses of the Paper:

      The major limitation of the study is the absence of causal experiments linking the observed changes in MPOA cell types to species-specific social behaviors. While the study provides valuable correlational data, it lacks functional experiments that would demonstrate a direct relationship between the neuronal differences and behavior. For instance, manipulating these cell types or gene expressions in vivo and observing their effects on behavior would have strengthened the conclusions, although I certainly appreciate the difficulty in this, especially in non-musculus mice. Without such experiments, the study remains speculative about how these neuronal differences contribute to the evolution of social behaviors.

    3. Reviewer #2 (Public review):

      Summary:

      The authors report several interesting species and sex differences in cell type expression that may relate to species differences in behavior. The differential cell type abundance findings build on previously observed species/sex differences in behavior and brain anatomy. These data will be a valuable resource for behavioral neuroscientists. These findings are important but the manuscript goes too far in attributing causal influences to differences in behavior. A second important problem is that dissections used for the sequencing data include other neuropeptide-rich areas of the hypothalamus like the PVN. Although histology is included, the results in the main manuscript often do not include the mPOA making it hard to know if species/sex differences are consistent across different hypothalamic regions. The manuscript would benefit from more precise language.

      Strengths:

      The data are novel because cell-type atlases are available for only a few species.

      The authors have clearly defined appropriate steps taken to obtain trustworthy estimations of cell type abundance. Furthermore, the criteria for each cell type assignment were described in a way for readers to easily replicate. The rigor in comparing cell abundance provides convincing evidence that these species have differences in MPOA cellular composition.

      The authors have a good explanation for why 19 of the 53 neuron clusters were not classified (possible Mus/Peromyscus anatomical differences, some cell types don't have well-defined transcriptional profiles).

      Validated findings with histology

      Weaknesses:

      Some methodology could be further explained, like the decision of a 15% cutoff value for cell type assignment per cluster, or the necessity of a multi-step analysis pipeline for gene enrichment studies.

      The authors should exercise strong caution in making inferences about these differences being the basis of parental behavior. It is possible, given connections to relevant research, but without direct intervention, direct claims should be avoided. There should be clear distinctions of what to conclude and what to propose as possibilities for future research.

      Histology is not performed on all regions included in the sequencing analysis.

    4. Reviewer #3 (Public review):

      Summary:

      The authors performed snRNA-seq in the pre-optic area (POA), a heterogeneous brain region implicated in multiple innate behaviors, comparing two species of Peromyscus mice that possess strikingly different parenting behaviors. P. polionotus shows high levels of parental care from both sexes of parent, and P. maniculatus shows lower levels of care, predominantly displayed by dams rather than sires. The overall goal of understanding the genomic basis of behavioral variation is significant and of broad interest and comparative studies in POA in these two species is an excellent approach to tackle this question. The authors correctly point out that existing studies largely compare species that are highly divergent, such as mice and humans, which confounds the association of specific neuronal populations or gene expression patterns with distinct behaviors. They identify neuronal populations with differential abundance between species and sexes and additionally report sex and species differences in gene expression within each transcriptomic cell type. Their cell type classification is aided by mapping their Peromyscus cells onto a previously existing POA single-cell dataset generated in lab mice. However, a significant fraction of the cells cannot be assigned to Mus types, which confounds their analysis. The detection and validation of previously observed sex differences in the Gal/Moxd1 cell type and species differences in Avp expression provide additional support that their data are solid. This study provides an important resource for comparative single-cell studies in the brain.

      Strengths:

      This is a pioneering comparative snRNA-seq study that provides a roadmap for similar approaches in non-traditional model organisms.

      The authors have identified populations that may underlie sex- and species- differences in parenting behavior in rodents.

      A significant strength of the manuscript is the histological validation of their most robust marker genes.

      Weaknesses:

      My primary concern is that the dataset is limited: 52,121 neuronal nuclei across 24 samples, which does not provide many cells per cluster to analyze comparatively across sex and species, particularly given the heterogeneity of the region dissected. The Supplementary table reports lower UMIs/genes per cell than is typically seen as well. Perhaps additional information could be obtained from the data by not restricting the analyses to cells that can be assigned to Mus types. A direct comparison of the two Peromyscus species could be valuable as would a more complete Peromyscus POA atlas.

      In Supplement 7, it appears that most neurons can be assigned as excitatory or inhibitory, but then so many of these cells remain in the unassigned "gray blob" seen in panel 1E. Clustering of excitatory and inhibitory neurons separately, as in in prior cited work in Mus POA (refs 31 and 57) may boost statistical power to detect sex and species differences in cell types. Perhaps the cells that cannot be assigned to Mus contain too few reads to be useful, in which case they should be filtered out in the QC. The technical challenges of a comparative single-cell approach are considerable, so it benefits the scientific community to provide transparency about them.

      The Calb1 dimorphism as observed by immunostaining, appears much more extensive in P. maniculatus compared to P. polionotus (Figures 3 E and F). This finding is not reflected in the counts of the i20:Gal/Moxd1 cluster. The use of Calb1 staining as a proxy for the Gal/Moxd1 cluster would be strengthened if the number of POA Calb1+ neurons that are found in each cluster was apparent. There may be additional Calb+ neurons in the cells that are not annotated to a Mus cluster. This clarification would add support to the overall conclusion that there is reduced sexual dimorphism in P. polionotus.

      The relationship between the sex steroid receptor expression and the sex bias in gene expression would be improved if the sex bias in sex steroid receptor expression was included in Supplementary Figure 10.

      There is no explanation for the finding that there is a female bias in gene expression across all cell types in P. polionotus.

    5. Author response:

      We thank the reviewers for their thoughtful comments. 

      Based on their suggestions we will: 

      (1) Use more accurate language to describe the hypothalamus regions under investigation in this study. While we aimed to primarily investigate the medial preoptic area (MPOA), our dissections and sequencing data in fact capture several regions of the anterior hypothalamus including the anteroventral periventricular (AVPV), paraventricular (PVN), supraoptic (SON), suprachiasmatic nuclei (SCN), and more. We will revise the language in our manuscript to reflect that our study in fact investigates the cellular evolution of the anterior hypothalamus across behaviorally divergent deer mice.

      (2) Revise our language to clarify that while our study provides a rich dataset for generating hypotheses about which cell types may contribute to behavioral differences, it does not provide any evidence of causal relationships. We hope to investigate this further in future work.

      (3) Clarify specific methodological choices for which reviewers had questions, especially about the hypothalamic regions for which we did histology to validate cell abundance differences and methodological choices related to mapping our cell clusters to Mus cell types.

      Our responses to each reviewer’s specific comments are below.

      Reviewer #1:

      The major limitation of the study is the absence of causal experiments linking the observed changes in MPOA cell types to species-specific social behaviors. While the study provides valuable correlational data, it lacks functional experiments that would demonstrate a direct relationship between the neuronal differences and behavior. For instance, manipulating these cell types or gene expressions in vivo and observing their effects on behavior would have strengthened the conclusions, although I certainly appreciate the difficulty in this, especially in non-musculus mice. Without such experiments, the study remains speculative about how these neuronal differences contribute to the evolution of social behaviors.

      Yes, we agree the study lacks functional experiments. We hope that the dataset is of value for generating hypotheses about how hypothalamic neuronal cell types may govern species-specific social behaviors, and for these hypotheses to be functionally tested by us and others in future work.

      Reviewer #2:

      Some methodology could be further explained, like the decision of a 15% cutoff value for cell type assignment per cluster, or the necessity of a multi-step analysis pipeline for gene enrichment studies.

      A 15% cutoff value for cell type assignment was chosen to include all known homology correspondences between our dataset and the Mus atlas. For example, i14:Avp/Cck cells from the Mus atlas represent Avp cells from the suprachiasmatic nuclei (SCN). Though only 17.3% of cluster 15 maps to i14:Avp/Cck, we know these two clusters correspond based on the expression of Avp and additional SCN marker genes in cluster 15 (Supp Fig 6). We will further explain this cutoff in the revised manuscript.

      Our gene enrichment study includes a multi-step analysis pipeline because we wanted to control for confounders that may be introduced because of gene expression level. Genes that are more highly expressed are more accurately quantified and thus more likely to be identified as differentially expressed. Therefore, we wanted to test for gene enrichments in our set of DE genes against a background of genes with similar expression levels. We will clarify this motivation in the revised manuscript.

      The authors should exercise strong caution in making inferences about these differences being the basis of parental behavior. It is possible, given connections to relevant research, but without direct intervention, direct claims should be avoided. There should be clear distinctions of what to conclude and what to propose as possibilities for future research.

      Yes, we agree that we are unable to make direct claims about neuronal differences being the basis of parental behavior. We will revise our language to be clearer about which relationships we are hypothesizing and what we propose as possibilities for future research.

      Histology is not performed on all regions included in the sequencing analysis.

      We apologize that our language describing the hypothalamic regions included in the sequencing analysis and those included in the histology is unclear. We aimed to dissect the medial preoptic region for the sequencing analysis, but additionally captured parts of the anterior hypothalamus including the paraventricular (PVN), supraoptic (SON), and suprachiasmatic nuclei (SCN), and more.  Our histology was performed across the entire hypothalamus and includes all regions included in the sequencing data. We will revise the manuscript to more accurately describe the hypothalamic regions for which we investigated.

      Reviewer #3:

      My primary concern is that the dataset is limited: 52,121 neuronal nuclei across 24 samples, which does not provide many cells per cluster to analyze comparatively across sex and species, particularly given the heterogeneity of the region dissected. The Supplementary table reports lower UMIs/genes per cell than is typically seen as well. Perhaps additional information could be obtained from the data by not restricting the analyses to cells that can be assigned to Mus types. A direct comparison of the two Peromyscus species could be valuable as would a more complete Peromyscus POA atlas.

      Our dataset reports ~1,500 genes and ~1,000 UMIs per nuclei which is indeed lower than is typically reported in other single nuclei datasets. Some of this discrepancy is due to a lower quality genome and annotated transcriptome available for Peromyscus compared to Mus musculus, which results in a lower mapping rate than is typically reported in Mus studies. However, our dataset was sufficient to identify known peptidergic cell types (Supp Fig 6) and to map homology to Mus cell types for 34 (64%) of our 53 clusters. Additionally, although some of our clusters contain small numbers of cells, our differential abundance analysis accounts for the variance in cell numbers observed across samples and should be robust against any increase in variance due to small numbers. In fact, even differential abundance of very small cell clusters such as oxytocin neurons (cell type 40) was validated by histology. 

      We would like to clarify that all analyses were performed on all cell clusters, regardless of whether or not they could be assigned homology to a Mus cell type. All the cell types that we identified as differentially abundant or contained significant sex differences happened to be cell types for which homology to a Mus cell type could be defined. This may arise for a relatively uninteresting reason: cell types that have more distinct transcriptional signatures will be more accurately clustered, leading to more accurate identification of homology as well as more accurate measurements of differential abundance / expression. We will revise language to make this more clear in our manuscript.

      In Supplement 7, it appears that most neurons can be assigned as excitatory or inhibitory, but then so many of these cells remain in the unassigned "gray blob" seen in panel 1E. Clustering of excitatory and inhibitory neurons separately, as in prior cited work in Mus POA (refs 31 and 57) may boost statistical power to detect sex and species differences in cell types. Perhaps the cells that cannot be assigned to Mus contain too few reads to be useful, in which case they should be filtered out in the QC. The technical challenges of a comparative single-cell approach are considerable, so it benefits the scientific community to provide transparency about them.

      We are not certain about why we are unable to cluster and assign homology to many of our cells (i.e. cells in the unassigned “gray blob”). However, we note that even in the Mus atlas, many cells did not belong to obvious clusters by UMAP visualization and that several clusters lacked notable marker genes and were designated simply as “Gaba” and “Glut” clusters. Therefore, it is unsurprising that our own dataset also contains cells that lack the transcriptional signatures needed to be clustered and/or mapped to Mus cell types. We do know, however, that the median number of reads/nuclei is uniform across cell clusters and does not explain why some clusters could not be assigned to Mus. We will add this information to our revised manuscript. 

      We do not think that a two-stage clustering (i.e. clustering first by excitatory vs. inhibitory neurons) is expected to gain power to resolve cell types in this case. Excitatory vs. inhibitory neurons are clearly separable on our UMAP (Supp Fig 7) so that information is already being used by our clustering procedure. However, we will explore this further in our revised manuscript to see if doing so will boost statistical power.

      The Calb1 dimorphism as observed by immunostaining, appears much more extensive in P. maniculatus compared to P. polionotus (Figures 3 E and F). This finding is not reflected in the counts of the i20:Gal/Moxd1 cluster. The use of Calb1 staining as a proxy for the Gal/Moxd1 cluster would be strengthened if the number of POA Calb1+ neurons that are found in each cluster was apparent. There may be additional Calb+ neurons in the cells that are not annotated to a Mus cluster. This clarification would add support to the overall conclusion that there is reduced sexual dimorphism in P. polionotus.

      From the Mus MPOA atlas (which includes both single-cell sequencing data and imaging-based spatial information), it is known that the i20:Gal/Moxd1 cluster comprises sexually dimorphic cells that make up both the BNST and the SDN-POA. These sexually dimorphic cells are well-studied and known to be marked by Calb1, which we used in immunostaining as a proxy for i20:Gal/Moxd1. 

      However, we would like to clarify that in our study, the immunostaining of Calb1+ neurons and the sequencing counts of the i20:Gal/Moxd1 cluster are not completely reflective of each other because our sequencing dataset only captured the ventral portion of the BNST. Therefore our i20:Gal/Moxd1 counts contain a combination of some Calb1+ BNST cells and likely all Calb1+ SDN-POA cells and is difficult to interpret on its own. Our histology, however, covers the entire hypothalamus and is more reliable for identifying sex and species differences in each region. We will clarify this in the revised manuscript. 

      The relationship between the sex steroid receptor expression and the sex bias in gene expression would be improved if the sex bias in sex steroid receptor expression was included in Supplementary Figure 10.

      We will include this in the revised manuscript. 

      There is no explanation for the finding that there is a female bias in gene expression across all cell types in P. polionotus.

      We also find this observation interesting but don’t have a good explanation for why at this point. We plan to follow this up in future work.

    1. eLife Assessment

      This valuable study investigates the brain representations of Braille letters in blind participants and provides evidence using EEG and fMRI that the decoding of letter identity across the reading hand takes place in the visual cortex. The evidence supporting the claims of the authors is convincing and the work will be of interest to neuroscientists working on brain plasticity.

    2. Reviewer #1 (Public review):

      Summary:

      The researchers examined how individuals who were born blind or lost their vision early in life process information, specifically focusing on the decoding of Braille characters. They explored the transition of Braille character information from tactile sensory inputs, based on which hand was used for reading, to perceptual representations that are not dependent on the reading hand.

      They identified tactile sensory representations in areas responsible for touch processing and perceptual representations in brain regions typically involved in visual reading, with the lateral occipital complex serving as a pivotal "hinge" region between them.

      In terms of temporal information processing, they discovered that tactile sensory representations occur prior to cognitive perceptual representations. The researchers suggest that this pattern indicates that even in situations of significant brain adaptability, there is a consistent chronological progression from sensory to cognitive processing.

      Strengths:

      By combining fMRI and EEG, and focusing on the diagnostic case of Braille reading, the paper provides an integrated view of the transformation processing from sensation to perception in the visually deprived brain. Such a multimodal approach is still rare in the study of human brain plasticity and allows to discern the nature of information processing in blind people early visual cortex, as well as the timecourse of information processing in a situation of significant brain adaptability.

      Weaknesses:

      ROI and searchlight analyses are not completely overlapping, although this might be due to the specific limits and strengths of each approach. Moreover, the conclusions regarding the behavioral relevance of the sensory and perceptual representations in the putatively reorganized brain, although important, are limited due to the behavioral measurements adopted.

    3. Reviewer #2 (Public review):

      Summary:

      Haupt and colleagues performed a well-designed study to test the spatial and temporal gradient of perceiving braille letters in blind individuals. Using cross-hand decoding of the read letters, and comparing it to the decoding of the read letter for each hand, they defined perceptual and sensory responses. Then they compared where (using fMRI) and when (using EEG) these were decodable. Using fMRI, they showed that low-level tactile responses specific to each hand are decodable from the primary and secondary somatosensory cortex as well as from IPS subregions, the insula and LOC. In contrast, more abstract representations of the braille letter independent from the reading hand were decodable from several visual ROIs, LOC, VWFA and surprisingly also EVC. Using a parallel EEG design, they showed that sensory hand-specific responses emerge in time before perceptual braille letter representations. Last, they used RSA to show that the behavioral similarity of the letter pairs correlates to the neural signal of both fMRI (for the perceptual decoding, in visual and ventral ROIs) and EEG (for both sensory and perceptual decoding).

      Strengths:

      This is a very well-designed study and it is analyzed well. The writing clearly describes the analyses and results. Overall, the study provides convincing evidence from EEG and fMRI that the decoding of letter identity across the reading hand occurs in the visual cortex in blindness. Further, it addresses important questions about the visual cortex hierarchy in blindness (whether it parallels that of the sighted brain or is inverted) and its link to braille reading.

    4. Author response:

      The following is the authors’ response to the original reviews.

      Public Reviews: 

      Reviewer #1 (Public Review): 

      We thank Reviewer #1 for the relevant and insightful comments on our paper. Please find our detailed answers below in the Recommendations to the Authors section.

      Summary: 

      The researchers examined how individuals who were born blind or lost their vision early in life process information, specifically focusing on the decoding of Braille characters. They explored the transition of Braille character information from tactile sensory inputs, based on which hand was used for reading, to perceptual representations that are not dependent on the reading hand. 

      They identified tactile sensory representations in areas responsible for touch processing and perceptual representations in brain regions typically involved in visual reading, with the lateral occipital complex serving as a pivotal "hinge" region between them.

      In terms of temporal information processing, they discovered that tactile sensory representations occur prior to cognitive-perceptual representations. The researchers suggest that this pattern indicates that even in situations of significant brain adaptability, there is a consistent chronological progression from sensory to cognitive processing. 

      Strengths: 

      By combining fMRI and EEG, and focusing on the diagnostic case of Braille reading, the paper provides an integrated view of the transformation processing from sensation to perception in the visually deprived brain. Such a multimodal approach is still rare in the study of human brain plasticity and allows us to discern the nature of information processing in blind people's early visual cortex, as well as the time course of information processing in a situation of significant brain adaptability. 

      Weaknesses: 

      The lack of a sighted control group limits the interpretations of the results in terms of profound cortical reorganization, or simple unmasking of the architectural potentials already present in the normally developing brain. 

      We thank the reviewer for raising this important point! We acknowledge that our claims regarding the unmasking of architectural potentials in both the normally developing and visually deprived brain are limited by the study design we employed. However, we note that defining an appropriate control group and assessing non-visual reading in sighted participants is far from straightforward. We discuss these issues in our response to the Public Review of Reviewer 2.

      Moreover, the conclusions regarding the behavioral relevance of the sensory and perceptual representations in the putatively reorganized brain are limited due to the behavioral measurements adopted.

      We agree with the reviewer that the relation between behavior and neural representations as established via perceived similarity judgments are task-dependent, and that a richer assessment of behavior would be valuable. Please note, however, that this limitation pertains to any experimental task used to assess behavior in the laboratory. Our major goal was to assess whether the identified neural representations are suitably formatted to be used by the brain for at least one behavior rather than being epiphenomenal. We found that the representations are suitably formatted for similarity judgments, thus establishing that they are relevant for at least this behavior. We also argue that judging similarity is a complex task that may underlie many other relevant behaviors. We discuss this point further in response to the Recommendations to the Authors.

      Reviewer #2 (Public Review): 

      We thank the reviewer for the considerate and thoughtful suggestions. Please find a detailed description of the implemented changes below.

      Summary: 

      Haupt and colleagues performed a well-designed study to test the spatial and temporal gradient of perceiving braille letters in blind individuals. Using cross-hand decoding of the read letters, and comparing it to the decoding of the read letter for each hand, they defined perceptual and sensory responses. Then they compared where (using fMRI) and when (using EEG) these were decodable. Using fMRI, they showed that low-level tactile responses specific to each hand are decodable from the primary and secondary somatosensory cortex as well as from IPS subregions, the insula, and LOC. In contrast, more abstract representations of the braille letter independent from the reading hand were decodable from several visual ROIs, LOC, VWFA, and surprisingly also EVC. Using a parallel EEG design, they showed that sensory hand-specific responses emerge in time before perceptual braille letter representations. Last, they used RSA to show that the behavioral similarity of the letter pairs correlates to the neural signal of both fMRI (for the perceptual decoding, in visual and ventral ROIs) and EEG (for both sensory and perceptual decoding). 

      Strengths: 

      This is a very well-designed study and it is analyzed well. The writing clearly describes the analyses and results. Overall, the study provides convincing evidence from EEG and fMRI that the decoding of letter identity across the reading hand occurs in the visual cortex in blindness. Further, it addresses important questions about the visual cortex hierarchy in blindness (whether it parallels that of the sighted brain or is inverted) and its link to braille reading. 

      Weaknesses: 

      Although I have some comments and requests for clarification about the details of the methods, my main comment is that the manuscript could benefit from expanding its discussion. Specifically, I'd appreciate the authors drawing clearer theoretical conclusions about what this data suggests about the direction of information flow in the reorganized visual system in blindness, the role VWFA plays in blindness (revised from the original sighted role or similar to it?), how information arrives to the visual cortex, and what the authors' predictions would be if a parallel experiment would be carried out in sighted people (is this a multisensory recruitment or reorganization?). The data has the potential to speak to a lot of questions about the scope of brain plasticity, and that would interest broad audiences. 

      We thank the reviewer for the opportunity to provide clearer theoretical conclusions from our data. We elaborate on each of the points raised by the reviewer in the discussion section.

      Concerning the direction of information flow in the reorganized visual system in blindness, we focus on information arrival to EVC and information flow beyond EVC.

      p. 11, ll. 376-386, Discussion 4.1:

      “Overall, identifying braille letter representations in widespread brain areas raises the question of how information flow is organized in the visually deprived brain. Functional connectivity studies report deprivation-driven changes of thalamo-cortical connections which could explain both arrival of information to and further flow of information beyond EVC. First, the coexistence of early thalamic connections to both S1 and V1 (Müller et al., 2019) would enable EVC to receive from different sources and at different timepoints. Second, potentially overlapping connections from both sensory cortices to other visual or parietal areas (Ioannides et al., 2013) could enable the visually deprived brain to process information in a widespread and interconnected array of brain areas. In such a network architecture, several brain areas receive and forward information at the same time. In contrast to information discretely traveling from one processing unit to the next in the sighted brain’s processing cascade, we can rather picture information flowing in a spatially and functionally more distributed and overlapping fashion.”

      Regarding the role of VWFA, we propose that the functional organization of VWFA is modality-independent.

      p. 10, ll. 346-348, Discussion 4.1:

      “Second, we found that VWFA contains perceptual but not sensory braille letter representations. By clarifying the representational format of language representations in VWFA, our results support previous findings of the VWFA being functionally selective for letter and word stimuli in the visually deprived brain (Reich et al., 2011; Striem-Amit et al., 2012; Liu et al., 2023). Together, these findings suggest that the functional organization of the VWFA is modality-independent (Reich et al., 2011), depicting an important contribution to the ongoing debate on how visual experience shapes representations along the ventral stream (Bedny et al., 2021).” Lastly, we would like to share our thoughts about carrying out a parallel experiment in sighted people. 

      In general, we agree that it seems insightful to conduct a parallel, analogous experiment in sighted participants with the aim to disentangle whether the effects seen in blind participants are due to multisensory recruitment or reorganization. However, before making predictions regarding the outcome, we would have to define an analogous experiment in sighted participants that taps into the same mechanisms. This, however, is difficult to do as it is unclear what counts as analogous. For example, if we compare braille reading to reading visually presented braille dot arrays or Roman letters, we will assess visual object processing, a different mechanism from that involved in braille reading. Alternatively, if we compare braille reading to sighted participants reading embossed Roman letters haptically or ideally even reading Braille after extensive training, we still face the inherent problem that sighted participants have visual experiences and could use visual imagery strategies in these nonvisual tasks. As we cannot experimentally ensure that sighted participants do not use visual strategies to solve a task, this would always complicate drawing conclusions about the underlying processes. More specifically, we could never pinpoint whether differences between sighted and blind participants are due to measuring different mechanisms or measuring the same mechanism and unravelling underlying changes (i.e., multisensory recruitment or reorganization). Finally, apart from potential confounds due to visual imagery, considering populations of sighted readers and Braille readers as only differing with regard to their input modality and otherwise being comparable is problematic: In general, blind populations are more heterogenous than most typical samples due to various factors such as aetiologies, onset and severity (Merabet & Pascual-Leone, 2010). Even when carrying out studies in highly specific population subsamples, such as in congenitally blind braille readers, vast within-group differences remain, e.g., the quality and quantity of their braille education, as well as across braille and print readers, e.g., different passive exposure to braille versus written letters during childhood (Englebretson et al., 2023). Hence, to fully match the groups in terms of learning experience we would, for example, have to teach sighted infants braille reading in childhood and follow them up until a comparable age. This approach does not seem feasible. 

      p. 10, ll. 328-341, Discussion 4.1:

      “We note that our findings contribute additional evidence but cannot conclusively distinguish between the competing hypotheses that visually deprived brains dynamically adjust to the environmental constraints versus that they undergo a profound cortical reorganization. Resolving this debate would require an analogous experiment in sighted people which taps into the same mechanisms as the present study. Defining a suitable control experiment is, however, difficult. Any other type of reading would likely tap into different mechanism than braille reading. Further, whenever sighted participants are asked to perform a haptic reading task, outcomes can be confounded by visual imagery driving visual cortex (Dijkstra et al., 2019). Thus, the results would remain ambiguous as to whether observed differences between the groups index different mechanisms or plastic changes in the same mechanisms. Last, matching groups of sighted readers and braille readers such that they only differ with regard to their input modality seems practically unfeasible: There are vast differences within the blind population in general, e.g., aetiologies, onset and severity, and the subsample of congenitally blind braille readers more specifically, e.g., the quality and quantity of their braille education, as well as across braille and print readers, e.g., different passive exposure to braille versus written letters during childhood (Englebretson et al., 2023; Merabet & Pascual-Leone, 2010).”

      While we appreciate that the conclusions we can draw from our results are limited by our sample and defining an appropriate parallel experiment in sighted participants is difficult for the reasons discussed above, we would still like to share our speculations regarding the process underlying our result pattern. We think that our results, taken together with results of previous studies, suggest that EVC does not undergo fundamental reorganization in the case of visual deprivation. Rather, it can flexibly adjust to given processing requirements. This flexibility is not infinite; adjustments are limited by the area’s architectural and computational capacity. Importantly, we think that this claim refers to an unmasking of preexisting potential rather than multisensory recruitment.

      To aid in drawing even more concrete conclusions about the flow of information, I suggest that the authors also add at least another early visual ROI to plot more clearly whether EVC's response to braille letters arrives there through an inverted cortical hierarchy, intermediate stages from VWFA, or directly, as found in the sighted brain for spoken language. 

      We thank the reviewer for this comment. However, EVC here consists of V1 to V3, and we already also assess V4, LOC, VWFA and LFA. Thus, we assess regions at all levels of processing from mid- over low- to high-level and cannot add a further interim ROI. Our results using this ROI set do not allow us to arbitrate between the hypotheses raised by the reviewer.

      Similarly, it may be informative to look specifically at the occipital electrodes' time differences between decoding for the different parameters and their correlation to behavior.

      We thank the reviewer for this suggestion. However, the spatial resolution of EEG measurements is limited, and we cannot convincingly determine the neural source of signals being recorded from specific electrodes, i.e., occipital. When we reduce the number of electrodes before analysis, we primarily see comparable qualitative trends in the data albeit with a reduction in signal-to-noise-ratio.

      To illustrate, we repeated the EEG time decoding and the EEG-behavior RSA with only occipital and parieto-occipital electrodes (n=8) instead of all electrodes (n=63) and added the results to the Supplementary Material (see Supplementary Figure 3 and 4). Overall, we observe a reduction in signal-to-noise-ratio. This is not surprising given that the EEG searchlight decoding results (Figure 3b) reveal sources of the decoding signals extend beyond occipital and parieto-occipital electrodes. 

      In the EEG time decoding analysis, we see a comparable trend to the whole brain EEG analysis but do not find a significant difference in onsets of sensory and perceptual representation. 

      In the behavior-EEG RSA, we do find that the correlations between behavior and sensory representations emerge significantly earlier than correlations between behavior and perceptual representations. (N = 11, 1,000 bootstraps, one-tailed bootstrap test against zero, P< 0.001). This result is in line with the whole brain EEG analysis.

      Regarding the methods, further detail on the ability to read with both hands equally and any residual vision of the participants would be helpful.

      We thank the reviewer for raising this point. We assessed participants’ letter reading capabilities in a short screening task prior to the experiment. Participants read letters with both hands separately and we used the same presentation time as in the experiment. As the result showed that average performance for recognizing letters with the left hand (89%) and right hand (88%) were comparable. We did not measure continuous reading in the present study, and we did not assess further information about participants’ ability to read equally well with both hands. 

      While the information about the screening task was previously included in Methods section 5.3.2 EEG experiment, we now moved it into a separate section 5.3.3 Braille screening task to make the information better accessible. 

      p. 14, ll. 529-533, Methods 5.3.3:

      “Prior to the experiment, participants completed a short screening task during which each letter of the alphabet was presented for 500ms to each hand in random order. Participants were asked to verbally report the letter they had perceived to assess their reading capabilities with both hands using the same presentation time as in the experiment. The average performance for the left hand was 89% correct (SD = 10) and for the right hand it was 88% correct (SD = 13).”

      We thank the reviewer for the suggestion to include information regarding participant’s residual vision. We now added information about participants’ residual light perception to Supplementary Table 1.

      Recommendations for the authors:

      Reviewer #1 (Recommendations For The Authors): 

      (1) ROI vs Searchlight Results: Figures 2 b and c do not seem to match. The ROI results (b) should be somehow consistent with the whole brain results (c), but "perceptual" decoding in the searchlight (in green) seems localized in sensorimotor areas while for the same classification, no sensorimotor ROI is significant. can the authors clarify this difference?

      Similarly, perceptual decoding does not emerge in EVC with the searchlight analysis, whereas is quite strong in ROI analysis.

      We agree that the results of the ROI and searchlight decoding do not show a direct match. We think that this difference is due to methodological reasons. For example, ROI decoding can be more sensitive when ROIs follow functionally relevant boundaries in the brain, in comparison to spheres used in searchlight decoding that do not. In turn, searchlight decoding may be more sensitive when information is distributed across functional boundaries that would be captured in different ROIs rather than combined, or when ROI definition is difficult (such as here in the visual system of blind participants).

      However, we point out that the primary goal of our searchlight decoding was to show that no other areas beyond our hypothesized ROIs contained braille letter representations, rather than reproducing the ROI results.

      Decoding accuracies are tested against chance (50% for pairwise classifications) according to methods. In the case of "sensory and perceptual" and "perceptual" classification, this is straightforward. In the case of the analysis that isolates "sensory" representations though the difference is computed between "sensory and perceptual" and "perceptual" decoding accuracies, the accuracies resulting from this difference should thus be centered around 0.

      Are the accuracies tested against 0 in this case? This is not specified in the methods. Furthermore, the data reported in Figure 2 and Figure 3. seem to have 0% as a baseline and the label states "decoding accuracy". Can the authors clarify whether the reported data are the difference in accuracy with an estimated empirical baseline or an expected baseline of 50%? 

      The reviewer is correct in stating that we tested “sensory and perceptual” and “perceptual” against chance level and the difference score “sensory” against 0 and that this information was missing in the methods section.

      We now specify in the methods that we are testing the accuracies for the “sensory” analysis against 0.

      p. 16, ll. 625-627, Methods 5.6:

      “We conducted subject-specific braille letter classification in two ways. First, we classified between letter pairs presented to one reading hand, i.e., we trained and tested a classifier on brain data recorded during the presentation of braille stimuli to the same hand (either the right or the left hand). This yields a measure of hand-dependent braille letter information in neural measurements. We refer to this analysis as within-hand classification. Second, we classified between letter pairs presented to different hands in that we trained a classifier on brain data recorded during the presentation of stimuli to one hand (e.g., right), and tested it on data related to the other hand (e.g., left). This yields a measure of hand-independent braille letter information in neural measurements. We refer to this analysis as across-hand classification. We tested both within-hand and across-hand pairwise classification accuracies against a chance level of 50%. We also calculated a within-across hand classification score which we compared against 0.”

      Regarding Figures 2 and 3, we plot the results as decoding accuracies minus chance level to standardize the y-axes for all three analyses, i.e., compare them to 0. We have corrected the y-axis labels accordingly. 

      In our analyses, we assumed an expected baseline of 50%. But in the response below we provide evidence that our results remain stable whether using an expected or empirical baseline.

      If my understanding is correct, a potential problem persists. The different analyses may not be comparable, because in the "sensory" analysis the baseline is empirically defined, being the classification accuracies of the "perceptual" decoding, while in the other two analyses, the baseline is set at 50%. There are suggestions in the literature to derive empirically defined baselines by randomly shuffling the trial labels and repeating the classification accuracies [grootswagers 2017]. In the context of the present work, its use will make the different statistical analyses more comparable. I would thus suggest the authors define the baseline empirically for all their analyses or, given the high computational demand of this analysis, provide evidence that the results are not affected by this difference in the baseline. 

      We thank the reviewer for raising this point. As the reviewer correctly stated, the “sensory” analysis has an empirically defined baseline because it is a difference score while in the other two analyses the baseline is set at 50%.

      To provide evidence that our results are not affected by this difference in baseline, we now re-ran the EEG time decoding. We derived null distributions from the empirical data for all three analyses, following the guidelines from Grootswagers 2017 (page 688, section “Evaluation of Classifier Performance and Group Level Statistical Testing Statistical”):

      “Another popular alternative is the permutation test, which entails repeatedly shuffling the data and recomputing classifier performance on the shuffled data to obtain a null distribution, which is then compared against observed classifier performance on the original set to assess statistical significance (see, e.g., Kaiser et al., 2016; Cichy et al., 2014; Isik et al., 2014). Permutation tests are especially useful when no assumptions about the null distribution can be made (e.g., in the case of biased classifiers or unbalanced data), but they take much longer to run (e.g., repeating the analysis 10,000 times).”

      Running a sign permutation test with 10,000 repetitions, we show that the results are comparable to the previously reported results based on one-sided Wilcoxon signed rank tests. We are, therefore, confident that our reported results are not affected by this difference in baseline. We now added this control analysis to the results section and supplementary material (see Supplementary Figure 5).

      p. 7-8, ll. 213-215, Results 3.2: 

      “Importantly, the temporal dynamics of sensory and perceptual representations differed significantly. Compared to sensory representations, the significance onset of perceptual representations was delayed by 107ms (21-167ms) (N = 11, 1,000 bootstraps, one-tailed bootstrap test against zero, P= 0.012). This results pattern was consistent when defining the analysis baseline empirically (see Supplementary Figure 5).”

      (2) According to the authors, perceptual rather than sensory braille letter representations identified in space are suitably formatted to guide behavior. However, they acknowledge that this finding is likely to be task-dependent because it is based on subject similarity ratings.

      Maybe they could use a more objective similarity measurement of Braille letters similarity?

      For instance, they can compare letters using Jaccard similarity (See for instance: Bottini et al. 2022). 

      We thank the reviewer for the opportunity to clarify. We acknowledge that our findings regarding the behavioral relevance of the identified neural representations are task-dependent. But, importantly, this is not because we use perceived similarity ratings as a measurement, but because we only use one measurement while there are infinitely many other potential tasks to assess behavior. This means that the same limitation holds when using another similarity measure like Jaccard similarity. We now clarify this in the Discussion section: 

      p. 12, ll. 419-420, Discussion 4.3:

      “Our results clarified that perceptual rather than sensory braille letter representations identified in space are suitably formatted to guide behavior. However, we only use one specific task to assess behavior and, therefore, acknowledge that this finding is taskdependent.”

      Nevertheless, we calculated Jaccard similarity based on the definition used in Bottini et. al. There are no significant correlations for the EEG-behavior or fMRI-behavior RSA when we use the Jaccard matrix and subject-specific EEG or fMRI RDMs (see Supplementary Figure 6).

      This demonstrates that braille letter similarity ratings are significantly correlated with neural representations in space and time but Jaccard similarity of braille dot overlaps is not. 

      (3) If the primacy of perceptual similarity holds also with more objective measures of letter similarity, I think the authors should spend a few more words characterizing the results in fMRI and EEG that are rather divergent (concerning this analysis). Indeed, EEG analysis shows a significant correlation between similarity ratings and within-hand classification accuracy, although this correlation does not emerge in the "sensory" ROIs. I think these findings can be put together, hypothesizing that sensory-based similarity correlates with behavior but only in perceptual ROIs. However, why so? Can the authors provide a more mechanistic explanation? Am I missing something? 

      We thank the reviewer for this intriguing idea. We now speculate about how we could harmonize the results from the behavior-EEG and behavior-fMRI RSAs in the discussion section. 

      p. 12, ll. 438-442, Discussion 4.3:

      “Similarity ratings and sensory representations as captured by EEG are correlated, and so are similarity ratings and representations in perceptual ROIs, but not sensory ROIs. This might be interpreted as suggesting a link between the sensory representations captured in EEG and the representations in perceptual ROIs. However, we do not have any evidence towards this idea. Differing signalto-noise ratios for the different ROIs and sensory versus perceptual analysis could be an alternative explanation.“

      (4) In the methods they state that EEG decoding is tested against chance at each time point but these results are not reported, only latency analysis is reported. Can the authors report the significant time points of the EEG time series decoding?  

      We thank the reviewer for catching this inconsistency! We have now added this information to Figure 3a.

      (5) In fMRI ROI definition procedure, the top 321 voxels of each anatomical ROI that had the highest functional activation were selected. The number of voxels is based on the smaller ROI, which to my understanding means that for this ROI all the voxels were selected potentially introducing noise and impacting the comparison between ROIs. Can the authors clarify which ROI was the smallest? 

      Thank you for the question! The smallest ROI was V4. This indeed means that for this ROI all voxels were selected. This could have led to our results being noisy in V4 but should not influence the results in other ROIs. We now added this information to the methods section.  p. 15, ll. 592, Methods 5.4.4:

      “The smallest mask was V4 which included 321 voxels.”

      (6) Finally, the author suggests that: "Importantly, higher-level computations are not limited to the EVC in visually deprived brains. Natural sound representations 41 and language activations 53 are also located in EVC of sighted participants. This suggests that EVC, in general, has the capacity to process higher-level information 54. Thus, EVC in the visually deprived brain might not be undergoing fundamental changes in brain organization 53. This promotes a view of brain plasticity in which the cortex is capable of dynamic adjustments within pre-existing computational capacity limits 4,53-55." - The presence of a sighted control group would have strengthened this claim. 

      We agree with the reviewer and now discuss the limitations of our approach in the discussion section (see response to weaknesses raised by Reviewer 2 in the Public Review above).

      Reviewer #2 (Recommendations For The Authors): 

      (1) Can the authors comment on the reaction time of the two reading hands? Completely ambidextrous reading is not necessarily common, so any differences in ability or response time across the hands may affect the EEG results. Alternatively, do the authors have any additional behavioral data about the participants' ability to read well with both hands? 

      We thank the reviewer for these questions! We did not assess reaction times and acknowledge this as a limitation. We did, however, measure accuracies and would have expected to see a speed-accuracy-trade off if reaction times would differ between hands, i.e., we would have expected lower accuracy for the hand with higher RTs. But this was not the case: our participants had comparable accuracy values when reading letters with both hands (see methods section 5.3.3 and answer to Public Review above). This measure indicated that participants recognized Braille letters presented for 500ms equally well with both index fingers.

      (2) Please add information about any residual sight in the blind participants (or are they all without light perception?)

      We have now added information about residual light perception in Supplementary Table 1 (see above in response to Public Review).

      (3) Is active tactile exploration involved, or are the participants not moving their fingers at all over the piezo-actuators? Can the authors elaborate more on how the participants used this passive input?

      We thank the reviewer for the opportunity to clarify. Our experimental setup does not involve tactile exploration or sliding motions. Instead, participants rest their index fingers on the piezo-actuators and feel the static sensation of dots pushing up against their fingertips. We assume that participants used the passive input of specific dot stimulation location on fingers to perceive a dot array which, in turn, led to the percept of a braille letter.

      We now specify this information in the methods section.

      p. 13, ll. 474-475, Methods 5.2:

      “The modules were taped to the clothes of a participant for the fMRI experiment and on the table for the EEG and behavioral experiment. This way, participants could read in a comfortable position with their index fingers resting on the braille cells to avoid motion confounds. Importantly, our experimental setup did not involve tactile exploration or sliding motions. We instructed participants to read letters regardless of whether the pins passively stimulated their immobile right or left index finger.”

      (4) I appreciated the RSA analysis, but remain curious about what the ratings were based on.

      Do the authors know what parameters participants used to rate for? Were these consistent across participants? That would aid in interpreting the results.

      We thank the reviewer for the interest in our representational similarity analyses linking the neural representations to behavior. 

      We do not know which parameters participants explicitly used to rate the similarity between letters. We instructed participants to freely compare the similarity of pairs of braille letters without specifying which parameters they should use for the similarity assessment. We speculate that participants used a mixture of low-level features such as stimulation location on fingers and higher-level features such as linguistic similarity between letters. We now clarify the free comparison of braille letter pairs in the methods section:

      p. 14, ll. 538-539, Methods 5.3.4:

      “Each pair of letters was presented once, and participants compared them with the same finger. We instructed participants to freely compare the similarity of pairs of Braille letters without specifying which parameters they should use for the similarity assessment. The rating was without time constraints, meaning participants decided when they rated the stimuli. Participants were asked to verbally rate the similarity of each pair of braille letters on a scale from 1 = very similar to 7 = very different and the experimenter noted down their responses.”

      (5) Can the authors provide confusion matrices for the decoding analyses in the supplementary materials? This could be informative in understanding what pairs of letters are most discernable and where. 

      We have added confusion matrices for within- and between-hand decoding for all ROIs and for the time points 100ms, 200ms, 300ms and 400ms to the Supplementary Material (see Supplementary Figures 7-10).

      (6) Was slice time correction done for the fMRI data? This is not reported. 

      We now added this information to the methods section - our fMRI preprocessing pipeline did not include slice timing correction.  

      p. 14, ll. 554, Methods 5.4.2:

      “We did not apply high or low-pass temporal filters and did not perform slice time correction.”

    1. eLife Assessment

      This study presents a useful finding on the ferroptosis-mediated tumor microenvironment (TME) in triple-negative breast cancer (TNBC) using public single-cell RNA sequencing (scRNA-seq) and bulk RNA sequencing data. The evidence supporting the claims of the authors is somewhat incomplete and some data are rather questionable; the authors should clarify the relations between ferroptosis-related genes in immune cells and those genes applied in a risk factor analysis in tumor cells. Moreover, the authors should provide experimental validation for the risk score model based on ferroptosis-related genes. The work will be of interest to scientists or clinical scientists working in the field of breast cancer.

    2. Reviewer #1 (Public review):

      Summary:

      Triple-negative breast cancer (TNBC) accounts for approximately 15-20% of all breast cancers. Compared to other types of breast cancer, TNBC exhibits highly aggressive clinical characteristics, a greater likelihood of metastasis, poorer clinical outcomes, and lower survival rates. Immunotherapy is an important treatment option for TNBC, but there is significant heterogeneity in treatment response. Therefore, it is crucial to accurately identify immunosuppressive patients before treatment and actively seek more effective therapeutic approaches for TNBC patients.

      Strengths:

      In this work, the authors collected and integrated data from single cells and large volumes of RNA sequencing and RNA-SEQ to analyze the TME landscape mediated by genes associated with iron death. On this basis, the prediction model of prognosis and treatment response of 131 patients was constructed using a machine learning algorithm, which is beneficial to provide individualized and precise treatment guidance for breast cancer patients.

      Weaknesses:

      However, there are still some issues that need to be clarified:

      (1) The description of the research background is too brief and concise, and it is necessary to add some information about the limitations of existing methods and the differences and advantages of this study compared with other published relevant studies, so as to better highlight the necessity and research value of this study.

      (2) This study is a retrospective analysis of a public data set and lacks experimental validation and prospective experiments to support the results of bioinformatics analysis. This should be added to the acknowledgment of limitations in the study.

    3. Reviewer #2 (Public review):

      Summary:

      This study aims to explore the ferroptosis-related immune landscape of TNBC through the integration of single-cell and bulk RNA sequencing data, followed by the development of a risk prediction model for prognosis and drug response. The authors identified key subpopulations of immune cells within the TME, particularly focusing on T cells and macrophages. Using machine learning algorithms, the authors constructed a ferroptosis-related gene risk score that accurately predicts survival and the potential response to specific drugs in TNBC patients.

      Strengths:

      The study identifies distinct subpopulations of T cells and macrophages with differential expression of ferroptosis-related genes. The clustering of these subpopulations and their correlation with patient prognosis is highly insightful, especially the identification of the TREM2+ and FOLR2+ macrophage subtypes, which are linked to either favorable or poor prognoses. The risk model thus holds potential not only for prognosis but also for guiding treatment selection in personalized oncology.

      Weaknesses:

      The study has a relatively small sample size, with only 9 samples analyzed by scRNA-seq. Given the typically high heterogeneity of the tumor microenvironment (TME) in cancer patients, this may affect the accuracy of the conclusions. The scRNA-seq analysis focuses on the expression of ferroptosis-related genes in various cells within the TME. In contrast, bulk RNA sequencing uses data from tumor samples, and the results between the two analyses are not consistent. The bulk RNA sequencing results may not accurately capture the changes happening in the microenvironment.

    1. eLife Assessment

      This fundamental study substantially advances our understanding of how habitat fragmentation and climate change jointly influence bird community thermophilization in a fragmented island system. The authors provide convincing evidence using appropriate and validated methodologies to examine how island area and isolation affect the colonization of warm-adapted species and the extinction of cold-adapted species. This study is of high interest to ecologists and conservation biologists, as it provides insight into how ecosystems and communities respond to climate change.

    2. Reviewer #3 (Public review):

      Summary:

      Juan Liu et al. investigated the interplay between habitat fragmentation and climate-driven thermophilization in birds in an island system in China. They used extensive bird monitoring data (9 surveys per year per island) across 36 islands of varying size and isolation from the mainland covering 10 years. The authors use extensive modeling frameworks to test a general increase of the occurrence and abundance of warm-dwelling species and vice versa for cold-dwelling species using the widely used Community Temperature Index (CTI), as well the relationship between island fragmentation in terms of island area and isolation from the mainland on extinction and colonization rates of cold- and warm-adapted species. They found that indeed there was thermophilization happening during the last 10 years, which was more pronounced for the CTI based on abundances and less clearly for the occurrence based metric. Generally, the authors show that this is driven by an increased colonization rate of warm-dwelling and an increased extinction rate of cold-dwelling species. Interestingly, they unravel some of the mechanisms behind this dynamic by showing that warm-adapted species increased while cold-dwelling decreased more strongly on smaller islands, which is - according to the authors - due to lowered thermal buffering on smaller islands (which was supported by air temperature monitoring done during the study period on small and large islands). They argue, that the increased extinction rate of cold-adapted species could also be due to lowered habitat heterogeneity on smaller islands. With regards to island isolation, they show that also both thermophilization processes (increase of warm and decrease of cold-adapted species) was stronger on islands closer to the mainland, due to closer sources to species populations of either group on the mainland as compared to limited dispersal (i.e. range shift potential) in more isolated islands.

      The conclusions drawn in this study are sound, and mostly well supported by the results. Only few aspects leave open questions and could quite likely be further supported by the authors themselves thanks to their apparent extensive understanding of the study system.

      Strengths:

      The study questions and hypotheses are very well aligned with the methods used, ranging from field surveys to extensive modeling frameworks, as well as with the conclusions drawn from the results. The study addresses a complex question on the interplay between habitat fragmentation and climate-driven thermophilization which can naturally be affected by a multitude of additional factors than the ones included here. Nevertheless, the authors use a well balanced method of simplifying this to the most important factors in question (CTI change, extinction, colonization, together with habitat fragmentation metrics of isolation and island area). The interpretation of the results presents interesting mechanisms without being too bold on their findings and by providing important links to the existing literature as well as to additional data and analyses presented in the appendix.

      Weaknesses:

      The metric of island isolation based on distance to the mainland seems a bit too oversimplified as in real-life the study system rather represents an island network where the islands of different sizes are in varying distances to each other, such that smaller islands can potentially draw from the species pools from near-by larger islands too - rather than just from the mainland. Although the authors do explain the reason for this metric, backed up by earlier research, a network approach could be worthwhile exploring in future research done in this system. The fact, that the authors did find a signal of island isolation does support their method, but the variation in responses to this metric could hint on a more complex pattern going on in real-life than was assumed for this study.

      Comments on revisions:

      I'm happy with the revisions made by the authors.

    3. Author response:

      The following is the authors’ response to the previous reviews.

      Public Reviews:

      Reviewer #3 (Public review):

      Summary:

      Juan Liu et al. investigated the interplay between habitat fragmentation and climate-driven thermophilization in birds in an island system in China. They used extensive bird monitoring data (9 surveys per year per island) across 36 islands of varying size and isolation from the mainland covering 10 years. The authors use extensive modeling frameworks to test a general increase of the occurrence and abundance of warm-dwelling species and vice versa for cold-dwelling species using the widely used Community Temperature Index (CTI), as well the relationship between island fragmentation in terms of island area and isolation from the mainland on extinction and colonization rates of cold- and warm-adapted species. They found that indeed there was thermophilization happening during the last 10 years, which was more pronounced for the CTI based on abundances and less clearly for the occurrence based metric. Generally, the authors show that this is driven by an increased colonization rate of warm-dwelling and an increased extinction rate of cold-dwelling species. Interestingly, they unravel some of the mechanisms behind this dynamic by showing that warm-adapted species increased while cold-dwelling decreased more strongly on smaller islands, which is - according to the authors - due to lowered thermal buffering on smaller islands (which was supported by air temperature monitoring done during the study period on small and large islands). They argue, that the increased extinction rate of cold-adapted species could also be due to lowered habitat heterogeneity on smaller islands. With regards to island isolation, they show that also both thermophilization processes (increase of warm and decrease of cold-adapted species) was stronger on islands closer to the mainland, due to closer sources to species populations of either group on the mainland as compared to limited dispersal (i.e. range shift potential) in more isolated islands.

      The conclusions drawn in this study are sound, and mostly well supported by the results. Only few aspects leave open questions and could quite likely be further supported by the authors themselves thanks to their apparent extensive understanding of the study system.

      Strengths:

      The study questions and hypotheses are very well aligned with the methods used, ranging from field surveys to extensive modeling frameworks, as well as with the conclusions drawn from the results. The study addresses a complex question on the interplay between habitat fragmentation and climate-driven thermophilization which can naturally be affected by a multitude of additional factors than the ones included here. Nevertheless, the authors use a well balanced method of simplifying this to the most important factors in question (CTI change, extinction, colonization, together with habitat fragmentation metrics of isolation and island area). The interpretation of the results presents interesting mechanisms without being too bold on their findings and by providing important links to the existing literature as well as to additional data and analyses presented in the appendix.

      Weaknesses:

      The metric of island isolation based on distance to the mainland seems a bit too oversimplified as in real-life the study system rather represents an island network where the islands of different sizes are in varying distances to each other, such that smaller islands can potentially draw from the species pools from near-by larger islands too - rather than just from the mainland. Although the authors do explain the reason for this metric, backed up by earlier research, a network approach could be worthwhile exploring in future research done in this system. The fact, that the authors did find a signal of island isolation does support their method, but the variation in responses to this metric could hint on a more complex pattern going on in real-life than was assumed for this study.

      Thank you again for this suggestion. Based on the previous revision, we discussed more about the importance of taking the island network into future research. The paragraph is now on Lines 294-304:

      “As a caveat, we only consider the distance to the nearest mainland as a measure of fragmentation, consistent with previous work in this system (Si et al., 2014), but we acknowledge that other distance-based metrics of isolation that incorporate inter-island connections and island size could hint on a more complex pattern going on in real-life than was assumed for this study, thus reveal additional insights on fragmentation effects. For instance, smaller islands may also potentially utilize species pools from nearby larger islands, rather than being limited solely to those from the mainland. The spatial arrangement of islands, like the arrangement of habitat, can influence niche tracking of species (Fourcade et al., 2021). Future studies should use a network approach to take these metrics into account to thoroughly understand the influence of isolation and spatial arrangement of patches in mediating the effect of climate warming on species.”

      Recommendations for the authors:

      Reviewer #3 (Recommendations for the authors):

      Great job on the revision! The new version reads well and in my opinion all comments were addressed appropriately. A few additional comments are as follows:

      Thank you very much for your further review and recognition. We have carefully modified the manuscript according to all recommendations.

      (1) L 62: replace shifts with process

      Done. We also added the word “transforming” to match this revision. The new sentence is now on Lines 61-63:

      “Habitat fragmentation, usually defined as the process of transforming continuous habitat into spatially isolated and small patches”

      (2) L 363: Your metric for habitat fragmentation is isolation and habitat area and I think this could be introduced already in the introduction, where you somewhat define fragmentation (although it could be clearer still). You could also discuss this in the discussion more, that other measures of fragmentation may be interesting to look at.

      Thank you for this suggestion. We now introduced metric of habitat fragmentation in the Introduction part after habitat fragmentation was defined. The sentence is now on Lines 64-66:

      “Among the various ways in which habitat fragmentation is conceptualized and measured, patch area and isolation are two of the most used measures (Fahrig, 2003).”

      (3) L 384: replace for with because of

      Done.

      (4) L 388: "Following this filtering, 60 ...."

      Done.

      (5) Figure 1: In panels b-d you use different terms (fragmented, small, isolated) but aiming to describe the same thing. I would highly recommend to either use fragmented islands or isolated islands for all panels. Although I see that in your study fragmentation includes both, habitat loss and isolation. So make this clear in the figure caption too...

      Thank you very much for this suggestion. It’s important to maintain consistency in using “fragmentation”. We change “fragmented, small, isolated” into “Fragmented patches” in the caption of b-d. The modified caption is now on Line 771:

      (6) L 783: replace background with habitat (or landscape) and exhibit with exemplify

      Done. The new sentence is now on Lines 782-784:

      “The three distinct patches signify a fragmented landscape and the community in the middle of the three patches was selected to exemplify colonization-extinction dynamics in fragmented habitats.”

      (7) One bigger thing is the definition of fragmentation in your study for which you used habitat area (from habitat loss process) and isolation. This could still be clarified a bit more, especially in the figures. In Fig. 1 the smaller panels b-d could all be titled fragmented islands as this is what the different terms describe in your study (small, isolated) and thus the figure would become even clearer. Otherwise I'm happy with the changes made.

      Thank you for raising this important question. Yes, “habitat fragmentation” in our research includes both habitat loss and fragmentation per se. We have clarified the caption of b-d in Figure 1 as suggested by Recommendation (5). We believe this can make it clearer to the readers.

    1. eLife Assessment

      Leveraging state-of-the-art experimental and analytical approaches, this important study characterizes the recruitment and activation of large populations of human motor units during slow isometric contractions in two lower limb muscles. Evidence for the main claims is solid and advances our understanding of how humans generate and control voluntary force.

    2. Reviewer #1 (Public review):

      Summary:

      The Avrillon et al. explore the neural control of muscle by decomposing the firing activity of constituent motor units from the grid of surface electromyography (EMG) in the Tibialis (TA) Anterior and Vastus Lateralis (VL) during isometric contractions. The study involves extensive samples of motor units across the broadest range of voluntary contraction intensities up to 80% of MVC. The authors examine rate coding of the population of motor units, which describes the instantaneous firing rate of each motor unit as a function of muscle force. This relationship is characterized by a natural logarithm function that delineates two distinct phases: an initial phase with a steep acceleration in firing rate, particularly pronounced in low-threshold motor units, and a subsequent modest linear increase in firing rate, more significant in high-threshold motor units.

      Strengths:

      The study makes a significant contribution to the field of neuromuscular physiology by providing a detailed analysis of motor unit behavior during muscle contractions in a few ways.

      (1) The significance lies in its comprehensive framework of motor unit activity during isometric contractions in the broad range of intensities, providing insights into the non-linear relationship between the firing rate and the muscle force. The extensive sample of motor units across the pool confirms the observation in animal studies in which the the spinal motoneuron exhibits a discharge consists of the distinct phases in response to synaptic currents, under the influence of persistent inward currents. As such, it is now reasonable to state the human motor units across the pool are also under control of gain modulation via some neuromodulatory effects in addition to synaptic inputs arising from ionotropic effects.<br /> (2) The firing scheme across in the entire motoneuron pool revealed in this study reconciles the discrepancy in firing organization under debate; i.e., whether it is 'onion skin' like or not (Heckman and Enoka 2012). The onion skin like model states that the low threshold motor units discharge higher than high threshold motor units and has been held for long time because the firing behaviors were examined in a partial range of contraction force range due to technical limitations. This reconciliation is crucial because it is fundamental to modelling the organization of motor unit recruitment and rate coding to achieve a desired force generation to advance our understanding of motor control.<br /> (3) The extensive data collection with a novel blind source separation algorithm on the expanded number of channel of surface EMG signal provides a robust dataset that enhances the reliability and validity of findings, setting a new standard for empirical studies in the field. \par<br /> Collectively, this study fills several knowledge gaps in the field and advances our understanding the mechanism underlying the isometric force generation.

    3. Reviewer #2 (Public review):

      Avrillon et al. provides a comprehensive assessment of firing rate parameters from a large percentage of the motor unit pool, in two muscles, during voluntary isometric contractions. The authors have used new quantitative methods to extract more unique motor units across contractions than prior studies. This was achieved by recording muscle fibre action potentials from four high density surface electromyogram (HDsEMG) arrays, quantifying residual EMG comparing the recorded and data-based simulation (Fig. 1A-B), and developing a metric to compare the spatial identification for each motor unit (Fig. 1D-E). From identified motor units, the authors have provided a detailed characterization of recruitment and firing rate responses during slow voluntary isometric contractions in the vastus lateralis and tibialis anterior muscles up to 75-80% of maximum intensity. In the lower limb it is interesting how lower threshold motor units have firing rate responses that saturate, whereas higher threshold units that presumably produce higher muscle contractile forces continue to increase their firing rate. Conceptually, the authors rightly focus on the literature of intrinsic motoneurone properties, but in vivo, other possibilities (that are difficult to measure in awake human participants) are that the form of descending supraspinal drive, spinal network dynamics and afferent inputs may have different effects across motor unit sizes, muscles and types of contractions. These results from single trail contractions and with a larger sample of motor units, supports the summary rate coding profiles of motor units in the extensor digitorum communis muscle (Monster and Chan, 1977).