10,000 Matching Annotations
  1. Jun 2025
    1. eLife Assessment

      This important study presents a pipeline for discovering cooperative transcription factor (TF) interactions that regulate development, and applies this pipeline in a systematic investigation of TF co-regulation in 11 human embryonic tissues. The authors provide overall solid bioinformatics and experimental support for their findings: although they make a convincing argument for the role of TEAD factors as co-repressors of regulatory activity with tissue-specific TFs, other aspects of the study would benefit from additional validation. This work would be of interest to cell biologists focused on development or on discovery of TF relationships.

    2. Reviewer #1 (Public review):

      Summary:

      In this manuscript, the authors present a pipeline for the identification of transcription factor (TF) co-occurrence in regulatory regions. This pipeline aims to generate a catalogue of combinations of TFs working together, and the authors apply this during human embryonic development. In particular, they identified co-occurrences of TFs starting from H3K27ac ChIP-seq and RNA-seq input data to select active enhancers and transcribed TFs. The pipeline is applied to explore TF motifs co-occurrence at tissue-specific developmental enhancers across 11 human embryonic tissues. The application of the pipeline suggests the presence of regulatory patterns in different human developmental tissue-specific enhancers in association with ubiquitous TFs. The authors further explore the role of TEAD1 (an ubiquitously expressed TF) as a repressor. They test the role of TEAD1 as a co-repressor using a luciferase assay and tissue-specific enhancers, either alone or combined with a YAP coactivator. Overall, this paper presents an important aspect in mammalian gene regulation, the cooperative binding of TFs, and provides an important resource for TF pairs.

      Strengths:

      I appreciated the number of datasets analysed and the validation of a subset of enhancers.

      Weaknesses:

      Not many, but probably validation at more enhancers could have made the paper stronger.

    3. Reviewer #2 (Public review):

      Summary:

      Garcia-Mora et al. presented a two-step bioinformatics pipeline using H3K27ac ChIP-seq and RNA-seq data from 11 human embryonic tissues published by the same groups of senior authors. "First Search" identifies motifs for TFs that are both tissue-restricted in expression and enriched in tissue-specific enhancers. "Second Search" then looks for additional motifs that co-occur near each "First Search" motif. The authors here went further than previous motif co-occurrence/co-enrichment analyses by identifying TEAD motifs as (1) representing a ubiquitously expressed family and (2) showing high co-occurrence with tissue-specific motifs at tissue-specific enhancers. They then elaborate on this finding and speculate that "TEAD, in concert with cardiac-restricted transcriptional regulators, may contribute to the recruitment of CHD4 and may play a role in attenuating the activity of enhancers involved in cardiomyocyte differentiation." They also discussed validation experiments using the luciferase assay.

      Strengths:

      The manuscript is well-written and easy to follow for the most part.

      Weaknesses:

      My main concerns and criticisms are about the sensitivity of the method and the validation of experiment designs and conclusions. Some examples where validation could be improved are as follows:

      (1) The authors propose a mechanism of a TF trio (TEAD - CHD4 - tissue-specific TFs). However, only one validation experiment checked CHD4. CHD4 binding was not mentioned at all in the other cases.

      (2) The authors integrated E12.5 TEAD binding with E11.5 acetylation data, and it would be important to show that this experimental approach is valid or otherwise qualify its limitations.

      (3) Motif co-occurrence analysis was extended to claiming TF interactions without further validation.

    4. Reviewer #3 (Public review):

      Summary:

      Mora et al employ published ChIP-seq and RNA-seq from embryonic tissues to nominate transcription factors that work combinatorially during development. This manuscript addresses an important gap in knowledge regarding the complexities of gene regulation. However, as written, the manuscript is focused on confirming mostly known associations and does not unveil principles that can be broadly applied, given multiple technical caveats that are outlined below.

      Strengths:

      (1) Instead of focusing on a single transcription factor motif enriched within peaks, the authors search the flanking regions of enriched motifs to nominate additional transcription factors that may work cooperatively to provide organ specificity. This type of analysis is a crucial next step in the gene regulation field, as transcription factors rarely work independently.

      (2) Figure 6 is a good demonstration of the preliminary experiments that can be done to test the activity of co-occurring motifs.

      (3) This is a really nice resource of organ-specific motif associations that can be used to generate many testable hypotheses.

      (4) The rationale and writing are very clear and easy to read.

      Weaknesses:

      (1) Much of this manuscript focuses on confirming transcription factor relationships that have been reported previously. For example, it is well known that GATA4 interacts with MEF2 in the ventricle. There are limited new or unexpected associations discussed and tested.

      (2) Embryonic tissues are highly heterogeneous, limiting the utility of the bulk ChIP-seq employed in these analyses. Does the cellular heterogeneity explain the discrepancy between TEAD binding and histone acetylation? Similarly, how does conservation between species affect the TF predictions?

      (3) Some of the interpretations should also be fleshed out a bit more to clarify the advantage of the analyses presented here. For example, if Gata4 and Foxa2 transcripts are expressed during different stages of development, then it's likely that (as stated by the authors) these motifs are not used during the same stage of development. But examining the flanking regions wasn't necessary to make that statement. This type of conclusion seems tangential to the benefit of this analysis, which is to understand which TFs work together in a single organ at a single time point.

      (4) This manuscript hinges on luciferase assays whose results can be difficult to translate to complex gene regulation networks. Many motifs are often clustered together, which makes designing experiments at endogenous loci important in studies such as this one.

    5. Author response:

      Reviewer #1:

      Point 1

      Not many weaknesses, but probably validation at more enhancers could have made the paper stronger.

      We experimentally validated two sets of enhancers from two distinct tissues and observed similar effects. While this supports the idea that the TEAD-tissue-specific TF interaction we observe is not restricted to a single tissue, we agree that testing additional enhancers from a third tissue would strengthen our conclusions. We will acknowledge in the discussion that including a third tissue could provide additional support for the generality of our findings.

      Reviewer #2:

      Point 1

      The authors propose a mechanism of a TF trio (TEAD - CHD4 - tissue-specific TFs). However, only one validation experiment checked CHD4. CHD4 binding was not mentioned at all in the other cases.

      Indeed, CHD4 binding was experimentally validated at only one enhancer. This was a deliberate decision based on two key considerations:

      (1) Consistent functional response across enhancers: We tested multiple enhancers (n =8) for functional response to the TEAD+YAP and GATA4/6 combination. All enhancers tested exhibited the same trend—attenuation of GATA-mediated activation upon co-expression of TEAD or TEAD/YAP. This consistent pattern supports a shared mechanism across these elements.

      (2) Substantial prior evidence supporting CHD4 recruitment by both GATA4 and YAP: Specifically, CHD4 recruitment by GATA4 has been described in the context of cardiovascular development[1], and CHD4 can also be recruited by TEAD coactivator YAP2. Furthermore, published genomic occupancy data from embryonic heart tissue show widespread co-binding of GATA4, TEAD, and CHD4[1,3], including at most of the cardiac enhancers we functionally tested (4 out of 5).

      Given the consistent enhancer responses and the supporting literature and genomic data indicating TEAD-CHD4 co-occupancy, we chose to validate CHD4 binding at a representative enhancer as a proof of concept.

      We will clarify this rationale in the revised manuscript to better address this concern.

      Reviewer #2:

      Point 2

      The authors integrated E12.5 TEAD binding with E11.5 acetylation data, and it would be important to show that this experimental approach is valid or otherwise qualify its limitations.

      We will provide additional evidence in support of this approach in the revised manuscript or alternatively acknowledge its limitations.

      Reviewer #2:

      Point 3

      Motif co-occurrence analysis was extended to claiming TF interactions without further validation.

      We thank the reviewer for pointing out this important distinction. We reviewed the manuscript and identified seven instances where TF interactions were mentioned. Four of these correctly refer to previously established protein-protein interactions. For the remaining instances, we will adjust the wording to reflect the level of evidence, e.g.  describe combinatorial binding based on motif co-occurrence, rather than implying direct interaction.

      Reviewer #3:

      Point 1

      Much of this manuscript focuses on confirming transcription factor relationships that have been reported previously. For example, it is well known that GATA4 interacts with MEF2 in the ventricle. There are limited new or unexpected associations discussed and tested.

      We thank the reviewer for this important observation and see the recurrence of known interactions, such as GATA4-MEF2, not as a drawback, but as an important validation of our methodology.

      The identification of novel TF-TF combinations was geared toward uncovering shared regulatory principles across diverse human developmental tissues. While analysing 13 heterogeneous embryonic tissues introduced limitations, such as cellular complexity that may obscure rare interactions, it also allowed the identification of robust, recurrent patterns across tissues.  Indeed, using this approach, we identified the widespread combinatorial effect of TEAD in partnership with lineage-specific TFs, which is explored more in depth in the manuscript.

      Another main goal of the study was to develop and demonstrate a generalizable strategy for identifying combinatorial TF binding patterns that underlie tissue-specific gene regulation. Given the inherent heterogeneity of the embryonic organs analysed, the approach is naturally biased toward recovering the most prevalent, and often well-characterized, TF combinations. While we fully acknowledge this limitation, we believe that the ability to robustly recover well-established TF partnerships across multiple organs provides a valuable proof of concept. The next step will be to apply this strategy to single-cell RNA datasets, in order to define TF relationships at higher resolution, for example, resolving associations down to specific family members that cooperate within distinct lineages or cell types, and identifying less frequent or underrepresented TF-TF relationships.

      In this context, we believe that our strategy has successfully highlighted shared enhancer logic and offers a framework for future high-resolution dissection of TF cooperativity at the single-cell level. The rationale for analysing heterogeneous tissues, along with its limitations, will be addressed in the revised version.

      Reviewer #3:

      Point 2

      Embryonic tissues are highly heterogeneous, limiting the utility of the bulk ChIP-seq employed in these analyses. Does the cellular heterogeneity explain the discrepancy between TEAD binding and histone acetylation? Similarly, how does conservation between species affect the TF predictions?

      We thank the reviewer for raising these important points. We acknowledge the limitations of using bulk ChIP-seq data in the context of complex embryonic tissues (see also previous point). We cannot exclude that the discrepancy between TEAD binding and histone acetylation is an effect of cellular heterogeneity. Indeed, we mention in the results “Our ventricle-specific enhancers were sampled at a single time point and likely represent enhancers that are selectively active in different cell types and developmental stages, given the heterogeneity of cell types in the ventricle”. The limitation of bulk ChIP-seq will be addressed in the discussion. In the specific case of the enhancers selected for validation, the binding site sequences are conserved between species, suggesting that the cis-regulatory activity is likely to be similar in both.

      Reviewer #3:

      Point 3

      Some of the interpretations should also be fleshed out a bit more to clarify the advantage of the analyses presented here. For example, if Gata4 and Foxa2 transcripts are expressed during different stages of development, then it's likely that (as stated by the authors) these motifs are not used during the same stage of development. But examining the flanking regions wasn't necessary to make that statement. This type of conclusion seems tangential to the benefit of this analysis, which is to understand which TFs work together in a single organ at a single time point.

      We appreciate the reviewer’s comment and the opportunity to clarify our interpretation. The reviewer refers to the finding that GATA4 and FOXA2 motifs are flanked by different sets of motifs in liver enhancers, suggesting that these TFs operate within distinct regulatory contexts.

      Our aim was not to state that GATA4 and FOXA2 do not function simultaneously—this can indeed be inferred from their non-overlapping expression patterns. Rather, we intended to highlight the potential of our approach, even when applied to bulk data, to resolve distinct regulatory modules that may act in different subpopulations of cells or developmental windows within the same tissue.

      We will revise the relevant section of the manuscript to make this interpretative point clearer.

      Reviewer #3:

      Point 4

      This manuscript hinges on luciferase assays whose results can be difficult to translate to complex gene regulation networks. Many motifs are often clustered together, which makes designing experiments at endogenous loci important in studies such as this one.

      We agree with the Reviewer that luciferase assays represent an oversimplified model of gene regulation and do not fully capture the complexity of endogenous regulatory networks. We will explicitly acknowledge this limitation in the discussion.

      Mutagenesis of TEAD and tissue-specific TF motifs at endogenous loci would provide more conclusive evidence. However, our goal was to test the generality of TEAD effect across multiple enhancers and tissues. Despite its limitations, a luciferase-based assay was the most feasible approach, as an endogenous strategy would not have allowed us to assess a broader set of enhancers efficiently. Additionally, the presence of recurrent motifs and the potential functional redundancy among enhancers targeting the same gene can complicate the interpretation of single-locus perturbations.

      References

      (1) Robbe ZL, Shi W, Wasson LK, Scialdone AP, Wilczewski CM, Sheng X, et al. CHD4 is recruited by GATA4 and NKX2-5 to repress noncardiac gene programs in the developing heart. Genes Dev. 2022 Apr 1;36(7–8):468–82.

      (2) Kim M, Kim T, Johnson RL, Lim DS. Transcriptional Co-repressor Function of the Hippo Pathway Transducers YAP and TAZ. Cell Rep. 2015 Apr;11(2):270–82.

      (3) Akerberg BN, Gu F, VanDusen NJ, Zhang X, Dong R, Li K, et al. A reference map of murine cardiac transcription factor chromatin occupancy identifies dynamic and conserved enhancers. Nat Commun. 2019 Oct 28;10(1):4907.

    1. eLife Assessment

      There is a growing interest in understanding the individuality of animal behaviours. In this article, the authors build and use an impressive array of high throughput phenotyping paradigms to examine the 'stability' (consistency) of behavioural characteristics in a range of contexts and over time. They find that certain behaviours are individualistic and persist robustly across external stimuli while others are less robust to these changing parameters. The data, while extensive are incompletely analysed/explained. With more appropriate statistical methods adopted, the findings would have important implications for the study of individual variability.

    2. Reviewer #1 (Public review):

      Summary:

      The authors state the study's goal clearly: "The goal of our study was to understand to what extent animal individuality is influenced by situational changes in the environment, i.e., how much of an animal's individuality remains after one or more environmental features change." They use visually guided behavioral features to examine the extent of correlation over time and in a variety of contexts. They develop new behavioral instrumentation and software to measure behavior in Buridan's paradigm (and variations thereof), the Y-maze, and a flight simulator. Using these assays, they examine the correlations between conditions for a panel of locomotion parameters. They propose that inter-assay correlations will determine the persistence of locomotion individuality.

      Strengths:

      The OED defines individuality as "the sum of the attributes which distinguish a person or thing from others of the same kind," a definition mirrored by other dictionaries and the scientific literature on the topic. The concept of behavioral individuality can be characterized as: (1) a large set of behavioral attributes, (2) with inter-individual variability, that are (3) stable over time. A previous study examined walking parameters in Buridan's paradigm, finding that several parameters were variable between individuals, and that these showed stability over separate days and up to 4 weeks (DOI: 10.1126/science.aaw718). The present study replicates some of those findings and extends the experiments from temporal stability to examining correlation of locomotion features between different contexts.

      The major strength of the study is using a range of different behavioral assays to examine the correlations of several different behavior parameters. It shows clearly that the inter-individual variability of some parameters is at least partially preserved between some contexts, and not preserved between others. The development of high-throughput behavior assays and sharing the information on how to make the assays is a commendable contribution.

      Weaknesses:

      The definition of individuality considers a comprehensive or large set of attributes, but the authors consider only a handful. In Supplemental Fig. S8, the authors show a large correlation matrix of many behavioral parameters, but these are illegible and are only mentioned briefly in Results. Why were five or so parameters selected from the full set? How were these selected? Do the correlation trends hold true across all parameters? For assays in which only a subset of parameters can be directly compared, were all of these included in the analysis, or only a subset?

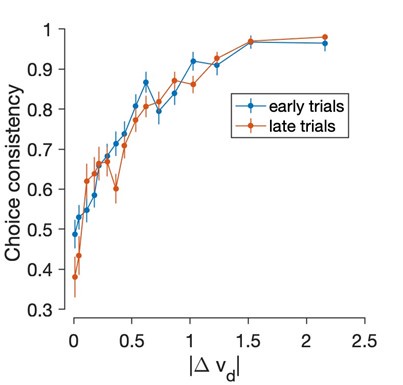
      The correlation analysis is used to establish stability between assays. For temporal re-testing, "stability" is certainly the appropriate word, but between contexts it implies that there could be 'instability'. Rather, instead of the 'instability' of a single brain process, a different behavior in a different context could arise from engaging largely (or entirely?) distinct context-dependent internal processes, and have nothing to do with process stability per se. For inter-context similarities, perhaps a better word would be "consistency".

      The parameters are considered one-by-one, not in aggregate. This focuses on the stability/consistency of the variability of a single parameter at a time, rather than holistic individuality. It would appear that an appropriate measure of individuality stability (or individuality consistency) that accounts for the high-dimensional nature of individuality would somehow summarize correlations across all parameters. Why was a multivariate approach (e.g. multiple regression/correlation) not used? Treating the data with a multivariate or averaged approach would allow the authors to directly address 'individuality stability', along with the analyses of single-parameter variability stability.

      The correlation coefficients are sometimes quite low, though highly significant, and are deemed to indicate stability. For example, in Figure 4C top left, the % of time walked at 23{degree sign}C and 32{degree sign}C are correlated by 0.263, which corresponds to an R2 of 0.069 i.e. just 7% of the 32{degree sign}C variance is predictable by the 23{degree sign}C variance. Is it fair to say that 7% determination indicates parameter stability? Another example: "Vector strength was the most correlated attention parameter... correlations ranged... to -0.197," which implies that 96% (1 - R2) of Y-maze variance is not predicted by Buridan variance. At what level does an r value not represent stability?

      The authors describe a dissociation between inter-group differences and inter-individual variation stability, i.e. sometimes large mean differences between contexts, but significant correlation between individual test and retest data. Given that correlation is sensitive to slope, this might be expected to underestimate the variability stability (or consistency). Is there a way to adjust for the group differences before examining correlation? For example, would it be possible to transform the values to in-group ranks prior to correlation analysis?

      What is gained by classifying the five parameters into exploration, attention, and anxiety? To what extent have these classifications been validated, both in general, and with regard to these specific parameters? Is increased walking speed at higher temperature necessarily due to increased 'explorative' nature, or could it be attributed to increased metabolism, dehydration stress, or a heat-pain response? To what extent are these categories subjective?

      The legends are quite brief and do not link to descriptions of specific experiments. For example, Figure 4a depicts a graphical overview of the procedure, but I could not find a detailed description of this experiment's protocol.

      Using the current single-correlation analysis approach, the aims would benefit from re-wording to appropriately address single-parameter variability stability/consistency (as distinct from holistic individuality). Alternatively, the analysis could be adjusted to address the multivariate nature of individuality, so that the claims and the analysis are in concordance with each other.

      The study presents a bounty of new technology to study visually guided behaviors. The Github link to the software was not available. To verify successful transfer or open-hardware and open-software, a report would demonstrate transfer by collaboration with one or more other laboratories, which the present manuscript does not appear to do. Nevertheless, making the technology available to readers is commendable.<br /> The study discusses a number of interesting, stimulating ideas about inter-individual variability and presents intriguing data that speaks to those ideas, albeit with the issues outlined above.

      While the current work does not present any mechanistic analysis of inter-individual variability, the implementation of high-throughput assays sets up the field to more systematically investigate fly visual behaviors, their variability, and their underlying mechanisms.

      Comments on revisions:

      I want to express my appreciation for the authors' responsiveness to the reviewer feedback. They appear to have addressed my previous concerns through various modifications including GLM analysis, however, some areas still require clarification for the benefit of an audience that includes geneticists.

      (1) GLM Analysis Explanation (Figure 9)<br /> While the authors state that their new GLM results support their original conclusions, the explanation of these results in the text is insufficient. Specifically:

      - The interpretation of coefficients and their statistical significance needs more detailed explanation. The audience includes geneticists and other non-statistical people, so the GLM should be explained in terms of the criteria or quantities used to assess how well the results conform with the hypothesis, and to what extent they diverge.<br /> - The criteria used to judge how well the GLM results support their hypothesis are not clearly stated.<br /> - The relationship between the GLM findings and their original correlation-based conclusions needs better integration and connection, leading the reader through your reasoning.

      (2) Documentation of Changes<br /> One struggle with the revised manuscript is that no "tracked changes" version was included, so it is hard to know exactly what was done. Without access to the previous version of the manuscript, it is difficult to fully assess the extent of revisions made. The authors should provide a more comprehensive summary of the specific changes implemented, particularly regarding:

      (3) Statistical Method Selection<br /> The authors mention using "ridge regression to mitigate collinearity among predictors" but do not adequately justify this choice over other approaches. They should explain:

      - Why ridge regression was selected as the optimal method<br /> - How the regularization parameter (λ) was determined<br /> - How this choice affects the interpretation of environmental parameters' influence on individuality

    3. Reviewer #2 (Public review):

      Summary:

      The authors repeatedly measured the behavior of individual flies across several environmental situations in custom-made behavioral phenotyping rigs.

      Strengths:

      The study uses several different behavioral phenotyping devices to quantify individual behavior in a number of different situations and over time. It seems to be a very impressive amount of data. The authors also make all their behavioral phenotyping rig design and tracking software available, which I think is great, and I'm sure other folks will be interested in using and adapting to their own needs.

      Weaknesses/Limitations:

      I think an important limitation is that while the authors measured the flies under different environmental scenarios (i.e. with different lighting, temperature) they didn't really alter the "context" of the environment. At least within behavioral ecology, context would refer to the potential functionality of the expressed behaviors so for example, an anti-predator context, or a mating context, or foraging. Here, the authors seem to really just be measuring aspects of locomotion under benign (relatively low risk perception) contexts. This is not a flaw of the study, but rather a limitation to how strongly the authors can really say that this demonstrates that individuality is generalized across many different contexts. It's quite possible that rank-order of locomotor (or other) behaviors may shift when the flies are in a mating or risky context.

      I think the authors are missing an opportunity to use much more robust statistical methods It appears as though the authors used pearson correlations across time/situations to estimate individual variation; however far more sophisticated and elegant methods exist. The problem is that pearson correlation coefficients can be anti-conservative and additionally, the authors have thus had to perform many many tests to correlate behaviors across the different trials/scenarios. I don't see any evidence that the authors are controlling for multiple testing which I think would also help. Alternatively, though, the paper would be a lot stronger, and my guess is, much more streamlined if the authors employ hierarchical mixed models to analyse these data, which are the standard analytical tools in the study of individual behavioral variation. In this way, the authors could partition the behavioral variance into its among- and within-individual components and quantify repeatability of different behaviors across trials/scenarios simultaneously. This would remove the need to estimate 3 different correlations for day 1 & day 2, day 1 & 3, day 2 & 3 (or stripe 0 & stripe 1, etc) and instead just report a single repeatability for e.g. the time spent walking among the different strip patterns (eg. figure 3). Additionally, the authors could then use multivariate models where the response variables are all the behaviors combined and the authors could estimate the among-individual covariance in these behaviors. I see that the authors state they include generalized linear mixed models in their updated MS, but I struggled a bit to understand exactly how these models were fit? What exactly was the response? what exactly were the predictors (I just don't understand what Line404 means "a GLM was trained using the environmental parameters as predictors (0 when the parameter was not changed, 1 if it was) and the resulting individual rank differences as the response"). So were different models run for each scenario? for different behaviors? Across scenarios? What exactly? I just harp on this because I'm actually really interested in these data and think that updating these methods can really help clarify the results and make the main messages much clearer!

      I appreciate that the authors now included their sample sizes in the main body of text (as opposed to the supplement) but I think that it would still help if the authors included a brief overview of their design at the start of the methods. It is still unclear to me how many rigs each individual fly was run through? Were the same individuals measured in multiple different rigs/scenarios? Or just one?

      I really think a variance partitioning modeling framework could certainly improve their statistical inference and likely highlight some other cool patterns as these methods could better estimate stability and covariance in individual intercepts (and potentially slopes) across time and situation. I also genuinely think that this will improve the impact and reach of this paper as they'll be using methods that are standard in the study of individual behavioral variation

    4. Reviewer #3 (Public review):

      This manuscript is a continuation of past work by the last author where they looked at stochasticity in developmental processes leading to inter-individual behavioural differences. In that work, the focus was on a specific behaviour under specific conditions while probing the neural basis of the variability. In this work, the authors set out to describe in detail how stable individuality of animal behaviours is in the context of various external and internal influences. They identify a few behaviours to monitor (read outs of attention, exploration, and 'anxiety'); some external stimuli (temperature, contrast, nature of visual cues, and spatial environment); and two internal states (walking and flying).

      They then use high-throughput behavioural arenas - most of which they have built and made plans available for others to replicate - to quantify and compare combinations of these behaviours, stimuli, and internal states. This detailed analysis reveals that:

      (1) Many individualistic behaviours remain stable over the course of many days.<br /> (2) That some of these (walking speed) remain stable over changing visual cues. Others (walking speed and centrophobicity) remain stable at different temperatures.<br /> (3) All the behaviours they tested fail to remain stable over spatially varying environment (arena shape).<br /> (4) and only angular velocity (a read out of attention) remains stable across varying internal states (walking and flying)

      Thus, the authors conclude that there is a hierarchy in the influence of external stimuli and internal states on the stability of individual behaviours.

      The manuscript is a technical feat with the authors having built many new high-throughput assays. The number of animals are large and many variables have been tested - different types of behavioural paradigms, flying vs walking, varying visual stimuli, different temperature among others.

      Comments on revisions:'

      The authors have addressed my previous concerns.

    5. Author response:

      The following is the authors’ response to the original reviews

      Public Reviews: 

      Reviewer #1 (Public Review): 

      Summary: 

      The authors state the study's goal clearly: "The goal of our study was to understand to what extent animal individuality is influenced by situational changes in the environment, i.e., how much of an animal's individuality remains after one or more environmental features change." They use visually guided behavioral features to examine the extent of correlation over time and in a variety of contexts. They develop new behavioral instrumentation and software to measure behavior in Buridan's paradigm (and variations thereof), the Y-maze, and a flight simulator. Using these assays, they examine the correlations between conditions for a panel of locomotion parameters. They propose that inter-assay correlations will determine the persistence of locomotion individuality.

      Strengths: 

      The OED defines individuality as "the sum of the attributes which distinguish a person or thing from others of the same kind," a definition mirrored by other dictionaries and the scientific literature on the topic. The concept of behavioral individuality can be characterized as: 

      (1) a large set of behavioral attributes, 

      (2) with inter-individual variability, that are 

      (3) stable over time. 

      A previous study examined walking parameters in Buridan's paradigm, finding that several parameters were variable between individuals, and that these showed stability over separate days and up to 4 weeks (DOI: 10.1126/science.aaw718). The present study replicates some of those findings and extends the experiments from temporal stability to examining the correlation of locomotion features between different contexts.

      The major strength of the study is using a range of different behavioral assays to examine the correlations of several different behavior parameters. It shows clearly that the inter-individual variability of some parameters is at least partially preserved between some contexts, and not preserved between others. The development of highthroughput behavior assays and sharing the information on how to make the assays is a commendable contribution.

      We thank the reviewer for his exceptionally kind assessment of our work!

      Weaknesses: 

      The definition of individuality considers a comprehensive or large set of attributes, but the authors consider only a handful. In Supplemental Fig. S8, the authors show a large correlation matrix of many behavioral parameters, but these are illegible and are only mentioned briefly in Results. 

      We have now uploaded a high-resolution PDF to the Github Address: https://github.com/LinneweberLab/Mathejczyk_2024_eLife_Individuality/blob/main/S8.pdf, and this is also mentioned in the figure legend for Fig. S8

      Why were five or so parameters selected from the full set? How were these selected? 

      The five parameters (% of time walked, walking speed, vector strength, angular velocity, and centrophobicity) were selected because they describe key aspects of the investigated behaviors that can be compared directly across assays. Importantly, several parameters we typically use (e.g., Linneweber et al., 2020) cannot be applied under certain conditions, such as darkness or the absence of visual cues. Furthermore, these five parameters encompass three critical aspects of navigation across standard visual behavioral arenas: (1) The “exploration” category is characterized by parameters describing the fly’s activity. (2) Parameters related to “attention” reflect heightened responses to visual cues, but unlike commonly used metrics such as angle or stripe deviations (e.g., Coulomb, 2012; Linneweber et al., 2020), they can also be measured in absence of visual cues and are therefore suitable for cross-assay comparisons. (3) The parameter “centrophobicity,” used as a potential indicator of anxiety, is conceptually linked to the open-field test in mice, where the ratio of wall-to-open-field activity is frequently calculated as a measurement of anxiety (see for example Carter, Sheh, 2015, chapter 2. https://www.sciencedirect.com/book/9780128005118/guide-to-researchtechniques-in-neuroscience). Admittedly, this view is frequently challenged in mice, but it has a long history which is why we use it.

      Do the correlation trends hold true across all parameters? For assays in which only a subset of parameters can be directly compared, were all of these included in the analysis, or only a subset? 

      As noted above, we only included a subset of parameters in our final analysis, as many were unsuitable for comparison across assays while still providing valuable assayspecific information which are important to relate these results to previous publications.

      The correlation analysis is used to establish stability between assays. For temporal retesting, "stability" is certainly the appropriate word, but between contexts, it implies that there could be 'instability'. Rather, instead of the 'instability' of a single brain process, a different behavior in a different context could arise from engaging largely (or entirely?) distinct context-dependent internal processes, and have nothing to do with process stability per se. For inter-context similarities, perhaps a better word would be "consistency". 

      Thank you for this suggestion. During the preparation of the manuscript, we indeed frequently alternated between the terms “stability” and “consistency.” And decided to go with “stability” as the only descriptor, to keep it simple. We now fully agree with the reviewer’s argument and have replaced “stability” by “consistency” throughout the current version of the manuscript in order to increase clarity and coherence.

      The parameters are considered one by one, not in aggregate. This focuses on the stability/consistency of the variability of a single parameter at a time, rather than holistic individuality. It would appear that an appropriate measure of individuality stability (or individuality consistency) that accounts for the high-dimensional nature of individuality would somehow summarize correlations across all parameters. Why was a multivariate approach (e.g. multiple regression/correlation) not used? Treating the data with a multivariate or averaged approach would allow the authors to directly address 'individuality stability' and analyses of single-parameter variability stability.

      We agree with the reviewer that a multivariate analysis adds clear advantages in terms of statistical power, in addition to our chosen approach. On one hand, we believe that the simplicity of our initial analysis, both for correlational and mean data, makes easy for readers to understand and reproduce our data. While preparing the previous version of the manuscript we were skeptical since more complex analyses often involve numerous choices, which can complicate reproducibility. For instance, a recent study in personality psychology (Paul et al., 2024) highlighted the risks of “forking paths” in statistical analysis, showing that certain choices of statistical methods could even reverse findings—a concern mitigated by our simplistic straightforward approach. Still, in preparation of this revised version of the manuscript, we accepted the reviewer’s advice and reanalyzed the data using a generalized linear model. This analysis nicely recapitulates our initial findings and is now summarized in a single figure (Fig. 9).

      The correlation coefficients are sometimes quite low, though highly significant, and are deemed to indicate stability. For example, in Figure 4C top left, the % of time walked at 23{degree sign}C and 32{degree sign}C are correlated by 0.263, which corresponds to an R2 of 0.069 i.e. just 7% of the 32{degree sign}C variance is predictable by the 23{degree sign}C variance. Is it fair to say that a 7% determination indicates parameter stability? Another example: "Vector strength was the most correlated attention parameter... correlations ranged... to -0.197," which implies that 96% (1 - R2) of Y-maze variance is not predicted by Buridan variance. At what level does an r value not represent stability?

      We agree that this is an important question. Our paper clearly demonstrates that individuality always plays a role in decision-making (and, in this context, any behavioral output can be considered a decision). However, the non-linear relationship between certain situations and the individual’s behavior often reduces the predictive value (or correlation) across contexts, sometimes quite drastically.

      For instance, temperature has a relatively linear effect on certain behavioral parameters, leading to predictable changes across individuals. As a result, correlations across temperature conditions are often similar to those observed across time within the same situation. In contrast, this predictability diminishes when comparing conditions like the presence or absence of visual stimuli, the use of different arenas, or different modalities.

      For this reason, we believe that significance remains the best indicator for describing how measurable individuality persists, even across vastly different situations.

      The authors describe a dissociation between inter-group differences and interindividual variation stability, i.e. sometimes large mean differences between contexts, but significant correlation between individual test and retest data. Given that correlation is sensitive to slope, this might be expected to underestimate the variability stability (or consistency). Is there a way to adjust for the group differences before examining the correlation? For example, would it be possible to transform the values to in-group ranks prior to correlation analysis?  

      We thank the reviewer for this suggestion, and we have now addressed this point. To account for slope effects, we have now introduced in-group ranks for our linear model computation (see Fig. 9). 

      What is gained by classifying the five parameters into exploration, attention, and anxiety? To what extent have these classifications been validated, both in general and with regard to these specific parameters? Is the increased walking speed at higher temperatures necessarily due to an increased 'explorative' nature, or could it be attributed to increased metabolism, dehydration stress, or a heat-pain response? To what extent are these categories subjective?

      We agree that grouping our parameters into traits like exploration, attention, and anxiety always includes subjective decisions. The classification into these three categories is even considered partially controversial in the mouse specific literature, which uses the term “anxiety” in similar experiments (see for exampler Carter, Sheh, 2015, chapter 2 . https://www.sciencedirect.com/book/9780128005118/guide-to-research-techniquesin-neuroscience). Nevertheless, we believe that readers greatly benefit from these categories, since they make it easier to understand (beyond mathematical correlations) which aspects of the flies’ individuality can be considered consistent across situations. Furthermore, these categories serve as a bridge to compare insight from very distinct models.

      The legends are quite brief and do not link to descriptions of specific experiments. For example, Figure 4a depicts a graphical overview of the procedure, but I could not find a detailed description of this experiment's protocol.

      We assume the reviewer is referring to Figure 3a. The detailed experimental protocol can be found in the Materials and Methods section under Setup 2: IndyTrax Multi-Arena Platform. We have now clarified this in the mentioned figure legend.

      Using the current single-correlation analysis approach, the aims would benefit from rewording to appropriately address single-parameter variability stability/consistency (as distinct from holistic individuality). Alternatively, the analysis could be adjusted to address the multivariate nature of individuality, so that the claims and the analysis are in concordance with each other.

      The reviewer raises an important point about hierarchies within the concept of animal individuality or personality. We agree that this is best addressed by first focusing on single behavioral traits/parameters and then integrating several trait properties into a cohesive concept of animal personality (holistic individuality). To ensure consistency throughout the text, we have now thoroughly reviewed the entire manuscript clearly distinguish between single-parameter variability stability/consistency and holistic individuality/personality.

      The study presents a bounty of new technology to study visually guided behaviors. The GitHub link to the software was not available. To verify the successful transfer of open hardware and open-software, a report would demonstrate transfer by collaboration with one or more other laboratories, which the present manuscript does not appear to do. Nevertheless, making the technology available to readers is commendable.

      We have now uploaded all codes and materials to GitHub and made them available as soon as we received the reviewers’ comments. All files and materials can be accessed at https://github.com/LinneweberLab/Mathejczyk_2024_eLife_Individuality, which is now frequently mentioned throughout the revised manuscript.

      The study discusses a number of interesting, stimulating ideas about inter-individual variability, and presents intriguing data that speaks to those ideas, albeit with the issues outlined above.

      While the current work does not present any mechanistic analysis of inter-individual variability, the implementation of high-throughput assays sets up the field to more systematically investigate fly visual behaviors, their variability, and their underlying mechanisms. 

      We thank the reviewer again for the extensive and constructive feedback.

      Reviewer #2 (Public Review): 

      Summary: 

      The authors repeatedly measured the behavior of individual flies across several environmental situations in custom-made behavioral phenotyping rigs.

      Strengths: 

      The study uses several different behavioral phenotyping devices to quantify individual behavior in a number of different situations and over time. It seems to be a very impressive amount of data. The authors also make all their behavioral phenotyping rig design and tracking software available, which I think is great and I'm sure other folks will be interested in using and adapting it to their own needs.

      We thank the reviewer for highlighting the strengths of our study.

      Weaknesses/Limitations: 

      I think an important limitation is that while the authors measured the flies under different environmental scenarios (i.e. with different lighting and temperature) they didn't really alter the "context" of the environment. At least within behavioral ecology, context would refer to the potential functionality of the expressed behaviors so for example, an anti-predator context, a mating context, or foraging. Here, the authors seem to really just be measuring aspects of locomotion under benign (relatively low-risk perception) contexts. This is not a flaw of the study, but rather a limitation to how strongly the authors can really say that this demonstrates that individuality is generalized across many different contexts. It's quite possible that rank order of locomotor (or other) behaviors may shift when the flies are in a mating or risky context. 

      We agree with the reviewer that the definition of environmental context can differ between fields and that behavioral context is differently defined, particularly in ecology. Nevertheless, we highlight that our alternations of environmental context are highly stereotypic, well-defined, and unbiased from any interpretation (we only modified what we stated in the experimental description without designing a specific situation that might be again perceived individually differently. E.g., comparing a context with a predator and one without might result in a binary response because one fraction of the tested individuals might perceive the predator in the predator situation, and the other half does not. 

      The analytical framework in terms of statistical methods is lacking. It appears as though the authors used correlations across time/situations to estimate individual variation; however, far more sophisticated and elegant methods exist. The paper would be a lot stronger, and my guess is, much more streamlined if the authors employ hierarchical mixed models to analyse these data these models could capture and estimate differences in individual behavior across time and situations simultaneously. Along with this, it's currently unclear whether and how any statistical inference was performed. Right now, it appears as though any results describing how individuality changes across situations are largely descriptive (i.e. a visual comparison of the strengths of the correlation coefficients?). 

      The reviewer raises an important point, also raised by reviewer #1. On one hand, we agree with both reviewers that a more aggregated analysis has clear advantages like more statistical power and has the potential to streamline our manuscript, which is why we added such an analysis (see below). On the other hand, we would also like to defend the initial approach we took, since we think that the simplicity of the analysis for both correlational and mean data is easy to understand and reproduce. More complex analyses necessarily include the selection of a specific statistical toolbox by the experimenters and based on these decisions, different analyses become less comparable and more and more complicated to reproduce, unless the entire decision tree is flawlessly documented. For instance, a recent personality psychology paper investigated the relationship between statistical paths within the decision tree (forking analysis) and their results, leading to very surprising results (Paul et al., 2024), since some paths even reversed their findings. Such a variance in conclusions is hardly possible with the rather simplistic and easily reproducible analysis we performed. One of the major strengths of our study is the simple experimental design, allowing for rather simple and easy to understand analyses.

      We nevertheless took the reviewer’s advice very seriously and reanalyzed the data using a generalized linear model, which largely recapitulated the findings of our previously performed “low-tech” analysis in a single figure (Fig. 9).

      Another pretty major weakness is that right now, I can't find any explicit mention of how many flies were used and whether they were re-used across situations. Some sort of overall schematic showing exactly how many measurements were made in which rigs and with which flies would be very beneficial. 

      We apologize for this inconvenience. A detailed overview of male and female sample sizes has been listed in the supplemental boxplots next to the plots (e.g, Fig S6). Apparently, this was not visible enough. Therefore, we have now also uniformly added the sample sizes to the main figure legends.

      I don't necessarily doubt the robustness of the results and my guess is that the author's interpretations would remain the same, but a more appropriate modeling framework could certainly improve their statistical inference and likely highlight some other cool patterns as these methods could better estimate stability and covariance in individual intercepts (and potentially slopes) across time and situation.

      As described above, we have now added the suggested analyses. We hope that the reviewer will appreciate the new Fig. 9, which, in our opinion, largely confirms our previous findings using a more appropriate generalized linear modelling framework.

      Reviewer #3 (Public Review): 

      This manuscript is a continuation of past work by the last author where they looked at stochasticity in developmental processes leading to inter-individual behavioural differences. In that work, the focus was on a specific behaviour under specific conditions while probing the neural basis of the variability. In this work, the authors set out to describe in detail how stable the individuality of animal behaviours is in the context of various external and internal influences. They identify a few behaviours to monitor (read outs of attention, exploration, and 'anxiety'); some external stimuli (temperature, contrast, nature of visual cues, and spatial environment); and two internal states (walking and flying).

      They then use high-throughput behavioural arenas - most of which they have built and made plans available for others to replicate - to quantify and compare combinations of these behaviours, stimuli, and internal states. This detailed analysis reveals that:

      (1) Many individualistic behaviours remain stable over the course of many days. 

      (2) That some of these (walking speed) remain stable over changing visual cues. Others (walking speed and centrophobicity) remain stable at different temperatures.

      (3) All the behaviours they tested failed to remain stable over the spatially varying environment (arena shape).

      (4) Only angular velocity (a readout of attention) remains stable across varying internal states (walking and flying).

      Thus, the authors conclude that there is a hierarchy in the influence of external stimuli and internal states on the stability of individual behaviours.

      The manuscript is a technical feat with the authors having built many new highthroughput assays. The number of animals is large and many variables have been tested - different types of behavioural paradigms, flying vs walking, varying visual stimuli, and different temperatures among others. 

      We thank the reviewer for this extraordinary kind assessment of our work!

      Recommendations for the authors:  

      Reviewing Editor (Recommendations For The Authors): 

      While appreciating the effort and quality of the work that went into this manuscript, the reviewers identified a few key points that would greatly benefit this work.

      (1) Statistical methods adopted. The dataset produced through this work is large, with multiple conditions and comparisons that can be made to infer parameters that both define and affect the individualistic behaviour of an animal. Hierarchical mixed models would be a more appropriate approach to handle such datasets and infer statistically the influence of different parameters on behaviours. We recommend that the authors take this approach in the analyses of their data.

      (2) Brevity in the text. We urge the authors to take advantage of eLife's flexible template and take care to elaborate on the text in the results section, the methods adopted, the legends, and the guides to the legends embedded in the main text. The findings are likely to be of interest to a broad audience, and the writing currently targets the specialist.

      Reviewer #2 (Recommendations For The Authors): 

      I want to start by saying this seems like a really cool study! It's an impressive amount of work and addressing a pretty basic question that is interesting (at least I think so!)

      We thank the reviewer again for this assessment!

      That said, I would really strongly recommend the authors embrace using mixed/hierarchical models to analyze their data. They're producing some really impressive data and just doing Pearson correlation coefficients across time points and situations is very clunky and actually losing out on a lot of information. The most up-todate, state-of-the-art are mixed models - these models can handle very complex (or not so complex) random structures which can estimate variance and importantly, covariance, in individual intercepts both over time and across situations. I actually think this could add some really cool insights into the data and allow you to characterize the patterns you're seeing in far more detail. It's datasets exactly like this that are tailormade for these complex variance partitioning models! 

      As mentioned before, we have now adopted a more appropriate GLM-based data analysis (see above).

      Regardless of which statistical methods you decide to use, please explicitly state in your methods exactly what analyses you did. That is completely lacking now and was a bit frustrating. As such, it's completely unclear whether or how statistical inference was performed. How did you do the behavioral clustering? 

      We apologize that these points were not clearly represented in the previous version of the manuscript. We have now significantly extended the methods section to include a separate paragraph on the statistical methods used, in order to address this critique and hope that the revised version is clear now.

      Also, I could not for the life of me figure out how many flies had been measured. Were they reused across the situation? Or not?

      We reused the same flies across situations whenever possible. However, having one fly experience all assays consecutively was not feasible due to their fragility. Instead, individual flies were exposed to at least 2 of the 3 groups of assays used here: in the Indytrax setup ,  the Buridan arenas and variants thereof, and the virtual arenas Hence, we have compared flies across entirely different setups, but the number of times flies can be retested is limited (as otherwise, sample sizes will drop over time, and the flies will have gone through too many experimental alternations). To make this more clear, we have elaborated on this point in the main text, and we added group sample sizes to figure legends r.

      What are these "groups" and "populations" that are referred to in the results (e.g. lines 384, 391, 409)?

      We apologize for using these two terms somewhat interchangeably without proper introduction/distinction. We have now made this more clear in at the beginning of the results in the main text, by focusing on the term ‘group’. By ‘group’ we refer to the average of all individuals tested in the same situation. Sample sizes in the figure legends now indicate group/population sizes to make this clearer.

      Some of the rationale for the development of the behavioral rigs would have actually been nice to include in the intro, rather than in the results.

      This rationale is introduced at the beginning of the last paragraph of the introduction. We hope that this now becomes clear in the revised version of the manuscript.

      Reviewer #3 (Recommendations For The Authors): 

      This manuscript would do well to take advantage of eLife's flexible word limit. I sense that it has been written in brevity for a different journal but I would urge the authors to revisit this and unpack the language here - in the text, in the figure legends, in references to the figures within the text. The way it's currently written, though not misleading, will only speak to the super-specialist or the super-invested :). But the findings are nice, and it would be nice to tailor it to a broader audience.

      We appreciate this suggestion. Initially, we were hoping that we had described our results as clearly and brief as possible. We apologize if that was not always the case. The comments and requests of all three reviewers now led to a series of additions to both main text and methods, leading to a significantly expanded manuscript. We hope that these additons are helpful for the general, non-expert audience.

    1. eLife Assessment

      This important study tests the development of motor reinforcement learning from toddlerhood to adulthood, using a large online sample. They show that learning improves with age in a task that, like real-life movement, involves a continuous range of response options and probabilistic rewards, and link this shift to reduced movement variability and more efficient feedback-based learning through behavioural modeling. Simplifying the task with discrete actions and deterministic outcomes boosted younger children's performance, suggesting early learning is limited by spatial and probabilistic processing. The evidence is convincing, although future work may investigate more naturalistic movement.

    2. Reviewer #1 (Public review):

      Summary:

      Here the authors address how reinforcement-based sensorimotor adaptation changes throughout development. To address this question, they collected many participants in ages that ranged from small children (3 years old) to adulthood (18+ years old). The authors used four experiments to manipulate whether binary and positive reinforcement was provided probabilistically (e.g., 30 or 50%) versus deterministically (e.g.,100%), and continuous (infinite possible locations) versus discrete (binned possible locations) when the probability of reinforcement varied along the span of a large redundant target. The authors found that both movement variability and the extent of adaptation changed with age.

      Strengths:

      The major strength of the paper is the number of participants collected (n = 385). The authors also answer their primary question, that reinforcement-based sensorimotor adaptation changes throughout development, which was shown by utilizing established experimental designs and computational modelling. They have compared an extensive number of potential models, finding the one that best fits the data while penalizing the number of free parameters.

    3. Reviewer #2 (Public review):

      Summary:

      In this study, Hill and colleagues use a novel reinforcement-based motor learning task ("RML"), asking how aspects of RML change over the course of development from toddler years through adolescence. Multiple versions of the RML task were used in different samples, which varied on two dimensions: whether the reward probability of a given hand movement direction was deterministic or probabilistic, and whether the solution space had continuous reach targets or discrete reach targets. Using analyses of both raw behavioral data and model fits, the authors report four main results: First, developmental improvements reflected 3 clear changes, including increases in exploration, an increase in the RL learning rate, and a reduction of intrinsic motor noise. Second, changes to the task that made it discrete and/or deterministic both rescued performance in the youngest age groups, suggesting that observed deficits could be linked to continuous/probabilistic learning settings. Overall, the results shed light on how RML changes throughout human development, and the modeling characterizes the specific learning deficits seen in the youngest ages.

      Strengths:

      (1) This impressive work addresses an understudied subfield of motor control/psychology - the developmental trajectory of motor learning. It is thus timely and will interest many researchers.

      (2) The task, analysis, and modeling methods are very strong. The empirical findings are rather clear and compelling, and the analysis approaches are convincing. Thus, at the empirical level, this study has very few weaknesses.

      (3) The large sample sizes and in-lab replications further reflect the laudable rigor of the study.

      (4) The main and supplemental figures are clear and concise.

    4. Reviewer #3 (Public review):

      Summary:

      The study investigates the development of reinforcement learning across the lifespan with a large sample of participants recruited for an online game. It finds that children gradually develop their abilities to learn reward probability, possibly hindered by their immature spatial processing and probabilistic reasoning abilities. Motor noise and exploration after a failure all contribute to children's subpar performance.  

      Strengths:

      Experimental manipulations of both the continuity of movement options and the probabilistic nature of the reward function enable the inference of what cognitive factors differ between age groups. <br /> A large sample of participants is studied.<br /> The model-based analysis provides further insights into the development of reinforcement learning ability. 

      Weaknesses:

      The conclusion that immature spatial processing and probabilistic reasoning abilities limit reinforcement learning here still needs more direct evidence.

    5. Author response:

      The following is the authors’ response to the original reviews

      Overview of changes in the revision

      We thank the reviewers for the very helpful comments and have extensively revised the paper. We provide point-by-point responses below and here briefly highlight the major changes:

      (1) We expanded the discussion of the relevant literature in children and adults.

      (2) We improved the contextualization of our experimental design within previous reinforcement studies in both cognitive and motor domains highlighting the interplay between the two.

      (3) We reorganized the primary and supplementary results to better communicate the findings of the studies.

      (4) The modeling has been significantly revised and extended. We now formally compare 31 noise-based models and one value-based model and this led to a different model from the original being the preferred model. This has to a large extent cleaned up the modeling results. The preferred model is a special case (with no exploration after success) of the model proposed in Therrien et al. (2018). We also provide examples of individual fits of the model, fit all four tasks and show group fits for all, examine fits vs. data for the clamp phases by age, provide measures of relative and absolute goodness of fit, and examine how the optimal level of exploration varies with motor noise.

      Reviewer #1 (Public review):

      Summary:

      Here the authors address how reinforcement-based sensorimotor adaptation changes throughout development. To address this question, they collected many participants in ages that ranged from small children (3 years old) to adulthood (1 8+ years old). The authors used four experiments to manipulate whether binary and positive reinforcement was provided probabilistically (e.g., 30 or 50%) versus deterministically (e.g., 100%), and continuous (infinite possible locations) versus discrete (binned possible locations) when the probability of reinforcement varied along the span of a large redundant target. The authors found that both movement variability and the extent of adaptation changed with age.

      Thank you for reviewing our work. One note of clarification. This work focuses on reinforcementbased learning throughout development but does not evaluate sensorimotor adaptation. The four tasks presented in this work are completed with veridical trajectory feedback (no perturbation).

      The goal is to understand how children at different ages adjust their movements in response to reward feedback but does not evaluate sensorimotor adaptation. We now explain this distinction on line 35.

      Strengths:

      The major strength of the paper is the number of participants collected (n = 385). The authors also answer their primary question, that reinforcement-based sensorimotor adaptation changes throughout development, which was shown by utilizing established experimental designs and computational modelling.

      Thank you.

      Weaknesses:

      Potential concerns involve inconsistent findings with secondary analyses, current assumptions that impact both interpr tation and computational modelling, and a lack of clearly stated hypotheses.

      (1) Multiple regression and Mediation Analyses.

      The challenge with these secondary analyses is that:

      (a) The results are inconsistent between Experiments 1 and 2, and the analysis was not performed for Experiments 3 and 4,

      (b) The authors used a two-stage procedure of using multiple regression to determine what variables to use for the mediation analysis, and

      (c)The authors already have a trial-by-trial model that is arguably more insightful.

      Given this, some suggested changes are to:

      (a) Perform the mediation analysis with all the possible variables (i.e., not informed by multiple regression) to see if the results are consistent.

      (b) Move the regression/mediation analysis to Supplementary, since it is slightly distracting given current inconsistencies and that the trial-by-trial model is arguably more insightful.

      Based on these comments, we have chosen to remove the multiple regression and mediation analyses. We agree that they were distracting and that the trial-by-trial model allows for differentiation of motor noise from exploration variability in the learning block.

      (2) Variability for different phases and model assumptions:

      A nice feature of the experimental design is the use of success and failure clamps. These clamped phases, along with baseline, are useful because they can provide insights into the partitioning of motor and exploratory noise. Based on the assumptions of the model, the success clamp would only reflect variability due to motor noise (excludes variability due to exploratory noise and any variability due to updates in reach aim). Thus, it is reasonable to expect that the success clamps would have lower variability than the failure clamps (which it obviously does in Figure 6), and presumably baseline (which provides success and failure feedback, thus would contain motor noise and likely some exploratory noise).

      However, in Figure 6, one visually observes greater variability during the success clamp (where it is assumed variability only comes from motor noise) compared to baseline (where variability would come from: (a) Motor noise.

      (b) Likely some exploratory noise since there were some failures.

      (c) Updates in reach aim.

      Thanks for this comment. It made us realize that some of our terminology was unintentionally misleading. Reaching to discrete targets in the Baseline block was done to a) determine if participants could move successfully to targets that are the same width as the 100% reward zone in the continuous targets and b) determine if there are age dependent changes in movement precision. We now realize that the term Baseline Variability was misleading and should really be called Baseline Precision.

      This is an important distinction that bears on this reviewer's comment. In clamp trials, participants move to continuous targets. In baseline, participants move to discrete targets presented at different locations. Clamp Variability cannot be directly compared to Baseline Precision because they are qualitatively different. Since the target changes on each baseline trial, we would not expect updating of desired reach (the target is the desired reach) and there is therefore no updating of reach based on success or failure. The SD we calculate over baseline trials is the endpoint variability of the reach locations relative to the target centers. In success clamp, there are no targets so the task is qualitatively different.

      We have updated the text to clarify terminology, expand upon our operational definitions, and motivate the distinct role of the baseline block in our task paradigm (line 674).

      Given the comment above, can the authors please:

      (a) Statistically compare movement variability between the baseline, success clamp, and failure clamp phases.

      Given our explanation in the previous point we don't think that comparing baseline to the clamp makes sense as the trials are qualitatively different.

      (b) The authors have examined how their model predicts variability during success clamps and failure clamps, but can they also please show predictions for baseline (similar to that of Cashaback et al., 2019; Supplementary B, which alternatively used a no feedback baseline)?

      Again, we do not think it makes sense to predict the baseline which as we mention above has discrete targets compared to the continuous targets in the learning phase.

      (c) Can the authors show whether participants updated their aim towards their last successful reach during the success clamp? This would be a particularly insightful analysis of model assumptions.

      We have now compared 31 models (see full details in next response) which include the 7 models in Roth et al. (2023). Several of these model variants have updating even after success with so called planning noise). We also now fit the model to the data that includes the clamp phases (we can't easily fit to success clamp alone as there are only 10 trials). We find that the preferred model is one that does not include updating after success.

      (d) Different sources of movement variability have been proposed in the literature, as have different related models. One possibility is that the nervous system has knowledge of 'planned (noise)' movement variability that is always present, irrespective of success (van Beers, R.J. (2009). Motor learning is optimally tuned to the properties of motor noise. Neuron, 63(3), 406-417). The authors have used slightly different variations of their model in the past. Roth et al (2023) directly Rill compared several different plausible models with various combinations of motor, planned, and exploratory noise (Roth A, 2023, "Reinforcement-based processes actively regulate motor exploration along redundant solution manifolds." Proceedings of the Royal Society B 290: 20231475: see Supplemental). Their best-fit model seems similar to the one the authors propose here, but the current paper has the added benefit of the success and failure clamps to tease the different potential models apart. In light of the results of a), b), and c), the authors are encouraged to provide a paragraph on how their model relates to the various sources of movement variability and ther models proposed in the literature.

      Thank you for this. We realized that the models presented in Roth et al. (2023) as well as in other papers, are all special cases of a more general model. Moreover, in total there are 30 possible variants of the full model so we have now fit all 31 models to our larger datasets and performed model selection (Results and Methods). All the models can be efficiently fit by Kalman smoother to the actual data (rather than to summary statistics which has sometimes been done). For model selection, we fit only the 100 learning trials and chose the preferred model based on BIC on the children's data (Figure 5—figure Supplement 1). After selecting the preferred model we then refit this model to all trials including the clamps so as to obtain the best parameter estimates.

      The preferred model was the same whether we combined the continuous and discrete probabilistic data or just examin d each task separately either for only the children or for the children and adults combined. The preferred model is a pecial case (no exploration after success) of the one proposed in Therrien et al. (2018) and has exploration variability (after failure) and motor noise with full updating with exploration variability (if any) after success. This model differs from the model in the original submission which included a partial update of the desired reach after exploration this was considered the learning rate. The current model suggests a unity learning rate.

      In addition, as suggested by another reviewer, we also fit a value-based model which we adapted from the model described in Giron et al. (2023). This model was not preferred.

      We have added a paragraph to the Discussion highlighting different sources of variability and links to our model comparison.

      (e) line 155. Why would the success clamp be composed of both motor and exploratory noise? Please clarify in the text

      This sentence was written to refer to clamps in general and not just success clamps. However, in the revision this sentence seemed unnecessary so we have removed it.

      (3) Hypotheses:

      The introduction did not have any hypotheses of development and reinforcement, despite the discussion above setting up potential hypotheses. Did the authors have any hypotheses related to why they might expect age to change motor noise, exploratory noise, and learning rates? If so, what would the experimental behaviour look like to confirm these hypotheses? Currently, the manuscript reads more as an exploratory study, which is certainly fine if true, it should just be explicitly stated in the introduction. Note: on line 144, this is a prediction, not a hypothesis. Line 225: this idea could be sharpened. I believe the authors are speaking to the idea of having more explicit knowledge of action-target pairings changing behaviour.

      We have included our hypotheses and predictions at two points in the paper In the introduction we modified the text to:

      "We hypothesized that children's reinforcement learning abilities would improve with age, and depend on the developmental trajectory of exploration variability, learning rate (how much people adjust their reach after success), and motor noise (here defined as all sources of noise associated with movement, including sensory noise, memory noise, and motor noise). We think that these factors depend on the developmental progression of neural circuits that contribute to reinforcement learning abilities (Raznahan et al., 2014; Nelson et al., 2000; Schultz, 1998)."

      In results we modified the sentence to:

      "We predicted that discrete targets could increase exploration by encouraging children to move to a different target after failure.”

      Reviewer #2 (Public review):

      Summary:

      In this study, Hill and colleagues use a novel reinforcement-based motor learning task ("RML"), asking how aspects of RML change over the course of development from toddler years through adolescence. Multiple versions of the RML task were used in different samples, which varied on two dimensions: whether the reward probability of a given hand movement direction was deterministic or probabilistic, and whether the solution space had continuous reach targets or discrete reach targets. Using analyses of both raw behavioral data and model fits, the authors report four main results: First, developmental improvements reflected 3 clear changes, including increases in exploration, an increase in the RL learning rate, and a reduction of intrinsic motor noise. Second, changes to the task that made it discrete and/or deterministic both rescued performance in the youngest age groups, suggesting that observed deficits could be linked to continuous/probabilistic learning settings. Overall, the results shed light on how RML changes throughout human development, and the modeling characterizes the specific learning deficits seen in the youngest ages.

      Strengths:

      (1) This impressive work addresses an understudied subfield of motor control/psychology - the developmental trajectory of motor learning. It is thus timely and will interest many researchers.

      (2) The task, analysis, and modeling methods are very strong. The empirical findings are rather clear and compelling, and the analysis approaches are convincing. Thus, at the empirical level, this study has very few weaknesses.

      (3) The large sample sizes and in-lab replications further reflect the laudable rigor of the study.

      (4) The main and supplemental figures are clear and concise.

      Thank you.

      Weaknesses:

      (1) Framing.

      One weakness of the current paper is the framing, namely w/r/t what can be considered "cognitive" versus "non-cognitive" ("procedural?") here. In the Intro, for example, it is stated that there are specific features of RML tasks that deviate from cognitive tasks. This is of course true in terms of having a continuous choice space and motor noise, but spatially correlated reward functions are not a unique feature of motor learning (see e.g. Giron et al., 2023, NHB). Given the result here that simplifying the spatial memory demands of the task greatly improved learning for the youngest cohort, it is hard to say whether the task is truly getting at a motor learning process or more generic cognitive capacities for spatial learning, working memory, and hypothesis testing. This is not a logical problem with the design, as spatial reasoning and working memory are intrinsically tied to motor learning. However, I think the framing of the study could be revised to focus in on what the authors truly think is motor about the task versus more general psychological mechanisms. Indeed, it may be the case that deficits in motor learning in young children are mostly about cognitive factors, which is still an interesting result!

      Thank you for these comments on the framing of our study. We now clearly acknowledge that all motor tasks have cognitive components (new paragraph at line 65). We also explain why we think our tasks has features not present in typical cognitive tasks.

      (2) Links to other scholarship.

      If I'm not mistaken a common observation in tudies of the development of reinforcement learning is a decrease in exploration over-development (e.g., Nussenbaum and Hartley, 2019; Giron et al., 2023; Schulz et al., 2019); this contrasts with the current results which instead show an increase. It would be nice to see a more direct discussion of previous findings showing decreases in exploration over development, and why the current study deviates from that. It could also be useful for the authors to bring in concepts of different types of exploration (e.g. "directed" vs "random"), in their interpretations and potentially in their modeling.

      We recognize that our results differ from prior work. The optimal exploration pattern differs from task to task. We now discuss that exploration is not one size fits all, it's benefits vary depending upon the task. We have added the following paragraphs to the Discussion section:

      "One major finding from this study is that exploration variability increases with age. Some other studies of development have shown that exploration can decrease with age indicating that adults explore less compared to children (Schulz et al., 2019; Meder et al., 2021; Giron et al., 2023). We believe the divergence between our work and these previous findings is largely due to the experimental design of our study and the role of motor noise. In the paradigm used initially by Schulz et al. (2019) and replicated in different age groups by Meder et al. (2021) and Giron et al. (2023), participants push buttons on a two-dimensional grid to reveal continuous-valued rewards that are spatially correlated. Participants are unaware that there is a maximum reward available and therefore children may continue to explore to reduce uncertainty if they have difficulty evaluating whether they have reached a maxima. In our task by contrast, participants are given binary reward and told that there is a region in which reaches will always be rewarded. Motor noise is an additional factor which plays a key role in our reaching task but minimal if any role in the discretized grid task. As we show in simulations of our task, as motor noise goes down (as it is known to do through development) the optimal amount of exploration goes up (see Figure 7—figure Supplement 2 and Appendix 1). Therefore, the behavior of our participants is rational in terms of R230 increasing exploration as motor noise decreases.

      A key result in our study is that exploration in our task reflects sensitivity to failure. Older children make larger adjustments after failure compared to younger children to find the highly rewarded zone more quickly. Dhawale et al. (2017) discuss the different contexts in which a participant may explore versus exploit (i.e., stick at the same position). Exploration is beneficial when reward is low as this indicates that the current solution is no longer ideal, and the participant should search for a better solution. Konrad et al. (2025) have recently shown this behavior in a real-world throwing task where 6 to 12 year old children increased throwing variability after missed trials and minimized variability after successful trials. This has also been shown in a postural motor control task where participants were more variable after non-rewarded trials compared to rewarded trials (Van Mastrigt et al., 2020). In general, these studies suggest that the optimal amount of exploration is dependent on the specifics of the task."

      (3) Modeling.

      First, I may have missed something, but it is unclear to me if the model is actually accounting for the gradient of rewards (e.g., if I get a probabilistic reward moving at 45°, but then don't get one at 40°, I should be more likely to try 50° next then 35°). I couldn't tell from the current equations if this was the case, or if exploration was essentially "unsigned," nor if the multiple-trials-back regression analysis would truly capture signed behavior. If the model is sensitive to the gradient, it would be nice if this was more clear in the Methods. If not, it would be interesting to have a model that does "function approximation" of the task space, and see if that improves the fit or explains developmental changes.

      The model we use (similar to Roth et al. (2023) and Therrien et al. (2016, 2018)) does not model the gradient. Exploration is always zero-mean Gaussian. As suggested by the reviewer, we now also fit a value-based model (described starting at line 810) which we adapted from the model presented in Giron et al. (2023). We show that the exploration and noise-based model is preferred over the value-based model.

      The multiple-trials-back regression was unsigned as the intent was to look at the magnitude and not the direction of the change in movement. We have decided to remove this analysis from the manuscript as it was a source of confusion and secondary analysis that did not add substantially to the findings of these studies.

      Second, I am curious if the current modeling approach could incorporate a kind of "action hysteresis" (aka perseveration), such that regardless of previous outcomes, the same action is biased to be repeated (or, based on parameter settings, avoided).

      In some sense, the learning rate in the model in the original submission is highly related to perseveration. For example if the learning rate is 0, then there is complete perseveration as you simply repeat the same desired movement. If the rate is 1, there is no perseveration and values in between reflect different amounts of perseveration. Therefore, it is not easy to separate learning rate from perseveration. Adding perseveration as another parameter would likely make it and the learning unidentifiable. However, we now compare 31 models and those that have a non-unity learning rate are not preferred suggesting there is little perseveration.

      (4) Psychological mechanisms. There is a line of work that shows that when children and adults perform RL tasks they use a combination of working memory and trial-by-trial incremental learning processes (e.g., Master et al., 2020; Collins and Frank 2012). Thus, the observed increase in the learning rate over development could in theory reflect improvements in instrumental learning, working memory, or both. Could it be that older participants are better at remembering their recent movements in short-term memory (Hadjiosif et al., 2023; Hillman et al., 2024)?

      We agree that cognitive processes, such as working memory or visuospatial processing, play a role in our task and describe cognitive elements of our task in the introduction (new paragraph at line 65). However, the sensorimotor model we fit to the data does a good job of explaining the variation across age, which suggests that that age-dependent cognitive processes probably play a smaller role.

      Reviewer #3 (Public review):

      Summary:

      The study investigates reinforcement learning across the lifespan with a large sample of participants recruited for an online game. It finds that children gradually develop their abilities to learn reward probability, possibly hindered by their immature spatial processing and probabilistic reasoning abilities. Motor noise, reinforcement learning rate, and exploration after a failure all contribute to children's subpar performance.

      Strengths:

      (1) The paradigm is novel because it requires continuous movement to indicate people's choices, as opposed to discrete actions in previous studies.

      (2) A large sample of participants were recruited.

      (3) The model-based analysis provides further insights into the development of reinforcement learning ability.

      Thank you.

      Weaknesses:

      (1 ) The adequacy of model-based analysis is questionable, given the current presentation and some inconsistency in the results.

      Thank you for raising this concern. We have substantially revised the model from our first submission. We now compare 31 noise-based models and 1 value-based model and fit all of the tasks with the preferred model. We perform model selection using the two tasks with the largest datasets to identify the preferred model. From the preferred model, we found the parameter fits for each individual dataset and simulated the trial by trial behavior allowing comparison between all four tasks. We now show examples of individual fits as well as provide a measure of goodness of fit. The expansion of our modeling approach has resolved inconsistencies and sharpened the conclusions drawn from our model.

      (2) The task should not be labeled as reinforcement motor learning, as it is not about learning a motor skill or adapting to sensorimotor perturbations. It is a classical reinforcement learning paradigm.

      We now make it clear that our reinforcement learning task has both motor and cognitive demands, but does not fall entirely within one of these domains. We use the term motor learning because it captures the fact that participants maximize reward by making different movements, corrupted by motor noise, to unmarked locations on a continuous target zone. When we look at previous ublications, it is clear that our task is similar to those that also refer to this as reinforcement motor learning Cashaback et al. (2019) (reaching task using a robotic arm in adults), Van Mastrigt et al. (2020) (weight shifting task in adults), and Konrad et al. (2025) (real-world throwing task in children). All of these tasks involve trial-by-trial learning through reinforcement to make the movement that is most effective for a given situation. We feel it is important to link our work to these previous studies and prefer to preserve the terminology of reinforcement motor learning.

      Recommendations for the authors:

      Reviewing Editor Comments:

      Thank you for this summary. Rather than repeat the extended text from the responses to the reviewers here, we point the Editor to the appropriate reviewer responses for each issue raised.

      The reviewers and editors have rated the significance of the findings in your manuscript as "Valuable" and the strength of evidence as "Solid" (see eLife evalutation). A consultancy discussion session to integrate the public reviews and recommendations per reviewer (listed below), has resulted in key recommendations for increasing the significance and strength of evidence:

      To increase the Significance of the findings, please consider the following:

      (1) Address and reframe the paper around whether the task is truly getting at a motor learning process or more generic cognitive decision-making capacities such as spatial memory, reward processing, and hypothesis testing.

      We have revised the paper to address the comments on the framing of our work. Please see responses to the public review comments of Reviewers #2 and #3.

      (2) It would be beneficial to specify the differences between traditional reinforcement algorithms (i.e., using softmax functions to explore, and build representations of state-action-reward) and the reinforcement learning models used here (i.e., explore with movement variability, update reach aim towards the last successful action), and compare present findings to previous cognitive reinforcement learning studies in children.

      Please see response to the public review comments of Reviewer #1 in which we explain the expansion of our modeling approach to fit a value-based model as well as 31 other noise-based models. In our response to the public review comments of Reviewer #2, we comment on our expanded discussion of how our findings compare with previous cognitive reinforcement learning studies.

      To move the "Strength of Evidence" to "Convincing", please consider doing the following:

      (1 ) Address some apparently inconsistent and unrealistic values of motor noise, exploration noise, and learning rate shown for individual participants (e.g., Figure 5b; see comments reviewers 1 and take the following additional steps: plotting r squares for individual participants, discussing whether individual values of the fitted parameters are plausible and whether model parameters in each age group can extrapolate to the two clamp conditions and baselines.

      We have substantially updated our modeling approach. Now that we compare 31 noise-based models, the preferred model does not show any inconsistent or unrealistic values (see response to Reviewer #3). Additionally, we now show example individual fits and provide both relative and absolute goodness of fit (see response to Reviewer #3).

      (2) Relatedly, to further justify if model assumptions are met, it would be valuable to show that the current learning model fits the data better than alternative models presented in the literature by the authors themselves and by others (reviewer 1). This could include alternative development models that formalise the proposed explanations for age-related change: poor spatial memory, reward/outcome processing, and exploration strategies (reviewer 2).

      Please see response to public review comments of Reviewer #1 in which we explain that we have now fit a value-based model as well as 31 other noise-based models providing a comparison of previous models as well as novel models. This led to a slightly different model being preferred over the model in the original submission (updated model has a learning rate of unity). These models span many of the processes previously proposed for such tasks. We feel that 32 models span a reasonable amount of space and do not believe we have the power to include memory issues or heuristic exploration strategies in the model.

      (3) Perform the mediation analysis with all the possible variables (i.e., not informed by multiple regression) to see if the results are more consistent across studies and with the current approach (see comments reviewer 1).

      Please see response to public review comments of Reviewer #1. We chose to focus only on the model based analysis because it allowed us to distinguish between exploration variability and motor noise.

      Please see below for further specific recommendations from each reviewer.

      Reviewer #1 (Recommendations for the author):

      (1) In general, there should be more discussion and contextualization of other binary reinforcement tasks used in the motor literature. For example, work from Jeroen Smeets, Katinka van der Kooij, and Joseph Galea.

      Thank you for this comment. We have edited the Introduction to better contextualize our work within the reinforcement motor learning literature (see line 67 and line 83).

      (2) Line 32. Very minor. This sentence is fine, but perhaps could be slightly improved. “select a location along a continuous and infinite set of possible options (anywhere along the span of the bridge)"

      Thank you for this comment. We have edited the sentence to reflect this suggestion.

      (3) Line 57. To avoid some confusion in successive sentences: Perhaps, "Both children over 12 and adolescents...".

      Thank you for this comment. We have edited the sentence to reflect this suggestion.

      (4) Line 80. This is arguably not a mechanistic model, since it is likely not capturing the reward/reinforcement machinery used by the nervous system, such as updating the expected value using reward predic tion errors/dopamine. That said, this phenomenological model, and other similar models in the field, do very well to capture behaviour with a very simple set of explore and update rules.

      We use mechanistic in the standard use in modeling, as in Levenstein et al. (2023), for example. The contrast is not with neural modeling, but with normative modeling, in which one develops a model to optimize a function (or descriptive models as to what a system is trying to achieve). In mechanistic modeling one proposes a mechanism and this can be at a state-space level (as in our case) or a neural level (as suggested my the reviewer) but both are considered mechanistic, just at different levels. Quoting Levenstein "... mechanistic models, in which complex processes are summarized in schematic or conceptual structures that represent general properties of components and their interactions, are also commonly used." We now reference the Levenstein paper to clarify what we mean by mechanistic.

      (5) Figure 1. It would be useful to state that the x-axis in Figure 1 is in normalized units, depending on the device.

      Thank you for this comment. We have added a description of the x-axis units to the Fig. 1 caption.

      (6) Were there differences in behaviour for these different devices? e.g., how different was motor noise for the mouse, trackpad, and touchscreen?

      Thank you for this question. We did not find a significant effect of device on learning or precision in the baseline block. We have added these one way ANOVA results for each task in Supplementary Table 1.

      (7) Line 98. Please state that participants received reinforcement feedback during baseline.

      Thank you for this comment. We have updated the text to specify that participants receive reward feedback during the baseline block.

      (8) Line 99. Did the distance from the last baseline trial influence whether the participant learned or did not learn? For example, would it place them too far from the peak success location such that it impacted learning?

      Thank you for this question. We looked at whether the position of movement on the last baseline block trial was correlated with the first movement position in the learning block. We did not find any correlations between these positions for any of the tasks. Interestingly, we found that the majority of participants move to the center of the workspace on the first trial of the learning block for all tasks (either in the presence of the novel continuous target scene or the presentation of 7 targets all at once). We do not think that the last movement in the baseline block "primed" the participant for the location of the success zone in the learning block. We have added the following sentence to the Results section:

      "Note that the reach location for the first learning trial was not affected by (correlated with) the target position on the last baseline trial (p > 0.3 for both children and adults, separately)."

      (9) The term learning distance could be improved. Perhaps use distance from target.

      Thank you for this comment. We appreciate that learning distance defined with 0 as the best value is counter intuitive. We have changed the language to be "distance from target" as the learning metric.

      (10) Line 188. This equation is correct, but to estimate what the standard deviation by the distribution of changes in reach position is more involved. Not sure if the authors carried out this full procedure, which is described in Cashaback et al., 2019; Supplemental 2.

      There appear to be no Supplemental 2 in the referenced paper so we assume the reviewer is referring to Supplemental B which deals with a shuffling procedure to examine lag-1 correlations.

      In our tasks, we are limited to only 9 trials to analyze in each clamp phase so do not feel a shuffling analysis is warranted. In these blocks, we are not trying to 'estimate what the standard deviation by the distribution of changes in reach position' but instead are calculating the standard deviation of the reach locations and comparing the model fit (for which the reviewer says the formula is correct) with the data. We are unclear what additional steps the reviewer is suggesting. In our updated model analysis, we fit the data including the clamp phases for better parameter estimation. We use simulations to estimate s.d. in the clamp phase (as we ensure in simulations the data does not fall outside the workspace) making the previous analytic formulas an approximation that are no longer used.

      (11) Line 197-199. Having done the demo task, it is somewhat surprising that a 3-year-old could understand these instructions (whose comprehension can be very different from even a 5-year old).

      Thank you for raising this concern. We recognize that the younger participants likely have different comprehension levels compared to older participants. However, we believe that the majority of even the youngest participants were able to sufficiently understand the goal of the task to move in a way to get the video clip to play. We intentionally designed the tasks to be simple such that the only instructions the child needed to understand were that the goal was to get the video clip to play as much as possible and the video clip played based on their movement. Though the majority of younger children struggled to learn well on the probabilistic tasks, they were able to learn well on the deterministic tasks where the task instructions were virtually identical with the exception of how many places in the workspace could gain reward. On the continuous probabilistic task, we did have a small number (n = 3) of 3 to 5 year olds who exhibited more mature learning ability which gives us confidence that the younger children were able to understand the task goal.

      (12) Line 497: Can the authors please report the F-score and p-value separately for each of these one-way ANOVA (the device is of particular interest here).

      Thank you for this request. We have added ina upplementarytable (Supplementary Table 1) with the results of these ANOVAs.

      (13) Past work has discussed how motivation influences learning, which is a function of success rate (van der Kooij, K., in 't Veld, L., & Hennink, T. (2021). Motivation as a function of success frequency. Motivation and Emotion, 45, 759-768.). Can the authors please discuss how that may change throughout development?

      Thank you for this comment. While motivation most probably plays a role in learning, in particular in a game environment, this was out of the scope of the direct focus of this work and not something that our studies were designed to test. We have added the following sentence to the discussion section to address this comment:

      "We also recognize that other processes, such as memory and motivation, could affect performance on these tasks however our study was not designed to test these processes directly and future work would benefit from exploring these other components more explicitly."

      (14) Supplement 6. This analysis is somewhat incomplete because it does not consider success.

      Pekny and collegues (2015) looked at 3 trials back but considered both success and reward. However, their analysis has issues since successive time points are not i.i.d., and spurious relationships can arise. This issue is brought up by Dwahale (Dhawale, A. K., Miyamoto, Y. R., Smith, M. A., & R475 Ölveczky, B. P. (2019). Adaptive regulation of motor variability. Current Biology, 29(21), 3551-3562.). Perhaps it is best to remove this analysis from the paper.

      Thank you for this comment. We have decided to remove this secondary analysis from the paper as it was a source of confusion and did not add to the understanding and interpretation of our behavioral results.

      Reviewer #2 (Recommendations for the author):

      (1 ) the path length ratio analyses in the supplemental are interesting but are not mentioned in the main paper. I think it would be helpful to mention these as they are somewhat dramatic effects

      Thank you for this comment. Path length ratios are defined in the Methods and results are briefly summarized in the Results section with a point to the supplementary figures. We have updated the text to more explicitly report the age related differences in path length ratios.

      (2) The second to last paragraph of the intro could use a sentence motivating the use ofthe different task features (deterministic/probabilistic and discrete/continuous).

      Thank you for this comment. We have added an additional motivating sentence to the introduction.

      Reviewer #3 (Recommendations for the author):

      The paper labeled the task as one for reinforcement motor learning, which is not quite appropriate in my opinion. Motor learning typically refers to either skill learning or motor adaptation, the former for improving speed-accuracy tradeoffs in a certain (often new) motor skill task and the latter for accommodating some sensorimotor perturbations for an existing motor skill task. The gaming task here is for neither. It is more like a

      decision-making task with a slight contribution to motor execution, i.e., motor noise. I would recommend the authors label the learning as reinforcement learning instead of reinforcement motor learning.

      Thank you for this comment. As noted in the response to the public review comments, we agree that this task has components of classical reinforcement learning (i.e. responding to a binary reward) but we specifically designed it to require the learning of a movement within a novel game environment. We have added a new paragraph to the introduction where we acknowledge the interplay between cognitive and motor mechanisms while also underscoring the features in our task that we think are not present in typical cognitive tasks.

      My major concern is whether the model adequately captures subjects' behavior and whether we can conclude with confidence from model fitting. Motor noise, exploration noise, and learning rate, which fit individual learning patterns (Figure 5b), show some quite unrealistic values. For example, some subjects have nearly zero motor noise and a 100% learning rate.

      We have now compared 31 models and the preferred model is different from the one in the first submission. The parameter fits of the new model do not saturate in any way and appear reasonable to us. The updates to the model analysis have addressed the concern of previously seen unrealistic values in the prior draft.

      Currently, the paper does not report the fitting quality for individual subjects. It is good to have an exemplary subject's fit shown, too. My guess is that the r-squared would be quite low for this type of data. Still, given that the children's data is noisier, it might be good to use the adult data to show how good the fitting can be (individual fits, r squares, whether the fitted parameters make sense, whether it can extrapolate to the two clamp phases). Indeed, the reliability of model fitting affects how we should view the age effect of these model parameters.

      We now show fits to individual subjects. But since this is a Kalman smoother it fits the data perfectly by generating its best estimate of motor noise and exploration variability on each trial to fully account for the data — so in that sense R<sup>2</sup> is always 1 so that is not helpful.

      While the BIC analysis with the other model variants provides a relative goodness of fit, it is not straightforward to provide an absolute goodness of fit such as standard R<sup>2</sup> for a feedforward simulation of the model given the parameters (rather than the output of the Kalman smoother). There are two problems. First, there is no single model output. Each time the model is simulated with the fit parameters it produces a different output (due to motor noise, exploration variability and reward stochasticity). Second, the model is not meant to reproduce the actual motor noise, exploration variability and reward stochasticity of a trial. For example, the model could fit pure Gaussian motor noise across trials (for a poor learner) by accurately fitting the standard deviation of motor noise but would not be expected to actually match each data point so would have a traditional R<sup>2</sup> of O.

      To provide an overall goodness of fit we have to reduce the noise component and to do so we exam ined the traditional R<sup>2</sup> between the average of all the children's data and the average simulation of the model (from the median of 1000 simulations per participant) so as to reduce the stochastic variation. The results for the continuous probabilistic and discrete probabilistic task are R<sup>2</sup> of 0.41 and 0.72, respectively.

      Not that variability in the "success clamp" doe not change across ages (Figure 4C) and does not contribute to the learning effect (Figure 4F). However, it is regarded as reflecting motor noise (Figure SC), which then decreases over age from the model fitting (Figure 5B). How do we reconcile these contradictions? Again, this calls the model fitting into question.

      For the success clamp, we only have 9 trials to calculate variability which limits our power to detect significance with age. In contrast, the model uses all 120 trials to estimate motor noise. There is a downward trend with age in the behavioral data which we now show overlaid on the fits of the model for both probabilistic conditions (Figure 5—figure Supplement 4) and Figure 6—figure Supplement 4). These show a reasonable match and although the variance explained is 1 6 and 56% (we limit to 9 trials so as to match the fail clamp), the correlations are 0.52 and 0.78 suggesting we have reasonable relation although there may be other small sources of variability not captured in the model.

      Figure 5C: it appears one bivariate outlier contributes a lot to the overall significant correlation here for the "success clamp".

      Recalculating after removing that point in original Fig 5C was still significant and we feel the plots mentioned in the previous point add useful information to this issue. With the new model this figure has changed.

      It is still a concern that the young children did not understand the instructions. Nine 3-to-8 children (out of 48) were better explained by the noisy only model than the full model. In contrast, ten of the rest of the participants (out of 98) were better explained by the noisy-only model. It appears that there is a higher percentage of the "young" children who didn't get the instruction than the older ones.

      Thank you for this comment. We did take participant comprehension of the task into consideration during the task design. We specifically designed it so that the instructions were simple and straight forward. The child simply needs to understand the underlying goal to make the video clip play as often as possible and that they must move the penguin to certain positions to get it to play. By having a very simple task goal, we are able to test a naturalistic response to reinforcement in the absence of an explicit strategy in a task suited even for young children.

      We used the updated reinforcement learning model to assess whether an individual's performance is consistent with understanding the task. In the case of a child who does not understand the task, we expect that they simply have motor noise on their reach, and crucially, that they would not explore more after failure, nor update their reach after success. Therefore, we used a likelihood ratio test to examine whether the preferred model was significantly better at explaining each participant's data compared to the model variant which had only motor noise (Model 1). Focusing on only the youngest children (age 3-5), this analysis showed that that 43, 59, 65 and 86% of children (out of N = 21, 22, 20 and 21 ) for the continuous probabilistic, discrete probabilistic, continuous deterministic, and discrete deterministic conditions, respectively, were better fit with the preferred model, indicating non-zero exploration after failure. In the 3-5 year old group for the discrete deterministic condition, 18 out of 21 had performance better fit by the preferred model, suggesting this age group understands the basic task of moving in different directions to find a rewarding location.

      The reduced numbers fit by the preferred model for the other conditions likely reflects differences in the task conditions (continuous and/or probabilistic) rather than a lack of understanding of the goal of the task. We include this analysis as a new subsection at the end of the Results.

      Supplementary Figure 2: the first panel should belong to a 3-year-old not a 5-year-old? How are these panels organized? This is kind of confusing.

      Thank you for this comment. Figure 2—figure Supplement 1 and Figure 2—figure Supplement 2 are arranged with devices in the columns and a sample from each age bin in the rows. For example in Figure 2—figure Supplement 1, column 1, row 1 is a mouse using participant age 3 to 5 years old while column 3, row 2 is a touch screen using participant age 6 to 8 years old. We have edited the labeling on both figures to make the arrangement of the data more clear.

      Line 222: make this a complete sentence.

      This sentence has been edited to a complete sentence.

      Line 331: grammar.

      This sentence has been edited for grammar.

    1. eLife Assessment

      This study provides an important set of analyses and theoretical derivations to understand the mechanisms used by recurrent neural networks (RNNs) to perform context-dependent accumulation of evidence. The results regarding the dimensionality and neural dynamical signatures of RNNs are convincing and provide new avenues to study the mechanisms underlying context-dependent computations. This manuscript will be of interest to a broad audience in systems and computational neuroscience.

    2. Reviewer #1 (Public review):

      Summary:

      This paper investigates how recurrent neural networks (RNNs) can perform context-dependent decision-making (CDM). The authors use low-rank RNN modeling and focus on a CDM task where subjects are presented with sequences of auditory pulses that vary in location and frequency, and they must determine either the prevalent location or frequency based on an external context signal. In particular, the authors focus on the problem of differentiating between two distinct selection mechanisms: input modulation, which involves altering the stimulus input representation, and selection vector modulation, which involves altering the "selection vector" of the dynamical system.

      First, the authors show that rank-one networks can only implement input modulation, and that higher-rank networks are required for selection vector modulation. Then, the authors use pathway-based information flow analysis to understand how information is routed to the accumulator based on context. This analysis allows the authors to introduce a novel definition of selection vector modulation that explicitly links it to changes in the effective coupling along specific pathways within the network.

      The study further generates testable predictions for differentiating selection vector modulation from input modulation based on neural dynamics. In particular, the authors find that: 1) A larger proportion of selection vector modulation is expected in networks with high-dimensional connectivity. 2) Single-neuron response kernels exhibiting specific profiles (peaking between stimulus onset and choice onset) are indicative of neural dynamics in extra dimensions, supporting the presence of selection vector modulation. 3) The percentage of explained variance (PEV) of extra dynamical modes extracted from response kernels at the population level can serve as an index to quantify the amount of selection vector modulation.

      Strengths:

      The paper is clear and well written, and it draws bridges between two recent important approaches in the study of CDM: circuit-level descriptions of low-rank RNNs, and differentiation across alternative mechanisms in terms of neural dynamics. The most interesting aspect of the study involves establishing a link between selection vector modulation, network dimensionality and dimensionality of neural dynamics. The high correlation between the networks' mechanisms and their dimensionality (Fig. 7d) is surprising since differentiating between selection mechanisms is generally a difficult task, and the strength of this result is further corroborated by its consistency across multiple RNN hyperparameters (Figure 7-figure supplement 1 and Figure 7-figure supplement 2). Interestingly, the correlation between the selection mechanism and the dimensionality of neural dynamics is also high (Fig. 7g), potentially providing a promising future avenue for the study of neural recordings in this task.

      Weaknesses:

      As acknowledged by the authors, the results linking selection vector modulation and dimensionality might not generalize to neural representations where a significant fraction of the variance encodes information unrelated to the task. Therefore, these tools might not be applicable to neural recordings or to artificial neural networks with additional high-dimensional activity unrelated to the task (e.g. RNNs trained to perform many other tasks).

    3. Reviewer #2 (Public review):

      This manuscript examines network mechanisms that allow networks of neurons to perform context-dependent decision-making.<br /> In a recent study, Pagan and colleagues identified two distinct mechanisms by which recurrent neural networks can perform such computations. They termed these two mechanisms input-modulation and selection-vector modulation. Pagan and colleagues demonstrated that recurrent neural networks can be trained to implement combinations of these two mechanisms, and related this range of computational strategies with inter-individual variability in rats performing the same task. What type of structure in the recurrent connectivity favors one or the other mechanism however remained an open question.

      The present manuscript addresses this specific question by using a class of mechanistically interpretable recurrent neural networks, low-rank RNNs.<br /> The manuscript starts by demonstrating that unit-rank RNNs can only implement the input-modulation mechanism, but not the selection-vector modulation. The authors then build rank three networks which implement selection-vector modulation, and show how the two mechanisms can be combined. Finally, they relate the amount of selection-vector modulation with the effective rank, ie the dimensionality of activity, of a trained full-rank RNN.

      Strength:

      - The manuscript is written in an obvious manner<br /> - The analytic approach adopted in the manuscript is impressive<br /> - Very clear identification of the mechanisms leading to the two types of context-dependent modulation<br /> - Altogether, this manuscript reports remarkable insights on a very timely question

    4. Author response:

      The following is the authors’ response to the original reviews

      Reviewer 1 (Public review):

      The first part of the manuscript is not particularly novel, and it would be beneficial to clearly state which aspects of the analyses and derivations are different from previous literature. For example, the derivation that rank-1 RNNs cannot implement selection vector modulation is already present in the Extended Discussion of Pagan et al., 2022 (Equations 42-43). Similarly, it would be helpful to more clearly explain how the proposed pathway-based information flow analysis differs from the circuit diagram of latent dynamics in Dubreuil et al., 2022.

      We thank the reviewer for the insightful comments and providing us a good opportunity to better clarify the novelty of our work regarding the analyses and derivations. In general, as the reviewer pointed out, the major novelty of our work lies in explicitly linking selection mechanisms (proposed in Mante et al. 2013) with circuit-level descriptions of low-rank RNNs (developed in Dubreuil et al. 2022). This is made possible through a set of analyses and derivation integrating both linearized dynamical systems analysis (Mante et al., 2013) and the circuit diagram of latent dynamics (Dubreuil et al. 2022). Specifically, starting from rank-3 RNN models, we first derived the circuit diagram of latent dynamics (Eqs. 18 and 19) by applying the theory developed in Dubreuil et al. 2022. However, without further analysis, there is no explicit link between this latent dynamics and selection mechanism. In this manuscript, based on the line attractor assumption, we linearized the latent dynamics around the line attractor (Mante et al., 2013), which enabled us to explicitly solve the equation (from eq. 20 to eq. 27) and derive an explicit formula for the effective coupling of information flow (Fig. 5A). This formula of effective coupling strength supported an explicit pathway-based definition of selection vector modulation (Fig. 5) and selection vector (Fig. 6), the core result of this manuscript. Importantly, the same analysis can be extended to higher-order lowrank RNNs (Eqs. 47-55), suggesting the general applicability of our result. We have revised the manuscript to clearly state the novelty of our work. Please see Lines 292-294.

      As such a set of analyses and derivation integrates many results from previous literatures, it naturally shared many similarities with previous results as the reviewer pointed out. Below, we compared our work with previous ones mentioned by the reviewer:

      (1) For example, the derivation that rank-1 RNNs cannot implement selection vector modulation is already present in the Extended Discussion of Pagan et al., 2022 (Equations 42-43). 

      For this point, we totally agree with the reviewer that the derivation of rank-1 RNNs’ limitations in implementing selection vector modulation is not particularly novel. The reason why we started from rank-1 RNNs is because these RNNs are the simplest examples revealing the intriguing link between the connectivity property and the modulation mechanism and thereby serving as the ideal introduction for the subsequent in-depth discussion for general audiences. In the original manuscript, we cited the Pagan et al. 2023 note but may not make it explicit enough. As the reviewer pointed out that the derivation has been added into the latest version of Pagan et al. paper (Pagan et al. 2024), we now cite the Pagan et al. 2024 paper and make it clear that the derivation has been derived in Pagan et al. 2024. Please see Lines 186-188 in the main text.

      (2) Similarly, it would be helpful to more clearly explain how the proposed pathway-based information flow analysis differs from the circuit diagram of latent dynamics in Dubreuil et al., 2022.

      As we explained earlier, the latent dynamics in Dubreuil et al. alone did not provide an explicit link between circuit diagram and selection mechanisms. Our analysis go beyond the theory developed in Dubreuil et al. 2022 paper by integrating the linearized dynamical systems analysis (Mante et al. 2013), eventually providing a previously-unknown explicit link between circuit diagram and selection mechanisms.

      With regard to the results linking selection vector modulation and dimensionality, more work is required to understand the generality of these results, and how practical it would be to apply this type of analysis to neural recordings. For example, it is possible to build a network that uses input modulation and to greatly increase the dimensionality of the network simply by adding additional dimensions that do not directly contribute to the computation. Similarly, neural responses might have additional high-dimensional activity unrelated to the task. My understanding is that the currently proposed method would classify such networks incorrectly, and it is reasonable to imagine that the dimensionality of activity in high-order brain regions will be strongly dependent on activity that does not relate to this task.

      We thank the reviewer for this insightful comment. As what the reviewer suggested, we did more work to better understand the generality and applicability of the index proposed in the manuscript.

      Firstly, to see if the currently proposed method can work when there is significant amount of neural activity variance irrelevant to the task, we manually added irrelevant neural activity into the trained RNNs (termed as redundant RNNs, see Methods for details, Lines 1200-1215). As expected, we found that for these redundant RNNs, the correlation between the proposed index and the proportion of selection vector modulation indeed disappeared (Figure 7-figure supplement 4B). In fact, in the original version of our manuscript, we presented an extreme example of this idea in our discussion, where we designed two RNNs with theoretically identical neural activity patterns—one relying purely on input modulation and the other on selection vector modulation (Figure 7-figure supplement 3). Therefore, for this extreme example, any activity-based index alone would fail to differentiate between these two mechanisms, suggesting the challenge of distinguishing different selection mechanisms when taskirrelevant neural activity is added.

      Secondly, we asked why the proposed index works well for the trained RNNs, which is kind of surprising in the first place as the reviewer pointed out. One possibility is that for trained RNNs, the task-irrelevant neural activity is minimal. To test this possibility, we conducted in-silico lesion experiments for the trained RNNs. The main idea is that if an RNN contains a large portion of taskirrelevant variance, there will exist a subspace (termed as task-irrelevant subspace) that captures this part of variance and removing this task-irrelevant subspace will not affect the network’s behavior. Based on this idea, we developed an optimization method to identify such a task-irrelevant subspace for any given RNN (see Methods for details, Lines 1216-1244). The results show that in the originally trained RNNs, the identified task-irrelevant subspace can only explain a small portion of neural activity variance (Figure 7-figure supplement 4, panel C). As a control, when applying the same optimization method to the redundant RNNs, we found that the identified task-irrelevant subspace can explain a significantly larger portion of neural activity variance (Figure 7-figure supplement 4, panel C). Taken together, we concluded that the reason why the index works for trained RNNs is because the major variance of the neural activity of the network learned through backpropagation is task-relevant.

      Therefore, this set of analyses provided an understanding why the proposed index works for trained RNNs and failed for the redundant RNNs. We have added this part of analyses in the Discussion part. See Lines 601-610. As the reviewer pointed out that it is highly likely that there exists taskirrelevant neural activity variance in high brain regions, the proposed index may not work well in neural recordings. With this understanding, we tone down the conclusion related to experimentally testable prediction in the main text (e.g., in Abstract and Introduction). We thank the reviewer again for helping us improve the clarity of our work.

      Finally, a number of aspects of the analysis are not clear. The most important element to clarify is how the authors quantify the "proportion of selection vector modulation" in vanilla RNNs (Figures 7d and 7g). I could not find information about this in the Methods, yet this is a critical element of the study results. In Mante et al., 2013 and in Pagan et al., 2022 this was done by analyzing the RNN linearized dynamics around fixed points: is this the approach used also in this study? Also, how are the authors producing the trial-averaged analyses shown in Figures 2f and 3f? The methods used to produce this type of plot differ in Mante et al., 2013 and Pagan et al., 2022, and it is necessary for the authors to explain how this was computed in this case.

      We thank the reviewer for the valuable comments. Yes, for proportion of selection vector modulation (Figure 7D and 7G) we employed the method used in Mante et al., 2013. For the trial-averaged analyses shown in Figures 2f and 3f, we followed a procedure used in Mante et al., 2013. In the revised version, we have added the relate information. See Lines 852-853 and 872-889. We thank the reviewer again for improving the clarify of our work.

      I am also confused by a number of analyses done to verify mathematical derivations, which seem to suggest that the results are close to identical, but not exactly identical. For example, in the histogram in Figure 6b, or the histogram in Figure 7-figure supplement 3d: what is the source of the small variability leading to some of the indices being less than 1?

      In Figure 6B, the two selection vectors are considered theoretically equivalent under the meanfield assumption. However, because the RNNs we use have a finite number of neurons, finite-size effects inevitably cause slight deviations from perfect equivalence.

      To verify this, we generated rank-3 RNNs of different sizes in the experiment for Figure 6b (see the Supplementary section “Building rank-3 RNNs with both input and selection vector modulations”). Specifically, for a fixed number of neurons 𝑁, we independently sampled 𝛼, 𝛽 and 𝛾 from a Uniform(0,1) distribution and built an RNN with 𝑁 neurons based on the procedure as in Figure 5C. We then computed the selection vector for the RNN in a given context (for example, context 1) in two ways:

      (1) via linearized dynamical system analysis following Mante et al. (2013), producing the selection vector sc<sup>classical</sup>

      (2) using the theoretical derivation

      Author response image 1.

      cos angles for selection vectors computed using two methods in RNN with different size. Black bars indicate median values.

      We repeated this process 1000 times for each 𝑁 and measured the cosine angle between these two selection vectors. As shown in Author response image 1, as 𝑁 increases, the cosine angles approach 1 more consistently, indicating that the two selection vectors become nearly equivalent in larger RNNs. Conversely, smaller RNNs display more pronounced finite-size effects, which accounts for indices slightly below 1.

      Reviewer 2 (Public review):

      The introduction could have been written in a more accessible manner for any non-expert readers.

      We sincerely thank the reviewer for the constructive feedback on the introduction and have revised it accordingly.

      Reviewer #2 (Recommendations for the authors):

      The level of mastery of the low-rank framework is altogether impressive. I need however to point to a technical detail. The derivations of the information flow assume that the vectors m and vectors I are orthogonal (e.g. in Equation 14). This is not necessarily the case in trained networks, and Figure 2F suggests this is not the case in the trained rank 1 network. In that situation, the overlap between m and I leads to an additional term in the Equation going directly from the input to the output vector (see, e.g., Equation 15 in Beiran et al. Neuron 2023). In general, these kind of overlaps can contribute an additional pathway in higher rank networks too.

      We thank the reviewer for the valuable comments. The derivations presented in Equation 14 do not actually require that the vectors 𝒎 and 𝑰 are orthogonal. Rather, our definition of the task variable differs slightly from the one in Beiran et al. (2023). Consider a rank-1 RNN with a single input channel:

      Author response image 2.

      Difference of the definition of task variable with previous work. (A) Our definition of task variable. (B) Definition of task variable in Beiran et al. 2023.

      As long as 𝒎 and 𝑰 are linearly independent, the state 𝒙(𝑡) can be uniquely written as a linear combination of the two vectors (Author response image 2):

      where and are the task variables associated with 𝒎 and 𝑰, respectively. Substituting this expression into the dynamical equations yields:

      Hence, there is no additional term directly linking the input to the output vector in our formulation. By contrast, in Beiran et al. (2023), the input vector 𝑰 is decomposed into components parallel (𝐼//) and perpendicular (𝑰-) to 𝒎, and the task variables are defined as (Figure 4-figure supplement 3B):

      This leads to dynamics of the form:

      thus creating an additional direct term from the input to the output vector under their definition.

      The designed rank 3 network relies on a multi-population structure. This is explained clearly in the methods, but it could be stressed more in the main text to dispel the notion that higherrank networks may not need a multi-population structure to perform this task (cf Dubreuil et al 2022).

      Thank you for the valuable comments. In the revised version, we emphasize this point by adding the following sentence: “our rank-3 network relies on a multi-population structure, consistent with the notion that higher-rank networks still require a multi-population structure to perform flexible computations (Dubreuil et al. 2022)”. See Lines 238-240.

      (3) An important result in Pagan et al and Mante et al is that the line attractor direction is invariant across contexts. I believe this is explicitly enforced in the models studied here, but this could be made more clear. It would be interesting to discuss the importance of this constraint.

      We thank the reviewer for the valuable comments. In our hand-crafted RNN examples (Figures 3– 6), we enforce the choice axis to be identical across the two contexts (Figure R4B). Even in the rank-1 example (Figure 2), where we analyze a trained RNN, the choice axis still shows a substantial overlap between the two contexts (Figure R4A). However, in the trained vanilla RNNs shown in Figure 7, when the regularization term is relatively small, the overlap in the choice axis between contexts is smaller (Figure R4C)—i.e., the line attractor direction shifts between different contexts.

      Author response image 3.

      Cosine angle between the choice axes in two contexts for different RNNs. (A) Rank-1 RNNs in Figure 2. (B) Rank-3 RNNs in Figure 3-6. (C) Vanilla RNNs in Figure 7.

      Our theoretical framework can also accommodate situations where the direction of the choice axis changes. For instance, consider the rank-3 RNN in Figure 6, where the choice axis is defined as with 𝐺 being a diagonal matrix whose elements represent the slopes of each neuron’s activation function. Since these slopes can change across contexts, itself can vary across contexts. Likewise, the input representation direction may be written as , allowing both the choice axis and the input axis to adapt to the context. The selection vector is given by:

      Here, we no longer assume that is context-invariant; rather, we only assume its norm remains the same across contexts. Under this weaker assumption, we still have

      Substituting these into the equations yields the following expressions for input modulation and selection vector modulation:

      Figure 6B: it was not clear to me what exactly is plotted here.

      We thank the reviewer for pointing out the missing explanation. In Figure 6B, we show the distribution of the cosine angles between two ways of computing the selection vector for randomly generated rank-3 RNNs. Specifically, We generate 1000 RNNs according to the procedure in Figure 5C, with each RNN defined by parameters 𝛼 , 𝛽 and 𝛾 independently sampled from a Uniform(0,1) distribution. For each RNN, we computed the selection vector for the RNN in a given context (e.g., context 1 or 2) in two ways:

      (1)  via linearized dynamical system analysis following Mante et al. (2013), producing the selection vector sv<supclassical</sup> (classical in Figure 6B),

      (2)  using the theoretical derivation (“our’s” in Figure 6B)

      We repeated this process 1000 times and measured the cosine angle between these two selection vectors and plot the resulting distribution for context 1 (gray) and context 2 (blue) in Figure 6B. The figure shows that the computed selection vectors via the two methods are almost equal, as evidenced by the cosine angles clustering very close to 1.

      We have revised it accordingly. See Lines 1135-1143.

      In Figure 7, how was the effective dimension of vanilla RNNs controlled or varied? The metric used (effective dimension) is relatively non-standard, it would be useful to give some intuition to the reader about it.

      We thank the reviewer for these valuable comments.

      Controlling the effective dimension

      When train vanilla RNNs, we included a regularization term in the loss function of the form

      where 𝑤536 is a regularization coefficient. By adjusting 𝑤536, we can influence the distribution of singular values of connectivity of 𝐽. When w<sub>reg</sub> is larger, the learned 𝐽 tends to have fewer large singular values, hence with lower effectivity dimension; when 𝑤536 is small, more singular values remain large, increasing the matrix’s effective dimension.

      Definition and intuition: effective dimension

      Consider a connectivity matrix 𝐽 with singular values . The matrix’s rank is the number of nonzero singular values. However, rank alone can overlook differences in how quickly those singular values decay. To capture this, we define the effective dimension as:

      Each term lies between 0 and 1, so the effective dimension satisfies:

      When all nonzero singular values are equal, edim(𝐽) equals the matrix rank. But if some singular values are much smaller than others, effective dimension will be closer to 1. For example:

      -  𝐽<sub>1</sub> has nonzero singular values (1, 0.1, 0.01). Its effective dimension is 1.0101, indicating that most of the variance is captured by the largest singular value.

      -  𝐽sub>0</sub> has nonzero singular values (1, 0.8, 0.7). Its effective dimension is 2.13, which reflects that multiple singular values contribute significantly.

      Hence, while both >𝐽<sub>1</sub> and 𝐽sub>0</sub> are rank-3 matrices, their effective dimensions highlight the difference in how each matrix distributes its variance.

      We have added the intuition underlying this concept in Methods (see Lines 1135-1143). We thank the reviewer for improving the clarity of our work. 

      Eqs 19&21: n^T_r should be n^T_dv?

      Thank you for point out this mistake. We have fixed it in the revised version.

    1. eLife Assessment

      The manuscript contains important findings regarding inflammatory macrophage subsets that have theoretical and/or practical applications beyond the field of rheumatology. The authors demonstrate with compelling evidence the effects of PGE2 on TNF signaling. This work will be of broad interest to immunologists and cell biologists.

    2. Reviewer #1 (Public review):

      Summary:

      This article investigates the phenotype of macrophages with a pathogenic role in arthritis, particularly focusing on arthritis induced by immune checkpoint inhibitor (ICI) therapy.

      Building on prior data from monocyte-macrophage coculture with fibroblasts, the authors hypothesized a unique role for the combined actions of prostaglandin PGE2 and TNF. The authors studied this combined state using an in vitro model with macrophages derived from monocytes of healthy donors. They complemented this with single-cell transcriptomic and epigenetic data from patients with ICI-RA, specifically, macrophages sorted out of synovial fluid and tissue samples. The study addressed critical questions regarding the regulation of PGE2 and TNF: Are their actions co-regulated or antagonistic? How do they interact with IFN-γ in shaping macrophage responses?

      This study is the first to specifically investigate a macrophage subset responsive to the PGE2 and TNF combination in the context of ICI-RA, describes a new and easily reproducible in vitro model, and studies the role of IFNgamma regulation of this particular Mф subset.

      Strengths:

      Methodological quality: The authors employed a robust combination of approaches, including validation of bulk RNA-seq findings through complementary methods. The methods description is excellent and allows for reproducible research. Importantly, the authors compared their in vitro model with ex vivo single-cell data, demonstrating that their model accurately reflects the molecular mechanisms driving the pathogenicity of this macrophage subset.

      Comments on latest version:

      The revisions made to this manuscript followed the suggestions and improved the manuscript. The authors have thoroughly addressed my previous concerns, making several key improvements:

      The expanded comparison between rheumatoid arthritis (RA) and immune checkpoint inhibitor-induced RA (ICI-RA) in both cellular and molecular pathology is excellent. These additions to the literature review and discussion sections significantly strengthen the manuscript and provide valuable context.

      I particularly appreciate the added effort in mapping a particular cell subset onto previously published single-cell RNA-Seq embeddings. The enhanced UMAPs with cell subset projection analyses are methodologically compelling, informative and visually are easy to understand for any reader. The new Figure 3 represents a substantial improvement.

      More detailed comparisons with previously published single-cell datasets from 2019, 2020, and 2023 effectively contextualize this research within the broader field of rheumatoid arthritis pathogenesis. This enhances the manuscript's value for specialists in autoimmunity and myeloid immunology.

      I find the authors' suggestion to use the defined myeloid pathogenic phenotypes as biomarkers for therapy response prediction or dose optimization particularly insightful and clinically relevant.

      Overall, the authors have significantly improved both the analysis and presentation of results. The manuscript has been substantially enhanced.

    3. Reviewer #2 (Public review):

      Summary/Significance of the findings:

      The authors have done a great job by extensively carrying out transcriptomic and epigenomic analyses in the primary human/mouse monocytes/macrophages to investigate TNF-PGE2 (TP) crosstalk and their regulation by IFN-γ in the Rheumatoid arthritis (RA) synovial macrophages. They proposed that TP induces inflammatory genes via a novel regulatory axis whereby IFN-γ and PGE2 oppose each other to determine the balance between two distinct TNF-induced inflammatory gene expression programs relevant to RA and ICI-arthritis.

      Strengths:

      The authors have done a great job on RT-qPCR analysis of gene expression in primary human monocytes stimulated with TNF and showing the selective agonists of PGE2 receptors EP2 and EP4 22 that signal predominantly via cAMP. They have beautifully shown IFN-γ opposes the effects of PGE2 on TNF-induced gene expression. They found that TP signature genes are activated by cooperation of PGE2-induced AP-1, CEBP, and NR4A with TNF-induced NF-κB activity. On the other hand, they found that IFN-γ suppressed induction of AP-1, CEBP, and NR4A activity to ablate induction of IL-1, Notch, and neutrophil chemokine genes but promoted expression of distinct inflammatory genes such as TNF and T cell chemokines like CXCL10 indicating that TP induces inflammatory genes via IFN-γ in the RA and ICI-arthritis.

      Comments on latest version:

      The authors have answered my questions and i recommend this manuscript for publication.

    4. Author response:

      The following is the authors’ response to the original reviews

      Public Reviews: 

      Reviewer #1 (Public review): 

      Summary: 

      This article investigates the phenotype of macrophages with a pathogenic role in arthritis, particularly focusing on arthritis induced by immune checkpoint inhibitor (ICI) therapy. 

      Building on prior data from monocyte-macrophage coculture with fibroblasts, the authors hypothesized a unique role for the combined actions of prostaglandin PGE2 and TNF. The authors studied this combined state using an in vitro model with macrophages derived from monocytes of healthy donors. They complemented this with single-cell transcriptomic and epigenetic data from patients with ICI-RA, specifically, macrophages sorted out of synovial fluid and tissue samples. The study addressed critical questions regarding the regulation of PGE2 and TNF: Are their actions co-regulated or antagonistic? How do they interact with IFN-γ in shaping macrophage responses? 

      This study is the first to specifically investigate a macrophage subset responsive to the PGE2 and TNF combination in the context of ICI-RA, describes a new and easily reproducible in vitro model, and studies the role of IFNgamma regulation of this particular Mф subset. 

      Strengths: 

      Methodological quality: The authors employed a robust combination of approaches, including validation of bulk RNA-seq findings through complementary methods. The methods description is excellent and allows for reproducible research. Importantly, the authors compared their in vitro model with ex vivo single-cell data, demonstrating that their model accurately reflects the molecular mechanisms driving the pathogenicity of this macrophage subset. 

      Weaknesses: 

      Introduction: The introduction lacks a paragraph providing an overview of ICI-induced arthritis pathogenesis and a comparison with other types of arthritis. Including this would help contextualize the study for a broader audience.

      Thank you for this suggestion, we have added a paragraph on ICI-arthritis to intro (pg. 4, middle paragraph).  

      Results Section: At the beginning of the results section, the experimental setup should be described in greater detail to make an easier transition into the results for the reader, rather than relying just on references to Figure 1 captions.

      We have clarified the experimental setup (pg. 5).  

      There is insufficient comparison between single-cell RNA-seq data from ICI-induced arthritis and previously published single-cell RA datasets. Such a comparison may include DEGs and GSEA, pathway analysis comparison for similar subsets of cells. Ideally, an integration with previous datasets with RA-tissue-derived primary monocytes would allow for a direct comparison of subsets and their transcriptomic features.

      We thank the Reviewer for this suggestion, which has increased the impact of our data and analysis. A computationally rigorous representation mapping approach showed that ICI-arthritis myeloid subsets predominantly mapped onto 4 previously defined RA subsets including IL-1β+ cells. This result was corroborated using a complementary data integration approach. Analysis of (TNF + PGE)-induced gene sets (TP signatures) in ICI-arthritis myeloid cells projected onto the RA subsets using the AUCell package showed elevated TP gene expression in similar ICI-arthritis and RA monocytic cell subsets. We also found mutually exclusive expression of TP and IFN signatures in distinct RA and ICI-arthritis myeloid cell subsets, which supports that the opposing cross-regulation between IFN-γ and PGE2 pathways that we identified in vitro also functions similarly in vivo. This analysis is shown in the new Fig. 3, described on pg. 7, and discussed on pp. 13-14.

      While it's understandable that arthritis samples are limited in numbers and myeloid cell numbers, it would still be interesting to see the results of PGE2+TNF in vitro stimulation on the primary RA or ICI-RA macrophages. It would be valuable to see RNA-Seq signatures of patient cell reactivation in comparison to primary stimulation of healthy donor-derived monocytes.

      We agree that this would be interesting but given limited samples and distribution of samples amongst many studies and investigators this is beyond the scope of the current study.  

      Discussion: Prior single-cell studies of RA and RA macrophage subpopulations from 2019, 2020, 2023 publications deserve more discussion. A thorough comparison with these datasets would place the study in a broader scientific context. 

      Creating an integrated RA myeloid cell atlas that combines ICI-RA data into the RA landscape would be ideal to add value to the field. 

      As one of the next research goals, TNF blockade data in RA and ICI-RA patients would be interesting to add to such an integrated atlas. Combining responders and non-responders to TNF blockade would help to understand patient stratification with the myeloid pathogenic phenotypes. It would be great to read the authors' opinion on this in the Discussion section. 

      Please see our response to point 3 above. This point is addressed in Fig. 3, pg. 7, and pp. 13-14, which includes a discussion of responders and nonresponders and patient stratification.  

      Conclusion: The authors demonstrated that while PGE2 maintains the inflammatory profile of macrophages, it also induces a distinct phenotype in simultaneous PGE2 and TNF treatment. The study of this specific subset in single-cell data from ICI-RA patients sheds light on the pathogenic mechanisms underlying this condition, however, how it compares with conventional RA is not clear from the manuscript. 

      Given the substantial incidence of ICI-induced autoimmune arthritis, understanding the unique macrophage subsets involved for future targeting them therapeutically is an important challenge. The findings are significant for immunologists, cancer researchers, and specialists in autoimmune diseases, making the study relevant to a broad scientific audience. 

      Reviewer #2 (Public review): 

      Summary/Significance of the findings: 

      The authors have done a great job by extensively carrying out transcriptomic and epigenomic analyses in the primary human/mouse monocytes/macrophages to investigate TNF-PGE2 (TP) crosstalk and their regulation by IFN-γ in the Rheumatoid arthritis (RA) synovial macrophages. They proposed that TP induces inflammatory genes via a novel regulatory axis whereby IFN-γ and PGE2 oppose each other to determine the balance between two distinct TNF-induced inflammatory gene expression programs relevant to RA and ICI-arthritis. 

      Strengths: 

      The authors have done a great job on RT-qPCR analysis of gene expression in primary human monocytes stimulated with TNF and showing the selective agonists of PGE2 receptors EP2 and EP4 22 that signal predominantly via cAMP. They have beautifully shown IFN-γ opposes the effects of PGE2 on TNF-induced gene expression. They found that TP signature genes are activated by cooperation of PGE2-induced AP-1, CEBP, and NR4A with TNF-induced NF-κB activity. On the other hand, they found that IFN-γ suppressed induction of AP-1, CEBP, and NR4A activity to ablate induction of IL-1, Notch, and neutrophil chemokine genes but promoted expression of distinct inflammatory genes such as TNF and T cell chemokines like CXCL10 indicating that TP induces inflammatory genes via IFN-γ in the RA and ICI-arthritis. 

      Weaknesses: 

      (1) The authors carried out most of the assays in the monocytes/macrophages. How do APCcells like Dendritic cells behave with respect to this TP treatment similar dosing? 

      We agree that this is an interesting topic especially as TNF + PGE2 is one of the standard methods of maturing in vitro generated human DCs and promoting antigen-presenting function. As DC maturation is quite different from monocyte activation this would represent a new study and is beyond the scope of the current manuscript. We have instead added a paragraph to the discussion (pg. 12) and cited the literature on DC maturation by TNF + PGE2 including one of our older papers (PMID: 18678606; 2008)  

      (2) The authors studied 3h and 24h post-treatment transcriptomic and epigenomic. What happens to TP induce inflammatory genes post-treatment 12h, 36h, 48h, 72h. It is critical to see the upregulated/downregulated genes get normalised or stay the same throughout the innate immune response.

      We now clarify that subsets of inducible genes showed distinct kinetics of induction with transient expression at 3 hr versus sustained expression over the 24 hr stimulation period as shown in Supplementary Fig. 1 (pg. 5).

      (3) The authors showed IL1-axis in response to the TP-treatment. Do other cytokine axes get modulated? If yes, then how do they cooperate to reduce/induce inflammatory responses along this proposed axis?

      This is an interesting question, which we approached using a combination of pathway analysis and targeted inspection of pathways important pathogenesis of RA, which is the inflammatory condition most relevant for this study. In addition to genes in the IL-1-NF-κB core inflammatory pathway, pathway analysis of genes induced by TP co-stimulation showed enrichment of genes related to leukocyte chemotaxis, in particular neutrophil migration. Accordingly, TP costimulation increased expression of CSF3, which plays a key role in mobilizing neutrophils from the bone marrow, and major neutrophil chemokines CXCL1, CXCL2, CXCL3 and CXCL5 that recruit neutrophils to sites of inflammation including in inflammatory arthritis. Analysis of the late response to TNF similarly showed enrichment of genes important in chemotaxis, and suppression of genes in the cholesterol biosynthetic pathway, which we and others have previously linked to IFN responses. Targeted inspection of genes in additional pathways implicated in RA pathogenesis showed increased expression of genes in the Notch pathway. We believe that these pathways work together with the IL-1 pathway to increase immune cell recruitment and activation in inflammatory responses; these results are described on pp. 5-6 and are incorporated into Figures 1, 2 and Supplementary Fig. 2. 

      Overall, the data looks good and acceptable but I need to confirm the above-mentioned criticisms. 

      Recommendations for the authors: 

      Reviewer #1 (Recommendations for the authors):   

      The discussion section of the manuscript claims: "In this study, we utilized transcriptomics to demonstrate a 'TNF + PGE2' (TP) signature in RA and ICI-arthritis IL-1β+ synovial macrophages." This statement is misleading, as no new transcriptomic data from RA synovial samples were generated in this study. To support such a claim, the authors would need to compare primary monocytes or macrophages from RA patients using bulk RNA-seq or singlecell RNA-seq. Based on the current data, the comparison is limited to bulk RNA-seq findings from the authors' in vitro model and prior monocyte-fibroblast coculture studies. 

      We have modified the abstract and discussion (pg. 10) to reflect that we have compared an in vitro generated TP signature with gene expression in previously identified RA macrophage subsets.

    1. eLife Assessment

      The authors study the context of the skeletal remains of three individuals and associated sediment samples to conclude that the hominin species Homo naledi intentionally buried their dead. Demonstration of the earliest known instance of intentional funerary practice with a relatively small-brained hominin engaging in a highly complex behavior that has otherwise been observed from Homo sapiens and Homo neanderthalensis would represent a landmark finding. The authors have revised their manuscript extensively in light of the reviews of their initial submission, with improved illustration, context, discussion, and theoretical frameworks, leading to an improved case supporting their conclusion that Homo naledi intentionally buried their dead. One of the reviewers concludes that the findings convincingly demonstrate intentional burial practices, while another considers evidence for such an unambiguous conclusion to be incomplete given a lack of definitive knowledge around how the hominins got into the chamber. We look forward to seeing the continued development and assessment of this hypothesis. It is worth noting that the detailed reviews (both rounds) and comprehensive author response are commendable and consequential parts of the scientific record of this study. The editors note that the authors' response repeatedly invokes precedent from previous publications to help justify the conclusions in this paper. While doing so is helpful, the editors also note that scientific norms and knowledge are constantly evolving, and that any study has to rest on its own scientific merit.

    2. Reviewer #1 (Public review):

      Thank you for allowing me to review the paper "Evidence for deliberate burial of the dead by Homo naledi". This remains a very important site for paleoanthropology. I appreciate the work that the crew, especially the junior members of the team, put into this massive project. I appreciate that the authors did revise the paper since that is not a requirement of eLife. Extensive reviews by peer-reviewers have been provided for this paper, as well as professionally published replies (Martinón-Torres et al., 2023; Foecke et al., 2023). The composition, and citations of this version are much improved, though important information, some requested by reviewers, are buried in the supplementary section. It seems important that the authors make these sections more easily accessible to the general reader. The length of the paper is also unnecessary and impedes the readability of the work. Concise clarity is an expectation of most journals. The Netflix documentary was made to appeal to a mass audience, I would hope that the goal of the accompanying publication would be to enable readers to fully comprehend the work behind the claims.

      This version of the paper considers at great length many possibilities for how the H. naledi skeletal material came to rest in the cave system with some additional figures and data provided. However, quite a lot is still unclear. In my original review I stated, "The authors have repeatedly described how incredibly challenging it is to get into and out of this cave system and all of its chambers." This was a point emphasized in the Netflix documentary. In this version of the paper the authors have included within the supplementary section a brief discussion of other entrances. The work by Robbins et al. 2021 (a peer-reviewed paper in the impact factor rated journal Chemical Geology) is extremely relevant here. In this revision it is noted in the supplementary section that if the Postbox chamber was used as an opening, it would have reduced the length of the access to the system by 80 m. This fact seems important. This section should be moved out of the supplementary material and expanded because the conclusions published by Robbins et al. (2021) indicate a completely different route by which H. naledi accessed the cave, but this is hardly mentioned in the revision and deserves attention. To quote the Robbins et al.'s (2021) discussion section 6.3:

      "We acknowledge that additional data is required in order to confidently assess the relative timing of the Dragon's Back collapse and entry of H. naledi. Nonetheless, the stratigraphic and geochronologic observations presented here, together with those previously published (Dirks et al., 2017) are consistent with the following scenario. Prior to the collapse of the Dragon's Back, sometime before 241 ka (new minimum age for H. naledi from RS68), the cave could be entered by H. naledi via a shaft in the roof of the Postbox Chamber. From there H. naledi could walk along a straight passage that follows a gently descending, SW trending fracture into the Dragon's Back Chamber and, with the Dragon's Back block still attached to the roof, would have only needed to climb over a ~5 m high sill to access the Dinaledi Subsystem behind it. This sill and narrow fracture system behind the Dragon's Back block would have been a major impediment to any flood waters and most other fauna into the Dinaledi Subsystem, but it would have been a more accessible route than that today."

      The paper's conclusion continues, "The new dates further constrain the minimum age of H. naledi to 241 ka. Thus, H. naledi entered the subsystem between 241 ka and 335 ka, during a glacial period, when clastic sediment along the access route into the Dinaledi Subsystem experienced erosion. H. naledi would have probably entered the cave in the same way as the clastic sediments did, through an opening in the roof of the Postbox Chamber and may have entered via the Dragon's Back Chamber by climbing a 5 m high sill and passing below the Dragon's Back Block that was then still attached to the roof, to enter the Dinaledi Subsystem. In this context it is important to emphasize that it was not the Dragon's Back Block that prevented high-energy transport of coarse siliciclastic sediment from the Dragon's Back Chamber into the Dinaledi Subsystem, but rather the in situ floor block in the back wall of the Dragon's Back Chamber, against which the Dragon's Back Block slumped after it fell." This conclusion is very different from the complex pathway suggested by Berger et al. Martinón-Torres et al., 2023 also requested elaboration on this point in their reply by stating, "Moreover, recent studies by the Rising Star Cave team also point to a possible different and easier accesses for H. naledi into the fossil-bearing cave chambers than the current restricted access chute used by the research team, making clear that the degree of accessibility remains an open question (Robbins et al., 2021). Based on extensive dating studies of speleothem, this research (Robbins et al., 2021) implies that prior to 241 ka and the collapse of the Dragon's Back block hominins and other species could have more easily entered the cave via the Post Box Chamber and beneath the Dragon's Back Block before it fell. This gives access to a series of rifts that allow easier entry to the Dinaledi and other chambers beyond the present-day chute."

      Because this paper introduces very different sets of possibilities, it seems impossible to derive an understanding of the processes that occurred 335-241 ka throughout the cave system without going into detail on these other openings, especially openings that are hypothesized to have been used by the hominins in question.

      The world cares deeply about the H. naledi hominins and their story. I hope that in the coming years these issues are addressed, and perhaps other independent teams are allowed to do a full analysis since science is about replication. In any case, the excavation team has contributed important fossils to paleoanthropology.

      Literature cited:

      • Foecke, Kimberly K., Queffelec, Alain, & Pickering, Robyn. (2023). No Sedimentological Evidence for Deliberate Burial by Homo naledi - A Case Study Highlighting the Need for Best Practices in Geochemical Studies Within Archaeology and Paleoanthropology. PaleoAnthropology, 2024.

      • Martinón-Torres, M., Garate, D., Herries, A. I. R., & Petraglia, M. D. (2023). No scientific evidence that Homo naledi buried their dead and produced rock art. Journal of Human Evolution, 103464. https://doi.org/10.1016/j.jhevol.2023.103464

      • Robbins, J. L., Dirks, P. H. G. M., Roberts, E. M., Kramers, J. D., Makhubela, T. V., HilbertWolf, H. L., Elliott, M., Wiersma, J. P., Placzek, C. J., Evans, M., & Berger, L. R. (2021). Providing context to the Homo naledi fossils: Constraints from flowstones on the age of sediment deposits in Rising Star Cave, South Africa. Chemical Geology, 567, 120108. https://doi.org/10.1016/j.chemgeo.2021.120108

    3. Reviewer #2 (Public review):

      Before providing my review of the revised version of this study by Berger et al., which explores potential deliberate burials of Homo naledi within the Rising Star Cave System, I would like to briefly summarize the key points from my previous review of the earlier version (in 2023). Summarizing my previous review will provide context for assessing how effectively the revised study addresses the concerns I raised previously (in 2023).

      In my earlier comments, I highlighted significant methodological and analytical shortcomings that, in my view, undermined the authors' claim of intentional burials by Homo naledi. While the study presented detailed geological and fossil data, I found the evidence for intentional burials unconvincing due to insufficient application of archaeothanatological principles and other methodological gaps.

      My key concerns included:

      (1) The absence of a comprehensive archaeothanatological analysis, particularly with respect to taphonomic changes, bone articulations, and displacement patterns such as the collapse of sediments and bone remains into voids created by decomposition.

      (2) Missing or unclear illustrations of bone arrangements, which are critical for interpreting burial positions and processes.

      (3) A lack of detailed discussion on the sequence of decomposition, joint disarticulation, sediment infill, and secondary bone displacement.

      To convincingly support claims of deliberate burial, I argued that the study must reconstruct the timeline and processes surrounding death and deposition while clearly distinguishing natural taphonomic changes from intentional human actions. I emphasized the importance of integrating established archaeothanatological frameworks, such as those outlined by Duday et al. or Boulestin et al., to provide the necessary analytical rigor.

      I will now explain how the revised version of this study has successfully addressed all the concerns raised in my previous review and why I now think that the authors provide sufficient evidence for the presence of "repeated and patterned" deliberate burials (referred to as "cultural burials" by the authors) by Homo naledi within the Rising Star Cave System.

      In their revised manuscript, the authors have implemented substantial improvements in methodology, analytical depth, and overall presentation, which have effectively resolved the critical issues I previously highlighted. These revisions greatly strengthen their argument for intentional funerary practices. Importantly, the authors remain cautious in their interpretation of the evidence, explicitly refraining from inferring "symbolic" behavior or complex cognitive motivations behind these burials. Instead, they focus on presenting clear evidence for deliberate, patterned practices while leaving the broader implications for Homo naledi's cultural and cognitive capacities open for further investigation. This cautious approach adds to the credibility of their conclusions and avoids overextending the interpretation of the data.

      The authors' enhanced application of archaeothanatological principles now offers a more comprehensive and convincing interpretation of the burial features. Key gaps in the earlier version, such as the absence of detailed reconstructions of taphonomic processes, bone articulations, and displacement patterns, have been addressed with thorough analyses and clearer illustrations. The study also now includes a well-structured timeline of events surrounding death and deposition, demonstrating an improved ability to differentiate between natural processes and deliberate human actions. These additions lend greater clarity and rigor to the evidence, making the argument for intentional burials both robust and persuasive.

      Furthermore, the revised study presents detailed data on skeletal arrangements, decomposition sequences, and spatial patterns. This information is now relatively well illustrated and contextualized, enabling readers to better understand the complex processes involved in these burial practices. Importantly, the authors provide a stronger theoretical framework, integrating established archaeothanatological methodologies and taphonomic studies that situate their findings within broader archaeological and anthropological discussions of funerary behavior.

      That being said, there remain relatively minor issues that could be refined further. Addressing these would help ensure the study is as clear and accessible as possible to the reader. Such adjustments would enhance the overall readability and reinforce the study's impact within the scientific community.

      A - Suggested changes:

      While the revised version of this study marks a significant improvement, successfully addresses my previous major concerns and provides a convincing argument for deliberate burials by Homo naledi, I believe that including both one summary table + one summary figure for each of the three main locations and the-Hill Antechamber, and Dinaledi Chamber (Feature 1 and Puzzle Box)-would further enhance the clarity and accessibility of the findings. Such tables and figures would serve as a valuable reference, allowing readers to more easily follow how the detailed patterns observed at each site fit the criteria for distinguishing intentional from natural processes.

      The summary tables should consolidate key information for each location, such as:

      (1) Bone articulations: A comprehensive list of articulated skeletal elements, categorized by their anatomical relationships (e.g., labile vs. stable articulations).

      (2) Displacement patterns: Documentation of any spatial shifts in bone positions, noting directions and extents of disarticulation.

      (3) Sequence of decomposition: Observations regarding the sequence of decomposition, joint disarticulation and associated changes in bone arrangements.

      (4) Sediment interaction: Notes on sediment infill and its timing relative to decomposition, including evidence of secondary voids or delayed sediment deposition.

      (5) Distinguishing criteria: Clear indications of how each observed pattern supports intentional burial (e.g., structured placement, lack of natural transport mechanisms) versus natural processes (e.g., random dispersal, sediment-driven bone displacement).<br /> Including such tables would not only summarize the complex taphonomic and archaeothanatological data but also allow readers to quickly assess how the evidence supports the authors' conclusions. This approach would bridge the gap between the detailed narrative descriptions and the criteria necessary to differentiate deliberate funerary practices from natural occurrences.

      To streamline the main text further, many of the detailed descriptions of individual bones, specific displacement measurements, and other intricate observations could be moved to the supplementary data. This reorganization would maintain the richness of the data for those who wish to explore it in depth, while the summary tables would present the key findings concisely in the main text. This balance between accessibility and detail would ensure that the study appeals to both specialists requiring comprehensive data and readers looking for an overarching understanding of the findings.

      In addition to these structural changes, it is crucial to ensure that evidence is consistently illustrated throughout the text.

      Importantly the skeletal part representation is provided for Dinaledi Feature 1 in Figure 14, but similar data is not presented for the other burial features, such as those in the Hill Antechamber or Puzzle Box. This inconsistency could make it more challenging for readers to compare the features and fully appreciate the patterns of burial behavior across the different locations. Ensuring that similar types of evidence and analyses are presented uniformly for all features would strengthen the study and make its conclusions more cohesive and compelling.

      Adding supplementary figures to represent the skeletal part distribution (as in Figure 14) within each excavated area (i.e., not only for Dinaledi Feature 1 but also for Hill Antechamber and Puzzle Box) would significantly enhance the study's clarity and accessibility. These figures could provide a visual summary of skeletal part representation, allowing readers to easily understand the nature of human remains within each burial context.

      Specifically, such figures could:

      (1) Illustrate Skeletal Part Representation: By visually mapping the presence and location of various skeletal elements, the figures would make it easier for readers to assess the completeness and arrangement of remains in each feature. This is particularly important for interpreting patterns of bone articulation and disarticulation.<br /> For example, it is quite challenging to determine the exact number and characteristics of the human skeletal remains identified within the Puzzle Box and those recovered through the "subsurface collection" in its surrounding area. The authors state that "at least six individuals" were identified in this area (during "subsurface collection") but provide no further clarification. They simply mention that "most elements" were described previously, without specifying which elements or where this prior description can be found.

      (2) Highlight Articulations and Displacements: Figures could indicate which bones are articulated and their relative positions, as well as the spatial distribution of disarticulated elements. This would provide a clear visual context to support interpretations of taphonomic processes.

      (3) Facilitate Comparisons Across Locations: By presenting skeletal part representation consistently for each location, the figures would enable readers to directly compare features, reinforcing the argument for "repeated and patterned" behavior.

      (4) Simplify Complex Data: Instead of relying solely on textual descriptions, the visual format would allow readers to quickly grasp the key findings, making the study more accessible to a broader audience

      By including such figures alongside the proposed summary tables in the main text, the study would achieve a balance between detailed narrative descriptions and concise, visual representation of the data. This approach would strengthen the overall presentation and support the authors' conclusions effectively.

      Again, by presenting the data in a structured and comparative format, the new tables + figures could also highlight the differences and similarities between the three locations. This would reinforce the argument for "repeated and patterned" behavior, as the tables would make it easier to observe consistent burial practices across different contexts within the Rising Star Cave System.

      Adding these summary tables + figures, ensuring consistent presentation of evidence, and reallocating detailed descriptions to supplementary materials would not require significant new analysis. However, these organizational adjustments would greatly enhance the study's clarity, readability, and overall impact.

      B - A few additional changes are needed:

      Figure 8: This figure is critical but lacks clarity. Specifically:

      Panels 8a-c suffer from low contrast, making details difficult to discern.<br /> Panel 8d (sediment profile) is too small and lacks annotations that would aid interpretation.<br /> Figure S7: While this figure has significantly better contrast than Figures 8a-c, I am unable to identify the "articulated foot ... at right of frame," as mentioned in the caption. Please clarify this by adding annotations directly to the figure.

      Page 4, 2nd paragraph: In the sentence "Researchers thus have diverse opinions about how to test whether ...," the word "opinions" should be replaced with a more precise term, such as "approaches."

      C - In conclusion, I am impressed by the significant effort and meticulous work that has gone into this revised version of the study. The quality of the new evidence presented is commendable, and the findings now convincingly demonstrate not only clear evidence of intentional burial practices by Homo naledi but also compelling indications of post-depositional reworking. These advancements reflect a major improvement in the study's analytical rigor and the robustness of its conclusions, making it a valuable contribution to the understanding of early hominin funerary behavior.

    4. Author response:

      [The following is the authors’ response to the original reviews.]

      We extend our sincere thanks to the editor, referees for eLife, and other commentators who have written evaluations of this manuscript, either in whole or in part. Sources of these comments were highly varied, including within the bioRxiv preprint server, social media (including many comments received on X/Twitter and some YouTube presentations and interviews), comments made by colleagues to journalists, and also some reviews of the work published in other academic journals. Some of these are formal and referenced with citations. Others were informal but nonetheless expressed perspectives that helped enable us to revise the manuscript with the inclusion of broader perspectives than the formal review process. It is beyond the scope of this summary to list every one of these, which have often been brought to the attention of different coauthors, but we begin by acknowledging the very wide array of peer and public commentary that have contributed to this work. The reaction speaks to a broad interest in open discussion and review of preprints. 

      As we compiled this summary of changes to the manuscript, we recognized that many colleagues made comments about the process of preprint dissemination and evaluation rather than the data or analyses in the manuscript. Addressing such comments is outside the scope of this revised manuscript, but we do feel that a broader discussion of these comments would be valuable in another venue. Many commentators have expressed confusion about the eLife system of evaluation of preprints, which differs from the editorial acceptance or rejection practiced in most academic journals. As authors in many different nations, in varied fields, and in varied career stages, we ourselves are still working to understand how the academic publication landscape is changing, and how best to prepare work for new models of evaluation and dissemination. 

      The manuscript and coauthor list reflect an interdisciplinary collaboration. Analyses presented in the manuscript come from a wide range of scientific disciplines. These range from skeletal inventory, morphology, and description, spatial taphonomy, analysis of bone fracture patterns and bone surface modifications, sedimentology, geochemistry, and traditional survey and mapping. The manuscript additionally draws upon a large number of previous studies of the Rising Star cave system and the Dinaledi Subsystem, which have shaped our current work. No analysis within any one area of research stands alone within this body of work: all are interpreted in conjunction with the outcomes of other analyses and data from other areas of research. Any single analysis in isolation might be consistent with many different hypotheses for the formation of sediments and disposition of the skeletal remains. But testing a hypothesis requires considering all data in combination and not leaving out data that do not fit the hypothesis. We highlight this general principle at the outset because a number of the comments from referees and outside specialists have presented alternative hypotheses that may arguably be consistent with one kind of analysis that we have presented, while seeming to overlook other analyses, data, or previous work that exclude these alternatives. In our revision, we have expanded all sections describing results to consider not only the results of each analysis, but how the combination of data from different kinds of analysis relate to hypotheses for the deposition and subsequent history of the Homo naledi remains. We address some specific examples and how we have responded to these in our summary of changes below. 

      General organization:

      The referee and editor comments are mostly general and not line-by-line questions, and we have compiled them and treated them as a group in this summary of changes, except where specifically noted. 

      The editorial comments on the previous version included the suggestion that the manuscript should be reorganized to test “natural” (i.e. noncultural) hypotheses for the situations that we examine. The editorial comment suggested this as a “null hypothesis” testing approach. Some outside comments also viewed noncultural deposition as a null hypothesis to be rejected. We do not concur that noncultural processes should be construed as a null hypothesis, as we discuss further below. However, because of the clear editorial opinion we elected to revise the manuscript to make more explicit how the data and analyses test noncultural depositional hypotheses first, followed by testing of cultural hypotheses. This reorganization means that the revised manuscript now examines each hypothesis separately in turn. 

      Taking this approach resulted in a substantial reorganization of the “Results” section of the manuscript. The “Results” section now begins with summaries of analyses and data conducted on material from each excavation area. After the presentation of data and analyses from each area, we then present a separate section for each of several hypotheses for the disposition and sedimentary context of the remains. These hypotheses include deposition of bodies upon a talus (as hypothesized in some previous work), slow sedimentary burial on a cave floor or within a natural depression, rapid burial by gravity-driven slumping, and burial of naturally mummified remains. We then include sections to test the hypothesis of primary cultural burial and secondary cultural burial. This approach adds substantial length to the Results. While some elements may be repeated across sections, we do consider the new version to be easier to take piece by piece for a reader trying to understand how each hypothesis relates to the evidence. 

      The Results section includes analyses on several different excavation areas within the Dinaledi Subsystem. Each of these presents somewhat different patterns of data. We conceived of this manuscript combining these distinct areas because each of them provides information about the formation history of the Homo naledi-associated sediments and the deposition of the Homo naledi remains. Together they speak more strongly than separately. In the previous version of the manuscript, two areas of excavation were considered in detail (Dinaledi Feature 1 and the Hill Antechamber Feature), with a third area (the Puzzle Box area) included only in the Discussion and with reference to prior work. We now describe the new work undertaken after the 2013-2014 excavations in more detail. This includes an overview of areas in the Hill Antechamber and Dinaledi Chamber that have not yielded substantial H. naledi remains and that thereby help contextualize the spatial concentration of H. naledi skeletal material. The most substantial change in the data presented is a much expanded reanalysis of the Puzzle Box area. This reanalysis provides greater clarity on how previously published descriptions relate to the new evidence. The reanalysis also provides the data to integrate the detailed information on bone identification fragmentation, and spatial taphonomy from this area with the new excavation results from the other areas. 

      In addition to Results, the reorganization also affected the manuscript’s Introduction section. Where the previous version led directly from a brief review of Pleistocene burial into the description of the results, this revised manuscript now includes a review of previous studies of the Rising Star cave system. This review directly addresses referee comments that express some hesitation to accept previous results concerning the structure and formation of sediments, the accessibility of the Dinaledi Subsystem, the geochronological setting of the H. naledi remains, and the relation of the Dinaledi Subsystem to nearby cave areas. Some parts of this overview are further expanded in the Supplementary Information to enable readers to dive more deeply into the previous literature on the site formation and geological configuration of the Rising Star cave system without needing to digest the entirety of the cited sources. 

      The Discussion section of the revised manuscript is differentiated from Results and focuses on several areas where the evidence presented in this study may benefit from greater context. One new section addresses hypothesis testing and parsimony for Pleistocene burial evidence, which we address at greater length in this summary below. The majority of the Discussion concerns the criteria for recognizing evidence for burial as applied in other studies. In this research we employ a minimal definition but other researchers have applied varied criteria. We consider whether these other criteria have relevance in light of our observations and whether they are essential to the recognition of burial evidence more broadly. 

      Vocabulary:

      We introduce the term “cultural burial” in this revised manuscript to refer to the burial of dead bodies as a mortuary practice. “Burial” as an unmodified term may refer to the passive covering of remains by sedimentary processes. Use of the term “intentional burial” would raise the question of interpreting intent, which we do not presume based on the evidence presented in this research. The relevant question in this case is whether the process of burial reflects repeated behavior by a group. As we received input from various colleagues it became clear that burial itself is a highly loaded term. In particular there is a common assumption within the literature and among professionals that burial must by definition be symbolic. We do not take any position on that question in this manuscript, and it is our hope that the term “cultural burial” may focus the conversation around the extent that the behavioral evidence is repeated and patterned. 

      Sedimentology and geochemistry of Dinaledi Feature 1:

      Reviewer 4 provided detailed comments on the sedimentological and geochemical context that we report in the manuscript. One outside review (Foecke et al. 2024) included some of the points raised by reviewer 4, and additionally addressed the reporting of geochemical and sedimentological data in previous work that we cite. 

      To address these comments we have revised the sedimentary context and micromorphology of sediments associated with Dinaledi Feature 1. In the new text we demonstrate the lack of microstratigraphy (supported by grain size analysis) in the unlithified mud clast breccia (UMCB), while such a microstratigraphy is observed in the laminated orange-red mudstones (LORM) that contribute clasts to the UMCB. Thus, we emphasize the presence and importance of a laterally continuous layer of LORM nature occurring at a level that appears to be the maximum depth of fossil occurrence. This layer is severely broken under extensive accumulation of fossils such as Feature 1 and only evidenced by abundant LORM clasts within and around the fossils. 

      We have completely reworked the geochemical context associated with Feature 1 following the comments of reviewer 4. We described the variations and trends observed in the major oxides separate from trace and rare-earth elements. We used Harker variations plots to assess relationships between these element groups with CaO and Zn, followed by principal component analysis of all elements analyzed. The new geochemical analysis clearly shows that Feature 1 is associated with localized trace element signatures that exist in the sediments only in association with the fossil bones, which suggests lack of postdepositional mobilization of the fossils and sediments. We additionally have included a fuller description of XRF methods. 

      To clarify the relation of all results to the features described in this study, we removed the geochemical and sedimentological samples from other sites within the Dinaledi Subsystem. These localities within the fissure network represent only surface collection of sediment, as no excavation results are available from those sites to allow for comparison in the context of assessing evidence of burial. These were initially included for comparison, but have now been removed to avoid confusion.  

      Micromorphology of sediments:

      Some referees (1, 3, and 4) and other commentators (including Martinón-Torres et al. 2024) have suggested that the previous manuscript was deficient due to an insufficient inclusion of micromorphological analysis of sediments. Because these commentators have emphasized this kind of evidence as particularly important, we review here what we have included and how our revision has addressed this comment. Previous work in the Dinaledi Chamber (Dirks et al., 2015; 2017) included thin section illustrations and analysis of sediment facies, including sediments in direct association with H. naledi remains within the Puzzle Box area. The previous work by Wiersma and coworkers (2020) used micromorphological analysis as one of several approaches to test the formation history of Unit 3 sediments in the Dinaledi Subsystem, leading to the interpretation of autobrecciation of earlier Unit 1 sediment. In the previous version of this manuscript we provided citations to this earlier work. The previous manuscript also provided new thin section illustrations of Unit 3 sediment near Dinaledi Feature 1 to place the disrupted layer of orange sediment (now designated the laminated orange silty mudstone unit) into context. 

      In the new revised manuscript we have added to this information in three ways. First, as noted above in response to reviewer 4, we have revised and added to our discussion of micromorphology within and adjacent to the Dinaledi Feature 1. Second, we have included more discussion in the Supplementary Information of previous descriptions of sediment facies and associated thin section analysis, with illustrations from prior work (CC-BY licensed) brought into this paper as supplementary figures, so that readers can examine these without following the citations. Third, we have included Figure 10 in the manuscript which includes six panels with microtomographic sections from the Hill Antechamber Feature. This figure illustrates the consistency of sub-unit 3b sediment in direct contact with H. naledi skeletal material, including anatomically associated skeletal elements, with previous analyses that demonstrate the angular outlines and chaotic orientations of LORM clasts. It also shows density contrasts of sediment in immediate contact with some skeletal elements, the loose texture of this sediment with air-filled voids, and apparent invertebrate burrowing activity. To our knowledge this is the first application of microtomography to sediment structure in association with a Pleistocene burial feature. 

      To forestall possible comments that the revised manuscript does not sufficiently employ micromorphological observations, or that any one particular approach to micromorphology is the standard, we present here some context from related studies of evidence from other research groups working at varied sites in Africa, Europe, and Asia. Hodgkins et al. (2021) noted: “Only a handful of micromorphological studies have been conducted on human burials and even fewer have been conducted on suspected burials from Paleolithic or hunter-gatherer contexts.” In that study, one supplementary figure with four photomicrographs of thin sections of sediments was presented. Interpretation of the evidence for a burial pit by Hodgkins et al. (2021) noted the more open microstructure of sediment but otherwise did not rely upon the thin section data in characterizing the sediments associated with grave fill. Martinón-Torres et al. (2021) included one Extended Data figure illustrating thin sections of sediments and bone, with two panels showing sediments (the remainder showing bone histology). The micromorphological analysis presented in the supplementary information of that paper was restricted to description of two microfacies associated with the proposed “pit” in that study. That study did carry out microCT scanning of the partially-prepared skeletal remains but did not report any sediment analysis from the microtomographic results. Maloney et al. (2022) reported no micromorphological or thin section analysis. Pomeroy et al. (2020a) included one illustration of a thin section; this study may be regarded as a preliminary account rather than a full description of the work undertaken. Goldberg et al. (2017) analyzed the geoarchaeology of the Roc de Marsal deposits in which possible burial-associated sediments had been fully excavated in the 1960s, providing new morphological assessments of sediment facies; the supplementary information to this work included five scans (not microscans) of sediment thin sections and no microphotographs. Fewlass et al. (2023) presented no thin section or micromorphological illustrations or methods. In summary of this research, we note that in one case micromorphological study provided observations that contributed to the evidence for a pit, in other cases micromorphological data did not test this hypothesis, and many researchers do not apply micromorphological techniques in their particular contexts. 

      Sediment micromorphology is a growing area of research and may have much to provide to the understanding of ancient burial evidence as its standards continue to develop (Pomeroy et al. 2020b). In particular microtomographic analysis of sediments, as we have initiated in this study, may open new horizons that are not possible with more destructive thin-section preparation. In this manuscript, the thin section data reveals valuable evidence about the disruption of sediment structure by features within the Dinaledi Chamber, and microtomographic analysis further documents that the Hill Antechamber Feature reflects similar processes, in addition to possible post-burial diagenesis and invertebrate activity. Following up in detail on these processes will require further analysis outside the scope of this manuscript. 

      Access into the Dinaledi Subsystem:

      Reviewer 1 emphasizes the difficulty of access into the Dinaledi Subsystem as a reason why the burial hypothesis is not parsimonious. Similar comments have been made by several outside commentators who question whether past accessibility into the Dinaledi Subsystem may at one time have been substantially different from the situation documented in previous work. Several pieces of evidence are relevant to these questions and we have included some discussion of them in the Introduction, and additionally include a section in the Supplementary Information (“Entrances to the cave system”) to provide additional context for these questions. Homo naledi remains are found not only within the Dinaledi Subsystem but also in other parts of the cave system including the Lesedi Chamber, which is similarly difficult for non-expert cavers to access. The body plan, mass, and specific morphology of H. naledi suggest that this species would be vastly more suited to moving and climbing within narrow underground passages than living people. On this basis it is not unparsimonious to suggest that the evidence resulted from H. naledi activity within these spaces. We note that the accessibility of the subsystem is not strictly relevant to the hypothesis of cultural burial, although the location of the remains does inform the overall context which may reflect a selection of a location perceived as special in some way. 

      Stuffing bodies down the entry to the subsystem:

      Reviewer 3 suggests that one explanation for the emplacement of articulated remains at the top of the sloping floor of the Hill Antechamber is that bodies were “stuffed” into the chute that comprises the entry point of the subsystem and passively buried by additional accumulation of remains. This was one hypothesis presented in earlier work (Dirks et al. 2015) and considered there as a minimal explanation because it did not entail the entry of H. naledi individuals into the subsystem. The further exploration (Elliott et al. 2021) and ongoing survey work, as well as this manuscript, all have resulted in data that rejects this hypothesis. The revised manuscript includes a section in the results “Deposition upon a talus with passive burial” that examines this hypothesis in light of the data. 

      Recognition of pits:

      Referee 3 and 4 and several additional commentators have emphasized that the recognition of pit features is necessary to the hypothesis of burial, and questioned whether the data presented in the manuscript were sufficient to demonstrate that pits were present. We have revised the manuscript in several ways to clarify how all the different kinds of evidence from the subsystem test the hypothesis that pits were present. This includes the presentation of a minimal definition of burial to include a pit dug by hominins, criteria for recognizing that a pit was present, and an evaluation of the evidence in each case to make clear how the evidence relates to the presence of a pit and subsequent infill. As referee 3 notes, it can be challenging to recognize a pit when sediment is relatively homogeneous. This point was emphasized in the review by Pomeroy and coworkers (2020b), who reflected on the difficulty seeing evidence for shallow pits constructed by hominins, and we have cited this in the main text. As a result, the evidence for pits has been a recurrent topic of debate for most Pleistocene burial sites. However in addition to the sedimentological and contextual evidence in the cases we describe, the current version also reflects upon other possible mechanisms for the accumulation of bones or bodies. The data show that the sedimentary fill associated with the H. naledi remains in the cases we examine could not have passively accumulated slowly and is not indicative of mass movement by slumping or other high-energy flow. To further put these results into context, we added a section to the Discussion that briefly reviews prior work on distinguishing pits in Pleistocene burial contexts, including the substantial number of sites with accepted burial evidence for which no evidence of a pit is present. 

      Extent of articulation and anatomical association:

      We have added significantly greater detail to the descriptions of articulated remains and orientation of remains in order to describe more specifically the configuration of the skeletal material. We also provide 14 figures in main text (13 of them new) to illustrate the configuration of skeletal remains in our data. For the Puzzle Box area, this now includes substantial evidence on the individuation of skeletal fragments, which enables us to illustrate the spatial configuration of remains associated with the DH7 partial skeleton, as well as the spatial position of fragments refitted as part of the DH1, DH2, DH3, and DH4 crania. For Dinaledi Feature 1 and the Hill Antechamber Feature we now provide figures that key skeletal parts as identified, including material that is unexcavated where possible, and a skeletal part representation figure for elements excavated from Dinaledi Feature 1. 

      Archaeothanatology:

      Reviewer 2 suggests that a greater focus on the archaeothanatology literature would be helpful to the analysis, with specific reference to the sequence of joint disarticulation, the collapse of sediment and remains into voids created by decomposition, and associated fragmentation of the remains. In the revised manuscript we have provided additional analysis of the Hill Antechamber Feature with this approach in mind. This includes greater detail and illustration of our current hypothesis for individuation of elements. We now discuss a hypothesis of body disposition, describe the persistent joints and articulation of elements, and examine likely decomposition scenarios associated with these remains. Additionally, we expand our description and illustration of the orientation of remains and degree of anatomical association and articulation within Dinaledi Feature 1. For this feature and for the Hill Antechamber Feature we have revised the text to describe how fracturing and crushing patterns are consistent with downward pressure from overlying sediment and material. In these features, postdepositional fracturing occurred subsequent to the decomposition of soft tissue and partial loss of organic integrity of the bone. We also indicate that the loss by postdepositional processes of most long bone epiphyses, vertebral bodies, and other portions of the skeleton less rich in cortical bone, poses a challenge for testing the anatomical associations of the remaining elements. This is a primary reason why we have taken a conservative approach to identification of elements and possible associations. 

      A further aspect of the site revealed by our analysis is the selective reworking of sediments within the Puzzle Box area subsequent to the primary deposition of some bodies. The skeletal evidence from this area includes body parts with elements in anatomical association or articulation, juxtaposed closely with bone fragments at varied pitch and orientation. This complexity of events evidenced within this area is a challenge for approaches that have been developed primarily based on comparative data from single-burial situations. In these discussions we deepen our use of references as suggested by the referee.   

      Burial positions:

      Reviewer 2 further suggests that illustrations of hypothesized burial positions would be valuable. We recognize that a hypothesized burial position may be an appealing illustration, and that some recent studies have created such illustrations in the context of their scientific articles. However such illustrations generally include a great deal of speculation and artist imagination, and tend to have an emotive character. We have added more discussion to the manuscript of possible primary disposition in the case of the Hill Antechamber Feature as discussed above. We have not created new illustrations of hypothesized burial positions for this revision. 

      Carnivore involvement:

      Referee 1 suggests that the manuscript should provide further consideration of whether carnivore activity may have introduced bones or bodies into the cave system. The reorganized Introduction now includes a review of previous work, and an expanded discussion within the Supplementary Information (“Hypotheses tested in previous work”). This includes a review of literature on the topic of carnivore accumulation and the evidence from the Dinaledi and Lesedi Chamber that rejects this hypothesis. 

      Water transport and mud:

      The eLife referees broadly accepted previous work showing that water inundation or mass flow of water-saturated sediment did not occur within the history of Unit 2 and 3 sediments, including those associated with H. naledi remains. However several outside commentators did refer specifically to water flow or mud flow as a mechanism for slumping of deposits and possible sedimentary covering of the remains. To address these comments we have added a section to the

      Supplementary Information (“Description of the sedimentary deposits of the Dinaledi Subsystem”) that reviews previous work on the sedimentary units and formation processes documented in this area. We also include a subsection specifically discussing the term “mud” as used in the description of the sedimentology within the system, as this term has clearly been confusing for nonspecialists who have read and commented on the work. We appreciate the referees’ attention to the previous work and its terminology.  

      Redescription of areas of the cave system:

      Reviewer 1 suggests that a detailed reanalysis of all portions of the cave system in and around the Dinaledi Subsystem is warranted to reject the hypothesis that bodies entered the space passively and were scattered from the floor by natural (i.e. noncultural) processes. The referee suggests that National Geographic could help us with these efforts. To address this comment we have made several changes to the manuscript. As noted above, we have added material in Supplementary Information to review the geochronology of the Dinaledi Subsystem and nearby Dragon’s Back Chamber, together with a discussion of the connections between these spaces. 

      Most directly in response to this comment we provide additional documentation of the possibility of movement of bodies or body parts by gravity within the subsystem itself. This includes detailed floor maps based on photogrammetry and LIDAR measurement, where these are physically possible, presented in Figures 2 and 3. In some parts of the subsystem the necessary equipment cannot be used due to the extremely confined spaces, and for these areas our maps are based on traditional survey methods. In addition to plan maps we have included a figure showing the elevation of the subsystem floor in a cross-section that includes key excavation areas, showing their relative elevation. All figures that illustrate excavation areas are now keyed to their location with reference to a subsystem plan. These data have been provided in previous publications but the visualization in the revised manuscript should make the relationship of areas clear for readers. The Introduction now includes text that discusses the configuration of the Hill Antechamber, Dinaledi Chamber, and nearby areas, and also discusses the instances in which gravity-driven movement may be possible, at the same time reviewing that gravity-driven movement from the entry point of the subsystem to most of the localities with hominin skeletal remains is not possible. 

      Within the Results, we have added a section on the relationship of features to their surroundings in order to assist readers in understanding the context of these bone-bearing areas and the evidence this context brings to the hypothesis in question. We have also included within this new section a discussion of the discrete nature of these features, a question that has been raised by outside commentators. 

      Passive sedimentation upon a cave floor or within a natural depression:

      Reviewer 3 suggests that the situation in the Dinaledi Subsystem may be similar to a European cave where a cave bear skeleton might remain articulated on a cave floor (or we can add, within a hollow for hibernation), later to be covered in sediment. The reviewer suggests that articulation is therefore no evidence of burial, and suggests that further documentation of disarticulation processes is essential to demonstrating the processes that buried the remains. We concur that articulation by itself is not sufficient evidence of cultural burial. To address this comment we have included a section in the Results that tests the hypothesis that bodies were exposed upon the cave floor or within a natural depression. To a considerable degree, additional data about disarticulation processes subsequent to deposition are provided in our reanalysis of the Puzzle Box area, including evidence for selective reworking of material after burial. 

      Postdepositional movement and floor drains:

      Reviewer 3 notes that previous work has suggested that subsurface floor drains may have caused some postdepositional movement of skeletal remains. The hypothesis of postdepositional slumping or downslope movement has also been discussed by some external commentators (including Martinón-Torres et al. 2024). We have addressed this question in several places within the revised manuscript. As we now review, previous discussion of floor drains attempted to explain the subvertical orientation of many skeletal elements excavated from the Puzzle Box area. The arrangement of these bones reflects reworking as described in our previous work, and without considering the possibility of reworking by hominins, one mechanism that conceivably might cause reworking was downward movement of sediments into subsurface drains. Further exploration and mapping, combined with additional excavation into the sediments beneath the Puzzle Box area provided more information relevant to this hypothesis. In particular this evidence shows that subsurface drains cannot explain the arrangement of skeletal material observed within the Puzzle Box area. As now discussed in the text, the reworking is selective and initiated from above rather than below. This is best explained by hominin activity subsequent to burial. 

      In a new section of the Results we discuss slumping as a hypothesis for the deposition of the remains. This includes discussion of downslope movement within the Hill Antechamber and the idea that floor drains may have been a mechanism for sediment reworking in and around the Puzzle Box area and Dinaledi Feature 1. As described in this section the evidence does not support these hypotheses. 

      Hypothesis testing and parsimony:

      Referees 1 and 3 and the editorial guidance all suggested that a more appropriate presentation would adopt a null hypothesis and test it. The specific suggestion that the null hypothesis should be a natural sedimentary process of deposition was provided not only by these reviewers but also by some outside commentators. To address this comment, we have edited the manuscript in two ways. The first is the addition of a section to the Discussion that specifically discusses hypothesis testing and parsimony as related to Pleistocene evidence of cultural burial. This includes a brief synopsis of recent disciplinary conversations and citation of work by other groups of authors, none of whom adopted this “null hypothesis” approach in their published work. 

      As we now describe in the manuscript, previous work on the Dinaledi evidence never assumed any role for H. naledi in the burial of remains. Reading the reviewer reports caused us to realize that this previous work had followed exactly the “null hypothesis” approach that some suggested we follow. By following this null hypothesis approach, we neglected a valuable avenue of investigation. In retrospect, we see how this approach impeded us from understanding the pattern of evidence within the Puzzle Box area. Thus in the revised manuscript we have mentioned this history within the Discussion and also presented more of the background to our previous work in the Introduction. Hopefully by including this discussion of these issues, the manuscript will broaden conversation about the relation of parsimony to these issues. 

      Language and presentation style:

      Reviewer 4 criticizes our presentation, suggesting that the text “gives the impression that a hypothesis was formulated before data were collected.” Other outside commentators have mentioned this notion also, including Martinón-Torres et al. (2024) who suggest that the study began from a preferred hypothesis and gathered data to support it. The accurate communication of results and hypotheses in a scientific article is a broader issue than this one study. Preferences about presentation style vary across fields of study as well as across languages. We do not regret using plain language where possible. In any study that combines data and methods from different scientific disciplines, the use of plain language is particularly important to avoid misunderstandings where terms may mean different things in different fields. 

      The essential question raised by these comments is whether it is appropriate to present the results of a study in terms of the hypothesis that is best supported. As noted above, we read carefully many recent studies of Pleistocene burial evidence. We note that in each of these studies that concluded that burial is the best hypothesis, the authors framed their results in the same way as our previous manuscript: an introduction that briefly reviews background evidence for treatment of the dead, a presentation of results focused on how each analysis supports the hypothesis of burial for the case, and then in some (but not all) cases discussion of why some alternative hypotheses could be rejected. We do not infer from this that these other studies started from a presupposition and collected data only to confirm it. Rather, this is a simple matter of presentation style. 

      The alternative to this approach is to present an exhaustive list of possible hypotheses and to describe how the data relate to each of them, at the end selecting the best. This is the approach that we have followed in the revised manuscript, as described above under the direction of the reviewer and editorial guidance. This approach has the advantage of bringing together evidence in different combinations to show how each data point rejects some hypotheses while supporting others. It has the disadvantage of length and repetition. 

      Possible artifact:

      We have chosen to keep the description of the possible artifact associated with the Hill Antechamber Feature in the Supplementary Information. We do this while acknowledging that this is against the opinion of reviewer 4, who felt the description should be removed unless the object in question is fully excavated and physically analyzed. The previous version of the manuscript did not rely upon the stone as positive evidence of grave goods or symbolic content, and it noted that the data do not test whether the possible artifact was placed or was intentionally modified. However this did not satisfy reviewer 4, and some outside commentators likewise asserted that the object must be a “geofact” and that it should be removed. 

      We have three arguments against this line of thinking. First, we do not omit data from our reporting. Whether Homo naledi shaped the rock or not, used it as a tool or not, whether the rock was placed with the body or not, it is unquestionably there. Omitting this one object from the report would be simply dishonest. Second, the data on this rock are at 16 micron resolution. While physical inspection of its surface may eventually reveal trace evidence and will enable better characterization of the raw material, no mode of surface scanning will produce better evidence about the object’s shape. Third, the position of this possible artifact within the feature provides significant information about the deposition of the skeletal material and associated sediments. The pitch, orientation, and position of the stone is not consistent with slow deposition but are consistent with the hypothesis that the surrounding sediment was rapidly emplaced at the same time as the articulated elements less than 2 cm away. 

      In the current version, we have redoubled our efforts to provide information about the position and shape of this stone while not presupposing the intentionality of its shape or placement. We add here that the attitude expressed by referee 4 and other commentators, if followed at other sites, would certainly lead to the loss or underreporting of evidence, which we are trying to avoid.  

      Consistency versus variability of behavior:

      As described in the revised manuscript, different features within the Dinaledi Subsystem exhibit some shared characteristics. At the same time, they vary in positioning, representation of individuals and extent of commingling. Other localities within the subsystem and broader cave system present different evidence. Some commentators have questioned whether the patterning is consistent with a single common explanation, or whether multiple explanations are necessary. To address this line of questioning, we have added several elements to the manuscript. We created a new section on secondary cultural burial, discussing whether any of the situations may reflect this practice. In the Discussion, we briefly review the ways in which the different features support the involvement of H. naledi without interpreting anything about the intentionality or meaning of the behavior. We further added a section to the Discussion to consider whether variation among the features reflects variation in mortuary practices by H. naledi. One aspect of this section briefly cites variation in the location and treatment of skeletal remains at other sites with evidence of burial. 

      Grave goods:

      Some commentators have argued that grave goods are a necessary criterion for recognizing evidence of ancient burial. We added a section to the Discussion to review evidence of grave goods at other Pleistocene sites where burial is accepted. 

      References:

      • Dirks, P. H., Berger, L. R., Roberts, E. M., Kramers, J. D., Hawks, J., Randolph-Quinney, P. S., Elliott, M., Musiba, C. M., Churchill, S. E., de Ruiter, D. J., Schmid, P., Backwell, L. R., Belyanin, G. A., Boshoff, P., Hunter, K. L., Feuerriegel, E. M., Gurtov, A., Harrison, J. du G., Hunter, R., … Tucker, S. (2015). Geological and taphonomic context for the new hominin species Homo naledi from the Dinaledi Chamber, South Africa. eLife, 4, e09561. https://doi.org/10.7554/eLife.09561

      • Dirks, P. H., Roberts, E. M., Hilbert-Wolf, H., Kramers, J. D., Hawks, J., Dosseto, A., Duval, M., Elliott, M., Evans, M., Grün, R., Hellstrom, J., Herries, A. I., Joannes-Boyau, R., Makhubela, T. V., Placzek, C. J., Robbins, J., Spandler, C., Wiersma, J., Woodhead, J., & Berger, L. R. (2017). The age of Homo naledi and associated sediments in the Rising Star Cave, South Africa. eLife, 6, e24231. https://doi.org/10.7554/eLife.24231

      • Elliott, M., Makhubela, T., Brophy, J., Churchill, S., Peixotto, B., FEUERRIEGEL, E., Morris, H., Van Rooyen, D., Ramalepa, M., Tsikoane, M., Kruger, A., Spandler, C., Kramers, J., Roberts, E., Dirks, P., Hawks, J., & Berger, L. R. (2021). Expanded Explorations of the Dinaledi Subsystem,Rising Star Cave System, South Africa. PaleoAnthropology, 2021(1), 15–22. https://doi.org/10.48738/2021.iss1.68

      • Fewlass, H., Zavala, E. I., Fagault, Y., Tuna, T., Bard, E., Hublin, J.-J., Hajdinjak, M., & Wilczyński, J. (2023). Chronological and genetic analysis of an Upper Palaeolithic female infant burial from Borsuka Cave, Poland. iScience, 26(12). https://doi.org/10.1016/j.isci.2023.108283

      • Foecke, Kimberly K., Queffelec, Alain, & Pickering, Robyn. (n.d.). No Sedimentological Evidence for Deliberate Burial by Homo naledi – A Case Study Highlighting the Need for Best Practices in Geochemical Studies Within Archaeology and Paleoanthropology. PaleoAnthropology, 2024. https://doi.org/10.48738/202x.issx.xxx

      • Goldberg, P., Aldeias, V., Dibble, H., McPherron, S., Sandgathe, D., & Turq, A. (2017). Testing the Roc de Marsal Neandertal “Burial” with Geoarchaeology. Archaeological and Anthropological Sciences, 9(6), 1005–1015. https://doi.org/10.1007/s12520-013-0163-2

      • Maloney, T. R., Dilkes-Hall, I. E., Vlok, M., Oktaviana, A. A., Setiawan, P., Priyatno, A. A. D., Ririmasse, M., Geria, I. M., Effendy, M. A. R., Istiawan, B., Atmoko, F. T., Adhityatama, S., Moffat, I., Joannes-Boyau, R., Brumm, A., & Aubert, M. (2022). Surgical amputation of a limb 31,000 years ago in Borneo. Nature, 609(7927), 547–551. https://doi.org/10.1038/s41586-022-05160-8

      • Martinón-Torres, M., d’Errico, F., Santos, E., Álvaro Gallo, A., Amano, N., Archer, W., Armitage, S. J., Arsuaga, J. L., Bermúdez de Castro, J. M., Blinkhorn, J., Crowther, A., Douka, K., Dubernet, S., Faulkner, P., Fernández-Colón, P., Kourampas, N., González García, J., Larreina, D., Le Bourdonnec, F.-X., … Petraglia, M. D. (2021). Earliest known human burial in Africa. Nature, 593(7857), Article 7857. https://doi.org/10.1038/s41586021-03457-8

      • Martinón-Torres, M., Garate, D., Herries, A. I. R., & Petraglia, M. D. (2023). No scientific evidence that Homo naledi buried their dead and produced rock art. Journal of Human Evolution, 103464. https://doi.org/10.1016/j.jhevol.2023.103464

      • Pomeroy, E., Bennett, P., Hunt, C. O., Reynolds, T., Farr, L., Frouin, M., Holman, J., Lane, R., French, C., & Barker, G. (2020a). New Neanderthal remains associated with the ‘flower burial’ at Shanidar Cave. Antiquity, 94(373), 11–26. https://doi.org/10.15184/aqy.2019.207

      • Pomeroy, E., Hunt, C. O., Reynolds, T., Abdulmutalb, D., Asouti, E., Bennett, P., Bosch, M., Burke, A., Farr, L., Foley, R., French, C., Frumkin, A., Goldberg, P., Hill, E., Kabukcu, C., Lahr, M. M., Lane, R., Marean, C., Maureille, B., … Barker, G. (2020b). Issues of theory and method in the analysis of Paleolithic mortuary behavior: A view from Shanidar Cave. Evolutionary Anthropology: Issues, News, and Reviews, 29(5), 263–279. https://doi.org/10.1002/evan.21854

      • Robbins, J. L., Dirks, P. H. G. M., Roberts, E. M., Kramers, J. D., Makhubela, T. V., HilbertWolf, H. L., Elliott, M., Wiersma, J. P., Placzek, C. J., Evans, M., & Berger, L. R. (2021). Providing context to the Homo naledi fossils: Constraints from flowstones on the age of sediment deposits in Rising Star Cave, South Africa. Chemical Geology, 567, 120108. https://doi.org/10.1016/j.chemgeo.2021.120108

      • Wiersma, J. P., Roberts, E. M., & Dirks, P. H. G. M. (2020). Formation of mud clast breccias and the process of sedimentary autobrecciation in the hominin-bearing (Homo naledi) Rising Star Cave system, South Africa. Sedimentology, 67(2), 897–919. https://doi.org/10.1111/sed.12666

    1. eLife Assessment

      The songbird vocal motor nucleus HVC contains cells that project to the basal ganglia, the auditory system, or to downstream vocal motor structures. In this fundamental study, the authors conduct optogenetic circuit mapping to clarify how four distinct inputs to HVC act on these distinct HVC cell types. They provide compelling evidence that all long range projections engage inhibitory circuits in HVC and can also exhibit cell-type specific preferences in monosynaptic input strength. Understanding HVC at this microcircuit level is critical for constraining models of song learning and production.

    2. Reviewer #1 (Public review):

      Summary:

      This work has crated the map of synaptic connectivity between the inputs and outputs of song premotor nucleus, HVC in zebra finches to understand how sensory (auditory) to motor circuit interact to coordinate song production and learning. The authors optimized the optogenetic technique via AAV to manipulate auditory inputs from a specific auditory area one-by-one and recorded synaptic activity from a neuron in HVC with whole-cell recording from slice preparation with identification of projection area by retrograde neuronal tracing. These thorough and detailed analysis provide compelling evidence of synaptic connections between 4 major auditory inputs (3 forebrain and 1 thalamic regions) within three projection neurons in the HVC; all areas give monosynaptic excitatory inputs and polysynaptic inhibitory inputs, but proportions of projection to each projection neuron varied. They also find specific reciprocal connections between mMAN and Av. Taken together the authors provide the map of synaptic connection between intercortical sensory to motor areas which is suggested to be involved in zebra finch song production and learning.

      Strengths:

      The authors optimized optogenetical tools with eGtACR1 by using AAV which allow them to manipulate synaptic inputs in a projection-specific manner in zebra finches. They also identify HVC cell type based on projection area. With their technical advance and thorough experiments, they provided detailed map synaptic connection and gave insights into the neuronal circuit for auditory guided vocal (motor) learning.

      Weaknesses:

      As this study is in adult brain slices, there might be a gap to the functions in developmental song learning.

    3. Reviewer #2 (Public review):

      Summary:

      The manuscript describes synaptic connectivity in Songbird cortex four main classes of sensory neurons afferents onto three known classes of projection neurons of the pre-motor cortical region HVC. HVC is a region associated with the generation of learned bird song. Investigators here use all male zebra finches to examine the functional anatomy of this region using patch clamp methods combined with optogenetic activation of select neuronal groups.

      Strengths:

      The quality of the recordings is extremely high and the quantity of data is on a very significant scale, this will certainly aid the field.

      Weaknesses:

      Could make the figures a little easier to navigate by having some atlas drawings.

      Comments on revisions:

      The authors have addressed the minor concerns and suggestions

    4. Reviewer #3 (Public review):

      Nucleus HVC is critical both for song production as well as learning and arguably, sitting at the top of the song control system, is the most critical node in this circuit receiving a multitude of inputs and sending precisely timed commands that determine the temporal structure of song. The complexity of this structure and its underlying organization seem to become more apparent with each experimental manipulation, and yet our understanding of the underlying circuit organization remains relatively poorly understood. In this study, Trusel and Roberts use classic whole-cell patch clamp techniques in brain slices coupled with optogenetic stimulation of select inputs to provide a careful characterization and quantification of synaptic inputs into HVC. By identifying individual projections neurons using retrograde tracer injections combined with pharmacological manipulations, they classify monosynaptic inputs onto each of the three main classes of glutamatergic projection neurons in HVC (RA-, Area X- and Av-projecting neurons). This study is remarkable in the amount of information that it generates, and the tremendous labor involved for each experiment, from the expression of opsins in each of the target inputs (Uva, NIf, mMAN and Av), the retrograde labelling of each type of projection neuron, and ultimately the optical stimulation of infected axons while recording from identified projection neurons. Taken together, this study makes an important contribution to increasing our identification, and ultimately understanding, of the basic synaptic elements that make up the circuit organization of HVC, and how external inputs, which we know to be critical for song production and learning, contribute to the intrinsic computations within this critic circuit.

      This study is impressive in its scope, rigorous in its implementation and thoughtful regarding its limitations. The manuscript is well written, and I appreciate the clarity with which the authors use our latest understanding of the evolutionary origins of this circuit to place these studies within a larger context and their relevance to the study of vocal control, including human speech. My comments are minor and primarily about legibility, clarification of certain manipulations and organization of some of the summary figures.

      Comments on revisions:

      The authors have done a very nice job addressing the reviewers' comments.

    5. Author response:

      The following is the authors’ response to the original reviews

      Public Reviews:

      Reviewer #1 (Public review):

      Summary:

      This work tried to map the synaptic connectivity between the inputs and outputs of the song premotor nucleus, HVC in zebra finches to understand how sensory (auditory) to motor circuits interact to coordinate song production and learning. The authors optimized the optogenetic technique via AAV to manipulate auditory inputs from a specific auditory area one-by-one and recorded synaptic activity from a neuron with whole-cell recording from slice preparation with identification of the projection area by retrograde neuronal tracing. This thorough and detailed analysis provides compelling evidence of synaptic connections between 4 major auditory inputs (3 forebrain and 1 thalamic region) within three projection neurons in the HVC; all areas give monosynaptic excitatory inputs and polysynaptic inhibitory inputs, but proportions of projection to each projection neuron varied. They also find specific reciprocal connections between mMAN and Av. Taken together the authors provide the map of the synaptic connection between intercortical sensory to motor areas which is suggested to be involved in zebra finch song production and learning.

      Strengths:

      The authors optimized optogenetic tools with eGtACR1 by using AAV which allow them to manipulate synaptic inputs in a projection-specific manner in zebra finches. They also identify HVC cell types based on projection area. With their technical advance and thorough experiments, they provided detailed map synaptic connections.

      Weaknesses:

      As it is the study in brain slice, the functional implication of synaptic connectivity is limited. Especially as all the experiments were done in the adult preparation, there could be a gap in discussing the functions of developmental song learning.

      We thank the reviewer for their appreciation of our work. Although we agree that there can be limitations to brain slice preparations, the approaches used here for synaptic connectivity mapping are well-designed to identify long-range synaptic connectivity patterns. Optogenetic stimulation of axon terminals in brain slices does not require intact axons and works well when axons are cut, allowing identification of all inputs expressing optogenetic channels from aXerent regions. Terminal stimulation in slices yields stable post-synaptic responses for hours without rundown, assuring that polysynaptic and monosynaptic connections can be reliably identified in our brain slices.  Additionally, conducting similar types of experiments in vivo can run into important limitations. First, the extent of TTX and 4-AP diXusion, which is necessary for identification of long-range monosynaptic connections, can be diXicult to verify in vivo - potentially confounding identification of monosynaptic connectivity.  Second, conducting whole-cell patch-clamp experiments in vivo, particularly in deeper brain regions, is technically challenging, and would limit the number of cells that can be patched and increase the number of animals needed. 

      We agree that there may well be important diXerences between adult connectivity and connectivity patterns in the juvenile brain. Indeed, learning and experience during development almost certainly shape connectivity patterns and these patterns of connectivity may change incrementally and/or dynamically during development. Ultimately, adult connectivity patterns are the result of changes in the brain that accrue over development. Given that this is the first study mapping long-range connectivity of HVC input-output pathways, we reasoned that the adult connectivity would provide a critical reference allowing future studies to map diXerent stages of juvenile connectivity and the changes in connectivity driven by milestones like forming a tutor song memory, sensorimotor learning, and song crystallization.

      In this revision we worked to better highlight the points raised above and thank the reviewer for their comments.

      Reviewer #2 (Public review):

      Summary:

      The manuscript describes synaptic connectivity in the Songbird cortex's four main classes of sensory neuron aXerents onto three known classes of projection neurons of the pre-motor cortical region HVC. HVC is a region associated with the generation of learned bird songs. Investigators here use all male zebra finches to examine the functional anatomy of this region using patch clamp methods combined with optogenetic activation of select neuronal groups.

      Strengths:

      The quality of the recordings is extremely high and the quantity of data is on a very significant scale, this will certainly aid the field.

      Weaknesses:

      The authors could make the figures a little easier to navigate. Most of the figures use actual anatomical images but it would be nice to have this linked with a zebra finch atlas in more of a cartoon format that accompanied each fluro image. Additionally, for the most part, figures showing the labeling lack scale bar values (in um). These should be added not just shown in the legends.

      The authors could make it clear in the abstract that this is all male zebra finches - perhaps this is obvious given the bird song focus, but it should be stated. The number of recordings from each neuron class and the overall number of birds employed should be clearly stated in the methods (this is in the figures, but it should say n=birds or cells as appropriate).

      The authors should consider sharing the actual electrophysiology records as data.

      We thank the reviewer for their assessment of our research and suggestions. We have implemented many of these suggestions and provide details in our response to their specific Recommendations. Additionally, we are organizing our data and will make it publicly available with the version of record.

      Reviewer #3 (Public review):

      Nucleus HVC is critical both for song production as well as learning and arguably, sitting at the top of the song control system, is the most critical node in this circuit receiving a multitude of inputs and sending precisely timed commands that determine the temporal structure of song. The complexity of this structure and its underlying organization seem to become more apparent with each experimental manipulation, and yet our understanding of the underlying circuit organization remains relatively poorly understood. In this study, Trusel and Roberts use classic whole-cell patch clamp techniques in brain slices coupled with optogenetic stimulation of select inputs to provide a careful characterization and quantification of synaptic inputs into HVC. By identifying individual projection neurons using retrograde tracer injections combined with pharmacological manipulations, they classify monosynaptic inputs onto each of the three main classes of glutamatergic projection neurons in HVC (RA-, Area X- and Av-projecting neurons). This study is remarkable in the amount of information that it generates, and the tremendous labor involved for each experiment, from the expression of opsins in each of the target inputs (Uva, NIf, mMAN, and Av), the retrograde labelling of each type of projection neuron, and ultimately the optical stimulation of infected axons while recording from identified projection neurons. Taken together, this study makes an important contribution to increasing our identification, and ultimately understanding, of the basic synaptic elements that make up the circuit organization of HVC, and how external inputs, which we know to be critical for song production and learning, contribute to the intrinsic computations within this critic circuit.

      This study is impressive in its scope, rigorous in its implementation, and thoughtful regarding its limitations. The manuscript is well-written, and I appreciate the clarity with which the authors use our latest understanding of the evolutionary origins of this circuit to place these studies within a larger context and their relevance to the study of vocal control, including human speech. My comments are minor and primarily about legibility, clarification of certain manipulations, and organization of some of the summary figures.

      We thank the reviewer for their thoughtful assessment of our research.

      Recommendations for the authors:

      The following recommendations were considered by all reviewers to be important to incorporate for improving this paper:

      (1) Clarify the site of viral injection and the possibility of labeling other structures a) Show images of viral injection sites.

      We provide a representative image of viral expression for each pathway studied in this manuscript. Please see panel A in Figures 2-3 and 5-6 showing our viral expression in Uva, NIf, mMAN, and Av respectively.  

      b) Include in discussion caveats that the virus may spread beyond the boundaries of structures (e.g. especially injections into NIF could spread into Field L).

      For each HVC aXerent nucleus we have now included a sentence describing the possible spread of viral infection in surrounding structures in the Results. We also now expanded the image from the Av section to include NIf, to showcase lack of viral expression in NIf (see Fig. 6A).

      (2) Clarify the logic and precise methods of the TTX and 4-AP experiments

      a) Please see the detailed issue raised by Reviewer 3, Major Point 1 below.

      The TTX and 4AP application is the gold-standard of opsin-assisted synaptic circuit interrogation, pioneered by the Svoboda lab in 2009 (Petreanu, Mao et al. 2009) and widely used to assess monosynaptic connectivity in multiple brain circuits, as summarized in a recent review(Linders, Supiot et al. 2022). We now better describe the logic of this approach in the second paragraph of the Results section and cite the first description of this method from the Svoboda lab and a recent review weighing this method with other optogenetic methods for tracing synaptic connections in the brain.

      (3) Include caveats in discussion

      a) Note that there may be other inputs to HVC that were not examined in this study (e.g. CMM, Field L)

      In our original manuscript we did state “Although a complete description of HVC circuitry will require the examination of other potential inputs (i.e. RA<sub>HVC</sub> PNs, A11 glutamatergic neurons(Roberts, Klein et al. 2008, Ben-Tov, Duarte et al. 2023)) and a characterization of interneuron synaptic connectivity, here we provide a map of the synaptic connections between the 4 best described aPerents to HVC and its 3 populations of projection neurons” in the last paragraph of the Discussion. We have now edited this sentence to include the projection from NCM to HVC and cited Louder et al., 2024.

      We have extensively mapped input pathways to HVC, and consistent with Vates (Vates, Broome et al. 1996) we have not found evidence that Field L projects to HVC. Rather that it projects to the shelf region outside of HVC. Consistent with this, we do not see retrogradely labeled neurons in Field L following tracer injections confined to HVC (see Fig. 3G). Additionally, we find that CM projections to HVC arise from the nucleus Avalanche (Roberts, Hisey et al. 2017) which we specifically examine in this study. We do not dispute that there may be other pathways projecting to HVC that will need to be examined in the future, including known projections from neuromodulatory regions and RA, from developmentally restricted pathway(s) like NCM (Louder, Kuroda et al. 2024), and from yet unidentified pathways.

      b) Also note that birds in this study were adults and that some inputs to HVC likely to be important for learning may recede during development (e.g. Louder et al, 2024).

      In the second to last paragraph of the Discussion we now state: While our opsin-assisted circuit mapping provides us with a new level of insight into HVC synaptic circuitry, there are limitations to this research that should be considered. All circuit mapping in this study was carried out in brain slices from adult male zebra finches. Future studies will be needed to examine how this adult connectivity pattern relates to patterns of connectivity in juveniles during sensory or sensorimotor phases of vocal learning and connectivity patterns in female birds.   

      (4) Consider cosmetic changes to figures as suggested by Reviewers 2-3 below.

      We thank the reviewers for their suggestions and have implemented the changes as best we can.

      (5) Address all minor issues raised below.

      Reviewer #1 (Recommendations for the authors):

      I see this study is well designed to answer the author's specific question, mapping synaptic auditorymotor connections within HVC. Their experiments with advanced techniques of projection-specific optogenetic manipulation of synaptic inputs and retrograde identification of projection areas revealed input-output combination selective synaptic mapping.

      As I found this study advanced our knowledge with the compelling dataset, I have only some minor comments here.

      (1) One technical concern is we don't see how much the virus infection was focused on the target area and if we can ignore the eXect of synaptic connectivity from surrounding areas. As the amount of virus they injected is large (1.5ul) and target areas are small, we assume the virus might spread to the surrounding area, such as field L which also projects to HVC when targeting Nif. While I think the majority of the projections were from their target areas, it would be better to mention (also the images with larger view areas) the possibilities of projections of surrounding areas.

      We agree with the reviewer about the concern about specificity of viral expression. For this reason, we included sample images of the viral expression in each target area (panel A in Fig. 2,3,5,6). We have now also included a sentence at the beginning of each subsection of our Result to describe how we have ensured interpretability of the results. Uva and mMAN’s surrounding areas are not known to project to HVC. Possible cross-infection is an issue for Av and NIf, and we checked each bird’s injection site to ensure that eGtACR1+ cells were not visible in the unintended HVC-projecting areas.

      As mentioned in our response the public comment, consistent with Vates (Vates, Broome et al. 1996) we do not see evidence that Field L projects directly to HVC (see Fig. 3G).

      (2) Another concern about the technical issue is the damage to axonal projections. While I understand the authors stimulated axonal terminals axonal projections were assumed to be cut and their ability to release neurotransmitters would be reduced especially after long-term survival or repeated stimulation. Mentioning whether projection pathways were within their 230um-thick slice (probably depends on input sites) or not and the eXect of axonal cut would be helpful.

      We agree that slice electrophysiology has limitations. However, we disagree with the claim of reduced reliability or stability of the evoked response. We and others find that electrical and optogenetic repeated terminal stimulation in slices can yield stable post-synaptic responses for tens of minutes and even hours (Bliss and Gardner-Medwin 1973, Bliss and Lomo 1973, Liu, Kurotani et al. 2004, Pastalkova, Serrano et al. 2006, Xu, Yu et al. 2009, Trusel, Cavaccini et al. 2015, Trusel, Nuno-Perez et al. 2019). Indeed, long-term synaptic plasticity experiments in most preparations and across brain areas rely on such stability of the presynaptic machinery for synaptic release, despite axons being severed from their parent soma. Our assumption is the vast majority, if not all, connections between axon terminals and their cell body in the aXerent regions have been cut in our preparations. Nonetheless, the diversity of outcomes we report (currents returning after TTX+4AP or not, depending on the specific combination of input and HVCPN class) is consistent with the robustness of the synaptic interrogation method. 

      (3) While I understand this study focused on 4 major input areas and the authors provide good pictures of synaptic HVC connections from those areas, HVC has been reported to receive auditory inputs from other areas as well (CMM, FieldL, etc.). It is worth mentioning that there are other auditory inputs and would be interesting to discuss coordination with the inputs from other areas.

      We have extensively mapped input pathways to HVC, and consistent with Vates (Vates, Broome et al. 1996) we have not found evidence that Field L projects to HVC. Rather that it projects to the shelf region outside of HVC. Consistent with this, we do not see retrogradely labeled neurons in Field L following tracer injections confined to HVC (see Fig. 3G). Additionally, we find that CM projections to HVC arise from the nucleus Avalanche (Roberts, Hisey et al. 2017) which we specifically examine in this study. We do not dispute that there may be other pathways projecting to HVC that will need to be examined in the future, including known projections from neuromodulatory regions and RA, from developmentally restricted pathway(s) like NCM (Louder, Kuroda et al. 2024), and from yet unidentified pathways.

      (4) The HVC local neuronal connections have been reported to be modified and a recent study revealed the transient auditory inputs into HVC during song learning period. The author discusses the functions of HVC synaptic connections on song learning (also title says synaptic connection for song learning), however, the experiments were done in adults and dp not discuss the possibility of diXerent synaptic connection mapping in juveniles in the song learning period. Mentioning the neuronal activities and connectivity changes during song learning is important. Also, it would be helpful for the readers to discuss the potential diXerences between juveniles/adults if they want to discuss the functions of song learning.

      We now mention in the Discussion that this is an important caveat of our research and that future studies will be needed to examine how these adult connectivity patterns relate to connectivity patterns in juveniles during sensory or sensorimotor phases of vocal learning and connectivity patterns in female birds. Nonetheless, the title and abstract cite song learning because it is important for the broader public to understand that at least some of these aXerent brain regions carry an essential role in song learning (Foster and Bottjer 2001, Roberts, Gobes et al. 2012, Roberts, Hisey et al. 2017, Zhao, Garcia-Oscos et al. 2019, Koparkar, Warren et al. 2024).

      Reviewer #2 (Recommendations for the authors):

      The work is very detailed and will be an important resource to those working in the field. The recordings are of a high quality and lots of information is included such as measures of response kinetics amplitude and pharmacological confirmation of excitatory and inhibitory synaptic responses. In general, I feel the quality is extremely high and the quantity of data is on a very significant exhaustive scale that will certainly aid the field. I have come at this conclusion as a non zebra finch person but I feel the connection information shown will be of benefit given its high quality.

      Figure 7 is a nice way of showing the overall organization. Optional suggestion, consider highlighting anything in Figure 7 that results in a new understanding of the song system as compared to previous work on anatomy and function.

      We thank the reviewer for the kind comments about our research. We have highlighted our newly found connection between mMAN and Av and all the connections onto the HVC PNs in Panel B are newly identified in this study.

      Reviewer #3 (Recommendations for the authors):

      Major points

      (1) Clarification regarding methods for determining monosynaptic events:

      One of the manipulations that I struggled the most with was those describing the use of TTX + 4AP to isolate monosynaptic events. Initially, not being as familiar with the use of optically based photostimulation of axons to release transmitter locally, I was initially confused by statements such as "we found that oEPSC returned after application of TTX+4AP". This might be clear to someone performing these manipulations, but a bit more clarification would be helpful. Should I assume that an existing monosynaptic EPSC would be masked by co-occurring polysynaptic IPSCs which disappear following application of TTX + 4AP, thereby unmasking the monosynaptic EPSC, thereby causing the EPSC to "return"? A word that I am not sure works. Continuing my confusion with these experiments, I am unsure how this cocktail of drugs is added, if it is even added as a cocktail, which is what I initially assumed. The methods and the results are not so clear if they are added in sequence and why and if traces are recorded after the addition of both drugs or if they are recorded for TTX and then again for TTX + 4AP. Finally, looking at the traces in the experimental figures (e.g. Figures 2F, 3F, 5F, and 6F), it is diXicult to see what is being shown, at least for me. First, the authors need to describe better in the results why they stimulate twice in short succession and why they seem to use the response to the second pulse (unless I am mistaken) to measure the monosynaptic event. Second, I was confused by the traces (which are very small) in the presence of TTX. I would have expected to see a response if there was a monosynaptic EPSC but I only seem to see a flat line.  

      The confusion that I list above might be due in part to my ignorance, but it is important in these types of papers not to assume too much expertise if you want readers with a less sophisticated understanding of synaptic physiology to understand the data. In other words, a little bit more clarity and hand-holding would be welcome.

      We understand the reviewer’s confusion about the methodology.  In Voltage clamp, the amplifier injects current through the electrode maintaining the membrane voltage to -70mV, where the equilibrium potential for Cl- is near equilibrium, and therefore the only synaptic current evoked by light stimulation is due to cation influx, mainly through AMPA receptors (see Fig. 1).  Therefore, cooccurring polysynaptic IPSCs wouldn’t be visible. We examine those holding the membrane voltage at +10mV, see Fig. 1. TTX application suppresses V-dependent Na+ channels and therefore stops all neurotransmission. We show the traces upon TTX to show that currents we were recording prior to TTX application were of synaptic origin, and not due to accidental expression of opsin in the patched cell. Also, this ensures that any current visible after 4AP application is due to monosynaptic transmission and not to a failure of TTX application.

      After recording and light stimulation with TTX, we then add 4AP, which is a blocker of presynaptic K+ channels. This prevents the repolarization of the terminals that would occur in response to opsinmediated local depolarization. 4AP application, therefore, allows local opsin-driven depolarizations to reach the threshold for Ca2+-dependent vesicle docking and release. This procedure selectively reveals or unmasks the monosynaptic currents because any non-monosynaptically connected neuron would still need V-dependent Na+ channels to eXectively produce indirect neurotransmission onto the patched cell. The TTX and 4AP application is the gold-standard of opsinassisted synaptic circuit interrogation, pioneered by the Svoboda lab in 2009 and widely used to assess monosynaptic connectivity in multiple brain circuits, as summarized in a recent review (Linders et al., 2022). We now include 2 more sentences near the beginning of the Results to clarify this process and directly point to the Linders review for researchers wanting a deeper explanation of this technique. 

      The double stimulation is unrelated to our testing of monosynaptic connections. We originally conducted the experiments by delivering 2 pulses of light separated by 50ms, a common way to examine the pair-pulse ratio (PPR) – a physiological measure which is used to probe synapses for short-term plasticity and release probability. However, through discussions with colleagues we realized that the slow decay time of eGtACR1 may complicate interpretation of the response to the second light pulse. Thus, we elected to not report these results and indicated this in the Methods section:  “We calculated the paired-pulse ratio (PPR) as the amplitude of the second peak divided by the amplitude of the first peak elicited by the twin stimuli, however due to slow kinetics of eGtACR1 the results would be diPicult to interpret, and therefore we are not currently reporting them.” 

      (2) Suggestions for improving summary figures:

      Summary Figure 1a: The circuit diagram (schematic to the right of 1a) is OK but I initially found it a bit diXicult to interpret. For example, it is not clear why pink RA projecting neurons don't reach as far to the right as X or Av projecting neurons, suggesting that they are not really projection neurons. Also, the big question marks in the intermediate zone are not entirely intuitive. It seems there might be a better way of representing this. It might also be worth stating in the figure legend that the interconnectivity patterns shown in the figure between PNs in HVC are based on specific prior studies.

      We thank the reviewer for the constructive criticism. We have modified the figure to extend the RA projection line and mentioned in the figure legend that connectivity between PNs is based on prior studies.

      Summary Figure 1a: I am not sure I love this figure. There are a few minor issues. First, there are too many browns [Nif/AV and mMAN] which makes it more challenging to clearly disambiguate the diXerent projections. Second, it is unclear why this figure does not represent projections from RA to HVC. My biggest concern with this figure is that it oversimplifies some of the findings. From the figure, one gets the impression that Uva only projects to RA-PNs and that Av only projects to X-PNs even though the authors show connections to other PNs. With the small sample size in this current study for each projection and each PN type, one really cannot rule out that these "minority" projections are not important. I, therefore, suggest that the authors qualitatively represent the strength/probability of connections by weighting with thickness of aXerent connections.

      We assume the reviewer is commenting on our summary figure panel 7B. We agree with the referee that this is a simplified representation of our findings. We had indeed indicated in the legend that this was just a “Schematic of the HVC aXerent connectivity map resulting from the present work” and that “For conceptualization purposes, aXerent connectivity to HVC-PNs is shown only when the rate of monosynaptic connectivity reaches 50% of neurons examined”. We have added a title to highlight that this is but a simplification. We have now adjusted the colors to make the figure easier to follow. Based on the reviewers critique we searched for a better method for summarizing the complex connectivity patterns described in this research. We settled on a Sankey diagram of connectivity. This is now Figure 7C. In this diagram, we are able to show the proportion of connections from each input pathway onto each class of neuron and if these connections are poly or monosynaptic. We find this to a straightforward way of displaying all of the connectivity patterns identified in our figure 2-3 and 4-5 look forward to understanding if the reviewers find this a useful way of illustrating our findings.

      Minor points:

      (1) Line 50 - typo - song circuits.

      Thank you for catching this.

      (2) Line 106 - 111 - The findings suggest that 100% of Uva projections onto HVCRA neurons are monosynaptic. However, because the authors only tested 6 neurons their statements that their findings are so diXerent from other studies, should be somewhat tempered since these other studies (e.g. Moll et al.) looked at 251 neurons in HVC and sampling bias could still somewhat explain the diXerence.

      We observed oEPSCs in 43 of 51 (84.3%) HVC-RA neurons recorded (mean rise time = 2.4 ms) and monosynaptic connections onto 100% of the HVC-RA neurons tested (n = 6). Moll et al. combined electrical stimulation of Uva with two-photon calcium imaging (GCaMP6s) of putative HVC-RA neurons (n = 251 neurons). We should note that these are putative HVC-RA neurons because they were not visually identified using retrograde tracing or using some other molecular handle. They report that only ~16% of HVC-RA neurons showed reliable calcium responses following Uva stimulation. Although the experiments by Moll et al are technically impressive, calcium imaging is an insensitive technique for measuring post-synaptic responses, particularly subthreshold responses, when compared to whole-cell patch-clamp recordings. This approach cannot identify monosynaptic connections and is likely limited to only be sensitive suprathreshold activity that likely relies on recruitment of other polysynaptic inputs onto the neurons in HVC. Furthermore, as indicated in the Discussion, our opsin-mediated synaptic interrogation recruits any eGtACR1+ Uva terminal in the slice and therefore will have great likelihood of revealing any existing connections. 

      A limitation of whole-cell patch-clamp recordings is that it is a laborious low throughput technique. Future experiments using better imaging approaches, like voltage imaging, may be able to weigh in on diXerences between what we report here using whole-cell patch-clamp recordings from visually identified HVC-RA neurons combined with optogenetic manipulations of Uva terminals and the calcium imaging results reported by Moll. Nonetheless, whole-cell patch-clamp recordings combined with optogenetic manipulations is likely to remain the most sensitive method for identifying synaptic connectivity.

      (3) Figure 2G - the significance of white circles is not clear.

      The figure legend indicates that those highlight and mark the position of “retrogradely labeled HVCprojecting neurons in Uva (cyan, white circles)” to facilitate identification of colocalization with the in-situ markers.

      (4) Line 135 - Cardin et al. (J. Neurophys. 2004) is the first to show that song production does not require Nif.

      We thank the reviewer pointing this out and we have cited this important study. 

      (5) Line 183 - This is a confusing sentence because I initially thought that mMAN-mMANHVC PNs was a category!

      We switched the dash with a colon.

      (6) Figure 4d could use some arrows to identify what is shown. It is assumed that the box represents mMAN. Should it be assumed that Av is not in the plane of this section? If not, this should be stated in the legend. It is also unclear where the anterograde projections are. Is this the dork highway that goes from the box to the dorsal surface? If yes this should be indicated but it should also be made clear why the projections go both in the dorsal as well as the ventral directions.

      The inset, as indicated by the lines around it, is a magnification of the terminal fields in Av. We added an explanation of the inset.

      (7) Discussion. In the introduction, the authors mention projections from RA to HVC but never end up studying them in the current manuscript which seems like a missed opportunity and perhaps even a weakness of the study. In the discussion, it would certainly be good for the authors to at least discuss the possible significance of these projections and perhaps why they decided not to study them.

      We thank the reviewer for the comment. Unfortunately, we couldn’t reliably evoke interpretable currents from RA, and we elected to publish the current version of the paper with these 4 major inputs. Nonetheless, we have indicated in the Introduction and in the Discussion that more inputs (e.g. RA, A11, NCM) remain to be evaluated. 

      (8) Line 622 - Is this reference incomplete?

      We thank the reviewer. We have corrected the reference.

      • Ben-Tov, M., F. Duarte and R. Mooney (2023). "A neural hub for holistic courtship displays." Curr Biol 33(9): 1640-1653 e1645.

      • Bliss, T. V. and A. R. Gardner-Medwin (1973). "Long-lasting potentiation of synaptic transmission in the dentate area of the unanaestetized rabbit following stimulation of the perforant path." J Physiol 232(2): 357-374.

      • Bliss, T. V. and T. Lomo (1973). "Long-lasting potentiation of synaptic transmission in the dentate area of the anaesthetized rabbit following stimulation of the perforant path." J Physiol 232(2): 331-356.

      • Foster, E. F. and S. W. Bottjer (2001). "Lesions of a telencephalic nucleus in male zebra finches: Influences on vocal behavior in juveniles and adults." J Neurobiol 46(2): 142-165.

      • Koparkar, A., T. L. Warren, J. D. Charlesworth, S. Shin, M. S. Brainard and L. Veit (2024). "Lesions in a songbird vocal circuit increase variability in song syntax." Elife 13.

      • Linders, L. E., L. F. Supiot, W. Du, R. D'Angelo, R. A. H. Adan, D. Riga and F. J. Meye (2022). "Studying Synaptic Connectivity and Strength with Optogenetics and Patch-Clamp Electrophysiology." Int J Mol Sci 23(19).

      • Liu, H. N., T. Kurotani, M. Ren, K. Yamada, Y. Yoshimura and Y. Komatsu (2004). "Presynaptic activity and Ca2+ entry are required for the maintenance of NMDA receptor-independent LTP at visual cortical excitatory synapses." J Neurophysiol 92(2): 1077-1087.

      • Louder, M. I. M., M. Kuroda, D. Taniguchi, J. A. Komorowska-Muller, Y. Morohashi, M. Takahashi, M. Sanchez-Valpuesta, K. Wada, Y. Okada, H. Hioki and Y. Yazaki-Sugiyama (2024). "Transient sensorimotor projections in the developmental song learning period." Cell Rep 43(5): 114196.

      • Pastalkova, E., P. Serrano, D. Pinkhasova, E. Wallace, A. A. Fenton and T. C. Sacktor (2006). "Storage of spatial information by the maintenance mechanism of LTP." Science 313(5790): 1141-1144.

      • Petreanu, L., T. Mao, S. M. Sternson and K. Svoboda (2009). "The subcellular organization of neocortical excitatory connections." Nature 457(7233): 1142-1145.

      • Roberts, T. F., S. M. Gobes, M. Murugan, B. P. Olveczky and R. Mooney (2012). "Motor circuits are required to encode a sensory model for imitative learning." Nat Neurosci 15(10): 1454-1459.

      • Roberts, T. F., E. Hisey, M. Tanaka, M. G. Kearney, G. Chattree, C. F. Yang, N. M. Shah and R. Mooney (2017). "Identification of a motor-to-auditory pathway important for vocal learning." Nat Neurosci 20(7): 978-986.

      • Roberts, T. F., M. E. Klein, M. F. Kubke, J. M. Wild and R. Mooney (2008). "Telencephalic neurons monosynaptically link brainstem and forebrain premotor networks necessary for song." J Neurosci 28(13): 3479-3489.

      • Trusel, M., A. Cavaccini, M. Gritti, B. Greco, P. P. Saintot, C. Nazzaro, M. Cerovic, I. Morella, R. Brambilla and R. Tonini (2015). "Coordinated Regulation of Synaptic Plasticity at Striatopallidal and Striatonigral Neurons Orchestrates Motor Control." Cell Rep 13(7): 1353-1365.

      • Trusel, M., A. Nuno-Perez, S. Lecca, H. Harada, A. L. Lalive, M. Congiu, K. Takemoto, T. Takahashi, F. Ferraguti and M. Mameli (2019). "Punishment-Predictive Cues Guide Avoidance through Potentiation of Hypothalamus-to-Habenula Synapses." Neuron 102(1): 120-127.e124.

      • Vates, G. E., B. M. Broome, C. V. Mello and F. Nottebohm (1996). "Auditory pathways of caudal telencephalon and their relation to the song system of adult male zebra finches." Journal of Comparative Neurology 366(4): 613-642.

      • Xu, T., X. Yu, A. J. Perlik, W. F. Tobin, J. A. Zweig, K. Tennant, T. Jones and Y. Zuo (2009). "Rapid formation and selective stabilization of synapses for enduring motor memories." Nature 462(7275): 915-919.

      • Zhao, W., F. Garcia-Oscos, D. Dinh and T. F. Roberts (2019). "Inception of memories that guide vocal learning in the songbird." Science 366: 83 - 89.

    1. eLife Assessment

      The study reports valuable findings from a very rich EEG-fMRI dataset, including 107 participants, which was collected during nocturnal naps. Using overall solid methods, the authors link activity in memory-related brain regions (e.g., hippocampus, thalamus, and medial prefrontal cortex), and their functional connectivity to the occurrence of canonical sleep rhythms (spindles and slow oscillations) in non-rapid eye movement sleep. This work will be of broad interest to sleep and memory researchers and beyond.

    2. Reviewer #1 (Public review):

      Wang et al., recorded concurrent EEG-fMRI in 107 participants during nocturnal NREM sleep to investigate brain activity and connectivity related to slow oscillations (SO), sleep spindles, and in particular their co-occurrence. The authors found SO-spindle coupling to be correlated with increased thalamic and hippocampal activity, and with increased functional connectivity from the hippocampus to the thalamus and from the thalamus to the neocortex, especially the medial prefrontal cortex (mPFC). They concluded the brain-wide activation pattern to resemble episodic memory processing, but to be dissociated from task-related processing and suggest that the thalamus plays a crucial role in coordinating the hippocampal-cortical dialogue during sleep.

      The paper offers an impressively large and highly valuable dataset that provides the opportunity for gaining important new insights into the network substrate involved in SOs, spindles, and their coupling.

      Comments on revisions:

      While the authors have sufficiently addressed some of my previous comments, I still have severe concerns regarding several key aspects of the methodology, which were even corroborated by the supplementary results presented in response to the last round of reviews. I have the following specific comments (numbers refer to comments raised in the previous review):

      Re 1: The revised introduction now cites a couple of papers but discusses them only very superficially, lumping together several studies with very different key results. This is stil not very informative for the reader and does not sufficiently acknowledge previously published work. Here are two examples to illustrate this:<br /> a. "These studies have generally reported that slow oscillations are associated with widespread cortical and subcortical BOLD changes, whereas spindles elicit activation in the thalamus, as well as in several cortical and paralimbic regions."  Several studies even showed e.g., a clear activation of the hippocampus and parahippocampal gyrus associated with spindles, not just the thalamus<br /> b. "Although these findings provide valuable insights into the BOLD correlates of sleep rhythms, they often do not employ sophisticated temporal modeling (Huang et al., 2024) [, ...]." - previous studies have used e.g., spindle event-related regressors with individual spindle amplitudes as parametric modulators, first and second order derivatives of the HRF function, as well as PPI connectivity analyses, which I would consider rather sophisticated temporal modelling.

      Re 4+9: The short overall recordings in some subjects on the one hand and the large number of spindles and SOs detected in N1 sleep stages are still highly concerning, in fact even more so, now that the actual numbers have been provided in the Supplementary Tables. Either the sleep staging or the detection of SO and spindle events must be incorrect. I understand that for specific EEG analysis and fMRI modelling purposes sometimes slightly different thresholds are used as compared to clinical sleep staging, but several parameters here are alarmingly off.<br /> a. Given that proper NREM sleep (N2+N3) is the relevant stage for the analyses conducted in this paper, some of the N2+N3 durations are very short (eg 7-8 min) while those subjects' results have the same impact on the group level analyses as those with >100 min of N2+N3. Either subjects with very little relevant data (not overall recording time but N2+N3 time) should be excluded or weighting subject data for the group analyses according to the amount od contributed data should be done.<br /> b. The authors argue that the SO and spindle detection algorithms are valid since widely used and that they were developed for N2+N3 stages, which is why they will also detect events in other stages: "While, because the detection methods for SO and spindle are based on percentiles, this method will always detect a certain number of events when used for other stages (N1 and REM) sleep data, but the differences between these events and those detected in stage N23 remain unclear." I do agree that with very liberal thresholds, also SO and spindle vents may be detected in other stages, but it shouldn't be that many. If the percentiles of amplitude thresholds were defined based on properly scored N2+N3 stages only, very few events should be detected (erroneously!) in N1, as the occurrence of K-complexes (isolated SOs) and spindles per definition makes it N2, and during REM sleep only very few spindles and SOS are allowed to occur, without scoring it NREM instead. For the first subject (just as example, but with similar numbers for the rest of the sample), reveals as many as 60 SOs and 31 spindles within 8 min of N1 sleep (Table S2) as well as 13 SOs and 7 spindles within 2 min of REM sleep (Table S4). These numbers are completely unrealistic and question the correctness of the sleep staging as well as the physiological relevance of the EEG graphoelements identified as SO and spindles. It also completely undermines the interpretability of the respective event regressors for the fMRI analyses.<br /> c. Likely, given the large numbers of coupled SO-spindle events and the apparently very low amplitude criteria for event identification, also the number of SO-spindle couplings is likely severely overestimated.

      Re 10: The rationale for using a lateralized frontal electrode (F3) for both SO (should have been at least bilateral or central) and spindle detection (should have been a centro-parietal electrode) is not convincing. Other EEG-fMRI spindle or SO papers have used a number of frontal (SO) or centro-parietal (spindles) electrodes averaged or even approaches including all EEG electrodes. Searching events with low thresholds at suboptimal recording sites does not dot this highly valuable dataset justice.

      Re 7: It is not clear to me why/how larger voxels would reduce susceptibility-related distortions and partial volume effects. Usually, the opposite is true. This should be elaborated.

    3. Reviewer #2 (Public review):

      In this study, Wang and colleagues aimed to explore brain-wide activation patterns associated with NREM sleep oscillations, including slow oscillations (SOs), spindles, and SO-spindle coupling events. Their findings reveal that SO-spindle events corresponded with increased activation in both the thalamus and hippocampus. Additionally, they observed that SO-spindle coupling was linked to heightened functional connectivity from the hippocampus to the thalamus, and from the thalamus to the medial prefrontal cortex-three key regions involved in memory consolidation and episodic memory processes.

      This study's findings are timely and highly relevant to the field. The authors' extensive data collection, involving 107 participants sleeping in an fMRI while undergoing simultaneous EEG recording, deserves special recognition. If shared, this unique dataset could lead to further valuable insights.

      Comments on revisions:

      The authors' efforts in revising the manuscript and addressing the reviewers' comments are certainly commendable. However, I remain concerned about potential issues in detecting sleep-related oscillations (SOs, spindles, and consequently coupled SO-spindle events), which may arise due to suboptimal parameter selection or inaccurate sleep staging, potentially impacting all subsequent analyses.

      A review of Supplementary Tables 1-4 reveals an unusually high number of detected SOs and spindles during sleep stage N1 and REM sleep. While the authors correctly note that a percentile-based detection approach will always identify a certain number of events across sleep stages, the particularly high counts in N1 and REM are concerning. To mitigate the limitations of this method, the authors could have performed event detection independently of sleep stages (i.e., across the entire dataset for each participant) and subsequently assigned the detected events to the corresponding sleep stages. If the event counts in N1 and REM remained disproportionately high, this would indicate a fundamental issue with the detection procedure.

    4. Reviewer #3 (Public review):

      Summary:

      Wang et al., examined the brain activity patterns during sleep, especially when locked to those canonical sleep rhythms such as SO, spindle, and their coupling. Analyzing data from a large sample, the authors found significant coupling between spindles and SOs, particularly during the up-state of the SO. Moreover, the authors examined the patterns of whole-brain activity locked to these sleep rhythms. The authors next investigated the functional connectivity analyses, and found enhanced connectivity between the hippocampus and the thalamus and the medial PFC. These results reinforced the theoretical model of sleep-dependent memory consolidation, such that SO-spindle coupling is conducive for systems-level memory reactivation and consolidation.

      Strengths:

      There are obvious strengths in this work, including the large sample size, state-of-the-art neuroimaging and neural oscillation analyses, and the richness of results. The results now inform hemodynamic neural activity that coincided with SO-spindle couplings.

      Weaknesses:

      My earlier comments were about the inability to make inferences on memory given the lack of memory tasks, and the weakness in using the open-ended cognitive state decoding.

      The current revision has addressed these major concerns. The authors expanded discussions regarding the theoretical implications of the work in a more nuanced manner.

    5. Author response:

      The following is the authors’ response to the original reviews

      Public Reviews:

      Reviewer #1 (Public review):

      Wang et al., recorded concurrent EEG-fMRI in 107 participants during nocturnal NREM sleep to investigate brain activity and connectivity related to slow oscillations (SO), sleep spindles, and in particular their co-occurrence. The authors found SO-spindle coupling to be correlated with increased thalamic and hippocampal activity, and with increased functional connectivity from the hippocampus to the thalamus and from the thalamus to the neocortex, especially the medial prefrontal cortex (mPFC). They concluded the brain-wide activation pattern to resemble episodic memory processing, but to be dissociated from task-related processing and suggest that the thalamus plays a crucial role in coordinating the hippocampal-cortical dialogue during sleep.

      The paper offers an impressively large and highly valuable dataset that provides the opportunity for gaining important new insights into the network substrate involved in SOs, spindles, and their coupling. However, the paper does unfortunately not exploit the full potential of this dataset with the analyses currently provided, and the interpretation of the results is often not backed up by the results presented. I have the following specific comments.

      Thank you for your thoughtful and constructive feedback. We greatly appreciate your recognition of the strengths of our dataset and findings Below, we address your specific comments and provide responses to each point you raised to ensure our methods and results are as transparent and comprehensible as possible. We hope these revisions address your comments and further strengthen our manuscript. Thank you again for the constructive feedback.

      (1) The introduction is lacking sufficient review of the already existing literature on EEG-fMRI during sleep and the BOLD-correlates of slow oscillations and spindles in particular (Laufs et al., 2007; Schabus et al., 2007; Horovitz et al., 2008; Laufs, 2008; Czisch et al., 2009; Picchioni et al., 2010; Spoormaker et al., 2010; Caporro et al., 2011; Bergmann et al., 2012; Hale et al., 2016; Fogel et al., 2017; Moehlman et al., 2018; Ilhan-Bayrakci et al., 2022). The few studies mentioned are not discussed in terms of the methods used or insights gained.

      We acknowledge the need for a more comprehensive review of prior EEG-fMRI studies investigating BOLD correlates of slow oscillations and spindles. However, these articles are not all related to sleep SO or spindle. Articles (Hale et al., 2016; Horovitz et al., 2008; Laufs, 2008; Laufs, Walker, & Lund, 2007; Spoormaker et al., 2010) mainly focus on methodology for EEG-fMRI, sleep stages, or brain networks, which are not the focus of our study. Thank you again for your attention to the comprehensiveness of our literature review, and we will expand the introduction to include a more detailed discussion of the existing literature, ensuring that the contributions of previous EEG-fMRI sleep studies are adequately acknowledged.  

      Introduction, Page 4 Lines 62-76

      “Investigating these sleep-related neural processes in humans is challenging because it requires tracking transient sleep rhythms while simultaneously assessing their widespread brain activation. Recent advances in simultaneous EEG-fMRI techniques provide a unique opportunity to explore these processes. EEG allows for precise event-based detection of neural signal, while fMRI provides insight into the broader spatial patterns of brain activation and functional connectivity (Horovitz et al., 2008; Huang et al., 2024; Laufs, 2008; Laufs, Walker, & Lund, 2007; Schabus et al., 2007; Spoormaker et al., 2010). Previous EEG-fMRI studies on sleep have focused on classifying sleep stages or examining the neural correlates of specific waves (Bergmann et al., 2012; Caporro et al., 2012; Czisch et al., 2009; Fogel et al., 2017; Hale et al., 2016; Ilhan-Bayrakcı et al., 2022; Moehlman et al., 2019; Picchioni et al., 2011). These studies have generally reported that slow oscillations are associated with widespread cortical and subcortical BOLD changes, whereas spindles elicit activation in the thalamus, as well as in several cortical and paralimbic regions. Although these findings provide valuable insights into the BOLD correlates of sleep rhythms, they often do not employ sophisticated temporal modeling (Huang et al., 2024), to capture the dynamic interactions between different oscillatory events, e.g., the coupling between SOs and spindles.”

      (2) The paper falls short in discussing the specific insights gained into the neurobiological substrate of the investigated slow oscillations, spindles, and their interactions. The validity of the inverse inference approach ("Open ended cognitive state decoding"), assuming certain cognitive functions to be related to these oscillations because of the brain regions/networks activated in temporal association with these events, is debatable at best. It is also unclear why eventually only episodic memory processing-like brain-wide activation is discussed further, despite the activity of 16 of 50 feature terms from the NeuroSynth v3 dataset were significant (episodic memory, declarative memory, working memory, task representation, language, learning, faces, visuospatial processing, category recognition, cognitive control, reading, cued attention, inhibition, and action).

      Thank you for pointing this out, particularly regarding the use of inverse inference approaches such as “open-ended cognitive state decoding.” Given the concerns about the indirectness of this approach, we decided to remove its related content and results from Figure 3 in the main text and include it in Supplementary Figure 7. We will refocus the main text on direct neurobiological insights gained from our EEG-fMRI analyses, particularly emphasizing the hippocampal-thalamocortical network dynamics underlying SO-spindle coupling, and we will acknowledge the exploratory nature of these findings and highlight their limitations.

      Discussion, Page 17-18 Lines 323-332

      “To explore functional relevance, we employed an open-ended cognitive state decoding approach using meta-analytic data (NeuroSynth: Yarkoni et al. (2011)). Although this method usefully generates hypotheses about potential cognitive processes, particularly in the absence of a pre- and post-sleep memory task, it is inherently indirect. Many cognitive terms showed significant associations (16 of 50), such as “episodic memory,” “declarative memory,” and “working memory.” We focused on episodic/declarative memory given the known link with hippocampal reactivation (Diekelmann & Born, 2010; Staresina et al., 2015; Staresina et al., 2023). Nonetheless, these inferences regarding memory reactivation should be interpreted cautiously without direct behavioral measures. Future research incorporating explicit tasks before and after sleep would more rigorously validate these potential functional claims.”

      (3) Hippocampal activation during SO-spindles is stated as a main hypothesis of the paper - for good reasons - however, other regions (e.g., several cortical as well as thalamic) would be equally expected given the known origin of both oscillations and the existing sleep-EEG-fMRI literature. However, this focus on the hippocampus contrasts with the focus on investigating the key role of the thalamus instead in the Results section.

      We appreciate your insight regarding the relative emphasis on hippocampal and thalamic activation in our study. We recognize that the manuscript may currently present an inconsistency between our initial hypothesis and the main focus of the results. To address this concern, we will ensure that our Introduction and Discussion section explicitly discusses both regions, highlighting the complementary roles of the hippocampus (memory processing and reactivation) and the thalamus (spindle generation and cortico-hippocampal coordination) in SO-spindle dynamics.

      Introduction, Page 5 Lines 87-103

      “To address this gap, our study investigates brain-wide activation and functional connectivity patterns associated with SO-spindle coupling, and employs a cognitive state decoding approach (Margulies et al., 2016; Yarkoni et al., 2011)—albeit indirectly—to infer potential cognitive functions. In the current study, we used simultaneous EEG-fMRI recordings during nocturnal naps (detailed sleep staging results are provided in the Methods and Table S1) in 107 participants. Although directly detecting hippocampal ripples using scalp EEG or fMRI is challenging, we expected that hippocampal activation in fMRI would coincide with SO-spindle coupling detected by EEG, given that SOs, spindles, and ripples frequently co-occur during NREM sleep. We also anticipated a critical role of the thalamus, particularly thalamic spindles, in coordinating hippocampal-cortical communication.

      We found significant coupling between SOs and spindles during NREM sleep (N2/3), with spindle peaks occurring slightly before the SO peak. This coupling was associated with increased activation in both the thalamus and hippocampus, with functional connectivity patterns suggesting thalamic coordination of hippocampal-cortical communication. These findings highlight the key role of the thalamus in coordinating hippocampal-cortical interactions during human sleep and provide new insights into the neural mechanisms underlying sleep-dependent brain communication. A deeper understanding of these mechanisms may contribute to future neuromodulation approaches aimed at enhancing sleep-dependent cognitive function and treating sleep-related disorders.”

      Discussion, Page 16-17 Lines 292-307

      “When modeling the timing of these sleep rhythms in the fMRI, we observed hippocampal activation selectively during SO-spindle events. This suggests the possibility of triple coupling (SOs–spindles–ripples), even though our scalp EEG was not sufficiently sensitive to detect hippocampal ripples—key markers of memory replay (Buzsáki, 2015). Recent iEEG evidence indicates that ripples often co-occur with both spindles (Ngo, Fell, & Staresina, 2020) and SOs (Staresina et al., 2015; Staresina et al., 2023). Therefore, the hippocampal involvement during SO-spindle events in our study may reflect memory replay from the hippocampus, propagated via thalamic spindles to distributed cortical regions.

      The thalamus, known to generate spindles (Halassa et al., 2011), plays a key role in producing and coordinating sleep rhythms (Coulon, Budde, & Pape, 2012; Crunelli et al., 2018), while the hippocampus is found essential for memory consolidation (Buzsáki, 2015; Diba & Buzsá ki, 2007; Singh, Norman, & Schapiro, 2022). The increased hippocampal and thalamic activity, along with strengthened connectivity between these regions and the mPFC during SO-spindle events, underscores a hippocampal-thalamic-neocortical information flow. This aligns with recent findings suggesting the thalamus orchestrates neocortical oscillations during sleep (Schreiner et al., 2022). The thalamus and hippocampus thus appear central to memory consolidation during sleep, guiding information transfer to the neocortex, e.g., mPFC.”

      (4) The study included an impressive number of 107 subjects. It is surprising though that only 31 subjects had to be excluded under these difficult recording conditions, especially since no adaptation night was performed. Since only subjects were excluded who slept less than 10 min (or had excessive head movements) there are likely several datasets included with comparably short durations and only a small number of SOs and spindles and even less combined SO-spindle events. A comprehensive table should be provided (supplement) including for each subject (included and excluded) the duration of included NREM sleep, number of SOs, spindles, and SO+spindle events. Also, some descriptive statistics (mean/SD/range) would be helpful.

      We appreciate your recognition of our sample size and the challenges associated with simultaneous EEG-fMRI sleep recordings. We acknowledge the importance of transparently reporting individual subject data, particularly regarding sleep duration and the number of detected SOs, spindles, and SO-spindle events. To address this, we will provide comprehensive tables in the supplementary materials, contains descriptive information about sleep-related characteristics (Table S1), as well as detailed information about sleep waves at each sleep stage for all 107 subjects(Table S2-S4), listing for each subject:(1)Different sleep stage duration; (2)Number of detected SOs; (3)Number of detected spindles; (4)Number of detected SO-spindle coupling events; (5)Density of detected SOs; (6)Density of detected spindles; (7)Density of detected SO-spindle coupling events.

      However, most of the excluded participants were unable to fall asleep or had too short a sleep duration, so they basically had no NREM sleep period, so it was impossible to count the NREM sleep duration, SO, spindle, and coupling numbers.

      Supplementary Materials, Page 42-54, Table S1-S4

      (5) Was the 20-channel head coil dedicated for EEG-fMRI measurements? How were the electrode cables guided through/out of the head coil? Usually, the 64-channel head coil is used for EEG-fMRI measurements in a Siemens PRISMA 3T scanner, which has a cable duct at the back that allows to guide the cables straight out of the head coil (to minimize MR-related artifacts). The choice for the 20-channel head coil should be motivated. Photos of the recording setup would also be helpful.

      Thank you for your comment regarding our choice of the 20-channel head coil for EEG-fMRI measurements. We acknowledge that the 64-channel head coil is commonly used in Siemens PRISMA 3T scanners; however, the 20-channel coil was selected due to specific practical and technical considerations in our study. In particular, the 20-channel head coil was compatible with our EEG system and ensured sufficient signal-to-noise ratio (SNR) for both EEG and fMRI acquisition. The EEG electrode cables were guided through the lateral and posterior openings of the head coil, secured with foam padding to reduce motion and minimize MR-related artifacts. Moreover, given the extended nature of nocturnal sleep recordings, the 20-channel coil allowed us to maintain participant comfort while still achieving high-quality simultaneous EEG-fMRI data.

      We have made this clearer in the revised manuscript. 

      Methods, Page 20 Lines 385-392

      “All MRI data were acquired using a 20-channel head coil on a research-dedicated 3-Tesla Siemens Magnetom Prisma MRI scanner. Earplugs and cushions were provided for noise protection and head motion restriction. We chose the 20-channel head coil because it was compatible with our EEG system and ensured sufficient signal-to-noise ratio (SNR) for both EEG and fMRI acquisition. The EEG electrode cables were guided through the lateral and posterior openings of the head coil, secured with foam padding to reduce motion and minimize MR-related artifacts. Moreover, given the extended nature of nocturnal sleep recordings, the 20-channel coil helped maintain participant comfort while still achieving high-quality simultaneous EEG-fMRI data.”

      (6) Was the EEG sampling synchronized to the MR scanner (gradient system) clock (the 10 MHz signal; not referring to the volume TTL triggers here)? This is a requirement for stable gradient artifact shape over time and thus accurate gradient noise removal.

      Thank you for raising this important point. We confirm that the EEG sampling was synchronized to the MR scanner’s 10 MHz gradient system clock, ensuring a stable gradient artifact shape over time and enabling accurate artifact removal. This synchronization was achieved using the standard clock synchronization interface of the EEG amplifier, minimizing timing jitter and drift. As a result, the gradient artifact waveform remained stable across volumes, allowing for more effective artifact correction during preprocessing. We appreciate your attention to this critical aspect of EEG-fMRI data acquisition.

      We have made this clearer in the revised manuscript. 

      Methods, Page 19-20 Lines 371-383

      “EEG was recorded simultaneously with fMRI data using an MR-compatible EEG amplifier system (BrainAmps MR-Plus, Brain Products, Germany), along with a specialized electrode cap. The recording was done using 64 channels in the international 10/20 system, with the reference channel positioned at FCz. In order to adhere to polysomnography (PSG) recording standards, six electrodes were removed from the EEG cap: one for electrocardiogram (ECG) recording, two for electrooculogram (EOG) recording, and three for electromyogram (EMG) recording. EEG data was recorded at a sample rate of 5000 Hz, the resistance of the reference and ground channels was kept below 10 kΩ, and the resistance of the other channels was kept below 20 kΩ. To synchronize the EEG and fMRI recordings, the BrainVision recording software (BrainProducts, Germany) was utilized to capture triggers from the MRI scanner. The EEG sampling was synchronized to the MR scanner’s 10 MHz gradient system clock, ensuring a stable gradient artifact shape over time and enabling accurate artifact removal. This was achieved via the standard clock synchronization interface of the EEG amplifier, minimizing timing jitter and drift.”

      (7) The TR is quite long and the voxel size is quite large in comparison to state-of-the-art EPI sequences. What was the rationale behind choosing a sequence with relatively low temporal and spatial resolution?

      We acknowledge that our chosen TR and voxel size are relatively long and large compared to state-of-the-art EPI sequences. This decision was made to optimize the signal-to-noise ratio (SNR) and reduce susceptibility-related distortions, which are particularly critical in EEG-fMRI sleep studies where head motion and physiological noise can be substantial. A longer TR allowed us to sample whole-brain activity with sufficient coverage, while a larger voxel size helped enhance BOLD sensitivity and minimize partial volume effects in deep brain structures such as the thalamus and hippocampus, which are key regions of interest in our study. We appreciate your concern and hope this clarification provides sufficient rationale for our sequence parameters.

      We have made this clearer in the revised manuscript. 

      Methods, Page 20-21 Lines 398-408

      “Then, the “sleep” session began after the participants were instructed to try and fall asleep. For the functional scans, whole-brain images were acquired using k-space and steady-state T2*-weighted gradient echo-planar imaging (EPI) sequence that is sensitive to the BOLD contrast. This measures local magnetic changes caused by changes in blood oxygenation that accompany neural activity (sequence specification: 33 slices in interleaved ascending order, TR = 2000 ms, TE = 30 ms, voxel size = 3.5 × 3.5 × 4.2 mm3, FA = 90°, matrix = 64 × 64, gap = 0.7 mm). A relatively long TR and larger voxel size were chosen to optimize SNR and reduce susceptibility-related distortions, which are critical in EEG-fMRI sleep studies where head motion and physiological noise can be substantial. The longer TR allowed whole-brain coverage with sufficient temporal resolution, while the larger voxel size helped enhance BOLD sensitivity and minimize partial volume effects in deep brain structures (e.g., the thalamus and hippocampus), which are key regions of interest in this study.”

      (8) The anatomically defined ROIs are quite large. It should be elaborated on how this might reduce sensitivity to sleep rhythm-specific activity within sub-regions, especially for the thalamus, which has distinct nuclei involved in sleep functions.

      We appreciate your insight regarding the use of anatomically defined ROIs and their potential limitations in detecting sleep rhythm-specific activity within sub-regions, particularly in the thalamus. Given the distinct functional roles of thalamic nuclei in sleep processes, we acknowledge that using a single, large thalamic ROI may reduce sensitivity to localized activity patterns. To address this, we will discuss this limitation in the revised manuscript, acknowledging that our approach prioritizes whole-structure effects but may not fully capture nucleus-specific contributions.

      Discussion, Page 18 Lines 333-341

      “Despite providing new insights, our study has several limitations. First, our scalp EEG did not directly capture hippocampal ripples, preventing us from conclusively demonstrating triple coupling. Second, the combination of EEG-fMRI and the lack of a memory task limit our ability to parse fine-grained BOLD responses at the DOWN- vs. UP-states of SOs and link observed activations to behavioral outcomes. Third, the use of large anatomical ROIs may mask subregional contributions of specific thalamic nuclei or hippocampal subfields. Finally, without a memory task, we cannot establish a direct behavioral link between sleep-rhythm-locked activation and memory consolidation. Future studies combining techniques such as ultra-high-field fMRI or iEEG with cognitive tasks may refine our understanding of subregional network dynamics and functional significance during sleep.”

      (9) The study reports SO & spindle amplitudes & densities, as well as SO+spindle coupling, to be larger during N2/3 sleep compared to N1 and REM sleep, which is trivial but can be seen as a sanity check of the data. However, the amount of SOs and spindles reported for N1 and REM sleep is concerning, as per definition there should be hardly any (if SOs or spindles occur in N1 it becomes by definition N2, and the interval between spindles has to be considerably large in REM to still be scored as such). Thus, on the one hand, the report of these comparisons takes too much space in the main manuscript as it is trivial, but on the other hand, it raises concerns about the validity of the scoring.

      We appreciate your concern regarding the reported presence of SOs and spindles in N1 and REM sleep and the potential implications. Our detection method for detecting SO, spindle, and coupling were originally designed only for N2&N3 sleep data based on the characteristics of the data itself, and this method is widely recognized and used in the sleep research (Hahn et al., 2020; Helfrich et al., 2019; Helfrich et al., 2018; Ngo, Fell, & Staresina, 2020; Schreiner et al., 2022; Schreiner et al., 2021; Staresina et al., 2015; Staresina et al., 2023). While, because the detection methods for SO and spindle are based on percentiles, this method will always detect a certain number of events when used for other stages (N1 and REM) sleep data, but the differences between these events and those detected in stage N23 remain unclear. We will acknowledge the reasons for these results in the Methods section and emphasize that they are used only for sanity checks.

      Methods, Page 25 Lines 515-524

      “We note that the above methods for detecting SOs, spindles, and their couplings were originally developed for N2 and N3 sleep data, based on the specific characteristics of these stages. These methods are widely recognized in sleep research (Hahn et al., 2020; Helfrich et al., 2019; Helfrich et al., 2018; Ngo, Fell, & Staresina, 2020; Schreiner et al., 2022; Schreiner et al., 2021; Staresina et al., 2015; Staresina et al., 2023). However, because this percentile-based detection approach will inherently identify a certain number of events if applied to other stages (e.g., N1 and REM), the nature of these events in those stages remains unclear compared to N2/N3. We nevertheless identified and reported the detailed descriptive statistics of these sleep rhythms in all sleep stages, under the same operational definitions, both for completeness and as a sanity check. Within the same subject, there should be more SOs, spindles, and their couplings in N2/N3 than in N1 or REM (see also Figure S2-S4, Table S1-S4).”

      (10) Why was electrode F3 used to quantify the occurrence of SOs and spindles? Why not a midline frontal electrode like Fz (or a number of frontal electrodes for SOs) and Cz (or a number of centroparietal electrodes) for spindles to be closer to their maximum topography?

      We appreciate your suggestion regarding electrode selection for SO and spindle quantification. Our choice of F3 was primarily based on previous studies (Massimini et al., 2004; Molle et al., 2011), where bilateral frontal electrodes are commonly used for detecting SOs and spindles. Additionally, we considered the impact of MRI-related noise and, after a comprehensive evaluation, determined that F3 provided an optimal balance between signal quality and artifact minimization. We also acknowledge that alternative electrode choices, such as Fz for SOs and Cz for spindles, could provide additional insights into their topographical distributions.

      (11) Functional connectivity (hippocampus -> thalamus -> cortex (mPFC)) is reported to be increased during SO-spindle coupling and interpreted as evidence for coordination of hippocampo-neocortical communication likely by thalamic spindles. However, functional connectivity was only analysed during coupled SO+spindle events, not during isolated SOs or isolated spindles. Without the direct comparison of the connectivity patterns between these three events, it remains unclear whether this is specific for coupled SO+spindle events or rather associated with one or both of the other isolated events. The PPIs need to be conducted for those isolated events as well and compared statistically to the coupled events.

      We appreciate your critical perspective on our functional connectivity analysis and the interpretation of hippocampus-thalamus-cortex (mPFC) interactions during SO-spindle coupling. We acknowledge that, in the current analysis, functional connectivity was only examined during coupled SO-spindle events, without direct comparison to isolated SOs or isolated spindles. To address this concern, we have conducted PPI analyses for all three ROIs(Hippocampus, Thalamus, mPFC) and all three event types (SO-spindle couplings, isolated SOs, and isolated spindles). Our results indicate that neither isolated SOs nor isolated Spindles yielded significant connectivity changes in all three ROIs, as all failed to survive multiple comparison corrections. This suggests that the observed connectivity increase is specific to SO-spindle coupling, rather than being independently driven by either SOs or spindles alone.

      Results, Page 14 Lines 248-255

      “Crucially, the interaction between FC and SO-spindle coupling revealed that only the functional connectivity of hippocampus -> thalamus (ROI analysis, t(106) = 1.86, p = 0.0328) and thalamus -> mPFC (ROI analysis, t(106) = 1.98, p = 0.0251) significantly increased during SO-spindle coupling, with no significant changes in all other pathways (Fig. 4e). We also conducted PPI analyses for the other two events (SOs and spindles), and neither yielded significant connectivity changes in the three ROIs, as all failed to survive whole-brain FWE correction at the cluster level (p < 0.05). Together, these findings suggest that the thalamus, likely via spindles, coordinates hippocampal-cortical communication selectively during SO-spindle coupling, but not isolated SOs or spindle events alone.”

      (12) The limited temporal resolution of fMRI does indeed not allow for easily distinguishing between fMRI activation patterns related to SO-up- vs. SO-down-states. For this, one could try to extract the amplitudes of SO-up- and SO-down-states separately for each SO event and model them as two separate parametric modulators (with the risk of collinearity as they are likely correlated).

      We appreciate your insightful comment regarding the challenge of distinguishing fMRI activation patterns related to SO-up vs. SO-down states due to the limited temporal resolution of fMRI. While our current analysis does not differentiate between these two phases, we acknowledge that separately modeling SO-up and SO-down states using parametric modulators could provide a more refined understanding of their distinct neural correlates. However, as you notes, this approach carries the risk of collinearity, and there is indeed a high correlation between the two amplitudes across all subjects in our results (r=0.98). Future studies could explore more on leveraging high-temporal-resolution techniques. While implementing this in the current study is beyond our scope, we will acknowledge this limitation in the Discussion section.

      Discussion, Page 17 Lines 308-322

      “An intriguing aspect of our findings is the reduced DMN activity during SOs when modeled at the SO trough (DOWN-state). This reduced DMN activity may reflect large-scale neural inhibition characteristic of the SO trough. The DMN is typically active during internally oriented cognition (e.g., self-referential processing or mind-wandering) and is suppressed during external stimuli processing (Yeshurun, Nguyen, & Hasson, 2021). It is unlikely, however, that this suppression of DMN during SO events is related to a shift from internal cognition to external responses given it is during deep sleep time. Instead, it could be driven by the inherent rhythmic pattern of SOs, which makes it difficult to separate UP- from DOWN-states (the two temporal regressors were highly correlated, and similar brain activation during SOs events was obtained if modelled at the SO peak instead, Fig. S5). Since the amplitude at the SO trough is consistently larger than that at the SO peak, the neural activation we detected may primarily capture the large-scale inhibition from DOWN-state. Interestingly, no such DMN reduction was found during SO-spindle coupling, implying that coupling may involve distinct neural dynamics that partially re-engage DMN-related processes, possibly reflecting memory-related reactivation. Future research using high-temporal-resolution techniques like iEEG could clarify these possibilities.”

      Discussion, Page 18 Lines 333-341

      “Despite providing new insights, our study has several limitations. First, our scalp EEG did not directly capture hippocampal ripples, preventing us from conclusively demonstrating triple coupling. Second, the combination of EEG-fMRI and the lack of a memory task limit our ability to parse fine-grained BOLD responses at the DOWN- vs. UP-states of SOs and link observed activations to behavioral outcomes. Third, the use of large anatomical ROIs may mask subregional contributions of specific thalamic nuclei or hippocampal subfields. Finally, without a memory task, we cannot establish a direct behavioral link between sleep-rhythm-locked activation and memory consolidation. Future studies combining techniques such as ultra-high-field fMRI or iEEG with cognitive tasks may refine our understanding of subregional network dynamics and functional significance during sleep.”

      (13) L327: "It is likely that our findings of diminished DMN activity reflect brain activity during the SO DOWN-state, as this state consistently shows higher amplitude compared to the UP-state within subjects, which is why we modelled the SO trough as its onset in the fMRI analysis." This conclusion is not justified as the fact that SO down-states are larger in amplitude does not mean their impact on the BOLD response is larger.

      We appreciate your concern regarding our interpretation of diminished DMN activity reflecting the SO down-state. We acknowledge that the current expression is somewhat misleading, and our interpretation of it is: it could be driven by the inherent rhythmic pattern of SOs, which makes it difficult to separate UP- from DOWN-states (the two temporal regressors were highly correlated, and similar brain activation during SOs events was obtained if modelled at the SO peak instead). Since the amplitude at the SO trough is consistently larger than that at the SO peak, the neural activation we detected may primarily capture the large-scale inhibition from DOWN-state. And we will make this clear in the Discussion section.

      Discussion, Page 17 Lines 308-322

      “An intriguing aspect of our findings is the reduced DMN activity during SOs when modeled at the SO trough (DOWN-state). This reduced DMN activity may reflect large-scale neural inhibition characteristic of the SO trough. The DMN is typically active during internally oriented cognition (e.g., self-referential processing or mind-wandering) and is suppressed during external stimuli processing (Yeshurun, Nguyen, & Hasson, 2021). It is unlikely, however, that this suppression of DMN during SO events is related to a shift from internal cognition to external responses given it is during deep sleep time. Instead, it could be driven by the inherent rhythmic pattern of SOs, which makes it difficult to separate UP- from DOWN-states (the two temporal regressors were highly correlated, and similar brain activation during SOs events was obtained if modelled at the SO peak instead, Fig. S5). Since the amplitude at the SO trough is consistently larger than that at the SO peak, the neural activation we detected may primarily capture the large-scale inhibition from DOWN-state. Interestingly, no such DMN reduction was found during SO-spindle coupling, implying that coupling may involve distinct neural dynamics that partially re-engage DMN-related processes, possibly reflecting memory-related reactivation. Future research using high-temporal-resolution techniques like iEEG could clarify these possibilities.”

      (14) Line 77: "In the current study, while directly capturing hippocampal ripples with scalp EEG or fMRI is difficult, we expect to observe hippocampal activation in fMRI whenever SOs-spindles coupling is detected by EEG, if SOs- spindles-ripples triple coupling occurs during human NREM sleep". Not all SO-spindle events are associated with ripples (Staresina et al., 2015), but hippocampal activation may also be expected based on the occurrence of spindles alone (Bergmann et al., 2012).

      We appreciate your clarification regarding the relationship between SO-spindle coupling and hippocampal ripples. We acknowledge that not all SO-spindle events are necessarily accompanied by ripples (Staresina et al., 2015). However, based on previous research, we found that hippocampal ripples are significantly more likely to occur during SO-spindle coupling events. This suggests that while ripple occurrence is not guaranteed, SO-spindle coupling creates a favorable network state for ripple generation and potential hippocampal activation. To ensure accuracy, we will revise the manuscript to delete this misleading sentence in the Introduction section and acknowledge in the Discussion that our results cannot conclusively directly observe the triple coupling of SO, spindle, and hippocampal ripples.

      Discussion, Page 18 Lines 333-341

      “Despite providing new insights, our study has several limitations. First, our scalp EEG did not directly capture hippocampal ripples, preventing us from conclusively demonstrating triple coupling. Second, the combination of EEG-fMRI and the lack of a memory task limit our ability to parse fine-grained BOLD responses at the DOWN- vs. UP-states of SOs and link observed activations to behavioral outcomes. Third, the use of large anatomical ROIs may mask subregional contributions of specific thalamic nuclei or hippocampal subfields. Finally, without a memory task, we cannot establish a direct behavioral link between sleep-rhythm-locked activation and memory consolidation. Future studies combining techniques such as ultra-high-field fMRI or iEEG with cognitive tasks may refine our understanding of subregional network dynamics and functional significance during sleep.”

      Reviewer #2 (Public review):

      In this study, Wang and colleagues aimed to explore brain-wide activation patterns associated with NREM sleep oscillations, including slow oscillations (SOs), spindles, and SO-spindle coupling events. Their findings reveal that SO-spindle events corresponded with increased activation in both the thalamus and hippocampus. Additionally, they observed that SO-spindle coupling was linked to heightened functional connectivity from the hippocampus to the thalamus, and from the thalamus to the medial prefrontal cortex-three key regions involved in memory consolidation and episodic memory processes.

      This study's findings are timely and highly relevant to the field. The authors' extensive data collection, involving 107 participants sleeping in an fMRI while undergoing simultaneous EEG recording, deserves special recognition. If shared, this unique dataset could lead to further valuable insights. While the conclusions of the data seem overall well supported by the data, some aspects with regard to the detection of sleep oscillations need clarification.

      The authors report that coupled SO-spindle events were most frequent during NREM sleep (2.46 [plus minus] 0.06 events/min), but they also observed a surprisingly high occurrence of these events during N1 and REM sleep (2.23 [plus minus] 0.09 and 2.32 [plus minus] 0.09 events/min, respectively), where SO-spindle coupling would not typically be expected. Combined with the relatively modest SO amplitudes reported (~25 µV, whereas >75 µV would be expected when using mastoids as reference electrodes), this raises the possibility that the parameters used for event detection may not have been conservative enough - or that sleep staging was inaccurately performed. This issue could present a significant challenge, as the fMRI findings are largely dependent on the reliability of these detected events.

      Thank you very much for your thorough and encouraging review. We appreciate your recognition of the significance and relevance of our study and dataset, particularly in highlighting how simultaneous EEG-fMRI recordings can provide complementary insights into the temporal dynamics of neural oscillations and their associated spatial activation patterns during sleep. In the sections that follow, we address each of your comments in detail. We have revised the text and conducted additional analyses wherever possible to strengthen our argument, clarify our methodological choices. We believe these revisions improve the clarity and rigor of our work, and we thank you for helping us refine it.

      We appreciate your insightful comments regarding the detection of sleep oscillations. Our methods for detecting SOs, spindles, and their couplings were originally developed for N2 and N3 sleep data, based on the specific characteristics of these stages. These methods are widely recognized in sleep research (Hahn et al., 2020; Helfrich et al., 2019; Helfrich et al., 2018; Ngo, Fell, & Staresina, 2020; Schreiner et al., 2022; Schreiner et al., 2021; Staresina et al., 2015; Staresina et al., 2023). However, because this percentile-based detection approach will inherently identify a certain number of events if applied to other stages (e.g., N1 and REM), the nature of these events in those stages remains unclear compared to N2/N3. We nevertheless identified and reported the detailed descriptive statistics of these sleep rhythms in all sleep stages, under the same operational definitions, both for completeness and as a sanity check. Within the same subject, there should be more SOs, spindles, and their couplings in N2/N3 than in N1 or REM. We will acknowledge the reasons for these results in the Methods section and emphasize that they are used only for sanity checks.

      Regarding the reported SO amplitudes (~25 µV), during preprocessing, we applied the Signal Space Projection (SSP) method to more effectively remove MRI gradient artifacts and cardiac pulse noise. While this approach enhances data quality, it also reduces overall signal power, leading to systematically lower reported amplitudes. Despite this, our SO detection in NREM sleep (especially N2/N3) remain physiologically meaningful and are consistent with previous fMRI studies using similar artifact removal techniques. We appreciate your careful evaluation and valuable suggestions.

      In addition, we will provide comprehensive tables in the supplementary materials, contains descriptive information about sleep-related characteristics (Table S1), as well as detailed information about sleep waves at each sleep stage for all 107 subjects(Table S2-S4), listing for each subject:(1)Different sleep stage duration; (2)Number of detected SOs; (3)Number of detected spindles; (4)Number of detected SO-spindle coupling events; (2)Density of detected SOs; (3)Density of detected spindles; (4)Density of detected SO-spindle coupling events.

      Methods, Page 25 Lines 515-524

      “We note that the above methods for detecting SOs, spindles, and their couplings were originally developed for N2 and N3 sleep data, based on the specific characteristics of these stages. These methods are widely recognized in sleep research (Hahn et al., 2020; Helfrich et al., 2019; Helfrich et al., 2018; Ngo, Fell, & Staresina, 2020; Schreiner et al., 2022; Schreiner et al., 2021; Staresina et al., 2015; Staresina et al., 2023). However, because this percentile-based detection approach will inherently identify a certain number of events if applied to other stages (e.g., N1 and REM), the nature of these events in those stages remains unclear compared to N2/N3. We nevertheless identified and reported the detailed descriptive statistics of these sleep rhythms in all sleep stages, under the same operational definitions, both for completeness and as a sanity check. Within the same subject, there should be more SOs, spindles, and their couplings in N2/N3 than in N1 or REM (see also Figure S2-S4, Table S1-S4).”

      Supplementary Materials, Page 42-54, Table S1-S4

      Reviewer #3 (Public review):

      Summary:

      Wang et al., examined the brain activity patterns during sleep, especially when locked to those canonical sleep rhythms such as SO, spindle, and their coupling. Analyzing data from a large sample, the authors found significant coupling between spindles and SOs, particularly during the upstate of the SO. Moreover, the authors examined the patterns of whole-brain activity locked to these sleep rhythms. To understand the functional significance of these brain activities, the authors further conducted open-ended cognitive state decoding and found a variety of cognitive processing may be involved during SO-spindle coupling and during other sleep events. The authors next investigated the functional connectivity analyses and found enhanced connectivity between the hippocampus, the thalamus, and the medial PFC. These results reinforced the theoretical model of sleep-dependent memory consolidation, such that SO-spindle coupling is conducive to systems-level memory reactivation and consolidation.

      Strengths:

      There are obvious strengths in this work, including the large sample size, state-of-the-art neuroimaging and neural oscillation analyses, and the richness of results.

      Weaknesses:

      Despite these strengths and the insights gained, there are weaknesses in the design, the analyses, and inferences.

      Thank you for your detailed and thoughtful review of our manuscript. We are delighted that you recognize our advanced analysis methods and rich results of neuroimaging and neural oscillations as well as the large sample size data. In the following sections, we provide detailed responses to each of your comments. And we have revised the text and conducted additional analyses to strengthen our arguments and clarify our methodological choices. We believe these revisions enhance the clarity and rigor of our work, and we sincerely appreciate your thoughtful feedback in helping us refine the manuscript.

      (1) A repeating statement in the manuscript is that brain activity could indicate memory reactivation and thus consolidation. This is indeed a highly relevant question that could be informed by the current data/results. However, an inherent weakness of the design is that there is no memory task before and after sleep. Thus, it is difficult (if not impossible) to make a strong argument linking SO/spindle/coupling-locked brain activity with memory reactivation or consolidation.

      We appreciate your suggestion regarding the lack of a pre- and post-sleep memory task in our study design. We acknowledge that, in the absence of behavioral measures, it is hard to directly link SO-spindle coupling to memory consolidation in an outcome-driven manner. Our interpretation is instead based on the well-established role of these oscillations in memory processes, as demonstrated in previous studies. We sincerely appreciate this feedback and will adjust our Discussion accordingly to reflect a more precise interpretation of our findings.

      Discussion, Page 18 Lines 333-341

      “Despite providing new insights, our study has several limitations. First, our scalp EEG did not directly capture hippocampal ripples, preventing us from conclusively demonstrating triple coupling. Second, the combination of EEG-fMRI and the lack of a memory task limit our ability to parse fine-grained BOLD responses at the DOWN- vs. UP-states of SOs and link observed activations to behavioral outcomes. Third, the use of large anatomical ROIs may mask subregional contributions of specific thalamic nuclei or hippocampal subfields. Finally, without a memory task, we cannot establish a direct behavioral link between sleep-rhythm-locked activation and memory consolidation. Future studies combining techniques such as ultra-high-field fMRI or iEEG with cognitive tasks may refine our understanding of subregional network dynamics and functional significance during sleep.”

      (2) Relatedly, to understand the functional implications of the sleep rhythm-locked brain activity, the authors employed the "open-ended cognitive state decoding" method. While this method is interesting, it is rather indirect given that there were no behavioral indices in the manuscript. Thus, discussions based on these analyses are speculative at best. Please either tone down the language or find additional evidence to support these claims.

      Moreover, the results from this method are difficult to understand. Figure 3e showed that for all three types of sleep events (SO, spindle, SO-spindle), the same mental states (e.g., working memory, episodic memory, declarative memory) showed opposite directions of activation (left and right panels showed negative and positive activation, respectively). How to interpret these conflicting results? This ambiguity is also reflected by the term used: declarative memory and episodic memories are both indexed in the results. Yet these two processes can be largely overlapped. So which specific memory processes do these brain activity patterns reflect? The Discussion shall discuss these results and the limitations of this method.

      We appreciate your critical assessment of the open-ended cognitive state decoding method and its interpretational challenges. Given the concerns about the indirectness of this approach, we decided to remove its related content and results from Figure 3 in the main text and include it in Supplementary Figure 7. 

      Due to the complexity of memory-related processes, we acknowledge that distinguishing between episodic and declarative memory based solely on this approach is not straightforward. We will revise the Supplementary Materials to explicitly discuss these limitations and clarify that our findings do not isolate specific cognitive processes but rather suggest general associations with memory-related networks.

      Discussion, Page 17-18 Lines 323-332

      “To explore functional relevance, we employed an open-ended cognitive state decoding approach using meta-analytic data (NeuroSynth: Yarkoni et al. (2011)). Although this method usefully generates hypotheses about potential cognitive processes, particularly in the absence of a pre- and post-sleep memory task, it is inherently indirect. Many cognitive terms showed significant associations (16 of 50), such as “episodic memory,” “declarative memory,” and “working memory.” We focused on episodic/declarative memory given the known link with hippocampal reactivation (Diekelmann & Born, 2010; Staresina et al., 2015; Staresina et al., 2023). Nonetheless, these inferences regarding memory reactivation should be interpreted cautiously without direct behavioral measures. Future research incorporating explicit tasks before and after sleep would more rigorously validate these potenial functional claims.”

      (3) The coupling strength is somehow inconsistent with prior results (Hahn et al., 2020, eLife, Helfrich et al., 2018, Neuron). Specifically, Helfrich et al. showed that among young adults, the spindle is coupled to the peak of the SO. Here, the authors reported that the spindles were coupled to down-to-up transitions of SO and before the SO peak. It is possible that participants' age may influence the coupling (see Helfrich et al., 2018). Please discuss the findings in the context of previous research on SO-spindle coupling.

      We appreciate your concern regarding the temporal characteristics of SO-spindle coupling. We acknowledge that the SO-spindle coupling phase results in our study are not identical to those reported by Hahn et al. (2020); Helfrich et al. (2018). However, these differences may arise due to slight variations in event detection parameters, which can influence the precise phase estimation of coupling. Notably, Hahn et al. (2020) also reported slight discrepancies in their group-level coupling phase results, highlighting that methodological differences can contribute to variability across studies. Furthermore, our findings are consistent with those of Schreiner et al. (2021), further supporting the robustness of our observations.  

      That said, we acknowledge that our original description of SO-spindle coupling as occurring at the "transition from the lower state to the upper state" was not entirely precise. The -π/2 phase represents the true transition point, while our observed coupling phase is actually closer to the SO peak rather than strictly at the transition. We will revise this statement in the manuscript to ensure clarity and accuracy in describing the coupling phase.  

      Discussion, Page 16 Lines 283-291

      “Our data provide insights into the neurobiological underpinnings of these sleep rhythms. SOs, originating mainly in neocortical areas such as the mPFC, alternate between DOWN- and UP-states. The thalamus generates sleep spindles, which in turn couple with SOs. Our finding that spindle peaks consistently occurred slightly before the UP-state peak of SOs (in 83 out of 107 participants), concurs with prior studies, including Schreiner et al. (2021). Yet it differs from some results suggesting spindles might peak right at the SO UP-state (Hahn et al., 2020; Helfrich et al., 2018). Such discrepancies could arise from differences in detection algorithms, participant age (Helfrich et al., 2018), or subtle variations in cortical-thalamic timing. Nonetheless, these results underscore the importance of coordinated SO-spindle interplay in supporting sleep-dependent processes.”

      (4) The discussion is rather superficial with only two pages, without delving into many important arguments regarding the possible functional significance of these results. For example, the author wrote, "This internal processing contrasts with the brain patterns associated with external tasks, such as working memory." Without any references to working memory, and without delineating why WM is considered as an external task even working memory operations can be internal. Similarly, for the interesting results on SO and reduced DMN activity, the authors wrote "The DMN is typically active during wakeful rest and is associated with self-referential processes like mind-wandering, daydreaming, and task representation (Yeshurun, Nguyen, & Hasson, 2021). Its reduced activity during SOs may signal a shift towards endogenous processes such as memory consolidation." This argument is flawed. DMN is active during self-referential processing and mind-wandering, i.e., when the brain shifts from external stimuli processing to internal mental processing. During sleep, endogenous memory reactivation and consolidation are also part of the internal mental processing given the lack of external environmental stimulation. So why during SO or during memory consolidation, the DMN activity would be reduced? Were there differences in DMN activity between SO and SO-spindle coupling events?

      We appreciate your concerns regarding the brevity of the discussion and the need for clearer theoretical arguments. We will expand this section to provide more in-depth interpretations of our findings in the context of prior literature. Regarding working memory (WM), we acknowledge that our phrasing was ambiguous. We will modify this statement in the Discussion section.

      For the SO-related reduction in DMN activity, we recognize the need for a more precise explanation. This reduced DMN activity may reflect large-scale neural inhibition characteristic of the SO trough. The DMN is typically active during internally oriented cognition (e.g., self-referential processing or mind-wandering) and is suppressed during external stimuli processing (Yeshurun, Nguyen, & Hasson, 2021). It is unlikely, however, that this suppression of DMN during SO events is related to a shift from internal cognition to external responses given it is during deep sleep time. Instead, it could be driven by the inherent rhythmic pattern of SOs, which makes it difficult to separate UP- from DOWN-states (the two temporal regressors were highly correlated, and similar brain activation during SOs events was obtained if modelled at the SO peak instead). Since the amplitude at the SO trough is consistently larger than that at the SO peak, the neural activation we detected may primarily capture the large-scale inhibition from DOWN-state.

      To address your final question, we have conducted the additional post hoc comparison of DMN activity between isolated SOs and SO-spindle coupling events. Our results indicate that

      DMN activation during SOs was significantly lower than during SO-spindle coupling (t(106) = -4.17, p < 1e-4). This suggests that SO-spindle coupling may involve distinct neural dynamics that partially re-engage DMN-related processes, possibly reflecting memory-related reactivation. We appreciate your constructive feedback and will integrate these expanded analyses and discussions into our revised manuscript.

      Results, Page 11 Lines 199-208

      “Spindles were correlated with positive activation in the thalamus (ROI analysis, t(106) = 15.39, p < 1e-4), the anterior cingulate cortex (ACC), and the putamen, alongside deactivation in the DMN (Fig. 3c). Notably, SO-spindle coupling was linked to significant activation in both the thalamus (ROI analysis, t(106) \= 3.38, p = 0.0005) and the hippocampus (ROI analysis, t(106) \= 2.50, p = 0.0070, Fig. 3d). However, no decrease in DMN activity was found during SO-spindle coupling, and DMN activity during SO was significantly lower than during coupling (ROI analysis, t(106) \= -4.17, p < 1e-4). For more detailed activation patterns, see Table S5-S7. We also varied the threshold used to detect SO events to assess its effect on hippocampal activation during SO-spindle coupling and observed that hippocampal activation remained significant when the percentile thresholds for SO detection ranged between 71% and 80% (see Fig. S6).”

      Discussion, Page 17-18 Lines 308-332

      “An intriguing aspect of our findings is the reduced DMN activity during SOs when modeled at the SO trough (DOWN-state). This reduced DMN activity may reflect large-scale neural inhibition characteristic of the SO trough. The DMN is typically active during internally oriented cognition (e.g., self-referential processing or mind-wandering) and is suppressed during external stimuli processing (Yeshurun, Nguyen, & Hasson, 2021). It is unlikely, however, that this suppression of DMN during SO events is related to a shift from internal cognition to external responses given it is during deep sleep time. Instead, it could be driven by the inherent rhythmic pattern of SOs, which makes it difficult to separate UP- from DOWN-states (the two temporal regressors were highly correlated, and similar brain activation during SOs events was obtained if modelled at the SO peak instead, Fig. S5). Since the amplitude at the SO trough is consistently larger than that at the SO peak, the neural activation we detected may primarily capture the large-scale inhibition from DOWN-state. Interestingly, no such DMN reduction was found during SO-spindle coupling, implying that coupling may involve distinct neural dynamics that partially re-engage DMN-related processes, possibly reflecting memory-related reactivation. Future research using high-temporal-resolution techniques like iEEG could clarify these possibilities.

      To explore functional relevance, we employed an open-ended cognitive state decoding approach using meta-analytic data (NeuroSynth: Yarkoni et al. (2011)). Although this method usefully generates hypotheses about potential cognitive processes, particularly in the absence of a pre- and post-sleep memory task, it is inherently indirect. Many cognitive terms showed significant associations (16 of 50), such as “episodic memory,” “declarative memory,” and “working memory.” We focused on episodic/declarative memory given the known link with hippocampal reactivation (Diekelmann & Born, 2010; Staresina et al., 2015; Staresina et al., 2023). Nonetheless, these inferences regarding memory reactivation should be interpreted cautiously without direct behavioral measures. Future research incorporating explicit tasks before and after sleep would more rigorously validate these potential functional claims.”

      Recommendations for the authors:

      Reviewing Editor Comment:

      The reviewers think that you are working on a relevant and important topic. They are praising the large sample size used in the study. The reviewers are not all in line regarding the overall significance of the findings, but they all agree the paper would strongly benefit from some extra work, as all reviewers raise various critical points that need serious consideration.

      We appreciate your recognition of the relevance and importance of our study, as well as your acknowledgment of the large sample size as a strength of our work. We understand that there are differing perspectives regarding the overall significance of our findings, and we value the constructive critiques provided. We are committed to addressing the key concerns raised by all reviewers, including refining our analyses, clarifying our interpretations, and incorporating additional discussions to strengthen the manuscript. Below, we address your specific recommendations and provide responses to each point you raised to ensure our methods and results are as transparent and comprehensible as possible. We believe that these revisions will significantly enhance the rigor and impact of our study, and we sincerely appreciate your thoughtful feedback in helping us improve our work.

      Reviewer #1 (Recommendations for the authors):

      (1) The phrase "overnight sleep" suggests an entire night, while these were rather "nocturnal naps". Please rephrase.

      Response: Thank you for pointing this out. We have revised the phrasing in our manuscript to "nocturnal naps" instead of "overnight sleep" to more accurately reflect the duration of the sleep recordings.

      (2) Sleep staging results (macroscopic sleep architecture) should be provided in more detail (at least min and % of the different sleep stages, sleep onset latency, total sleep duration, total recording duration), at least mean/SD/range.

      Thank you for this suggestion. We will provide comprehensive tables in the supplementary materials, contains descriptive information about sleep-related characteristics. This information will help provide a clearer overview of the macroscopic sleep architecture in our dataset.

      Reviewer #2 (Recommendations for the authors):

      In order to allow for a better estimation of the reliability of the detected sleep events, please:

      (1) Provide densities and absolute numbers of all detected SOs and spindles (N1, NREM, and REM sleep).

      Thank you for pointing this out. We will provide comprehensive tables in the supplementary materials, contains detailed information about sleep waves at each sleep stage for all 107 subjects (Table S2-S4), listing for each subject:1) Different sleep stage duration; 2) Number of detected SOs; 3) Number of detected spindles; 4) Number of detected SO-spindle coupling events; 5) Density of detected SOs; 6) Density of detected spindles; 7) Density of detected SO-spindle coupling events.

      Supplementary Materials, Page 43-54, Table S2-S4

      (2) Show ERPs for all detected SOs and spindles (per sleep stage).

      Thank you for the suggestion. We will provide ERPs for all detected SOs and spindles, separated by sleep stage (N1, N2&N3, and REM) in supplementary Fig. S2-S4. These ERP waveforms will help illustrate the characteristic temporal profiles of SOs and spindles across different sleep stages.

      Methods, Page 25, Line 525-532

      “Event-related potentials (ERP) analysis. After completing the detection of each sleep rhythm event, we performed ERP analyses for SOs, spindles, and coupling events in different sleep stages. Specifically, for SO events, we took the trough of the DOWN-state of each SO as the zero-time point, then extracted data in a [-2 s to 2 s] window from the broadband (0.1–30 Hz) EEG and used [-2 s to -0.5 s] for baseline correction; the results were then averaged across 107 subjects (see Fig. S2a). For spindle events, we used the peak of each spindle as the zero-time point and applied the same data extraction window and baseline correction before averaging across 107 subjects (see Fig. S2b). Finally, for SO-spindle coupling events, we followed the same procedure used for SO events (see Fig. 2a, Figs. S3–S4).”

      (3) Provide detailed info concerning sleep characteristics (time spent in each sleep stage etc.).

      Thank you for this suggestion. Same as the response above, we will provide comprehensive tables in the supplementary materials, contains descriptive information about sleep-related characteristics.

      Supplementary Materials, Page 42, Table S1 (same as above)

      (4) What would happen if more stringent parameters were used for event detection? Would the authors still observe a significant number of SO spindles during N1 and REM? Would this affect the fMRI-related results?

      Thank you for this suggestion. Our methods for detecting SOs, spindles, and their couplings were originally developed for N2 and N3 sleep data, based on the specific characteristics of these stages. These methods are widely recognized in sleep research (Hahn et al., 2020; Helfrich et al., 2019; Helfrich et al., 2018; Ngo, Fell, & Staresina, 2020; Schreiner et al., 2022; Schreiner et al., 2021; Staresina et al., 2015; Staresina et al., 2023). However, because this percentile-based detection approach will inherently identify a certain number of events if applied to other stages (e.g., N1 and REM), the nature of these events in those stages remains unclear compared to N2/N3. We nevertheless identified and reported the detailed descriptive statistics of these sleep rhythms in all sleep stages, under the same operational definitions, both for completeness and as a sanity check. Within the same subject, there should be more SOs, spindles, and their couplings in N2/N3 than in N1 or REM (see also Figure S2-S4, Table S1-S4).

      Furthermore, in order to explore the impact of this on our fMRI results, we conducted an additional sensitivity analysis by applying different detection parameters for SOs. Specifically, we adjusted amplitude percentile thresholds for SO detection (the parameter that has the greatest impact on the results). We used the hippocampal activation value during N2&N3 stage SO-spindle coupling as an anchor value and found that when the parameters gradually became stricter, the results were similar to or even better than the current results. However, when we continued to increase the threshold, the results began to gradually decrease until the threshold was increased to 80%, and the results were no longer significant. This indicates that our results are robust within a specific range of parameters, but as the threshold increases, the number of trials decreases, ultimately weakening the statistical power of the fMRI analysis.

      Thank you again for your suggestions on sleep rhythm event detection. We will add the results in Supplementary and revise our manuscript accordingly.

      Results, Page 11, Line 199-208

      “Spindles were correlated with positive activation in the thalamus (ROI analysis, t(106) = 15.39, p < 1e-4), the anterior cingulate cortex (ACC), and the putamen, alongside deactivation in the DMN (Fig. 3c). Notably, SO-spindle coupling was linked to significant activation in both the thalamus (ROI analysis, t(106) \= 3.38, p = 0.0005) and the hippocampus (ROI analysis, t(106) \= 2.50, p = 0.0070, Fig. 3d). However, no decrease in DMN activity was found during SO-spindle coupling, and DMN activity during SO was significantly lower than during coupling (ROI analysis, t(106) \= -4.17, p < 1e-4). For more detailed activation patterns, see Table S5-S7. We also varied the threshold used to detect SO events to assess its effect on hippocampal activation during SO-spindle coupling and observed that hippocampal activation remained significant when the percentile thresholds for SO detection ranged between 71% and 80% (see Fig. S6).”

      Finally, we sincerely thank all again for your thoughtful and constructive feedback. Your insights have been invaluable in refining our analyses, strengthening our interpretations, and improving the clarity and rigor of our manuscript. We appreciate the time and effort you have dedicated to reviewing our work, and we are grateful for the opportunity to enhance our study based on your recommendations.  

      References:

      Bergmann, T. O., Mölle, M., Diedrichs, J., Born, J., & Siebner, H. R. (2012). Sleep spindle-related reactivation of category-specific cortical regions after learning face-scene associations. NeuroImage, 59(3), 2733-2742. 

      Buzsáki, G. (2015). Hippocampal sharp wave‐ripple: A cognitive biomarker for episodic memory and planning. Hippocampus, 25(10), 1073-1188. 

      Caporro, M., Haneef, Z., Yeh, H. J., Lenartowicz, A., Buttinelli, C., Parvizi, J., & Stern, J. M. (2012). Functional MRI of sleep spindles and K-complexes. Clinical neurophysiology, 123(2), 303-309. 

      Coulon, P., Budde, T., & Pape, H.-C. (2012). The sleep relay—the role of the thalamus in central and decentral sleep regulation. Pflügers Archiv-European Journal of Physiology, 463, 53-71. 

      Crunelli, V., Lőrincz, M. L., Connelly, W. M., David, F., Hughes, S. W., Lambert, R. C., Leresche, N., & Errington, A. C. (2018). Dual function of thalamic low-vigilance state oscillations: rhythm-regulation and plasticity. Nature Reviews Neuroscience, 19(2), 107-118. 

      Czisch, M., Wehrle, R., Stiegler, A., Peters, H., Andrade, K., Holsboer, F., & Sämann, P. G. (2009). Acoustic oddball during NREM sleep: a combined EEG/fMRI study. PloS one, 4(8), e6749. 

      Diba, K., & Buzsáki, G. (2007). Forward and reverse hippocampal place-cell sequences during ripples. Nature Neuroscience, 10(10), 1241. 

      Diekelmann, S., & Born, J. (2010). The memory function of sleep. Nature Reviews Neuroscience, 11(2), 114-126. 

      Fogel, S., Albouy, G., King, B. R., Lungu, O., Vien, C., Bore, A., Pinsard, B., Benali, H., Carrier, J., & Doyon, J. (2017). Reactivation or transformation? Motor memory consolidation associated with cerebral activation time-locked to sleep spindles. PloS one, 12(4), e0174755. 

      Hahn, M. A., Heib, D., Schabus, M., Hoedlmoser, K., & Helfrich, R. F. (2020). Slow oscillation-spindle coupling predicts enhanced memory formation from childhood to adolescence. Elife, 9, e53730. 

      Halassa, M. M., Siegle, J. H., Ritt, J. T., Ting, J. T., Feng, G., & Moore, C. I. (2011). Selective optical drive of thalamic reticular nucleus generates thalamic bursts and cortical spindles. Nature Neuroscience, 14(9), 1118-1120. 

      Hale, J. R., White, T. P., Mayhew, S. D., Wilson, R. S., Rollings, D. T., Khalsa, S., Arvanitis, T. N., & Bagshaw, A. P. (2016). Altered thalamocortical and intra-thalamic functional connectivity during light sleep compared with wake. NeuroImage, 125, 657-667. 

      Helfrich, R. F., Lendner, J. D., Mander, B. A., Guillen, H., Paff, M., Mnatsakanyan, L., Vadera, S., Walker, M. P., Lin, J. J., & Knight, R. T. (2019). Bidirectional prefrontal-hippocampal dynamics organize information transfer during sleep in humans. Nature Communications, 10(1), 3572. 

      Helfrich, R. F., Mander, B. A., Jagust, W. J., Knight, R. T., & Walker, M. P. (2018). Old brains come uncoupled in sleep: slow wave-spindle synchrony, brain atrophy, and forgetting. Neuron, 97(1), 221-230. e224. 

      Horovitz, S. G., Fukunaga, M., de Zwart, J. A., van Gelderen, P., Fulton, S. C., Balkin, T. J., & Duyn, J. H. (2008). Low frequency BOLD fluctuations during resting wakefulness and light sleep: A simultaneous EEG‐fMRI study. Human brain mapping, 29(6), 671-682. 

      Huang, Q., Xiao, Z., Yu, Q., Luo, Y., Xu, J., Qu, Y., Dolan, R., Behrens, T., & Liu, Y. (2024). Replay-triggered brain-wide activation in humans. Nature Communications, 15(1), 7185. 

      Ilhan-Bayrakcı, M., Cabral-Calderin, Y., Bergmann, T. O., Tüscher, O., & Stroh, A. (2022). Individual slow wave events give rise to macroscopic fMRI signatures and drive the strength of the BOLD signal in human resting-state EEG-fMRI recordings. Cerebral Cortex, 32(21), 4782-4796. 

      Laufs, H. (2008). Endogenous brain oscillations and related networks detected by surface EEG‐combined fMRI. Human brain mapping, 29(7), 762-769. 

      Laufs, H., Walker, M. C., & Lund, T. E. (2007). ‘Brain activation and hypothalamic functional connectivity during human non-rapid eye movement sleep: an EEG/fMRI study’—its limitations and an alternative approach. Brain, 130(7), e75. 

      Margulies, D. S., Ghosh, S. S., Goulas, A., Falkiewicz, M., Huntenburg, J. M., Langs, G., Bezgin, G., Eickhoff, S. B., Castellanos, F. X., & Petrides, M. (2016). Situating the default-mode network along a principal gradient of macroscale cortical organization. Proceedings of the National Academy of Sciences, 113(44), 12574-12579. 

      Massimini, M., Huber, R., Ferrarelli, F., Hill, S., & Tononi, G. (2004). The sleep slow oscillation as a traveling wave. Journal of Neuroscience, 24(31), 6862-6870. 

      Moehlman, T. M., de Zwart, J. A., Chappel-Farley, M. G., Liu, X., McClain, I. B., Chang, C., Mandelkow, H., Özbay, P. S., Johnson, N. L., & Bieber, R. E. (2019). All-night functional magnetic resonance imaging sleep studies. Journal of neuroscience methods, 316, 83-98. 

      Molle, M., Bergmann, T. O., Marshall, L., & Born, J. (2011). Fast and slow spindles during the sleep slow oscillation: disparate coalescence and engagement in memory processing. Sleep, 34(10), 1411-1421. 

      Ngo, H.-V., Fell, J., & Staresina, B. (2020). Sleep spindles mediate hippocampal-neocortical coupling during long-duration ripples. Elife, 9, e57011. 

      Picchioni, D., Horovitz, S. G., Fukunaga, M., Carr, W. S., Meltzer, J. A., Balkin, T. J., Duyn, J. H., & Braun, A. R. (2011). Infraslow EEG oscillations organize large-scale cortical– subcortical interactions during sleep: a combined EEG/fMRI study. Brain research, 1374, 63-72. 

      Schabus, M., Dang-Vu, T. T., Albouy, G., Balteau, E., Boly, M., Carrier, J., Darsaud, A., Degueldre, C., Desseilles, M., & Gais, S. (2007). Hemodynamic cerebral correlates of sleep spindles during human non-rapid eye movement sleep. Proceedings of the National Academy of Sciences, 104(32), 13164-13169. 

      Schreiner, T., Kaufmann, E., Noachtar, S., Mehrkens, J.-H., & Staudigl, T. (2022). The human thalamus orchestrates neocortical oscillations during NREM sleep. Nature communications, 13(1), 5231. 

      Schreiner, T., Petzka, M., Staudigl, T., & Staresina, B. P. (2021). Endogenous memory reactivation during sleep in humans is clocked by slow oscillation-spindle complexes. Nature Communications, 12(1), 3112. 

      Singh, D., Norman, K. A., & Schapiro, A. C. (2022). A model of autonomous interactions between hippocampus and neocortex driving sleep-dependent memory consolidation. Proceedings of the National Academy of Sciences, 119(44), e2123432119. 

      Spoormaker, V. I., Schröter, M. S., Gleiser, P. M., Andrade, K. C., Dresler, M., Wehrle, R., Sämann, P. G., & Czisch, M. (2010). Development of a large-scale functional brain network during human non-rapid eye movement sleep. Journal of Neuroscience, 30(34), 11379-11387. 

      Staresina, B. P., Bergmann, T. O., Bonnefond, M., van der Meij, R., Jensen, O., Deuker, L., Elger, C. E., Axmacher, N., & Fell, J. (2015). Hierarchical nesting of slow oscillations, spindles and ripples in the human hippocampus during sleep. Nature Neuroscience, 18(11), 1679-1686. 

      Staresina, B. P., Niediek, J., Borger, V., Surges, R., & Mormann, F. (2023). How coupled slow oscillations, spindles and ripples coordinate neuronal processing and communication during human sleep. Nature Neuroscience, 1-9. 

      Yarkoni, T., Poldrack, R. A., Nichols, T. E., Van Essen, D. C., & Wager, T. D. (2011). Large-scale automated synthesis of human functional neuroimaging data. Nature methods, 8(8), 665-670. 

      Yeshurun, Y., Nguyen, M., & Hasson, U. (2021). The default mode network: where the idiosyncratic self meets the shared social world. Nature Reviews Neuroscience, 1-12.

    1. eLife Assessment

      The findings of this study are valuable, offering insights into the neural representation of reversal probability in decision-making tasks, with potential implications for understanding flexible behavior in changing environments. The study contains interesting comparisons between neural data and models, including evidence for partial consistency with line attractor models in this probabilistic reversal learning task. However, it remains incomplete due to issues related to how the RNN training and the analysis of its dynamics, which renders the evidence as not complete.

    2. Reviewer #1 (Public review):

      The authors aimed to investigate how the probability of a reversal in a decision-making task is computed in cortical neurons. They analyzed neural activity in the prefrontal cortex of monkeys and units in recurrent neural networks (RNNs) trained on a similar task. Their goal was to understand how the dynamical systems that implement computation perform a probabilistic reversal learning task in RNNs and nonhuman primates.

      Major strengths and weaknesses:

      Strengths:

      (1) Integrative Approach: The study exemplifies a modern approach by combining empirical data from monkey experiments with computational modeling using RNNs. This integration allows for a more comprehensive understanding of the dynamical systems that implement computation in both biological and artificial neural networks.<br /> (2) The focus on using perturbations to identify causal relationships in dynamical systems is a good goal. This approach aims to go beyond correlational observations.<br /> (3) The revised manuscript provides a more nuanced interpretation of the dynamics, reconciling the observations with aspects of line attractor models.

      Weaknesses:

      (1) The use of targeted dimensionality reduction (TDR) to identify the axis determining reversal probability may not necessarily isolate the dimension along which the RNN computes reversal probability. This should be computed from the RNN update itself rather than through a readout of network variance. Depending on how this is formulated, it could be something like the Jacobian of the state update with respect to inputs at input onset and with respect to the state during relaxation dynamics. This is worth thinking through further. It's important to try to take advantage of access afforded by using RNNs rather than solely relying on analyses available to us in neural data.

      Appraisal of aims and conclusions:

      The authors have substantially revised their interpretation of the results to reconcile their findings with line attractor models. They now acknowledge that their observation of reward integration explaining reversal probability activity (x_rev) is compatible with line attractor models, which addresses one of my main concerns.

      Their expanded analysis now differentiates between two activity modes: (1) substantial non-stationary dynamics during a trial (incompatible with line attractors) and (2) stationary and stable dynamics at trial start (compatible with point attractors and line attractor models). This dual characterization provides a more complete picture of the dynamical system and highlights the composability of dynamical features.

      Likely impact and utility:

      This work makes a stronger contribution to our understanding of how probabilistic information is represented in neural circuits with intervening behaviors. The augmented model that combines elements of attractor dynamics with non-stationary trajectories offers a more comprehensive framework for understanding neural computations in decision-making tasks.

      The data and methods could be useful to the community. While the authors have improved their analysis of network dynamics, additional reverse engineering that takes full advantage of access to the RNN's update equations could further strengthen the work.

    3. Reviewer #2 (Public review):

      Summary:

      In this work the authors trained RNN to perform a reversal task also performed by animals while PFC activity is recorded. The authors devised a new method to train RNN on this type of reversal task, which in principle ensures that the behavior of the RNN matches the behavior of the animal. They then performed some analysis of neural activity, both RNN and PFC recording, focusing on the neural representation of the reversal probability and its evolution across trials. Given the analysis presented, it has been difficult for me to asses at which point RNN can reasonably be compared to PFC recordings.

      Strengths:

      Focusing on a reversal task, the authors address a challenge in RNN training, as they do not use a standard supervised learning procedure where the desired output is available for each trial. They propose a new way of doing that.

      They attempt to confront RNN and neural recordings in behaving animals.

      Weaknesses:

      It would be nice to better articulate the analysis results of the two training set-ups (with and without 0 response during fixation). The dynamical system analysis is confusing, the notions of stationary and non-stationary dynamics and its relationship with attractors are puzzling. Is there a line attractor in one case (with inputs orthogonal to the integration direction being called back to the attractor, and reward input aligned with the stable direction)? In the other case, do we have a cylindrical attracting manifold on which activity circles around and is pushed along the axis of the cylinder by reward inputs? Which case is closest to the PFC recordings?

    4. Reviewer #3 (Public review):

      Summary:

      Kim et al. present a study of the neural dynamics underlying reversal learning in monkey PFC and neural networks. Their main finding is that neural activity during fixation resembles a line attractor storing the current belief of the reversal state of the task. This is followed by richer dynamics unfolding throughout the remainder of the trial, which eventually converge to a new point on the line attractor by the start of the next trial. The idea of studying neural dynamics throughout the task (including intervening behaviour) is interesting, and the data provides some insights into the neural dynamics driving reversal learning. The modelling seems to support the analyses, but both the modelling and analyses also leave several open questions.

      Strengths:

      The paper addresses an interesting topic of the neural dynamics underlying reversal learning in PFC, using a combination of biological and simulated data. Reversal learning has been studied extensively in neuroscience, but this paper takes a step further by analysing neural dynamics throughout the trials instead of focusing on just the evidence integration epoch.

      The authors show some close parallels between the experimental data and RNN simulations, both in terms of behaviour and neural dynamics. The analyses of how rewarded and unrewarded trials differentially affect dynamics throughout the trials in RNNs and PFC were particularly interesting. This work has the potential to provide new insights into the neural underpinnings of reversal learning.

      Weaknesses:

      Data analyses:

      While the analyses seem mostly sound, one shortcoming is that they are all aligned to the inferred reversal trial rather than the true experimental reversal trial. For example, the analyses showing that 'x_rev' decays strongly after the reversal trial, irrespective of the reward outcome, seem like they are true essentially by design. The choice to align to the inferred reversal trial also makes this trial seem 'special' (e.g. in Fig 2 & Fig 6A), but it is unclear whether this is a real feature of the data or an artifact of effectively conditioning on a change in behaviour. It would be useful to investigate whether any of these analyses differ when aligned to the true reversal trial. It is also unsurprising that x_rev increases before the reversal and decreases after the reversal (it is hard to imagine a system where this is not the case), yet all of Fig 6 and several other analyses are devoted to this point.

      Most of the analyses focus on the dynamics specifically in the x_rev subspace, but a major point of the paper is to say that biological (and artificial) networks may also have to do other things at different times in the trial. If that is the case, it would be interesting to also ask what happens in other subspaces of neural activity, which are not specifically related to evidence integration or choice - are there other subspaces that explain substantial variance? Do they relate to any meaningful features of the experiment?

      This is especially important when considering analyses trying to establish the presence (or absence) of attractor dynamics in the circuit. In particular, activity in the x_rev subspace both affects and depends on other subspaces of neural activity, so it is not as meaningful to analyse the dynamics of this subspace in isolation. It would e.g. have been preferable to analyse the early-trial dynamics in the full state space and then possibly projecting onto x_rev, rather than first projecting activity onto x_rev and then fitting a linear autoregressive model.

      Modelling:

      There are a number of surprising and non-standard modelling choices made in this paper. For example, the choice to only use inhibitory neurons is non-conventional and it is not clear whether and how this impacts the results. The inputs are also provided without any learnable input weights, which makes it harder to interpret the input-driven dynamics during the different phases of a trial.

      It is surprising that the RNN is "trained to flip its preferred choice a few trials after the inferred scheduled reversal trial", with the reversal trial inferred by an ideal Bayesian observer. A more natural approach would be to directly train the RNN to solve the task (by predicting the optimal choice) and then investigating the emergent behaviour & dynamics. If the authors prefer their imitation learning approach, it is also surprising that the network is trained to predict the reversal trial inferred using Bayesian smoothing instead of Bayesian filtering.

      Finally, it was surprising that the network is trained and tested with different block lengths (24 & 36 trials, respectively), and it is not mentioned whether or how this affects behaviour.

    5. Author response:

      The following is the authors’ response to the original reviews

      Main revision made to the manuscript

      The main revision made to the manuscript is to reconcile our findings with the line attractor model. The revision is based on Reviewer 1’s comment on reinterpreting our results as a superposition of an attractor model with fast timescale dynamics. We expanded our analysis regime to the start of a trial and characterized the overall within-trial dynamics to reinterpret our findings.

      We first acknolwedge that our results are not in contradiction with evidence integration on a line attractor. As pointed out by the reviewers, our finding that the integration of reward outcome explains the reversal probability activity x_rev (Figure 3) is compatible with the line attractor model. However, the reward integration equation is an algebraic relation and does not characterize the dynamics of reversal probability activity. So a closer analysis on the neural dynamics is needed to assess the feasibility of line attractor.

      In the revised manuscript, we show that x_rev exhibits two different activity modes (Figure 4). First, x_rev has substantial non-stationary dynamics during a trial, and this non-stationary activity is incompatible with the line attractor model, as claimed in the original manuscript. Second, we present new results showing that x_rev is stationary (i.e., constant in time) and stable (i.e., contracting) at the start of a trial. These two properties of x_rev support that it is a point attractor at the start of a trial and is compatible with the line attractor model. 

      We further analyze how the two activity modes are linked (Figure 4, Support vector regression). We show that the non-stationary activity is predictable from the stationary activity if the underlying dynamics can be inferred. In other words, the non-stationary activity during a trial is generated by an underlying dynamics with the initial condition provided by the stationary state at the start of trial.

      These results suggest an extension of the line attractor model where an attractor state at the start of a trial provides an initial condition from which non-stationary activity is generated during a trial by an underlying dynamics associated with task-related behavior (Figure 4, Augmented model). 

      The separability of non-stationary trajectories (Figure 5 and 6) is a property of the non-stationary dynamics that allows separable points in the initial stationary state to remain separable during a trial, thus making it possible to represent distinct probabilistic values in non-stationary activity.

      This revised interpretation of our results (1) retains our original claim that the non-stationary dynamics during a trial is incompatible with the line attractor model and (2) introduces attractor state at the start of a trial which is compatible with the line attractor model. Our anlaysis shows that the two activity modes are linked by an underlying dynamics, and the attractor state serves as initial state to launch the non-stationary activity.

      Responses to the Public Reviews:

      Reviewer # 1:

      (1) To provide better explanation of the reversal learning task and network training method, we added detailed description of RNN and monkey task structure (Result Section 1), included a schematic of target outputs (Figure1B), explained the rationale behind using inhibitory network model (Method Section 1) and explained the supervised RNN training scheme (Result Section 1). This information can also be found in the Methods.

      (2) Our understanding is that the augmented model discussed in the previous page is aligned with the model suggested by Reviewer 1: “a curved line attractor, with faster timescale dynamics superimposed on this structure”. It is likely that the “fast” non-stationary activity observed during the trial is driven by task-related behavior, thus is transient. For instance, we do not observe such non-stationary activity in the inter-trial-interval when the task-related behavior is absent. For this reason, the non-stationary trajectories were not considered to be part of the attractor. Instead, they are transient activity generated by the underlying neural dynamics associated with task-related behavior. We believe such characterization of faster timescale dynamics is consistent with Reviewer 1’s view and wanted to clarify that there are two different activity modes.

      (3) We appreciate the reviewers (Reviewer 1 and Reviewer 2) comment that TDR may be limited in isolating the neural subspace of interest. Our study presents what could be learned from TDR but is by no means the only way to interpret the neural data. It would be of future work to apply other methods for isolating task-related neural activities.

      We would appreciate it if the reviewers could share thoughts on what other alternative methods could better isolate the reversal probability activity.

      Reviewer # 2:

      (1) (i) We respectfully disagree with Reviewer 2’s comment that “no action is required to be performed by neurons in the RNN”. In our network setup, the output of RNN learns to choose a sign (+ or -), as Reviewer 2 pointed out, to make a choice. This is how the RNN takes an action. It is unclear to us what Reviewer 2 has intended by “action” and how reaching a target value (not just taking a sign) would make a significant difference in how the network performs the task. 

      (ii)  From Reviewer 2’s comment that “no intervening behavior is thus performed by neurons”, we noticed that the term “intervening behavior” has caused confusion. It refers to task-related behavior, such as making choices or receiving reward, that the subject must perform across trials before reversing its preferred choice. These are the behaviors that intervene the reversal of preferred choice. To clarify its meaning, in the revised manuscript, we changed the term to “task-related behavior” and put them in context. For example, in the Introduction we state that “However, during a trial, task-related behavior, such as making decisions or receiving feedback, produced …”

      (iii) As pointed out by Reviewer 2, the lack of fixation period in the RNN could make differences in the neural dynamics of RNN and PFC, especially at the start of a trial. We demonstrate this issue in Result Section 4 where we analyze the stationary activity at the start of a trial. We find that fixating the choice output to zero before making a choice promotes stationary activity and makes the RNN activity more similar to the PFC activity.

      Reviewer #3:

      (1) (i) In the previous study (Figure 1 in [Bartolo and Averbeck ‘20]), it was shown that neural activity can predict the behavioral reversal trial. This is the reason we examined the neural activity in the trials centered at the behavioral reversal trial. We explained in Result Section 2 that we followed this line of analysis in our study.

      (ii) We would like to emphasize that the main point of Figures 4 and 5 is to show the separability of neural trajectories: the entire trajectory shifts without overlapping. It is not obvious that high-dimensional neural population activity from two trials should remain separated when their activities are compressed into a one-dimensional subspace. The onedimensional activities can easily collide since their activities are compressed into a lowdimensional space. We revised the manuscript to bring out these points. We added an opening paragraph that discusses separability of trajectories and revised the main text to bring out the findings on separability. 

      (iii) We agree with Reviewer 3 that it would be interesting to look at what happens in other subspace of neural activity that are not related to reversal probability and characterize how different neural subspace interact with each. However, the focus of this paper was the reversal probability activity, and we’d consider these questions out of the scope of current paper. We point out that, using the same dataset, neural activity related to other experimental variables were analyzed in other papers [Bartolo and Averbeck ’20; Tang, Bartolo and Averbeck ‘21] 

      (2) (i) In the revised manuscript, we added explanation on the rational behind choosing inhibitory network as a simplified model for the balanced state. In brief, strong inhibitory recurrent connections with strong excitatory external input operates in the balanced state, as in the standard excitatory-inhibitory network. We included references that studied this inhibitory network. We also explained the technical reason (GPU memory) for choosing the inhibitory model.

      (ii) We thank the reviewer for pointing out that the original manuscript did not mention how the feedback and cue were initialized. They were random vectors sample from Gaussian distribution. We added this information in the revised manuscript. In our opinion, it is common to use random external inputs for training RNNs, as it is a priori unclear how to choose them. In fact, it is possible to analyze the effects of random feedback on one-dimensional x_rev dynamics by projecting the random feedback vector to the reversal probability vector. This is shown in Figure 4F.

      (iii) We agree that it would be more natural to train the RNN to solve the task without using the Bayesian model. We point out this issue in the Discussion in the revised manuscript.

      Recommendations for the authors:

      Reviewer #1:

      (1) My understanding of network training was that a Bayesian ideal observer signaled target output based on previous reward outcomes. However, the authors never mention that networks are trained by supervised learning in the main text until the last paragraph of the discussion. There is no mention that there was an offset in the target based on the behavior of the monkeys in the main text. These are really important things to consider in the context of the network solution after training. I couldn't actually find any figure that presents the target output for the network. Did I miss something key here?

      In Result Section 1, we added a paragraph that describes in detail how the RNN is trained. We explained that the network is first simulated and then the choice outputs and reward outcomes are fed into the Bayesian model to infer the scheduled reversal trial. A few trials are added to the inferred reversal trial to obtain the behavioral reversal trial, as found in a previous study [Bartolo and Averbeck ‘20]. Then the network weights are updated by backpropagation-through-time via supervised learning. 

      In the original manuscript, the target output for the network was described in Methods Section 2.5, Step 4. To make this information readily accessible, we added a schematic in Figure 1B that shows the scheduled, inferred and behavioral reversal trials. It also shows how the target choice ouputs are defined. They switch abruptly at the behavioral reversal trial.

      (2) The role of block structure in the task is an important consideration. What are the statistics of block switches? The authors say on average the reversals are every 36 trials, but also say there are random block switches. The reviewer's notes suggest that both the networks and monkeys may be learning about the typical duration of blocks, which could influence their expectations of reversals. This aspect of the task design should be explained more thoroughly and considered in the context of Figure 1E and 5 results.

      We provided more detailed description of the reversal learning task in Result Section 1. We clarified that (1) a task is completed by executing a block of fixed number of trials and (2) reversal of reward schedule occurrs at a random trial around the mid-trial in a block. The differences in the number of trials in a block that the RNNs (36) and the monkeys (80) perform are also explained. We also pointed out the differences in how the reversal trial is randomly sampled.

      However, it is unclear what Reviewer 1 meant by random block switches. Our reversal learning task is completed when a block of fixed number of trials is executed. Reversal of reward schedule occurs only once on a randomly selected trial in the block, and the reversed reward schedule is maintained until the end of a block. It is different from other versions of reveral learning where the reward schedule switches multiple times across trials. We clarified this point in Result Section 1.

      (3) The relationship between the supervised learning approach used in the RNNs and reinforcement learning was confused in the discussion. "Although RNNs in our study were trained via supervised learning, animals learn a reversal-learning task from reward feedback, making it into a reinforcement learning (RL) problem." This is fundamentally not true. In the case of this work, the outcome of the previous trial updates the target output, rather than the trial and error type learning as is typical in reinforcement learning. Networks are not learning by reinforcement learning and this statement is confusing.

      We agree with Reviewer 1’s comment that the statement in the original manuscript is confusing. Our intention was to point out that our study used supervised learning, and this is different from animals learn by reinforcement learning in rea life. We revised the sentence in Discussion as follows:

      “The RNNs in our study were trained via supervised learning. However, in real life, animals learn a reversal learning task via reinforcement learning (RL), i.e., learn the task from reward outcomes.”

      (4) The distinction between line attractors and the dynamic trajectories described by the authors deserves further investigation. A significant concern arises from the authors' use of targeted dimensionality reduction (TDR), a form of regression, to identify the axis determining reversal probability. While this approach can reveal interesting patterns in the data, it may not necessarily isolate the dimension along which the RNN computes reversal probability. This limitation could lead to misinterpretation of the underlying neural dynamics.

      a) This manuscript cites work described in "Prefrontal cortex as a meta-reinforcement learning system," which examined a similar task. In that study, the authors identified a v-shaped curve in the principal component space of network states, representing the probability of choosing left or right.

      Importantly, this curve is topologically equivalent to a line and likely represents a line attractor. However, regressing against reversal probability in such a case would show that a single principal component (PC2) directly correlates with reversal probability.

      b) The dynamics observed in the current study bear a striking resemblance to this structure, with the addition of intervening loops in the network state corresponding to within-trial state evolution. Crucially, these observations do not preclude the existence of a line attractor. Instead, they may reflect the network's need to produce fast timescale dynamics within each trial, superimposed on the slower dynamics of the line attractor.

      c) This alternative interpretation suggests that reward signals could function as inputs that shift the network state along the line attractor, with information being maintained across trials. The fast "intervening behaviors" observed by the authors could represent faster timescale dynamics occurring on top of the underlying line attractor dynamics, without erasing the accumulated evidence for reversals.

      d) Given these considerations, the authors' conclusion that their results are better described by separable dynamic trajectories rather than fixed points on a line attractor may be premature. The observed dynamics could potentially be reconciled with a more nuanced understanding of line attractor models, where the attractor itself may be curved and coexist with faster timescale dynamics.

      We appreciate the insightful comments on (1) the similarity of the work by Wang et al ’18 with our findings and (2) an alternative interpretation that augments the line attractor with fast timescale dynamics. 

      (1) We added a discussion of the work by Wang et al ’18 in Result Section 2 to point out the similarity of their findings in the principal component space with ours in the x_rev and x_choice space. We commented that such network dynamics could emerge when learning to perform the reversal learning the task, regardless of the training schemes. 

      We also mention that the RL approach in Wang et al ’18 does not consider within-trial dynamics, therefore lacks the non-stationary activity observed during the trial in the PFC of monkeys and our trained RNNs.

      (2) We revised our original manuscript substantially to reconcile the line attractor model with the nonstationary activity observed during a trial. 

      Here are the highlights of the revised interpretation of the PFC and the RNN network activity

      - The dynamics of x_rev consists of two activity modes, i.e., stationary activity at the start of a trial and non-stationary activity during the trial. Schematic of the augmented model that reconciles two activity modes is shown in Figure 4A. Analysis of the time derivative (dx_reverse / dt) and contractivity of the stationary state are shown in Figure 4B,C to demonstrate two activity modes.

      - We discuss in Result Section 4 main text that the stationary activity is consistent with the line attractor model, but the non-stationary activity deviates from the model. 

      - The two activity modes are linked dynamically. There is an underlying dynamics that can map the stationary state to the non-stationary trajectory. This is shown by predicting the nonstationary trajectory with the stationary state using a support vector regression model. The prediction results are shown in Figure 4D,E,F.

      - We discuss in Result Section 4 an extension of the standard line attractor model: points on the line attractor can serve as initial states that launch non-stationary activity associated with taskrelated behavior.

      - The separability of neural trajectories presented in Result Section 5 is framed as a property of the non-stationary dynamics associated with task-related behavior.

      To strengthen their claims, the authors should:

      (1) Provide a more detailed description of their RNN training paradigm and task structure, including clear illustrations of target outputs.

      (2) Discuss how their findings relate to and potentially extend previous work on similar tasks, particularly addressing the similarities and differences with the v-shaped state organization observed in reinforcement learning contexts. (https://www.nature.com/articles/s41593-018-0147-8 Figure1).

      (3) Explore whether their results could be consistent with a curved line attractor model, rather than treating line attractors and dynamic trajectories as mutually exclusive alternatives.

      Our response to these three comments is described above.

      Addressing these points would significantly enhance the impact of the study and provide a more nuanced understanding of how reversal probabilities are represented in neural circuits.

      In conclusion, while this study provides interesting insights into the neural representation of reversal probability, there are several areas where the methodology and interpretations could be refined.

      Additional Minor Concerns:

      (1) Network Training and Reversal Timing: The authors mention that the network was trained to switch after a reversal to match animal behavior, stating "Maximum a Posterior (MAP) of the reversal probability converges a few trials past the MAP estimate." More explanation of how this training strategy relates to actual animal behavior would enhance the reader's understanding of the meaning of the model's similarity to animal behavior in Figure 1.

      In Method Section 2.5, we described how our observation that the running estimate of MAP converges a few trials after the actual MAP is analogous to the animal’s reversal behavior.

      “This observation can be interpreted as follows. If a subject performing the reversal learning task employs the ideal observer model to detect the trial at which reward schedule is reversed, the subject can infer the reversal of reward schedule a few trials past the actual reversal and then switch its preferred choice. This delay in behavioral reversal, relative to the reversal of reward schedule, is analogous to the monkeys switching their preferred choice a few trials after the reversal of reward schedule.”

      In Step 4, we also mentioned that the target choice outputs are defined based on our observation in Step 3.

      “We used the observation from Step 3 to define target choice outputs that switch abruptly a few trials after the reversal of reward schedule, denoted as $t^*$ in the following. An example of target outputs are shown in Fig.\,\ref{fig_behavior}B.”

      (2) How is the network simulated in step 1 of training? Is it just randomly initialized? What defines this network structure?

      The initial state at the start of a block was random. We think the initial state is less relevant as the external inputs (i.e., cue and feedback) are strong and drive the network dynamics. We mentioned these setup and observation in Step 1 of training.

      “Step 1. Simulate the network starting from a random initial state, apply the external inputs, i.e., cue and feedback inputs, at each trial and store the network choices and reward outcomes at all the trials in a block. The network dynamics is driven by the external inputs applied periodically over the trials.”

      (3) Clarification on Learning Approach: More description of the approach in the main text would be beneficial. The statement "Here, we trained RNNs that learned from a Bayesian inference model to mimic the behavioral strategies of monkeys performing the reversal learning task [2, 4]" is somewhat confusing, as the model isn't directly fit to monkey data. A more detailed explanation of how the Bayesian inference model relates to monkey behavior and how it's used in RNN training would improve clarity.

      We described the learning approach in more detail, but also tried to be concise without going into technical details.

      We revised the sentence in Introduction as follows:

      “We sought to train RNNs to mimic the behavioral strategies of monkeys performing the reversal learning task. Previous studies \cite{costa2015reversal, bartolo2020prefrontal} have shown that a Bayesian inference model can capture a key aspect of the monkey's behavioral strategy, i.e., adhere to the preferred choice until the reversal of reward is detected and then switch abruptly. We trained the RNNs to replicate this behavioral strategy by training them on target behaviors generated from the Bayesian model.”

      We also added a paragraph in Result Section 1 that explains in detail how the training approach works.

      (4) In Figure 1B, it would be helpful to show the target output.

      We added a figure in Fig1B that shows a schematic of how the target output is generated.

      (5) An important point to consider is that a line attractor can be curved while still being topologically equivalent to a line. This nuance makes Figure 4A somewhat difficult to interpret. It might be helpful to discuss how the observed dynamics relate to potentially curved line attractors, which could provide a more nuanced understanding of the neural representations.

      As discussed above, we interpret the “curved” activity during the trial as non-stationary activity. We do not think this non-stationary activity would be characterized as attractor. Attractor is (1) a minimal set of states that is (2) invariant under the dynamics and (3) attracting when perturbed into its neighborhood [Strogatz, Nonlinear dynamics and chaos]. If we consider the autonomous system without the behavior-related external input as the base system, then the non-stationary states could satisfy (2) and (3) but not (1), so they are not part of the attractor. If we include the behavior-related external input to the autonomous dynamics, then it may be possible that the non-stationary trajectories are part of the attractor. We adopted the former interpretation as the behavior-related inputs are external and transient.

      (6) The results of the perturbation experiments seem to follow necessarily from the way x_rev was defined. It would be valuable to clarify if there's more to these results than what appears to be a direct consequence of the definition, or if there are subtleties in the experimental design or analysis that aren't immediately apparent.

      The neural activity x_rev is correlated to the reversal probability, but it is unclear if the activity in this neural subspace is causally linked to behavioral variables, such as choice output. We added this explanation at the beginning of Results Section 7 to clarify the reason for performing the perturbation experiments.

      “The neural activity $x_{rev}$ is obtained by identifying a neural subspace correlated to reversal probability. However, it remains to be shown if activity within this neural subspace is causally linked to behavioral variables, such as choice output.”

      Reviewer #2:

      Below is a list of things I have found difficult to understand, and been puzzled/concerned about while reading the manuscript:

      (1) It would be nice to say a bit more about the dataset that has been used for PFC analysis, e.g. number of neurons used and in what conditions is Figure 2A obtained (one has to go to supplementary to get the reference).

      We added information about the PFC dataset in the opening paragraph of Result Section 2 to provide an overview of what type of neural data we’ve analyzed. It includes information about the number of recorded neurons, recording method and spike binning process.

      (2) It would be nice to give more detail about the monkey task and better explain its trial structure.

      In Result Section 1 we added a description of the overall task structure (and its difference with other versions of revesal learning task), the RNN / monkey trial structure and differences in RNN and monkey tasks.

      (3) In the introduction it is mentioned that during the hold period, the probability of reversal is represented. Where does this statement come from?

      The fact that neural activity during a hold period, i.e., fixation period before presenting the target images, encodes the probability of reversal was demonstrated in a previous study (Bartolo and Averbeck ’20). 

      We realize that our intention was to state that, during the hold period, the reversal probability activity is stationary as in the line attractor model, instead of focusing on that the probability of reversal is represented during this period. We revised the sentence to convey this message. In addition, we revised the entire paragraph to reinterpret our findings: there are two activity modes where the stationary activity is consistent with the line attractor model but the non-stationary activity deviates from it.

      (4) "Around the behavioral reversal trial, reversal probabilities were represented by a family of rankordered trajectories that shifted monotonically". This sentence is confusing and hard to understand.

      Thank you for point this out. We rewrote the paragraph to reflect our revised interpretation. This sentence was removed, as it can be considered as part of the result on separable trajectories.

      (5) For clarity, in the first section, when it is written that "The reversal behavior of trained RNNs was similar to the monkey's behavior on the same task" it would be nice to be more precise, that this is to be expected given the strategy used to train the network.

      We removed this sentence as it makes a blanket statement. Instead, we compared the behavioral outputs of the RNNs and the monkeys one by one.

      We added a sentence in Result Section 1 that the RNN’s abrupt behavioral reversal is expected as they are trained to mimic the target choice outputs of the Bayesian model.

      “Such abrupt reversal behavior was expected as the RNNs were trained to mimic the target outputs of the Bayesian inference model.”

      (6) What is the value of tau used in eq (1), and how does it compare to trial duration?

      We described the value of time constant tau in Eq (1) and also discussed in Result Section 1 that tau=20ms is much faster than trial duration 500ms, thus the persistent behavior seen in trained RNNs is due to learning.

      (7) It would be nice to expand around the notion of « temporally flexible representation » to help readers grasp what this means.

      Instead of stating that the separable dynamic trajectories have “temporally flexible representation”, we break down in what sense it is temporally flexible: separable dynamic trajectories can accommodate the effects that task-related behavior have on generating non-stationary neural dynamics.

      “In sum, our results show that, in a probabilistic reversal learning task, recurrent neural networks encode reversal probability by adopting, not only stationary states as in a line attractor, but also separable dynamic trajectories that can represent distinct probabilistic values while accommodating non-stationary dynamics associated with task-related behavior.”

      Reviewer #3:

      (1) Data:

      It would be useful to describe the experimental task, recording setup, and analyses in much more detail - both in the text and in the methods. What part of PFC are the recordings from? How many neurons were recorded over how many sessions? Which other papers have they been used in? All of these things are important for the reader to know, but are not listed anywhere. There are also some inconsistencies, with the main text e.g. listing the 'typical block length' as 36 trials, and the methods listing the block length as 24 trials (if this is a difference between the biological data and RNN, that should be more explicit and motivated).

      We provided more detailed description of the monkey experimental task and PFC recordings in Result Section 1. We also added a new section in Methods 2.1 to describe the monkey experiment.

      The experimental analyses should be explained in more detail in the methods. There is e.g. no detailed description of the analysis in Figure 6F.

      We added a new section in Methods 6 to describe how the residual PFC activity is computed. It also describes the RNN perturbation experiments.

      Finally, it would be useful for more analyses of monkey behaviour and performance, either in the main text or supplementary figures.

      We did not pursue this comment as it is unclear how additional behavioral analyses would improve the manuscript.

      (2) Model:

      When fitting the network, 'step 1' of training in 2.3 seems superfluous. The posterior update from getting a reward at A is the same as that from not getting a reward at B (and vice versa), and it is therefore completely independent of the network choice. The reversal trial can therefore be inferred without ever simulating the network, simply by generating a sample of which trials have the 'good' option being rewarded and which trials have the 'bad' option being rewarded.

      We respectfully disagree with Reviewer 3’s comment that the reversal trial can be inferred without ever simulating the network. The only way for the network to know about the underlying reward schedule is to perform the task by itself. By simulating the network, it can sample the options and the reward outcomes. 

      Our understanding is that Review 3 described a strategy that a human would use to perform this task. Our goal was to train the RNN to perform the task.

      Do the blocks always start with choice A being optimal? Is everything similar if the network is trained with a variable initial rewarded option? E.g. in Fig 6, would you see the appropriate swap in the effect of the perturbation on choice probability if choice B was initially optimal?

      Thank you for pointing out that the initial high-value option can be random. When setting up the reward schedule, the initial high-value option was chosen randomly from two choice outputs and, at the scheduled reversal, it was switched to the other option. We did not describe this in the original manuscript.

      We added a descrption in Training Scheme Step 4 that the the initial high-value option is selected randomly. This is also explained in Result Section 1 when we give an overview of the RNN training procedure.

      (3) Content:

      It is rarely explained what the error bars represent (e.g. Figures 3B, 4C, ...) - this should be clear in all figures.

      We added that the error bars represent the standard error of mean.

      Figure 2A: this colour scheme is not great. There are abrupt colour changes both before and after the 'reversal' trial, and both of the extremes are hard to see.

      We changed the color scheme to contrast pre- and post-reversal trials without the abrupt color change.

      Figure 3E/F: how is prediction accuracy defined?

      We added that the prediction accuracy is based on Pearson correlation.

      Figure 4B: why focus on the derivative of the dynamics? The subsequent plots looking at the actual trajectories are much easier to understand. Also - what is 'relative trial' relative to?

      The derivative was analyzed to demonstrate stationarity or non-stationarity of the neural activity. We think it will be clearer in the revised manuscript that the derivative allows us to characterize those two activity modes.

      Relative trial number indicate the trial position relative to the behavioral reversal trial. We added this description to the figures when “relative trial” is used.

      Figure 4C: what do these analyses look like if you match the trial numbers for the shift in trajectories? As it is now, there will presumably be more rewarded trials early and late in each block, and more unrewarded trials around the reversal point. Does this introduce biases in the analysis? A related question is (i) why the black lines are different in the top and bottom plots, and (ii) why the ends of the black lines are discontinuous with the beginnings of the red/blue lines.

      We could not understand what Reviewer 3 was asking in this comment. It’d help if Review 3 could clarify the following question:

      “Figure 4C: what do these analyses look like if you match the trial numbers for the shift in trajectories?”

      Question (i): We wanted to look at how the trajectory shifts in the subsequent trial if a reward is or is not received in the current trial. The top panel analyzed all the trials in which the subsquent trial did not receive a reward. The bottom panel analyzed all the trials in which the subsequent trial received a reward. So, the trials analyzed in the top and bottom panels are different, and the black lines (x_rev of “current” trial) in the top and bottom panels are different.

      Question (ii): Black line is from the preceding trial of the red/blue lines, so if trials are designed to be continuous with the inter-trial-interval, then black and red/blue should be continuous. However, in the monkey experiment, the inter-trial-intervals were variable, so the end of current trial does not match with the start of next trial. The neural trajectories presented in the manuscript did not include the activity in this inter-trial-interval.

      Figure 6C: are the individual dots different RNNs? Claiming that there is a decrease in Delta x_choice for a v_+ stimulation is very misleading.

      Yes individual dots are different RNN perturbations. We added explanation about the dots in Figure7C caption. 

      We agree with the comment that \Delta x_choice did not decrease. This sentence was removed. Instead, we revised the manuscript to state that x_choice for v_+ stimulation was smaller than the x_choice for v_- stimulation. We performed KS-test to confirm statistical significance.

      Discussion: "...exhibited behaviour consistent with an ideal Bayesian observer, as found in our study". The RNN was explicitly trained to reproduce an ideal Bayesian observer, so this can only really be considered an assumption (not a result) in the present study.

      We agree that the statement in the original manuscript is inaccurate. It was revised to reflect that, in the other study, behavior outputs similar to a Bayesian observer emerged by simply learning to do the task, intead of directly mimicking the outputs of Bayesian observer as done in our study.

      “Authors showed that trained RNNs exhibited behavior outputs consistent with an ideal Bayesian observer without explicitly learning from the Bayesian observer. This finding shows that the behavioral strategies of monkeys could emerge by simply learning to do the task, instead of directly mimicking the outputs of Bayesian observer as done in our study.”

      Methods: Would the results differ if your Bayesian observer model used the true prior (i.e. the reversal happens in the middle 10 trials) rather than a uniform prior? Given the extensive literature on prior effects on animal behaviour, it is reasonable to expect that monkeys incorporate some non-uniform prior over the reversal point.

      Thank you for pointing out the non-uniform prior. We haven’t conducted this analysis, but would guess that the convergence to the posterior distribution would be faster. We’d have to perform further analysis, which is out of the scope of this paper, to investigate whether the posteior distribution would be different from what we obtained from uniform prior.

      Making the code available would make the work more transparent and useful to the community.

      The code is available in the following Github repository: https://github.com/chrismkkim/LearnToReverse

    1. eLife Assessment

      This valuable paper uses a quantitative modeling approach to explore a well-studied transition in motor behavior in the nematode C. elegans. The authors provide solid evidence that this transition, which has been considered by many in the field to be a two-state behavior, can instead be described as a process whose parameters are smoothly modulated within a single state. This finding provides insight into the relationships between latent internal states and observable behavioral states, and suggests that relatively simple neuronal mechanisms can drive behavioral sequences that appear more complex.

    2. Reviewer #1 (Public review):

      Summary of what the authors were trying to achieve

      This paper concerns mechanisms of foraging behavior in C. elegans. Upon removal from food, C. elegans first executes a stereotypical local search behavior in which it explores a small area by executing many random, undirected reversals and turns called "reorientations." If the worm fails to find food, it transitions to a global search in which it explores larger areas by suppressing reorientations and executing long forward runs (Hills et al., 2004). At the population level, reorientation rate declines gradually. Nevertheless, about 50% of individual worms appear to exhibit an abrupt transition between local and global search, which is evident as a discrete transition from high to low reorientation rate (Lopez-Cruz et al., 2019). This observation has given rise to the hypothesis that local and global search correspond to separate internal states with the possibility of sudden transitions between them (Calhoun et al., 2014). The objective of the paper is to demonstrate that is not necessary to posit distinct internal states to account for discrete transitions from high to low reorientation rate. On the contrary, discrete transitions can occur simply because of the stochastic nature of the reorientation behavior itself.

      Major strengths and weaknesses of the methods and results

      • The model was not explicitly designed to match the sudden, stable changes in reorientation rates observed in the experimental data from individual worms. Kinetic parameters were simply chosen to match the average population behavior. Nevertheless, many sudden stable changes in reorientation rates occurred. This is a strong argument that apparent state changes can arise as an epiphenomenon of stochastic processes.

      • The new stochastic model is more parsimonious than reorientation-state change model because it posits one state rather than two.

      • A prominent feature of the empirical data is that 50% of the worms exhibit a single (apparent) state change and the rest show either no state changes or multiple state changes. Does the model reproduce these proportions? This obvious question was not addressed.

      • There is no obvious candidate for the neuronal basis of the decaying factor M. The authors speculate that decreasing sensory neuron activity might be the correlate of M but then provide contradictory evidence that seems to undermine that hypothesis. The absence of a plausible neuronal correlate of M weakens the case for the model.

      Appraisal of whether the authors achieved their aims, and whether the results support their conclusions

      The authors have made a solid case that is not necessary to posit distinct internal states to account for discrete transitions from high to low reorientation rate. On the contrary, discrete transitions can occur simply because of the stochastic nature of the reorientation behavior itself.

      Impact of the work on the field, and the utility of the methods and data to the community

      Posting hidden internal states to explain behavioral sequences is gaining acceptance in behavioral neuroscience. The likely impact of the paper is to establish a compelling example of how statistical reasoning can reduce the number of hidden states to achieve more parsimonious models.

    3. Reviewer #2 (Public review):

      Summary:

      In this study, the authors build a statistical model that stochastically samples from a time-interval distribution of reorientation rates. The form of the distribution is extracted from a large array of behavioral data, is then used to describe not only the dynamics of individual worms (including the inter-individual variability in behavior), but also the aggregate population behavior. The authors note that the model does not require an assumption about behavioral state transitions, or evidence accumulation, as has been done previously, but rather that the stochastic nature of behavior is "simply the product of stochastic sampling from an exponential function".

      Strengths:

      This model provides a strong juxtaposition to other foraging models in the worm. Rather than evoking a behavioral transition function (that might arise from a change in internal state or the activity of a cell type in the network), or evidence accumulation (which again maps onto a cell type, or the activity of a network) - this model explains behavior via the stochastic sampling of a function of an exponential decay. The underlying model and the dynamics being simulated, as well as the process of stochastic sampling are well described and the model fits the exponential function (equation 1) to data on a large array of worms exhibiting diverse behaviors (1600+ worms from Lopez-Cruz et al). The work of this study is able to explain or describe the inter-individual diversity of worm behavior across a large population. The model is also able to capture two aspects of the reorientations, including the dynamics (to switch or not to switch) and the kinetics (slow vs fast reorientations). The authors also work to compare their model to a few others including the Levy walk (whose construction arises from a Markov process) to a simple exponential distribution, all of which have been used to study foraging and search behaviors.

      Weaknesses:

      This manuscript has two weaknesses that dampen the enthusiasm for the results. First, in all of the examples the authors cite where a Gillespie algorithm is used to sample from a distribution, be it the kinetics associated with chemical dynamics, or a Lotka-Volterra Competition Model, there are underlying processes that govern the evolution of the dynamics, and thus the sampling from distributions. In one of their references for instance, the stochasticity arises from the birth and death rates, thereby influencing the genetic drift in the model. In these examples, the process governing the dynamics (and thus generating the distributions from which one samples) are distinct from the behavior being studied. In this manuscript, the distribution being sampled from is the exponential decay function of the reorientation rate (lines 100-102). This appears to be tautological - a decay function fitted to the reorientation data is then sampled to generate the distributions of the reorientation data. That the model performs well, and matches the data is commendable, but it is unclear how that could not be the case if the underlying function generating the distribution was fit to the data.

      The second weakness is somewhat related to the first, in that absent an underlying mechanism or framework, one is left wondering what insight the model provides. Stochastic sampling a function generated by fitting the data to produce stochastic behavior is where one ends up in this framework, and the authors indeed point this out: "simple stochastic models should be sufficient to explain observably stochastic behaviors." (Line 233-234). But if that is the case, what do we learn about how the foraging is happening. The authors suggest that the decay parameter M can be considered a memory timescale; which offers some suggestion, but then go on to say that the "physical basis of M can come from multiple sources". Here is where one is left for want: The mechanisms suggested, including loss of sensory stimuli, alternations in motor integration, ionotropic glutamate signaling, dopamine, and neuropeptides are all suggested: this is basically all of the possible biological sources that can govern behavior, and one is left not knowing what insight the model provides. The array of biological processes listed are so variable in dynamics and meaning, that their explanation of what govern M is at best unsatisfying. Molecular dynamics models that generate distributions can point to certain properties of the model, such as the binding kinetics (on and off rates, etc.) as explanations for the mechanisms generating the distributions, and therefore point to how a change in the biology affects the stochasticity of the process. It is unclear how this model provides such a connection, especially taken in aggregate with the previous weakness.

      Providing a roadmap of how to think about the processes generating M, the meaning of those processes in search, and potential frameworks that are more constrained and with more precise biological underpinning (beyond the array of possibilities described) would go a long way to assuaging the weaknesses.

      Comments on revised version:

      The authors have addressed the main concerns of the manuscript.

    1. eLife Assessment

      This study provides valuable insights into the evolutionary conservation of sex determination mechanisms in ants by identifying a candidate sex-determining region in a parthenogenetic species. The strength of evidence is solid, using genomic analyses to identify differences in heterozygosity between females and diploid males, though the conclusions are limited by the lack of functional analysis.

    2. Reviewer #1 (Public review):

      This study investigates the sex determination mechanism in the clonal ant Ooceraea biroi, focusing on a candidate complementary sex determination (CSD) locus-one of the key mechanisms supporting haplodiploid sex determination in hymenopteran insects. Using whole genome sequencing, the authors analyze diploid females and the rarely occurring diploid males of O. biroi, identifying a 46 kb candidate region that is consistently heterozygous in females and predominantly homozygous in diploid males. This region shows elevated genetic diversity, as expected under balancing selection. The study also reports the presence of an lncRNA near this heterozygous region, which, though only distantly related in sequence, resembles the ANTSR lncRNA involved in female development in the Argentine ant, Linepithema humile (Pan et al. 2024). Together, these findings suggest a potentially conserved sex determination mechanism across ant species. However, while the analyses are well conducted and the paper is clearly written, the insights are largely incremental. The central conclusion - that the sex determination locus is conserved in ants - was already proposed and experimentally supported by Pan et al. (2024), who included O. biroi among the studied species and validated the locus's functional role in the Argentine ant. The present study thus largely reiterates existing findings without providing novel conceptual or experimental advances.

      Other comments:

      The mapping is based on a very small sample size: 19 females and 16 diploid males, and these all derive from a single clonal line. This implies a rather high probability for false-positive inference. In combination with the fact that only 11 out of the 16 genotyped males are actually homozygous at the candidate locus, I think a more careful interpretation regarding the role of the mapped region in sex determination would be appropriate. The main argument supporting the role of the candidate region in sex determination is based on the putative homology with the lncRNA involved in sex determination in the Argentine ant, but this argument was made in a previous study (as mentioned above).<br /> In the abstract, it is stated that CSD loci have been mapped in honeybees and two ant species, but we know little about their evolutionary history. But CSD candidate loci were also mapped in a wasp with multi-locus CSD (study cited in the introduction). This wasp is also parthenogenetic via central fusion automixis and produces diploid males. This is a very similar situation to the present study and should be referenced and discussed accordingly, particularly since the authors make the interesting suggestion that their ant also has multi-locus CSD and neither the wasp nor the ant has tra homologs in the CSD candidate regions. Also, is there any homology to the CSD candidate regions in the wasp species and the studied ant?

      The authors used different clonal lines of O. biroi to investigate whether heterozygosity at the mapped CSD locus is required for female development in all clonal lines of O. biroi (L187-196). However, given the described parthenogenesis mechanism in this species conserves heterozygosity, additional females that are heterozygous are not very informative here. Indeed, one would need diploid males in these other clonal lines as well (but such males have not yet been found) to make any inference regarding this locus in other lines.

    3. Reviewer #2 (Public review):

      The manuscript by Lacy et al. is well written, with a clear and compelling introduction that effectively conveys the significance of the study. The methods are appropriate and well-executed, and the results, both in the main text and supplementary materials, are presented in a clear and detailed manner. The authors interpret their findings with appropriate caution.

      This work makes a valuable contribution to our understanding of the evolution of complementary sex determination (CSD) in ants. In particular, it provides important evidence for the ancient origin of a non-coding locus implicated in sex determination, and shows that, remarkably, this sex locus is conserved even in an ant species with a non-canonical reproductive system that typically does not produce males. I found this to be an excellent and well-rounded study, carefully analyzed and well contextualized.

      That said, I do have a few minor comments, primarily concerning the discussion of the potential 'ghost' CSD locus. While the authors acknowledge (line 367) that they currently have no data to distinguish among the alternative hypotheses, I found the evidence for an additional CSD locus presented in the results (lines 261-302) somewhat limited and at times a bit difficult to follow. I wonder whether further clarification or supporting evidence could already be extracted from the existing data. Specifically:

      (1) Line 268: I doubt the relevance of comparing the proportion of diploid males among all males between lines A and B to infer the presence of additional CSD loci. Since the mechanisms producing these two types of males differ, it might be more appropriate to compare the proportion of diploid males among all diploid offspring. This ratio has been used in previous studies on CSD in Hymenoptera to estimate the number of sex loci (see, for example, Cook 1993, de Boer et al. 2008, 2012, Ma et al. 2013, and Chen et al., 2021). The exact method might not be applicable to clonal raider ants, but I think comparing the percentage of diploid males among the total number of (diploid) offspring produced between the two lineages might be a better argument for a difference in CSD loci number.

      (2) If line B indeed carries an additional CSD locus, one would expect that some females could be homozygous at the ANTSR locus but still viable, being heterozygous only at the other locus. Do the authors detect any females in line B that are homozygous at the ANTSR locus? If so, this would support the existence of an additional, functionally independent CSD locus.

      (3) Line 281: The description of the two tra-containing CSD loci as "conserved" between Vollenhovia and the honey bee may be misleading. It suggests shared ancestry, whereas the honey bee csd gene is known to have arisen via a relatively recent gene duplication from fem/tra (10.1038/nature07052). It would be more accurate to refer to this similarity as a case of convergent evolution rather than conservation.

      (4) Finally, since the authors successfully identified multiple alleles of the first CSD locus using previously sequenced haploid males, I wonder whether they also observed comparable allelic diversity at the candidate second CSD locus. This would provide useful supporting evidence for its functional relevance.

      Overall, these are relatively minor points in the context of a strong manuscript, but I believe addressing them would improve the clarity and robustness of the authors' conclusions.

    4. Reviewer #3 (Public review):

      Summary:

      The sex determination mechanism governed by the complementary sex determination (CSD) locus is one of the mechanisms that support the haplodiploid sex determination system evolved in hymenopteran insects. While many ant species are believed to possess a CSD locus, it has only been specifically identified in two species. The authors analyzed diploid females and the rarely occurring diploid males of the clonal ant Ooceraea biroi and identified a 46 kb CSD candidate region that is consistently heterozygous in females and predominantly homozygous in males. This region was found to be homologous to the CSD locus reported in distantly related ants. In the Argentine ant, Linepithema humile, the CSD locus overlaps with an lncRNA (ANTSR) that is essential for female development and is associated with the heterozygous region (Pan et al. 2024). Similarly, an lncRNA is encoded near the heterozygous region within the CSD candidate region of O. biroi. Although this lncRNA shares low sequence similarity with ANTSR, its potential functional involvement in sex determination is suggested. Based on these findings, the authors propose that the heterozygous region and the adjacent lncRNA in O. biroi may trigger female development via a mechanism similar to that of L. humile. They further suggest that the molecular mechanisms of sex determination involving the CSD locus in ants have been highly conserved for approximately 112 million years. This study is one of the few to identify a CSD candidate region in ants and is particularly noteworthy as the first to do so in a parthenogenetic species.

      Strengths:

      (1) The CSD candidate region was found to be homologous to the CSD locus reported in distantly related ant species, enhancing the significance of the findings.

      (2) Identifying the CSD candidate region in a parthenogenetic species like O. biroi is a notable achievement and adds novelty to the research.

      Weaknesses

      (1) Functional validation of the lncRNA's role is lacking, and further investigation through knockout or knockdown experiments is necessary to confirm its involvement in sex determination.

      (2) The claim that the lncRNA is essential for female development appears to reiterate findings already proposed by Pan et al. (2024), which may reduce the novelty of the study.

    5. Author response:

      Reviewer #1 (Public review):

      This study investigates the sex determination mechanism in the clonal ant Ooceraea biroi, focusing on a candidate complementary sex determination (CSD) locus-one of the key mechanisms supporting haplodiploid sex determination in hymenopteran insects. Using whole genome sequencing, the authors analyze diploid females and the rarely occurring diploid males of O. biroi, identifying a 46 kb candidate region that is consistently heterozygous in females and predominantly homozygous in diploid males. This region shows elevated genetic diversity, as expected under balancing selection. The study also reports the presence of an lncRNA near this heterozygous region, which, though only distantly related in sequence, resembles the ANTSR lncRNA involved in female development in the Argentine ant, Linepithema humile (Pan et al. 2024). Together, these findings suggest a potentially conserved sex determination mechanism across ant species. However, while the analyses are well conducted and the paper is clearly written, the insights are largely incremental. The central conclusion - that the sex determination locus is conserved in ants - was already proposed and experimentally supported by Pan et al. (2024), who included O. biroi among the studied species and validated the locus's functional role in the Argentine ant. The present study thus largely reiterates existing findings without providing novel conceptual or experimental advances.

      Although it is true that Pan et al., 2024 demonstrated (in Figure 4 of their paper) that the synteny of the region flanking ANTSR is conserved across aculeate Hymenoptera (including O. biroi), Reviewer 1’s claim that that paper provides experimental support for the hypothesis that the sex determination locus is conserved in ants is inaccurate. Pan et al., 2024 only performed experimental work in a single ant species (Linepithema humile) and merely compared reference genomes of multiple species to show synteny of the region, rather than functionally mapping or characterizing these regions.

      Other comments:

      The mapping is based on a very small sample size: 19 females and 16 diploid males, and these all derive from a single clonal line. This implies a rather high probability for false-positive inference. In combination with the fact that only 11 out of the 16 genotyped males are actually homozygous at the candidate locus, I think a more careful interpretation regarding the role of the mapped region in sex determination would be appropriate. The main argument supporting the role of the candidate region in sex determination is based on the putative homology with the lncRNA involved in sex determination in the Argentine ant, but this argument was made in a previous study (as mentioned above).

      Our main argument supporting the role of the candidate region in sex determination is not based on putative homology with the lncRNA in L. humile. Instead, our main argument comes from our genetic mapping (in Fig. 2), and the elevated nucleotide diversity within the identified region (Fig. 4). Additionally, we highlight that multiple genes within our mapped region are homologous to those in mapped sex determining regions in both L. humile and Vollenhovia emeryi, possibly including the lncRNA.

      In response to the Reviewer’s assertion that the mapping is based on a small sample size from a single clonal line, we want to highlight that we used all diploid males available to us. Although the primary shortcoming of a small sample size is to increase the probability of a false negative, small sample sizes can also produce false positives. We used two approaches to explore the statistical robustness of our conclusions. First, we generated a null distribution by randomly shuffling sex labels within colonies and calculating the probability of observing our CSD index values by chance (shown in Fig. 2). Second, we directly tested the association between homozygosity and sex using Fisher’s Exact Test (shown in Supplementary Fig. S2). In both cases, the association of the candidate locus with sex was statistically significant after multiple-testing correction using the Benjamini-Hochberg False Discovery Rate. These approaches are clearly described in the “CSD Index Mapping” section of the Methods.

      We also note that, because complementary sex determination loci are expected to evolve under balancing selection, our finding that the mapped region exhibits a peak of nucleotide diversity lends orthogonal support to the notion that the mapped locus is indeed a complementary sex determination locus.

      The fourth paragraph of the results and the sixth paragraph of the discussion are devoted to explaining the possible reasons why only 11/16 genotyped males are homozygous in the mapped region. The revised manuscript will include an additional sentence (in what will be lines 384-388) in this paragraph that includes the possible explanation that this locus is, in fact, a false positive, while also emphasizing that we find this possibility to be unlikely given our multiple lines of evidence.

      In response to Reviewer 1’s suggestion that we carefully interpret the role of the mapped region in sex determination, we highlight our careful wording choices, nearly always referring to the mapped locus as a “candidate sex determination locus” in the title and throughout the manuscript. For consistency, the revised manuscript version will change the second results subheading from “The O. biroi CSD locus is homologous to another ant sex determination locus but not to honeybee csd” to “O. biroi’s candidate CSD locus is homologous to another ant sex determination locus but not to honeybee csd,” and will add the word “candidate” in what will be line 320 at the beginning of the Discussion, and will change “putative” to “candidate” in what will be line 426 at the end of the Discussion.

      In the abstract, it is stated that CSD loci have been mapped in honeybees and two ant species, but we know little about their evolutionary history. But CSD candidate loci were also mapped in a wasp with multi-locus CSD (study cited in the introduction). This wasp is also parthenogenetic via central fusion automixis and produces diploid males. This is a very similar situation to the present study and should be referenced and discussed accordingly, particularly since the authors make the interesting suggestion that their ant also has multi-locus CSD and neither the wasp nor the ant has tra homologs in the CSD candidate regions. Also, is there any homology to the CSD candidate regions in the wasp species and the studied ant?

      In response to Reviewer 1’s suggestion that we reference the (Matthey-Doret et al. 2019) study in the context of diploid males being produced via losses of heterozygosity during asexual reproduction, the revised manuscript will include the following sentence: “Therefore, if O. biroi uses CSD, diploid males might result from losses of heterozygosity at sex determination loci (Fig. 1C), similar to what is thought to occur in other asexual Hymenoptera that produce diploid males (Rabeling and Kronauer 2012; Matthey-Doret et al. 2019).”

      We note, however, that in their 2019 study, Matthey-Doret et al. did not directly test the hypothesis that diploid males result from losses of heterozygosity at CSD loci during asexual reproduction, because the diploid males they used for their mapping study came from inbred crosses in a sexual population of that species.

      We address this further below, but we want to emphasize that we do not intend to argue that O. biroi has multiple CSD loci. Instead, we suggest that additional, undetected CSD loci is one possible explanation for the absence of diploid males from any clonal line other than clonal line A. In response to Reviewer 1’s suggestion that we reference the (Matthey-Doret et al. 2019) study in the context of multilocus CSD, the revised manuscript version will include the following additional sentence in the fifth paragraph of the discussion: “Multi-locus CSD has been suggested to limit the extent of diploid male production in asexual species under some circumstances (Vorburger 2013; Matthey-Doret et al. 2019).”

      Regarding Reviewer 2’s question about homology between the putative CSD loci from the (Matthey-Doret et al. 2019) study and O. biroi, we note that there is no homology. The revised manuscript version will have an additional Supplementary Table (which will be the new Supplementary Table S3) that will report the results of this homology search. The revised manuscript will also include the following additional sentence in the Results: “We found no homology between the genes within the O. biroi CSD index peak and any of the genes within the putative L. fabarum CSD loci (Supplementary Table S3).”

      The authors used different clonal lines of O. biroi to investigate whether heterozygosity at the mapped CSD locus is required for female development in all clonal lines of O. biroi (L187-196). However, given the described parthenogenesis mechanism in this species conserves heterozygosity, additional females that are heterozygous are not very informative here. Indeed, one would need diploid males in these other clonal lines as well (but such males have not yet been found) to make any inference regarding this locus in other lines.

      We agree that a full mapping study including diploid males from all clonal lines would be preferable, but as stated earlier in that same paragraph, we have only found diploid males from clonal line A. We stand behind our modest claim that “Females from all six clonal lines were heterozygous at the CSD index peak, consistent with its putative role as a CSD locus in all O. biroi.” In the revised manuscript version, this sentence (in what will be lines 199-201) will be changed slightly in response to a reviewer comment below: “All females from all six clonal lines (including 26 diploid females from clonal line B) were heterozygous at the CSD index peak, consistent with its putative role as a CSD locus in all O. biroi.”

      Reviewer #2 (Public review):

      The manuscript by Lacy et al. is well written, with a clear and compelling introduction that effectively conveys the significance of the study. The methods are appropriate and well-executed, and the results, both in the main text and supplementary materials, are presented in a clear and detailed manner. The authors interpret their findings with appropriate caution.

      This work makes a valuable contribution to our understanding of the evolution of complementary sex determination (CSD) in ants. In particular, it provides important evidence for the ancient origin of a non-coding locus implicated in sex determination, and shows that, remarkably, this sex locus is conserved even in an ant species with a non-canonical reproductive system that typically does not produce males. I found this to be an excellent and well-rounded study, carefully analyzed and well contextualized.

      That said, I do have a few minor comments, primarily concerning the discussion of the potential 'ghost' CSD locus. While the authors acknowledge (line 367) that they currently have no data to distinguish among the alternative hypotheses, I found the evidence for an additional CSD locus presented in the results (lines 261-302) somewhat limited and at times a bit difficult to follow. I wonder whether further clarification or supporting evidence could already be extracted from the existing data. Specifically:

      We agree with Reviewer 2 that the evidence for a second CSD locus is limited. In fact, we do not intend to advocate for there being a second locus, but we suggest that a second CSD locus is one possible explanation for the absence of diploid males outside of clonal line A. In our initial version, we intentionally conveyed this ambiguity by titling this section “O. biroi may have one or multiple sex determination loci.” However, we now see that this leads to undue emphasis on the possibility of a second locus. In the revised manuscript, we will split this into two separate sections: “Diploid male production differs across O. biroi clonal lines” and “O. biroi lacks a tra-containing CSD locus.”

      (1) Line 268: I doubt the relevance of comparing the proportion of diploid males among all males between lines A and B to infer the presence of additional CSD loci. Since the mechanisms producing these two types of males differ, it might be more appropriate to compare the proportion of diploid males among all diploid offspring. This ratio has been used in previous studies on CSD in Hymenoptera to estimate the number of sex loci (see, for example, Cook 1993, de Boer et al. 2008, 2012, Ma et al. 2013, and Chen et al., 2021). The exact method might not be applicable to clonal raider ants, but I think comparing the percentage of diploid males among the total number of (diploid) offspring produced between the two lineages might be a better argument for a difference in CSD loci number.

      We want to re-emphasize here that we do not wish to advocate for there being two CSD loci in O. biroi. Rather, we want to explain that this is one possible explanation for the apparent absence of diploid males outside of clonal line A. We hope that the modifications to the manuscript described in the previous response help to clarify this.

      Reviewer 2 is correct that comparing the number of diploid males to diploid females does not apply to clonal raider ants. This is because males are vanishingly rare among the vast numbers of females produced. We do not count how many females are produced in laboratory stock colonies, and males are sampled opportunistically. Therefore, we cannot report exact numbers. However, we will add the following sentence to the revised manuscript: “Despite the fact that we maintain more colonies of clonal line B than of clonal line A in the lab, all the diploid males we detected came from clonal line A.”

      (2) If line B indeed carries an additional CSD locus, one would expect that some females could be homozygous at the ANTSR locus but still viable, being heterozygous only at the other locus. Do the authors detect any females in line B that are homozygous at the ANTSR locus? If so, this would support the existence of an additional, functionally independent CSD locus.

      We thank the reviewer for this suggestion, and again we emphasize that we do not want to argue in favor of multiple CSD loci. We just want to introduce it as one possible explanation for the absence of diploid males outside of clonal line A.

      The 26 sequenced diploid females from clonal line B are all heterozygous at the mapped locus, and the revised manuscript will clarify this in what will be lines 199-201. Previously, only six of those diploid females were included in Supplementary Table S2, and that will be modified accordingly.

      (3) Line 281: The description of the two tra-containing CSD loci as "conserved" between Vollenhovia and the honey bee may be misleading. It suggests shared ancestry, whereas the honey bee csd gene is known to have arisen via a relatively recent gene duplication from fem/tra (10.1038/nature07052). It would be more accurate to refer to this similarity as a case of convergent evolution rather than conservation.

      In the sentence that Reviewer 2 refers to, we are representing the assertion made in the (Miyakawa and Mikheyev 2015) paper in which, regarding their mapping of a candidate CSD locus that contains two linked tra homologs, they write in the abstract: “these data support the prediction that the same CSD mechanism has indeed been conserved for over 100 million years.” In that same paper, Miyakawa and Mikheyev write in the discussion section: “As ants and bees diverged more than 100 million years ago, sex determination in honey bees and V. emeryi is probably homologous and has been conserved for at least this long.”

      As noted by Reviewer 2, this appears to conflict with a previously advanced hypothesis: that because fem and csd were found in Apis mellifera, Apis cerana, and Apis dorsata, but only fem was found in Mellipona compressipes, Bombus terrestris, and Nasonia vitripennis, that the csd gene evolved after the honeybee (Apis) lineage diverged from other bees (Hasselmann et al. 2008). However, it remains possible that the csd gene evolved after ants and bees diverged from N. vitripennis, but before the divergence of ants and bees, and then was subsequently lost in B. terrestris and M. compressipes. This view was previously put forward based on bioinformatic identification of putative orthologs of csd and fem in bumblebees and in ants [(Schmieder et al. 2012), see also (Privman et al. 2013)]. However, subsequent work disagreed and argued that the duplications of tra found in ants and in bumblebees represented convergent evolution rather than homology (Koch et al. 2014). Distinguishing between these possibilities will be aided by additional sex determination locus mapping studies and functional dissection of the underlying molecular mechanisms in diverse Aculeata.

      Distinguishing between these competing hypotheses is beyond the scope of our paper, but the revised manuscript will include additional text to incorporate some of this nuance. We will include these modified lines below:

      “A second QTL region identified in V. emeryi (V.emeryiCsdQTL1) contains two closely linked tra homologs, similar to the closely linked honeybee tra homologs, csd and fem (Miyakawa and Mikheyev 2015). This, along with the discovery of duplicated tra homologs that undergo concerted evolution in bumblebees and ants (Schmieder et al. 2012; Privman et al. 2013) has led to the hypothesis that the function of tra homologs as CSD loci is conserved with the csd-containing region of honeybees (Schmieder et al. 2012; Miyakawa and Mikheyev 2015). However, other work has suggested that tra duplications occurred independently in honeybees, bumblebees, and ants (Hasselmann et al. 2008; Koch et al. 2014), and it remains to be demonstrated that either of these tra homologs acts as a primary CSD signal in V. emeryi.”

      (4) Finally, since the authors successfully identified multiple alleles of the first CSD locus using previously sequenced haploid males, I wonder whether they also observed comparable allelic diversity at the candidate second CSD locus. This would provide useful supporting evidence for its functional relevance.

      As is already addressed in the final paragraph of the results and in Supplementary Fig. S4, there is no peak of nucleotide diversity in any of the regions homologous to V.emeryiQTL1, which is the tra-containing candidate sex determination locus (Miyakawa and Mikheyev 2015). In the revised manuscript, the relevant lines will be 307-310. We want to restate that we do not propose that there is a second candidate CSD locus in O. biroi, but we simply raise the possibility that multi-locus CSD *might* explain the absence of diploid males from clonal lines other than clonal line A (as one of several alternative possibilities).

      Overall, these are relatively minor points in the context of a strong manuscript, but I believe addressing them would improve the clarity and robustness of the authors' conclusions.

      Reviewer #3 (Public review):

      Summary:

      The sex determination mechanism governed by the complementary sex determination (CSD) locus is one of the mechanisms that support the haplodiploid sex determination system evolved in hymenopteran insects. While many ant species are believed to possess a CSD locus, it has only been specifically identified in two species. The authors analyzed diploid females and the rarely occurring diploid males of the clonal ant Ooceraea biroi and identified a 46 kb CSD candidate region that is consistently heterozygous in females and predominantly homozygous in males. This region was found to be homologous to the CSD locus reported in distantly related ants. In the Argentine ant, Linepithema humile, the CSD locus overlaps with an lncRNA (ANTSR) that is essential for female development and is associated with the heterozygous region (Pan et al. 2024). Similarly, an lncRNA is encoded near the heterozygous region within the CSD candidate region of O. biroi. Although this lncRNA shares low sequence similarity with ANTSR, its potential functional involvement in sex determination is suggested. Based on these findings, the authors propose that the heterozygous region and the adjacent lncRNA in O. biroi may trigger female development via a mechanism similar to that of L. humile. They further suggest that the molecular mechanisms of sex determination involving the CSD locus in ants have been highly conserved for approximately 112 million years. This study is one of the few to identify a CSD candidate region in ants and is particularly noteworthy as the first to do so in a parthenogenetic species.

      Strengths:

      (1) The CSD candidate region was found to be homologous to the CSD locus reported in distantly related ant species, enhancing the significance of the findings.

      (2) Identifying the CSD candidate region in a parthenogenetic species like O. biroi is a notable achievement and adds novelty to the research.

      Weaknesses

      (1) Functional validation of the lncRNA's role is lacking, and further investigation through knockout or knockdown experiments is necessary to confirm its involvement in sex determination.

      See response below.

      (2) The claim that the lncRNA is essential for female development appears to reiterate findings already proposed by Pan et al. (2024), which may reduce the novelty of the study.

      We do not claim that the lncRNA is essential for female development in O. biroi, but simply mention the possibility that, as in L. humile, it is somehow involved in sex determination. We do not have any functional evidence for this, so this is purely based on its genomic position immediately adjacent to our mapped candidate region. We agree with the reviewer that the study by Pan et al. (2024) decreases the novelty of our findings. Another way of looking at this is that our study supports and bolsters previous findings by partially replicating the results in a different species.

    1. eLife Assessment

      This manuscript presents an interesting new framework (VARX) for simultaneously quantifying effective connectivity in brain activity during sensory stimulation and how that brain activity is being driven by that sensory stimulation. The reviewers thought the model was original and its conclusion that intrinsic connectivity is reduced (rather than increased) during sensory stimulation is very interesting, but that for ideal performance, one must specify all sensory features in the model, which is not possible. Overall, however, this work is important with convincing evidence for its conclusions - it will be of interest to neuroscientists working on brain connectivity and dynamics.

    2. Reviewer #1 (Public review):

      This manuscript presents an interesting new framework (VARX) for simultaneously quantifying effective connectivity in brain activity during sensory stimulation and how that brain activity is being driven by that sensory stimulation. The core idea is to combine the Vector Autoregressive model that is often used to infer Granger-causal connectivity in brain data with an encoding model that maps the features of a sensory stimulus to that brain data. The authors do a nice job of explaining the framework. And then they demonstrate its utility through some simulations and some analysis of real intracranial EEG data recorded from subjects as they watched movies. They infer from their analyses that the functional connectivity in these brain recordings is essentially unaltered during movie watching, that accounting for the driving movie stimulus can protect one against misidentifying brain responses to the stimulus as functional connectivity, and that recurrent brain activity enhances and prolongs the putative neural responses to a stimulus.

      This manuscript presents an interesting new framework (VARX) for simultaneously quantifying effective connectivity in brain activity during sensory stimulation and how that brain activity is being driven by that sensory stimulation. Overall, I thought this was an interesting manuscript with some rich and intriguing ideas.

      Comments on revisions:'

      The responses to the previous comments are very helpful. I think the manuscript does a nice job now of presenting its interesting findings in a convincing and measured manner.

      I had only one small remaining suggestion - to maybe link the finding of reduced intrinsic connectivity during stimulation to previous work on that topic. I thought of Nauhaus et al., Nature Neurosci, 2009.

    3. Reviewer #2 (Public review):

      Summary:

      The authors apply the recently developed VARX model, which explicitly models intrinsic dynamics and the effect of extrinsic inputs, to simulated data and intracranial EEG recordings. This method provides a directed method of 'intrinsic connectivity'. They argue this model is better suited to the analysis of task neuroimaging data because it separates the intrinsic and extrinsic activity. They show: that intrinsic connectivity is largely unaltered during a movie-watching task compared to eyes open rest; intrinsic noise is reduced in the task; and there is intrinsic directed connectivity from sensory to higher-order brain areas.

      Strengths:

      (1) The paper tackles an important issue with an appropriate method.

      (2) The authors validated their method on data simulated with a neural mass model.

      (3) They use intracranial EEG, which provides a direct measure of neuronal activity.

      (4) Code is made publicly available and the paper is written well.

      Comments on revisions:'

      The authors have addressed my comments.

    4. Author response:

      The following is the authors’ response to the original reviews

      Public Reviews:

      Reviewer #1 (Public review):

      This manuscript presents an interesting new framework (VARX) for simultaneously quantifying effective connectivity in brain activity during sensory stimulation and how that brain activity is being driven by that sensory stimulation. The core idea is to combine the Vector Autoregressive model that is often used to infer Granger-causal connectivity in brain data with an encoding model that maps the features of a sensory stimulus to that brain data. The authors do a nice job of explaining the framework. And then they demonstrate its utility through some simulations and some analysis of real intracranial EEG data recorded from subjects as they watched movies. They infer from their analyses that the functional connectivity in these brain recordings is essentially unaltered during movie watching, that accounting for the driving movie stimulus can protect one against misidentifying brain responses to the stimulus as functional connectivity, and that recurrent brain activity enhances and prolongs the putative neural responses to a stimulus.

      This manuscript presents an interesting new framework (VARX) for simultaneously quantifying effective connectivity in brain activity during sensory stimulation and how that brain activity is being driven by that sensory stimulation. Overall, I thought this was an interesting manuscript with some rich and intriguing ideas. That said, I had some concerns also - one potentially major - with the inferences drawn by the authors on the analyses that they carried out.

      Main comments:

      (1) My primary concern with the way the manuscript is written right now relates to the inferences that can be drawn from the framework. In particular, the authors want to assert that, by incorporating an encoding model into their framework, they can do a better job of accounting for correlated stimulus-driven activity in different brain regions, allowing them to get a clearer view of the underlying innate functional connectivity of the brain. Indeed, the authors say that they want to ask "whether, after removing stimulus-induced correlations, the intrinsic dynamic itself is preserved". This seems a very attractive idea indeed. However, it seems to hinge critically on the idea of fitting an encoding model that fully explains all of the stimulus-driven activity. In other words, if one fits an encoding model that only explains some of the stimulus-driven response, then the rest of the stimulus-driven response still remains in the data and will be correlated across brain regions and will appear as functional connectivity in the ongoing brain dynamics - according to this framework. This residual activity would thus be misinterpreted. In the present work, the authors parameterize their stimulus using fixation onsets, film cuts, and the audio envelope. All of these features seem reasonable and valid. However, they surely do not come close to capturing the full richness of the stimuli, and, as such, there is surely a substantial amount of stimulus-driven brain activity that is not being accounted for by their "B" model and that is being absorbed into their "A" model and misinterpreted as intrinsic connectivity. This seems to me to be a major limitation of the framework. Indeed, the authors flag this concern themselves by (briefly) raising the issue in the first paragraph of their caveats section. But I think it warrants much more attention and discussion.

      We agree. One can never be sure that all stimulus induced correlation is accounted for. We now formulate our question more cautiously: 

      “We will ask here whether, after removing some of the stimulus-induced correlations, the intrinsic dynamic is similar between stimulus and rest conditions.”

      We also highlight that one may expect the opposite result of what we found: 

      “A general observation of these studies is that a portion of the functional connectivity is preserved between rest and stimulus conditions, while some aspects are altered by the perceptual task [12,16], sometimes showing increased connectivity during the stimulus.[15].” 

      We have added a number of additional features (acoustic edges, fixation novelty, and motion) and more carefully characterize how much “connectivity” each one explains in the neural data: 

      “Removing any of the input features increased the effect size of recurrent connections compared to a model with all features (Fig. S4). We then cumulatively added each feature to the VARX model. Effect size monotonically decreases with each feature added (Fig. 3F). Decreases of effect size are significant when adding film cuts (ΔR=-3.6*10<sup>-6</sup>, p<0.0001, N=26, FDR correction, α=0.05) and the sound envelope (ΔR=-3.59*10<sup>-6</sup>, p=0.002, N=26, FDR correction, α=0.05). Thus, adding more input features progressively reduces the strength of recurrent “connections”.”

      We also added more data to the analysis comparing movies vs rest. We now use 4 different movie segments instead of 1 and find reduced recurrent connectivity during movies: 

      “The number of significant recurrent connections in  were significantly reduced during  movie watching compared to rest (Fig. 4C, fixed effect of stimulus: beta = -3.8*10<sup>-3</sup>, t(17) = -3.9, p<0.001), as is the effect size R (Fig. 4D, fixed effect of stimulus: beta = -2.5*10<sup>-4</sup>, t(17) = -4.1, p<0.001).”

      The additional analysis is described in the Methods section:

      “To compare recurrent connectivity between movies and the resting-state, we compute VARX models in four different movie segments of 5 minutes length to match the length of the resting state recording. We use the first and second half of ‘Despicable Me English’, the first half of ‘Inscapes’ and one of the ‘Monkey’ movies. 18 patients include each of these recordings. For each recording in each patient we compute the fraction of significant channels (p<0.001) and average the effect size R across all channel pairs, excluding the diagonal. We test the difference between movies and resting-state with linear mixed-effect models with stimulus as fixed effect (movie vs rest), and patient as random effect, using matlab’s fitlme() routine.”

      We had already seen this trend of decreasing connectivity during movie watching before, and reported on it cautiously as “largely unaltered”. We updated the Abstract correspondingly from “largely unaltered” to “reduced”: 

      “We also find that the recurrent connectivity during rest is reduced during movie watching.”

      We mentioned this possibility in the Discussion before, namely, that additional input features may reduce recurrent connectivity in the model, and therefore show a difference. We discuss this result now as follows: 

      “The stimulus features we included in our model capture mostly low-level visual and auditory input. It is possible that regressing out a richer stimulus characterization would have removed additional stimulus-induced correlation. While we do not expect that this would change the overall effect of a reduced number of “connections” during movie watching compared to resting state, the interpretation of changes in specific connections will be affected by the choice of features. For example, in sensory cortices, higher recurrent connectivity in the LFP during rest would be consistent with the more synchronized state we saw in rest, as reflected by larger oscillatory activity. Synchronization in higher-order cortices, however, is expected to be more strongly influenced by semantic content of external input.”

      In the Discussion we expand on what might happen if additional stimulus features were to be included into the model:  

      “Previous literature does often not distinguish between intrinsic dynamics and extrinsic effects. By factoring out some of the linear effects of the external input we conclude here that recurrent connectivity is reduced in average. From our prior work49, we know that the stimulus features we included here capture a substantial amount of variance across the brain in intracranial EEG. Arguably, however, the video stimuli had rich semantic information that was not captured by the low-level features used here. Adding such semantic features could have further reduced shared variance, and consequently further reduced average recurrent connectivity in the model.”

      “Similarities and differences between rest and movie watching conditions reported previously, do not draw a firm conclusion as to whether overall “functional connectivity” is increased or reduced. Results seem to depend on the time scale of neural activity analyzed, and the specific brain networks [12,16,63]. However, in fMRI, the conclusion seems to be that functional connectivity during movies is stronger than during rest[15], which likely results from stimulus induced correlations. The VARX model can remove some of the effects of these stimuli, revealing that average recurrent connectivity may be reduced rather than increased during stimulus processing.”

      And in the conclusion we now write: 

      “The model revealed a small but significant decrease of recurrent connectivity when watching movies.”

      (2) Related to the previous comment, the authors make what seems to me to be a complex and important point on page 6 (of the pdf). Specifically, they say "Note that the extrinsic effects captured with filters B are specific (every stimulus dimension has a specific effect on each brain area), whereas the endogenous dynamic propagates this initial effect to all connected brain areas via matrix A, effectively mixing and adding the responses of all stimulus dimensions. Therefore, this factorization separates stimulus-specific effects from the shared endogenous dynamic." It seems to me that the interpretation of the filter B (which is analogous to the "TRF") for the envelope, say, will be affected by the fact that the matrix A is likely going to be influenced by all sorts of other stimulus features that are not included in the model. In other words, residual stimulus-driven correlations that are captured in A might also distort what is going on in B, perhaps. So, again, I worry about interpreting the framework unless one can guarantee a near-perfect encoding model that can fully account for the stimulus-driven activity. I'd love to hear the authors' thoughts on this. (On this issue - the word "dominates" on page 12 seems very strong.)

      This is an interesting point we had not thought about. After some theoretical considerations and some empirical testing we conclude that the effect of missing inputs is relevant, but can be easily anticipated. 

      We have added the following to the Results section explaining and demonstrated empirically the effects of adding features and signals to the model: 

      “As with conventional linear regression, the estimate in B for a particular input and output channel is not affected by which other signals are included in or , provided those other inputs are uncorrelated. We confirmed this here empirically by removing dimensions from (Fig. S11A), and by adding uncorrelated input to (Fig. S11B, adding fixation onset does not affect the estimate for auditory envelope responses). In other words, to estimate B, we do not require all possible stimulus features and all brain activity to be measured and included in the model. In contrast, B does vary when correlated inputs are added to (Fig. S11C, adding acoustic edges changes the auditory envelope response). Evidently the auditory envelope and acoustic edges are tightly coupled in time, whereas fixation onset is not. When a correlated input is missing (acoustic edges) then the other input (auditory envelope) absorbs the correlated variance, thus capturing the combined response of both.”

      (3) Regarding the interpretation of the analysis of connectivity between movies and rest... that concludes that the intrinsic connectivity pattern doesn't really differ. This is interesting. But it seems worth flagging that this analysis doesn't really account for the specific dynamics in the network that could differ quite substantially between movie watching and rest, right? At the moment, it is all correlational. But the dynamics within the network could be very different between stimulation and rest I would have thought.

      As discussed above, with more data and additional stimulus features we now see detectable changes in the connectivity. The example in Figure 4G also shows that specific connections may change in different directions, while overall the strength of connections slightly decreases during movie watching compared to rest. We added the following to the results:

      “While the effect size decreases on average, there is some variation across different brain areas (Fig. 4E-G).”

      But even if the connectivity were unchanged, the activity on this network can be different with varying inputs. We actually also saw that there were changes in the variability of activity (Figs. 6 and S13) that may point to non-linear effects. It seems that injecting the input will cause an overall change in power, which can be explained by a relatively simple non-linear gain adaptation. These effects are already discussed at some length in the paper. 

      (4) I didn't really understand the point of comparing the VARX connectivity estimate with the spare-inverse covariance method (Figure 2D). What was the point of this? What is a reader supposed to appreciate from it about the validity or otherwise of the VARX approach?

      We added the following motivation and clarification on this topic: 

      “To test the descriptive validity [43] of the VARX model we follow the approach of recovering structural connectivity from functional activity in simulation. [44] Specifically, we will compare the recurrent connectivity A derived from brain activity simulated assuming a given structural connectivity, i.e. we ask, can the VARX model recover the underlying structural connectivity, at least in a simulated whole-brian model with known connectivity? … For comparison, we also used the sparse-inverse covariance method to recover connectivity from the correlation matrix (functional connectivity). This method is considered state-of-the-art as it is more sensitive than other methods in detecting structural connections [48]”

      (5) I think the VARX model section could have benefitted a bit from putting some dimensions on some of the variables. In particular, I struggled a little to appreciate the dimensionality of A. I am assuming it has to involve both time lags AND electrode channels so that you can infer Granger causality (by including time) between channels. Including a bit more detail on the dimensionality and shape of A might be helpful for others who want to implement the VARX model.

      Your assumption is correct. We added the following to make this easier for readers: 

      “Therefore, A  has dimensions B has dimensions , where are the dimensions of and respectively.”

      (6) A second issue I had with the inferences drawn by the authors was a difficulty in reconciling certain statements in the manuscript. For example, in the abstract, the authors write "We find that the recurrent connectivity during rest is largely unaltered during movie watching." And they also write that "Failing to account for ... exogenous inputs, leads to spurious connections in the intrinsic "connectivity".

      Perhaps this segment of the abstract needed more explanation. To enhance clarity we have also changed the ordering of the findings. Hopefully this is more clear now: 

      “This model captures the extrinsic effect of the stimulus and separates that from the intrinsic effect of the recurrent brain dynamic. We find that the intrinsic dynamic enhances and prolongs the neural responses to scene cuts, eye movements, and sounds. Failing to account for these extrinsic inputs, leads to spurious recurrent connections that govern the intrinsic dynamic. We also find that the recurrent connectivity during rest is reduced during movie watching.”

      Reviewer #2 (Public review):

      Summary:

      The authors apply the recently developed VARX model, which explicitly models intrinsic dynamics and the effect of extrinsic inputs, to simulated data and intracranial EEG recordings. This method provides a directed method of 'intrinsic connectivity'. They argue this model is better suited to the analysis of task neuroimaging data because it separates the intrinsic and extrinsic activity. They show: that intrinsic connectivity is largely unaltered during a movie-watching task compared to eyes open rest; intrinsic noise is reduced in the task; and there is intrinsic directed connectivity from sensory to higher-order brain areas.

      Strengths:

      (1) The paper tackles an important issue with an appropriate method.

      (2) The authors validated their method on data simulated with a neural mass model.

      (3) They use intracranial EEG, which provides a direct measure of neuronal activity.

      (4) Code is made publicly available and the paper is written well.

      Weaknesses:

      It is unclear whether a linear model is adequate to describe brain data. To the author's credit, they discuss this in the manuscript. Also, the model presented still provides a useful and computationally efficient method for studying brain data - no model is 'the truth'.

      We fully agree and have nothing much to add to this, except to highlight the benefit of a linear model even as explanation for non-linear phenomena: 

      “The [noise-quenching] effect we found here can be explained by a VARX model with the addition of a divisive gain adaptation mechanism … The noise-quenching result and its explanation via gain adaptation shows the benefit of using a parsimonious linear model, which can suggest nonlinear mechanisms as simple corrections from linearity.”

      Appraisal of whether the authors achieve their aims:

      As a methodological advancement highlighting a limitation of existing approaches and presenting a new model to overcome it, the authors achieve their aim. Generally, the claims/conclusions are supported by the results.

      The wider neuroscience claims regarding the role of intrinsic dynamics and external inputs in affecting brain data could benefit from further replication with another independent dataset and in a variety of tasks - but I understand if the authors wanted to focus on the method rather than the neuroscientific claims in this manuscript.

      We fully agree. We added the following to the Discussion section:

      “Future studies should test if our findings replicate in an independent iEEG datasets, including active tasks and whether they generalize to other neuroimaging modalities.”

      Impact:

      The authors propose a useful new approach that solves an important problem in the analysis of task neuroimaging data. I believe the work can have a significant impact on the field.

      Recommendations for the authors:  

      Reviewer #1 (Recommendations for the authors):

      Minor comments:

      (1) Did you mean "less" or "fewer" in the following sentence "..larger values lead to overfitting, i.e. less significant connections..."?

      We mean fewer. Thanks for catching this. 

      (2) I didn't see any equations showing how the regularization parameter lambda is incorporated into the framework.

      We prefer the math and details of the algorithm to an earlier paper that has now been published. Instead we added the following clarification: 

      “The VARX models were fitted to data with the matlab version of the code31 using conventional L2-norm regularization. The corresponding regularization parameter was set to 𝜆=0.3.”

      (3) I think some readers of this might struggle to understand the paragraph beginning

      "Connectivity plots are created with nilearn's plot_connectome() function...". It's all quite opaque for the uninitiated.

      Agreed. We now write more simply: 

      “Connectivity plots in Fig. 4 were created with routines from the nilearn toolbox [51].”

      (4) The paragraph beginning "The length of responses for Figure 5..." is also very opaque and could do with being explained more fully. Or this text could be removed from the methods and incorporated into the relevant results section where you actually discuss this analysis.

      Thank you for flagging this. We expand on the details in the Methods as follows: 

      “The length of responses for each channel in B and H to external inputs in Fig. 5 is computed with Matlab's findpeaks() function. This function returns the full-width at half of the peak maximum minus baseline. Power in each channel is computed as the squares of the responses averaged over the time window that was analyzed (0-0.6s).”

      (5) I think adding some comments to the text or caption related to Figures 3C and 3D would be helpful so readers can understand these numbers a bit better. One seems to be the delta log p value and the other is the delta ratio. What does positive or negative mean? Readers might appreciate a little more help.

      We expanded it as follows, hopefully this helps: 

      “C) difference of log for VAX model without minus with inputs (panel A - B). Both models are fit to the same data. D) Thresholding panels A and B at p<0.0001 gives a fraction of significant connections. Here we show the fraction of significant channels for models with and without input. Each line is a patient with color indicating increase or decrease  E) Mean over all channels for VARX models with and without inputs. Each line is a patient.”

      (6) It is not clear what the colors mean in Figures 4 E, F, G.

      We updated the color scheme for those figure panels and carefully explained it in the caption. Please see the manuscript for updated figure 4.   

      (7) It might be nice to slightly unpack what you mean by the "variability of the internal dynamic" and why it can be equated with the power of the innovation process.

      In the methods we added the following clarification right after defining the VARX model: 

      “The innovation process captures the internal variability of the model. Without it, repeating the same input would always result in a fixed deterministic output .”

      In the results section we added the following: 

      “As a metric of internal variability we measured the power of the intrinsic innovation process , which captures the unobserved “random” brain activity which leads to variations in the responses.”

      (8) Typos etc.

      a) "... has been attributed to variability of ongoing dynamic"

      b) The manuscript refers to a Figure 3G, but there is no Figure 3G.

      c) n_a = n_a = 1. Is that a typo?

      d) fiction

      Thank you for catching these. We fixed them. 

      Reviewer #2 (Recommendations for the authors):

      (1) I'm curious about the authors' opinions on the conditions studied. Naively, eyes open rest and passive movie watching seem like similar conditions - were the authors expecting to see a difference with VARX? Do the authors expect that they would see bigger differences when there is a larger difference in sensory input, e.g. eyes closed rest vs movie watching? Given the authors are arguing the need to explicitly model external inputs, a real data example contrasting two very different external inputs might better demonstrate the model's utility.

      Thank you for this suggestion. We added an analysis of eyes-closed rest recordings, available in 8 patients (Fig. S8). The difference between movie and rest is indeed more pronounced than for eyes open rest. The result is described in the methods:

      “In a subset of patients with eyes-closed resting state we find the same effect, that is qualitatively more pronounced (Fig. S8).”

      This complements our updated finding of a difference between movie and eyes-open rest that does show a significant difference after adding more data to this analysis. The results have been updated as following

      “The number of significant recurrent connections in  were significantly reduced during  movie watching compared to rest (Fig. 4C, fixed effect of stimulus:

      beta = -3.8*10<sup>-3</sup>, t(17) = -3.9, p<0.001), as is the effect size R (Fig. 4D, fixed effect of stimulus: beta = -2.5*10<sup>-4</sup>, t(17) = -4.1, p<0.001).”

      The abstract has been updated accordingly:

      “We also find that the recurrent connectivity during rest is reduced during movie watching.”

      (2) It would also have been interesting to see how the proposed model compares to DCM - however, I understand if the authors wanted to focus on their model rather than a comparison with other models.

      We did not try the DCM for a number of reasons. 1) it does not allow for delays in the model dynamic (i.e. the entire time course of the response has to be captured by the recurrent dynamic of a single time step A). 2. It is computationally prohibitive and would not allow us to analyze large channel counts. 3. The available code is custom made for fMRI or EEG analysis with very specified signal generation models that do not obviously apply to iEEG. We added the following to the Discussion of the CDM:  

      “Similar to the VARX model, DCM includes intrinsic and extrinsic effects A and B. However, the modeling is limited to first-order dynamics (i.e. η<sub>a</sub>=η<sub>b</sub>=1). Thus, prolonged responses have to be entirely captured with a first-order recurrent A. … In contrast, here we have analyzed up to 300 channels per subject across the brain, which would be prohibitive with DCM. By analyzing a large number of recordings we were able to draw more general conclusions about whole-brain activity.”

      (3) I believe improving the consistency of the terminology used would improve the manuscript:

      a) Intrinsic dynamics vs intrinsic connectivity vs recurrent connectivity:

      - The term 'intrinsic dynamic' is first introduced in paragraph 3 of the introduction. An explicit definition of is meant by this term would benefit the manuscript.

      - Sometimes the terminology changes to 'intrinsic connectivity' or 'recurrent connectivity'. An explicit definition of these terms (if they refer to different things) would also benefit the manuscript.

      We had used the term “intrinsic” and “recurrent” interchangeably. We now try to mostly say “intrinsic dynamic” when we talk about the more general phenomenon or recurrent brain dynamic, while using “recurrent connectivity” when we refer to the model parameters A. 

      We provide now a definition already at the start of the Abstract: 

      “Sensory stimulation of the brain reverberates in its recurrent neural networks. However, current computational models of brain activity do not separate immediate sensory responses from this intrinsic dynamic. We apply a vector-autoregressive model with external input (VARX), combining the concepts of “functional connectivity” and “encoding models”, to intracranial recordings in humans. This model captures the extrinsic effect of the stimulus and separates that from the intrinsic effect of the recurrent brain dynamic.”

      And at the start of the introduction: 

      “The primate brain is highly interconnected between and within brain areas. … We will refer to the dynamic driven by this recurrent architecture as the intrinsic dynamic of the brain.”

      b) Intrinsic vs Endogenous and Extrinsic vs Exogenous:

      - Footnote 1 defines the 'intrinsic' and 'extrinsic' terminology.

      - However, there are instances where the authors switch back to endogenous/exogenous.

      - Methods section: "Overall system response", paragraph 2.

      - Results section: "Recurrent dynamic enhances and prolongs stimulus responses".

      - Conclusions section.

      With a foot in both neuroscience and systems identification, it’s a hard habit to break. Thanks for catching it. We searched and replaced all instances of endogenous and exogenous.  

      (4) Methods:

      a) The model equation would be clearer if the convolution was written out fully. (I had to read reference 1 to understand the model.).

      We now spell out the full equation and hope it's not too cumbersome to read:  

      “For the th signal channel the recurrence of the VARX model is given by: 

      b) How is an individual dimension omitted in the reduced model, are the values in the y, x set to zero?

      No, it is actually removed from the linear prediction. We added: 

      “… omitted from the prediction …”

      c) "The p-value quantifies the probability that a specific connection in A or B is zero" - for each of n_a/n_b filters?

      d) It should be clarified that D is a vector.

      We hope the following clarification addresses both these questions: 

      “The p-value quantifies the probability that a specific connection in either A or B is zero. Therefore, D,P and R<sup>2</sup> all have dimensions or for A or B  respectively.”

      (5) Results:

      a) Stimulus-induced reduction of noise in the intrinsic activity: would be good to define the frequency range for theta and beta in paragraph 2.

      Added. 

      b) Neural mass model simulation:

      - A brief description of what was simulated is needed.

      We basically ran the sample code of the neurolib library. With that in mind maybe the description we already provide is sufficient:  

      “We used the default model simulation of the neurolib python library (using their sample code for the “ALNModel”), which is a mean-field approximation of adaptive exponential integrate-and-fire neurons. This model can generate simulated mean firing rates in 80 brain areas based on connectivity and delay matrices determined with diffusion tensor imaging (DTI). We used 5 min of “resting state” activity (no added stimulus, simulated at 0.1ms resolution, subsequently downsampled to 100Hz).”

      - It's not clear to me why the A matrix should match the structural connectivity.

      We added the following introduction to make the purpose of this simulation clear:

      “To test the descriptive validity [43] of the VARX model we follow the approach of recovering structural connectivity from functional activity in simulation. [44] Specifically, we will compare the “connectivity” A derived from brain activity simulated assuming a given structural connectivity, i.e. we ask, can the VARX model recover the underlying structural connectivity, at least in a simulated whole-brian model with known connectivity?”

      - It would be interesting to see the inferred A matrix.

      We added a Supplement figure for this and the following: 

      “The VARX model was estimated with n<sub>a</sub>=2, and no input. The resulting estimate for A is dominated by the diagonal elements that capture the autocorrelation within brain areas (Fig. S1).”

      - How many filters were used here?

      No input filters were used for this simulation:

      We used 5 min of “resting state” activity (no added stimulus, simulated at 0.1ms resolution, subsequently downsampled to 100Hz). 

      c) Intracranial EEG:

      - It's not clear how overfitting was measured and how the selection of the number of filters (n_a and n_b) was done.

      We have removed the statement about overfitting. Mostly the word is used in the context of testing on a separate dataset, which we did not do here. So this “overfitting” can be confusing. Instead we used the analytic p-value as indication that a larger model order is not supported by the data. We write this now as follows: 

      “Increasing the number of delays n<sub>a</sub>, increases estimated effect size R (Fig. S3A,B), however, larger values lead to fewer significant connections (Fig. S3C). Significance (p-value) is computed analytically, i.e. non-parametrically, based on deviance. Values around n<sub>a</sub>=6 time delays appear to be the largest model order supported by this statistical analysis.”

      d) Figure 1:

      - Typo: "auto-regressive"

      Fixed. Thanks for catching that. 

      - LFP and BHA in C are defined much later in the text, would be useful to define these in the caption. o Shouldn't B (the VARX model parameter) be a 2x3 matrix for different time lags?

      Hopefully the following clarifications address both these points: 

      “C) Example of neural signal y(t) recorded at a single location in the brain. We will analyze local field potentials (LFP) and broad-band high frequency activity (BHA) in separate analyses.  D) Examples of filters B for individual feed-forward connections between an extrinsic input and a specific recording location in the brain.”

      (6) Discussion:

      I could not find Muller et al 2016 listed in the references.

      Added. Thanks for catching that omission. 

      Additional edits prompted by reviewers, but not in the context of any particular comment.

      While reviewers did not raise this following point, we felt the need clarify the terminology in the Methods to make sure there is not misunderstanding in the proposed interpretation of the model: 

      “We will refer to the filters in matrix A and B and as recurrent and feed-forward “connections”, but avoid the use of the word “causal” which can be misleading.”

      In addressing questions to Figure 4, we noticed that there is quite a bit of variability across patients, so the analysis for Figure 4 and 7 which combines data across patients now accounts for a random effect of patient (previously we have used mean values for repeated measures). We added the following to the Methods to explain this:

      “To compare recurrent connectivity between movies and the resting-state (in Fig. 4), we compute VARX models in four different movie segments of 5 minutes length to match the length of the resting state recording. We use the first and second half of ‘Despicable Me English’, the first half of ‘Inscapes’ and one of the ‘Monkey’ movies. 18 patients include each of these recordings. For each recording in each patient we compute the fraction of significant channels (p<0.001) and average the effect size R across all channel pairs, excluding the diagonal. We test the difference between movies and resting-state with linear mixed-effect models with stimulus as fixed effect (movie vs rest), and patient as random effect (to account for the repeated measures for the different video segments), using matlab’s fitlme() routine. For the analysis of asymmetry of recurrent connectivity (in Fig. 4) we also used a mixed-effect model with T1w/T2w ratio as fixed effect and patients as random effect (to account for the repeated measures in multiple brain locations).”

      All analyses were rerun with more data (eyes closed resting) and 2 additional patients that have become available since the first submission. Therefore all figures and statistics have been updated throughout the paper. Other than the difference between movies and resting state which was trending before and is now significant, no results changed.

    1. eLife Assessment

      This valuable work presents an interpretable protein-DNA Energy Associative (IDEA) model for predicting binding sites and affinities of DNA-binding proteins. While the method is convincing, it requires some adaptation for application to different proteins. The IDEA method is available and can be potentially used for predicting genome-wide protein-DNA binding sites.

    2. Reviewer #2 (Public review):

      Summary:

      Zhang et al. present a methodology to model protein-DNA interactions via learning an optimizable energy model, taking into account a represetative bound structure for the system and binding data. The methodology is sound and interesting. They apply this model for predicting binding affinity data and binding sites in vivo.

      Strengths:

      The manuscript is well organized with good visualizations and is easy to follow. The methodology is discussed in detail. The IDEA energy model seems like an interesting way to study a protein-DNA system in the context of a given structure and binding data. The authors show that an IDEA model trained on one system can be transferred to other structurally similar systems. The authors show good performance in discriminating between binding-vs-decoy sequences for various systems, and binding affinity prediction. The authors also show evidence of the ability to predict genome-wide binding sites.

      Weaknesses:

      An energy-based model which needs to be optimized for specific systems is inherently an uncomfortable idea. Prediction of binding affinity is a well-studied domain and many competitors exist, some of which are well used. The usefulness of this method will be a test of time. The methodology is interpretable in a limited sense. The model is dependent on preserved interface geometry which might lead to suboptimal results for novel folds. The model predicts different output for reverse complement sequence (which in reality are the same as far as double helix is concerned). This is unintuitive.

      Comments on revisions:

      The authors have addressed my points regarding comparisons with existing methods, clarifying discussion terminologies and proper discussion of the existing literature. This resulted in a stronger manuscript with a clearer understanding of applicability.

    3. Reviewer #3 (Public review):

      Summary:

      Protein-DNA interactions and sequence readout represent a challenging and rapidly evolving field of study. Recognizing the complexity of this task, the authors have developed a compact and elegant model. They applied well-established approaches to address a difficult problem, effectively enhancing the information extracted from sparse contact maps by integrating an artificial decoy sequence set and available experimental data. This has resulted in a practical tool that can be adapted for use with other proteins.

      Strengths:

      The authors integrate sparse information with available experimental data to construct a model whose utility extends beyond the limited set of structures used for training.

      A comprehensive methods section is included, ensuring reproducibility.

      The authors provide a well-represented performance comparison between their model and other existing models.

      Additionally, the authors have shared their model as a GitHub project, reflecting their commitment to research transparency.

      Weaknesses:

      The coarse-graining procedure is quite convoluted, but the authors provide reasoning for the proposed scheme. The authors acknowledge discrepancies between data-driven and simulation models.

    4. Author response:

      The following is the authors’ response to the original reviews

      Reviewer #1:

      Comment 0: Summary: This work presents an Interpretable protein-DNA Energy Associative (IDEA) model for predicting binding sites and affinities of DNA-binding proteins. Experimental results demonstrate that such an energy model can predict DNA recognition sites and their binding strengths across various protein families and can capture the absolute protein-DNA binding free energies.

      We appreciate the reviewer’s careful assessment of the paper, and we thank the reviewer for the insightful suggestions and comments.

      Comment 1: Strengths: (1) The IDEA model integrates both structural and sequence information, although such an integration is not completely original. (2) The IDEA predictions seem to have agreement with experimental data such as ChIP-seq measurements.

      We appreciate the reviewer’s positive comments on the strength of the paper.

      Comment 2: Weaknesses: (1) The authors claim that the binding free energy calculated by IDEA, trained using one MAX-DNA complex, correlates well with experimentally measured MAX-DNA binding free energy (Figure 2) based on the reported Pearson Correlation of 0.67. However, the scatter plot in Figure 2A exhibits distinct clustering of the points and thus the linear fit to the data (red line) may not be ideal. As such. the use of the Pearson correlation coefficient that measures linear correlation between two sets of data may not be appropriate and may provide misleading results for non-linear relationships.

      We thank the reviewer for the insightful comments and agree that a linear fit between our predictions and the experimental data may not be the best measure of performance. The primary utility of the IDEA model is to predict high-affinity DNA-binding sequences for a given DNA-binding protein by assessing the relative binding affinities across different DNA sequences. In this regard, the ranked order of predicted sequence binding affinities serves as a better metric for evaluating the success of this model. To evaluate this, we calculated both Spearman’s rank correlation coefficient, which does not rely on linear correlation, and the Pearson correlation coefficient between our predictions and the experimental results. As shown in Figure 2, our computation shows a Spearman’s rank correlation coefficient of 0.65 for the MAX-based predictions using one MAX-DNA complex (PDB ID: 1HLO), supporting the model’s capability to effectively distinguish strong from weak binders.

      Although our model generally captures the relative binding affinities across different DNA sequences, its predictive accuracy diminishes for low-affinity sequences (Figure 2).

      This could be due to two limitations of the current modeling framework: (1) The model is residue-based and estimates binding free energy as the additive sum of contributions from individual contacting amino-acid-nucleotide pairs. This assumption does not account for cooperative effects caused by simultaneous changes at multiple nucleotide positions. One potential direction to further improve the model would be to use a finergrained representation by incorporating more atom types within contacting residues, and to use a many-body potential to better capture cooperative effects from multiple mutations. (2) The model assumes that the target DNA adopts the same binding interface as in the reference crystal structure. However, sequence-dependent DNA shape has been shown to be important in determining protein-DNA binding affinity [1]. To address this limitation, a future direction is to use deep-learning-based methods to incorporate predicted DNA shape or protein-DNA complex structures based on their sequences [2, 3] into our model prediction.

      To fully evaluate the predictive power of IDEA, we have included Spearman’s rank correlation coefficient for every correlation plot in this manuscript and have updated the relevant texts. Across all our analyses, the Spearman’s rank correlation coefficients reveal similar predictive performance as the Pearson correlation coefficients. Additionally, we have included in our discussion the current limitations of our model and potential directions for future improvement.

      We have edited our Discussion Section to include a discussion on the limitations of the current model. Specifically, the added texts are:

      “Although IDEA has proved successful in many examples, it can be improved in several aspects. The model currently assumes the training and testing sequences share the same protein-DNA structure. While double-stranded DNA is generally rigid, recent studies have shown that sequence-dependent DNA shape contributes to their binding specificity [1, 2, 4]. To improve predictive accuracy, one could incorporate predicted DNA shapes or structures into the IDEA training protocol. In addition, the model is residue-based and evaluates the binding free energy as the additive sum of contributions from individual amino-acid-nucleotide contacts. This assumption does not account for cooperative effects that may arise from multiple nucleotide changes. A potential refinement could utilize a finer-grained model that includes more atom types within contacting residues and employs a many-body potential to account for such cooperative effects.”

      Comment 3: (2) In the same vein, the linear Pearson Correlation analysis performed in Figure 5A and the conclusion drawn may be misleading.

      We thank the reviewer for the insightful comments. As noted in our response to the previous comment, we have added Spearman’s rank correlation coefficient in addition to the Pearson correlation coefficient to all correlation plots, including Figure 5A.

      Comment 4: (3) The authors included the sequences of the protein and DNA residues that form close contacts in the structure in the training dataset, whereas a series of synthetic decoy sequences were generated by randomizing the contacting residues in both the protein and DNA sequences. In particular, synthetic decoy binders were generated by randomizing either the DNA (1000 sequences) or protein sequences (10,000 sequences) from the strong binders. However, the justification for such randomization and how it might impact the model’s generalizability and transferability remain unclear.

      We thank the reviewer for the insightful comments. The number of randomizing sequences was chosen to strike a balance between sufficient sequence coverage and computational feasibility. Because proteins have more types of amino acids than four nucleotides in DNA, we utilized more protein decoy sequences than DNA decoys. To examine the robustness of our choice against different number of decoy sequences, we repeated the transferability analysis within the bHLH superfamily (Figure 3A) and the generalizability analysis across 12 protein families (Figure 2E) using two additional decoy sequence combinations: (1) 1000 DNA sequences and 1000 protein sequences; (2) 100 DNA sequences and 1000 protein sequences. As shown in Figure S15, we achieved similar results to those reported using the original decoy set, demonstrating the robustness of our model prediction against the variations in the number of decoys. We have included this figure as Figure S15.

      Comment 5: (4) The authors performed Receiver Operating Characteristic (ROC) analysis and reported the Area Under the Curve (AUC) scores in order to quantitate the successful identification of the strong binders by IDEA. It would be beneficial to analyze the precision-recall (PR) curve and report the PRAUC metric which could be more robust.

      We agree with the reviewer that more robust statistical metrics should be used to evaluate our model’s performance. We have included the PRAUC score as an additional evaluation metric of the model’s performance. Due to a significant imbalance in the number of strong and weak binders from the experimental data [5], where the experimentally identified strong binders are far fewer than the weak binders, we reweighted the sample to achieve a balanced evaluation [6], using 0.5 as the baseline for randomized prediction. As shown in Figure S5, IDEA achieves successful predictions in 18 out of 22 cases, demonstrating its predictive accuracy.

      The updated PRAUC result has been included as Figure S5 in the manuscript. We have also included the detailed precision-recall curves for each case in Figure S4.

      In addition, we have provided PRAUC scores for comparing the performance of IDEA with other models, and have summarized these results in Table S2.

      Reviewer #2:

      Comment 0: Summary: Zhang et al. present a methodology to model protein-DNA interactions via learning an optimizable energy model, taking into account a representative bound structure for the system and binding data. The methodology is sound and interesting. They apply this model for predicting binding affinity data and binding sites in vivo. However, the manuscript lacks discussion of/comparison with state-of-the-art and evidence of broad applicability. The interpretability aspect is weak, yet over-emphasized.

      We appreciate the reviewer’s excellent summary of the paper, and we thank the reviewer for the insightful suggestions and comments.

      Comment 1: Strengths: The manuscript is well organized with good visualizations and is easy to follow. The methodology is discussed in detail. The IDEA energy model seems like an interesting way to study a protein-DNA system in the context of a given structure and binding data. The authors show that an IDEA model trained on one system can be transferred to other structurally similar systems. The authors show good performance in discriminating between binding-vs-decoy sequences for various systems, and binding affinity prediction. The authors also show evidence of the ability to predict genome-wide binding sites.

      We appreciate the reviewer’s strong assessment of the strengths of this paper. We have further refined our Methods Section to ensure all modeling details are clearly presented.

      Comment 2: Weaknesses: An energy-based model that needs to be optimized for specific systems is inherently an uncomfortable idea. Is this kind of energy model superior to something like Rosetta-based energy models, which are generally applicable? Or is it superior to family-specific knowledge-based models? It is not clear.

      We thank the reviewer for the insightful comments. The protein-DNA energy model facilitates the calculation of protein-DNA binding free energy based on protein-DNA structures and sequences. Because this model is optimized using the structure-sequence relationship of given protein-DNA complexes, it features specificity based on the conserved structural interface characteristic of each protein family. Because of that, its predictive accuracy depends on the degree of protein-DNA interface similarity between the training and target protein-DNA pairs, and is distinct from a general protein-DNA energy model, such as a Rosetta-based energy model. The model has some connections to the familyspecific energy model. As shown in Author response image 1, systems belonging to the same protein superfamily (MAX and PHO4) exhibit similar patterns in their learned energy models, in contrast to those from a different superfamily (PDX1).

      Author response image 1:

      Comparison of learned energy models for different protein-DNA complexes: MAX (A), PHO4 (B), and PDX1 (C). MAX and PHO4 are members of the Helixloop-helix (HLH) CATH protein superfamily (4.10.280.100), while PDX1 belongs to another Homeodomain-like CATH protein superfamily (1.10.10.60).

      To compare our approach with both general and family-specific knowledge-based energy models, we conducted two studies. First, we incorporated a knowledge-based generic protein-DNA energy model (DBD-Hunter) learned from the protein-DNA database, reported by Skoinick and coworkers [7], into our prediction protocol. This model assigns interaction energies to different functional groups within each DNA nucleotide (e.g., phosphate (PP), sugar (SU), pyrimidine (PY), and imidazole (IM) groups). For our comparison, we averaged the energy contributions of these groups within each nucleotide and replaced the IDEA-learned energy model with this generic one to test its ability to differentiate strong binders from weak binders in the HT-SELEX dataset [5]. As shown in Figure S6, the IDEA model generally achieves better performance than the generic energy model.

      Additionally, we compared IDEA with rCLAMPS, a family-specific energy model developed to predict protein-DNA binding specificity in the C2H2 and homeodomain families.

      As shown in Table S1 and Table S2, IDEA also shows better performance than rCLAMPS in most cases across the C2H2 and homeodomain families, demonstrating that it has better predictive accuracy than both state-of-the-art family-specific and generic knowledgebased models.

      We have included relevant texts in Appendix Section Comparison of IDEA predictive performance Using HT-SELEX data to clarify this point. The added texts are:

      In addition, we compared the performance of IDEA with both general and family-specific knowledge-based energy models. First, we incorporated a knowledgebased generic protein-DNA energy model (DBD-Hunter) learned from the protein-DNA database, reported by Skoinick and coworkers [7], into our prediction protocol. This model assigns interaction energies to different functional groups within each DNA nucleotide, including phosphate (PP), sugar (SU), pyrimidine (PY), and imidazole (IM) groups. For our comparison, we averaged the energy contributions of these groups within each nucleotide and replaced the IDEA-learned energy model with the DBD-Hunter model to assess its ability to differentiate strong binders from weak binders in the HTSELEX dataset [5]. Additionally, we compared IDEA with rCLAMPS, a familyspecific energy model developed to predict protein-DNA binding specificity in the C2H2 and homeodomain families. rCLAMPS learns a position-dependent amino-acid-nucleotide interaction energy model. To incorporate this model into the binding free energy calculation, we averaged the energy contributions across all occurrences of each amino-acid-nucleotide pair, which resulted in a 20-by-4 residue-type-specific energy matrix. This matrix is structurally analogous to the IDEA-trained energy model and can be directly integrated into the binding free energy calculations. As shown in Figure S6, Table S1, and Table S2, the IDEA model generally outperforms DBD-Hunter and rCLAMPS, demonstrating that it can achieve better predictive accuracy than both generic and family-specific knowledge-based models.

      Comment 3: Prediction of binding affinity is a well-studied domain and many competitors exist, some of which are well-used. However, no quantitative comparison to such methods is presented. To understand the scope of the presented method, IDEA, the authors should discuss/compare with such methods (e.g. PMID 35606422).

      We thank the reviewer for the insightful comments. As detailed in our response to Comment 5, we previously misused the term “binding specificity”, and would like to clarify that our model is designed to predict protein-DNA binding affinity. To compare the performance of IDEA with state-of-the-art protein-DNA predictive models, we examined the predictive accuracies of two additional popular computational models: ProBound [8] and DeepBind [9]. ProBound has been shown to have a better performance than several earlier predictive protein-DNA models, including JASPAR 2018 [11], HOCOMOCO [12], Jolma et al. [13], and DeepSELEX [14]. To benchmark these models’ performance, we examine each method’s capability to identify strong binders with the HT-SELEX datasets covering 22 proteins from 12 protein families [5]. As suggested by Reviewer 1, we also calculated the PRAUC score, reweighted to account for data imbalance [6], as a complementary metric for evaluating the model performance.

      As shown in Figure S6, Table S1, and Table S2, IDEA ranked second among the three predictive methods. It is important to note that both ProBound and DeepBind were trained on a curated version of the HT-SELEX data [13], which overlaps with the testing data [5]. Compared with them, IDEA was trained only on the given structural and sequence information from a single protein-DNA complex, thus independent of the testing data. In order to assess how IDEA performs when incorporating knowledge from HT-SELEX data, we augmented the training by randomly including half of the HT-SELEX data (see the Methods Section Enhanced Modeling Prediction with SELEX Data). The augmented IDEA model achieved the best performance among all the models. Overall, IDEA can be used to predict protein-DNA affinities in the absence of known binding sequence data, thereby filling a critical gap when such experimental datasets are unavailable.

      Additionally, we have conducted a 10-fold cross-validation using the same HT-SELEX data [5] and found that IDEA outperformed a recent regression model that considers the shape of DNA with different sequences [5].

      We have revised our text to include the comparison between IDEA and other predictive models. Specifically, we revised the text in Section: IDEA Generalizes across Various Protein Families.

      The revised text reads:

      “To examine IDEA’s predictive accuracy across different DNA-binding protein families, we applied it to calculate protein-DNA binding affinities using a comprehensive HT-SELEX dataset [5]. We focused on evaluating the capability of IDEA to distinguish strong binders from weak binders for each protein with an experimentally determined structure. We calculated the probability density distribution of the top and bottom binders identified in the SELEX experiment. A well-separated distribution indicates the successful identification of strong binders by IDEA (Figure 2D and S4). Receiver Operating Characteristic (ROC) analysis was performed to calculate the Area Under the Curve (AUC) and the precision-recall curve (PRAUC) scores for these predictions. Further details are provided in the Methods Section Evaluation of IDEA Prediction Using HT-SELEX Data. Our analysis shows that IDEA successfully differentiates strong from weak binders for 80% of the 22 proteins across 12 protein families, achieving AUC and balanced PRAUC scores greater than 0.5 (Figure 2D and S5). To benchmark IDEA’s performance against other leading methods, we compared its predictions with several popular models, including the sequence-based predictive models ProBound [8] and DeepBind [9], the familybased energy model rCLAMPS [10], and the knowledge-based energy model DBD-Hunter [7]. IDEA demonstrates performance comparable to these stateof-the-art approaches, and incorporating sequence features further improves its prediction accuracy (Figure S6, Table S1, and Table S2). We also performed 10-fold cross-validation on the binding affinities of protein–DNA pairs in this dataset and found that IDEA outperforms a recent regression model that considers the shape of DNA with different sequences [5] (Figure S7). Details are provided in Section: Comparison of IDEA predictive performance Using HT-SELEX data.”

      We also added one section Comparison of IDEA predictive performance Using HT-SELEX data in the Appendix to fully explain the comparison between IDEA and other popular models. The added texts are:

      “To benchmark the performance of IDEA against state-of-the-art protein-DNA predictive models, we evaluated its ability to recognize strong binders with the HT-SELEX datasets across 22 proteins from 12 families [5]. Specifically, we compare IDEA with two widely used sequence-based models: ProBound [8] and DeepBind [9]. ProBound has demonstrated superior performance over many other predictive protein-DNA models, including JASPAR 2018 [11], HOCOMOCO [12], Jolma et al. [13], and DeepSELEX [14]. To use ProBound, we retrieved the trained binding model for each protein from motifcentral.org and used the GitHub implementation of ProBoundTools to infer the binding scores between protein and target DNA sequences. Except for POU3F1, binding models are available for all proteins. Therefore, we excluded POU3F1 and evaluated the protein-DNA binding affinities for the remaining 21 proteins. To use DeepBind, sequence-specific binding affinities were predicted directly with its web server. The Area Under the Curve (AUC) and the Precision-Recall AUC (PRAUC) scores were used as metrics for comparison. An AUC score of 1.0 indicates a perfect separation between the strong- and weak-binder distributions, while an AUC score of 0.5 indicates no separation. Because there is a significant imbalance in the number of strong and weak binders from the experimental data [5], where the strong binders are far fewer than the weak binders, we reweighted the samples to achieve a balanced evaluation, using 0.5 as the baseline for randomized prediction [6]. As summarized in Figure S6, Table S1, and Table S2, IDEA ranked second among the three predictive models. In order to assess the performance of IDEA when augmented with additional protein-DNA binding data, we augmented IDEA using randomly selected half of the HT-SELEX data (see the Methods Section Enhanced Modeling Prediction with SELEX Data). The augmented IDEA model achieved the best performance among all the models.”

      “We also performed 10-fold cross-validation using the same HT-SELEX datasets, following the protocol described in the Methods Section Enhanced Modeling Prediction with SELEX Data. For each protein, we divided the entire dataset into 10 equal, randomly assigned folds. In each iteration, we used randomly selected 9 of the 10 folds as the training dataset and the remaining fold as the testing dataset. This process was repeated 10 times so that each fold served as the test set once. We then reported the average R2 scores across these iterations to evaluate IDEA’s predictive performance. Our results are compared with the 1mer and 1mer+shape methods from [5], the latest regression model that considers the shape of DNA with different sequences (Figure S7). This comparative analysis shows IDEA achieved higher predictive accuracy than the state-of-the-art sequence-based protein-DNA binding predictors for proteinDNA complexes that have available experimentally resolved structures.”

      “Overall, these results demonstrate that IDEA can be used to predict the proteinDNA pairs in the absence of known binding sequence data, thus filling an important gap in protein-DNA predictions when experimental binding sequence data are unavailable.”

      Comment 4: The term “interpretable” has been used lavishly in the manuscript while providing little evidence on the matter. The only evidence shown is the family-specific residue-nucleotide interaction/energy matrix and speculations on how these values are biologically sensible. Recent works already present more biophysical, fine-grained, and sometimes family-independent interpretability (e.g. PMID 39103447, 36656856, 38352411, etc.). The authors should put into context the scope of the interpretability of IDEA among such works.

      We thank the reviewer for the insightful comment and agree that “interpretability” should be discussed in a relevant context. In our work, interpretability refers to the familyspecific amino-acid-nucleotide interaction energies identified from the model training, which reveal interaction preferences within protein-DNA binding interfaces. As detailed in our response to Comment 6, we performed principal component analysis (PCA) on the learned energy models and observed clustering of learned energy models corresponding to protein families. Therefore, the IDEA-learned energy models can be used as a signature to capture the energetic preferences of amino-acid-nucleotide interactions within a given protein family. This preference can be used to infer preferred sequence binding motifs, similar to those identified by other computational tools [10, 4, 15, 16].

      We have revised the text to clarify the “interpretability” as the family-specific aminoacid-nucleotide interactions that govern sequence-dependent protein-DNA binding, and to discuss IDEA’s interoperability within the context of recent works, including those suggested by the reviewers.

      We have revised the text in Introduction. The new text reads:

      “Here, we introduce the Interpretable protein-DNA Energy Associative (IDEA) model, a predictive model that learns protein-DNA physicochemical interactions by fusing available biophysical structures and their associated sequences into an optimized energy model (Figure 1). We show that the model can be used to accurately predict the sequence-specific DNA binding affinities of DNA-binding proteins and is transferrable across the same protein superfamily. Moreover, the model can be enhanced by incorporating experimental binding data and can be generalized to enable base-pair resolution predictions of genomic DNA-binding sites. Notably, IDEA learns a family-specific interaction matrix that quantifies energetic interactions between each amino acid and nucleotide, allowing for a direct interpretation of the “molecular grammar” governing sequence-specific protein-DNA binding affinities. This interpretable energy model is further integrated into a simulation framework, facilitating mechanistic studies of various biomolecular functions involving protein-DNA dynamics.”

      We have revised the text in Results. The new text reads:

      “IDEA is a coarse-grained biophysical model at the residue resolution for investigating protein-DNA binding interactions (Figure 1). It integrates both structures and corresponding sequences of known protein-DNA complexes to learn an interpretable energy model based on the interacting amino acids and nucleotides at the protein-DNA binding interface. The model is trained using available protein-DNA complexes curated from existing databases [17, 18].

      Unlike existing deep-learning-based protein-DNA binding prediction models, IDEA aims to learn a physicochemical-based energy model that quantitatively characterizes sequence-specific interactions between amino acids and nucleotides, thereby interpreting the “molecular grammar” driving the binding energetics of protein-DNA interactions. The optimized energy model can be used to predict the binding affinity of any given protein-DNA pair based on its structures and sequences. Additionally, it enables the prediction of genomic DNA binding sites by a given protein, such as a transcription factor. Finally, the learned energy model can be incorporated into a simulation framework to study the dynamics of DNA-binding processes, revealing mechanistic insights into various DNA-templated processes. Further details of the optimization protocol are provided in Methods Section Energy Model Optimization.”

      The revised text in Section: Discussion now reads:

      “Another highlight of IDEA is its ability to present an interpretable, familyspecific amino acid-nucleotide interaction energy model for given proteinDNA complexes. The optimized IDEA energy model can not only predict sequence-specific binding affinities of protein-DNA pairs but also provide a residue-specific interaction matrix that dictates the preferences of amino acidnucleotide interactions within specific protein families (Figure S11). This interpretable energy matrix would facilitate the discovery of sequence binding motifs for target DNA-binding proteins, complementing both sequencebased [24, 16, 25] and structure-based approaches [10, 26, 4, 15]. Additionally, we integrated this physicochemical-based energy model into a simulation framework, thereby improving the characterization of protein-DNA binding dynamics. IDEA-based simulation enables the investigation into dynamic interactions between various proteins and DNA, facilitating molecular-level understanding of the physical mechanisms underlying many DNA-binding processes, such as transcription, epigenetic regulations, and their modulation by sequence variations, such as single-nucleotide polymorphisms (SNPs) [22, 23].”

      Comment 5: The manuscript disregards subtle yet important differences in commonly used terminology in the field. For example, the authors use the term ”specificity” and ”affinity” almost interchangeably (for example, the caption for Figure 3A uses ”specificity” although the Methods text describes the prediction as about ”affinity”). If the authors are looking to predict specificity, IDEA needs to be put in the context of the corresponding state-of-the-art (PMID 36123148, 39103447, 38867914, 36124796, etc).

      We really appreciate the reviewer for pointing out the conflation of “specificity” and “affinity” in our manuscript. To clarify, the primary function of IDEA is to predict the binding affinities of protein-DNA pairs in a sequence-specific manner. We have revised the text to clarify the distinction between affinity and specificity and acknowledge prior works, including those provided by the reviewers, that focus on predicting protein-DNA binding specificity.

      We have revised the Section title IDEA Accurately Predicts Protein-DNA Binding Specificity to IDEA Accurately Predicts Sequence-Specific Protein-DNA Binding Affinity; and ResidueLevel Protein-DNA Energy Model for Predicting Protein-DNA Recognition Specificities to Predictive Protein-DNA Energy Model at Residue Resolution.

      We have revised the text in Introduction. The revised text reads:

      “Computational methods complement experimental efforts by providing the initial filter for assessing sequence-specific protein-DNA binding affinity. Numerous methods have emerged to enable predictions of binding sites and affinities of DNA-binding proteins [27, 9, 1, 5, 28, 29, 30, 31, 8]. These methods often utilized machine-learning-based training to extract sequence preference information from DNA or protein by utilizing experimental high-throughput (HT) assays [27, 9, 1, 5, 28, 8], which rely on the availability and quality of experimental binding assays. Additionally, many approaches employ deep neural networks [29, 30, 31], which could obscure the interpretation of interaction patterns governing protein-DNA binding specificities. Understanding these patterns, however, is crucial for elucidating the molecular mechanisms underlying various DNA-recognition processes, such as those seen in TFs [32].”

      We have revised the text in Section: IDEA Demonstrates Transferability across Proteins in the Same CATH Superfamily.

      The revised text reads:

      “Since IDEA relies on the sequence-structure relationship of given protein-DNA complexes to reach predictive accuracy, we inquired whether the trained energy model from one protein-DNA complex could be generalized to predict the sequence-specific binding affinities of other complexes. To test this, we assessed the transferability of IDEA predictions across all 11 structurally available protein-DNA complexes within the MAX TF-associated CATH superfamily (CATH ID: 4.10.280.10, Helix-loop-helix DNA-binding domain). We trained IDEA based on each of these 11 complexes and then used the trained model to predict the MAX-based MITOMI binding affinity. Our results show that IDEA generally makes correct predictions of the binding affinity when trained on proteins that are homologous to MAX, with Pearson and Spearman Correlation coefficients larger than 0.5 (Figure 3A and Figure S10).”

      We have revised the caption of Figure 3: The revised text reads:

      “IDEA prediction shows transferability within the same CATH superfamily. (A) The predicted MAX binding affinity, trained on other protein-DNA complexes within the same protein CATH superfamily, correlates well with experimental measurement. The proteins are ordered by their probability of being homologous to the MAX protein, determined using HHpred [33]. Training with a homologous protein (determined as a hit by HHpred) usually leads to better predictive performance (Pearson Correlation coefficient > 0.5) compared to non-homologous proteins. (B) Structural alignment between 1HLO (white) and 1A0A (blue), two protein-DNA complexes within the same CATH Helix-loop-helix superfamily. The alignment was performed based on the Ebox region of the DNA [34]. (C) The optimized energy model for 1A0A, a protein-DNA complex structure of the transcription factor PHO4 and DNA, with 33.41% probability of being homologous to the MAX protein. The optimized energy model is presented in reduced units, as explained in the Methods Section: Training Protocol.”

      We have revised the text in Section Discussion: The revised text now reads:

      “The protein-DNA interaction landscape has evolved to facilitate precise targeting of proteins towards their functional binding sites, which underlie essential processes in controlling gene expression. These interaction specifics are determined by physicochemical interactions between amino acids and nucleotides. By integrating sequences and structural data from available proteinDNA complexes into an interaction matrix, we introduce IDEA, a data-driven method that optimizes a system-specific energy model. This model enables high-throughput in silico predictions of protein-DNA binding specificities and can be scaled up to predict genomic binding sites of DNA-binding proteins, such as TFs. IDEA achieves accurate de novo predictions using only proteinDNA complex structures and their associated sequences, but its accuracy can be further enhanced by incorporating available experimental data from other binding assay measurements, such as the SELEX data [35, 36, 37], achieving accuracy comparable or better than state-of-the-art methods (Figures S2 and S7, Table S1 and S2). Despite significant progress in genome-wide sequencing techniques [38, 39, 40, 41], determining sequence-specific binding affinities of DNA-binding biomolecules remains time-consuming and expensive. Therefore, IDEA presents a cost-effective alternative for generating the initial predictions before pursuing further experimental refinement.”

      We have revised the text in Discussion to clarify that the acquired binding affinities of target DNA sequences can be used to help existing models to infer specific DNA binding motifs.

      The revised text now reads:

      Another highlight of IDEA is its ability to present an interpretable, familyspecific amino acid-nucleotide interaction energy model for given proteinDNA complexes. The optimized IDEA energy model can not only predict sequence-specific binding affinities of protein-DNA pairs but also provide a residue-specific interaction matrix that dictates the preferences of amino acidnucleotide interactions within specific protein families (Figure S11). This interpretable energy matrix would facilitate the discovery of sequence binding motifs for target DNA-binding proteins, complementing both sequencebased [24, 16, 25] and structure-based approaches [10, 26, 4, 15]. Additionally, we integrated this physicochemical-based energy model into a simulation framework, thereby improving the characterization of protein-DNA binding dynamics. IDEA-based simulation enables the investigation into dynamic interactions between various proteins and DNA, facilitating molecular-level understanding of the physical mechanisms underlying many DNA-binding processes, such as transcription, epigenetic regulations, and their modulation by sequence variations, such as single-nucleotide polymorphisms (SNPs) [22, 23].

      Comment 6: It is not clear how much the learned energy model is dependent on the structural model used for a specific system/family. It would be interesting to see the differences in learned model based on different representative PDB structures used. Similarly, the supplementary figures show a lack of discriminative power for proteins like PDX1 (homeodomain family), POU, etc. Can the authors shed some light on why such different performances?

      We thank the reviewer for the insightful comments and agree that the trained energy model should be presented in the context of protein families. To further analyze the dependence of the energy model on protein family, we visualized the trained energy models for 24 proteins, including all proteins from the HT-SELEX dataset as well as PHO4 (PDB ID: 1A0A) and CTCF (PDB ID: 8SSQ), spanning 12 distinct protein families. To quantitatively assess similarities and differences among these energy models, we flattened each normalized energy model into an 80-dimensional vector and performed principal component analysis (PCA). As shown in Author response image 1 and Figure S11, energy models optimized from the same protein family fall within the same cluster, while those from different protein families exhibit distinct patterns. Moreover, the relative distance between energy models in PCA space reflects the degree of transferability. For example, PHO4 (PDB ID: 1A0A) is positioned close to MAX (PDB ID: 1HLO), whereas USF1 (PDB ID: 1AN4) and TCF4 (PDB ID: 6OD3) are farther away. This is consistent with the results shown in Figure 3A, where the energy model trained from PHO4 has better transferability than those from the other two systems.

      We also greatly appreciate the reviewer’s suggestion to examine cases where IDEA failed to demonstrate strong discriminative power. When evaluating the model’s ability to distinguish between strong and weak binders, we used the available experimental structure most similar to the protein employed in the HT-SELEX experiments. In some instances, only the structure of the same protein from a different organism is available. For example, the HT-SELEX data for PDX1-DNA used the human PDX1 protein, but no human PDX1–DNA complex structure is available. Therefore, we used the mouse PDX1–DNA complex (PDB ID: 2H1K) for model training. The differences between species may limit the predictive accuracy of the model. A similar limitation applies to POU3F1, where an available mouse complex (PDB ID: 4Y60) was used to predict human protein–DNA interactions. Notably, DeepBind [9], a sequence-based prediction tool, also failed to distinguish strong from weak binders when using the mouse POU3F1 protein (AUC score: 0.457), but this was corrected with the human POU3F1 protein (AUC score: 0.956).

      We also examined the remaining cases where IDEA did not show a clear distinction between strong and weak binders: USF1, Egr1, and PROX1. For PROX1, we initially used the structure of a protein-DNA complex (PDB ID: 4Y60) in training. However, upon closer inspection, we discovered that this structure does not include the PROX1 protein, but SOX-18, a different transcription factor. This explains the inaccurate prediction made by IDEA. Since no experimental PROX1-DNA complex structure is currently available, we have removed this case from our HT-SELEX evaluation.

      IDEA also fails to fully resolve the binding preference of USF1. A closer examination of the HT-SELEX data reveals a lack of distinction among the sequences, as most sequences, including those with the lowest M-word (binding affinity) scores, contain the DNA-binding E-box sequence CACGTG. Therefore, USF1 represents a challenging example where the experimental data only consists of strong binders with limited variations in binding affinity, which likely results from differences in flanking sequences of the E-box motif.

      Egr1 stands as a peculiar example. Whereas IDEA does not effectively distinguish between the strong and weak binders in the current HT-SELEX dataset, its predictions are consistent with other experimental datasets, including binding affinities measured by kMITOMI [42] (Figure S8A, B), preferred binding sequences from protein-binding microarray, an earlier HT-SELEX experiment, and bacterial one-hybrid data [43]. Therefore, further investigation of the current HT-SELEX data is needed to reconcile these differences.

      We have included additional text in Section: IDEA Demonstrates Transferability across Proteins in the Same CATH Superfamily to discuss the PCA analysis and the dependence of the model’s transferability on the similarity among the learned energy models.

      The revised text now reads:

      “The transferability of IDEA within the same CATH superfamily can be understood from the similarities in protein-DNA binding interfaces, which determine similar learned energy models. For example, the PHO4 protein (PDB I”D: 1A0A) shares a highly similar DNA-binding interface with the MAX protein (PDB ID: 1HLO) (Figure 3B), despite sharing only a 33.41% probability of being homologous. Consequently, the energy model derived from the PHO4DNA complex (Figure 3C) exhibits a similar amino-acid-nucleotide interactive pattern as that learned from the MAX-DNA complex (Figure 2B). To further evaluate the similarity between the learned energy models and their connection to protein families, we performed principal component analysis (PCA) on the normalized energy models across 24 proteins from 12 protein families [5]. Our analysis (Figure S11) reveals that most of the energy models from the same protein family fall within the same cluster, while those from different protein families exhibit distinct patterns. Moreover, the relative distance between energy models in PCA space reflects the degree of transferability between them. For example, PHO4 (PDB ID: 1A0A) is positioned close to MAX (PDB ID: 1HLO), whereas USF1 (PDB ID: 1AN4) and TCF4 (PDB ID: 6OD3) are farther away. This is consistent with the results in Figure 3A, where the energy model trained on PHO4 has better transferability than those trained on USF1 or TCF4.”

      We have also added an Appendix section titled Analysis of examples where IDEA fails to recognize strong DNA binders to discuss the examples in which IDEA did not perform well:

      “We examine IDEA’s capability in identifying strong binders from the HT-SELEX dataset across 12 protein families [5]. The model successfully predicts 18 out of 22 protein-DNA systems, but the performance is reduced in 4 cases. Closer investigations revealed the source of these limitations. In some instances, only the protein from a different organism is available. For example, the PDX1 HT-SELEX data utilized the human PDX1 protein, but no human PDX1–DNA complex structure is available. Therefore, the mouse PDX1–DNA complex structure (PDB ID: 2H1K) was used for model training. Differences between model organisms may reduce predictive accuracy. A similar limitation applies to POU3F1, where an available mouse complex (PDB ID: 4Y60) was used to predict human protein–DNA interactions. Notably, DeepBind [9], a sequence-based prediction tool, also failed to distinguish strong from weak binders when using the mouse POU3F1 protein (AUC score: 0.457), but this was corrected with the human POU3F1 protein (AUC score: 0.956).

      IDEA also fails to fully resolve the binding preference of USF1. A closer examination of the HT-SELEX data reveals a lack of distinction among the sequences, as most sequences, including those with the lowest M-word (binding affinity) scores, contain the DNA-binding E-box sequence CACGTG. Therefore, USF1 represents a challenging example where the experimental data only consists of strong binders with limited variations in binding affinity, which likely results from differences in flanking sequences of the E-box motif.

      Egr1 stands as a peculiar example. Whereas IDEA does not effectively distinguish between the strong and weak binders in the current HT-SELEX dataset, its predictions are consistent with other experimental datasets, including binding affinities measured by k-MITOMI [42] (Figure S8A, B), preferred binding sequences from protein-binding microarray, an earlier HT-SELEX experiment, and bacterial one-hybrid data [43]. Therefore, further investigation of the current HT-SELEX data is needed to reconcile these differences.”

      Comment 7: It is also not clear if IDEA’s prediction for reverse complement sequences is the same for a given sequence. If so, how is this property being modelled? Either this description is lacking or I missed it.

      We thank the reviewer for the insightful comments. Given a target protein-DNA sequence, the IDEA protocol substitutes it into a known protein-DNA complex structure to evaluate the binding free energy, which can be converted into binding affinity. IDEA uses sequence identity to determine whether the forward or reverse strand of the DNA should be replaced. Only the strand most similar to the target sequence is substituted. As a result, the model treats reverse-complement sequences differently. As the orientations of test sequences are specified from 5’ to 3’ in all datasets used in this study (e.g., processed MITOMI, HT-SELEX, and ChIP-seq data), this approach ensures that the target sequences are replaced and evaluated correctly. In cases where sequence orientation is not provided (though this was not an issue in this study), we recommend replacing both the forward and reverse strands with the target sequence separately and evaluating the corresponding protein–DNA binding free energies. Since strong binders are likely to dominate the experimental signals, the higher predicted binding affinity, with stronger binding free energies, should be taken as the model’s final prediction.

      We have added one section to the Methods Section titled Treatment of Complementary DNA Sequences to clarify these modeling details.

      The specific text reads:

      To replace the DNA sequence in the protein-DNA complex structure with a target sequence, IDEA uses sequence identity to determine whether the target sequence belongs to the forward or reverse strand of the DNA in the proteinDNA structure. The more similar strand is selected and replaced with the target sequence. As the orientations of test sequences are specified from 5’ to 3’ in all datasets used in this study (e.g., processed MITOMI, HT-SELEX, and ChIP-seq data), this approach ensures that the target sequences are replaced and evaluated correctly. In cases where sequence orientation is not provided (though this was not an issue in this study), we recommend replacing both the forward and reverse strands with the target sequence separately and evaluating the corresponding protein–DNA binding free energies. Since strong binders are likely to dominate the experimental signals, the higher predicted binding affinity, with stronger binding free energy, should be taken as the model’s final prediction.”

      “Comment 8: Page 21 line 403, the E-box core should be CACGTG instead of CACGTC.

      We apologize for our oversight and have corrected the relevant text.

      Comment 9: The citation for DNAproDB is outdated and should be updated (PMID 39494533).

      We thank the reviewer for pointing this out and have updated our citation accordingly.

      Reviewer #3:

      Comment 0: Summary: Protein-DNA interactions and sequence readout represent a challenging and rapidly evolving field of study. Recognizing the complexity of this task, the authors have developed a compact and elegant model. They have applied well-established approaches to address a difficult problem, effectively enhancing the information extracted from sparse contact maps by integrating artificial sequences decoy set and available experimental data. This has resulted in the creation of a practical tool that can be adapted for use with other proteins.

      We appreciate the reviewer’s excellent summary of the paper, and we thank the reviewer for the insightful suggestions and comments.

      Comment 1: Strengths: (1) The authors integrate sparse information with available experimental data to construct a model whose utility extends beyond the limited set of structures used for training. (2) A comprehensive methods section is included, ensuring that the work can be reproduced. Additionally, the authors have shared their model as a GitHub project, reflecting their commitment to transparency of research.

      We appreciate the reviewer’s strong assessment of the strengths of this paper. In addition to sharing our model on GitHub, we have also uploaded the original data and the essential scripts required to reproduce the results presented in the manuscript. We hope this further demonstrates our commitment to transparency and reproducibility.

      Comment 2: Weaknesses: (1) The coarse-graining procedure appears artificial, if not confusing, given that full-atom crystal structures provide more detailed information about residue-residue contacts. While the selection procedure for distance threshold values is explained, the overall motivation for adopting this approach remains unclear. Furthermore, since this model is later employed as an empirical potential for molecular modeling, the use of P and C5 atoms raises concerns, as the interactions in 3SPN are modeled between Cα and the nucleic base, represented by its center of mass rather than P or C5 atoms.

      We appreciate the reviewer’s insightful comments. The selection of P and C5 atoms was based on different relative positions of protein and DNA across various complex structures, each with distinctive protein-DNA structural interfaces. To illustrate this, we selected two representative structures where our algorithm selected C5 and P atoms, respectively: MAX-DNA (PDB ID: 1HLO) and FOXP3 (PDB ID: 7TDW). As shown in Author response image 2, in the case of 1HLO, more C5 atoms are within the cutoff distance of 10 A from˚ the protein Cα atoms, thus capturing essential contacting interactions. In contrast, 7TDW has more P atoms within this cutoff. Importantly, several P atoms are distributed on the minor groove of the DNA, which were not captured by the C5 atoms. To maximize the inclusion of relevant structural contacts, we employed a filtering scheme that selectively chooses either P or C5 atoms based on their proximity to the protein to enhance the model prediction. We note that while this scheme is helpful, the IDEA predictions remain robust across different atom selections. To assess this robustness, we performed binding affinity predictions using only P atoms on the HT-SELEX dataset across 12 protein families [5]. Our predictions (Author response table 1) show comparable performance to that achieved using our filtering scheme.

      Author response image 2.

      Comparison between P and C5 atoms in proximity to the protein 3D structures of MAX–DNA (A) and FOXP-DNA (B) complexes, where P atoms (red sphere) and C5 atoms (blue sphere) that are within 10 A of Cα atoms are highlighted.

      When incorporating the trained IDEA energy model into a simulation model, we acknowledge a potential mismatch between the resolution of the data-driven model (one coarse-grained site per nucleotide) and the 3SPN simulation model (three coarse-grained sites per nucleotide). The selection of nucleic base sites for molecular interactions in the 3SPN model follows our previous work [44] and its associated code implementation. While revisiting this part of the manuscript, we identified an inconsistency in the reported results in Figure 5A of our initial version: Specifically, we previously used the protein side-chain atoms, rather than only the Cα atoms, in model training. Retraining the data using the Cα atoms results in reduced prediction performance for the IDEA model (Figure 5A). Nonetheless, incorporating this updated energy model into simulations still yielded high accuracy in the predicted absolute binding free energies (Author response image 3A), demonstrating the robustness of our simulation framework in predicting absolute binding free energies against variations in atom selection during the IDEA model training. Following the reviewer’s suggestion, we also incorporated the IDEA-trained energy model as short-range van der Waals interactions between protein Cα atoms and DNA P atoms. As shown in Author response image 3B, our simulation reveals a slightly improved performance over our original implementation, with higher Pearson and Spearman correlation coefficients and a fitted slope closer to 1.0. This result suggests that a more consistent atom selection scheme between the data-driven and simulation models can improve the overall predictions. Accordingly, we have updated Figure 5 with this improved setup, using the simulation model with short-range vdW interactions implemented between protein Cα atoms and DNA P atoms (Figure 5C), ensuring consistency between the IDEA model and simulation framework.

      Author response table 1.

      Comparison of IDEA performance using two DNA atom selection schemes: the filtering scheme presented in the manuscript (C5 and P atoms) versus using only P atoms. Cases where the two schemes result in different atom selections are highlighted in bold.

      We acknowledge that a gap still exists between the resolution of the data-driven and simulation models. To ensure a completely consistent coarse-grained level between these two models, we will work on implementing the IDEA model output for 1-bead-per-nucleotide DNA simulation models in the future.

      Comment 3: (2) Although the authors use a standard set of metrics to assess model quality and predictive power, some ∆∆G predictions compared to MITOMI-derived ∆∆G values appear nonlinear, which casts doubt on the interpretation of the correlation coefficient.

      Author response image 3.

      Comparison of simulations using different representative atoms (A) Protein-DNA binding simulation with the IDEA-model incorporated as short-range van der Waals between protein Cα atom and nucleic base site. (B) Protein-DNA binding simulation with the IDEA-model incorporated as short-range van der Waals between protein Cα atom and DNA P atoms. The predicted free energies are robust to the choice of DNA representative atoms. The predicted binding free energies are presented in physical units, and error bars represent the standard deviation of the mean.

      We thank the reviewer for the insightful comments and agree that the linear fit between our model’s prediction and the experimental data may not be the best measure of performance. The primary utility of the IDEA model is to predict high-affinity DNA-binding sequences for a given DNA-binding protein by assessing the relative binding affinities across different DNA sequences. In this regard, the ranked order of predicted sequence binding affinities serves as a better metric for evaluating the success of this model. To evaluate this, we calculated both Spearman’s rank correlation coefficient, which does not rely on linear correlation, and the Pearson correlation coefficient between our predictions and the experimental results. As shown in Figure 2, our computation shows a Spearman’s rank correlation coefficient of 0.65 for the MAX-based predictions using one MAX-DNA complex (PDB ID: 1HLO), supporting the model’s capability to effectively distinguish strong from weak binders.

      As reflected in Figure 2 of the main text, although our model generally captures the relative binding affinities across different DNA sequences, its predictive accuracy diminishes for low-affinity sequences (Figure 2). This could be due to two limitations of the current modeling framework: (1) The model is residue-based and estimates binding free energy as the additive sum of contributions from individual contacting amino-acid-nucleotide pairs. This assumption does not account for cooperative effects caused by simultaneous changes at multiple nucleotide positions. One potential direction to further improve the model would be to use a finer-grained representation by incorporating more atom types within contacting residues, and to use a many-body potential to better capture cooperative effects from multiple mutations. (2) The model assumes that the target DNA adopts the same binding interface as in the reference crystal structure. However, sequencedependent DNA shape has been shown to be important in determining protein-DNA binding affinity [1]. To address this limitation, a future direction is to use deep-learningbased methods to incorporate predicted DNA shape or protein-DNA complex structures based on their sequences [2, 3] into our model prediction.

      To fully evaluate the predictive power of IDEA, we have included Spearman’s rank correlation coefficient for every correlation plot in this manuscript. Across all our analyses, the Spearman’s rank correlation coefficients reveal similar predictive performance as the Pearson correlation coefficients. Additionally, we have included in our discussion the current limitations of our model and potential directions for future improvement.

      We have edited our Discussion Section to include a discussion on the limitations of the current model. Specifically, the added texts are:

      “Although IDEA has proved successful in many examples, it can be improved in several aspects. The model currently assumes the training and testing sequences share the same protein-DNA structure. While double-stranded DNA is generally rigid, recent studies have shown that sequence-dependent DNA shape contributes to their binding specificity [1, 2, 4]. To improve predictive accuracy, one could incorporate predicted DNA shapes or structures into the IDEA training protocol. In addition, the model is residue-based and evaluates the binding free energy as the additive sum of contributions from individual amino-acid-nucleotide contacts. This assumption does not account for cooperative effects that may arise from multiple nucleotide changes. A potential refinement could utilize a finer-grained model that includes more atom types within contacting residues and employs a many-body potential to account for such cooperative effects.”

      Comment 4: (3) The discussion section lacks information about the model’s limitations and a comprehensive comparison with other models. Additionally, differences in model performance across various proteins and their respective predictive powers are not addressed.

      We thank the reviewer for the insightful comments. As discussed in the response to Comment 3, the current structural model has several limitations, which may reduce predictive accuracy for weak DNA binders. We have noted these limitations in the Discussion section.

      To compare the performance of IDEA with state-of-the-art protein-DNA predictive models, we examined the predictive accuracies of two additional popular computational models: ProBound [8] and DeepBind [9]. ProBound has been shown to have a better performance than several earlier predictive protein-DNA models, including JASPAR 2018 [11], HOCOMOCO [12], Jolma et al. [13], and DeepSELEX [14]. To benchmark these models’ performance, we examine each method’s capability to identify strong binders with the HT-SELEX datasets covering 22 proteins from 12 protein families [5]. As suggested by Reviewer 1, we also calculated the PRAUC score, reweighted to account for data imbalance [6], as a complementary metric for evaluating the model performance.

      As shown in Figure S6, Table S1, and Table S2, IDEA ranked second among the three predictive methods. It is important to note that both ProBound and DeepBind were trained on a curated version of the HT-SELEX data [13], which overlaps with the testing data [5]. Compared with them, IDEA was trained only on the given structural and sequence information from a single protein-DNA complex, thus independent of the testing data. In order to assess how IDEA performs when incorporating knowledge from HT-SELEX data, we augmented the training by randomly including half of the HT-SELEX data (see the Methods Section Enhanced Modeling Prediction with SELEX Data). The augmented IDEA model achieved the best performance among all the models. We further benchmarked IDEA using a 10-fold cross-validation on the same HT-SELEX data [5] and found that IDEA outperformed a recent regression model that considers the shape of DNA with different sequences [5]. Overall, IDEA can be used to predict protein-DNA affinities in the absence of known binding sequence data, thereby filling a critical gap when such experimental datasets are unavailable.

      In addition, we compared the performance of IDEA with both general and family-specific knowledge-based energy models. First, we incorporated a knowledge-based generic protein-DNA energy model (DBD-Hunter) learned from the protein-DNA database, reported by Skoinick and coworkers [7], into our prediction protocol. This model assigns interaction energies to different functional groups within each DNA nucleotide (e.g., phosphate (PP), sugar (SU), pyrimidine (PY), and imidazole (IM) groups). For our comparison, we averaged the energy contributions of these groups within each nucleotide and replaced the IDEA-learned energy model with this generic one to test its ability to differentiate strong binders from weak binders in the HT-SELEX dataset [5]. As shown in Figure S6, the IDEA model generally achieves better performance than the generic energy model. Additionally, we compared IDEA with rCLAMPS, a family-specific energy model developed to predict protein-DNA binding specificity in the C2H2 and homeodomain families. As shown in Table S1 and Table S2, IDEA also shows better performance than rCLAMPS in most cases across the C2H2 and homeodomain families, demonstrating that it has better predictive accuracy than both family-specific and generic knowledge-based models.

      We have revised our text to include the comparison between IDEA and other predictive models. Specifically, we revised the text in Section: IDEA Generalizes across Various Protein Families.

      The revised text reads:

      “To examine IDEA’s predictive accuracy across different DNA-binding protein families, we applied it to calculate protein-DNA binding affinities using a comprehensive HT-SELEX dataset [5]. We focused on evaluating the capability of IDEA to distinguish strong binders from weak binders for each protein with an experimentally determined structure. We calculated the probability density distribution of the top and bottom binders identified in the SELEX experiment. A well-separated distribution indicates the successful identification of strong binders by IDEA (Figure 2D and S4). Receiver Operating Characteristic (ROC) analysis was performed to calculate the Area Under the Curve (AUC) and the precision-recall curve (PRAUC) scores for these predictions. Further details are provided in the Methods Section Evaluation of IDEA Prediction Using HT-SELEX Data. Our analysis shows that IDEA successfully differentiates strong from weak binders for 80% of the 22 proteins across 12 protein families, achieving AUC and balanced PRAUC scores greater than 0.5 (Figure 2E and S5). To benchmark IDEA’s performance against other leading methods, we compared its predictions with several popular models, including the sequence-based predictive models ProBound [8] and DeepBind [9], the familybased energy model rCLAMPS [10], and the knowledge-based energy model DBD-Hunter [7]. IDEA demonstrates performance comparable to these stateof-the-art approaches (Figure S6, Table S1, and Table S2), and incorporating sequence features further improves its prediction accuracy. We also performed 10-fold cross-validation on the binding affinities of protein–DNA pairs in this dataset and found that IDEA outperforms a recent regression model that considers the shape of DNA with different sequences [5] (Figure S7). Details are provided in Section: Comparison of IDEA predictive performance Using HT-SELEX data.”

      We also added one section Comparison of IDEA predictive performance Using HT-SELEX data in the Appendix to fully explain the comparison between IDEA and other popular models.

      The added texts are:

      “To benchmark the performance of IDEA against state-of-the-art protein-DNA predictive models, we evaluated its ability to recognize strong binders with the HT-SELEX datasets across 22 proteins from 12 families [5]. Specifically, we compare IDEA with two widely used sequence-based models: ProBound [8] and DeepBind [9]. ProBound has demonstrated superior performance over many other predictive protein-DNA models, including JASPAR 2018 [11], HOCOMOCO [12], Jolma et al. [13], and DeepSELEX [14]. To use ProBound, we retrieved the trained binding model for each protein from motifcentral.org and used the GitHub implementation of ProBoundTools to infer the binding scores between protein and target DNA sequences. Except for POU3F1, binding models are available for all proteins. Therefore, we excluded POU3F1 and evaluated the protein-DNA binding affinities for the remaining 21 proteins. To use DeepBind, sequence-specific binding affinities were predicted directly with its web server. The Area Under the Curve (AUC) and the Precision-Recall AUC (PRAUC) scores were used as metrics for comparison. An AUC score of 1.0 indicates a perfect separation between the strong- and weak-binder distributions, while an AUC score of 0.5 indicates no separation. Because there is a significant imbalance in the number of strong and weak binders from the experimental data [5], where the strong binders are far fewer than the weak binders, we reweighted the samples to achieve a balanced evaluation, using 0.5 as the baseline for randomized prediction [6]. As summarized in Figure S6, Table S1, and Table S2, IDEA ranked second among the three predictive models. In order to assess the performance of IDEA when augmented with additional protein-DNA binding data, we augmented IDEA using randomly selected half of the HT-SELEX data (see the Methods Section Enhanced Modeling Prediction with SELEX Data). The augmented IDEA model achieved the best performance among all the models.”

      “In addition, we compared the performance of IDEA with both general and family-specific knowledge-based energy models. First, we incorporated a knowledgebased generic protein-DNA energy model (DBD-Hunter) learned from the protein-DNA database, reported by Skoinick and coworkers [7], into our prediction protocol. This model assigns interaction energies to different functional groups within each DNA nucleotide, including phosphate (PP), sugar (SU), pyrimidine (PY), and imidazole (IM) groups. For our comparison, we averaged the energy contributions of these groups within each nucleotide and replaced the IDEA-learned energy model with the DBD-Hunter model to assess its ability to differentiate strong binders from weak binders in the HTSELEX dataset [5]. Additionally, we compared IDEA with rCLAMPS, a familyspecific energy model developed to predict protein-DNA binding specificity in the C2H2 and homeodomain families. rCLAMPS learns a position-dependent amino-acid-nucleotide interaction energy model. To incorporate this model into the binding free energy calculation, we averaged the energy contributions across all occurrences of each amino-acid-nucleotide pair, which resulted in a 20-by-4 residue-type-specific energy matrix. This matrix is structurally analogous to the IDEA-trained energy model and can be directly integrated into the binding free energy calculations. As shown in Figure S6, Table S1, and Table S2, the IDEA model generally outperforms DBD-Hunter and rCLAMPS, demonstrating that it can achieve better predictive accuracy than both generic and family-specific knowledge-based models.”

      “We also performed 10-fold cross-validation using the same HT-SELEX datasets, following the protocol described in the Methods Section Enhanced Modeling Prediction with SELEX Data. For each protein, we divided the entire dataset into 10 equal, randomly assigned folds. In each iteration, we used randomly selected 9 of the 10 folds as the training dataset and the remaining fold as the testing dataset. This process was repeated 10 times so that each fold served as the test set once. We then reported the average R2 scores across these iterations to evaluate IDEA’s predictive performance. Our results are compared with the 1mer and 1mer+shape methods from [5], the latest regression model that considers the shape of DNA with different sequences (Figure S7). This comparative analysis shows IDEA achieved higher predictive accuracy than the state-of-the-art sequence-based protein-DNA binding predictors for proteinDNA complexes that have available experimentally resolved structures.”

      “Overall, these results demonstrate that IDEA can be used to predict the proteinDNA pairs in the absence of known binding sequence data, thus filling an important gap in protein-DNA predictions when experimental binding sequence data are unavailable.”

      We also greatly appreciate the reviewer’s suggestion to examine the model’s performance across different proteins. To do this, we first evaluated the dependence of IDEA prediction on the availability of experimental structures similar to the target protein-DNA complexes. To quantitatively assess similarities and differences among the IDEA-derived energy models, we flattened each normalized energy model into an 80-dimensional vector and performed principal component analysis (PCA). As shown in Author response image 1 and Figure S11, energy models optimized from the same protein family fall within the same cluster, while those from different protein families exhibit distinct patterns. Moreover, the relative distance between energy models in PCA space reflects the degree of transferability. For example, PHO4 (PDB ID: 1A0A) is positioned close to MAX (PDB ID: 1HLO), whereas USF1 (PDB ID: 1AN4) and TCF4 (PDB ID: 6OD3) are farther away. This is consistent with the results shown in Figure 3A, where the energy model trained from PHO4 has better transferability than those from the other two systems. Therefore, the availability of experimental structures from protein-DNA complexes more similar to the target can lead to better predictive performance.

      We also examine cases in which the IDEA model failed to show strong discriminative power for protein-DNA complexes in the HT-SELEX datasets [5] (Figures 2E and S5). When evaluating the model’s ability to distinguish between strong and weak binders, we used the available experimental structure most similar to the protein employed in the HT-SELEX experiments. In some instances, only the structure of the same protein from a different organism is available. For example, the HT-SELEX data for PDX1-DNA used the human PDX1 protein, but no human PDX1–DNA complex structure is available. Therefore, we used the mouse PDX1–DNA complex (PDB ID: 2H1K) for model training. The differences between species may limit the predictive accuracy of the model. A similar limitation applies to POU3F1, where an available mouse complex (PDB ID: 4Y60) was used to predict human protein–DNA interactions. Notably, DeepBind [9], a sequencebased prediction tool, also failed to distinguish strong from weak binders when using the mouse POU3F1 protein (AUC score: 0.457), but this was corrected with the human POU3F1 protein (AUC score: 0.956).

      We also examined the remaining cases where IDEA did not show a clear distinction between strong and weak binders: USF1, Egr1, and PROX1. For PROX1, we initially used the structure of a protein-DNA complex (PDB ID: 4Y60) in training. However, upon closer inspection, we discovered that this structure does not include the PROX1 protein, but SOX-18, a different transcription factor. This explains the inaccurate prediction made by IDEA. Since no experimental PROX1-DNA complex structure is currently available, we have removed this case from our HT-SELEX evaluation.

      IDEA also fails to fully resolve the binding preference of USF1. A closer examination of the HT-SELEX data reveals a lack of distinction among the sequences, as most sequences, including those with the lowest M-word (binding affinity) scores, contain the DNA-binding E-box sequence CACGTG. Therefore, USF1 represents a challenging example where the experimental data only consists of strong binders with limited variations in binding affinity, which likely results from differences in flanking sequences of the E-box motif.

      Egr1 stands as a peculiar example. Whereas IDEA does not effectively distinguish between the strong and weak binders in the current HT-SELEX dataset, its predictions are consistent with other experimental datasets, including binding affinities measured by kMITOMI [42] (Figure S8A, B), preferred binding sequences from protein-binding microarray, an earlier HT-SELEX experiment, and bacterial one-hybrid data [43]. Therefore, further investigation of the current HT-SELEX data is needed to reconcile these differences.

      In summary, IDEA’s predictive performance depends on the availability of experimental structures closely related to the target protein-DNA complexes, both in terms of protein sequences and model organisms.

      We have included additional text in Section: IDEA Demonstrates Transferability across Proteins in the Same CATH Superfamily to discuss the PCA analysis and the dependence of the model’s transferability on the similarity among the learned energy models.

      The revised text now reads:

      “The transferability of IDEA within the same CATH superfamily can be understood from the similarities in protein-DNA binding interfaces, which determine similar learned energy models. For example, the PHO4 protein (PDB ID: 1A0A) shares a highly similar DNA-binding interface with the MAX protein (PDB ID: 1HLO) (Figure 3B), despite sharing only a 33.41% probability of being homologous. Consequently, the energy model derived from the PHO4DNA complex (Figure 3C) exhibits a similar amino-acid-nucleotide interactive pattern as that learned from the MAX-DNA complex (Figure 2B). To further evaluate the similarity between the learned energy models and their connection to protein families, we performed principal component analysis (PCA) on the normalized energy models across 24 proteins from 12 protein families [5]. Our analysis (Figure S11) reveals that most of the energy models from the same protein family fall within the same cluster, while those from different protein families exhibit distinct patterns. Moreover, the relative distance between energy models in PCA space reflects the degree of transferability between them. For example, PHO4 (PDB ID: 1A0A) is positioned close to MAX (PDB ID: 1HLO), whereas USF1 (PDB ID: 1AN4) and TCF4 (PDB ID: 6OD3) are farther away. This is consistent with the results in Figure 3A, where the energy model trained on PHO4 has better transferability than those trained on USF1 or TCF4.”

      We have also added an Appendix section titled Analysis of examples where IDEA fails to recognize strong DNA binders to discuss the examples in which IDEA did not perform well:

      “We examine IDEA’s capability in identifying strong binders from the HT-SELEX dataset across 12 protein families [5]. The model successfully predicts 18 out of 22 protein-DNA systems, but the performance is reduced in 4 cases. Closer investigations revealed the source of these limitations. In some instances, only the protein from a different organism is available. For example, the PDX1 HT-SELEX data utilized the human PDX1 protein, but no human PDX1–DNA complex structure is available. Therefore, the mouse PDX1–DNA complex structure (PDB ID: 2H1K) was used for model training. Differences between model organisms may reduce predictive accuracy. A similar limitation applies to POU3F1, where an available mouse complex (PDB ID: 4Y60) was used to predict human protein–DNA interactions. Notably, DeepBind [9], a sequence-based prediction tool, also failed to distinguish strong from weak binders when using the mouse POU3F1 protein (AUC score: 0.457), but this was corrected with the human POU3F1 protein (AUC score: 0.956).

      IDEA also fails to fully resolve the binding preference of USF1. A closer examination of the HT-SELEX data reveals a lack of distinction among the sequences, as most sequences, including those with the lowest M-word (binding affinity) scores, contain the DNA-binding E-box sequence CACGTG. Therefore, USF1 represents a challenging example where the experimental data only consists of strong binders with limited variations in binding affinity, which likely results from differences in flanking sequences of the E-box motif.

      Egr1 stands as a peculiar example. Whereas IDEA does not effectively distinguish between the strong and weak binders in the current HT-SELEX dataset, its predictions are consistent with other experimental datasets, including binding affinities measured by k-MITOMI [42] (Figure S8A, B), preferred binding sequences from protein-binding microarray, an earlier HT-SELEX experiment, and bacterial one-hybrid data [43]. Therefore, further investigation of the current HT-SELEX data is needed to reconcile these differences.”

      Comment 5: The authors provide an implementation of their model via GitHub, which is commendable. However, it unexpectedly requires the Modeller suite, despite no details about homology modeling being included in the methods section.

      We thank the reviewer for the helpful comments. We did not use the homology modeling module of Modeller. Instead, we only used a single Python script, buildseq.py, from the Modeller package to extract the protein and DNA sequences from the given PDB structure. We have clarified this in the README file on our GitHub repository.

      Comment 6: While the manuscript is written in clear and accessible English, some sentences are quite long and could benefit from rephrasing (e.g., lines 49-52).

      Thank you for the helpful suggestion. We agree that the original sentence was overly long and have revised it by splitting it into two for improved clarity and readability.

      The revised version reads:

      “The very robustness of evolution [46, 47, 48, 49] provides an opportunity to extract the sequence-structure relationships embedded in existing complexes. Guided by this principle, we can learn an interpretable binding energy landscape that governs the recognition processes of DNA-binding proteins.”

      Comment 7: In line 82, the citations appear out of place, as the context seems to suggest the use of the newly developed model.

      Thank you for this insightful suggestion. We have rephrased the sentence to better connect with the context of this section.

      The revised text now reads:

      “Finally, the learned energy model can be incorporated into a simulation framework to explore the dynamics of DNA-binding processes, revealing mechanistic insights into various DNA-templated processes.”

      Comment 8: Line 143 ”different structure from the bHLH TFs and thus requires a different atom” This is the first instance in the manuscript where the atom selection for distance thresholding is mentioned, making the text somewhat confusing.

      We thank the reviewer for the insightful comment and agree that the atom selection scheme appears abruptly in this section. To improve clarity, we have moved the detailed atom selection scheme and its rationale to the Methods Section titled Structural Modeling of Protein and DNA.

      Comment 9: Figures: Overall, the figures are visually appealing but could be further improved.

      We appreciate the positive feedback regarding the visual presentation of our figures. Following the reviewer’s suggestions and to further enhance clarity, we have revised several figures to improve labeling, layout, and annotations.

      Comment 10: Figure 1: The description ”highlighted in blue” considers changing to ”highlighted in blue on the structure.”.

      We have revised the text based on your suggestion.

      Comment 11: Figure 2: Panel B is missing a color bar legend and units, as is the case in Figure 3C. Additionally, the placement of Panel C is unconventional - it appears it should be Panel D. The color scheme for the spheres is not fully described. Panel E: There are too many colors used; consider employing different markers to improve clarity.

      Thank you for the helpful suggestions.

      For Figure 2B and Figure 3C, we would like to clarify that the predicted energies are presented in reduced units due to an undetermined prefactor introduced during the model optimization. This point has now been clarified in the figure captions and is also explained in the Methods section titled Training Protocol.

      Additionally, we have rearranged Panels C and D to improve the figure layout and have fully described the color coding used in the structural representations.

      We have updated it to read:

      “Results for MAX-based predictions. (A) The binding free energies calculated by IDEA, trained using a single MAX–DNA complex (PDB ID: 1HLO), correlate well with experimentally measured MAX–DNA binding free energies [50]. ∆∆G represents the changes in binding free energy relative to that of the wild-type protein–DNA complex. (B) The heatmap, derived from the optimized energy model, illustrates key amino acid–nucleotide interactions governing MAX–DNA recognition, showing pairwise interaction energies between 20 amino acids and the four DNA bases—DA (deoxyadenosine), DT (deoxythymidine), DC (deoxycytidine), and DG (deoxyguanosine). Both the predicted binding free energies and the optimized energy model are expressed in reduced units, as explained in the Methods Section Training Protocol. Each cell represents the optimized energy contribution, where blue indicates more favorable (lower) energy values, and red indicates less favorable (higher) values. (C) The 3D structure of the MAX–DNA complex (zoomed in with different views) highlights key amino acid–nucleotide contacts at the protein–DNA interface. Notably, several DNA deoxycytidines (red spheres) form close contacts with arginines (blue spheres). Additional nucleotide color coding: adenine (yellow spheres), guanine (green spheres), thymine (pink spheres). (D) Probability density distributions of predicted binding free energies for strong (blue) and weak (red) binders of the protein ZBTB7A. The mean of each distribution is marked with a dashed line. (E) Summary of AUC scores for protein–DNA pairs across 12 protein families, calculated based on the predicted probability distributions of binding free energies.”

      We fully agree that Panel E was visually overwhelming. We have revised the plot by using a combination of color and marker shapes to more clearly distinguish between different protein families, as suggested.

      Comment 12: Typos:

      Line 18: Gene expressions → Gene expression?

      Line 28: performed → utilized ?

      We really appreciate the suggestions and have corrected the text accordingly.

      References

      (1) Tianyin Zhou, Ning Shen, Lin Yang, Namiko Abe, John Horton, Richard S Mann, Harmen J Bussemaker, Raluca Gordan, and Remo Rohs. Quantitative modeling ofˆ transcription factor binding specificities using DNA shape. Proceedings of the National Academy of Sciences, 112(15):4654–4659, 2015.

      (2) Jinsen Li, Tsu-Pei Chiu, and Remo Rohs. Predicting DNA structure using a deep learning method. Nat Commun, 15(1):1243, February 2024.

      (3) Josh Abramson, Jonas Adler, Jack Dunger, Richard Evans, Tim Green, Alexander Pritzel, Olaf Ronneberger, Lindsay Willmore, Andrew J. Ballard, Joshua Bambrick, Sebastian W. Bodenstein, David A. Evans, Chia-Chun Hung, Michael O’Neill, David Reiman, Kathryn Tunyasuvunakool, Zachary Wu, Akvile˙ Zemgulytˇ e, Eirini Arvan-˙ iti, Charles Beattie, Ottavia Bertolli, Alex Bridgland, Alexey Cherepanov, Miles Congreve, Alexander I. Cowen-Rivers, Andrew Cowie, Michael Figurnov, Fabian B. Fuchs, Hannah Gladman, Rishub Jain, Yousuf A. Khan, Caroline M. R. Low, Kuba Perlin, Anna Potapenko, Pascal Savy, Sukhdeep Singh, Adrian Stecula, Ashok Thillaisundaram, Catherine Tong, Sergei Yakneen, Ellen D. Zhong, Michal Zielinski, Augustin Zˇ´ıdek, Victor Bapst, Pushmeet Kohli, Max Jaderberg, Demis Hassabis, and John M. Jumper. Accurate structure prediction of biomolecular interactions with AlphaFold 3. Nature, pages 1–3, May 2024.

      (4) Raktim Mitra, Jinsen Li, Jared M. Sagendorf, Yibei Jiang, Ari S. Cohen, Tsu-Pei Chiu, Cameron J. Glasscock, and Remo Rohs. Geometric deep learning of protein–DNA binding specificity. Nat Methods, 21(9):1674–1683, September 2024.

      (5) Lin Yang, Yaron Orenstein, Arttu Jolma, Yimeng Yin, Jussi Taipale, Ron Shamir, and Remo Rohs. Transcription factor family-specific DNA shape readout revealed by quantitative specificity models. Mol Syst Biol, 13(2):910, February 2017.

      (6) Takaya Saito and Marc Rehmsmeier. The Precision-Recall Plot Is More Informative than the ROC Plot When Evaluating Binary Classifiers on Imbalanced Datasets. PLoS ONE, 10(3):e0118432, March 2015.

      (7) Mu Gao and Jeffrey Skolnick. DBD-Hunter: a knowledge-based method for the prediction of DNA-protein interactions. Nucleic Acids Res, 36(12):3978–3992, July 2008.

      (8) H. Tomas Rube, Chaitanya Rastogi, Siqian Feng, Judith F. Kribelbauer, Allyson Li, Basheer Becerra, Lucas A. N. Melo, Bach Viet Do, Xiaoting Li, Hammaad H. Adam, Neel H. Shah, Richard S. Mann, and Harmen J. Bussemaker. Prediction of protein–ligand binding affinity from sequencing data with interpretable machine learning. Nat Biotechnol, 40(10):1520–1527, October 2022.

      (9) Babak Alipanahi, Andrew Delong, Matthew T Weirauch, and Brendan J Frey. Predicting the sequence specificities of DNA- and RNA-binding proteins by deep learning. Nat Biotechnol, 33(8):831–838, August 2015.

      (10) Joshua L. Wetzel, Kaiqian Zhang, and Mona Singh. Learning probabilistic proteinDNA recognition codes from DNA-binding specificities using structural mappings. Genome Res, 32(9):1776–1786, September 2022.

      (11) Aziz Khan, Oriol Fornes, Arnaud Stigliani, Marius Gheorghe, Jaime A CastroMondragon, Robin van der Lee, Adrien Bessy, Jeanne Cheneby, Shubhada R Kulka-` rni, Ge Tan, Damir Baranasic, David J Arenillas, Albin Sandelin, Klaas Vandepoele, Boris Lenhard, Benoˆıt Ballester, Wyeth W Wasserman, Franc¸ois Parcy, and Anthony Mathelier. JASPAR 2018: update of the open-access database of transcription factor binding profiles and its web framework. Nucleic Acids Research, 46(D1):D260–D266, January 2018.

      (12) Ivan V. Kulakovskiy, Ilya E. Vorontsov, Ivan S. Yevshin, Ruslan N. Sharipov, Alla D. Fedorova, Eugene I. Rumynskiy, Yulia A. Medvedeva, Arturo Magana-Mora, Vladimir B. Bajic, Dmitry A. Papatsenko, Fedor A. Kolpakov, and Vsevolod J. Makeev. HOCOMOCO: towards a complete collection of transcription factor binding models for human and mouse via large-scale ChIP-Seq analysis. Nucleic Acids Res, 46(D1):D252–D259, January 2018.

      (13) Arttu Jolma, Jian Yan, Thomas Whitington, Jarkko Toivonen, Kazuhiro R. Nitta, Pasi Rastas, Ekaterina Morgunova, Martin Enge, Mikko Taipale, Gonghong Wei, Kimmo Palin, Juan M. Vaquerizas, Renaud Vincentelli, Nicholas M. Luscombe, Timothy R. Hughes, Patrick Lemaire, Esko Ukkonen, Teemu Kivioja, and Jussi Taipale. DNABinding Specificities of Human Transcription Factors. Cell, 152(1-2):327–339, January 2013.

      (14) Maor Asif and Yaron Orenstein. DeepSELEX: inferring DNA-binding preferences from HT-SELEX data using multi-class CNNs. Bioinformatics, 36(Supplement 2):i634–i642, December 2020.

      (15) Oriol Fornes, Alberto Meseguer, Joachim Aguirre-Plans, Patrick Gohl, Patricia M Bota, Ruben Molina-Fernandez, Jaume Bonet, Altair Chinchilla-Hernandez, Ferran´ Pegenaute, Oriol Gallego, Narcis Fernandez-Fuentes, and Baldo Oliva. Structurebased learning to predict and model protein–DNA interactions and transcriptionfactor co-operativity in cis -regulatory elements. NAR Genomics and Bioinformatics, 6(2):lqae068, April 2024.

      (16) Sofia Aizenshtein-Gazit and Yaron Orenstein. DeepZF: improved DNA-binding prediction of C2H2-zinc-finger proteins by deep transfer learning. Bioinformatics, 38(Suppl 2):ii62–ii67, September 2022.

      (17) Stephen K Burley, Charmi Bhikadiya, Chunxiao Bi, Sebastian Bittrich, Henry Chao, Li Chen, Paul A Craig, Gregg V Crichlow, Kenneth Dalenberg, Jose M Duarte, Shuchismita Dutta, Maryam Fayazi, Zukang Feng, Justin W Flatt, Sai Ganesan, Sutapa Ghosh, David S Goodsell, Rachel Kramer Green, Vladimir Guranovic, Jeremy Henry, Brian P Hudson, Igor Khokhriakov, Catherine L Lawson, Yuhe Liang, Robert Lowe, Ezra Peisach, Irina Persikova, Dennis W Piehl, Yana Rose, Andrej Sali, Joan Segura, Monica Sekharan, Chenghua Shao, Brinda Vallat, Maria Voigt, Ben Webb, John D Westbrook, Shamara Whetstone, Jasmine Y Young, Arthur Zalevsky, and Christine Zardecki. RCSB Protein Data Bank (RCSB.org): delivery of experimentally-determined PDB structures alongside one million computed structure models of proteins from artificial intelligence/machine learning. Nucleic Acids Research, 51(D1):D488–D508, November 2022.

      (18) Raktim Mitra, Ari S. Cohen, Jared M. Sagendorf, Helen M. Berman, and Remo Rohs. DNAproDB: an updated database for the automated and interactive analysis of protein-DNA complexes. Nucleic Acids Res, 53(D1):D396–D402, January 2025.

      (19) Natalia Petrenko, Yi Jin, Liguo Dong, Koon Ho Wong, and Kevin Struhl. Requirements for RNA polymerase II preinitiation complex formation in vivo. eLife, 8:e43654, January 2019.

      (20) Rudolf Jaenisch and Adrian Bird. Epigenetic regulation of gene expression: how the genome integrates intrinsic and environmental signals. Nat Genet, 33(3):245–254, March 2003.

      (21) Claire Marchal, Jiao Sima, and David M. Gilbert. Control of DNA replication timing in the 3D genome. Nat Rev Mol Cell Biol, 20(12):721–737, December 2019.

      (22) Lucia A. Hindorff, Praveen Sethupathy, Heather A. Junkins, Erin M. Ramos, Jayashri P. Mehta, Francis S. Collins, and Teri A. Manolio. Potential etiologic and functional implications of genome-wide association loci for human diseases and traits. Proceedings of the National Academy of Sciences, 106(23):9362–9367, June 2009.

      (23) Tuuli Lappalainen, Alexandra J Scott, Margot Brandt, and Ira M Hall. Genomic analysis in the age of human genome sequencing. Cell, 177(1):70–84, 2019.

      (24) Sonali Mukherjee, Michael F. Berger, Ghil Jona, Xun S. Wang, Dale Muzzey, Michael Snyder, Richard A. Young, and Martha L. Bulyk. Rapid analysis of the DNA-binding specificities of transcription factors with DNA microarrays. Nat Genet, 36(12):1331– 1339, December 2004.

      (25) Shaoxun Liu, Pilar Gomez-Alcala, Christ Leemans, William J. Glassford, Lucas A. N. Melo, Xiang-Jun Lu, Richard S. Mann, and Harmen J. Bussemaker. Predicting the DNA binding specificity of transcription factor mutants using family-level biophysically interpretable machine learning. bioRxiv, page 2024.01.24.577115, April 2025.

      (26) Tsu-Pei Chiu, Satyanarayan Rao, and Remo Rohs. Physicochemical models of protein–DNA binding with standard and modified base pairs. Proc. Natl. Acad. Sci. U.S.A., 120(4):e2205796120, January 2023.

      (27) Matthew T Weirauch, Atina Cote, Raquel Norel, Matti Annala, Yue Zhao, Todd R Riley, Julio Saez-Rodriguez, Thomas Cokelaer, Anastasia Vedenko, Shaheynoor Talukder, and others. Evaluation of methods for modeling transcription factor sequence specificity. Nature biotechnology, 31(2):126–134, 2013.

      (28) Chaitanya Rastogi, H. Tomas Rube, Judith F. Kribelbauer, Justin Crocker, Ryan E. Loker, Gabriella D. Martini, Oleg Laptenko, William A. Freed-Pastor, Carol Prives, David L. Stern, Richard S. Mann, and Harmen J. Bussemaker. Accurate and sensitive quantification of protein-DNA binding affinity. Proc. Natl. Acad. Sci. U.S.A., 115(16), April 2018.

      (29) Rahmatullah Roche, Bernard Moussad, Md Hossain Shuvo, Sumit Tarafder, and Debswapna Bhattacharya. EquiPNAS: improved protein–nucleic acid binding site prediction using protein-language-model-informed equivariant deep graph neural networks. Nucleic Acids Research, 52(5):e27–e27, March 2024.

      (30) Yufan Liu and Boxue Tian. Protein–DNA binding sites prediction based on pretrained protein language model and contrastive learning. Briefings in Bioinformatics, 25(1):bbad488, November 2023.

      (31) Binh P. Nguyen, Quang H. Nguyen, Giang-Nam Doan-Ngoc, Thanh-Hoang Nguyen-Vo, and Susanto Rahardja. iProDNA-CapsNet: identifying protein-DNA binding residues using capsule neural networks. BMC Bioinformatics, 20(S23):634, December 2019.

      (32) Trevor Siggers and Raluca Gordan. Protein–DNA binding: complexities and multi-ˆ protein codes. Nucleic Acids Research, 42(4):2099–2111, February 2014.

      (33) Johannes Soding, Andreas Biegert, and Andrei N. Lupas. The HHpred interactive¨ server for protein homology detection and structure prediction. Nucleic Acids Research, 33(suppl 2):W244–W248, July 2005.

      (34) William Humphrey, Andrew Dalke, and Klaus Schulten. VMD – Visual Molecular Dynamics. Journal of Molecular Graphics, 14:33–38, 1996.

      (35) Arttu Jolma, Teemu Kivioja, Jarkko Toivonen, Lu Cheng, Gonghong Wei, Martin Enge, Mikko Taipale, Juan M Vaquerizas, Jian Yan, Mikko J Sillanpa¨a, and others.¨ Multiplexed massively parallel SELEX for characterization of human transcription factor binding specificities. Genome research, 20(6):861–873, 2010.

      (36) Nobuo Ogawa and Mark D Biggin. High-throughput SELEX determination of DNA sequences bound by transcription factors in vitro. Gene Regulatory Networks: Methods and Protocols, pages 51–63, 2012.

      (37) Alina Isakova, Romain Groux, Michael Imbeault, Pernille Rainer, Daniel Alpern, Riccardo Dainese, Giovanna Ambrosini, Didier Trono, Philipp Bucher, and Bart Deplancke. SMiLE-seq identifies binding motifs of single and dimeric transcription factors. Nature methods, 14(3):316–322, 2017.

      (38) Paul G. Giresi, Jonghwan Kim, Ryan M. McDaniell, Vishwanath R. Iyer, and Jason D. Lieb. FAIRE (Formaldehyde-Assisted Isolation of Regulatory Elements) isolates active regulatory elements from human chromatin. Genome Res., 17(6):877–885, January 2007.

      (39) Peter J Park. ChIP–seq: advantages and challenges of a maturing technology. Nature reviews genetics, 10(10):669–680, 2009.

      (40) Terrence S. Furey. ChIP–seq and beyond: new and improved methodologies to detect and characterize protein–DNA interactions. Nat Rev Genet, 13(12):840–852, December 2012.

      (41) Anna Bartlett, Ronan C. O’Malley, Shao-shan Carol Huang, Mary Galli, Joseph R. Nery, Andrea Gallavotti, and Joseph R. Ecker. Mapping genome-wide transcriptionfactor binding sites using DAP-seq. Nat Protoc, 12(8):1659–1672, August 2017.

      (42) Marcel Geertz, David Shore, and Sebastian J Maerkl. Massively parallel measurements of molecular interaction kinetics on a microfluidic platform. Proceedings of the National Academy of Sciences, 109(41):16540–16545, 2012.

      (43) Gary D. Stormo and Yue Zhao. Determining the specificity of protein–DNA interactions. Nat Rev Genet, 11(11):751–760, November 2010.

      (44) Xingcheng Lin, Rachel Leicher, Shixin Liu, and Bin Zhang. Cooperative DNA looping by PRC2 complexes. Nucleic Acids Research, 49(11):6238–6248, June 2021.

      (45) P. L. Privalov, A. I. Dragan, and C. Crane-Robinson. Interpreting protein/DNA interactions: distinguishing specific from non-specific and electrostatic from nonelectrostatic components. Nucleic Acids Research, 39(7):2483–2491, April 2011.

      (46) J D Bryngelson and P G Wolynes. Spin glasses and the statistical mechanics of protein folding. Proc. Natl. Acad. Sci. U.S.A., 84(21):7524–7528, November 1987.

      (47) J. N. Onuchic, Z. Luthey-Schulten, and P. G. Wolynes. Theory of protein folding: the energy landscape perspective. Annu Rev Phys Chem, 48:545–600, 1997.

      (48) N. P. Schafer, B. L. Kim, W. Zheng, and P. G. Wolynes. Learning To Fold Proteins Using Energy Landscape Theory. Isr J Chem, 54(8-9):1311–1337, August 2014.

      (49) Wen-Ting Chu, Zhiqiang Yan, Xiakun Chu, Xiliang Zheng, Zuojia Liu, Li Xu, Kun Zhang, and Jin Wang. Physics of biomolecular recognition and conformational dynamics. Rep. Prog. Phys., 84(12):126601, December 2021.

      (50) Sebastian J. Maerkl and Stephen R. Quake. A Systems Approach to Measuring the Binding Energy Landscapes of Transcription Factors. Science, 315(5809):233–237, January 2007.

    1. eLife Assessment

      In this important paper, the authors use single-cell RNA sequencing to understand post-mitotic cone and rod developmental states and identify cone-specific features that contribute to retinoblastoma genesis. The authors report findings that have practical implications for retinal development, gene expression, and cell fate specification. The evidence is compelling as the experimental design and analysis are exceptionally rigorous.

    2. Reviewer #1 (Public review):

      Summary:

      The authors have used full length single cell sequencing on a sorted population of human fetal retina to delineate expression patterns associated with the progression of progenitors to rod and cone photoreceptors. They find that rod.cone precursors contain a mix of rod/cone determinants, with a bias in both amounts and isoform balance likely deciding the ultimate cell fate. Markers of early rod/cone hybrids are clarified, and a gradient of lncRNAs is uncovered in maturing cones. Comparison of early rods and cones exposes an enriched MYCN regulon, as well as expression of SYK, which may contribute to tumor initiation in RB1 deficient cone precursors.

      Strengths:

      The insight into how cone and rod transcripts are mixed together at first is important and clarifies a long-standing notion in the field.

      The discovery of distinct active vs inactive mRNA isoforms for rod and cone determinants is crucial to understand how cells make the decision to form one or the other cell type. This is only really possible with full length scRNAseq analysis.

      New markers of subpopulations are also uncovered, such as CHRNA1 in rod/cone hybrids that seem to give rise to either rods or cones.

      Regulon analyses provide insight into key transcription factor programs linked to rod or cone fates.

      The gradient of lncRNAs in maturing cones is novel, and while the functional significance is unclear, it opens up a new line of questioning around photoreceptor maturation.

      The finding that SYK mRNA is naturally expressed in cone precursors is novel, as previously it was assumed that SYK expression required epigenetic rewiring in tumors.

      Weaknesses:

      Functional data on many new hypothesis regarding potential players in cone genesis are not performed, but these are beyond the scope of the current work.

      Validation of the SYK inhibitor data e.g. by genetic means, is not included, but the authors acknowledge this caveat throughout.

    3. Reviewer #2 (Public review):

      Summary:

      The authors used deep full-length single-cell sequencing to study the human photoreceptor development, with a particular emphasis on the characteristics of photoreceptors that may contribute to retinoblastoma.

      Strengths:

      This single-cell study captures gene regulation in photoreceptors across different developmental stages, defining post-mitotic cone and rod populations by highlighting their unique gene expression profiles through analyses such as RNA velocity and SCENIC. By leveraging full-length sequencing data, the study identifies differentially expressed isoforms of NRL and THRB in L/M cone and rod precursors, illustrating the dynamic gene regulation involved in photoreceptor fate commitment. Additionally, the authors performed high-resolution clustering to explore markers defining developing photoreceptors across the fovea and peripheral retina, particularly characterizing SYK's role in the proliferative response of cones in the RB loss background. The study provides an in-depth analysis of developing human photoreceptors, with the authors conducting thorough analyses using full-length single-cell RNA sequencing. The strength of the study lies in its design, which integrates single-cell full-length RNA-seq, long-read RNA-seq, and follow-up histological and functional experiments to provide compelling evidence supporting their conclusions. The model of cell type-dependent splicing for NRL and THRB is particularly intriguing. Moreover, the potential involvement of the SYK and MYC pathways with RB in cone progenitor cells aligns with previous literature, offering additional insights into RB development.

      Weaknesses:

      The manuscript feels somewhat unfocused, with a lack of a strong connection between the analysis of developing photoreceptors, which constitutes the bulk of the manuscript, and the discussion on retinoblastoma. Additionally, given the recent publication of several single-cell studies on developing human retina, it is important for the authors to cross-validate their findings and adjust their statements where appropriate.

      Comments on revisions:

      The authors have done quite thorough work addressing concerns raised by myself and other reviewers. The identification of unresolved developing state of rod/cone precursor cell is interesting and intriguing. I do not have much more to add.

    4. Reviewer #3 (Public review):

      Summary:

      The authors use high-depth, full-length scRNA-Seq analysis of fetal human retina to identify novel regulators of photoreceptor specification and retinoblastoma progression.

      Strengths:

      The use of high-depth, full-length scRNA-Seq to identify functionally important alternatively spliced variants of transcription factors controlling photoreceptor subtype specification, and identification of SYK as a potential mediator of RB1-dependent cell cycle reentry in immature cone photoreceptors.

      Weaknesses:

      Relatively minor. This is a technically strong and thorough study that is broadly useful to investigators studying retinal development and retinoblastoma.

      Comments on revisions:

      The authors have addressed all points raised in the review and considerably strengthened the manuscript. No additional changes are required.

    5. Author response:

      The following is the authors’ response to the original reviews

      Public Reviews:

      Reviewer #1 (Public review):

      Summary:

      The authors have used full-length single-cell sequencing on a sorted population of human fetal retina to delineate expression patterns associated with the progression of progenitors to rod and cone photoreceptors. They find that rod and cone precursors contain a mix of rod/cone determinants, with a bias in both amounts and isoform balance likely deciding the ultimate cell fate. Markers of early rod/cone hybrids are clarified, and a gradient of lncRNAs is uncovered in maturing cones. Comparison of early rods and cones exposes an enriched MYCN regulon, as well as expression of SYK, which may contribute to tumor initiation in RB1 deficient cone precursors.

      Strengths:

      (1) The insight into how cone and rod transcripts are mixed together at first is important and clarifies a long-standing notion in the field.

      (2) The discovery of distinct active vs inactive mRNA isoforms for rod and cone determinants is crucial to understanding how cells make the decision to form one or the other cell type. This is only really possible with full-length scRNAseq analysis.

      (3) New markers of subpopulations are also uncovered, such as CHRNA1 in rod/cone hybrids that seem to give rise to either rods or cones.

      (4) Regulon analyses provide insight into key transcription factor programs linked to rod or cone fates.

      (5) The gradient of lncRNAs in maturing cones is novel, and while the functional significance is unclear, it opens up a new line of questioning around photoreceptor maturation.

      (6) The finding that SYK mRNA is naturally expressed in cone precursors is novel, as previously it was assumed that SYK expression required epigenetic rewiring in tumors.

      We thank the reviewer for describing the study’s strengths, reflecting the major conclusions of the initially submitted manuscript.  However, based on new analyses – including the requested analyses of other scRNA-seq datasets, our revision clarifies that:

      -  related to point (1), cone and rod transcripts do not appear to be mixed together at first (i.e., in immediately post-mitotic immature cone and rod precursors) but appear to be coexpressed in subsequent cone and rod precursor stages; and 

      - related to point (3), CHRNA1 appears to mark immature cone precursors that are distinct from the maturing cone and rod precursors that co-express cone- and rod-related RNAs (despite the similar UMAP positions of the two populations in our dataset). 

      Weaknesses:

      (1) The writing is very difficult to follow. The nomenclature is confusing and there are contradictory statements that need to be clarified.

      (2) The drug data is not enough to conclude that SYK inhibition is sufficient to prevent the division of RB1 null cone precursors. Drugs are never completely specific so validation is critical to make the conclusion drawn in the paper.

      We thank the reviewer for noting these important issues. Accordingly, in the revised manuscript:

      (1) We improve the writing and clarify the nomenclature and contradictory statements, particularly those noted in the Reviewer’s Recommendations for Authors. 

      (2) We scale back claims related to the role of SYK in the cone precursor response to RB1 loss, with wording changes in the Abstract, Results, and Discussion, which now recognize that the inhibitor studies only support the possibility that cone-intrinsic SYK expression contributes to retinoblastoma initiation, as detailed in our responses to Reviewer’s Recommendations for Authors. We agree and now mention that genetic perturbation of SYK is required to prove its role.  

      Reviewer #2 (Public review):

      Summary:

      The authors used deep full-length single-cell sequencing to study human photoreceptor development, with a particular emphasis on the characteristics of photoreceptors that may contribute to retinoblastoma.

      Strengths:

      This single-cell study captures gene regulation in photoreceptors across different developmental stages, defining post-mitotic cone and rod populations by highlighting their unique gene expression profiles through analyses such as RNA velocity and SCENIC. By leveraging fulllength sequencing data, the study identifies differentially expressed isoforms of NRL and THRB in L/M cone and rod precursors, illustrating the dynamic gene regulation involved in photoreceptor fate commitment. Additionally, the authors performed high-resolution clustering to explore markers defining developing photoreceptors across the fovea and peripheral retina, particularly characterizing SYK's role in the proliferative response of cones in the RB loss background. The study provides an in-depth analysis of developing human photoreceptors, with the authors conducting thorough analyses using full-length single-cell RNA sequencing. The strength of the study lies in its design, which integrates single-cell full-length RNA-seq, longread RNA-seq, and follow-up histological and functional experiments to provide compelling evidence supporting their conclusions. The model of cell type-dependent splicing for NRL and THRB is particularly intriguing. Moreover, the potential involvement of the SYK and MYC pathways with RB in cone progenitor cells aligns with previous literature, offering additional insights into RB development.

      We thank the reviewer for summarizing the main findings and noting the compelling support for the conclusions, the intriguing cell type-dependent splicing of rod and cone lineage factors, and the insights into retinoblastoma development.  

      Weaknesses:

      The manuscript feels somewhat unfocused, with a lack of a strong connection between the analysis of developing photoreceptors, which constitutes the bulk of the manuscript, and the discussion on retinoblastoma. Additionally, given the recent publication of several single-cell studies on the developing human retina, it is important for the authors to cross-validate their findings and adjust their statements where appropriate.

      We agree that the manuscript covers a range of topics resulting from the full-length scRNAseq analyses and concur that some studies of developing photoreceptors were not well connected to retinoblastoma. However, we also note that the connection to retinoblastoma is emphasized in several places in the Introduction and throughout the manuscript and was a significant motivation for pursuing the analyses. We suggest that it was valuable to highlight how deep, fulllength scRNA-seq of developing retina provides insights into retinoblastoma, including i) the similar biased expression of NRL transcript isoforms in cone precursors and RB tumors, ii) the cone precursors’ co-expression of rod- and cone-related genes such as NR2E3 and GNAT2, which may explain similar co-expression in RB cells, and iii) the expression of  SYK in early cones and RB cells.  While the earlier version had mainly highlighted point (iii), the revised Discussion further refers to points (i) and (ii) as described further in the response to the Reviewer’s Recommendations for Authors. 

      We address the Reviewer’s request to cross-validate our findings with those of other single-cell studies of developing human retina by relating the different photoreceptor-related cell populations identified in our study to those characterized by Zuo et al (PMID 39117640), which was specifically highlighted by the reviewer and is especially useful for such cross-validation given the extraordinarily large ~ 220,000 cell dataset covering a wide range of retinal ages (pcw 8–23) and spatiotemporally stratified by macular or peripheral retina location. Relevant analyses of the Zuo et al dataset are shown in Supplementary Figures S3G-H, S10B, S11A-F, and S13A,B. 

      Reviewer #3 (Public review):

      Summary:

      The authors use high-depth, full-length scRNA-Seq analysis of fetal human retina to identify novel regulators of photoreceptor specification and retinoblastoma progression.

      Strengths:

      The use of high-depth, full-length scRNA-Seq to identify functionally important alternatively spliced variants of transcription factors controlling photoreceptor subtype specification, and identification of SYK as a potential mediator of RB1-dependent cell cycle reentry in immature cone photoreceptors.

      Human developing fetal retinal tissue samples were collected between 13-19 gestational weeks and this provides a substantially higher depth of sequencing coverage, thereby identifying both rare transcripts and alternative splice forms, and thereby representing an important advance over previous droplet-based scRNA-Seq studies of human retinal development.

      Weaknesses:

      The weaknesses identified are relatively minor. This is a technically strong and thorough study, that is broadly useful to investigators studying retinal development and retinoblastoma.

      We thank the reviewer for describing the strengths of the study. Our revision addresses the concerns raised separately in the Reviewer’s Recommendations for Authors, as detailed in the responses below.  

      Recommendations for the authors:

      Reviewing Editor Comments:

      The reviewers have completed their reviews. Generally, they note that your work is important and that the evidence is generally convincing. The reviewers are in general agreement that the paper adds to the field. The findings of rod/cone fate determination at a very early stage are intriguing. Generally, the paper would benefit from clarifications in the writing and figures. Experimentally, the paper would benefit from validation of the drug data, for example using RNAi or another assay. Alternatively, the authors could note the caveats of the drug experiments and describe how they could be improved. In terms of analysis, the paper would be improved by additional comparisons of the authors' data to previously published datasets.

      We thank the reviewing editor for this summary. As described in the individual reviewer responses, we clarify the writing and figures and provide comparisons to previously published datasets (in particular, the large snRNA-seq dataset of Zuo et al., 2024 (PMID 39117640).  With regard to the drug (i.e., SYK inhibitor) studies, we opted to provide caveats and describe the need for genetic approaches to validate the role of SYK, owing to the infeasibility of completing genetic perturbation experiments in the appropriate timeframe.  We are grateful for the opportunity to present our findings with appropriate caveats. 

      Reviewer #1 (Recommendations for the authors):

      Shayler cell sort human progenitor/rod/cone populations then full-length single cell RNAseq to expose features that distinguish paths towards rods or cones. They initially distinguish progenitors (RPCs), immature photoreceptor precursors (iPRPs), long/medium wavelength (LM) cones, late-LM cones, short wavelength (S) cones, early rods (ER) and late rods (LR), which exhibit distinct transcription factor regulons (Figures 1, 2). These data expose expected and novel enriched genes, and support the notion that S cones are a default state lacking expression of rod (NRL) or cone (THRB) determinants but retaining expression of generic photoreceptor drivers (CRX/OTX2/NEUROD1 regulons). They identify changes in regulon activity, such as increasing NRL activity from iPRP to ER to LR, but decreasing from iPRP to cones, or increasing RAX/ISL2/THRB regulon activity from iPRP to LM cones, but decreasing from iPRP to S cones or rods.

      They report co-expression of rod/cone determinants in LM and ER clusters, and the ratios are in the expected directions (NRLTHRB or RXRG in ER). A novel insight from the FL seq is that there are differing variants generated in each cell population. Full-length NRL (FL-NRL) predominates in the rod path, whereas truncated NRL (Tr-NRL) does so in the cone path, then similar (but opposite) findings are presented for THRB (Fig 3, 4), whereas isoforms are not a feature of RXRG expression, just the higher expression in cones.

      The authors then further subcluster and perform RNA velocity to uncover decision points in the tree (Figure 5). They identify two photoreceptor precursor streams, the Transitional Rods (TRs) that provide one source for rod maturation and (reusing the name from the initial clustering) iPRPs that form cones, but also provide a second route to rods. TR cells closest to RPCs (immediately post-mitotic) have higher levels of the rod determinant NR2E3 and NRL, whereas the higher resolution iPRPs near RPCs lack NR2E3 and have higher levels of ONECUT1, THRB, and GNAT2, a cone bias. These distinct rod-biased TR and cone-biased high-resolution iPRPs were not evident in published scRNAseq with 3′ end-counting (i.e. not FL seq). Regulon analysis confirmed higher NRL activity in TR cells, with higher THRB activity in highresolution iPRP cells.

      Many of the more mature high-resolution iPRPs show combinations of rod (GNAT1, NR2E3) and cone (GNAT2, THRB) paths as well as both NRL and THRB regulons, but with a bias towards cone-ness (Figure 6). Combined FISH/immunofluorescence in fetal retina uncovers cone-biased RXRG-protein-high/NR2E3-protein-absent cone-fated cells that nevertheless expressed NR2E3 mRNA. Thus early cone-biased iPRP cells express rod gene mRNA, implying a rod-cone hybrid in early photoreceptor development. The authors refer to these as "bridge region iPRP cells".

      In Figure 7, they identify CHRNA1 as the most specific marker of these bridge cells (overlapping with ATOH7 and DLL3, previously linked to cone-biased precursors), and FISH shows it is expressed in rod-biased NRL protein-positive and cone-biased RXRG proteinpositive cones at fetal week 12.

      Figure 8 outlines the graded expression of various lncRNAs during cone maturation, a novel pattern.

      Finally (Figure 9), the authors identify differential genes expressed in early rods (ER cluster from Figure 1) vs early cones (LM cluster, excluding the most mature opsin+ cells), revealing high levels of MYCN targets in cones. They also find SYK expression in cones. SYK was previously linked to retinoblastoma, so intrinsic expression may predispose cone precursors to transformation upon RB loss. They finish by showing that a SYK inhibitor blocks the proliferation of dividing RB1 knockdown cone precursors in the human fetal retina.

      Overall, the authors have uncovered interesting patterns of biased expression in cone/rod developmental paths, especially relating to the isoform differences for NRL and THRB which add a new layer to our understanding of this fate choice. The analyses also imply that very soon after RPCs exit the cell cycle, they generate post-mitotic precursors biased towards a rod or cone fate, that carry varying proportions of mixed rod/cone determinants and other rod/cone marker genes. They also introduce new markers that may tag key populations of cells that precede the final rod/cone choice (e.g. CHRNA1), catalogue a new lncRNA gradient in cone maturation, and provide insight into potential genes that may contribute to retinoblastoma initiation, like SYK, due to intrinsic expression in cone precursors. However, as detailed below, the text needs to be improved considerably, and overinterpretations need to be moderated, removed, or tested more rigorously with extra data.

      Major Comments

      The manuscript is very difficult to follow. The nomenclature is at times torturous, and the description of hybrid rod/cone hybrid cells is confusing in many aspects.

      (1) A single term, iPRP, is used to refer to an initial low-resolution cluster, and then to a subset of that cluster later in the paper.

      We agree that using immature photoreceptor precursor (iPRP) for both high-resolution and lowresolution clusters was confusing. We kept this name for the low-resolution cluster (which includes both immature cone and immature rod precursors), renamed the high-resolution iPRP cluster immature cone precursors (iCPs). and renamed their transitional rod (TR) counterparts immature rod precursors (iRPs). These designations are based on 

      - the biased expression of THRB, ONECUT1, and the THRB regulon in iCPs (Fig. 5D,E);

      - the biased expression of NRL, NR2E3, and NRL regulon iRPs (Fig. 5D,E);

      - the partially distinct iCP and iRP UMAP positions (Figure 5C); and 

      - the evidence of similar immature cone versus rod precursor populations in the Zuo et al 3’ snRNA-seq dataset, as noted below and described in two new paragraphs starting at the bottom of p. 12.

      (2) To complicate matters further, the reader needs to understand the subset within the iPRP referred to as bridge cells, and we are told at one point that the earliest iPRPs lack NR2E3, then that they later co-express NR2E3, and while the authors may be referring to protein and RNA, it serves to further confuse an already difficult to follow distinction. I had to read and re-read the iPRP data many times, but it never really became totally clear.

      We agree that the description of the high-resolution iPRP (now “iCP”) subsets was unclear, although our further analyses of a large 3’ snRNA-seq dataset in Figure S11 support the impression given in the original manuscript that the earliest iCPs lack NR2E3 and then later coexpress NR2E3 while the earliest iRPs lack THRB and then later express THRB. As described in new text in the Two post-mitotic immature photoreceptor precursor populations section (starting on line 7 of p. 13): 

      When considering only the main cone and rod precursor UMAP regions, early (pcw 8 – 13) cone precursors expressed THRB and lacked NR2E3 (Figure S11D,E, blue arrows), while early (pcw 10 – 15) rod precursors expressed NR2E3 and lacked THRB (Figure S11D,E, red arrows), similar to RPC-localized iCPs and iRPs in our study (Figure 5D).

      Next, as summarized in new text in the Early cone and rod precursors with rod- and conerelated RNA co-expression section (new paragraph at top of p. 16): 

      Thus, a 3’ snRNA-seq analysis confirmed the initial production of immature photoreceptor precursors with either L/M cone-precursor-specific THRB or rod-precursor-specific NR2E3 expression, followed by lower-level co-expression of their counterparts, NR2E3 in cone precursors and THRB in rod precursors. However, in the Zuo et al. analyses, the co-expression was first observed in well-separated UMAP regions, as opposed to a region that bridges the early cone and early rod populations in our UMAP plots. These findings are consistent with the notion that cone- and rod-related RNA co-expression begins in already fate-determined cone and rod precursors, and that such precursors aberrantly intermixed in our UMAP bridge region due to their insufficient representation in our dataset.  

      Importantly, and as noted in our ‘Public response’ to Reviewer 1, “CHRNA1 appears to mark immature cone precursors that are distinct from the maturing cone and rod precursors that coexpress cone- and rod-related RNAs (despite the similar UMAP positions of the two populations in our dataset).” In support of this notion, the immature cone precursors expressing CHRNA1  and other  populations did not overlap in UMAP space in the Zuo et al dataset. We hope the new text cited above along with other changes will significantly clarify the observations.

      (3) The term "cone/rod precursor" shows up late in the paper (page 12), but it was clear (was it not?) much earlier in this manuscript that cone and rod genes are co-expressed because of the coexpressed NRL and THRB isoforms in Figures 3/4.

      We thank the reviewer for noting that the differential NRL and THRB isoform expression already implies that cone and rod genes are co-expressed. However, as we now state, the co-expression of RNAs encoding an additional cone marker (GNAT2) and rod markers (GNAT1, NR2E3) was 

      “suggestive of a proposed hybrid cone/rod precursor state more extensive than implied by the coexpression of different THRB and NRL isoforms” (first paragraph of “Early cone and rod …” section on p. 14; new text underlined). 

      (4) The (incorrect) impression given later in the manuscript is that the rod/cone transcript mixture applies to just a subset of the iPRP cells, or maybe just the bridge cells (writing is not clear), but actually, neither of those is correct as the more abundant and more mature LM and ER populations analyzed earlier coexpress NRL and THRB mRNAs (Figures 2, 3). Overall, the authors need to vastly improve the writing, simplify/clarify the nomenclature, and better label figures to match the text and help the reader follow more easily and clearly. As it stands, it is, at best, obtuse, and at worst, totally confusing.

      We thank the reviewer for bringing the extent of the confusing terminology and wording to our attention. We revised the terminology (as in our response to point 1) and extensively revised the text.  We also performed similar analyses of the Zuo et al. data (as described in more detail in our response to Reviewer 2), which clarifies the distinct status of cells with the “rod/cone transcript mixture” and cells co-expressing early cone and rod precursor markers.  

      To more clearly describe data related to cells with rod- and cone-related RNA co-expression, we divided the former Figure 6 into two figures, with Figure 6 now showing the cone- and rodrelated RNA co-expression inferred from scRNA-seq and Figure 7 showing GNAT2 and NR2E3 co-expression in FISH analyses of human retina plus a new schematic in the new panel 7E.

      To separate the conceptually distinct analyses of cone and rod related RNA co-expression and the expression of early photoreceptor precursor markers (which were both found in the so-called bridge region – yet now recognized to be different subpopulations), we separated the analyses of the early photoreceptor precursor markers to form a new section, “Developmental expression of photoreceptor precursor markers and fate determinants,” starting on p. 16. 

      Additionally, we further review the findings and their implications in four revised Discussion paragraphs starting at the bottom of p. 23).

      (5) The data showing that overexpressing Tr-NRL in murine NIH3T3 fibroblasts blocks FL-NRL function is presented at the end of page 7 and in Figure 3G. Subsequent analysis two paragraphs and two figures later (end page 8, Figure 5C + supp figs) reveal that Tr-NRL protein is not detectable in retinoblastoma cells which derive from cone precursors cells and express Tr-NRL mRNA, and the protein is also not detected upon lentiviral expression of Tr-NRL in human fetal retinal explants, suggesting it is unstable or not translated. It would be preferable to have the 3T3 data and retinoblastoma/explant data juxtaposed. E.g. they could present the latter, then show the 3T3 that even if it were expressed (e.g. briefly) it would interfere with FL-NRL. The current order and spacing are somewhat confusing.

      We thank the reviewer for this suggestion and moved the description of the luciferase assays to follow the retinoblastoma and explant data and switched the order of Figure panels 3G and 3H.  

      (6) On page 15, regarding early rod vs early cone gene expression, the authors state: "although MYCN mRNA was not detected....", yet on the volcano plot in Figure S14A MYCN is one of the marked genes that is higher in cones than rods, meaning it was detected, and a couple of sentences later: "Concordantly, the LM cluster had increased MYCN RNA". The text is thus confusing.

      With respect, we note that the original text read, “although MYC RNA was not detected,” which related to a statement in the previous sentence that the gene ontology analysis identified “MYC targets.” However, given that this distinction is subtle and may be difficult for readers to recognize, we revised the text (now on p. 19) to more clearly describe expression of MYCN (but not MYC) as follows:

      “The upregulation of MYC target genes was of interest given that many MYC target genes are also targets of MYCN, that MYCN protein is highly expressed in maturing (ARR3+) cone precursors but not in NRL+ rods (Figure 10A), and that MYCN is critical to the cone precursor proliferative response to pRB loss8–10.  Indeed, whereas MYC RNA was not detected, the LM cone cluster had increased MYCN RNA …”

      (7) The authors state that the SYK drug is "highly specific". They provide no evidence, but no drug is 100% specific, and it is possible that off-target hits are important for the drug phenotype. This data should be removed or validated by co-targeting the SYK gene along with RB1.

      We agree that our data only show the potential for SYK to contribute to the cone proliferative response; however, we believe the inhibitor study retains value in that a negative result (no effect of the SYK inhibitor) would disprove its potential involvement. To reflect this, we changed wording related to this experiment as follows:

      In the Abstract, we changed:

      (1) “SYK, which contributed to the early cone precursors’ proliferative response to RB1 loss” To: “SYK, which was implicated in the early cone precursors’ proliferative response to RB1 loss.”  

      (2) “These findings reveal … and a role for early cone-precursor-intrinsic SYK expression.” To:  “These findings reveal … and suggest a role for early cone-precursor-intrinsic SYK expression.”

      In the last paragraph of the Results, we changed:

      (1) “To determine if SYK contributes…” To:  “To determine if SYK might contribute…”

      (2) “the highly specific SYK inhibitor” To:  “the selective SYK inhibitor”  

      (3)  “indicating that cone precursor intrinsic SYK activity is critical to the proliferative response” To: “consistent with the notion that cone precursor intrinsic SYK activity contributes to the proliferative response.”

      In the Results, we added a final sentence: 

      “However, given potential SYK inhibitor off-target effects, validation of the role of SYK in retinoblastoma initiation will require genetic ablation studies.”

      In the Discussion (2nd-to-last paragraph), we changed: 

      “SYK inhibition impaired pRB-depleted cone precursor cell cycle entry, implying that native SYK expression rather than de novo induction contributes to the cone precursors’ initial proliferation.” To: “…the pRB-depleted cone precursors’ sensitivity to a SYK inhibitor suggests that native SYK expression rather than de novo induction contributes to the cone precursors’ initial proliferation, although genetic ablation of SYK is needed to confirm this notion.” In the Discussion last sentence, we changed:

      “enabled the identification of developmental stage-specific cone precursor features that underlie retinoblastoma predisposition.” To: “enabled the identification of developmental stage-specific cone precursor features that are associated with the cone precursors’ predisposition to form retinoblastoma tumors.”

      Minor/Typos

      Figure 7 legend, H should be D.

      We corrected the figure legend (now related to Figure 8).

      Reviewer #2 (Recommendations for the authors):

      (1) The author should take advantage of recently published human fetal retina data, such as PMID:39117640, which includes a larger dataset of cells that could help validate the findings. Consequently, statements like "To our knowledge, this is the first indication of two immediately post-mitotic photoreceptor precursor populations with cone versus rod-biased gene expression" may need to be revised.

      We thank the reviewer for noting the evidence of distinct immediately post-mitotic rod and cone populations published by others after we submitted our manuscript. In response, we omitted the sentence mentioned and extensively cross-checked our results including:

      - comparison of our early versus late cone and rod maturation states to the cone and rod precursor versus cone and rod states identified by Zuo et al (new paragraph on the top half of p. 6 and new figure panels S3G,H);

      - detection of distinct immediately post-mitotic versus later cone and rod precursor populations (two new paragraphs on pp. 12-13 and new Figures S10B and S11A-E); 

      - identification of cone and rod precursor populations that co-express cone and rod marker genes (two new paragraphs starting at the bottom of p. 15 and new Figures S11D-F);

      - comparison of expression patterns of immature cone precursor (iCP) marker genes in our and the Zuo et al dataset (new paragraph on top half of p. 17 and new Figure S13).

      We also compare the cell states discerned in our study and the Zuo et al. study in a new Discussion paragraph (bottom of p. 23) and new Figure S17.

      (2) The data generated comes from dissociated cells, which inherently lack spatial context. Additionally, it is unclear whether the dataset represents a pool of retinas from multiple developmental stages, and if so, whether the developmental stage is known for each cell profiled. If this information is available, the authors should examine the distribution of developmental stages on the UMAP and trajectory analysis as part of the quality control process. 

      We thank the reviewer for highlighting the importance of spatial context and developmental stage. 

      Related to whether the dataset represents a pool of retinae from multiple developmental stages, the different cell numbers examined at each time point are indicated in Figure S1A. To draw the readers’ attention to this detail, Figure S1A is now cited in the first sentence of the Results. 

      Related to the age-related cell distributions in UMAP plots, the distribution of cells from each retina and age was (and is) shown in Fig. S1F. In addition, we now highlight the age distributions by segregating the FW13, FW15-17, and FW17-18-19 UMAP positions in the new Figure 1C. We describe the rod temporal changes in a new sentence at the top of  p. 5:

      “Few rods were detected at FW13, whereas both early and late rods were detected from FW15-19 (Figure 1C), corroborating prior reports [15,20].”  

      We describe the cone temporal changes and note the likely greater discrimination of cell state changes that would be afforded by separately analyzing macula versus peripheral retina at each age in a new sentence at the bottom of p. 5:

      “L/M cone precursors from different age retinae occupied different UMAP regions, suggesting age-related differences in L/M cone precursor maturation (Figure 1C).”

      Moreover, they should assess whether different developmental stages impact gene expression and isoform ratios. It is well established that cone and rod progenitors typically emerge at different developmental times and in distinct regions of the retina, with minimal physical overlap. Grouping progenitor cells based solely on their UMAP positioning may lead to an oversimplified interpretation of the data.

      (2a) We agree that different developmental stages may impact gene expression and isoform ratios, and evaluated stages primarily based on established Louvain clustering rather than UMAP position. However, we also used UMAP position to segregate so-called RPC-localized and nonRPC-localized iCPs and iRPs, as well as to characterize the bridge region iCP sub-populations. In the revision, we examine whether cell groups defined by UMAP positions helped to identify transcriptomically distinct populations and further examine the spatiotemporal gene expression patterns of the same genes in the Zuo et al. 3’ snRNA-seq dataset. 

      (2b) Related to analyses of immediately post-mitotic iRPs and iCPs, the new Figure S10A expanded the violin plots first shown in Figure 5D to compare gene expression in RPC-localized versus non-RPC-localized iCPs and iRPs and subsequent cone and rod precursor clusters (also presented in response to Reviewer 3). The new Figure S10C, shows a similar analysis of UMAP region-specific regulon activities. These figures support the idea that there are only subtle UMAP region-related differences in the expression of the selected gene and regulons. 

      To further evaluate early cone and rod precursors, we compared expression patterns in our cluster- and UMAP-defined cell groups to those of the spatiotemporally defined cell groups in the Zuo et al. 3’ snRNA-seq study. The results revealed similar expression timing of the genes examined, although the cluster assignments of a subset of cells were brought into question, especially the assigned rod precursors at pcw 10 and 13, as shown in new Figures S10B (grey columns) and S11, and as described in two new paragraphs starting near the bottom of p.12. 

      (2c) Related to analyses of iCPs in the so-called bridge region, our analyses of the Zuo et al dataset helped distinguish early cone and rod precursor populations (expressing early markers such as ATOH7 and CHRNA1) from the later stages exhibiting rod- and cone-related gene coexpression, which had intermixed in the UMAP bridge region in our dataset. Further parsing of early cone precursor marker spatiotemporal expression revealed intriguing differences as now described in the second half of a new paragraph at the top of p. 17, as follows:

      “Also, different iCP markers had different spatiotemporal expression: CHRNA1 and ATOH7 were most prominent in peripheral retina with ATOH7 strongest at pcw 10 and CHRNA1 strongest at pcw 13; CTC-378H22.2 was prominently expressed from pcw 10-13 in both the macula and the periphery; and DLL3 and ONECUT1 showed the earliest, strongest, and broadest expression (Figure S13B). The distinct patterns suggest spatiotemporally distinct roles for these factors in cone precursor differentiation.”

      (3) I would commend the authors for performing a validation experiment via RNA in situ to validate some of the findings. However, drawing conclusions from analyzing a small number of cells can still be dangerous. Furthermore, it is not entirely clear how the subclustering is done. Some cells change cell type identities in the high-resolution plot. For example, some iPRP cells from the low-resolution plots in Figure 1 are assigned as TR in high-resolution plots in Figure 5.

      The authors should provide justification on the identifies of RPC localized iPRP and TR.

      Comparison of their data with other publicly available data should strengthen their annotation

      We agree that drawing conclusions from scRNA-seq or in situ hybridization analysis of a small number of cells can be dangerous and have followed the reviewer’s suggestion to compare our data with other publicly available data, focusing on the 3’ snRNA-seq of Zuo et al. given its large size and extensive annotation. Our analysis of  the Zuo et al. dataset helped clarify cell identities by segregating cone and rod precursors with similar gene expression properties in distinct UMAP regions. However, we noted that the clustering of early cone and rod precursors likely gave numerous mis-assigned cells (as noted in response 2b above and shown in the new Figure S11). It would appear that insights may be derived from the combination of relatively shallow sequencing of a high number of cells and deep sequencing of substantially fewer cells. 

      Related to how subclustering was done, the Methods state, “A nearest-neighbors graph was constructed from the PCA embedding and clusters were identified using a Louvain algorithm at low and high resolutions (0.4 and 1.6)[70],” citing the Blondel et al reference for the Louvain clustering algorithm used in the Seurat package.  To clarify this, the results text was revised such that it now indicates the levels used to cluster at low resolution (0.4, p. 4, 2nd paragraph) and at high resolution (1.6, top of p. 11) .

      Related to the assignment of some iPRP cells from the low-resolution plots in Figure 1 to the TR cluster (now called the ‘iRP’ ‘cluster) in the high-resolution plots in Figure 5, we suggest that this is consistent with Louvain clustering, which does not follow a single dendrogram hierarchy. 

      The justification for referring to these groups as RPC-localized iCPs and iRPs relates to their biased gene and regulon expression in Fig. 5D and 5E, as stated on p. 12: 

      “In the RPC-localized region, iCPs had higher ONECUT1, THRB, and GNAT2, whereas iRPs trended towards higher NRL and NR2E3 (p= 0.19, p=0.054, respectively).”

      (4) Late-stage LM5 cluster Figure 9 is not defined anywhere in previous figures, in which LM clusters only range from 1 to 4. The inconsistency in cluster identification should be addressed.

      We revised the text related to this as follows: 

      “Indeed, our scRNA-seq analyses revealed that SYK RNA expression increased from the iCP stage through cluster LM4, in contrast to its minimal expression in rods (Figure 10E).  Moreover, SYK expression was abolished in the five-cell group with properties of late maturing cones (characterized in Figure 1E), here displayed separately from the other LM4 cells and designated LM5 (Figure 10E).”  (p. 19-20)

      (5) Syk inhibitor has been shown to be involved in RB cell survival in previous studies. The manuscript seems to abruptly make the connection between the single-cell data to RB in the last figure. The title and abstract should not distract from the bulk of the manuscript focusing on the rod and cone development, or the manuscript should make more connection to retinoblastoma.

      We appreciate the reviewer’s concern that the title may seem to over-emphasize the connection to retinoblastoma based solely on the SYK inhibitor studies. However, we suggest the title also emphasizes the identification and characterization of early human photoreceptor states, per se, and that there are a number of important connections beyond the SYK studies that could warrant the mention of cell-state-specific retinoblastoma-related features in the title.

      Most importantly, a prior concern with the cone cell-of-origin theory was that retinoblastoma cells express RNAs thought to mark retinal cell types other than cones, especially rods. The evidence presented here, that cone precursors also express the rod-related genes helps resolve this issue. The issue is noted numerous times in the manuscript, as follows:  

      In the Introduction, we write:

      “However, retinoblastoma cells also express rod lineage factor NRL RNAs, which – along with other evidence – suggested a heretofore unexplained connection between rod gene expression and retinoblastoma development[12,13]. Improved discrimination of early photoreceptor states is needed to determine if co-expression of rod- and cone-related genes is adopted during tumorigenesis or reflects the co-expression of such genes in the retinoblastoma cell of origin.” (bottom, p. 2) And: 

      “In this study, we sought to further define the transcriptomic underpinnings of human  photoreceptor development and their relationship to retinoblastoma tumorigenesis.” (last paragraph, p. 3)

      The Discussion also alluded to this issue and in the revised Discussion, we aimed to make the connection clearer.  We previously ended the 3rd-to-last paragraph with,  

      “iPRP [now iCP] and early LM cone precursors’ expression of NR2E3 and NRL RNAs suggest that their presence in retinoblastomas[12,13] reflects their normal expression in the L/M cone precursor cells of origin.” 

      We now separate and elaborate on this point in a new paragraph as follows: 

      “Our characterization of cone and rod-related RNA co-expression may help resolve questions about the retinoblastoma cell of origin. Past studies suggested that retinoblastoma cells co-express RNAs associated with rods, cones, or other retinal cells due to a loss of lineage fidelity[12]. However, the early L/M cone precursors’ expression of NR2E3 and NRL RNAs suggest that their presence in retinoblastomas[12,13] reflects their normal expression in the L/M cone precursor cells of origin. This idea is further supported by the retinoblastoma cells’ preferential expression of cone-enriched NRL transcript isoforms (Figure S5B).” (middle of p. 24) Based on the above, we elected to retain the title.  

      Minor comments:

      (1) It is difficult to see the orange and magenta colors in the Fig 3E RNA-FISH image. The colors should be changed, or the contrast threshold needs to be adjusted to make the puncta stand out more.

      We re-assigned colors, with red for FL-NRL puncta and green for Tr-NRL puncta. 

      (2) Figure 5C on page 8 should be corrected to Supplementary Figure 5C.

      We thank the reviewer for noting this error and changed the figure citation.

      Reviewer #3 (Recommendations for the authors):

      (1) Minor concerns

      a. Abbreviation of some words needs to be included, example: FW. 

      We now provide abbreviation definitions for FW and others throughout the manuscript.  

      b. Cat # does not matches with the 'key resource table' for many reagents/kits. Some examples are: CD133-PE mentioned on Page # 22 on # 71, SMART-Seq V4 Ultra Low Input RNA Kit and SMARTer Ultra Low RNA Kit for the Fluidigm C1 Sytem on Page # 22 on # 77, Nextera XT DNA Library preparation kit on Page # 23 on # 77.

      We thank the reviewer for noting these discrepancies. We have now checked all catalog numbers and made corrections as needed.

      c. Cat # and brand name of few reagents & kits is missing and not mentioned either in methods or in key resource table or both. Eg: FBS, Insulin, Glutamine, Penicillin, Streptomycin, HBSS, Quant-iT PicoGreen dsDNA assay, Nextera XT DNA LibraryPreparation Kit, 5' PCR Primer II A with CloneAmp HiFi PCR Premix. 

      Catalog numbers and brand names are now provided for the tissue culture and related reagents within the methods text and for kits in the Key Resources Table. Additional descriptions of the primers used for re-amplification and RACE were added to the Methods (p. 28-29).

      d. Spell and grammar check is needed throughout the manuscript is needed. Example. In Page # 46 RXRγlo is misspelled as RXRlo.

      Spelling and grammar checks were reviewed.

      (2) Methods & Key Resource table.

      a. In Page # 21, IRB# needs to be stated.      

      The IRB protocols have been added, now at top of p. 26.

      b. In Page # 21, Did the authors dissociate retinae in ice-cold phosphate-buffered saline or papain?   

      The relevant sentence was corrected to “dissected while submerged in ice-cold phosphatebuffered saline (PBS) and dissociated as described10.” ( p. 26)

      c. In Page # 21, How did the authors count or enumerate the cell count? Provide the details.

      We now state, “… a 10 µl volume was combined with 10 µl trypan blue and counted using a hemocytometer” (top of p. 27)

      d. Why did the authors choose to specifically use only 8 cells for cDNA preparation in Page # 22? State the reason and provide the details.

      The reasons for using 8 cells (to prevent evaporation and to manually transfer one slide-worth of droplets to one strip of PCR tubes) and additional single cell collection details are now provided as follows (new text underlined): 

      “Single cells were sorted on a BD FACSAria I at 4°C using 100 µm nozzle in single-cell mode into each of eight 1.2 µl lysis buffer droplets on parafilm-covered glass slides, with droplets positioned over pre-defined marks … .  Upon collection of eight cells per slide, droplets were transferred to individual low-retention PCR tubes (eight tubes per strip) (Bioplastics K69901, B57801) pre-cooled on ice to minimize evaporation. The process was repeated with a fresh piece of parafilm for up to 12 rounds to collect 96 cells). (p. 27, new text underlined)

      e. Key resource table does not include several resources used in this study. Example - NR2E3 antibody.

      We added the NR2E3 antibody and checked for other omissions.

      (3) Results & Figures & Figure Legends

      a. Regulon-defined RPC and photoreceptor precursor states

      i. On page # 4, 1 paragraph - Clarify the sentence 'Exclusion of all cells with <100,000 cells read and 18 cells.........Emsembl transcripts inferred'. Did the authors use 18 cells or 18FW retinae? 

      The sentence was changed to:

      “After sequencing, we excluded all cells with <100,000 read counts and 18 cells expressing one or more markers of retinal ganglion, amacrine, and/or horizontal cells (POU4F1, POU4F2, POU4F3, TFAP2A, TFAP2B, ISL1) and concurrently lacking photoreceptor lineage marker OTX2. This yielded 794 single cells with averages of 3,750,417 uniquely aligned reads, 8,278 genes detected, and 20,343 Ensembl transcripts inferred (Figure S1A-C).” (p. 4, new words underlined)

      To clarify that 18 retinae were used, the first sentence of the Results was revised as follows:

      “To interrogate transcriptomic changes during human photoreceptor development, dissociated RPCs and photoreceptor precursors were FACS-enriched from 18 retinae, ages FW13-19 …” (p. 4).

      Why did the authors 'exclude cells lacking photoreceptor lineage marker OTX2' from analysis especially when the purpose here was to choose photoreceptor precursor states & further results in the next paragraph clearly state that 5 clusters were comprised of cells with OTX2 and CRX expression. This is confusing.

      We apologize for the imprecise diction. We divided the evidently confusing sentence into two sentences to more clearly indicate that we removed cells that did not express OTX2, as in the first response to the previous question.

      ii. In Page # 5, the authors reported the number of cell populations (363 large and 5 distal) identified in the THRB+ L/M-cone cluster. What were the # of cell populations identified in the remaining 5 clusters of the UMAP space?

      We added the cell numbers in each group to Fig. 1B. We corrected the large LM group to 366 cells (p. 5) and note 371 LM cells , which includes the five distal cells, in Figure 1B.

      b. Differential expression of NRL and THRB isoforms in rod and cone precursors

      i. In Figure 3B, the authors compare and show the presence of 5 different NRL isoforms for all the 6 clusters that were defined in 3A. However, in the results, the ENST# of just 2 highly assigned transcript isoforms is given. What are the annotated names of the three other isoforms which are shown in 3B? Please explain in the Results.

      As requested, we now annotate the remaining isoforms as encoding full-length or truncated NRL in Fig. 3B and show isoform structures in new Supplementary Figure S4B.  We also refer to each transcript isoform in the Results (p. 7, last paragraph) and similarly evaluate all isoforms in RB31 cells (Fig. S5B).

      ii. What does the Mean FPM in the y-axis of Fig 3C refer to?

      Mean FPM represents mean read counts (fragments per million, FPM) for each position across Ensembl NRL exons for each cluster, as now stated in the 6th line of the Fig. 3 legend.

      iii. A clear explanation of the results for Figures 3E-3F is missing.

      We revised the text to more clearly describe the experiment as follows:

      “The cone cells’ higher proportional expression of Tr-NRL first exon sequences was validated by RNA fluorescence in situ hybridization (FISH) of FW16 fetal retina in which NRL immunofluorescence was used to identify rod precursors, RXRg immunofluorescence was used to identify cone precursors, and FISH probes specific to truncated Tr-NRL exon 1T or FL-NRL exons 1 and 2 were used to assess Tr-NRL and FL-NRL expression (Figure 3E,F).” (p. 8, new text underlined).

      c. Two post-mitotic photoreceptor precursor populations

      i. Although deep-sequencing and SCENIC analysis clarified the identities of four RPC-localized clusters as MG, RPC, and iPRP indicative of cone-bias and TR indicative of rod-bias. It would be interesting to see the discriminating determinant between the TR and ER by SCENIC and deep-sequencing gene expression violin/box plots.

      We agree it is of interest to see the discriminating determinant between the TR [now termed iRP] and ER clusters by SCENIC and deep-sequencing gene expression violin/box plots. We now provide this information for selected genes and regulons of interest in the new Supplementary Figures S10A and S10C, along with a similar comparison between the prior high-resolution iPRP (now termed iCP) cluster and the first high-resolution LM cluster, LM1, as described for gene expression on p. 12:

      “Notably, THRB and GNAT2 expression did not significantly change while ONECUT1 declined in the subsequent non-RPC-localized iCP and LM1 stages, whereas NR2E3 and NRL dramatically increased on transitioning to the ER state (Figure S10A).”

      And as described for regulon activities on pp. 13-14:

      “Finally, activities of the cone-specific THRB and ISL2 regulons, the rod-specific NRL regulon, and the pan-photoreceptor LHX3, OTX2, CRX, and NEUROD1 regulons increased to varying extents on transitioning from the immature iCP or iRP states to the early-maturing LM1 or ER states (Figure 10C).”

      We also show expression of the same genes for spatiotemporally grouped cells from the Zuo et al. dataset in the new Figure S10B, which displays a similar pattern (apart from the possibly mixed pcw 10 and pcw13 designated rod precursors).

      d. Early cone precursors with cone- and rod-related RNA expression

      i. On page #12, the last paragraph where the authors explain the multiplex RNA FISH results of RXRγ and NR2E3 by citing Figure S8E. However, in Fig S8E, the authors used NRL to identify the rods. Please clarify which one of the rod markers was used to perform RNA FISH?

      Figure S8E (where NRL was used as a rod marker) was cited to remind readers that RXRg has low expression in rods and high expression in cones, rather than to describe the results of this multiplex FISH section. To avoid confusion on this point, Figure S8E is now cited using “(as earlier shown in Figure S8E).” With this issue clarified, we expect the markers used in the FISH + IF analysis will be clear from the revised explanation, 

      “… we examined GNAT2 and NR2E3 RNA co-expression in RXRg+ cone precursors in the outermost NBL and in RXRg+ rod precursors in the middle NBL … .” (p. 14-15).

      To provide further clarity, we provide a diagram of the FISH probes, protein markers, and expression patterns in the new Figure 7E.

      ii. The Y-axis of Fig 6G-6H needs to be labelled.

      The axes have been re-labeled from “Nb of cells” to “Number of RXRg+ outermost NBL cells in each region” (original Fig. 6G, now Fig. 7C) and “Number of RXRg+ middle NBL cells in each region” (original Fig. 6H, now Fig. 7D).

      iii. The legends of Figures 6G and 6H are unclear. In the Figure 6G legend, the authors indicate 'all cells are NR2E3 protein-'. Does that imply the yellow and green bars alone? Similarly, clarify the Figure 6H legend, what does the dark and light magenta refer to? What does the light magenta color referring to NR2E3+/ NR2E3- and the dark magenta color referring to NR2E3+/ NR2E3+ indicate? 

      We regret the insufficient clarity. We revised the Fig. 6G (now Fig. 7C) key, which now reads

      “All outermost NBL cells are NR2E3 protein-negative.”  We added to the figure legend for panel 7C,D “(n.b., italics are used for RNAs, non-italics for proteins).”  The new scheme in Figure 7E shows the RNAs in italics proteins in non-italics. We hope these changes will clarify when RNA or protein are represented in each histogram category.

      Overall, the results (on page # 13) reflecting Figures 6E-6H & Figure S11 are confusing and difficult to understand. Clear descriptions and explanations are needed.

      We revised this results section described in the paragraph now spanning p. 14:

      -  We now refer to the bar colors in Figures 7C and 7D that support each statement. 

      -  We provide an illustration of the findings in Figure 7E.

      iv. Previously published literature has shown that cells of the inner NBL are RXRγ+ ganglion cells. So, how were these RXRγ+ ganglion cells in the inner NBL discriminated during multiplex RNA FISH (in Fig 6E-6H and in Fig S11)?

      We thank the reviewer for requesting this clarification. We agree that “inner NBL” is the incorrect term for the region in which we examined RXRg+ photoreceptor precursors, as this could include RXRγ+ nascent RGCs. We now clarify that 

      “we examined GNAT2 and NR2E3 RNA co-expression in RXRg+ cone precursors in the outermost NBL and in RXRg+ rod precursors in the middle NBL … .”  (p. 14-15) We further state, 

      “Limiting our analysis to the outer and middle NBL allowed us to disregard RXRγ+ retinal ganglion cells in the retinal ganglion cell layer or inner NBL (top of p. 15)”

      Figure 7E is provided to further aid the reader in understanding the positions examined, and the legend states “RXRg+ retinal ganglion cells in the inner NBL and ganglion cell layer not shown. 

      v. In Figure 6E, what marker does each color cell correspond to?

      In this figure (now panel 7A), we declined to provide the color key since the image is not sufficiently enlarged to visualize the IF and FISH signals. The figure is provided solely to document the regions analyzed and readers are now referred to “see Figure S12 for IF + FISH images” (2nd line, p. 15), where the marker colors are indicated.

      vi. In Figure S11 & 6E, Protein and RNA transcript color of NR2E3, GNAT2 are hard to distinguish. Usage of other colors is recommended.  

      We appreciate the reviewer’s concern related to the colors (in the now redesignated Figure S12 and 7A); however, we feel this issue is largely mitigated by our use of arrows to point to the cells needed to illustrate the proposed concepts in Figure S12B. All quantitation was performed by examining each color channel separately to ensure correct attribution, which is now mentioned in the Methods (2nd-to-last line of Quantitation of FISH section, p. 35).

      vii. 

      With due respect, we suggest that labeling each box (now in Figure 8B) makes the figure rather busy and difficult to infer the main point, which is that boxed regions were examined at various distanced from the center (denoted by the “C” and “0 mm”) with distances periodically indicated. We suggest the addition of such markers would not improve and might worsen the figure for most readers.    

      e. An early L/M cone trajectory marked by successive lncRNA expression

      i. In Figure 8C - color-coded labelling of LM1-4 clusters is recommended.

      We note Fig. 8C (now 9C) is intended to use color to display the pseudotemporal positions of each cell. We recognize that an additional plot with the pseudotime line imposed on LM subcluster colors could provide some insights, yet we are unaware of available software for this and are unable to develop such software at present. To enable readers to obtain a visual impression of the pseudotime vs subcluster positions, we now refer the reader to Figure 5A in the revised figure legend, as follows:  (“The pseudotime trajectory may be related to LM1-LM4 subcluster distributions in Figure 5A.”).

      ii. In Figure 8G - what does the horizontal color-coded bar below the lncRNAs name refer to? These bars are similar in all four graphs of the 8G figure.

      As stated in the Fig. 8G (now 9G) legend, “Colored bars mark lncRNA expression regions as described in the text.”  We revised the text to more clearly identify the color code. (p. 18-19)   

      f. Cone intrinsic SYK contributions to the proliferative response to pRB loss

      i. In Fig 9F - The expression of ARR3+ cells (indicated by the green arrow in FW18) is poorly or rarely seen in the peripheral retina.

      We thank the reviewer for finding this oversight. In panel 9F (now 10F), we removed the green arrows from the cells in the periphery, which are ARR3- due to the immaturity of cones in this region. 

      ii. In Figure 9F - Did the authors stain the FW16 retina with ARR3?

      Unfortunately, we did not stain the FW16 retina for ARR3 in this instance.

      iii. Inclusion of DAPI staining for Fig 9F is recommended to justify the ONL & INL in the images.

      We regret that we are unable to merge the DAPI in this instance due to the way in which the original staining was imaged.  A more detailed analysis corroborating and extending the current results is in progress. 

      iv. Immunostaining images for Figure 9G are missing & are required to be included. What does shSCR in Fig 9G refer to?

      We now provide representative immunostaining images below the panel (now 10G). The legend was updated: “Bottom: Example of Ki67, YFP, and RXRg co-immunostaining with DAPI+ nuclei (yellow outlines). Arrows: Ki67+, YFP+, RXRg+ nuclei.”  The revised legend now notes that shSCR refers to the scrambled control shRNA.

      v. For Figure 9H - Is the presence and loss of SYK activity consistent with all the subpopulations (S & LM) of early maturing and matured cones?

      We appreciate the reviewer’s question and interest (relating to the redesignated Figure 10H); however, we have not yet completed a comprehensive evaluation of SYK expression in all the subpopulations (S & LM) of early maturing and matured cones and will reserve such data for a subsequent study. We suggest that this information is not critical to the study’s major conclusions.

      vi. Figure 9A is not explained in the results. Why were MYCN proteins assessed along with ARR3 and NRL? What does this imply?

      We thank the reviewer for noting that this figure (now Figure 10A) was not clearly described. 

      As per the response to Reviewer 1, point 6 , the text now states,  

      “The upregulation of MYC target genes was of interest given that many MYC target genes are also MYCN targets, that MYCN protein is highly expressed in maturing (ARR3+) cone precursors but not in NRL+ rods (Figure 10A), and that MYCN is critical to the cone precursor proliferative response to pRB loss [8–10].” (middle, p. 19, new text underlined).

      Hence, the figure demonstrates the cone cell specificity of high MYCN protein.  This is further noted in the Fig. 10a legend: “A. Immunofluorescent staining shows high MYCN in ARR3+ cones but not in NRL+ rods in FW18 retina.”

    1. eLife Assessment

      This useful manuscript addresses a stability issue for long-term chronically implanted array recordings and electrolytic lesioning, which is relevant to both basic science and translational research. The authors provide a systematic scanning electron microscopy (SEM) of explanted arrays, evaluating electrode damage and sharing extensive datasets accessible through interactive plots. The strength of the evidence is solid, but it can be improved by performing additional analyses on complementary neurophysiology, functional, or histological data.

    2. Reviewer #1 (Public review):

      Summary:

      This work presents a GUI with SEM images of 8 Utah arrays (8 of which were explanted, and 4 of which were used for creating cortical lesions).

      Strengths:

      Visual comparison of electrode tips with SEM images, showing that electrolytic lesioning did not appear to cause extra damage to electrodes.

      Weaknesses:

      Given that the analysis was conducted on explanted arrays, and no functional or behavioural in vivo data or histological data are provided, any damage to the arrays may have occurred after explantation. This makes the results limited and inconclusive ( firstly, that there was no significant relationship between degree of electrode damage and use of electrolytic lesioning, and secondly, that electrodes closer to the edge of the arrays showed more damage than those in the center).

      Overall, these results do not add new insight to the field, although they do add more data and reference images.

    3. Reviewer #2 (Public review):

      In this study, the authors used scanning electron microscopy (SEM) to image and analyze eleven Utah multielectrode arrays (including eight chronically implanted in four macaques). Four of the eight arrays had previously been used to deliver electrolytic lesions. Each intact electrode was scored in five damage categories. They found that damage disproportionately occurred to the outer edges of arrays. Importantly, the authors conclude that their electrolytic Lesioning protocol does not significantly increase material degradation compared to normal chronic use without lesion. Additionally, the authors have released a substantial public dataset of single-electrode SEM images of explanted Utah arrays.

      The paper is well-written and addresses an important stability issue for long-term chronically implanted array recordings and electrolytic lesioning, which is relevant to both basic science and translational research. By comparing lesioning and non-lesioning electrodes on the same array and within the same animal, the study effectively controls for confounds related to the animal and surgical procedures. The shared dataset, accessible via interactive plots, enhances transparency and serves as a valuable reference for future investigations. Below, we outline some major and minor concerns that could help improve the work.

      Major concerns:

      (1) Electrode impedance is a critical measurement to evaluate the performance of recording electrodes. It would be helpful if the authors could provide pre-explant and post-explant impedance values for each electrode alongside the five SEM damage scores. This would allow the readers to assess how well the morphological scores align with functional degradation.

      (2) The lesion parameters differ across experiments and electrodes. It would be helpful if the authors could evaluate whether damage scores (and/or impedance changes) correlate with total charge, current amplitude, duration, or frequency.

    1. eLife Assessment

      This fundamental study demonstrates how a left-right bias in the relationship between numerical magnitude and space depends on brain lateralization. The evidence is compelling, and the manuscript could be strengthened by improving its contextualization, presentation, and discussion. The results will be of interest to researchers studying numerical cognition, brain lateralization, and cognitive brain development more broadly.

    2. Reviewer #1 (Public review):

      Functional lateralization between the right and left hemispheres is reported widely in animal taxa, including humans. However, it remains largely speculative as to whether the lateralized brains have a cognitive gain or a sort of fitness advantage. In the present study, by making use of the advantages of domestic chicks as a model, the authors are successful in revealing that the lateralized brain is advantageous in the number sense, in which numerosity is associated with spatial arrangements of items. Behavioral evidence is strong enough to support their arguments. Brain lateralization was manipulated by light exposure during the terminal phase of incubation, and the left-to-right numerical representation appeared when the distance between items gave a reliable spatial cue. The light-exposure induced lateralization, though quite unique in avian species, together with the lack of intense inter-hemispheric direct connections (such as the corpus callosum in the mammalian cerebrum), was critical for the successful analysis in this study. Specification of the responsible neural substrates in the presumed right hemisphere is expected in future research. Comparable experimental manipulation in the mammalian brain must be developed to address this general question (functional significance of brain laterality) is also expected.

    3. Reviewer #2 (Public review):

      Summary:

      This is the first study to show how a L-R bias in the relationship between numerical magnitude and space depends on brain lateralisation, and moreover, how is modulated by in ovo conditions.

      Strengths:

      Novel methodology for investigating the innateness and neural basis of an L-R bias in the relationship between number and space.

      Weaknesses:

      I would query the way the experiment was contextualised. They ask whether culture or innate pre-wiring determines the 'left-to-right orientation of the MNL [mental number line]'.

      The term, 'Mental Number Line' is an inference from experimental tasks. One of the first experimental demonstrations of a preference or bias for small numbers in the left of space and larger numbers in the right of space, was more carefully described as the spatial-numerical association of response codes - the SNARC effect (Dehaene, S., Bossini, S., & Giraux, P. (1993). The mental representation of parity and numerical magnitude. Journal of Experimental Psychology: General, 122, 371-396).

      This has meant that the background to the study is confusing. First, the authors note, correctly, that many other creatures, including insects, can show this bias, though in none of these has neural lateralisation been shown to be a cause. Second, their clever experiment shows that an experimental manipulation creates the bias. If it were innate and common to other species, the experimental manipulation shouldn't matter. There would always be an L-R bias. Third, they seem to be asserting that humans have a left-to-right (L-R) MNL. This is highly contentious, and in some studies, reading direction affects it, as the original study by Dehaene et al showed; and in others, task affects direction (e.g. Bachtold, D., Baumüller, M., & Brugger, P. (1998). Stimulus-response compatibility in representational space. Neuropsychologia, 36, 731-735, not cited). Moreover, a very careful study of adult humans, found no L-R bias (Karolis, V., Iuculano, T., & Butterworth, B. (2011), not cited, Mapping numerical magnitudes along the right lines: Differentiating between scale and bias. Journal of Experimental Psychology: General, 140(4), 693-706). Indeed, Rugani et al claim, incorrectly, that the L-R bias was first reported by Galton in 1880. There are two errors here: first, Galton was reporting what he called 'visualised numerals', which are typically referred to now as 'number forms' - spontaneous and habitual conscious visual representations - not an inference from a number line task. Second, Galton reported right-to-left, circular, and vertical visualised numerals, and no simple left-to-right examples (Galton, F. (1880). Visualised numerals. Nature, 21, 252-256.). So in fact did Bertillon, J. (1880). De la vision des nombres. La Nature, 378, 196-198, and more recently Seron, X., Pesenti, M., Noël, M.-P., Deloche, G., & Cornet, J.-A. (1992). Images of numbers, or "When 98 is upper left and 6 sky blue". Cognition, 44, 159-196, and Tang, J., Ward, J., & Butterworth, B. (2008). Number forms in the brain. Journal of Cognitive Neuroscience, 20(9), 1547-1556.

      If the authors are committed to chicks' MN Line they should test a series of numbers showing that the bias to the left is greater for 2 and 3 than for 4, etc.

      What does all this mean? I think that the paper should be shorn of its misleading contextualisation, including the term 'Mental Number Line'. The authors also speculate, usefully, on why chicks and other species might have a L-R bias. I don't think the speculations are convincing, but at least if there is an evolutionary basis for the bias, it should at least be discussed.

      This paper is very interesting with its focus on why the L-R bias exists, and where and why it does not.

    4. Author response:

      Reviewer #1 (Public review):

      Functional lateralization between the right and left hemispheres is reported widely in animal taxa, including humans. However, it remains largely speculative as to whether the lateralized brains have a cognitive gain or a sort of fitness advantage. In the present study, by making use of the advantages of domestic chicks as a model, the authors are successful in revealing that the lateralized brain is advantageous in the number sense, in which numerosity is associated with spatial arrangements of items. Behavioral evidence is strong enough to support their arguments. Brain lateralization was manipulated by light exposure during the terminal phase of incubation, and the left-to-right numerical representation appeared when the distance between items gave a reliable spatial cue. The light-exposure induced lateralization, though quite unique in avian species, together with the lack of intense inter-hemispheric direct connections (such as the corpus callosum in the mammalian cerebrum), was critical for the successful analysis in this study. Specification of the responsible neural substrates in the presumed right hemisphere is expected in future research. Comparable experimental manipulation in the mammalian brain must be developed to address this general question (functional significance of brain laterality) is also expected.

      We sincerely appreciate the Reviewer's insightful feedback and his/her recognition of the key contributions of our study.

      Reviewer #2 (Public review):

      Summary:

      This is the first study to show how a L-R bias in the relationship between numerical magnitude and space depends on brain lateralisation, and moreover, how is modulated by in ovo conditions.

      Strengths:

      Novel methodology for investigating the innateness and neural basis of an L-R bias in the relationship between number and space.

      We would like to thank the Reviewer for their valuable feedback and for highlighting the key contributions of our study.

      Weaknesses:

      I would query the way the experiment was contextualised. They ask whether culture or innate pre-wiring determines the 'left-to-right orientation of the MNL [mental number line]'.

      We thank the Reviewer for raising this point, which has allowed us to provide a more detailed explanation of this aspect. Rather than framing the left-to-right orientation of the mental number line (MNL) as exclusively determined by either cultural influences or innate pre-wiring, our study highlights the role of environmental stimulation. Specifically, prenatal light exposure can shape hemispheric specialization, which in turn contributes to spatial biases in numerical processing. Please see lines 115-118.

      The term, 'Mental Number Line' is an inference from experimental tasks. One of the first experimental demonstrations of a preference or bias for small numbers in the left of space and larger numbers in the right of space, was more carefully described as the spatialnumerical association of response codes - the SNARC effect (Dehaene, S., Bossini, S., & Giraux, P. (1993). The mental representation of parity and numerical magnitude. Journal of Experimental Psychology: General, 122, 371-396).

      We have refined our description of the MNL and SNARC effect to ensure conceptual accuracy in the revised manuscript; please see lines 53-59.

      This has meant that the background to the study is confusing. First, the authors note, correctly, that many other creatures, including insects, can show this bias, though in none of these has neural lateralisation been shown to be a cause. Second, their clever experiment shows that an experimental manipulation creates the bias. If it were innate and common to other species, the experimental manipulation shouldn't matter. There would always be an LR bias. Third, they seem to be asserting that humans have a left-to-right (L-R) MNL. This is highly contentious, and in some studies, reading direction affects it, as the original study by Dehaene et al showed; and in others, task affects direction (e.g. Bachtold, D., Baumüller, M., & Brugger, P. (1998). Stimulus-response compatibility in representational space. Neuropsychologia, 36, 731-735, not cited). Moreover, a very careful study of adult humans, found no L-R bias (Karolis, V., Iuculano, T., & Butterworth, B. (2011), not cited, Mapping numerical magnitudes along the right lines: Differentiating between scale and bias. Journal of Experimental Psychology: General, 140(4), 693-706). Indeed, Rugani et al claim, incorrectly, that the L-R bias was first reported by Galton in 1880. There are two errors here: first, Galton was reporting what he called 'visualised numerals', which are typically referred to now as 'number forms' - spontaneous and habitual conscious visual representations - not an inference from a number line task. Second, Galton reported right-to-left, circular, and vertical visualised numerals, and no simple left-to-right examples (Galton, F. (1880). Visualised numerals. Nature, 21, 252-256.). So in fact did Bertillon, J. (1880). De la vision des nombres. La Nature, 378, 196-198, and more recently Seron, X., Pesenti, M., Noël, M.-P., Deloche, G., & Cornet, J.-A. (1992). Images of numbers, or "When 98 is upper left and 6 sky blue". Cognition, 44, 159-196, and Tang, J., Ward, J., & Butterworth, B. (2008). Number forms in the brain. Journal of Cognitive Neuroscience, 20(9), 1547-1556.

      We sincerely appreciate the opportunity to discuss numerical spatialization in greater detail. We have clarified that an innate predisposition to spatialize numerosity does not necessarily exclude the influence of environmental stimulation and experience. We have proposed an integrative perspective, incorporating both cultural and innate factors, suggesting that numerical spatialization originates from neural foundations while remaining flexible and modifiable by experience and contextual influences. Please see lines 69–75.

      We have incorporated the Reviewer’s suggestions and cited all the recommended papers; please see lines 47–75.

      If the authors are committed to chicks' MN Line they should test a series of numbers showing that the bias to the left is greater for 2 and 3 than for 4, etc. 

      What does all this mean? I think that the paper should be shorn of its misleading contextualisation, including the term 'Mental Number Line'. The authors also speculate, usefully, on why chicks and other species might have a L-R bias. I don't think the speculations are convincing, but at least if there is an evolutionary basis for the bias, it should at least be discussed.

      In the revised version of the manuscript, we have resorted to adopt the Spatial Numerical Association (SNA). We thank the Reviewer for this valuable comment.

      We appreciated the Reviewer’s suggestion regarding the evolutionary basis of lateralization and have included considerations of its relevance in chicks and other species; please see lines 143-151 and 381-386.

      This paper is very interesting with its focus on why the L-R bias exists, and where and why it does not.

      We wish to thank the Reviewer again for his/her work.

    1. Author response:

      The following is the authors’ response to the original reviews.

      Reviewer #1:

      “EGFRvIII is mainly associated with the classical subtype, so the mesenchymal subtype might be unexpected here. This could be commented on.” 

      We acknowledge that EGFRvIII is most often associated with the classical subtype of glioblastoma and agree that mesenchymal subtype classification may be unexpected given the use of her4.1:EGFRvIII as a driver in our model. We would like to highlight the fact that our brain tumors do also express certain markers associated with the classical subtype including neural precursor and neural stem cell markers like sox2, ascl1b, and gli2 (Supplementary Fig 4, 5; Supplementary Table 1-3). However, our transcriptomic data was not found to significantly enrich for classical subtype gene expression, compared to normal brains. This could be due to a significant contribution of normal brain tissue to our analyses (bulk tumor burdened brains were harvested for RNA sequencing), as well as the significant contribution of mesenchymal subtype signatures and/or inflammatory gene expression in our brain tumor-positive samples. Because signatures associated with inflammation consist of some of the most highly upregulated genes in our samples, this could potentially dilute out and/or lessen alterative subtype and/or signature gene expression. Importantly, it is now widely appreciated that patient tumors simultaneously consist of heterogenous tumor cells reflecting multiple molecular subtypes (Couturier et al., 2020; Darmanis et al., 2017; Neftel et al., 2019), providing glioblastoma with a high level of phenotypic plasticity. We also demonstrate that the contribution of additional drivers not always present with EGFRvIII in patient glioblastoma enhances primary brain tumors in vivo. This result is consistent with more aggressive glioblastomas seen in patients with EGFRvIII variants and TP53 loss-of-function mutations (Ruano et al., 2009). It will therefore be interesting in the future to consider how single or multiple driver mutations contribute to subtype-specific gene expression in our model, as well as histopathology, relative to patients. We have included some of these discussion points to our revised manuscript.     

      “Some more histologic characterization of the tumors would be helpful. Are they invasive, do larger tumors show necrosis and microvascular proliferation? This would help with understanding the full potential of the new model.”

      We have updated our manuscript to include more histolopathological characterization and images (Supplementary Fig 2).

      “Current thinking in established glioblastoma is that the M1/M2 designations for macrophages are not relevant, with microglia macrophage populations showing a mixture of pre- and anti-inflammatory features. Ideally, there would be a much more detailed characterization of the intratumoral microglia/macrophage population here, as single markers can’t be relied upon.”

      We performed additional gene set enrichment analyses (GSEA) using our sequencing datasets and compared p53EPS gene expression to M1/M2 macrophage expression signatures and expression signatures from MCSF-stimulated macrophages at early and late (M2 polarized) time-points. From this analysis, we detected enrichment for markers of both pro- and antiinflammatory features, however, with stronger and significant enrichment for gene expression signatures associated with classical pro-inflammatory M1 macrophages. We have included these GSEA plots and gene set enrichment lists as supplementary materials (Supplementary Fig 6, Supplementary Table 6). We also performed GSEA against a broad curated set of immunologic gene sets (C7: immunologic signature gene sets, Molecular Signatures Database, (Liberzon et al., 2011)) and have included the list of signatures and enrichment scores as a supplementary table (Supplementary Table 6). 

      “Phagocytosis could have anti-tumor effects through removal of live cancer cells or could be cancer-promoting if apoptotic cells are being rapidly cleared with concomitant activation of an immunosuppressive phenotype in the phagocytes (ie. efferocytosis).” 

      We looked at efferocytosis-associated gene expression in our sequencing dataset (124 “efferocytosis” genes, GeneCards), and while we detected upregulation of certain genes associated with efferocytosis in p53EPS brains, we did not detect significant enrichment for the entire gene set. Furthermore, we did not detect up-regulation of key efferocytosis receptors including Axl and Tyro3 (Supplementary Table 1, 2), compared to normal brains. While efferocytosis may contribute to tumor growth and evolution, this GSEA combined with our functional data supporting an inhibitory role for phagocytes in p53EPS tumor initiation and engraftment following transplantation (Fig 4, Fig 5, Supplementary Fig 7), suggests that efferocytosis is not a major driver of tumor formation in our model. However, how efferocytosis affects tumor progression in our model and/or relapse following therapy will be an interesting feature to explore in the future using temporal manipulations of phagocytes and/or treatments with chemical inhibitors.

      Author response image 1.

      Gene Set Enrichment Analysis (GSEA) for efferocytosis-associated gene expression (124 “efferocytosis” genes in GeneCards) in tp53EPS tumor brains, compared to normal zebrafish brains. Normalized enrichment score (NES) and p-value are indicated. 

      “Do the irf7/8 and chlodronate experiments distinguish between effects on microglia/macrophages and dendritic cells?”

      In addition to microglia/macrophages, the IRF8 transcription factor has been shown to control survival and function of dendritic cells (Sichien et al., 2016). Chlodronate treatments are also used to deplete both macrophages and dendritic cells in vivo. Therefore, we cannot distinguish the effects of these manipulations in our experiments and have updated our manuscript throughout to reflect this.     

      Reviewer #2:

      “The authors state that oncogenic MAPK/AKT pathway activation drives glial-derived tumor formation. It would be important to include a wild-type or uninjected control for the pERK and pAKT staining shown in Fig1 I-K to aid in the interpretation of these results. Likewise, quantification of the pERK and pAKT staining would be useful to demonstrate the increase over WT, and would also serve to facilitate comparison with the similar staining in the KPG model (Supp Fig 2D).”

      We have updated Fig 1 and Supplementary Fig 3D (formerly Fig 2D), to include histology from tumor-free uninjected control animals, as well as quantifications of p-ERK and p-AKT staining to highlight increased MAPK/AKT signaling pathway activation in our tumor model.  

      “The authors use a transplantation assay to further test the tumorigenic potential of dissociated cells from glial-derived tumors. Listing the percentage of transplants that generate fluorescent tumor would be helpful to fully interpret these data. Additionally, it was not clear based on the description in the results section that the transplantation assay was an “experimental surrogate” to model the relapse potential of the tumor cell. This is first mentioned in the discussion. The authors may consider adding a sentence for clarity earlier in the manuscript as it helps the reader better understand the logic of the assay.” 

      We have clarified in the text the percentage of transplants that generated fluorescent tumor (1625%, n=3 independent screens). This is also represented in Fig 5C,D. We also added text when introducing the transplantation assay, explaining that transplantation is frequently used as an experimental surrogate to assess relapse potential, and that our objective was to assess tumor cell propagation in the context of specific manipulations within the TME.  

      “The authors nicely show high levels of immune cell infiltration and associations between microglia/macrophages and tumor cells. However, a quantification of the emergence of macrophages over time in relation to tumor initiation and growth would provide significant support to the observations of tumor suppressive activity of the phagocytes. Along these lines, the inclusion of a statement about when leukocytes emerge during normal development would be informative for those not familiar with the zebrafish model.”

      In zebrafish, microglia colonize the neural retina by 48 hpf, and the optic tectum by 84 hpf (Herbomel et al., 2001), prior to when we typically observe lesions in our p53EPS brains. To validate the emergence of microglia prior to tumor formation in p53EPS, we have now used live confocal imaging through the brains of uninjected control and p53EPS injected zebrafish at 5, 7 and 9 dpf. As expected, microglia were present throughout the cephalic region and in the brain at 5 dpf (120 hpf). At this stage, p53EPS injected zebrafish brains displayed mosaic cellular expression of her4.1:mScarlet; however, cells were sparse and diffuse, and no large intensely fluorescent tumor-like clusters were detected at this stage (n=12/12 tumor negative). At 7 dpf, microglia were observed in the brains of control and p53EPS zebrafish; however, at this stage we detected clusters of her4.1:mScarlet+ cells (n=5/9), indicative of tumor formation. Lesions were found to be surrounded and/or infiltrated by mpeg:_EGFP+ microglia. Finally, at 9 dpf _her4.1:mScarlet+ expression became highly specific to tumor lesions, and these lesions were associated with _mpeg:_EGFP+ microglia/macrophages (n=8/8 of tumor-positive zebrafish). These descriptions along with representative images has been added to Figure 3.

      “From the data provided in Figure 4G and Supp Fig 7b, the authors suggest that “increased p53EPS tumor initiation following Irf gene knock-down is a consequence of irf7 and irf8 loss-of-function in the TME.” Given the importance of the local microenvironment highlighted in this study, spatial information on the form of in situ hybridization to identify the relevant location of the expression change would be important to support this conclusion.”

      We performed fluorescent in situ hybridization (using HCR RNA-FISH, Molecular Instruments) on whole mount control and irf7 CRISPR-injected p53EPG animals (her4.1:EGFRvIII +her4.1:PI3KCAH1047R + her4.1:GFP, GFP was used in this case because of probe availability).

      Representative confocal projections through tumors, as well as single optical sections are presented and discussed in Figure 4, highlighting the location of irf7 expression change following gene knock-down. We found significant irf7 signal in and surrounding p53EPS tumors at early stages of tumor formation_. This expression was reduced and/or lost following _irf7 CRISPR gene targeting, consistent with RT-PCR data (Supplementary Fig 7).          

      “The authors used neutral red staining that labels lysosomal-rich phagocytes to assess enrichment at the early stages of tumor initiation. The images in Figure 3 panel A should be labeled to denote the uninjected controls to aid in the interpretation of the data. In Supplemental Figure 6, the neutral red staining in the irf8 CRISPR-injected larvae looks to be increased, counter to the quantification. Can the authors comment if the image is perhaps not representative?”

      We have updated Figure 3 and Supplementary Figure 6 to aid in the interpretation of our results. In Fig 3A, we used tumor-negative controls from our injected cohorts. This was done to control for exogenous transgene presence and/or over-expression prior to (or in the absence of) malignant transformation. In Supplementary Fig 6, our images are representative, but we have now used unprocessed images with arrowheads to highlight neutral-red positive foci for clarity. In our original manuscript the images contained software generated markers, which could have obscured and/or confused the neutral red staining we were trying the highlight.    

      Recommendations For the Authors:

      Reviewer #1: 

      “The PI 3-kinase does a lot more than just activating mTOR and Akt – I would suggest modifying that sentence in the introduction.”

      We have adjusted text in the introduction to reflect the broad role for PI3K signaling.

      Reviewer #2:

      “In Supplemental Fig 1, it would be helpful for the authors to provide a co-stain, such as DAPI to label all nuclei, which would allow the reader to assess the morphology of the cells in the context of the surrounding tissue.”

      We have included brightfield images in Supplementary Fig 1, that together with her4.1:mScarlet fluorescence, should help readers assess tumor location and morphology in the context of surrounding tissue. Tumor cell morphology at high-resolution can be visualized in Fig 3, Movie 1 and Movie 2.

      “The authors state that oncogenic MAPK/AKT pathway activation drives glial-derived tumor formation. The authors may consider testing if the addition of an inhibitor of MAPK signaling may prevent or decrease the formation of glial-derived tumors in this context to further support their results.” 

      To further assess the role for MAPK activation, we decided to test the effect of 50uM AZD6244 MAPK inhibitor following transplantation of dissociated primary p53EPS cells into syngeneic CG1 strain zebrafish embryos, similar to as previously described (Modzelewska et al., 2016). Following 5 days of drug treatments, we did not detect significant differences in tumor engraftment or in tumor size between DMSO control and AZD6244-treated cohorts, suggesting that MAPK inhibition is not sufficient to prevent p53EPS engraftment and growth in our model. In the future, assessments of on-target drug effects, possible resistance mechanisms, and/or testing MAPK inhibitors in combination with other targeted agents including Akt and/or mTOR inhibitors (Edwards et al., 2006; McNeill et al., 2017; Schreck et al., 2020) will enhance our understanding of potential therapeutic strategies.

      Author response image 2.

      Dorsal views of 8 dpf zebrafish larvae engrafted with her4.1:mScarlet+ p53EPS tumor cells following treatment from 3-8dpf with 0.1% DMSO (control) or 50uM AZD6244. Tumor cell injections were performed at 2 dpf into syngeneic CG1 strain embryos. The percentage of total animals with persisting engraftment following drug treatments, as well as tumor size (microns squared, quantified using Carl Zeiss ZEN software) are shown for control and AZD6244 treated larvae. 

      “Have the authors tested if EGFR and PI3KCA driven by other neural promoters produce similar results, or not? This would help support the specificity of her4.1 neural progenitors and glia as the cell of origin in this model.”

      At this time, we have not tested other neural promoters. However, previous reports describe a zebrafish zic4-driven glioblastoma model with mesenchymal-like gene expression (Mayrhofer et al., 2017), supporting neural progenitors as a cell of origin. In the future it will be interesting to test sox2, nestin, and gfap promoters to further define and support her4.1-expressing neural progenitors and glia as the cell of origin in our model.

      “Other leukocyte populations, such as neutrophils, can also respond to inflammatory cues. Can the authors comment if neutrophils are also observed in the TME?”

      We performed initial assessments of neutrophils in the TME using our expression datasets as well as her4.1:EGFRvIII + her4.1:PI3KCAH1047R co-injection into Tg(mpx:EGFP) strain zebrafish. We observed tumor formation without significant infiltration of mpx:EGFP+ neutrophils. Future investigations will be important to assess differences in the contributions of different myeloidderived lineages in the TME of p53EPS, as well as how heterogeneity may be altered depending on different oncogenic drivers and/or stage of tumor progression, as seen in human glioblastoma (Friedmann-Morvinski and Hambardzumyan, 2023). We have added text in the disscussion section of our manuscript to indicate the possibility of neutrophils and/or other immune cell types contributing to p53EPS tumor biology. 

      Author response image 3.

      Control-injected tumornegative and tumor-positive Tg(mpx:EGFP) zebrafish at 10 dpf. Tg(mpx:EGFP) strain embryos were injected at the one-cell stage with her4.1:EGFRvIII + her4.1:PI3KCAH1047R + her4.1:mScarlet.

      “It is not clear if the transcriptomics data has been deposited in a publicly available database, such as the Gene Expression Omnibus (GEO). Sharing of these data would be a benefit to the field and facilitate use in other studies.”

      We have uploaded all transcriptomic data to GEO under accession GSE246295.

    1. Author response:

      Reviewer #1 (Public Review):

      Summary:

      In this manuscript, the authors investigated the effect of chronic activation of dopamine neurons using chemogenetics. Using Gq-DREADDs, the authors chronically activated midbrain dopamine neurons and observed that these neurons, particularly their axons, exhibit increased vulnerability and degeneration, resembling the pathological symptoms of Parkinson's disease. Baseline calcium levels in midbrain dopamine neurons were also significantly elevated following the chronic activation. Lastly, to identify cellular and circuit-level changes in response to dopaminergic neuronal degeneration caused by chronic activation, the authors employed spatial genomics (Visium) and revealed comprehensive changes in gene expression in the mouse model subjected to chronic activation. In conclusion, this study presents novel data on the consequences of chronic hyperactivation of midbrain dopamine neurons.

      Strengths:

      This study provides direct evidence that the chronic activation of dopamine neurons is toxic and gives rise to neurodegeneration. In addition, the authors achieved the chronic activation of dopamine neurons using water application of clozapine-N-oxide (CNO), a method not commonly employed by researchers. This approach may offer new insights into pathophysiological alterations of dopamine neurons in Parkinson's disease. The authors also utilized state-of-the-art spatial gene expression analysis, which can provide valuable information for other researchers studying dopamine neurons. Although the authors did not elucidate the mechanisms underlying dopaminergic neuronal and axonal death, they presented a substantial number of intriguing ideas in their discussion, which are worth further investigation.

      We thank the reviewer for these positive comments.

      Weaknesses:

      Many claims raised in this paper are only partially supported by the experimental results. So, additional data are necessary to strengthen the claims. The effects of chronic activation of dopamine neurons are intriguing; however, this paper does not go beyond reporting phenomena. It lacks a comprehensive explanation for the degeneration of dopamine neurons and their axons. While the authors proposed possible mechanisms for the degeneration in their discussion, such as differentially expressed genes, these remain experimentally unexplored.

      We thank the reviewer for this review. We do believe that the manuscript has a mechanistic component, as the central experiments involve direct manipulation of neuronal activity, and we show an increase in calcium levels and gene expression changes in dopamine neurons that coincide with the degeneration. However, we agree that deeper mechanistic investigation would strengthen the conclusions of the paper. We have planned several important revisions, including the addition of CNO behavioral controls, manipulation of intracellular calcium using isradipine, additional transcriptomics experiments and further validation of findings. We anticipate that these additions will significantly bolster the conclusions of the paper.

      Reviewer #2 (Public Review):

      Summary:

      Rademacher et al. present a paper showing that chronic chemogenetic excitation of dopaminergic neurons in the mouse midbrain results in differential degeneration of axons and somas across distinct regions (SNc vs VTA). These findings are important. This mouse model also has the advantage of showing a axon-first degeneration over an experimentally-useful time course (2-4 weeks). 2. The findings that direct excitation of dopaminergic neurons causes differential degeneration sheds light on the mechanisms of dopaminergic neuron selective vulnerability. The evidence that activation of dopaminergic neurons causes degeneration and alters mRNA expression is convincing, as the authors use both vehicle and CNO control groups, but the evidence that chronic dopaminergic activation alters circadian rhythm and motor behavior is incomplete as the authors did not run a CNO-control condition in these experiments.

      Strengths:

      This is an exciting and important paper.

      The paper compares mouse transcriptomics with human patient data.

      It shows that selective degeneration can occur across the midbrain dopaminergic neurons even in the absence of a genetic, prion, or toxin neurodegeneration mechanism.

      We thank the reviewer for these insightful comments.

      Weaknesses:

      Major concerns:

      (1) The lack of a CNO-positive, DREADD-negative control group in the behavioral experiments is the main limitation in interpreting the behavioral data. Without knowing whether CNO on its own has an impact on circadian rhythm or motor activity, the certainty that dopaminergic hyperactivity is causing these effects is lacking.

      This is an important point. Although we show that CNO does not produce degeneration of DA neuron terminals, we do not exclude a contribution to the behavioral changes. We agree that this behavioral control is necessary, and will address it in revision with a CNO-only running wheel cohort.

      (2) One of the most exciting things about this paper is that the SNc degenerates more strongly than the VTA when both regions are, in theory, excited to the same extent. However, it is not perfectly clear that both regions respond to CNO to the same extent. The electrophysiological data showing CNO responsiveness is only conducted in the SNc. If the VTA response is significantly reduced vs the SNc response, then the selectivity of the SNc degeneration could just be because the SNc was more hyperactive than the VTA. Electrophysiology experiments comparing the VTA and SNc response to CNO could support the idea that the SNc has substantial intrinsic vulnerability factors compared to the VTA.

      We agree that additional electrophysiology conducted in the VTA dopamine neurons would meaningfully add to our understanding of the selective vulnerability in this model, and will complete these experiments in revision.

      (3) The mice have access to a running wheel for the circadian rhythm experiments. Running has been shown to alter the dopaminergic system (Bastioli et al., 2022) and so the authors should clarify whether the histology, electrophysiology, fiber photometry, and transcriptomics data are conducted on mice that have been running or sedentary.

      We will explicitly clarify which mice had access to a running wheel in our revision. Briefly, mice for histology, electrophysiology, and transcriptomics all had access to a running wheel during their treatment. The mice used for photometry underwent about 7 days of running wheel access approximately 3 weeks prior to the beginning of the experiment. The photometry headcaps sterically prevented mice from having access to a running wheel in their home cage.

      Reviewer #3 (Public Review):

      Summary:

      In this manuscript, Rademacher and colleagues examined the effect on the integrity of the dopamine system in mice of chronically stimulating dopamine neurons using a chemogenetic approach. They find that one to two weeks of constant exposure to the chemogenetic activator CNO leads to a decrease in the density of tyrosine hydroxylase staining in striatal brain sections and to a small reduction of the global population of tyrosine hydroxylase positive neurons in the ventral midbrain. They also report alterations in gene expression in both regions using a spatial transcriptomics approach. Globally, the work is well done and valuable and some of the conclusions are interesting. However, the conceptual advance is perhaps a bit limited in the sense that there is extensive previous work in the literature showing that excessive depolarization of multiple types of neurons associated with intracellular calcium elevations promotes neuronal degeneration. The present work adds to this by showing evidence of a similar phenomenon in dopamine neurons.

      We thank the reviewer for the careful and thoughtful review of our manuscript.

      While extensive depolarization and associated intracellular calcium elevations promotes degeneration generally, we emphasize that the process we describe is novel. Indeed, prior studies delivering chronic DREADDs to vulnerable neurons in models of Alzheimer’s disease did not report an increase in neurodegeneration, despite seeing changes in protein aggregation (e.g. Yuan and Grutzendler, J Neurosci 2016, PMID: 26758850; Hussaini et al., PLOS Bio 2020, PMID: 32822389). Further, a critical finding from our study is that in our paradigm, this stressor does not impact all dopamine neurons equally, as the SNc DA neurons are more vulnerable than the VTA, mirroring selective vulnerability characteristic of Parkinson’s disease. This is consistent with a large body of literature that SNc dopamine neurons are less capable of handling large energetic and calcium loads compared to neighboring VTA neurons, and the finding that chronically altered activity is sufficient to drive this preferential loss is novel.

      In addition, we are not aware of prior studies that have chronically activated DREADDs to produce neurodegeneration. Other studies have shown that acute excitotoxic stressors can produce neuronal degeneration, but the chronic increase in activity is central to our approach.

      In terms of the mechanisms explaining the neuronal loss observed after 2 to 4 weeks of chemogenetic activation, it would be important to consider that dopamine neurons are known from a lot of previous literature to undergo a decrease in firing through a depolarization-block mechanism when chronically depolarized. Is it possible that such a phenomenon explains much of the results observed in the present study? It would be important to consider this in the manuscript.

      As discussed in greater detail in the results section below, our data suggests this may not be a prominent feature in our model. However, we cannot rule out a contribution of depolarization block, and will expand on the discussion of this possibility in the revised manuscript.

      The relevance to Parkinson's disease (PD) is also not totally clear because there is not a lot of previous solid evidence showing that the firing of dopamine neurons is increased in PD, either in human subjects or in mouse models of the disease. As such, it is not clear if the present work is really modelling something that could happen in PD in humans.

      We completely agree that evidence of increased dopamine neuron activity from human PD patients is lacking and the existing data are difficult to interpret without human controls. However, as we outline in the manuscript, multiple lines of evidence suggest that the activity level of dopamine neurons almost certainly does change in PD. Therefore, it is very important that we understand how changes in the level of neural activity influence the degeneration of DA neurons. In this paper we examine the impact of increased activity. Increased activity may be compensatory after initial dopamine neuron loss, or may be an initial driver of death (Rademacher & Nakamura, Exp Neurol 2024, PMID: 38092187). Beyond what is already discussed in the manuscript, additional support for increased activity in PD models include:

      - Elevated firing rates in asymptomatic MitoPark mice (Good et al., FASEB J 2011, PMID: 21233488)

      - Increased frequency of spontaneous firing in patient-derived iPSC dopamine neurons and primary mouse dopamine neurons that overexpress synuclein (Lin et al., Acta Neuropath Comm 2021, PMID: 34099060)

      - Increased spontaneous firing in dopamine neurons of rats injected with synuclein preformed fibrils compared to sham (Tozzi et al., Brain 2021, PMID: 34297092)

      We will include and further discuss these important examples in our revision.

      Similarly, in future studies, it will also be important to study the impact of decreasing DA neuron activity. There will be additional levels of complexity to accurately model changes in PD, which may differ between subtypes of the disease, the disease stage, and the subtype of dopamine neuron. Our study models the possibility of chronically increased pacemaking, and interpretation of our results will be informed as we learn more about how the activity of DA neurons changes in humans in PD. We will discuss and elaborate on these important points in the revision.

      Comments on the introduction:

      The introduction cites a 1990 paper from the lab of Anthony Grace as support of the fact that DA neurons increase their firing rate in PD models. However, in this 1990 paper, the authors stated that: "With respect to DA cell activity, depletions of up to 96% of striatal DA did not result in substantial alterations in the proportion of DA neurons active, their mean firing rate, or their firing pattern. Increases in these parameters only occurred when striatal DA depletions exceeded 96%." Such results argue that an increase in firing rate is most likely to be a consequence of the almost complete loss of dopamine neurons rather than an initial driver of neuronal loss. The present introduction would thus benefit from being revised to clarify the overriding hypothesis and rationale in relation to PD and better represent the findings of the paper by Hollerman and Grace.

      We agree that the findings of Hollerman and Grace support compensatory changes in dopamine neuron activity in response to loss of dopamine neurons, rather than informing whether dopamine neuron loss can also be an initial driver of activity. We will clarify this point in our revision. In addition, the results of other studies on this point are mixed: a 50% reduction in dopamine neurons didn’t alter firing rate or bursting (Harden and Grace, J Neurosci 1995, PMID: 7666198; Bilbao et al, Brain Res 2006, PMID: 16574080), while a 40% loss was found to increase firing rate and bursting (Chen et al, Brain Res 2009. PMID: 19545547) and larger reductions alter burst firing (Hollerman & Grace, Brain Res 1990, PMID: 2126975; Stachowiak et al, J Neurosci 1987, PMID: 3110381). Importantly, even if compensatory, such late-stage increases in dopamine neuron activity may contribute to disease progression and drive a vicious cycle of degeneration in surviving neurons. In addition, we also don’t know how the threshold of dopamine neuron loss and altered activity may differ between mice and humans, and PD patients do not present with clinical symptoms until ~30-60% of nigral neurons are lost (Burke & O’Malley, Exp Neurol 2013, PMID: 22285449; Shulman et al, Annu Rev Pathol 2011, PMID: 21034221).

      Other lines of evidence support the potential role of hyperactivity in disease initiation, including increased activity before dopamine neuron loss in MitoPark mice (Good et al., FASEB J 2011, PMID: 21233488), increased spontaneous firing in patient-derived iPSC dopamine neurons (Lin et al., Acta Neuropath Comm 2021, PMID: 34099060), and increased activity observed in genetic models of PD (Bishop et al., J Neurophysiol 2010, PMID: 20926611; Regoni et al., Cell Death Dis 2020,  PMID: 33173027).

      It would be good that the introduction refers to some of the literature on the links between excessive neuronal activity, calcium, and neurodegeneration. There is a large literature on this and referring to it would help frame the work and its novelty in a broader context.

      We agree that a discussion of hyperactivity, calcium, and neurodegeneration would benefit the introduction. While we briefly discuss calcium and neurodegeneration in the discussion, we will expand on this literature in both the introduction and discussion sections. We will carefully review and contextualize our work within existing frameworks of calcium and neurodegeneration (e.g. Surmeier & Schumacker, J Biol Chem 2013, PMID: 23086948; Verma et al., Transl Neurodegener 2022, PMID: 35078537). We believe that the novelty of our study lies in 1) a chronic chemogenetic activation paradigm via drinking water, 2) demonstrating selective vulnerability of dopamine neurons as a result of altering their activity/excitability alone, and 3) comparing mouse and human spatial transcriptomics.

      Comments on the results section:

      The running wheel results of Figure 1 suggest that the CNO treatment caused a brief increase in running on the first day after which there was a strong decrease during the subsequent days in the active phase. This observation is also in line with the appearance of a depolarization block.

      The authors examined many basic electrophysiological parameters of recorded dopamine neurons in acute brain slices. However, it is surprising that they did not report the resting membrane potential, or the input resistance. It would be important that this be added because these two parameters provide key information on the basal excitability of the recorded neurons. They would also allow us to obtain insight into the possibility that the neurons are chronically depolarized and thus in depolarization block.

      We do report the input resistance in Supplemental Figure 1C, which was unchanged in CNO-treated animals compared to controls. We did not report the resting membrane potential because many of the DA neurons were spontaneously firing. However, we will report the initial membrane potential on first breaking into the cell for the whole cell recordings in the revision, which did not vary between groups. This is still influenced by action potential activity, but is the timepoint in the recording least impacted by dialyzing of the neuron by the internal solution. We observed increased spontaneous action potential activity ex vivo in slices from CNO-treated mice (Figure 1D), thus at least under these conditions these dopamine neurons are not in depolarization block. We also did not see strong evidence of changes in other intrinsic properties of the neurons with whole cell recordings (e.g. Figure S1C). Overall, our electrophysiology experiments are not consistent with the depolarization block model, at least not due to changes in the intrinsic properties of the neurons. Although our ex vivo findings cannot exclude a contribution of depolarization block in vivo, we do show that CNO-treated mice removed from their cages for open field testing continue to have a strong trend for increased activity for approximately 10 days (S1E).  This finding is also consistent with increased activity of the DA neurons. We will add discussion of these important considerations in the revision.

      It is great that the authors quantified not only TH levels but also the levels of mCherry, co-expressed with the chemogenetic receptor. This could in principle help to distinguish between TH downregulation and true loss of dopamine neuron cell bodies. However, the approach used here has a major caveat in that the number of mCherry-positive dopamine neurons depends on the proportion of dopamine neurons that were infected and expressed the DREADD and this could very well vary between different mice. It is very unlikely that the virus injection allowed to infect 100% of the neurons in the VTA and SNc. This could for example explain in part the mismatch between the number of VTA dopamine neurons counted in panel 2G when comparing TH and mCherry counts. Also, I see that the mCherry counts were not provided at the 2-week time point. If the mCherry had been expressed genetically by crossing the DAT-Cre mice with a floxed fluorescent reported mice, the interpretation would have been simpler. In this context, I am not convinced of the benefit of the mCherry quantifications. The authors should consider either removing these results from the final manuscript or discussing this important limitation.

      We thank the reviewer for this insightful comment, and we agree that this is a caveat of our mCherry quantification. Quantitation of the number of mCherry+ DA neurons specifically informs the impact on transduced DA neurons, and mCherry appears to be less susceptible to downregulation versus TH. As the reviewer points out, it carries the caveat that there is some variability between injections. Nonetheless, we believe that it conveys useful complementary data. As suggested, we will discuss this caveat in our revision. Note that mCherry was not quantified at the two-week timepoint because there is no loss of TH+ cells at that time.

      Although the authors conclude that there is a global decrease in the number of dopamine neurons after 4 weeks of CNO treatment, the post-hoc tests failed to confirm that the decrease in dopamine number was significant in the SNc, the region most relevant to Parkinson's. This could be due to the fact that only a small number of mice were tested. A "n" of just 4 or 5 mice is very small for a stereological counting experiment. As such, this experiment was clearly underpowered at the statistical level. Also, the choice of the image used to illustrate this in panel 2G should be reconsidered: the image suggests that a very large loss of dopamine neurons occurred in the SNc and this is not what the numbers show. A more representative image should be used.

      We agree that the stereology experiments were performed on relatively small numbers of animals. Combined with the small effect size, this may have contributed to the post-hoc tests showing a trend of p=0.1 for both the TH and mCherry dopamine cell counts in the SN at 4 weeks. As part of the planned experiments for our revision, we will perform an additional stereologic analysis to further assess the loss of SNc dopamine neurons. We will also review and ensure the images are representative.

      In Figure 3, the authors attempt to compare intracellular calcium levels in dopamine neurons using GCaMP6 fluorescence. Because this calcium indicator is not quantitative (unlike ratiometric sensors such as Fura2), it is usually used to quantify relative changes in intracellular calcium. The present use of this probe to compare absolute values is unusual and the validity of this approach is unclear. This limitation needs to be discussed. The authors also need to refer in the text to the difference between panels D and E of this figure. It is surprising that the fluctuations in calcium levels were not quantified. I guess the hypothesis was that there should be more or larger fluctuations in the mice treated with CNO if the CNO treatment led to increased firing. This needs to be clarified.

      We thank the reviewer for this comment. We understand that this method of comparing absolute values is unconventional. However, these animals were tested concurrently on the same system, and a clear effect on the absolute baseline was observed. We will include a caveat of this in our discussion. Panel D of this figure shows the raw, uncorrected photometry traces, whereas panel E shows the isosbestic corrected traces for the same recording. In panel E, the traces follow time in ascending order. We will also include frequency and amplitude data for these recordings.   

      Although the spatial transcriptomic results are intriguing and certainly a great way to start thinking about how the CNO treatment could lead to the loss of dopamine neurons, the presented results, the focusing of some broad classes of differentially expressed genes and on some specific examples, do not really suggest any clear mechanism of neurodegeneration. It would perhaps be useful for the authors to use the obtained data to validate that a state of chronic depolarization was indeed induced by the chronic CNO treatment. Were genes classically linked to increased activity like cfos or bdnf elevated in the SNc or VTA dopamine neurons? In the striatum, the authors report that the levels of DARP32, a gene whose levels are linked to dopamine levels, are unchanged. Does this mean that there were no major changes in dopamine levels in the striatum of these mice?

      We will review the expression of activity-related genes in our dataset, although we must keep in mind that these genes may behave differently in the context of chronic activation as opposed to acutely increased activity. We will also include experiments assessing striatal dopamine levels by HPLC in the revision.

      The usefulness of comparing the transcriptome of human PD SNc or VTA sections to that of the present mouse model should be better explained. In the human tissues, the transcriptome reflects the state of the tissue many years after extensive loss of dopamine neurons. It is expected that there will be few if any SNc neurons left in such sections. In comparison, the mice after 7 days of CNO treatment do not appear to have lost any dopamine neurons. As such, how can the two extremely different conditions be reasonably compared?

      Our mouse model and human PD progress over distinct timescales, as is the case with essentially all mouse models of neurodegenerative diseases. Nonetheless, in our view there is still great value in comparing gene expression changes in mouse models with those in human disease. It seems very likely that the same pathologic processes that drive degeneration early in the disease continue to drive degeneration later in the disease. Note that we have tried to address the discrepancy in time scales in part by comparing to early PD samples when there is more limited SNc DA neuron loss. Please note the numbers of DA neurons within the areas we have selected for sampling (Figure at right). Therefore, we can indeed use spatial transcriptomics to compare dopamine neurons from mice with initial degeneration and patients where degeneration is ongoing during their disease.

      Author response image 1.

      Violin plot of DA neuron proportions sampled within the vulnerable SNV (deconvoluted RCTD method used in unmasked tissue sections of the SNV). Control and early PD subjects.

      Comments on the discussion:

      In the discussion, the authors state that their calcium photometry results support a central role of calcium in activity-induced neurodegeneration. This conclusion, although plausible because of the very broad pre-existing literature linking calcium elevation (such as in excitotoxicity) to neuronal loss, should be toned down a bit as no causal relationship was established in the experiments that were carried out in the present study.

      Our model utilizes hM3Dq-DREADDs that function by increasing intracellular calcium to increase neuronal excitability, and our results show increased Ca2+ by fiber photometry and changes to Ca2+-related genes, strongly suggesting a causal relation and crucial role of calcium in the mechanism of degeneration. However, we agree that we have not experimentally proven this point, as we acknowledged in the text. Additionally, we have planned revision experiments involving chronic isradipine treatment to further test the role of calcium in the mechanism of degeneration in this model.

      In the discussion, the authors discuss some of the parallel changes in gene expression detected in the mouse model and in the human tissues. Because few if any dopamine neurons are expected to remain in the SNc of the human tissues used, this sort of comparison has important conceptual limitations and these need to be clearly addressed.

      As discussed, we can sample SN DA neurons in early PD (see figure above), and in our view there is great value for such comparisons. We agree that discussion of appropriate caveats is warranted and this will be clearly addressed in the revision.

      A major limitation of the present discussion is that it does not discuss the possibility that the observed phenotypes are caused by the induction of a chronic state of depolarization block by the chronic CNO treatment. I encourage the authors to consider and discuss this hypothesis.

      As discussed above, our analyses of DA neuron firing in slices and open field testing to date do not support a prominent contribution of depolarization block with chronic CNO treatment. However, we cannot rule out this hypothesis, therefore we will include additional electrophysiology experiments and add discussion of this important consideration.  

      Also, the authors need to discuss the fact that previous work was only able to detect an increase in the firing rate of dopamine neurons after more than 95% loss of dopamine neurons. As such, the authors need to clearly discuss the relevance of the present model to PD. Are changes in firing rate a driver of neuronal loss in PD, as the authors try to make the case here, or are such changes only a secondary consequence of extensive neuronal loss (for example because a major loss of dopamine would lead to reduced D2 autoreceptor activation in the remaining neurons, and to reduced autoreceptor-mediated negative feedback on firing). This needs to be discussed.

      As discussed above, while increases in dopamine neuron activity may be compensatory after loss of neurons, the precise percentage required to induce such compensatory changes is not defined in mice and varies between paradigms, and the threshold level is not known in humans. We also reiterate that a compensatory increase in activity could still promote the degeneration of critical surviving DA neurons, whose loss underlies the substantial decline in motor function that typically occurs over the course of PD. Moreover, there are also multiple lines of evidence to suggest that changes in activity can initiate and drive dopamine neuron degeneration (Rademacher & Nakamura, Exp Neurol 2024). For example, overexpression of synuclein can increase firing in cultured dopamine neurons (Dagra et al., NPJ Parkinsons Dis 2021, PMID: 34408150) while mice expressing mutant Parkin have higher mean firing rates (Regoni et al., Cell Death Dis 2020,  PMID: 33173027). Similarly, an increased firing rate has been reported in the MitoPark mouse model of PD at a time preceding DA neuron degeneration (Good et al., FASEB J 2011, PMID: 21233488). We also acknowledge that alterations to dopamine neuron activity are likely complex in PD, and that dopamine neuron health and function can be impacted not just by simple increases in activity, but also by changes in activity patterns and regularity. We will amend our discussion to include the important caveat of changes in activity occurring as compensation, as well as further evidence of changes in activity preceding dopamine neuron death.

      There is a very large, multi-decade literature on calcium elevation and its effects on neuronal loss in many different types of neurons. The authors should discuss their findings in this context and refer to some of this previous work. In a nutshell, the observations of the present manuscript could be summarized by stating that the chronic membrane depolarization induced by the CNO treatment is likely to induce a chronic elevation of intracellular calcium and this is then likely to activate some of the well-known calcium-dependent cell death mechanisms. Whether such cell death is linked in any way to PD is not really demonstrated by the present results. The authors are encouraged to perform a thorough revision of the discussion to address all of these issues, discuss the major limitations of the present model, and refer to the broad pre-existing literature linking membrane depolarization, calcium, and neuronal loss in many neuronal cell types.

      While our model demonstrates classic excitotoxic cell death pathways, we would like to emphasize both the chronic nature of our manipulation and the progressive changes observed, with increasing degeneration seen at 1, 2, and 4 weeks of hyperactivity in an axon-first manner. This is a unique aspect of our study, in contrast to much of the previous literature which has focused on shorter timescales. Thus, while we will revise the discussion to more comprehensively acknowledge previous studies of calcium-dependent neuron cell death, we believe we have made several new contributions that are not predicted by existing literature. We have shown that this chronic manipulation is specifically toxic to nigral dopamine neurons, and the data that VTA dopamine neurons continue to be resilient even at 4 weeks is interesting and disease-relevant. We therefore do not want to use findings from other neuron types to draw assumptions about DA neurons, which are a unique and very diverse population. We acknowledge that as with all preclinical models of PD, we cannot draw definitive conclusions about PD with this data. However, we reiterate that we strongly believe that drawing connections to human disease is important, as dopamine neuron activity is very likely altered in PD and a clearer understanding of how dopamine neuron survival is impacted by activity will provide insight into the mechanisms of PD.

    1. Author response:

      The following is the authors’ response to the original reviews.

      Public Reviews:

      Reviewer #1 (Public Review):

      Summary:

      In this study, the authors engineer the endogenous left boundary of the Drosophila eve TAD, replacing the endogenous Nhomie boundary by either a neutral DNA, a wildtype Nhomie boundary, an inverted Nhomie boundary, or a second copy of the Homie boundary. They perform Micro-C on young embryos and conclude that endogenous Nhomie and Homie boundaries flanking eve pair with head-to-tail directionality to form a chromosomal stem loop. Abrogating the Nhomie boundary leads to ectopic activation of genes in the former neighboring TAD by eve embryonic stripe enhancers. Replacing Nhomie by an inverted version or by Homie (which pairs with itself head-to-head) transformed the stem loop into a circle loop. An important finding was that stem and circle loops differentially impact endogenous gene regulation both within the eve TAD and in the TADs bracketing eve. Intriguingly, an eve TAD with a circle loop configuration leads to ectopic activation of flanking genes by eve enhancers - indicating compromised regulatory boundary activity despite the presence of an eve TAD with intact left and right boundaries.

      Strengths:

      Overall, the results obtained are of high-quality and are meticulously discussed. This work advances our fundamental understanding of how 3D genome topologies affect enhancer-promoter communication.

      Weaknesses:

      Though convincingly demonstrated at eve, the generalizability of TAD formation by directional boundary pairing remains unclear, though the authors propose this mechanism could underly the formation of all TADs in Drosophila and possibly even in mammals. Strong and ample evidence has been obtained to date that cohesin-mediated chromosomal loop extrusion explains the formation of a large fraction of TADs in mammals. 

      (1.1) The difficultly with most all of the studies on mammal TADs, cohesin and CTCF roadblocks is that the sequencing depth is not sufficient, and large bin sizes (>1 kb) are needed to visualize chromosome architecture.  The resulting contact profiles show TAD neighborhoods, not actual TADs.

      The problem with these studies is illustrated by comparing the contact profiles of mammalian MicroC data sets at different bin sizes in Author response image 1.  In this figure, the darkness of the “pixels” in panels E, F, G and H was enhanced by reducing brightness in photoshop.

      Author response image 1.

      Mammalian MicroC profiles different bun sizes

      Panels A and C show “TADs” using bin sizes typical of most mammalian studies (see Krietenstein et al. (2023) (Krietenstein et al. 2020)).  At this level of resolution, TADs, the “trees” that are the building blocks of chromosomes, are not visible.  Instead, what is seen are TAD neighborhoods or “forests”.  Each neighborhood consists of several dozen individual TADs.  The large bins in these panels also artificially accentuated TAD:TAD interactions, generating a series of “stripes” and “dots” that correspond to TADs bumping into each other and sequences getting crosslinked.  For example, in panel A there is prominent stripe on the edge of a “TAD” (blue arrow).  In panel C, this stripe resolves into a series of dots arranged as parallel, but interrupted “stripes” (green and blue arrows).  At the next level of resolution, it can be seen that the stripe marked by the blue arrow and magenta asterisk is generated by contacts between the left boundary of the TAD indicated by the magenta bar with sequences in a TAD (blue bar) ~180 kb way.  While dots and stripes are prominent features in contact profiles visualized with larger bin sizes (A and C), the actual TADs that are observed with a bin size of 200 bp (examples are underlined by black bars in panel G) are not bordered by stripes, nor are they topped by obvious dots.  The one possible exception is the dot that appears at the top of the volcano triangle underlined with magenta.

      The chromosome 1 DNA segment from the MicroC data of Hseih et al. (2023) (Hsieh et al. 2020) shows a putative volcano triangle with a plume (indicated by a V in Author response image 1 panels D, F and H).  Sequences in the V TAD don’t crosslink with their immediate neighbors, and this gives a “plume” above the volcano triangle, as indicate by the light blue asterisk in panels D, F and H.  Interestingly the V TAD does contact two distant TADs, U on the left and W on the right. The U TAD is ~550 kb from V, and the region of contact is indicated by the black arrow.  The W TAD is ~585 kb from V, and the region of contact is indicated by the magenta arrow.  While the plume still seems to be visible with a bin size of 400 bp (light blue asterisk), it is hard to discern when the bin size is 200 bp, as there are not enough reads.

      The evidence demonstrating that cohesin is required for TAD formation/maintenance is based on low resolution Hi-C data, and the effects that are observed are on TAD neighborhoods (forests) and not TADs (trees).  In fact, there is published evidence that cohesin is not required in mammals for TAD formation/maintenance.  In an experiment from Goel et al. 2023 the authors depleted the cohesin component Rad21 and then visualized the effects on TAD organization using the high resolution region capture MicroC (RCMC) protocol.  The MicroC contact map in this figure visualizes a ~250 kb DNA segment around the Ppm1pg locus at 250 bp resolution.  On the right side of the diagonal is the untreated control, while the left side shows the MicroC profile of the same region after Rad21 depletion.  The authors indicated that there was a 97% depletion of Rad21 in their experiment.  However, as is evident from a comparison of the experimental and control, loss of Rad21 has no apparent effect on the TAD organization of this mammalian DNA segment.

      Several other features are worth noting.  First, unlike the MicroC experiments shown in Author response image 1, there are dots at the apex of the TADs in this chromosomal segment.  In the MicroC protocol, fixed chromatin is digested to mononucleosomes by extensive MNase digestion.  The resulting DNA fragments are then ligated, and dinucleosome-length fragments are isolated and sequenced. 

      DNA sequences that are nucleosome free in chromatin (which would be promoters, enhancers, silencers and boundary elements) are typically digested to oligonucleotides in this procedure and won’t be recovered. This means that the dots shown here must correspond to mononucleosome-length elements that are MNase resistant.  This is also true for the dots in the MicroC contact profiles of the Drosophila Abd-B regulatory domain (see Fig. 2B in the paper).  Second, the TADs are connected to each other by 45o stripes (see blue and green arrowheads).  While it is not clear from this experiment whether the stipes are generated by an active mechanism (enzyme) or by some “passive” mechanism (e.g., sliding), the stripes in this chromosomal segment are not generated by cohesin, as they are unperturbed by Rad21 depletion.  Third, there are no volcano triangles with plumes in this chromosomal DNA segment.  Instead, the contact patterns (purple and green asterisks) between neighboring TADs closely resemble those seen for the Abd-B regulatory domains (compare Goel et al. 2023 with Fig. 2B in the paper).  This similarity suggests that the TADs in and around Ppm1g may be circle-loops, not stem-loops.  As volcano triangles with plumes also seem to be rare in the MicroC data sets of Krietenstein et al. (Krietenstein et al. 2020) and Hesih et al. (Hsieh et al. 2020) (with the caveat that these data sets are low resolution: see Author response image 1), it is possible that much of the mammalian genome is assembled into circle-loop TADs, a topology that can’t be generated by the cohesin loop extrusion (bolo tie clip) /CTCF roadblock model.

      While Rad21 depletion has no apparent effect on TADs, it does appear to impact TAD neighborhoods.  This is in a supplemental figure in Goel et al. (Goel et al. 2023).  In this figure, TADs in the Ppm1g region of chromosome 5 are visualized with bin sizes of 5 kb and 1 kb.  A 1.2 Mb DNA segment is shown for the 5 kb bin size, while an 800 kb DNA segment is shown for the 1 kb bin size.  As can be seen from comparing the MicroC profiles in Author response image 2 with that in Goel et al. 2023, individual TADs are not visible.  Instead, the individual TADs are binned into large TAD “neighborhoods” that consist of several dozen or more TADs.

      Unlike the individual TADs shown in Goel et al. 2023, the TAD neighborhoods in Author response image 2 are sensitive to Rad21 depletion.  The effects of Rad21 depletion can be seen by comparing the relative pixel density inside the blue lines before (above the diagonal) and after (below the diagonal) auxin-induced Rad21 degradation.  The reduction in pixel density is greatest for more distant TAD:TAD contacts (farthest from the diagonal).  By contrast, the TADs themselves are unaffected (Goel et al. 2023), as are contacts between individual TADs and their immediate neighbors.  In addition, contacts between partially overlapping TAD neighborhoods are also lost.  At this point it isn’t clear why contacts between distant TADs in the same neighborhood are lost when Rad21 is depleted; however, a plausible speculation is that it is related to the functioning of cohesin in holding newly replicated DNAs together until mitosis and whatever other role it might have in chromosome condensation.

      Author response image 2.

      Ppm1g full locus chr5

      Moreover, given the unique specificity with which Nhomie and Homie are known to pair (and exhibit "homing" activity), it is conceivable that formation of the eve TAD by boundary pairing represents a phenomenon observed at exceptional loci rather than a universal rule of TAD formation. Indeed, characteristic Micro-C features of the eve TAD are only observed at a restricted number of loci in the fly genome…..

      (1.2) The available evidence does not support the claim that nhomie and homie are “exceptional.”  To begin with, nhomie and homie rely on precisely the same set of factors that have been implicated in the functioning of other boundaries in the fly genome.  For example, homie requires (among other factors) the generic boundary protein Su(Hw) for insulation and long-distance interactions (Fujioka et al. 2024).  (This is also true of nhomie: unpublished data.)  The Su(Hw) protein (like other fly polydactyl zinc finger proteins) can engage in distant interactions.  This was first shown by Sigrist and Pirrotta (Sigrist and Pirrotta 1997), who found that the su(Hw) element from the gypsy transposon can mediate long-distance regulatory interactions (PRE dependent silencing) between transgenes inserted at different sites on homologous chromosomes (trans interactions) and at sites on different chromosomes.

      The ability to mediate long-distance interactions is not unique to the su(Hw) element, or homie and nhomie.  Muller et al. (Muller et al. 1999) found that the Mcp boundary from the Drosophila BX-C is also able to engage in long-distance regulatory interactions—both PRE-dependent silencing of mini-white and enhancer activation of mini-white and yellow.  The functioning of the Mcp boundary depends upon two other generic insulator proteins, Pita and the fly CTCF homolog (Kyrchanova et al. 2017).  Like Su(Hw) both are polydactyl zinc finger proteins, and they resemble the mammalian CTCF protein in that their N-terminal domain mediates multimerization (Bonchuk et al. 2020; Zolotarev et al. 2016).  Figure 6 from Muller et el. 1999 shows PRE-dependent “pairing sensitive silencing” interactions between transgenes carrying a mini-white reporter, the Mcp and scs’ (Beaf dependent)(Hart et al. 1997) boundary elements, and a PRE closely linked to Mcp.  In this experiment flies homozygous for different transgene inserts were mated and the eye color was examined in their transheterozygous progeny.  As indicated in the figure, the strongest trans-silencing interactions were observed for inserts on the same chromosomal arm; however, transgenes inserted on the left arm of chromosome 3 can interact across the centromere with transgenes inserted on the right arm of chromosome 3. 

      Figure 5C (left) from Muller et el. 1999 shows a trans-silencing interaction between w#11.102 at 84D and w#11.16 approximately 5.8 Mb away, at 87D.  Figure 5C (right) shows a trans-silencing interaction across the centromere between w#14.29 on the left arm of chromosome 3 at 78F and w#11.102 on the right arm of chromosome 3 at 84D. The eye color phenotype of mini-white-containing transgenes is usually additive: homozygyous inserts have twice as dark eye color as the corresponding hemizygous inserts.  Likewise, in flies trans-_heterozygous for _mini-white transgenes inserted at different sites, the eye color is equivalent to the sum of the two transgenes.  This is not true when mini-white transgenes are silenced by PREs.  In the combination shown in panel A, the t_rans-_heterozygous fly has a lighter eye color than either of the parents.  In the combination in panel B, the _trans-_heterozygous fly is slightly lighter than either parent.

      As evident from the diagram in Figure 6 from Muller et el. 1999, all of the transgenes inserted on the 3rd chromosome that were tested were able to participate in long distance (>Mbs) regulatory interactions.  On the other hand, not all possible pairwise interactions are observed.  This would suggest that potential interactions depend upon the large scale (Mb) 3D folding of the 3rd chromosome.

      When the scs boundary (Zw5 dependent) (Gaszner et al. 1999) was added to the transgene to give sMws’, it further enhanced the ability of distant transgenes to find each other and pair.  All eight of the sMws’ inserts that were tested were able to interact with at least one other sMws’ insert on a different chromosome and silence mini-white.  Vazquez et al. () subsequently tagged the sMws’ transgene with LacO sequences (ps0Mws’) and visualized pairing interactions in imaginal discs.  Trans-heterozygous combinations on the same chromosome were found paired in 94-99% of the disc nuclei, while a trans-heterozygous combination on different chromosomes was found paired in 96% of the nuclei (Table 3 from Vazquez et al. 2006).  Vazquez et al. also examined a combination of four transgenes inserted on the same chromosome (two at the same insertion site, and two at different insertion sites).  In this case, all four transgenes were clustered together in 94% of the nuclei (Table 3 from Vazquez et al. 2006).  Their studies also suggest that the distant transgenes remain paired for at least several hours.  A similar experiment was done by Li et al. (Li et al. 2011), except that the transgene contained only a single boundary, Mcp or Fab-7.  While pairing was still observed in trans-heterozygotes, the frequency was reduced without scs and scs’.

      It is worth pointing out that there is no plausible mechanism in which cohesin could extrude a loop through hundreds of intervening TADs, across the centromere (ff#13.101_ßà_w#11.102: Figure 6 from Muller et el. 1999; w#14.29_ßà_w#11.02: Figure 6 from Muller et el. 1999 and 5) and come to a halt when it “encounters” Mcp containing transgenes on different homologs.  The same is true for Mcp-dependent pairing interactions in cis (Fig. 7 in Muller et al. (Muller et al. 1999)) or Mcp-dependent pairing interactions between transgenes inserted on different chromosomes (Fig. 8 in Muller et al. (Muller et al. 1999); Line 8 in Table 3 from Vazquez et al. 2006). 

      These are not the only boundaries that can engage in long-distance pairing.  Mohana et al. (Mohana et al. 2023) identified nearly 60 meta-loops, many of which appear to be formed by the pairing of TAD boundary elements.  Two examples (at 200 bp resolution from 12-16 hr embryos) are shown in Author response image 3.

      Author response image 3.

      Metaloops on the 2nd and 3rd chromosomes: circle-loops and multiple stem-loops

      One of these meta-loops (panel A) is generated by the pairing of two TAD boundaries on the 2nd chromosome.  The first boundary, blue, (indicated by blue arrow) is located at ~2,006, 500 bp between a small TAD containing the Nplp4 and CG15353 genes and a larger TAD containing 3 genes, CG33543, Obp22a and Npc2aNplp4 encodes a neuropeptide.  The functions of CG15354 and CG33543 are unknown.  Obp22a encodes an odorant binding protein, while Npc2a encodes the Niemann-Pick type C-2a protein which is involved sterol homeostasis.  The other boundary (purple: indicated by purple arrow) is located between two TADs 2.8 Mb away at 4,794,250 bp.  The upstream TAD contains the fipi gene (CG15630) which has neuronal functions in male courtship, while the downstream TAD contains CG3294, which is thought to be a spliceosome component, and schlaff (slf) which encodes a chitin binding protein.  As illustrated in the accompanying diagram, the blue boundary pairs with the purple boundary in a head-to-head orientation, generating a ~2.8 Mb loop with a circle-loop topology.  As a result of this pairing, the multi-gene (CG33543, Obp22a and Npc2a) TAD upstream of the blue boundary interacts with the CG15630 TAD upstream of the purple boundary.  Conversely the small Nplp4:CG15353 TAD downstream of the blue boundary interacts with the CG3294:slf TAD downstream of the purple boundary.  Even if one imagined that the cohesin bolo tie clip was somehow able to extrude 2.8 Mb of chromatin and then know to stop when it encountered the blue and purple boundaries, it would’ve generated a stemloop, not a circle-loop.

      The second meta-loop (panel B) is more complicated as it is generated by pairing interactions between four boundary elements.  The blue boundary (blue arrow) located ~4,801,800 bp (3L) separates a large TAD containing the RhoGEF64C gene from a small TAD containing CG7509, which encodes a predicted subunit of an extracellular carboxypeptidase.  As can be seen in the MicroC contact profile and the accompanying diagram, the blue boundary pairs with the purple boundary (purple arrow) which is located at ~7,013, 500 (3L) just upstream of the 2nd internal promoter (indicated by black arrowhead) of the Mp (Multiplexin) gene.  This pairing interaction is head-to-tail and generates a large stem-loop that spans ~2.2 Mb.  The stem-loop brings sequences upstream of the blue boundary and downstream of the purple boundary into contact (the strings below a bolo tie clip), just as was observed in the boundary bypass experiments of Muravyova et al. (Muravyova et al. 2001) and Kyrchanova et al. (Kyrchanova et al. 2008).  The physical interactions result in a box of contacts (right top) between sequences in the large RhoGEF64C TAD and sequences in a large TAD that contains an internal Mp promoter.  The second pairing interaction is between the brown boundary (brown arrow) and the green boundary (green arrow).  The brown boundary is located at ~4 805,600 bp (3L) and separates the TAD containing CG7590 from a large TAD containing CG1808 (predicted to encode an oxidoreductase) and the Dhc64C (Dynein heavy chain 64C) gene.  The green boundary is located at ~6,995,500 bp (3L), and it separates a TAD containing CG32388 and the biniou (bin) transcription factor from a TAD that contains the most distal promoter of the Mp (Multiplexin) gene (blue arrowhead).  As indicated in the diagram, the brown and green boundaries pair with each other head-to-tail, and this generates a small internal loop (and the final configuration would resemble a bolo tie with two tie clips).  This small internal loop brings the CG7590 TAD into contact with the TAD that extends from the distal Mp promoter to the 2nd internal Mp promoter.  The resulting contact profile is a rectangular box with diagonal endpoints corresponding to the paired blue:purple and brown:green boundaries.  The pairing of the brown:green boundaries also brings the TADs immediately downstream of the brown boundary and upstream of the green boundary into contact with each other, and this gives a rectangular box of interactions between the Dhc64C TAD, and sequences in the bin/CG3238 TAD.  This box is located on the lower left side of the contact map.

      Since the bin and Mp meta-loops in Author response image 3B are stem-loops, they could have been generated by “sequential” cohesin loop extrusion events.  Besides the fact that cohesin extrusion of 2 Mb of chromatin and breaking through multiple intervening TAD boundaries challenges the imagination, there is no mechanism in the cohesion loop extrusion/CTCF roadblock model to explain why cohesion complex 1 would come to a halt at the purple boundary on one side and the blue boundary on the other, while cohesin complex 2 would instead stop when it hits the brown and green boundaries.  This highlights another problem with the cohesin loop extrusion/CTCF roadblock model, namely that the roadblocks are functionally autonomous: they have an intrinsic ability to block cohesin that is entirely independent of the intrinsic ability of other roadblocks in the neighborhood.  As a result, there is no mechanism for generating specificity in loop formation.  By contrast, boundary pairing interactions are by definition non-autonomous and depend on the ability of individual boundaries to pair with other boundaries: specificity is built into the model. The mechanism for pairing, and accordingly the basis for partner preferences/specificity, are reasonably well understood.  Probably the most common mechanism in flies is based on shared binding sites for architectural proteins that can form dimers or multimers (Bonchuk et al. 2021; Fedotova et al. 2017).  Flies have a large family of polydactyl zinc finger DNA binding proteins, and as noted above, many of these form dimers or multimers and also function as TAD boundary proteins.  This pairing principle was first discovered by Kyrchanova et al. (Kyrchanova et al. 2008).  This paper also showed that orientation-dependent pairing interactions is a common feature of endogenous fly boundaries.  Another mechanism for pairing is specific protein:protein interactions between different DNA binding factors (Blanton et al. 2003).  Yet a third mechanism would be proteins that bridge different DNA binding proteins together.  The boundaries that use these different mechanisms (BX-C boundaries, scs, scs’) depend upon the same sorts of proteins that are used by homie and nhomie.  Likewise, these same set of factors reappear in one combination or another in most other TAD boundaries.  As for the orientation of pairing interactions, this is most likely determined by the order of binding sites for chromosome architectural proteins in the partner boundaries.

      …and many TADs lack focal 3D interactions between their boundaries.

      (1.3) The idea that flies differ from mammals in that they “lack” focal 3D interactions is simply mistaken.  One of the problems with drawing this distinction is that most all of the “focal 3D interactions” seen mammalian Hi-C experiments are a consequence of binning large DNA segments in low resolution restriction enzyme-dependent experiments.  This is even true in the two “high” resolution MicroC experiments that have been published (Hsieh et al. 2020; Krietenstein et al. 2020).  As illustrated above in Author response image 1, most of the “focal 3D interactions” (the dots at the apex of TAD triangles) seen with large bin sizes (1 kb and greater) disappear when the bin size is 200 bp and TADs rather than TAD neighborhoods are being visualized.

      As described in point #1.1, in the MicroC protocol, fixed chromatin is first digested to mononucloesomes by extensive MNase digestion, processed/biotinylated, and ligated to give dinucleosome-length fragments, which are then sequenced.  Regions of chromatin that are nucleosome free (promoters, enhancers, silencers, boundary elements) will typically be reduced to oligonucleotides in this procedure and will not be recovered when dinucleosome-length fragments are sequenced.  The loss of sequences from typical paired boundary elements is illustrated by the lar meta-loop shown in Author response image 4 (at 200 bp resolution).  Panels A and B show the contact profiles generated when the blue boundary (which separates two TADs that span  the Lar (Leukocyteantigen-related-like) transcription unit interacts with the purple boundary (which separates two TADs in a gene poor region ~620 kb away).  The blue and purple boundaries pair with each other head-to-head, and this pairing orientation generates yet another circle-loop.  In the circle-loop topology, sequences in the TADs upstream of both boundaries come into contact with each other, and this gives the small dark rectangular box to the upper left of the paired boundaries (Author response image 4A).  (Note that this small box corresponds to the two small TADs upstream of the blue and purple boundaries, respectively. See panel B.)  Sequences in the TADs downstream of the two boundaries also come into contact with each other, and this gives the large box to the lower right of the paired boundaries.  While this meta-loop is clearly generated by pairing interactions between the blue and purple boundaries, the interacting sequences are degraded in the MicroC protocol, and sequences corresponding to the blue and purple boundaries aren’t recovered.  This can be seen in panel B (red arrow and red arrowheads).  When a different Hi-C procedure is used (dHS-C) that captures nucleosome-free regions of chromatin that are physically linked to each other (Author response image 4C & D), the sequences in the interacting blue and purple boundaries are recovered and generate a prominent “dot” at their physical intersection (blue arrow in panel D).

      Author response image 4.

      Lar metaloop. Panels A & bB: MicroC. Panels C & D: dHS-C

      While sequences corresponding to the blue and purple boundaries are lost in the MicroC procedure, there is at least one class of elements that engage in physical pairing interactions whose sequences are (comparatively) resistant to MNase digestion.  This class of elements includes many PREs ((Kyrchanova et al. 2018); unpublished data), the boundary bypass elements in the Abd-B region of BX-C (Kyrchanova et al. 2023; Kyrchanova et al. 2019a; Kyrchanova et al. 2019b; Postika et al. 2018), and “tethering” elements (Batut et al. 2022; Li et al. 2023).  In all of the cases tested, these elements are bound in nuclear extracts by a large (>1000 kD) GAGA factor-containing multiprotein complex called LBC.  LBC also binds to the hsp70 and eve promoters (unpublished data).  Indirect end-labeling experiments (Galloni et al. 1993; Samal et al. 1981; Udvardy and Schedl 1984) indicate that the LBC protects a ~120-180 bp DNA segment from MNase digestion.  It is likely that this is the reason why LBC-bound sequences can be recovered in MicroC experiments as dots when they are physically linked to each other.  One such example (based on the ChIP signatures of the paired elements) is indicated by the green arrow in panel B and D of Author response image 4.  Note that there are no dots corresponding to these two LBC elements within either of the TADs immediately downstream of the blue and purple boundaries.  Instead the sequences corresponding to the two LBC elements are only recovered when the two elements pair with each other over a distance of ~620 kb.  The fact that these two elements pair with each other is consistent with other findings which indicate that, like classical boundaries, LBC elements exhibit partner preferences.  In fact, LBC elements can sometimes function as TAD boundaries.  For example, the Fab-7 boundary has two LBC elements, and full Fab-7 boundary function can be reconstituted with just these two elements (Kyrchanova et al. 2018).

      Reviewer #2 (Public Review):

      "Chromatin Structure II: Stem-loops and circle-loops" by Ke*, Fujioka*, Schedl, and Jaynes reports a set of experiments and subsequent analyses focusing on the role of Drosophila boundary elements in shaping 3D genome structure and regulating gene expression. The authors primarily focus on the region of the fly genome containing the even skipped (eve) gene; eve is expressed in a canonical spatial pattern in fly embryos and its locus is flanked by the well-characterized neighbor of homie (nhomie) and homie boundary elements. The main focus of investigation is the orientation dependence of these boundary elements, which had been observed previously using reporter assays. In this study, the authors use Crispr/Cas9 editing followed by recombination-mediated cassette exchange to create a series of recombinant fly lines in which the nhomie boundary element is either replaced with exongenous sequence from phage 𝝀, an inversion of nhomie, or a copy of homie that has the same orientation as the endogenous homie sequence. The nhomie sequence is also regenerated in its native orientation to control for effects introduced by the transgenesis process.

      The authors then perform high-resolution Micro-C to analyze 3D structure and couple this with fluorescent and colorimetric RNA in situ hybridization experiments to measure the expression of eve and nearby genes during different stages of fly development. The major findings of these experiments are that total loss of boundary sequence (replacement with 𝝀 DNA) results in major 3D structure changes and the most prominent observed gene changes, while inversion of the nhomie boundary or replacement with homie resulted in more modest effects in terms of 3D structure and gene expression changes and a distinct pattern of gene expression change from the 𝝀 DNA replacement. As the samples in which the nhomie boundary is inverted or replaced with homie have similar Micro-C profiles at the eve locus and show similar patterns of a spurious gene activation relative to the control, the observed effects appear to be driven by the relative orientation of the nhomie and homie boundary elements to one another.

      Collectively, the findings reported in the manuscript are of broad interest to the 3D genome field. Although extensive work has gone into characterizing the patterns of 3D genome organization in a whole host of species, the underlying mechanisms that structure genomes and their functional consequences are still poorly understood. The perhaps best understood system, mechanistically, is the coordinated action of CTCF with the cohesin complex, which in vertebrates appears to shape 3D contact maps through a loop extrusion-pausing mechanism that relies on orientation-dependent sequence elements found at the boundaries of interacting chromatin loops.

      (2.1) The notion that mammalian genome is shaped in 3D by the coordinate action of cohesin and CTCF has achieved the status of dogma in the field of chromosome structure in vertebrates.  However, as we have pointed out in #1.1, the evidence supporting this dogma is far from convincing.  To begin with, it is based on low resolution Hi-C experiments that rely on large bin sizes to visualize so-called “TADs.”  In fact, the notion that cohesin/CTCF are responsible on their own for shaping the mammalian 3D genome appears to be a result of mistaking a series of forests for the actual trees that populate each of the forests.

      As illustrated in Author response image 1 above, the “TADs” that are visualized in these low resolution data sets are not TADs at all, but rather TAD neighborhoods consisting of several dozen or more individual TADs.  Moreover, the “interesting” features that are evident at low resolution (>1 kb)—the dots and stripes—largely disappear at resolutions appropriate for visualizing individual TADs (~200 bp).

      In Goel et al. 2023, we presented data from one of the key experiments in Goel et al. (Goel et al. 2023).  In this experiment,  the authors used RCMC to generate high resolution (~250 bp) MicroC contact maps before and after Rad21 depletion.  Contrary to dogma, Rad21 depletion has absolutely no effect on TADs in a ~250 kb DNA segment—and these TADs look very much like the TADs we observe in the Drosophila genome, in particular in the Abd-B region of BX-C that is thought to be assembled into a series of circle-loops (see Fig. 2B).

      While Goel et al. (Goel et al. 2023) observed no effect of Rad21 depletion on TADs, they found that loss of Rad21 disturbs long-distance (but not short-distance) contacts in large TAD neighborhoods when their RCMC data set is visualized using bin sizes of 5 kb and I kb.  This is shown in Author response image 2.  The significance of this finding is, however, uncertain.  It could mean that the 3D organization of large TAD neighborhoods have a special requirement for cohesin activity.  On the other hand, since cohesin functions to hold sister chromosomes together after replication until they separate during mitosis (and might also participate in mitotic condensation), it is also possible that the loss of long-range contacts in large TAD neighborhoods when Rad21 is depleted is simply a reflection of this particular activity.  Further studies will be required to address these possibilities.

      As for CTCF: a careful inspection of the ChIP data in Goel et al. 2023 indicates that CTCF is not found at each and every TAD boundary.  In fact, the notion that CTCF is the be-all and end-all of TAD boundaries in mammals is truly hard to fathom.  For one, the demands for specificity in TAD formation (and in regulatory interactions) are likely much greater than those in flies, and specificity can’t be generated by a single DNA binding protein.  For another, several dozen chromosomal architectural proteins have already been identified in flies.  This means that (unlike what is thought to be true in mammals) it is possible to use a combinatorial mechanism to generate specificity in, for example, the long distance interactions in RFig 6 and 7.  As noted in #2.1 above, many of the known chromosomal architectural proteins in flies are polydactyl zinc finger proteins (just like CTCF).  There are some 200 different polydactyl zinc finger proteins in flies, and the function of only a hand full of these is known at present.  However, it seems likely that a reasonable fraction of this class of DNA binding proteins will ultimately turn out to have an architectural function of some type (Bonchuk et al. 2021; Fedotova et al. 2017).  The number of different polydactyl zinc finger protein genes in mammals is nearly 3 times that of flies.  It is really possible that of these, only CTCF is involved in shaping the 3D structure of the mammalian genome?

      Despite having a CTCF paralog and cohesin, the Drosophila genome does not appear to be structure by loop extrusion-pausing. The identification of orientation-dependent elements with pronounced structural effects on genome folding thus may shed light on alternative mechanisms used to regulated genome structure, which in turn may yield insights into the significance of particular folding patterns.

      (2.2) Here we would like to draw the reviewer’s and reader’s attention to Author response image 3, which shows that orientation-dependent pairing interactions have a significant impact on physical interactions between different sequences.  We would also refer the reader to two other publications.  One of these is Kyrchanova et al. (Kyrchanova et al. 2008), which was the first to demonstrate that orientation of pairing interactions matters.  The second is Fujioka et al. (Fujioka et al. 2016), which describes experiments indicating that nhomie and homie pair with each other head-to-tail and with themselves head-to-head.

      On the whole, this study is comprehensive and represents a useful contribution to the 3D genome field. The transgenic lines and Micro-C datasets generated in the course of the work will be valuable resources for the research community. Moreover, the manuscript, while dense in places, is generally clearly written and comprehensive in its description of the work. However, I have a number of comments and critiques of the manuscript, mainly centering on the framing of the experiments and presentation of the Micro-C results and on manner in which the data are analyzed and reported. They are as follows:

      Major Points:

      (1) The authors motivate much of the introduction and results with hypothetical "stem loop" and "circle loop" models of chromosome confirmation, which they argue are reflected in the Micro-C data and help to explain the observed ISH patterns. While such structures may possibly form, the support for these specific models vs. the many alternatives is not in any way justified. For instance, no consideration is given to important biophysical properties such as persistence length, packing/scaling, and conformational entropy. As the biophysical properties of chromatin are a very trafficked topic both in terms of experimentation and computational modeling and generally considered in the analysis of chromosome conformation data, the study would be strengthened by acknowledgement of this body of work and more direct integration of its findings.

      (2.3) The reviewer is not correct in claiming that “stem-loops” and “circle-loops” are “hypothetical.”  There is ample evidence that both types of loops are present in eukaryotic genomes, and that loop conformation has significant readouts in terms of not only the physical properties of TADs but also their functional properties.  Here we would draw the reviewer’s attention to Author response image 3 and Author response image 4 for examples of loops formed by the orientation-dependent pairing of yet other TAD boundary elements.  As evident from the MicroC data in these figures, circle-loops and stem-loops have readily distinguishable contact patterns.  The experiments in Fujioka et al. (Fujioka et al. 2016) demonstrate that homie and nhomie pair with each other head-to-tail, while they pair with themselves head-to-head.  The accompany paper (Bing et al. 2024) also provides evidence that loop topology is reflected both in the pattern of activation of reporters and in the MicroC contact profiles.  We would also mention again Kyrchanova et al. (Kyrchanova et al. 2008), who were the first to report orientation-dependent pairing of endogenous fly boundaries.

      At this juncture it would premature to try to incorporate computational modeling of chromosome conformation in our studies.  The reason is that the experimental foundations that would be essential for building accurate models are lacking.  As should be evident from RFigs. 1-3 above, studies on mammalian chromosomes are simply not of high enough resolution to draw firm conclusions about chromosome conformation: in most studies only the forests are visible.  While the situation is better in flies, there are still too many unknown.  As just one example, it would be important to know the orientation of the boundary pairing interactions that generate each TAD.  While it is possible to infer loop topology from how TADs interact with their neighbors (a plume versus clouds), a conclusive identification of stem- and circle-loops will require a method to unambiguously determine whether a TAD boundary pairs with its neighbor head-to-head or headto-tail.

      (2) Similar to Point 1, while there is a fair amount of discussion of how the observed results are or are not consistent with loop extrusion, there is no discussion of the biophysical forces that are thought to underly compartmentalization such as block-polymer co-segregation and their potential influence. I found this absence surprising, as it is generally accepted that A/B compartmentalization essentially can explain the contact maps observed in Drosophila and other non-vertebrate eukaryotes (Rowley, ..., Corces 2017; PMID 28826674). The manuscript would be strengthened by consideration of this phenomenon.

      (2.4) Compartments in mammals have typically been identified and characterized using lowresolution data sets, and these studies have relied on visualizing compartments using quite large bin sizes (>>1 kb).  Our experiments have nothing to do with the large-scale compartments seen in these Hi-C experiments.  Instead, we are studying the properties of individual TADs: how TADs are formed, the relationship between TAD topology and boundary:boundary pairing, and the impact of TAD topology on interactions between TADs in the immediate neighborhood.  There is no evidence to date that these large compartments or “block polymer co-segregation” have a) any impact on the properties of individual boundary elements, b) have a role in determining which boundary elements actually come together to form a given TAD, c) impact the orientation of the interactions between boundaries that generate the TAD or d) determine how TADs tend to interact with their immediate neighbors.  

      In more recent publications (c.f., Harris et al. 2023) compartments have shrunk in size and instead of being units of several hundred kb, the median length of the “compartmental” unit in mammalian cells is about12 kb. This is not too much different from the size of fly TADs.  However, the available evidence does not support the idea that block polymer co-segregation/co-repulsion drive the TAD:TAD interactions seen in MicroC experiments.  For example, according to this “micro-compartment” model, the specific patterns of interaction between TADs in the CG3294 meta-loop in Author response image 3 would be driven by block polymer co-segregation and co-repulsion. In this model, the TAD upstream of the blue boundary (which contains CG33543, the odorant binding protein gene Obp22a and the Npc2a gene which encodes a protein involved in sterol homeostasis) would share the same chromatin state/biophysical properties as the TAD upstream of the purple boundary, which has the fipi gene. While it is true that CG33543, Obp22a and also the fipi gene are not expressed in embryos, Npc2a is expressed at high levels during embryogenesis, yet it is part of the TAD that interacts with the fipi TAD.  The TAD downstream of the blue boundary contains CG15353 and Nplp4 and it interacts with the TAD downstream of the purple boundary which contains CG3294 and slfCG15353 and Nplp4 are not expressed in the embryo and as such should share a compartment with a TAD that is also silent. However, slf is expressed at a high level in 1216 hr embryos, while CG3294 is expressed at a low level.  In neither case would one conclude that the TADs upstream and downstream of the blue and purple boundaries, respectively, interact because of shared chromatin/biophysical states that drive block polymer co-segregation corepulsion. 

      One might also consider several gedanken experiments involving the long-range interactions that generate the CG3294 meta-loop in Author response image 3.    According to the micro-compartment model the patchwork pattern of crosslinking evident in the CG3294 meta-loop arises because the interacting  TADs share the same biochemical/biophysical properties, and this drives block polymer cosegregation and co-repulsion.  If this model is correct, then this patchwork pattern of TAD:TAD interactions would remain unchanged if we were to delete the blue or the purple boundary.  However, given what we know about how boundaries can find and pair with distant boundaries (c.f., Figure 6 from Muller et el. 1999 and the discussion in #1.2), the result of these gedanken experiments seem clear: the patchwork pattern shown in Author response image 3A will disappear.  What would happen if we inverted the blue or the purple boundary? Would the TAD containing CG33543, Obp22a and Npc2a still interact with fipi as would be expected from the compartment model?  Or would the pattern of interactions flip so that the CG33543, Obp22a and Npc2a TAD interacts with the TAD containing CG3294 and slf?  Again we can anticipate the results based on previous studies: the interacting TADs will switch when the CG3294 meta-loop is converted into a stem-loop.  If this happened, the only explanation possible in the compartment model is that the chromatin states change when the boundary is inverted so that TAD upstream of blue boundary now shares the same chromatin state as the TAD downstream of the purple boundary, while the TAD downstream of the blue boundary shares same state as the TAD upstream of the purple boundary.  However, there is no evidence that boundary orientation per se can induce a complete switch in “chromatin states” as would be required in the compartment model. 

      While we have not done these experimental manipulations with the CG3294 meta-loop, an equivalent experiment was done in Bing et al. (Bing et al. 2024).  However, instead of deleting a boundary element, we inserted a homie boundary element together with two reporters (gfp and LacZ) 142 kb away from the eve TAD.  The result of this gedanken “reverse boundary deletion” experiment is shown in Author response image 5.  Panel A shows the MicroC contact profile in the region spanning the transgene insertion site and the eve TAD in wild type (read “deletion”) NC14 embryos.  Panel B shows the MicroC contact profile from 12-16 hr embryos carrying the homie dual reporter transgene inserted at -142 kb.  Prior to the “deletion”, the homie element in the transgene pairs with nhomie and homie in the eve TAD and this generates a “mini-metaloop.”  In this particular insert, the homie boundary in the transgene (red arrow) is “pointing” in the opposite orientation from the homie boundary in the eve TAD (red arrow).  In this orientation, the pairing of the transgene homie with eve nhomie/homie brings the LacZ reporter into contact with sequences in the eve TAD.  Since a mini-metaloop is formed by homie_à _nhomie/homie pairing, sequences in TADs upstream and downstream of the transgene insert interact with sequences in TADs close to the eve TAD (Author response image 5B).  Taken together these interactions correspond to the interaction patchwork that is typically seen in “compartments” (see boxed region and inset).  If this patchwork is driven as per the model, by block polymer co-segregation and co-repulsion, then it should still be present when the transgene is deleted.  However, panel A shows that the interactions linking the transgene and the sequences in TADs next to the transgene to eve and TADs next to eve disappear when the homie boundary (plus transgene) is “deleted” in wild type flies.

      Author response image 5.

      Boundary deletion and compartments

      A second experiment would be to invert the homie boundary so that instead of pointing away from eve it points towards eve.  Again, if the compartmental patchwork is driven by block polymer co-segregation and co-repulsion, inverting the homie boundary in the transgene should have no effect on the compartmental contact profile.  Inspection of Fig. 7 in Bing et al. (Bing et al. 2024) will show that this prediction doesn’t hold either.  When homie is inverted, sequences in the eve TAD interact with the gfp reporter not the LacZ reporter.  In addition, there are corresponding changes in how sequences in TADs to either side of eve interact with sequences to either side of the transgene insert.  

      Yet another “test” of compartments generated by block polymer co-segregation/co-repulsion is provided by the plume above the eve volcano triangle.  According to the compartment model, sequences in TADs flanking the eve locus form the plume above the eve volcano triangle because their chromatin shares properties that drive block polymer co-segregation.  These same properties result in repulsive interactions with chromatin in the eve TAD, and this would explain why the eve TAD doesn’t crosslink with its neighbors.  If the distinctive chromatin properties of eve and the neighboring TADs drive block polymer co-segregation and co-repulsion, then inverting the nhomie boundary or introducing homie in the forward orientation should have absolutely no effect on the physical interactions between chromatin in the eve TAD and chromatin in the neighboring TADs.  However, Figures 4 and 6 in this paper indicate that boundary pairing orientation, not block polymer co-segregation/co-repulsion, is responsible for forming the plume above the eve TAD. Other findings also appear to be inconsistent with the compartment model. (A) The plume topping the eve volcano triangle is present in NC14 embryos when eve is broadly expressed (and potentially active throughout the embryo).  It is also present in 12-16 hr embryos when eve is only expressed in a very small subset of cells and is subject to PcG silencing everywhere else in the embryo.  B) According to the compartment model the precise patchwork pattern of physical interactions should depend upon the transcriptional program/chromatin state that is characteristic of a particular developmental stage or cell type.  As cell fate decisions are just being made during NC14 one might expect that most nuclei will share similar chromatin states throughout much of the genome.  This would not be true for 12-16 hr embryos.  At this stage the compartmental patchwork would be generated by a complex mixture of interactions in cells that have quite different transcriptional programs and chromatin states.  In this case, the patchwork pattern would be expected to become fuzzy as a given chromosomal segment would be in compartment A in one group of cells and in compartment B in another.   Unlike 12-16 hr embryos,  larval wing discs would be much more homogeneous and likely give a distinct and relatively well resolved compartmental pattern. We’ve examined the compartment patchwork of the same chromosomal segments in NC14 embryos, 12-16 hr embryos and larval wing disc cells.  While there are some differences (e.g., changes in some of the BX-C TADs in the wing disc sample) the compartmental patchwork patterns are surprisingly similar in all three cases. Nor is there any “fuzziness” in the compartmental patterns evident in 12-16 hr embryos, despite the fact that there are many different cell types at this stage of development.  C) TAD interactions with their neighbors and compartmental patchworks are substantially suppressed in salivary gland polytene chromosomes.  This would suggest that features of chromosome structure might be the driving force behind many of the “compartmental” interactions as opposed to distinct biochemical/biophysical of properties of small chromosomal segments that drive polymer co- segregation/co-repulsion.  

      (3) The contact maps presented in the study represent many cells and distinct cell types. It is clear from single-cell Hi-C and multiplexed FISH experiments that chromosome conformation is highly variable even within populations of the same cell, let alone between cell types, with structures such as TADs being entirely absent at the single cell level and only appearing upon pseudobulking. It is difficult to square these observations with the models of relatively static structures depicted here. The authors should provide commentary on this point.

      (2.5) As should be evident from Author response image 1, single-cell Hi-C experiments would not provide useful information about the physical organization of individual TADs, TAD boundaries or how individual TADs interact with their immediate neighbors.  In addition, since they capture only a very small fraction of the possible contacts within and between TADs, we suspect that these single-cell studies aren’t likely to be useful for making solid conclusions about TAD neighborhoods like those shown in Author response image 1 panels A, B, C and D, or Author response image 2.  While it might be possible to discern relatively stable contacts between pairs of insulators in single cells with the right experimental protocol, the stabilities/dynamics of these interactions may be better judged by the length of time that physical interactions are seen to persist in live imaging studies such as Chen et al. (2018), Vazquez et al. (2006) and Li et al. (2011).

      The in situ FISH data we’ve seen also seems problematic in that probe hybridization results in a significant decondensation of chromatin.  For two probe sets complementary to adjacent ~1.2 kb DNA sequences, the measured center-to-center distance that we’ve seen was ~110 nM.  This is about 1/3rd the length that is expected for a 1.2 kb naked DNA fragment, and about 1.7 times larger than that expected for a beads-on-a-string nucleosome array (~60 nM).  However, chromatin is thought to be compacted into a 30 nM fiber, which is estimated to reduce the length of DNA by at least another ~6 fold.  If this estimate is correct, FISH hybridization would appear to result in a ~10 fold decompaction of chromatin.  A decompaction of this magnitude would necessarily be followed by a significant distortion in the actual conformation of chromatin loops.

      (4) The analysis of the Micro-C data appears to be largely qualitative. Key information about the number of reads sequenced, reaps mapped, and data quality are not presented. No quantitative framework for identifying features such as the "plumes" is described. The study and its findings would be strengthened by a more rigorous analysis of these rich datasets, including the use of systematic thresholds for calling patterns of organization in the data.

      Additional information on the number of reads and data quality have been included in the methods section. 

      (5) Related to Point 4, the lack of quantitative details about the Micro-C data make it difficult to evaluate if the changes observed are due to biological or technical factors. It is essential that the authors provide quantitative means of controlling for factors like sampling depth, normalization, and data quality between the samples.

      In our view the changes in the MicroC contact patterns for the eve locus and its neighbors when the nhomie boundary is manipulated are not only clear cut and unambiguous but are also readily evident in the Figs that are presented in the manuscript.  If the reviewer believes that there aren’t significant differences between the MicroC contact patterns for the four different nhomie replacements, it seems certain that they would also remain unconvinced by a quantitative analysis.

      The reviewer also suggests that biological and/or technical differences between the four samples could account for the observed changes in the MicroC patterns for the eve TAD and its neighbors.  If this were the case, then similar changes in MicroC patterns should be observed elsewhere in the genome.  Since much of the genome is analyzed in these MicroC experiments there is an abundance of internal controls for each experimental manipulation of the nhomie boundary.  For two of the nhomie replacements, nhomie reverse and homie forward, the plume above the eve volcano triangle is replaced by clouds surrounding the eve volcano triangle.  If these changes in the eve MicroC contact patterns are due to significant technical (or biological) factors, we should observe precisely the same sorts of changes in TADs elsewhere in the genome that are volcano triangles with plumes.   Author response image 6 shows the MicroC contact pattern for several genes in the Antennapedia complex.  The deformed gene is included in a TAD which, like eve, is a volcano triangle topped by a plume.  A comparison of the deformed MicroC contact patterns for nhomie forward (panel B) with the MicroC patterns for nhomie reverse (panel C) and homie forward (panel D) indicates that while there are clearly technical differences between the samples, these differences do not result in the conversion of the deformed plume into clouds as is observed for the eve TAD.  The MicroC patterns elsewhere in Antennapedia complex are also very similar in all four samples.  Likewise, comparisons of regions elsewhere in the fly genome indicate that the basic contact patterns are similar in all four samples.   So while there are technical differences which are reflected in the relative pixel density in the TAD triangles and the LDC domains, these differences do not result in converting plumes into clouds nor do the alter the basic patterns of TAD triangles and LDC domains.  As for biological differences— the embryos in each sample are at roughly the same developmental stage and were collected and processed using the same procedures. Thus, the biological factors that could reasonably be expected to impact the organization of specific TADs (e.g., cell type specific differences) are not going to impact the patterns we see in our experiments. 

      Author response image 6.

      (6) The ISH effects reported are modest, especially in the case of the HCR. The details provided for how the imaging data were acquired and analyzed are minimal, which makes evaluating them challenging. It would strengthen the study to provide much more detail about the acquisition and analysis and to include depiction of intermediates in the analysis process, e.g. the showing segmentation of stripes.

      The imaging analysis is presented in Fig. 5 is just standard confocal microscopy.  Individual embryos were visualized and scored.  An embryo in which stripes could be readily detected was scored as ‘positive’ while an embryo in which stripes couldn’t be detected was scored as ‘negative.’   

      Recommendations for the authors:

      Editor comments:

      It was noted that the Jaynes lab previously published extensive genetic evidence to support the stem loop and circle loop models of Homie-Nhomie interactions (Fujioka 2016 Plos Genetics) that were more convincing than the Micro-C data presented here in proof of their prior model. Maybe the authors could more clearly summarize their prior genetic results to further try to convince the reader about the validity of their model.

      Reviewer #1 (Recommendations For The Authors):

      Below, I list specific comments to further improve the manuscript for publication. Most importantly, I recommend the authors tone down their proposal that boundary pairing is a universal TAD forming mechanism.

      (1) The title is cryptic.

      (2) The second sentence in the abstract is an overstatement: "In flies, TADs are formed by physical interactions between neighboring boundaries". Hi-C and Micro-C studies have not provided evidence that most TADs in Drosophila show focal interactions between their bracketing boundaries. The authors rely too strongly on prior studies that used artificial reporter transgenes to show that multimerized insulator protein binding sites or some endogenous fly boundaries can mediate boundary bypass, as evidence that endogenous boundaries pair.

      Please see responses #1.1 and #1.3 and figures Author response image 1 and Author response image 3.  Note that using dHS-C, most TADs that we’ve looked at so far are topped by a “dot” at their apex.

      (3) Line 64: the references do not cite the stated "studies dating back to the '90's'".

      The papers cited for that sentence are reviews which discussed the earlier findings.  The relevant publications are cited at the appropriate places in the same paragraph.  

      (4) Line 93: "On the other hand, while boundaries have partner preferences, they are also promiscuous in their ability to establish functional interactions with other boundaries." It was unclear what is meant here.

      Boundaries that a) share binding sites for proteins that multimerized, b) have binding sites for proteins that interact with each other, or c) have binding sites for proteins that can be bridged by a third protein can potentially pair with each other.  However, while these mechanisms enable promiscuous pairing interactions, they will also generate partner preferences (through a greater number of a, b and/or c).

      (5) It could be interesting to discuss the fact that it remains unclear whether Nhomie and Homie pair in cis or in trans, given that homologous chromosomes are paired in Drosophila.

      The studies in Fujioka et al. (Fujioka et al. 2016) show that nhomie and homie can pair both in cis and in trans.  Given the results described in #1.2, we imagine that they are paired in both cis and trans in our experiments.

      (6) Line 321: Could the authors further explain why they think that "the nhomie reverse circle-loop also differs from the nhomie deletion (λ DNA) in that there is not such an obvious preference for which eve enhancers activate expression"?

      The likely explanation is that the topology/folding of the altered TADs impacts the probability of interactions between the various eve enhancers and the promoters of the flanking genes.  

      (7) The manuscript would benefit from shortening the long Discussion by avoiding repeating points described previously in the Results.

      (8) Line 495: "If, as seems likely, a significant fraction of the TADs genome-wide are circle loops, this would effectively exclude cohesin-based loop extrusion as a general mechanism for TAD formation in flies". The evidence provided in this manuscript appears insufficient to discard ample evidence from multiple laboratories that TADs form by compartmentalization or loop extrusion. Multiple laboratories have, for example, demonstrated that cohesin depletion disrupts a large fraction of mammalian TADs. 

      Points made here and in #9 have been responded to in #1.1, #2.1 and #2.4 above.  We would suggest that the evidence for loop extrusion falls short of compelling (as it is based on the analysis of TAD neighborhoods, not TADs—that is forests, not trees) and given the results reported in Goel et al. (in particular Fig. 4 and Sup Fig. 8) is clearly suspect. This is not to mention the fact that cohesin loop-extrusion can’t generate circle-loops TADs, yet circle-loops clearly exist.  Likewise, as discussed in #2.4, it is not clear to us that the shared chromatin states, polymer co-segregation and co-repulsion account for the compartmental patchwork patterns of TAD;TAD interactions. The results from the  experimental manipulations in this paper and the accompanying paper, together with studies by others (e.g., Kyrchanova et al. (Kyrchanova et al. 2008), Mohana et al. (Mohana et al. 2023) would also seem to be at odds with the model for compartments as currently formulated.  

      The unique properties of Nhomie and Homie, namely the remarkable specificity with which they physically pair over large distances (Fujioka et al. 2016) may rather suggest that boundary pairing is a phenomenon restricted to special loci. Moreover, it has not yet been demonstrated that Nhomie or Homie are also able to pair with the TAD boundaries on their left or right, respectively.

      Points made here were discussed in detail in #1.2.  As described in detail in #1.2, It is not the case that nhomie and homie are in “unique” or “special.”  Other fly boundaries can do the same things.  As for whether nhomie and homie pair with their neighbors:  We haven’t done transgene experiments (e.g., testing by transvection or boundary bypass).  Likewise, in MicroC experiments there are no obvious dots at the apex of the neighboring TADs that would correspond to nhomie pairing with the neighboring boundary to the left and homie pairing with the neighboring boundary to the right. However, this is to be expected. As we discussed in in #1.3 above, only MNase resistant elements will generate dots in standard MicroC experiments.  On the other hand, when boundary:boundary interactions are analyzed by dHS-C (c.f., Author response image 4), there are dots at the apex of both neighboring TADs.  This would be direct evidence that nhomie pairs with the neighboring boundary to the left and homie pairs with the neighboring boundary to the right.

      (9) The comment in point 8 also applies to the concluding 2 sentences (lines 519-524) of the Discussion.

      See response to 8 above. Otherwise, the concluding sentences are completely accurate. Validation of the cohesin loop extrusion/CTCF roadblock model will required demonstrating a) that all TADs are either stem-loops or unanchored loops and b) that TAD endpoints are always marked by CTCF. 

      The likely presence of circle-loops and evidence that TAD boundaries that don’t have CTCF (c.f.,Goel et al. 2023) already suggests that this model can’t (either fully or not all) account for TAD formation in mammals. 

      (10) Figs. 3 and 6: It would be helpful to add the WT screenshot in the same figure, for direct comparison.

      It is easy enough to scroll between Figs-especially since nhomie forward looks just like WT.

      (11) Fig. 6: It would be helpful to show a cartoon view of a circle loop to the right of the Micro-C screenshot, as was done in Fig. 3.

      Good idea.   Added to the Fig.

      (12) Fig. 5: It would be helpful to standardize the labelling of the different genotypes throughout the figures and panels ("inverted" versus "reverse" versus an arrow indicating the direction).

      Fixed.

      Reviewer #2 (Recommendations For The Authors):

      Minor Points:

      (1) The Micro-C data does not appear to be deposited in an appropriate repository. It would be beneficial to the community to make these data available in this way.

      This has been done.

      (2) Readers not familiar with Drosophila development would benefit from a gentle introduction to the stages analyzed and some brief discussion on how the phenomenon of somatic homolog pairing might influence the study, if at all.

      We included a rough description the stages that were analyzed for both the in situs and MicroC. We thought that an actual description of what is going on at each of the stages wasn’t necessary as the process of development is not a focus of this manuscript.  In other studies, we’ve found that there are only minor differences in MicroC patterns between the blastoderm stage and stage 12-16 embryos.  While these minor differences are clearly interesting, we didn’t discuss them in the text.   In all of experiments chromosomes are likely to be paired.  In NC14 embryos (the stage for visualizing eve stripes and the MicroC contact profiles in Fig. 2) replication of euchromatic sequences is thought to be quite rapid.  While homolog pairing is incomplete at this stage, sister chromosomes are paired.  In stage 12-16 embryos, homologs will be paired and if the cells are arrested in G2, then sister chromosome will also be paired.  So in all of experiments, chromosomes (sisters and/or homologs) are paired. However, since we don’t have examples of unpaired chromosomes, our experiments don’t provide any info on how chromosome pairing might impact MicroC/expression patterns.

      (3) "P > 0.01" appears several times. I believe the authors mean to report "P < 0.01".

      Fixed.  

      References for Response

      Batut PJ, Bing XY, Sisco Z, Raimundo J, Levo M, Levine MS. 2022. Genome organization controls transcriptional dynamics during development. Science. 375(6580):566-570.

      Bing X, Ke W, Fujioka M, Kurbidaeva A, Levitt S, Levine M, Schedl P, Jaynes JB. 2024. Chromosome structure i: Loop extrusion or boundary:Boundary pairing? eLife.

      Blanton J, Gaszner M, Schedl P. 2003. Protein:Protein interactions and the pairing of boundary elements in vivo. Genes Dev. 17(5):664-675.

      Bonchuk A, Boyko K, Fedotova A, Nikolaeva A, Lushchekina S, Khrustaleva A, Popov V, Georgiev P. 2021. Structural basis of diversity and homodimerization specificity of zincfinger-associated domains in drosophila. Nucleic Acids Res. 49(4):2375-2389.

      Bonchuk A, Kamalyan S, Mariasina S, Boyko K, Popov V, Maksimenko O, Georgiev P. 2020. Nterminal domain of the architectural protein ctcf has similar structural organization and ability to self-association in bilaterian organisms. Sci Rep. 10(1):2677.

      Chen H, Levo M, Barinov L, Fujioka M, Jaynes JB, Gregor T. 2018. Dynamic interplay between enhancer–promoter topology and gene activity. Nat Genet. 50(9):1296.

      Fedotova AA, Bonchuk AN, Mogila VA, Georgiev PG. 2017. C2h2 zinc finger proteins: The largest but poorly explored family of higher eukaryotic transcription factors. Acta Naturae. 9(2):47-58.

      Fujioka M, Ke W, Schedl P, Jaynes JB. 2024. The homie insulator has sub-elements with different insulating and long-range pairing properties. bioRxiv. 2024.02.01.578481.

      Fujioka M, Mistry H, Schedl P, Jaynes JB. 2016. Determinants of chromosome architecture: Insulator pairing in cis and in trans. PLoS Genet. 12(2):e1005889.

      Galloni M, Gyurkovics H, Schedl P, Karch F. 1993. The bluetail transposon: Evidence for independent cis‐regulatory domains and domain boundaries in the bithorax complex. The EMBO Journal. 12(3):1087-1097.

      Gaszner M, Vazquez J, Schedl P. 1999. The zw5 protein, a component of the scs chromatin domain boundary, is able to block enhancer-promoter interaction. Genes Dev. 13(16):2098-2107.

      Goel VY, Huseyin MK, Hansen AS. 2023. Region capture micro-c reveals coalescence of enhancers and promoters into nested microcompartments. Nat Genet. 55(6):1048-1056.

      Harris HL, Gu H, Olshansky M, Wang A, Farabella I, Eliaz Y, Kalluchi A, Krishna A, Jacobs M, Cauer G et al. 2023. Chromatin alternates between a and b compartments at kilobase scale for subgenic organization. Nat Commun. 14(1):3303.

      Hart CM, Zhao K, Laemmli UK. 1997. The scs' boundary element: Characterization of boundary element-associated factors. Mol Cell Biol. 17(2):999-1009.

      Hsieh TS, Cattoglio C, Slobodyanyuk E, Hansen AS, Rando OJ, Tjian R, Darzacq X. 2020. Resolving the 3d landscape of transcription-linked mammalian chromatin folding. Mol Cell. 78(3):539-553.e538.

      Krietenstein N, Abraham S, Venev SV, Abdennur N, Gibcus J, Hsieh TS, Parsi KM, Yang L, Maehr R, Mirny LA et al. 2020. Ultrastructural details of mammalian chromosome architecture. Mol Cell. 78(3):554-565.e557.

      Kyrchanova O, Chetverina D, Maksimenko O, Kullyev A, Georgiev P. 2008. Orientation-dependent interaction between drosophila insulators is a property of this class of regulatory elements. Nucleic Acids Res. 36(22):7019-7028.

      Kyrchanova O, Ibragimov A, Postika N, Georgiev P, Schedl P. 2023. Boundary bypass activity in the abdominal-b region of the drosophila bithorax complex is position dependent and regulated. Open Biol. 13(8):230035.

      Kyrchanova O, Kurbidaeva A, Sabirov M, Postika N, Wolle D, Aoki T, Maksimenko O, Mogila V, Schedl P, Georgiev P. 2018. The bithorax complex iab-7 polycomb response element has a novel role in the functioning of the fab-7 chromatin boundary. PLoS Genet. 14(8):e1007442. Kyrchanova O, Sabirov M, Mogila V, Kurbidaeva A, Postika N, Maksimenko O, Schedl P, Georgiev P. 2019a. Complete reconstitution of bypass and blocking functions in a minimal artificial fab-7 insulator from drosophila bithorax complex. Proceedings of the National Academy of Sciences.201907190.

      Kyrchanova O, Wolle D, Sabirov M, Kurbidaeva A, Aoki T, Maksimenko O, Kyrchanova M, Georgiev P, Schedl P. 2019b. Distinct elements confer the blocking and bypass functions of the bithorax fab-8 boundary. Genetics.genetics. 302694.302019.

      Kyrchanova O, Zolotarev N, Mogila V, Maksimenko O, Schedl P, Georgiev P. 2017. Architectural protein pita cooperates with dctcf in organization of functional boundaries in bithorax complex. Development. 144(14):2663-2672.

      Li H-B, Muller M, Bahechar IA, Kyrchanova O, Ohno K, Georgiev P, Pirrotta V. 2011. Insulators, not polycomb response elements, are required for long-range interactions between polycomb targets in drosophila melanogaster. Mol Cell Biol. 31(4):616-625.

      Li X, Tang X, Bing X, Catalano C, Li T, Dolsten G, Wu C, Levine M. 2023. Gaga-associated factor fosters loop formation in the drosophila genome. Mol Cell. 83(9):1519-1526.e1514.

      Mohana G, Dorier J, Li X, Mouginot M, Smith RC, Malek H, Leleu M, Rodriguez D, Khadka J, Rosa P et al. 2023. Chromosome-level organization of the regulatory genome in the drosophila nervous system. Cell. 186(18):3826-3844.e3826.

      Muller M, Hagstrom K, Gyurkovics H, Pirrotta V, Schedl P. 1999. The mcp element from the drosophila melanogaster bithorax complex mediates long-distance regulatory interactions. Genetics. 153(3):1333-1356.

      Muravyova E, Golovnin A, Gracheva E, Parshikov A, Belenkaya T, Pirrotta V, Georgiev P. 2001. Loss of insulator activity by paired su(hw) chromatin insulators. Science. 291(5503):495498.

      Postika N, Metzler M, Affolter M, Müller M, Schedl P, Georgiev P, Kyrchanova O. 2018. Boundaries mediate long-distance interactions between enhancers and promoters in the drosophila bithorax complex. PLoS Genet. 14(12):e1007702.

      Samal B, Worcel A, Louis C, Schedl P. 1981. Chromatin structure of the histone genes of d. Melanogaster. Cell. 23(2):401-409.

      Sigrist CJ, Pirrotta V. 1997. Chromatin insulator elements block the silencing of a target gene by the drosophila polycomb response element (pre) but allow trans interactions between pres on different chromosomes. Genetics. 147(1):209-221.

      Udvardy A, Schedl P. 1984. Chromatin organization of the 87a7 heat shock locus of drosophila melanogaster. J Mol Biol. 172(4):385-403.

      Vazquez J, Muller M, Pirrotta V, Sedat JW. 2006. The mcp element mediates stable long-range chromosome-chromosome interactions in drosophila. Molecular Biology of the Cell. 17(5):2158-2165.

      Zolotarev N, Fedotova A, Kyrchanova O, Bonchuk A, Penin AA, Lando AS, Eliseeva IA, Kulakovskiy IV, Maksimenko O, Georgiev P. 2016. Architectural proteins pita, zw5,and zipic contain homodimerization domain and support specific long-range interactions in drosophila. Nucleic Acids Res. 44(15):7228-7241.

    1. Author response:

      The following is the authors’ response to the original reviews.

      Public Reviews:

      Reviewer #1 (Public Review):

      In the manuscript titled "Vangl2 suppresses NF-κB signaling and ameliorates sepsis by targeting p65 for NDP52-mediated autophagic degradation" by Lu et al, the authors show that Vangl2, a planner cell polarity component, plays a direct role in autophagic degradation of NFkB-p65 by facilitating its ubiquitination via PDLIM2 and subsequent recognition and autophagic targeting via the autophagy adaptor protein NDP52. Conceptually it is a wonderful study with excellent execution of experiments and controls. The concerns with the manuscript are mainly on two counts - First issue is the kinetics of p65 regulation reported here, which does not fit into the kinetics of the mechanism proposed here, i.e., Vangl2-mediated ubiquitination followed by autophagic degradation of p65. The second issue is more technical- an absolute lack of quantitative analyses. The authors rely mostly on visual qualitative interpretation to assess an increase or decrease in associations between partner molecules throughout the study. While the overall mechanism is interesting, the authors should address these concerns as highlighted below:

      Major points:

      (1) Kinetics of p65 regulation by Vangl2: As mentioned above, authors report that LPS stimulation leads to higher IKK and p65 activation in the absence of Vangl2. The mechanism of action authors subsequently work out is that- Vangl2 helps recruit E3 ligase PDLIM to p65, which causes K63 ubiquitination, which is recognised by NDP52 for autophagic targeting. Curiously, peak p65 activation is achieved within 30 minutes of LPS stimulation. The time scale of all other assays is way longer. It is not clear that in WT cells, p65 could be targeted to autophagic degradation in Vangl2 dependent manner within 30 minutes. The HA-Myc-Flag-based overexpression and Co-IP studies do confirm the interactions as proposed. However, they do not prove that this mechanism was responsible for the Vangl2-mediated modulation of p65 activation upon LPS stimulation. Moreover, the Vangl2 KO line also shows increased IKK activation. The authors do not show the cause behind increased IKK activation, which in itself can trigger increased p65 phosphorylation.
      We thank the reviewer for this valuable suggestion.

      Indeed, we agreed with the reviewer that peak p65 activation is achieved within 30 minutes of LPS stimulation in vitro, and p65 could not be targeted to autophagic degradation in a Vangl2 dependent manner within 30 minutes. Given that the protein and mRNA levels of Vangl2 were elevated at 3-6 h of LPS stimulation (Fig. S1 C-E), we extended the stimulation time scale in the revised manuscript. The data (Fig. 2A-D in the revised manuscript) demonstrated that IKK phosphorylation was enhanced in Vangl2 KO myeloid cells during the early phase (within 3 h) of LPS stimulation, but not for the prolonged period of LPS stimulation. The underlying mechanism may be complex. Only p65 phosphorylation was continuously enhanced after long-term LPS stimulation in Vangl2 KO cells, compared to WT cells. Furthermore, the overexpression of Vangl2 in A549 cells also demonstrated a reduction of phosphorylation and total endogenous p65 (Fig. 2 I, J in the revised manuscript). These findings were corroborated by overexpression and Co-IP experiments, which collectively indicated that Vangl2 regulates the stability of p65 by promoting its interaction with NDP52 and autophagic degradation. (Page 7; Line 183-185).  

      (2) The other major concern is regarding the lack of quantitative assessments. For Co-IP experiments, I can understand it is qualitative observation. However, when the authors infer that there is an increase or decrease in the association through co-IP immunoblots, it should also be quantified, especially since the differences are quite marginal and could be easily misinterpreted.

      We are grateful to the reviewer for this suggestion. The quantitative analysis has been updated in the revised version.

      (3) Figure 4E and F: It is evident that inhibiting Autolysosome (CQ or BafA1) or autophagy (3MA) led to the recovery of p65 levels and inducing autophagy by Rapamycin led to faster decay in p65 levels. Did the authors also note/explore the possibility that Vangl2 itself may be degraded via the autophagy pathway? IB of WCL upon CQ/BAF/3MA or upon Rapa treatment does indicate the same. If true, how would that impact the dynamics of p65 activation?

      We thank the reviewer for this question. Previous studies have shown that Vangl2 is primarily degraded by the proteasome pathway, rather than by the autolysosomal pathway (doi: 10.1126/sciadv.abg2099; doi: 10.1038/s41598-019-39642-z). In our experiments, Vangl2 recruits E3 ligase PDLIM2 to enhance K63-linked ubiquitination on p65, which serves as a recognition signal for cargo receptor NDP52-mediated selective autophagic degradation. Vangl2 facilitated the interaction between p65 and NDP52, yet itself did not undergo significant autophagic degradation.

      (4) Autophagic targeting of p65 should also be shown through alternate evidence, like microscopy etc., in the LPS-stimulated WT cells.

      We thank the reviewer for this suggestion. We have added the data (co-localization of p65 and LC3 was detected by immunofluorescence) in the revised version (Fig. S4 H in the revised manuscript). (Page 9, lines 267-268)

      Reviewer #2 (Public Review):

      Vangl2, a core planar cell polarity protein involved in Wnt/PCP signaling, mediates cell proliferation, differentiation, homeostasis, and cell migration. Vangl2 malfunctioning has been linked to various human ailments, including autoimmune and neoplastic disorders. Interestingly, Vangl2 was shown to interact with the autophagy regulator p62, and indeed, autophagic degradation limits the activity of inflammatory mediators such as p65/NF-κB. However, if Vangl2, per se, contributes to restraining aberrant p65/NF-kB activity remains unclear.

      In this manuscript, Lu et al. describe that Vangl2 expression is upregulated in human sepsis-associated PBMCs and that Vangl2 mitigates experimental sepsis in mice by negatively regulating p65/NF-κB signaling in myeloid cells. Vangl2 recruits the E3 ubiquitin ligase PDLIM2 to promote K63-linked poly-ubiquitination of p65. Vangl2 also facilitates the recognition of ubiquitinated p65 by the cargo receptor NDP52. These molecular processes cause selective autophagic degradation of p65. Indeed, abrogation of PDLIM2 or NDP52 functions rescued p65 from autophagic degradation, leading to extended p65/NF-κB activity.
      As such, the manuscript presents a substantial body of interesting work and a novel mechanism of NF-κB control. If found true, the proposed mechanism may expand therapeutic opportunities for inflammatory diseases. However, the current draft has significant weaknesses that need to be addressed.

      We appreciate the reviewer’s comments on our manuscript, and we have further improved the manuscript as suggested.

      Specific comments

      (1) Vangl2 deficiency did not cause a discernible increase in the cellular level of total endogenous p65 (Fig 2A and Fig 2B) but accumulated also phosphorylated IKK.

      Even Fig 4D reveals that Vangl2 exerts a rather modest effect on the total p65 level and the figure does not provide any standard error for the quantified data. Therefore, these results do not fully support the proposed model (Figure 7) - this is a significant draw back. Instead, these data provoke an alternate hypothesis that Vangl2 could be specifically mediating autophagic removal of phosphorylated IKK and phosphorylated IKK, leading to exacerbated inflammatory NF-κB response in Vangl2-deficient cells. One may need to use phosphorylation-defective mutants of p65, at least in the over-expression experiments, to dissect between these possibilities.

      We appreciate the reviewer’s comments on our manuscript, and we have further improved the manuscript as suggested.

      (1) Indeed, we agreed with the reviewer that Vangl2 deficiency did not cause a discernible increase in the cellular level of total p65 after a short time of LPS stimulation in vitro, and p65 could not be targeted to autophagic degradation in a Vangl2 dependent manner within 30 minutes. Given that the protein and mRNA levels of Vangl2 were elevated at 3-6 h of LPS stimulation (Fig. S1 C-E), we extended the stimulation time scale in the revised manuscript. The data (Fig. 2A-D in the revised manuscript) demonstrated that IKK phosphorylation was enhanced in Vangl2 KO myeloid cells during the early phase (within 3 h) of LPS stimulation, but not for the prolonged period of LPS stimulation. The underlying mechanism may be complex. Only phosphorylation of p65 and total endogenous p65 was continuously enhanced after long-term LPS stimulation in Vangl2 KO cells, compared to WT cells. Furthermore, the overexpression of Vangl2 in A549 cells also demonstrated a reduction of phosphorylation and total endogenous p65 (Fig. 2 I, J in the revised manuscript). These findings were corroborated by overexpression and Co-IP experiments, which collectively indicated that Vangl2 regulates the stability of p65 by promoting its interaction with NDP52 and autophagic degradation. (Page 7; Line 183-185).  

      (2) Similarly, the stimulation time scale in Fig 4D was extended, and it was demonstrated that p65 was more stable in Vangl2-deficient cells.

      3) Moreover, we constructed phosphorylation-defective mutants of p65 (S536A), and found that Vangl2 could also promote the degradation of the p65 phosphorylation mutants (Fig. S4 A, B in the revised manuscript). Thus, Vangl2 promote the degradation of the basal/unphosphorylated p65. (Page 8, lines 237-240)

      (2) Fig 1A: The data indicates the presence of two subgroups within the sepsis cohort - one with high Vangl2 expressions and the other with relatively normal Vangl2 expression. Was there any difference with respect to NF-κB target inflammatory gene expressions between these subgroups?

      As suggested, we conducted an analysis of NF-kB target inflammatory gene expressions between the high and relatively low Vangl2 expression groups in sepsis patients. The results showed that the serum of the high Vangl2 expression group exhibited lower levels of IL-6, WBC, and CRP than the low Vangl2 expression group, which suggested an inverse correlation between Vangl2 and the inflammatory response (Fig. S1 A in the revised manuscript) (Page 5, lines 126-128).

      (3) The effect of Vangl2 deficiency was rather modest in the neutrophil. Could it be that Vangl2 mediates its effect mostly in macrophages?

      As showed in Fig. S1C-E, the induction of Vangl2 by LPS stimulation is more rapid in macrophages than in neutrophils. This may contribute to its dominant effect in macrophages. Consequently, we primarily focused our investigation on the role of Vangl2 in macrophages.

      (4) Fig 1D and Figure 1E: Data for unstimulated Vangl2 cells should be provided. Also, the source of the IL-1β primary antibody has not been mentioned.

      Thank you for the suggestion. We have updated the data for unstimulated cells in the revised manuscript (Fig. 1 D, E in the revised manuscript). Also, IL-1β primary antibody was purchased from Cell Signaling Technology and the information has been included in the Materials and Methods section (Table S1).

      (5) The relevance and the requirement of RNA-seq analysis are not clear in the present draft. Figure 1E already reveals upregulation of the signature NF-κB target inflammatory genes upon Vangl2 deficiency.

      We agreed with the reviewer that the data presented in Figure 1E demonstrated the upregulation of the signature NF-kB target inflammatory genes upon Vangl2 deficiency in a murine model of LPS induced sepsis. Subsequently, we proceeded to investigate the mechanism by which Vangl2 regulates NF-kB target inflammatory genes at the cellular level in Figure 2. To this end, we performed RNA-seq analysis to screen signal pathways involved in LPS-induced septic shock by comparing LPS-stimulated BMDMs from Vangl2ΔM and WT mice, and identified that TNF signaling pathway and cytokine-cytokine receptor interaction were found to be significantly enriched in Vangl2ΔM BMDMs upon LPS stimulation. This analysis provides further evidence that Vangl2 plays a role in regulating NF-kB signaling pathways and the release of related inflammatory cytokines.
      (6) Fig 2A reveals an increased accumulation of phosphorylated p65 and IKK in Vangl2-deficient macrophages upon LPS stimulation within 30 minutes. However, Vangl2 accumulates at around 60 minutes post-stimulation in WT cells. Similar results were obtained for neutrophils (Fig 2B). There appears to be a temporal disconnect between Vangl2 and phosphorylated p65 accumulation - this must be clarified.

      This concern has been addressed above (see response to questions 1 from reviewer #2). 

      (7) Figure 2E and 2F do not have untreated controls. Presentations in Fig 2E may be improved to more clearly depict IL6 and TNF data, preferably with separate Y-axes.

      Thank you for the suggestion. We have added untreated controls and separated Y-axes for IL-6 and TNF data in the revised manuscript (Fig. 2 E, F in the revised manuscript).

      (8) Line 219: "strongly with IKKα, p65 and MyD88, and weak" - should be revised.

      We have improved the manuscript as suggested in the revised manuscript (Page 7; Line 203).

      (9) It is not clear why IKKβ was excluded from interaction studies in Fig S3G.

      We added the Co-IP experiment and showed that HA-tagged Vangl2 only interacted with Flag-tagged p65, but not with Flag-tagged IKKb in 293T cells (Fig S3H). Furthermore, endogenous co-IP immunoblot analyses showed that Vangl2 did not associate with IKKb (Fig. S3I)

      (10) Fig 3F- In the text, authors mentioned that Vangl2 strongly associates with p65 upon LPS stimulation in BMDM. However, no controls, including input or another p65-interacting protein, were used.

      As reviewer suggested, we have added input and positive control (IkBa) in this experiment (Fig. 3F in the revised manuscript). The results demonstrated that the interaction between p65 and IkBa was attenuated, although the total IkBa did not undergo significant degradation over long-term course of LPS stimulation.

      (11) Figure 4D - Authors claim that Vangl2-deficient BMDMs stabilized the expression of endogenous p65 after LPS treatment. However, p65 levels were particularly constitutively elevated in knockout cells, and LPS signaling did not cause any further upregulation. This again indicates the role of Vangl2 in the basal state. The authors need to explain this and revise the test accordingly.

      Thank you for the reviewer's comments. We repeated the experiment to ascertain whether Vangl2 could stabilize the expression of endogenous p65 before and after LPS treatment. It was found that, due to the extremely low expression of Vangl2 in WT cells in the absence of stimulation, there was no observable difference on the basal level of p65 between WT and Vangl2DM cells. However, upon prolonged LPS stimulation, Vangl2 expression was induced, resulting in p65 degradation in WT cells. In contrast, p65 protein was more stable in Vangl2 deficient cells after LPS stimulation (Fig. 4D in the revised manuscript).

      Reviewer #3 (Public Review):

      Lu et al. describe Vangl2 as a negative regulator of inflammation in myeloid cells. The primary mechanism appears to be through binding p65 and promoting its degradation, albeit in an unusual autolysosome/autophagy dependent manner. Overall, the findings are novel and the crosstalk of PCP pathway protein Vangl2 with NF-kappaB is of interest. …….Regardless, Vangl2 as a negative regulator of NF-kappaB is an important finding. There are, however, some concerns about methodology and statistics that need to be addressed.

      Thank you for your comments on our manuscript, and we have further improved the manuscript as suggested.

      (1) Whether PCP is anyway relevant or if this is a PCP-independent function of Vangl2 is not directly explored (the later appears more likely from the manuscript/discussion). PCP pathways intersect often with developmentally important pathways such as WNT, HH/GLI, Fat-Dachsous and even mechanical tension. It might be of importance to investigate whether Vangl2-dependent NF-kappaB is influenced by developmental pathways.

      Thank you for the reviewer's insightful comments. Our study revealed that Vangl2 recruits the E3 ubiquitin ligase PDLIM2 to facilitate K63-linked ubiquitination of p65, which is subsequently recognized by autophagy receptor NDP52 and then promotes the autophagic degradation of p65. Our findings by using autophagy inhibitors and autophagic-deficient cells indicate that Vangl2 regulates NF-kB signaling through a selective autophagic pathway, rather than affecting the PCP pathway, WNT, HH/GLI, Fat-Dachsous or even mechanical tension. Moreover, a discussion section has been added to the revised version. (Page 12, lines 377-393)

      (2) Are Vangl2 phosphorylations (S5, S82 and S84) in anyway necessary for the observed effects on NF-kappaB or would a phospho-mutant (alanine substitution mutant) Vangl2 phenocopy WT Vangl2 for regulation of NF-kappaB?

      As suggested, we generated phospho-mutants of Vangl2 (S82/84A) and observed that Vangl2 (S82/84A) could still facilitate the degradation of p65 (Fig. S4 B in the revised manuscript), suggesting that Vangl2 regulates the NF-kB pathway independently of its phosphorylation.

      (3) Another area to strengthen might be with regards to specificity of cell types where this phenomenon may be observed. LPS treatment in mice resulted in Vangl2 upregulation in spleen and lymph nodes, but not in lung and liver. What explains the specificity of organ/cell-type Vangl2 upregulation and its consequences observed here? Why is NF-kappaB signaling not more broadly or even ubiquitously affected in all cell types in a Vangl2-dependent manner, rather than being restricted to macrophages, neutrophils and peritoneal macrophages, or, for that matter, in spleen and LN and not liver and lung? After all, one may think that the PCP proteins, as well as NF-kappaB, are ubiquitous.

      Thank you for the reviewer's comments.

      (1) LPS is an important mediator to trigger sepsis with excessive immune activation. As is well known, the spleen and lymph nodes are important peripheral immune organs, where immune cells (e.g., macrophages) are abundant and respond sensitively to LPS stimulation. Nevertheless, immune cells represent a minor fraction of the lungs and liver. Consequently, Vangl2 represents a pivotal regulator of immune function, exhibiting a more pronounced increase in the immune organs and cells.

      2) Induction of Vangl2 expression by LPS stimulation is cell specific. Given that different cells exhibit varying protein abundances, the molecular events involved may also differ. Moreover, we observed high Vangl2 expression in the liver at the basal state (Author response image 1), whereas it was not induced after 12 h of LPS stimulation. Therefore, the functional role of Vangl2 exhibits significant phenotype in macrophages and neutrophils/spleen and LN, rather than in liver or lung cells.

      Author response image 1.

      Vangl2 showed no significant changes in the liver after LPS treatment. Mice (n≥3) were treated with LPS (30 mg/kg, i.p.). Livers were collected at 12 h after LPS treatment. Immunoblot analysis of Vangl2.

      Recommendations For The Authors:

      Reviewer #1 (Recommendations For The Authors):

      General points:

      Figure 4G- panels appear mislabeled. Pl correct.

      We have corrected this mislabeling as you suggested.

      The dynamics of Vangl2 interaction with p65 and autophagy adaptors is not clear/apparent. For example, Vangl2 expression destabilises p65 levels (as in Fig. 4), but in Fig. 5, it seems there is no decline in the p65 protein level, and a large fraction of it coprecipitates with NDP52.

      We appreciate the reviewer’s comments. In the co-IP assay, we used the lysosomal inhibitor CQ to inhibit p65 degradation to observe the interaction between p65 and NDP52 or Vangl2.

      Fig 5E- I would expect p65 levels to be lower in WT cells than Vangl2 KO cells. But as such, there is no difference between the two.

      We appreciate the reviewer’s comments. We repeated the experiments and updated the data. Firstly, Vangl2 was not induced in WT cells in the absence of LPS stimulation, thus there was no difference in p65 expression between the two groups at the basal level. Secondly, we used CQ/Baf-A1 to inhibit the degradation of Vangl2 in the co-IP assay to observe the interaction between p65 and other molecule.

      Reviewer #2 (Recommendations For The Authors):

      A few points that can be looked at and revised.

      (1) Quantification of the presented data is needed for Fig 4D and Fig 4E.

      We added the quantification analysis as suggested.  

      (2) The labeling of Fig 4G should be scrutinized.

      We have corrected this mislabeling as you suggested.

      (3) Fig 6B and Fig 6C should be explained in the result section more elaborately.

      We thank the reviewer for the suggestion, and we have rephrased this sentence to better describe the results. (Page 10, lines 306-313)

      (4) Line 85: "Vangl2 mediated downstream of Toll-like or interleukin (IL)-1" - unclear.

      We appreciate the reviewer’s comments on our manuscript, and we have further improved the manuscript as suggested in the revised manuscript. (Page 3, lines 68)

      (5) Line 181: "mice. Differentially expression analysis" - this should be revised.

      We appreciate the reviewer’s comments on our manuscript, and we have further improved the manuscript as suggested in the revised manuscript. (Page 11, lines 323)

      (6) Line 261-264- CHX-chase assay showed the degradation rate of p65 in Vangl2-deficient BMDM was slower compared with WT cells. However, Vangl2 is not induced in WT BMDMs upon CHX treatment (Fig. S4B).

      We appreciate the reviewer’s comments on our manuscript, and we have further improved the manuscript as suggested in the revised manuscript (Fig. S4D).

      (7) Finally, some editing to provide data only critical for the conclusions could improve the ease of reading.

      We have further improved the manuscript as suggested in the revised manuscript.

      Reviewer #3 (Recommendations For The Authors):

      Comments (general, please address at least in Discussion. Some experimental data, for example the role, if any, of Vangl2 phosphorylations will be very useful):

      (1) It might be interesting to explore whether there are any potential effects of developmental pathways on the observed effect mediated by Vangl2 or if the effects are entirely a PCP-independent function of Vangl2. Please see above public review.

      Thank you for the reviewer's insightful comments. Our study revealed that Vangl2 recruits the E3 ubiquitin ligase PDLIM2 to facilitate K63-linked ubiquitination of p65, which is subsequently recognized by autophagy receptor NDP52 and then promotes the autophagic degradation of p65. Our findings by using autophagy inhibitors and autophagic-deficient cells indicate that Vangl2 regulates NF-kB signaling through a selective autophagic pathway, rather than affecting the PCP pathway, WNT, HH/GLI, Fat-Dachsous or even mechanical tension. Furthermore, we generated phospho-mutants of Vangl2 (S82/84A) and observed that Vangl2 (S82/84A) could still facilitate the degradation of p65 (Fig. S4 B), suggesting that Vangl2 regulates the NF-kB pathway independently of its phosphorylation. In addition, a discussion section has been added to the revised version. (Page 12, lines 377-393)

      (2) What explains the specificity of organ/cell-type Vangl2 upregulation and its consequences observed here? Why is NF-kappaB signaling not more broadly or even ubiquitously affected in all cell types in a Vangl2-dependent manner, rather than being restricted to macrophages, neutrophils and peritoneal macrophages, or, for that matter, in spleen and LN and not liver and lung? Afterall, one may think that the PCP proteins, as well as NF-kappaB, are ubiquitous.

      Thank you for the reviewer's comments. A similar question has been addressed above (refer to the response to question 3 of reviewer 3).

      (3) Another specificity-related question that comes to mind is whether the Vangl2 function in autolysomal/autophagic degradation is restricted to p65 as the exclusive substrate? The cytosolic targeting of p65 as opposed to the more well-known nuclear-targeting is interesting.

      Our previous finding demonstrated that Vangl2 inhibits antiviral IFN-I signaling by targeting TBK1 for autophagic degradation (doi: 10.1126/sciadv.adg2339), thereby indicating that p65 is not the sole substrate for Vangl2. However, in the NF-kB pathway, p65 is a specific substrate for Vangl2. Moreover, our findings indicate that the interaction between Vangl2 and p65 occurs predominantly in the cytoplasm, rather than in the nucleus (Fig. S4 C).

      (4) Pharmacological approach is used to tease apart autolysosome versus proteasome pathway. What is the physiological importance of autophagic degradation? It is interesting to note that Vangl2 was already previously implicated in degrading LAMP-2A and increasing chaperon-mediated autophagy (CMA)-lysosome numbers (PMID: 34214490).

      Previous literature has domonstrated that Vangl2 can inhibit CMA degradation (PMID: 34214490). However, in our study, we found that Vangl2 can promote the selective autophagic degradation of p65. It is important to note that CMA degradation and selective autophagic degradation are two distinct degradation modes, which is not contradictory.

      (5) Are these phenotypes discernable in heterozygotes or only when ablated in homozygosity? Any phenotypes recapitulated in the looptail heterozygote mice?

      We found that these phenotypes discernable only in homozygosity.

      (6) What is the conservation of the Vangl2 p65-interaction site between Vangl2 and Vangl1? PDLIM2 recruitment between Vangl2 and Vangl1?

      We appreciate the reviewer’s comments on our manuscript. Previous studies have shown that human Vangl1 and Vangl2 exhibit only 72% identity and exhibit distinct functional properties (doi: 10.1530/ERC-14-0141).Thus, the interaction of Vangl2 with p65 and PDLIM2 recruitment may not necessarily occur in Vangl1.

      Comments (specific to experiments and data analyses. Please address the following):

      (7) The patient population used in Fig 1 is not described in the Methods. This is a critical omission. Were age, sex etc. controlled for between healthy and disease? How was the diagnosis made? What times during sepsis were the samples collected? As presented, this data is impossible to evaluate and interpret.

      We appreciate the reviewer’s comments on our manuscript, and we have further improved the manuscript as suggested in the revised supplement materials. (Supplementary information, Page 12, lines 146-147)

      (8) In general, the statistical method should be described for each experiment presented in the figures. Comparisons should not be made only at the time point with maximal difference (such as in Fig 1F or Fig 2C, but at all time points using appropriate statistical methods). The sample size should also be included to allow determination appropriateness of parametric or non-parametric tests.

      We appreciate the reviewer’s comments on our manuscript, and we have further improved the manuscript as suggested in the revised manuscript (Figures 1F and 2C).

      (9) PCP pathways can activate p62/SQSTM1 or JNK via RhoA. JNK activation should be tested experimentally.

      According to the reviewer's comments, we further examined the effect of Vangl2 on the JNK pathway. The results showed that Vangl2 did not affect the JNK pathway (Author response image 2). This suggests that Vangl2 functions independently of the PCP pathway.

      Author response image 2.

      Vangl2 did not affect the JNK pathway. WT and Vangl2-deficient (n≥3) BMDMs were stimulated with LPS (100 ng/ml) for the indicated times. Immunoblot analysis of total and phosphorylated JNK.

      (10) Why are different cells such as A549, HEK293, CHO, 293T, THP-1 used during the studies for different experiments? Consistency would improve rigor. At least, logical explanation driving the cell type of choice for each experiment should be included in the manuscript. Nonetheless, one aspect of using a panel of cell lines indicate that the effect of Vangl2 on NF-kappa B is pleiotropic.

      We are grateful to the reviewer for their comments on our manuscript. A549, HEK293, CHO, and 293T cells are commonly utilized in protein-protein interaction studies. The selection of cell lines for overexpression (exogenous) experiment is dependent on their transfection efficiency and the ability to express TLR4 (the receptor for LPS). Additionally, we conducted endogenous experiments by using THP-1 and BMDMs, which are human macrophage cell lines and murine primary macrophages, respectively. Moreover, we generated Vangl2f/f lyz-cre mice by specifically knocking out Vangl2 in myeloid cells, and investigated the effect of Vangl2 on NF-kB signaling in vivo.

    1. Author response:

      The following is the authors’ response to the original reviews.

      Public Reviews:

      Reviewer #1 (Public Review):

      Summary:

      The manuscript examines the contribution of the dorsal and intermediate hippocampus to goal-directed navigation in a wide virtual environment where visual cues are provided by the scenery on the periphery of a wide arena. Among a choice of 2 reward zones located near the arena periphery, rats learn to navigate from the center of the arena to the reward zone associated with the highest reward. Navigation performance is largely assessed from the rats' body orientation when they leave the arena center and when they reach the periphery, as well as the angular mismatch between the reward zone and the site rats reach the periphery. Muscimol inactivation of the dorsal and intermediate hippocampus alters rat navigation to the reward zone, but the effect was more pronounced for the inactivation of the intermediate hippocampus, with some rat trajectories ending in the zone associated with the lowest reward. Based on these results, the authors suggest that the intermediate hippocampus is critical, especially for navigating to the highest reward zone.

      Strengths:

      -The authors developed an effective approach to study goal-directed navigation in a virtual environment where visual cues are provided by the peripheral scenery.

      - In general, the text is clearly written and the figures are well-designed and relatively straightforward to interpret, even without reading the legends.

      - An intriguing result, which would deserve to be better investigated and/or discussed, was that rats tended to rotate always in the counterclockwise direction. Could this be because of a hardware bias making it easier to turn left, some aspect of the peripheral landscape, or a natural preference of rats to turn left that is observable (or reported) in a real environment?

      Thank you for the insightful question. As the reviewer mentioned, the counterclockwise rotation behavior was intriguing and unexpected. To answer the reviewer’s question properly, we examined whether such stereotypical turning behavior appeared before the rats acquired the task rule and reward zones in the pre-surgical training phase of the task. Data from the last day of shaping and the first day of the pre-surgical main task day showed no significant difference in the number of trials in which the first body-turn was either clockwise or counterclockwise, suggesting that the rats did not have a bias toward a specific side (p=0.46 for Shaping; p=0.76 for the Main task, Wilcoxon signed-rank test). These results excluded the possibility that there was something in the apparatus's hardware that made the rats turn only to the left. Also, since we used the same peripheral landscape for the shaping and main task, we could assume that the peripheral landscape did not cause movement bias.

      Author response image 1.

      Although it remains inconclusive, we have noticed that some prior studies alluded to a phenomenon similar to this issue, framed as the topic of lateralization or spatial preference by comparing left and right biases. For example, Wishaw et al. (1992) suggested that there was natural lateralization in rats (“Most of the rats displayed either a strong right limb bias or a strong left limb bias.”) but no dominance to a specific side. Andrade et al. (2001) also claimed that “83% of Wistar rats spontaneously showed a clear preference for left or right arms in the T-maze.” However, to the best of our knowledge, there has been no direct evidence that rats have a dominant natural preference only to one side.

      Therefore, while the left-turning behavior remains an intriguing topic for further investigation, we find it difficult to pinpoint the reason behind the behavior in the current study. However, we would like to emphasize that this behavior did not interrupt testing our hypothesis. Nonetheless, we agree with the reviewer’s point that the counterclockwise rotation needs to be discussed more, so we revised the manuscript as follows:

      “To rule out the potential effect of hardware bias or any particular aspect of peripheral landscape to make rats turn only to one side, we measured the direction of the first body-turn in each trial on the last day of shaping and the first day of the main task (i.e., before rats learned the reward zones). There was no significant difference between the clockwise and counterclockwise turns (p=0.46 for shaping, p=0.76 for main task; Wilcoxon signed-rank test), indicating that the stereotypical pattern of counterclockwise body-turn appeared only after the rats learned the reward locations.” (p.6)

      - Another interesting observation, which would also deserve to be addressed in the discussion, is the fact that dHP/iHP inactivations produced to some extent consistent shifts in departing and peripheral crossing directions. This is visible from the distributions in Figures 6 and 7, which still show a peak under muscimol inactivation, but this peak is shifted to earlier angles than the correct ones. Such change is not straightforward to interpret, unlike the shortening of the mean vector length.

      Maybe rats under muscimol could navigate simply by using the association of reward zone with some visual cues in the peripheral scene, in brain areas other than the hippocampus, and therefore stopped their rotation as soon as they saw the cues, a bit before the correct angle. While with their hippocampus is intact, rats could estimate precisely the spatial relationship between the reward zone and visual cues.

      We agree with the possibility suggested by the reviewer. However, although not described in the original manuscript, we performed several different control experiments in a few rats using various visual stimulus manipulations to test how their behaviors change as a result. One of the experiments was the landmark omission test, where one of the landmarks was omitted. The landmark to be made disappear was pseudorandomly manipulated on a trial-by-trial basis. We observed that the omission of one landmark, regardless of its identity, did not cause a specific behavioral change in finding the reward zones, suggesting that the rats were not relying on a single visual landmark when finding the reward zone.

      Author response image 2.

      Therefore, it is unlikely that rats used the spatial relationship between the reward zone and a specific visual cue to solve the task in our study. However, the result was based on an insufficient sample size (n=3), not permitting any meaningful statistical testing. Thus, we have now updated this information in the manuscript as an anecdotal result as follows:

      “Additionally, to investigate whether the rats used a certain landmark as a beacon to find the reward zones, we conducted the landmark omission test as a part of control experiments. Here, one of the landmarks was omitted, and the landmark to be made disappear was pseudorandomly manipulated on a trial-by-trial basis. The omission of one landmark, regardless of its identity, did not cause a specific behavioral change in finding the reward zones, suggesting that the rats were not relying on a single visual landmark when finding the reward zones. The result can be reported anecdotally only because of an insufficient sample size (n=3), not permitting any meaningful statistical testing.” (p.9)

      Weaknesses:

      -I am not sure that the differential role of dHP and iHP for navigation to high/low reward locations is supported by the data. The current results could be compatible with iHP inactivation producing a stronger impairment on spatial orientation than dHP inactivation, generating more erratic trajectories that crossed by chance the second reward zone.

      To make the point that iHP inactivation affects the disambiguation of high and low reward locations, the authors should show that the fraction of trajectories aiming at the low reward zone is higher than expected by chance. Somehow we would expect to see a significant peak pointing toward the low reward zone in the distribution of Figures 6-7.

      We thank the reviewer for the valuable comments. We agree that it is difficult to rigorously distinguish the loss of value representation from spatial disorientation in our experiment. Since the trial ended once the rat touched either reward zone, it was difficult to specify whether they intended to arrive at the location or just moved randomly and arrived there by chance. Moreover, it is possible that the drug infusion did not completely inactivate the iHP but only partially did so.

      To investigate this issue further, we checked whether the distribution of the departure direction (DD) differed between the trials in which rats initially headed north (NW, N, NE) and south (SE, S, SW) at the start. In the manuscript, we demonstrated that DD aligned with the high-value zone, indicating that the rat remembered the scenes associated with the high-value zone (p.8). Based on the rats’ characteristic counterclockwise rotation, the reward zone rats would face first upon starting while heading north would be the high-value zone. On the other hand, the rat would face the low-value reward zone when starting while heading south. In this case, normal rats would inhibit leaving the start zone and rotate further until they face the high-value zone before finally departing the start location. If the iHP inactivation caused a more severe impairment in spatial orientation but not in value representation, it is likely that the iHP-inactivated rats in both north- and south-starting trials would behave similarly with the dHP-inactivated rats, but producing a larger deviation from the high-value zone. However, if the iHP inactivation affected the disambiguation of high and low reward locations, north and south-starting trials would show different DD distributions.

      The circular plots shown below are the DD distributions of dMUS and iMUS. We could see that when they started facing north, iHP-inactivated rats still aligned themselves towards the high-value zone and thus remained spatially oriented, similar to the dHP inactivation session. However, in the south-starting trials, the DD distribution was completely different from the north-starting trials; the rats failed in body alignment towards the high-value zone. Instead, they departed the start point while heading south in most trials. This pattern was not seen in dMUS sessions, even in their south-starting trials, illustrating the distinct deficit caused by iHP inactivation. Additionally, most of the rats with iHP inactivation visited the low-value zone more in south-headed starting trials than in the north-headed trials, except for one rat.

      Author response image 3.

      Furthermore, we would like to clarify that we do not limit the effect of iHP inactivation to the impairment in distinguishing the high and low reward zones. It is possible that iHP inactivation resulted in the loss of a global value-representing map, leading to the impairment in distinguishing both reward zones from other non-rewarded areas in the environment. Figures 6 and 7 implicated this possibility by showing that the peaks are not restricted only to the reward zones. Unfortunately, we cannot rigorously address this in the current study because of the limitations of our experimental design mentioned above.

      Nonetheless, we agree with the reviewer that this limitation needs to be addressed, so we now added how the current study needs further investigation to clarify what causes the behavioral change after the iHP inactivation in the Limitations section (p.21).

      Reviewer #2 (Public Review):

      Summary:

      The aim of this paper was to elucidate the role of the dorsal HP and intermediate HP (dHP and iHP) in value-based spatial navigation through behavioral and pharmacological experiments using a newly developed VR apparatus. The authors inactivated dHP and iHP by muscimol injection and analyzed the differences in behavior. The results showed that dHP was important for spatial navigation, while iHP was critical for both value judgments and spatial navigation. The present study developed a new sophisticated behavioral experimental apparatus and proposed a behavioral paradigm that is useful for studying value-dependent spatial navigation. In addition, the present study provides important results that support previous findings of differential function along the dorsoventral axis of the hippocampus.

      Strengths:

      The authors developed a VR-based value-based spatial navigation task that allowed separate evaluation of "high-value target selection" and "spatial navigation to the target." They were also able to quantify behavioral parameters, allowing detailed analysis of the rats' behavioral patterns before and after learning or pharmacological inactivation.

      Weaknesses:

      Although differences in function along the dorsoventral axis of the hippocampus is an important topic that has received considerable attention, differences in value coding have been shown in previous studies, including the work of the authors; the present paper is an important study that supports previous studies, but the novelty of the findings is not that high, as the results are from pharmacological and behavioral experiments only.

      We appreciate the reviewer's insightful comments. In response, we would like to emphasize that a very limited number of studies investigated the function of the intermediate hippocampus, especially in spatial memory tasks. We tested the differential functions of the dorsal and intermediate hippocampus using a within-animal design and used reversible inactivation manipulation (i.e., muscimol injection) to prevent potential compensation by other brain regions when using irreversible manipulation techniques (i.e., lesion). Also, very few studies have analyzed the navigation trajectories of animals as closely as in the current study. We emphasize the novelty of our study by comparing it with prior studies, as shown below in Table 1.

      Author response table 1.

      Comparison of our study with those from prior studies

      Moreover, to the best of our knowledge, the current manuscript is the first to investigate the hippocampal subregions along the long axis in a VR environment using a hippocampal-dependent spatial memory task. Nonetheless, we agree that the current study has a limitation as a behavior-only experiment. We now have added a comment on how other techniques, such as electrophysiology, would develop our findings in the Limitation section (p.21).

      Reviewer #3 (Public Review):

      Summary:

      The authors established a new virtual reality place preference task. On the task, rats, which were body-restrained on top of a moveable Styrofoam ball and could move through a circular virtual environment by moving the Styrofoam ball, learned to navigate reliably to a high-reward location over a low-reward location, using allocentric visual cues arranged around the virtual environment.

      The authors also showed that functional inhibition by bilateral microinfusion of the GABA-A receptor agonist muscimol, which targeted the dorsal or intermediate hippocampus, disrupted task performance. The impact of functional inhibition targeting the intermediate hippocampus was more pronounced than that of functional inhibition targeting the dorsal hippocampus.

      Moreover, the authors demonstrated that the same manipulations did not significantly disrupt rats' performance on a virtual reality task that required them to navigate to a spherical landmark to obtain reward, although there were numerical impairments in the main performance measure and the absence of statistically significant impairments may partly reflect a small sample size (see comments below).

      Overall, the study established a new virtual-reality place preference task for rats and established that performance on this task requires the dorsal to intermediate hippocampus. They also established that task performance is more sensitive to the same muscimol infusion (presumably - doses and volumes used were not clearly defined in the manuscript, see comments below) when the infusion was applied to the intermediate hippocampus, compared to the dorsal hippocampus, although this does not offer strong support for the authors claim that dorsal hippocampus is responsible for accurate spatial navigation and intermediate hippocampus for place-value associations (see comments below).

      Strengths:

      (1) The authors established a new place preference task for body-restrained rats in a virtual environment and, using temporary pharmacological inhibition by intra-cerebral microinfusion of the GABA-A receptor agonist muscimol, showed that task performance requires dorsal to intermediate hippocampus.

      (2) These findings extend our knowledge about place learning tasks that require dorsal to intermediate hippocampus and add to previous evidence that, for some place memory tasks, the intermediate hippocampus may be more important than other parts of the hippocampus, including the dorsal hippocampus, for goal-directed navigation based on allocentric place memory.

      (3) The hippocampus-dependent task may be useful for future recording studies examining how hippocampal neurons support behavioral performance based on place information.

      Weaknesses:

      (1) The new findings do not strongly support the authors' suggestion that the dorsal hippocampus is responsible for accurate spatial navigation and the intermediate hippocampus for place-value associations.

      The authors base this claim on the differential effects of the dorsal and intermediate hippocampal muscimol infusions on different performance measures. More specifically, dorsal hippocampal muscimol infusion significantly increased perimeter crossings and perimeter crossing deviations, whereas dorsal infusion did not significantly change other measures of task performance, including departure direction and visits to the high-value location. However, these statistical outcomes offer only limited evidence that dorsal hippocampal infusion specifically affected the perimeter crossing, without affecting the other measures. Numerically the pattern of infusion effects is quite similar across these various measures: intermediate hippocampal infusions markedly impaired these performance measures compared to vehicle infusions, and the values of these measures after dorsal hippocampal muscimol infusion were between the values in the intermediate hippocampal muscimol and the vehicle condition (Figures 5-7). Moreover, I am not so sure that the perimeter crossing measures really reflect distinct aspects of navigational performance compared to departure direction and hit rate, and, even if they did, which aspects this would be. For example, in line 316, the authors suggest that 'departure direction and PCD [perimeter crossing deviation] [are] indices of the effectiveness and accuracy of navigation, respectively'. However, what do the authors mean by 'effectiveness' and 'accuracy'? Accuracy typically refers to whether or not the navigation is 'correct', i.e. how much it deviates from the goal location, which would be indexed by all performance measures.

      So, overall, I would recommend toning down the claim that the findings suggest that the dorsal hippocampus is responsible for accurate spatial navigation and the intermediate hippocampus for place-value associations.

      The reviewer mentioned that the statistical outcomes offer limited evidence as the dHP inactivation results were always positioned between the results of the iHP inactivation and controls. However, we would like to emphasize that, projecting to each other, the two subregions are not completely segregated anatomically. It is highly likely this is also true functionally and there should be some overlap in their roles. Considering such relationships between the dHP and iHP, it could be natural to see an intermediate effect after inactivating the dHP, and that is why we focused on the “magnitude” of behavioral changes after inactivation instead of complete dissociation between the two subregions in our manuscript. Unfortunately, because of the nature of the drug infusion study, further dissociation would be difficult, requiring further investigation with different experimental techniques, such as physiological examinations of the neural firing patterns between the two regions. We mentioned this caveat of the current study in the Limitations as follows:

      “However, our study includes only behavioral results and further mechanistic explanations as to the processes underlying the behavioral deficits require physiological investigations at the cellular level. Neurophysiological recordings during VR task performance could answer, for example, the questions such as whether the value-associated map in the iHP is built upon the map inherited from the dHP or it is independently developed in the iHP.” (p.21)

      Regarding the reviewer’s comment on the meaning of measuring the perimeter crossing directions, we would like to draw the reviewer’s attention to the individual trajectories during the iMUS sessions described in Figure 5. Particularly when they were not confident with the location of the higher reward, rats changed their heading directions during the navigation, which resulted in a less efficient route to the goal location. Rats showing this type of behavior tended to hit the perimeter of the arena first before correcting their routes toward the goal zone. In contrast, rats showing effective navigation hardly bumped into the wall or perimeter before hitting the goal zone. Thus, their PCDs matched DDs almost always. When considered together with DD, our PCD measure could tell whether rats not hitting the goal zone directly after departure were impaired in either maintaining the correct heading direction to the goal zone at the start location or orienting themselves to the target zone accurately from the start. Our results suggest that the latter is the case. We included the relevant explanation in the Discussion section as follows:

      “Particularly, rats changed their heading directions during the navigation when they were not confident with the location of the higher reward, resulting in a less efficient route to the goal location. Rats showing this type of behavior tended to hit the perimeter of the arena first before correcting their routes. Therefore, when considered together with DD, our PCD measure could tell that the rats not hitting the goal zone directly after departure were impaired in orienting themselves to the target zone accurately from the start, not in maintaining the correct heading direction to the goal zone at the start location.” (p.19)

      Nonetheless, we agree with the reviewer that the term ‘accuracy’ might be confusing with performance accuracy, so we replaced the term with ‘precision’ throughout the manuscript, referring to the precise targeting of the reward zones.

      (2) The claim that the different effects of intermediate and dorsal hippocampal muscimol infusions reflect different functions of intermediate and dorsal hippocampus rests on the assumption that both manipulations inhibit similar volumes of hippocampal tissue to a similar extent, but at different levels along the dorso-ventral axis of the hippocampus. However, this is not a foregone conclusion (e.g., drug spread may differ depending on the infusion site or drug effects may differ due to differential expression of GABA-A receptors in the dorsal and intermediate hippocampus), and the authors do not provide direct evidence for this assumption. Therefore, a possible alternative account of the weaker effects of dorsal compared to intermediate hippocampal muscimol infusions on place-preference performance is that the dorsal infusions affect less hippocampal volume or less markedly inhibit neurons within the affected volume than the intermediate infusions. I would recommend that the authors briefly consider this issue in the discussion. Moreover, from the Methods, it is not clear which infusion volume and muscimol concentration were used for the different infusions (see below, 4.a.), and this must be clarified.

      We appreciate these insightful comments from the reviewer and agree that we do not provide direct evidence for the point raised by the reviewer. To the best of our knowledge, most of the behavioral studies on the long axis of the hippocampus did not particularly address the differential expression of GABA-A receptors along the axis. We could not find any literature that specifically introduced and compared the levels of expression of GABA-A receptors or the diffusion range of muscimol in the intermediate hippocampus to the other subregions. However, we found that Sotiriou et al. (2005) made such comparisons with respect to the expression of different GABA-A receptors. They concluded that the dorsal and ventral hippocampi have different levels of the GABA-A receptor subtypes. The a1/b2/g2 subtype was dominant in the dorsal hippocampus, while the a2/b1/g2 subtype was prevalent in the ventral hippocampus. Sotiriou and colleagues also mentioned the lower affinity of GABA-A receptor binding in the ventral hippocampus, and this result is consistent with the Papatheodoropoulos et al. (2002) study that showed a weaker synaptic inhibition in the ventral hippocampus compared to the dorsal hippocampus. Papatheodoropoulos et al. speculated differences in GABA receptors as one of the potential causes underlying the differential synaptic inhibition between the dorsal and ventral hippocampal regions. Based on these findings, the same volume of muscimol is more likely to cause a more severe effect on the ventral hippocampus than the dorsal hippocampus. Therefore, we do not believe that the less significant changes after the dorsal hippocampal inactivation were induced by the expression level of GABA-A receptors. Additionally, we have demonstrated in our previous study that muscimol injections in the dorsal hippocampus impair performance to the chance level in scene-based behavioral tasks (Lee et al., 2014; Kim et al., 2012).

      Nonetheless, we mentioned the possibility of differential muscimol expressions between the two target regions. Following the suggestion of the reviewer, we now included this information in the Discussion as follows:

      “Although there is still a possibility that the levels of expression of GABA-A receptors might be different along the longitudinal axis of the hippocampus, …” (p.20)

      Regarding the drug infusion volume and concentration, we included these details in the Methods. Please see our detailed response to 4.a. below.

      (3) It is good that the authors included a comparison/control study using a spherical beacon-guided navigation task, to examine the specific psychological mechanisms disrupted by the hippocampal manipulations. However, as outlined below (4.b.), the sample size for the comparison study was lower than for the main study, and the data in Figure 8 suggest that the comparison task may be affected by the hippocampal manipulations similarly to the place-preference task, albeit less markedly. This would raise the question as to which mechanisms that are common to the two tasks may be affected by hippocampal functional inhibition, which should be considered in the discussion.

      The sample size for the object-guided navigation task was smaller because we initially did not plan the experiment, but later in the study decided to conduct the control test. Therefore, the object-guided navigation task was added to the study design after finishing the first three rats, resulting in a smaller sample size than the place preference task. We included this detail in the manuscript, as follows:

      “Note the smaller sample size in the object-guided navigation task. This was because the task was later added to the study design.” (p.24)

      Regarding the mechanism behind the two different tasks, we did not perform the same heading direction analysis here as in the place preference task because the two tasks have different characteristics such as task complexity. The object-guided navigation task is somewhat similar to the visually guided (or cued) version of the water maze task, which is widely known as hippocampal-independent (Morris et al., 1986; Packard et al., 1989; also see our descriptions on p.15). Therefore, we would argue that the two tasks (i.e., place preference task and object-guided navigation task) used in the current manuscript do not share neural mechanisms in common. Additionally, we confirmed that several behavioral measurements related to motor capacity, such as travel distance and latency, along with the direct hit proportion provided in Figure 8, did not show any statistically significant changes across drug conditions.

      4. Several important methodological details require clarification:

      a. Drug infusions (from line 673):

      - '0.3 to 0.5 μl of either phosphate-buffered saline (PBS) or muscimol (MUS) was infused into each hemisphere'; the authors need to clarify when which infusion volume was used and why different infusion volumes were used.

      We thank the reviewer for carefully reading our manuscript. We were cautious about side effects, such as suppressed locomotion or overly aggressive behavior, since the iHP injection site was close to the ventricle. We were keenly aware that the intermediate to ventral hippocampal regions are sensitive to the drug dosage from our previous experiments. Thus, we observed the rat’s behavior for 20 minutes after drug injection in a clean cage. We started from 0.5 μl, based on our previous study, but if the injected rat showed any sign of side effects in the cage, we stopped the experiment for the day and tried with a lower dosage (i.e., 0.4 μl first, then 0.3 μl, etc.) until we found the right dosage under which the rat did not show any side effect. This procedure is necessary because cannula tip positions are slightly different from rat to rat. When undergoing this procedure, five out of eight rats received 0.4 μl, two received 0.3 μl, and one received 0.5 μl. Still, there was no significant difference in performance, including the high-value visit percentage, departing and perimeter crossing directions, across all dosages. This information is now added in the Methods section as follows:

      “If the rat showed any side effect, particularly sluggishness or aggression, we reduced the drug injection amount in the rat by 0.1 ml until we found the dosage with which there was no visible side effect. As a result, five of the rats received 0.4 ml, two received 0.3 ml, and one received 0.5 ml.” (p.25)

      - I could not find the concentration of the muscimol solution that was used. The authors must clarify this and also should include a justification of the doses used, e.g. based on previous studies.

      Thank you for the suggestion. We used the drug concentration of 1mg/ml, which was adapted from our previous muscimol study (Lee et al., 2014; Kim et al., 2012). The manuscript is now updated, as follows:

      “…or muscimol (MUS; 1mg/ml, dissolved in saline) was infused into each hemisphere via a 33-gauge injection cannula at an injection speed of 0.167 ml/min, based on our previous study (Lee et al., 2014; Kim et al., 2012).” (p.25)

      -  Please also clarify if the injectors and dummies were flush with the guides or by which distance they protruded from the guides.

      The injection and dummy cannula both protruded from the guide cannula by 1 mm, and this information is now added to the Methods section, as follows:

      “The injection cannula and dummy cannula extended 1 mm below the tip of the guide cannula.” (p.25)

      b. Sample sizes: The authors should include sample size justifications, e.g. based on considerations of statistical power, previous studies, practical considerations, or a combination of these factors. Importantly, the smaller sample size in the control study using the spherical beacon-guided navigation task (n=5 rats) limits comparability with the main study using the place-preference task (n=8). Numerically, the findings on the control task (Figure 8) look quite similar to the findings on the place-preference task, with intermediate hippocampal muscimol infusions causing the most pronounced impairment and dorsal hippocampal muscimol infusions causing a weaker impairment. These effects may have reached statistical significance if the same sample size had been used in the place-preference study.

      We set the current sample size for several reasons. First, based on our previous studies, we assumed that eight, or more than six, would be enough to achieve statistical power in a “within-animal design” study. Also, considering the ethical commitments, we tried to keep the number of animals used in the study to the least. Last, our paradigm required very long training periods (3 months on average per animal), so we could not increase the sample size for practical reasons. Regarding the reasons for the smaller sample size for the object-guided navigation task, please see the previous response to 3 above. The manuscript is now revised as follows:

      “Based on our prior studies (Park et al., 2017; Yoo and Lee, 2017; Lee et al., 2014), the sample size of our study was set to the least number to achieve the necessary statistical power in the current within-subject study design for ethical commitments and practical considerations (i.e., relatively long training periods).” (p.22)

      c. Statistical analyses: Why were the data of the intermediate and dorsal hippocampal PBS infusion conditions averaged for some of the analyses (Figure 5; Figure 6B and C; Figure 7B and C; Figure 8B) but not for others (Figure 6A and Figure 7A)?

      The reviewer is correct that we only illustrated the separate dPBS and iPBS data for Figures 6A and 7A. Since the directional analysis is the main focus of the current manuscript, we tried to provide better visualization and more detailed examples of how the drug infusion changed the behavioral patterns between the PBS and MUS conditions in each region. Except for the visualization of DD and PCD, we averaged the PBS sessions to increase statistical power, as described in p.9. We added a detailed description of the reasons for illustrating dPBS and iPBS data separately in the manuscript, as follows:

      “Note that dPBS and iPBS sessions were separately illustrated here for better visualization of changes in the behavioral pattern for each subregion.” (p.12)

      Reviewing Editor (Recommendations For The Authors):

      The strength of evidence rating in the assessment is currently noted as "incomplete." This can be improved following revisions if you amend your conclusions in the paper, including in the title and abstract, such that the paper's major conclusions more closely match what is shown in the Results.

      Following the suggestions of the reviewing editor, we have mentioned the caveats of our study in the Limitations section of our revised manuscript (p.21). In addition, the manuscript has been revised so that the conclusions in the paper match more closely to the experimental results as can been seen in some of the relevant sentences in the abstract and main text as follows:

      “Inactivation of both dHP and iHP with muscimol altered efficiency and precision of wayfinding behavior, but iHP inactivation induced more severe damage, including impaired place preference. Our findings suggest that the iHP is more critical for value-dependent navigation toward higher-value goal locations.” (Abstract; p.2)

      “Whereas inactivation of the dHP mainly affected the precision of wayfinding, iHP inactivation impaired value-dependent navigation more severely by affecting place preference.” (p.5)

      “The iHP causes more damage to value-dependent spatial navigation than the dHP, which is important for navigational precision” (p.12)

      However, we haven’t changed the title of the manuscript as it carries what we’d like to deliver in this study accurately.

      Reviewer #1 (Recommendations For The Authors):

      - What were the dimensions of the environment? What distance did rats typically run to reach the reward zone? A scale bar would be helpful in Figure 1.

      We used the same circular arena from the shaping session, which was 1.6 meters in diameter (p.23), and the shortest path between the start location and either reward zone was 0.62 meters. We revised the manuscript for clarification as follows:

      “For the pre-training session, rats were required to find hidden reward zones…, on the same circular arena from the shaping session.” (p.23)

      “Therefore, the shortest path length between the start position and the reward zone was 0.62 meters.” (p.23)

      We also added a scale bar in Figure 1C for a better understanding.

      - Line 169: "The scene rotation plot covers the period from the start of the trial to when the rat leaves the starting point at the center and the departure circle (Figure 2B)."

      The sentence is unclear. Maybe it should be "... from the start of the trial to when the rat leaves the departure circle”.

      The sentence has been revised following the reviewer's suggestion. (p.7)

      - Line 147: "First, they learned to rotate the spherical treadmill counterclockwise to move around in the virtual environment (presumably to perform energy-efficient navigation)."

      It is not clear from this sentence if rats naturally preferred the counterclockwise direction or if the counterclockwise direction was a task requirement.

      We now clarified in our revised manuscript that it was not a task requirement to turn counterclockwise, as follows:

      “First, although it was not required in the task, they learned to rotate the spherical treadmill counterclockwise…” (p.6)

      - Line 149: "Second, once a trial started, but before leaving the starting point at the center, the animal rotated the treadmill to turn the virtual environment immediately to align its starting direction with the visual scene associated with the high-value reward zone."

      The sentence is unclear. Maybe "Second, once a trial started, the animal rotated the treadmill immediately to align its starting direction with the visual scene associated with the high-value reward zone.”

      We have updated the description following the suggestion. (p.6)

      Reviewer #2 (Recommendations For The Authors):

      - There are some misleading descriptions of the conclusion of the results in this paper. In this study, the functions of (a) selection of high-value target and (b) spatial navigation to the target were assessed in the behavioral experiments. The results of the pharmacological experiments showed that dHP inactivation impaired (b) and iHP inactivation impaired both (a) and (b) (Figures 5 B & D). However, the last sentence of the abstract states that dHP is important for the functions of (a) and iHP for (b). There are several other similar statements in the main text. Since the separation of (a) and (b) is an important and original aspect of this study, the description should clearly show the conclusion that dHP is important for (a) and iHP is important for both (a) and (b).

      Related to the above, the paragraph title in the Discussion "The iHP may contain a value-associated cognitive map with reasonable spatial resolution for goal-directed navigation (536-537)" is also somewhat misleading: "with reasonable resolution for goal-directed behavior" seems to reflect the results of an object-guided navigation task (Figure 8). However, the term "goal-directed behavior" is also used for value-dependent spatial navigation (i.e., the main task), which causes confusion. I would like to suggest clarifying the wording on this point.

      First, we need to correct the reviewer’s statement regarding our descriptions of the results. As the reviewer mentioned, our results indicated that the dHP inactivation impaired (b) but not (a), while the iHP inactivation impaired both (a) and (b). Regarding the iHP inactivation result, we focused on the impairment of (a) since our aim was to investigate spatial-value association in the hippocampus. Also, it was more likely that (a) affected (b), but not the other way, because (a) remained intact when (b) was impaired after dHP inactivation. We emphasized this difference between dHP and iHP inactivation, which was (a). Therefore, we mentioned in the last sentence of the abstract that the dHP is important for (b), which is the precision of spatial navigation to the target location, and the iHP is critical for (a).

      Moreover, we would like to clarify that we were not referring to the object-guided navigation task in Figure 8 in the phrase ‘with a reasonable spatial resolution for goal-directed navigation.’ Please note that the object-guided navigation task did not require fine spatial resolution to find the reward. The phrase instead referred to the dHP inactivation result (Figure 5 and 6), where the rats could find the high-value zone even with dHP inactivation, although the navigational precision decreased. Nonetheless, we agree with the reviewer for the confusion that the title might cause, so now have updated the title as follows:

      “The iHP may contain a value-associated cognitive map with reasonable spatial resolution for value-based navigation” (p.19)

      - As an earlier study focusing on the physiology of iHP, Maurer et al, Hippocampus 15:841 (2005) is also a pioneering and important study, and I suggest citing it.

      Thank you for the suggestion. We included the Maurer et al. (2005) study in the Introduction section as follows:

      “…Specifically, there is physiological evidence that the size of a place field becomes larger as recordings of place cells move from the dHP to the vHP (Jung et al., 1994; Maurer et al., 2005; Kjelstrup et al., 2008; Royer et al., 2010).” (p.4)

      - One of the strengths of this paper is that we have developed a new control system for the VR navigation task device, but I cannot get a very detailed description of this system in the Methods section. Also, no information about the system control has been uploaded to GitHub. I would suggest adding a description of the manufacturer, model number, and size of components, such as a rotary encoder and ball, and information about the software of the control system, with enough detail to allow the reader to reconstruct the system.

      We have now added detailed descriptions of the VR system in the Methods section (see “2D VR system). (p.22)

      Reviewer #3 (Recommendations For The Authors):

      (1) Some comments on specific passages of text:

      Lines 87 to 89: 'Surprisingly, beyond the recognition of anatomical divisions, little is known about the functional differentiation of subregions along the dorsoventral axis of the hippocampus. Moreover, the available literature on the subject is somewhat inconsistent.'

      I would recommend to rephrase these statements. Regarding the first statement, there is substantial evidence for functional differentiation along the dorso-ventral axis of the hippocampus (e.g., see reviews by Moser and Moser, 1998, Hippocampus; Bannerman et al., 2004, Neurosci Biobehav Rev; Bast, 2007, Rev Neurosci; Bast, 2011, Curr Opin Neurobiol; Fanselow and Dong, 2010, Neuron; Strange et al., 2014, Nature Rev Neurosci). Regarding the second statement, the authors may consider being more specific, as the inconsistencies demonstrated seem to relate mainly to the hippocampal representation of value information, instead of functional differentiation along the dorso-ventral hippocampal axis in general.

      We agree with the reviewer that the abovementioned statements need further clarification. The manuscript is now revised as follows:

      “Surprisingly, beyond the recognition of anatomical divisions, the available literature on the functional differentiation of subregions along the dorsoventral axis of the hippocampus, particularly in the context of value representation, is somewhat inconsistent.” (p.4)

      Lines 92 to 93: 'Thus, it has been thought that the dHP is more specialized for precise spatial representation than the iHP and vHP.'

      I think 'fine-grained' may be the more appropriate term here. Also, check throughout the manuscript when referring to the differences of spatial representations along the hippocampal dorso-ventral axis.

      Thank you for the insightful suggestion. We changed the term to ‘fine-grained’ throughout the manuscript, as follows:

      “Thus, it has been thought that the dHP is more specialized for fine-grained spatial representation than the iHP and vHP.” (p.4)

      “Consequently, the fine-grained spatial map present in the dHP…” (p.20)

      Line 217: well-'trained' rats?

      We initially used the term ‘well-learned’ to focus on the effect of learning, not training. Please note that the rats were already adapted to moving freely in the VR environment during the Shaping sessions, but the immediate counterclockwise body alignment only appeared after they acquired the reward locations for the main task. Nonetheless, we agree that the term might cause confusion, so we revised the manuscript as the reviewer suggested, as follows:

      “This implies that well-trained rats aligned their bodies more efficiently…” (p.8)

      Lines 309 to 311: 'Taken together, these results indicate that iHP inactivation severely damages normal goal-directed navigational patterns in our place preference task.'

      Consider to mention that dHP inactivation also causes impairments, albeit weaker ones.

      We thank the reviewer for the suggestion. We revised the manuscript by mentioning dHP inactivation as follows:

      “Taken together, these results indicate that iHP inactivation more severely damages normal goal-directed navigational patterns than dHP inactivation in our place-preference task.” (p.11-12)

      Lines 550 to 552: 'The involvement of the iHP in spatial value association has been reported in several studies. For example, Bast and colleagues reported that rapid place learning is disrupted by removing the iHP and vHP, even when the dHP remains undamaged (Bast et al., 2009).'

      Bast et al. (2009) did not directly show the role of iHP in 'spatial value associations'. They suggested that the importance of iHP for behavioral performance based on rapid, one-trial, place learning may reflect neuroanatomical features of the intermediate region, especially the combination of afferents that could convey the required fine-grained visuo-spatial information with relevant afferent and efferent connections that may be important to translate hippocampal place memory into appropriate behavioral performance (this may include afferents conveying value information). More recent theoretical and empirical research suggests that projections to the (ventral) striatum may be relevant (see Tessereau et al., 2021, BNA and Bauer et al., 2021, BNA).

      We appreciate the reviewer for this insightful comment. We agree with the reviewer that Bast et al. (2009) did not directly mention spatial value association; however, learning a new platform location needs an update of value information in the spatial environment. Therefore, we thought the study, though indirectly, suggested how the iHP contributes to spatial value associations. Nonetheless, to avoid confusion, we revised the manuscript, as follows:

      “The involvement of the iHP in spatial value association has been reported or implicated in several studies” (p.20)

      (2) Figures and legends:

      Figure 2B: What do the numbers after novice and expert indicate?

      The numbers indicate the rat ID, followed by the session number. We added the details to the Figure legend, as follows:

      “The numbers after ‘Novice’ and ‘Expert’ indicate the rat and session number of the example.” (p.34)

      Figure 2C: Please indicate units of the travel distance and latency measurements.

      The units are now described in the Figure legends, as follows:

      “Mean travel distance in meters and latency in seconds are shown below the VR arena trajectory.” (p.34)

      Figure 3Aii: Here and in other figures - do the vector lengths have a unit (degree?)?

      No, the mean vector length is an averaged value of the resultant vectors, thus having no specific unit.

      Figure 5A: Please explain what the numbers on top of the individual sample trajectories indicate.

      The numbers are IDs for rats, sessions, and trials of specific examples. We added the explanation to the Figure legends, as follows:

      “Numbers above each trajectory indicate the identification numbers for rat, session, and trial.” (p.35)

      (3) Additional comments on some methodological details:

      a. Why was the non-parametric Wilcoxon signed-rank test used for the planned comparison between intermediate and dorsal hippocampal PBS infusions, whereas parametric ANOVA and post-hoc comparisons were used for other analyses? This probably doesn't make a big difference for the interpretation of the present data (as a parametric pairwise comparison would also not have revealed any significant difference between intermediate and dorsal hippocampal PBS infusions), but it would nevertheless be good to clarify the rationale for this.

      We used the non-parametric statistics since our sample size was rather small (n=8) to use the parametric statistics, although we used the parametric ANOVA for some of the results because it is the most commonly known and widely used statistical test in such comparisons. However, we also checked the statistics with the alternatives (i.e., non-parametric Wilcoxon signed-rank test to parametric paired t-test and parametric One-way RM ANOVA with Bonferroni post hoc test to non-parametric Friedman’s test with Dunn’s post hoc test), and the statistical significance did not change with any of the tests. We now added the explanation in the manuscript, as follows:

      “Although most of our statistics were based on the non-parametric tests for the relatively small sample size (n=8), we used the parametric RM ANOVA for comparing three groups (i.e., PBS, dMUS, and iMUS) because it is the most commonly known and widely used statistical test in such comparison. However, we also performed statistical tests with the alternatives for reference, and the statistical significances were not changed with any of the results.” (p.26)

      b. Single housing of rats:

      Why was this chosen? Based on my experience, this is not necessary for studies involving cannula implants and food restriction. Group housing is generally considered to improve the welfare of rats.

      We chose single housing of rats because our training paradigm required precise restrictions on the food consumption of individual rats, which could be difficult in group housing.

      c. Anesthesia:

      Why was pentobarbital used, alongside isoflurane, to anesthetize rats for surgery (line 663)? The use of gaseous anesthesia alone offers very good control of anesthesia and reduces the risk of death from anesthesia compared to the use of pentobarbital.

      Why was anesthesia used for the drug infusions (line 674)? If rats are well-habituated to handling by the experimenter, manual restraint is sufficient for intra-cerebral infusions. Therefore, anesthesia could be omitted, reducing the risk of adverse effects on the experimental rats.

      I do not think that points b. and c. are relevant for the interpretation of the present findings, but the authors may consider these points for future studies to improve further the welfare of the experimental rats.

      We appreciate the reviewer’s careful suggestions. For both the use of pentobarbital during surgery and anesthesia for the drug infusion, we chose to do so to avoid any risk of rats being awake and becoming anxious and to ensure safety during the procedures. They might not be necessary, but they were helpful for the experimenters to proceed with sufficient time to maintain precision. Nonetheless, we agree with the reviewer’s concern, which was the reason why we monitored the rats’ behavior for 20 minutes in the cage after drug infusion to minimize any potential influence on the task performance. We updated the relevant details in the Methods section, as follows:

      “The rat was kept in a clean cage to recover from anesthesia completely and monitored for side effects for 20 minutes, then was moved to the VR apparatus for behavioral testing.” (p.25)

    1. Author response:

      The following is the authors’ response to the original reviews.

      eLife assessment 

      fMRI was used to address an important aspect of human cognition - the capacity for structured representations and symbolic processing - in a cross-species comparison with non-human primates (macaques); the experimental design probed implicit symbolic processing through reversal of learned stimulus pairs. The authors present solid evidence in humans that helps elucidate the role of brain networks in symbolic processing, however the evidence from macaques was incomplete (e.g., sample size constraints, potential and hard-to-quantify differences in attention allocation, motivation, and lived experience between species).

      Thank you very much for your assessment. We would like to address the potential issues that you raise point-by-point below.

      We agree that for macaque monkey physiology, sample size is always a constraint, due to both financial and ethical reasons. We addressed this concern by combining the results from two different labs, which allowed us to test 4 animals in total, which is twice as much as what is common practice in the field of primate physiology. (We discuss this now on lines 473-478.)

      Interspecies differences in motivation, attention allocation, task strategies etc. could also be limiting factors. Note that we did address the potential lack of attention allocation directly in Experiment 2 using implicit reward association, which was successful as evidenced by the activation of attentional control areas in the prefrontal cortex. We cannot guarantee that the strategies that the two species deploy are identical, but we tentatively suggest that this might be a less important factor in the present study than in other interspecies comparisons that use explicit behavioral reports. In the current study, we directly measured surprise responses in the brain in the absence of any explicit instructions in either species, which allowed us to  measure the spontaneous reversal of learned associations, which is a very basic element of symbolic representation. Our reasoning is that such spontaneous responses should be less dependent on attention allocation and task strategies. (We discuss this now in more detail on lines 478-485.)

      Finally, lived experience could be a major factor. Indeed, obvious differences include a lifetime of open-field experiences and education in our human adult subjects, which was not available to the monkey subjects, and includes a strong bias towards explicit learning of symbolic systems (e.g. words, letters, digits, etc). However, we have previously shown that 5-month-old human infants spontaneously generalize learning to the reversed pairs after a short learning in the lab using EEG (Kabdebon et al, PNAS, 2019). This indicates that also with very limited experience, humans spontaneously reverse learned associations. (We discuss this now in more detail on lines 478-485.) It could be very interesting to investigate whether spontaneous reversal could be present in infant macaque monkeys, as there might be a critical period for this effect. Although neurophysiology in awake infant monkeys is highly challenging, it would be very relevant for future work. (We discuss this in more detail on lines 493-498.)

      Public Reviews: 

      Reviewer #1 (Public Review): 

      Kerkoerle and colleagues present a very interesting comparative fMRI study in humans and monkeys, assessing neural responses to surprise reactions at the reversal of a previously learned association. The implicit nature of this task, assessing how this information is represented without requiring explicit decision-making, is an elegant design. The paper reports that both humans and monkeys show neural responses across a range of areas when presented with incongruous stimulus pairs. Monkeys also show a surprise response when the stimuli are presented in a reversed direction. However, humans show no such surprise response based on this reversal, suggesting that they encode the relationship reversibly and bidirectionally, unlike the monkeys. This has been suggested as a hallmark of symbolic representation, that might be absent in nonhuman animals. 

      I find this experiment and the results quite compelling, and the data do support the hypothesis that humans are somewhat unique in their tendency to form reversible, symbolic associations. I think that an important strength of the results is that the critical finding is the presence of an interaction between congruity and canonicity in macaques, which does not appear in humans. These results go a long way to allay concerns I have about the comparison of many human participants to a very small number of macaques. 

      We thank the reviewer for the positive assessment. We also very much appreciate the point about the interaction effect in macaque monkeys – indeed, we do not report just a negative finding. 

      I understand the impossibility of testing 30+ macaques in an fMRI experiment. However, I think it is important to note that differences necessarily arise in the analysis of such datasets. The authors report that they use '...identical training, stimuli, and whole-brain fMRI measures'. However, the monkeys (in experiment 1) actually required 10 times more training. 

      We agree that this description was imprecise. We have changed it to “identical training stimuli” (line 151), indeed the movies used for training were strictly identical. Furthermore, please note that we do report the fMRI results after the same training duration. In experiment 1, after 3 days of training, the monkeys did not show any significant results, even in the canonical direction. However, in experiment 2, with increased attention and motivation, a significant effect was observed on the first day of scanning after training, as was found in human subjects (see Figure 4 and Table 3).

      More importantly, while the fMRI measures are the same, group analysis over 30+ individuals is inherently different from comparing only 2 macaques (including smoothing and averaging away individual differences that might be more present in the monkeys, due to the much smaller sample size). 

      Thank you for understanding that a limited sampling size is intrinsic to macaque monkey physiology. We also agree that data analysis in humans and monkeys is necessarily different. As suggested by the reviewer, we added an analysis to address this, see the corresponding reply to the ‘Recommendations for the authors’ section below.

      Despite this, the results do appear to show that macaques show the predicted interaction effect (even despite the sample size), while humans do not. I think this is quite convincing, although had the results turned out differently (for example an effect in humans that was absent in macaques), I think this difference in sample size would be considerably more concerning. 

      Thank you for noting this. Indeed, the interaction effect is crucial, and the task design was explicitly made to test this precise prediction, described in our manuscript as the “reversibility hypothesis”. The congruity effect in the learned direction served as a control for learning, while the corresponding congruity effect in the reversed direction tested for spontaneous reversal. The reversibility hypothesis stipulates that in humans there should not be a difference between the learned and the reversed direction, while there should be for monkeys. We already wrote about that in the result section of the original manuscript and now also describe this more explicitly in the introduction and beginning of the result section.

      I would also note that while I agree with the authors' conclusions, it is notable to me that the congruity effect observed in humans (red vs blue lines in Fig. 2B) appears to be far more pronounced than any effect observed in the macaques (Fig. 3C-3). Again, this does not challenge the core finding of this paper but does suggest methodological or possibly motivational/attentional differences between the humans and the monkeys (or, for example, that the monkeys had learned the associations less strongly and clearly than the humans). 

      As also explained in response to the eLife assessment above, we expanded the “limitations” section of the discussion, with a deeper description of the possible methodological differences between the two species (see lines 478-485).

      With the same worry in mind, we did increase the attention and motivation of monkeys in experiment 2, and indeed obtained a greater activation to the canonical pairs and their violation, -notably in the prefrontal cortex – but crucially still without reversibility.

      In the end, we believe that the striking interspecies difference in size and extent of the violation effect, even for purely canonical stimuli, is an important part of our findings and points to a more efficient species-specific learning system, that our experiment tentatively relates to a symbolic competence.

      This is a strong paper with elegant methods and makes a worthwhile contribution to our understanding of the neural systems supporting symbolic representations in humans, as opposed to other animals. 

      We again thank the reviewer for the positive review.

      Reviewer #2 (Public Review): 

      In their article titled "Brain mechanisms of reversible symbolic reference: a potential singularity of the human brain", van Kerkoerle et al address the timely question of whether non-human primates (rhesus macaques) possess the ability for reverse symbolic inference as observed in humans. Through an fMRI experiment in both humans and monkeys, they analyzed the bold signal in both species while observing audio-visual and visual-visual stimuli pairs that had been previously learned in a particular direction. Remarkably, the findings pertaining to humans revealed that a broad brain network exhibited increased activity in response to surprises occurring in both the learned and reverse directions. Conversely, in monkeys, the study uncovered that the brain activity within sensory areas only responded to the learned direction but failed to exhibit any discernible response to the reverse direction. These compelling results indicate that the capacity for reversible symbolic inference may be unique to humans. 

      In general, the manuscript is skillfully crafted and highly accessible to readers. The experimental design exhibits originality, and the analyses are tailored to effectively address the central question at hand.

      Although the first experiment raised a number of methodological inquiries, the subsequent second experiment thoroughly addresses these concerns and effectively replicates the initial findings, thereby significantly strengthening the overall study. Overall, this article is already of high quality and brings new insight into human cognition. 

      We sincerely thank the reviewer for the positive comments. 

      I identified three weaknesses in the manuscript: 

      - One major issue in the study is the absence of significant results in monkeys. Indeed, authors draw conclusions regarding the lack of significant difference in activity related to surprise in the multidemand network (MDN) in the reverse congruent versus reverse incongruent conditions. Although the results are convincing (especially with the significant interaction between congruency and canonicity), the article could be improved by including additional analyses in a priori ROI for the MDN in monkeys (as well as in humans, for comparison). 

      First, we disagree with the statement about “absence of significant results in monkeys”. We do report a significant interaction which, as noted by the referee, is a crucial positive finding.

      Second, we performed the suggested analysis for experiment 2, using the bilateral ROIs of the putative monkey MDN from previous literature (Mitchell, et al. 2016), which are based on the human study by Fedorenko et al. (PNAS, 2013). 

      Author response table 1.

      Congruity effect for monkeys in Experiment 2 within the ROIs of the MDN (n=3). Significance was assessed with one-sided one-sample t-tests.

      As can be seen, none of the regions within the monkey MDN showed an FDR-corrected significant difference or interaction. Although the absence of a canonical congruity effect makes it difficult to draw strong conclusions, it did approach significance at an uncorrected level in the lateral frontal posterior region, similar to  the large prefrontal effect we report in Figures 4 and 5. Furthermore, for the reversed congruity effect there was never even a trend at the uncorrected level, and the crucial interaction of canonicity and congruity again approached significance in the lateral prefrontal cortex.  

      We also performed an ANOVA  in the human participants of the VV experiment on the average betas across the 7 different fronto-parietal ROIs as used by Mitchell et al to define their equivalent to the monkey brain (Fig 1a, right in Mitchell et al. 2016) with congruity, canonicity and hemisphere (except for the anterior cingulate which is a bilateral ROI) as within-subject factors. We confirmed the results presented in the manuscript (Figure 4C) with notably no significant interaction between congruity and canonicity in any of these ROIs (all F-values (except insula) <1). A significant main effect of congruity was observed in the posterior middle frontal gyrus (MFG) and inferior precentral sulcus at the FDR corrected level. Analyses restricted to the canonical trials found a congruity effect in these two regions plus the anterior insula and anterior cingulate/presupplementary motor area, whereas no ROIs were significant at a FDR corrected level for reverse trials. There was a trend in the middle MFG and inferior precentral region for reversed trials. Crucially, there was not even a trend for the interaction between congruity and canonicity at the uncorrected level. The difference in the effect size between the canonical and reversed direction can therefore be explained by the larger statistical power due to the larger number of congruent trials (70%, versus 10% for the other trial conditions), not by a significant effect by the canonical and the reversed direction. 

      Author response table 2.

      Congruity effect for humans in Experiment 2 within the ROIs of the MDN (n=23).

      These results support our contention that the type of learning of the stimulus pairs was very different in the two species. We thank the reviewer for suggesting these relevant additional analyses.

      - While the authors acknowledge in the discussion that the number of monkeys included in the study is considerably lower compared to humans, it would be informative to know the variability of the results among human participants. 

      We agree that this is an interesting question, although it is also very open-ended. For instance, we could report each subjects’ individual whole-brain results, but this would take too much space (and the interested reader will be able to do so from the data that we make available as part of this publication). As a step in this direction, we provide below a figure showing the individual congruity effects, separately for each experiment and for each ROI of table 5, and for each of the 52 participants for whom an fMRI localizer was available:

      Author response image 1.

      Difference in mean betas between congruent and incongruent conditions in a-priori linguistic and mathematical ROIs (see definition and analyses in Table 5) in both experiments (experiment 1 = AV, left panel; experiment 2= VV, right panel). Dots correspond to participants (red: canonical trials, green reversed trials).The boxplot notch is located at the median and the lower and upper box hinges at the 25th and 75th centiles. Whiskers extend to 1.5 inter-quartile ranges on either side of the hinges. ROIs are ranked by the median of the Incongruent-Congruent difference across canonical and reversed order, within a given experiment. For purposes of comparison between the two experiments, we have underlined with colors the top-five common ROIs between the two experiments. N.s.: non-significant congruity effect (p>0.05)

      Several regions show a rather consistent difference across subjects (see, for instance, the posterior STS in experiment 1, left panel). Overall, only 3 of the 52 participants did not show any beta superior to 2 in canonical or reversed in any ROIs. The consistency is quite striking, given the limited number of test trials (in total only 16 incongruent trials per direction per participant), and the fact that these ROIs were selected for their responses to spoken or written  sentences, as part of a subsidiary task quite different from the main task.

      - Some details are missing in the methods.  

      Thank you for these comments, we reply to them point-by-point below.

      Reviewer #3 (Public Review): 

      This study investigates the hypothesis that humans (but not non-human primates) spontaneously learn reversible temporal associations (i.e., learning a B-A association after only being exposed to A-B sequences), which the authors consider to be a foundational property of symbolic cognition. To do so, they expose humans and macaques to 2-item sequences (in a visual-auditory experiment, pairs of images and spoken nonwords, and in a visual-visual experiment, pairs of images and abstract geometric shapes) in a fixed temporal order, then measure the brain response during a test phase to congruent vs. incongruent pairs (relative to the trained associations) in canonical vs. reversed order (relative to the presentation order used in training). The advantage of neuroimaging for this question is that it removes the need for a behavioral test, which non-human primates can fail for reasons unrelated to the cognitive construct being investigated. In humans, the researchers find statistically indistinguishable incongruity effects in both directions (supporting a spontaneous reversible association), whereas in monkeys they only find incongruity effects in the canonical direction (supporting an association but a lack of spontaneous reversal). Although the precise pattern of activation varies by experiment type (visual-auditory vs. visual-visual) in both species, the authors point out that some of the regions involved are also those that are most anatomically different between humans and other primates. The authors interpret their finding to support the hypothesis that reversible associations, and by extension symbolic cognition, is uniquely human. 

      This study is a valuable complement to prior behavioral work on this question. However, I have some concerns about methods and framing. 

      We thank the reviewer for the careful summary of the manuscript, and the positive comments.

      Methods - Design issues: 

      The authors originally planned to use the same training/testing protocol for both species but the monkeys did not learn anything, so they dramatically increased the amount of training and evaluation. By my calculation from the methods section, humans were trained on 96 trials and tested on 176, whereas the monkeys got an additional 3,840 training trials and 1,408 testing trials. The authors are explicit that they continued training the monkeys until they got a congruity effect. On the one hand, it is commendable that they are honest about this in their write-up, given that this detail could easily be framed as deliberate after the fact. On the other hand, it is still a form of p-hacking, given that it's critical for their result that the monkeys learn the canonical association (otherwise, the critical comparison to the non-canonical association is meaningless). 

      Thank you for this comment. 

      Indeed, for experiment 1, the amount of training and testing was not equal for the humans and monkeys, as also mentioned by reviewer 2. We now describe in more detail how many training and imaging days we used for each experiment and each species, as well as the number of blocks per day and the number of trials per block (see lines 572-577). We also added the information on the amount of training receives to all of the legends of the Tables.

      We are sorry for giving the impression that we trained until the monkeys learned this. This was not the case. Based on previous literature, we actually anticipated that the short training would not be sufficient, and therefore planned additional training in advance. Specifically, Meyer & Olson (2011) had observed pair learning in the inferior temporal cortex of macaque monkeys after 816 exposures per pair. This is similar to the additional training we gave, about 80 blocks with 12 trials per pair per block. This is  now explained in more detail (lines 577-580).

      Furthermore, we strongly disagree with the pejorative term p-hacking. The aim of the experiment was not to show a congruency effect in the canonical direction in monkeys, but to track and compare their behavior in the same paradigm as that of humans for the reverse direction. It would have been unwise to stop after human-identical training and only show that humans learn better, which is a given. Instead, we looked at brain activations at both times, at the end of human-identical training and when the monkeys had learned the pairs in the canonical direction. 

      Finally, in experiment 2, monkeys were tested after the same 3 days of training as humans. We wrote: “Using this design, we obtained significant canonical congruity effects in monkeys on the first imaging day after the initial training (24 trials per pair), indicating that the animals had learned the associations” (lines 252-253).

      (2) Between-species comparisons are challenging. In addition to having differences in their DNA, human participants have spent many years living in a very different culture than that of NHPs, including years of formal education. As a result, attributing the observed differences to biology is challenging. One approach that has been adopted in some past studies is to examine either young children or adults from cultures that don't have formal educational structures. This is not the approach the authors take. This major confound needs to minimally be explicitly acknowledged up front. 

      Thank you for raising this important point. We already had a section on “limitations” in the manuscript, which we now extended (line 478-485). Indeed, this study is following a previous study in 5-month-old infants using EEG, in which we already showed that after learning associations between labels and categories, infants spontaneously generalize learning to the reversed pairs after a short learning period in the lab (Kabdebon et al, PNAS, 2019). We also cited preliminary results of the same paradigm as used in the current study but using EEG in 4-month-old infants (Ekramnia and Dehaene-Lambertz, 2019), where we replicated the results obtained by Kabdebon et al. 2019 showing that preverbal infants spontaneously generalize learning to the reversed pairs. 

      Functional MRI in awake infants remains a challenge at this age (but see our own work, DehaeneLambertz et al, Science, 2002), especially because the experimental design means only a few trials in the conditions of interest (10%) and thus a long experimental duration that exceed infants’ quietness and attentional capacities in the noisy MRI environment. (We discuss this on lines 493-496.)

      (3) Humans have big advantages in processing and discriminating spoken stimuli and associating them with visual stimuli (after all, this is what words are in spoken human languages). Experiment 2 ameliorates these concerns to some degree, but still, it is difficult to attribute the failure of NHPs to show reversible associations in Experiment 1 to cognitive differences rather than the relative importance of sound string to meaning associations in the human vs. NHP experiences. 

      As the reviewer wrote, we deliberately performed Experiment 2 with visual shapes to control for various factors that might have explained the monkeys' failure in Experiment 1. 

      (4) More minor: The localizer task (math sentences vs. other sentences) makes sense for math but seems to make less sense for language: why would a language region respond more to sentences that don't describe math vs. ones that do? 

      The referee is correct: our use of the word “reciprocally” was improper (although see Amalric et Dehaene, 2016 for significant differences in both directions when non-mathematical sentences concern specific knowledge). We changed the formulation to clarify this as follows: “In these ROIs, we recovered the subject-specific coordinates of each participant’s 10% best voxels in the following comparisons: sentences vs rest for the 6 language Rois ; reading vs listening for the VWFA ; and numerical vs non-numerical sentences for the 8 mathematical ROIs.” (lines 678-680).

      Methods - Analysis issues: 

      (5) The analyses appear to "double dip" by using the same data to define the clusters and to statistically test the average cluster activation (Kriegeskorte et al., 2009). The resulting effect sizes are therefore likely inflated, and the p-values are anticonservative. 

      It is not clear to us which result the reviewer is referring to. In Tables 1-4, we report the values that we found significant in the whole brain analysis, we do not report additional statistical tests for this data. For Table 5, the subject-specific voxels were identified through a separate localizer experiment, which was designed to pinpoint the precise activation areas for each subject in the domains of oral and written language-processing and math. Subsequently, we compared the activation at these voxel locations across different conditions of the main experiment. Thus, the two datasets were distinct, and there was no double dipping. In both interpretations of the comment, we therefore disagree with the reviewer.

      Framing: 

      (6) The framing ("Brain mechanisms of reversible symbolic reference: A potential singularity of the human brain") is bigger than the finding (monkeys don't spontaneously reverse a temporal association but humans do). The title and discussion are full of buzzy terms ("brain mechanisms", "symbolic", and "singularity") that are only connected to the experiments by a debatable chain of assumptions. 

      First, this study shows relatively little about brain "mechanisms" of reversible symbolic associations, which implies insights into how these associations are learned, recognized, and represented. But we're only given standard fMRI analyses that are quite inconsistent across similar experimental paradigms, with purely suggestive connections between these spatial patterns and prior work on comparative brain anatomy. 

      We agree with the referee that the term “mechanism” is ambiguous and, for systems neuroscientists, may suggest more than we are able to do here with functional MRI. We changed the title to “Brain areas for reversible symbolic reference, a potential singularity of the human brain”. This title better describes our specific contribution: mapping out the areas involved in reversibility in humans, and showing that they do not seem to respond similarly in macaque monkeys.

      Second, it's not clear what the relationship is between symbolic cognition and a propensity to spontaneously reverse a temporal association. Certainly, if there are inter-species differences in learning preferences this is important to know about, but why is this construed as a difference in the presence or absence of symbols? Because the associations aren't used in any downstream computation, there is not even any way for participants to know which is the sign and which is the signified: these are merely labels imposed by the researchers on a sequential task. 

      As explained in the introduction, the reversibility test addressed a very minimal core property of symbolic reference. There cannot be a symbol if its attachment doesn’t operate in both directions. Thus, this property is necessary – but we agree that it is not sufficient. Indeed, more tests are needed to establish whether and how the learned symbols are used in further downstream compositional tasks (as discussed in our recent TICS papers, Dehaene et al. 2022). We added a sentence in the introduction to acknowledge this fact:

      “Such reversibility is a core and necessary property of symbols, although we readily acknowledge that it is not sufficient, since genuine symbols present additional referential and compositional properties that will not be tested in the present work.” (lines 89-92).

      Third, the word "singularity" is both problematically ambiguous and not well supported by the results. "Singularity" is a highly loaded word that the authors are simply using to mean "that which is uniquely human". Rather than picking a term with diverse technical meanings across fields and then trying to restrict the definition, it would be better to use a different term. Furthermore, even under the stated definition, this study performed a single pairwise comparison between humans and one other species (macaques), so it is a stretch to then conclude (or insinuate) that the "singularity" has been found (see also pt. 2 above). 

      We have published an extensive review including a description of our use of the term “singularity” (Dehaene et al., TICS 2022). Here is a short except: “Humans are different even in domains such as drawing and geometry that do not involve communicative language. We refer to this observation using the term “human cognitive singularity”, the word singularity being used here in its standard meaning (the condition of being singular) as well as its mathematical sense (a point of sudden change). Hominization was certainly a singularity in biological evolution, so much so that it opened up a new geological age (the Anthropocene). Even if evolution works by small continuous change (and sometimes it doesn’t [4]), it led to a drastic cognitive change in humans.”

      We find the referee’s use of the pejorative term ”insinuate” quite inappropriate. From the title on, we are quite nuanced and refer only to a “potential singularity”. Furthermore, as noted above, we explicitly mention in the discussion the limitations of our study, and in particular the fact that only a single non-human species was tested (see lines 486-493). We are working hard to get chimpanzee data, but this is remarkably difficult for us, and we hope that our paper will incite other groups to collect more evidence on this point.

      (7) Related to pt. 6, there is circularity in the framing whereby the authors say they are setting out to find out what is uniquely human, hypothesizing that the uniquely human thing is symbols, and then selecting a defining trait of symbols (spontaneous reversible association) *because* it seems to be uniquely human (see e.g., "Several studies previously found behavioral evidence for a uniquely human ability to spontaneously reverse a learned association (Imai et al., 2021; Kojima, 1984; Lipkens et al., 1988; Medam et al., 2016; Sidman et al., 1982), and such reversibility was therefore proposed as a defining feature of symbol representation reference (Deacon, 1998; Kabdebon and DehaeneLambertz, 2019; Nieder, 2009).", line 335). They can't have it both ways. Either "symbol" is an independently motivated construct whose presence can be independently tested in humans and other species, or it is by fiat synonymous with the "singularity". This circularity can be broken by a more modest framing that focuses on the core research question (e.g., "What is uniquely human? One possibility is spontaneous reversal of temporal associations.") and then connects (speculatively) to the bigger conceptual landscape in the discussion ("Spontaneous reversal of temporal associations may be a core ability underlying the acquisition of mental symbols").

      We fail to understand the putative circularity that the referee sees in our introduction. We urge him/her to re-read it, and hope that, with the changes that we introduced, it does boil down to his/her summary, i.e. “What is uniquely human? One possibility is spontaneous reversal of temporal associations."

      Reviewer #1 (Recommendations For The Authors): 

      In general, the manuscript was very clear, easy to read, and compelling. I would recommend the authors carefully check the text for consistency and minor typos. For example: 

      The sample size for the monkeys kept changing throughout the paper. E.g., Experiment 1: n = 2 (line 149); n = 3 (line 205).  

      Thank you for catching this error, we corrected it. The number of animals was indeed 2  for experiment 1, and 3 for experiment 2. (Animals JD and YS participated in experiment 1 and JD, JC and DN in experiment 2. So only JD participated in both experiments.)

      Similarly, the number of stimulus pairs is reported inconsistently (4 on line 149, 5 pairs later in the paper). 

      We’re sorry that this was unclear. We used 5 sets of 4 audio-visual pairs each. We now clarify this, on line 157 and on lines 514-516.

      At least one case of p>0.0001, rather than p < 0.0001 (I assume). 

      Thank you once again, we now corrected this.

      Reviewer #2 (Recommendations For The Authors): 

      One major issue in the study is the absence of significant results in monkeys. Indeed, the authors draw conclusions regarding the lack of significant difference in activity related to surprise in the multidemand network (MDN) in the reverse congruent versus reverse incongruent conditions. Although the results are convincing (especially with the significant interaction between congruency and canonicity), the article could be improved by including additional analyses in a priori ROI for the MDN in monkeys (as well as in humans, for comparison). In other words: what are the statistics for the MDN regarding congruity, canonicity, and interaction in both species? Since the authors have already performed this type of analysis for language and Math ROIs (table 5), it should be relatively easy for them to extend it to the MDN. Demonstrating that results in monkeys are far from significant could further convince the reader. 

      Furthermore, while the authors acknowledge in the discussion that the number of monkeys included in the study is considerably lower compared to humans, it would be informative to know the variability of the results among human participants. Specifically, it would be valuable to describe the proportion of human participants in which the effects of congruency, canonicity, and their interaction are significant. Additionally, stating the variability of the F-values for each effect would provide reassurance to the reader regarding the distinctiveness of humans in comparison to monkeys. Low variability in the results would serve to mitigate concerns that the observed disparity is merely a consequence of testing a unique subset of monkeys, which may differ from the general population. Indeed, this would be a greater support to the notion that the dissimilarity stems from a genuine distinction between the two species. 

      We responded to both of these points above.

      In terms of methods, details are missing: 

      - How many trials of each condition are there exactly? (10% of 44 trials is 4.4) : 

      We wrote: “In both humans and monkeys, each block started with 4 trials in the learned direction (congruent canonical trials), one trial for each of the 4 pairs (2 O-L and 2 L-O pairs). The rest of the block consisted of 40 trials in which 70% of trials were identical to the training; 10% were incongruent pairs but the direction (O-L or L-O) was correct (incongruent canonical trials), thus testing whether the association was learned; 10% were congruent pairs but the direction within the pairs was reversed relative to the learned pairs (congruent reversed trials) and 10% were incongruent pairs in reverse (incongruent reversed trials).”(See lines 596-600.)

      Thus, each block comprised 4 initial trials, 28 canonical congruent trials, 4 canonical incongruent, 4 reverse congruent and 4 reverse incongruent trials, i.e. 4+28+3x4=40 trials.

      - How long is one trial? 

      As written in the method section: “In each trial, the first stimulus (label or object) was presented during 700ms, followed by an inter-stimulus-interval of 100ms then the second stimulus during 700ms. The pairs were separated by a variable inter-trial-interval of 3-5 seconds” i.e. 700+100+700=1500, plus 3 to 4.75 seconds of blank between the trials (see lines 531-533).

      - How are the stimulus presentations jittered? 

      See : “The pairs were separated by a variable inter-trial-interval randomly chosen among eight different durations between 3 and 4.75 seconds (step=250 ms). The series of 8 intervals was randomized again each time it was completed.”(lines 533-535).

      - What is the statistical power achieved for humans? And for monkeys? 

      We know of no standard way to define power for fMRI experiments. Power will depend on so many parameters, including the fMRI signal-to-noise ratio, the attention of the subject, the areas being considered, the type of analysis (whole-brain versus ROIs), etc.

      - Videos are mentioned in the methods, is it the image and sound? It is not clear. 

      We’re sorry that it was unclear. Video’s were only used for the training of the human subjects. We now corrected this in the method section (lines 552-554).

      Reviewer #3 (Recommendations For The Authors): 

      The main recommendations are to adjust the framing (making it less bold and more connected to the empirical evidence) and to ensure independence in the statistical analyses of the fMRI data. 

      See our replies to the reviewer’s comments on “Framing” above. In particular, we changed the title of the paper from “Brain mechanisms of reversible symbolic reference” to “Brain areas for reversible symbolic reference”.

      References cited in this response

      Dehaene, S., Al Roumi, F., Lakretz, Y., Planton, S., & Sablé-Meyer, M. (2022). Symbols and mental programs : A hypothesis about human singularity. Trends in Cognitive Sciences, 26(9), 751‑766. https://doi.org/10.1016/j.tics.2022.06.010.

      Dehaene-Lambertz, Ghislaine, Stanislas Dehaene, et Lucie Hertz-Pannier. Functional Neuroimaging of Speech Perception in Infants. Science 298, no 5600 (2002): 2013-15. https://doi.org/10.1126/science.1077066.

      Ekramnia M, Dehaene-Lambertz G. 2019. Investigating bidirectionality of associations in young infants as an approach to the symbolic system. Presented at the CogSci. p. 3449.

      Fedorenko E, Duncan J, Kanwisher N (2013) Broad domain generality in focal regions of frontal and parietal cortex. Proc Natl Acad Sci U S A 110:16616-16621.

      Kabdebon, Claire, et Ghislaine Dehaene-Lambertz. « Symbolic Labeling in 5-Month-Old Human Infants ». Proceedings of the National Academy of Sciences 116, no 12 (2019): 5805-10. https://doi.org/10.1073/pnas.1809144116.

      Mitchell, D. J., Bell, A. H., Buckley, M. J., Mitchell, A. S., Sallet, J., & Duncan, J. (2016). A Putative Multiple-Demand System in the Macaque Brain. Journal of Neuroscience, 36(33), 8574‑8585. https://doi.org/10.1523/JNEUROSCI.0810-16.2016

    1. Author response:

      The following is the authors’ response to the original reviews.

      Reviewer 1:

      (1) In several instances the paper does not address apparent inconsistencies between the prior literature and the findings. For example, the first main finding is that recalled items have more differentiated lateral temporal cortex representations within lists than not recalled items. This seems to be the opposite of the prediction from temporal context models that are used to motivate the paper-context models would predict that greater contextual similarity within a list should lead to greater memory through enhanced temporal clustering in recall. This is what El-Kalliny et al (2019) found, using a highly similar design (free recall, intracranial recordings from the lateral temporal lobe). The authors never address this contradiction in any depth to reconcile it with the previous literature and with the motivating theoretical model. 

      Figure 2 supports the findings from El-Kalliny and colleagues because it shows the relationship of each list item relative to the first item (El-Kalliny et al. 2019). Items encoded adjacent to SP1 show the highest spectral similarity supporting the idea of overlapping context predicted by the Temporal Context Model. However, our figure characterizes how increasing inter-item distance affects spectral similarity. It shows that two items successfully recalled from temporally distant serial positions show reduced spectral similarity. These findings align with the predictions of the temporal context model because two temporally distant items would lack significant contextual overlap and therefore would have more distinct spectral representations.

      El-Kalliny and colleagues do use a similar experimental set-up however the authors define drift differently. They identified patients with a tendency to temporally cluster, and observed those patients tend to drift less between temporally clustered items however they do not specify drift relative to a constant serial position as we do in our analysis. They define drift as spectral change between two adjacent items which is a more relative measure between any two items rather than in relation to a fixed point like SP1. Finally, our analysis focuses only on gamma activity while El-Kalliny and colleagues identified drift across a much broader set of frequency bands.

      (2) The way that the authors conduct the analysis of medial parietal neural similarity at boundaries leads to results that cannot be conclusively interpreted. The authors report enhanced similarity across lists for the first item in each list, which they interpret as reflecting a qualitatively distinct boundary signal. However, this finding can readily be explained by contextual drift if one assumes that whatever happens at the start of each list is similar or identical across lists (for example, a get ready prompt or reminder of instructions). The authors do not include analyses to rule this out, which undermines one of the main findings. 

      Extensions of the temporal context model (Lohnas et al. 2015) predict context at the beginning of a list will be most similar to the end of the prior list. The theory assumes a single-context state, consisting of a recency-weighted average of prior items, that is updated, even across different encoding periods.

      However, our results show a boundary item representation is most similar to the prior lists first item rather than the last item. Our results conflict with the extension of TCM because the shared similarity of boundary items suggests the context state for the first item in the list is not a recency-weighted average of the items presented immediately prior. The same boundary sensitive signal is not present in other regions, namely the hippocampus and lateral temporal cortex. Those regions do not show similarity between items at the beginning of each list.  

      Our main conclusion from these data was that the medial parietal lobe activity seems to be specifically sensitive to task boundaries, defined by the first event or the get ready prompt, while other regions are not.

      (3) Although several previous studies have linked hippocampal fMRI and electrophysiological activity at event boundaries with memory performance, the authors do not find similar relationships between hippocampal activity, event boundaries, and memory There are potential explanations for why this might be the case, including the distinction between item vs. associative memory, which has been a prominent feature of previous work examining this question. However, the authors do not address these potential explanations (or others) to explain their findings' divergence from prior work -this makes it difficult to interpret and to draw conclusions from the data about the hippocampus' mechanistic role in forming event memories.

      The following text was added and revised in the discussion to discuss hippocampal activity shown in our results and its lack of sensitivity to boundaries.  

      “Spectral activity in the medial parietal lobe aligned closely with boundaries. Drift between item pairs seemed to reset at each boundary, leading to renewed similarity after each boundary. This observation aligns with previous work suggesting boundaries reset temporal context.  In the temporal cortex, our findings extend prior studies which suggest the temporal lobe may play a role in associating adjacently presented items (Yaffe et al. 2014, ElKalliny et al 2019). We found items encoded in distant serial positions, but within the same list, drifted significantly more than items from adjacent serial positions (Figure 2C). Consistent with the predictions of the temporal context model, the reduced similarity between distant items may reflect reduced contextual overlap proportional to the time elapsed between them. However, across task boundaries, our study did not detect a robust change in drift rate in the medial or lateral temporal cortex. This finding contrasts with significant work (Ben-Yakov et al. 2018, Ezzyat et al.  2014; Griffiths et al. 2020) which shows hippocampal sensitivity to event-boundaries. One interpretation would be that boundary representations in the hippocampus are quite sparse and represented by populations of time-sensitive cells whose activity is indexed to task-related boundaries (Umbach et al. 2020). While the sparse representations may not be detectable in gamma activity, perhaps it suggests drift in these regions represents a more abstract set of contextual features accumulated from multiple brain regions.”

      (4) There is a similar absence of interpretation with respect to the previous literature for the data showing enhanced boundary-related similarity in the medial parietal cortex. The authors’ interpretation seems to be that they have identified a boundary-specific signal that reflects a large and abrupt change in context, however, another plausible interpretation is that enhanced similarity in the medial parietal cortex is related to a representation of a schema for the task structure that has been acquired across repeated instances. 

      We agree our results could suggest the MPL creates a generalized situational model or schematic of the task. Unfortunately, our behavioral task does not allow us to differentiate between these ideas and pure boundary representation. However, given boundaries are a component in defining situational models, we chose to interpret our results conservatively as a form of boundary representation.  

      (5) The authors do not directly compare their model to other models that could explain how variability in neural activity predicts memory. One example is the neural fatigue hypothesis, which the authors mention, however there are no analyses or data to suggest that their data is better fit by a boundary/contextual drift mechanism as opposed to neural fatigue. 

      The study by Lohnas and colleagues does find higher HFA was greater for recalled items but does not describe a serial position specific trend (Lohnas et al. 2020). For our study, we stringently controlled for recall success in each of our analyses. Our main finding of boundary similarity compares recalled boundary items to recalled items in each of the other serial positions. We also show the similarity of nonrecalled items in all serial positions to demonstrate the lack of boundary representation in first list items, when neural fatigue is presumably least present.

      In addition, their study demonstrated neural fatigue in the hippocampus. They did not find evidence of fatigue in the DLPFC, suggesting region-specific mechanisms of neural fatigue. Our results are focused on the medial parietal lobe, and we were not able to find a fatigue model of the region for further comparison. While our results do not rule out the possibility of neural fatigue driving a drifting or boundary signal, we focus on the relevance of the signal to memory performance.

      (6) P2. Line 65 cites Polyn et al (2009b) as an example where ‘random’ boundary insertions improve subsequent memory. However, the boundaries in that study always occurred at the same serial position and were therefore completely predictable and not random.

      The citation was removed from the corresponding sentence.

      (7) P2. Line 74 cites Pu et al. (2022) as an example of medial temporal lobe ‘regional activity’ showing sensitivity to event boundaries; however, this paper reported behavioral and computational modeling results and did not include measurement of neural activity. 

      The citation was removed from the corresponding sentence.

      (8) P.3 Line 117, Hseih et al (2014) and Hseih and Ranganath (2015) are cited as evidence that ‘spectral’ relatedness decreases as a function of distance, but neither of these studies examined ‘spectral’ activity (fMRI univariate and multivariate). The manuscript would benefit from a careful review and updating of how the prior literature is cited, which will increase the impact of the findings for readers. 

      The text has been updated to reflect this distinction by modifying the statement to:  “Previous work consistent with temporal context models suggests neural pattern similarity reduces as a function of distance between related memories.”

      (9) Several previous studies have found hippocampal activity at event boundaries correlates with memory performance (Ben-Yakov et al 2011, 2018; Baldassano et al 2017), yet here the authors do not find evidence for hippocampal activity at event boundaries related to memory. Does this difference reflect something important about how the hippocampus vs. medial parietal cortex vs. lateral temporal cortex contribute to memory formation? Currently, there is not much discussion about how to interpret the differences between brain regions. Previous work has suggested that hippocampal pattern similarity at event boundaries specifically supports associative memory across events (Ezzyat & Davachi, 2014; Griffiths & Fuentemilla, 2020; Heusser et al., 2016), which may help explain their findings. In any case the authors could increase the impact of their paper by further situating their findings within the previous literature. 

      We would not suggest there is no boundary-related activity in the hippocampus. Similar to an earlier point made by the reviewer, to clarify our interpretation of regional differences, the following text has been added to the discussion.  

      “However, across task boundaries, our study did not detect a robust change in drift rate in the medial or lateral temporal cortex. This finding contrasts with significant work (Ezzyat and Davachi, 2014; Griffiths and Fuentemilla, 2020) which shows hippocampal sensitivity to event-boundaries. One interpretation would be that boundary representations in the hippocampus are quite sparse and represented by populations of time-sensitive cells whose activity is indexed to task-related boundaries (Umbach et al 2020). While the sparse representations may not be detectable in gamma activity, perhaps it suggests drift in these regions represents a more abstract set of contextual features accumulated from multiple brain regions (Baldassano et al. 2017). “

      (10) The authors mention neural fatigue as an alternative theory to explain the primacy effect (Serruya et al., 2014), however there are no analyses or data to suggest that their data is better fit by a boundary mechanism as opposed to neural fatigue. Previous studies have shown that gamma activity in the hippocampus changes with serial position and with encoding history (Serruya et al 2014; Lohnas et al 2020). Here, the authors could compare the reported pattern similarity results to control analyses that replicate this prior work, which would strengthen their argument that there is unique information at boundaries that is distinct from a neural fatigue signal. 

      The serial position effects described by Serruya and colleagues describe decreasing HFA with increasing serial position in the MTL, lateral temporal cortex and prefrontal cortex (Serruya et al. 2014). Despite their findings, we do not observe a strong boundary effect in those regions (see Supp Fig 3 a,b). The lack of boundary effect in regions where HFA is selectively increased for primacy items suggests the global neural fatigue model does not account for our results.

      Notably, the authors do not characterize HFA trends in the MPL. Nevertheless, their findings do not rule out the possibility of a boundary effect driving the HFA. We demonstrate boundary-relevant HFA only in the MPL but not in other regions. In addition, we show a correlation between SP1 recalls and boundary representation strength, as well as a conserved similarity of multiple boundary-adjacent items.  

      Next, the neural fatigue study by Lohnas and colleagues does find higher HFA was greater for recalled items but does not describe a serial position specific trend (Lohnas et al. 2015). For our study, we stringently controlled for recall success in each of our analyses. Our main finding of boundary similarity compares recalled boundary items to recalled items in each of the other serial positions. We also show the similarity of non-recalled items in all serial positions to demonstrate the lack of boundary representation in the first list items, when neural fatigue is presumably least present.

      In addition, their study demonstrated neural fatigue in the hippocampus. They did not find evidence of fatigue in the DLPFC, suggesting region-specific mechanisms of neural fatigue. Our results are focused on the medial parietal lobe, and we were not able to find a fatigue model of the region for further comparison. While our results do not rule out the possibility of neural fatigue driving a drifting or boundary signal, we focus on the relevance of the signal to memory performance.

      (11) For the analyses that examine cross-list similarity (e.g. the medial parietal analysis in Figure 3), how did the authors choose the number of lists over which similarity was calculated? Was the selection of this free parameter cross-validated to ensure that it is not overfitting the data? Given that there were 25 lists per session, using the three succeeding lists seems arbitrary. Why not use every list across the whole session? 

      Given the volume of data, number of patients, and computational time available at our facility, we extended the analysis as far as we could to characterize the observed trend.

      (12) P4. Line 155 says that Figure 3C shows example subject data, but it looks like it is actually Figure 3D. 

      The text was updated to reference the correct figure.

      (13) The t-tests on P.4 Line 159 have two sets of degrees of freedom but should only have one. 

      The t-tests described by Figure 3B represent the mean parameter estimate of the predictor for boundary proximity contrasted by region for all item pairs. The statistical test in this case was an unpaired t-test between parameter estimates for patients with electrodes in each of the regions. The numbers within parentheses represent the sample size, or number of subjects, contributing electrodes to each region.

      Reviewer 2:

      (1) Because this is not a traditional event boundary study, the data are not ideally positioned to demonstrate boundary specific effects. In a typical study investigating event boundary effects, a series of stimuli are presented and within that series occurs an event boundary – for instance, a change in background color. The power of this design is that all aspects between stimuli are strictly controlled – in particular, the timing – meaning that the only difference between boundary-bridging items is the boundary itself. The current study was not designed in this manner, thus it is not possible to fully control for effects of time or that multiple boundaries occur between study lists (study to distractor, distractor to recall, recall to study). Each list in a free recall study can be considered its own “mini” experiment such that the same mechanisms should theoretically be recruited across any/all lists. There are multiple possible processes engaged at the start of a free recall study list which may not be specific to event boundaries per se. For example, and as cited by the authors, neural fatigue/attentional decline (and concurrent gamma power decline) may account for serial position effects. Thus, SP1 on all lists will be similar by virtue of the fact that attention/gamma decrease across serial position, which may or may not be a boundaryspecific effect. In an extreme example, the analyses currently reported could be performed on an independent dataset with the same design (e.g. 12 word delayed free recall) and such analyses could potentially reveal high similarity between SP1-list1 in the current study and SP1-list1 in the second dataset, effects which could not be specifically attributed to boundaries.

      The neural fatigue study by Lohnas and colleagues does find higher HFA was greater for recalled items but does not describe a serial position specific trend (Lohnas et al. 2020). For our study, we stringently controlled for recall success in each of our analyses. Our main finding of boundary similarity compares recalled boundary items to recalled items in each of the other serial positions. We also show the similarity of non-recalled items in all serial positions to demonstrate the lack of boundary representation in the first list items, when neural fatigue is presumably least present.

      In addition, their study demonstrated neural fatigue in the hippocampus. They did not find evidence of fatigue in the DLPFC, suggesting region-specific mechanisms of neural fatigue. Our results are focused on the medial parietal lobe, and we were not able to find a fatigue model of the region for further comparison. While our results do not rule out the possibility of neural fatigue driving a drifting or boundary signal, we focus on the relevance of the signal to memory performance.

      (2) Comparisons of recalled "pairs" does not account for the lag between those items during study or recall, which based on retrieved context theory and prior findings (e.g. Manning et al., 2011), should modulate similarity between item representations. Although the GLM will capture a linear trend, it will not reveal serial position specific effects. It appears that the betas reported for the SP12 analyses are driven by the fact that similarity with SP12 generally increases across serial position, rather a specific effect of "high similarity to SP12 in adjacent lists" (Page 5, excluding perhaps the comparison with list x+1). It is also unclear how the SP12 similarity analyses support the statement that "end-list items are represented more distinctly, or less similarly, to all succeeding items" (Page 5). It is not clear how the authors account for the fact that the same participants do not contribute equally to all ROIs or if the effects are consistent if only participants who have electrodes in all ROIs are included.

      In our study, all pairs are defined by the lag between a reference and target item. The results in Figure 3 show the similarity between each serial position in relation to SP1; Figure 4 shows lag between each serial position relative to SP2 and 3; and Figure 5 shows lag relative to SP12. Each statistical model accounts for the lag by ordering the data by increased inter-item distance. Further, our definition of lag is significantly more rigorous than that used by Manning and colleagues. Our similarity results for Figures 3-5 characterize the change in similarity relative to a constant reference point, such as SP1, rather than a relative reference point, such as +1 lag, which aggregates similarity between pairs such as SP1 to SP2 with SP4 to SP5, which maybe recalled via different memory mechanisms.  

      In Figure 5, we agree your characterization that ‘similarity with SP12 generally increases across serial position’ is a more accurate description of the trend. The text has been updated to reflect this by changing the interpretation to “later serial positions in adjacent lists shared a gradually increasing similarity to SP12.”  

      Next, we clarify the statement "end-list items are represented more distinctly, or less similarly, to all succeeding items". When recalling SP12, the subsequent items recalled exhibit significantly lower similarity to SP12 (see Figure 5D, pink). Consequently, the spectral representation of successfully recalled end-list items appears more distinct from later items in similar serial positions. This stands in contrast to our observations illustrated in Figures 3 and 4, where successfully recalled start-list items demonstrate greater similarity to later items in similar serial positions.

      (3) The authors use the term "perceptual" boundary which is confusing. First, "perceptual boundary" seems to be a specific subset of the broader term "event boundary," and it is unclear why/how the current study is investigating "perceptual" boundaries specifically. Second and relatedly, the current study does not have a sole "perceptual" boundary (as discussed in point 1 above), it is really a combination of perceptual and conceptual since the task is changing (from recalling the words in the previous list to studying the words in the current list OR studying the words in the current list to solving math problems in the current list) in addition to changes in stimulus presentation. 

      We agree with the statement that ‘perceptual’ as a modifier to the boundaries described here does not add significant information. Therefore, we have removed all reference to perceptual boundaries.

      (4) Although the results show that item-item similarity in the gamma band decreases across serial position, it is unclear how the present findings further describe "how gamma activity facilitates contextual associations" (Page 5). As mentioned in point 1 above, such effects could be driven by attentional declines across serial position -- and a concurrent decline in gamma power -- which may be unrelated to, and actually potentially impair, the formation of contextual associations, given evidence from the literature that increased gamma power facilitates binding processes.

      We agree that our study does not elucidate a mechanistic relationship between gamma power and contextual associations. The referenced sentence has been changed to: “how gamma activity is associated with context”.

      Please see our response to point 1 above. In addition, studies demonstrating decreasing gamma power with increasing serial position focus primarily on the MTL, lateral temporal cortex and prefrontal cortex (Serruya et al. 2012). Despite their findings, we do not observe a strong boundary effect in those regions (see Supp Fig 3 a,b). The lack of boundary effect in regions where HFA is selectively increased for primacy items suggests the global attentional decline or neural fatigue model does not account for our results.

      Notably, HFA trends in the MPL are poorly described. Further, gamma power decline does not rule out the possibility of a boundary effect driving the HFA. We demonstrate boundary-relevant HFA only in the MPL but not in other regions. In addition, we show a correlation between SP1 recalls and boundary representation strength, as well as a conserved similarity of multiple boundary-adjacent items.

      (5) Some of the logic and interpretations are inconsistent with the literature. For example, the authors state that "The temporal context model (TCM) suggests that gradual drift in item similarity provides context information to support recovery of individual items" however, this does not seem like an accurate characterization of TCM. According to TCM, context is a recency-weighted average of previous experience. Context "drifts" insofar as information is added to/removed from context. Context drift thus influences item similarity -- it is not that item similarity itself drifts, but that any change in item-item similarity is due to context drift. 

      The current findings do not appear at odds with the conceptualization of drift and context in current version of the context maintenance and retrieval model. Furthermore, the context representation is posited to include information beyond basic item representations. Two items, regardless of their temporal distance, can be associated with similar contexts if related information is included in both context representations, as predicted and shown for multiple forms of relatedness including semantic relatedness (Manning & Kahana, 2012) and task relatedness (Polyn et al., 2012).

      We revised the sentence and encompassing paragraph to describe the temporal context model more accurately and emphasize how our findings align with the stated version of CMR. The revised text is below:  

      “Next, we asked how gamma spectral activity reflects contextual association between items. In the medial parietal lobe, we observed recurring similarity between items distant in time but adjacent to boundaries. This pattern suggests spectral activity may carry information about an item's relationship to a boundary. These observations align with the Context Maintenance and Retrieval model which extends the predictions of TCM to encompass broader relationships among items. Our results demonstrate boundaries as an important aspect of context and specify the spectral and regional properties of these boundary-related contextual features.”

      (6) Lohnas et al. (2020) Neural fatigue influences memory encoding in the human hippocampus, Neuropsychologia, should be cited when discussing neural fatigue

      Thank you for your suggestion. The citation has been added to the text.

      (7) A within-list, not an across list, similarity analysis should be used to test the interpretation that end-of-list items are more distinct than other list items.

      We believe this recommendation refers to the following line in our text: “These findings suggest end-list items are represented more distinctly, or less similarly, to all succeeding items.” Our statement compares list x, SP12 to all succeeding items (in list x+1, x+2, etc.). Therefore, this statement refers to items in the next lists which is why we performed an across list analysis rather than within-list one.

      (8) It is unclear why it is necessary to use PCA to estimate similarity between items.

      PCA was used to reduce the dimensionality of the time-frequency matrix for the gamma band. This technique allowed us to compare predominant trends in gamma between items. In addition, we added a figure showing 3 example subjects in Figure 3 – supplementary figure 2D to show unique time-frequency components contribute to signal reconstructed from the PCs for each subject. Therefore, the boundary representation may be represented differently for each patient.

      (9) Lags are listed as -4, 4 (Page 8), however with a list length of 12, possible lags should be 11, 11.

      The listed parenthetical statement ‘(-4 to 4)’ referred to Figure 1 where Lag CRP is shown for transitions from -4 to 4. However, we did calculate lag CRP for all possible transitions. Therefore, the referenced phrase was changed to: “Lagged CRP was calculated for all possible transitions (-11 to 11).”

      (10) Hsieh et al. 2014 and Hsieh & Ranganath (2015) are fMRI studies and as such, do not support the statement "Previous work consistent with temporal context models suggests spectral relatedness reduces as a function of distance between words" (Page 3). 

      The statement has been revised to: “Previous work consistent with temporal context models suggests neural pattern similarity reduces as a function of distance between related memories.”

      (11) Although statistically one can measure "How item-item similarity is affected by recollection" (Page 3), this is logically backwards, given that similarity during study necessarily precedes performance during free recall. Additionally, it is erroneous to assume that recalled words are "recollected" without additional measurements (e.g. Mickes et al. (2013) Rethinking familiarity: Remember/Know judgments in free recall, JML).

      The statement was changed to “item-item similarity is affected based on successful recall” given recollection cannot be determined in our paradigm.

      Reviewer 3:

      (1) My primary confusion in the current version of this paper is that the analyses don't seem to directly compare the two proposed models illustrated in Fig 1B, i.e. the temporal context model (with smooth drifts between items, including across lists) versus the boundary model (with similarities across all lists for items near boundaries). After examining smooth drift in the within-list analysis (Fig 2), the across-list analyses (Figs 3-5) use a model with two predictors (boundary proximity and list distance), neither of which is a smoothlydrifting context. Therefore there does not appear to be a quantitative analysis supporting the conclusion that in lateral temporal cortex "drift exhibits a relationship with elapsed time regardless of the presences of intervening boundaries" (lines 272-3).

      We could not use a smoothly drifting regressor due to its collinearity with any model of boundary similarity. Therefore, we chose our two regressors: boundary proximity, which models intra-list changes in similarity and list distance, which models a stepwise decrease in similarity from adjacent lists.

      However, we agree with the comment that the presented data does not directly support the lateral temporal cortex drifts independent of intervening boundaries. Therefore, we amended the statement to: “We found successfully recalled items encoded in distant serial positions drifted significantly more than items from adjacent serial positions (Figure 2C)”. Consistent with the predictions of the temporal context model, the reduced similarity between distant items may reflect reduced contextual overlap proportional time elapsed between them.”

      (2) The feature representation used for the neural response to each item is a gamma power time-frequency matrix. This makes it unclear what characteristics of the neural response are driving the observed similarity effects. It appears that a simple overall scaling of the response after boundaries (stronger responses to initial items during the beginning portion of the 1.6s time window) would lead to the increased cosine similarity between initial items, but wouldn't necessarily reflect meaningful differences in the neural representation or context of these items.

      Our study aims to draw the connection between the neural response after boundaries with neural representation and context of these items. Prior studies (Manning et al. 2011, El Kalliny et al. 2017) have interpreted similarity in neural spectra as a memory relevant phenomenon. We use very similar methods to perform our analysis.  

      In addition, we compare the fit of our boundary similarity model to behavioral performance to show increased boundary representation correlates with improved boundary item recall.

      While our study does not specify which time-frequency components underly the increased similarity, we do limit our analysis to the gamma band. Traditional analyses include log-scaled, broadband time-frequency data (eg. 3-100hz) from which we specify the relevance of a much narrower spectral band.  

      Finally, we tried to study which time–frequency components contributed to the increased similarity, but it varied greatly between patients (see Figure 3 – supplementary figure 2D). Hence, we opted to use principal component analyses to compare the features showing the most variation for each given participant. This added analytical step allows us to detect boundary effects across patients despite individual variability in boundary representation.

      (3) The specific form of the boundary proximity models is not well justified. For initial items, a model of e^(1-d) is used (with d being serial position), but it is not stated how the falloff scale of this model was selected (as opposed to e.g. e^((1-d)/2)). For final items, a different model of d/#items is used, which seems to have a somewhat different interpretation (about drift between boundaries, rather than an effect specific to items near a final boundary). The schematic in Fig 1B appears to show a hypothesis which is not tested, with symmetric effects at initial and final boundaries.

      The boundary proximity models were chosen empirically. Our model was intended to quantify a decreasing relationship across many patients. We acknowledge the constants and variables may not definitively describe underlying neural processes.  

      For start- and end-list boundaries, we used different models because primacy and recency effects are unique phenomena. Primacy memory is classically thought to arise from rehearsal during the encoding time (Polyn et al. 2009, Lohnas et al. 2015). Alternatively, recency memory is thought to arise from strong contextual cues of recency items during recall due to their temporal proximity. Therefore, we have a limited basis on which to assume their spectral representation in relation to task boundaries would be symmetric.

      (4) The main text description of Fig 2 only describes drift effects in lateral temporal cortex, but Fig 2 - supplement 1 shows that there is also drift and a significant subsequent memory effect in the other two ROIs as well. There is not a significant memory x drift slope interaction in these regions; are the authors arguing that the lack of this interaction (different drift rates for remembered versus forgotten items) is critical for interpreting the roles of lateral temporal cortex versus medial parietal and hippocampal regions?

      Yes. Fig 2- Supplement 1 shows that drift occurs in both the HC and MPL. However, the interaction term is not significant, which suggests that the rate of drift between recalled and non-recalled items is not significantly different.  

      In contrast, Fig 2C shows that recalled pairs drift at a higher rate than non-recalled pairs. For the LTC, the interaction term is negative in magnitude and statistically significant. This suggests successfully encoded item pairs encoded far apart share more distinct spectral representations, specifically in the LTC. These findings lead to our interpretation in the discussion that “elevated drift rate might allow the representations of recalled items to remain distinct but ordered in memory.”

      (5) The parameter fits for the "list distance" regressor are not shown or analyzed, though they do appear to be important for the observed similarity structure (e.g. Fig 3E). I would interpret this regressor as also being "boundary-related" in the sense that it assumes discrete changes in similarity at boundaries.

      Parameter fits for the ‘list distance’ regressor are now shown in the supplementary portion of Figures 3 and Figure 5. The difference between regions is non-significant.

      (6) To make strong claims about temporal context versus boundary models as implied by Fig 1B, these two regressors should be fit within the same model to explain across-list similarity. The temporal context model could be based on the number of intervening items (as in Fig 1B) or actual time elapsed between items. The relationship between the smoothly drifting temporal context model and the discretely-jumping list distance models should also be clarified.

      We could not use a smoothly drifting regressor due to its collinearity with any model of boundary similarity. A model which included a ‘temporal context regressor’ would not be able to account for the presence of a boundary effect and would not allow us to demonstrate a boundary representation in the presence of drift. Therefore, we chose our two regressors: boundary proximity, which models intra-list changes in similarity and list distance, which models a stepwise decrease in similarity from adjacent lists. These regressors allow the model to differentiate between intra-list changes (the boundary regressor) verses inter-list changes (the list distance regressor).  

      (7) The features of the time-frequency matrix that are driving similarity between events could be visualized to provide a better understanding of the boundary-related signals. The analysis could also be re-run with reduced versions of the feature space in order to determine the critical components of this signal; for example, responses could be averaged across time to examine only differences across frequencies, or across frequencies to examine purely temporal changes across the 1.6 second window.

      Figure 3 – supplementary figure 2 A-C has been added to show varying the number of principal components (PCs) does not change the trend of boundary sensitivity in the MPL. In addition, we included 3 example subjects in Figure 3 – supplementary figure 2D to show unique time-frequency components contribute to signal reconstructed from the PCs for each subject. Therefore, the boundary representation may be represented differently for each patient.

      (8) If the authors are considering a space of multiple models as "boundary proximity models" (e.g. linear models and exponential models with different scale factors), this should be part of the model-fitting process rather than a single model being selected posthoc.

      We agree with the reviewer’s suggestion that the most ideal way to fit a model to the trend would be using a model-fitting process. However, due to a limitation on the amount of computational resources available, we were not able to perform it given the size of our dataset.

      (9) The interpretation of region differences in the results in Fig 2 and Fig 2 - supplement 1 should be clarified. 

      In discussion, we have added the following text to clarify our interpretation of the regional differences shown in the mentioned figures.  

      “However, across task boundaries, our study did not detect a robust change in drift rate in the medial or lateral temporal cortex. This finding contrasts with significant work (Ezzyat and Davachi, 2014; Griffiths and Fuentemilla, 2020) which shows hippocampal sensitivity to event-boundaries. One interpretation would be that boundary representations in the hippocampus are quite sparse and represented by populations of time-sensitive cells whose activity is indexed to task-related boundaries (Umbach et al 2018). While the sparse representations may not be detectable in gamma activity, perhaps it suggests drift in these regions represents a more abstract set of contextual features accumulated from multiple brain regions (Baldassano et al. 2017). “

      (10) Whether there are significant fits for the list distance regressor, and whether these fits vary across regions, could be stated. The list distance regressor could also be directly compared (in the same model) to a temporal-context regressor, which predicts graded changes in similarity between items rather than the discrete changes between lists.

      We have added parameter fits for the ‘list distance’ regressor in the supplementary portion of Figures 3 and Figure 5. The difference between regions is non-significant. Therefore, our results show very similar stepwise decrease in similarity across lists between regions (list distance regressor; Figure 3 —supplementary figure 1B).

      We could not compare these parameters to a separate model which includes a smoothly drifting ‘temporal-context’ regressor due to the regressors collinearity with any representation of boundary. See our response to Reviewer 3 –comment 6.  

      (11) The authors should clarify their interpretation of the results, and whether they are proposing a tweak to the temporal context model or a substantially different organizational system. 

      In the disucssion we include the following statements to clarify what we suggest regarding the temporal context model.  

      “Our findings suggest a broader scope of contextual association than just prior items, where temporal proximity as well as task structure in the form of boundaries, play intertwined roles in contextual construction. Our data therefore have implications for updated iterations of the temporal context model incorporating (perhaps) specific terms for boundary information. This may in turn provide a more systematic prediction of primacy effects in behavioral data.”  

      (12) Minor typos and corrections: 

      52: using -> use 

      108: patients -> patients'  156: list -> lists 

      The list distance plot is described as "pink" in Fig 3 and Fig 5 - supplement 1, but appears gray in the figures.

      Each of these corrections has been corrected in the text.

    1. Author Response

      Reviewer #1 (Public Review):

      Weaknesses:

      1) The authors should better review what we know of fungal Drosophila microbiota species as well as the ecology of rotting fruit. Are the microbiota species described in this article specific to their location/setting? It would have been interesting to know if similar species can be retrieved in other locations using other decaying fruits. The term 'core' in the title suggests that these species are generally found associated with Drosophila but this is not demonstrated. The paper is written in a way that implies the microbiota members they have found are universal. What is the evidence for this? Have the fungal species described in this paper been found in other studies? Even if this is not the case, the paper is interesting, but there should be a discussion of how generalizable the findings are.

      The reviewer inquires as to whether the microbial species described in this article are ubiquitously associated with Drosophila or not. Indeed, most of the microbes described in this manuscript are generally recognized as species associated with Drosophila spp. For example, species such as Hanseniaspora uvarum, Pichia kluyveri, and Starmerella bacillaris have been detected in or isolated from Drosophila spp. collected in European countries as well as the United States and Oceania (Chandler et al., 2012; Solomon et al., 2019). As for the bacteria, species belonging to the genera Pantoea, Lactobacillus, Leuconostoc, and Acetobacter have also previously been detected in wild Drosophila spp. (Chandler et al., 2011). These elucidations will be incorporated into our revised manuscript.

      Nevertheless, the term “core” in the manuscript title may lead to misunderstanding, as the generality does not ensure the ubiquitous presence of these microbial species in every individual fly. Considering this point, we will replace the term with an expression more appropriate to our context.

      2) Can the authors clearly demonstrate that the microbiota species that develop in the banana trap are derived from flies? Are these species found in flies in the wild? Did the authors check that the flies belong to the D. melanogaster species and not to the sister group D. simulans?

      Can the authors clearly demonstrate that the microbiota species that develop in the banana trap are derived from flies? Are these species found in flies in the wild?

      The reviewer asked whether the microbial species identified in the fermented banana samples were derived from flies. To address this question, additional experiments under more controlled conditions, such as the inoculation of specific species of wild flies onto fresh bananas, would be needed. Nevertheless, the microbes may potentially originate from wild flies, as supported by the literature cited in our response to the Weakness 1).

      Alternative sources for microbial provenance also merit consideration. For example, microbial entities may be inherently present in unfermented bananas through the infiltration of peel injuries (lines 1141-1142 of the original manuscript). In addition, they could be introduced by insects other than flies, given that both rove beetles (Staphylinidae) and sap beetles (Nitidulidae) were observed in some of the traps. These possibilities will be incorporated into the 'MATERIALS AND METHODS' and 'DISCUSSION' sections of our revised manuscript.

      Did the authors check that the flies belong to the D. melanogaster species and not to the sister group D. simulans?

      Our sampling strategy was designed to target not only D. melanogaster but also other domestic Drosophila species, such as D. simulans, that inhabit human residential areas. After adult flies were caught in each trap, we identified the species as shown in Table S1, thereby showing the presence of either or both D. melanogaster and D. simulans. We will provide these descriptions in MATERIALS AND METHODS and DISCUSSION.

      3) Did the microarrays highlight a change in immune genes (ex. antibacterial peptide genes)? Whatever the answer, this would be worth mentioning. The authors described their microarray data in terms of fed/starved in relation to the Finke article. They should clarify if they observed significant differences between species (differences between species within bacteria or fungi, and more generally differences between bacteria versus fungi).

      Did the microarrays highlight a change in immune genes (ex. antibacterial peptide genes)? Whatever the answer, this would be worth mentioning.

      Regarding the antimicrobial peptide genes, statistical comparisons of our RNA-seq data across different conditions were impracticable because most of them showed low expression levels (refer to Author response table 1, which exhibits the RNA-seq data of the yeast-fed larvae; similar expression profiles were observed in the bacteria-fed larvae). While a subset of genes exhibited significantly elevated expression in the non-supportive conditions relative to the supportive ones, this can be due to intra-sample variability rather than due to distinct nutritional environments. Therefore, it would be difficult to discuss a change in immune genes in the paper. Additionally, the previous study that conducted larval microarray analysis (Zinke et al., 2002) did not explicitly focus on immune genes.

      Author response table 1.

      Antimicrobial peptide genes are not up-regulated by any of the microbes. Antimicrobial peptides gene expression profiles of whole bodies of first-instar larvae fed on yeasts. TPM values of all samples and comparison results of gene expression levels in the larvae fed on supportive and non-supportive yeasts are shown. Antibacterial peptide genes mentioned in Hanson and Lemaitre, 2020 are listed. NA or na, not available.

      They should clarify if they observed significant differences between species (differences between species within bacteria or fungi, and more generally differences between bacteria versus fungi).

      We did not observe significant differences between species within bacteria or fungi, or between bacteria and fungi. For example, the gene expression profiles of larvae fed on the various supporting microbes showed striking similarities to each other, as evidenced by the heat map showing the expression of all genes detected in larvae fed either yeast or bacteria (Author response image 1). Similarities were also observed among larvae fed on distinct non-supporting microbes.

      Author response image 1.

      Gene expression profiles of larvae fed on the various supporting microbes show striking similarities to each other. Heat map showing the gene expression of the first-instar larvae that fed on yeasts or bacteria. Freshly hatched germ-free larvae were placed on banana agar inoculated with each microbe and collected after 15 h feeding to examine gene expression of the whole body. Note that data presented in Figures 3A and 4C in the original manuscript, which are obtained independently, are combined to generate this heat map. The labels under the heat map indicate the microbial species fed to the larvae, with three samples analyzed for each condition. The lactic acid bacteria (“LAB”) include Lactiplantibacillus plantarum and Leuconostoc mesenteroides, while the lactic acid bacterium (“AAB”) represents Acetobacter orientalis. “LAB + AAB” signifies mixtures of the AAB and either one of the LAB species. The asterisk in the label highlights a sample in a “LAB” condition (Leuconostoc mesenteroides), which clustered separately from the other “LAB” samples. Brown abbreviations of scientific names are for the yeast-fed conditions. H. uva, Hanseniaspora uvarum; K. hum, Kazachstania humilis; M. asi, Martiniozyma asiatica; S. cra, Saccharomycopsis crataegensis; P. klu, Pichia kluyveri; S. bac, Starmerella bacillaris; S. cer, S. cerevisiae BY4741 strain.

      Only a handful of genes showed different expression patterns between larvae fed on yeast and those fed on bacteria, without any enrichment for specialized gene functions. Thus, it is challenging to discuss the potential differential impacts, if any, of yeast and bacteria on larval growth.

      4) The whole paper - and this is one of its merits - points to a role of the Drosophila larval microbiota in processing the fly food. Are these bacterial and fungal species found in the gut of larvae/adults? Are these species capable of establishing a niche in the cardia of adults as shown recently in the Ludington lab (Dodge et al.,)? Previous studies have suggested that microbiota members stimulate the Imd pathway leading to an increase in digestive proteases (Erkosar/Leulier). Are the microbiota species studied here affecting gut signaling pathways beyond providing branched amino acids?

      The whole paper - and this is one of its merits - points to a role of the Drosophila larval microbiota in processing the fly food. Are these bacterial and fungal species found in the gut of larvae/adults? Are these species capable of establishing a niche in the cardia of adults as shown recently in the Ludington lab (Dodge et al.,)?

      Although we did not investigate the microbiota in the gut of either larvae or adults, we did compare the microbiota within surface-sterilized larvae or adults with those in food samples. We found that adult flies and early-stage food sources, as well as larvae and late-stage food sources, harbor similar microbial species (Figure 1F). Additionally, previous examinations of the gut microbiota in wild adult flies have identified microbial species or taxa congruent with those we isolated from our foods (Chandler et al., 2011; Chandler et al., 2012). We have elaborated on this in our response to Weakness 1).

      While we did not investigate whether these species are capable of establishing a niche in the cardia of adults, we will cite the study by Dodge et al., 2023 in our revised manuscript and discuss the possibility that predominant microbes in adult flies may show a propensity for colonization.

      Previous studies have suggested that microbiota members stimulate the Imd pathway leading to an increase in digestive proteases (Erkosar/Leulier). Are the microbiota species studied here affecting gut signaling pathways beyond providing branched amino acids?

      The reviewer inquires whether the supportive microbes in our study stimulate gut Imd signaling pathways and induce the expression of digestive protease genes, as demonstrated in a previous study (Erkosar et al., 2015). According to our RNA-seq data, it seems unlikely that the supportive microbes stimulate the signaling pathway. Figures contained in Author response image 2 provide the statistical comparisons of expression levels for seven protease genes between the supportive and the non-supportive conditions. These genes did not exhibit a consistent upregulation in the presence of the supportive microbes (H. uva or K. hum in Author response image 2A; Le mes + A. ori in Author response image 2B). Rather, they exhibited a tendency to be upregulated under the non-supportive microbes (St. bac or Pi. klu in Author response image 2A; La. pla in Author response image 2B).

      Author response image 2.

      Most of the peptidase genes reported by Erkosar et al., 2015 are more highly expressed under the non-supportive conditions than the supportive conditions. Comparison of the expression levels of seven peptidase genes derived from the RNA-seq analysis of yeast-fed (A) or bacteria-fed (B) first-instar larvae. A previous report demonstrated that the expression of these genes is upregulated upon association with a strain of Lactiplantibacillus plantarum, and that the PGRP-LE/Imd/Relish signaling pathway, at least partially, mediates the induction (Erkosar et al., 2015). H. uva, Hanseniaspora uvarum; K. hum, Kazachstania humilis; P. klu, Pichia kluyveri; S. bac, Starmerella bacillaris; La. pla, Lactiplantibacillus plantarum; Le. mes, Leuconostoc mesenteroides; A. ori, Acetobacter orientalis; ns, not significant.

      Reviewer #2 (Public Review):

      Weaknesses:

      The experimental setting that, the authors think, reflects host-microbe interactions in nature is one of the key points. However, it is not explicitly mentioned whether isolated microbes are indeed colonized in wild larvae of Drosophila melanogaster who eat bananas. Another matter is that this work is rather descriptive and a few mechanical insights are presented. The evidence that the nutritional role of BCAAs is incomplete, and molecular level explanation is missing in "interspecies interactions" between lactic acid bacteria (or yeast) and acetic acid bacteria that assure their inhabitation. Apart from these matters, the future directions or significance of this work could be discussed more in the manuscript.

      The experimental setting that, the authors think, reflects host-microbe interactions in nature is one of the key points. However, it is not explicitly mentioned whether isolated microbes are indeed colonized in wild larvae of Drosophila melanogaster who eat bananas.

      The reviewer asks whether the isolated microbes were colonized in the larval gut. Previous studies on microbial colonization associated with Drosophila have predominantly focused on adults (Pais et al. PLOS Biology, 2018), rather than larval stages. Developing larvae continually consume substrates which are already subjected to microbial fermentation and abundant in live microbes until the end of the feeding larval stage. Therefore, we consider it difficult to discuss microbial colonization in the larval gut. We will add this point in the DISCUSSION of the revised manuscript.

      Another matter is that this work is rather descriptive and a few mechanical insights are presented. The evidence that the nutritional role of BCAAs is incomplete, and molecular level explanation is missing in "interspecies interactions" between lactic acid bacteria (or yeast) and acetic acid bacteria that assure their inhabitation.

      While recognizing the importance of comprehensive mechanistic analysis, this study includes all experimentally feasible data. Elucidation of more detailed molecular mechanisms lies beyond the scope of this study and will be the subject of future research.

      Regarding the nutritional role of BCAAs, the incorporation of BCAAs enabled larvae fed with the non-supportive yeast to grow to the second instar. This observation suggests that consumption of BCAAs upregulates diverse genes involved in cellular growth processes in larvae. We have discussed the hypothetical interaction between lactic acid bacteria (LAB) and acetic acid bacteria (AAB) in the manuscript (lines 402-405): LAB may facilitate lactate provision to AAB, consequently enhancing the biosynthesis of essential nutrients such as amino acids. To test this hypothesis, future experiments will include the supplementation of lactic acid to AAB culture plates and the co-inoculating LAB mutant strains defective in lactate production with AABs, to assess both larval growth and continuous larval association with AABs. With respect to AAB-yeast interactions, metabolites released from yeast cells might benefit AAB growth, and this possibility will be investigated through the supplementation of AAB culture plates with candidate metabolites identified in the cell suspension supernatants of the late-stage yeasts.

      Apart from these matters, the future directions or significance of this work could be discussed more in the manuscript.

      We appreciate the reviewer's recommendations and will include additional descriptions regarding these aspects in the DISCUSSION section.

      Reviewer #3 (Public Review):

      Weaknesses:

      Despite describing important findings, I believe that a more thorough explanation of the experimental setup and the steps expected to occur in the exposed diet over time, starting with natural "inoculation" could help the reader, in particular the non-specialist, grasp the rationale and main findings of the manuscript. When exactly was the decision to collect early-stage samples made? Was it when embryos were detected in some of the samples? What are the implications of bacterial presence in the no-fly traps? These samples also harbored complex microbial communities, as revealed by sequencing. Were these samples colonized by microbes deposited with air currents? Were they the result of flies that touched the material but did not lay eggs? Could the traps have been visited by other insects? Another interesting observation that could be better discussed is the fact that adult flies showed a microbiome that more closely resembles that of the early-stage diet, whereas larvae have a more late-stage-like microbiome. It is easy to understand why the microbiome of the larvae would resemble that of the late-stage foods, but what about the adult microbiome? Authors should discuss or at least acknowledge the fact that there must be a microbiome shift once adults leave their food source. Lastly, the authors should provide more details about the metabolomics experiments. For instance, how were peaks assigned to leucine/isoleucine (as well as other compounds)? Were both retention times and MS2 spectra always used? Were standard curves produced? Were internal, deuterated controls used?

      When exactly was the decision to collect early-stage samples made? Was it when embryos were detected in some of the samples?

      We collected traps and early-stage samples 2.5 days after setting up the traps. This time frame was determined by pilot experiments. A shorter collection time resulted in a greater likelihood of obtaining no-fly traps, whereas a longer collection time caused larval overcrowding, as well as adults’ deaths from drowning in the liquid seeping out of fruits. These procedural details will be delineated in the MATERIALS AND METHODS section of the revised manuscript.

      What are the implications of bacterial presence in the no-fly traps? These samples also harbored complex microbial communities, as revealed by sequencing. Were these samples colonized by microbes deposited with air currents? Were they the result of flies that touched the material but did not lay eggs? Could the traps have been visited by other insects?

      We assume that the origins of the microbes detected in the no-fly trap foods vary depending on the species. For instance, Colletotrichum musae, the fungus that causes banana anthracnose, may have been present in fresh bananas before trap placement. The filamentous fungi could have originated from airborne spores, but they could also have been introduced by insects that feed on these fungi. We will include these possibilities in the DISCUSSION section of the revised manuscript.

      Another interesting observation that could be better discussed is the fact that adult flies showed a microbiome that more closely resembles that of the early-stage diet, whereas larvae have a more late-stage-like microbiome. It is easy to understand why the microbiome of the larvae would resemble that of the late-stage foods, but what about the adult microbiome? Authors should discuss or at least acknowledge the fact that there must be a microbiome shift once adults leave their food source.

      We are grateful for the reviewer's insightful suggestions regarding shifts in the adult microbiome. We plan to include in the DISCUSSION section of the revised manuscript the possibility that the microbial composition may change substantially during pupal stages and that microbes obtained after eclosion could potentially form the adult gut microbiota.

      Lastly, the authors should provide more details about the metabolomics experiments. For instance, how were peaks assigned to leucine/isoleucine (as well as other compounds)? Were both retention times and MS2 spectra always used? Were standard curves produced? Were internal, deuterated controls used?

      We appreciate the reviewer's advice. Detailed methods of the metabolomic experiments will be included in our revised manuscript.

    1. Author Response

      The following is the authors’ response to the original reviews.

      Reviewer #1 (Public Review):

      The modeling approaches are very sophisticated, and clearly demonstrate the selective nature of acute ketamine to reduce the impact of trial losses on subsequent performance, relative to neutral or gain outcomes. The authors then, not unreasonably, suggest that this effect is important in the context of the negative bias in interpreting events that is prominent in depression, in that if ketamine reduces the ability of negative outcomes to alter behavior, this may be a mechanism for its rapid acting antidepressant effects.

      However, there is a very strong assumption in this regard, as shown by the first sentence of the discussion which implies this is a systematic study of ketamine's acute antidepressant effects. In actuality, this is a study of the acute effects of ketamine on reinforcement learning (RL) modeled parameters. A primary concern here is that an effect presented as a "robust antidepressant-like behavioral effect" should be more enduring than just an alteration during the acute administration. As it is, the link to an "anti-depressant effect" is based solely on the selective effects on losses. This is not to say this is not an interesting observation, worthy of exploration. It is noted that a similar lack of enduring effects on outcome evaluation is observed in humans, as shown in supplemental fig. S4, but there is not accompanying citation for the human work.

      We agree with the reviewer that the way we linked the study results to ketamine’s antidepressant action can be misleading and based on a rather strong assumption which was not systematically tested in the study. We made the following changes to the manuscript:

      (1) These results constitute a rare report of a robust antidepressant-like behavioral effect produced by therapeutic doses of ketamine during acute phase (<1 hour) after injection (Introduction, 3rd paragraph, line 8-9 in the original manuscript).

      Changed to: These results constitute a rare report of an acute effect of therapeutic dose of ketamine on the processing of affectively negative events during dynamic decision-making.

      (2) We clarified in the Discussion that our study is to gain insights into, but not a systematic investigation of ketamine’s antidepressant action as follows:

      (2.1) A sentence was added (1st paragraph of Discussion): Using a token-based decision task and extensive computational modeling, we examined the behavioral modulation induced by therapeutic doses of ketamine to gain insights into possible early signs of ketamine’s antidepressant activity.

      (2.2) Consistent with the findings from humans, ketamine’s effect on outcome evaluation was acute and did not last over subsequent days (Supplemental Figure S4) (Discussion, 2nd paragraph, line 6-7 in the original manuscript).

      Changed to: While ketamine’s antidepressant effect is reported to be sustained over a week of period (5), ketamine’s effect on outcome evaluation was acute and did not last over subsequent days (Supplemental Figure S4). This discrepancy might be attributable to the possible differences in the state of brain network between healthy subjects and those with depression as well as the type of measures taken to assess ketamine’s effect.

      (2.3) A sentence was added (Discussion, last sentence of the 2nd paragraph) : Nevertheless, systematic studies are required to understand whether the reduced aversiveness to loss in our task might share the same mechanisms that underlie ketamine’s antidepressant action.

      One question that comes to mind in terms of the selectivity observed is whether similar work has been done to examine the acute effects of any other drugs. If ketamine is unique in this regard, that would be quite interesting.

      We think this is an interesting idea. However, comparing ketamine’s effect to that of other drugs is not the scope of the current study. We hope that we will be able to answer this question with future studies.

      Reviewer #2 (Public Review):

      Oemisch and Seo set out to examine the effects of low-dose ketamine on reinforcement learning, with the idea that alterations in reinforcement learning and/or motivation might inform our understanding of what alterations co-occur with potential antidepressant effects. Macaques performed a reinforced/punished matching pennies task while under effects of saline or ketamine administration and the data were fit to a series of reinforcement learning models to determine which model described behavior under saline most closely and then what parameters of this best-fitting model were altered by ketamine. They found a mixed effect, with two out of three macaques primarily exhibiting an effect of ketamine on processing of losses and one out of three macaques exhibiting an effect of ketamine on processing of losses and perseveration. They found that these effects of ketamine appeared to be dissociable from the nystagmus effects of the ketamine.

      The findings are novel and the data suggesting that ketamine is primarily having its effects on processing of losses (under the procedures used) are solid. However, it is unclear whether the connection between processing of losses and the antidepressant effects of ketamine is justified and the current findings may be more useful for those studying reinforcement learning than those studying depression and antidepressant effects. In addition, the co-occurrence of different behavioral procedures with different patterns of ketamine effects, with one macaque tested with different parameters than the other two exhibiting effects of ketamine that were best fit with a different model than the other two macaques, suggests that there may be difficulty in generalizing these findings to reinforcement learning more generally.

      (1) First, the authors should be more explicit and careful in the connection they are trying to make about the link between loss processing and depression. The authors call their effect a "robust antidepressant-like behavioral effect" but there are no references to support this or discussion of how the altered loss processing would relate directly to the antidepressant effects.

      We agree with the reviewer’s point on the way we made the connection between the study results and ketamine’s antidepressant action. This concern overlaps with the reviewer #1’s concern. Please refer to our response 2, 2-1, 2-2 and 2-3.

      (2) It appears that the monkey P was given smaller rewards and punishers than the other two monkeys and this monkey had an effect of ketamine on perseveration that was not observed in the other two monkeys. Is this believed to be due to the different task, or was this animal given a different task because of some behavioral differences that preceded the experiment? The authors should also discuss what these differences may mean for the generality of their findings. For example, might there be some set of parameters where ketamine would only alter perseveration and not processing of losses?

      Although the best-fitting ketamine model for monkey P includes an additional element – perseveration, we believe that monkey P’s baseline behavior and ketamine’s effect are not significantly different from the other two monkeys for the following reasons.

      First, monkey P was the first animal that we tested ketamine’s effect, and therefore we aimed to match the other two monkeys’ baseline behavior similar to monkey P’s behavior in order to reduce variability in ketamine’s effect potentially attributable to the difference in baseline behavior before pharmacological manipulation. We had to adjust the payoff matrix for the subsequent animals (Y and B) because these monkeys were more sensitive to loss, and seldom chose “risky” target (yielding loss). In order to make the other two monkeys’ behavior similar to that of monkey P, we adjusted the asymmetry between the risky and the safe target in the way that loss (neutral) outcome occurred from the safe (risky) target as well. Eventually, this adjustment made the baseline behavior similar across all three monkeys. The goal of the study was to reliably measure the ketamine’s effect, and not to study individual differences that can naturally occur with the same task parameters. Therefore, we believe that the adjustment of payoff matrix helped to reliably detect ketamine’s effect starting from the common baseline behavior.

      Second, the best-fitting model for monkey P (K-model 7) and that for the other two monkeys (K-model 4) make very similar predictions both qualitatively and quantitatively as are seen in the revised Figure 4. The parameters for outcome values estimated from these two models in monkey P are very similar as is seen in the revised Table 3. In addition, the difference in BIC between the model which includes only perseveration modulation (K-model 6) and the model incorporating outcome value modulation as well (K-model 7) is 441, whereas the difference in BIC between K-model 7 and the model that includes only outcome value modulation (K-model 4) is as small as 4. These BIC results indicate that the variability explained by ketamine’s modulation of outcome evaluation is remarkably larger that that explained by its modulation of perseveration in monkey P.

      Therefore, we conclude that ketamine’s effect was not significantly different between monkey P and the other two monkeys. We clarified this in the revised manuscript by adding the following paragraph in the Result section:

      “Unlike monkey Y and B, the best-fitting model for monkey P indicated that ketamine increased overall tendency to switch choice in addition to outcome-dependent modulation of outcome evaluation. However, BIC differed only slightly (dBIC = 3.99) between the best-fitting (K-model 7) and the second-best model (K-model 4) and the model predictions for choice behavior were very similar both qualitatively and quantitatively (Table 3, Figure 4). We conclude that the behavioral effects of ketamine were consistent across all three monkeys.”

      (3) The authors should discuss whether the plasma ketamine levels they observed are similar to those seen with rapid antidepressant ketamine or are higher or lower.

      We added a sentence in the first paragraph of the Result section as follows with a reference.

      “Plasma concentration and its time course over 60 minutes were also comparable to those measured after 0.5mg/kg in human subjects (35).”

      (35) Zarate CA, Brutsche N, Laje G, Luckenbaugh DA, Venkata SLV, Ramamoorthy A, et al (2012): Relationship of ketamine’s plasma metabolites with response, diagnosis, and side effects in major depression. Biol Psychiatry, 72: 331-338.

      (4) For Figure 4 or S3, the authors should show the data fitted to model 7, which was the best for one of the animals.

      We added the parameters and model predictions from both K-model 7 and K-model 4 for monkey P to help comparison between two models in Table 3, and Figure 4. Revised Table 3 and Figure 4 are as follows:

      Author response table 1.

      Maximum likelihood parameter estimates of the best models for saline and ketamine sessions.

      In all three animals, the model incorporating valence-dependent change in outcome evaluation best fit the choice data from ketamine sessions with (K-model 7 in the parenthesis, P) or without (K-model 4, P and Y/B) additional change in the tendency of choice perseveration (Figure 3, Table 3).

      Author response image 1.

      ketamine-induced behavioral modulation simulated with differential forgetting model (for saline session) and best-fitting K-model (for ketamine session).

    1. Author Response

      The following is the authors’ response to the original reviews.

      Public Reviews:

      The study could also valuably explore what kinds of genes experienced what forms of expression evolution. A brief description of GO terms frequently represented in genes which showed strong patterns of expression evolution might be suggestive of which selective pressures led to the changes in expression in the C. bursa-pastoris lineage, and to what extent they related to adaptation to polyploidization (e.g. cell-cycle regulators), compensating for the initial pollen and seed inviability or adapting to selfing (endosperm- or pollen-specific genes), or adaptation to abiotic conditions. ”

      We did not include a gene ontology (GO) analysis in the first place as we did not have a clear expectation on the GO terms that would be enriched in the genes that are differentially expressed between resynthesized and natural allotetraploids. Even if we only consider adaptive changes, the modifications could occur in various aspects, such as stabilizing meiosis, adapting to the new cell size, reducing hybrid incompatibility and adapting to self-fertilization. And each of these modifications involves numerous biological processes and molecular functions. As we could make post-hoc stories for too many GO terms, extrapolating at this stage have limited implications and could be misleading.

      Nonetheless, we are not the only study that compared newly resynthesized and established allopolyploids. GO terms that were repeatedly revealed by this type of exploratory analysis may give a hint for future studies. For this reason, now we have reported the results of a simple GO analysis.

      Recommendations for the authors: please note that you control which, if any, revisions, to undertake

      The majority of concerns from reviewers and the reviewing editor are in regards to the presentation of the manuscript; that the framing of the manuscript does not help the general reader understand how this work advances our knowledge of allopolyploid evolution in the broad sense. The manuscript may be challenging to read for those who aren't familiar with the study system or the genetic basis of polyploidy/gene expression regulation. Further, it is difficult to understand from the introduction how this work is novel compared to the recently published work from Duan et al and compared to other systems. Because eLife is a journal that caters to a broad readership, re-writing the introduction to bring home the novelty for the reader will be key.

      Additionally, the writing is quite technical and contains many short-hands and acronyms that can be difficult to keep straight. Revising the full text for clarity (and additionally not using acronyms) would help highlight the findings for a larger audience.

      Reviewer #1 (Recommendations For The Authors):

      Most of my suggestions on this interesting and well-written study are minor changes to clarify the writing and the statistical approaches.

      The use of abbreviations throughout for both transcriptional phenomena and lines is logical because of word limits, but for me as a reader, it really added to the cognitive burden. Even though writing out "homoeolog expression bias" or "hybridization-first" every time would add length, I would find it easier to follow and suspect others would too.

      Thank you for this suggestion. Indeed, using less uncommon acronyms or short-hands should increase the readability of the text for broader audience. Now in most places, we refer to “Sd/Sh” and “Cbp” as “resynthesized allotetraploids” and “natural allotetraploids”, respectively. We have also replaced the most occurrences of the acronyms for transcriptional phenomena (ELD, HEB and TRE) with full phrases, unless there are extra attributes before them (such as “Cg-/Co-ELD” and “relic/Cbp-specific ELD”).

      It would be helpful to include complete sample sizes to either a slightly modified Figure 1 or the beginning of the methods, just to reduce mental arithmetic ("Each of the five groups was represented by six "lines", and each line had six individuals" so there were 180 total plants, of which 167 were phenotyped - presumably the other 13 died? - and 30 were sequenced).

      The number 167 only applied to floral morphorlogical traits (“Floral morphological traits were measured for all five groups on 167 plants…”), but the exact total sample size for other traits differed. Now the total sample sizes of other traits have also been added to beginning of the second paragraph of the methods.

      For this study 180 seedings have been transplanted from Petri dishes to soil, but 8 seedlings died right after transplanting, seemingly caused by mechanical damage and insufficient moistening. Later phenotyping (2020.02-2020.05) was also disrupted by the COVID-19 pandemic, and some individuals were not measured as we missed the right life stages. Specifically, 5 individuals were missing for floral morphological traits (sepal width, sepal length, petal width, petal length, pistil width, pistil length, and stamen length), 30 for pollen traits, 1 for stem length, and 2 for flowering time. As for seed traits, we only measured individuals with more than ten fruits, so apart from the reasons mentioned above, individuals that were self-incompatible and had insufficient hand-pollination were also excluded. We spotted another mistake during the revision: two individuals with floral morphological measurements had no positional information (tray ID). These measurements were likely mis-sampled or mislabeled, and were therefore excluded from analysis. We assumed most of these missing values resulted from random technical mistakes and were not directly related to the measured traits.

      In general, the methods did a thorough job of describing the genomics approaches but could have used more detail for the plant growth (were plants randomized in the growth chamber, can you rule out block/position effects) and basic statistics (what statistical software was used to perform which tests comparing groups in each section, after the categories were identified).

      When describing the methods, mention whether the plants; this should be straightforward as a linear model with position as a covariate.

      Data used in the present study and a previously published work (Duan et al., 2023) were different subsets of a single experiment. For this reason, we spent fewer words in describing shared methods in this manuscript but tried to summarize some methods that were essential for understanding the current paper. But as you have pointed out, we did miss many important details that should have been kept. Now we have added some description and a table (Supplementary file 1) in the “Plant material” section for explaining randomization, and added more information of the software used for performing statistic tests in the “Phenotyping” section.

      Although we did not mention in the present manuscript, we used a randomized block design for the experiment (Author response image 1).

      Author response image 1.

      Plant positions inside the growth chamber. Plants used in the present study and Duan et al. (2023) were different subsets of a single experiment. The entire experiment had eight plant groups, including the five plant groups used in the present study (diploid C. orientalis (Co2), diploid C. grandiflora (Cg2), “whole-genome-duplication-first” (Sd) and “hybridization-first”(Sh) resynthesized allotetraploids, and natural allotetraploids, C. bursa pastoris (Cbp), as well as three plant groups that were only used in Duan et al. (2023; tetraploid C. orientalis (Co4), tetraploid C. grandiflora (Cg4) and diploid hybrids (F)). Each of the eight plant groups had six lines and each line represented by six plants, resulting in 288 plants (8 groups x 6 lines x 6 individuals = 288 plants). The 288 plants were grown in 36 trays placed on six shelves inside the same growth chamber. Each tray had exactly one plant from each of the eight groups, and the position of the eight plants within each tray (A-H) were randomized with random.shuffle() method in Python (Supplementary file 1). The position of the 36 trays inside the growth room (1-36) was also random and the positions of all trays were shuffled once again 28 days after germination (randomized with RAND() and sorting in Microsoft Excel Spreadsheet). (a) Plant distribution; (b) An example of one tray; (c) A view inside the growth chamber, showing the six benches.

      With the randomized block design and one round of shuffling, positional effect is very unlikely to bias the comparison among the five plant groups. The main risk of not adding positions to the statistical model is increasing error variance and decreasing the statistical power for detecting group effect. As we had already observed significant among-group variation in all phenotypic traits (p-value <2.2e-16 for group effect in most tests), further increasing statistical power is not our primary concern. In addition, during the experiment we did not notice obvious difference in plant growth related to positions. Although we could have added more variables to account for potential positional effects (tray ID, shelf ID, positions in a tray etc.), adding variables with little effect may reduce statistical power due to the loss of degree of freedom.

      Due to one round of random shuffling, positions cannot be easily added as a single continuous variable. Now we have redone all the statistical tests on phenotypic traits and included tray ID as a categorical factor (Figure 2-Source Data 1). In general, the results were similar to the models without tray ID. The F-values of group effect was only slightly changed, and p-values were almost unchanged in most cases (still < 2.2e-16). The tray effect (df=35) was not significant in most tests and was only significant in petal length (p-value=0.0111), sepal length (p-value=0.0242) and the number of seeds in ten fruits (p-value=0.0367). As expected, positions (tray ID) had limited effect on phenotypic traits.

      Figure 2 - I assume the numbers at the top indicate sample sizes but perhaps add this to the figure caption.

      Statistical power depends on both the total sample size and the sample size of each group, especially the group with the fewest observations. We lost different number of measurements in each phenotypic trait, and for pollen traits we did have a notable loss, so we chose to show sample sizes above each group to increase transparency. Since we had five different sets of sample sizes (for floral morphological traits, stem length, days to flowering, pollen traits and seed traits, respectively), it would be cumbersome to introduce all 25 numbers in figure caption and could be hard for readers to match the sample sizes with results. For this reason, we would like to keep the sample sizes in the figure, and now we have modified the legend to clarify that the numbers above groups are sample sizes.

      ’The trend has been observed in a wide range of organisms, including ...’ - perhaps group Brassica and Raphanobrassica into one clause in the sentence, since separating them out undermines the diversity somewhat.

      Indeed, it is very strange to put “cotton” between two representatives from Brassicaceae. Now the sentence is changed to “… including Brassica (Wu et al., 2018; Li et al., 2020; Wei et al., 2021) and Raphanobrassica (Ye et al., 2016), cotton (Yoo et al., 2013)…”

      The diagrams under the graph in Figure 4B are particularly helpful for understanding the expression patterns under consideration! I appreciated them a lot!

      Thank you for the comment. We also feel the direction of expression level dominance is convoluted and hard to remember, so we adopted the convention of showing the directions with diagrams.

      Reviewer #2 (Recommendations For The Authors):

      The science is very interesting and thorough, so my comments are mostly meant to improve the clarity of the manuscript text:

      • I found it challenging to remember the acronyms for the different gene expression phenomena and had to consistently cross-reference different parts of the manuscript to remind myself. I think using the full phrase once or twice at the start of a paragraph to remind readers what the acronym stands for could improve readability.

      Thank you for this reasonable suggestion. Now we have replaced the most occurrence of acronyms with the full phrases.

      • There are some technical terms, such as "homoeologous synapsis" and "disomic inheritance", which I think are under-defined in the current text.

      Indeed these terms were not well-defined before using in the manuscript. Now we have added a brief explanation for each term.

      • Under the joint action of these forces, allopolyploid subgenomes are further coordinated and degenerated, and subgenomes are often biasedly fractionated" This sentence has some unclear terminology. Does "coordinated" mean co-adapted, co-inherited, or something else? Is "biasedly fractionated" referring to biased inheritance or evolution of one of the parental subgenomes?

      We apologize for not using accurate terms. With “coordinated” we emphasized the evolution of both homoeologs depends on the selection on total expression of both homoeologs, and on both relative and absolute dosages, which may have shifted away from optima after allopolyploidization. “Co-evolved” or “co-adapted” might be a better word.

      But the term "biasedly fractionation" has been commonly used for referring to the phenomenon that genes from one subgenome of polyploids are preferentially retained during diploidization (Woodhouse et al., 2014; Wendel, 2015). Instead of inventing a new term, we prefer to keep the same term for consistency, so readers could link our findings with numerous studies in this field. Now the sentence is changed to “Under the joint action of these forces, allopolyploid subgenomes are further co-adapted and degenerated, and subgenomes are often biasedly retained, termed biased fractionation”.

      • There are a series of paragraphs in the results, starting with "Resynthesized allotetraploids and the natural Cbp had distinct floral morphologies", which consistently reference Figure 1 where they should be referencing Figure 2.

      Thank you for spotting this mistake! Now the numbers have been corrected.

      • ‘The number of pollen grains per flower decreased in natural Cbp’ this wording implies it's the effect of some experimental treatment on Cbp, rather than just measured natural variation.

      Yes, it is not scientifically precise to say this in the Results section, especially when describing details of results. We meant that assuming resynthesized allopolyploids are good approximation of the initial state of natural allotetraploid C. bursa-pastoris, our results indicate that the number of pollen grains had decreased in natural C. bursa-pastoris. But this is an implication, rather than an observation, so the sentence is better rewritten as “Natural allotetraploids had less pollen grains per flower.”

      • ‘The percentage of genes showing complete ELD was altogether limited but doubled between resynthesized allotetraploid groups and natural allotetraploids’ for clarity, I would suggest revising this to something like "doubled in natural allotetraploids relative to resynthesized allotetraploids

      Thank you for the suggestion. The sentence has been revised as suggested.

      • I'm not sure I understand what the difference is between expression-level dominance and homeolog expression bias. It seems to me like the former falls under the umbrella of the latter.

      Expression-level dominance and homeolog expression bias are easily confused, but they are conceptually independent. One gene could have expression-level dominance without any homeolog expression bias, or strong homeolog expression bias without any expression-level dominance. The concepts were well explained in Grover et al., (2012) with nice figures.

      Expression level dominance compares the total expression level of both homoeologs in allopolyploids with the expression of the same gene in parental species, and judges whether the total expression level in allopolyploids is only similar to one of the parental species. The contributions from different homoeologs are not distinguished.

      While homoeolog expression bias compares the relative expression level of each homoeologs in allopolyploids, with no implication on the total expression of both homoeologs.

      Let the expression level of one gene in parental species X and Y be e(X) and e(Y), respectively. And let the expression level of x homoeolog (from species X) and y homoeolog (from species Y) in allopolyploids be e(x) and e(y), respectively.

      Then a (complete) expression level dominance toward species X means: e(x)+e(y)=e(X) and e(x)+e(y)≠e(Y);

      While a homoeolog expression bias toward species X means: e(x) > e(y), or e(x)/e(y) > e(X)/e(Y), depending on the definition of studies.

      Both expression-level dominance and homeolog expression bias have been widely studied in allopolyploids (Combes et al., 2013; Li et al., 2014; Yoo et al., 2014; Hu & Wendel, 2019). As the two phenomena could be in opposite directions, and may be caused by different mechanisms, we think adopting the definitions in Grover et al., (2012) and distinguishing the two concepts would facilitate communication.

      • Is it possible to split up the results in Figure 7 to show which of the two homeologs was lost (i.e. orientalis vs. grandiflora)? Or at least clarify in the legend that these scenarios are pooled together in the figure?

      Maybe using acronyms without explanation made the figure titles hard to understand, but in the original Figure 7 the loss of two homoeologs were shown separately. Figure 7a,c showed the loss of C. orientalis-homoeolog (“co-expession loss”), and Figure 7b,d showed the loss of C. grandiflora-homoeolog (“cg-expession loss”). Now the legends have been modified to explain the Figure.

      • The paragraph starting with "The extant diploid species" is too long, should probably be split into two paragraphs and edited for clarity.

      The whole paragraph was used to explain why the resynthesized allotetraploids could be a realistic approximation of the early stage of C. bursa-pastoris with two arguments:

      1) The further divergence between C. grandiflora and C. orientalis after the formation of C. bursa-pastoris should be small compared to the total divergence between the two parental species; 2) The mating systems of real parental populations were most likely the same as today. Now the two arguments were separated as two paragraphs, and the second paragraph has been shortened.

      • On the other hand, the number of seeds per fruit" implies this is evidence for an alternative hypothesis, when I think it's really just more support for the same idea.

      “On the other hand” was used to contrast the reduced number of pollen grains and the increased number of seeds in natural allotetraploids. As both changes are typical selfing syndrome, indeed the two support the same idea. We replaced the “On the other hand” with “Moreover”.

      • ‘has become self-compatible before the formation" "has become" should be "became".

      The tense of the word has been changed.

      • If natural C. bursa-pastoris indeed originated from the hybridization between C. grandiflora-like outcrossing plants and C. orientalis-like self-fertilizing plants, the selfing syndrome in C. bursa-pastoris does not reflect the instant dominance effect of the C. orientalis alleles, but evolved afterward.’ This sentence should be closer to the end of the paragraph, after the main morphological results are summarized.

      Thank you for the suggestion. The paragraph is indeed more coherent after moving the conclusion sentence.

      References

      Combes, M.C., Dereeper, A., Severac, D., Bertrand, B. & Lashermes, P. (2013) Contribution of subgenomes to the transcriptome and their intertwined regulation in the allopolyploid Coffea arabica grown at contrasted temperatures. New Phytologist, 200, 251–260.

      Grover, C.E., Gallagher, J.P., Szadkowski, E.P., Yoo, M.J., Flagel, L.E. & Wendel, J.F. (2012) Homoeolog expression bias and expression level dominance in allopolyploids. New Phytologist, 196, 966–971.

      Hu, G. & Wendel, J.F. (2019) Cis – trans controls and regulatory novelty accompanying allopolyploidization. New Phytologist, 221, 1691–1700.

      Li, A., Liu, D., Wu, J., Zhao, X., Hao, M., Geng, S., et al. (2014) mRNA and Small RNA Transcriptomes Reveal Insights into Dynamic Homoeolog Regulation of Allopolyploid Heterosis in

      Nascent Hexaploid Wheat. The Plant Cell, 26, 1878–1900. Wendel, J.F. (2015) The wondrous cycles of polyploidy in plants. American Journal of Botany, 102, 1753–1756.

      Woodhouse, M.R., Cheng, F., Pires, J.C., Lisch, D., Freeling, M. & Wang, X. (2014) Origin, inheritance, and gene regulatory consequences of genome dominance in polyploids. Proceedings of the National Academy of Sciences of the United States of America, 111, 5283–5288.

      Yoo, M.J., Liu, X., Pires, J.C., Soltis, P.S. & Soltis, D.E. (2014) Nonadditive Gene Expression in Polyploids. https://doi.org/10.1146/annurev-genet-120213-092159, 48, 485–517.

    1. Author response:

      The following is the authors’ response to the original reviews.

      As you will see, the main changes in the revised manuscript pertain to the structure and content of the introduction. Specifically, we have tried to more clearly introduce our paradigm, the rationale behind the paradigm, why it is different from learning paradigms, and why we study “relief”.

      In this rebuttal letter, we will go over the reviewers’ comments one-by-one and highlight how we have adapted our manuscript accordingly. However, because one concern was raised by all reviewers, we will start with an in-depth discussion of this concern.

      The shared concern pertained to the validity of the EVA task as a model to study threat omission responses. Specifically, all reviewers questioned the effectivity of our so-called “inaccurate”, “false” or “ruse” instructions in triggering an equivalent level of shock expectancy, and relatedly, how this effectivity was affected by dynamic learning over the course of the task.

      We want to thank the reviewers for raising this important issue. Indeed, it is a vital part of our design and it therefore deserves considerable attention. It is now clear to us that in the previous version of the manuscript we may have focused too little on why we moved away from a learning paradigm, and how we made sure that the instructions were successful at raising the necessary expectations; and how the instructions were affected by learning. We believe this has resulted in some misunderstandings, which consequently may have cast doubts on our results. In the following sections, we will go into these issues.

      The rationale behind our instructed design

      The main aim of our study was to investigate brain responses to unexpected omissions of threat in greater detail by examining their similarity to the reward prediction error axioms (Caplin & Dean, 2008), and exploring the link with subjective relief. Specifically, we hypothesized that omission-related responses should be dependent on the probability and the intensity of the expected-but-omitted aversive event (i.e., electrical stimulation), meaning that the response should be larger when the expected stimulation was stronger and more expected, and that fully predicted outcomes should not trigger a difference in responding.

      To this end, we required that participants had varying levels of threat probability and intensity predictions, and that these predictions would most of the time be violated. Although we fully agree with the reviewers that fear conditioning and extinction paradigms can provide an excellent way to track the teaching properties of prediction error responses (i.e., how they are used to update expectancies on future trials), we argued that they are less suited to create the varying probability and intensity-related conditions we required (see Willems & Vervliet, 2021). Specifically, in a standard conditioning task participants generally learn fast, rendering relatively few trials on which the prediction is violated. As a result, there is generally little intraindividual variability in the prediction error responses. This precludes an in-depth analysis of the probability-related effects. Furthermore, conditioning paradigms generally only include one level of aversive outcome: the electrical stimulation is either delivered or omitted. As a result, intensity-related effects cannot be tested. Finally, because CS-US contingencies change over the course of a fear conditioning and extinction study (e.g. from acquisition to extinction), there is never complete certainty about when the US will (not) follow. This precludes a direct comparison of fully predicted outcomes.

      Another added value of studying responses to the prediction error at threat omission outside a learning context is that it can offer a way to disentangle responses to the violation of threat expectancy, with those of subsequent expectancy updating.

      Also note that Rutledge and colleagues (2010), who were the first to show that human fMRI responses in the Nucleus Accumbens comply to the reward prediction error axioms also did not use learning experiences to induce expectancy. In that sense, we argued it was not necessary to adopt a learning paradigm to study threat omission responses.

      Adaptations in the revised manuscript: We included two new paragraphs in the introduction of the revised manuscript to elaborate on why we opted not to use a learning paradigm in the present study (lines 90-112).

      “However, is a correlation with the theoretical PE over time sufficient for neural activations/relief to be classified as a PE-signal? In the context of reward, Caplin and colleagues proposed three necessary and sufficient criteria all PE-signals should comply to, independent of the exact operationalizations of expectancy and reward (the socalled axiomatic approach24,25; which has also been applied to aversive PE26–28). Specifically, the magnitude of a PE signal should: (1) be positively related to the magnitude of the reward (larger rewards trigger larger PEs); (2) be negatively related to likelihood of the reward (more probable rewards trigger smaller PEs); and (3) not differentiate between fully predicted outcomes of different magnitudes (if there is no error in prediction, there should be no difference in the PE signal).”

      “It is evident that fear conditioning and extinction paradigms have been invaluable for studying the role of the threat omission PE within a learning context. However, these paradigms are not tailored to create the varying intensity and probability-related conditions that are required to evaluate the threat omission PE in the light of the PE axioms. First, conditioning paradigms generally only include one level of aversive outcome: the electrical stimulation is either delivered or omitted. As a result, the magnitude-related axiom cannot be tested. Second, in conditioning tasks people generally learn fast, rendering relatively few trials on which the prediction is violated. As a result, there is generally little intra-individual variability in the PE responses. Moreover, because of the relatively low signal to noise ratio in fMRI measures, fear extinction studies often pool across trials to compare omission-related activity between early and late extinction16, which further reduces the necessary variability to properly evaluate the probability axiom. Third, because CS-US contingencies change over the course of the task (e.g. from acquisition to extinction), there is never complete certainty about whether the US will (not) follow. This precludes a direct comparison of fully predicted outcomes. Finally, within a learning context, it remains unclear whether PErelated responses are in fact responses to the violation of expectancy itself, or whether they are the result of subsequent expectancy updating.”

      Can verbal instructions be used to raise the expectancy of shock?

      The most straightforward way to obtain sufficient variability in both probability and intensityrelated predictions is by directly providing participants with instructions on the probability and intensity of the electrical stimulation. In a previous behavioral study, we have shown that omission responses (self-reported relief and omission SCR) indeed varied with these instructions (Willems & Vervliet, 2021). In addition, the manipulation checks that are reported in the supplemental material provided further support that the verbal instructions were effective at raising the associated expectancy of stimulation. Specifically, participants recollected having received more stimulations after higher probability instructions (see Supplemental Figure 2). Furthermore, we found that anticipatory SCR, which we used as a proxy of fearful expectation, increased with increasing probability and intensity (see Supplemental Figure 3). This suggests that it is not necessary to have expectation based on previous experience if we want to evaluate threat omission responses in the light of the prediction error axioms.

      Adaptations in the revised manuscript: We more clearly referred to the manipulation checks that are presented in the supplementary material in the results section of the main paper (lines 135-141).

      “The verbal instructions were effective at raising the expectation of receiving the electrical stimulation in line with the provided probability and intensity levels. Anticipatory SCR, which we used as a proxy of fearful expectation, increased as a function of the probability and intensity instructions (see Supplementary Figure 3). Accordingly, post-experimental questions revealed that by the end of the experiment participants recollected having received more stimulations after higher probability instructions, and were willing to exert more effort to prevent stronger hypothetical stimulations (see Supplementary Figure 2).”

      How did the inconsistency between the instructed and experienced probability impact our results?

      All reviewers questioned how the inconsistency between the instructed and experienced probability might have impacted the probability-related results. However, judging from the way the comments were framed, it seems that part of the concern was based on a misunderstanding of the design we employed. Specifically, reviewer 1 mentions that “To ensure that the number of omissions is similar across conditions, the task employs inaccurate verbal instructions; I.e., 25% of shocks are omitted regardless of whether subjects are told that the probability is 100%, 75%, 50%, 25%, 0%.”, and reviewer 3 states that “... the fact remains that they do not get shocks outside of the 100% probability shock. So learning is occurring, at least for subjects who realize the probability cue is actually a ruse.” We want to emphasize that this was not what we did, and if it were true, we fully agree with the reviewers that it would have caused serious trust- and learning related issues, given that it would be immediately evident to participants that probability instructions were false. It is clear that under such circumstances, dynamic learning would be a big issue.

      However, in our task 0% and 100% instructions were always accurate. This means that participants never received a stimulus following 0% instructions and always received the stimulation of the given intensity on the 100% instructions (see Supplemental Figure 1 for an overview of the trial types). Only for the 25%, 50% and 75% trials an equal reinforcement rate (25%) was maintained, meaning that the stimulation followed in 25% of the trials, irrespective of whether a 25%, 50% or 75% instruction was given. The reason for this was that we wanted to maximize and balance the number of omission trials across the different probability levels, while also keeping the total number of presentations per probability instruction constant. We reasoned that equating the reinforcement rate across the 25%, 50% and 75% instructions should not be detrimental, because (1) in these trials there was always the possibility that a stimulation would follow; and (2) we instructed the participants that each trial is independent of the previous ones, which should have discouraged them to actively count the number of shocks in order to predict future shocks.

      Adaptations in the revised manuscript: We have tried to further clarify the design in several sections of the manuscript, including the introduction (lines 121-125), results (line 220) and methods (lines 478-484) sections:

      Adaptation in the Introduction section: “Specifically, participants received trial-by-trial instructions about the probability (0%, 25%, 50%, 75% and 100%) and intensity (weak, moderate, strong) of a potentially painful upcoming electrical stimulation, time-locked by a countdown clock (see Fig.1A). While stimulations were always delivered on 100% trials and never on 0% trials, most of the other trials (25%-75%) did not contain the expected stimulation and hence provoked an omission PE.”

      Adaptation in the Results section: “Indeed, the provided instructions did not map exactly onto the actually experienced probabilities, but were all followed by stimulation in 25% on the trials (except for the 0% trials and the 100% trials).”

      Adaptation in the Methods section: “Since we were mainly interested in how omissions of threat are processed, we wanted to maximize and balance the number of omission trials across the different probability and intensity levels, while also keeping the total number of presentations per probability and intensity instruction constant. Therefore, we crossed all non-0% probability levels (25, 50, 75, 100) with all intensity levels (weak, moderate, strong) (12 trials). The three 100% trials were always followed by the stimulation of the instructed intensity, while stimulations were omitted in the remaining nine trials. Six additional trials were intermixed in each run: Three 0% omission trials with the information that no electrical stimulation would follow (akin to 0% Probability information, but without any Intensity information as it does not apply); and three trials from the Probability x Intensity matrix that were followed by electrical stimulation (across the four runs, each Probability x Intensity combination was paired at least once, and at most twice with the electrical stimulation).”

      Could the incongruence between the instructed and experienced reinforcement rate have detrimental effects on the probability effect? We agree with reviewer 2 that it is possible that the inconsistency between instructed and experienced reinforcement rates could have rendered the exact probability information less informative to participants, which might have resulted in them paying less attention to the probability information whenever the probability was not 0% or 100%. This might to some extent explain the relatively larger difference in responding between 0% and 25% to 75% trials, but the relatively smaller differences between the 25% to 75% trials.

      However, there are good reasons to believe that the relatively smaller difference between 25% to 75% trials was not caused by the “inaccurate” nature of our instructions, but is inherent to “uncertain” probabilities.

      We added a description of these reasons to the supplementary materials in a supplementary note (supplementary note 4; lines 97-129 in supplementary materials), and added a reference to this note in the methods section (lines 488-490).

      “Supplementary Note 4: “Accurate” probability instructions do not alter the Probability-effect

      A question that was raised by the reviewers was whether the inconsistency between the probability instruction and the experienced reinforcement rate could have detrimental effects on the Probability-related results; especially because the effect of Probability was smaller when only including non-0% trials.

      However, there are good reasons to believe that the relatively smaller difference between 25% to 75% trials was not caused by the “inaccurate” nature of our instructions, but that they are inherent to “uncertain” probabilities.

      First, in a previously unpublished pilot study, we provided participants with “accurate” probability instructions, meaning that the instruction corresponded to the actual reinforcement rate (e.g., 75% instructions were followed by a stimulation in 75% of the trials etc.). In line with the present results and our previous behavioral study (Willems & Vervliet, 2021), the results of this pilot (N = 20) showed that the difference in the reported relief between the different probability levels was largest when comparing 0% and the rest (25%, 50% and 75%). Furthermore the overall effect size of Probability (excluding 0%) matched the one of our previous behavioral study (Willems & Vervliet, 2021): ηp2 = +/- 0.50.”

      Author response image 1.

      Main effect of Probability including 0% : F(1.74,31.23) = 53.94, p < .001, ηp2 = 0.75. Main effect of Probability excluding 0%: F(1.50, 28.43) = 21.03, p < .001, ηp2 = 0.53.

      Second, also in other published studies that used CSs with varying reinforcement rates (which either included explicit written instructions of the reinforcement rates or not) showed that the difference in expectations, anticipatory SCR or omission SCR was largest when comparing the CS0% to the other CSs of varying reinforcement rates (Grings & Sukoneck, 1971; Öhman et al., 1973; Ojala et al., 2022).

      Together, this suggests that when there is a possibility of stimulation, any additional difference in probability will have a smaller effect on the omission responses, irrespective of whether the underlying reinforcement rate is accurate or not.

      Adaptation to methods section: “Note that, based on previous research, we did not expect the inconsistency between the instructed and perceived reinforcement rate to have a negative effect on the Probability manipulation (see Supplementary Note 4).”

      Did dynamic learning impact the believability of the instructions?

      Although we tried to minimize learning in our paradigm by providing instructions that trials are independent from one another, we agree with the reviewers that this cannot preclude all learning. Any remaining learning effects should present themselves by downweighing the effect of the probability instructions over time. We controlled for this time-effect by including a “run” regressor in our analyses. Results of the Run regressor for subjective relief and omission-related SCR are presented in Supplemental Figure 5. These figures show that although there was a general drop in reported relief pleasantness and omission SCR over time, the effects of probability and intensity remained present until the last run. This indicates that even though some learning might have taken place, the main manipulations of probability and intensity were still present until the end of the task.

      Adaptations in the revised manuscript: We more clearly referred to the results of the Blockregressor which were presented in the supplementary material in the results section of the main paper (lines 159-162).

      Note that while there was a general drop in reported relief pleasantness and omission SCR over time, the effects of Probability and Intensity remained present until the last run (see Supplementary Figure 5). This further confirms that probability and intensity manipulations were effective until the end of the task.

      In the following sections of the rebuttal letter, we will go over the rest of the comments and our responses one by one.

      Reviewer #1 (Public Review):

      Summary:

      Willems and colleagues test whether unexpected shock omissions are associated with reward-related prediction errors by using an axiomatic approach to investigate brain activation in response to unexpected shock omission. Using an elegant design that parametrically varies shock expectancy through verbal instructions, they see a variety of responses in reward-related networks, only some of which adhere to the axioms necessary for prediction error. In addition, there were associations between omission-related responses and subjective relief. They also use machine learning to predict relief-related pleasantness, and find that none of the a priori "reward" regions were predictive of relief, which is an interesting finding that can be validated and pursued in future work.

      Strengths:

      The authors pre-registered their approach and the analyses are sound. In particular, the axiomatic approach tests whether a given region can truly be called a reward prediction error. Although several a priori regions of interest satisfied a subset of axioms, no ROI satisfied all three axioms, and the authors were candid about this. A second strength was their use of machine learning to identify a relief-related classifier. Interestingly, none of the ROIs that have been traditionally implicated in reward prediction error reliably predicted relief, which opens important questions for future research.

      Weaknesses:

      To ensure that the number of omissions is similar across conditions, the task employs inaccurate verbal instructions; i.e. 25% of shocks are omitted, regardless of whether subjects are told that the probability is 100%, 75%, 50%, 25%, or 0%. Given previous findings on interactions between verbal instruction and experiential learning (Doll et al., 2009; Li et al., 2011; Atlas et al., 2016), it seems problematic a) to treat the instructions as veridical and b) average responses over time. Based on this prior work, it seems reasonable to assume that participants would learn to downweight the instructions over time through learning (particularly in the 100% and 0% cases); this would be the purpose of prediction errors as a teaching signal. The authors do recognize this and perform a subset analysis in the 21 participants who showed parametric increases in anticipatory SCR as a function of instructed shock probability, which strengthened findings in the VTA/SN; however given that one-third of participants (n=10) did not show parametric SCR in response to instructions, it seems like some learning did occur. As prediction error is so important to such learning, a weakness of the paper is that conclusions about prediction error might differ if dynamic learning were taken into account.

      We thank the reviewer for raising this important concern. We believe we replied to all the issues raised in the general reply above.

      Lastly, I think that findings in threat-sensitive regions such as the anterior insula and amygdala may not be adequately captured in the title or abstract which strictly refers to the "human reward system"; more nuance would also be warranted.

      We fully agree with this comment and have changed the title and abstract accordingly.

      Adaptations in the revised manuscript: We adapted the title of the manuscript.

      “Omissions of Threat Trigger Subjective Relief and Prediction Error-Like Signaling in the Human Reward and Salience Systems”

      Adaptations in the revised manuscript: We adapted the abstract (lines 27-29).

      “In line with recent animal data, we showed that the unexpected omission of (painful) electrical stimulation triggers activations within key regions of the reward and salience pathways and that these activations correlate with the pleasantness of the reported relief.”

      Reviewer #2 (Public Review):

      The question of whether the neural mechanisms for reward and punishment learning are similar has been a constant debate over the last two decades. Numerous studies have shown that the midbrain dopamine neurons respond to both negative and salient stimuli, some of which can't be well accounted for by the classic RL theory (Delgado et al., 2007). Other research even proposed that aversive learning can be viewed as reward learning, by treating the omission of aversive stimuli as a negative PE (Seymour et al., 2004).

      Although the current study took an axiomatic approach to search for the PE encoding brain regions, which I like, I have major concerns regarding their experimental design and hence the results they obtained. My biggest concern comes from the false description of their task to the participants. To increase the number of "valid" trials for data analysis, the instructed and actual probabilities were different. Under such a circumstance, testing axiom 2 seems completely artificial. How does the experimenter know that the participants truly believe that the 75% is more probable than, say, the 25% stimulation? The potential confusion of the subjects may explain why the SCR and relief report were rather flat across the instructed probability range, and some of the canonical PE encoding regions showed a rather mixed activity pattern across different probabilities. Also for the post-hoc selection criteria, why pick the larger SCR in the 75% compared to the 25% instructions? How would the results change if other criteria were used?

      We thank the reviewer for raising this important concern. We believe the general reply above covers most of the issues raised in this comment. Concerning the post-hoc selection criteria, we took 25% < 75% as criterium because this was a quite “lenient” criterium in the sense that it looked only at the effects of interest (i.e., did anticipatory SCR increase with increasing instructed probability?). However, also when the criterium was more strict (e.g., selecting participants only if their anticipatory SCR monotonically increased with each increase in instructed probability 0% < 25% < 50% < 75% < 100%, N = 11 participants), the probability effect (ωp2 = 0.08), but not the intensity effect, for the VTA/SN remained.

      To test axiom 3, which was to compare the 100% stimulation to the 0% stimulation conditions, how did the actual shock delivery affect the fMRI contrast result? It would be more reasonable if this analysis could control for the shock delivery, which itself could contaminate the fMRI signal, with extra confound that subjects may engage certain behavioral strategies to "prepare for" the aversive outcome in the 100% stimulation condition. Therefore, I agree with the authors that this contrast may not be a good way to test axiom 3, not only because of the arguments made in the discussion but also the technical complexities involved in the contrast.

      We thank the reviewer for addressing this additional confound. It was indeed impossible to control for the delivery of shock since the delivery of the shock was always present on the 100% trials (and thus completely overlapped with the contrast of interest). We added this limitation to our discussion in the manuscript. In addition, we have also added a suggestion for a contrast that can test the “no surprise equivalence” criterium.

      Adaptations in the revised manuscript: We adapted lines 358-364.

      “Thus, given that we could not control for the delivery of the stimulation in the 100% > 0% contrast (the delivery of the stimulation completely overlapped with the contrast of interest), it is impossible to disentangle responses to the salience of the stimulation from those to the predictability of the outcome. A fairer evaluation of the third axiom would require outcomes that are roughly similar in terms of salience. When evaluating threat omission PE, this implies comparing fully expected threat omissions following 0% instructions to fully expected absence of stimulation at another point in the task (e.g. during a safe intertrial interval).”

      Reviewer #3 (Public Review):

      We thank the reviewer for their comments. Overall, based on the reviewer’s comments, we noticed that there was an imbalance between a focus on “relief” in the introduction and the rest of the manuscript and preregistration. We believe this focus raised the expectation that all outcome measures were interpreted in terms of the relief emotion. However, this was not what we did nor what we preregistered. We therefore restructured the introduction to reduce the focus on relief.

      Adaptations in the revised manuscript: We restructured the introduction of the manuscript. Specifically, after our opening sentence: “We experience a pleasurable relief when an expected threat stays away1” we only introduce the role of relief for our research in lines 79-89.

      “Interestingly, unexpected omissions of threat not only trigger neural activations that resemble a reward PE, they are also accompanied by a pleasurable emotional experience: relief. Because these feelings of relief coincide with the PE at threat omission, relief has been proposed to be an emotional correlate of the threat omission PE. Indeed, emerging evidence has shown that subjective experiences of relief follow the same time-course as theoretical PE during fear extinction. Participants in fear extinction experiments report high levels of relief pleasantness during early US omissions (when the omission was unexpected and the theoretical PE was high) and decreasing relief pleasantness over later omissions (when the omission was expected and the theoretical PE was low)22,23. Accordingly, preliminary fMRI evidence has shown that the pleasantness of this relief is correlated to activations in the NAC at the time of threat omission. In that sense, studying relief may offer important insights in the mechanism driving safety learning.”

      Summary:

      The authors conducted a human fMRI study investigating the omission of expected electrical shocks with varying probabilities. Participants were informed of the probability of shock and shock intensity trial-by-trial. The time point corresponding to the absence of the expected shock (with varying probability) was framed as a prediction error producing the cognitive state of relief/pleasure for the participant. fMRI activity in the VTA/SN and ventral putamen corresponded to the surprising omission of a high probability shock. Participants' subjective relief at having not been shocked correlated with activity in brain regions typically associated with reward-prediction errors. The overall conclusion of the manuscript was that the absence of an expected aversive outcome in human fMRI looks like a reward-prediction error seen in other studies that use positive outcomes.

      Strengths:

      Overall, I found this to be a well-written human neuroimaging study investigating an often overlooked question on the role of aversive prediction errors, and how they may differ from reward-related prediction errors. The paper is well-written and the fMRI methods seem mostly rigorous and solid.

      Weaknesses:

      I did have some confusion over the use of the term "prediction-error" however as it is being used in this task. There is certainly an expectancy violation when participants are told there is a high probability of shock, and it doesn't occur. Yet, there is no relevant learning or updating, and participants are explicitly told that each trial is independent and the outcome (or lack thereof) does not affect the chances of getting the shock on another trial with the same instructed outcome probability. Prediction errors are primarily used in the context of a learning model (reinforcement learning, etc.), but without a need to learn, the utility of that signal is unclear.

      We operationalized “prediction error” as the response to the error in prediction or the violation of expectancy at the time of threat omission. In that sense, prediction error and expectancy violation (which is more commonly used in clinical research and psychotherapy; Craske et al., 2014) are synonymous. While prediction errors (or expectancy violations) are predominantly studied in learning situations, the definition in itself does not specify how the “expectancy” or “prediction” arises: whether it was through learning based on previous experience or through mere instruction. The rationale why we moved away from a conditioning study in the present manuscript is discussed in our general reply above.

      We agree with the reviewer that studying prediction errors outside a learning context limits the ecological validity of the task. However, we do believe there is also a strength to this approach. Specifically, the omission-related responses we measure are less confounded by subsequent learning (or updating of the wrongful expectation). Any difference between our results and prediction error responses in learning situation can therefore point to this exact difference in paradigm, and can thus identify responses that are specific to learning situations.

      An overarching question posed by the researchers is whether relief from not receiving a shock is a reward. They take as neural evidence activity in regions usually associated with reward prediction errors, like the VTA/SN . This seems to be a strong case of reverse inference. The evidence may have been stronger had the authors compared activity to a reward prediction error, for example using a similar task but with reward outcomes. As it stands, the neural evidence that the absence of shock is actually "pleasurable" is limited-albeit there is a subjective report asking subjects if they felt relief.

      We thank the reviewer for cautioning us and letting us critically reflect on our interpretation. We agree that it is important not to be overly enthusiastic when interpreting fMRI results and to attribute carelessly psychological functions to mere activations. Therefore, we will elaborate on the precautions we took not to minimize detrimental reverse inference.

      First, prior to analyzing our results, we preregistered clear hypotheses that were based on previous research, in addition to clear predictions, regions of interest and a testing approach on OSF. With our study, we wanted to investigate whether unexpected omissions of threat: (1) triggered activations in the VTA/SN, putamen, NAc and vmPFC (as has previously been shown in animal and human studies); (2) represent PE signals; and (3) were related to self-reported relief, which has also been shown to follow a PE time-curve in fear extinction (Vervliet et al., 2017). Based on previous research, we selected three criteria all PE signals should comply to. This means that if omission-related activations were to represent true PE signals, they should comply to these criteria. However, we agree that it would go too far to conclude based on our research that relief is a reward, or even that the omission-related activations represent only PE signals. While we found support for most of our hypotheses, this does not preclude alternative explanations. In fact, in the discussion, we acknowledge this and also discuss alternative explanations, such as responding to the salience (lines 395-397; “One potential explanation is therefore that the deactivation resulted from a switch from default mode to salience network, triggered by the salience of the unexpected threat omission or by the salience of the experienced stimulation.”), or anticipation (line 425-426; “... we cannot conclusively dismiss the alternative interpretation that we assessed (part of) expectancy instead”).

      Second, we have deliberately opted to only use descriptive labels such as omission-related activations when we are discussing fMRI results. Only when we are talking about how the activations were related to self-reported relief, we talk about relief-related activations.

      I have some other comments, and I elaborate on those above comments, below:

      (1) A major assumption in the paper is that the unexpected absence of danger constitutes a pleasurable event, as stated in the opening sentence of the abstract. This may sometimes be the case, but it is not universal across contexts or people. For instance, for pathological fears, any relief derived from exposure may be short-lived (the dog didn't bite me this time, but that doesn't mean it won't next time or that all dogs are safe). And even if the subjective feeling one gets is temporary relief at that moment when the expected aversive event is not delivered, I believe there is an overall conflation between the concepts of relief and pleasure throughout the manuscript. Overall, the manuscript seems to be framed on the assumption that "aversive expectations can transform neutral outcomes into pleasurable events," but this is situationally dependent and is not a common psychological construct as far as I am aware.

      We thank the reviewer for their comment. We have restructured the introduction because we agree with the reviewer that the introduction might have set false expectations concerning our interpretation of the results. The statements related to relief have been toned down in the revised manuscript.

      Still, we want to note that the initial opening statement “unexpected absence of danger constitutes the pleasurable emotion relief” was based on a commonly used definition of relief that states that relief refers to “the emotion that is triggered by the absence of expected or previously experienced negative stimulation ” (Deutsch, 2015). Both aspects that it is elicited by the absence of an otherwise expected aversive event and that it is pleasurable in nature has received considerable empirical support in emotion and fear conditioning research (Deutsch et al., 2015; Leknes et al., 2011; Papalini et al., 2021; Vervliet et al., 2017; Willems & Vervliet, 2021).

      That said, the notion that the feeling of relief is linked to the (reward) prediction error underlying the learning of safety is included in several theoretical papers in order to explain the commonly observed dopaminergic response at the time of threat omission (both in animals and humans; Bouton et al., 2020; Kalisch et al., 2019; Pittig et al., 2020).

      Together, these studies indicate that the definition of relief, and its potential role in threat omission-driven learning is – at least in our research field – established. Still, we felt that more direct research linking feelings of relief to omission-related brain responses was warranted.

      One of the main reasons why we specifically focus on the “pleasantness” of the relief is to assess the hedonic impact of the threat omission, as has been done in previous studies by our lab and others (Leknes et al., 2011; Leng et al., 2022; Papalini et al., 2021; Vervliet et al., 2017; Willems & Vervliet, 2021). Nevertheless, we agree with the reviewer that the relief we measure is a short-lived emotional state that is subjected to individual differences (as are all emotions).

      (2) The authors allude to this limitation, but I think it is critical. Specifically, the study takes a rather simplistic approach to prediction errors. It treats the instructed probability as the subjects' expectancy level and treats the prediction error as omission related activity to this instructed probability. There is no modeling, and any dynamic parameters affected by learning are unaccounted for in this design . That is subjects are informed that each trial is independently determined and so there is no learning "the presence/absence of stimulations on previous trials could not predict the presence/absence of stimulation on future trials." Prediction errors are central to learning. It is unclear if the "relief" subjects feel on not getting a shock on a high-probability trial is in any way analogous to a prediction error, because there is no reason to update your representation on future trials if they are all truly independent. The construct validity of the design is in question.

      (3) Related to the above point, even if subjects veered away from learning by the instruction that each trial is independent, the fact remains that they do not get shocks outside of the 100% probability shock. So learning is occurring, at least for subjects who realize the probability cue is actually a ruse.

      We thank the reviewer for raising these concerns. We believe that the general reply above covers the issues raised in points 2 and 3.

      (4) Bouton has described very well how the absence of expected threat during extinction can create a feeling of ambiguity and uncertainty regarding the signal value of the CS. This in large part explains the contextual dependence of extinction and the "return of fear" that is so prominent even in psychologically healthy participants. The relief people feel when not receiving an expected shock would seem to have little bearing on changing the long-term value of the CS. In any event, the authors do talk about conditioning (CS-US) in the paper, but this is not a typical conditioning study, as there is no learning.

      We fully agree with the reviewer that our study is no typical conditioning study. Nevertheless, because our research mostly builds on recent advances in the fear extinction domain, we felt it was necessary to introduce the fear extinction procedure and related findings. In the context of fear extinction learning, we have previously shown that relief is an emotional correlate of the prediction error driving acquisition of the novel safety memory (CSnoUS; Papalini et al., 2021; Vervliet et al., 2017). The ambiguity Bouton describes is the result of extinguished CS holding multiple meanings once the safety memory is acquired. Does it signal danger or safety? We agree with Bouton that the meaning of the CS for any new encounter will depend on the context, and the passage of time, but also on the initial strength of the safety acquisition (which is dependent on the size of the prediction error, and hence the amount of relief; Craske et al., 2014). However, it was not our objective to directly study the relation of relief to subsequent CS value, and our design is not tailored to do so post hoc.

      (5) In Figure 2 A-D, the omission responses are plotted on trials with varying levels of probability. However, it seems to be missing omission responses in 0% trials in these brain regions. As depicted, it is an incomplete view of activity across the different trial types of increasing threat probability.

      We thank the reviewer for pointing out this unclarity. The betas that are presented in the figures represent the ROI averages from each non-0% vs 0% contrasts (i.e., 25%>0%; 50%>0%; and 75%>0% for the weak, moderate and strong intensity levels). Any positive beta therefore indicates a stronger activation in the given region compared to a fully predicted omission. Any negative beta indicates a weaker activation.

      Adaptations in the revised manuscript: We have adapted the figure captions of figures 2 and 3.

      “The extracted beta-estimates in figures A-D represent the ROI averages from each non0% > 0% contrast (i.e., 25%>0%; 50%>0%; and 75%>0% for the weak, moderate and strong intensity levels). Any positive beta therefore indicates a stronger activation in the given region compared to a fully predicted omission. Any negative beta indicates a weaker activation.”

      (6) If I understand Figure 2 panels E-H, these are plotting responses to the shock versus no-shock (when no-shock was expected). It is unclear why this would be especially informative, as it would just be showing activity associated with shocks versus no-shocks. If the goal was to use this as a way to compare positive and negative prediction errors, the shock would induce widespread activity that is not necessarily reflective of a prediction error. It is simply a response to a shock. Comparing activity to shocks delivered after varying levels of probability (e.g., a shock delivered at 25% expectancy, versus 75%, versus 100%) would seem to be a much better test of a prediction error signal than shock versus no-shock.

      We thank the reviewer for this comment. The purpose of this preregistered contrast was to test whether fully predicted outcomes elicited equivalent activations in our ROIs (corresponding to the third prediction error axiom). Specifically, if a region represents a pure prediction error signal, the 100% (fully predicted shocks) > 0% (fully predicted shock omissions) contrast should be nonsignificant, and follow-up Bayes Factors would further provide evidence in favor of this null-hypothesis.

      We agree with the reviewer that the delivery of the stimulation triggers widespread activations in our regions of interest that confounded this contrast. However, given that it was a preregistered test for the prediction error axioms, we cannot remove it from the manuscript. Instead, we have argued in the discussion that future studies who want to take an axiomatic stance should consider alternative tests to examine this axiom.

      Adaptations in the revised manuscript: We adapted lines 358-364.

      “Thus, given that we could not control for the delivery of the stimulation in the 100% > 0% contrast (the delivery of the stimulation completely overlapped with the contrast of interest), it is impossible to disentangle responses to the salience of the stimulation from those to the predictability of the outcome. A fairer evaluation of the third axiom would require outcomes that are roughly similar in terms of salience. When evaluating threat omission PE, this implies comparing fully expected threat omissions following 0% instructions to fully expected absence of stimulation at another point in the task (e.g. during a safe intertrial interval).”

      Also note that our task did not lend itself for an in-depth analysis of aversive (worse-thanexpected) prediction error signals, given that there was only one stimulation trial for each probability x intensity level (see Supplemental Figure 1). The most informative contrast that can inform us about aversive prediction error signals contrasts all non-100% stimulation trials with all 100% stimulation trials. The results of this contrast are presented in Supplemental Figure 16 and Supplemental Table 11 for completeness.

      (7) I was unclear what the results in Figure 3 E-H were showing that was unique from panels A-D, or where it was described. The images looked redundant from the images in A-D. I see that they come from different contrasts (non0% > 0%; 100% > 0%), but I was unclear why that was included.

      We thank the reviewer for this comment. Our answer is related to that of the previous comment. Figure 3 presents the results of the axiomatic tests within the secondary ROIs we extracted from a wider secondary mask based on the non0%>0% contrast.

      (8) As mentioned earlier, there is a tendency to imply that subjects felt relief because there was activity in "the reward pathway ."

      We thank the reviewer for their comment, but we respectfully disagree. Subjective relief was explicitly probed when the instructed stimulations stayed away. In the manuscript we only talk about “relief” when discussing these subjective reports. We found that participants reported higher levels of relief-pleasantness following omissions of stronger and more probable threat. This was an observation that matches our predictions and replicates our previous behavioral study (Willems & Vervliet, 2021).

      The fMRI evidence is treated separately from the “pleasantness” of the relief. Specifically, we refrain from calling the threat omission-related neural responses “relief-activity” as this would indeed imply that the activation would only be attributed to this psychological function. Instead, we talked about omission-related activity, and we assessed whether it complied to the prediction error criteria as specified by the axiomatic approach.

      Only afterwards, because we hypothesized that omission-related fMRI activation and selfreported relief-pleasantness were related, and because we found a similar response pattern for both measures, we examined how relief and omission-related fMRI activations within our ROIs were related on a trial-by-trial basis. To this end, we entered relief-pleasantness ratings as a parametric modulator to the omission regressor.

      By no means do we want to reduce an emotional experience (relief) to fMRI activations in isolated regions in the brain. We agree with the reviewer that this would be far too reductionist. We therefore also ran a pre-registered LASSO-PCR analysis in order to identify whether a whole-brain pattern of activations can predict subjective relief (independent from the exact instructions we gave, and independent of our a priori ROIs). This analysis used trialby-trial patterns of activation across all voxels in the brain as the predictor and self-reported relief as the outcome variable. It is therefore completely data-driven and can be seen as a preregistered exploratory analysis that is intended to inform future studies.

      (9) From the methods, it wasn't entirely clear where there is jitter in the course of a trial. This centers on the question of possible collinearity in the task design between the cue and the outcome. The authors note there is "no multicollinearity between anticipation and omission regressors in the firstlevel GLMs," but how was this quantified? b The issue is of course that the activity coded as omission may be from the anticipation of the expected outcome.

      We thank the reviewer for pointing out this unclarity. Jitter was introduced in all parts of the trial: i.e., the duration of the inter-trial interval (4-7s), countdown clock (3-7s), and omission window (4-8s) were all jittered (see fig. 1A and methods section, lines 499-507). We added an additional line to the method section.

      Adaptations in the revised manuscript: We added an additional line of to the methods section to further clarify the jittering (lines 498-500).

      “The scale remained on the screen for 8 seconds or until the participant responded, followed by an intertrial interval between 4 and 7 seconds during which only a fixation cross was shown. Note that all phases in the trial were jittered (i.e., duration countdown clock, duration outcome window, duration intertrial interval).”

      Multicollinearity between the omission and anticipation regressors was assessed by calculating the variance inflation factor (VIF) of omission and anticipation regressors in the first level GLM models that were used for the parametric modulation analyses.

      Adaptations in the revised manuscript: We replaced the VIF abbreviation with “variance inflation factor” (line 423-424).

      “Nevertheless, there was no multicollinearity between anticipation and omission regressors in the first-level GLMs (VIFs Variance Inflation Factor, VIF < 4), making it unlikely that the omission responses purely represented anticipation.”

      (10) I did not fully understand what the LASSO-PCR model using relief ratings added. This result was not discussed in much depth, and seems to show a host of clusters throughout the brain contributing positively or negatively to the model. Altogether, I would recommend highlighting what this analysis is uniquely contributing to the interpretation of the findings.

      The main added value of this analyses is that it uses a different approach altogether. Where the (mass univariate) parametric modulation analysis estimated in each voxel (and each ROI) whether the activity in this voxel/ROI covaried with the reported relief, a significant activation only indicated that this voxel was related to relief. However, given that each voxel/ROI is treated independently in this analysis, it remains unclear how the activations were embedded in a wider network across the brain, and which regions contributed most to the prediction of relief. The multivariate LASSO-PCR analysis approach we took attempts to overcome this limitation by examining if a more whole-brain pattern can predict relief. Because we use the whole-brain pattern (and not only our a priori ROIs), this analysis is completely data-driven and is intended to inform future studies. In addition, the LASSO-PCR model was cross-validated using five-fold cross-validation, which is also a difference (and a strength) compared to the mass univariate GLM approach.

      One interesting finding that only became evident when we combined univariate and multivariate approaches is that despite that the parametric modulation analysis showed that omission-related fMRI responses in the ROIs were modulated by the reported relief, none of these ROIs contributed significantly to the prediction of relief based on the identified signature. Instead, some of the contributing clusters fell within other valuation and errorprocessing regions (e.g. lateral OFC, mid cingulate, caudate nucleus). This suggests that other regions than our a priori ROIs may have been especially important for the subjective experience of relief, at least in this task. However, all these clusters were small and require further validation in out of sample participants. More research is necessary to test the generalizability and validity of the relief signature to new individuals and tasks, and to compare the signature with other existing signature models (e.g., signature of pain, fear, reward, pleasure). However, this was beyond the scope of the present study.

      Adaptations in the revised manuscript: We altered the explanation of the LASSO-PCR approach in the results section (lines 286-295) and the discussion (lines 399-402)

      Adaptations in the Results section: “The (mass univariate) parametric modulation analysis showed that omission-related fMRI activity in our primary and secondary ROIs correlated with the pleasantness of the relief. However, given that each voxel/ROI is treated independently in this analysis, it remains unclear how the activations were embedded in a wider network of activation across the brain, and which regions contributed most to the prediction of relief. To overcome these limitations, we trained a (multivariate) LASSO-PCR model (Least Absolute Shrinkage and Selection Operator-Regularized Principle Component Regression) in order to identify whether a spatially distributed pattern of brain responses can predict the perceived pleasantness of the relief (or “neural signature” of relief)31. Because we used the whole-brain pattern (and not only our a priori ROIs), this analysis is completely data driven and can thus identify which clusters contribute most to the relief prediction.”

      Adaptations in the Discussion section: “In addition to examining the PE-properties of neural omission responses in our a priori ROIs, we trained a LASSO-PCR model to establish a signature pattern of relief. One interesting finding that only became evident when we compared the univariate and multivariate approach was that none of our a priori ROIs appeared to be an important contributor to the multivariate neural signature, even though all of them (except NAc) were significantly modulated by relief in the univariate analysis.”

      In addition to the public peer review, the reviewers provided some recommendation on how to further improve our manuscript. We will reply to the recommendations below.

      Reviewer #1 (Recommendations For The Authors):

      Given that you do have trial-level estimates from the classifier analysis, it would be very informative to use learning models and examine responses trial-by-trial to test whether there are prediction errors that vary over time as a function of learning.

      We thank the reviewer for the suggestion. However, based on the results of the run-regressor, we do not anticipate large learning effects in our paradigm. As we mentioned in our responses above, we controlled for time-related drops in omission-responding by including a “run” regressor in our analyses. Results of this regressor for subjective relief and omission-related SCR showed that although there was a general drop in reported relief pleasantness and omission SCR over time, the effects of probability and intensity remained present until the last run. This suggests that even though some learning might have taken place, its effect was likely small and did not abolish our manipulations of probability and intensity. In any case, we cannot use the LASSO-PCR signature model to investigate learning, as this model uses the trial-level brain pattern at the time of US omission to estimate the associated level of relief. These estimates can therefore not be used to examine learning effects.

      Reviewer #2 (Recommendations For The Authors):

      The LASSO-PCR model feels rather disconnected from the rest of the paper and does not add much to the main theme. I would suggest to remove this part from the paper.

      We thank the reviewer for this suggestion. However, the LASSO-PCR analysis was a preregistered. We therefore cannot remove it from the manuscript. We hope to have clarified its added value in the revised version of the manuscript.

    1. Author response:

      The following is the authors’ response to the original reviews.

      Public Reviews:

      Reviewer #1 (Public Review):

      Valk and Engert et al. examined the potential relations between three different mental training modules, hippocampal structure and functional connectivity, and cortisol levels over a 9-month period. They found that among the three types of mental training: Presence (attention and introspective awareness), Affect (socio-emotional - compassion and prosocial motivation), and Perspective (socio-cognitive - metacognition and perspective taking) modules; Affect training most consistently related to changes in hippocampal structure and function - specifically, CA1-3 subfields of the hippocampus. Moreover, decreases in diurnal cortisol correlated to bilateral increases in volume, and decreases in diurnal and chronic cortisol left CA1-3 functional connectivity. Chronic cortisol levels also related to right CA4/DG volume and left subiculum function. The authors demonstrate that mindfulness training programs impact hippocampus and are a potential avenue for stress interventions, a potential avenue to improve health. The data contribute to the literature on plasticity of hippocampal subfields during adulthood, the impact of mental training interventions on the brain, and the link between CA1-3 and both short- and long-term stress changes. Additional clarification and extension of the methods is needed to strengthen the authors' conclusions.

      We thank the Reviewer for their positive evaluation and summary of our findings and work. We made additional changes as suggested by the Reviewer and hope this clarified any open points.

      (1) The authors thoughtfully approached the study of hippocampal subfields, utilizing a method designed for T1w images that outperformed Freesurfer 5.3 and that produced comparable results to an earlier version of ASHS. However, given the use of normalized T1-weighted images to delineate hippocampal subfield volume, some caution may be warranted (Wisse et al. 2020). While the authors note the assessment of quality control processes, the difficulty in ensuring valid measurement is an ongoing conversation in the literature. This also extends to the impact of functional co-registration using segmentations. I appreciate the inclusion of Table 5 in documenting reasons for missing data across subjects. Providing additional details on the distribution of quality ratings across subfields would help contextualize the results and ensure there is equal quality of segmentations across subfields.

      We thank the Reviewer for bringing up this point. In the current work, we assessed the overall segmentation of all six subfields per individual. Thus, unfortunately, we have no data of quality of segmentation of individual subfields beyond our holistic assessment. Indeed, registration of hippocampal subfields remains a challenge and we have further highlighted this limitation in the Discussion of the current work.

      “It is of note that the current work relies on a segmentation approach of hippocampal subfields including projection to MNI template space, an implicit correction for total brain volume through the use of a stereotaxic reference frame. Some caution for this method may be warranted, as complex hippocampal anatomy can in some cases lead to over- as well as underestimation of subfield volumes, as well as subfield boundaries may not always be clearly demarcated (1). Future work, studying the hippocampal surface at higher granularity, for example though unfolding the hippocampal sheet (2-5), may further help with both alignment and identification of not only subfield-specific change but also alterations as a function of the hippocampal long axis, a key dimension of hippocampal structural and functional variation that was not assessed in the current work (6, 7).”

      (2) Given the consistent pattern of finding results with CA1-3, in contrast to other subfields, it would help to know if the effects of the different training modules on subfields differed from each other statistically (i.e., not just that one is significant, and one is not) to provide an additional context of the strength of results focused on Affect training and CA1-3 (for example, those shown in Figure 3).

      Our work investigated i) whether the effects of the individual Training Modules differed from each other statistically. We found that the Affect Training Module showed increases in CA1-3 volume, and that these increases remained when testing effects relative to changes in this subfield following Perspective training and in retest controls. Moreover, in CA1-3 we found changes in functional connectivity when comparing the Affect to Perspective training Module. These changes were only present in this contrast, but not significant in each of the Training Modules per se. To test for specificity, we additionally evaluated whether subfield-specific changes were present above and beyond changes in the other ipsilateral hippocampal subfields. Relative to other subfields, right CA1-3 showed increases in the Affect vs Perspective contrast (left: t-value: 2.298, p=0.022, Q>0.1; right: t-value: 3.045, p=0.0025, Q=0.015). No other subfield showed significant changes. We now include this statement in the revised Results and Supplementary Tables.

      “Moreover, associations between CA1-3 and Affect, relative to Perspective, seemed to go largely above and beyond changes in the other subfields (left: t-value: 2.298, p=0.022, Q>0.1; right: t-value: 3.045, p=0.0025, Q=0.015, see further Supplementary File 1h).”

      Author response table 1.

      Subfield-specific changes following the Training Modules, controlling for the other two ipsilateral subfields

      Reviewer #1 (Recommendations For The Authors):

      (1) In Figure 1, using different colors for subfields versus the modules (yellow, red, green) would help as it could lead the reader to try to draw connections between the two when it is namely a depiction of the delineations.

      As suggested, we updated Figure 1 accordingly and present the subfields in different shades of purple for clarity. Please find the updated figure below.

      Author response image 1.

      (2) In the Results, it was at times hard to follow when Affect off Perspective where the focus of the results. Perhaps the authors could restructure or add additional context for clarity.

      We are happy to clarify. For the first analysis on Module-specific changes in hippocampal subfield volume, we compared effects across Training Modules. Here, main contrasts were ran between subjects: Presence vs active control and within subjects: Affect versus Perspective. In additional secondary contrasts, we studied training effects vs retest control. After observing consistent increases in bilateral CA1-3 following Affect, in the following analysis, we evaluated 1) intrinsic functional networks in main and supplementary contrasts and 2) diurnal cortisol measures within the Training modules only and all three Training Modules combined, and also adopted 3) a multivariate approach (PLS) (see comments Reviewer 2). We now also report effects of cortisol change on structural and functional subfield change in Presence and Perspective, for additional completeness and clarity.

      “To study whether there was any training module-specific change in hippocampal subfield volumes following mental training, we compared training effects between all three Training Modules (Presence, Affect, and Perspective). Main contrasts were: Presence vs Active control (between subjects) and Affect vs Perspective (within subjects). Supplementary comparisons were made vs retest controls and within training groups.”

      “Overall, for all hippocampal subfields, findings associated with volume increases in CA1-3 fol-lowing the Affect training were most consistent across timepoints and contrasts (Supplementary File 1a-f).”

      “Subsequently, we studied whether hippocampal CA1-3 would show corresponding changes in intrinsic function following the Affect mental training.”

      “In particular, the moderately consistent CA1-3 volume increases following Affect training were complemented with differential functional connectivity alterations of this subfield when comparing Affect to Perspective training”

      “Last, we probed whether group-level changes in hippocampal subfield CA1-3 volume would correlate with individual-level changes in diurnal cortisol indices (Presence: n= 86; Affect: n=92; Perspective: n=81), given that the hippocampal formation is a nexus of the HPA-axis (8). We took a two-step approach. First, we studied associations between cortisol and subfield change, particularly focusing on the Affect module and CA1-3 volume based on increases in CA1-3 volume identified in our group-level analysis.”

      “We observed that increases in bilateral CA1-3 following Affect showed a negative association with change in total diurnal cortisol output […]”

      “We did not observe alterations in CA1-3 volume in relation to change in cortisol markers in Presence or Perspective. Yet, for Presence, we observed association between slope and LCA4/DG change (t=-2.89, p=0.005, q=0.03), (Supplementary File 1uv).”

      “In case of intrinsic function, we also did not observe alterations in CA1-3 in relation to change in cortisol markers in Presence or Perspective, nor in other subfields (Supplementary File 1wx).”

      Author response table 2.

      Correlating change in subfield volume and diurnal cortisol indices in Presence. Main focus was on CA1-3 based on volumetric observations and are highlighted in bold.

      Author response table 3.

      Correlating change in subfield volume and diurnal cortisol indices in Perspective. Main focus was on CA1-3 based on volumetric observations and are highlighted in bold.

      Author response table 4.

      Association between stress-markers and within functional network sub-regions in Affect and Perspective.

      Author response table 5.

      Correlating change in subfield function and diurnal cortisol indices in Presence. Main focus was on CA1-3 based on volumetric observations and are highlighted in bold. For these multiple comparisons (FDRq, corrected for two subfields) values are reported if uncorrected p values are below p<.05.

      Author response table 6.

      Correlating change in subfield function and diurnal cortisol indices in Perspective. Main focus was on CA1-3 based on volumetric observations and are highlighted in bold. For these multiple comparisons (FDRq, corrected for two subfields) values are reported if uncorrected p values are below p<.05.

      (3) In the Methods, the authors note that corrections for multiple comparisons were used where needed, throughout the manuscript there is some switching between corrected and uncorrected p-values. At times, this made it difficult to follow in terms of when these corrections were needed.

      For clarity, we added explicit multiple comparisons information a) in main and supplementary results, and b) wherever extra information was needed. Also, we only included main contrasts in Table 1-3 to avoid confusion and moved the information on changes in SUB and CA4/DG to the Supplementary tables.

      (4) Typically, when correcting for intracranial volume the purpose is the ensure that sexual dimorphism in the size of the brain is accounted for. I would recommend the authors assess whether sex differences are accounted for by the MNI normalization approach taken. In the reading of the original Methods paper for the patch-based algorithm used, ICV was used to transform to MNI152 space. It would help to have additional information on how the normalization was done in the current study in order to draw comparisons to other findings in the literature.

      We are happy to further clarify. In the current work, we used the same approach as in the original paper. Volumes were linearly registered to the MNI template using FSL flirt. We now provided this additional information in the revised methods.

      “Hippocampal volumes were estimated based on T1w data that were linearly registered to MNI152 using FSL flirt (http://www.fmrib.ox.ac.uk/fsl/), such that intracranial volume was implicitly controlled for.”

      We agree with the Reviewer that sex differences may still be present, and investigated this. At baseline, sex differences were found in all subfields in the left hemisphere, and right CA4/DG (FDRq<0.05). Regressing out ICV resolved remaining sex differences. We then evaluated whether main results of volumetric subfield change were impacted by ICV differences. Differences between Affect and Perspective remained stable. We have now added this additional analysis in the Supplementary Materials.

      “Although stereotaxic normalization to MNI space would in theory account for global sex differences in intra-cranial volume, we still observed sex differences in various subfield volumes at baseline. Yet, accounting for ICV did not impact our main results suggesting changes in CA1-3 following Affect were robust to sex differences in overall brain volume (Supplementary File1j).”

      Author response table 7.

      Sex differences (female versus male) in hippocampal subfield volumes.

      Reviewer #2 (Public Review):

      In this study, Valk, Engert et al. investigated effects of stress-reducing behavioral intervention on hippocampal structure and function across different conditions of mental training and in relation to diurnal and chronic cortisol levels. The authors provide convincing multimodal evidence of a link between hippocampal integrity and stress regulation, showing changes in both volume and intrinsic functional connectivity, as measured by resting-state fMRI, in hippocampal subfield CA1-3 after socio-affective training as compared to training in a socio-cognitive module. In particular, increased CA1-3 volume following socio-affective training overlapped with increased functional connectivity to medial prefrontal cortex, and reductions in cortisol. The conclusions of this paper are well supported by the data, although some aspects of the data analysis would benefit from being clarified and extended.

      A main strength of the study is the rigorous design of the behavioral intervention, including test-retest cohorts, an active control group, and a previously established training paradigm, contributing to an overall high quality of included data. Similarly, systematic quality checking of hippocampal subfield segmentations contributes to a reliable foundation for structural and functional investigations.

      We thank the Reviewer for the thoughtful summary and appreciation of our work, as well as requests for further clarification and analyses. We addressed each of them in a point by point fashion below.

      Another strength of the study is the multimodal data, including both structural and functional markers of hippocampal integrity as well as both diurnal and chronic estimates of cortisol levels.

      (1) However, the included analyses are not optimally suited for elucidating multivariate interrelationships between these measures. Instead, effects of training on structure and function, and their links to cortisol, are largely characterized separately from each other. This results in the overall interpretation of results, and conclusions, being dependent on a large number of separate associations. Adopting multivariate approaches would better target the question of whether there is cortisol-related structural and functional plasticity in the hippocampus after mental training aimed at reducing stress.

      We thank the Reviewer for this suggestion. Indeed, our project combined different univariate analyses to uncover the association between hippocampal subfield structure, function, and cortisol markers. While systematic, a downside of this approach is indeed that interpretation of our results depend on a large number of analyses. To further explore the question whether there is cortisol-related structural and functional plasticity in the hippocampus, we followed the Reviewer’s suggestion and additionally adopted a multivariate partial least squares (PLS) model. We ran two complementary models. One focusing on the bilateral CA1-3, as this region showed increases in volume following Affect training and differential change between Affect and Perspective training in our resting state analyses and one model including all subfields. Both models included all stress markers. We found that both models could significantly relate stress markers to brain measures, and that in particular Affect showed strong associations with significant the latent markers. Both analyses showed inverse effects of structure and function in relation to stress markers and both slope and AUC changes showed strongest loadings. We now include these analyses the revised manuscript.

      Abstract

      “Of note, using a multivariate approach we found that other subfields, showing no group-level changes, also contributed to alterations in cortisol levels, suggesting circuit-level alterations within the hippocampal formation.”

      Methods

      “Partial least squares analysis

      To assess potential relationships between cortisol change and hippocampal subfield volume and functional change, we performed a partial least squares analysis (PLS) (9, 10). PLS is a multivariate associative model that to optimizes the covariance between two matrices, by generating latent components (LCs), which are optimal linear combinations of the original matrices (9, 10). In our study, we utilized PLS to analyze the relationships between change in volume and intrinsic function of hippocampal subfields and diurnal cortisol measures. Here we included all Training Modules and regressed out effects of age, sex, and random effects of subject on the brain measures before conducting the PLS analysis. The PLS process involves data normalization within training groups, cross-covariance, and singular value decomposition. Subsequently, subfield and behavioral scores are computed, and permutation testing (1000 iterations) is conducted to evaluate the significance of each latent factor solution (FDR corrected). We report then the correlation of the individual hippocampal and cortisol markers with the latent factors. To estimate confidence intervals for these correlations, we applied a bootstrapping procedure that generated 100 samples with replacement from subjects’ RSFC and behavioral data.”

      Results

      “Last, to further explore the question whether there is concordant cortisol-related structural and functional plasticity in the hippocampus we adopted a multivariate partial least square approach, with 1000 permutations to account for stability (9, 10) and bootstrapping (100 times) with replacement. We ran two complementary models including all Training Modules whilst regressing out age, sex and random effects of subject. First, we focused on the bilateral CA1-3, as this region showed increases in volume following Affect training and differential change between Affect and Perspective training in our resting state analyses. In the second model included structural and functional data of all subfields. Both models included all stress markers. We found that both models could identify significant associations between cortisol stress markers and hippocampal plasticity (FDRq<0.05), and that in particular Affect showed strongest associations with the latent markers for CA1-3 (Table 5). Both analyses showed inverse effects of subfield structure and function in relation to stress markers and both slope and AUC changes showed strongest associations with the latent factor.”

      Author response table 8.

      Multivariate PLS analyses linking cortisol markers to hippocampal subfield volume and function.

      Discussion

      “Last, performing multivariate analysis, we again observed associations between CA1-3 volume and function plasticity and stress change, strongest in Affect. Yet combining all subfields in a single model indicated that other subfields also link to stress alterations, indicating that ultimately circuit-level alterations within the hippocampal formation relate to latent changes in diurnal stress markers across Training Modules.”

      “This interpretation is also supported by our multivariate observations.”

      “In line with our observations in univariate analysis, we found multivariate associations between hippocampal subfield volume, intrinsic function and cortisol markers. Again, the contribution of volume and intrinsic function was inverse. This may possibly relate to the averaging procedure of the functional networks. Combined, outcomes of our univariate and multivariate analyses point to an association between change in hippocampal subfields and stress markers, and that these changes, at the level of the individual, ultimately reflect complex interactions within and across hippocampal subfields and may capture different aspects of diurnal stress. Future work may more comprehensively study the plasticity of the hippocampal structure, and link this to intrinsic functional change and cortisol to gain full insights in the specificity and system-level interplay across subfields, for example using more detailed hippocampal models (3). Incorporating further multivariate, computational, models is needed to further unpack and investigate the complex and nuanced association between hippocampal structure and function, in particular in relation to subfield plasticity and short and long-term stress markers.”

      “…based on univariate analysis. Our multivariate analysis further nuanced this observation, but again pointed to an overall association between hippocampal subfield changes and cortisol changes, but this time more at a systems level.”

      “Lastly, our multivariate analyses also point to a circuit level understanding of latent diurnal stress scores.”

      Author response image 2.

      Multivariate associations between changes in structure and function of hippocampal subfield volume and markers of stress change in Affect. A) Multivariate associations between bilateral CA1-3 volume and intrinsic function and stress markers. Left: Scatter of loadings, colored by Training Module; Right upper: individual correlations of stress markers; Right lower: individual correlation of subfields; B). Multivariate associations between all subfields’ volume and intrinsic function and stress markers. Left: Scatter of loadings, colored by Training Module; Right upper: individual correlations of stress markers; Right lower: individual correlation of subfields.

      (2) The authors emphasize a link between hippocampal subfield CA1-3 and stress regulation, and indeed, multiple lines of evidence converge to highlight a most consistent role of CA1-3. There are, however, some aspects of the results that limit the robustness of this conclusion. First, formal comparisons between subfields are incomplete, making it difficult to judge whether the CA1-3, to a greater degree than other subfields, display effects of training.

      We thank the Reviewer for this comment. To further test for specificity, we additionally evaluated subfield-specific changes relative to other subfields for our main contrasts (Presence versus Active Control and Affect versus Perspective). Relative to other subfields, right CA1-3 showed increases in the Affect vs Perspective contrast (left: t-value: 2.298, p=0.022, Q>0.1; right: t-value: 3.045, p=0.0025, Q=0.015); no other subfield showed significant changes. We now include this statement in Results and Supplementary Tables.

      “Moreover, associations between CA1-3 and Affect, relative to Perspective, seemed to go largely above and beyond changes in the other subfields (left: t-value: 2.298, p=0.022, Q>0.1; right: t-value: 3.045, p=0.0025, Q=0.015, see further Supplementary File 1h).”

      Author response table 9.

      Subfield-specific changes following the Training Modules, controlling for the other two ipsilateral subfields

      (3) Relatedly, it would be of interest to assess whether changes in CA1-3 make a significant contribution to explaining the link between hippocampal integrity and cortisol, as compared to structure and functional connectivity of the whole hippocampus.

      We thank the Reviewer for this comment. Please see the PLS analysis performed above (R2Q1). Indeed, not only CA1-3 but also other subfields seem to show a relationship with cortisol, in line with circuit level accounts on stress regulation and hippocampal circuit alterations (8, 11-15).

      (4) Second, both structural and functional effects (although functional to a greater degree), were most pronounced in the specific comparison of "Affect" and "Perspective" training conditions, possibly limiting the study's ability to inform general principles of hippocampal stress-regulation.

      We agree with the Reviewer that the association between stress and hippocampal plasticity, on the one hand, and mental training and hippocampal plasticity, on the other hand, make it not very straightforward to inform general principles on hippocampal stress regulation. However, as underscored in the discussion, in previous work we could also link mental training to stress reductions(16-18). We hope that the additional analyses and explanations further explain the multilevel insights of the current work, on the one hand using group-level analysis to investigate and illustrate the association between mental training and hippocampal subfield volume and intrinsic function, and on the other hand using individual level analysis to unpack the association between cortisol change and hippocampal subfield change.

      Reviewer #2 (Recommendations For The Authors):

      (1) In the Results, the description of how the hippocampal subfields' functional networks were defined would benefit from some clarification. It is also somewhat unclear what is meant by (on page 10): "Evaluating functional connectivity changes, we found that connectivity of the right CA1-3 functional network showed differential changes when comparing Affect training to Perspective training (2.420, p=0.016, FDRq=0.032, Cohens D =0.289), but not versus retest control (Table 1 and Supplementary Table 8-14)." Were there significant changes in CA1-3 FC following both training conditions (but these differed from each other)? A description of what this difference reflected would increase the reader's understanding.

      We are happy to clarify. We included information of change of individual modules in the Supplementary materials, Supplementary Table 1 and 2, 9 and 10. Changes for functional connectivity were largely due to the differences in Modules, but did not show strong effects in one Module alone. We now include information on Affect and Perspective un-contrasted change in the main results text:

      “… which could be attributed to decreases in right CA1-3 mean FC following Perspective (t=-2.012, p=0.045, M:-0.024, std: 0.081, CI [-0.041 -0.006]), but not Affect (t=1.691, p=0.092, M: 0.010, std: 0.098, CI [-0.01 0.031]); changes were not present when comparing Affect training versus retest control (Table 1 and Supplementary File 1k-q).”

      (2) As described in the Public Review, the lack of multivariate assessments may risk selling the data short. Including analyses of concomitant functional and structural changes, in relation to cortisol, seems like an approach better adapted to characterize meaningful interrelationships between these measures.

      We thank the Reviewer for suggesting multivariate assessments. To understand the interrelation between behavioral intervention, hippocampal plasticity, and cortisol changes, the current work first evaluates a simpler operationalization of the relationship between hippocampal subfield structure and volume, and cortisol as a function of mental training. Thus, given the complex nature of the study, we initially opted for a model where we assess structural and functional changes independently, with structural changes as the basis of our investigations. Now we have also included a multivariate approach (PLS) to further test the association between hippocampal subfields and cortisol markers, please see our additions to the manuscript above. We now highlighted multivariate associations in the Discussion as well, and suggest this as an important next step for more detailed, future investigations.

      “Incorporating further multivariate, computational, models is needed to further unpack and investigate the complex and nuanced association between hippocampal structure and function, in particular in relation to subfield plasticity and short and long-term stress markers.”

      (3) A minor comment regards the Figures. Some main effects should be visualized in a clearer manner. For instance, the scatterplots in Figure 1, panel D. Also, some of the current headings within the figures could be made more intuitive to the reader.

      We thank the Reviewer for this comment. To improve clarity, we updated figure headings. For Figure 1D, the challenge is that the data are quite scattered and we aimed to visualize our observations in a naturalistic way. Therefore, we added additional y-axis information to further clarify the figures. Creating more overlap or differentiation would make other elements of the figure less clear, hence we remained with the current set-up detailing the intra- and inter-individual alterations of the current model.

      (1) Wisse LEM, Chetelat G, Daugherty AM, de Flores R, la Joie R, Mueller SG, et al. (2021): Hippocampal subfield volumetry from structural isotropic 1 mm(3) MRI scans: A note of caution. Hum Brain Mapp. 42:539-550.

      (2) DeKraker J, Kohler S, Khan AR (2021): Surface-based hippocampal subfield segmentation. Trends Neurosci. 44:856-863.

      (3) DeKraker J, Haast RAM, Yousif MD, Karat B, Lau JC, Kohler S, et al. (2022): Automated hippocampal unfolding for morphometry and subfield segmentation with HippUnfold. Elife. 11.

      (4) Vos de Wael R, Lariviere S, Caldairou B, Hong SJ, Margulies DS, Jefferies E, et al. (2018): Anatomical and microstructural determinants of hippocampal subfield functional connectome embedding. Proc Natl Acad Sci U S A. 115:10154-10159.

      (5) Bernhardt BC, Bernasconi A, Liu M, Hong SJ, Caldairou B, Goubran M, et al. (2016): The spectrum of structural and functional imaging abnormalities in temporal lobe epilepsy. Ann Neurol. 80:142-153.

      (6) Vogel JW, La Joie R, Grothe MJ, Diaz-Papkovich A, Doyle A, Vachon-Presseau E, et al. (2020): A molecular gradient along the longitudinal axis of the human hippocampus informs large-scale behavioral systems. Nat Commun. 11:960.

      (7) Genon S, Bernhardt BC, La Joie R, Amunts K, Eickhoff SB (2021): The many dimensions of human hippocampal organization and (dys)function. Trends Neurosci. 44:977-989.

      (8) McEwen BS (1999): Stress and hippocampal plasticity. Annu Rev Neurosci. 22:105-122.

      (9) Kebets V, Holmes AJ, Orban C, Tang S, Li J, Sun N, et al. (2019): Somatosensory-Motor Dysconnectivity Spans Multiple Transdiagnostic Dimensions of Psychopathology. Biol Psychiatry. 86:779-791.

      (10) McIntosh AR, Lobaugh NJ (2004): Partial least squares analysis of neuroimaging data: applications and advances. Neuroimage. 23 Suppl 1:S250-263.

      (11) Paquola C, Benkarim O, DeKraker J, Lariviere S, Frassle S, Royer J, et al. (2020): Convergence of cortical types and functional motifs in the human mesiotemporal lobe. Elife. 9.

      (12) DeKraker J, Ferko KM, Lau JC, Kohler S, Khan AR (2018): Unfolding the hippocampus: An intrinsic coordinate system for subfield segmentations and quantitative mapping. Neuroimage. 167:408-418.

      (13) McEwen BS, Nasca C, Gray JD (2016): Stress Effects on Neuronal Structure: Hippocampus, Amygdala, and Prefrontal Cortex. Neuropsychopharmacology. 41:3-23.

      (14) Sapolsky RM (2000): Glucocorticoids and hippocampal atrophy in neuropsychiatric disorders. Arch Gen Psychiatry. 57:925-935.

      (15) Jacobson L, Sapolsky R (1991): The role of the hippocampus in feedback regulation of the hypothalamic-pituitary-adrenocortical axis. Endocr Rev. 12:118-134.

      (16) Engert V, Hoehne K, Singer T (2023): Specific reduction in the cortisol awakening response after socio-affective mental training. Mindfulness.

      (17) Puhlmann LMC, Vrticka P, Linz R, Stalder T, Kirschbaum C, Engert V, et al. (2021): Contemplative Mental Training Reduces Hair Glucocorticoid Levels in a Randomized Clinical Trial. Psychosom Med. 83:894-905.

      (18) Engert V, Kok BE, Papassotiriou I, Chrousos GP, Singer T (2017): Specific reduction in cortisol stress reactivity after social but not attention-based mental training. Sci Adv. 3:e1700495.

    1. Author Response

      The following is the authors’ response to the original reviews.

      Reviewer #1

      Strengths:

      This study uses a carefully constructed experiment design and decision-making task that allows separation of multiple electroencephalographic (EEG) signals thought to track different stages of decision-making. For example, the steady-state visual evoked potential measures can be cleanly dissociated from more anterior beta-band activity over the motor cortex. They also allow evaluation of how cued expectancy effects may unfold over a number of testing sessions. This is important because the most consistent evidence of expectation-related modulations of electrophysiological measures (using EEG, local field potentials, or single neuron firing rates) is from studies of nonhuman primates that involved many days of cue-stimulus contingency learning, and there is a lack of similar work using several testing sessions in humans. Although there were several experimental conditions included in the study, careful trial-balancing was conducted to minimise biases due to incidental differences in the number of trials included for analyses across each condition. Performance for each individual was also carefully calibrated to maximise the possibility of identifying subtle changes in task performance by expectation and avoid floor or ceiling effects.

      We would like to thank Reviewer 1 for these very positive comments.

      Weaknesses:

      Although the experiment and analysis methods are cohesive and well-designed, there are some shortcomings that limit the inferences that can be drawn from the presented findings.

      Comment #1

      The first relates to the measures of SSVEPs and their relevance for decision-making in the task. In order to eliminate the influence of sporadic pulses of contrast changes that occurred during stimulus presentation, a time window of 680-975 ms post-stimulus onset was used to measure the SSVEPs. The mean response times for the valid and neutral cues were around 850-900 ms for correct responses, and within the same time window for errors in the invalid cue condition. In addition, a large portion of response times in perceptual decision-making tasks are substantially faster than the mean due to right-skewed response time distributions that are typically observed. As it has also been estimated to require 70-100 ms to execute a motor action (e.g., a keypress response) following the commitment to a decision. This raises some concerns about the proportion of trials in which the contrast-dependent visual responses (indexed by the SSVEPs) indexed visual input that was actually used to make the decision in a given trial. Additional analyses of SSVEPs that take the trial-varying pulses into account could be run to determine whether expectations influenced visual responses earlier in the trial.

      The reviewer raises a very valid point and, indeed, it is an issue that we grappled with in our analyses. Actually, in this study, the RT distributions were not right-skewed, but appear to be relatively normal (RT distributions shown below). This is something that we have previously observed when using tasks that involve an initial zero-evidence lead in at the start of each trial which means that participants cannot start accumulating at stimulus onset and must rely on their knowledge of the lead-in duration to determine when the physical evidence has become available (e.g. Kelly et al 2021, Nat Hum Beh). We agree that it is important to establish whether the reported SSVEP modulations occur before or after choice commitment. In our original submission we had sought to address this question through our analysis of the response-locked ‘difference SSVEP’. Figure 4D clearly indicates that the cue modulations are evident before as well as after response.

      However, we have decided to include an additional Bayesian analysis of the response-locked signal to offer more evidence that the cue effect is not a post-response phenomenon.

      Manuscript Changes

      To quantify the evidence that the cue effect was not driven by changes in the signal after the response, we ran Bayesian one-way ANOVAs on the SSVEP comparing the difference across cue conditions before and after the response. If the cue effect only emerged after the response, we would expect the difference between invalid and neutral or invalid and valid cues to increase in the post-response window. There was no compelling evidence of an increase in the effect when comparing invalid to neutral (BF10 = 1.58) or valid cues (BF10 = 0.32).

      Comment #2

      Presenting response time quantile plots may also help to determine the proportions of motor responses (used to report a decision) that occurred during or after the SSVEP measurement window.

      We agree that it may be helpful for the reader to be able to determine the proportion of responses occurring at different phases of the trial, so we have included the requested response time quantile plot (shown below) as a supplementary figure.

      Author response image 1.

      Reaction time quantiles across cue conditions. The plot illustrates the proportion of trials where responses occurred at different stages of the trial. The SSVEP analysis window is highlighted in purple.

      Comment #3

      In addition, an argument is made for changes in the evidence accumulation rate (called the drift rate) by stimulus expectancy, corresponding to the observed changes in SSVEP measures and differences in the sensory encoding of the stimulus. This inference is limited by the fact that evidence accumulation models (such as the Diffusion Decision Model) were not used to test for drift rate changes as could be determined from the behavioural data (by modelling response time distributions). There appear to be ample numbers of trials per participant to test for drift rate changes in addition to the starting point bias captured in earlier models. Due to the very high number of trials, models could potentially be evaluated for each single participant. This would provide more direct evidence for drift rate changes than the findings based on the SSVEPs, particularly due to the issues with the measurement window relating to the response times as mentioned above.

      The focus of the present study was on testing for sensory-level modulations by predictive cues, rather than testing any particular models. Given that the SSVEP bears all the characteristics of a sensory evidence encoding signal, we believe it is reasonable to point out that its modulation by the cues would very likely translate to a drift rate effect. But we do agree with the reviewer that any connection between our results and previously reported drift rate effects can only be confirmed with modelling and we have tried to make this clear in the revised text. We plan to comprehensively model the data from this study in a future project. While we do indeed have the benefit of plenty of trials, the modelling process will not be straightforward as it will require taking account of the pulse effects which could have potentially complicated, non-linear effects. In the meantime, we have made changes to the text to qualify the suggestion and stress that modelling would be necessary to determine if our hypothesis about a drift rate effect is correct.

      Manuscript Changes

      (Discussion): [...] We suggest that participants may have been able to stabilise their performance across task exposure, despite reductions in the available sensory evidence, by incorporating the small sensory modulation we detected in the SSVEP. This would suggest that the decision process may not operate precisely as the models used in theoretical work describe. Instead, our study tentatively supports a small number of modelling investigations that have challenged the solitary role of starting point bias, implicating a drift bias (i.e. a modulation of the evidence before or upon entry to the decision variable) as an additional source of prior probability effects in perceptual decisions (Dunovan et al., 2014; Hanks et al., 2011; Kelly et al., 2021; van Ravenzwaaij et al., 2012 Wyart et al., 2012) and indicates that these drift biases could, at least partly, originate at the sensory level. However, this link could only be firmly established with modelling in a future study.

      Recommendations For The Authors:

      Comment #4

      The text for the axis labels and legends in the figures is quite small relative to the sizes of the accompanying plots. I would recommend to substantially increase the sizes of the text to aid readability.

      Thank you for this suggestion. We have increased the size of the axis labels and made the text in the figure legends just 1pt smaller than the text in the main body of the manuscript.

      Comment #5

      It is unclear if the scalp maps for Figure 5 (showing the mu/beta distributions) are on the same scale or different scales. I assume they are on different scales (adjusted to the minimum/maximum within each colour map range), as a lack of consistent signals (in the neutral condition) would be expected to lead to a patchy pattern on the scalp as displayed in that figure (due to the colour range shrinking to the degree of noise across electrodes). I would recommend to include some sort of colour scale to show that, for example, in the neutral condition there are no large-amplitude mu/ beta fluctuations distributed somewhat randomly across the scalp.

      Thank you to the reviewer for pointing this out. They were correct, the original topographies were plotted according to their own scale. The topographies in Figure 5 have now been updated to put them on a common scale and we have included a colour bar (as shown below). The caption for Figure 5 has also been updated to confirm that the topos are on a common scale.

      Author response image 2.

      Manuscript Changes

      (Figure 5 Caption): [...] The topography of MB activity in the window - 200:0 ms before evidence onset is plotted on a common scale for neutral and cued conditions separately.

      Comment #6

      In Figure 2, the legend is split across the two panels, despite the valid/invalid/neutral legend also applying to the first panel. This gives an initial impression that the legend is incomplete for the first panel, which may confuse readers. I would suggest putting all of the legend entries in the first panel, so that all of this information is available to readers at once.

      We are grateful to the reviewer for spotting this. Figure 2 has been updated so that the full legend is presented in the first panel, as shown below.

      Author response image 3.

      Comment #7

      Although linear mixed-effects models (using Gaussian families) for response times are standard in the literature, they incorrectly specify the distributions of response times to be Gaussian instead of substantially right-skewed. Generalised linear mixed-effects models using gamma families and identity functions have been shown to more accurately model distributions of response times (see Lo and Andrews, 2015. Frontiers in Psychology). The authors may consider using these models in line with good practice, although it might not make a substantial difference relating to the patterns of response time differences.

      We appreciate this thoughtful comment from Reviewer 1. Although RT distributions are often right skewed, we have previously observed that RT distributions can be closer to normal when the trial incorporates a lead-in phase with no evidence (e.g. Kelly et al 2021, Nat Hum Beh). Indeed, the distributions we observed in this study were markedly Gaussian (as shown in the plot below). Given the shape of these distributions and the reviewer’s suggestion that adopting alternative models may not lead to substantial differences to our results, we have decided to leave the mixed effects models as they are in the manuscript, but we will take note of this advice in future work.

      Author response image 4.

      Reviewer #2

      Strengths:

      The work is executed expertly and focuses cleverly on two features of the EEG signals that can be closely connected to specific loci of the perceptual decision-making process - the SSVEP which connects closely to sensory (visual) encoding, and Mu-Beta lateralisation which connects closely to movement preparation. This is a very appropriate design choice given the authors' research question.

      Another advantage of the design is the use of an unusually long training regime (i.e., for humans) - which makes it possible to probe the emergence of different expectation biases in the brain over different timecourses, and in a way that may be more comparable to work with nonhuman animals (who are routinely trained for much longer than humans).

      We are very grateful for these positive comments from Reviewer 2.

      Weaknesses:

      In my view, the principal shortcoming of this study is that the experimental task confounds expectations about stimulus identity with expectations about to-be-performed responses. That is, cues in the task don't just tell participants what they will (probably) see, but what they (probably) should do.

      In many respects, this feature of the paradigm might seem inevitable, as if specific stimuli are not connected to specific responses, it is not possible to observe motor preparation of this kind (e.g., de Lange, Rahnev, Donner & Lau, 2013 - JoN).

      However, the theoretical models that the authors focus on (e.g., drift-diffusion models) are models of decision (i.e., commitment to a proposition about the world) as much as they are models of choice (i.e., commitment to action). Expectation researchers interested in these models are often interested in asking whether predictions influence perceptual processing, perceptual decision, and/ or response selection stages (e.g., Feuerriegel, Blom & Hoogendorn, 2021 - Cortex), and other researchers have shown that parameters like drift bias and start point bias can be shifted in paradigms where observers cannot possibly prepare a response (e.g., Thomas, Yon, de Lange & Press, 2020 - Psych Sci).

      The present paradigm used by Walsh et al makes it possible to disentangle sensory processing from later decisional processes, but it blurs together the processes of deciding about the stimulus and choosing/initiating the response. This ultimately limits the insights we can draw from this study - as it remains unclear whether rapid changes in motor preparation we see reflect rapid acquisition of new decision criterion or simple cue-action learning. I think this would be important for comprehensively testing the models the authors target - and a good avenue for future work.

      Thank you to Reviewer 2 for these observations. We adopted this paradigm because it is typical of the perceptual decision making literature and our central focus in this study was to test for a sensory-level modulation as a source of a decision bias. We are pleased that the Reviewer agrees that the paradigm successfully disentangles sensory encoding from later decisional processes since this was our priority. However, we agree with Reviewer 2 that because the response mapping was known to the participants, the cues predicted both the outcome of the perceptual decision (“Is this a left- or right-tilted grating?”) and the motor response that the participant should anticipate making (“It’s probably going to be a left click on this trial”). They are correct that this makes it difficult to know whether the changes in motor preparation elicited by the predictive cues reflect action-specific preparation or a more general shift in the boundaries associated with the alternate perceptual interpretations. We fully agree that it remains an interesting and important question and in our future work we hope to conduct investigations that better dissect the distinct components of the decision process during prior-informed decisions. In the interim, we have made some changes to the manuscript to reflect the Reviewer’s concerns and better address this limitation of the study design (these are detailed in the response to the comment below).

      Recommendations For The Authors:

      Comment #8

      As in my public review, my main recommendation to the authors is to think a bit more in the presentation of the Introduction and Discussion about the difference between 'perceiving', 'deciding', and 'responding'.

      The paper is presently framed in terms of the debates around whether expectations bias decision or bias perception - and these debates are in turn mapped onto different aspects of the driftdiffusion model. Biases in sensory gain, for instance, are connected to biases in the drift rate parameter, while decisional shifts are connected to parameters like start points.

      In line with this kind of typology, the authors map their particular EEG signals (SSVEP and MB lateralisation) onto perception and decision. I see the logic, but I think the reality of these models is more nuanced.

      In particular, strictly speaking, the process of evidence accumulation to bound is the formation of a 'decision' (i.e., a commitment to having seen a particular stimulus). Indeed, the dynamics of this process have been beautifully described by other authors on this paper in the past. Since observers in this task simultaneously form decisions and prepare actions (because stimuli and responses are confounded) it is unclear whether changes in motor preparation are reflecting changes in what perceivers 'decide' (i.e., changes in what crosses the decision threshold) or what they 'do' (i.e., changes in the motor response threshold). This is particularly important for the debate around whether expectations change 'perception' or 'decision' because - in some accounts - is the accumulation of evidence to the bound that is hypothesised to cause the perceptual experience observers actually have (Pereira, Perrin & Faivre, 2022 - TiCS). The relevant 'bound' here though is not the bound to push the button, but the bound for the brain to decide what one is actually 'seeing'.

      I completely understand the logic behind the authors' choices, but I would have liked more discussion of this issue. In particular, it seems strange to me to talk about the confounding of stimuli and responses as a particular 'strength' of this design in the manuscript - when really it is a 'necessary evil' for getting the motor preparation components to work. Here is one example from the Introduction:

      "While some have reported expectation effects in humans using EEG/MEG, these studies either measured sensory signals whose relevance to the decision process is uncertain (e.g. Blom et al., 2020; Solomon et al., 2021; Tang et al., 2018) and/or used cues that were implicit or predicted a forthcoming stimulus but not the correct choice alternative (e.g. Aitken et al., 2020; Feuerriegel et al., 2021b; Kok et al., 2017). To assess whether prior probabilities modulate sensory-level signals directly related to participants' perceptual decisions, we implemented a contrast discrimination task in which the cues explicitly predicted the correct choice and where sensory signals that selectively trace the evidence feeding the decision process could be measured during the process of deliberation."

      I would contend that this design allows you to pinpoint signals related to participant's 'choices' or 'actions' but not necessarily their 'decisions' in the sense outlined above.

      As I say though, I don't think this is fatal and I think the paper is extremely interesting in any case. But I think it would be strengthened if some of these nuances were discussed a bit more explicitly, as a 'perceptual decision' is more than pushing a button. Indeed, the authors might want to consider discussing work that shows the neural overlap between deciding and acting breaks down when Ps cannot anticipate which actions to use to report their choices ahead of time (Filimon, Philiastides, Nelson, Kloosterman & Heekeren, 2013 - JoN) and/or work which has combined expectations with drift diffusion modelling to show how expectations change drift bias (Yon, Zainzinger, de Lange, Eimer & Press, 2020 - JEP:General) and/or start bias (Thomas, Yon, de Lange & Press, 2020 - Psych Sci) even when Ps cannot prepare a motor response ahead of time.

      While our focus was on testing for sensory-level modulations, we think the question of whether the motor-level effects we observed are attributable to the task design or represents a more general perceptual bound adjustment is an important question for future research. In our previous work, we have examined this distinction between abstract, movement-independent evidence accumulation (indexed by the centro-parietal positivity, CPP) and response preparation in detail. The CPP has been shown to trace evidence accumulation irrespective of whether the sensory alternatives are associated with a specific response or not (Twomey et al 2016, J Neurosci). When speed pressure is manipulated in tasks with fixed stimulus-response mappings we have found that the CPP undergoes systematic adjustments in its pre-response amplitude that closely accord with the starting-level modulations observed in mu/beta, suggesting that motor-level adjustments do still translate to differences at the perceptual level under these task conditions (e.g. Kelly et al 2021, Nat Hum Beh; Steinemann et al., 2018, Nat Comms). We have also observed that the CPP and mu-beta exhibit corresponding adjustments in response to predictive cues (Kelly et al., 2021) that are consistent with both a starting-point shift and drift rate bias. However, the Kelly et al. study did not include a signature of sensory encoding and therefore could not test for sensory-level modulations.

      We have added some remarks to the discussion to acknowledge this issue with the interpretation of the preparatory shifts in mu-beta activity we observed when the predictive cues were presented, and we have included references to the papers that the reviewer helpfully provided. We have also offered some additional consideration of the features of the task design that may have influenced the SSVEP results.

      Manuscript Changes

      An implication of using cues that predict not just the upcoming stimulus, but the most likely response, is that it becomes difficult to determine if preparatory shifts in mu-beta (MB) activity that we observed reflect adjustments directly influencing the perceptual interpretation of the stimulus or simply preparation of the more probable action. When perceptual decisions are explicitly tied to particular modes of response, the decision state can be read from activity in motor regions associated with the preparation of that kind of action (e.g. de Lafuente et al., 2015; Ding & Gold, 2012; Shadlen & Newsome, 2001; Romo et al., 2004), but these modules appear to be part of a constellation of decision-related areas that are flexibly recruited based on the response modality (e.g. Filimon et al., 2013). When the response mapping is withheld or no response is required, MB no longer traces decision formation (Twomey et al., 2015), but an abstract decision process is still readily detectable (e.g. O’Connell et al., 2012), and modelling work suggests that drift biases and starting point biases (Thomas et al., 2020; Yon et al., 2021) continue to influence prior-informed decision making. While the design of the present study does not allow us to offer further insight about whether the MB effects we observed were inherited from strategic adjustments at this abstract level of the decision process, we hope to conduct investigations in the future that better dissect the distinct components of prior-informed decisions to address this question.

      Several other issues remain unaddressed by the present study. One, is that it is not clear to what extent the sensory effects may be influenced by features of the task design (e.g. speeded responses under a strict deadline) and if these sensory effects would generalise to many kinds of perceptual decision-making tasks or whether they are particular to contrast discrimination.

      Comment #9

      On a smaller, unrelated point - I thought the discussion in the Discussion section about expectation suppression was interesting, but I did not think it was completely logically sound. The authors suggest that they may see relative suppression (rather than enhancement) of their marginal SSVEP under a 'sharpening' account because these accounts suggest that there is a relative suppression of off-channel sensory units, and there are more off-channel sensory units than onchannel sensory units (i.e., there are usually more possibilities we don't expect than possibilities that we do, and suppressing the things we don't expect should therefore yield overall suppression).

      However, this strikes me as a non-sequitur given that the marginal SSVEP only reflects featurespecific visual activity (i.e., activity tuned to one of the two grating stimuli used). The idea that there are more off-channel than on-channel units makes sense for explaining why we would see overall signal drops on expected trials e.g., in an entire visual ROI in an fMRI experiment. But surely this explanation cannot hold in this case, as there is presumably an equal number of units tuned to each particular grating?

      My sense is that this possibility should probably be removed from the manuscript - and I suspect it is more likely that the absence of a difference in marginal SSVEP for Valid vs Neutral trials has more to do with the fact that participants appear to be especially attentive on Neutral trials (and so any relative enhancement of feature-specific activity for expected events is hard to detect against a baseline of generally high-precision sensory evidence on these highly attentive, neutral trials).

      We thank the reviewer for flagging that we did not clearly articulate our thoughts in this section of the manuscript. Our primary purpose in mentioning this sharpening account was simply to point out that, where at first blush our results seem to conflict with expectation suppression effects in the fMRI literature, the sharpening account provides an explanation that can reconcile them. In the case of BOLD data, the sharpening account proposes that on-channel sensory units are boosted and off-channel units are suppressed and, due to the latter being more prevalent, this leads to an overall suppression of the global signal. In the case of the SSVEP, the signal isolates just the onunits and so the sharpening account would predict that when there is a valid cue, the SSVEP signal associated with the high-contrast, expected stimulus should be boosted and the SSVEP signal associated with the low-contrast, unexpected stimulus should be weakened; this would result in a larger difference between these signals and therefore, a larger ‘marginal SSVEP’. Conversely, when there is an invalid cue, the SSVEP signal associated with the, now unexpected, high-contrast stimulus should be relatively weakened and the SSVEP signal associated with the expected, but low-contrast stimulus should be relatively boosted; this would result in a smaller difference between these signals and therefore, a lower amplitude marginal SSVEP. We do not think that this account needs to make reference to any channels beyond those feature-specific channels driving the two SSVEP signals. Again our central point is simply that the sharpening account offers a means of reconciling our SSVEP findings with expectation suppression effects previously reported in the fMRI literature.

      We suspect that this was not adequately explained in the discussion. We have adjusted the way this section is phrased to make it clear that we are not invoking off-channel activity to explain the SSVEP effect we observed and we thank the Reviewer for pointing out that this was unclear in the original text.

      Manuscript Changes

      An alternative account for expectation suppression effects, which is consistent with our SSVEP results, is that they arise, not from a suppression of expected activity, but from a ‘sharpening’ effect whereby the response of neurons that are tuned to the expected feature are enhanced while the responses of neurons tuned to unexpected features are suppressed (de Lange et al., 2018). On this account, the expectation suppression commonly reported in fMRI studies arises because voxels contain intermingled populations with diverse stimulus preferences and the populations tuned to the unexpected features outnumber those tuned to the expected feature. In contrast to these fMRI data, the SSVEP represents the activity of sensory units driven at the same frequency as the stimulus, and thus better isolates the feature-specific populations encoding the task-relevant sensory evidence. Therefore, according to the sharpening account, an invalid cue would have enhanced the SSVEP signal associated with the low contrast grating and weakened the SSVEP signal associated with the high contrast grating. As this would result in a smaller difference between these signals, and therefore, a lower amplitude marginal SSVEP compared to the neutral cue condition, this could explain the effect we observed. 

      Reviewer #3

      Observers make judgements about expected stimuli faster and more accurately. How expectations facilitate such perceptual decisions remains an ongoing area of investigation, however, as expectations may exert their effects in multiple ways. Expectations may directly influence the encoding of sensory signals. Alternatively (or additionally), expectations may influence later stages of decision-making, such as motor preparation, when they bear on the appropriate behavioral response.

      In the present study, Walsh and colleagues directly measured the effect of expectations on sensory and motor signals by making clever use of the encephalogram (EEG) recorded from human observers performing a contrast discrimination task. On each trial, a predictive cue indicated which of two superimposed stimuli would likely be higher contrast and, therefore, whether a left or right button press was likely to yield a correct response. Deft design choices allowed the authors to extract both contrast-dependent sensory signals and motor preparation signals from the EEG. The authors provide compelling evidence that, when predictive cues provide information about both a forthcoming stimulus and the appropriate behavioral response, expectation effects are immediately manifest in motor preparation signals and only emerge in sensory signals after extensive training.

      Future work should attempt to reconcile these results with related investigations in the field. As the authors note, several groups have reported expectation-induced modulation of sensory signals (using both fMRI and EEG/MEG) on shorter timescales (e.g. just one or two sessions of a few hundred trials, versus the intensive multi-session study reported here). One interesting possibility is that perceptual expectations are not automatic but demand the deployment of feature-based attention, while motor preparation is comparatively less effortful and so dominates when both sources of information are available, as in the present study. This hypothesis is consistent with the authors' thoughtful analysis showing decreased neural signatures of attention over posterior electrodes following predictive cues. Therefore, observing the timescale of sensory effects using the same design and methods (facilitating direct comparison with the present work), but altering task demands slightly such that cues are no longer predictive of the appropriate behavioral response, could be illuminating.

      We would like to thank Reviewer 3 for their positive comments and thoughtful suggestions for future work.

      Recommendations For The Authors:

      Comment #10

      In the methods, the term 'session' is used early on but only fleshed out at the end of the 'Procedure' subsection and never entirely explained (e.g., did sessions take place over multiple days?). A brief sentence laying this out early on, perhaps in 'Participants' after the (impressive) trial counts are reported, might be helpful.

      Thank you to Reviewer 3 for pointing out that this was not clear in the original draft. We have amended the text in the Methods section to better explain the relationship between sessions, days, and trial bins.

      Manuscript Changes

      (Methods - Participants): [...] All procedures were approved by the Trinity College Dublin School of Psychology Ethics Committee and were in accordance with the Declaration of Helsinki. Participants completed between 4 and 6 testing sessions, each on a different day. While the sample size was small, on average, participants completed 5750 (SD = 1066) trials each.

      (Methods - Data Analysis): [...] As there were two lengths of testing session and participants completed different numbers of sessions, we analysed the effect of task exposure by pooling trials within-subjects and dividing them into five ‘trial bins’. The first bin represents the participants’ earliest exposure to the task and the final bin represents trials at the end of their participation, when they had had substantial task exposure. All trials with valid responses and reaction times greater than 100 ms were included in the analyses of behavioural data and the SSVEP.

      Comment #11

      On a related note: participants completed a variable number of trials/sessions. To facilitate comparison across subjects, training effects are reported by dividing each subject's data into 5 exposure bins. This is entirely reasonable but does leave the reader wondering about whether you found any effects of rest or sleep between sessions.

      We agree with the reviewer that this is an interesting question that absolutely merits further investigation. As different participants completed different numbers of sessions, different session lengths, and had variable gaps between their sessions, we do not think a per-session analysis would be informative. We think it may be better addressed in a future study, perhaps one with a larger sample where we could collect data specifically about sleep and more systematically control the intervals between testing sessions.

      Comment #12

      Fig 2B: the 'correct' and 'neutral' labels in the legend are switched

      Thank you to the reviewer for spotting that error, the labels in Figure 2 have been corrected.

      Comment #13

      Fig 4B: it's a bit difficult to distinguish which lines are 'thick' and 'thin'

      We have updated Figure 4.B to increase the difference in line thickness between the thick and thin lines (as shown below).

      Author response image 5.

      Comment #14

      Fig 4C: missing (I believe?) the vertical lines indicating median reaction time

      We have updated Figure 4.C to include the median reaction times.

      Author response image 6.

    1. Author Response

      The following is the authors’ response to the original reviews.

      eLife assessment

      This important study enhances our understanding of the effects of landscape context on grassland plant diversity and biomass. Notably, the authors use a well-designed field sampling method to separate the effects of habitat loss and fragmentation per se. Most of the data and analyses provide solid support for the findings that habitat loss weakens the positive relationship between grassland plant richness and biomass.

      Response: Thanks very much for organizing the review of the manuscript. We are grateful to you for the recognition. We have carefully analyzed all comments of the editors and reviewers and revised our manuscript to address them. All comments and recommendations are helpfully and constructive for improving our manuscript. We have described in detail our response to each of comment below.

      In addition to the reviewers' assessments, we have the following comments on your paper.

      (1) Some of the results are not consistent between figures. The relationships between overall species richness and fragmentation per se are not consistent between Figs. 3 and 5. The relationships between aboveground biomass and habitat loss are not consistent between Figs. 4 and 5. How shall we interpret these inconsistent results?

      Response: Thanks for your insightful comments. The reason for these inconsistencies is that the linear regression model did not take into account the complex causal relationships (including direct and indirect effects) among the different influencing factors. The results in Figures 3 and 4 just represent the pairwise relationship pattern and relative importance, respectively. The causal effects of habitat loss and fragmentation per se on plant richness and above-ground biomass should be interpreted based on the structural equation model results (Figure 6). We have revised the data analysis to clear these inconsistent results. Line 225-228

      In the revised manuscript, we have added the interpretation for these inconsistent results. The inconsistent effects between Figures 3 and 6 suggest that fragmentation per se actually had a positive effect on plant richness after accounting for the effects of habitat loss and environmental factors simultaneously.

      The inconsistent effects between Figures 4 and 6 are because the effects of habitat loss and fragmentation per se on above-ground biomass were mainly mediated by plant richness and environmental factors, which had no significant direct effect (Figure 6). Thus, habitat loss and fragmentation per se showed no significant relative effects on above-ground biomass after controlling the effects of plant richness and environmental factors (Figure 4).

      (2) One of the fragmentation indices, mean patch area metric, seems to be more appropriate as a measure of habitat loss, because it represents "a decrease in grassland patch area in the landscape".

      Response: Thanks for your insightful comments. We apologize for causing this confusion. The mean patch area metric in our study represents the mean size of grassland patches in the landscape for a given grassland amount. Previous studies have often used the mean patch metric as a measure of fragmentation, which can reflect the processes of local extinction in the landscape (Fahrig, 2003; Fletcher et al., 2018). We have revised the definition of the mean patch area metric and added its ecological implication in the revised manuscript to clarify this confusion.

      (3) It is important to show both the mean and 95% CI (or standard error) of the slope coefficients regarding to Figs. 3 and 6.

      Response: Thanks for your suggestions. We have added the 95% confidence intervals to the Figure 3 and Figure 6 in the revised manuscript.

      (4) It would be great to clarify what patch-level and landscape-level studies are in lines 302-306. Note that this study assesses the effects of landscape context on patch-level variables (i.e., plot-based plant richness and plot-based grassland biomass) rather than landscape-level variables (i.e., the average or total amount of biomass in a landscape).

      Response: Thanks for your insightful comment. We agree with your point that our study investigated the effect of fragmented landscape context (habitat loss and fragmentation per se) on plot-based plant richness and plot-based above-ground biomass rather than landscape-level variables.

      Therefore, we no longer discussed the differences between the patch-level and landscape-level studies here, instead focusing on the different ecological impacts of habitat loss and fragmentation per se in the revised manuscript.

      Line 369-374:

      “Although habitat loss and fragmentation per se are generally highly associated in natural landscapes, they are distinct ecological processes that determine decisions on effective conservation strategies (Fahrig, 2017; Valente et al., 2023). Our study evaluated the effects of habitat loss and fragmentation per se on grassland plant diversity and above-ground productivity in the context of fragmented landscapes in the agro-pastoral ecotone of northern China, with our results showing the effects of these two facets to not be consistent.”

      (5) One possible way to avoid the confusion between "habitat fragmentation" and "fragmentation per se" could be to say "habitat loss and fragmentation per se" when you intend to express "habitat fragmentation".

      Response: Thanks for your constructive suggestions. To avoid this confusion, we no longer mention habitat fragmentation in the revised manuscript but instead express it as habitat loss and fragmentation per se.

      Reviewer #1 (Public Review):

      This is a well-designed study that explores the BEF relationships in fragmented landscapes. Although there are massive studies on BEF relationships, most of them were conducted at local scales, few considered the impacts of landscape variables. This study used a large dataset to specifically address this question and found that habitat loss weakened the BEF relationships. Overall, this manuscript is clearly written and has important implications for BEF studies as well as for ecosystem restoration.

      Response: We are grateful to you for the recognition and constructive comments. All the comments and suggestions are very constructive for improving this manuscript. We have carefully revised the manuscript following your suggestions. All changes are marked in red font in the revised manuscript.

      My only concern is that the authors should clearly define habitat loss and fragmentation. Habitat loss and fragmentation are often associated, but they are different terms. The authors consider habitat loss a component of habitat fragmentation, which is not reasonable. Please see my specific comments below.

      Response: We agree with your point. In the revised manuscript, we no longer consider habitat loss and fragmentation per se as two facets of habitat fragmentation. We have clearly defined habitat loss and fragmentation per se and explicitly evaluated their relative effects on plant richness, above-ground biomass, and the BEF relationship.

      Reviewer #1 (Recommendations For The Authors):

      Title: It is more proper to say habitat loss, rather than habitat fragmentation.

      Response: Thanks for your suggestion. We have revised the title to “Habitat loss weakens the positive relationship between grassland plant richness and above-ground biomass”

      Line 22, remove "Anthropogenic", this paper is not specifically discussing habitat fragmentation driven by humans.

      Response: Thanks for your suggestion. We have removed the “Anthropogenic” from this sentence.

      Line 26, revise to "we investigated the effects of habitat loss and fragmentation per se on plant richness... in grassland communities by using a structural equation model".

      Response: Thanks for your suggestion. We have revised this sentence.

      Line 25-28:

      “Based on 130 landscapes identified by a stratified random sampling in the agro-pastoral ecotone of northern China, we investigated the effects of landscape context (habitat loss and fragmentation per se) on plant richness, above-ground biomass, and the relationship between them in grassland communities using a structural equation model.”

      Line 58-60, habitat fragmentation generally involves habitat loss, but habitat loss is independent of habitat fragmentation, it is not a facet of habitat fragmentation.

      Response: Thanks for your insightful comment. We have no longer considered habitat loss and fragmentation per se as two facets of habitat fragmentation. In the revised manuscript, we consider habitat loss and fragmentation as two different processes in fragmented landscapes.

      Line 65-67, this sentence is not very relevant to this paragraph and can be deleted.

      Response: Thanks for your suggestion. We have deleted this sentence from the paragraph.

      Line 87-90, these references are mainly based on microorganisms, are there any references based on plants? These references are more relevant to this study. In addition, this is a key mechanism mentioned in this study, this section needs to be strengthened with more evidence and further exploration.

      Response: Thanks for your comment and suggestion. Thanks for your comment and suggestion. We have added some references based on plants here to strengthen the evidence and mechanism of habitat specialisation determines the BEF relationship.

      Line 89-95:

      “In communities, specialists with specialised niches in resource use may contribute complementary roles to ecosystem functioning, whereas generalists with unspecialised in resource use may contribute redundant roles to ecosystem functioning due to overlapping niches (Dehling et al., 2021; Denelle et al., 2020; Gravel et al., 2011; Wilsey et al., 2023). Therefore, communities composed of specialists should have a higher niche complementarity effect in maintaining ecosystem functions and a more significant BEF relationship than communities composed of generalists.”

      Denelle, P., Violle, C., DivGrass, C., Munoz, F. 2020. Generalist plants are more competitive and more functionally similar to each other than specialist plants: insights from network analyses. Journal of Biogeography 47: 1922-1933.

      Dehling, D.M., Bender, I.M.A., Blendinger, P.G., Böhning-Gaese, K., Muñoz, M.C., Neuschulz, E.L., Quitián, M., Saavedra, F., Santillán, V., Schleuning, M., Stouffer, D.B. 2021. Specialists and generalists fulfil important and complementary functional roles in ecological processes. Functional Ecology 35: 1810-1821.

      Wilsey, B., Martin, L., Xu, X., Isbell, F., Polley, H.W. 2023. Biodiversity: Net primary productivity relationships are eliminated by invasive species dominance. Ecology Letters.

      Line 129-130, Although you can use habitat loss in the discussion or the introduction, here preferably use habitat amount or habitat area, rather than habitat loss in this case. Habitat loss represents changes in habitat area, but the remaining grasslands could be the case of natural succession or other processes, rather than loss of natural habitat.

      Response: Thanks for your insightful comment. We agree with your point. In the revised manuscript, we have explicitly stated that habitat loss was represented by the loss of grassland amount in the landscape.

      Since the remaining grassland fragments in this region were mainly caused by grassland loss due to human activities such as cropland expansion (Chen et al., 2019; Yang et al., 2020), we used the percentage of non-grassland cover in the landscape to represent habitat loss in our study.

      Line 132-135:

      “Habitat loss was represented by the loss of grassland amount in the landscape. As the remaining grassland fragments in this region were mainly caused by grassland loss due to human activities such as cropland expansion (Chen et al., 2019; Yang et al., 2020), the percentage of non-grassland cover in the landscape was used in our study to represent habitat loss.”

      Lines 245-246, please also give more details of the statistical results, such as n, r value et al in the text.

      Response: Thanks for your suggestion. We have added the details of the statistical results in the revised manuscript.

      Line 283-290:

      “Habitat loss was significantly negatively correlated with overall species richness (R = -0.21, p < 0.05, Figure 3a) and grassland specialist richness (R = -0.41, p < 0.01, Figure 3a), but positively correlated with weed richness (R = 0.31, p < 0.01, Figure 3a). Fragmentation per se was not significantly correlated with overall species richness and grassland specialist richness, but was significantly positively correlated with weed richness (R = 0.26, p < 0.01, Figure 3b). Habitat loss (R = -0.39, p < 0.01, Figure 3c) and fragmentation per se (R = -0.26, p < 0.01, Figure 3d) were both significantly negatively correlated with above-ground biomass.”

      Fig. 5, is there any relationship between habitat amount and fragmentation per se in this study?

      Response: Thanks for your insightful comment. We have considered a causal relationship between habitat loss and fragmentation per se in the structural equation model. We have discussed this relationship in the revised manuscript.

      Line 290-293, how about the BEF relationships with different fragmentation levels? I may have missed something somewhere, but it was not shown here.

      Response: Thanks for your insightful comment. We have added the BEF relationships with different fragmentation per se levels here.

      Line 323-340:

      “The linear regression models showed that habitat loss had a significant positive modulating effect on the positive relationship between plant richness and above-ground biomass, and fragmentation per se had no significant modulating effect (Figure 5). The positive relationship between plant richness and above-ground biomass weakened with increasing levels of habitat loss, strengthened and then weakened with increasing levels of fragmentation per se.

      Author response image 1.

      Relationships between grassland plant richness and above-ground biomass at different levels of habitat loss and fragmentation per se from 130 landscapes in the Tabu River Basin, a typical agro-pastoral ecotone of northern China: (a) high habitat loss and low fragmentation per se, (b) high habitat loss and moderate fragmentation per se, (c) high habitat loss and high fragmentation per se, (d) moderate habitat loss and low fragmentation per se, (e) moderate habitat loss and moderate fragmentation per se, (f) moderate habitat loss and high fragmentation per se, (g) low habitat loss and low fragmentation per se, (h) low habitat loss and moderate fragmentation per se. The R2 values in each panel are from linear regression models. The n in each panel is the number of surveying sites used in the linear regression models. The blue solid and dashed trend lines represent the significant and not significant effects, respectively. The shaded area around the trend line represents the 95% confidence interval. * represent significance at the 0.05 level. ** represent significance at the 0.01 level.”

      Discussion

      The Discussion (Section 4.2) needs to be revised and focused on your key findings, it is habitat loss, not fragmentation per se, that weakens the BEF relationships.

      Response: Thanks for your insightful comment and suggestion. In the revised manuscript, we have rephrased the Discussion (Section 4.2) to mainly discuss the inconsistent effects of habitat loss and fragmentation per se on the BEF relationship.

      Line 414-416:

      “4.2 Habitat loss rather than fragmentation per se weakened the magnitude of the positive relationship between plant diversity and ecosystem function”

      The R2 in the results are low (e.g., Fig. 3), please also mention other variables that might influence the observed pattern in the Discussion, such as soil and topography, though I understand it is difficult to collect such data in this study.

      Response: Thanks for your insightful comment and suggestion. We agree with you and reviewer 3 that the impact of environmental factors should also be considered.

      Therefore, we have considered two environmental factors related to water and temperature (soil water content and land surface temperature) in the analysis and discussed their impacts on plant diversity and above-ground biomass in the revised manuscript.

      Lines 344-345, its relative importance was stronger in the intact landscape than that of the fragmented landscape?

      Response: We apologize for making this confusion. We have rephrased this sentence.

      Line 422-426:

      “Our study found grassland plant diversity showed a stronger positive impact on above-ground productivity than landscape context and environmental factors. This result is consistent with findings by Duffy et al. (2017) in natural ecosystems, indicating grassland plant diversity has an important role in maintaining grassland ecosystem functions in the fragmented landscapes of the agro-pastoral ecotone of northern China.”

      Reviewer #2 (Public Review):

      Summary:

      In this manuscript, Yan et al. assess the effect of two facets of habitat fragmentation (i.e., habitat loss and habitat fragmentation per se) on biodiversity, ecosystem function, and the biodiversity-ecosystem function (BEF) relationship in grasslands of an agro-pastoral ecotone landscape in northern China. The authors use stratified random sampling to select 130 study sites located within 500m-radius landscapes varying along gradients of habitat loss and habitat fragmentation per se. In these study sites, the authors measure grassland specialist and generalist plant richness via field surveys, as well as above-ground biomass by harvesting and dry-weighting the grass communities in each 3 x 1m2 plots of the 130 study sites. The authors find that habitat loss and fragmentation per se have different effects on biodiversity, ecosystem function and the BEF relationship: whereas habitat loss was associated with a decrease in plant richness, fragmentation per se was not; and whereas fragmentation per se was associated with a decrease in above-ground biomass, habitat loss was not. Finally, habitat loss, but not fragmentation per se was linked to a decrease in the magnitude of the positive biodiversity-ecosystem functioning relationship, by reducing the percentage of grassland specialists in the community.

      Strengths:

      This study by Yan et al. is an exceptionally well-designed, well-written, clear and concise study shedding light on a longstanding, important question in landscape ecology and biodiversity-ecosystem functioning research. Via a stratified random sampling approach (cf. also "quasi-experimental design" Butsic et al. 2017), Yan et al. create an ideal set of study sites, where habitat loss and habitat fragmentation per se (usually highly correlated) are decorrelated and hence, separate effects of each of these facets on biodiversity and ecosystem function can be assessed statistically in "real-world" (and not experimental, cf. Duffy et al. 2017) communities. The authors use adequate and well-described methods to investigate their questions. The findings of this study add important empirical evidence from real-world grassland ecosystems that help to advance our theoretical understanding of landscape-moderation of biodiversity effects and provide important guidelines for conservation management.

      Weaknesses:

      I found only a few minor issues, mostly unclear descriptions in the study that could be revised for more clarity.

      Response: Thanks very much for your review of the manuscript. We are grateful to you for the recognition. All the comments and suggestions are very insightful and constructive for improving this manuscript. We have carefully studied the literature you recommend and revised the manuscript carefully following your suggestions. All changes are marked in red font in the revised manuscript.

      Reviewer #2 (Recommendations For The Authors):

      Specific comments

      (1) Some aspects of the Methods section were not entirely clear to me, could you revise them for more clarity?

      (a) Whereas you describe 4 main facets of fragmentation per se that are used to create the PC1 as a measure of overall fragmentation per se, it looks as if this PC1 is mainly driven by 3 facets only (ED, PD and AREA_MN), and patch isolation (nearest neighbour distance, ENN) having a relatively low loading on PC1 (Figure A1). I think it would be good to discuss this fact and the consequences of it, that your definition of fragmentation is focused more on edge density, patch density and mean patch area, and less on patch isolation in your Discussion section?

      Response: Thanks for your insightful comment and suggestion. We agree with your point. We have discussed this fact and its implications for understanding the effects of fragmentation per se in our study.

      Line 384-389:

      “However, it is important to stress that the observed positive effect of fragmentation per se does not imply that increasing the isolation of grassland patches would promote biodiversity, as the metric of fragmentation per se used in our study was more related to patch density, edge density and mean patch area while relatively less related to patch isolation (Appendix Table A1). The potential threats from isolation still need to be carefully considered in the conservation of biodiversity in fragmented landscapes (Haddad et al., 2015).”

      (b) Also, from your PCA in Figure A1, it seems that positive values of PC1 mean "low fragmentation", whereas high values of PC1 mean "high fragmentation", however, in Figure A2, the inverse is shown (low values of PC1 = low fragmentation, high values of PC1 = high fragmentation). Could you clarify in the Methods section, if you scaled or normalized the PC1 to match this directionality?

      Response: We apologize for making this confusion. In order to be consistent with the direction of change in fragmentation per se, we took the inverse of the PC1 as a single fragmentation per se index, which was positively correlated with patch density, edge density, mean nearest-neighbor distance metric, and negatively with mean patch area (Appendix Figure A1 and Table A1). We have clarified this point in the Method section.

      Line 160-163:

      “We took the inverse of the PC1 as a single fragmentation per se index, which was positively correlated with patch density, edge density, mean nearest-neighbor distance metric, and negatively with mean patch area (Appendix Figure A1 and Table A1).”

      (c) On line 155 you describe that you selected at least 20 landscapes using stratified sampling from each of the eight groups of habitat amount and fragmentation combination. Could you clarify: 1) did you randomly sample within these groups with a minimum distance condition or was it a non-random selection according to other criteria? (I think you could move the "To prevent overlapping landscapes..." sentence up here to the description of the landscape selection process) 2) Why did you write "at least 20 landscapes" - were there in some cases more or less landscapes selected? 130 study landscapes divided by 8 groups only gives you 16.25, hence, at least for some groups there were less than 20 landscapes? Could you describe your final dataset in more detail, i.e. the number of landscapes per group and potential repercussions for your analysis?

      Response: Thanks for your insightful comments. In the revised manuscript, we have rephrased the method to provide more detail for the sampling landscape selection.

      (1) Line 169-172

      We randomly selected at least 20 grassland landscapes with a minimum distance condition using stratified sampling from each of the remaining eight grassland types as alternative sites for field surveys. The minimum distance between each landscape was at least 1000 m to prevent overlapping landscapes and potential spatial autocorrelation.

      (2) Line 184-191

      The reason for selecting at least 20 grassland landscapes of each type in this study was to ensure enough alternative sites for the field survey. This is because the habitat type of some selected sites was not the natural grasslands, such as abandoned agricultural land. Some of the selected sites may not be permitted for field surveys.

      Thus, we finally established 130 sites in the field survey. The types of the 130 sites were: 19 high-moderate, 14 high-low, 19 moderate-high, 16 moderate-moderate, 18 moderate-low, 16 low-high, 17 low-moderate, 11 low-low habitat amount and fragmentation per se.

      (d) On line 166, you describe that you established 130 sites of 30 m by 30 m - I assume they were located (more or less) exactly in the centre of the selected 500 m - radius landscapes? Were they established so that they were fully covered with grassland? And more importantly, how did you establish the 10 m by 10 m areas and the 1 m2 plots within the 30 m by 30 m sites? Did you divide the 30 m by 30 m areas into three rectangles of 10 m by 10 m and then randomly established 1 m2 plots? Were the 1 m2 plots always fully covered with grassland/was there a minimum distance to edge criterion? Please describe with more detail how you established the 1 m2 study sites, and how many there were per landscape.

      Response: Thanks for your insightful comments. In the revised manuscript, we have provided more detailed information on how to set up 130 sites of 30 m by 30 m and three plots of 1 m by 1 m.

      (1) As these 130 sites were selected based on the calculation of the moving window, they were located (more or less) exactly in the centre of the 500-m radius buffer.

      (2) These sites were fully covered with grassland because their size (30 m by 30 m) was the same as the size of the grassland cell (30 m by 30 m) used in the calculation of the moving window.

      (3) We randomly set up three 1 m * 1 m plots in a flat topographic area at the 10 m * 10 m centre of each site. Thus, there was a minimum distance of 10 m to the edge for each 1 m * 1 m plot.

      (4) There are three 1 m * 1 m plots per landscape.

      Line 182-191:

      “Based on the alternative sites selected above, we established 130 sites (30 m * 30 m) between late July to mid-August 2020 in the Tabu River Basin in Siziwang Banner, Inner Mongolia Autonomous Region (Figure 1). The types of the 130 sites were: 19 high-moderate, 14 high-low, 19 moderate-high, 16 moderate-moderate, 18 moderate-low, 16 low-high, 17 low-moderate, 11 low-low habitat amount and fragmentation per se. In order to exclude the impact of historical agricultural activities, the habitat type of the established sites was natural grasslands with regional vegetation characteristics. Each site was not abandoned agricultural land, and there was no sign of agricultural reclamation.

      At the 10 m * 10 m center of each site, we randomly set up three 1 m * 1 m plots in a flat topographic area to investigate grassland vascular plant diversity and above-ground productivity.”

      (e) Line 171: could you explain what you mean by reclaimed?

      Response: Thanks for your comment. The “reclaimed” means that historical agricultural activities. We have rephrased this sentence to make it more explicit.

      Line 186-189:

      “In order to exclude the impact of historical agricultural activities, the habitat type of the established sites was natural grasslands with regional vegetation characteristics. Each site was not abandoned agricultural land, and there was no sign of agricultural reclamation.”

      (f) Line 188 ff.: Hence your measure of productivity is average-above ground biomass per 1 m2. I think it would add clarity if you highlighted this more explicitly.

      Response: Thanks for your suggestion. We have highlighted that the productivity in our study was the average above-ground biomass per 1 m * 1 m plots in each site.

      Line 215-217:

      “For each site, we calculated the mean vascular plant richness of the three 1 m * 1 m plots, representing the vascular plant diversity, and mean above-ground biomass of the three 1 m * 1 m plots, representing the above-ground productivity.”

      (2) All figures are clear and well-designed!

      (a) Just as a suggestion: in Figures 3 and 6, you could maybe add the standard errors of the mean as well?

      Response: Thanks for your suggestion. In the revised manuscript, we have added the standard errors of the mean in Figures 3 and 6.

      (b) Figure 4: Could you please clarify: Which models were the optimal models on which these model-averaged standardized parameter estimates were based on? And hence, the optimal models contained all 4 predictors (otherwise, no standardized parameter estimate could be calculated)? Or do these model-averaged parameters take into account all possible models (and not only the optimal ones)?

      Response: Thanks for your suggestion. We selected the four optimal models based on the AICc value to calculate the model-averaged standardized parameter estimates. The four optimal models contained all predictors in Figure 4. We have added the four optimal models in Appendix Table A3.

      Appendix:

      Author response table 1.

      Four optimal models of landscape context, environment factors, and plant diversity affecting above-ground biomass.

      Note: AGB: above-ground biomass; HL: habitat loss; FPS: fragmentation per se; SWT: soil water content; LST: land surface temperature; GSR: grassland specialist richness; WR: weed richness; **: significance at the 0.01 level.”

      (c) Please add in all Figures (i.e., Figures 4, 5 and 6, Figure 6 per "high, moderate and low-class") the number of study units the analyses were based on.

      Response: Thanks for your suggestion. In the revised manuscript, we have added the number of study units the analyses were based on in all Figures.

      (d) Figure 6: I think it would be more consistent to add a second plot where the BEF-relationship is shown for low, moderate and high levels of habitat fragmentation per se. Could you also add a clearer description in the Methods and/or Results section of how you assessed if habitat amount or fragmentation per se affected the BEF-relationship? I.e. based on the significance of the interaction term (habitat amount x species richness) in a linear model?

      Response: Thanks for your insightful comment and suggestion. We have added a second plot in Figure 5 to show the BEF relationship at low, moderate and high levels of fragmentation per se.

      Line 328-340:

      Author response image 2.

      Relationships between grassland plant richness and above-ground biomass at different levels of habitat loss and fragmentation per se from 130 landscapes in the Tabu River Basin, a typical agro-pastoral ecotone of northern China: (a) high habitat loss and low fragmentation per se, (b) high habitat loss and moderate fragmentation per se, (c) high habitat loss and high fragmentation per se, (d) moderate habitat loss and low fragmentation per se, (e) moderate habitat loss and moderate fragmentation per se, (f) moderate habitat loss and high fragmentation per se, (g) low habitat loss and low fragmentation per se, (h) low habitat loss and moderate fragmentation per se. The R2 values in each panel are from linear regression models. The n in each panel is the number of surveying sites used in the linear regression models. The blue solid and dashed trend lines represent the significant and not significant effects, respectively. The shaded area around the trend line represents the 95% confidence interval. * represent significance at the 0.05 level. ** represent significance at the 0.01 level.”

      We determined whether habitat loss and fragmentation per se moderated the BEF relationship by testing the significance of their interaction term with plant richness. We have added a clearer description in the Methods section of the revised manuscript.

      Line 245-250:

      “We then assessed the significance of interaction terms between habitat loss and fragmentation per se and plant richness in the linear regression models to evaluate whether they modulate the relationship between plant richness and above-ground biomass. Further, we used a piecewise structural equation model to investigate the specific pathways in which habitat loss and fragmentation per se modulate the relationship between plant richness and above-ground biomass.”

      (3) While reading your manuscript, I missed a discussion on the potential non-linear effects of habitat amount and fragmentation per se. In your study, it seems that the effects of habitat amount and fragmentation per se on biodiversity and ecosystem function are quite linear, which contrasts previous research highlighting that intermediate levels of fragmentation/heterogeneity could maximise spatial asynchrony, biodiversity and ecosystem function (e.g. Redon et al. 2014, Thompson & Gonzalez 2016, Tscharntke et al. 2012, Wilcox et al. 2017). I think it would add depth to your study if you discussed your finding of linear effects of habitat amount and fragmentation on biodiversity, ecosystem functioning and BEF. For example:

      Response: Thanks for your constructive suggestions. We have carefully studied the literature (e.g. Redon et al. 2014, Thompson & Gonzalez 2016, Tscharntke et al. 2012, Wilcox et al. 2017), which highlights that intermediate levels of fragmentation/heterogeneity could maximise spatial asynchrony, biodiversity and ecosystem function.

      In the revised manuscript, we have added the discussion about the linear positive effects of fragmentation on plant diversity and above-ground productivity and discussed possible reasons for this linear effect.

      Line 402-413:

      “In our study, a possible mechanism for the positive impacts of fragmentation per se on plant diversity and above-ground productivity (indirect positive impact via plant diversity) is that fragmentation per se increases the habitat heterogeneity in the landscape, which can promote biodiversity through spatial asynchrony and spatial insurance effects (Tscharntke et al., 2012). Previous studies indicated that heterogeneity typically has nonlinear effects on biodiversity and ecosystem function, as moderate heterogeneity can maximise spatial asynchrony (Redon et al., 2014; Wilcox et al., 2017). However, our study did not observe nonlinear patterns between fragmentation per se and plant diversity and above-ground productivity. This may be due to the low spatial heterogeneity of this area as a result of agricultural intensification (Benton et al., 2003; Chen et al., 2019). The gradient of fragmentation per se in our study may not cover the optimal heterogeneity levels for maximising plant diversity and above-ground productivity (Thompson and Gonzalez, 2016).”

      Meanwhile, we also discussed the nonlinear pattern of the BEF relationship with increasing levels of fragmentation per se to add depth to the discussion.

      Line 442-451:

      “In addition, our study found that the BEF relationship showed a nonlinear pattern with increasing levels of fragmentation per se. For a given level of habitat loss, the positive BEF relationship was strongest at moderate fragmentation per se level and became neutral at high fragmentation per se level. This can be explained by the increased spatial asynchrony at moderate fragmentation per se level, which can promote niche complementary among species in the community and thus strengthen the BEF relationship (Gonzalez et al., 2020; Thompson and Gonzalez, 2016; Tscharntke et al., 2012). The neutral BEF relationship at high fragmentation per se level may be due to edge effects enhancing environmental filtering, thereby leading to functional redundancy among species and decoupling the BEF relationship (Fetzer et al., 2015; Hu et al., 2016; Zambrano et al., 2019).”

      (a) Line 74-75: I was wondering if you also thought of spatial insurance effects or spatial asynchrony effects that can emerge with habitat fragmentation, which could lead to increased ecosystem functioning as well? (refs. above).

      Response: Thanks for your constructive suggestions. In the revised manuscript, we have explicitly considered the spatial insurance effect or spatial asynchrony as the important mechanism for fragmentation per se to increase plant diversity, ecosystem function, and the BEF relationship.

      Line 74-77:

      “In theory, habitat loss and fragmentation per se can regulate ecosystem function and the BEF relationship by altering species composition, interactions, and spatial asynchrony regardless of changes in species richness (Liu et al., 2018; Thompson and Gonzalez, 2016; Tscharntke et al., 2012).”

      Line 402-408:

      “In our study, a possible mechanism for the positive impacts of fragmentation per se on plant diversity and above-ground productivity (indirect positive impact via plant diversity) is that fragmentation per se increases the habitat heterogeneity in the landscape, which can promote biodiversity through spatial asynchrony and spatial insurance effects (Tscharntke et al., 2012). Previous studies indicated that heterogeneity typically has nonlinear effects on biodiversity and ecosystem function, as moderate heterogeneity can maximise spatial asynchrony (Redon et al., 2014; Wilcox et al., 2017).”

      Line 442-451:

      “In addition, our study found that the BEF relationship showed a nonlinear pattern with increasing levels of fragmentation per se. For a given level of habitat loss, the positive BEF relationship was strongest at moderate fragmentation per se level and became neutral at high fragmentation per se level. This can be explained by the increased spatial asynchrony at moderate fragmentation per se level, which can promote niche complementary among species in the community and thus strengthen the BEF relationship (Gonzalez et al., 2020; Thompson and Gonzalez, 2016; Tscharntke et al., 2012). The neutral BEF relationship at high fragmentation per se level may be due to edge effects enhancing environmental filtering, thereby leading to functional redundancy among species and decoupling the BEF relationship (Fetzer et al., 2015; Hu et al., 2016; Zambrano et al., 2019).”

      (b) I was wondering, if this result of linear effects could also be the result of a fragmentation gradient that does not cover the whole range of potential values? Maybe it would be good to compare the gradient in habitat fragmentation in your study with a theoretical minimum maximum/considering that there might be an optimal medium degree of fragmentation.

      Response: Thanks for your insightful comment. We agree with your point that the linear effect of fragmentation per se in our study may be due to the fact that the gradient of fragmentation per se in this region may not cover the optimal heterogeneity levels for maximising spatial asynchrony. This is mainly because the agricultural intensification in the agro-pastoral ecotone of northern China could lead to lower spatial heterogeneity in this region. We have explicitly discussed this point in the revised manuscript.

      Line 406-413:

      “Previous studies indicated that heterogeneity typically has nonlinear effects on biodiversity and ecosystem function, as moderate heterogeneity can maximise spatial asynchrony (Redon et al., 2014; Wilcox et al., 2017). However, our study did not observe nonlinear patterns between fragmentation per se and plant diversity and above-ground productivity. This may be due to the low spatial heterogeneity of this area as a result of agricultural intensification (Benton et al., 2003; Chen et al., 2019). The gradient of fragmentation per se in our study may not cover the optimal heterogeneity levels for maximising plant diversity and above-ground productivity (Thompson and Gonzalez, 2016).”

      (4) Some additional suggestions:

      (a) Line 3: Maybe add "via reducing the percentage of grassland specialists in the community"?

      Response: Thanks for your suggestion. We have revised this sentence.

      Line 19:

      “Habitat loss can weaken the positive BEF relationship via reducing the percentage of grassland specialists in the community”

      (b) Lines 46-48: Maybe add "but see: Duffy, J.E., Godwin, C.M. & Cardinale, B.J. (2017). Biodiversity effects in the wild are common and as strong as key drivers of productivity. Nature."

      Response: Thanks for your suggestion. We have added this reference here.

      Line 47-49:

      “When research expands from experiments to natural systems, however, BEF relationships remain unclear in the natural assembled communities, with significant context dependency (Hagan et al., 2021; van der Plas, 2019; but see Duffy et al., 2017).”

      (c) Lines 82-87 and lines 90-93: Hence, your study actually is in contrast to these findings, i.e., fragmented landscapes do not necessarily have a lower fraction of grassland specialists? If yes, could you highlight this more explicitly?

      Response: Thanks for your insightful comment. We have explicitly highlighted this point in the revised manuscript.

      Line 434-439:

      “Meanwhile, our study demonstrates that habitat loss, rather than fragmentation per se, can decrease the degree of habitat specialisation by leading to the replacement of specialists by generalists in the community, thus weakening the BEF relationship. This is mainly because fragmentation per se did not decrease the grassland specialist richness in this region, whereas habitat loss decreased the grassland specialist richness and led to the invasion of more weeds from the surrounding farmland into the grassland community (Yan et al., 2022; Yan et al., 2023).”

      (d) Line 360: Could you add some examples of these multiple ecosystem functions you refer to?

      Response: Thanks for your suggestion. We have added some examples of these multiple ecosystem functions here.

      Line 456-457:

      “Therefore, future studies are needed to focus on multiple ecosystem functions, such as below-ground productivity, litter decomposition, soil carbon stocks, etc.”

      Reviewer #3 (Public Review):

      Summary:

      The authors aim to solve how landscape context impacts the community BEF relationship. They found habitat loss and fragmentation per se have inconsistent effects on biodiversity and ecosystem function. Habitat loss rather than fragmentation per se can weaken the positive BEF relationship by decreasing the degree of habitat specialization of the community.

      Strengths:

      The authors provide a good background, and they have a good grasp of habitat fragmentation and BEF literature. A major strength of this study is separating the impacts of habitat loss and fragmentation per se using the convincing design selection of landscapes with different combinations of habitat amount and fragmentation per se. Another strength is considering the role of specialists and generalists in shaping the BEF relationship.

      Response: We are grateful to you for the recognition and constructive comments. All the comments and suggestions are very constructive for improving this manuscript. We have carefully revised the manuscript following your suggestions. All changes are marked in red font in the revised manuscript.

      Weaknesses:

      (1) The authors used five fragmentation metrics in their study. However, the choice of these fragmentation metrics was not well justified. The ecological significance of each fragmentation metric needs to be differentiated clearly. Also, these fragmentation metrics may be highly correlated with each other and redundant. I suggest author test the collinearity of these fragmentation metrics for influencing biodiversity and ecosystem function.

      Response: Thanks for your constructive suggestion. The fragmentation metrics used in our study represent the different processes of breaking apart of habitat in the landscape, which are widely used by previous studies (Fahrig, 2003; Fahrig, 2017). In the revised manuscript, we have provided more detailed information about the ecological significance of these fragmentation indices.

      Line 142-148:

      “The patch density metric reflects the breaking apart of habitat in the landscape, which is a direct reflection of the definition of fragmentation per se (Fahrig et al., 2019). The edge density metric reflects the magnitude of the edge effect caused by fragmentation (Fahrig, 2017). The mean patch area metric and the mean nearest-neighbor distance metric are associated with the area and distance effects of island biogeography, respectively, reflecting the processes of local extinction and dispersal of species in the landscape (Fletcher et al., 2018).”

      Meanwhile, we have calculated the variance inflation factors (VIF) for each fragmentation metric to assess their collinearity. The VIF of these fragmentation metrics were all less than four, suggesting no significant multicollinearity for influencing biodiversity and ecosystem function.

      Author response table 2.

      Variance inflation factors of habitat loss and fragmentation per se indices for influencing plant richness and above-ground biomass.

      (2) I found the local environmental factors were not considered in the study. As the author mentioned in the manuscript, temperature and water also have important impacts on biodiversity and ecosystem function in the natural ecosystem. I suggest authors include the environmental factors in the data analysis to control their potential impact, especially the structural equation model.

      Response: Thanks for your constructive suggestion. We agree with you that environmental factors should be considered in our study. In the revised manuscript, we have integrated two environmental factors related to water and temperature (soil water content and land surface temperature) into the data analysis to control their potential impact. The main results and conclusions of the revised manuscript are consistent with those of the previous manuscript.

      Reviewer #3 (Recommendations For The Authors):

      (1) L60-63. The necessity to distinguish between habitat loss and fragmentation per se is not clearly stated. More information about biodiversity conservation strategies can be given here.

      Response: Thanks for your suggestion. In the revised manuscript, we have provided more evidence about the importance of distinguishing between habitat loss and fragmentation per se for biodiversity conservation.

      Line 62-67:

      “Habitat loss is often considered the major near-term threat to the biodiversity of terrestrial ecosystems (Chase et al., 2020; Haddad et al., 2015), while the impact of fragmentation per se remains debated (Fletcher Jr et al., 2023; Miller-Rushing et al., 2019). Thus, habitat loss and fragmentation per se may have inconsistent ecological consequences and should be considered simultaneously to establish effective conservation strategies in fragmented landscapes (Fahrig et al., 2019; Fletcher et al., 2018; Miller-Rushing et al., 2019).”

      (2) L73-77. The two sentences are hard to follow. Please rephrase to improve the logic. And I don't understand the "however" here. There is no twist.

      Response: Thanks for your suggestion. We have rephrased the two sentences to improve their logic.

      Line 74-79:

      “In theory, habitat loss and fragmentation per se can regulate ecosystem function and the BEF relationship by altering species composition, interactions, and spatial asynchrony regardless of changes in species richness (Liu et al., 2018; Thompson and Gonzalez, 2016; Tscharntke et al., 2012). This is because species in communities are not ecologically equivalent and may respond differently to habitat loss and fragmentation per se, and contribute unequally to ecosystem function (Devictor et al., 2008; Wardle and Zackrisson, 2005).”

      (3) L97. Are grasslands really the largest terrestrial ecosystem? Isn't it the forest?

      Response: We apologize for making this confusion. We have rephrased this sentence here.

      Line 101-104:

      “Grasslands have received considerably less attention, despite being one of the largest terrestrial ecosystems, and suffering severe fragmentation due to human activities, such as agricultural reclamation and urbanisation (Fardila et al., 2017).”

      (4) Fig.1, whether the four sample plots presented in panel b are from panel a. Please add the scale bar in panel b.

      Response: Thanks for your comment. The four sample plots presented in panel b are from panel a in Figure 1. We have also added the scale bar in panel b.

      (5) L105. This statement is too specific. Please remove and consider merging this paragraph with the next.

      Response: Thanks for your suggestion. We have removed this sentence and merged this paragraph with the next.

      (6) L157. The accuracy and kappa value of the supervised classification should be given.

      Response: Thanks for your suggestion. We have added the accuracy and kappa value of the supervised classification in the revised manuscript.

      Line 176-177:

      “The overall classification accuracy was 84.3 %, and the kappa coefficient was 0.81.”

      (7) I would recommend the authors provide the list of generalists and specialists surveyed in the supplementary. Readers may not be familiar with the plant species composition in this area.

      Response: Thanks for your suggestion. We agree with your point. We have provided the list of generalists and specialists surveyed in the Appendix Table A4.

      Line 282-283:

      “A total of 130 vascular plant species were identified in our study sites, including 91 grassland specialists and 39 weeds (Appendix Table A4).”

      (8) Fig.4, it is better to add the results of variation partition to present the relative contribution of habitat fragmentation, environmental factors, and plant diversity.

      Response: Thanks for your suggestion. We have integrated the landscape context, environmental factors, and plant diversity into the multi-model averaging analysis and redraw Figure 4 to present their relative importance for above-ground biomass.

      Line 313-319:

      Author response image 3.

      Standardised parameter estimates and 95% confidence intervals for landscape context, plant diversity, and environmental factors affecting above-ground biomass from 130 landscapes in the Tabu River Basin, a typical agro-pastoral ecotone of northern China. Standardised estimates and 95% confidence intervals are calculated by the multi-model averaging method based on the four optimal models affecting above-ground biomass (Appendix Table A3). ** represent significance at the 0.01 level.

      (9) Please redraw Fig.2 and Fig.5 to integrate the environmental factors. Add the R-square to Fig 5.

      Response: Thanks for your suggestion. We have integrated two environmental factors into the structural equation model and redraw Figure 2 and Figure 5 in the revised manuscript. And we have added the R-square to the Figure 5.

      (10) L354. The authors should be careful to claim that habitat loss could reduce the importance of plant diversity to ecosystem function. This pattern observed may depend on the type of ecosystem function studied.

      Response: Thanks for your suggestion. We have avoided this claim in the revised manuscript and explicitly discussed the importance of simultaneously focusing on multiple ecosystem functions, such as below-ground productivity, litter decomposition, soil carbon stocks, etc.

      Line 454-457:

      “This inconsistency can be explained by trade-offs between different ecosystem functions that may differ in their response to fragmentation per se (Banks-Leite et al., 2020). Therefore, future studies are needed to focus on multiple ecosystem functions, such as below-ground productivity, litter decomposition, soil carbon stocks, etc.”

    1. Author Response

      The following is the authors’ response to the original reviews.

      Public Reviews:

      Reviewer #1 (Public Review):

      Transcriptional readthrough, intron retention, and transposon expression have been previously shown to be elevated in mammalian aging and senescence by multiple studies. The current manuscript claims that the increased intron retention and readthrough could completely explain the findings of elevated transposon expression seen in these conditions. To that end, they analyze multiple RNA-seq expression datasets of human aging, human senescence, and mouse aging, and establish a series of correlations between the overall expression of these three entities in all datasets.

      While the findings are useful, the strength of the evidence is incomplete, as the individual analyses unfortunately do not support the claims. Specifically, to establish this claim there is a burden of proof on the authors to analyze both intron-by-intron and gene-by-gene, using internal matched regions, and, in addition, thoroughly quantify the extent of transcription of completely intergenic transposons and show that they do not contribute to the increase in aging/senescence. Furthermore, the authors chose to analyze the datasets as unstranded, even though strand information is crucial to their claim, as both introns and readthrough are stranded, and if there is causality, than opposite strand transposons should show no preferential increase in aging/senescence. Finally, there are some unclear figures that do not seem to show what the authors claim. Overall, the study is not convincing.

      Major concerns: 1) Why were all datasets treated as unstanded? Strand information seems critical, and should not be discarded. Specifically, stranded information is crucial to increase the confidence in the causality claimed by the authors, since readthrough and intron retention are both strand specific, and therefore should influence only the same strand transposons and not the opposite-strand ones.

      This is an excellent suggestion. Since only one of our datasets was stranded, we did not run stranded analyses for the sake of consistency. We would like to provide two analyses here that consider strandedness:

      First, we find that within the set of all expressed transposons (passing minimal read filtering), 86% of intronic transposons match the strand of the intron (3147 out of 3613). In contrast, the number is 51% after permutation of the strands. Similarly, when we randomly select 1000 intronic transposons 45% match the strandedness of the intron (here we select from the set of all transposons). This is consistent with the idea that most transposons are only detectable because they are co-expressed on the sense strand of other features that are highly expressed.

      As for the readthrough data, 287 out of 360 transposons (79%) within readthrough regions matched the strand of the gene and its readthrough.

      Second, in the model we postulate, the majority of transposon transcription occurs as a co-transcriptional artifact. This applies equally to genic transposons (gene expression), intronic (intron retention) and gene proximal (readthrough or readin) transposons. Therefore, we performed the following analysis for the set of all transposons in the Fleischer et al. fibroblast dataset.

      When we invert the strand annotation for transposons, before counting and differential expression, we would expect the counts and log fold changes to be lower compared to using the “correct” annotation file.

      Indeed, we show that out of 6623 significantly changed transposons with age only 226 show any expression in the “inverted run” (-96%). (Any expression is defined as passing basic read filtering.)

      Out of the 226 transposons that can be detected in both runs most show lower counts (A) and age-related differential expression converging towards zero (B) in the inverted run (Fig. L1).

      Author response image 1.

      Transposons with inverted strandedness (“reverse”) show lower expression levels (log counts; A) and no differential expression with age (B) when compared to matched differentially expressed transposons (“actual”). For this analysis we selected all transposons showing significant differential expression with age in the actual dataset that also showed at least minimal expression in the strand-inverted analysis (n=226). Data from Fleischer et al. (2018). (A) The log (counts) are clipped because we only used transposons that passed minimal read filtering in this analysis. (B) The distribution of expression values in the actual dataset is bimodal and positive since some transposons are significantly up- or downregulated. This bimodal distribution is lost in the strand-inverted analysis.

      2) "Altogether this data suggests that intron retention contributes to the age-related increase in the expression of transposons" - this analysis doesn't demonstrate the claim. In order to prove this they need to show that transposons that are independent of introns are either negligible, or non-changing with age.

      We would like to emphasize that we never claimed that intron retention and readthrough can explain all of the age-related increases in transposon expression. In fact, our data is compatible with a multifactorial origin of transposons expression. Age- and senescence-related transposon expression can occur due to: 1/ intron retention, 2/ readthrough, 3/ loss of intergenic heterochromatin. Specifically, we do not try to refute 3.

      However, since most transposons are found in introns or downstream of genes, this suggests that intron retention and readthrough will be major, albeit non-exclusive, drivers of age-related changes in transposons expression. Even if the fold-change for intergenic transposons with aging or senescence were higher this would not account for the broadscale expression patterns seen in RNAseq data.

      To further illustrate this, we analyzed transposons located in introns, genes, downstream (ds) or upstream (us) of genes (distance to gene < 25 kb) or in intergenic regions (distance to gene > 25 kb). Indeed, we find that although intergenic transposons show similar log-fold changes to other transposon classes (Fig. L2A), their total contribution to read counts is negligible (Fig. L2B, Fig. Fig. S15). We have also now added a more nuanced explanation of this issue to the discussion.

      Author response image 2.

      We analyzed transposons located in introns, genes, downstream (ds) or upstream (us) of genes (distance to gene < 25 kb) or in intergenic regions (distance to gene > 25 kb). Independent of their location, transposons show similar differential expression with aging or cellular senescence (A). In contrast, the expression of transposons (log counts) is highly dependent on their location and the median log(count) value decreases in the order: genic > intronic > ds > us > intergenic.

      Author response image 3.

      Total counts are the sum of all counts from transposons located in introns, genes, downstream (ds) or upstream (us) of genes (distance to gene < 25 kb) or in intergenic regions (distance to gene > 25 kb). Counts were defined as cumulative counts across all samples.

      3) Additionally, the correct control regions should be intronic regions other than the transposon, which overall contributed to the read counts of the intron.

      4) Furthermore, analysis of read spanning intron and partly transposons should more directly show this contribution.

      Thank you for this comment. To rephrase this, if we understand correctly, the concern is that an increase in transposon expression could bias the analysis of intron retention since transposons often make up a substantial portion of an intron. We would like to address this concern with the following three points:

      First, if the concern is the correlation between log fold-change of transposons vs log fold-change of their containing introns, we do not think that this kind of data is biased. While transposons make up much of the intron, a single transposon on average only accounts for less than 10% of an intron.

      Second, to address this more directly, we show here that even introns that do not contain expressed transposons are increased in aging fibroblasts and after induction of cellular senescence (Fig. S8). This shows that intron retention is universal and most likely not heavily biased by the presence or absence of expressed transposons.

      Author response image 4.

      We split the set of introns that significantly change with cellular aging (A) or cell senescence (B) into introns that contain at least one transposon (has_t) and those that do not contain any transposons (has_no_t). Intron retention is increased in both groups. In this analysis we included all transposons that passed minimal read filtering (n=63782 in A and n=124173 in B). Median log-fold change indicated with a dashed red line for the group of introns without transposons.

      Third, we provide an argument based on the distribution of transposons within introns (Fig. L3).

      Author response image 5.

      The 5’ and 3’ splice sites show the highest sequence conservation between introns, whereas the majority of the intronic sequence does not. This is because these sites contain binding sites for splicing factors such as U1, U2 and SF1 (A). Transposons could affect splicing and we present a biologically plausible mechanism and two ancillary hypotheses here (B). If transposons affect the splicing (retention) of introns the most likely mechanism would be via impairment of splice site recognition because a transposon close to the site forms a secondary structure, binds an effector protein or provides inadequate sequences for pairing. Hypothesis 1: Transposons impair splicing because they are close to the splice site. Hypothesis 2: Transposons do not impair splicing because they are located away from the splice junction. Retained introns should show a similar depletion of transposons around the junction. Image adapted from: Ren, Pingping, et al. "Alternative splicing: a new cause and potential therapeutic target in autoimmune disease." Frontiers in Immunology 12 (2021): 713540.

      Consistent with hypothesis 2 (“transposons do not impair splicing”), we show that the distribution of transposons within introns is similar for the set of all transposons and all significant transposons within significantly overexpressed introns (Fig. S7. A and B is similar in the case of aged fibroblasts; D and E is similar in the case of cellular senescence). If transposon expression was causally linked to changes in intron retention, the most likely mechanism would be via an impairment of splicing. We would expect transposons to be located close to the splice junction, which is not what we observed. Instead, the data is more consistent with intron retention as a driver of transposon expression.

      Author response image 6.

      Transposons are evenly distributed within introns except for the region close to splice junctions (A-E). Transposons appear to be excluded from the splice junction-adjacent region both in all introns (A, D) and in significantly retained introns (B, E). In addition, transposon density of all introns and significantly retained introns is comparable (C, F). We included only introns containing at least one transposon in this analysis. A) Distribution of 2292769 transposons within 163498 introns among all annotated transposons. B) Distribution of 195190 transposons within 14100 introns significantly retained with age. C) Density (transposon/1kb of intron) of transposons in all introns (n=163498) compared to significantly retained introns (n=14100). D) as in (A) E) Distribution of 428130 transposons within 13205 introns significantly retained with induced senescence. F) Density (transposon/1kb of intron) of transposons in all introns (n=163498) compared to significantly retained introns (n=13205).

      5) "This contrasts with the almost completely even distribution of randomly permuted transposons." How was random permutation of transposons performed? Why is this contract not trivial, and why is this a good control?

      Permutation was performed using the bedtools shuffle function (Quinlan et al. 2010). We use the set of all annotated transposons and all reshuffled transposons as a control. It is interesting to observe that these two show a very similar distribution with transposons evenly spread out relative to genes. In contrast, expressed transposons are found to cluster downstream of genes. This gave rise to our initial working hypothesis that readthrough should affect transposon expression.

      6) Fig 4: the choice to analyze only the 10kb-20kb region downstream to TSE for readthrough regions has probably reduced the number of regions substantially (there are only 200 left) and to what extent this faithfully represent the overall trend is unclear at this point.

      This is addressed in Suppl. Fig. 7, we repeated the analysis for every 10kb region between 0 and 100kb, showing similar results.

      Furthermore, we show below in a new figure that the results are comparable when we measure readthrough in the 0 to 10kb region, while the sample size of readthrough regions is increased.

      Finally, it is commonly accepted to remove readthrough regions overlapping genes, which while reducing sample size, increases accuracy for readthrough determination (Rosa-Mercado et al. 2021). Without filtering readthrough regions can overlap neighboring genes which is reflected in an elevated ratio of Readthrough_counts/Genic_counts (Fig. S9).

      Author response image 7.

      A) Readthrough was determined in a region 0 to 10 kb downstream of genes for a subset of genes that were at least 10 kb away from the nearest neighboring gene (n=684 regions). The log2 ratio of readthrough to gene expression is plotted across five age groups (adolescent n=32, young n=31, middle-aged n=22, old n=37 and very old n=21). B) As in (A) but data is plotted on a per sample basis. C) Readthrough was determined in a region 0 to 10 kb downstream of genes for a subset of genes that were at least 10 kb away from the nearest neighboring gene (n=1045 regions). The log2 ratio of readthrough to gene expression is plotted for the groups comprising senescence (n=12) and the non-senescent group (n=6). D) As in (D) but data is plotted on a per sample basis and for additional control datasets (serum-starved, immortalized, intermediate passage and early passage). N=3 per group.

      7) Fig. 5B shows the opposite of the authors claims: in the control samples there are more transposon reads than in the KCl samples.

      Thank you for pointing this out. During preparation of the manuscript the labels of Fig. 5B were switched (however, the color matching between Fig. 5A-C is correct). We apologize for this mistake, which we have now corrected.

      8) "induced readthrough led to preferential expression of gene proximal transposons (i.e. those within 25 kb of genes), when compared with senescence or aging". A convincing analysis would show if there is indeed preferential proximity of induced transposons to TSEs. Since readthrough transcription decays as a function of distance from TSEs, the expression of transposons should show the same trends if indeed simply caused by readthrough. Also, these should be compared to the extent of transposon expression (not induction) in intergenic regions without any readthrough, in these conditions.

      This is a very good suggestion. We now provide two new supplementary figures analyzing the distance-dependence of transposon expression.

      In the first figure (Fig. S13) we show that readthrough decreases with distance (A, B) and we show that transposon counts are higher for transposons close to genes, following a similar pattern to readthrough. This is true in fibroblasts isolated from aged donors (A) and with cellular senescence (B).

      Author response image 8.

      Readthrough counts (rt_counts) decrease exponentially downstream of genes, both in the aging dataset (A) and in the cellular senescence dataset (B). Although noisier, the pattern for transposon counts (transp_cum_counts) is similar with higher counts closer to gene terminals, both in the aging dataset (C) and in the cellular senescence dataset (D). Readthrough counts are the cumulative counts across all genes and samples. Readthrough was determined in 10 kb bins and the values are assigned to the midpoint of the bin for easier plotting. Transposon counts are the cumulative counts across all samples for each transposon that did not overlap a neighboring gene. n=801 in (C) and n=3479 in (D).

      In the second figure (Fig. S14) we show that transposons found downstream of genes with high readthrough show a more pronounced log-fold change (differential expression) than transposons downstream of genes with low readthrough (defined based on log-fold change). This is true in fibroblasts isolated from aged donors (A) and with cellular senescence (B). Furthermore, the difference between high and low readthrough region transposons is diminished for transposons that are more than 10 kb downstream of genes, as would be expected given that readthrough decreases with distance.

      Author response image 9.

      Transposons found downstream of genes with high readthrough (hi_RT) show a more pronounced log-fold change (transp_logfc) than transposons downstream of genes with low readthrough (low_RT). This is true in fibroblasts isolated from aged donors (A) and with cellular senescence (B). Furthermore, the difference between high and low readthrough region transposons is diminished for transposons that are more than 10 kb downstream of genes (“Transp > 10 kb”). Transposons in high readthrough regions were defined as those in the top 20% of readthrough log-fold change. Readthrough was measured between 0 and 10 kb downstream from genes. n=2124 transposons in (A) and n=6061 transposons in (B) included in the analysis.

      Reviewer #2 (Public Review):

      In this manuscript, the authors examined the role of transcription readout and intron retention in increasing transcription of transposable elements during aging in mammals. It is assumed that most transposable elements have lost the regulatory elements necessary for transcription activation. Using available RNA-seq datasets, the authors showed that an increase in intron retention and readthrough transcription during aging contributes to an increase in the number of transcripts containing transposable elements.

      Previously, it was assumed that the activation of transposable elements during aging is a consequence of a gradual imbalance of transcriptional repression and a decrease in the functionality of heterochromatin (de repression of transcription in heterochromatin). Therefore, this is an interesting study with important novel conclusion. However, there are many questions about bioinformatics analysis and the results obtained.

      Major comments:

      1) In Introduction the authors indicated that only small fraction of LINE-1 and SINE elements are expressed from functional promoters and most of LINE-1 are co-expressed with neighboring transcriptional units. What about other classes of mobile elements (LTR mobile element and transposons)?

      We thank the reviewer for this comment. Historically, most repetitive elements, e.g. DNA elements and retrotransposon-like elements, have been considered inactive, having accrued mutations which prevent them from transposition. On the other hand, based on recent data it is indeed very possible that certain LTR elements become active with aging as suggested in several manuscripts (Liu et al. 2023, Autio et al. 2020). However, these elements are not well annotated and our final analysis (Fig. 6) relies on a well-defined distinction between active and inactive elements. (See also question 2 for further discussion.)

      Finally, we would like to point out some of the difficulties with defining expression and re-activation of LTR/ERV elements based on RNAseq data that have been highlighted for the Liu manuscript and are concordant with several of our results: https://pubpeer.com/publications/364E785636ADF94732A977604E0256

      Liu, Xiaoqian, et al. "Resurrection of endogenous retroviruses during aging reinforces senescence." Cell 186.2 (2023): 287-304.

      Autio A, Nevalainen T, Mishra BH, Jylhä M, Flinck H, Hurme M. Effect of ageing on the transcriptomic changes associated with expression at the HERV-K (HML-2) provirus at 1q22. Immun Ageing. 2020;17(1):11.

      2) Results: Why authors considered all classes of mobile elements together? It is likely that most of the LTR containing mobile elements and transposons contain active promoters that are repressed in heterochromatin or by KRAB-C2H2 proteins.

      We do not consider LTR containing elements because there is uncertainty regarding their overall expression levels and their expression with aging (Nevalainen et al. 2018). Furthermore, we believe that substantial activity of LTR elements in human genomes should have been detectable through patterns of insertional mutagenesis. Yet studies generally show low to negligible levels of LTR (ERV) mutagenesis. Here, for example, at a 200-fold lower rate than for LINEs (Lee et al. 2012).

      Importantly, our analysis in Fig. 6 relies on well-annotated elements like LINEs, which is why we do not include LTR or SINE elements that could be potentially expressed. However, for other analyses we did consider element families independently as can be seen in Table S1, for example.

      Nevalainen, Tapio, et al. "Aging-associated patterns in the expression of human endogenous retroviruses." PLoS One 13.12 (2018): e0207407.

      Lee, Eunjung, et al. "Landscape of somatic retrotransposition in human cancers." Science 337.6097 (2012): 967-971.

      3) Fig. 2. A schematic model of transposon expression is not presented clearly. What is the purpose of showing three identical spliced transcripts?

      This is indeed confusing. There are three spliced transcripts to schematically indicate that the majority of transcripts will be correctly spliced and that intron retention is rare (estimated at 4% of all reads in our dataset). We have clarified the figure now, please see below:

      Author response image 10.

      A schematic model of transposon expression. In our model, represented in this schematic, transcription (A) can give rise to mRNAs and pre-mRNAs that contain retained introns when co-transcriptional splicing is impaired. This is often seen during aging and senescence, and these can contain transposon sequences (B). In addition, transcription can give rise to mRNAs and pre-mRNAs that contain transposon sequences towards the 3’-end of the mRNA when co-transcriptional termination at the polyadenylation signal (PAS) is impaired (C, D) as seen with aging and senescence. Some of these RNAs may be successfully polyadenylated (as depicted here) whereas others will be subject to nonsense mediated decay. Image created with Biorender.

      4) The study analyzed the levels of RNA from cell cultures of human fibroblasts of different ages. The annotation to the dataset indicated that the cells were cultured and maintained. (The cells were cultured in high-glucose (4.5mg/ml) DMEM (Gibco) supplemented with 15% (vol/vol) fetal bovine serum (Gibco), 1X glutamax (Gibco), 1X non-essential amino acids (Gibco) and 1% (vol/vol) penicillin-streptomycin (Gibco). How correct that gene expression levels in cell cultures are the same as in body cells? In cell cultures, transcription is optimized for efficient division and is very different from that of cells in the body. In order to correlate a result on cells with an organism, there must be rigorous evidence that the transcriptomes match.

      We agree and have updated the discussion to reflect this shortcoming. While we do not have human tissue data, we would like to draw the reviewer’s attention to Fig. S3 where we presented some liver data for mice. We now provide an additional supplementary figure (in a style similar to Fig. S2) showing how readthrough, transposon expression and intron retention changes in 26 vs 5-month-old mice (Fig. S4). Indeed, intron, readthrough and transposons increase with age in mice, although this is more pronounced for transposons and readthrough.

      Author response image 11.

      Intron, readthrough and transposon elements are elevated in the liver of aging mice (26 vs 5-month-old, n=6 per group). Readthrough and transposon expression is especially elevated even when compered to genic transcripts. The percentage of upregulated transcripts is indicated above each violin plot and the median log10-fold change for genic transcripts is indicated with a dashed red line.

      Finally, just to elaborate, we used the aging fibroblast dataset by Fleischer et al. for three reasons:

      1) Yes, aging fibroblasts could be a model of human aging, with important caveats as you correctly point out,

      2) it is one of the largest such datasets allowing us to draw conclusions with higher statistical confidence and do things such as partial correlations

      3) it has been analyzed using similar techniques before (LaRocca, Cavalier and Wahl 2020) and this dataset is often used to make strong statements about transposons and aging such as transposon expression in this dataset being “consistent with growing evidence that [repetitive element] transcripts contribute directly to aging and disease”. Our goal was to put these statements into perspective and to provide a more nuanced interpretation.

      LaRocca, Thomas J., Alyssa N. Cavalier, and Devin Wahl. "Repetitive elements as a transcriptomic marker of aging: evidence in multiple datasets and models." Aging Cell 19.7 (2020): e13167.

      5) The results obtained for isolated cultures of fibroblasts are transferred to the whole organism, which has not been verified. The conclusions should be more accurate.

      We agree and have updated the discussion accordingly.

      6) The full pipeline with all the configuration files IS NOT available on github (pabisk/aging_transposons).

      Thank you for pointing this out, we have now uploaded the full pipeline and configuration files.

      7) Analysis of transcripts passing through repeating regions is a complex matter. There is always a high probability of incorrect mapping of multi-reads to the genome. Things worsen if unpaired short reads are used, as in the study (L=51). Therefore, the authors used the Expectation maximization algorithm to quantify transposon reads. Such an option is possible. But it is necessary to indicate how statistically reliable the calculated levels are. It would be nice to make a similar comparison of TE levels using only unique reads. The density of reads would drop, but in this case it would be possible to avoid the artifacts of the EM algorithm.

      We thank the reviewer for this suggestion. We show here that mapping only unique alignments (outFilterMultimapNmax=1 in STAR) leads to similar results.

      For the aging fibroblast dataset:

      Author response image 12.

      For the induced senescence dataset:

      Author response image 13.

    1. Author Response

      The following is the authors’ response to the original reviews.

      Public Reviews:

      Reviewer #1 (Public Review):

      The regulation of motor autoinhibition and activation is essential for efficient intracellular transport. This manuscript used biochemical approaches to explore two members in the kinesin-3 family. They found that releasing UNC-104 autoinhibition triggered its dimerization whereas unlocking KLP-6 autoinhibition is insufficient to activate its processive movement, which suggests that KLP-6 requires additional factors for activation, highlighting the common and diverse mechanisms underlying motor activation. They also identified a coiled-coil domain crucial for the dimerization and processive movement of UNC-104. Overall, these biochemical and single-molecule assays were well performed, and their data support their statements. The manuscript is also clearly written, and these results will be valuable to the field.

      Thank you very much!

      Ideally, the authors can add some in vivo studies to test the physiological relevance of their in vitro findings, given that the lab is very good at worm genetic manipulations. Otherwise, the authors should speculate the in vivo phenotypes in their Discussion, including E412K mutation in UNC-104, CC2 deletion of UNC-104, D458A in KLP-6.

      1. We have shown the phenotypes unc-104(E412K) mutation in C. elegans (Niwa et al., Cell Rep, 2016) and described about it in discussion (p.14 line 3-4). The mutant worm showed overactivation of the UNC-104-dependent axonal transport, which is consistent with our biochemical data showing that UNC-104(1-653)(E412K) is prone to form a dimer and more active than wild type.

      2. It has been shown that L640F mutation induces a loss of function phenotype in C. elegans (Cong et al., 2021). The amount of axonal transport is reduced in unc-104(L640F) mutant worms. L640 is located within the CC2 domain. To show the importance of CC2-dependent dimerization in the axonal transport in vivo, we biochemically investigated the impact of L640F mutation.

      By introducing L640F into UNC-104(1-653)(E412K), we performed SEC analysis. The result shows that UNC-104(1-653)(E412K,L640F) failed to form stable dimers despite the release of their autoinhibition (new Figure S8). This result strongly suggests the importance of the CC2 domain in the axonal transport in vivo. Based on the result, we discussed it in the revised manuscript (p.13 line 6-8).

      1. Regarding KLP-6(D458A), we need a genetic analysis using genome editing and we would like to reserve it for a future study. We speculate that the D458A mutation could lead to an increase in transport activity in vivo similar to unc-104(E412K). This is because the previous study have shown that wild-type KLP-6 was largely localized in the cell body, while KLP-6(D458A) was enriched at the cell periphery in the N2A cells (Wang et al., 2022). We described it in discussion (p.14 line 13-14).

      While beyond the scope of this study, can the author speculate on the candidate for an additional regulator to activate KLP-6 in C. elegans?

      The heterodimeric mechanoreceptor complex, comprising LOV-1 and PKD-2, stands as potential candidates for regulating KLP-6 dimerization. We speculate the heterodimerization property is suitable for the enhancement of KLP-6 dimerization. On the other hand, it's noteworthy that KLP-6 can undergo activation in Neuro 2a cells upon the release of autoinhibition (Wang et al., 2022). This observation implies the involvement of additional factors which are not present in sf9 cells may be able to induce dimerization. Post-translational modifications would be one of the candidates. We discussed it in p14 line 7-14.

      The authors discussed the differences between their porcine brain MTs and chlamydonomas axonemes in UNC-104 assays. However, the authors did not really retest UNC-104 on axonemes after more than two decades, thereby not excluding other possibilities.

      We thought that comparing different conditions used in different studies is essential for the advancement of the field of molecular motors. Therefore, we newly performed single-molecule assay using Chlamydomonas axonemes and compared the results with brain MTs (Fig. S6). Just as observed in the study by Tomoshige et al., we were also unable to observe the processive runs of UNC-104(1-653) on Chlamydomonas axonemes (Fig. S6A). Furthermore, we found that the landing rate of UNC-104(1-653) on Chlamydomonas axonemes was markedly lower in comparison to that on purified porcine microtubules (Fig. S6B).

      Reviewer #1 (Recommendations For The Authors):

      More discussion as suggested above would improve the manuscript.

      We have improved our manuscript as described above.

      Reviewer #2 (Public Review):

      The Kinesin superfamily motors mediate the transport of a wide variety of cargos which are crucial for cells to develop into unique shapes and polarities. Kinesin-3 subfamily motors are among the most conserved and critical classes of kinesin motors which were shown to be self-inhibited in a monomeric state and dimerized to activate motility along microtubules. Recent studies have shown that different members of this family are uniquely activated to undergo a transition from monomers to dimers.

      Niwa and colleagues study two well-described members of the kinesin-3 superfamily, unc104 and KLP6, to uncover the mechanism of monomer to dimer transition upon activation. Their studies reveal that although both Unc104 and KLP6 are both self-inhibited monomers, their propensities for forming dimers are quite different. The authors relate this difference to a region in the molecules called CC2 which has a higher propensity for forming homodimers. Unc104 readily forms homodimers if its self-inhibited state is disabled while KLP6 does not.

      The work suggests that although mechanisms for self-inhibited monomeric states are similar, variations in the kinesin-3 dimerization may present a unique form of kinesin-3 motor regulation with implications on the forms of motility functions carried out by these unique kinesin-3 motors.

      Thank you very much!

      Reviewer #2 (Recommendations For The Authors):

      The work is interesting but the process of making constructs and following the transition from monomers to dimers seems to be less than logical and haphazard. Recent crystallographic studies for kinesin-3 have shown the fold and interactions for all domains of the motor leading to the self-inhibited state. The mutations described in the manuscript leading to disabling of the monomeric self-inhibited state are referenced but not logically explained in relation to the structures. Many of the deletion constructs could also present other defects that are not presented in the mutations. The above issues prevent wide audience access to understanding the studies carried out by the authors.

      We appreciate this comment. We improved it as described bellow.

      Suggestions: Authors should present schematic, or structural models for the self-inhibited and dimerized states. The conclusions of the papers should be related to those models. The mutations should be explained with regard to these models and that would allow the readers easier access. Improving access to the readers in and outside the motor field would truly improve the impact of the manuscript on the field.

      The structural models illustrating the autoinhibited state have been included in new Figure S4, accompanied by an explanation of the correlation between the mutations and these structures in the figure legend. Additionally, schematic models outlining the dimerization process of both UNC-104 and KLP-6 have been provided in Figure S9 to enhance reader comprehension of the process.

      Reviewer #3 (Public Review):

      In this work, Kita et al., aim to understand the activation mechanisms of the kinesin-3 motors KLP-6 and UNC-104 from C. elegans. As with many other motor proteins involved in intracellular transport processes, KLP-6 and UNC-104 motors suppress their ATPase activities in the absence of cargo molecules. Relieving the autoinhibition is thus a crucial step that initiates the directional transport of intracellular cargo. To investigate the activation mechanisms, the authors make use of mass photometry to determine the oligomeric states of the full-length KLP-6 and the truncated UNC-104(1-653) motors at sub-micromolar concentrations. While full-length KLP-6 remains monomeric, the truncated UNC-104(1-653) displays a sub-population of dimeric motors that is much more pronounced at high concentrations, suggesting a monomer-to-dimer conversion. The authors push this equilibrium towards dimeric UNC-104(1-653) motors solely by introducing a point mutation into the coiled-coil domain and ultimately unleashing a robust processivity of the UNC-104 dimer. The authors find that the same mechanistic concept does not apply to the KLP-6 kinesin-3 motor, suggesting an alternative activation mechanism of the KLP-6 that remains to be resolved. The present study encourages further dissection of the kinesin-3 motors with the goal of uncovering the main factors needed to overcome the 'self-inflicted' deactivation.

      Thank you very much!

      Reviewer #3 (Recommendations For The Authors):

      126-128: It is surprising that surface-attachment does not really activate the full-length KLP6 motor (v=48 {plus minus} 42 nm/s). Can the authors provide an example movie of the gliding assay for the FL KLP6 construct? Gliding assays are done by attaching motors via their sfGFP to the surface using anti-GFP antibodies. Did the authors try to attach the full-length KLP-6 motor directly to the surface? If the KLP-6 motor sticks to the surface via its (inhibitory) C-terminus, this attachment would be expected to activate the motor in the gliding assay, ideally approaching the in vivo velocities of the activated motor.

      We have included an example kymograph showing the gliding assay of KLP-6FL (Fig. S1A). When we directly attached KLP-6FL to the surface, the velocity was 0.15 ± 0.02 µm/sec (Fig. S1B), which is similar to the velocity of KLP-6(1-390). While the velocity observed in the direct-attachment condition is much better than those observed in GFP-mediated condition, the observed velocity remains considerably slower than in vivo velocities. Firstly, we think this is because dimerization of KLP-6 is not induced by the surface attachment. Previous studies have shown that monomeric proteins are generally slower than dimeric proteins in the gliding assay (Tomishige et al., 2002). These are consistent with our observation that KLP-6 remains to be monomeric even when autoinhibition is released. Secondly, in vitro velocity of motors is generally slower than in vivo velocity.

      156-157: It seems that the GCN4-mediated dimerization induces aggregation of the KLP6 motor domains as seen in the fractions under the void volume in Figure 3B (not seen with the Sf9 expressed full-length constructs, see Figure 1B). Also, the artificially dimerized motor construct does not fully recapitulate the in vivo velocity of UNC-104. Did the authors analyze the KLP-6(1-390)LZ with mass photometry and is it the only construct that is expressed in E. coli?

      KLP-6::LZ protein is not aggregating. We have noticed that DNA and RNA from E. coli exists in the void fraction and they occasionally trap recombinant kinesin-3 proteins in the void fraction. To effectively remove these nucleic acids from our protein samples, we employed streptomycin sulfate as a purification method (Liang et al., Electrophoresis, 2009). Please see Purification of recombinant proteins in Methods. In the size exclusion chromatography analysis, we observed that KLP-6(1-393)LZ predominantly eluted in the dimer fraction (New Figure 3). Subsequently, we reanalyzed the motor's motility using a total internal reflection fluorescence (TIRF) assay, as shown in the revised Figure 3. Even after these efforts, the velocity was not changed significantly. The velocity of KLP-6LZ is about 0.3 µm/sec while that of cellular KLP-6::GFP is 0.7 µm/sec (Morsci and Barr, 2011). Similar phenomena, "slower velocity in vitro", has been observed in other motor proteins.

      169: In Wang et al., (2022) the microtubule-activated ATPase activities of the mutants were measured in vitro as well, with the relative activities of the motor domain and the D458A mutant being very similar. The D458A mutation is introduced into the full-length motor in Wang et al., while in the present work, the mutation is introduced into the truncated KLP-6(1-587) construct. Can the authors explain their reasoning for the latter?

      (1) Kinesins are microtubule-stimulated ATPases. i.e. The ATPase activity is induced by the binding with a microtubule.

      (2) Previous studies have shown that the one-dimensional movement of the monomeric motor domain of kinesin-3 depends on the ATPase activity even when the movement does not show clear plus-end directionality (Okada et al., Science, 1998).

      (3) While KLP-6(1-587) does not bind to microtubules, both KLP-6(1-390) (= the monomeric motor domain) and KLP-6(1-587)(D458A) similarly bind to microtubules and show one dimensional diffusion on microtubules (Fig. 4E and S2B).

      Therefore, the similar ATPase activities of the motor domain(= KLP-6(1-390)) and KLP-6(D458A) observed by Wang et al. is because both proteins similarly associate with and hydrolyze ATP on microtubules, which is consistent with our observation. On the other hand, because KLP-6(wild type) cannot efficiently bind to microtubules, the ATPase activity is low.

      Can the authors compare the gliding velocities of the KLP-6(1-390)LZ vs KLP-6(1-587) vs KLP-6(1-587)(D458A) constructs to make sure that the motors are similarly active?

      We conducted a comparative analysis of gliding velocities involving KLP-6(1-390), KLP-6(1-587), and KLP-6(1-587)(D458A) (Fig. S1C). We used KLP-6(1-390) instead of KLP-6(1-390)LZ, aligning with the protein used by Wang et al.. We demonstrated that both KLP-6(1-587) and KLP-6(1-587) (D458A) exhibited activity levels comparable to that of KLP-6(1-390). The data suggests that the motor of all recombinant proteins are similarly active.

      Please note that, unlike full length condition (Fig. 1D and S1A and S1B), the attachment to the surface using the anti-GFP antibody can activates KLP-6(1-587). The data suggests that, due to the absence of coverage by the MBS and MATH domain (Wang et al., Nat. Commun., 2022), the motor domain of KLP-6(1-587) to some extent permits direct binding to microtubules under gliding assay conditions.

      Are the monomeric and dimeric UNC-104(1-653) fractions in Figure 5B in equilibrium? Did the authors do a re-run of the second peak of UNC-104(1-653) (i.e. the monomeric fraction with ~100 kDa) to assess if the monomeric fraction re-equilibrates into a dimer-monomer distribution?

      We conducted a re-run of the second peak of UNC-104(1-653) and verified its re-equilibration into a distribution of dimers and monomers after being incubated for 72 hours at 4°C (Fig. S5).

      UNC-104 appears to have another predicted coiled-coiled region around ~800 aa (e.g. by NCoils) that would correspond to the CC3 in the mammalian homolog KIF1A. This raises the question if the elongated UNC-104(1-800) would dimerize more efficiently than UNC-104(1-653) (authors highlight the sub-population of dimerized UNC-104(1-653) at low concentrations in Figure 5C) and if this dimerization alone would suffice to 'match' the UNC-104(1-653)E412K mutant (Figure 5D). Did the authors explore this possibility? This would mean that dimerization does not necessarily require the release of autoinhibition.

      We have tried to purify UNC-104(1-800) and full-length UNC-104 using the baculovirus system. However, unfortunately, the expression level of UNC-104(1-800) and full length UNC-104 was too low to perform in vitro assays even though codon optimized vectors were used. Instead, we have analyzed full-length human KIF1A. We found that full-length KIF1A is mostly monomeric, not dimeric (Please look at the Author response image 1). The property is similar to UNC-104(1-653) (Figure 5A-C). Therefore, we think CC3 does not strongly affect dimerization of KIF1A, and probably its ortholog UNC-104. Moreover, a recent study has shown that CC2 domain, but not other CC domains, form a stable dimer in the case of KIF1A (Hummel and Hoogenraad, JCB, 2021). Given the similarity in the sequence of KIF1A and UNC-104, we anticipate that the CC2 domain of UNC-104 significantly contributes to dimerization, potentially more than other CC domains. We explicitly describe it in the Discussion in the revised manuscript.

      Author response image 1.

      Upper left, A representative result of size exclusion chromatography obtained from the analysis of full-length human KIF1A fused with sfGFP. Upper right, A schematic drawing showing the structure of KIF1A fused with sfGFP and a result of SDS-PAGE recovered from SEC analysis. Presumable dimer and monomer peaks are indicated. Lower left, Presumable dimer fractions in SEC were collected and analyzed by mass photometry. The result confirms that the fraction contains considerable amount of dimer KIF1A. Lower right, Presumable monomer fractions were collected and analyzed by mass photometry. The result confirms that the fraction mainly consists of monomer KIF1A. Note that these results obtained from full-length KIF1A protein are similar to those of UNC-104(1-653) protein shown in Figure 5A-C.

    1. Author Response

      The following is the authors’ response to the original reviews.

      Response to reviewer’s comments

      Reviewer #1 (Public Review):

      In this study, the structural characteristics of plant AlaDC and SerDC were analyzed to understand the mechanism of functional differentiation, deepen the understanding of substrate specificity and catalytic activity evolution, and explore effective ways to improve the initial efficiency of theanine synthesis.

      On the basis of previous solid work, the authors successfully obtained the X-ray crystal structures of the precursors of theanine synthesis-CsAlaDC and AtSerDC, which are key proteins related to ethylamine synthesis, and found a unique zinc finger structure on these two crystal structures that are not found in other Group II PLP-dependent amino acid decarboxylases. Through a series of experiments, it is pointed out that this characteristic zinc finger motif may be the key to the folding of CsAlaDC and AtSerDC proteins, and this discovery is novel and prospective in the study of theine synthesis.

      In addition, the authors identified Phe106 of CsAlaDC and Tyr111 of AtSerDC as key sites of substrate specificity by comparing substrate binding regions and identified amino acids that inhibit catalytic activity through mutation screening based on protein structure. It was found that the catalytic activity of CsAlaDCL110F/P114A was 2.3 times higher than that of CsAlaDC. At the same time, CsAlaDC and AtSerDC substrate recognition key motifs were used to carry out evolutionary analysis of the protein sequences that are highly homologous to CsAlaDC in embryos, and 13 potential alanine decarboxylases were found, which laid a solid foundation for subsequent studies related to theanine synthesis.

      In general, this study has a solid foundation, the whole research idea is clear, the experimental design is reasonable, and the experimental results provide strong evidence for the author's point of view. Through a large number of experiments, the key links in the theanine synthesis pathway are deeply studied, and an effective way to improve the initial efficiency of theanine synthesis is found, and the molecular mechanism of this way is expounded. The whole study has good novelty and prospectivity, and sheds light on a new direction for the efficient industrial synthesis of theanine

      Response: Thank you very much for taking time to review this manuscript. We appreciate all your insightful comments and constructive suggestions.

      Reviewer #1 (Recommendations For The Authors):

      (1) If some test methods are not original, references or method basis should be indicated.

      Response: Thank you very much for your careful reading of the manuscript and valuable suggestions. We have added references for the enzymatic activity experiments performed to measure the synthesis of theanine in the revised manuscript.

      (2) The conclusion is a little lengthy, and the summary of the whole study is not well condensed.

      Response: Thank you very much for your valuable suggestions. We have refined the conclusion in the revised manuscript, and it is as follows:

      In conclusion, our structural and functional analyses have significantly advanced understanding of the substrate-specific activities of alanine and serine decarboxylases, typified by CsAlaDC and AtSerDC. Critical amino acid residues responsible for substrate selection were identified—Tyr111 in AtSerDC and Phe106 in CsAlaDC—highlighting pivotal roles in enzyme specificity. The engineered CsAlaDC mutant (L110F/P114A) not only displayed enhanced catalytic efficiency but also substantially improved L-theanine yield in a synthetic biosynthesis setup with PsGS or GMAS. Our research expanded the repertoire of potential alanine decarboxylases through the discovery of 13 homologous enzyme candidates across embryophytic species and uncovered a special motif present in serine protease-like proteins within Fabale, suggesting a potential divergence in substrate specificity and catalytic functions. These insights lay the groundwork for the development of industrial biocatalytic processes, promising to elevate the production of L-theanine and supporting innovation within the tea industry.

      Reviewer #2 (Public Review)

      Summary:

      The manuscript focuses on the comparison of two PLP-dependent enzyme classes that perform amino acyl decarboxylations. The goal of the work is to understand the substrate specificity and factors that influence the catalytic rate in an enzyme linked to theanine production in tea plants.

      Strengths:

      The work includes x-ray crystal structures of modest resolution of the enzymes of interest. These structures provide the basis for the design of mutagenesis experiments to test hypotheses about substrate specificity and the factors that control catalytic rate. These ideas are tested via mutagenesis and activity assays, in some cases both in vitro and in plants.

      Weaknesses:

      The manuscript could be more clear in explaining the contents of the x-ray structures and how the complexes studied relate to the reactant and product complexes. The structure and mechanism section would also be strengthened by including a diagram of the reaction mechanism and including context about reactivity. As it stands, much of the structural results section consists of lists of amino acids interacting with certain ligands without any explanation of why these interactions are important or the role they play in catalysis. The experiments testing the function of a novel Zn(II)-binding domain also have serious flaws. I don't think anything can be said at this point about the function of the Zn(II) due to a lack of key controls and problems with experimental design.

      Response: Thank you very much for your thoughtful comments and feedback on our manuscript. We are pleased to hear that the work's strengths, such as the X-ray crystal structures and the mutagenesis experiments tied to the catalytic rate and substrate specificity, align with the goals of our research.

      We recognize the areas identified for improvement and appreciate the suggestions provided. We have emphasized how we use the structural information obtained to infer the roles of key amino acid residues in the reaction. Additionally, we have added a diagram of the reaction mechanism in the Supplementary figure to provide clearer context on reactivity and improve the overall understanding of the catalytic process. Regarding the structural results section, we have included a discussion that contextualizes the list of amino acids and their interactions with the ligands by explaining their significance and roles in catalysis. We acknowledge the weaknesses you've pointed out in the experiments concerning the novel Zn(II)-binding domain, but we would like to clarify that the focus of our study was not primarily on the zinc structure. While we agree that there may be limitations in the experimental design and controls for the zinc binding domain, we believe that these flaws do not significantly impact the overall findings of the study. The experiment served as a preliminary exploration of the potential functionality of the domain, and further studies are required to fully understand its role and mechanism.

      Reviewer #2 (Recommendations For The Authors):

      (1) In addition to the points raised in the public review, it would be ideal to provide some context for the enzymatic characterization. Why are the differences in kinetic parameters for AlaDC and SerDC significant?

      Response: Thank you for your comments and suggestions. The Km values for CsAlaDC and SerDCs are comparable, suggesting similar substrate affinities. However, CsAlaDC exhibits a significantly lower Vmax compared to AtSerDC and CsSerDC. This discrepancy implies that CsAlaDC and SerDCs may differ in the rates at which they convert substrate to product when saturated with substrate. SerDCs may have a faster turnover rate, meaning they convert substrate to product and release the enzyme more quickly, resulting in a higher Vmax. Differences in the stability or correct folding of the enzymes under assay conditions can also affect their Vmax. If SerDCs are more stable, they might maintain their catalytic activity better at higher substrate concentrations, contributing to a higher Vmax. We have added these to the part of “Enzymatic properties of CsAlaDC, AtSerDC, and CsSerDC” in our revised manuscript.

      (2) Why is Phe106/Tyr111 pair critical for substrate specificity? Does the amino acid contact the side chain? It might be helpful to a reader to formulate a hypothesis for this interaction.

      Response: Thank you for the question and comments. We conducted a comparison between the active sites of CsAlaDC and AtSerDC and observed a distinct difference in only two amino acids: F106 in CsAlaDC and Y111 in AtSerDC. The remaining amino acids were found to be identical. Expanding on previous research concerning Group II PLP-dependent amino acid decarboxylases, it was postulated and subsequently confirmed that these specific amino acids play a crucial role in substrate recognition. However, since we lack the structure of the enzyme-substrate complex, we are unable to elucidate the precise interactions occurring between the substrate and the amino acids at this particular site based solely on structural information.

      (3) Line 55 - Define EA again.

      Response: Thank you very much for your careful reading of the manuscript and valuable suggestions. We have redefined “EA” as the abbreviation for ethylamine in the revised manuscript.

      (4) Line 58 - The meaning of "determined by the quality formation of tea" is not clear.

      Response: Thank you very much for your careful reading of the manuscript and valuable suggestions. We have modified it in the revised manuscript.

      (5) Line 65 - Missing words between "despite they".

      Response: Thank you very much for your careful reading of the manuscript. We have corrected it in the revised manuscript.

      (6) Line 67 - Need a reference for the statement about lower activity?

      Response: Thank you for the question and comments. We have provided the following reference to support this statement in the revised manuscript.

      Reference: Bai, P. et al. (2021) Biochemical characterization of specific Alanine Decarboxylase (ADC) and its ancestral enzyme Serine Decarboxylase (SDC) in tea plants (Camellia sinensis). BMC Biotechnol. 21,17.

      (7) Line 100-101 - The meaning of "its closer relationship was Dicots plants." is not clear.

      Response: We have revised the sentence in the revised manuscript, as follows: “Phylogenetic analysis indicated that CsAlaDC is homologous with SerDCs in Dicots plants.”

      (8) Line 139 - Missing a word between "as well as" and "of".

      Response: Thank you very much for your careful reading of the manuscript and valuable suggestions. We have corrected it in the revised manuscript.

      (9) Line 142 - The usage of comprised here is not correct. It would be more correct to say "The overall architecture of CsAlaDC and AtSerDC is homodimeric with the two subunits...".

      Response: Thank you very much for your careful reading of the manuscript and valuable suggestions. We have corrected it in the revised manuscript.

      (10) Line 148-149 - I didn't understand the statement about the "N-terminal structures" Are these structures obtained from protein samples that have a truncated N-terminus?

      Response: Group II PLP-dependent amino acid decarboxylases are comprised of three distinct structural domains: the N-terminal domain, the large domain, and the C-terminal domain. Each of these domains possesses unique structural features. Similarly, CsAlaDC and AtSerDC can also be classified into three structural domains based on their specific characteristics. To achieve more stable proteins for further experiments, we conducted truncation on both of these proteins. The truncated section pertains to a subsection of the N-terminal domain and is truncated from the protein's N-terminus.

      (11) Line 153 - Say "is composed of" instead of "composes of".

      Response: Thank you very much for your careful reading of the manuscript and valuable suggestions. We have corrected it in the revised manuscript.

      (12) Line 156 - I didn't understand the statement about the cofactor binding process. What is the cofactor observed? And how can we say anything about the binding process from a single static structure of the enzyme? It might be better to say that the cofactor binding site is located at the subunit junction - but the identity of the cofactor still needs to be defined first.

      Response: Thank you for your comments and suggestions. The cofactor mentioned here is PLP. We aim to elucidate the binding state of PLP at the active site, excluding the binding process. The description has been revised in the revised manuscript.

      (13) Lines 157-158 - I didn't understand the conclusion about the roles of each monomer. In the images in Figure 3 - both monomers appear to bind PLP but the substrate is not present - so it's not clear how conclusions can be drawn about differential substrate binding in the two subunits.

      Response: Thank you very much for your careful reading and valuable suggestions. The main idea we want to convey is that this protein possesses two active sites. At each active site, the two monomers carry out distinct functions. Of course, our previous conclusion is inaccurate due to the non-existence of the substrate. So, we have made the necessary amendments in the revised manuscript.

      (14) Line 161 - I would say loop instead of ring.

      Response: Thank you very much for your careful reading of the manuscript and valuable suggestions. We have corrected it in the revised manuscript.

      (15) Line 165 - Please provide some references for this statement. It would also be ideal to state the proximity of the Zn-binding motif to the active site or otherwise provide some information about the role of the motif based on its location.

      Response: Thank you for your comments and suggestions. We have provided the following references to support this statement in the revised manuscript.

      Author response image 1.

      (A) Structure of histidine decarboxylase. (B) Structure of glutamate decarboxylase.

      Reference:

      30 Komori, H. et al. (2012) Structural study reveals that Ser-354 determines substrate specificity on human Histidine Decarboxylase. J Biol Chem. 287, 29175-83.

      31 Huang, J. et al. (2018) Lactobacillus brevis CGMCC 1306 glutamate decarboxylase: Crystal structure and functional analysis. Biochem Biophys Res Co. 503, 1703-1709

      In CsAlaDC, the zinc is positioned at a distance of 29.6 Å from the active center, whereas in AtSerDC, the zinc is situated 29 Å away from the active center. Hence, we hypothesize that this structure does not impact the enzyme's catalytic activity but might be correlated with its stability.

      (16) Lines 166-178 - This paragraph appears to be a list of all of the interactions between the protein, PLP, and the EA product. It would be ideal to provide some text to explain why these interactions are important and what we can learn from them.

      Response: Thank you very much for your careful reading of the manuscript and valuable suggestions. We have been conducting additional analysis on the functional roles of amino acid residues involved in the interaction between the active site and PLP. This analysis focuses on aiding PLP binding, determining its orientation, and understanding enzyme catalytic mechanisms. These details are mentioned in the revised manuscript.

      (17) Line 192 - Bond not bound.

      Response: Thank you very much for your careful reading of the manuscript and valuable suggestions. We have made corrections in the revised manuscript.

      (18) Lines 201-207 - It would be ideal to verify that the inclusion of 5 mM DTT affects Zn binding. It's not clear to me that this reagent would necessarily disrupt Zn binding. Under certain circumstances, it could instead promote Zn association. For example, if the Cys ligands are oxidized initially but then become reduced? I don't think the current experiment really provides any insight into the role of the Zn.

      Response: Thank you for your valuable insights regarding the role of DTT and its potential effects on Zn binding in our experiments. The main function of DTT is to protect or restore the reduced state of proteins and other biological molecules, particularly by disrupting the crosslinking formed by thiol (-SH) groups and disulfide bonds to maintain the function and structure of proteins. Therefore, the reason for DTT's inhibition of enzyme activity is unknown, and we cannot provide a reasonable explanation for this phenomenon. As a result, we have removed the section discussing the inhibition of enzyme activity by DTT in our revised manuscript.

      Reviewer #3 (Public Review):

      In the manuscript titled "Structure and Evolution of Alanine/Serine Decarboxylases and the Engineering of Theanine Production," Wang et al. solved and compared the crystal structures of Alanine Decarboxylase (AlaDC) from Camellia sinensis and Serine Decarboxylase (SerDC) from Arabidopsis thaliana. Based on this structural information, the authors conducted both in vitro and in vivo functional studies to compare enzyme activities using site-directed mutagenesis and subsequent evolutionary analyses. This research has the potential to enhance our understanding of amino acid decarboxylase evolution and the biosynthetic pathway of the plant-specialized metabolite theanine, as well as to further its potential applications in the tea industry. Response: Thank you very much for taking the time to review this manuscript. We appreciate all your insightful comments.

      Reviewer #3 (Recommendations For The Authors):

      Page 6, Figure 2, Page 23 (Methods)

      "The supernatants were purified with a Ni-Agarose resin column followed by size-exclusion chromatography."

      What kind of SEC column did the authors use? Can the authors provide the SEC elution profile comparison results and size standard curve?

      Response: We use a Superdex 200 (Hiload 16/600) column for size exclusion chromatography. The comparison results of SEC elution profiles for AtSerDC and CsAlaDC, along with the standard curve of SEC column, are presented below.

      Author response image 2.

      (A) Comparison of elution profiles of CsAlaDC and AtSerDC. (B) Elution profile of Blue Dextron 2000. (C) Elution profile of mixed protein (Aldolase, 158000 Da,71.765ml; Conalbumin, 75000 Da,79.391ml; Ovalbumin, 44000 Da,83.767ml; Carbonic anhydrase, 29000 Da,90.019ml; Ribonuclease A, 13700 Da,98.145ml). (D) Size standard curves of Superdex 200 (Hiload 16/600) column.

      Page 6 & Page 24 (Methods)

      "The 100 μL reaction mixture, containing 20 mM substrate (Ala or Ser), 100 mM potassium phosphate, 0.1 mM PLP, and 0.025 mM purified enzyme, was prepared and incubated at standard conditions (45 ℃ and pH 8.0 for CsAlaDC, 40 ℃ and pH 8.0 for AtSerDC for 30 min)."

      (1) The enzymatic activities of CsAldDC and AtSerDC were measured at two different temperatures (45 and 40 ℃, but their activities were directly compared. Is there a reason for experimenting at different temperatures?

      Response: We determined that the optimal reaction temperature for AtSerDC is 40°C and for CsAlaDC is 45°C through our verification process. Consequently, all subsequent experiments were performed at these specific temperatures.

      Author response image 3.

      (A) Relative activity of CsAlaDC at different temperatures. (B) Relative activity of AtSerDC at different temperatures.

      (2) Enzyme activities were measured at temperatures above 40℃, which is not a physiologically relevant temperature and may affect the stability or activity of the proteins. At the very least, the authors should provide temperature-dependent protein stability data (e.g., CD spectra analysis) or, if possible, temperature-dependent enzyme activities, to show that their experimental conditions are suitable for studying the activities of these enzymes.

      Response: Thank you very much for your careful reading. We have already validated that the experimental temperature we used did not significantly affect the stability of the protein before experimenting. The results are shown in the figure below:

      Author response image 4.

      Place the two proteins individually into water baths set at temperatures of 25°C, 37°C, 45°C, 60°C, and 80°C for 15 minutes. Subsequently, carry out enzymatic reactions utilizing a standard reaction system, with untreated enzymes serving as the experimental control within the said system. The experimental results suggest that the temperature at which we experimented does not have a significant impact on the stability of the enzyme.

      (3) The authors used 20 mM of substrate. What are the physiological concentrations of alanine and serine typically found in plants?

      Response: The content of alanine in tea plant roots ranges from 0.28 to 4.18 mg/g DW (Yu et al., 2021; Cheng et al., 2017). Correspondingly, the physiological concentration of alanine is 3.14 mM to 46.92 mM, in tea plant roots. The content of serine in plants ranges from 0.014 to 17.6 mg/g DW (Kumar et al., 2017). Correspondingly, the physiological concentration of serine is 0.13 mM to 167.48 mM in plants. In this study, the substrate concentration of 20 mM was close to the actual concentrations of alanine and serine in plants.

      Yu, Y. et al. (2021) Glutamine synthetases play a vital role in high accumulation of theanine in tender shoots of albino tea germplasm "Huabai 1". J. Agric. Food Chem. 69 (46),13904-13915.

      Cheng, S. et al. (2017) Studies on the biochemical formation pathway of the amino acid L-theanine in tea (Camellia sinensis) and other plants.” J. Agric. Food Chem. 65 (33), 7210-7216.

      Kumar, V. et al. (2017) Differential distribution of amino acids in plants. Amino Acids. 49(5), 821-869.

      Pages 6-7 & Table 1

      (1) Use the correct notation for Km and Vmax. Also, the authors show kinetic parameters and use multiple units (e.g., mmol/L or mM for Km).

      Response: Thank you very much for your careful reading of the manuscript and valuable suggestions. We have corrected this in the revised manuscript.

      (2) When comparing the catalytic efficiency of enzymes, kcat/Km (or Vmax/Km) is generally used. The authors present a comparison of catalytic activity from results to conclusion. A clarification of what results are being compared is needed.

      Response: Thank you for your comments and suggestions. The catalytic activity is assessed by comparing reaction rates.

      Page 7 & Figure 3

      In Figure 3A, the authors describe the overall structure, but a simple explanation or labeling within the figure should be added.

      Response: Thank you very much for your suggestions, we have made modifications to Figure 3A as follows:

      Author response image 5.

      Crystal structures of CsAlaDC and AtSerDC. (A) Dimer structure of CsAlaDC. The color display of the N-terminal domain, large domain, and C-terminal domains of chain A is shown in light pink, khaki and sky blue, respectively. Chain B is shown in spring green. The PLP molecule is shown as a sphere model. The zinc finger structure at the C-terminus of CsAlaDC is indicated by the red box. The gray spheres represent zinc ions, while the red dotted line depicts the coordination bonds formed by zinc ions with cysteine and histidine.

      Figures 3F & 4A

      In these figures, the two structures are overlaid and compared, but the colors are very similar to see the differences. The authors should use a different color scheme.

      Response: Thank you very much for your suggestions, we have made modifications to the Figure 3F & 4A as follows:

      Author response image 6.

      (Figure 3F) - The monomers of CsAlaDC and AtSerDC are superimposed. CsAlaDC is depicted in spring green, while AtSerDC is shown in plum. The conserved amino acid catalytic ring is indicated by the red box. (Figure 4A) - Superposition of substrate binding pocket amino acid residues in CsAlaDC and AtSerDC. The amino acid residues of CsAlaDC are shown in spring green, the amino acid residues of AtSerDC are shown in plum, with the substrate specificity-related amino acid residue highlighted in a red ellipse.

      Pages 7 & 8

      Figures 3 and 4 do not include illustrations of what the authors describe in the text. The reader will not be able to understand the descriptions until they download and view the structures themselves. The authors should create additional figures to make it easier for readers to understand the structures.

      Response: Thank you very much for your suggestions, we have included supplementary figure 1 in the revised manuscript, which presents more elaborate structural depictions of the two proteins.

      Pages 9 & 10

      "This result suggested this Tyr is required for the catalytic activity of CsAlaDC and AtSerDC."

      The author's results are interesting, but it is recommended to perform the experiments in a specific order. First, experiments should determine whether mutagenesis affects the protein's stability (e.g., CD, as discussed earlier), and second, whether mutagenesis affects ligand binding (e.g., ITC, SPR, etc.), before describing how site-directed mutagenesis alters enzyme activity. In particular, the authors' hypothesis would be much more convincing if they could show that the ligand binding affinity is similar between WT and mutants.

      Response: Thank you for your insightful feedback on our manuscript, which we greatly appreciate. Your suggestion to methodically sequence the experiments provides a clear pathway to bolster the strength and conclusiveness of our results.

      We agree that it is crucial to first assess the stability of the mutant proteins, as changes therein could inadvertently affect catalytic activity. To this end, we have employed circular dichroism (CD) to study the potential structural alterations in the proteins induced by mutations. The experimental results are shown in the following figure:

      Author response image 7.

      (A) Circular Dichroism Spectra of CsAlaDC (WT). (B) Circular Dichroism Spectra of CsAlaDC (Y336F). (C) Circular Dichroism Spectra of CD of AtSerDC (WT). (D) Circular Dichroism Spectra of AtSerDC (Y341F).

      The experimental results indicate that the secondary structure of the mutant proteins remains unchanged, which means the mutations do not alter the protein's stability.

      The ligand PLP forms a Schiff base structure with the ε-amino group of a lysine residue in the protein, with maximum absorbance around 420-430 nm. Since we have already added PLP during the protein purification process, as long as the absorbance of mutant proteins and wild-type proteins is the same at 420-430 nm at equivalent concentrations, it indicates that the mutant proteins do not affect the binding of the ligand PLP. Therefore, we scanned the UV-visible absorption spectra of both the wild-type and mutant proteins, and the results are as presented in the following figure:

      Author response image 8.

      (A) UV-Visible Absorption Spectra of CsAlaDC (WT) compared to CsAlaDC (Y336F). (B) UV-Visible Absorption Spectra of AtSerDC (WT) compared to AtSerDC (Y341F).

      The mutant protein and the wild-type protein exhibit similar absorbance at 420-430 nm, indicating that the mutation does not affect the binding of PLP to the protein.

      The above experiments have confirmed that the mutations do not significantly affect the stability of the protein or the affinity for the ligand, so we can more confidently attribute changes in enzyme activity to the specific role of the tyrosine residue in question. We believe this comprehensive approach will substantiate our hypothesis and illustrate the necessity of this Tyr residue for the catalytic activity of CsAlaDC and AtSerDC enzymes.

      Figure 3

      In the 3D structure figure provided by the authors, the proposed reaction mechanism of the enzyme and the involved amino acids are not included. Can the authors add a supplementary figure with a schematic drawing that includes more information, such as distances?

      Response: Thank you for your valuable feedback on our manuscript. We completely agree that a schematic drawing with additional details, including distances, would enhance the clarity and understanding of the enzymatic mechanism. In response to your suggestion, we have added a supplementary figure 2 in the revised manuscript that accurately illustrates the proposed reaction pathway, highlighting the key amino acids involved.

      Page 10

      "The results showed that 5 mM L-DTT reduced the relative activity of CsAlaDC and AtSerDC to 22.0% and 35.2%, respectively"

      The authors primarily use relative activity to compare WT and mutants. Can the authors specify the exact experiments, units, and experimental conditions? Is it Vmax or catalytic efficiency? If so, under what specific experimental conditions?

      Response: Thank you for your attention and review of our research paper, we appreciate your suggestions and feedback. The experimental protocol employed to evaluate the influence of DTT on protein catalytic efficiency is outlined as follows:

      The 100 μL reaction mixture, containing 20 mM substrate (Ala or Ser), 100 mM potassium phosphate, 0.1 mM PLP, 5 mM L-DTT, and 0.025 mM purified enzyme, was prepared and incubated at standard conditions (45 °C and pH 8.0 for CsAlaDC for 5 min, 40 °C and pH 8.0 for AtSerDC for 2 min). DTT is absent as a control in the reaction system. Then the reaction was stopped with 20 μL of 10% trichloroacetic acid. The product was derivatized with 6-aminoquinolyl-N-hydroxy-succinimidyl carbamate (AQC) and subjected to analysis by UPLC. All enzymatic assays were performed in triplicate.

      However, due to the unknown mechanism of DTT inhibition on protein activity, we have removed this part of the content in the revised manuscript.

      Pages 10-12

      The identification of 'Phe106 in CsAlaDC' and 'Tyr111 in AtSerDC,' along with the subsequent mutagenesis and enzymatic activity assays, is intriguing. However, the current manuscript lacks an explanation and discussion of the underlying reasons for these results. As previously mentioned, it would be helpful to gain insights and analysis from WT-ligand and mutant-ligand binding studies (e.g., ITC, SPR, etc.). Furthermore, the authors' analysis would be more convincing with accompanying structural analysis, such as steric hindrance analysis.

      Response: Thank you for your insightful comments and constructive feedback on our manuscript. We appreciate the interest you have expressed in the identification of 'Phe106 in CsAlaDC' and 'Tyr111 in AtSerDC' and their functional implications based on mutagenesis and enzymatic assays.

      In order to investigate the binding status of the mutant protein and the ligand PLP,we scanned the UV-visible absorption spectra of both the wild-type and mutant proteins, and the results are as presented in the following figure:

      Author response image 9.

      (A) UV-Visible Absorption Spectra of CsAlaDC (WT) compared to CsAlaDC (F106Y). (B) UV-Visible Absorption Spectra of AtSerDC (WT) compared to AtSerDC (Y111F).

      The mutant protein and the wild-type protein exhibit similar absorbance at 420-430 nm, indicating that the mutation does not affect the binding of PLP to the protein. Therefore, we can conclude that the change in activity of the mutant protein is caused by the substitution of the amino acid at that site, i.e., the amino acid at that site affects substrate specificity. By combining the structure of the two proteins, we can see that the Lys at position 111 of AtSerDC is a hydrophilic amino acid, which increases the hydrophilicity of the active site, and thus the substrate is the hydrophilic amino acid Ser. In contrast, the amino acid at the corresponding site in CsAlaDC is Phe, which, lacking a hydroxyl group compared to Lys, increases the hydrophobicity of the active site, making the substrate lean towards the hydrophobic amino acid Ala. We have added a discussion of the potential reasons for this result to the revised manuscript's discussion section.

      Page 5 & Figure 1B

      "As expected, CsSerDC was most closed to AtSerDC, which implies that they shared similar functions. However, CsAlaDC is relatively distant from CsSerDC."

      In Figure 1B, CsSerDC and AtSerDC are in different clades, and this figure does not show that the two enzymes are closest. To provide another quantitative comparison, please provide a matrix table showing amino acid sequence similarities as a supplemental table.

      Response: Many thanks for your constructive suggestion. We added a matrix table showing amino acid sequence similarities in the supplemental materials. The results showed that the similarity of amino acid sequences between CsSerDC and AtSerDC is 86.21%, which is higher than that between CsAlaDC and CsSerDC (84.92%). This data exactly supports the description of Figure 1B. We added the description of the amino acid sequence similarities analysis in the revised manuscript. The description of "As expected, CsSerDC was most closed to AtSerDC, which implies that they shared similar functions. " is not accurate enough, so we revised it to "As expected, CsSerDC was closer to AtSerDC, which implies that they shared similar functions.", in the revised manuscript.

      Page 5 & Figure 1C

      Figure 1C, which shows a multiple sequence alignment with the amino acid sequences of the 6 SerDCs and CsAlaDC, clearly shows the differences between the sequences of AlaDC and other SerDCs. However, the authors' hypothesis would be more convincing if they showed that this difference is also conserved in AlaDCs from other plants. Can the authors show a new multiple-sequence alignment by adding more amino acid sequences of other AlaDCs?

      Response: Thank you for your comments and suggestions. We aim to discover additional alanine decarboxylase. However, at present, the only experimentally confirmed alanine decarboxylase is CsAlaDC. No experimentally verified alanine decarboxylases have been found in other plant species.

      Figure 5A

      Figure 5A is missing the error bar.

      Response: Figure 5A serves as a preliminary screening for these mutants, without conducting repeated experiments. Subsequently, only the L110F and P114A mutants, which exhibited significantly improved activity, underwent further experimental verification to confirm their enhanced functionality.

    1. Author Response

      The following is the authors’ response to the original reviews.

      First, the authors would like to thank the reviewers and editors for their thoughtful comments. The comments were used to guide our revision, which is substantially improved over our initial submission. We have addressed all comments in our responses below, through a combination of clarification, new analyses and new experimental data.

      Reviewer #1 (Public Review):

      In this manuscript, the authors identified and characterized the five C-terminus repeats and a 14aa acidic tail of the mouse Dux protein. They found that repeat 3&5, but not other repeats, contribute to transcriptional activation when combined with the 14aa tail. Importantly, they were able to narrow done to a 6 aa region that can distinguish "active" repeats from "inactive" repeats. Using proximal labeling proteomics, the authors identified candidate proteins that are implicated in Dux-mediated gene activation. They were able to showcase that the C-terminal repeat 3 binds to some proteins, including Smarcc1, a component of SWI/SNF (BAF) complex. In addition, by overexpressing different Dux variants, the authors characterized how repeats in different combinations, with or without the 14aa tail, contribute to Dux binding, H3K9ac, chromatin accessibility, and transcription. In general, the data is of high quality and convincing. The identification of the functionally important two C-terminal repeats and the 6 aa tail is enlightening. The work shined light on the mechanism of DUX function.

      A few major comments that the authors may want to address to further improve the work:

      We thank the reviewer for their efforts and constructive comments, which have guided our revisions.

      1) The summary table for the Dux domain construct characteristics in Fig. 6a could be more accurate. For example, C3+14 clearly showed moderate weaker Dux binding and H3K9ac enrichment in Fig 3c and 3e. However, this is not illustrated in Fig. 6a. The authors may consider applying statistical tests to more precisely determine how the different Dux constructs contribute to DNA binding (Fig. 3c), H3K9ac enrichment (Fig. 3e), Smarcc1 binding (Fig. 5e), and ATAC-seq signal (Fig. 5f).

      We thank the reviewer for this comment, and agree that there were some modest differences in construct characteristics that were not captured in the Summary Table (6a). To better reflect the differences between constructs, we added additional dynamic range to our depiction/scoring, and believe that the new scoring system provides sufficient qualitative range to capture the difference without imposing a statistical approach.

      2) Another concern is that exogenous overexpressed Dux was used throughout the experiments. The authors may consider validating some of the protein-protein interactions using spontaneous or induced 2CLCs (where Dux is expressed).

      We agree that it would be helpful to determine endogenous DUX interaction with our BioID candidates. Here, we attempted co-IPs for endogenous DUX protein with the DUX antibody and were unsuccessful, which indicated that the DUX antibody is useful for detection but not efficient in the primary IP. This is why we utilized the mCherry tag for DUX IP experiments, which worked exceptionally well.

      3) It could be technically challenging, but the authors may consider to validate Dux and Smarcc1 interaction in a biologically more relevant context such as mouse 2-cell embryos where both proteins are expressed. Whether Smarcc1 binding will be dramatically reduced at 4-cell embryos due to loss of Dux expression?

      While we agree that it would be interesting to validate the in vivo interaction of DUX and SMARCC1 in the early embryo, it is not technically feasible for us to conduct the experiment, as the IP would require thousands of two-cell embryos, and we have the issue of poor co-IP quality with the DUX antibody.

      Reviewer #2 (Public Review):

      In this manuscript, Smith et al. delineated novel mechanistic insights into the structure-function relationships of the C-terminal repeat domains within the mouse DUX protein. Specifically, they identified and characterised the transcriptionally active repeat domains, and narrowed down to a critical 6aa region that is required for interacting with key transcription and chromatin regulators. The authors further showed how the DUX active repeats collaborate with the C-terminal acidic tail to facilitate chromatin opening and transcriptional activation at DUX genomic targets.

      Although this study attempts to provide mechanistic insights into how DUX4 works, the authors will need to perform a number of additional experiments and controls to bolster their claims, as well as provide detailed analyses and clarifications.

      We thank this reviewer for their constructive comments, and have conducted several new analyses, additional experiments and clarifications – which have strengthened the manuscript in several locations. Highlights include a statistical approach to the similarity of mouse repeats to themselves and to orthologs (Figure S1d) and clarified interpretations, a wider dynamic range to better reflect changes in DUX construct behaviors (Figure 6a), and additional data on construct behavior, including ‘inactive’ constructs (e.g C1+14aa in Figure 1a,d, new ATAC-seq in Figure S1g), and active constructs such as C3+C5+14aa and C3+C514aa (in Figure S1b).

      Reviewer #3 (Public Review):

      Dux (or DUX4 in human) is a master transcription factor regulating early embryonic gene activation and has garnered much attention also for its involvement in reprogramming pluripotent embryonic stem cells to totipotent "2C-like" cells. The presented work starts with the recognition that DUX contains five conserved c. 100-amino acid carboxy-terminal repeats (called C1-C5) in the murine protein but not in that of other mammals (e.g. human DUX4). Using state-of-the-art techniques and cell models (BioID, Cut&Tag; rescue experiments and functional reporter assays in ESCs), the authors dissect the activity of each repeat, concluding that repeats C3 and C5 possess the strongest transactivation potential in synergy with a short C-terminal 14 AA acidic motif. In agreement with these findings, the authors find that full-length and active (C3) repeat containing Dux leads to increased chromatin accessibility and active histone mark (H3K9Ac) signals at genomic Dux binding sites. A further significant conclusion of this mutational analysis is the proposal that the weakly activating repeats C2 and C4 may function as attenuators of C3+C5-driven activity.

      By next pulling down and identifying proteins bound to Dux (or its repeat-deleted derivatives) using BioID-LC/MS/MS, the authors find a significant number of interactors, notably chromatin remodellers (SMARCC1), a histone chaperone (CHAF1A/p150) and transcription factors previously (ZSCAN4D) implicated in embryonic gene activation.

      The experiments are of high quality, with appropriate controls, thus providing a rich compendium of Dux interactors for future study. Indeed, a number of these (SMARCC1, SMCHD1, ZSCAN4) make biological sense, both for embryonic genome activation and for FSHD (SMCHD1).

      A critical question raised by this study, however, concerns the function of the Dux repeats, apparently unique to mice. While it is possible, as the authors propose, that the weak activating C1, C2 C4 repeats may exert an attenuating function on activation (and thus may have been selected for under an "adaptationist" paradigm), it is also possible that they are simply the result of Jacobian evolutionary bricolage (tinkering) that happens to work in mice. The finding that Dux itself is not essential, in fact appears to be redundant (or cooperates with) the OBOX4 factor, in addition to the absence of these repeats in the DUX protein of all other mammals (as pointed out by the authors), might indeed argue for the second, perhaps less attractive possibility.

      In summary, while the present work provides a valuable resource for future study of Dux and its interactors, it fails, however, to tell a compelling story that could link the obtained data together.

      We appreciated the reviewer’s views regarding the high quality of the work and our generation of an important dataset of DUX interactors. We also appreciate the comments provided to improve the work, and have performed and included in the revised version a set of clarifications, additional analyses and additional experiments that have served to reinforce our main points and provide additional mechanistic links. We also agree that more remains to be done to understand the function and evolution of repeats C1, C2 and C4.

      Reviewer #1 (Recommendations For The Authors):

      1) For immuno-blots, authors may indicate the expected bands to help readers better understand the results.

      Agreed, and we have included the predicted molecular weight of proteins in the Figure Legends. We note that our work shows that the C-terminal domains confer anomalous migration in SDS-PAGE.

      2) Fig. 5b, a blot missing for the mCherry group?

      Figure 5b is a volcano blot, so we believe the reviewer is referring to Figure 5d, which is a coimmunoprecipitation experiment between SMARCC1 and mCherry-tagged DUX constructs. However, we are unsure of the comment as an anti mCherry sample is present in that panel.

      3) Line 99-100, Fig. S1d, it seems that repeat2, but not repeat3, is more similar to human DUX4 C-terminal region.

      This comment and one by another reviewer have prompted us to re-examine the similarities of the DUX repeats, and we have new analyses (Figure S1d) and an alternative framing in the manuscript as a result. We have expanded on this in our response to Reviewer #2, point #1 – and direct the reviewer there for our expanded treatment.

      4) There are a few references are misplaced. For example, line 48, the studies that reported the role of Dux in inducing 2CLCs should be from Hendrickson et al., 2017, De Iaco et al., 2017, and Whiddon et al., 2017. The authors may want to double check all references.

      Thanks for pointing these out. These issues have been corrected in the manuscript.

      5) In the materials & methods section, a few potential errors are noticed. For example, concentrations of PD0325901 and CHIR99021 in mESC medium appear ~1000-fold higher than standards.

      Thanks – corrected.

      Reviewer #2 (Recommendations For The Authors):

      Major Points

      1) Line 99 - The authors claimed that the "human DUX4 C-terminal region is most similar to the 3rd repeat of mouse DUX", but based on Supp. Fig. 1d, the human DUX4 C-term should be most similar to the 2nd repeat of mouse DUX. If this is indeed the case, it will undermine the rest of this study, since the authors claim that the 3rd repeat is transcriptionally active, whereas the 2nd repeat is transcriptionally inactive, and the bulk of this study largely focused on how the active repeats, not the inactive repeats, are critical in recruiting key transcriptional and chromatin regulators to induce the embryonic gene expression program.

      We thank the reviewer for their comments here. Since submission,and as mentioned above for reviewer #1 we have revisited the issue of similarity of the DUX4 C-terminal region to the mouse C-terminal repeats, with a BLAST-based approach that is more rigorous and informed by statistics – which is in Author response table 1 and now in the manuscript as Figure S1d, and has affected our interpretation. Our prior work involved a simple % identity comparison table and we now appreciate that some of the similarity analyses did not meet statistical significance, and therefore we are unable to draw certain conclusions. We make the appropriate modifications in the text. For example, we no longer state that the DUX4 C-terminus appears to be most similar to mouse repeats 3 and 5. This does not affect the main conclusions of the paper regarding interactions of the C-terminus with chromatin-related proteins, only our speculation on which repeat might have represented the original single repeat in the mouse – an issue we think of some interest, but did not rise to the level of mentioning in the original or current abstract.

      Author response table 1.

      Parameters: PAM250 matrix. Gap costs of existence: 15 and extension: 3. Numbers represent e-value of each pairwise comparison

      *No significant similarities found (>0.05).

      2) In Supp Fig 1d, it seems that the rat DUX4 C-terminal region is most similar to the 4th repeat of mouse DUX, which according to the author is supposedly transcriptionally inactive. This weakens the authors justification that the 3rd or 5th repeat is likely the "parental repeat for the other four", and further echoes my concern in point 1 where the human DUX4 C-term is most similar to the 2nd (inactive) repeat of mouse DUX.

      The reviewer’s point is well taken and is addressed in point #1 above.

      3) In Fig. 1d, the authors showed that DUX4-containing C3 and C5, but lacking acidic tail, can promote MERVL::GFP expression, albeit to a slightly lower extent compared to FL. However, in Fig. 2b, C3 or C5 alone (lacking acidic tail) completely failed to promote MERVL::GFP expression. However, in the presence of the acidic tail, both versions were able to promote MERVL::GFP expression, similar to that of FL. The latter would suggest that it is the acidic tail that is crucial for MERVL::GFP expression, and this does not quite agree with Fig 1b, where C12345 (lacking acidic tail) was able to promote MERVL::GFP expression. Although C12345 did not activate MERVL to a similar level as FL, it is clearly proficient, compared to C3 or C5 alone (lacking acidic tail) where there is no increase in MERVL at all. Additional constructs will be helpful to clarify these points. For example, 'C3+C5 minus acidic tail' and 'HD1+HD2+acidic tail only' constructs.

      We agree that constructs such as those mentioned would add to the work. First, we have done the additional construct HD1+HD2+14aa tail, which is presented as ΔC12345+14aa in Figure 2a and in S2a. Additionally, we performed experiments on the requested C3+C5+14aa and C3+C5Δ14aa (see samples 6 and 7 in Author response image 1, which are now included in Supplemental Figure 2b). The results reinforce our hypothesis of an additive effect toward DUX target gene activation by increasing C-terminal repeats and including the 14aa tail.

      Author response image 1.

      4) Related to the above, the flow cytometry data for the MERVL::GFP reporter as presented in Figures 1 and 2, as well as in Supp. Fig. 2, show a considerably large difference in the %GFP|mCherry for the FL construct, ranging from ~6-26%. This makes it difficult to convince the reader which of the different DUX domain constructs cannot or can partially induce GFP|mCherry signal when compared to FL, and hence it is tough to definitively ascertain the exact contribution of each of the 5 C-terminal repeats with high confidence, as it appears that there exists a significant amount of variability in this MERVL::GFP reporter system. The authors need to address this issue since this is their primary method to elucidate the transcriptional activity of each of the mouse DUX repeat domains.

      We note that with the Dux-/- cell lines we used throughout the timeline of the study, the percent of %GFP|mCherry expression progressively and slowly decreased – possibly due to slow/modest epigenetic silencing of the reporter. However, we always used the full-length DUX construct to establish the dynamic range. We emphasize that the relative differences between constructs over multiple cell line replicates remained relatively consistent. However, we elected to show absolute values in each experiment, rather than simply normalizing the full-length to 100% and showing relative.

      5) Lines 140-142 - The authors claimed that the functional difference between the transcriptionally active and inactive repeats could be narrowed down to a "6aa region which is conserved between repeats C3 and C5, but not conserved in C1, C2 and C4". Assuming the 6aa sequence is DPLELF, why does C1C3a elicit almost twice the intensity of GFP|mCherry signal compared to C3C1c, despite both constructs having the exact same 6aa sequence?

      Indeed, C1C3a and C3C1c both containing the ‘active’ DPL sequence but having different relative levels of %GFP|mCherry. This is consistent with these sequences having a positive role in DUX target gene regulation – but likely in combination with other other regions which potentiate its affect, possibly through interacting proteins or post-translational modifications.

      Why does DPLEPL (the intermediate C3C1b construct) induce a similar extent of GFP|mCherry signal as the FL construct, even though the former includes 3aa from a transcriptionally inactive repeat? In contrast, GSLELF (the other intermediate C1C3b construct) that also includes 3aa from a transcriptionally inactive repeat is almost completely deficient in inducing any GFP|mCherry signal. Why is that so? Is DPL the most crucial sequence? It will be important to mutate these 3 (or the above 6) residues on FL DUX4 to examine if its transcriptional activity is abolished.

      These are interesting points. DPL does appear to be the most important region in the mouse DUX repeats. However, DPL is not shared in the C-terminus of human DUX4. Notably, the DUX4 C-terminus is sufficient to activate the mouse MERVL::GFP reporter when cloned to mouse homeodomains (see Author response image 2, second sample) and other DUX target genes (initially published in Whiddon et al. 2017). One clear possibility is that the DPL region is helping to coordinate the additive effects of multiple DUX repeats, which only exist in the mouse protein.

      Author response image 2.

      6) Line 154 - The intermediate DUX domain construct C1C3b occupied a different position on the PCA plot from the C1C3c construct that does not contain any of the critical 6aa sequence, as shown in Fig. 2e. However, both these constructs appear to be similarly deficient in inducing any GFP|mCherry signal, as seen in Fig. 2c. Why is that so?

      The PCA plot assesses the impact on the whole transcriptome and not just the MERVL::GFP reporter, suggesting the 3aa region has transcriptional effects on the genome beyond what is detected in the MERVL::GFP reporter.

      7) To strengthen the claim that "Chromatin alterations at DUX bindings sites require a transcriptionally active DUX repeat", the authors should also perform CUT&Tag for constructs containing transcriptionally inactive DUX repeats (e.g. C1+14aa), and show that such constructs fail to occupy DUX binding sites, as well as are deficient in H3K9ac accumulation.

      This is a good comment. We elected to control this with constructs containing or lacking an active repeat. Although we have not pursued this by CUT&TAG, we have examined the impact of DUX constructs with inactive repeats (including the requested C1+14aa, new Figure S1g) by ATAC-seq (see #12, ATAC-seq section, below), and observe no chromatin opening, suggesting that the lack of transcriptional activity is rooted in the inability to open chromatin.

      8) It would be good if the authors could also include CUT&Tag data for some of the C1C3 chimeric constructs that were used in Fig. 2, since the authors argued that the minimal 6aa region is sufficient to activate many of the DUX target genes. This would also strengthen the authors’ case that the transcriptionally active, not inactive, repeats are critical for binding at DUX binding sites and ensuring H3K9ac occupancy.

      We agree that these would be helpful, and have examined the inactive repeats in transcription and ATAC-seq formats during revision (new data in Figures 1d and S1g), but not yet the CUT&TAG format.

      9) Line 213 - "SMARCA4" should have been "SMARCA5"? Based on Fig. 4d, SMARCA5 is picked up in the BirA*-DUX interactome, not SMARCA4.

      Thanks – corrected.

      10) Lines 250-252 - The authors compared the active BirA-C3 against the inactive BirA-C1 to elucidate the interactome of the transcriptionally active C3 repeat, as illustrated in Fig. 5c. They found 12 proteins more enriched in C1 and 154 proteins in C3. This information should be presented clearly as a separate tab in Supp Table 2. What are the proteins common to both constructs, i.e. enriched to a similar extent? Do they include chromatin remodellers too? Although the authors sought to identify differential interactors between the 2 constructs, it is also meaningful to perform 2 separate comparisons - active BirA-C3 against BirA alone control, and inactive BirA-C1 against BirA alone control - like in Fig. 4d, so as to more accurately define whether the active C3 repeat, and not the inactive C1 repeat, interacts with proteins involved in chromatin remodeling.

      We thank the reviewer for this comment, and we have modified the manuscript by adding a second sheet in Supplementary Table 2 including the results for enriched proteins in BirA-C1 vs. C3. Additionally, due to limitations of annotation between BirA alone and BirA*-C3 being sequenced in different mass spectrometry experiments, it is difficult to quantitatively compare the two datasets with pairwise comparisons.

      11) Fig 5d: The authors mentioned in the legend that endogenous IP was performed for SMARCC1. However, in line 266, they stated Flag-tagged SMARCC1. Is SMARCC1 overexpressed? The reciprocal IP should also be presented. More importantly, C1 constructs (e.g. C1+14aa and C1Δ14aa) should also be included.

      To clarify, Figure 4e used exogenously overexpressed FLAG-SMARCC1 in HEK-293T cells to confirm the results of the full-length DUX BioID experiment. Figure 5d was performed with overexpressed DUX construct, but involved endogenous SMARCC1 in mESCs. This has now been made clearer in the revised manuscript.

      12) For both the SMARCC1 CUT&Tag and ATAC-seq experiments shown in Figures 5e and 5f respectively, the authors need to include DUX derivatives that contain transcriptionally inactive repeats with and without the 14aa acidic tail, i.e. C1+14aa and C1Δ14aa, and show that these constructs prevent the binding/recruitment of SMARCC1 to DUX genomic targets, and correspondingly display a decrease in chromatin accessibility. Only then can they assert the requirement of the transcriptionally active repeat domains for proper DUX protein interaction, occupancy and target activation.

      We agree that examination of an inactive repeat in certain approaches would improve the manuscript. Importantly, we have now included C1+14 in our ATAC-seq experiments, and in Author response image 3 two individual replicates, which constitute a new Figure S1g. Compared to the transcriptionally active DUX constructs, which see opening at DUX binding sites, we do not see chromatin opening at DUX binding sites with transcriptionally inactive C1+14.

      Author response image 3.

      13) To prove that DUX-interactors are important for embryonic gene expression, it will be important to perform loss of function studies. For instance, will the knockdown/knockout of SMARCC1 in cells expressing the active DUX repeat(s) lead to a loss of DUX target gene occupancy and activation?

      We agree that it would be interesting to better understand SMARCC1 cooperation with DUX function in the embryo, but we believe this is beyond the scope of this paper.

      Minor Points

      1) Lines 124-126 - What is the reason/rationale for why the authors used one linker (GGGGS2) for constructs with a single internal deletion, but 2 different linkers (GGGGS2 and GAGAS2) for constructs with 2 internal deletions?

      With Gibson cloning, there are homology overhang arms for each PCR amplicon that are required to be specific for each overlap. Additionally, each PCR amplicon needs to be specific enough from one another so that all inserts (up to 5 in this manuscript) are included and oriented in the right order. The linker sequences were included in the homology arm overlaps, so the nucleotide sequences for each linker needed to be specific enough to include all inserts. This is a general rule to Gibson cloning. Additionally, both GGGGS2 and GAGAS2 are common linker sequences used in molecular biology and the amino acids structures are similar to one another, suggesting there is no functional difference between linkers.

      2) Line 704 - 705: In the figure legend, the authors stated that 'Constructs with a single black line have the linker GGGGS2 and constructs with two black lines have linkers with GGGGS2 and GAGAS2, respectively.'. This was not obvious in the figures.

      Constructs used for flow and genomics experiments that are depicted in Figure 2, Supplementary Figure 2, Figure 3, Figure 4, and Figure 5 have depicted black lines where deletions are present. Where these deletions are present, there are linkers in order to preserve spacing and mobility for the protein.

      3) Line 160 - Clusters #1 and #2 are likely written in the wrong order. It should have been "activating the majority of DUX targets in cluster #2, not cluster #1" and "failed to activate those in cluster #1, not cluster #2", based on the RNA-seq heatmap in Fig. 2f.

      We thank the reviewer for this comment, and the error has been corrected in the manuscript.

      4) Line 188 - Delete the word "of" in the following sentence fragment: "DUX binding sites correlating with the of transcriptional".

      Thanks – corrected.

      5) Line 191 - Delete the word "aids" in the following sentence fragment: "important for conferring H3K9ac aids at bound".

      Thanks – corrected.

      6) Line 711 - "C1-C3 a,b,d" should be "C1-C3 a,b,c".

      Thanks – corrected.

      7) Lines 711-712 - The colors "pink to blue" and "blue to pink" are likely written in the wrong order. Based on Fig. 2c, the blue to pink bar graphs should represent C1-C3 a,b,c in that order, and likewise the pink to blue bar graphs should represent C3-C1 a,b,c in that order.

      Thanks – corrected.

      8) There is an overload of data presented in Fig. 2c, such that it is difficult to follow which part of the figure represents each data segment as written in the figure legend. It is recommended that the data presented here is split into 2 sub-figures.

      Figure 2c has a supporting figure in Supplementary Figure 2b. While there is both a graphical depiction of the constructions and the data both in the main panel of Figure 2C, we have depicted it as so to be as clear as possible for the reader to interpret the complexity and presentence of amino acids in each of the constructs.

      9) Line 717 - "following" is misspelt.

      Thanks – corrected.

      10) Lines 720-721 - "(Top)" and "(Bottom)" should be replaced with "(Left)" and "(Right)", as the 2 bar graphs presented in Fig. 2d are placed side by side to each other, not on the top and bottom.

      Thanks – corrected.

      11) Lines 725 and 839 - "Principle" is misspelt. It should be "Principal".

      Thanks – corrected.

      12) In Figures 3d and 3e, the sample labeled "C3+14_1" should be re-labeled to "C3+14", in accordance with the other sub-figures. Additionally, for the sake of consistency, "aa" should be appended to the relevant constructs, e.g. "C3+14aa" and "C3Δ14aa".

      Thanks – corrected.

      13) Line 773 - Were the DUX domain constructs over-expressed for 12hr (as written in the figure legend) or 18hr (as labeled in Fig. 5d)?

      Thanks – corrected.

      14) Related to minor point 19 above, is there a reason/rationale for why some of the experiments used 12hr over-expression of DUX domain constructs (e.g. for CUT&TAG in Fig. 3), whereas in other experiments 18hr over-expression was chosen instead (e.g. flow cytometry for MERVL::GFP reporter in Figures 1 and 2, and co-IP validations of BirA*-DUX interactions in Fig. 4)?

      Thanks for the opportunity to explain. In this work, experiments that reported on proteins that are translated following DUX gene activation (e.g. MERVL:GFP via flow) were done at 18hr to allow for enough time for transcription and translation of GFP (or other DUX target genes). For experiments that report on the impact of DUX on chromatin and transcription, such as RNA-seq, CUT&Tag, and ATAC-seq, we induced DUX domain constructs for 12 hours.

      15) Line 804 - "ΔHDs" is missing between "C2345+14aa" and "ΔHD1".

      Thanks – corrected.

      16) In Fig. 5c, "Chromatin remodelers" is misspelt.

      Thanks – corrected.

      17) There is no reference in the manuscript to the proposed model that is presented in Fig. 6b.

      Thanks – corrected.

      Reviewer #3 (Recommendations For The Authors):

      Given the uncertainty of the function of the Dux peptide repeats in mice, could it not also be possible that the underlying repeated nature of the (coding) DNA? That is, could these DNA repeats exert a regulatory function on Dux transcription itself (also given the dire consequences of misregulated DUX4 expression as seen in FSHD, for example).

      Yes, it remains possible that the internal coding repeats within Dux are playing a role in locus regulation, and might be interesting to examine. However, we consider this question as being outside the scope of the current paper.

      Finally, it would be interesting to know whether these repeats are, in fact, present in all mouse species. Already no longer present in rat, do they exist, or not, in more "distant" mice, e.g. M. caroli?

      Determining whether all mouse strains contain C-terminal repeats in DUX is a question we also considered. However, Dux and its orthologs are present in long and very complex repeat arrays that are not present in the sequencing data or annotation in other mouse strains. Therefore, we are not unable to answer this question from existing sequencing data. Answering would require a considerable genome sequencing and bioinformatics effort, or alternatively a considerable effort aimed at cloning ortholog cDNAs from 2-cell embryos.

      Minor points:

      line 169: here it seems, in fact, that the 'inactive' C2, C4 repeats are more similar to each other (my calculation: 91 and 96% identity at the protein and DNA level, respectively) than the active C3 and C5 repeats (82 and 89% identity, resp.), the outlier being C1.

      Thanks for this comment, which was mentioned by other reviewers as well and has been addressed through new statistical analyses and interpretation (see new Figure S1d).

      line 191: I'm not sure this sentence parses correctly ("...14AA tail is important for conferring H3K9Ac aids at bound sites...")

      We thank the reviewer for this comment, and we have corrected the sentence in the manuscript.

    1. Author Response

      The following is the authors’ response to the original reviews.

      eLife assessment

      The authors have developed a compelling coarse-grained simulation approach for nucleosome-nucleosome interactions within a chromatin array. The data presented are solid and provide new insights that allow for predictions of how chromatin interactions might occur in vivo, but some of the claims should be tempered. The tools will be valuable for the chromosome biology field.

      Response: We want to thank the editors and all the reviewers for their insightful comments. We have made substantial changes to the manuscript to improve its clarity and temper necessary claims, as detailed in the responses, and we performed additional analyses to address the reviewers’ concerns. We believe that we have successfully addressed all the comments, and the quality of our paper has improved significantly.

      In the following, we provide point-to-point responses to all the reviewer comments. 

      RESPONSE TO REFEREE 1:

      Comment 0: This study develops and applies a coarse-grained model for nucleosomes with explicit ions. The authors perform several measurements to explore the utility of a coarse-grained simulation method to model nucleosomes and nucleosome arrays with explicit ions and implicit water. ’Explicit ions’ means that the charged ions are modeled as particles in simulation, allowing the distributions and dynamics of ions to be measured. Since nucleosomes are highly charged and modulated by charge modifications, this innovation is particularly relevant for chromatin simulation.

      Response: We thank the reviewer’s excellent summary of the work.

      Comment 1: Strengths: This simulation method produces accurate predictions when compared to experiments for the binding affinity of histones to DNA, counterion interactions, nucleosome DNA unwinding, nucleosome binding free energies, and sedimentation coefficients of arrays. The variety of measured quantities makes both this work and the impact of this coarse-grained methodology compelling. The comparison between the contributions of sodium and magnesium ions to nucleosome array compaction, presented in Figure 3, was exciting and a novel result that this simulation methodology can assess.

      Response: We appreciate the reviewer’s strong assessment of the paper’s significance, novelty, and broad interest, and we thank him/her for the detailed suggestions and comments.

      Comment 2: Weaknesses: The presentation of experimental data as representing in vivo systems is a simplification that may misrepresent the results of the simulation work. In vivo, in this context, typically means experimental data from whole cells. What one could expect for in vivo experimental data is measurements on nucleosomes from cell lysates where various and numerous chemical modifications are present. On the contrary, some of the experimental data used as a comparison are from in vitro studies. In vitro in this context means nucleosomes were formed ’in a test tube’ or under controlled conditions that do not represent the complexity of an in vivo system. The simulations performed here are more directly compared to in vitro conditions. This distinction likely impacts to what extent these simulation results are biologically relevant. In vivo and in vitro differences could be clarified throughout and discussed.

      Response: As detailed in Response to Comment 3, we have made numerous modifications in the Introduction, Results, and Discussion Section to emphasize the differences between reconstituted and native nucleosomes. The newly added texts also delve into the utilization of the interaction strength measured for reconstituted nucleosomes as a reference point for conceptualizing the interactions among native nucleosomes.

      Comment 3: In the introduction (pg. 3), the authors discuss the uncertainty of nucleosome-tonucleosome interaction strengths in vivo. For example, the authors discuss works such as Funke et al. However, Funke et al. used reconstituted nucleosomes from recombinant histones with one controlled modification (H4 acetylation). Therefore, this study that the authors discuss is measuring nucleosome’s in vitro affinity, and there could be significant differences in vivo due to various posttranslational modifications. Please revise the introduction, results section ”Close contacts drive nucleosome binding free energy,” and discussion to reflect and clarify the difference between in vitro and in vivo measurements. Please also discuss how biological variability could impact your findings in vivo. The works of Alexey Onufriev’s lab on the sensitivity of nucleosomes to charge changes (10.1016/j.bpj.2010.06.046, 10.1186/s13072-018-0181-5), such as some PTMs, are one potential starting place to consider how modifications alter nucleosome stability in vivo.

      Response: We thank the reviewer for the insightful comments and agree that native nucleosomes can differ from reconstituted nucleosomes due to the presence of histone modifications.

      We have revised the introduction to emphasize the differences between in vitro and in vivo nucleosomes. The new text now reads

      "The relevance of physicochemical interactions between nucleosomes to chromatin organization in vivo has been constantly debated, partly due to the uncertainty in their strength [cite]. Examining the interactions between native nucleosomes poses challenges due to the intricate chemical modifications that histone proteins undergo within the nucleus and the variations in their underlying DNA sequences [cite]. Many in vitro experiments have opted for reconstituted nucleosomes that lack histone modifications and feature wellpositioned 601-sequence DNA to simplify the chemical complexity. These experiments aim to establish a fundamental reference point for understanding the strength of interactions within native nucleosomes. Nevertheless, even with reconstituted nucleosomes, a consensus regarding the significance of their interactions remains elusive. For example, using force-measuring magnetic tweezers, Kruithof et al. estimated the inter-nucleosome binding energy to be ∼ 14 kBT [cite]. On the other hand, Funke et al. introduced a DNA origamibased force spectrometer to directly probe the interaction between a pair of nucleosomes [cite], circumventing any potential complications from interpretations of single molecule traces of nucleosome arrays. Their measurement reported a much weaker binding free energy of approximately 2 kBT. This large discrepancy in the reported reference values complicates a further assessment of the interactions between native nucleosomes and their contribution to chromatin organization in vivo."

      We modified the first paragraph of the results section to read

      "Encouraged by the explicit ion model’s accuracy in reproducing experimental measurements of single nucleosomes and nucleosome arrays, we moved to directly quantify the strength of inter-nucleosomes interactions. We once again focus on reconstituted nucleosomes for a direct comparison with in vitro experiments. These experiments have yielded a wide range of values, ranging from 2 to 14 kBT [cite]. Accurate quantification will offer a reference value for conceptualizing the significance of physicochemical interactions among native nucleosomes in chromatin organization in vivo."

      New text was added to the Discussion Section to emphasize the implications of simulation results for interactions among native nucleosomes.

      "One significant finding from our study is the predicted strong inter-nucleosome interactions under the physiological salt environment, reaching approximately 9 kBT. We showed that the much lower value reported in a previous DNA origami experiment is due to the restricted nucleosomal orientation inherent to the device design. Unrestricted nucleosomes allow more close contacts to stabilize binding. A significant nucleosome binding free energy also agrees with the high forces found in single-molecule pulling experiments that are needed for chromatin unfolding [cite]. We also demonstrate that this strong inter-nucleosomal interaction is largely preserved at longer nucleosome repeat lengths (NRL) in the presence of linker histone proteins. While posttranslational modifications of histone proteins may influence inter-nucleosomal interactions, their effects are limited, as indicated by Ding et al. [cite], and are unlikely to completely abolish the significant interactions reported here. Therefore, we anticipate that, in addition to molecular motors, chromatin regulators, and other molecules inside the nucleus, intrinsic inter-nucleosome interactions are important players in chromatin organization in vivo."

      The suggested references (10.1016/j.bpj.2010.06.046, 10.1186/s13072-018-0181-5) are now included as citations # 44 and 45.

      Comment 4: Due to the implicit water model, do you know if ions can penetrate the nucleosome more? For example, does the lack of explicit water potentially cause sodium to cluster in the DNA grooves more than is biologically relevant, as shown in Figure 1?

      Response: We thank the reviewer for the insightful comments. The parameters of the explicit-ion model were deduced from all-atom simulations and fine-tuned to replicate crucial aspects of the local ion arrangements around DNA (1). The model’s efficacy was demonstrated in reproducing the radial distribution function of Na+ and Mg2+ ion distributions in the proximity of DNA (see Author response image 1). Consequently, the number of ions near DNA in the coarse-grained models aligns with that observed in all-atom simulations, and we do not anticipate any significant, unphysical clustering. It is worth noting that previous atomistic simulations have also reported the presence of a substantial quantity of Na+ ions in close proximity to nucleosomal DNA (refer to Author response image 2).

      Author response image 1.

      Comparison between the radial distribution functions of Na+ (left) and Mg2+ (right) ions around the DNA phosphate groups computed from all-atom (black) and coarse-grained (red) simulations. Figure adapted from Figure 4 of Ref. 1. The coarse-grained explicit ion model used in producing the red curves is identical to the one presented in the current manuscript. (© 2011, AIP Publishing. This figure is reproduced with permission from Figure 4 in Freeman GS, Hinckley DM, de Pablo JJ (2011) A coarse-grain three-site-pernucleotide model for DNA with explicit ions. The Journal of Chemical Physics 135:165104. It is not covered by the CC-BY 4.0 license and further reproduction of this figure would need permission from the copyright holder.)

      Author response image 2.

      Three-dimensional distribution of sodium ions around the nucleosome determined from all-atom explicit solvent simulations. Darker blue colors indicate higher sodium density and high density of sodium ions around the DNA is clearly visible. The crystallographically identified acidic patch has been highlighted as spheres on the surface of the histone core and a high level of sodium condensation is observed around these residues. Figure adapted from Ref. 2. (© 2009, American Chemical Society. This figure is reproduced with permission from Figure 7 in Materese CK, Savelyev A, Papoian GA (2009) Counterion Atmosphere and Hydration Patterns near a Nucleosome Core Particle. J. Am. Chem. Soc. 131:15005–15013.. It is not covered by the CC-BY 4.0 license and further reproduction of this figure would need permission from the copyright holder.)

      Comment 5: Histone side chain to DNA interactions, such as histone arginines to DNA, are essential for nucleosome stability. Therefore, can the authors provide validation or references supporting your model of the nucleosome with one bead per amino acid? I would like to see if the nucleosomes are stable in an extended simulation or if similar dynamic motions to all-atom simulations are observed.

      Response: The nucleosome model, which employs one bead per amino acid and lacks explicit ions, has undergone extensive calibration and has found application in numerous prior studies. For instance, the de Pablo group utilized a similar model to showcase its ability to accurately replicate the experimentally measured nucleosome unwinding free energy penalty (3), sequence-dependent nucleosome sliding (4), and the interaction between two nucleosomes (5). Similarly, the Takada group employed a comparable model to investigate acetylation-modulated tri-nucleosome structures (6), chromatin structures influenced by chromatin factors (7), and nucleosome sliding (8). Our group also employed this model to study the structural rearrangement of a tetranucleosome (9) and the folding of larger chromatin systems (10). In cases where data were available, simulations frequently achieved quantitative reproduction of experimental results.

      We added the following text to the manuscript to emphasize previous studies that validate the model accuracy.

      "We observe that residue-level coarse-grained models have been extensively utilized in prior studies to examine the free energy penalty associated with nucleosomal DNA unwinding [cite], sequence-dependent nucleosome sliding [cite], binding free energy between two nucleosomes [cite], chromatin folding [cite], the impact of histone modifications on tri-nucleosome structures [cite], and protein-chromatin interactions [cite]. The frequent quantitative agreement between simulation and experimental results supports the utility of such models in chromatin studies. Our introduction of explicit ions, as detailed below, further extends the applicability of these models to explore the dependence of chromatin conformations on salt concentrations."

      We agree that arginines are important for nucleosome stability. Since we assign positive charges to these residues, their contribution to DNA binding can be effectively captured. The model’s ability in reproducing nucleosome stability is supported by the good agreement between the simulated free energy penalty associated with nucleosomal DNA unwinding and experimental value estimated from single molecule experiments (Figure 1).

      To further evaluate nucleosome stability in our simulations, we conducted a 200-ns-long simulation of a nucleosome featuring the 601-sequence under physiological salt conditions– 100 mM NaCl and 0.5 mM MgCl2, consistent with the conditions in Figure 1 of the main text. We found that the nucleosome maintains its overall structure during this simulation. The nucleosome’s radius of gyration (Rg) remained proximate to the value corresponding to the PDB structure (3.95 nm) throughout the entire simulation period (see Author response image 3).

      Author response image 3.

      Time trace of the radius of gyration (Rg) of a nucleosome with the 601-sequence along an unbiased, equilibrium trajectory. It is evident the Rg fluctuates around the value found in the PDB structure (3.95 nm), supporting the stability of the nucleosome in our simulation.

      Occasional fluctuations in Rg corresponded to momentary, partial unwrapping of the nucleosomal DNA, a phenomenon observed in single-molecule experiments. However, we advise caution due to the coarse-grained nature of our simulations, which prevents a direct mapping of simulation timescale to real time. Importantly, the rate of DNA unwrapping in our simulations is notably overestimated.

      It’s plausible that coarse-grained models, lacking side chains, might underestimate the barrier for DNA sliding along the nucleosome. Specifically, our model, without differentiation between interactions among various amino acids and nucleotides, accurately reproduces the average nucleosomal DNA binding affinity but may not capture the energetic variations among binding interfaces. Since sliding’s contribution to chromatin organization is minimal due to the use of strongly positioning 601 sequences, we imposed rigidity on the two nucleotides situated at the dyad axis to prevent nucleosomal DNA sliding. In future studies, enhancing the calibration of protein-DNA interactions to achieve improved sequence specificity would be an intriguing avenue. To underscore this limitation of the model, we have included the following text in the discussion section of the main text.

      "Several aspects of the coarse-grained model presented here can be further improved. For instance, the introduction of specific protein-DNA interactions could help address the differences in non-bonded interactions between amino acids and nucleotides beyond electrostatics [cite]. Such a modification would enhance the model’s accuracy in predicting interactions between chromatin and chromatin-proteins. Additionally, the single-bead-per-amino-acid representation used in this study encounters challenges when attempting to capture the influence of histone modifications, which are known to be prevalent in native nucleosomes. Multiscale simulation approaches may be necessary [cite]. One could first assess the impact of these modifications on the conformation of disordered histone tails using atomistic simulations. By incorporating these conformational changes into the coarse-grained model, systematic investigations of histone modifications on nucleosome interactions and chromatin organization can be conducted. Such a strategy may eventually enable the direct quantification of interactions among native nucleosomes and even the prediction of chromatin organization in vivo."

      Comment 6: The solvent salt conditions vary in the experimental reference data for internucleosomal interaction energies. The authors note, for example, that the in vitro data from Funke et al. differs the most from other measurements, but the solvent conditions are 35 mM NaCl and 11 mM MgCl2. Since this simulation method allows for this investigation, could the authors speak to or investigate if solvent conditions are responsible for the variability in experimental reference data? The authors conclude on pg. 8-9 and Figure 4 that orientational restraints in the DNA origami methodology are responsible for differences in interaction energy. Can the authors rule out ion concentration contributions?

      Response: We thank the reviewer for the insightful comment. We would like to clarify that the black curve presented in Figure 4B of the main text was computed using the salt concentration specified by Funke et al. (35 mM NaCl and 11 mM MgCl2). Furthermore, there were no restraints placed on nucleosome orientations during these calculations. Consequently, the results in Figure 4B can be directly compared with the black curve in Figure 5C. The data in Figure 5C were calculated under physiological salt conditions (150 mM NaCl and 2 mM MgCl2), which are the standard solvent salt conditions used in most studies. It is worth noting that the free energy of nucleosome binding is significantly higher at the salt concentration employed by Funke et al. (14 kBT) than the value at the physiological salt condition (9 kBT). Therefore, comparing the results in Figure 4B and 5C eliminates ion concentration conditions as a potential cause for the the almost negligible result reported by Funke et al.

      Comment 7: In the discussion on pg. 12 residual-level should be residue-level.

      Response: We apologize for the oversight and have corrected the grammatical error in our manuscript.

      RESPONSE TO REFEREE 2:

      Comment 0: In this manuscript, the authors introduced an explicit ion model using the coarse-grained modelling approach to model the interactions between nucleosomes and evaluate their effects on chromatin organization. The strength of this method lies in the explicit representation of counterions, especially divalent ions, which are notoriously difficult to model. To achieve their aims and validate the accuracy of the model, the authors conducted coarse-grained molecular dynamics simulations and compared predicted values to the experimental values of the binding energies of protein-DNA complexes and the free energy profile of nucleosomal DNA unwinding and inter-nucleosome binding. Additionally, the authors employed umbrella sampling simulations to further validate their model, reproducing experimentally measured sedimentation coefficients of chromatin under varying salt concentrations of monovalent and divalent ions.

      Response: We thank the reviewer’s excellent summary of the work.

      Comment 1: The significance of this study lies in the authors’ coarse-grained model which can efficiently capture the conformational sampling of molecules while maintaining a low computational cost. The model reproduces the scale and, in some cases, the shape of the experimental free energy profile for specific molecule interactions, particularly inter-nucleosome interactions. Additionally, the authors’ method resolves certain experimental discrepancies related to determining the strength of inter-nucleosomal interactions. Furthermore, the results from this study support the crucial role of intrinsic physicochemical interactions in governing chromatin organization within the nucleus.

      Response: We appreciate the reviewer’s strong assessment of the paper’s significance, novelty, and broad interest, and we thank him/her for the detailed suggestions and comments.

      Comment 2: The method is simple but can be useful, given the authors can provide more details on their ion parameterization. The paper says that parameters in their ”potentials were tuned to reproduce the radial distribution functions and the potential of mean force between ion pairs determined from all-atom simulations.” However, no details on their all-atom simulations were provided; at some point, the authors refer to Reference 67 which uses all-atom simulations but does not employ the divalent ions. Also, no explanation is given for their modelling of protein-DNA complexes.

      Response: We appreciate the reviewer’s suggestion on clarifying the parameterization of the explicition model. The parameterization was not carried out in reference 67 nor by us, but by the de Pablo group in citation 53. Specifically, ion potentials were parameterized to fit the potential of mean force between both monovalent and divalent ion pairs, calculated either from all-atom simulations or from the literature. The authors carried out extensive validations of the model parameters by comparing the radial distribution functions of ions computed using the coarse-grained model with those from all-atom simulations. Good agreements between coarse-grained and all-atom results ensure that the parameters’ accuracy in reproducing the local structures of ion interactions.

      To avoid confusion, we have revised the text from:

      "Parameters in these potentials were tuned to reproduce the radial distribution functions and the potential of mean force between ion pairs determined from all-atom simulations."

      to

      "Parameters in these potentials were tuned by Freeman et al. [cite] to reproduce the radial distribution functions and the potential of mean force between ion pairs determined from all-atom simulations."

      We modified the Supporting Information at several places to clarify the setup and interpretation of protein-DNA complex simulations.

      For example, we clarified the force fields used in these simulation with the following text

      "All simulations were carried out using the software Lammps [cite] with the force fields defined in the previous two sections."

      We added details on the preparation of these simulations as follows

      "We carried out a series of umbrella-sampling simulations to compute the binding free energies of a set of nine protein-DNA complexes with experimentally documented binding dissociation constants [cite]. Initial configurations of these simulations were prepared using the crystal structures with the corresponding PDB IDs listed in Fig. S1."

      We further revised the caption of Figure S1 (included as Author response image 4) to facilitate the interpretation of simulation results.

      Author response image 4.

      The explicit-ion model predicts the binding affinities of protein-DNA complexes well, related to Fig. 1 of the main text. Experimental and simulated binding free energies are compared for nine protein-DNA complexes [cite], with a Pearson Correlation coefficient of 0.6. The PDB ID for each complex is indicated in red, and the diagonal line is drawn in blue. The significant correlation between simulated and experimental values supports the accuracy of the model. To further enhance the agreement between the two, it will be necessary to implement specific non-bonded interactions that can resolve differences among amino acids and nucleotides beyond simple electrostatics. Such modifications will be interesting avenues for future research. See text Section: Binding free energy of protein-DNA complexes for simulation details.

      Comment 3: Overall, the paper is well-written, concise and easy to follow but some statements are rather blunt. For example, the linker histone contribution (Figure 5D) is not clear and could be potentially removed. The result on inter-nucleosomal interactions and comparison to experimental values from Ref#44 is the most compelling. It would be nice to see if the detailed shape of the profile for restrained inter-nucleosomal interactions in Figure 4B corresponds to the experimental profile. Including the dependence of free energy on a vertex angle would also be beneficial.

      Response: We thank the reviewer for the comments and agree that the discussion on linker histone results was brief. However, we believe the results are important and demonstrate our model’s advantage over mesoscopic approaches in capturing the impact of chromatin regulators on chromatin organization.

      Therefore, instead of removing the result, we expanded the text to better highlight its significance, to help its comprehension, and to emphasize its biological implications. The image in Figure 5D was also redesigned to better visualize the cross contacts between nucleosomes mediated by histone H1. The added texts are quoted as below, and the new Figure 5 is included.

      Author response image 5.

      Revised main text Figure 5, with Figure 5D modified for improved visual clarity.

      "Importantly, we found that the weakened interactions upon extending linker DNA can be more than compensated for by the presence of histone H1 proteins. This is demonstrated in Fig. 5C and Fig. S8, where the free energy cost for tearing part two nucleosomes with 167 bp DNA in the presence of linker histones (blue) is significantly higher than the curve for bare nucleosomes (red). Notably, at larger inter-nucleosome distances, the values even exceed those for 147 bp nucleosomes (black). A closer examination of the simulation configurations suggests that the disordered C-terminal tail of linker histones can extend and bind the DNA from the second nucleosome, thereby stabilizing the internucleosomal contacts (as shown in Fig. 5D). Our results are consistent with prior studies that underscore the importance of linker histones in chromatin compaction [cite], particularly in eukaryotic cells with longer linker DNA [cite]."

      We further compared the simulated free energy profile, depicting the center of mass distance between nucleosomes, with the experimental profile, as depicted in Author response image 6. The agreement between the simulated and experimental results is evident. The nuanced features observed between 60 to 80 Ain the simulated profile stem from DNA unwinding˚ to accommodate the incoming nucleosome, creating a small energy barrier. It’s worth noting that such unwinding is unlikely to occur in the experimental setup due to the hybridization method used to anchor nucleosomes onto the DNA origami. Moreover, our simulation did not encompass configurations below 60 A, resulting in a lack of data in˚ that region within the simulated profile.

      We projected the free energy profile onto the vertex angle of the DNA origami device, utilizing the angle between two nucleosome faces as a proxy. Once more, the simulated profile demonstrates reasonable agreement with the experimental data (Author response image 6). Author response image 6 has been incorporated as Figure S4 in the Supporting Information.

      Author response image 6.

      Explicit ion modeling reproduces the experimental free energy profiles of nucleosome binding. (A) Comparison between the simulated (black) and experimental (red) free energy profile as a function of the inter-nucleosome distance. Error bars were computed as the standard deviation of three independent estimates. The barrier observed between 60A and 80˚ A arises from the unwinding of nucleosomal DNA when the two nu-˚ cleosomes are in close proximity, as highlighted in the orange circle. (B) Comparison between the simulated (black) and experimental (red) free energy profile as a function of the vertex angle. Error bars were computed as the standard deviation of three independent estimates. (C) Illustration of the vertex angle Φ used in panel (B).

      Comment 4: Another limitation of this study is that the authors’ model sacrifices certain atomic details and thermodynamic properties of the modelled systems. The potential parameters of the counter ions were derived solely by reproducing the radial distribution functions (RDFs) and potential of mean force (PMF) based on all-atom simulations (see Methods), without considering other biophysical and thermodynamic properties from experiments. Lastly, the authors did not provide any examples or tutorials for other researchers to utilize their model, thus limiting its application.

      Response: We agree that residue-level coarse-grained modeling indeed sacrifices certain atomistic details. This sacrifice can be potentially limiting when studying the impact of chemical modifications, especially on histone and DNA methylations. We added a new paragraph in the Discussion Section to point out such limitations and the relevant text is quoted below.

      "Several aspects of the coarse-grained model presented here can be further improved. For instance, the introduction of specific protein-DNA interactions could help address the differences in non-bonded interactions between amino acids and nucleotides beyond electrostatics [cite]. Such a modification would enhance the model’s accuracy in predicting interactions between chromatin and chromatin-proteins. Additionally, the single-bead-per-amino-acid representation used in this study encounters challenges when attempting to capture the influence of histone modifications, which are known to be prevalent in native nucleosomes. Multiscale simulation approaches may be necessary [cite]. One could first assess the impact of these modifications on the conformation of disordered histone tails using atomistic simulations. By incorporating these conformational changes into the coarse-grained model, systematic investigations of histone modifications on nucleosome interactions and chromatin organization can be conducted. Such a strategy may eventually enable the direct quantification of interactions among native nucleosomes and even the prediction of chromatin organization in vivo."

      Nevertheless, it’s important to note that while the model sacrifices accuracy, it compensates with superior efficiency. Atomistic simulations face significant challenges in conducting extensive free energy calculations required for a quantitative evaluation of ion impacts on chromatin structures.

      The explicit ion model, introduced by the de Pablo group, follows a standard approach adopted by other research groups, such as the parameterization of ion models using the potential of mean force from atomistic simulations (11; 12). According to multiscale coarse-graining theory, reproducing potential mean force (PMF) enables the coarsegrained model to achieve thermodynamic consistency with the atomistic model, ensuring identical statistical properties derived from them. However, it’s crucial to recognize that an inherent limitation of such approaches is their dependence on the accuracy of atomistic force fields in reproducing thermodynamic properties from experiments, as any inaccuracies in the atomistic force fields will similarly affect the resulting coarse-grained (CG) model.

      We have provided the implementation of CG model and detailed instructions on setting up and performing simulations GitHub repository. Examples include simulation setup for a protein-DNA complex and for a nucleosome with the 601-sequence.

      References [1] Freeman GS, Hinckley DM, de Pablo JJ (2011) A coarse-grain three-site-pernucleotide model for DNA with explicit ions. The Journal of Chemical Physics 135:165104.

      [2] Materese CK, Savelyev A, Papoian GA (2009) Counterion Atmosphere and Hydration Patterns near a Nucleosome Core Particle. J. Am. Chem. Soc. 131:15005–15013.

      [3] Lequieu J, Cordoba A, Schwartz DC, de Pablo JJ´ (2016) Tension-Dependent Free Energies of Nucleosome Unwrapping. ACS Cent. Sci. 2:660–666.

      [4] Lequieu J, Schwartz DC, De Pablo JJ (2017) In silico evidence for sequence-dependent nucleosome sliding. Proc. Natl. Acad. Sci. U.S.A. 114.

      [5] Moller J, Lequieu J, de Pablo JJ (2019) The Free Energy Landscape of Internucleosome Interactions and Its Relation to Chromatin Fiber Structure. ACS Cent. Sci. 5:341–348.

      [6] Chang L, Takada S (2016) Histone acetylation dependent energy landscapes in trinucleosome revealed by residue-resolved molecular simulations. Sci Rep 6:34441.

      [7] Watanabe S, Mishima Y, Shimizu M, Suetake I, Takada S (2018) Interactions of HP1 Bound to H3K9me3 Dinucleosome by Molecular Simulations and Biochemical Assays. Biophysical Journal 114:2336–2351.

      [8] Brandani GB, Niina T, Tan C, Takada S (2018) DNA sliding in nucleosomes via twist defect propagation revealed by molecular simulations. Nucleic Acids Research 46:2788–2801.

      [9] Ding X, Lin X, Zhang B (2021) Stability and folding pathways of tetra-nucleosome from six-dimensional free energy surface. Nat Commun 12:1091.

      [10] Liu S, Lin X, Zhang B (2022) Chromatin fiber breaks into clutches under tension and crowding. Nucleic Acids Research 50:9738–9747.

      [11] Savelyev A, Papoian GA (2010) Chemically accurate coarse graining of doublestranded DNA. Proc. Natl. Acad. Sci. U.S.A. 107:20340–20345.

      [12] Noid WG (2013) Perspective: Coarse-grained models for biomolecular systems. The Journal of Chemical Physics 139:090901.

    1. eLife Assessment

      This manuscript develops a theoretical model of osmotic pressure adaptation in microbes by osmolyte production and wall synthesis. The prediction of a rapid increase in growth rate on osmotic shock is experimentally validated using fission yeast. By using phenomenological rules rather than detailed molecular mechanisms, the model can potentially apply to a wide range of microbes, providing important insights that would be of interest to the wider community studying the regulation of cell size and mechanics. The level of coarse-graining and the assumptions and limitations of the model have been well described, providing a convincing foundation for making predictions. However, further experimental work on the validity of the core assumptions across a range of microbial organisms is needed to assess the universality of the model.

    2. Reviewer #1 (Public review):

      Summary:

      A theoretical model for microbial osmoresponse was proposed. The model assumes simple phenomenological rules: (i) the change of free water volume in the cell due to osmotic imbalance based on pressure balance, (ii) Osmoregulation that assumes change of the proteome partitioning depending on the osmotic pressure that affects the osmolyte-producing protein production, (iii) The cell-wall synthesis regulation where the change of the turgor pressure to the cell-wall synthesis efficiency to go back to the target turgor pressure, (iv) Effect of Intracellular crowding assuming that the biochemical reactions slows down for more crowding and stops when the protein density (protein mass divided by free water volume) reaches a critical value. The parameter values were found in the literature or obtained by fitting to the experimental data. The authors compare the model behavior with various microorganismcs (E. coli, B. subtils, S. Cerevisiae, S. pombe), and successfully reproduced the overall trend (steady state behavior for many of them, dynamics for S. pombe). In addition, the model predicts non-trivial behavior such as the fast cell growth just after the hypoosmotic shock, which is consistent with experimental observation. The authors further make experimentally testable predictions regarding mutant behavior and transient dynamics.

      The theory assumes simple mechanistic dependence between core variables without going into specific molecular mechanisms of regulations. The simplicity allows the theory to apply to different organisms by adjusting the time scales with parameters, and the model successfully explains broad classes of observed behaviours. Mathematically, the model provides analytical expressions of the parameter dependencies and an understanding of the dynamics through the phase space without being buried in the detail. This theory can serve as a base to discuss the universality and diversity of microbial osmoresponse.

      The coarse-grained nature of the model is the strength of the model in terms of its generality. However, it does not consider various regulations at the molecular level. Hence, certain adaptation features are not considered in the current version of the model. The updated manuscript discusses the pros and cons of the current approach.

    3. Reviewer #2 (Public review):

      Summary:

      In this study, Ye et al. have developed a theoretical model of osmotic pressure adaptation by osmolyte production and wall synthesis.

      Strengths:

      They validate their model predictions of a rapid increase in growth rate on osmotic shock experimentally using fission yeast. The study has several interesting insights which are of interest to the wider community of cell size and mechanics.

      Comments on revisions:

      The authors have in the revised manuscript addressed the aspects of the writing that were unclear. , that are listed previously as major and minor comments. We believe the issues raised by this reviewer have been adequately addressed in the manuscript.

    4. Author response:

      The following is the authors’ response to the original reviews

      List of major changes

      (1) We have emphasized the assumptions underlying our modeling approach in the third paragraph of the Introduction section.

      (2) We have included a new paragraph in the Discussion section to compare our model with a molecular mechanism-oriented model.

      (3) We have included a new paragraph at the end of the Introduction section to outline the main content of each subsection in Results and the logical connections between them. Correspondingly, the chapter hierarchy and section titles have been adjusted.

      (4) The Supplementary Material includes an additional table (Table S2) that provides detailed explanations of the symbols used in the model.

      (5) We have included a new paragraph in the Introduction section to explicitly emphasize the phenomenological nature of our model and its broad applicability.

      (6) In the Osmoregulation subsection, we have added a discussion on how our model can be directly generalized to scenarios involving the environmental uptake of osmolytes.

      (7) We have included a more detailed examination of the limitations inherent in our modeling approach in the second last paragraph of the Discussion section.

      (8) In the third last paragraph of the Discussion section, we have explicitly demonstrated that our model does not conflict with the observation that, in E. coli, cell wall synthesis is not directly regulated by the turgor pressure.

      Reviewer #1 (Public review):

      Summary:

      A theoretical model for microbial osmoresponse was proposed. The model assumes simple phenomenological rules: (i) the change of free water volume in the cell due to osmotic imbalance based on pressure balance, (ii) osmoregulation that assumes change of the proteome partitioning depending on the osmotic pressure that affects the osmolyte-producing protein production, (iii) the cell-wall synthesis regulation where the change of the turgor pressure to the cell-wall synthesis efficiency to go back to the target turgor pressure, (iv) effect of Intracellular crowding assuming that the biochemical reactions slow down for more crowding and stops when the protein density (protein mass divided by free water volume) reaches a critical value. The parameter values were found in the literature or obtained by fitting to the experimental data. The authors compare the model behavior with various microorganisms (E. coli, B. subtils, S. Cerevisiae, S. pombe), and successfully reproduced the overall trend (steady state behavior for many of them, dynamics for S. pombe). In addition, the model predicts non-trivial behavior such as the fast cell growth just after the hypoosmotic shock, which is consistent with experimental observation. The authors further make experimentally testable predictions regarding mutant behavior and transient dynamics.

      Strength:

      The theory assumes simple mechanistic dependence between core variables without going into specific molecular mechanisms of regulations. The simplicity allows the theory to apply to different organisms by adjusting the time scales with parameters, and the model successfully explains broad classes of observed behaviors. Mathematically, the model provides analytical expressions of the parameter dependences and an understanding of the dynamics through the phase space without being buried in the detail. This theory can serve as a base to discuss the universality and diversity of microbial osmoresponse.

      We would like to thank Reviewer 1 for thoroughly reading our work and appreciating our theoretical approach to investigating microbial osmotic response.

      Weakness:

      The core part of this model is that everything is coupled with growth physiology, and, as far as I understand, the assumption (iv) (Eq. 8) that imposes the global reaction rate dependence on crowding plays a crucial role. I would think this is a strong and interesting assumption. However, the abstract or discussion does not discuss the importance of this assumption. In addition, the paper does not discuss gene regulation explicitly, and some comparison with a molecular mechanismoriented model may be beneficial to highlight the pros and cons of the current approach

      We thank Reviewer 1 for their very helpful feedback. We have significantly revised the manuscript as suggested by Reviewer 1. See the detailed answers in the following.

      Reviewer #1 (Recommendations for the authors)

      (1) Explicitly stating the assumption (iv) in the abstract and discussing its role would help readers understand.

      In the revised manuscript, we have significantly rewritten the third paragraph of the Introduction section to emphasize our key assumptions as suggested by Reviewer 1, including the relationship between global reaction rate and crowding:

      “Our model assumes the following phenomenological rules: (1) the change in free water volume within the cell is driven by osmotic imbalance (Cadart et al., Nature Physics, 2019; Rollin et al., Elife, 2023), while the remaining volume changes in proportion to protein production; (2) osmoregulation influences the production of osmolyte-producing protein, governed by intracellular protein density (Scott et al., Science, 2010); (3) cell-wall synthesis is regulated through a feedback mechanism, wherein turgor pressure modulates the efficiency of cell-wall synthesis, enabling the cell to maintain a relatively stable turgor pressure; and (4) intracellular crowding slows down biochemical reactions as cytoplasmic density increases, with reactions ceasing entirely when protein density reaches a critical threshold.”

      We have also modified the abstract to mention the crowding effects explicitly. Additionally, we have added a few sentences in the first and second paragraphs of the Discussion section to emphasize the importance of crowding effects to our conclusions regarding the growth rate reduction in steady states and the non-monotonic dependence of the growth rate peak on the shock amplitude after a hyperosmotic shock.

      (2) I found [Shen W , Gao Z, Chen K, Zhao A, Ouyang Q, Luo C. The regulatory mechanism of the yeast osmoresponse under different glucose concentrations. Iscience. 2023 Jan 20;26(1)], which discusses the medium glucose concentration dependence of the response, focused on the gene regulatory circuit and the metabolic flux. As far as I understood, this paper considers the effect of the reallocation of resources but not the mechanical part of the osmoresponse such as pressure explicitly. It will be interesting to discuss the pros and cons in comparison with such a model. In principle, I will not be surprised if the current model does not differentiate the different glucose concentrations much since it is a more coarse-grained model, and I don't think it is a problem, but it will be good to have an explicit discussion.

      We appreciate Reviewer 1's insightful comment regarding the work by Shen et al. (iScience, 2023), which elucidates the two distinct osmoresponse strategies in yeast. By quantifying Hog1 nuclear translocation dynamics and downstream protein expression, the study reveals that in a rich medium, cells can leverage surplus glycolytic products as defensive reserves, reallocating metabolic flux to facilitate rapid adaptation to osmotic changes. Conversely, limited glycolytic intermediates in low-glucose environments necessitate increased enzyme synthesis for osmotic adaptation. 

      The paper highlighted by Reviewer 1 studies yeast's adaptive strategies under two stresses— nutrient limitation and osmotic pressure and provides an important complement to our study.

      In our simplified model, we did not include the interaction between cell growth and osmolyte production, assuming a constant fraction of ribosomes translating ribosomal proteins, supported by the experiments of E. coli (Dai et al., mBio, 2018). We remark that incorporating competitive dynamics for translational resources into our framework can be achieved by modifying the proportion of ribosomes translating themselves (X<sub>r</sub>), from a constant to a function related to the translation strategy of the osmolyte-producing enzyme ((X<sub>a</sub>).

      In the revised manuscript, we have included a new discussion in the third paragraph of the Discussion section to compare our approach with the molecular mechanism-oriented model:

      “We remark that our model is intrinsically a coarse-grained model with many molecular details regarding gene expression regulation neglected, which allows us to gain more analytical insights. In [Shen et al., iScience, 2023], the authors studied the responses to osmotic stress in glucose-limited environments and found that cells exhibited stronger osmotic gene expression response under glucose-limited conditions than under glucose-rich conditions. Using a computational model based on molecular mechanisms combined with experimental measurements, the authors demonstrated that in a glucose-limited environment, glycolysis intermediates were limited, which required cells to express more glycerol-production enzymes for stress adaptation. In the current version of our model, we do not account for the interaction between cell growth and osmolyte production; instead, we assume a constant fraction of ribosomes dedicated to translating ribosomal proteins. Our model can be further generalized to include the more complex interactions, including the coupling between biomass and osmolyte production, e.g., by allowing the fraction of ribosomes translating ((X<sub>r</sub>) to depend on the translation strategy of the osmolyte-producing enzyme ((X<sub>a</sub>).”

      (3) A minor comment: The authors call assumption (iii) (eq. 7) "positive feedback from turgor pressure to the cell-wall synthesis efficiency" (line 204). I have a hard time seeing this as positive feedback. It regulates the cell wall synthesis so that turgor pressure returns to the desired value; hence, isn't it negative feedback?

      We apologize for this confusion. We have removed the term "positive feedback" in the revised manuscript.

      Reviewer #2 (Public review):

      Summary:

      In this study, Ye et al. have developed a theoretical model of osmotic pressure adaptation by osmolyte production and wall synthesis.

      Strengths:

      They validate their model predictions of a rapid increase in growth rate on osmotic shock experimentally using fission yeast. The study has several interesting insights which are of interest to the wider community of cell size and mechanics.

      Weaknesses:

      Multiple aspects of this manuscript require addressing, in terms of clarity and consistency with previous literature. The specifics are listed as major and minor comments.

      Major comments:

      (1) The motivation for the work is weak and needs more clarity.

      We thank Reviewer 2 for this very helpful comment, which we believe has significantly improved our manuscript. We would like to clarify the two major motivations of our study. 

      First, we aim to construct a systems-level and coarse-grained model capable of elucidating the complex processes underlying microbial osmoresponse. By leveraging the separation of timescales associated with mechanical equilibrium, cell-wall synthesis regulation, and osmoregulation, our model facilitates in-depth analytical and numerical analysis of how these various processes interact during cellular adaptation. In particular, we demonstrate the key physiological functions of osmoregulation and cell-wall synthesis regulation.

      Second, we seek to apply this model to interpret the phenomenon of supergrowth observed in fission yeast Schizosaccharomyces pombe (Knapp et al., Cell Systems, 2019). This application addresses an essential challenge in experimental studies: exclusive knockout experiments can be difficult, and mechanistic interpretations of experimental observations are often lacking. Our theoretical framework offers a valuable tool for understanding such phenomena, contributing to the fundamental knowledge of microbial physiology and developing predictive models for microbial behavior under osmotic stress.

      In the revised manuscript, we have included a new paragraph at the end of the Discussion section to emphasize our motivations better:

      “In this work, we construct a systems-level and coarse-grained model capable of elucidating the complex processes underlying microbial osmoresponse. By leveraging the separation of timescales associated with mechanical equilibrium, cell-wall synthesis regulation, and osmoregulation, our model facilitates in-depth analytical and numerical analysis of how these various processes interact during cellular adaptation. In particular, we demonstrate the key physiological functions of osmoregulation and cell-wall synthesis regulation. We then apply this model to interpret the unusual phenomenon of supergrowth observed in fission yeast. This application addresses an essential challenge in experimental studies: exclusive knockout experiments can be difficult, and mechanistic interpretations of experimental observations are often lacking. Our theoretical framework offers a valuable tool for understanding such phenomena, contributing to the fundamental knowledge of microbial physiology and developing predictive models for microbial behavior under osmotic stress.”

      (2) The link between sections is very frequently missing. The authors directly address the problem that they are trying to solve without any motivation in the results section.

      We are grateful to Reviewer 2 for their valuable feedback. In the revised manuscript, we have included a new paragraph at the end of the Introduction section to outline the main content of each subsection in Results and the logical connections between them:

      “In the following “Results” section, we begin by outlining the primary assumptions and equations of our model in the subsection "Model Description," which includes four parts, each addressing one of the four phenomenological rules. Additional details can be found in Methods. We then proceed to the subsection “Steady states in constant environments”, where we employ our theoretical framework to analyze steady-state growth and examine how the growth rate varies with external osmolarity. In the “Transient dynamics after a constant osmotic shock” subsection, we investigate the time-dependent osmoresponse after a constant hyperosmotic and hypoosmotic shock. Finally, in “Comparison with experiments: supergrowth phenomena after osmotic oscillation”, we address the supergrowth phenomena observed in S. pombe, utilizing our model to elucidate these experimental observations.”

      (3) The parameters used in the models (symbols) need to be explained better to make the paper more readable.

      We apologize for this confusion. In the revised Supplementary Material, we have included an additional table (Table S2) to explain the meanings of the symbols employed in the model to help the reader better understand.

      (4) Throughout the paper, the authors keep switching between organisms that they are modelling. There needs to be some consistency in this aspect where they mention what organism they are trying to model, since some assumptions that they make may not be valid for both yeast as well as bacteria.

      We thank Reviewer 2 for this very helpful comment. We would like to clarify that our model is coarse-grained without including detailed molecular mechanisms; therefore, it presumably applies to various species of microorganisms. Indeed, the predicted steady-state growth curves derived from our model and the experimental data obtained from various organisms agree reasonably well (Figure 2A of the main text). 

      In the revised manuscript, we have explicitly emphasized the nature of our phenomenological model and its broad applicability in the fourth paragraph of the Introduction section:

      “We remark that our model is coarse-grained, without including detailed molecular mechanisms, and is therefore applicable across diverse microbial species. Notably, the predicted steady-state growth rate as a function of internal osmotic pressure from our model aligns well with experimental data from diverse organisms. This alignment allows us to quantify the sensitivities of translation speed and regulation of osmolyte-producing protein in response to intracellular density. Additionally, we demonstrate that osmoregulation and cellwall synthesis regulation enable cells to adapt to a wide range of external osmolarities and prevent plasmolysis. Our model also predicts a non-monotonic time dependence of growth rate and protein density as they approach steady-state values following a constant osmotic shock, in concert with experimental observations (Rojas et al., PNAS, 2014; Rojas et al., Cell systems, 2017). Moreover, we show that a supergrowth phase can arise following a sudden decrease in external osmolarity, driven by cell-wall synthesis regulation, either through the direct application of a hypoosmotic shock or the withdrawal of an oscillatory stimulus. Remarkably, the predicted amplitudes of supergrowth (i.e., growth rate peaks) quantitatively agree with multiple independent experimental measurements.”

      Furthermore, we have also included a comparison with a detailed molecular mechanism model in the third paragraph of the Discussion section:

      “We remark that our model is intrinsically a coarse-grained model with many molecular details regarding gene expression regulation neglected, which allows us to gain more analytical insights. In [Shen et al., iScience, 2023], the authors studied the responses to osmotic stress in glucose-limited environments and found that cells exhibited stronger osmotic gene expression response under glucose-limited conditions than under glucose-rich conditions. Using a computational model based on molecular mechanisms combined with experimental measurements, the authors demonstrated that in a glucose-limited environment, glycolysis intermediates were limited, which required cells to express more glycerol-production enzymes for stress adaptation. In the current version of our model, we do not account for the interaction between cell growth and osmolyte production; instead, we assume a constant fraction of ribosomes dedicated to translating ribosomal proteins. Our model can be further generalized to include the more complex interactions, including the coupling between biomass and osmolyte production, e.g., by allowing the fraction of ribosomes translating ((X<sub>r</supb) to depend on the translation strategy of the osmolyte-producing enzyme ((X<sub>a</sub>).”

      (5) The extent of universality of osmoregulation i.e the limitations are not very well highlighted.

      The osmoregulation mechanism described in our model primarily addresses changes in cytoplasmic osmolarity through the de-novo synthesis of compatible solutes, widely observed across bacteria, archaea, and eukaryotic microorganisms. This review article (GundeCimerman et al., FEMS microbiology reviews, 2018) provides an extensive summary and exploration of the primary compatible solutes utilized by organisms from all three domains of life, underscoring the prevalence of this osmoregulatory strategy. Furthermore, our model can be directly generalized to scenarios involving the direct uptake of osmolytes from the environment. One only needs to change the interpretation of the parameter, 𝑘<sub>𝑎</sub> in the production of osmolyte molecule, , from the synthesis rate to the uptake rate, and all the results are equally applicable. In the revised manuscript, we have briefly discussed this point in the subsection “Osmoregulation.”

      We agree with Reviewer 2 that our model's coarse-grained nature makes it broadly applicable to diverse microbial taxa; however, more specialized adaptations are beyond our model. In the revised manuscript, we have included a more detailed examination of the limitations inherent in our modeling approach in the second last paragraph of the Discussion section:

      “We remark several limitations of our current coarse-grained model. First, the high membrane tension that inhibits transmembrane flux of peptidoglycan precursors, leading to a growth inhibition before the supergrowth peak (Rojas et al., Cell systems 2017) is beyond our model. Second, in our current framework, the osmoregulation and cell-wall synthesis regulation rely on the instantaneous cellular states. However, microorganisms can exhibit memory effects to external stimuli by adapting to their temporal order of appearance (Mitchell et al., Nature 2009). Notably, in the osmoregulation of yeast, a short-term memory, facilitated by post-translational regulation of the trehalose metabolism pathway, and a long-term memory, orchestrated by transcription factors and mRNP granules, have been identified (Jiang et al., Science signaling 2020). Besides, our model does not account for the role of osmolyte export in osmoregulation (Tamas et al., Molecular microbiology, 1999) and the interaction between biomass and osmolyte production (Shen et al., Iscience 2023). Extending our model to include more realistic biological processes will be interesting.”

      (6) Line 198-200: It is not clear in the text what organisms the authors are writing about here. "Experiments suggested that the turgor pressure induce cell-wall synthesis, e.g., through mechanosensors on cell membrane [45, 46], by increasing the pore size of the peptidoglycan network [5], and by accelerating the moving velocity of the cell-wall synthesis machinery [31]". This however is untrue for bacteria as shown by the study (reference 22 is this paper: E. Rojas, J. A. Theriot, and K. C. Huang, Response of escherichia coli growth rate to osmotic shock, Proceedings of the National Academy of Sciences 111, 7807 (2014).

      We thank Reviewer 2 for pointing out this very important issue and apologize for the confusion. References 45 and 46 (Dupres et al., Nature Chemical Biology 2009; Neeli-Venkata et al., Developmental Cell 2021) discuss how Wsc1 acts as a mechanosensor in S. pombe, detecting turgor pressure and activating pathways that reinforce the cell wall. Reference 5 (Typas et al., Cell 2010) explains the role of LpoA and LpoB, the two outer membrane lipoprotein regulators in E. coli, which modulate peptidoglycan synthesis in an extracellular manner. Reference 31 (Amir and Nelson, PNAS 2012) is a theoretical paper showing that turgor pressure may accelerate the moving velocity of the cell wall synthesis machinery in E. coli. In the revised manuscript, we have been more explicit about the organisms we refer to in the subsection “Cell-wall synthesis regulation.”

      Meanwhile, we agree with Reviewer 2 that cell wall synthesis may not be directly regulated by turgor pressure in E. coli (Rojas et al., PNAS 2014). We would like to clarify that this scenario is also included in our model corresponding to H<sub>cw</sub> = 0 (Eq. (7) in the main text): the turgor pressure does not affect the cell-wall synthesis. Therefore, the supergrowth phenomenon observed in S. pombe does not manifest under hypotonic stimulation in E. coli.

      In the revised manuscript, we have emphasized this point more explicitly in the third last paragraph of the Discussion section:

      “Reference 22 (Rojas et al., PNAS, 2014) showed that the expansion of E. coli cell wall is not directly regulated by turgor pressure, and this scenario is also included in our model as the case of H<sub>cw</sub> \= 0. According to our model, the supergrowth phase is absent if H<sub>cw</sub> = 0 (Figure S8), consistent with the absence of a growth rate peak after a hypoosmotic shock in the experiments of E. coli (Rojas et al., PNAS, 2014). Meanwhile, our predictions are consistent with the growth rate peak after a hypoosmotic shock observed for B. subtilis (Rojas et al., Cell systems, 2017).”

      (7) The time scale of reactions to hyperosmotic shocks does not agree with previous literature (reference 22). Therefore defining which organism you are looking at is important. Hence the statement " Because the timescale of the osmoresponse process, which is around hours (Figure 3B), is much longer than the timescale of the supergrowth phase, which is about 20 minutes, the turgor pressure at the growth rate peak can be well approximated by its immediate value after the shock." from line 447 does not seem to make sense. The authors need to address this.

      We apologize for this confusion. In the revised manuscript, we have clarified that the cited time scales are for the fission yeast S. pombe after Eq. (13) in the main text.

      Reviewer #2 (Recommendations for the authors):

      (1) Inconsistency in nomenclature: On line 117, the equation reads V<sub>b</sub> = αm<sub>p where V<sub>b</sub> is the bound volume. Whereas bound volume has been referred to as V<sub>bd</sub> previously and in Figure 1.

      Answer: We apologize for this confusion. In our model, the total bound volumeV<sub>b</sub> comprises the volume of dry mass and bound water, V<sub>b</sub> \= V<sub>bd</sub> + V<sub>bw</sub>, where V<sub>bd</sub> is the volume occupied by dry mass and V<sub>bw</sub> is the volume of bound water. In the revised manuscript, we have added a brief discussion of this point in the caption of Figure 1.

      (2) Line 180: Please define 𝜌𝜌 for equation 4.

      We apologize for this confusion. In the text, the symbol 𝜌<sub>p</sub> denotes the mass of a given substance per unit volume of free water, and its unit is g/ml. The specific substance in consideration is indicated by a subscript. For example, 𝜌<sub>p</sub> in Eq. (4) represents the protein density, and 𝜌<sub>c</sub> stands for the critical protein density, above which intracellular chemical reactions cease according to Eq. (8) of the main text. In the revised manuscript, we have clarified the meaning of 𝜌<sub>c</sub> after Eq. (4).

      (3) Line 187: Equation 5 also needs to be explained better. Hence there is a need to be more specific while stating the assumptions.

      The elastic modulus 𝐺 defined in Eq. (5) of the main text is a measure of the cell wall's resistance to volume expansion. We assume a constant 𝐺 for simplicity, which is reasonable when the cell wall deformation is mild. In the revised manuscript, we have been more explicit about our assumptions regarding the turgor pressure in the subsection “Cell-wall synthesis regulation.”

      (4) Line 225: For a biological audience some elaboration on "glass transition" may be required- either as a reference to a review or to a 1 sentence statement of relevance.

      We appreciate Reviewer 2’s helpful comment. In the revised manuscript, we have added a brief introduction to the glass transition and a citation to a review paper (Hunter and Weeks, Rep. Prog. Phys. 2012) at the beginning of the subsection “Intracellular crowding.”

      (5) Line 247: "All growth rates in steady states of cell growth are the same: 𝜇<sub>𝑓</sub> \= 𝜇<sub>r</sub> \= 𝜇<sub>cw</sub>". The authors need to explain in a line or two why this is true. Since the processes are independent, it is safe to assume that all 𝜇's are constant, but it is not obvious why they should all be equal.

      We apologize for the lack of a clear explanation regarding the equality of steady-state growth rates in our previous manuscript. In the revised manuscript, we have added a brief explanation of the equality of the three growth rates at the beginning of the subsection “Steady states in constant environments”:

      “When cell growth reaches a steady state, the proportions of all components, including free water volume, cell mass, and cell wall volume, must be constant relative to the total cell volume to ensure homeostasis. Therefore, all growth rates in steady states of cell growth must be the same: 𝜇<sub>𝑓</sub> \= 𝜇<sub>r</sub> \= 𝜇<sub>cw</sub>.”

      (6) Line 264: "Because the typical doubling times of microorganisms are around hours, we can estimate 𝜇<sub>𝑓</sub>/k<sub>w</sub> ∼ 10 Pa [51, 52] ..." since the authors are generalizing for yeast and bacteria, specifically E. coli, this is not a valid assumption to make. There is also a need to explain the basis of "𝜇<sub>𝑓</sub>/k<sub>w</sub> ∼ 10 Pa".  

      We appreciate the need for clarity in the estimation and its implications. The rough estimation of 𝜇<sub>𝑓</sub>/k<sub>w</sub> ~ 10 Pa in the main text is given by:

      Here, the typical value of 𝜇<sub>𝑓</sub> (which equals to 𝜇<sub>r</sub> in steady state) is approximated by the inverse of the cell cycle, which is around hours. The estimation above is employed to justify the assumption that 𝜇<sub>𝑓</sub>/k<sub>w</sub> is much smaller than the cytoplasmic osmotic and turgor pressures, which can be several atmospheric pressures.

      For the case of E. coli, based on the experimental results from Boer et al. (Boer et al., Biochemistry 2011), an 800mM hypoosmotic shock leads to a rapid expansion of cell volume accomplished within a time scale of 0.1s, from which we obtain:

      .

      Therefore, our assumption that 𝜇<sub>𝑓</sub>/k<sub>w</sub> is much smaller than the cytoplasmic osmotic and turgor pressures is still valid. 

      In the revised manuscript, we have increased the estimation ranges to include the case of E. coli in the first paragraph of the subsection “Steady states in constant environments.”

      (7) Lines 279-283 need to be explained better.  

      We apologize for the confusion. In the revised manuscript, we have explained more explicitly the meaning of the growth curve in the second paragraph of the subsection “Steady states in constant environments”:

      “Intriguingly, the relationship between the normalized growth rate () and the normalized cytoplasmic osmotic pressure (), which we refer to as the growth curve in the following, has only one parameter 𝐻<sub>r</sub>/(𝐻<sub>𝑎</sub>) . Therefore, the growth curves of different organisms can be unified by a single formula, Eq. (10b), and different organisms may have different values of 𝐻<sub>r</sub>/(𝐻<sub>𝑎</sub> + 1).”

      (8) In Figure 3, an arrow representing the onset of osmotic shock would make the figure more intuitive to understand.

      We appreciate Reviewer 2 for this helpful suggestion. We have modified Figure 3 as suggested.

      (9) It is unclear to me if the growth rate 𝜇𝜇𝑟𝑟 is representative of the growth of total protein. This can be motivated better.

      We would like to clarify that the growth rate 𝜇𝜇𝑟𝑟 is defined as the changing rate of total protein mass divided by the total protein mass:

      Here, 𝑚<sub>𝑝,𝑟</sub> is the total mass of ribosomal proteins and 𝑘𝑘𝑟𝑟 is a constant proportional to the elongation speed of ribosome. The expression of 𝜇<sub>𝑟</sub> is a direct consequence of ribosomes being responsible for producing all proteins. In the revised manuscript, we have added more details in the introduction of the variable 𝜇<sub>𝑟</sub> in the last paragraph of the subsection “Cell growth”:

      “In this work, we assume that the dry-mass growth rate is proportional to the fraction of ribosomal proteins within the total proteome for simplicity, 𝜇<sub>𝑟</sub> \= 𝑘<sub>r</sub>𝑚<sub>𝑝,𝑟</sub>/𝑚<sub>𝑝</sub> \= 𝑘<sub>r</sub>𝜙<sub>𝑟</sub>. This assumption leverages the fact that ribosomes are responsible for producing all proteins. The proportionality coefficient 𝑘<sub>𝑟</sub> encapsulates the efficiency of ribosomal activity, being proportional to the elongation speed of the ribosome. We remark that 𝑘𝑘𝑟𝑟 is influenced by the crowding effect, which we address later.”

    1. eLife Assessment

      O'Brien and co-authors addressed how statins reduce levels of aldosterone in humans and provide important data demonstrating that tissue-resident macrophages can exert physiological functions and influence endocrine systems. However, the strength of evidence, as of now, is incomplete, as the sole description of the phenotype of MARCO-deficient mice is insufficient to claim that MARCO in alveolar macrophages can negatively regulate ACE expression and aldosterone production at steady-state. The work will be of broad interest to cell biologists and immunologists.

    2. Reviewer #2 (Public review):

      Summary:

      Tissue-resident macrophages are more and more thought to exert key homeostatic functions and contribute to physiological responses. In the report of O'Brien and Colleagues, the idea that the macrophage-expressed scavenger receptor MARCO could regulate adrenal corticosteroid output at steady-state was explored. The authors found that male MARCO-deficient mice exhibited higher plasma aldosterone levels and higher lung ACE expression as compared to wild-type mice, while the availability of cholesterol and the machinery required to produce aldosterone in the adrenal gland were not affected by MARCO deficiency. The authors take these data to conclude that MARCO in alveolar macrophages can negatively regulate ACE expression and aldosterone production at steady-state and that MARCO-deficient mice suffer from a secondary hyperaldosteronism.

      Strengths:

      If properly demonstrated and validated, the fact that tissue-resident macrophages can exert physiological functions and influence endocrine systems would be highly significant and could be amenable to novel therapies.

      Major weakness:

      The comparison between C57BL/6J wild-type mice and knock-out mice for which a precise information about the genetic background and the history of breedings and crossings is lacking can lead to misinterpretations of the results obtained. Hence, MARCO-deficient mice should be compared with true littermate controls.

    3. Author response:

      The following is the authors’ response to the original reviews

      We again thank the reviewers for their comments and recommendations. In response to the reviewer’s suggestions, we have performed several additional experiments, added additional discussion, and updated our conclusions to reflect the additional work. Specifically, we have performed additional analyses in female WT and Marco-deficient animals, demonstrating that the Marco-associated phonotypes observed in male mice (reduced adrenal weight, increased lung Ace mRNA and protein expression, unchanged expression of adrenal corticosteroid biosynthetic enzymes) are not present in female mice. We also report new data on the physiological consequences of increased aldosterone levels observed in male mice, namely plasma sodium and potassium titres, and blood pressure alterations in WT vs Marco-deficient male mice. In an attempt to address the reviewer’s comments relating to our proposed mechanism on the regulation of lung Ace expression, we additionally performed a co-culture experiment using an alveolar macrophage cell line and an endothelial cell line. In light of the additional evidence presented herein, we have updated our conclusions from this study and changed the title of our work to acknowledge that the mechanism underlying the reported phenotype remains incompletely understood. Specific responses to reviewers can be seen below.

      Public Reviews:

      Reviewer #1 (Public Review):

      Summary:

      The investigators sought to determine whether Marco regulates the levels of aldosterone by limiting uptake of its parent molecule cholesterol in the adrenal gland. Instead, they identify an unexpected role for Marco on alveolar macrophages in lowering the levels of angiotensin-converting enzyme in the lung. This suggests an unexpected role of alveolar macrophages and lung ACE in the production of aldosterone.

      Strengths:

      The investigators suggest an unexpected role for ACE in the lung in the regulation of systemic aldosterone levels.

      The investigators suggest important sex-related differences in the regulation of aldosterone by alveolar macrophages and ACE in the lung.

      Studies to exclude a role for Marco in the adrenal gland are strong, suggesting an extra-adrenal source for the excess Marco observed in male Marco knockout mice.

      Weaknesses:

      While the investigators have identified important sex differences in the regulation of extrapulmonary ACE in the regulation of aldosterone levels, the mechanisms underlying these differences are not explored.

      The physiologic impact of the increased aldosterone levels observed in Marco -/- male mice on blood pressure or response to injury is not clear.

      The intracellular signaling mechanism linking lung macrophage levels with the expression of ACE in the lung is not supported by direct evidence.

      Reviewer #2 (Public Review):

      Summary:

      Tissue-resident macrophages are more and more thought to exert key homeostatic functions and contribute to physiological responses. In the report of O'Brien and Colleagues, the idea that the macrophage-expressed scavenger receptor MARCO could regulate adrenal corticosteroid output at steady-state was explored. The authors found that male MARCO-deficient mice exhibited higher plasma aldosterone levels and higher lung ACE expression as compared to wild-type mice, while the availability of cholesterol and the machinery required to produce aldosterone in the adrenal gland were not affected by MARCO deficiency. The authors take these data to conclude that MARCO in alveolar macrophages can negatively regulate ACE expression and aldosterone production at steady-state and that MARCO-deficient mice suffer from secondary hyperaldosteronism.

      Strengths:

      If properly demonstrated and validated, the fact that tissue-resident macrophages can exert physiological functions and influence endocrine systems would be highly significant and could be amenable to novel therapies.

      Weaknesses:

      The data provided by the authors currently do not support the major claim of the authors that alveolar macrophages, via MARCO, are involved in the regulation of a hormonal output in vivo at steady-state. At this point, there are two interesting but descriptive observations in male, but not female, MARCO-deficient animals, and overall, the study lacks key controls and validation experiments, as detailed below.

      Major weaknesses:

      (1) According to the reviewer's own experience, the comparison between C57BL/6J wild-type mice and knock-out mice for which precise information about the genetic background and the history of breedings and crossings is lacking, can lead to misinterpretations of the results obtained. Hence, MARCO-deficient mice should be compared with true littermate controls.

      (2) The use of mice globally deficient for MARCO combined with the fact that alveolar macrophages produce high levels of MARCO is not sufficient to prove that the phenotype observed is linked to alveolar macrophage-expressed MARCO (see below for suggestions of experiments).

      (3) If the hypothesis of the authors is correct, then additional read-outs could be performed to reinforce their claims: levels of Angiotensin I would be lower in MARCO-deficient mice, levels of Antiotensin II would be higher in MARCO-deficient mice, Arterial blood pressure would be higher in MARCO-deficient mice, natremia would be higher in MARCO-deficient mice, while kaliemia would be lower in MARCO-deficient mice. In addition, co-culture experiments between MARCO-sufficient or deficient alveolar macrophages and lung endothelial cells, combined with the assessment of ACE expression, would allow the authors to evaluate whether the AM-expressed MARCO can directly regulate ACE expression.

      Recommendations for the authors:

      Reviewer #1 (Recommendations For The Authors):

      (1) Corticosterone levels in male Marco -/- mice are not significantly different, but there is (by eye) substantially more variability in the knockout compared to the wild type. A power analysis should be performed to determine the number of mice needed to detect a similar % difference in corticosterone to the difference observed in aldosterone between male Marco knockout and wild-type mice. If necessary the experiments should be repeated with an adequately powered cohort.

      Using a power calculator (www.gigacalculator.com) it was determined that our sample size of 13 was one less than sufficient to detect a similar % difference in corticosterone as was detected in corticosterone. We regret that we unable to perform additional measurements as the author suggested in the available timeframe.

      (2) All of the data throughout the MS (particularly data in the lung) should be presented in male and female mice. For example, the induction of ACE in the lungs of Marco-/- female mice should be absent. Similar concerns relate to the dexamethasone suppression studies. Also would be useful if the single cell data could be examined by sex--should be possible even post hoc using Xist etc.

      Given the limitations outlined in our previous response to reviewers it was not possible to repeat every experiment from the original manuscript. We were able to measure the expression of lung Ace mRNA, ACE protein, adrenal weights, adrenal expression of steroid biosynthetic enzymes, presence of myeloid cells, and levels of serum electrolytes in female animals. These are presented in figures 1G, 3B, 4A, 4E, 4F, 4I, and 4J. We have elected to not present single cell seq data according to sex as it did not indicate substantial differences between males and females in Marco or Ace expression and so does not substantively change our approach.

      (3) IF is notoriously unreliable in the lung, which has high levels of autofluorescence. This is the only method used to show ACE levels are increased in the absence of Marco. Orthogonal methods (e.g. immunoblots of flow-sorted cells, or ideally CITE-seq that includes both male and female mice) should be used.

      We used negative controls to guide our settings during acquisition of immunofluorescent images. Additionally, we also used qPCR to show an increase in Ace mRNA expression in the lung in addition to the protein level. This data was presented in the original manuscript and is further bolstered by our additional presentation of expression data for Ace mRNA and protein in female animals in this revised manuscript.

      (4) Given the central importance of ACE staining to the conclusions, validation of the antibody should be included in the supplement.

      We don’t have ACE-deficient mice so cannot do KO validation of the antibody. We did perform secondary stain controls which confirmed the signal observed is primary antibody-derived. Moreover, we specifically chose an anti-ACE antibody (Invitrogen catalogue # MA5-32741) that has undergone advanced verification with the manufacturer. We additionally tested the antibody in the brain and liver and observed no significant levels of staining.

      Author response image 1.

      (5) The link between alveolar macrophage Marco and ACE is poorly explored.

      We carried out a co-culture experiments of alveolar macrophages and endothelial cells and measure ACE/Ace expression as a consequence. This is presented in figure 5D and the discussion.

      (6) Mechanisms explaining the substantial sex difference in the primary outcome are not explored.

      This is outside the scope if this project, though we would consider exploring such experiments in future studies.

      (7) Are there physiologic consequences either in homeostasis or under stress to the increased aldosterone (or lung ACE levels) observed in Marco-/- male mice?

      We measured blood electrolytes and blood pressure in Marco-deficient and Marco-sufficient mice. The results from these experiments are presented in 4G-4M.

      Reviewer #2 (Recommendations For The Authors):

      Below is a suggestion of important control or validation experiments to be performed in order to support the authors' claims.

      (1) It is imperative to validate that the phenotype observed in MARCO-deficient mice is indeed caused by the deficiency in MARCO. To this end, littermate mice issued from the crossing between heterozygous MARCO +/- mice should be compared to each other. C57BL/6J mice can first be crossed with MARCO-deficient mice in F0, and F1 heterozygous MARCO +/- mice should be crossed together to produce F2 MARCO +/+, MARCO +/- and MARCO -/- littermate mice that can be used for experiments.

      We thank the reviewer for their comments. We recognise the concern of the reviewer but due to limited experimenter availability we are unable to undertake such a breeding programme to address this particular concern.

      (2) The use of mice in which AM, but not other cells, lack MARCO expression would demonstrate that the effect is indeed linked to AM. To this end, AM-deficient Csf2rb-deficient mice could be adoptively transferred with MARCO-deficient AM. In addition, the phenotype of MARCO-deficient mice should be restored by the adoptive transfer of wild-type, MARCO-expressing AM. Alternatively, bone marrow chimeras in which only the hematopoietic compartment is deficient in MARCO would be another option, albeit less specific for AM.

      We recognise the concern of the reviewer. We carried out a co-culture experiments of alveolar macrophages and endothelial cells and measure ACE/Ace expression as a consequence. This is presented in figure 5D and the implications explored in the discussion.

      (3) If the hypothesis of the authors is correct, then additional read-outs could be performed to reinforce their claims: levels of Angiotensin I would be lower in MARCO-deficient mice, levels of Antiotensin II would be higher in MARCO-deficient mice, Arterial blood pressure would be higher in MARCO-deficient mice, natremia would be higher in MARCO-deficient mice, while kaliemia would be lower in MARCO-deficient mice. Similar read-outs could also be performed in the models proposed in point 2).

      We measured blood electrolytes and blood pressure in Marco-deficient and Marco-sufficient mice. The results from these experiments are presented in 4G-4M.

      (4) Co-culture experiments between MARCO-sufficient or deficient alveolar macrophages and lung endothelial cells, combined with the assessment of ACE expression, would allow the authors to evaluate whether the AM-expressed MARCO can directly regulate ACE expression.

      To address this concern we carried out a co-culture experiment as described above.

    1. eLife Assessment

      This paper presents important information about potential Homo naledi-associated markings discovered on the walls of the Hill Antechamber of the Rising Star Cave system, South Africa. If confirmed, the antiquity, intentionality, and authorship of the reported markings will have profound archaeological implications, as such behaviors are otherwise widely considered to be unique to our species, Homo sapiens. This report concerns preliminary findings and as it stands the study is incomplete, with further work needed in the future to support the claims about the anthropogenic nature, age, and author of the engravings.

    2. Reviewer #3 (Public review):

      In a characteristically bold fashion, Lee Berger and colleagues argue here that markings they have found in a dark isolated space in the Rising Star Cave system are likely over a quarter of a million years old and were made intentionally by Homo naledi, whose remains nearby they have previously reported. As in a European and much later case they reference ('Neanderthal engraved 'art' from the Pyrenees'), the entangled issues of demonstrable intentionality, persuasive age and likely authorship will generate much debate among the academic community of rock art specialists. The title of the paper and the reference to 'intentional designs', however, leave no room for doubt as to where the authors stand, despite an avoidance of the word art, entering a very disputed terrain. Iain Davidson's (2020) 'Marks, pictures and art: their contributions to revolutions in communication', also referenced here, forms a useful and clearly articulated evolutionary framework for this debate. The key questions are: 'are the markings artefactual or natural?', 'how old are they?' and 'who made them?, questions often intertwined and here, as in the Pyrenees, completely inseparable. I do not think that these questions are definitively answered in this paper and I guess from the language used by the authors (may, might, seem etc) that they do not think so either.

      Before considering the specific arguments of the authors to justify the claims of the title, we should recognise the shift in the academic climate of those concerned with 'ancient markings' that has taken place over the past two or three decades. Before those changes, most specialists would probably have expected all early intentional markings to have been made by Homo sapiens after the African diaspora as part of the explosion of innovative behaviours thought to characterise the 'origins of modern humans'. Now, claims for earlier manifestations of such innovations from a wider geographic range are more favourably received, albeit often fiercely challenged as the case for Pyrenean Neanderthal 'art' shows (White et al. 2020). This change in intellectual thinking does not, however, alter the strict requirements for a successful assertion of earlier intentionality by non-sapiens species. We should also note that stone, despite its ubiquity in early human evolutionary contexts, is a recalcitrant material not easily directly dated whether in the form of walling, artefact manufacture or potentially meaningful markings. The stakes are high but the demands no less so.

      Why are the markings not natural? Berger and co-authors seem to find support for the artefactual nature of the markings in their location along a passage connecting chambers in the underground Rising Star Cave system. The presumption is that the hominins passed by the marked panel frequently. I recognise the thinking but the argument is weak. More confidently they note that "In previous work researchers have noted the limited depth of artificial lines, their manufacture from multiple parallel striations, and their association into clear arrangement or pattern as evidence of hominin manufacture (Fernandez-Jalvo et al. 2014)". The markings in the Rising Star Cave are said to be shallow, made by repeated grooving with a pointed stone tool that has left striations within the grooves, and to form designs that are "geometric expressions" including crosshatching and cruciform shapes. "Composition and ordering" are said to be detectable in the set of grooved markings. Readers of this and their texts will no doubt have various opinions about these matters, mostly related to rather poorly defined or quantified terminology. I reserve judgement, but would draw little comfort from the similarities among equally unconvincing examples of early, especially very early, 'designs'. Two or even three half convincing arguments do not add up to one convincing one.

      The authors draw our attention to one very interesting issue: given the extensive grooving into the dolomite bedrock by sharp stone objects, where are these objects? Only one potential 'lithic artefact' is reported, a "tool-shaped rock [that] does resemble tools from other contexts of more recent age in southern Africa, such as a silcrete tool with abstract ochre designs on it that was recovered from Blombos Cave (Henshilwood et al. 2018)", also figured by Berger and colleagues. A number of problems derive from this comparison. First, 'tool-shaped rock' is surely a meaningless term: in a modern toolshed 'tool-shaped' would surely need to be refined into 'saw-shaped', 'hammer-shaped' or 'chisel-shaped' to convey meaning? The authors here seem to mean that the Rising Star Cave object is shaped like the Blombos painted stone fragment? But the latter is a painted fragment not a tool and so any formal similarity is surely superficial and offers no support to the 'tool-ness' of the Rising Star Cave object. Does this mean that Homo naledi took (several?) pointed stone tools down the dark passsageways, used them extensively and, whether worn out or still usable, took them all out again when they left? Not impossible, of course. And the lighting?

      The authors rightly note that the circumstance of the markings "makes it challenging to assess whether the engravings are contemporary with the Homo naledi burial evidence from only a few metres away" and more pertinently, whether the hominins did the markings. Despite this honest admission, they are prepared to hypothesise that the hominin marked, without, it seems, any convincing evidence. If archaeologists took juxtaposition to demonstrate authorship, there would be any number of unlikely claims for the authorship of rock paintings or even stone tools. The idea that there were no entries into this Cave system between the Homo naledi individuals and the last two decades is an assertion not an observation and the relationship between hominins and designs no less so. In fact the only 'evidence' for the age of the markings is given by the age of the Homo naledi remains, as no attempt at the, admittedly very difficult, perhaps impossible, task of geochronological assessment, has been made.

      The claims relating to artificiality, age and authorship made here seem entangled, premature and speculative. Whilst there is no evidence to refute them, there isn't convincing evidence to confirm them.

      References:

      Davidson, I. 2020. Marks, pictures and art: their contribution to revolutions in communication. Journal of Archaeological Method and Theory 27: 3 745-770.

      Henshilwood, C.S. et al. 2018. An abstract drawing from the 73,000-year-old levels at Blombos Cave, South Africa. Nature 562: 115-118.

      Rodriguez-Vidal, J. et al. 2014. A rock engraving made by Neanderthals in Gibralter. Proceedings of the National Academy of Sciences.

      White, Randall et al. 2020. Still no archaeological evidence that Neanderthals created Iberian cave art.

      Comments on latest version:

      The authors have not modified their stance or the authority of their arguments since the original paper.

    3. Reviewer #4 (Public review):

      Thank you for the opportunity to provide a peer-review of this manuscript, which I first reviewed in 2023 under the title of '241,000 to 335,000 Years Old Rock Engravings Made by Homo naledi in the Rising Star Cave system, South Africa'. My review is brief as the authors state they have made "relatively minimal changes", so most of the comments I made in 2023 still stand. Some of the language is a little more temperate but the main issues of this potentially landmark study remain and undermine scientific acceptance of the findings claim. The fact that this is an initial report does not excuse it from the normal conventions of building arguments supported by empirical data. Again, the absence of a rock art expert on the authorial team causes recurring weaknesses still to be evident (would one ask a rock art expert to analyse a new fossil hominin skull for example?). Specifically, there are two major issues that need to be resolved before there is necessary and sufficient cause to assign the term 'rock engravings' to the marks in the Dinaledi chamber. These are authorship and dating.

       Authorship: The assertion that the 'rock engravings' are anthropogenic remains unsupported by empirical evidence, with a number of possible natural factors that could just as likely have caused the marks. Not to use image enhancements - which is standard in most rock art research and has been for some time - is a critical omission. The concerns stated about AI and data standards are not developed and the authors are directed to the literature in this field, for example this 2025 overview - https://www.sciencedirect.com/science/article/pii/S1296207424002516. Again, having a rock art expert would show the AI concern to be valid but easily addressed using Data Standards. In the almost 2 years since the first pre-print was released, there has been ample time for high resolution photographs and scans of the purported 'rock engravings'; analysis of which by relevant experts could properly physically characterise the marks and thus establish more or less likely agents for their production. European-based researchers in particular has utilised this approach on material such as the Blombos ochre and marked bone from Europe and Africa. None of these methods is invasive or destructive.

      To then go on and link Homo naledi to these markings is premature, especially when this landscape has been home to multiple hominins. Most rock art sites do not contain the physical bodily remains of their makers so we assign authorship based on dating (such as for Neanderthal era art in Europe for example); the second critical issue in this report:

       Dating: There is no direct or closely associated chronometric dating of the 'rock engravings' or their immediate context, so the age range claimed is unsupported. Rock art dating is notoriously difficult - and why researchers closely scrutinise dates produced. In this case, however, the chronological context is physically so far removed from these rock markings, as to be misleading at best and need to be discounted until a proper programme of dating has commenced. The sources cited for rock art dating tend to be out of date and it would be standard practice to have a geochronologist assess the rock-marked areas and then establish dating protocols.

      Authorship and dating are cornerstone of archaeological/paleoanthropological work and need to established in the first instance. Until that has been done commensurate with current standards in global rock art research this potentially landmark finding cannot be taken as probable, only as possible. This is a pity as the last decade or so has revolutionised our understanding of the socially complex world multiple hominin species lived in, and marked in utilitarian and symbolic ways. The conditions for acceptance of ancient rock art has thus never been better, but the Dinaledi example needs to revisit research first principles around authorship and dating to be included as a credible part of this larger context. It would have been good to see a commitment to a coherent research programme to this end for this case study.

      I hope these observations are useful. As above I keep them short as there has been minimal change to the 2023 ms, and my detailed comments on that remain with the first version of the work.

    4. Author response:

      The following is the authors’ response to the original reviews

      We thank the reviewers for their very constructive and helpful comments on the previous version of this manuscript. They have focused on some important issues and have raised many valuable questions that we expect to answer as research begins on these markings. As has been often the case with preprints, a number of experts beyond the four reviewers and editor have provided comments, questions, and suggestions, and we have taken these on board in our revision of the manuscript. In particular, Martinón-Torres et al. (2024) focused several comments upon this manuscript and raise some points that were not considered by the reviewers, and so we discuss those points here in addition to the reviewer comments.

      Some of us have been engaged in other aspects of the possible cultural activities of Homo naledi. After the discovery of these markings we considered it indefensible to publish further research on the activity of H. naledi within this part of the cave system without making readers aware that the H. naledi skeletal remains occur in a spatial context near markings on cave walls. Of course, the presence of markings leaves many questions open. A spatial context does not answer all questions about the temporal context. The situation of the Dinaledi Subsystem does entail some constraints that would not apply to markings within a more open cave or rock wall, and we discuss those in the text.

      We find ourselves in agreement with most of the reviewers on many points. As reflected by several of the reviewers, and most pointedly in the remarks by reviewer 1, the purpose of this preprint is a preliminary report on the observation of the markings in a very distinctive location. This initial report is an essential step to enable further research to move forward. That research requires careful planning due to the difficulty of working within the Dinaledi Subsystem where the markings are located. This pattern of initial publication followed by more detailed study is common with observations of rock art and other markings identified in South Africa and elsewhere. We appreciate that the reviewers have understood the role of this initial study in that process of research.

      Because of this, the revised manuscript represents relatively minimal changes, and all those at the advice of reviewers. Many thanks to all the reviewers for noting various typographic errors, missed references and other issues that we have done our best to fix in the revised manuscript.

      Expertise of authors. Reviewer 4 mentions that the expertise of the authors does not include previous publication history on the identification of rock art, and other reviewers briefly comment that experts in this area would enhance the description. AF does have several publications on ancient engravings and other markings; LRB has geological training and field experience with rock art. Notwithstanding this, we do take on board the advice to include a wider array of subject experts in this research, and this is already underway.

      Image enhancement. We appreciate the suggestions of some reviewers for possible strategies to use software filters to bring out details that may not be obvious even with our cross-polarization lighting and filtering. These are great ideas to try. In this manuscript we thought that going very far into software editing or image enhancement might be perceived by some readers as excessive manipulation, particularly in an age of AI. In future work we will experiment with the suggested approaches. 

      Natural weathering. In the process of review and commentary by experts and the public there has been broad acceptance that many of the markings illustrated in this paper are artificial and not a product of natural weathering of the dolomite rock. We deeply appreciate this. At the same time, we accept the comments from reviewers that some markings may be difficult to differentiate from natural weathering, and that some natural features that were elaborated or altered may be among the markings we recognize. On pages 3 and 4 we present a description of the process of natural subaerial weathering of dolomite, which we have rooted in several references as well as our own observations of the natural weathering visible on dolomite cave walls in the Rising Star cave system. This includes other cave walls within the Dinaledi Subsystem. We discuss the “elephant skin” patterning of natural dolomite surface weathering, how that patterning emerges, and how that differs from the markings that are the subject of this manuscript.

      Animal claw marks. Martinón-Torres et al. 2024 accept that some of the markings illustrated on Panel A are artificial, but they offer the hypothesis that some of those markings may be consistent with claw marks from carnivores or other mammals. They provide a photo of claw marks within a limestone cave in Europe to illustrate this point. On pages 5 and 6 of the revised manuscript we discuss the hypothesis of claw marks. We discuss the presence of animals in southern Africa that may dig in caves or mark surfaces. However the key aspect of the Malmani dolomite caves is that the hardness of dolomitic limestone rock is much greater than many of the limestone caves in other regions such as Europe and Australia, where claw marks have been noted in rock walls. As we discuss, we have not been able to find evidence of claw marks within the dolomite host bedrock of caves in this region, although carnivores, porcupines, and other animals dig into the soft sediments within and around caves. The form of the markings themselves also counter-indicates the hypothesis that they are claw marks. 

      Recent manufacture. One comment that occurs within the reviews and from other readers of the preprint is that recent human visitors to the cave, either in historic or recent prehistoric times, may have made these marks. We discuss this hypothesis on page 6 of the revised manuscript. The simple answer is that no evidence suggests that any human groups were in the Dinaledi Subsystem between the presence of H. naledi and the entry of explorers within the last 25 years. The list of all explorers and scientific visitors to have entered this portion of the cave system is presented in a table. We can attest that these people did not make the marks. More generally, such marks have not been known to be made by cavers in other contexts within southern Africa.

      Panels B and C. We have limited the text related to these areas, other than indicating that we have observed them. The analysis of these areas and quantification of artificial lines does not match what we have done for the Panel A area and we leave these for future work. 

      Presence of modern humans. We have observed no evidence of modern humans or other hominin populations within the Dinaledi Subsystem, other than H. naledi. Several reviewers raise the question of whether the absence of evidence is evidence of absence of modern humans in this area. This is connected by two of the reviewers to the observation that the investigation of other caves in recent years has shown that markings or paintings were sometimes made by different groups over tens of thousands of years, in some cases including both Neanderthals and modern humans. We have decided it is best for us not to attempt to prove a negative. It is simple enough to say that there is no evidence for modern humans in this area, while there is abundant evidence of H. naledi there.

      Association with H. naledi. Reviewer 2 made an incisive point that the previous version contained some text that appeared contradictory: on the one hand we argued that modern humans were not present in the subsystem due to the absence of evidence of them, yet we accepted that H. naledi may have been present for a longer time than currently established by geochronological methods.

      We appreciate this comment because it helped us to think through the way to describe the context and spatial association of these markings and the skeletal remains, and how it may relate to their timeline. Other reviewers also raised similar questions, whether the context by itself demonstrates an association with H. naledi. We have revised the text, in particular on pages 5 and 7, to simply state that we accept as the most parsimonious alternative at present the hypothesis that the engravings were made by H. naledi, which is the only hominin known to be present in this space.

      Age of H. naledi in the system. At one place in the previous manuscript we indicated that we cannot establish that H. naledi was only active in the cave system within the constraints of the maximum and minimum ages for the Dinaledi Subsystem skeletal remains (viz., 335 ka – 241 ka), because some localities with skeletal material are undated. We have adjusted this paragraph on page 7 to be clear that we are discussing this only to acknowledge uncertainty about the full range of H. naledi use of the cave system.

      Geochronological methods. Several reviewers discuss the issue of geochronology as applied to these markings. This is an area of future investigation for us after the publication of this initial report. As some reviewers note, the prospects for successful placement of these engraved features and other markings with geochronological methods depends on factors that we cannot predict without very high-resolution investigation of the surfaces. We have included greater discussion of the challenges of geochronological placement of engravings on page 6, including more references to previous work on this topic. We also briefly note the ethical problems that may arise as we go further with potentially  invasive, destructive or contact studies of these engravings, which must be carefully considered by not just us, but the entire academy.

      Title. Some reviewers suggested that the title should be rephrased because this paper does not use chronological methods to derive date constraints for the markings. We have rephrased the title to reflect less certainty while hopefully retaining the clear hypothesis discussed in the paper.

    1. eLife Assessment

      This important study uses Mendelian Randomization to provide evidence that early-life reproductive phenotypes (i.e., age at onset of menarche and age at first birth) have a significant impact on numerous health outcomes later in life. The empirical evidence provided by the authors supporting the antagonistic pleiotropy theory is solid. Theories of aging should be empirically tested and this study provides a good first step in that direction.

    2. Reviewer #1 (Public review):

      Summary:

      The present study aims to determine possible associations between reproduction with prevalence of age-related diseases based on the antagonistic pleiotropy hypothesis of ageing predominantly using Mendelian Randomization. The authors provide evidence demonstrated that menarche before the age 11 and childbirth before 21 increases the risk of several diseases, and almost doubled the risk for diabetes, heart failure, and quadrupled the risk of obesity,

      Strengths:

      Large sample size. Many analyses

    3. Reviewer #2 (Public review):

      Summary:

      The authors present an interesting paper where they test the antagonistic pleiotropy theory. Based on this theory they hypothesize that genetic variants associated with later onset of age at menarche and age at first birth have a positive causal effect on a multitude of health outcomes later in life, such as epigenetic aging and prevalence of chronic diseases. Using a mendelian randomization and colocalization approach, the authors show that SNPs associated with later age at menarche are associated with delayed aging measurements, such as slower epigenetic aging and reduced facial aging and a lower risk of chronic diseases, such as type 2 diabetes and hypertension. Moreover, they identify 128 fertility-related SNPs that associate with age-related outcomes and they identified BMI as a mediating factor for disease risk, discussing this finding in the context of evolutionary theory.

      Strengths:

      The major strength of this manuscript is that it addresses the antagonistic pleiotropy theory in aging. Aging theories are not frequently empirically tested although this is highly necessary. The work is therefore relevant for the aging field as well as beyond this field, as the antagonistic pleiotropy theory addresses the link between fitness (early life health and reproduction) and aging.

      Weaknesses:

      The authors report evidence in support of the antagonistic pleiotropy theory in aging and discuss the discuss the disposable soma theory. Although both theories describe distinct mechanisms, separating them in empirical research is complicated and needs further studies in future research.

    4. Author response:

      The following is the authors’ response to the previous reviews

      Reviewer #1 (Public review):

      Summary:

      The present study aims to associate reproduction with age-related disease as support of the antagonistic pleiotropy hypothesis of ageing predominantly using Mendelian Randomization. The authors found evidence that early-life reproductive success is associated with advanced ageing.

      Strengths:

      Large sample size. Many analyses.

      Weaknesses:

      Still a number of doubts with regard to some of the results and their interpretation.

      Reviewer #1 (Recommendations for the authors):

      Thank you for the opportunity to review a revised version.

      I still have serious doubts with regard to a number of datasets presented. For example, the results on essential hypertension and cervical cancer show very small effect sizes, but according to the authors still reach the level of statistical significance. This is unlikely to be accurate. For MR analyses, this is nearly impossible. The analyses of these data and the statistical analysis need to be checked for errors and repeated. While BOLT-LLM might not be relevant here, there might be other things happening here. The authors should therefore always interpret the results also with regard to the observed effect sizes instead of only looking at the p-values (0.999 means that there is a 0.1% lower risk).

      Thank you for your suggestions. We have updated the results for essential hypertension, GAD, and cervical cancer in results, figures, and supplemental tables (lines 65-89, Figure 1, Tables S3-S4).

      Reviewer #2 (Public review):

      Summary:

      The authors present an interesting paper where they test the antagonistic pleiotropy theory. Based on this theory they hypothesize that genetic variants associated with later onset of age at menarche and age at first birth may have a positive effect on a multitude of health outcomes later in life, such as epigenetic aging and prevalence of chronic diseases. Using a mendelian randomization and colocalization approach, the authors show that SNPs associated with later age at menarche are associated with delayed aging measurements, such as slower epigenetic aging and reduced facial aging and a lower risk of chronic diseases, such as type 2 diabetes and hypertension. Moreover, they identify 128 fertility-related SNPs that associate with age-related outcomes and they identified BMI as a mediating factor for disease risk, discussing this finding in the context of evolutionary theory.

      Strengths:

      The major strength of this manuscript is that it addresses the antagonistic pleiotropy theory in aging. Aging theories are not frequently empirically tested although this is highly necessary. The work is therefore relevant for the aging field as well as beyond this field, as the antagonistic pleiotropy theory addresses the link between fitness (early life health and reproduction) and aging.

      The authors addressed the remarks on the previous version very well. Addressing the two points below would further increase the quality of the manuscript.

      (1) In the previous version the authors mentioned that their results are also consistent with the disposable soma theory: "These results are also consistent with the disposable soma theory that suggests aging as an outcome tradeoff between an organism's investment in reproduction and somatic maintenance and repair."

      Although the antagonistic pleiotropy and disposable soma theories describe different mechanisms, both provide frameworks for understanding how genes linked to fertility influence health. The antagonistic pleiotropy theory posits that genes enhancing fertility early in life may have detrimental effects later. In contrast, the disposable soma theory suggests that energy allocation involves a trade-off, where investment in fertility comes at the expense of somatic maintenance, potentially leading to poorer health in later life.

      To strengthen the manuscript, a discussion section should be added to clarify the overlap and distinctions between these two evolutionary theories and suggest directions for future research in disentangling their specific mechanisms.

      Thank you for your suggestions to clarify the overlap and distinctions between the antagonistic pleiotropy and disposable soma theories. While our primary focus is on the antagonistic pleiotropy framework, we acknowledge that the disposable soma theory also provides a relevant perspective on the trade-offs between reproduction and somatic maintenance.

      To address this, we have expanded the discussion section to highlight how both theories contribute to our understanding of the relationship between fertility-related traits and aging-related health outcomes. We also suggested potential future research directions, such as integrating genetic data with biomarkers of somatic to further explore the mechanisms underlying these trade-offs (lines 213-223).

      (2) In response to the question why the authors did not include age at menopause in addition to the already included age at first child and age at menarche the following explanation was provided: "Our manuscript focuses on the antagonistic pleiotropy theory, which posits that inherent trade-off in natural selection, where genes beneficial for early survival and reproduction (like menarche and childbirth) may have costly consequences later. So, we only included age at menarche and age at first childbirth as exposures in our research."

      It remains, however, unclear why genes beneficial for early survival and reproduction would be reflected only in age at menarche and age at first childbirth, but not in age at menopause. While age at menarche marks the onset of fertility, age at menopause signifies its end. Since evolutionary selection acts directly until reproduction is no longer possible (though indirect evolutionary pressures persist beyond this point), the inclusion of additional fertility-related measures could have strengthened the analysis. A more detailed justification for focusing exclusively on age at menarche and first childbirth would enhance the clarity and rigor of the manuscript.

      Thank you for your question regarding the age at menopause in our analysis. Our decision was based on the theoretical framework of antagonistic pleiotropy, which emphasizes early-life reproductive advantages that may have trade-offs later in life. Age at menarche and age at first childbirth are direct markers of early reproductive investment, which align closely with this framework.

      While age at menopause marks the cessation of reproductive capability, its evolutionary role is distinct. The selective pressures acting on menopause are complex and may involve post-reproductive contributions rather than direct reproductive fitness benefits. Moreover, the genetic architecture of menopause may be influenced by different biological pathways compared to early reproductive traits.

      Nonetheless, we acknowledge that including age at menopause could provide additional insights into reproductive aging. Several papers1,2 were already published regarding age at menopause and age-related outcomes, including diabetes, AD, osteoporosis, cancers, and cardiovascular diseases.

      Reviewing Editor (Recommendations for the authors):

      Above/below you will find the remaining comments from the reviewers. One of the main issues remaining is that some of the data seems to be incorrectly analysed and some of the findings may not be correct. To clarify this a lot more, I asked the reviewer for some details and received the following:

      - In Figure 1B one of their main outcomes is "age of menopause", but they report the data as an odds ratio. This is not correct and should be fixed (it seems the authors can run the right analysis, but just reported it with the wrong heading in the figure). This likely also applies to the outcome "facial aging". Also the heading in Figure 1A should be Beta instead of OR.

      We have updated the figures to ensure that the beta values of continuous outcomes and odds ratio values of categorical outcomes are presented in Figure 1.

      - With essential hypertension, GAD and cervical cancer, the estimates are so small that they need to re-review their results. The current MR analysis is not sufficiently powered to have such small confidence intervals. Essential hypertension was based on data from UK biobank, although I was also unable to find what program was used to generate the GWAS results, I have strong thoughts this was also BOLT-LLM. Same for cervical cancer. Both datasets used familial-related samples, so they are very likely derived with BOLT-LLM.

      I hope this will help to solve this issue.

      Based on published paper, gastrointestinal or abdominal disease (GAD) (GWAS ID: ebi-a-GCST90038597) is after BOLT-LLM. Based on MRC IEU UK Biobank GWAS pipeline, version 1 and 2, essential hypertension (GWAS ID: ukb-b-12493) and cervical cancer (GWAS ID: ukb-b-8777) are after BOLT-LLM. We have updated the MR analysis results and figures (lines 65-89, Figure 1, Tables S3-S4) as well as the following IPA analysis (lines 106-162 and 255-280, Figures 2-3).

      (1) Magnus, M. C., Borges, M. C., Fraser, A. & Lawlor, D. A. Identifying potential causal effects of age at menopause: a Mendelian randomization phenome-wide association study. Eur J Epidemiol 37, 971-982 (2022). https://doi.org:10.1007/s10654-022-00903-3

      (2) Zhang, X., Huangfu, Z. & Wang, S. Review of mendelian randomization studies on age at natural menopause. Front Endocrinol (Lausanne) 14, 1234324 (2023). https://doi.org:10.3389/fendo.2023.1234324

    1. eLife Assessment

      This study on the effect of the trophic factor BDNF upon dental cells is an understudied subject that is relevant to dental regeneration and repair. Given that the topic is new and has not been covered previously, the report is a useful foray into a new area of investigation, although several experimental results could be strengthened. The connection of BDNF and dental health is a solid attempt in potentially translating trophic factor signaling clinically, which has been stymied in past efforts.

    2. Joint Public Review:

      This work employs both in vitro and in vivo methods to investigate the contribution of BDNF/TrkB signaling to enhancing differentiation and dentin-repair capabilities of dental pulp stem cells in the context of exposure to a variety of inflammatory cytokines. A particular emphasis of the approach is employment of dental pulp stem cells in which BDNF expression has been enhanced using CRISPR technology. Transplantation of such cells are proposed to improve dentin regeneration in a mouse model of tooth decay. The study provides several interesting findings, including demonstrating that exposure to several cytokines/inflammatory agents increases the quantity of activated phospho-Trk B in dental pulp stem. One issue that was not covered is the involvement of the p75 neurotrophin receptor which is also highly sensitive to inflammation and injury. The conclusions could be further augmented by demonstrating the specificity of the antibodies via immunoblot methods, both in the presence and absence of BDNF and other neurotrophins, NT-3 and NT-4, which can also bind to the TrkB receptor.

    3. Author response:

      The following is the authors’ response to the original reviews

      Public Reviews:

      Reviewer #1 (Public review):

      This work employs both in vitro and in vivo/transplant methods to investigate the contribution of BDNF/TrkB signaling to enhancing differentiation and dentin-repair capabilities of dental pulp stem cells in the context of exposure to a variety of inflammatory cytokines. A particular emphasis of the approach is the employment of dental pulp stem cells in which BDNF expression has been enhanced using CRISPR technology. Transplantation of such cells is said to improve dentin regeneration in a mouse model of tooth decay.

      The study provides several interesting findings, including demonstrating that exposure to several cytokines/inflammatory agents increases the quantity of (activated) phospho-Trk B in dental pulp stem cells.

      However, a variety of technical issues weaken support for the major conclusions offered by the authors. These technical issues include the following:

      Thank you for your keen observation and evaluation, which helped us significantly improve our manuscript. We have addressed the concerns and comments point by point in detail and substantially revised the manuscript and Figures. We hope that the manuscript is acceptable in the current improvised version.

      Detailed response to your comments/concerns is as follows:

      (1) It remains unclear exactly how the cytokines tested affect BDNF/TrkB signaling. For example, in Figure 1C, TNF-alpha increases TrkB and phospho-TrkB immunoreactivity to the same degree, suggesting that the cytokine promotes TrkB abundance without stimulating pathways that activate TrkB, whereas in Figure 2D, TNF-alpha has little effect on the abundance of TrkB, while increasing phospho-TrkB, suggesting that it affects TrkB activation and not TrkB abundance.

      Thank you for your kind concern. Recently, we have demonstrated the effect and interaction of TNF-alpha and Ca2+/calmodulin-dependent protein kinase II on the regulation of the inflammatory hDPSCs dentino-differentiation via BDNF/TrkB receptor signaling using TrkB inhibitor (Ref. below, and Figure 9). Moreover, we agree with your concern, and we have re-analyzed our replicates and found a better trend and significant abundance of TrkB as well (please refer to revised Figure 2D).

      Ref.: Kim, Ji Hyun, et al. (2025) "Ca 2+/calmodulin-dependent protein kinase II regulates the inflammatory hDPSCs dentino-differentiation via BDNF/TrkB receptor signaling." Frontiers in Cell and Developmental Biology 13: 1558736.

      (2) I find the histological images in Figure 3 to be difficult to interpret. I would have imagined that DAPI nuclear stains would reveal the odontoblast layer, but this is not apparent. An adjacent section labeled with conventional histological stains would be helpful here. Others have described Stro-1 as a stem cell marker that is expressed on a minority of cells associated with vasculature in the dental pulp, but in the images in Figure 3, Stro-l label is essentially co-distributed with DAPI, in both control and injured teeth, indicating that it is expressed in nearly all cells. Although the authors state that the Stro-1-positive cells are associated with vasculature, but I see no evidence that is true.

      Thank you for your concern. STRO-1 is a mesenchymal stem cell marker also expressed in dental pulp stem cells; both populations are distributed in the pulp. DPSCs can contribute to tissue repair and regeneration in inflamed pulp by differentiating into odontoblasts and forming reparative dentin. Moreover, in the case of carious and inflamed pulp, they are disorganized depending on the extent of infection/injury. Our purpose here was to point out DPSCs presence, not vasculature, which will differentiate into odontoblasts in such a scenario. We have revised Figure 3 by adding magnified images and dotted lines to indicate the boundary between the pulp and dentin.

      Ref. Volponi A. A., Pang Y., Sharpe P. T. Stem cell-based biological tooth repair and regeneration. Trends in Cell Biology. 2010;20(12):715–722.

      (3) The data presented convincingly demonstrate that they have elevated BDNF expression in their dental pulp stem cells using a CRISPR-based approach I have a number of questions about these findings. Firstly, nowhere in the paper do they describe the nature of the CRISPR plasmid they are transiently transfecting. Some published methods delete segments of the BDNF 3'-UTR while others use an inactivated Cas9 to position an active transactivator to sequences in the BDNF promoter. If it is the latter approach, transient transfection will yield transient increases in BDNF expression. Also, as BDNF employs multiple promoters, it would be helpful to know which promoter sequence is targeted, and finally, knowing the identity of the guide RNAs would allow assessment for the potential of off-target effects I am guessing that the investigators employ a commercially obtained system from Santa Cruz, but nowhere is this mentioned. Please provide this information.

      Dear Reviewer, yes, you are right. We have used a commercially obtained system from Santa Cruz, i.e., BDNF CRISPR Activation Plasmid (h): sc-400029-ACT and UltraCruz® Transfection Reagent (sc-395739), and they have been mentioned in Chemicals and Reagents section of Materials and Methods as follows.

      “BDNF CRISPR Activation Plasmid (h) is a synergistic activation mediator (SAM) transcription activation system designed to upregulate gene expression specifically BDNF CRISPR Activation Plasmid (h) consists of three plasmids at a 1:1:1 mass ratio: a plasmid encoding the deactivated Cas9 (dCas9) nuclease (D10A and N863A) fused to the transactivation domain VP64, and a blasticidin resistance gene; a plasmid encoding the MS2-p65-HSF1 fusion protein, and a hygromycin resistance gene; a plasmid encoding a target-specific 20 nt guide RNA fused to two MS2 RNA aptamers, and a puromycin resistance gene.”

      The resulting SAM complex binds to a site-specific region approximately 200-250 nt upstream of the transcriptional start site and provides robust recruitment of transcription factors for highly efficient gene activation

      Following transfection, gene activation efficiency could be assayed by WB, IF, or IHC using antibody: pro-BDNF Antibody (5H8): sc-65514

      Author response image 1.

      (4) Another question left unresolved is whether their approach elevated BDNF, proBDNF, or both. Their 28 kDa western blot band apparently represents proBDNF exclusively, with no mature BDNF apparent, yet only mature BDNF effectively activates TrkB receptors. On the other hand, proBDNF preferentially activates p75NTR receptors. The present paper never mentions p75NTR, which is a significant omission, since other investigators have demonstrated that p75NTR controls odontoblast differentiation.

      Dear reviewer, thank you for your noticing the error.

      Pro-BDNF is produced as a 32-kDa precursor that undergoes N-glycosylation and glycosulfation on residues located within the pro-domain of the precursor. N-terminal cleavage of the precursor generates mature BDNF as well as a minor truncated form of the precursor (28 kDa) that arises by a different processing mechanism than mature BDNF. The precursor undergoes N-terminal cleavage within the trans-Golgi network and/or immature secretory vesicles to generate mature BDNF (14 kDa).

      We checked our data and band size, and it shows a little mistake (Thank you for your keen observation and pointing out). The CRISPR protocol required verification of gene activation by checking pro-BDNF, as mentioned in the methodology. The labeling has been revised in the figure as pro-BDNF, and the actual blot with a ladder has been shown below for clarification.

      (5) In any case, no evidence is presented to support the conclusion that the artificially elevated BDNF expression has any effect on the capability of the dental pulp stem cells to promote dentin regeneration. The results shown in Figures 4 and 5 compare dentin regeneration with BDNF-over-expressing stem cells with results lacking any stem cell transplantation. A suitable control is required to allow any conclusion about the benefit of over-expressing BDNF.

      We have tested the presence of BDNF overexpressing cells by the higher expression of GFP here. Moreover, a significant increment in the dentin mineralization volume indicates the advantage of BDNF-over-expressing stem cells. Recently, we published the in vitro effects of BDNF/TrkB on DPSCs odontoblastic differentiation strongly supporting our in vivo data. Currently, we are in a difficult position to conduct the animal study within a short period of time. We would definitely consider using positive control in our future studies.

      Ref.: Kim, Ji Hyun, et al. (2025) "Ca 2+/calmodulin-dependent protein kinase II regulates the inflammatory hDPSCs dentino-differentiation via BDNF/TrkB receptor signaling." Frontiers in Cell and Developmental Biology 13: 1558736.

      (6) Whether increased BDNF expression is beneficial or not, the evidence that the BDNF-overexpressing dental pulp stem cells promote dentin regeneration is somewhat weak. The data presented indicate that the cells increase dentin density by only 6%. The text and figure legend disagree on whether the p-value for this effect is 0.05 or 0.01. In either case, nowhere is the value of N for this statistic mentioned, leaving uncertainty about whether the effect is real.

      A significant increment in the dentin mineralization volume by about 7.76% indicates the advantage of BDNF-over-expressing stem cells, and we believe this could be a breakthrough to advance stem cell engineering and therapy further to get this percentage higher in the future. The text in the result section shows that the p-value for this effect is 0.05. While N was 3 previously, we analyzed two more samples by CT scan and revised results, taking N = 5, which improved the results a little more to about 8.53%. Thank you for noticing; the figure legend has been corrected to 0.05.

      Similarly, our in vitro data in the current study supports the notion that it adds up to mineralization and odontoblastic differentiation. We recently published that BDNF/TrkB significantly enhances calcium deposits and mineralization using a battery of in vitro experiments.

      Ref.: Kim, Ji Hyun, et al. (2025) "Ca 2+/calmodulin-dependent protein kinase II regulates the inflammatory hDPSCs dentino-differentiation via BDNF/TrkB receptor signaling." Frontiers in Cell and Developmental Biology 13: 1558736.

      (7) The final set of experiments applies transcriptomic analysis to address the mechanisms mediating function differences in dental pulp stem cell behavior. Unfortunately, while the Abstract indicates " we conducted transcriptomic profiling of TNFα-treated DPSCs, both with and without TrkB antagonist CTX-B" that does not describe the experiment described, which compared the transcriptome of control cells with cells simultaneously exposed to TNF-alpha and CTX-B. Since CTX-B blocks the functional response of cells to TNF-alpha, I don't understand how any useful interpretation can be attached to the data without controls for the effect of TNF alone and CTX-B alone.

      Dear reviewer, yes, we did it alone and together as well. Earlier, we showed only the combined results and mentioned the interaction between TNFα and TrkB. We have included the results from TNFα alone and combined them with CTX-B for better comparison (Please refer to Figure 8). Figure 8C1 clearly shows the reversal of certain factors with the treatment of TrkB inhibitor compared to figure 8C with TNFα alone treated group.

      Reviewer #2 (Public review):

      Summary:

      In this manuscript, the authors investigate the potential for overexpressing BDNF in dental pulp stem cells to enhance dentin regeneration. They suggest that in the inflammatory environment of injured teeth, there is increased signaling of TrkB in response to elevated levels of inflammatory molecules.

      Strengths:

      The potential application to dentin regeneration is interesting.

      Weaknesses:

      There are a number of concerns with this manuscript to be addressed.

      Thank you for your compliments, keen observation, and evaluation, which helped us significantly improve our manuscript. We have addressed the concerns and comments point by point in detail and substantially revised the manuscript and Figures. We hope that the manuscript is acceptable in the current improvised version.

      Detailed response to your comments/concerns is as follows:

      (1) Insufficient citation of the literature. There is a vast literature on BDNF-TrkB regulating survival, development, and function of neurons, yet there is only one citation (Zhang et al 2012) which is on Alzheimer's disease.

      More references have been cited accordingly.

      (2) There are several incorrect statements. For example, in the introduction (line 80) TrkA is not a BDNF receptor.

      Thank you for noticing the typo; the sentence has been corrected.

      (3) Most important - Specific antibodies must be identified by their RRID numbers. To state that "Various antibodies were procured:... from BioLegend" is unacceptable, and calls into question the entire analysis. Specifically, their Western blot in Figure 4B indicates a band at 28 kDa that they say is BDNF, however the size of BDNF is 14 kDa, and the size of proBDNF is 32 and 37 kDa, therefore it is not clear what they are indicating at 28 kDa. The validation is critical to their analysis of BDNF-expressing cells.

      Dear reviewer, thank you for your kind concern. Sorry for the inconvenience; we have added RRID numbers of antibodies.

      Pro-BDNF is produced as a 32-kDa precursor that undergoes N-glycosylation and glycosulfation on residues located within the pro-domain of the precursor. N-terminal cleavage of the precursor generates mature BDNF as well as a minor truncated form of the precursor (28 kDa) that arises by a different processing mechanism than mature BDNF. The precursor undergoes N-terminal cleavage within the trans-Golgi network and/or immature secretory vesicles to generate mature BDNF (14 kDa).

      We checked our data and band size, and it shows a mistake in recognizing ladder size. It is actually a 14kDa band which has been shown. The labeling has been revised in the figure, and the actual blot with a ladder has been shown below for clarification. Similarly, our data focused on the fact that the observed cellular effects are more consistent with BDNF/TrkB-mediated pathways, which are known to promote survival and differentiation.

      (4) Figure 2 indicates increased expression of TrkB and TrkA, as well as their phosphorylated forms in response to inflammatory stimuli. Do these treatments elicit increased secretion of the ligands for these receptors, BDNF and NGF, respectively, to activate their phosphorylation? Or are they suggesting that the inflammatory molecules directly activate the Trk receptors? If so, further validation is necessary to demonstrate that.

      Thank you for your kind concern. TNF-α increases the number of TrkB receptors. The enhanced TrkB activation may result from a greater number of receptors and/or increased activation of individual receptors. In either case, inflammatory agents enhance the TrkB receptor signaling pathway.

      Recently, we have demonstrated the effect and interaction of TNF-alpha and Ca2+/calmodulin-dependent protein kinase II on the regulation of the inflammatory hDPSCs dentino-differentiation via BDNF/TrkB receptor signaling using TrkB inhibitor (Ref. below, and Figure 9). For now, we have added figure 9 for the proposed mechanism of action based on our recent and current study.

      Ref.: Kim, Ji Hyun, et al. (2025) "Ca 2+/calmodulin-dependent protein kinase II regulates the inflammatory hDPSCs dentino-differentiation via BDNF/TrkB receptor signaling." Frontiers in Cell and Developmental Biology 13: 1558736.

      (5) Figure 7 - RNA-Seq data, what is the rationale for treatment with TNF+ CTX-B? How does this identify any role for TrkB signaling? They never define their abbreviations, but if CTX-B refers to cholera toxin subunit B, which is what it usually refers to, then it is certainly not a TrkB antagonist.

      Thank you for your concern. Cyclotraxin-B (CTX-B) is a TrkB antagonist (mentioned in the revised manuscript). In order to identify the underlying mechanism, we ought to locate certain transcriptional factors interacting with the TrkB/BDNF signaling, leading to differentiation and dentinogenesis. Therefore, we treated it with a TrkB inhibitor.

      Earlier, we showed only the combined results and mentioned the interaction between TNFα and TrkB. We have included the results from TNFα alone and combined them with CTX-B for better comparison (Please refer to Figure 8). Figure 8C1 clearly shows the reversal of certain factors with the treatment of TrkB inhibitor compared to figure 8C with TNFα alone treated group. We agree that the precise role of CTX-B in modulating TrkB signaling requires further clarification and have now included this point in the revised discussion while we are currently working on this aspect.

      Reviewer #3 (Public review):

      In general, although the authors interpret their results as pointing towards a possible role of BDNF in dentin regeneration, the results are over-interpreted due to the lack of proper controls and focus on TrkB expression, but not its isoforms in inflammatory processes. Surprisingly, the authors do not study the possible role of p75 in this process, which could be one of the mechanisms intervening under inflammatory conditions.

      Thank you for your compliments, keen observation, and evaluation, which helped us significantly improve our manuscript. We have addressed the concerns and comments point by point in detail and substantially revised the manuscript and Figures. We hope that the manuscript is acceptable in the current improvised version.

      Detailed response to your comments/concerns is as follows:

      (1) The authors claim that there are two Trk receptors for BDNF, TrkA and TrkB. To date, I am unaware of any evidence that BDNF binds to TrkA to activate it. It is true that two receptors have been described in the literature, TrkB and p75 or NGFR, but the latter is not TrkA despite its name and capacity to bind NGF along with other neurotrophins. It is crucial for the authors to provide a reference stating that TrkA is a receptor for BDNF or, alternatively, to correct this paragraph.

      Dear reviewer, we apologize for the inconvenience; it was an error. BDNF binds to TrkB, and the sentence has been corrected.

      (2) The authors discuss BDNF/TrkB in inflammation. Is there any possibility of p75 involvement in this process?

      Mature BDNF binds to the high-affinity receptor tyrosine kinase B (TrkB), activating signaling cascades, while pro-BDNF binds to the p75 neurotrophin receptor (p75NTR). So, we don’t think there’s a possibility, as our data shows mature BDNF production. Here, we initially screened the TrkA and TrkB involvement in dentinogenesis and chose to work with BDNF and its receptor TrkB. Future studies can be directed to elucidate its mechanism of action in the context of dentinogenesis.

      (3) The authors present immunofluorescence (IF) images against TrkB and pTrkB in the first figure. While they mention in the materials and methods section that these antibodies were generated for this study, there is no proof of their specificity. It should be noted that most commercial antibodies labeled as anti-TrkB recognize the extracellular domain of all TrkB isoforms. There are indications in the literature that pathological and excitotoxic conditions change the expression levels of TrkB-Fl and TrkB-T1. Therefore, it is necessary to demonstrate which isoform of TrkB the authors are showing as increased under their conditions. Similarly, it is essential to prove that the new anti-p-TrkB antibody is specific to this Trk receptor and, unlike other commercial antibodies, does not act as an anti-phospho-pan-Trk antibody.

      Thank you for your kind concern.

      Human TrkB has 7 isoforms and predicted Mw ranges from 35 to 93kDa. It has 11 potential N-glycosylation sites. The given antibody (isotype: Mouse IgG2a, κ) has been shown to interact with SHC1, PLCG1 and/or PLCG2, SH2B1 and SH2B2, NGFR, SH2D1A, SQSTM1 and KIDINS220, FRS2.

      And, sorry for the misunderstanding and text mistake. We procured all the antibodies from the market using proven products, and didn’t check any specific isoform. We have mentioned the details of antibodies and reagents in the chemicals section of the methodology.

      (4) I believe this initial conclusion could be significantly strengthened, without opening up other interpretations of the results, by demonstrating the specificity of the antibodies via Western blot (WB), both in the presence and absence of BDNF and other neurotrophins, NGF, and NT-3. Additionally, using WB could help reinforce the quantification of fluorescence intensity presented by the authors in Figure 1. It's worth noting that the authors fixed the cells with 4% PFA for 2 hours, which can significantly increase cellular autofluorescence due to the extended fixation time, favoring PFA autofluorescence. They have not performed negative controls without primary antibodies to determine the level of autofluorescence and nonspecific background. Nor have they indicated optimizing the concentration of primary antibodies to find the optimal point where the signal is strong without a significant increase in background. The authors also do not mention using reference markers to normalize specific fluorescence or indicating that they normalized fluorescence intensity against a standard control, which can indeed be done using specific signal quantification techniques in immunocytochemistry with a slide graded in black-and-white intensity controls. From my experience, I recommend caution with interpretations from fluorescence quantification assays without considering the aforementioned controls.

      Thank you for your insightful comments. We have now included a negative control image in the revised Figures. This control confirms that the observed fluorescence signal is specific and not due to autofluorescence or nonspecific background. In our lab, we have been using these antibodies and already optimized the concentration to use in certain cell types. Additionally, we followed the manufacturer’s recommended antibody concentration and protocol throughout our experiments to ensure an optimal signal-to-noise ratio.

      We agree that extended fixation with 4% PFA may increase autofluorescence; however, including negative controls helps account for this effect. We also ensured consistent imaging parameters and applied the same exposure settings across all samples to allow for a valid comparison of fluorescence intensity. We appreciate your emphasis on careful quantification and have clarified these methodological details in the revised Methods section.

      (5) In Figure 2, the authors determine the expression levels of TrkA and TrkB using qPCR. Although they specify the primers used for GAPDH as a control in materials and methods, they do not indicate which primers they used to detect TrkA and TrkB transcripts, which is essential for determining which isoform of these receptors they are detecting under different stimulations. Similarly, I recommend following the MIQE guidelines (Minimum Information for Publication of Quantitative Real-Time PCR experiments), so they should indicate the amplification efficiency of their primers, the use of negative and positive controls to validate both the primer concentration used, and the reaction, the use of several stable reference genes, not just one.

      We appreciate the reviewer’s suggestion regarding the specificity of primers and the amplification efficiency. In response, we have now included the primer sequences used for detecting TrkA and TrkB transcripts in the revised Materials and Methods section (Quantitative real-time PCR analysis of odontogenic differentiation marker gene expression in dental pulp stem cells). This ensures clarity on which isoforms of these receptors were assessed under different conditions. We also acknowledge the importance of following MIQE guidelines, and we got the primer provided by Integrated DNA Technologies with standard desalting purification and guaranteed yield.

      (6) Moreover, the authors claim they are using the same amounts of cDNA for qPCRs since they have quantified the amounts using a Nanodrop. Given that dNTPs are used during cDNA synthesis, and high levels remain after cDNA synthesis from mRNA, it is not possible to accurately measure cDNA levels without first cleaning it from the residual dNTPs. Therefore, I recommend that the authors clarify this point to determine how they actually performed the qPCRs. I also recommend using two other reference genes like 18S and TATA Binding Protein alongside GAPDH, calculating the geometric mean of the three to correctly apply the 2^-ΔΔCt formula.

      Thank you for your kind concern. We agree that residual dNTPs from cDNA synthesis could impact the accuracy of cDNA quantification. To address this, we have used the commercially available and guaranteed kit. The kit used is mentioned in Materials and Methods. We will definitely consider using 18S and TATA Binding Protein alongside GAPDH in our future studies. For now, we request you consider the results generated against GAPDH control.

      (7) Similarly, given that the newly generated antibodies have not been validated, I recommend introducing appropriate controls for the validation of in-cell Western assays.

      We apologize for the text mistake. Antibodies were procured commercially and not generated. We have corrected the sentence.

      (8) The authors' conclusion that TrkB levels are minimal (Figure 2E) raises questions about what they are actually detecting in the previous experiments might not be the TrkB-Fl form. Therefore, it is essential to demonstrate beyond any doubt that both the antibodies used to detect TrkB and the primers used for qPCR are correct, and in the latter case, specify at which cycle (Ct) the basal detection of TrkB transcripts occurs. Treatment with TNF-alpha for 14 days could lead to increased cell proliferation or differentiation, potentially increasing overall TrkB transcript levels due to the number of cells in culture, not necessarily an increase in TrkB transcripts per cell.

      Thank you for your comments. We appreciate your kind concerns. Here, we are trying to demonstrate that TrkB gets activated in inflammatory conditions. We have also provided the details on primers and antibodies. We have used commercial antibodies and qPCR primers, and they have been extensively validated with previous publications. The efficiency and validation of qPCR primers were provided by a company.

      Moreover, we used the minimal concentration of TNF-alpha twice a week, and before using it, we did preliminary experiments to determine whether it affected any experimental condition.

      (9) Overall, there are reasonable doubts about whether the authors are actually detecting TrkB in the first three images, as well as the phosphorylation levels and localization of this receptor in the cells. For example, in Figure 3 A to J, it is not clear where TrkB is expressed, necessitating better resolution images and a magnified image to show in which cellular structure TrkB is expressed.

      Thank you for your comment. Here, we aimed to show the expression of TrkB receptors in inflamed/infected pulp, especially in minority-distributed DPSCs. TrkB is present on the cell membrane and perinuclear region. We have provided a single-cell (magnified) image in the figure for better clarification.

      (10) In Figure 4, the authors indicate they have generated cells overexpressing BDNF after recombination using CRISPR technology. However, the WB they show in Figure 4B, performed under denaturing conditions, displays a band at approximately 28kDa. This WB is absolutely incorrect with all published data on BDNF detection via this technique. I believe the authors should demonstrate BDNF presence by showing a WB with appropriate controls and BDNF appearing at 14kDa to assume they are indeed detecting BDNF and that the cells are producing and secreting it. What antibodies have been used by the authors to detect BDNF? Have the authors validated it? There are some studies reporting the lack of specificity of certain commercial BDNF antibodies, therefore it is necessary to show that the authors are convincingly detecting BDNF.

      Dear reviewer, thank you for your kind concern. Firstly, we apologize for the inconvenience.

      Pro-BDNF is produced as a 32-kDa precursor that undergoes N-glycosylation and glycosulfation on residues located within the pro-domain of the precursor. N-terminal cleavage of the precursor generates mature BDNF and a minor truncated form of the precursor (28 kDa) that arises by a different processing mechanism than mature BDNF. The precursor undergoes N-terminal cleavage within the trans-Golgi network and/or immature secretory vesicles to generate mature BDNF (14 kDa).

      We checked our data and band size, and it shows a mistake in recognizing ladder size. It is actually a 14kDa band which has been shown. The labeling has been revised in the figure, and the actual blot with a ladder has been shown below for clarification. Similarly, our data focused on the fact that the observed cellular effects are more consistent with BDNF/TrkB-mediated pathways, which are known to promote survival and differentiation.

      (11) While the RNA sequencing data indicate changes in gene expression in cells treated with TNFalpha+CTX-B compared to control, the authors do not show a direct relationship between these genetic modifications with the rest of their manuscript's argument. I believe the results from these RNA sequencing assays should be put into the context of BDNF and TrkB, indicating which genes in this signaling pathway are or are not regulated, and their importance in this context.

      Thank you for your concern. In order to identify the underlying mechanism, we ought to locate certain transcriptional factors interacting with the TrkB/BDNF signaling, leading to differentiation and dentinogenesis. Therefore, we treated it with a TrkB inhibitor.

      Earlier, we showed only the combined results and mentioned the interaction between TNFα and TrkB. We have included the results from TNFα alone and combined them with CTX-B for better comparison (Please refer to Figure 8). Figure 8C1 clearly shows the reversal of certain factors with the treatment of TrkB inhibitor compared to figure 8C with TNFα alone treated group. We agree that the precise role of CTX-B in modulating TrkB signaling requires further clarification. We have now included this point in the revised discussion while working on this aspect. In a parallel study, we are trying to dig deep, especially the TCF family, as they have been documented to interact indirectly with BDNF and TrkB.

      Recommendations for the authors:

      Reviewer #1 (Recommendations for the authors):

      Some minor textual issues

      Line 120: It is obvious that TNFα stimulation caused significant phosphorylation of TrkB (p < 0.01) compared to TrkA (p < 0.05).

      Thank you for noticing the typo. The sentence has been corrected.

      The authors should consider rewording this sentence - I do not understand the intended meaning.

      Line 126: pronounced peak at 10 ng/mL. I am not convinced there is a peak. Looks like a plateau to me. To call it a peak one would have to show that the values at 10 ng/ml and 20 ng/ml are statistically different.

      We meant here the peak compared to 0.1 and 1ng/mL concentration and not compared to 20 ng/mL. The sentence has been elaborated accordingly.

      Reviewer #3 (Recommendations for the authors):

      The authors should show how they have validated the specificity of all the used antibodies as well as the efficiency and specificity of their qPCR data.

      We procured the commercially available antibodies (all of them have been extensively validated with previous publications) and also performed negative controls (provided in revised figures). We frequently used Western blot and validate it with band size. Primer sequences are also provided in the revised manuscript. We checked its specificity with R<sup>2</sup> of Standard Curve ≥ 0.98 and the single peak of melting curves. We edited accordingly in line 263.

      Once again, we thank all of you for your efforts in evaluating our study. It really helped us improve the quality of the manuscript. We hope all the queries have been answered and the revised manuscript is acceptable.

    1. eLife Assessment

      A combination of molecular dynamics simulation and state-of-the-art statistical post-processing techniques provided valuable insight into GPCR-ligand dynamics. This manuscript provides solid evidence for differences in the binding/unbinding of classical cannabinoid drugs from new psychoactive substances. The results could aid in mitigating the public health threat these drugs pose.

    2. Reviewer #1 (Public review):

      This manuscript presents insights into biased signaling in GPCRs, namely cannabinoid receptors. Biased signaling is of broad interest in general, and cannabinoid signaling is particular relevant for understanding the impact of new drugs that target this receptor. Mechanistic insight from work like this could enable new approaches to mitigate the public health impact of new psychoactive drugs. Towards that end, this manuscript seeks to understand how new psychoactive substances (NPS, e.g. MDMB-FUBINACA) elicit more signaling through β-arrestin than classical cannabinoids (e.g. HU-210). The authors use an interesting combination of simulations and machine learning.

      The caption for Figure 3 doesn't explain the color scheme, so its not obvious what the start and end states of the ligand are.

      For the metadynamics simulations were multiple Gaussian heights/widths tried to see what, if any, impact that has on the unbinding pathway? That would be useful to help ensure all the relevant pathways were explored.

      It would be nice to acknowledge previous applications of metadynamics+MSMs and (separately) TRAM, such as Simulation of spontaneous G protein activation... (Sun et al. eLife 2018) and Estimation of binding rates and affinities... (Ge and Voelz JCP 2022).

      What is KL divergence analysis between macrostates? I know KL divergence compares probability distributions, but its not clear what distributions are being compared.

      I suggest being more careful with the language of universality. It can be "supported" but "showing" or "proving" its universal would require looking at all possible chemicals in the class.

      Comments on revisions:

      The authors provided appropriate responses to the comments above.

    3. Reviewer #2 (Public review):

      Summary:

      The investigation provides a computational as well as biochemical insights into the (un)binding mechanisms of a pair of psychoactive substances into cannabinoid receptors. A combination of molecular dynamics simulation and a set of state-of-the art statistical post-processing techniques were employed to exploit GPCR-ligand dynamics.

      Strengths:

      The strength of the manuscript lies in usage and comparison of TRAM as well as Markov state modelling (MSM) for investigating ligand binding kinetics and thermodynamics. Usually MSMs have been more commonly used for this purpose. But as the authors have pointed out, implicit in the usage of MSMs lie the assumption of detailed balance, which would not hold true for many cases especially those with skewed binding affinities. In this regard, the author's usage of TRAM which harnesses both biased and unbiased simulations for extracting the same, provides a more appropriate way-out.

      Weaknesses:

      (1) While the authors have used TRAM (by citing MSM to be inadequate in these cases), the thermodynamic comparisons of both techniques provide similar values. In this case, one would wonder what advantage TRAM would hold in this particular case.

      (2) The initiation of unbiased simulations from previously run biased metadynamics simulations would almost surely introduce hysteresis in the analysis. The authors need to address these issues.

      (3) The choice of ligands in the current work seems very forced and none of the results compare directly with any experimental data. An ideal case would have been to use the seminal D.E. Shaw research paper on GPCR/ligand binding as a benchmark and then show how TRAM, using much lesser biased simulation times, would fare against the experimental kinetics or even unbiased simulated kinetics of the previous report

      (4) The method section of the manuscript seems to suggest all the simulations were started from a docked structure. This casts doubt on the reliability of the kinetics derived from these simulations that were spawned from docked structure, instead of any crystallographic pose. Ideally, the authors should have been more careful in choosing the ligands in this work based on the availability of the crystallographic structures.

      (5) The last part of using a machine learning-based approach to analyse allosteric interaction seems to be very much forced, as there are numerous distance-based more traditional precedent analyses that do a fair job of identifying an allosteric job.

      (6) While getting busy with the methodological details of TRAM vs MSM, the manuscript fails to share with sufficient clairty what the distinctive features of two ligand binding mechanisms are.

      Comments on revisions:

      The authors have addressed most of the queries of the reviewer in an adequate manner. However, The current code availability section just provides the link to Python files to generate the plots. It is not very useful in its current form. The code availability section should provide a proper GitHub page that shows the usage of TRAM for the readers to execute. While Pyemma has been cited for TRAM, a python note book to reproduce the TRAM would be very instructive.

    4. Author response:

      The following is the authors’ response to the original reviews

      Public Reviews: 

      Reviewer #1 (Public Review): 

      This manuscript presents insights into biased signaling in GPCRs, namely cannabinoid receptors. Biased signaling is of broad interest in general, and cannabinoid signaling is particularly relevant for understanding the impact of new drugs that target this receptor. Mechanistic insight from work like this could enable new approaches to mitigate the public health impact of new psychoactive drugs. Towards that end, this manuscript seeks to understand how new psychoactive substances (NPS, e.g. MDMB-FUBINACA) elicit more signaling through βarrestin than classical cannabinoids (e.g. HU-210). The authors use an interesting combination of simulations and machine learning. 

      We thank the reviewer for the comments. We have provided point by point response to the reviewer’s comment below and incorporated the suggestions in our revised manuscript. Modified parts of manuscripts are highlighted in yellow.   

      Comments:

      (1) The caption for Figure 3 doesn't explain the color scheme, so it's not obvious what the start and end states of the ligand are. 

      We thank the reviewer to point this out. We have added the color scheme in the figure caption. 

      (2) For the metadynamics simulations were multiple Gaussian heights/widths tried to see what, if any, impact that has on the unbinding pathway? That would be useful to help ensure all the relevant pathways were explored.  

      We thank the reviewer for the suggestion. We agree with the reviewer that gaussian height/width may impact unbinding pathway. However, we like to point out that we used a well-tempered version of the metadynamics. In well-tempered metadynamics, the effective gaussian height decreases as bias deposition progresses. Therefore, we believe that the gaussian height/width should have minimal impact on the unbinding pathway. To address the reviewer's suggestion, we conducted additional well-tempered metadynamics simulations varying key parameters such as bias height, bias factor, and the deposition rate, all of which can influence the sampling space. Parameter values for bias height, bias factor and deposition rate that we originally used in the paper are 0.4 kcal/mol, 15 and 1/5 ps<sup>-1</sup>, respectively. We explored different values for these parameters and projected the sampled space on top of previously sampled region (Figure S4). We observed that new simulations sample similar unbinding pathway in the extracellular direction and discover similar space in the binding pocket as well. 

      Results and Discussion (Page 10)

      “We also performed unbinding simulations using well-tempered metadynamics parameters (bias height, bias deposition rate and bias factor) to confirm the existence of alternative pathways (Figure S4). However, the simulations show that ligands follow the similar pathway for all

      metadynamics runs.”

      (3) It would be nice to acknowledge previous applications of metadynamics+MSMs and (separately) TRAM, such as the Simulation of spontaneous G protein activation... (Sun et al. eLife 2018) and Estimation of binding rates and affinities... (Ge and Voelz JCP 2022). 

      We appreciate the reviewer's feedback. We have incorporated additional citations of studies demonstrating the use of TRAM as an estimator for both kinetics and thermodynamics (e.g. Ligand binding: Ge, Y. and Voelz, V.A., JCP, 2022[1]; Peptide-protein binding kinetics: Paul, F. et al., Nat. Commun., 2017[2], Ge, Y. et al., JCIM, 2021[3]). Additionally, we have included references to studies where biased simulations were initially used to explore the conformational space, and the results were then employed to seed unbiased simulations for building a Markov state model. (Metadynamics: Sun, X. et al., elife, 2018[4]; Umbrella Sampling: Abella, J. R. et al., PNAS, 2020[5]; Replica Exchange: Paul, F. et al., Nat. Commun., 2017[2]).

      (4) What is KL divergence analysis between macrostates? I know KL divergence compares probability distributions, but it is not clear what distributions are being compared. 

      We apologize for this confusion. The KL divergence analysis was performed on the probability distributions of the inverse distances between residue pairs from any two macrostates. Each macrostate was represented by 1000 frames that were selected proportional to the TRAM stationary density. All possible pair-wise inverse distances were calculated per frame for the purpose of these calculations. Although KL divergence is inherently asymmetric, we symmetrized the measurement by calculating the average. Per-residue K-L divergence, which is shown in the main figures as color and thickness gradient, was calculated by taking the sum of all pairs corresponding to the residue. We have included a detailed discussion of K-L divergence in Methods section.  We have also modified the result section to add a brief discussion of K-L divergence methodology.

      Results and Discussion (Page 15)

      “We further performed Kullback-Leibler divergence (K-L divergence) analysis between inverse distance of residue pairs of two macrostates to highlight the protein region that undergoes high conformational change with ligand movement.”

      Methods (Page 33)

      “Kullback–Leibler divergence (K-L divergence) analysis was performed to show the structural differences in protein conformations in different macrostates[4,114] . In this study, this technique was used to calculate the difference in the pairwise inverse distance distributions between macrostates. Each macrostate was represented by 1000 frames that were selected proportional to their TRAM weighted probabilities. Although K-L divergence is an asymmetric measurement, for this study, we used a symmetric version of the K-L divergence by taking the average between two macrostates. Per residue contribution of K-L divergence was calculated by taking the sum of all the pairwise distances corresponding to that residue. This analysis was performed by inhouse Python code.”  

      (5) I suggest being more careful with the language of universality. It can be "supported" but "showing" or "proving" its universal would require looking at all possible chemicals in the class. 

      We thank the reviewer for the suggestion. In response, we have revised the manuscript to ensure that the language reflects that our findings are based on observations from a limited set of ligands, namely one NPS and one classical cannabinoid. We have replaced references to ligand groups (such as NPS or classical cannabinoid) with the specific ligand names (such as MDMB-FUBINACA or HU-210) to avoid claims of universality and prevent any potential confusion.

      Results and Discussion (Page 19)

      “In this work, we trained the network with the NPS (MDMB-FUBINACA), and classical cannabinoid (HU-210) bound unbiased trajectories (Method Section). Here, we compared the allosteric interaction weights between the binding pocket and the NPxxY motif which involves in triad interaction formation. Results show that each binding pocket residue in MDMBFUBINACA bound ensemble shows higher allosteric weights with the NPxxY motif, indicating larger dynamic interactions between the NPxxY motif and binding pocket residues(Figure S9).  The probability of triad formation was estimated to observe the effect of the difference in allosteric control. TRAM weighted probability calculation showed that MDMB-FUBINACA bound CB1 has the higher probability of triad formation (Figure 8A). Comparison of the pairwise interaction of the triad residues shows that interaction between Y397<sup>7.53</sup>-T210<sup>3.46</sup> is relatively more stable in case of MDMB-FUBINACA bound CB1, while other two inter- actions have similar behavior for both systems (Figures S10A, S10B, and S10C). Therefore, higher interaction between Y397<sup>7.53</sup> and T210<sup>3.46</sup> in MDMB-FUBINACA bound receptor causes the triad interaction to be more probable. 

      Furthermore, we also compared TM6 movement for both ligand bound ensemble which is another activation metric involved in both G-protein and β-arrestin binding. Comparison of TM6 distance from the DRY motif of TM3 shows similar distribution for HU-210 and MDMBFUBINACA (Figure 8B). These observations support that NPS binding causes higher β-arrestin signaling by allosterically controlling triad interaction formation.” 

      Reviewer #2 (Public Review): 

      Summary: 

      The investigation provides computational as well as biochemical insights into the (un)binding mechanisms of a pair of psychoactive substances into cannabinoid receptors. A combination of molecular dynamics simulation and a set of state-of-the art statistical post-processing techniques were employed to exploit GPCR-ligand dynamics. 

      Strengths: 

      The strength of the manuscript lies in the usage and comparison of TRAM as well as Markov state modelling (MSM) for investigating ligand binding kinetics and thermodynamics. Usually, MSMs have been more commonly used for this purpose. But as the authors have pointed out, implicit in the usage of MSMs lies the assumption of detailed balance, which would not hold true for many cases especially those with skewed binding affinities. In this regard, the author's usage of TRAM which harnesses both biased and unbiased simulations for extracting the same, provides a more appropriate way out. 

      Weaknesses: 

      (1) While the authors have used TRAM (by citing MSM to be inadequate in these cases), the thermodynamic comparisons of both techniques provide similar values. In this case, one would wonder what advantage TRAM would hold in this particular case. 

      We thank the reviewer for the comment. While we agree that the thermodynamic comparisons between MSM and TRAM provide similar values in this instance, we would like to emphasize the underlying reasoning behind our choice of TRAM.

      MSM can struggle to accurately estimate thermodynamic and kinetic properties in cases where local state reversibility (detailed balance) is not easily achieved with unbiased sampling. This is especially relevant in ligand unbinding processes, which often involve overcoming high free energy barriers. TRAM, by incorporating biased simulation data (such as umbrella sampling) in addition to unbiased data, can better achieve local reversibility and provide more robust estimates when unbiased sampling is insufficient.

      The similarity in thermodynamic estimates between MSM and TRAM in our study can be attributed to the relatively long unbiased sampling period (> 100 µs) employed. With sufficient sampling, MSM can approach detailed balance, leading to results comparable to those from TRAM. However, as we demonstrated in our manuscript (Figure 4D), when the amount of unbiased sampling is reduced, the uncertainties in both the thermodynamics and kinetics estimates increase significantly for MSM compared to TRAM. Thus, while MSM and TRAM perform similarly under the conditions of extensive sampling, TRAM's advantage lies in its robustness when unbiased sampling is limited or difficult to achieve. 

      (2) The initiation of unbiased simulations from previously run biased metadynamics simulations would almost surely introduce hysteresis in the analysis. The authors need to address these issues. 

      We thank the reviewer for the comment. We acknowledge that biased simulations could potentially introduce hysteresis or result in the identification of unphysical pathways. However, we believe this issue is mitigated using well-tempered metadynamics, which gradually deposit a decaying bias. This approach enables the simulation to explore orthogonal directions of collective variable (CV) space, reducing the likelihood of hysteresis effects(Invernizzi, M. and Parrinello, M., JCTC, 2019[6]).

      Furthermore, there is precedent for using metadynamics-derived pathways to initiate unbiased simulations for constructing Markov State Models (MSMs). This methodology has been successfully applied in studying G-protein activation (Sun, X. et al., elife, 2018[4]).

      Additional support to our observation can be found in two independent binding/unbinding studies of ligands from cannabinoid receptors, which have discovered similar pathway using different CVs (Saleh, et al., Angew. Chem., 2018[7]; Hua, T. et al., Cell, 2020[8]).   

      (3) The choice of ligands in the current work seems very forced and none of the results compare directly with any experimental data. An ideal case would have been to use the seminal D.E. Shaw research paper on GPCR/ligand binding as a benchmark and then show how TRAM, using much lesser biased simulation times, would fare against the experimental kinetics or even unbiased simulated kinetics of the previous report 

      We would like to address the reviewer's concerns regarding the choice of ligands, lack of direct experimental comparison, and the use of TRAM, and clarify our rationale point by point:

      Ligand Choice: The ligands selected for this study were chosen due to their relevance and well characterized binding properties. MDMB-FUBINACA is well-known NPS ligand with documented binding properties. This ligand is still the only NPS ligand with experimentally determined CB1 bound structure (Krishna Kumar, K. et al., Cell, 2019[9]). Similarly, the classical cannabinoid (HU-210) used in this study has established binding characteristics and is one of earliest known synthetic classical cannabinoid. Therefore, these ligands serve as representative compounds within their respective categories, making them suitable for our comparative analysis.

      Experimental Comparison: We have indeed compared our simulation results to experimental data, particularly focusing on binding free energies. In the result section, we have shown that the relative binding free energy estimated from our simulation aligns closely with the experimentally measured values. Additionally, Absolute binding energy estimates are also within ~3 kcal/mol of the experimentally predicted value.

      TRAM Performance: TRAM estimated free energies, and rates have been benchmarked against experimental predictions for various studies along with our study (Peptide-protein binding: Paul, F. et al., Nat. Commun., 2017[2]; Ligand unbinding: Wu, H. et al., PNAS, 2016[10]) . As the primary goal of this study is to compare ligand unbinding mechanism, we believe benchmarking against other datasets, such as the D.E. Shaw GPCR/ligand binding paper, is not essential for this work.

      (4) The method section of the manuscript seems to suggest all the simulations were started from a docked structure. This casts doubt on the reliability of the kinetics derived from these simulations that were spawned from docked structure, instead of any crystallographic pose. Ideally, the authors should have been more careful in choosing the ligands in this work based on the availability of the crystallographic structures. 

      We thank the reviewer for the comment. We would like to clarify that we indeed used an experimentally derived pose for one of the ligands (MDMB-FUBINACA) as the cryo-EM structure of MDMB-FUBINACA bound to the protein was available (PDB ID: 6N4B) (Krishna Kumar K. et al., Cell, 2019[9]). However, as the cryo-EM structure had missing loops, we modeled these regions using Rosetta. We apologize for this confusion and have modified our method section to make this point clearer. 

      Regarding HU-210, we acknowledge that a crystallographic or cryo-EM structure for this specific ligand was not available. We selected HU-210 because it is most commonly used example of classical cannabinoid in the literature with extensively studied thermodynamic properties. Importantly, our docking results for HU-210 align closely with previously experimentally determined poses for other classical cannabinoids (Figure S11) and replicate key polar interactions, such as those with S383<sup>7.39</sup>, which are characteristic of this class of compounds. 

      System Preparation (Page 22)

      “Modeling of this membrane proximal region was also performed Remodel protocol of Rosetta loop modeling. A distance constraint is added during this modeling step between C98N−term and C107N−term to create the disulfide bond between the residues. [74,76] 

      As the cryo-EM structure of MDMB-FUBINACA was known, ligand coordinate of MDMB- FUBINACA was added to the modeled PDB structure. The “Ligand Reader & Modeler” module of CHARMM-GUI was used for ligand (e.g., MDMB-Fubinaca) parameterization using CHARMM General Force Field (CGenFF).[77]”

      (5) The last part of using a machine learning-based approach to analyze allosteric interaction seems to be very much forced, as there are numerous distance-based more traditional precedent analyses that do a fair job of identifying an allosteric job. 

      We thank the reviewer for the valuable comment. Neural relational inference method, which leverages a VAE (Variational Autoencoder) architecture, attempts to reconstruct the conformation (X) at time t + τ based on the conformation at time t. In doing so, it captures the non-linear dynamic correlations between residues in the VAE latent space. We chose this method because it is not reliant on specific metrics such as distance or angle, making it potentially more robust in predicting allosteric effects between the binding pocket residues and the NPxxY motif.

      In response to the reviewer's suggestion, we have also performed a more traditional allosteric analysis by calculating the mutual information between the binding pocket residues and the NPxxY motif. Mutual information was computed based on the backbone dihedral angles, as this provides a metric that is independent of the relative distances between residues. Our results indicate that the mutual information between the binding pocket residues and the NPxxY motif is indeed higher for the NPS binding simulation (Figure S11).

      Method

      Mutual information calculation

      Mutual information was calculated on same trajectory data as NRI analysis. Python package MDEntropy was used for estimating mutual information between backbone dihedral angles of two residues. 

      Results and Discussion (Page 21)

      “To further validate our observations, we estimated allosteric weights between the binding pocket and the NPxxY motif by calculating mutual information between residue movements. Mutual information analysis reaffirms that allosteric weights between these residues are indeed higher for the MDMB-FUBINACA bound ensemble (Figure S11).”

      Mutual Information Estimation (Page 37)

      “Mutual information between dynamics of residue pairs was computed based on the backbone dihedral angles, as this provides a metric that is independent of the relative distances between residues. The calculations were done on same trajectory data as NRI analysis. Python package MDEntropy was used for estimating mutual information between backbone dihedral angles of two residues.[124]”

      (6) While getting busy with the methodological details of TRAM vs MSM, the manuscript fails to share with sufficient clarity what the distinctive features of two ligand binding mechanisms are. 

      We thank the reviewer for the insightful comment. In the manuscript, we discussed that the overall ligand (un)binding pathways are indeed similar for both ligands. Therefore, they interact with similar residues during the unbinding process. However, we have focused on two key differences in unbinding mechanism between the two ligands:

      (1) MDMB-FUBINACA exhibits two distinct unbinding mechanisms. In one, the linked portion of the ligand exits the receptor first. In the other mechanism, the ligand rotates within the pocket, allowing the tail portion to exit first. By contrast, for HU-210, we observe only a single unbinding mechanism, where the benzopyran ring leads the ligand out of the receptor. We have highlighted these differences in the Figure 6 and 7 and talked about the intermediate states appear along these different unbinding mechanisms. For further clarification of these differences, we have added arrows in the free energy landscapes to highlight these distinct pathways.

      (2) In the bound state, a significant difference is observed in the interaction profiles. HU-210, a classical cannabinoid, forms strong polar interactions with TM7, while MDMB-FUBINACA shows weaker polar interactions with this region.

      We have discussed these differences in the Results and Discussion section (Page 13-18) & conclusion section (Page 23-24).

      Recommendations for the authors:

      Reviewer #2 (Recommendations For The Authors): 

      (1) The authors should choose at least one case where the ligand's crystallographic pose is known and show how TRAM works in comparison to MSM or experimental report. 

      We thank the reviewer for the comment. We have used the experimentally determined cryo-EM pose for one of the ligands (i.e. MDMB-FUBINACA).  We have modified the manuscript to avoid confusion. (Please refer to the response of comment 4 of reviewer 2)

      (2) The authors should consider existing traditional methods that are used to detect allostery and compare their machine-learning-based approach to show its relevance. 

      We appreciate the reviewer’s comment. We have performed the traditional analysis by calculating mutual information between residue dynamics. We have shown that the traditional analysis matches with Machine learning based NRI calculation. (Please refer to the response of comment 5 of reviewer 2)

      (3) Figure 3 doesn't provide a guide on the pathway of ligand. Without a proper arrow, it is difficult to surmise what is the start and end of the pathway. The figures should be improved. 

      We appreciate the reviewer’s suggestion. In response, we have revised Figure 3 to clearly indicate the ligand’s unbinding pathway by adding directional arrows and labeling the bound pose. Additionally, we have updated the figure caption to better clarify the color scheme used in the illustration. 

      (4) The Figure 5 presentation of free energetics has a very similar shape for the two ligands. More clarity is required on how these two ligands are different. 

      We thank the reviewer for the comment. While the overall shapes of the free energy profiles for the two ligands are indeed similar, this is expected as both ligands dissociate from the same pocket and follow a comparable pathway. However, key differences in their unbinding mechanisms arise due to variations in the ligand motion within the pocket. Specifically, the intermediate metastable minima in the free energy landscapes reflect these differences. For instance, in the NPS unbinding free energy landscape, the intermediate metastable state I1 corresponds to a conformation where the NPS ligand maintains a polar interaction with TM7, while the tail of the ligand has shifted away from TM5. This intermediate state is absent in the classical cannabinoid unbinding pathway, where no equivalent conformation appears in the landscape.  

      (6) Page 30: TICA is wrongly expressed as 'Time-independent component analysis'. It is not a time-independent process. Rather it is 'Time structured independent component analysis'. 

      We thank the reviewer for pointing this out. TICA should be expressed as Time-lagged independent component analysis or Time-structure independent component analysis. We have used the first expression and modified the manuscript accordingly.  

      (7) The manuscript's MSM theory part is quite well-known which can be removed and appropriate papers can be cited. 

      We thank the reviewer for the comment. We have removed the theory discussion of MSM and cited relevant papers.

      “Markov State Model

      Markov state model (MSM) is used to estimate the thermodynamics and kinetics from the unbiased simulation.[56,91] MSM characterizes a dynamic process using the transition probability matrix and estimates its relevant thermodynamics and kinetic properties from the eigendecomposition of this matrix. This matrix is usually calculated using either maximum likelihood or Bayesian approach.[56,97] The prevalence of MSM as a post-processing technique for MD simulations was due to its reliance on only local equilibration of MD trajectories to predict the global equilibrium properties.[92,93] Hence, MSM can combine information from distinct short trajectories, which can only attain the local equilibrium.[94–96]  

      The following steps are taken for the practical implementation of the MSM from the MD data. [4,17,98–100]”

      (8) A proper VAMP score-based analysis should be provided to show confidence in MSM's clustering metric and other hyperparameters. 

      We thank the reviewer for the recommendation. VAMP-2 score based analysis had been discussed in the method section.  We estimated VAMP-2 score of MSM built with different cluster number and input TIC dimensions (Figure S15). Model with best VAMP-2 was selected for comparison with TRAM result.

    1. eLife Assessment

      This fundamental study investigates the role of polyunsaturated fatty acids (PUFAs) in physiology and membrane biology, using a unique model to perform a thorough genetic screen that demonstrates that PUFA synthesis defects cannot be compensated for by mutations in other pathways. These findings are supported by compelling evidence from a high quality genetic screen, functional validation of their hits, and lipid analyses. This study will appeal to researchers in membrane biology, lipid metabolism, and C. elegans genetics.

    2. Reviewer #1 (Public review):

      Summary:

      This study addresses the roles of polyunsaturated fatty acids (PUFAs) in animal physiology and membrane function. A C. elegans strain carrying the fat-2(wa17) mutation possess a very limited ability to synthesize PUFAs and there is no dietary input because the E. coli diet consumed by lab grown C. elegans does not contain any PUFAs. The fat-2 mutant strain was characterized to confirm that the worms grow slowly, have rigid membranes, and have a constitutive mitochondrial stress response. The authors showed that chemical treatments or mutations known to increase membrane fluidity did not rescue growth defects. A thorough genetic screen was performed to identify genetic changes to compensate for the lack of PUFAs. The newly isolated suppressor mutations that compensated for FAT-2 growth defects included intergenic suppressors in the fat-2 gene, as well as constitutive mutations in the hypoxia sensing pathway components EGL-9 and HIF-1, and loss of function mutations in ftn-2, a gene encoding the iron storage protein ferritin. Taken together, these mutations lead to the model that increased intracellular iron, an essential cofactor for fatty acid desaturases, allows the minimally functional FAT-2(wa17) enzyme to be more active, resulting in increased desaturation and increased PUFA synthesis.

      Strengths:

      (1) This study provides new information further characterizing fat-2 mutants. The authors measured increased rigidity of membranes compared to wild type worms, however this rigidity is not able to be rescued with other fluidity treatments such as detergent or mutants. Rescue was only achieved with polyunsaturated fatty acid supplementation.<br /> (2) A very thorough genetic suppressor screen was performed. In addition to some internal fat-2 compensatory mutations, the only changes in pathways identified that are capable of compensating for deficient PUFA synthesis was the hypoxia pathway and the iron storage protein ferritin. Suppressor mutations included an egl-9 mutation that constitutively activates HIF-1, and Gain of function mutations in hif-1 that are dominant. This increased activity of HIF conferred by specific egl-9 and hif-1 mutations lead to decreased expression of ftn-2. Indeed, loss of ftn-2 leads to higher intracellular iron. The increased iron apparently makes the FAT-2 fatty acid desaturase enzyme more active, allowing for the production of more PUFAs.<br /> (3) The mutations isolated in the suppressor screen show that the only mutations able to compensate for lack of PUFAs were ones that increased PUFA synthesis by the defective FAT-2 desaturase, thus demonstrating the essential need for PUFAs that cannot be overcome by changes in other pathways. This is a very novel study, taking advantage of genetic analysis of C. elegans, and it confirms the observations in humans that certain essential PUFAs are required for growth and development.<br /> (4) Overall, the paper is well written, and the experiments were carried out carefully and thoroughly. The conclusions are well supported by the results.

      Weaknesses:

      Overall, there are not many weaknesses. The main one I noticed is that the lipidomic analysis shown in Figs 3C, 7C, S1 and S3. Whie these data are an essential part of the analysis and provide strong evidence for the conclusions of the study, it is unfortunate that the methods used did not enable the distinction between two 18:1 isomers. These two isomers of 18:1 are important in C. elegans biology, because one is a substrate for FAT-2 (18:1n-9, oleic acid) and the other is not (18:1n-7, cis vaccenic acid). Although rarer in mammals, cis-vaccenic acid is the most abundant fatty acid in C. elegans and is likely the most important structural MUFA. The measurement of these two isomers is not essential for the conclusions of the study, but the manuscript should include a comment about the abundance of oleic vs vaccenic acid in C. elegans (authors can find this information, even in the fat-2 mutant, in other publications of C. elegans fatty acid composition). Otherwise, readers who are not familiar with C. elegans might assume the 18:1 that is reported is likely to be mainly oleic acid, as is common in mammals.

      Other suggestions to authors to improve the paper:<br /> (1) The title could be less specific; it might be confusing to readers to include the allele name in the title.<br /> (2) There are two errors in the pathway depicted in Figure 1A. The16:0-16:1 desaturation can be performed by FAT-5, FAT-6, and FAT-7. The 18:0-18:1 desaturation can only be performed by FAT-6 and FAT-7

    3. Reviewer #2 (Public review):

      Summary:

      The authors use a genetic screen in C. elegans to investigate the physiological roles of polyunsaturated fatty acids (PUFAs). They screen for mutations that rescue fat-2 mutants, which have strong reductions in PUFAs. As a result, either mutations in fat-2 itself, or mutations in genes involved in the HIF-1 pathway, were found to rescue fat-2 mutants. Mutants in the HIF-1 pathway rescue fat-2 mutants by boosting its catalytic activity (via upregulated Fe2+). Thus, the authors show that in the context of fat-2 mutation, the sole genetic means to rescue PUFA insufficiency is to restore PUFA levels.

      Strengths:

      As C. elegans can produce PUFAs de novo as essential lipids, the genetic model is well suited to study the fundamental roles of PUFAs. The genetic screen finds mutations in convergent pathways, suggesting that it has reached near-saturation. The authors extensively validate the results of the screening and provide sufficient mechanistic insights to show how PUFA levels are restored in HIF-1 pathway mutants. As many of the mutations found to rescue fat-2 mutants are of gain-of-function, it is unlikely that similar discoveries could have been made with other approaches like genome-wide CRISPR screenings, making the current study distinctive. Consequently, the study provides important messages. First, it shows that PUFAs are essential for life. The inability to genetically rescue PUFA deficiency, except for mutations that restore PUFA levels, suggests that they have pleiotropic essential functions. In addition, the results suggest that the most essential functions of PUFAs are not in fluidity regulation, which is consistent with recent reviews proposing that the importance of unsaturation goes beyond fluidity (doi: 10.1016/j.tibs.2023.08.004 and doi: 10.1101/cshperspect.a041409). Thus, the study provides fundamental insights about how membrane lipid composition can be linked to biological functions.

      Weaknesses:

      The authors did a lot of efforts to answer the questions that arose through peer review, and now all the claims seem to be supported by experimental data. Thus, I do not see obvious weaknesses. Of course, it remains still unclear what PUFAs do beyond fluidity regulation, but this is something that cannot be answered from a single study. I just have one final proposition to make.

      I still do not agree with the answer to my previous comment 6 regarding Figure S2E. The authors claim that hif-1(et69) suppresses fat-2(wa17) in a ftn-2 null background (in Figure S2 legend for example). To claim so, they would need to compare the triple mutant with fat-2(wa17);ftn-2(ok404) and show some rescue. However, we see in Figure 5H that ftn-2(ok404) alone rescues fat-2(wa17). Thus, by comparing both figures, I see no additional effect of hif-1(et69) in an ftn-2(ok404) background. I actually think that this makes more sense, since the authors claim that hif-1(et69) is a gain-of-function mutation that acts through suppression of ftn-2 expression. Thus, I would expect that without ftn-2 from the beginning, hif-1(et69) does not have an additional effect, and this seems to be what we see from the data. Thus, I would suggest that the authors reformulate their claims regarding the effect of hif-1(et69) in the ftn-2(ok404) background, which seems to be absent (consistently with what one would expect).

    4. Author response:

      The following is the authors’ response to the original reviews

      Reviewer #1:

      While very positive towards our manuscript, this reviewer also points out three suggestions for improvement.

      Overall, there are not many weaknesses. The main one I noticed is with the lipidomic analysis shown in Figs 3C, 7C, S1 and S3. While these data are an essential part of the analysis and provide strong evidence for the conclusions of the study, it is unfortunate that the methods used did not enable the distinction between two 18:1 isomers. These two isomers of 18:1 are important in C. elegans biology, because one is a substrate for FAT-2 (18:1n-9, oleic acid) and the other is not (18:1n-7, cis vaccenic acid). Although rarer in mammals, cisvaccenic acid is the most abundant fatty acid in C. elegans and is likely the most important structural MUFA. The measurement of these two isomers is not essential for the conclusions of the study, but the manuscript should include a comment about the abundance of oleic vs vaccenic acid in C. elegans (authors can find this information, even in the fat-2 mutant, in other publications of C. elegans fatty acid composition). Otherwise, readers who are not familiar with C. elegans might assume the 18:1 that is reported is likely to be mainly oleic acid, as is common in mammals.

      Excellent point. As suggested by the reviewer, we now include a clarification of this in the text: "Consistent with previous publications [10], the levels of 18:1 fatty acids were greatly increased in the fat-2(wa17) mutant. It is important to note that the majority of these 18:1 fatty acids is likely 18:1n7 (vaccenic acid) and not 18:1n9 (OA) [10,23], which is the substrate of FAT-2; the lipid analysis methods used here are not able to distinguish between the two 18:1 species."

      The title could be less specific; it might be confusing to readers to include the allele name in the title.

      We thank the reviewer for the suggestion, and we have now modified the title:

      "Forward Genetics In C. elegans Reveals Genetic Adaptations To Polyunsaturated Fatty Acid Deficiency"

      There are two errors in the pathway depicted in Figure 1A. The16:0-16:1 desaturation can be performed by FAT-5, FAT-6, and FAT-7. The 18:0-18:1 desaturation can only be performed by FAT-6 and FAT-7.

      We thank the reviewer for pointing out this mistake. The pathway in Fig. 1A has been corrected.

      Reviewer #2:

      This reviewer was also very positive towards our manuscript but also pointed out several suggestions for additional experiments or changes to the manuscript.

      Major recommendations

      (1) To conclude that membrane rigidification is not the major cause of defects associated with fat-2 mutations, the authors need to show that fluidity is rescued by their treatments (oleic acid or NP-40). I honestly doubt that it is the case, as oleic acid is already abundant in fat-2 mutants. It is possible that the treatments, which are effective in rescuing fluidity in paqr-2 mutants, do not have the same effects in fat-2 mutants.

      The reviewer raises an important point. In an effort to address this, we have now performed a FRAP study on fat-2(wa17) mutants with/without NP40 as a fluidizing agent (with wild-type and paqr-2 mutants as controls). The new data, now included as Fig. 2J, shows that NP40 did improve the fluidity of the intestinal cell membrane in the fat-2(wa17) mutant, though not to the same degree as in the paqr-2 mutant. This is now cited in the text as follows:

      "However, cultivating the fat-2(wa17) mutant in the presence of the non-ionic detergent NP40, which improves the growth of the paqr-2(tm3410) mutant [17], did not suppress the poor growth phenotype of the fat-2(wa17) mutant even though it did improve membrane fluidity as measured using FRAP (Fig. 2I-J). Similarly, supplementing the fat-2(wa17) mutant with the MUFA oleic acid (OA, 18:1), which also suppresses paqr-2(tm3410) phenotypes [17], did not suppress the poor growth phenotype of the fat-2(wa17) mutant (Fig 2K)."

      (2) It is not validated experimentally that the mutations converge into FTN-2 repression. This can be verified by analyzing mRNA or protein expression of FTN-2 in the egl-9 and hif-1 mutants obtained in the screening.

      Our manuscript does lean on several publications that previously established the HIF-1 pathway in C. elegans. Additionally, we now added a qPCR experiment showing that the newly isolated hif-1(et69) allele indeed suppresses the expression of ftn-2. This was an especially valuable experiment since the hif-1(et69) is proposed to act as a gain-of-function allele that would constitutively suppress ftn-2 expression. This new result is included as Fig. 6C and mentioned in the text:

      "Inhibition of egl-9 promotes HIF-1 activity [41], which we here verified for the egl-9(et60) allele using western blots (Fig 6A). Additionally, we found by qPCR that ftn-2 mRNA levels are as expected reduced by the proposed gain-of-function hif-1(et69) allele (Fig 6C). We conclude that the egl-9 and hif-1 suppressor mutations likely converge on inhibiting ftn-2 and thus act similarly to the ftn-2 loss-of-function alleles."

      (3) In the hif-1(et69) and ftn-2(et68) mutants, the rescues in lipid composition seem to be minor, with eicosapentaenoic acid (EPA) levels remaining low. The ftn-2 mutant data is especially concerning, as it suggests that egl-9 mutants rescue lipid composition via distinct mechanisms not including ftn-2 suppression. I suggest that the authors test the minimal doses of linoleic acid or EPA required to rescue fat-2 mutants and perform lipidomics to test which is the degree of EPA restoration that is needed. If a low level of restoration is sufficient, the hif-1 and ftn-2 mutants might indeed rescue phenotypes via a restoration of EPA levels. Otherwise, other mechanisms have to be considered.

      In line with the above issue, the low level or EPA restoration in hif-1 and ftn-2 mutants raise the possibility that the mutations rescue fat-2 mutants downstream of lipid changes. The reduction in HIF-1 levels in fat-2 mutants also suggest that lipid changes affect HIF-1 expression. Thus, the "impossibility to genetically compensate PUFA deficiency" might be wrong. The above experiment would answer to this point too.

      The reviewer is entirely correct to consider alternative explanations. In the lipidomics in Fig 3, we see that fat-2(wa17) worms on NGM have only ~1.5-2%mol EPA in phosphatidylcholines. When treated with 2 mM LA, the levels of EPA rise to ~10%mol, still below the ~ 25% observed in N2 but perhaps this is sufficient cause for restoring fat-2(wa17) health. Similarly, the hif-1(et69) and ftn-2(et68) mutant alleles elevate EPA levels to 5- 7% in fat-2(wa17). Thus, we have a correlation where a significant increase in EPA, obtained either through LA supplementation or through suppressor mutations (e.g. egl-9 (et60), hif-1(et69) or ftn-2(et68)), is associated with improved growth and health of the fat-2(wa17) mutant. However, correlation is of course not proof. The suggested experiment to titrate EPA to its lowest fat-2(wa17) rescuing levels and then perform lipidomics analysis was not possible in a reasonable time frame during this revision. However, preliminary experiments showed that even 25 μM LA (most of which will be converted to EPA by the worms) is enough to rescue the fat-2(wa17) or null mutant (Author response image 1), suggesting that even tiny amounts (much below the >250 μM used in our article) bring great benefits.

      Author response image 1.

      Nevertheless, we now acknowledge in the discussion that alternative explanations exist:

      "Other mechanisms are also possible. For example, mutations in the HIF-1 pathway could somehow reduce EPA turnover rates in the fat-2(wa17) mutant and allow its levels to rise above an essential threshold. This hypothesis is consistent with the observation that the suppressors can rescue both the fat-2(wa17) mutant and fat-2 RNAi-treated worms but not the fat-2 null mutant. It is even possible, though deemed unlikely, that the fat-2(wa17) suppressors act by compensating for the PUFA shortage via some undefined separate process downstream of the lipid changes and that they only indirectly result in elevated EPA levels."

      Additionally, another possible mechanism of action of the fat-2(wa17) suppressors could have been that they all cause upregulation of the FAT-2 protein. We have now explored this possibility using Western blots and found that this is an unlikely mechanism. This is presented in Fig. 6D-E and S3C-D, mentioned in the text as follows:

      "We also used Western blots to evaluate the abundance of the FAT-2 protein expressed from endogenous wild-type or mutant loci but to which a HA tag was fused using CRISPR/Cas9. We found that the FAT-2::HA levels are severely reduced when the locus contains the S101F substitution present in the wa17 allele, but restored close to wild-type levels by the fat2(et65) suppressor mutation (Fig 6D-E, S3C-D Fig). The levels of FAT-2 in the HIF-1 pathway suppressors varied between experiments, with the suppressors sometimes restoring FAT-2 levels and sometimes not even when the worms were growing well (Fig 6D-E, S3C-D Fig). The fat-2(wa17) suppressors, except for the intragenic fat-2 alleles, likely do not act by increasing FAT-2 protein levels."

      (4) It should be tested how Fe2+ levels are changed in the mutants, and how effective the ferric ammonium citrate treatment is. The authors might use a ftn-1::GFP reporter for this purpose.

      We did obtain a strain carrying the ftn-1::GFP reporter but could not generate conclusive data with it. In particular, we saw no increase in fluorescence in fat-2(wa17) worms carrying suppressor mutations. However, we also found that even FAC treatment that rescue the fat2(wa17) mutant did not result in a measurable increased GFP levels suggesting that the reporter is not sensitive enough.

      Minor comments

      (1) I think that putting Figure 6A in Figure 5 would be helpful for the readers, so that they understand that the mutations converge in the same pathway.

      This is now done.

      (2) Page 3: While it is clear that paqr-2 regulates lipid composition, I believe that it remains unclear if it "promote the production and incorporation of PUFAs into phospholipids to restore membrane homeostasis".

      A reference was missing to support that statement. Ruiz et al. (2023) is now cited for this (ref. 7).

      (3) C. elegans is extremely rich in EPA (see for example DOI: 10.3390/jcm5020019), but the lipidomics data in this study rather suggest that oleic acid is predominant. I recommend to check why this discrepancy occurs.

      OA (18:1n9) makes up only ~2%, but vaccenic acid (18:1n7) is ~21% in WT worms, EPA is slightly less at ~19% (Watts et al. 2002). These match with our lipidomics results although we cannot distinguish between 18:1n9 and n7. See also answer to Reviewer #1, comment 1.

      (4) Abstract: The authors write that mammals do not synthesize PUFAs, which is almost correct, but they still produce the PUFA mead acid. Thus, the statement is not completely right.

      Didn't know that! From literature, it is our understanding that mammals synthesize mead acid during FA deficiency but not in normal conditions, so they are not regularly producing mead acid. We have now updated the introduction:

      "An exception to this exists during severe essential fatty acid deficiency when mammals can synthesize mead acid (20:3n9), though this is not a common occurrence [11]"

      (5) Page 10: Eicosanoids are C20 lipid mediators, thus those produced from docosahexaenoic acid are not eicosanoids. Correct the statement.

      We thank the reviewer for pointing this out. We now write:

      " EPA and DHA, being long chain PUFAs should have similar fluidizing effects on membrane properties (though in vitro experiments challenge this view [78]), and both can serve as precursors of eicosanoids or docosanoids, particularly inflammatory ones [79]."

      (6) Page 7: "hif-1(et69) is similarly able to suppress fat-2(wa17) when ftn-2 is knocked out" I am not sure that the data agrees with this statement, and it is unclear what we can conclude from such observation.

      Fig. 2D shows that ftn-2(et68) suppresses fat-2(wa17) even in the presence of a hif-1(ok2654) null allele, showing that no HIF-1 function is required once ftn-2 is mutated. Conversely, Fig S2E shows that combining both the hif-1(et69) and the ftn-2(ok404) null allele also suppresses fat-2(wa17) (the worms do not fully reach N2 length, but they are significantly longer and were fertile adults); this is merely the expected outcome if the pathway converges on loss of ftn-2 function, though other interpretations could be possible from this experiment alone.

      (7) S3 Fig: in panel B, is the last column ftn-2;egl-9 mutant? I would imagine that it is ftn2;fat-2.

      We thank the reviewer for pointing this out. This has been corrected.

      (8) Fig 6B, how many times has been this experiment done?

      With these exact conditions (6h and 20h hypoxia) and order of strains the blot was done once, but the blot overall was done 5 times. We now added another replicate in Fig. S3A.

      Note also that a few minor modifications have been made throughout the text, which can be seen in the Word file with tracked changes.

    1. eLife Assessment

      This paper provides a useful new theory of the hallucinatory effects of psychedelics. The authors present convincing evidence that a computational model trained with the Wake-Sleep algorithm can reproduce some features of hallucinations by varying the strength of top-down connections in the model, but discussion of the model's relationships to the psychedelics and sleep literatures is incomplete. The work will be of interest to researchers studying hallucinations or offline activity and learning more broadly.

    2. Reviewer #1 (Public review):

      Bredenberg et al. aim to model some of the visual and neural effects of psychedelics via the Wake-Sleep algorithm. This is an interesting study with findings that go against certain mainstream ideas in psychedelic neuroscience (that I largely agree with). I cannot speak to the math in this manuscript, but it seems like quite a conceptual leap to set a parameter of the model in between wake and sleep and state that this is a proxy to acute psychedelic effects (point #20). My other concerns below are related to the review of the psychedelic literature:

      (1) Page 1, Introduction, "...they are agonists for the 5-HT2a serotonin receptor commonly expressed on the apical dendrites of cortical pyramidal neurons..." It is a bit redundant to say "5-HT2A serotonin receptor," as serotonin is already captured by its abbreviation (i.e., 5-HT).

      While psychedelic research has focused on 5-HT2A expression on cortical pyramidal cells, note that the 5-HT2A receptor is also expressed on interneurons in the medial temporal lobe (entorhinal cortex, hippocampus, and amygdala) with some estimates being >50% of these neurons (https://doi.org/10.1016/j.brainresbull.2011.11.006, https://doi.org/10.1007/s00221-013-3512-6, https://doi.org/10.7554/eLife.66960, https://doi.org/10.1016/j.mcn.2008.07.005, https://doi.org/10.1038/npp.2008.71, https://doi.org/10.1038/s41386-023-01744-8, https://doi.org/10.1016/j.brainres.2004.03.016, https://doi.org/10.1016/S0022-3565(24)37472-5, https://doi.org/10.1002/hipo.22611, https://doi.org/10.1016/j.neuron.2024.08.016). However, with ~1:4 ratio of inhibitory to excitatory neurons in the brain (https://doi.org/10.1101/2024.09.24.614724), this can make it seem as if 5-HT2A expression is negligible in the MTL. I think it might be important to mention these receptors, as this manuscript discusses replay.

      I see now that Figure 1 mentions that PV cells also express 5-HT2A receptors. This should probably be mentioned earlier.

      (2) Page 1, Introduction, "They have further been used for millennia as medicine and in religious rituals..." This might be a romanticization of psychedelics and indigenous groups, as anthropological evidence suggests that intentional psychedelic use might actually be more recent (see work by Manvir Singh and Andy Letcher).

      (3) When discussing oneirogens, it could be worth differentiating psychedelics from kappa opioid agonists such as ibogaine and salvinorin A, another class of hallucinogens that some refer to as "oneirogens" (similar to how "psychedelic" is the colloquial term for 5-HT2A agonists). Note that studies have found the effects of Salvia divinorum (which contains salvinorin A) to be described more similarly to dreams than psychedelics (https://doi.org/10.1007/s00213-011-2470-6). This makes me wonder why the present study is more applicable to 5-HT2A psychedelics than other kappa opioid agonists or other classes of hallucinogens (e.g., NMDA antagonists, muscarinic antagonists, GABAA agonists).

      (4) Page 2, Introduction, "Replay sequences have been shown to be important for learning during sleep [14, 15, 16, 17, 18]: we propose that mechanisms supporting replay-dependent learning during sleep are key to explaining the increases in plasticity caused by psychedelic drug administration." I'm not sure I follow the logic of this point. Dreams happen during REM sleep, whereas replay is most prominent during non-REM sleep. Moreover, while it's not clear what psychedelics do to hippocampal function, most evidence would suggest they impair it. As mentioned, most 5-HT2A receptors in the hippocampus seem to be on inhibitory neurons, and human and animal work finds that psychedelics impair hippocampal-dependent memory encoding (https://doi.org/10.1037/rev0000455, https://doi.org/10.1037/rev0000455, https://doi.org/10.3389/fnbeh.2014.00180, https://doi.org/10.1002/hipo.22712). One study even found that psilocin impairs hippocampal-dependent memory retrieval (https://doi.org/10.3389/fnbeh.2014.00180). Note that this is all in reference to the acute effects (psychedelics may post-acutely enhance hippocampal-dependent memory, https://doi.org/10.1007/s40265-024-02106-4).

      (5) Page 2, Introduction, "In total, our model of the functional effect of psychedelics on pyramidal neurons could provide a explanation for the perceptual psychedelic experience in terms of learning mechanisms for consolidation during sleep..." In contrast to my previous point, I think this could be possible. Three datasets have found that psychedelics may enhance cortical-dependent memory encoding (i.e., familiarity; https://doi.org/10.1037/rev0000455, https://doi.org/10.1037/rev0000455), and two studies found that post-encoding administration of psychedelics retroactively enhanced memory that may be less hippocampal-dependent/more cortical-dependent (https://doi.org/10.1016/j.neuropharm.2012.06.007, https://doi.org/10.1016/j.euroneuro.2022.01.114). Moreover, and as mentioned below, 5 studies have found decoupling between the hippocampus and the cortex (https://doi.org/10.3389/fnhum.2014.00020, https://doi.org/10.1002/hbm.22833, https://doi.org/10.1016/j.celrep.2021.109714, https://doi.org/10.1162/netn_a_00349, https://doi.org/10.1038/s41586-024-07624-5), something potentially also observed during REM sleep that is thought to support consolidation (https://doi.org/10.1073/pnas.2123432119). These findings should probably be discussed.

      (6) Page 2, Introduction, "In this work, we show that within a neural network trained via Wake-Sleep, it is possible to model the action of classical psychedelics (i.e. 5-HT2a receptor agonism)..." Note that 5-HT2A agonism alone is not sufficient to explain the effects of psychedelics, given that there are 5-HT2A agonists that are non-hallucinogenic (e.g., lisuride).

      (7) Page 2, Introduction, "...by shifting the balance during the wake state from the bottom-up pathways to the top-down pathways, thereby making the 'wake' network states more 'dream-like'." I could have included this in the previous point, but I felt that this idea deserved its own point. There has been a rather dogmatic assertion that psychedelics diminish top-down processing and/or enhance bottom-up processing, and I appreciate that the authors have not accepted this as fact. However, because this is an unfortunately prominent idea, I think it ought to be fleshed out more by first mentioning that it's one of the tenets of REBUS. REBUS has become a popular model of psychedelic drug action, but it's largely unfalsifiable (it's based on two unfalsifiable models, predictive processing and integrated information theory), so the findings from this study could tighten it up a bit. Second, there have now been a handful of studies that have attempted to study directionality in information flow under psychedelics, and the findings are rather mixed including increased bottom-up/decreased top-down effects (https://doi.org/10.7554/eLife.59784, https://doi.org/10.1073/pnas.1815129116; note that the latter "bottom-up" effect involves subcortical-cortical connections in which it's less clear what's actually "higher-/lower-level"), increased top-down/decreased bottom-up effects (https://doi.org/10.1038/s41380-024-02632-3, https://doi.org/10.1016/j.euroneuro.2016.03.018), or both (https://doi.org/10.1016/j.neuroimage.2019.116462, https://doi.org/10.1016/j.neuropharm.2017.10.039), though most of these studies are aggregating across largely inhomogeneous states (i.e., resting-state). Lastly, and somewhat problematically, facilitated top-down processing is also an idea proposed in psychosis that's based partially on findings with acute ketamine administration (note that all hallucinations to some degree might rely on top-down facilitation, as a hallucination involves a high-level concept that impinges on lower-level sensory areas; see work by Phil Corlett). While psychosis and the effects of ketamine have some similarities with psychedelics, there are certainly differences, and I think the goal of this manuscript is to uniquely describe 5-HT2A psychedelics (again, I'm left wondering why tweaking alpha in the Wake-Sleep algorithm is any more applicable to psychedelics than other hallucinogenic conditions).

      (8) Figure 2 equates alpha with a "psychedelic dose," but this is a bit misleading, as neither the algorithm nor an individual was administered a psychedelic. Alpha is instead a hypothetical proxy for a psychedelic dose. Moreover, if the model were recapitulating the effects of psychedelics, shouldn't these images look more psychedelic as alpha increases (e.g., they may look like images put through the DeepDream algorithm).

      (9) Page 11, Methods, "...and the gate α ensures that learning only occurs during sleep mode... The (1 − α) gate in this case ensures that plasticity only occurs during the Wake mode." Much of the math escapes me, so perhaps I'm misunderstanding these statements, but learning and plasticity certainly happen during both wake and sleep, making me wonder what is meant by these statements. Moreover, if plasticity is simply neural changes, couldn't plasticity be synonymous with neural learning? Perhaps plasticity and learning are meant to refer to different types of neural changes. It might be worth clarifying this, as a general problem in psychedelic research is that psychedelics are described as facilitating plasticity when brains are changing at every moment (hence not experiencing every moment as the same), and psychedelics don't impact all forms of plasticity equally. For example, psychedelics may not necessarily enhance neurogenesis or the addition of certain receptor types, and they impair certain forms of learning (i.e., episodic memory encoding). What is typically meant by plasticity enhancements induced by psychedelics (and where there's the most evidence) is dendritic plasticity (i.e., the growth of dendrites and spines). Whatever is meant by "plasticity" should be clarified in its first instance in this manuscript.

      (10) Page 12, Methods, "During training, neural network activity is either dominated entirely by bottom-up inputs (Wake, α = 0) or by top-down inputs (Sleep, α = 1)." Again, I could be misunderstanding the mathematical formulation, but top-down inputs operate during wake, and bottom-up inputs can operate during sleep (people can wake up or even incorporate noise from their environments into sleep.

      (11) Page 4, Results, "Thus, we can capture the core idea behind the oneirogen hypothesis using the Wake-Sleep algorithm, by postulating that the bottom-up basal synapses are predominantly driving neural activity during the Wake phase (when α is low)." However, several pieces of evidence (and the first circuit model of psychedelic drug action) suggest that psychedelics enhance functional connectivity and potentially even effective connectivity from the thalamus to the cortex (https://doi.org/10.1093/brain/awab406). Note that psychedelics may not equally impact all subcortical structures. REBUS proposes the opposite of the current study, that psychedelics facilitate bottom-up information flow, with one of the few explicit predictions being that psychedelics should facilitate information flow from the hippocampus to the default mode network. However, as mentioned earlier, 5 studies have found that psychedelics diminish functional connectivity between the hippocampus and cortex (including the DMN but also V1).

      (12) Page 4, Results, "...and have an excitatory effect that positively modulates glutamatergic transmission..." Note that this may not be brainwide. While psychedelics were found to increase glutamatergic transmission in the cortex, they were also found to decrease hippocampal glutamate (consistent with inhibition of the hippocampus, https://doi.org/10.1038/s41386-020-0718-8).

      (13) Page 5, "...which are similar to the 'breathing' and 'rippling' phenomena reported by psychedelic drug users at low doses..." Although it's sometimes unclear what is meant by "low doses," the breathing/rippling effect of psychedelics occurs at moderate and high doses as well.

      (14) I watched the videos, and it's hard for me to say there was some stark resemblance to psychedelic imagery. In contrast, for example, when the DeepDream algorithm came out, it did seem to capture something quite psychedelic.

      (15) Page 5, "This form of strongly correlated tuning has been observed in both cortex and the hippocampus." If this has been observed under non-psychedelic conditions, what does this tell us about this supposed model of psychedelics?

      (16) Page 6, with regards to neural variability, "...but whether this phenomenon [increased variability] is general across tasks and cortical areas remains to be seen." First, is variability here measured as variance? In fMRI datasets that have been used to support the Entropic Brain Hypothesis, note that variance tends to decrease, though certain measures of entropy increase (e.g., Figure 4A here https://doi.org/10.1073/pnas.1518377113 shows global variance decreases, and this reanalysis of those data https://doi.org/10.1002/hbm.23234 finds some entropy increases). Thus, variance and entropy should not be confused (in theory, one could cycle through several more brain states that are however, similar to each other, which would produce more entropy with decreased variance). Second, and perhaps more problematically for the EBH, is that the entropy effects of psychedelics completely disappear when one does a task, and unfortunately, the authors of these findings have misinterpreted them. What they'll say is that engaging in boring cognitive tasks or watching a video decreases entropy under psychedelics, but what you can see in Figure 1b of https://doi.org/10.1021/acschemneuro.3c00289 and Figure 4b of https://doi.org/10.1038/s41586-024-07624-5 is that entropy actually increases under sober conditions when you do a task. That is, it's a rather boring finding. Essentially, when resting in a scanner while sober, many may actually rest (including falling asleep, especially when subjects are asked to keep their eyes closed), and if you perform a task, brain activity should become more complex relative to doing nothing/falling asleep. When under a psychedelic, one can't fall asleep and thus, there's less change (though note that both of the above studies found numerical increases when performing tasks). Lastly, again I should note that the findings of the present study actually go against EBH/REBUS, given that the findings are increased top-down effects when EBH/REBUS predicts decreased top-down/increased bottom-up effects.

      (17) Page 6, "Because psychedelic drug administration increases influence of apical dendritic inputs on neural activity in our model, we found that silencing apical dendritic activity reduced across stimulus neural variability more as the psychedelic drug dose increases." I again want to point out that alpha is not the equivalent of a psychedelic dose here, but rather a parameter in the model that is being proposed as a proxy.

      (18) Page 8, "Experimentally, plasticity dynamics which could, theoretically, minimize such a prediction error have been observed in cortex [66, 67], and it has also been proposed that behavioral timescale plasticity in the hippocampus could subserve a similar function [68]. We found that plasticity rules of this kind induce strong correlations between inputs to the apical and basal dendritic compartments of pyramidal neurons, which have been observed in the hippocampus and cortex [55, 56]." Note that the plasticity effects of psychedelics are sometimes not observed in the hippocampus or are even observed as decreases (reviewed in https://doi.org/10.1038/s41386-022-01389-z).

      (19) Page 9, as is mentioned, REBUS proposes that there should be a decrease in top-down effects under psychedelics, which goes against what is found here, but as I describe above, the effects of psychedelics on various measures of directionality have been quite mixed.

      (20) Unless I'm misunderstanding something, it seems to be a bit of a jump to infer that simply changing alpha in your model is akin to psychedelic dosing. Perhaps if the model implemented biologically plausible 5-HT2A expression and/or its behavior were constrained by common features of a psychedelic experience (e.g., fractal-like visuals imposed onto perception, inability to fall asleep, etc.), I'd be more inclined to see the parallels between alpha and psychedelics dosing. However, it would still need to recapitulate unique effects of psychedelics (e.g., impairments in hippocampal-dependent memory with sparing/facilitation of cortical memory). At the moment, it seems like whatever the model is doing is applicable to any hallucinogenic drug or even psychosis.

    3. Reviewer #2 (Public review):

      This work is a nice contribution to the literature in articulating a specific, testable theory of how psychedelics act to generate hallucinations and plasticity. The connection to replay, however - including in the title, abstract, and framing throughout the paper - is not well fleshed out.

      In particular, the paper's framing seems to conflate replay, dreams, and top-down processing, but these are not one and the same. Picard-Delano et al. TICS 2023 provides a useful review of the differences between replay and dreams. One key point is that most replay has been observed during NREM sleep, but our canonically bizarre / vivid dreams occur during REM. Top-down connections have also been proposed to be used for many processes aside from replay. The paper would benefit from much more precision and nuance on these points.

      I believe the paper is missing demonstrations or speculation about how plasticity under various doses of psychedelics relates to changes in performance, which would be an important link to the replay-dependent learning literature.

      Are there renderings available for 'ripple' effects of psychedelics that could be included, to allow readers to compare the model's hallucinations to humans'? Short of this, it would be useful to have a more detailed description of what rippling is. (For those readers without firsthand knowledge!) It is currently difficult to assess how close the match is.

    4. Author response:

      We thank the reviewers for the valuable and constructive reviews. Thanks to these, we believe the article will be considerably improved. We have organized our response to address points that are relevant to both reviewers first, after which we address the unique concerns of each individual reviewer separately. We briefly paraphrase each concern and provide comments for clarification, outlining the precise changes that we will make to the text.

      Common Concerns (Reviewer 1 & Reviewer 2):

      Can you clarify how NREM and REM sleep relate to the oneirogen hypothesis?

      Within the submission draft we tried to stay agnostic as to whether mechanistically similar replay events occur during NREM or REM sleep; however, upon a more thorough literature review, we think that there is moderately greater evidence in favor of Wake-Sleep-type replay occurring during REM sleep which is related to classical psychedelic drug mechanisms of action.

      First, we should clarify that replay has been observed during both REM and NREM sleep, and dreams have been documented during both sleep stages, though the characteristics of dreams differ across stages, with NREM dreams being more closely tied to recent episodic experience and REM dreams being more bizarre/hallucinatory (see Stickgold et al., 2001 for a review). Replay during sleep has been studied most thoroughly during NREM sharp-wave ripple events, in which significant cortical-hippocampal coupling has been observed (Ji & Wilson, 2007). However, it is critical to note that the quantification methods used to identify replay events in the hippocampal literature usually focus on identifying what we term ‘episodic replay,’ which involves a near-identical recapitulation of neural trajectories that were recently experienced during waking experimental recordings (Tingley & Peyrach, 2020). In contrast, our model focuses on ‘generative replay,’ where one expects only a statistically similar reproduction of neural activity, without any particular bias towards recent or experimentally controlled experience. This latter form of replay may look closer to the ‘reactivation’ observed in cortex by many studies (e.g. Nguyen et al., 2024), where correlation structures of neural activity similar to those observed during stimulus-driven experience are recapitulated. Under experimental conditions in which an animal is experiencing highly stereotyped activity repeatedly, over extended periods of time, these two forms of replay may be difficult to dissociate.

      Interestingly, though NREM replay has been shown to couple hippocampal and cortical activity, a similar study in waking animals administered psychedelics found hippocampal replay without any obvious coupling to cortical activity (Domenico et al., 2021). This could be because the coupling was not strong enough to produce full trajectories in the cortex (psychedelic administration did not increase ‘alpha’ enough), and that a causal manipulation of apical/basal influence in the cortex may be necessary to observe the increased coupling. Alternatively, as Reviewer 1 noted, it may be that psychedelics induce a form of hippocampus-decoupled replay, as one would expect from the REM stage of a recently proposed complementary learning systems model (Singh et al., 2022). 

      Evidence in favor of a similarity between the mechanism of action of classical psychedelics and the mechanism of action of memory consolidation/learning during REM sleep is actually quite strong. In particular, studies have shown that REM sleep increases the activity of soma-targeting parvalbumin (PV) interneurons and decreases the activity of apical dendrite-targeting somatostatin (SOM) interneurons (Niethard et al., 2021), that this shift in balance is controlled by higher-order thalamic nuclei, and that this shift in balance is critical for synaptic consolidation of both monocular deprivation effects in early visual cortex (Zhou et al., 2020) and for the consolidation of auditory fear conditioning in the dorsal prefrontal cortex (Aime et al., 2022). These last studies were not discussed in the present manuscript–we will add them, in addition to a more nuanced description of the evidence connecting our model to NREM and REM replay.

      Can you explain how synaptic plasticity induced by psychedelics within your model relates to learning at a behavioral level?

      While the Wake-Sleep algorithm is a useful model for unsupervised statistical learning, it is not a model of reward or fear-based conditioning, which likely occur via different mechanisms in the brain (e.g. dopamine-dependent reinforcement learning or serotonin-dependent emotional learning). The Wake-Sleep algorithm is a ‘normative plasticity algorithm,’ that connects synaptic plasticity to the formation of structured neural representations, but it is not the case that all synaptic plasticity induced by psychedelic administration within our model should induce beneficial learning effects. According to the Wake-Sleep algorithm, plasticity at apical synapses is enhanced during the Wake phase, and plasticity at basal synapses is enhanced during the Sleep phase; under the oneirogen hypothesis, hallucinatory conditions (increased ‘alpha’) cause an increase in plasticity at both apical and basal sites. Because neural activity is in a fundamentally aberrant state when ‘alpha’ is increased, there are no theoretical guarantees that plasticity will improve performance on any objective: psychedelic-induced plasticity within our model could perhaps better be thought of as ‘noise’ that may have a positive or negative effect depending on the context.

      In particular, such ‘noise’ may be beneficial for individuals or networks whose synapses have become locked in a suboptimal local minimum. The addition of large amounts of random plasticity could allow a system to extricate itself from such local minima over subsequent learning (or with careful selection of stimuli during psychedelic experience), similar to simulated annealing optimization approaches. If our model were fully validated, this view of psychedelic-induced plasticity as ‘noise’ could have relevance for efforts to alleviate the adverse effects of PTSD, early life trauma, or sensory deprivation; it may also provide a cautionary note against repeated use of psychedelic drugs within a short time frame, as the plasticity changes induced by psychedelic administration under our model are not guaranteed to be good or useful in-and-of themselves without subsequent re-learning and compensation.

      We should also note that we have deliberately avoided connecting the oneirogen hypothesis model to fear extinction experimental results that have been observed through recordings of the hippocampus or the amygdala (Bombardi & Giovanni, 2013; Jiang et al., 2009; Kelly et al., 2024; Tiwari et al., 2024). Both regions receive extensive innervation directly from serotonergic synapses originating in the dorsal raphe nucleus, which have been shown to play an important role in emotional learning (Lesch & Waider, 2012); because classical psychedelics may play a more direct role in modulating this serotonergic innervation, it is possible that fear conditioning results (in addition to the anxiolytic effects of psychedelics) cannot be attributed to a shift in balance between apical and basal synapses induced by psychedelic administration. We will provide a more detailed review of these results in the text, as well as more clarity regarding their relation to our model.

      Reviewer 1 Concerns:

      Is it reasonable to assign a scalar parameter ‘alpha’ to the effects of classical psychedelics? And is your proposed mechanism of action unique to classical psychedelics? E.g. Could this idea also apply to kappa opioid agonists, ketamine, or the neural mechanisms of hallucination disorders?

      We will clarify that within our model ‘alpha’ is a parameter that reflects the balance between apical and basal synapses in determining the activity of neurons in the network. For the sake of simplicity we used a single ‘alpha’ parameter, but realistically, each neuron would have its own ‘alpha’ parameter, and different layers or individual neurons could be affected differentially by the administration of any particular drug; therefore, our scalar ‘alpha’ value can be thought of as a mean parameter for all neurons, disregarding heterogeneity across individual neurons.

      There are many different mechanisms that could theoretically affect this ‘alpha’ parameter, including: 5-HT2a receptor agonism, kappa opioid receptor binding, ketamine administration, or possibly the effects of genetic mutations underlying the pathophysiology of complex developmental hallucination disorders. We focused exclusively on 5-HT2a receptor agonism for this study because the mechanism is comparatively simple and extensively characterized, but similar mechanisms may well be responsible for the hallucinatory symptoms of a variety of drugs and disorders.

      Can you clarify the role of 5-HT2a receptor expression on interneurons within your model?

      While we mostly focused on the effects of 5-HT2a receptors on the apical dendrites of pyramidal neurons, these receptors are also expressed on soma-targeting parvalbumin (PV) interneurons. This expression on PV interneurons is consistent with our proposed psychedelic mechanism of action, because it could lead to a coordinated decrease in the influence of somatic and proximal dendritic inputs while increasing the influence of apical dendritic inputs. We will elaborate on this point, and will move the discussion earlier in the text.

      Discussions of indigenous use of psychedelics over millenia may amount to over-romanticization.

      We will take great care to conduct a more thorough literature review to reevaluate our statement regarding indigenous psychedelic use (including the citations you suggested), and will either provide a more careful statement or remove this discussion from our introduction entirely, as it has little bearing on the rest of the text. The Ethics Statement will also be modified accordingly.

      You isolate the 5-HT2a agonism as the mechanism of action underlying ‘alpha’ in your model, but there exist 5-HT2a agonists that do not have hallucinatory effects (e.g. lisuride). How do you explain this?

      Lisuride has much-reduced hallucinatory effects compared to other psychedelic drugs at clinical doses (though it does indeed induce hallucinations at high doses; Marona-Lewicka et al., 2002), and we should note that serotonin (5-HT) itself is pervasive in the cortex without inducing hallucinatory effects during natural function. Similarly, MDMA is a partial agonist for 5-HT2a receptors, but it has much-reduced perceptual hallucination effects relative to classical psychedelics (Green et al., 2003) in addition to many other effects not induced by classical psychedelics.

      Therefore, while we argue that 5-HT2a agonism induces an increase in influence of apical dendritic compartments and a decrease in influence of basal/somatic compartments, and that this change induces hallucinations, we also note that there are many other factors that control whether or not hallucinations are ultimately produced, so that not all 5-HT2a agonists are hallucinogenic. We will discuss two such factors in our revision: 5-HT receptor binding affinity and cellular membrane permeability.

      Importantly, many 5-HT2a receptor agonists are also 5-HT1a receptor agonists (e.g. serotonin itself and lisuride), while MDMA has also been shown to increase serotonin, norepinephrine, and dopamine release (Green et al., 2003). While 5-HT2a receptor agonism has been shown to reduce sensory stimulus responses (Michaiel et al., 2019), 5-HT1a receptor agonism inhibits spontaneous cortical activity (Azimi et al., 2020); thus one might expect the net effect of administering serotonin or a nonselective 5-HT receptor agonist to be widespread inhibition of a circuit, as has been observed in visual cortex (Azimi et al., 2020). Therefore, selective 5-HT2a agonism is critical for the induction of hallucinations according to our model, though any intervention that jointly excites pyramidal neurons’ apical dendrites and inhibits their basal/somatic compartments across a broad enough area of cortex would be predicted to have a similar effect. Lisuride has a much higher binding affinity for 5-HT1a receptors than, for instance, LSD (Marona-Lewicka et al., 2002).

      Secondly, it has recently been shown that both the head-twitch effect (a coarse behavioral readout of hallucinations in animals) and the plasticity effects of psychedelics are abolished when administering 5-HT2a agonists that are impermeable to the cellular membrane because of high polarity, and that these effects can be rescued by temporarily rendering the cellular membrane permeable (Vargas et al., 2023). This suggests that the critical hallucinatory effects of psychedelics (apical excitation according to our model) may be mediated by intracellular 5-HT2a receptors. Notably, serotonin itself is not membrane permeable in the cortex.

      Therefore, either of these two properties could play a role in whether a given 5-HT2a agonist induces hallucinatory effects. We will provide a considerably extended discussion of these nuances in our revision.

      Your model proposes that an increase in top-down influence on neural activity underlies the hallucinatory effects of psychedelics. How do you explain experimental results that show increases in bottom-up functional connectivity (either from early sensory areas or the thalamus)?

      Firstly, we should note that our proposed increase in top-down influence is a causal, biophysical property, not necessarily a statistical/correlative one. As such, we will stress that the best way to test our model is via direct intervention in cortical microcircuitry, as opposed to correlative approaches taken by most fMRI studies, which have shown mixed results with regard to this particular question. Correlative approaches can be misleading due to dense recurrent coupling in the system, and due to the coarse temporal and spatial resolution provided by noninvasive recording technologies (changes in statistical/functional connectivity do not necessarily correspond to changes in causal/mechanistic connectivity, i.e. correlation does not imply causation).

      There are two experimental results that appear to contradict our hypothesis that deserve special consideration in our revision. The first shows an increase in directional thalamic influence on the distributed cortical networks after psychedelic administration (Preller et al., 2018). To explain this, we note that this study does not distinguish between lower-order sensory thalamic nuclei (e.g. the lateral and medial geniculate nuclei receiving visual and auditory stimuli respectively) and the higher-order thalamic nuclei that participate in thalamocortical connectivity loops (Whyte et al., 2024). Subsequent more fine-grained studies have noted an increase in influence of higher order thalamic nuclei on the cortex (Pizzi et al., 2023; Gaddis et al., 2022), and in fact extensive causal intervention research has shown that classical psychedelics (and 5-HT2a agonism) decrease the influence of incoming sensory stimuli on the activity of early sensory cortical areas, indicating decoupling from the sensory thalamus (Evarts et al., 1955; Azimi et al., 2020; Michaiel et al. 2019). The increased influence of higher-order thalamic nuclei is consistent with both the cortico-striatal-thalamo-cortical (CTSC) model of psychedelic action as well as the oneirogen hypothesis, since higher-order thalamic inputs modulate the apical dendrites of pyramidal neurons in cortex (Whyte et al., 2024).

      The second experimental result notes that DMT induces traveling waves during resting state activity that propagate from early visual cortex to deeper cortical layers (Alamia et al., 2020). There are several possibilities that could explain this phenomenon: 1) it could be due to the aforementioned difficulties associated with directed functional connectivity analyses, 2) it could be due to a possible high binding affinity for DMT in the visual cortex relative to other brain areas, or 3) it could be due to increases in apical influence on activity caused by local recurrent connectivity within the visual cortex which, in the absence of sensory input, could lead to propagation of neural activity from the visual cortex to the rest of the brain. This last possibility is closest to the model proposed by (Ermentrout & Cowan, 1979), and which we believe would be best explained within our framework by a topographically connected recurrent network architecture trained on video data; a potentially fruitful direction for future research.

      Shouldn’t the hallucinations generated by your model look more ‘psychedelic,’ like those produced by the DeepDream algorithm?

      We believe that the differences in hallucination visualization quality between our algorithm and DeepDream are mostly due to differences in the scale and power of the models used across these two studies. We are confident that with more resources (and potentially theoretical innovations to improve the Wake-Sleep algorithm’s performance) the produced hallucination visualizations could become more realistic, but we believe this falls outside the scope of the present study.

      We note that more powerful generative models trained with backpropagation are able to produce surreal images of comparable quality (Rezende et al., 2014; Goodfellow et al., 2020; Vahdat & Kautz, 2020), though these have not yet been used as a model of psychedelic hallucinations. However, the DeepDream model operates on top of large pretrained image processing models, and does not provide a biologically mechanistic/testable interpretation of its hallucination effects. When training smaller models with a local synaptic plasticity rule (as opposed to backpropagation), the hallucination effects are less visually striking due to the reduced quality of our trained generative model, though they are still strongly tied to the statistics of sensory inputs, as quantified by our correlation similarity metric (Fig. 5b). We will provide a more detailed explanation of this phenomenon when we discuss our model limitations in our revised manuscript.

      Your model assumes domination by entirely bottom-up activity during the ‘wake’ phase, and domination entirely by top-down activity during ‘sleep,’ despite experimental evidence indicating that a mixture of top-down and bottom-up inputs influence neural activity during both stages in the brain. How do you explain this?

      Our use of the Wake-Sleep algorithm, in which top-down inputs (Sleep) or bottom-up inputs (Wake) dominate network activity is an over-simplification made within our model for computational and theoretical reasons. Models that receive a mixture of top-down and bottom-up inputs during ‘Wake’ activity do exist (in particular the closely related Boltzmann machine (Ackley et al., 1985)), but these models are considerably more computationally costly to train due to a need to run extensive recurrent network relaxation dynamics for each input stimulus. Further, these models do not generalize as cleanly to processing temporal inputs. For this reason, we focused on the Wake-Sleep algorithm, at the cost of some biological realism, though we note that our model should certainly be extended to support mixed apical-basal waking regimes. We will make sure to discuss this in our ‘Model Limitations’ section.

      Your model proposes that 5-HT2a agonism enhances glutamatergic transmission, but this is not true in the hippocampus, which shows decreases in glutamate after psychedelic administration.

      We should note that our model suggests only compartment specific increases in glutamatergic transmission; as such, our model does not predict any particular directionality for measures of glutamatergic transmission that includes signaling at both apical and basal compartments in aggregate, as was measured in the provided study (Mason et al., 2020).

      You claim that your model is consistent with the Entropic Brain theory, but you report increases in variance, not entropy. In fact, it has been shown that variance decreases while entropy increases under psychedelic administration. How do you explain this discrepancy?

      Unfortunately, ‘entropy’ and ‘variance’ are heavily overloaded terms in the noninvasive imaging literature, and the particularities of the method employed can exert a strong influence on the reported effects. The reduction in variance reported by (Carhart-Harris et al., 2016) is a very particular measure: they are reporting the variance of resting state synchronous activity, averaged across a functional subnetwork that spans many voxels; as such, the reduction in variance in this case is a reduction in broad, synchronous activity. We do not have any resting state synchronous activity in our network due to the simplified nature of our model (particularly an absence of recurrent temporal dynamics), so we see no reduction in variance in our model due to these effects.

      Other studies estimate ‘entropy’ or network state disorder via three different methods that we have been able to identify. 1) (Carhart-Harris et al., 2014) uses a different measure of variance: in this case, they subtract out synchronous activity within functional subnetworks, and calculate variability across units in the network. This measure reports increases in variance (Fig. 6), and is the closest measure to the one we employ in this study. 2) (Lebedev et al., 2016) uses sample entropy, which is a measure of temporal sequence predictability. It is specifically designed to disregard highly predictable signals, and so one might imagine that it is a measure that is robust to shared synchronous activity (e.g. resting state oscillations). 3) (Mediano et al., 2024) uses Lempel-Ziv complexity, which is, similar to sample entropy, a measure of sequence diversity; in this case the signal is binarized before calculation, which makes this method considerably different from ours. All three of the preceding methods report increases in sequence diversity, in agreement with our quantification method. Our strongest explanation for why the variance calculation in (Carhart-Harris et al., 2016) produces a variance reduction is therefore due to a reduction in low-rank synchronous activity in subnetworks during resting state.

      As for whether the entropy increase is meaningful: we share Reviewer 1’s concern that increases in entropy could simply be due to a higher degree of cognitive engagement during resting state recordings, due to the presence of sensory hallucinations or due to an inability to fall asleep. This could explain why entropy increases are much more minimal relative to non-hallucinating conditions during audiovisual task performance (Siegel et al., 2024; Mediano et al., 2024). However, we can say that our model is consistent with the Entropic Brain Theory without including any form of ‘cognitive processing’: we observe increases in variability during resting state in our model, but we observe highly similar distributions of activity when averaging over a wide variety of sensory stimulus presentations (Fig. 5b-c). This is because variability in our model is not due to unstructured noise: it corresponds to an exploration of network states that would ordinarily be visited by some stimulus. Therefore, when averaging across a wide variety of stimuli, the distribution of network states under hallucinating or non-hallucinating conditions should be highly similar.

      One final point of clarification: here we are distinguishing Entropic Brain Theory from the REBUS model–the oneirogen hypothesis is consistent with the increase in entropy observed experimentally, but in our model this entropy increase is not due to increased influence of bottom-up inputs (it is due instead to an increase in top-down influence). Therefore, one could view the oneirogen hypothesis as consistent with EBT, but inconsistent with REBUS.

      You relate your plasticity rule to behavioral-timescale plasticity (BTSP) in the hippocampus, but plasticity has been shown to be reduced in the hippocampus after psychedelic administration. Could you elaborate on this connection?

      When we were establishing a connection between our ‘Wake-Sleep’ plasticity rule and BTSP learning, the intended connection was exclusively to the mathematical form of the plasticity rule, in which activity in the apical dendrites of pyramidal neurons functions as an instructive signal for plasticity in basal synapses (and vice versa): we will clarify this in the text. Similarly, we point out that such a plasticity rule tends to result in correlated tuning between apical and basal dendritic compartments, which has been observed in hippocampus and cortex: this is intended as a sanity check of our mapping of the Wake-Sleep algorithm to cortical microcircuitry, and has limited further bearing on the effects of psychedelics specifically.

      Reduction in plasticity in the hippocampus after psychedelic administration could be due to a complementary learning systems-type model, in which the hippocampus becomes partly decoupled from the cortex during REM sleep (Singh et al., 2022); were this to be the case, it would not be incompatible with our model, which is mostly focused on the cortex. Notably, potentiating 5HT-2a receptors in the ventral hippocampus does not induce the head-twitch response, though it does produce anxiolytic effects (Tiwari et al., 2024), indicating that the hallucinatory and anxiolytic effects of classical psychedelics may be partly decoupled. 

      Reviewer 2 Concerns:

      Could you provide visualizations of the ‘ripple’ phenomenon that you’re referring to?

      We will do this! For now, you can get a decent understanding of what the ‘ripple effect’ looks like from the ‘eyes closed’ hallucination condition for networks trained on CIFAR10 (Fig. 2d). The ripple effect that we are referring to is very similar, except it is superimposed on a naturalistic image under ordinary viewing conditions; to give a higher quality visualization of the ripple phenomenon itself, we will subtract out the static contribution of the image itself, leaving only the ripple phenomenon.

      Could you provide a more nuanced description of alternative roles for top-down feedback, beyond being used exclusively for learning as depicted in your model?

      For the sake of simplicity, we only treat top-down inputs in our model as a source of an instructive teaching signal, the originator of generative replay events during the Sleep phase, and as the mechanism of hallucination generation. However, as discussed in a response to a previous question, in the cortex pyramidal neurons receive and respond to a mixture of top-down and bottom-up processing.

      There are a variety of theories for what role top-down inputs could play in determining network activity. To name several, top-down input could function as: 1) a denoising/pattern completion signal (Kadkhodaie & Simoncelli, 2021), 2) a feedback control signal (Podlaski & Machens, 2020), 3) an attention signal (Lindsay, 2020), 4) ordinary inputs for dynamic recurrent processing that play no specialized role distinct from bottom-up or lateral inputs except to provide inputs from higher-order association areas or other sensory modalities (Kar et al., 2019; Tugsbayar et al., 2025). Though our model does not include these features, they are perfectly consistent with our approach.

      In particular, denoising/pattern completion signals in the predictive coding framework (closely related to the Wake-Sleep algorithm) also play a role as an instructive learning signal (Salvatori et al., 2021); and top-down control signals can play a similar role in some models (Gilra & Gerstner, 2017; Meulemans et al., 2021). Thus, options 1 and 2 are heavily overlapping with our approach, and are a natural consequence of many biologically plausible learning algorithms that minimize a variational free energy loss (Rao & Ballard, 1997; Ackley et al., 1985). Similarly, top-down attentional signals can exist alongside top-down learning signals, and some models have argued that such signals can be heavily overlapping or mutually interchangeable (Roelfsema & van Ooyen, 2005). Lastly, generic recurrent connectivity (from any source) can be incorporated into the Wake-Sleep algorithm (Dayan & Hinton, 1996), though we avoided doing this in the present study due to an absence of empirical architecture exploration in the literature and the computational complexity associated with training on time series data.

      To conclude, there are a variety of alternative functions proposed for top-down inputs onto pyramidal neurons in the cortex, and we view these additional features as mutually compatible with our approach; for simplicity we did not include them in our model, but we believe that these features are unlikely to interfere with our testable predictions or empirical results.

    1. eLife Assessment

      This study proposes a potentially useful improvement on a popular fMRI method for quantifying representational similarity in brain measurements by focusing on representational strength at the single trial level and adding linear mixed effects modeling for group-level inference. The manuscript demonstrates increased sensitivity with no loss of precision compared to more classic versions of the method. However, the framing of the work with respect to these prior approaches is incomplete, several assumptions are insufficiently motivated, and it is unclear to what extent the approach would generalize to other paradigms.

    2. Reviewer #1 (Public review):

      Summary:

      The paper presents a novel method for RSA, called trial-level RSA (tRSA). The method first constructs a trial x trial representation dissimilarity matrix using correlation distances, assuming that (as in the empirical example) each trial has a unique stimulus. Whereas "classical RSA" correlates the entire upper triangular matrix of the RDM / RSM to a model RDM / RSM, tRSA first calculates the correlation to the model RDM per row, and then averages these values. The paper claims that tRSA has increased sensitivity and greater flexibility than classical RSA.

      Strengths & Weaknesses:

      I have to admit that it took a few hours of intense work to understand this paper and to even figure out where the authors were coming from. The problem setting, nomenclature, and simulation methods presented in this paper do not conform to the notation common in the field, are often contradictory, and are usually hard to understand. Most importantly, the problem that the paper is trying to solve seems to me to be quite specific to the particular memory study in question, and is very different from the normal setting of model-comparative RSA that I (and I think other readers) may be more familiar with.

      Main issues:

      (1) The definition of "classical RSA" that the authors are using is very narrow. The group around Niko Kriegeskorte has developed RSA over the last 10 years, addressing many of the perceived limitations of the technique. For example, cross-validated distance measures (Walther et al. 2016; Nili et al. 2014; Diedrichsen et al. 2021) effectively deal with an uneven number of trials per condition and unequal amounts of measurement noise across trials. Different RDM comparators (Diedrichsen et al. 2021) and statistical methods for generalization across stimuli (Schütt et al. 2023) have been developed, addressing shortcomings in sensitivity. Finally, both a Bayesian variant of RSA (Pattern component modelling, (Diedrichsen, Yokoi, and Arbuckle 2018) and an encoding model (Naselaris et al. 2011) can effectively deal with continuous variables or features across time points or trials in a framework that is very related to RSA (Diedrichsen and Kriegeskorte 2017). The author may not consider these newer developments to be classical, but they are in common use and certainly provide the solution to the problems raised in this paper in the setting of model-comparative RSA in which there is more than one repetition per stimulus.

      (2) The stated problem of the paper is to estimate "representational strength" in different regions or conditions. With this, the authors define the correlation of the brain RDM with a model RDM. This metric conflates a number of factors, namely the variances of the stimulus-specific patterns, the variance of the noise, the true differences between different dissimilarities, and the match between the assumed model and the data-generating model. It took me a long time to figure out that the authors are trying to solve a quite different problem in a quite different setting from the model-comparative approach to RSA that I would consider "classical" (Diedrichsen et al. 2021; Diedrichsen and Kriegeskorte 2017). In this approach, one is trying to test whether local activity patterns are better explained by representation model A or model B, and to estimate the degree to which the representation can be fully explained. In this framework, it is common practice to measure each stimulus at least 2 times, to be able to estimate the variance of noise patterns and the variance of signal patterns directly. Using this setting, I would define 'representational strength" very differently from the authors. Assume (using LaTeX notation) that the activity patterns $y_j,n$ for stimulus j, measurement n, are composed of a true stimulus-related pattern ($u_j$) and a trial-specific noise pattern ($e_j,n$). As a measure of the strength of representation (or pattern), I would use an unbiased estimate of the variance of the true stimulus-specific patterns across voxels and stimuli ($\sigma^2_{u}$). This estimator can be obtained by correlating patterns of the same stimuli across repeated measures, or equivalently, by averaging the cross-validated Euclidean distances (or with spatial prewhitening, Mahalanobis distances) across all stimulus pairs. In contrast, the current paper addresses a specific problem in a quite specific experimental design in which there is only one repetition per stimulus. This means that the authors have no direct way of distinguishing true stimulus patterns from noise processes. The trick that the authors apply here is to assume that the brain data comes from the assumed model RDM (a somewhat sketchy assumption IMO) and that everything that reduces this correlation must be measurement noise. I can now see why tRSA does make some sense for this particular question in this memory study. However, in the more common model-comparative RSA setting, having only one repetition per stimulus in the experiment would be quite a fatal design flaw. Thus, the paper would do better if the authors could spell the specific problem addressed by their method right in the beginning, rather than trying to set up tRSA as a general alternative to "classical RSA".

      (3) The notation in the paper is often conflicting and should be clarified. The actual true and measured activity patterns should receive a unique notation that is distinct from the variances of these patterns across voxels. I assume that $\sigma_ijk$ is the noise variances (not standard deviation)? Normally, variances are denoted with $\sigma^2$. Also, if these are variances, they cannot come from a normal distribution as indicated on page 10. Finally, multi-level models are usually defined at the level of means (i.e., patterns) rather than at the level of variances (as they seem to be done here).

      (4) In the first set of simulations, the authors sampled both model and brain RSM by drawing each cell (similarity) of the matrix from an independent bivariate normal distribution. As the authors note themselves, this way of producing RSMs violates the constraint that correlation matrices need to be positive semi-definite. Likely more seriously, it also ignores the fact that the different elements of the upper triangular part of a correlation matrix are not independent from each other (Diedrichsen et al. 2021). Therefore, it is not clear that this simulation is close enough to reality to provide any valuable insight and should be removed from the paper, along with the extensive discussion about why this simulation setting is plainly wrong (page 21). This would shorten and clarify the paper.

      (5) If I understand the second simulation setting correctly, the true pattern for each stimulus was generated as an NxP matrix of i.i.d. standard normal variables. Thus, there is no condition-specific pattern at all, only condition-specific noise/signal variances. It is not clear how the tRSA would be biased if there were a condition-specific pattern (which, in reality, there usually is). Because of the i.i.d. assumption of the true signal, the correlations between all stimulus pairs within conditions are close to zero (and only differ from it by the fact that you are using a finite number of voxels). If you added a condition-specific pattern, the across-condition RSA would lead to much higher "representational strength" estimates than a within-condition RSA, with obvious problems and biases.

      (6) The trial-level brain RDM to model Spearman correlations was analyzed using a mixed effects model. However, given the symmetry of the RDM, the correlations coming from different rows of the matrix are not independent, which is an assumption of the mixed effect model. This does not seem to induce an increase in Type I errors in the conditions studied, but there is no clear justification for this procedure, which needs to be justified.

      (7) For the empirical data, it is not clear to me to what degree the "representational strength" of cRSA and tRSA is actually comparable. In cRSA, the Spearman correlation assesses whether the distances in the data RSM are ranked in the same order as in the model. For tRSA, the comparison is made for every row of the RSM, which introduces a larger degree of flexibility (possibly explaining the higher correlations in the first simulation). Thus, could the gains presented in Figure 7D not simply arise from the fact that you are testing different questions? A clearer theoretical analysis of the difference between the average row-wise Spearman correlation and the matrix-wise Spearman correlation is urgently needed. The behavior will likely vary with the structure of the true model RDM/RSM.

      (8) For the real data, there are a number of additional sources of bias that need to be considered for the analysis. What if there are not only condition-specific differences in noise variance, but also a condition-specific pattern? Given that the stimuli were measured in 3 different imaging runs, you cannot assume that all measurement noise is i.i.d. - stimuli from the same run will likely have a higher correlation with each other.

      (9) The discussion should be rewritten in light of the fact that the setting considered here is very different from the model-comparative RSA in which one usually has multiple measurements per stimulus per subject. In this setting, existing approaches such as RSA or PCM do indeed allow for the full modelling of differences in the "representational strength" - i.e., pattern variance across subjects, conditions, and stimuli. Cross-validated distances provide a powerful tool to control for differences in measurement noise variances and possible covariances in measurement noise across trials, which has many distinct advantages and is conceptually very different from the approach taken here. One of the main limitations of tRSA is the assumption that the model RDM is actually the true brain RDM, which may not be the case. Thus, in theory, there could be a different model RDM, in which representational strength measures would be very different. These differences should be explained more fully, hopefully leading to a more accessible paper.

      References:

      Diedrichsen, J., Berlot, E., Mur, M., Schütt, H. H., Shahbazi, M., & Kriegeskorte, N. (2021). Comparing representational geometries using whitened unbiased-distance-matrix similarity. Neurons, Behavior, Data and Theory, 5(3). https://arxiv.org/abs/2007.02789

      Diedrichsen, J., & Kriegeskorte, N. (2017). Representational models: A common framework for understanding encoding, pattern-component, and representational-similarity analysis. PLoS Computational Biology, 13(4), e1005508.

      Diedrichsen, J., Yokoi, A., & Arbuckle, S. A. (2018). Pattern component modeling: A flexible approach for understanding the representational structure of brain activity patterns. NeuroImage, 180, 119-133.

      Naselaris, T., Kay, K. N., Nishimoto, S., & Gallant, J. L. (2011). Encoding and decoding in fMRI. NeuroImage, 56(2), 400-410.

      Nili, H., Wingfield, C., Walther, A., Su, L., Marslen-Wilson, W., & Kriegeskorte, N. (2014). A toolbox for representational similarity analysis. PLoS Computational Biology, 10(4), e1003553.

      Schütt, H. H., Kipnis, A. D., Diedrichsen, J., & Kriegeskorte, N. (2023). Statistical inference on representational geometries. ELife, 12. https://doi.org/10.7554/eLife.82566

      Walther, A., Nili, H., Ejaz, N., Alink, A., Kriegeskorte, N., & Diedrichsen, J. (2016). Reliability of dissimilarity measures for multi-voxel pattern analysis. NeuroImage, 137, 188-200.

    3. Reviewer #2 (Public review):

      Summary:

      This methods paper proposes two changes to classic RSA, a popular method to probe neural representation in neuroimaging experiments: computing RSA at row/column level of RDM, and using mixed linear modeling to compute second-level statistics, using the individual row/columns to estimate a random effect of stimulus. The benefit of the new method is demonstrated using simulations and a re-analysis of a prior fMRI dataset on object perception and memory encoding.

      Strengths:

      (1) The paper is clearly written and features clear illustrations of the proposed method.

      (2) The combination of simulation and real data works well, with the same factors being examined in both simulations and real data, resulting in a convincing demonstration of the benefits of tRSA in realistic experimental scenarios.

      (3) I find the author's claim that tRSA is a promising approach to perform more complete modeling of cogneuro data, but also to conceptualize representation at the single trial/event level (cf Discussion section on P42), quite appealing.

      Weaknesses:

      (1) While I generally welcome the contribution (see above), I take some issue with the accusatory tone of the manuscript in the Introduction. The text there (using words such as 'ignored variances', 'errouneous inferences', 'one must', 'not well-suited', 'misleading') appears aimed at turning cRSA in a 'straw man' with many limitations that other researchers have not recognized but that the new proposed method supposedly resolves. This can be written in a more nuanced, constructive manner without accusing the numerous users of this popular method of ignorance.

      (2) The described limitations are also not entirely correct, in my view: for example, statistical inference in cRSA is not always done using classic parametric statistics such as t-tests (cf Figure 1): the rsatoolbox paper by Nili et al. (2014) outlines non-parametric alternatives based on permutation tests, bootstrapping and sign tests, which are commonly used in the field. Nor has RSA ever been conducted at the row/column level (here referred to by the authors as 'trial level'; cf King et al., 2018).

      (3) One of the advantages of cRSA is its simplicity. Adding linear mixed effects modeling to RSA introduces a host of additional 'analysis parameters' pertaining to the choice of the model setup (random effects, fixed effects, interactions, what error terms to use) - how should future users of tRSA navigate this?

      (4) Here, only a single real fMRI dataset is used with a quite complicated experimental design for the memory part; it's not clear if there is any benefit of using tRSA on a simpler real dataset. What's the benefit of tRSA in classic RSA datasets (e.g., Kriegeskorte et al., 2008), with fixed stimulus conditions and no behavior?

      (5) The cells of an RDM/RSM reflect pairwise comparisons between response patterns (typically a brain but can be any system; cf Sucholutsky et al., 2023). Because the response patterns are repeatedly compared, the cells of this matrix are not independent of one another. Does this raise issues with the validity of the linear mixed effects model? Does it assume the observations are linearly independent?

      (6) The manuscript assumes the reader is familiar with technical statistical terms such as Type I/II error, sensitivity, specificity, homoscedasticity assumptions, as well as linear mixed models (fixed effects, random effects, etc). I am concerned that this jargon makes the paper difficult to understand for a broad readership or even researchers currently using cRSA that might be interested in trying tRSA.

      (7) I could not find any statement on data availability or code availability. Given that the manuscript reuses prior data and proposes a new method, making data and code/tutorials openly available would greatly enhance the potential impact and utility for the community.

      References

      King, M. L., Groen, I. I., Steel, A., Kravitz, D. J., & Baker, C. I. (2019). Similarity judgments and cortical visual responses reflect different properties of object and scene categories in naturalistic images. NeuroImage, 197, 368-382.

      Kriegeskorte, N., Mur, M., Ruff, D. A., Kiani, R., Bodurka, J., Esteky, H., ... & Bandettini, P. A. (2008). Matching categorical object representations in inferior temporal cortex of man and monkey. Neuron, 60(6), 1126-1141.

      Nili, H., Wingfield, C., Walther, A., Su, L., Marslen-Wilson, W., & Kriegeskorte, N. (2014). A toolbox for representational similarity analysis. PLoS computational biology, 10(4), e1003553.

      Sucholutsky, I., Muttenthaler, L., Weller, A., Peng, A., Bobu, A., Kim, B., ... & Griffiths, T. L. (2023). Getting aligned on representational alignment. arXiv preprint arXiv:2310.13018.

    1. eLife Assessment

      In this valuable study, Wandler et al. provide convincing theoretical evidence for alternate mechanisms of rhythm generation by CPGs. Their model shows that cell-type-specific connectivity and a dominant inhibitory drive could underlie rhythm generation. Excitatory input could act to enhance the frequency range of these rhythms. This modeling study could motivate further experimental investigation of these mechanisms to understand CPG rhythmogenesis.

    2. Reviewer #1 (Public review):

      This study explores the connectivity patterns that could lead to fast and slow undulating swim patterns in larval zebrafish using a simplified theoretical framework. The authors show that a pattern of connectivity based only on inhibition is sufficient to produce realistic patterns with a single frequency. Two such networks, coupled with inhibition but with distinct time constants, can produce a range of frequencies. Adding excitatory connections further increases the range of obtainable frequencies, albeit at the expense of sudden transitions in the mid-frequency range.

      Strengths:

      (1) This is an eloquent approach to answering the question of how spinal locomotor circuits generate coordinated activity using a theoretical approach based on moving bump models of brain activity.

      (2) The models make specific predictions on patterns of connectivity while discounting the role of connectivity strength or neuronal intrinsic properties in shaping the pattern.

      (3) The models also propose that there is an important association between cell-type-specific intersegmental patterns and the recruitment of speed-selective subpopulations of interneurons.

      (4) Having a hierarchy of models creates a compelling argument for explaining rhythmicity at the network level. Each model builds on the last and reveals a new perspective on how network dynamics can control rhythmicity. I liked that each model can be used to probe questions in the next/previous model.

      Major Issues:

      (1) How is this simplified model representative of what is observed biologically? A bump model does not naturally produce oscillations. How would the dynamics of a rhythm generator interact with this simplistic model?

      (2) Would this theoretical construct survive being expressed in a biophysical model? It seems that it should, but even a simple biological model with the basic patterns of connectivity shown here would greatly increase confidence in the biological plausibility of the theory.

      (3) How stable is this model in its output patterns? Is it robust to noise? Does noise, in fact, smooth out the abrupt transitions in frequency in the middle range?

      (4) All figure captions are inadequate. They should have enough information for the reader to understand the figure and the point that was meant to be conveyed. For example, Figure 1 does not explain what the red dot is, what is black, what is white, or what the gradations of gray are. Or even if this is a representative connectivity of one node, or if this shows all the connections? The authors should not leave the reader guessing.

    3. Reviewer #2 (Public review):

      Summary:

      The authors aimed to show that connectivity patterns within spinal circuits composed of specific excitatory and inhibitory connectivity and with varying degrees of modularity could achieve tail beats at various frequencies as well as proper left-right coordination and rostrocaudal propagation speeds.

      Strengths:

      The model is simple, and the connectivity patterns explored are well supported by the literature.

      The conclusions are intuitive and support many experimental studies on zebrafish spinal circuits for swimming. The simulations provide strong support for the sufficiency of connectivity patterns to produce and control many hallmark features of swimming in zebrafish.

      Weaknesses:

      I only have two minor suggestions:

      (1) Figure 1A, if I interpret Figure 1B correctly, should there not be long descending projections as well that don't seem to be illustrated?

      (2) Page 5, It would be good to define what is meant by slow and fast here, as this definition changes with age in zebrafish (what developmental age)?

    4. Reviewer #3 (Public review):

      Summary:

      Central pattern generator (CPG) circuits underly rhythmic motor behaviors. To date, it is thought that these CPG networks are rather local and multiple CPG circuits are serially connected to allow locomotion across the entire body. Distributed CPG networks that incorporate long-range connections have not been proposed, although such connectivity has been experimentally shown for several different spinal populations. In this manuscript, the authors use this existing literature on long-range spinal interneuron connectivity to build a new computational model that reproduces basic features of locomotion like left-right alternation, rostrocaudal propagation, and independent control of frequency and amplitude. Interestingly, the authors show that a model solely based on inhibitory neurons can recapitulate these basic locomotor features. Excitatory sources were then added that increased the dynamic range of frequencies generated. Finally, the authors were also able to reproduce experimentally observed consequences of cell-type-specific ablations, showing that local and long-range, cell-type-specific connectivity could be sufficient for generating locomotion.

      Strengths:

      This work is novel, providing an interesting alternative to distributed CPGs to the local networks traditionally predicted. It shows cell type cell-type-specific network connectivity is as important, if not more than intrinsic cell properties for rhythmogenesis and that inhibition plays a crucial role in shaping locomotor features. Given the importance of local CPGs in understanding motor control, this alternative concept will be of broad interest to the larger motor control field, including invertebrate and vertebrate species.

      Weaknesses:

      I have the following minor concerns/clarifications:

      (1) The authors describe a single unit as a neuron, be it excitatory or inhibitory, and the output of the simulation is the firing rate of these neurons. Experimentally and in other modeling studies, motor neurons are incorporated in the model, and the output of the network is based on motor neuron firing rate, not the interneurons themselves. Why did the authors choose to build the model this way?

      (2) In the single population model (Figure 1), the authors use ipsilateral inhibitory connections that are long-range in an ascending direction. Experimentally, these connections have been shown to be local, while long-range ipsilateral connections have been shown to be descending. What were the reasons the authors chose this connectivity? Do the authors think local ascending inhibitions contribute to rostrocaudal propagation, and how?

      (3) In the two-population model, the authors show independent control of frequency and rhythm, as has been reported experimentally. However, in these previous experimental studies, frequency and amplitude are regulated by different neurons, suggesting different networks dedicated to frequency and amplitude control. However, in the current model, the same population with the same connections can contribute to frequency or amplitude depending on relative tonic drive. Can the authors please address these differences either by changes in the model or by adding to the Discussion?

      (4) It would be helpful to add a paragraph in the Discussion on how these results could be applicable to other model systems beyond zebrafish. Cell intrinsic rhythmogenesis is a popular concept in the field, and these results show an interesting and novel alternative. It would help to know if there is any experimental evidence suggesting such network-based propagation in other systems, invertebrates, or vertebrates.

    1. eLife Assessment

      This important work compares the size of two brain areas, the amygdala and the hippocampus, across 12 species belonging to the Macaca genus. The authors find, using a convincing methodological approach, that amygdala - but not hippocampal - volume varies with social tolerance grade, with high tolerance species showing larger amygdala than low tolerance species of macaques. Interestingly, their findings also suggest an inverted developmental effect, with intolerant species showing an increase in amygdala volume across the lifespan, compared to tolerant species exhibiting the opposite trend. Overall, this paper offers new insights into the neural basis of social and emotional processing.

    2. Reviewer #1 (Public review):

      Summary:

      This paper investigates the potential link between amygdala volume and social tolerance in multiple macaque species. Through a comparative lens, the authors considered tolerance grade, species, age, sex, and other factors that may contribute to differing brain volumes. They found that amygdala, but not hippocampal, volume differed across tolerance grades, such that high-tolerance species showed larger amygdala than low-tolerance species of macaques. They also found that less tolerant species exhibited increases in amygdala volume with age, while more tolerant species showed the opposite. Given their wide range of species with varied biological and ecological factors, the authors' findings provide new evidence for changes in amygdala volume in relation to social tolerance grades. Contributions from these findings will greatly benefit future efforts in the field to characterize brain regions critical for social and emotional processing across species.

      Strengths:

      (1) This study demonstrates a concerted and impressive effort to comparatively examine neuroanatomical contributions to sociality in monkeys. The authors impressively collected samples from 12 macaque species with multiple datapoints across species age, sex, and ecological factors. Species from all four social tolerance grades were present. Further, the age range of the animals is noteworthy, particularly the inclusion of individuals over 20 years old - an age that is rare in the wild but more common in captive settings.

      (2) This work is the first to report neuroanatomical correlates of social tolerance grade in macaques in one coherent study. Given the prevalence of macaques as a model of social neuroscience, considerations of how socio-cognitive demands are impacted by the amygdala are highly important. The authors' findings will certainly inform future studies on this topic.

      (3) The methodology and supplemental figures for acquiring brain MRI images are well detailed. Clear information on these parameters is crucial for future comparative interpretations of sociality and brain volume, and the authors do an excellent job of describing this process in full.

      Weaknesses:

      (1) The nature vs. nurture distinction is an important one, but it may be difficult to draw conclusions about "nature" in this case, given that only two data points (from grades 3 and 4) come from animals under one year of age (Method Figure 1D). Most brains were collected after substantial social exposure-typically post age 1 or 1.5-so the data may better reflect developmental changes due to early life experience rather than innate wiring. It might be helpful to frame the findings more clearly in terms of how early experiences shape development over time, rather than as a nature vs. nurture dichotomy.

      (2) It would be valuable to clarify how the older individuals, especially those 20+ years old, may have influenced the observed age-related correlations (e.g., positive in grades 1-2, negative in grades 3-4). Since primates show well-documented signs of aging, some discussion of the potential contribution of advanced age to the results could strengthen the interpretation.

      (3) The authors categorize the behavioral traits previously described in Thierry (2021) into 3 self-defined cognitive requirements, however, they do not discuss under what conditions specific traits were assigned to categories or justify why these cognitive requirements were chosen. It is not fully clear from Thierry (2021) alone how each trait would align with the authors' categories. Given that these traits/categories are drawn on for their neuroanatomical hypotheses, it is important that the authors clarify this. It would be helpful to include a table with all behavioral traits with their respective categories, and explain their reasoning for selecting each cognitive requirement category.

      (4) One of the main distinctions the authors make between high social tolerance species and low tolerance species is the level of complex socio-cognitive demands, with more tolerant species experiencing the highest demands. However, socio-cognitive demands can also be very complex for less tolerant species because they need to strategically balance behaviors in the presence of others. The relationships between socio-cognitive demands and social tolerance grades should be viewed in a more nuanced and context-specific manner.

      (5) While the limitations section touches on species-related considerations, the issue of individual variability within species remains important. Given that amygdala volume can be influenced by factors such as social rank and broader life experience, it might be useful to further emphasize that these factors could introduce meaningful variation across individuals. This doesn't detract from the current findings but highlights the importance of considering life history and context when interpreting subcortical volumes-particularly in future studies.

    3. Reviewer #2 (Public review):

      Summary:

      This comparative study of macaque species and the type of social interaction is both ambitious and inevitably comes with a lot of caveats. The overall conclusion is that more intolerant species have a larger amygdala. There are also opposing development profiles regarding amygdala volume depending on whether it is a tolerant or intolerant species.

      To achieve any sort of power, they have combined data from 4 centres, which have all used different scanning methods, and there are some resolution differences. The authors have also had to group species into 4 classifications - again to assist with any generalisations and power. They have focussed on the volumes of two structures, the amygdala and the hippocampus, which seems appropriate. Neither structure is homogeneous and so it may well be that a targeted focus on specific nuclei or subfields would help (the authors may well do this next) - but as the variables would only increase further along with the number of potential comparisons, alongside small group numbers, it seems only prudent to treat these findings are preliminary. That said, it is highly unlikely that large numbers of macaque brains will become available in the near future.

      This introduction is by way of saying that the study achieves what it sets out to do, but there are many reasons to see this study as preliminary. The main message seems to be twofold: (1) that more intolerant species have relatively larger amygdalae, and (2) that with development, there is an opposite pattern of volume change (increasing with age in intolerant species and decreasing with age in tolerant species). Finding 1 is the opposite of that predicted in Table 1 - this is fine, but it should be made clearer in the Discussion that this is the case, otherwise the reader may feel confused. As I read it, the authors have switched their prediction in the Discussion, which feels uncomfortable.

      It is inevitable that the data in a study of this complexity are all too prone to post hoc considerations, to which the authors indulge. In the case of Grade 1 species, the individuals have a lot to learn, especially if they are not top of the hierarchy, but at the same time, there are fewer individuals in the troop, making predictions very tricky. As noted above, I am concerned by the seemingly opposite predictions in Table 1 and those in the Discussion regarding tolerance and amygdala volume. (It may be that the predictions in Table 1 are the opposite of how I read them, in which case the Table and preceding text need to align.)

    4. Reviewer #3 (Public review):

      Summary:

      In this study, the authors were looking at neurocorrelates of behavioural differences within the genus Macaca. To do so, they engaged in real-world dissection of dead animals (unconnected to the present study) coming from a range of different institutions. They subsequently compare different brain areas, here the amygdala and the hippocampus, across species. Crucially, these species have been sorted according to different levels of social tolerance grades (from 1 to 4). 12 species are represented across 42 individuals. The sampling process has weaknesses ("only half" of the species contained by the genus, and Macaca mulatta, the rhesus macaque, representing 13 of the total number of individuals), but also strengths (the species are decently well represented across the 4 grades) for the given purpose and for the amount of work required here. I will not judge the dissection process as I am not a neuroanatomist, and I will assume that the different interventions do not alter volume in any significant ways / or that the different conditions in which the bodies were kept led to the documented differences across species.

      There are two main results of the study. First, in line with their predictions, the authors find that more tolerant macaque species have larger amygdala, compared to the hippocampus, which remains undifferentiated across species. Second, they also identify developmental effects, although with different trends: in tolerant species, the amygdala relative volume decreases across the lifespan, while in intolerant species, the contrary occurs. The results look quite strong, although the authors could bring up some more clarity in their replies regarding the data they are working with. From one figure to the other, we switch from model-calculated ratio to model-predicted volume. Note that if one was to sample a brain at age 20 in all the grades according to the model-predicted volumes, it would not seem that the difference for amygdala would differ much across grades, mostly driven with Grade 1 being smaller (in line with the main result), but then with Grade 2 bigger than Grade 3, and then Grade 4 bigger once again, but not that different from Grade 2.

      Overall, despite this, I think the results are pretty strong, the correlations are not to be contested, but I also wonder about their real meaning and implications. This can be seen under 3 possible aspects:

      (1) Classification of the social grade

      While it may be familiar to readers of Thierry and collaborators, or to researchers of the macaque world, there is no list included of the 18 behavioral traits used to define the three main cognitive requirements (socio-cognitive demands, predictability of the environment, inhibitory control). It would be important to know which of the different traits correspond to what, whether they overlap, and crucially, how they are realized in the 12 study species, as there could be drastic differences from one species to the next. For now, we can only see from Table S1 where the species align to, but it would be a good addition to have them individually matched to, if not the 18 behavioral traits, at least the 3 different broad categories of cognitive requirements.

      (2) Issue of nature vs nurture

      Another way to look at the debate between nature vs nurture is to look at phylogeny. For now, there is no phylogenetic tree that shows where the different grades are realized. For example, it would be illuminating to know whether more related species, independently of grades, have similar amygdala or hippocampus sizes. Then the question will go to the details, and whether the grades are realized in particular phylogenetic subdivisions. This would go in line with the general point of the authors that there could be general species differences.

      With respect to nurture, it is likely more complicated: one needs to take into account the idiosyncrasies of the life of the individual. For example, some of the cited literature in humans or macaques suggests that the bigger the social network, the bigger the brain structure considered. Right, but this finding is at the individual level with a documented life history. Do we have any of this information for any of the individuals considered (this is likely out of the scope of this paper to look at this, especially for individuals that did not originate from CdP)?

      (3) Issue of the discussion of the amygdala's function

      The entire discussion/goal of the paper, states that the amygdala is connected to social life. Yet, before being a "social center", the amygdala has been connected to the emotional life of humans and non-humans alike. The authors state L333/34 that "These findings challenge conventional expectations of the amygdala's primary involvement in emotional processes and highlight the complexity of the amygdala's role in social cognition". First, there is no dichotomy between social cognition and emotion. Emotion is part of social cognition (unless we and macaques are robots). Second, there is nowhere in the paper a demonstration that the differences highlighted here are connected to social cognition differences per se. For example, the authors have not tested, say, if grade 4 species are more afraid of snakes than grade 1 species. If so, one could predict they would also have a bigger amygdala, and they would probably also find it in the model. My point is not that the authors should try to correlate any kind of potential aspect that has been connected to the amygdala in the literature with their data (see for example the nice review by Domínguez-Borràs and Vuilleumier, https://doi.org/10.1016/B978-0-12-823493-8.00015-8), but they should refrain from saying they have challenged a particular aspect if they have not even tested it. I would rather engage the authors to try and discuss the amygdala as a multipurpose center, that includes social cognition and emotion.

      Strengths:

      Methods & breadth of species tested.

      Weaknesses:

      Interpretation, which can be described as 'oriented' and should rather offer additional views.

    1. eLife Assessment

      This is a useful tool for code-less analysis of patterns in cell migratory behaviours in vivo using intravital microscopy data and allows correlation with spatial features of the tumour microenvironment. There is a need for these tools to make quantitative analysis, comparison and interpretation of complex cell tracking data more accessible and evidence is provided of its applicability to tracks generated by both proprietary and open tracking software. However, it is incomplete due to limitations imposed by the assumptions that apply to the statistical tests employed.

    2. Reviewer #1 (Public review):

      Summary:

      Intravital microscopy (IVM) is a powerful tool that facilitates live imaging of individual cells over time in vivo in their native 3D tissue environment. Extracting and analysing multi-parametric data from IVM images however is challenging, particularly for researchers with limited programming and image analysis skills. In this work, Rios-Jimenez and Zomer et al have developed a 'zero-code' accessible computational framework (BEHAV3D-Tumour Profiler) designed to facilitate unbiased analysis of IVM data to investigate tumour cell dynamics (via the tool's central 'heterogeneity module' ) and their interactions with the tumour microenvironment (via the 'large-scale phenotyping' and 'small-scale phenotyping' modules). It is designed as an open-source modular Jupyter Notebook with a user-friendly graphical user interface and can be implemented with Google Colab, facilitating efficient, cloud-based computational analysis at no cost. Demo datasets are also available on the authors GitHub repository to aid user training and enhance the usability of the developed pipeline.

      To demonstrate the utility of BEHAV3D-TP, they apply the pipeline to timelapse IVM imaging datasets to investigate the in vivo migratory behaviour of fluorescently labelled DMG cells in tumour bearing mice. Using the tool's 'heterogeneity module' they were able to identify distinct single-cell behavioural patterns (based on multiple parameters such as directionality, speed, displacement, distance from tumour edge) which was used to group cells into distinct categories (e.g. retreating, invasive, static, erratic). They next applied the framework's 'large-scale phenotyping' and 'small-scale phenotyping' modules to investigate whether the tumour microenvironment (TME) may influence the distinct migratory behaviours identified. To achieve this, they combine TME visualisation in vivo during IVM (using fluorescent probes to label distinct TME components) or ex vivo after IVM (by large-scale imaging of harvested, immunostained tumours) to correlate different tumour behavioural patterns with the composition of the TME. They conclude that this tool has helped reveal links between TME composition (e.g. degree of vascularisation, presence of tumour-associated macrophages) and the invasiveness and directionality of tumour cells, which would have been challenging to identify when analysing single kinetic parameters in isolation.

      The authors also evaluated the BEHAV3D TP heterogeneity module using available IVM datasets of distinct breast cancer cell lines transplanted in vivo, as well as healthy mammary epithelial cells to test its usability in non-tumour contexts where the migratory phenotypes of cells may be more subtle. This generated data is consistent with that produced during the original studies, as well as providing some additional (albeit preliminary) insights above that previously reported. Collectively, this provides some confidence in BEHAV3D TP's ability to uncover complex, multi-parametric cellular behaviours that may be missed using traditional approaches.

      Overall, this computational framework appears to represent a useful and comparatively user-friendly tool to analyse dynamic multi-parametric data to help identify patterns in cell migratory behaviours, and to assess whether these behaviours might be influenced by neighbouring cells and structures in their microenvironment. When combined with other methods, it therefore has the potential to be a valuable addition to a researcher's IVM analysis 'tool-box'.

      Strengths:

      - Figures are clearly presented, and the manuscript is easy to follow.<br /> - The pipeline appears to be intuitive and user-friendly for researchers with limited computational expertise. A detailed step-by-step video and demo datasets are also included to support its uptake.<br /> - The different computational modules have been tested using relevant datasets, including imaging data of normal and tumour cells in vivo.<br /> - All code is open source, and the pipeline can be implemented with Google Colab.<br /> - The tool combines multiple dynamic parameters extracted from timelapse IVM images to identify single-cell behavioural patterns and to cluster cells into distinct groups sharing similar behaviours, and provides avenues to map these onto in vivo or ex vivo imaging data of the tumour microenvironment

      Weaknesses:

      - The tool does not facilitate the extraction of quantitative kinetic cellular parameters (e.g. speed, directionality, persistence and displacement) from intravital images. To use the tool researchers must first extract dynamic cellular parameters from their IVM datasets using other software including Imaris, which is expensive and therefore not available to all. Nonetheless, the authors have developed their tool to facilitate the integration of other data formats generated by open-source Fiji plugins (e.g. TrackMate, MTrackJ, ManualTracking) which will help ensure its accessibility to a broader range of researchers.<br /> - The analysis provides only preliminary evidence in support of the authors conclusions on DMG cell migratory behaviours and their relationship with components of the tumour microenvironment. The authors acknowledge this however, and conclusions are appropriately tempered in the absence of additional experiments and controls.

    3. Reviewer #2 (Public review):

      Summary:

      The authors produce a new tool, BEHAV3D to analyse tracking data and to integrate these analyses with large and small scale architectural features of the tissue. This is similar to several other published methods to analyse spatio-temporal data, however, the connection to tissue features is a nice addition, as is the lack of requirement for coding. The tool is then used to analyse tracking data of tumour cells in diffuse midline glioma. They suggest 7 clusters exist within these tracks and that they differ spatially. They ultimately suggest that there these behaviours occur in distinct spatial areas as determined by CytoMAP.

      Strengths:

      - The tool appears relatively user-friendly and is open source. The combination with CytoMAP represents a nice option for researchers.

      - The identification of associations between cell track phenotype and spatial features is exciting and the diffuse midline glioma data nicely demonstrates how this could be used.

      Weaknesses:

      - The revision has dealt with many concerns, however, the statistics generated by the process are still flawed. While the statistics have been clarified within the legends and this is a great improvement in terms of clarity the underlying assumptions of the tests used are violated. The problem is that individual imaging positions or tracks are treated as independent and then analysed by ANOVA. As separate imaging positions within the same mouse are not independent, nor are individual cells within a single mouse, this makes the statistical analyses inappropriate. For a deeper analysis of this that is feasible within a review please see Lord, Samuel J., et al. "SuperPlots: Communicating reproducibility and variability in cell biology." The Journal of cell biology 219.6 (2020): e202001064. Ultimately, while this is a neat piece of software facilitating the analysis of complex data, the fact that it will produce flawed statistical analysis is a major problem. This problem is compounded by the fact that much imaging analysis has been analysed in this inappropriate manner in the past, leading to issues of interpretation and ultimately reproducibility.

    4. Reviewer #3 (Public review):

      The manuscript by Rios-Jimenez developed a software tool, BEHAV3D Tumor Profiler, to analyze 3D intravital imaging data and identify distinctive tumor cell migratory phenotypes based on the quantified 3D image data. Moreover, the heterogeneity module in this software tool can correlate the different cell migration phenotypes with variable features of the tumor microenvironment. Overall, this is a useful tool for intravital imaging data analysis and its open-source nature makes it accessible to all interested users.

      Strengths:

      An open-source software tool that can quantify cell migratory dynamics from intravital imaging data and identify distinctive migratory phenotypes that correlate with variable features of the tumor microenvironment.

      Weaknesses:

      Motility is only one tumor cell feature and is probably not sufficient to characterize and identify the heterogeneity of the tumor cell population that impacts their behaviors in the complex tumor microenvironment (TME). For instance, there are important non-tumor cell types in the TME, and the interaction dynamics of tumor cells with other cell types, e.g., fibroblasts and distinct immune cells, play a crucial role in regulating tumor behaviors. BEHAV3D-TP focuses on only motility feature analysis, and cannot be applied to analyze other tumor cell dynamic features or cell-cell interaction dynamics.

    5. Author response:

      The following is the authors’ response to the original reviews

      We thank the reviewers for their positive and constructive comments on the manuscript. In the revised manuscript we addressed these comments, which we believe have improved the quality of our work.

      In summary:

      (1) We acknowledge the reviewer's suggestion to incorporate open-source segmentation and tracking functionalities, increasing its accessibility to a wider user base; however, these additions fall outside the primary scope of our current work, which is to provide an analytical framework for IVM data after segmentation and tracking. Developing open-source segmentation and tracking tools represents a substantial undertaking in its own right, which has been comprehensively explored in other studies (e.g. https://doi.org/10.4049/jimmunol.2100811; https://doi.org/10.7554/eLife.60547; https://doi.org/10.1016/j.media.2022.102358; https://doi.org/10.1038/s41592024-02295-6 - now cited in our revised manuscript). 

      In our analyses, we used data processed with Imaris, a commercial software that, despite its limitations, is widely used by the intravital microscopy community due to its user-friendly platform for 3D image visualization and analysis. Nevertheless, recognizing the need for compatibility with tracking data from various pipelines, we have modified our tool to accept other data formats, such as those generated by open-source Fiji plugins like TrackMate, MTrackJ, ManualTracking (https://github.com/imAIgene-Dream3D/BEHAV3D_Tumor_Profiler?tab=readme-ov-file#data-input). These updates are available in our GitHub repository and are described in the revised manuscript. 

      (2) We appreciate the reviewer #3 suggestion to incorporate additional features into our analytical pipeline. In response, we have already updated the GitHub repository to allow users to input and select which features (dynamic, morphological, or spatial) they wish to include in the analysis (https://github.com/imAIgene-Dream3D/BEHAV3D_Tumor_Profiler?tab=readmeov-file#feature-selection ). In the revised manuscript, we highlighted this new functionality and provided examples using alternative datasets to demonstrate the application of these features.

      (3)  We appreciate the constructive feedback of reviewers #1 and #2 regarding the statistical analysis and interpretation of the data presented in Figures 3 and 4. We understand the importance of clarity and rigor in data analysis and presentation, and we addressed the concerns raised in the revised version of the manuscript.

      (4) We appreciate reviewer #1's suggestion regarding the inclusion of demo data, as we believe it would greatly enhance the usability of our pipeline. We acknowledge that this was an oversight on our part. To address this, we have now added demos to our GitHub repository (https://github.com/imAIgene-

      Dream3D/BEHAV3D_Tumor_Profiler/tree/BEHAV3D_TP-v2.0/demo_datasets). In the revised manuscript, we referenced this addition and present new figures with examples of these demo’s processing different IVM dataset (2D/3D, different tumors and healthy tissues). Additionally, we have provided processed DMG IVM movie samples in an imaging repository.

      (5) Finally, we made some small changes to the manuscript based on the reviewers’ feedback.

      Below we provide a point-by-point response to the reviewers’ comments

      Reviewer #1 (Public review):

      Comment #1: A key limitation of the pipeline is that it does not overcome the main challenges and bottlenecks associated with processing and extracting quantitative cellular data from timelapse and longitudinal intravital images. This includes correcting breathing-induced movement artifacts, automated registration of longitudinal images taken over days/weeks, and accurate, automated segmentation and tracking of individual cells over time. Indeed, there are currently no standardised computational methods available for IVM data processing and analysis, with most laboratories relying on custom-built solutions or manual methods. This isn't made explicit in the manuscript early on (described below), and the researchers rely on expensive software packages such as IMARIS for image processing and data extraction to feed the required parameters into their pipeline. This limitation unfortunately reduces the likely impact of BEHAV3D-TP on the IVM field. 

      As highlighted above, the tool does not facilitate the extraction of quantitative kinetic cellular parameters (e.g. speed, directionality, persistence, and displacement) from intravital images. Indeed, to use the tool researchers must first extract dynamic cellular parameters from their IVM datasets, requiring access to expensive software (e.g. IMARIS as used here) and/or above-average computational expertise to develop and use custom-made open-source solutions. This limitation is not made explicit or discussed in the text.

      We acknowledge the reviewer's suggestion to incorporate open-source segmentation and tracking functionalities, increasing its accessibility to a wider user base; however, these additions fall outside the primary scope of our current work and represent a substantial undertaking in their own right. Several studies (e.g., Diego Ulisse Pizzagalli et al., J Immunol (2022); Aby Joseph et al., eLife (2020); Molina-Moreno et al., Medical Image Analysis (2022); Hidalgo-Cenalmor et al., Nat Methods (2024); Ershov et al., Nat Methods (2022)) have comprehensively addressed these topics, and we now reference them in the revised manuscript to provide readers with relevant background.

      The objective of our manuscript is not to develop a complete segmentation or tracking pipeline but rather to introduce an analytical framework capable of extracting enhanced insights from the data generated by existing tools. This goal arises from our observations of the field: despite significant investment in image processing, researchers often rely on simplistic approaches, such as averaging single parameters across conditions, which can obscure tumor heterogeneity and spatial behavioral dynamics within the tumor microenvironment.

      Our current tool focuses on providing this much-needed analytical capability. For our analysis we used Imaris, a widely utilized software in the intravital microscopy (IVM) community, known for its intuitive 3D visualization and analysis platform despite certain limitations. 

      In our own literature search of recent IVM studies published by leading laboratories in high-impact journals, we found that close to half used Imaris, while the remainder primarily relied on manual workflows with Fiji plugins. Thus, we consider it valuable to offer a pipeline compatible with such commonly used software, given its prevalence in the field.

      However, following the suggestion of the reviewer, and to enhance the tool’s flexibility and compatibility, we have expanded the pipeline to accept data formats generated by open-source Fiji plugins, such as TrackMate, MTrackJ, and ManualTracking. These updates are detailed in the revised manuscript and are implemented in our GitHub repository (https://github.com/imAIgene-Dream3D/BEHAV3D_Tumor_Profiler?tab=readme-ov-file#data-input ), where we also provide several demos using TrackMate and Imaris processed data. This addition demonstrates our tool's capability to integrate with segmented and tracked datasets from diverse platforms, increasing its applicability to a broader range of researchers using both commercial and open-source pipelines.

      Comment #2: The number of cells (e.g. per behavioural cluster), and the number of independent mice, represented in each result figure, is not included in the figure legends and are difficult to ascertain from the methods.

      We appreciate the reviewer's constructive feedback regarding the clarity of the number and type of replicates used in our analyses. In the revised manuscript, we have included detailed information in the figure legends and the number of independent mice represented in each figure legend to ensure transparency. Regarding the number

      of cells, we have indicated the total number of processed cells in Figure 2b legend (953 cells). Additionally, we have now included figures (Sup Fig 4c, Sup Fig 5e-g, Fig 5c,e, Sup Fig 6 c,d) for each cluster, where individual dots represent the individual cell tracks with color indicating the position and the shape indicating individual mice.

      Comment #3: The data used to test the pipeline in this manuscript is currently not available, making it difficult to assess its usability. It would be important to include this for researchers to use as a 'training dataset'.

      As stated above we acknowledge that this was an oversight on our part and thank the reviewer for pointing this out. To address this, we have now added demo data to our GitHub repository (BEHAV3D_Tumor_Profiler/demo_datasets at main · imAIgeneDream3D/BEHAV3D_Tumor_Profiler · GitHub). In the revised manuscript we have referenced this addition in the Data availability section. Since we included now processing with Fiji as well, we provide 4 demo datasets (https://github.com/imAIgeneDream3D/BEHAV3D_Tumor_Profiler/tree/main/demo_datasets), one processed with Imaris in 3D; and one with CellPose2.0 and Trackmate in 2D; one processed with µSAM and Trackmate in 3D and one manually processed with MtrackJ in 2D . Moreover, we now provide Imaris-processed DMG IVM movie samples in an open-source repository.

      Comment #4: Precisely how the BEHAV3D-TP large-scale phenotyping module can map large-scale spatial phenotyping data generated using LSR-3D imaging data and Cytomap to 3D intravital imaging movies is unclear. Further details in the text and methods would be beneficial to aid understanding.

      We appreciate the reviewer’s comment and in the revised manuscript we have now provided details in the methods section “Tumor large-scale spatial phenotyping with Cytomap” to clarify how the BEHAV3D-TP module maps LSR-3D and Cytomap data to 3D intravital imaging movies:

      “To map the assigned regions onto IVM movies, a 3D image of the cluster distribution within the tumor was generated and exported for each sample (Figure Supplement 5a). Next, regions within the IVM movies were visually matched to the corresponding regions identified by the Large-Scale Phenotyping module of Cytomap (Figure 3c). For each mouse, at least one or two representative positions per matched region type were selected, cropped, and analyzed to assess tumor cell behavior, following the previously described cell tracking methodology (Imaris Cell tracking).”

      Moreover, we updated Figure 3 c to further clarify these steps.

      Comment #5: The analysis provides only preliminary evidence in support of the authors' conclusions on DMG cell migratory behaviours and their relationship with components of the tumour microenvironment. Conclusions should therefore be tempered in the absence of additional experiments and controls. 

      We appreciate the reviewer’s comment and acknowledge that our conclusions should be tempered due to the preliminary nature of our evidence. In the revised version of the manuscript we have revised our conclusions accordingly and emphasize the necessity for additional experiments and controls to further validate our findings on DMG cell migratory behaviors and their relationship with the tumor microenvironment.

      In discussion: “While our findings suggest that microenvironmental factors may influence tumor cell migration, further studies will be necessary to establish causal relationships. Additional experimental validation, such as macrophage ablation experiments, could help clarify the specific contributions of these factors.”

      Reviewer #1 (Recommendations for the authors): 

      (1) To test the ability of the pipeline to identify relevant patterns of migratory behaviours additional 'control' experiments would be helpful e.g. comparing non-invasive vs invasive tumour cell lines, artificially controlling migratory behaviours of cells such as implanting beads soaked in factors that would attract/repel cells? 

      (2) Does the pipeline work well for a variety of cell types/contexts? e.g. can it identify and cluster more subtle migratory behaviours such as non-tumour cells during tissue development or regeneration conditions? 

      We appreciate the reviewer’s valuable suggestions. In the revised manuscript, we have included additional examples demonstrating the capability of our pipeline to investigate heterogeneous cell behavior across two additional experimental setups:

      (1) We have now evaluated our BEHAV3D TP heterogeneity module using IVM data from breast cancer cell lines with varying migratory capacities (DOI: 10.1016/j.yexcr.2019.04.009). In these datasets, our pipeline extends beyond predefined characteristics based solely on speed, enabling the identification of distinct cell populations. Notably, our analysis reveals that the breast cancer lines exhibit different proportions of different migratory behaviors such as Fast, Intermediate, Very slow and Static (Supplementary Fig 1).

      (2) We have now evaluated our BEHAV3D TP heterogeneity module using IVM data from healthy breast epithelial cells (DOI: 10.1016/j.celrep.2024.115073), where we identify distinct morhophynamic epithelial cell populations in the terminal end but of the mammary gland that have a distinct distribution among Hormone receptor (HR) + and HR- terminal end but cells.

      (3) To support biological conclusions could the authors show that ablating tumourassociated macrophages or vasculature alters the migratory patterns of nearby tumour cells? 

      We appreciate the reviewer's suggestion regarding the potential effects of ablating tumor-associated macrophages or vasculature on the migratory patterns of nearby tumor cells. While these experiments would functionally validate the observations made by our method, we would like to clarify that the primary focus of our study was on the development and application of computational tools for behavioral analysis and thus we consider that delving deeper in understanding the biology behind our observation is out of the scope of the current study. However, as mentioned previously, we have carefully tempered our conclusions to acknowledge the limitations of our current study. In the revised manuscript, we explicitly highlight that experiments involving the ablation of tumor-associated macrophages or vasculature would be crucial for further understanding the biological relevance of our findings.

      Minor corrections to text: 

      (4) Line 63 - are references formatted correctly?

      Thank you for pointing out this error. We have corrected it in the revised manuscript.

      (5) Lines 161 -162 - 'intravitally imaged' used twice in a sentence.

      Thank you for pointing out the typo. We have corrected it in the revised manuscript.

      Reviewer #2 (Public review):

      Comment#1: The strength of democratizing this kind of analysis is undercut by the reliance upon Imaris for segmentation, so it would be nice if this was changed to an open-source option for track generation.

      As noted in our previous response to Reviewer #1, we would like to point out that although Imaris is a commercial software, it is widely used in the intravital microscopy community due to its user-friendly interface. We conducted a literature review to evaluate this aspect and below we include references from leading laboratories in the IVM field that utilize Imaris. One of its key advantages, which we also utilized, is semi-automated data tracking that allows for manual corrections in 3D—a process that can be more challenging in other open-source software with less effective data visualization.

      However, we recognize that enhancing our pipeline's compatibility with open-source options is important. To this end, we have updated our tool to support 2D and 3D data formats generated by open-source Fiji plugins like TrackMate, MTrackJ, and ManualTracking, improving compatibility with various segmentation and tracking pipelines (https://github.com/imAIgene-Dream3D/BEHAV3D_Tumor_Profiler?tab=readme-ov-file#data-input ). In the revised manuscript, we describe the new functionality and demonstrate the operation of the BEHAV3D-TP heterogeneity module across various IVM datasets, processed in both 2D and 3D with different processing pipelines (Supplementary Fig 1-3). This includes CellPose 2.0 and the novel 'Segment Anything' model, followed by TrackMate tracking, applied to both tumor and healthy IVM data. Moreover we have developed a new web application that integrates morphological and tracking information from Segment Anything segmentation and Trackmate tracking, depicted in Supplementary Fig 3 a (https://morphotrack-merger.streamlit.app/ ). Additionally, we have updated the introduction to better clarify the scope of our study and include references to existing image processing solutions.

      Comment#2: The main issue is with the interpretation of the biological data in Figure 3 where ANOVA was used to analyse the proportional distribution of different clusters. Firstly the n is not listed so it is unclear if this represents an n of 3 where each mouse is an individual or whether each track is being treated as a test unit. If the latter this is seriously flawed as these tracks can't be treated as independent. Also, a more appropriate test would be something like a Chi-squared test or Fisher's exact test. Also, no error bars are included on the stacked bar graphs making interpretation impossible. Ultimately this is severely flawed and also appears to show very small differences which may be statistically different but may not represent biologically important findings. This would need further study.

      We appreciate the reviewer’s insightful comments regarding the interpretation of the biological data in Figure 3. 

      To clarify, each imaged position is considered an independent biological replicate (n = 18 from a total of 6 mice). We acknowledge that the description of the statistical methods and the experimental units was not sufficiently clear in the previous version. In our original submission, we used an ANOVA to test whether the proportion of each behavioral cluster differed across the tumor microenvironment regions. Post hoc pairwise comparisons were performed using Tukey’s test, with the results shown in Supplementary Figure 2d (currently Fig 3d). However, we agree with the reviewer that this approach may be misleading when paired with stacked bar plots that lack error bars, as it can obscure individual variability and does not explicitly represent statistical uncertainty.

      In the revised manuscript, we present the data as boxplots with individual data points, where each dot represents an imaged position, and the shape corresponds to a specific mouse. In Figure 3 d the y-axis displays the normalized percentage of each cluster across TME regions, expressed as z-scores. This normalization corrects for inter-mouse variability and facilitates a comparison of the relative distribution of clusters across TME regions, independent of the overall abundance differences between mice. We performed an ANOVA with Tukey's post hoc test for each individual behavioral cluster to assess differences across TME regions. Additionally, for transparency, in Supplementary Figure 5 d we provide the raw percentage values. The legends provide the number of positions and mice included in the analysis. 

      Comment#3:  Figure 4 has similar statistical issues in that the n is not listed and, again, it is unclear whether they are treating each cell track as independent which, again, would be inappropriate. The best practice for this type of data would be the use of super plots as outlined in Lord et al. (2020) JCI - SuperPlots: Communicating reproducibility and variability in cell biology.

      We appreciate the reviewer’s comments and suggestions regarding Figure 4. In this case as we are comparing overall the behavioral clusters features, each individual cell is treated as a unit. In the revised manuscript, we have clarified this point in the figure legend and incorporated plots in Figure 4c and 4e, indicating the mouse and imaging position each data point originates from. This enhances the visualization of reproducibility and variability in our data, demonstrating that the results are consistent across multiple mice and positions and are not driven by a single mouse or imaging position.

      Comment#4: The main issue that this raises is that the large-scale phenotyping module and the heterogeneity module appear designed to produce these statistical analyses that are used in these figures and, if they are based on the assumption that each track is independent, then this will produce inappropriate analyses as a default.

      We appreciate the reviewer’s comment, although we are unclear about the specific concern being raised. To clarify, in our large-scale phenotyping analysis, each position is assigned to a TME niche based on the CytoMAP analysis and the workflow outlined in Figure 3c. Multiple positions are imaged per mouse. For each position, we measure the proportion of tumor cells exhibiting a specific behavioral phenotype, and these proportions are subsequently used for statistical analysis (Figure 3 d). 

      In contrast, in Supplementary Fig. 5e-g, we treat each cell track as an individual unit, grouping them by their assigned large-scale region. Here, we assess whether differences between regions can be detected using a conventional single-feature analysis—a more traditional approach. However, we find that this method loses important behavioral patterns and distinctions that BEHAV3D-TP captures.

      We hope that this explanation, along with the modifications made to the figures and figure legends, provides greater clarity.  

      Reviewer #3 (Public review):

      Comment #1: The most challenging task of analyzing 3D time-lapse imaging data is to accurately segment and track the individual cells in 3D over a long time duration. BEHAV3D Tumor Profiler did not provide any new advancement in this regard, and instead relies on commercial software, Imaris, for this critical step. Imaris is known to have a very high error rate when used for analyzing 3D time-lapse data. In the Methods section, the authors themselves stated that "Tumor cell tracks were manually corrected to ensure accurate tracking". Based on our own experience of using Imaris, such manual correction is tedious and often required for every time step of the movie. Therefore, Imaris is not a satisfactory tool for analyzing 3D time-lapse data. Moreover, Imaris is expensive and many research labs probably can't afford to buy it. The fact that BEHAV3D Tumor Profiler critically depends on the faulty ImarisTrack module makes it unclear whether the BEHAV3D tool or the results are reliable.

      If the authors want to "democratize the analysis of heterogeneous cancer cell behaviors", they should perform image segmentation and tracking using open-source codes (e.g., Cellpose, Stardisk & 3DCellTracker) and not rely on the expensive and inaccurate ImarisTrack Module for the image analysis step of BEHAV3D.

      We appreciate the reviewer’s comments on the challenges of segmenting and tracking individual cells in 3D time-lapse imaging data. As mentioned previously (please refer to comment #1 to reviewer #1), our primary focus is to develop an analytical tool for comprehensive data analysis rather than developing tools for image processing. However to enhance accessibility, we have updated our tool to support data formats from open-source Fiji plugins, such as TrackMate, which will benefit users without access to commercial software (https://github.com/imAIgeneDream3D/BEHAV3D_Tumor_Profiler?tab=readme-ov-file#data-input ). In Supplementary Figures 1, 2, and 3, we present IVM data from different sources, processed using three distinct methods: MTrackJ (Supplementary Fig. 1), Cellpose + TrackMate (Supplementary Fig. 2), and µSAM + TrackMate (Supplementary Fig. 3). The latter two represent state-of-the-art deep learning approaches.

      On the other hand, while we recognize the limitations of Imaris, it remains widely used in the intravital microscopy community due to its user-friendly interface for 3D visualization and semi-automated segmentation capabilities. Since no perfect tracking method currently exists, we initially utilized Imaris for its ability to allow manual correction of faulty tracks, ensuring the reliability of our results. This approach, not only widely used (see above) but was the best available option when we began our analysis, allowing us to obtain accurate results efficiently.

      In the revised manuscript, we clarify the scope of our study and provide information on both Imaris and alternative processing options to strengthen the reliability of our findings:

      In introduction: “While significant efforts have been made to develop opensource segmentation and tracking tools for live imaging data, including IVM22–27 fewer tools exist for the unbiased analysis of tumor dynamics. One major barrier is that implementing such analytical methods often requires substantial computational expertise, limiting accessibility for many biomedical researchers conducting IVM experiments. To bridge this gap, we present BEHAV3D Tumor Profiler (BEHAV3D-TP)  by providing a robust, user-friendly tool that allows researchers to extract meaningful insights from dynamic cellular behaviors without requiring advanced programming skills.”

      In the Methods, we describe now describe not only Imaris processing pipeline, but also the µSAM segmentation pipelines and reference to CellPose IVM processing, which are combined with TrackMate for tracking. Additionally, to integrate morphological information from µSAM with tracking data from TrackMate, we developed a web tool to merge the outputs from both processing steps: https://morphotrack-merger.streamlit.app/  

      Comment #2: The authors developed a "Heterogeneity module" to extract distinctive tumor migratory phenotypes from the cell tracks quantified by Imaris. The cell tracks of the individual tumor cells are all quite short, indicating relatively low motility of the tumor cells. It's unclear whether such short migratory tracks are sufficient to warrant the PCA analysis to identify the 7 distinctive migratory phenotypes shown in Figure 2d. It's also unclear whether these 7 migratory phenotypes correspond to unique functional phenotypes.  

      For the 7 distinctive motility clusters, the authors should provide a more detailed analysis of the differences between them. It's unclear whether the difference in retreating, slow retreating, erratic, static, slow, slow invading, and invading correspond to functional difference of the tumor cells.

      While some tumor cells exhibit limited motility, indicated by short tracks, others demonstrate significant migratory capabilities (Figure 2 Invading and Retreating cells). This variability in tumor cell behavior is a central focus of our analysis, and our tool is specifically designed to identify and distinguish these differences. Our PCA analysis effectively captures this variability, as illustrated in Figure 2 d-f. It differentiates between cells exhibiting varying degrees of migratory behavior, including both highly and less migratory phenotypes, as well as their directionality relative to the tumor core and the persistence of their movements. Thus, we believe that our approach provides valuable insights into the distinct migratory phenotypes within the tumor microenvironment. 

      While our current manuscript does not provide explicit evidence linking each motility cluster to functional differences among the tumor cells, it is important to note that the state of the field supports the idea that cell dynamics can predict cell states and phenotypes. Research conducted by ourselves (Dekkers, Alieva et al., Nat Biotech, 2023) and others, such as Craiciuc et al. (Nature, 2022) and Freckmann et al. (Nat Comm, 2022) has shown that variations in cell motility patterns are indicative of underlying functional characteristics. For instance, cell morphodynamic features have been shown to reflect differences in cell types, T cell targeting states (Dekkers, Alieva et al., Nat Biotech, 2023), immune cell types (Crainiciuc et al. (Nature, 2022)), tumor metastatic potential, and drug resistance states (Freckmann et al. (Nat Comm, 2022)). In the revised manuscript, we have referenced relevant studies to underscore the biological significance of these behaviors. By doing so, we hope to clarify the potential implications of our findings and strengthen the overall narrative of our research:

      In discussion: “While our current study does not provide direct functional validation of the distinct motility clusters identified, existing literature strongly supports the notion that cell dynamics can serve as a proxy for functional states and phenotypic heterogeneity. Prior work, including studies by our group[19,66]  as well as Crainiciuc et al.[35] and Freckmann et al.[20], has demonstrated that variations in cell motility patterns can reflect underlying functional characteristics. Specifically, cell morpho-dynamic features have been shown to correlate with differences in cell type identity, T-cell engagement, metastatic potential, and drug resistance states. This growing body of evidence suggests that tumor cell behavior, as captured by BEHAV3D-TP, may serve as a predictive tool for deciphering functional tumor heterogeneity. Future studies integrating transcriptomic or proteomic profiling of motility-defined subpopulations could further elucidate the biological significance of these behavioral phenotypes.”

      Comment #3: Using only motility to classify tumor cell behaviours in the tumor microenvironment (TME) is probably not sufficient to capture the tumor cell difference. There are also other non-tumor cell types in the TME. If the authors aim to develop a computational tool that can elucidate tumor cell behaviors in the TME, they should consider other tumor cell features, e.g., morphology, proliferation state, and tumor cell interaction with other cell types, e.g., fibroblasts and distinct immune cells.

      The authors should expand the scale of tumor behavior features to classify the tumor phenotype clusters, e.g., to include tumor morphology, proliferation state, and tumor cell interaction with other TME cell types.

      We believe that using dynamic features alone is sufficient to capture differences in tumor behavior, as demonstrated by our results in Figure 2. However, we appreciate the reviewer’s suggestion to consider additional features, such as cell morphology, to finetune our analyses. To this end, we have adapted our pipeline to be compatible with any dynamic, morphologic or spatial features present in the data. In the revised manuscript we showcase this new addition with the analyses of two new dataset: 2D IVM data from healthy epithelial breast cells (Supplementary Fig 2) and 3D IVM data from adult gliomas (Supplementary Fig 3). These analyses identified cells with specific morphodynamic characteristics, which exhibited distinct kinetic behaviors or spatial distributions.

      However, we would like to point out that not all features may provide informative insights and that a wide range of features can instead introduce biologically irrelevant noise, making interpretation more challenging. For instance, in 3D microscopy, the zaxis resolution is typically lower, which can lead to artifacts like elongation in that direction. Adding morphological features that capture this may skew the analysis. Therefore, we believe that incorporating additional features should be approached with caution. We clarify these considerations in the revised manuscript to better guide users in utilizing our computational tool effectively:

      In discussion: “In addition to motility-based classification, features such as tumor cell morphology, proliferation state, and interactions with the tumor microenvironment can further refine tumor phenotyping. BEHAV3D-TP allows for the selection of diverse feature types, supporting datasets that include both dynamic, morphological and spatial parameters. However, we recognize that expanding the feature set may introduce biologically irrelevant noise, particularly in 3D microscopy data where limited z-axis resolution can lead to morphological artifacts. This highlights the potential need in the future to include unbiased feature selection strategies, such as bootstrapping methods67, to ensure the identification of meaningful and biologically relevant parameters. Careful consideration of these aspects is key to maximizing the interpretability and predictive value of analyses performed with BEHAV3D-TP.”

      Comment #4: The authors have already published two papers on BEHAV3D [Alieva M et al. Nat Protoc. 2024 Jul;19(7): 2052-2084; Dekkers JF, et al. Nat Biotechnol. 2023 Jan;41(1):60-69]. Although the previous two papers used BEHAV3D to analyze T cells, the basic pipeline and computational steps are similar, in particular regarding cell segmentation and tracking. The addition of a "Heterogeneity module" based on PCA analysis does not make a significant advancement in terms of image analysis and quantification.

      We want to emphasize that we have no intention of duplicating our previous publications. In this manuscript, we have consistently cited our foundational papers, where BEHAV3D was first developed for T cell migratory analysis in in vitro settings. In the introduction, we clearly state that our earlier work inspired us to adopt a similar approach for analyzing cell behavior in intravital microscopy (IVM) data, addressing the specific needs and complexities of analyzing tumor cell behaviors in the tumor microenvironment.

      Importantly, our new work provides several key advancements: 1) a pipeline specifically adapted for intravital microscopy (IVM) data; 2) integration of spatial characteristics from both large-scale and small-scale phenotyping; and 3) a zero-code approach designed to empower researchers without coding skills to effectively utilize the tool. We believe that these enhancements represent meaningful progress in the analysis of cell behaviors within the tumor microenvironment which will be valuable for the IVM community. We ensure that these points are clearly articulated in the revised manuscript:

      In introduction: “In line with this concept of characterizing cellular dynamic properties for cell classification, we have previously developed an analytical platform termed BEHAV3D 19,21 allowing to perform behavioral phenotyping of engineered T cells targeting cancer. While BEHAV3D was initially developed to analyze T cell migratory behavior under controlled in vitro conditions, we sought to expand its application to investigate tumor cell behaviors in IVM data, where the complexity of the TME presents distinct analytical challenges. This manuscript builds on our foundational work but represents a significant advancement by adapting the pipeline specifically for IVM datasets.”

      Reviewer #3 (Recommendations for the authors): 

      (1) If the authors want to "democratize the analysis of heterogeneous cancer cell behaviors", they should perform image segmentation and tracking using open-source codes (e.g., Cellpose, Stardisk & 3DCellTracker) and not rely on the expensive and inaccurate ImarisTrack Module for the image analysis step of BEHAV3D. 

      We thank the reviewer for this recommendation and as stated above we recognize that enhancing our pipeline's compatibility with open-source options is important. To this end, we have updated our tool to support data formats generated by open-source Fiji plugins like TrackMate, MTrackJ, and ManualTracking, improving compatibility with various segmentation and tracking pipelines (https://github.com/imAIgeneDream3D/BEHAV3D_Tumor_Profiler?tab=readme-ov-file#data-input ). In the revised manuscript, we detail this new functionality and demonstrate the operation of the BEHAV3D-TP heterogeneity module using an example dataset of glioma tumors.

      Additionally, we have updated the introduction to better clarify the scope of our study (See comment #1 from Review #3) and include references to existing image processing solutions.

      (2) For the 7 distinctive motility clusters, the authors should provide a more detailed analysis of the differences between them. It's unclear whether the difference in retreating, slow retreating, erratic, static, slow, slow invading, and invading correspond to functional difference of the tumor cells. 

      As noted in the comment above, the revised manuscript now incorporates references to relevant literature that support our understanding that behavioral differences among cells are driven by their underlying functional differences (See comment #2 from Reviewer #3). Additionally, we would like to point to Figure 2d and Supplementary Fig 4 c that provide evidence of the functional distinctions between the identified clusters.

      (3) The authors should expand the scale of tumor behavior features to classify the tumor phenotype clusters, e.g., to include tumor morphology, proliferation state, and tumor cell interaction with other TME cell types.

      We thank the reviewer for this valuable suggestion. In the revised manuscript, we have added the flexibility to incorporate a wide range of features, including morphological ones, and enabled users to select the specific features they wish to include in their analysis. To illustrate this functionality, we have included 2 example dataset analyzed using this approach (See comment #3 from Reviewer #3). Additionally, as indicated above we emphasize the importance of careful selection and interpretation of features, as improper choices may lead to biologically irrelevant results. This clarification is intended to ensure that users apply the tool thoughtfully and derive meaningful insights.

    1. eLife Assessment

      This important study investigates the role of Drp1 in early embryo development. The authors have addressed most of the original comments and the work now presents convincing evidence on how this protein influences mitochondrial localization and partitioning during the first embryonic divisions. The research employs the Trim-Away technique to eliminate Drp1 in zygotes, revealing critical insights into mitochondrial clustering, spindle formation, and embryonic development.

    2. Reviewer #1 (Public review):

      Summary:

      Gekko, Nomura et al., show that Drp1 elimination in zygotes using the Trim-Away ttechnique leads to mitochondrial clustering and uneven mitochondrial partitioning during the first embryonic cleavage, resulting in embryonic arrest. They monitor organellar localization and partitioning using specific targeted fluorophores. They also describe the effects of mitochondrial clustering in spindle formation and the detrimental effect of uneven mitochondrial partitioning to daughter cells.

      Strengths:

      The authors have gathered solid evidence for the uneven segregation of mitochondria upon Drp1 depletion through different means: mitochondrial labelling, ATP labelling and mtDNA copy number assessement in each daughter cell. Authors have also characterised the defects in cleavage mitotic spindles upon Drp1 loss

      Weaknesses:

      This study convincingly describes the phenotype seen upon Drp1 loss. However, it remains descriptive. Further studies should be conducted to elucidate the mechanism by which Drp1 ensures even mitochondrial partitioning during the first embryonic cleavage.

    3. Reviewer #2 (Public review):

      Gekko et al investigate the impact of perturbing mitochondrial during early embryo development, through modulation of the mitochondrial fission protein Drp1 using Trim-Away technology. They aimed to validate a role for mitochondrial dynamics in modulating chromosomal segregation, mitochondrial inheritance and embryo development and achieve this through the examination of mitochondrial and endoplasmic reticulum distribution, as well as actin filament involvement, using targeted plasmids, molecular probes and TEM in pronuclear stage embryos through the first cleavages divisions. Drp1 deletion perturbed mitochondrial distribution, leading to asymmetric partitioning of mitochondria to the 2-cell stage embryo, prevented appropriate chromosomal segregation and culminated in embryo arrest. Resultant 2-cell embryos displayed altered ATP, mtDNA and calcium levels. Microinjection of Drp1 mRNA partially rescued embryo development. A role for actin filaments in mitochondrial inheritance is described, however the actin-based motor Myo19 does not appear to contribute.

      Overall, this study builds upon their previous work and provides further support for a role of mitochondrial dynamics in mediating chromosomal segregation and mitochondrial inheritance. In particular, Drp1 is required for redistribution of mitochondria to support symmetric partitioning and support ongoing development.

      Strengths:<br /> The study is well designed, the methods appropriate and the results clearly presented. The findings are nicely summarised in a schematic.

      The addition of further quantification, including mitochondrial cluster size, elongation/aspect ratio and ROS, as requested by the reviewers, has provided further evidence for the impact of Drp1 depletion on mitochondrial morphology and function.

      Understanding the role of mitochondria in binucleation and mitochondrial inheritance is of clinical relevance for patients undergoing infertility treatment, particularly those undergoing mitochondrial replacement therapy.

      Weaknesses (original manuscript):<br /> The authors first describe the redistribution of mitochondria during normal development, followed by alterations induced by Drp1 depletion. It would be useful to indicate time post-hCG for imaging of fertilised zygotes (first paragraph of the results/Figure 1) to compare with subsequent Drp1 depletion experiments.

      It is noted that Drp1 protein levels were undetectable 5h post-injection, suggesting earlier times were not examined, yet in Figure 3A it would seem that aggregation has occurred within 2 hours (relative to Figure 1).

      Mitochondria appear to be slightly more aggregated in Drp1 fl/fl embryos than in control, though comparison with untreated controls does not appear to have been undertaken. There also appears to be some variability in mitochondrial aggregation patterns following Drp1 depletion (Figure 2-suppl 1 B) which are not discussed.

      The authors use western blotting to validate the depletion of Drp1, however do not quantify band intensity. It is also unclear whether pooled embryo samples were used for western blot analysis.

      Likewise, intracellular ROS levels are examined however quantification is not provided. It is therefore unclear whether 'highly accumulated levels' are of significance or related to Drp1 depletion.

      In previous work, Drp1 was found to have a role as a spindle assembly checkpoint (SAC) protein. It is therefore unclear from the experiments performed whether aggregation of mitochondria separating the pronuclei physically (or other aspects of mitochondrial function) prevents appropriate chromosome segregation or whether Drp1 is acting directly on the SAC.

      Weaknesses (revised manuscript):

      The only remaining weakness is that the authors have not undertaken additional experiments to clarify any role for mitochondrial transport following Drp1 depletion.

    4. Reviewer #3 (Public review):

      Why mitochondria are finely maintained in the female germ cell (oocyte), zygotes, and preimplantation embryos? Mitochondrial fusion seems beneficial in somatic cells to compensate for unhealthy mitochondria, for example, mitochondria with mutated mtDNA that potentially defuel the respiratory activity if accumulated above a certain threshold. However, in the germ cells, it may rather increase the risk of transmitting mutated mtDNA to the next generation. Also, finely maintained mitochondria would also be beneficial for efficient removal when damaged, as authors briefly discussed. Due in part to the limited suitable model, physiological role of mitochondrial fission in embryos were obscure. In this study, authors demonstrated that mitochondrial fission prevents multiple adverse outcomes, especially including the aberrant demixing of parental genome (a clinical phenotype of human embryos) in zygotic stage. Thus, this study would be also of clinical importance that could contribute by proposing a novel mechanism.

      After reading through the comments of other reviewers, what authors could potentially improve their manuscript had been largely summarized in three following points.

      (1) Authors would better clarify whether a loss of Drp1 contributes to the chromosome segregation defects directly (e.g. checking SAC-like activity) or indirectly (aggregated mitochondria became physically obstacle; maybe in part getting the cytoskeleton involved).

      (2) Although the level of Myo19 may not be so high (given the low level of TRAK2 in oocytes: Lee et al. PNAS 2024, PMID 38917013), authors would better further clarify the effect of Myo19-Trim with timelapse (e.g. EB3-GFP/Mt-DsRed) and EM analysis (detailed mitochondrial architecture).

      (3) Authors would better clarify phenotypic heterogeneity/variety regarding the degree of alteration in mitochondrial morphology/ architecture dependent on the levels of Drp1 loss with detailed quantification of EM images to address why aggregation of mitochondria in Drp1-/- parthenote (possibly, more likely Drp1 protein-free) looks different/weaker than Trim-awayed one. Employment of the parthenotes of Trim-awayed MII oocytes might also complement the further discussion.

      The revised preprinted have addressed all the points described above. Authors have also adequately indicated the limitations at each of the specific points. Revisions authors made have consolidated their conclusion, thus still, making this study an excellent one.

    5. Author response:

      The following is the authors’ response to the original reviews

      Reviewer #1 (Public review):

      We thank reviewer 1 for the helpful comments. As indicated in the responses below, we have taken all comments and suggestions into consideration in this revised version of the manuscript.

      Weaknesses:

      While this study convincingly describes the phenotype seen upon Drp1 loss, my major concern is that the mechanism underlying these defects in zygotes remains unclear. The authors refer to mitochondrial fragmentation as the mechanism ensuring organelle positioning and partitioning into functional daughters during the first embryonic cleavage. However, could Drp1 have a role beyond mitochondrial fission in zygotes? I raise these concerns because, as opposed to other Drp1 KO models (including those in oocytes) which lead to hyperfused/tubular mitochondria, Drp1 loss in zygotes appears to generate enlarged yet not tubular mitochondria. Lastly, while the authors discard the role of mitochondrial transport in the clustering observed, more refined experiments should be performed to reach that conclusion.

      It would be difficult to answer from this study whether Drp1 plays a role beyond mitochondrial fission in zygotes. However, the reasons why Drp1 KO zygotes differ from the somatic Drp1 KO model can be discussed as follows.

      First, the reviewer mentioned that the loss of Drp1 in oocytes leads to hyperfused/tubular mitochondria, but in fact, unlike in somatic cells, the EM images in Drp1 KO oocytes show enlarged mitochondria rather than tubular structures (Udagawa et al., Curr Biol. 2014, PMID: 25264261, Fig. 2C and Fig. S1B-D), as in the case of zygotes in this study. Mitochondria in oocytes/zygotes have the shape of a small sphere with an irregular cristae located peripherally. These structural features may be the cause of insensitivity or resistance to inner membrane fusion the resultant failure to form tubular mitochondria as seen in somatic cell models. Nonetheless, quantitative analysis of EM images in the revised version confirmed that the mitochondria of Drp1-depleted embryos were not only enlarged but also significantly elongated (Figure 2J-2M). Therefore, in Drp1-depleted embryos, significant structural and functional (e.g., asymmetry between daughters) changes in mitochondria were observed, and these are expected to lead to defects in the embryonic development.

      As for mitochondrial transport, we do not fully understand the intent of this question, but we do not entirely rule out mitochondrial transport. At least clustered mitochondria did not disperse again, but how mitochondria behave through the cytoskeleton within clusters will require further study, as the reviewer pointed out.

      Reviewer #1 (Recommendations For The Authors):

      (1) The authors show no effect of Myo19 Trim-Away, yet it remains unclear whether myo19 is involved in the positioning of mitochondria around the spindle. Judging by their co-localization during that stage, it might be. Therefore, in the absence of myo19, mitochondria might remain evenly distributed throughout mitosis, thus passively resulting in equal partitioning to daughter cells, with no severe developmental defects. Could the authors show a video of the whole process and discuss it?

      We have newly performed live imaging of mitochondria and chromosomes in Myo19 Trim-Away zygotes (n=13). As shown in Figure 1-figure supplement 2 and Figure 1-Video 2, there were no obvious changes in mitochondrial (and chromosomal) dynamics throughout the first cleavage and no significant mitochondrial asymmetry was observed, Therefore, we conclude that depletion of Myo19 does not cause mitochondrial asymmetry during embryonic cleavage. These results are described in the revised manuscript (Line 218-221).

      (2) Mitochondrial aggregation upon Drp1 depletion should be characterized in more detail: for example, % of mitochondria free, % in small clusters (> X diameter), and % in big clusters (>Y diameter).

      In the revised version, mitochondrial aggregation has been quantified by comparing the cluster size and number in control, Drp1 Trim-Away and Drp1 Trim-Away embryos expressing exogenous Drp1 (mCh-Drp1) (Figure 2G, 2H). In control embryos, mitochondria were interspersed in a large number of small clusters, while in Drp1-depleted embryos, mitochondria became highly aggregated into a small number of large clusters that was reversed by expression of mCh-Drp1. These results are described in the revised manuscript (Line 242-245).

      (3) The discrepancies with parthenogenetic embryos derived from Drp1 (-/-) parthenotes should be commented on. Quantification of the dimensions of the clusters would help establish the degree of similarity/difference. Could the authors comment on their hypothesis as to why the clusters are remarkably larger in Drp1 depleted zygotes?

      In the revised version, we have quantified the mitochondrial aggregation in Drp1 KO parthenotes (Figure 2-figure supplement 1; the data for Drp1 KO parthenotes has been reorganized into the supplemental figure, due to lack of space in figure 2 caused by the addition of quantitative data for Drp1 Trim-Away embryos). The size of mitochondrial clusters in Drp1 KO parthenotes was significantly increased compared to controls, but as the reviewer noted, mitochondrial aggregation appears to be moderate compared to that in Drp1-depleted embryos. The phenotypic discrepancies in two Drp1-deficient embryo models is discussed below.

      First, it is clear that phenotypic severity of Drp1 KO oocytes is dependent on the age of the female. Indeed, oocytes collected from 8-week-old female arrested meiosis after NEB, mainly due to marked mitochondrial aggregation (Udagawa et al., Curr Biol. 2014, PMID: 25264261), whereas oocytes from juvenile female completed meiosis (Adhikari et al., Sci Adv. 2022, PMID: 35704569), and thus Drp1 KO pathenotes were obtained from juvenile female in the present study. Comparison of mitochondrial morphology in Drp1 KO oocytes in both papers also suggests that mitochondrial aggregation in adult mice is more intense (Udagawa et al., Curr Biol. Fig. 2A) than in juvenile mice (Adhikari et al., Sci Adv. 2022: Fig. 1G, 1H), and appears to be similar to Drp1-depleted embryos in this study (Figure 2E). There may be differences in the level of Drp1 depletion in these Drp1-deficient oocytes/zygotes. Similar results occurring between juvenile and adult KO female have been reported in a previous paper (Yueh et al., Development 2021, PMID: 34935904), as adult-derived Smac3<sup>Δ/Δ<?sup> zygotes arrested at the 2-cell stage, whereas juvenile-derived Smac3<sup>Δ/Δ<?sup> zygotes have developmental competence comparable to the wild type. Remarkably, the SMC3 protein levels in juvenile Smac3<sup>Δ/Δ<?sup> oocytes was also comparable to Smc3<sup>fl/fl</sup>. The authors surmised that the decline maternal SMC3 between juvenile and sexual maturity is probably due to the continuous induction of the promoter-Cre driver, suggesting that similar induction may also occur in Drp1 KO oocytes. In addition, we also observed not only age differences but also batch differences in Drp1 KO oocytes (and resulting embryos) such that little mitochondrial aggregation was observed in oocytes collected from some juvenile KO colonies. Therefore, for KO models showing age (sexual maturation)-dependent gradual phenotypic changes, Trim-way may be an approach that provides more reproducible results as it induces acute degradation of maternal proteins.

      (4) Mitochondrial clusters in Drp1 trim-away zygotes resemble those seen when defects in mitochondrial positioning are obtained by TRAK2 induction (PMID: 38917013), pointing again to a role of actin in the clustering process. Could the authors explore the role of actin further?

      TRAK2 and microtubule-dependent mechanisms may also be involved in mitochondrial dynamics during the first cleavage division, possibly in association with migration of two pronuclei. Although the mitochondrial aggregation induced by TRAK2 overexpression is similar to that in Drp1-depleted embryos, it is unlikely that changes at the EM level occurred as seen in Drp1-depleted embryos (enlarged mitochondria, etc.). In addition, in TRAK2-overexpressing embryos, rather than uneven partitioning of mitochondria, the daughter blatomeres themselves were uneven in size after cleavage, making it difficult to precisely assess the similarity between the two models.

      Regarding the role of F-actin, we show that the subcellular distribution of cytoplasmic actin overlaps with that of mitochondria throughout the first cleavage and seems to accumulate in aggregated mitochondria, particularly during the mitotic phase, as higher correlation was observed (Figure 1E). Although it was not observed that actin and the myo19 motor regulate mitochondrial partitioning, as reported in somatic cell-based studies, it is possible that actin accumulated in mitochondria may be indirectly involved in mitochondrial dynamics via mitochondrial fission. For example, inverted formin 2 (INF2) enhance actin polymerization and is required for efficient mitochondrial fission as an upstream function of Drp1 (Korobova et al., Science 2013, PMID: 23349293). In the revised manuscript, we have added the description on this point. (Line 452-456)

      (5) Electron microscopy images showed indeed aberrant morphology of the mitochondria, yet not a hyperfused morphology. Aspect ratio (long/short axis) quantification should be included, besides the current measurement, since mitochondria in Drp1 trim-away look bigger yet as round as in the control.

      In the revised version, detailed quantitative data on EM images has been added (Figure 2J-2M). In Drp1 depleted embryos, significant increases were observed in both the major and minor axes of mitochondria. As the reviewer noted, we also assumed that mitochondria in depleted embryos were enlarged rather than elongated, but the quantification of aspect ratio shows that significant elongation occurred. These results has been described in the revised manuscript (Line 252-256).

      (6) Why are mitochondria in golgi-mcherry-expressing cells showing a different morphology of the clusters?

      As noted by the reviewer, compared to other mitochondrial images, Drp1-depleted embryos expressing Golgi-mCherry appear to have less mitochondrial aggregation. The exact reason is not known, but may be due to inter-lot variation of Trim21 mRNA used in this experiment. Nevertheless, substantial mitochondrial aggregation was observed compared to the control, which does not seem to affect the conclusion.

      (7) Authors comment on ROS being enriched (highly accumulated) in mitochondria. However, while quantification is missing, it might seem that ROS are equally distributed in control or Drp1 Trim-Away embryos. Could the authors quantify ROS signal inside and outside of the mitochondria, perhaps using a mask drawn by mitotracker? Furthermore, it would make these data more convincing to artificially induce/deplete ROS to validate the sensitivity of the technique to variations. Also, why is ROS pattern referred to as ectopic?

      Thank you for your useful suggestions. In the revised version, masked binary images were created from mitochondrial images to quantify ROS levels inside and outside mitochondria (Line 734-741). The result shows the accumulation of ROS to mitochondria in Drp1-depleted embryos (Figure 4-figure supplement 1E). The term ectopic was used to mean excessive accumulation of ROS in the mitochondria compared to normal embryos, but has been deleted as it is not very accurate.

      Minor comments:

      (A) Video 1: images at t=-00:20 and t=00:00 of the mtGFP are actually the same images as H2B-mCherry.

      Probably a faulty filter/shutter control failed to capture GFP fluorescence at these times. It appears that the autocontrast function detected a small amount of mCherry fluorescence leakage. It would be possible to replace it with another video, but as the relevant frame were unrelated to the analysis, the previous video was used as is. The same problem also occurs in the newly added Myo19-depleted zygote movie (Figure 1-Video 2, 03:15).

      (B) Could you calculate the degree of colocalization between mt-GFP and ER-mCherry in ctrl and Drp1 trim-away? While it is apparent that ER is somehow more associated with mitochondrial clusters, it would be informative to quantify it.

      Since the ER is partially confined to the mitochondrial aggregation site, it was difficult to calculate correlation coefficients from fluorescence images of mt-GFP and ER-mCherry to quantitatively assess colocalization. Instead, line scan analysis of whole mitochondrial clumps showed that the peak of the ER-mCherry signal overlaps with that of mt-GFP, but this is not the case for Golgi-mCherry or peroxisome-mCherry (Figure 2-figure supplement 2A-2C).

      (C) Regarding the developmental arrest: The quantification of the different stages at each developmental time could be more informative. For example, at E4.5 how many embryos are at each stage (2-cell, 4-cell, ... blastocyst)? Also, could the authors comment on the reduction in developmental competence in Figure 4C, regarding the blastocyst stage?

      Many arrested embryos do not maintain their morphologies and undergo a unique degenerative process over time, known as cell fragmentation. Therefore, it is difficult to accurately determine the number of each developmental stage at, for example, E4.5 days. In this study, the 2-cell stage was observed at E1.5, the 4-8 cell at E2.5-E3.0, morula at E3.5 and the blastocyst at E4.5.

      Although the rate of embryos reaching the blastocyst stage was reduced compared to that of normal embryos, the overexpression of mCh-Drp1 may explain the failure of complete restoration of developmental competence, since embryos injected solely with mCh-Drp1 mRNA also showed reduced developmental competence. For rescue experiments, the comparison with internal controls is more important and therefore we described below. This is a specific effect of Drp1 deletion because none of the internal control conditions increased arrest at the 2-cell stage and arrest was completely reversed by microinjecting Trim-away insensitive exogenous mCh-Drp1 mRNA (Line 337-340).

      (D) In lines 103 to 105, proliferation should be changed to division or development.

      In the revised version, proliferation has been changed to division (Line 103).

      (E) Could the authors reference the statement in lines 168-169?

      The following 3 references have been added (Hardy et al., 1993, PMID: 8410824; Meriano et al., 2004, PMID: 15588469; Seikkula et al., 2018, PMID: 29525505).

      (F) Line 448: "Cells lacking Drp1 have highly elongated mitochondria that cannot be divided into transportable units,..." This is clearly not the case for zygotes, so why are then these mitochondria still clustering and not transported elsewhere?

      Although it is difficult to answer this reviewer's question precisely, EM images of Drp1-depleted embryos suggest that individual mitochondria appear not only to be enlarged but also to have increased outer membrane attachment due to excessive aggregation. Thus, these large mitochondrial clumps may therefore be preventing transport.

      Reviewer #2 (Public review):

      We thank reviewer 2 for the helpful comments. As indicated in the responses below, we have taken all comments and suggestions into consideration in this revised version of the manuscript.

      Weaknesses:

      The authors first describe the redistribution of mitochondria during normal development, followed by alterations induced by Drp1 depletion. It would be useful to indicate the time post-hCG for imaging of fertilised zygotes (first paragraph of the results/Figure 1) to compare with subsequent Drp1 depletion experiments.

      In the revised version, the time after hCG has been indicated (Line 176-182). In subsequent Drp1 depletion experiments, the revised version notes that “no significant delay in cell cycle progression was observed following Drp1 depletion (data not shown) compared to control embryos (Figure 1A)” (Line 291-193). There was a slight discrepancy in the time post-hCG between live imaging and immunofluorescence analysis (Figure 1-figure supplement 1A), which may be due to manipulation of zygotes outside incubator during the microinjection of mRNA.

      It is noted that Drp1 protein levels were undetectable 5h post-injection, suggesting earlier times were not examined, yet in Figure 3A it would seem that aggregation has occurred within 2 hours (relative to Figure 1).

      As the reviewer pointed out, the depletion of Drp1 is likely to have occurred at an earlier stage. In this study, due to the injection of various mRNAs to visualize organelles such as mitochondria and chromosomes, observations were started after about 5 h of incubation for their fluorescent proteins to be sufficiently expressed. Therefore, for the Western blot analysis, samples were prepared according to the time of the start of the observation.

      Mitochondria appear to be slightly more aggregated in Drp1 fl/fl embryos than in control, though comparison with untreated controls does not appear to have been undertaken. There also appears to be some variability in mitochondrial aggregation patterns following Drp1 depletion (Figure 2-suppl 1 B) which are not discussed.

      In the revised version, mitochondrial aggregation has been quantified by comparing the cluster size and number in control, Drp1 Trim-Away and Drp1 Trim-Away embryos expressing exogenous Drp1 (mCh-Drp1) (Figure 2G, 2H). We have also quantified the mitochondrial aggregation in Drp1<sup>fl/fl</sup> and Drp1<sup>Δ/Δ</sup> parhenotes (Figure 2-figure supplement 1; note that the data for Drp1 KO parthenotes has been reorganized into the supplemental figure, due to lack of space in figure 2 caused by the addition of quantitative data for Drp1 Trim-Away embryos). Mitochondria appear to be slightly more aggregated in Drp1<sup>fl/fl</sup> embryos than in control, but no significant differences in cluster size or number were observed (data not shown). On the other hand, mitochondrial clusters in Drp1 Trim-Away embryos were remarkably larger than Drp1<sup>Δ/Δ</sup> parhenotes, Please refer to the response to reviewer 1's comment (3) for discussion of this discrepancy.

      As noted by the reviewer, compared to other mitochondrial images, Drp1-depleted embryos expressing Golgi-mCherry appear to have less mitochondrial aggregation. The exact reason is not known, but may be due to inter-lot variation of Trim21 mRNA used in this experiment. Nevertheless, substantial mitochondrial aggregation was observed compared to the control, which does not seem to affect the conclusion.

      The authors use western blotting to validate the depletion of Drp1, however do not quantify band intensity. It is also unclear whether pooled embryo samples were used for western blot analysis.

      In the revised version, the band intensities in Western blot analysis were quantified and validated the previous results (Figure 1H for Myo19 depletion, Figure 2B for Drp1 expression during preimplantation development, Figure 2D for Drp1 depletion). The number of embryos analyzed was described in Figure legends (Pooled samples ranging from 20 to 100 were used).

      Likewise, intracellular ROS levels are examined however quantification is not provided. It is therefore unclear whether 'highly accumulated levels' are of significance or related to Drp1 depletion.

      In the revised version, masked binary images were created from mitochondrial images to quantify ROS levels inside and outside mitochondria (Line 734-741). The result shows the accumulation of ROS to mitochondria in Drp1-depleted embryos (Figure 4-figure supplement 1E).

      In previous work, Drp1 was found to have a role as a spindle assembly checkpoint (SAC) protein. It is therefore unclear from the experiments performed whether aggregation of mitochondria separating the pronuclei physically (or other aspects of mitochondrial function) prevents appropriate chromosome segregation or whether Drp1 is acting directly on the SAC.

      In the revised manuscript, we have discussed this reference (Zhou et al., Nature Communications, PMID: 36513638) (Line 482-483).

      Reviewer #2 (Recommendations For The Authors):

      The authors report that disruption of F-actin organization led to asymmetry in mitochondrial inheritance, however depletion of Myo19 does not impact inheritance. The authors note in the discussion that loss of another mitochondrial motor protein, Miro, has been shown to affect mitochondrial inheritance. They suggest this may be due to reduced levels of Myo19, despite data from the present study suggesting a lack of involvement of Myo19. Given that Miro1 also interacts with microtubules, and crosstalk between actin filaments and microtubules has been reported, have the authors considered whether other motor proteins, such as KIF5, may be involved in mitochondrial movement in the zygote and therefore inheritance? Myo19 also plays a role in mitochondrial architecture. Were any differences noted at the EM level?

      During oocyte meiosis and early embryonic cleavage, kinesin-5 has been reported to be important for the formation of bipolar spindles (Fitzharris, Curr Biol., 2009, PMID: 19465601) and may have some involvement in mitochondrial dynamics. Given that the migration of two pronuclei towards the zygotic centre is dynein-dependent manner (Scheffler Nat Commun. 2021PMID: 33547291), dynein may also be involved in the process of mitochondrial accumulation around the pronuclei. Nevertheless, whether microtubule-dependent mechanisms regulate mitochondrial partitioning remains controversial. Mitochondria basically diverge from microtubules at the onset of mitosis, and indeed Miro1-deleted zygotes did not show the asymmetric mitochondrial partitioning (Lee et al., Front Cell Dev Biol. 2022, PMID: 36325364). More recently, it was reported that overexpression of TRAK2 causes significant mitochondrial aggregation in embryos (Lee et al., Proc Natl Acad Sci U S A. 2024, PMID: 36325364), but since overexpression might disrupt a regulatory balance by other motors/adaptor complexes, further investigation using TRAK2-deficient embryos is expected.

      As noted by the reviewer, myo19 seems to be important for the maintenance of mitochondrial cristae architecture and, consequently, for the regulation of mitochondrial function (Shi et al., Nat Commun. 2022, PMID: 35562374). We have not observed the EM images in myo19-depleted embryos, but we examined their membrane potential and ROS by TMRM and H2DCF staining, respectively, and confirmed that they were comparable to control embryos (data not shown). The loss of myo19 in zygotes/embryos did not cause any functional changes in mitochondria, suggesting that mitochondrial architecture may not be substantially affected either.

      Transcriptomic analysis would be useful to identify alterations in cell cycle checkpoint regulators, as well as immunofluorescence to identify changes in spindle assembly checkpoint protein recruitment.

      The present results showed that the majority of Drp1-depleted embryos arrest at the G2 stage, possibly due to cell cycle checkpoint mechanisms. Transcriptome analysis would certainly be beneficial, but eventually more detailed analysis of proteins and their phosphorylation modifications, etc. is needed for accurate assessment. These studies will be the subject of future work.

      Minor comments:

      There are many instances where the English could be improved, particularly the overuse of the word 'the'.

      We have checked the manuscript again carefully and hopefully it has been improved some.

      Line 144: replace 'took' with 'take'.

      We have corrected this in the revised version (Line 140).

      Line 157: it is unclear what is meant by 'hinders the functional importance of Drp1 in mature oocytes and embryos'.

      This description has been corrected to “complicates the functional analysis of Drp1 in mature oocytes and embryos” (Line 152-153)

      Line 198: replace with 'displayed a mitochondrial distribution pattern closely associated with'

      We have corrected this in the revised version (Line 195-196).

      Line 200: provide a time to clarify when the cytoplasmic meshwork was 'subsequently reorganized'

      In the revised version, “at the metaphase” has been added (Line 198).

      Line 204: replace 'to' with 'for'

      We have corrected this in the revised version (Line 203).

      Lines 285-87: consider rearranging the text to improve the flow.

      To improve the flow of text before and after, the following sentence has been added; We postulated that this asymmetry was due to non-uniformity in the distribution of mitochondria around the spindle (Line 295-297)

      Line 418: replace 'central' with 'centre'

      We have corrected this in the revised version (Line 430).

      Line 427: replace 'pertaining' with 'partitioning'

      We have corrected this in the revised version (Line 438).

      Line 574: clarify to what '1-5% of that of the oocytes' refers

      We have corrected it to “1-5% of the total volume of the zygote.” (Line 587-588).

      Line 619: indicate the dilution used

      We apologize for the previous incorrect description. We used a part of the extract as the template, not a dilution, and have corrected it to be accurate (Line 631-632).

      Line 634: replace 'on' with 'in' and detail in which medium embryos were mounted.

      We have corrected this in the revised version (Line 647).

      Please check all spelling in the figures.

      Figure 1J - inheritance is spelt incorrectly.

      Figure-Suppl 1, D: Interphase (PN) and (2-cell) is spelt incorrectly. G: inheritance is spelt incorrectly.

      Figure 5F - bottom section prior to cytokinesis, spindle is spelt 'spincle'

      Ensure consistency in abbreviation use (e.g. use of NEB and NEBD).

      Thank you for your careful correction of typographical errors. In the revised version, all points raised by the reviewers have been corrected.

      Reviewer #3 (Public review):

      We thank reviewer 2 for the helpful comments. As indicated in the responses below, we have taken all comments and suggestions into consideration in this revised version of the manuscript.

      Seemingly, there are few apparent shortcomings. Following are the specific comments to activate the further open discussion.

      Line 246: Comments on cristae morphology of mitochondria in Drp1-depleted embryos would better be added.

      In the revised manuscript, we have added the following comment; swollen or partially elongated mitochondria with lamella cristae structures in the inner membrane were observed in Drp1 depleted embryos. In addition, the quantification of aspect ratio (long/short axis) shows that significant mitochondrial elongation was occurred (Figure 2M). These results has been described in the revised manuscript (Line 251-256).

      - Regarding Figure 2H: If possible, a representative picture of Ateam would better be included in the figure. As the authors discussed in line 458, Ateam may be able to detect whether any alterations of local energy demand occurred in the Drp1-depleted embryos.

      Thank you for your very useful comments. Although it would be interesting to investigate whether alterations in ATP levels occurred in localized areas (e.g., around the spindle), the present study used conventional fluorescence microscope instead of confocal laser microscopy to observe ATeam fluorescence in order to quantify the fluorescence intensity in the whole embryo (or whole blastomere) and thus we currently cannot provide the images that reviewer expected. As shown in Figure-figure supplement 1C, the ATP levels tend to be higher at the cell periphery in control and at the mitochondrial aggregation areas in Drp1-depleted embryos, but it would need high resolution images using confocal microscopy to show it clearly.

      - Line 282: In Figure 3-Video 1, mitochondria were seemingly more aggregated around female pronucleus. Is it OK to understand that there is no gender preference of pronuclei being encircled by more aggregated mitochondria?

      Review of multiple videos shows that aggregated mitochondria were localized toward the cell center, but did not exhibit the behavior of preferentially concentrating near the female pronucleus.

      - Line 317: A little more explanation of the "variability" would be fine. Does that basically mean that the Ca<sup>2+</sup> response in both Drp1-depleted blastomeres were lower than control and blastomere with more highly aggregated mitochondria show severer phenotype compared to the other blastomere with fewer mito?

      We think that the reviewer's comments are mostly correct. It is clear that there is a bias in Ca<sup>2+</sup> store levels between blastomeres of Drp1 depleted embryos, However, since mitochondria were not stained simultaneously in this experiment, we cannot draw conclusions in detail, such that daughter blastomere that inherit more mitochondria have higher Ca<sup>2+</sup> stores, or that blastomere with more aggregated mitochondria have lower Ca<sup>2+</sup> stores.

      - Regarding Figure 5B (& Figure 1-figure supplement 1B): Do authors think that there would be less abnormalities in the embryos if Drp1 is trim-awayed after 2-cell or 4-cell, in which mitochondria are less involved in the spindle?

      The marked centration of mitochondrial clusters in Drp1-depleted embryos appears to be associated with migration of the pronuclei toward the cell center, which is unique to the first embryonic cleavage. Since the assembly of the male and female pronuclei at the cell center is also unique to the first cleavage, binucleation due to mitochondrial misplacement was observed only in the first cleavage. Therefore, if Drp1 is depleted at the 2-cell or 4-cell stage, chromosome segregation errors may be less frequent. However, since unequal partitioning of mitochondria is thought to occur, some abnormalities in embryonic development is likely to be observed.

      Reviewer #3 (Recommendations For The Authors):

      Specific comments

      - Line 262: "Since mitochondrial dynamics are spatially coordinated at the ER-mitochondria MCSs," adequate ref. would better be added.

      We have added an adequate reference to the revised manuscript (Friedman et al., 2011, PMID: 21885730).

      - Line 333-336: "...as assessed by the presence of the nuclear envelope." Do authors show the data? In Figure 4-figure supplement 1A, the difference of the phosphoH3-ser10 signal between control and Trim-Away group might be weak. For clarity, it would be helpful if authors indicate the different points to note in the figure.

      Although the data is not shown, nuclear staining of arrested 2-cell stage embryos exhibited clear nuclear membranes, similar to the DAPI image in Figure 4-figure supplement 1A. We have indicated that the data is not shown in the revised version (Line 345). Based on a report that phosphorylated histone H3 (Ser10) localizes in pericentromeric heterochromatin that hat can be visualized by DAPI staining in late G2 interphase cell (Hendzel et al., 1997, Chromosoma, PMID: 9362543), this study qualitatively estimated the G2 phase from the phosphorylated histone H3 signal and the DAPI counterstained images. We have noted this point in the revised figure legend (Line 1012-1014).

      Typos or points for reword/rephrase

      - Line 149: "molecular identification" may better be " molecular characteristics".

      We have corrected this in the revised version (Line 145).

      - Line 157: "hinders the functional importance" would be "implies the functional importance" or "complicates the functional analysis".

      We have corrected this in the revised version (Line 152-153).

      - Line 208: "Since the role of F-actin in many cellular events, such as cytokinesis, preclude them as targets for experimentally manipulating mitochondrial distribution, " may better be "Given many cellular roles, disruption of F-actin per se was unsuitable as a strategy for manipulating mitochondrial distribution", for example.

      We have corrected this in the revised version (Line 207-208).

      - Line 260: "with MCSs with the plasma.." may better be "with MCSs such as with the plasma..".

      We have corrected this in the revised version (Line 267-268).

      - Line 312: "distribution and segregation" may better be "distribution and the resulting segregation of the inter-organelle contacts".

      We have corrected this in the revised version (Line 324-325).

      - Line 427: "pertaining" might be "partitioning".

      We have corrected this in the revised version (Line 438).

      Line 463: "loss of Drp1 induced mitochondrial aggregation disturbs" may better be "mitochondrial aggregation induced by the loss of Drp1 disturbs".

      We have corrected this in the revised version (Line 478-479).

      - Line 752: "endoplasmic reticulum (pink) " would be " endoplasmic reticulum (aqua) ".

      We have corrected this in the revised version (Line 780).

      - Figure 5E: "(Noma 2-cell embryos)" would be "(Nomal 2-cell embryos)".

      - Figure 5F: "Mitochondrial centration prevents dual spincle assembly" would be "Mitochondrial centration prevents dual spindle assembly".

      Thank you for your careful correction of typographical errors. We have corrected all the words/expressions the reviewer pointed out in the revised version.

    1. eLife Assessment

      This valuable study provides a novel framework for leveraging longitudinal field observations to examine the effects of aging on stone tool use behaviour in wild chimpanzees. The methods and results are robust providing solid evidence of the effects of old age on nut cracking behaviour at this field site. Despite the low sample size of five individuals, this study is of broad interest to ethologists, primatologists, archaeologists, and psychologists.

    2. Reviewer #1 (Public review):

      Summary:

      Howard-Spink et al. investigated how older chimpanzees changed their behavior regarding stone tool use for nutcracking over a period of 17 years, from late adulthood to old age. This behavior is cognitively demanding, and it is a good target for understanding aging in wild primates. They used several factors to follow the aging process of five individuals, from attendance at the nut-cracking outdoor laboratory site to time to select tools and efficiency in nut-cracking to check if older chimpanzee changed their behavior.

      Indeed, older chimpanzees reduced their visits to the outdoor lab, which was not observed in the younger adults. The authors discuss several reasons for that; the main ones being physiological changes, cognitive and physical constraints, and changes in social associations. Much of the discussion is hypothetical, but a good starting point, as there is not much information about senescence in wild chimpanzees.

      The efficiency for nut-cracking was variable, with some individuals taking a long time to crack nuts while others showed little variance. As this is not compared with the younger individuals and the sample is small (only five individuals), it is difficult to be sure if this is also partly a normal variance caused by other factors (ecology) or is only related to senescence.

      Strengths:

      (1) 17 years of longitudinal data in the same setting, following the same individuals.

      (2) Using stone tool use, a cognitively demanding behavior, to understand the aging process.

      Weaknesses:

      A lack of comparison of the stone tool use behavior with younger individuals in the same period, to check if the changes observed are only related to age or if it is an overall variance. The comparison with younger chimpanzees was only done for one of the variables (attendance).

      Comments on Revised Version (from BRE):

      The authors have now added to the manuscript that they did not have sufficient data to compare additional variables to younger chimpanzees, and therefore compared intra-individual variation across field seasons. They have also explained that nut hardness, although not measured, was largely controlled for due to the experimental nature of the 'outdoor laboratory' whereby only nuts of a suitable maturity (and hardness) are provided to the chimpanzees. The discussion now also includes mention of other ecological variables and their potential influence on the results.

    3. Reviewer #2 (Public review):

      Summary:

      Primates are a particularly important and oft-applied model for understanding the evolution of, e.g., life history and senescence in humans. Although there is a growing body of work on aging in primates, there are three components of primate senescence research that have been underutilized or understudied: (1) longitudinal datasets, (2) wild populations, and (3) (stone) tool-use behaviors. Therefore, the goal of this study was to (1) use a 17-year longitudinal dataset (2) of wild chimpanzees in the Bossou forest, (3) visiting a site for field experiments on nut-cracking. They sampled and analyzed data from five field seasons for five chimpanzees of old age. From this sample, Howard-Spink and colleagues noted a decline in tool-use and tool-use efficiency in some individuals, but not in others. The authors then conclude that there is a measurable effect of senescence on chimpanzee behavior, but that it varies individually. The study has major intellectual value as a building block for future research, but there are several major caveats.

      Strengths:

      With this study, Howard-Spink and colleagues make a foray into a neglected topic of research: the impact of the physiological and cognitive changes due to senescence on stone tool use in chimpanzees. Based on novelty alone, this is a valuable study. The authors cleverly make use of a longitudinal record covering 17 years of field data, which provides a window into long-term changes in the behavior of wild chimpanzees, which I agree cannot be understood through cross-sectional comparisons.

      The metrics of 'efficiency' (see caveats below) are suitable for measuring changes in technological behavior over time, as specifically tailored to the nut-cracking (e.g., time, number of actions, number of strikes, tool changes). The ethogram and the coding protocol are also suitable for studying the target questions and objectives. I would recommend, however, the inclusion of further variables that will assist in improving the amount of valid data that can be extrapolated (see also below).

      With this pilot, Howard-Spink and colleagues have established a foundation upon which future research can be designed, including further investigation with the Bossou dataset and other existing video archives, but especially future targeted data collection, which can be designed to overcome some of the limits and confounds that can be identified in the current study.

      Weaknesses:

      Although I agree with the reasoning behind conducting this research and understand that, as the authors state, there are logistical considerations that have to be made when planning and executing such a study, there are a number of methodological and theoretical shortcomings that either need to be more explicitly stated by the authors or would require additional data collection and analysis.

      One of the main limitations of this study is the small sample size. There are only 5 of the old-aged individuals, which is not enough to draw any inferences about aging for chimpanzees more generally. Howard-Spink and colleagues also study data from only five of the 17 years of recorded data at Bossou. The selection of this subset of data requires clarification: why were these intervals chosen, why this number of data points, and how do we know that it provides a representative picture of the age-related changes of the full 17 years?

      With measuring and interpreting the 'efficiency' of behaviors, there are in-built assumptions about the goals of the agents and how we can define efficiency. First, it may be that efficiency is not an intentional goal for nut-cracking at all, but rather, e.g., productivity as far as the number of uncrushed kernels (cf. Putt 2015). Second, what is 'efficient' for the human observer might not be efficient for the chimpanzee who is performing the behavior. More instances of tool-switching may be considered inefficient, but it might also be a valid strategy for extracting more from the nuts, etc. Understanding the goals of chimpanzees may be a difficult proposition, but these are uncertainties that must be kept in mind when interpreting and discussing 'decline' or any change in technological behaviors over time.

      For the study of the physiological impact of senescence of tool use (i.e., on strength and coordination), the study would benefit from the inclusion of variables like grip type and (approximate) stone size (Neufuss et al., 2016). The size and shape of stones for nut-cracking have been shown to influence the efficacy and 'efficiency' of tool use (i.e., the same metrics of 'efficiency' implemented by Howard-Spink et al. in the current study), meaning raw material properties are a potential confound that the authors have not evaluated.

      Similarly, inter- and intraspecific variation in the properties of nuts being processed is another confound (Falótico et al., 2022; Proffitt et al., 2022). If oil palm nuts were varying year-to-year, for example, this would theoretically have an effect on the behavioral forms and strategies employed by the chimpanzees, and thus, any metric of efficiency being collected and analyzed. Further, it is perplexing that the authors analyze only one year where the coula nuts were provided at the test site, but these were provided during multiple field seasons. It would be more useful to compare data from a similar number of field seasons with both species if we are to study age-related changes in nut processing over time (one season of coula nut-cracking certainly does not achieve this).

      Both individual personality (especially neophilia versus neophobia; e.g., Forss & Willems, 2022) and motivation factors (Tennie & Call, 2023) are further confounds that can contribute to a more valid interpretation of the patterns found. To draw any conclusions about age-related changes in diet and food preferences, we would need to have data on the overall food intake/preferences of the individuals and the food availability in the home range. The authors refer briefly to this limitation, but the implications for the interpretation of the data are not sufficiently underlined (e.g., for the relevance of age-related decline in stone tool-use ability for individual survival).

      Generally speaking, there is a lack of consideration for temporal variation in ecological factors. As a control for these, Howard-Spink and colleagues have examined behavioral data for younger individuals from Bossou in the same years, to ostensibly show that patterns in older adults are different from patterns in younger adults, which is fair given the available data. Nonetheless, they seem to focus mostly on the start and end points and not patterns that occur in between. For example, there is a curious drop in attendance rate for all individuals in the 2008 season, the implications of which are not discussed by the authors.

      As far as attendance, Howard-Spink and colleagues also discuss how this might be explained by changes in social standing in later life (i.e., chimpanzees move to the fringes of the social network and become less likely to visit gathering sites). This is not senescence in the sense of physiological and cognitive decline with older age. Instead, the reduced attendance due to changes in social standing seems rather to exacerbate signs of aging rather than be an indicator of it itself. The authors also mention a flu-like epidemic that caused the death of 5 individuals; the subsequent population decline and related changes in demography also warrant more discussion and characterization in the manuscript.

      Understandably, some of these issues cannot be evaluated or corrected with the presented dataset. Nonetheless, these undermine how certain and/or deterministic their conclusions can really be considered. Howard-Spink et al. have not strongly 'demonstrated' the validity of relationships between the variables of the study. If anything, their cursory observations provide us with methods to apply and hypotheses to test in future studies. It is likely that with higher-resolution datasets, the individual variability in age-related decline in tool-use abilities will be replicated. For now, this can be considered a starting point, which will hopefully inspire future attempts to research these questions.

      Falótico, T., Valença, T., Verderane, M. & Fogaça, M. D. Stone tools differences across three capuchin monkey populations: food's physical properties, ecology, and culture. Sci. Rep. 12, 14365 (2022).<br /> Forss, S. & Willems, E. The curious case of great ape curiosity and how it is shaped by sociality. Ethology 128, 552-563 (2022).<br /> Neufuss, J., Humle, T., Cremaschi, A. & Kivell, T. L. Nut-cracking behaviour in wild-born, rehabilitated bonobos (Pan paniscus): a comprehensive study of hand-preference, hand grips and efficiency. Am. J. Primatol. 79, e22589 (2016).<br /> Proffitt, T., Reeves, J. S., Pacome, S. S. & Luncz, L. V. Identifying functional and regional differences in chimpanzee stone tool technology. R. Soc. Open Sci. 9, 220826 (2022).<br /> Putt, S. S. The origins of stone tool reduction and the transition to knapping: An experimental approach. J. Archaeol. Sci.: Rep. 2, 51-60 (2015).<br /> Tennie, C. & Call, J. Unmotivated subjects cannot provide interpretable data and tasks with sensitive learning periods require appropriately aged subjects: A Commentary on Koops et al. (2022) "Field experiments find no evidence that chimpanzee nut cracking can be independently innovated". ABC 10, 89-94 (2023).

      Comments on Revised Version (from BRE):

      The authors have revised their methods to clarify why certain field seasons were chosen and have clarified aspects of their analysis relevant to this reviewer's concerns. The coula nut cracking data and results which were of a single season have now been restricted to the Supplementary. The revised discussion now includes a much more detailed limitations section including both ecological factors but also the effects of social aging. Stone tool size, grip and other factors are also acknowledged as being potentially important for measuring efficiency but the authors were unable to include in this study due to the nature of the dataset.

    4. Author response:

      The following is the authors’ response to the original reviews

      The main criticisms levied by both reviewers can be traced down to our use of a long-term video archive to assess for the effects of aging on individual chimpanzees over extended time periods. Specifically, the reviewers raised several points surrounding whether we could exclude ecological variation over years as the explanation of changes with aging, rather than aging itself. Whilst we acknowledge there are limitations to our approach, we provide a comprehensive response to these points highlighting:

      (1) Where ecological variables have been accounted for using controls (including the behaviors of other individuals, or an aging individuals’ behavior at younger ages).

      (2) Where ecological data may be missing, thus a potential limitation to our study, and further data would be beneficial.

      (3) Whether, in light of these limitations, interannual ecological variation offers a likely explanation for the behavioral changes we have identified. We provide an argument that whilst ecological data would be desirable for our study, interannual changes in ecology are unlikely to explain the trends in our data. Additionally, we explain why age-related changes, such as senescence, are more likely to underpin the patterns described in our manuscript.

      Across 1-3, we have made substantial changes to the reporting of our manuscript to ensure that our results are communicated transparently, and conclusions are made with appropriate care. We have also moved all discussion of coula-nut cracking to the supplementary materials, given the points raised by reviewers about the lack of data describing coula-nut cracking in earlier field seasons.

      We hope that these modifications will enhance both the editors’ and reviewers’ assessment of our manuscript, where we have aimed to make careful conclusions that are supported by our available data. Similarly, we have aimed to communicate the importance of our results across fields of research including primatology, evolutionary anthropology, and comparative gerontology, and hope that our research will be of use to further studies within these subfields.

      Reviewer 1 (Recommendations for the authors):

      (1) If possible, include results or a summary of the behaviour of younger adults using stone tools during the same period. It would be helpful to know if they had the same or different pattern to exclude other factors that may influence the tool use (harder nuts in a particular season, diseases, motivation for other foods, etc). 

      We include data for other individuals when analyzing attendance. However, we did not collect comparable long-term efficiency data on younger adult individuals for this study. This is, in part, due to the time constraints imposed by long-term behavior coding. Additionally, only one adult was both present at Bossou throughout the 1999-2016 period, and younger than the threshold for our old-age category across these years (thus, the baseline used to compare with older adults would be just one younger adult, thus would not have been useful for characterizing normal variation of many younger adults over time). However, given the longitudinal data we present, we can use data from the earlier field seasons for each elderly focal individual as a personalized baseline control. Previous studies at Bossou find that across the majority of adulthood, efficiency varies between individuals, but is stable within individuals over time (e.g., Berdugo et al. 2024, cited). We detected similar stability in individuals’ efficiency over the first three field seasons sampled in our analysis, where there was very little intra-individual variation in tool-using efficiency. However, in later years, two individuals (Velu & Yo) began to exhibit relatively large reductions in efficiency.

      These results are unlikely to be explained by ecological variation. If there was a change in ecology underpinning our results, we would expect: [1] changes in ecology to also introduce variation in earlier field seasons, and [2] to influence all individuals in our study similarly. As such, if the changes observed in later field seasons were due to ecological changes, they should have caused a reduced efficiency across individuals, and to a similar degree – we did not observe this result, with large reductions in efficiency were confined to two individuals.   Moreover, for Yo (the individual who exhibited the largest reduction in efficiency) we found some additional evidence that changes in oil-palm-nut cracking efficiency extended beyond the period we sampled, i.e. they were evident even in 2018, reflecting a long-term, directional reduction in efficiency as compared to earlier years of her life. This consistent reduction in tool-using efficiency over multiple years adds further weight to the hypothesis that changes at the level of the individual were causing reduced tool-using efficiency, rather than our results being underpinned by interseasonal variation in ecology.

      Whilst we agree that our study is limited in the extent to which we can analytically assess ecological explanations for changes in nut-cracking efficiency, we believe that hypothetical ecological changes across field seasons do not predict our results. We now raise both sides of this debate in our discussion, where we outline our limitations (see lines 535-593).

      (2) The data from 2011 was scarce, with only one individual having 10 encounters. It would be better to be cautious with this season's results. 

      We appreciate this limitation raised by the reviewer. Velu and Yo were only encountered a few times in 2011; however, both were encountered more frequently in 2016. For 2011, we did not collect oil-palm nut cracking data for either Yo or Velu. Thus, their change in efficiency was detected by models using data from all other years, regardless of the few encounters in 2011. This sparsity of data may still have influenced our metrics for the proportion of time chimpanzees spent engaging in different behaviors when present at the outdoor laboratory in 2011, particularly for Velu, who was one of the two individuals who exhibited a change in behavior in this year (along with Fana, N = 10 for 2011). We have therefore added a line in our results and discussion highlighting the sparsity of data for Velu when estimating these proportions for 2011 (see lines 255-256 & 410).

      Minor corrections 

      (1) The last paragraph of the introduction presents many results, which should be in the results section. 

      We would like to keep this section of the introduction. Our paper investigates the effect of aging on many different aspects of nut cracking, which could become confusing for readers unless laid out clearly. We believe that having a short summary early on in the paper assists readers with following the methods and arguments presented within our paper.

      (2) The first section (Sampled data) of the results contains much information that belongs in the methods section. 

      We appreciate that there is some overlap between our methods and results section. However as the results section comes before the methods in our manuscript, we wanted to ensure that there is suitable information in our results that allow our results to be interpreted clearly by readers, and that the methods used to generate these results are transparently communicated. For these reasons, we will leave this information in the results, as we believe it increases our paper’s readability. 

      Reviewer 2 (Public review):

      One of the main limitations of this study is the small sample size. There are only 5 of the old-aged individuals, which is not enough to draw any inferences about aging for chimpanzees more generally. Howard-Spink and colleagues also study data from only five of the 17 years of recorded data at Bossou. The selection of this subset of data requires clarification: why were these intervals chosen, why this number of data points, and how do we know that it provides a representative picture of the age-related changes of the full 17 years? 

      We note that our sample size is limited to 5 individuals. This is an inevitable constraint of analyzing aging longitudinally in long-lived species, as only few individuals will live to old age. We argue that 17 years is a long enough period of study, as in the initially sampled field season (1999) focal individuals are reaching a mature age of adulthood (39-44 years) and begin to age progressively up to ages that are typically considered to be on the extreme side for chimpanzees’ lifespans in the wild (56-61 years). We raise in our methods that whilst it is difficult to determine precisely when chimpanzees become ‘old aged’, previous studies use the age of around 40 years, as from this age survivorship begins to decrease more rapidly (see Wood et al., Science 2023). Indeed, one focal individual (Tua) disappeared during the period of our study (presumed dead), and one other individual died in 2017 (Velu), the year after our final sampled field season. As of 2025, two other focal females have since died, and only one focal individual was still alive at Bossou (Jire, the individual exhibiting the least evidence for senescence over our study period). These observations suggest that we successfully captured data from chimpanzees during the oldest ages of their lives for most individuals in the community. Moreover, the period of 1999-2016 contains the majority of data available within the Bossou Archive, with years before and after this window containing comparably less data. This information is included within our results and methods (see sections 2.1 and 4.1).

      For our earliest field season (1999), it is unlikely that senescence had already had an effect on stone-tool use, as we measured efficiency to be high across all efficiency metrics for all individuals. For example, in 1999, the median number of hammer strikes performed by focal chimpanzees ranged from 2-4 strikes, and this was comparable to the efficiency reported across all adults observed in previous studies at Bossou (Biro et al. 2003, Anim. Cog.). This finding suggests that senescence effects had not yet taken place, allowing us to evaluate whether aging affects efficiency over subsequent field seasons. This point is now included in the manuscript on lines 449-452. 

      We sampled at 4-to-5-year intervals to balance the time-intensive nature of fine-scale behavior coding against the need to sample data across the extended 17-year time window available in our study. We limited the final year to 2016 as, in following years, data were collected using different sampling protocols (though, see limited data from 2018 in the supplementary materials). We aimed to keep the intervals between years as consistent as possible (approx. 4 years); however, for some years data were not collected at Bossou, due to disease outbreaks in the region. In these instances, we selected the closest field season where suitable data were available for study (always +/- 1 year). We have provided further clarification surrounding our sampling regime in the methods (see amendments in section 4.1)

      With measuring and interpreting the 'efficiency' of behaviors, there are in-built assumptions about the goals of the agents and how we can define efficiency. First, it may be that efficiency is not an intentional goal for nut-cracking at all, but rather, e.g., productivity as far as the number of uncrushed kernels (cf. Putt 2015). Second, what is 'efficient' for the human observer might not be efficient for the chimpanzee who is performing the behavior. More instances of tool-switching may be considered inefficient, but it might also be a valid strategy for extracting more from the nuts, etc. Understanding the goals of chimpanzees may be a difficult proposition, but these are uncertainties that must be kept in mind when interpreting and discussing 'decline' or any change in technological behaviors over time.

      We agree that knowing precisely how chimpanzees perceive their own efficiency during tool use is unlikely to be available through observation alone. However, under optimal foraging theory, it is reasonable to assume that animals aim to economize foraging behaviors such that they maximize their rate of energy intake. Moreover, a wealth of studies demonstrate that adult chimpanzees acquire and refine tool-using skill efficiency throughout their lives. For example, during nut cracking, adults often select tools with specific properties that aid efficient nut cracking (Braun et al. 2025, J. Hum. Evol.; Carvalho et al. 2008, J. Hum. Evol.; Sirianni et al. 2015, Anim. Behav.); perform nut cracking using more streamlined combinations of actions than less experienced individuals (Howard-Spink et al. 2024, Peer J; Inoue-Nakamura & Matsuzawa 1997, J. Comp. Psychol.), and as a result end up cracking nuts using fewer hammer strikes, indicating a higher level of skill (Biro et al. 2003, Anim. Cogn.; Boesch et al. 2019, Sci. Rep.). Ultimately, these factors suggest that across adulthood, experienced chimpanzees perform nut cracking with a level of efficiency which exceeds novice individuals, including across the whole behavioral sequence for tool use, even if they are not aware or intending to do so. Previous studies at Bossou have also highlighted that there are stable inter-individual differences in efficiency of individuals over time (Berdugo et al. 2024, Nat. Hum. Behav.). This pattern of findings allows us to ask whether this acquired level of skill is stable across the oldest years of an individual’s life, or whether some individuals experience decreased efficiency with age. In addition, our selection of efficiency metrics is in keeping with a wealth of studies which examine the efficiency of stone-tool using in apes, thus, we argue that this is not problematic for our study.

      As we stated in our initial responses to reviewers, it is unlikely that tool switching is a valid strategy for tool use, as it is so rarely performed by proficient adult nut crackers (including earlier in life for our focal individuals). Nevertheless, we did not find a significant change in tool switching for oil-palm nut cracking, and this behavioral change was only observed when Yo was cracking coula nuts. As we have now moved discussion of coula nut cracking to the supplementary materials (and tempered discussion of coula nut cracking to emphasize the need for more data) this behavioral variable does not influence our reported results. 

      In our discussion, we also highlight how seemingly less efficient actions may reflect a valid strategy for nut cracking. E.g. a greater number of tool strikes may reflect a strategy of compensation for progressive tool wear. This would still reflect a reduced efficiency (e.g. in terms of the rate at which kernels can be consumed), but may perhaps borne for the necessity to accommodate for changes in an individuals’ physical affordances with aging. Thus, we do take the Reviewer’s point into account, but by using an alternative, more likely, example given the available data. We have now emphasized this point in lines 521-527.

      We have also clarified these matters by adding more information into our methods (see lines 798-802 and 828-829), highlighting that we take a perspective on efficiency that reflects the speed of nut processing and kernel consumption, and the number of different behavioral elements required to do so. Our phrasing now explicitly avoids using language that assumes that individuals’ have some perception of their own efficiency during tool use.

      For the study of the physiological impact of senescence of tool use (i.e., on strength and coordination), the study would benefit from the inclusion of variables like grip type and (approximate) stone size (Neufuss et al., 2016). The size and shape of stones for nut-cracking have been shown to influence the efficacy and 'efficiency' of tool use (i.e., the same metrics of 'efficiency' implemented by Howard-Spink et al. in the current study), meaning raw material properties are a potential confound that the authors have not evaluated. 

      We did not collect this data as part of our study. Whilst grip type could be a useful variable to measure for future studies, it is not necessary to demonstrate senescence per se. However, we agree that this could be a fruitful avenue to understand changes in behavior at greater granularity, and have added this as a recommendation for further study. We also now provide a discussion on stone dimensions and materials as part of our limitations (see lines 581-589 for both points).

      Similarly, inter- and intraspecific variation in the properties of nuts being processed is another confound (Falótico et al., 2022; Proffitt et al., 2022;). If oil palm nuts were varying year-to-year, for example, this would theoretically have an effect on the behavioral forms and strategies employed by the chimpanzees, and thus, any metric of efficiency being collected and analyzed. Further, it is perplexing that the authors analyze only one year where the coula nuts were provided at the test site, but these were provided during multiple field seasons. It would be more useful to compare data from a similar number of field seasons with both species if we are to study age-related changes in nut processing over time (one season of coula nut-cracking certainly does not achieve this). 

      We have moved all discussion of coula nuts to the supplementary materials so as to avoid any confusion with oil-palm nuts (see comments from Reviewer 2, and our response). Nut hardness may influence the difficulty with which nuts are cracked, with one of the most likely factors influencing nut hardness being its age: young nuts are relatively harder to crack, whereas older nuts, which are often worm-eaten or can be empty, crack more easily, yet are not worth cracking (Sakura & Matsuzawa, 1991; Ethology). We largely controlled for this in our study, as the nuts provided at outdoor laboratories were inspected to ensure that the majority of them were of suitable maturity for cracking, and we now clarify this control in our methods (see lines 678-680) and when discussing our study limitations (see lines 551-558). In these sections, we also highlight a previous study at Bossou that shows chimpanzees select nuts which can be readily cracked, based on their age (Sakura & Matsuzawa, 1991; Ethology).

      We acknowledge that we are limited in the extent to which we can control for interannual variation in ecology with our available data. However, we highlight why interannual variability is unlikely to fully explain our results (see lines 551-580 and response to comments from Reviewer 1). We also highlight in our limitations section that future studies should (where possible) aim to collect more ecological data to account for possible confounds more rigorously.

      Both individual personality (especially neophilia versus neophobia; e.g., Forss & Willems, 2022) and motivation factors (Tennie & Call, 2023) are further confounds that can contribute to a more valid interpretation of the patterns found. To draw any conclusions about age-related changes in diet and food preferences, we would need to have data on the overall food intake/preferences of the individuals and the food availability in the home range. The authors refer briefly to this limitation, but the implications for the interpretation of the data are not sufficiently underlined (e.g., for the relevance of age-related decline in stone tool-use ability for individual survival). 

      In our discussion, we highlight that multiple aging factors may influence apes’  dietary preferences and motivations to attend experimental (and perhaps also naturally-occurring) nut cracking sites (see lines 397-443 and 542-550). We do not believe that neophobia is a likely driver underlying our results, given that the outdoor laboratory has been used to collect data for many decades, including over a decade prior to the first field season in which data were sampled for our study (now highlighted in lines 692-694). In addition, previous studies at Bossou have determined that the outdoor laboratory is visited with comparable frequency to naturallyoccurring nut cracking sites, which makes any form of novelty bias unlikely (this information is now included in our methods, see lines 397-400, and also 687-689). 

      We agree that further information is required about foraging behaviours across the home range to understand changes in attendance at the outdoor laboratory, and have now provided more clarity on this within the limitations section of our discussion 542-550. In our discussion of individual survivability, we state clearly that we cannot make a conclusion about how changes in tool use influence survival with the available data, and assert that this would require data across the home range (see lines 627-638). We agree that future research is needed to assess whether changes in tool use would influence survivability, and also suggest that it may not be survival-relevant; instead changes in tool use with aging may simply be a litmus test for detecting more generalized senescence.

      Generally speaking, there is a lack of consideration for temporal variation in ecological factors. As a control for these, Howard-Spink and colleagues have examined behavioral data for younger individuals from Bossou in the same years, to ostensibly show that patterns in older adults are different from patterns in younger adults, which is fair given the available data. Nonetheless, they seem to focus mostly on the start and end points and not patterns that occur in between. For example, there is a curious drop in attendance rate for all individuals in the 2008 season, the implications of which are not discussed by the authors. 

      As the reviewer points out, when examining the attendance rates of older individuals over sampled field seasons, we used the attendance rates of younger individuals as a control. However, we do not run this analysis using start and end points only. Attendance rates were included in our model across the full range of sample field seasons. However, as the key result here is an interaction term between age cohort (old) and the field season (scaled about the mean), we supplement this significant statistical result with a digestible comparison of attendance rates between the first and last field season, to give a general sense of effect size. We have clarified that all data were used in our model (see line 229, and also the legend for Table 2), and in this section we also provide all key model outputs and signpost where the full model output can be found in the supplementary materials.

      As far as attendance, Howard-Spink and colleagues also discuss how this might be explained by changes in social standing in later life (i.e., chimpanzees move to the fringes of the social network and become less likely to visit gathering sites). This is not senescence in the sense of physiological and cognitive decline with older age. Instead, the reduced attendance due to changes in social standing seems rather to exacerbate signs of aging rather than be an indicator of it itself. The authors also mention a flu-like epidemic that caused the death of 5 individuals; the subsequent population decline and related changes in demography also warrant more discussion and characterization in the manuscript. 

      We have adapted this part of the discussion to make it clear that social aging is not necessarily equivalent to physiological and cognitive aging. We have also clarified in this section the changes in demography at Bossou during our study, which may have further impacted social behaviors (see lines 423-443). 

      Understandably, some of these issues cannot be evaluated or corrected with the presented dataset. Nonetheless, these undermine how certain and/or deterministic their conclusions can really be considered. Howard-Spink et al. have not strongly 'demonstrated' the validity of relationships between the variables of the study. If anything, their cursory observations provide us with methods to apply and hypotheses to test in future studies. It is likely that with higher-resolution datasets, the individual variability in age-related decline in tool-use abilities will be replicated. For now, this can be considered a starting point, which will hopefully inspire future attempts to research these questions. 

      We thank the reviewer for their comments. We have adapted our manuscript to highlight that we agree that it serves a starting point for answering these valuable questions; however, we do feel that we can contribute meaningful evidence that it is likely aging effects underlying the findings in our data (see responses above). We agree with the reviewer that further study is needed to understand these questions in more detail, and have tried to ensure that our conclusions are suitably tempered, and the recommendations for research are heavily encouraged to build on our findings.  

      Falótico, T., Valença, T., Verderane, M. & Fogaça, M. D. Stone tools differences across three capuchin monkey populations: food's physical properties, ecology, and culture. Sci. Rep. 12, 14365 (2022). 

      This has now been cited.

      Forss, S. & Willems, E. The curious case of great ape curiosity and how it is shaped by sociality. Ethology 128, 552-563 (2022). 

      We do not cite this – see above.

      Neufuss, J., Humle, T., Cremaschi, A. & Kivell, T. L. Nut-cracking behaviour in wild-born, rehabilitated bonobos (Pan paniscus): a comprehensive study of hand-preference, hand grips and efficiency. Am. J. Primatol. 79, e22589 (2016). 

      This has now been cited.

      Proffitt, T., Reeves, J. S., Pacome, S. S. & Luncz, L. V. Identifying functional and regional differences in chimpanzee stone tool technology. R. Soc. Open Sci. 9, 220826 (2022). 

      This has now been cited.

      Putt, S. S. The origins of stone tool reduction and the transition to knapping: An experimental approach. J. Archaeol. Sci.: Rep. 2, 51-60 (2015). 

      We do not cite this, as we instead cite studies which highlight chimpanzees’ ability to become more efficient in tool use with repeated practice (see above). 

      Tennie, C. & Call, J. Unmotivated subjects cannot provide interpretable data and tasks with sensitive learning periods require appropriately aged subjects: A Commentary on Koops et al. (2022) "Field experiments find no evidence that chimpanzee nut cracking can be independently innovated". ABC 10, 89-94 (2023). 

      We do not cite this – see above

      Reviewer #2 (Recommendations for the authors):

      Minor Comments: 

      (1) Line 494: Citation #53 is listed twice. 

      This has been amended.

      (2) Line 501: The term 'culturally-dependent' as used here is, at best, controversial, and at worst, misapplied. I would recommend replacing it with simply the term 'cultural'. 

      This has been changed to ‘cultural’.

      Major Comments: 

      For the Introduction, in the paragraph starting on Line 91, and the Discussion, starting on Line 369, I would recommend some simple re-structuring of the argumentation. As many in the Public Review, the changes in social standing according to age are not necessarily a case of senescence in the very sense of physiological or cognitive changes of the individual. This seems to have had an effect on attendance rates, which then could have been a driver of behavioral changes and even cognitive decline as ostensibly measured by the other variables. The social impact of aging should be mentioned in the Introduction (it is not currently) and the social and physiological/cognitive effects of aging should be separated in the Discussion. You can then discuss more clearly how the former via other behavioral changes can accelerate the latter (or not). 

      We take the point raised about social aging. Integrating information about social aging into the introduction was challenging without disrupting the flow of the paper; however, we have included these valuable points in the discussion (see lines 423-443). We now structure this section to clearly distinguish social aging, and discuss how, in tandem with changes in demography at Bossou, it may have influenced rates of attendance to the outdoor laboratory over the years. We do not go into detail about how social aging may interact with physiological or cognitive effects of aging, as we cannot support this with the available data, however we highlight at the end of this paragraph how all of these possible factors require further investigation.

      For the present study, it will either be impossible or impractical to gather data on the yearly ecological conditions, contextualized dietary preferences, individual personalities, etc., so I would not ask that you do so. It is important, however, to temper some of the claims being made in the manuscript about what you have 'determined' about the nature of senescence in chimpanzees and to be more transparent about the limitations and potential confounds when interpreting the data. To avoid repetition, the key points can be found in the Public Review under 'Weaknesses'. 

      We appreciate the reviewer’s understanding of the limitations of our study. Some of these factors – such as individual personalities and dietary preferences – are addressed somewhat by our use of long-term data at the level of the individual, particularly in the analyses of efficiency, where we model individuals’ behaviors compared to those in earlier years offers an individuallybespoke control. However, there are other ecological variables of possible importance that we cannot evaluate. We now address several of these points raised by reviewers in the discussion, to ensure transparency of reporting (see limitations section of our discussion, and results to the comments provided by Reviewer 1, and our responses to points raised in the Public Review). We have also tempered some of the phrasing surrounding our conclusions, where we say that this is the first evidence that aging can impact chimpanzee tool use, we also highlight the need for an assortment of further studies. 

      Finally, the integration of the coula nut-cracking data is not well-executed as it stands. I would recommend that they collect and analyze equivalent behavioral data from the other years where coula nuts were provided. By examining only one season of coula nut-cracking, we cannot contextualize the data to past seasons; there is no sense in comparing one season of coula nut-cracking (i.e., in a sense of efficiency) to roughly contemporary seasons of palm-nut cracking due to, as you describe, differences in physical properties of the nuts. If you are not able to collect the additional data and carry out the requisite analysis, then I would recommend that the coula nut-related sections be removed from the manuscript, so that it does not detract from the logical flow of arguments and distract from the other data, which is more logically-attuned to your research questions. 

      We have removed this from the main manuscript. We have decided to include the information surrounding coula nut cracking in the supplementary materials, as this information is still relevant to the findings of our study, and may interest some readers. However, we have phrased this information to make it clear that further data is needed to compare coula nut cracking across years.

      These criticisms do not subtract from the (potential) value or importance of the work for the field. This is, of course, an important contribution to an understudied topic. As such, I would gladly advocate for the manuscript, assuming the authors would reflect on the listed caveats and make changes in response to the 'Major Comments'. 

      We thank the reviewer for their comments.

    1. eLife Assessment

      This important study explores the mechanisms underlying the maintenance of cell surface protein levels. The authors present solid evidence to support their claims, though the addition of certain validation experiments could have further strengthened the conclusions. This work will be of particular interest to cell biologists focused on membrane trafficking.

    2. Reviewer #1 (Public review):

      G. Squiers et al. analyzed a previously reported CRISPR genetic screening dataset of engineered GLUT4 cell-surface presentation and identified the Commander complex subunit COMMD3 as being required for endosomal recycling of specific cargo protein, transferrin receptor (TfR), to the cell surface. Through comparison of COMMD3-KO and other Commander subunit-KO cells, they demonstrated that the role of COMMD3 in mediating TfR recycling is independent of the Commander complex. Structural analysis and co-immunoprecipitation followed by mass spectrometry revealed that TfR recycling by COMMD3 relies on ARF1. COMMD3 interacts with ARF1 through its N-terminal domain (NTD) to stabilize ARF1. A mutation in the NTD of COMMD3 failed to rescue cell surface TfR in COMMD3-KO cells. In conclusion, the authors assert that COMMD3 stabilizes ARF1 in a Commander complex-independent manner, which is essential for recycling specific cargo proteins from endosomes to the plasma membrane.

      The conclusions of this paper are generally supported by data, but some validation experiments should be included to strengthen the study.

      (1) Specific role of ARF1 to COMMD3:<br /> The authors don't think KO/KD of ARF1 is appropriate to address its specificity to COMMD3 cargo selection, so they focused on the COMMD3 NTD mutant. Though the mutant failed to rescue COMMD3 cargo TfR recycling, they did not examine the Commander cargo ITGA6. In addition, they cannot validate that the mutant interrupts the interaction between NTD and ARF1. These missing results and validation make their claim that ARF1 is specific to the COMMD3's Commander-independent function less convincing.

    3. Reviewer #2 (Public review):

      Summary:

      The Commander complex is a key player in endosomal recycling which recruits cargo proteins and facilitates the formation of tubulo-vesicular carriers. Squiers et al found COMMD3, a subunit of the Commander complex, could interact directly with ARF1 and regulate endosomal recycling.

      Strengths:

      Overall, this is a nice study that provides some interesting knowledge on the function of the Commander complex.

      Comments on revisions:

      The authors have addressed all my previous concerns

    4. Reviewer #3 (Public review):

      Summary:

      The study by Squiers and colleagues reveals a novel, Commander-independent role for COMMD3 in endosomal recycling. Through unbiased genetic screens, the authors identified COMMD3 as a regulator of GLUT4-SPR trafficking and validated its function using knockout experiments, which demonstrated its impact on endosomal morphology and trafficking independent of the Commander complex. Importantly, they mapped the interaction between the N-terminal domain (NTD) of COMMD3 and the GTPase Arf1, and through structure-guided mutagenesis, established that this interaction is essential for COMMD3's Commander-independent activity. The manuscript provides compelling evidence supporting this newly identified function of COMMD3, and I find the authors' interpretations well-justified. This is an excellent and intriguing study.

      Comments on revisions:

      The authors addressed all comments. Congratulations on this exciting work.

    5. Author response:

      The following is the authors’ response to the original reviews

      Reviewer 1 (Public reviews):

      (1) Commander-Independent Role of COMMD3: While the authors provided evidence to support the Commander-independent role of COMMD3-such as the absence of other Commander subunits in the CRISPR screen and not decreased COMMD3 levels in other subunit-KO cells- direct evidence is lacking. The mutation that specifically disrupts the COMMD3-ARF1 interaction could serve as a valuable tool to directly address this question.

      The Reviewer raised an excellent point. We fully agree with the Reviewer that multiple lines of evidence are needed to support the novel Commander-independent function of COMMD3.

      Comparative genetic analyses in Figures 4 and 5 indicate that COMMD3 regulates endosomal retrieval independently of the Commander complex. In Figure 8 of the revised manuscript, we show that point mutations introduced into the COMMD3:ARF1 interface impair this Commander-independent function. Moreover, Figure 6 demonstrates that ARF1 upregulation fully rescues the KO phenotype of COMMD3. In addition, Figure S2 further supports that COMMD3 levels, but not those of other Commander subunits, correspond to its Commander-independent function in endosomal trafficking. We have also revised the Discussion section to elaborate on the implications of these findings. We appreciate the Reviewer’s advice.

      (2) Role of ARF1 in Cargo Selection: The Commander-independent function of COMMD3 appears cargo-dependent and relies on ARF1's role in cargo selection. The authors should investigate whether KO/KD of ARF1 reduces cell surface levels of ITGA6 and TfR.

      The Reviewer correctly pointed out that KO/KD of ARF1 may provide further insights into the Commander-independent function of COMMD3. However, since ARF1 is involved in cargo sorting at both the endosome and the trans-Golgi network, its KO would disrupt multiple trafficking routes, making the data difficult to interpret. Instead, we focused on point mutations in the NTD that specifically disrupt ARF1 binding without affecting the function of the Commander complex (Fig. 8). As these mutations impair the Commander-independent function of COMMD3, our data strongly support a direct role for ARF1 in this recycling pathway. We note that the discovery of a novel trafficking pathway inevitably opens many research directions. One such direction is to systematically identify cargoes that rely on COMMD3 but not the Commander complex for endosomal retrieval.

      (3) Impact on TfR Stability: Figure 7D suggests that TfR protein levels are reduced in COMMD3-KO cells, potentially due to degradation caused by disrupted recycling. This raises the question of whether the observed reduction in cell surface TfR is due to impaired endosomal recycling or decreased total protein levels. The authors should quantify the ratio of cell surface protein to total protein for TfR, GLUT-SPR, and ITGA6 in COMMD3-KO cells.

      Based on the Reviewer's suggestion, we quantified both the total levels and the surface-tototal ratio of TfR, as shown in Figure S1 of the revised manuscript. These new data further support the conclusion that defects in TfR retrieval lead to its lysosomal degradation. The GLUT-SPR data presented in the main figures represent the surface-to-total ratio of the GLUT-SPR reporter. We thank the Reviewer for the important suggestion.

      Reviewer #1 (Recommendations for the authors):

      (1) Commander-Independent Role of COMMD3: The mutation that specifically disrupts the COMMD3-ARF1 interaction could serve as a valuable tool to directly address this question. The authors should evaluate whether the full-length mutant of COMMD3 can rescue decreased levels of CCDC93 and VPS35L, as well as cell surface ITGA6, TfR, and GLUT4 inCOMMD3-KO cells.

      This is an excellent point. In our mechanistic experiments, we focused on the NTD of COMMD3 because this domain mediates its Commander-independent function and is not involved in forming the Commander holo-complex. This approach allowed us to draw unambiguous conclusions. Nevertheless, we anticipate that full-length COMMD3 carrying these point mutations would also be defective in regulating Commander-independent cargo.

      (2) Role of ARF1 in Cargo Selection: The authors should investigate whether KO/KD of ARF1 reduces cell surface levels of ITGA6 and TfR. Was ARF1 identified in the initial CRISPR screen? If so, this should be explicitly noted. Alternatively, does ARF1 overexpression rescue ITGA6 levels in COMMD3-KO cells? Furthermore, does ARF1 overexpression rescue TfR levels in COMMD3 and CCDC93 double-KO cells?

      Reinto the Commander-independent function of COMMD3. However, since ARF1 is involved in cargo sorting at both the endosome and the trans-Golgi network, its KO would disrupt multiple trafficking routes, making the data difficult to interpret. Instead, we focused on point mutations that specifically disrupt ARF1 binding without affecting the function of the Commander complex (Fig. 8). Since these mutations impair the Commander-independent function of COMMD3, our data strongly support a direct role for ARF1 in this novel recycling pathway. Based on our genetic data, we anticipate that all COMMD3-dependent cargoes will be similarly rescued in ARF1-overexpressing cells. In line with the Reviewer's comment, a key research direction we are currently pursuing is systematically determining how surface protein levels are affected by COMMD3 KO and ARF1 overexpression using surface proteomics.

      (3) Inconsistency in COMMD3 Rescue Levels (Figure 5A): Figure 5A shows comparable or higher levels of COMMD3 in rescued cells than in CCDC93-KO and VPS35L-KO cells. However, COMMD3 rescue did not increase cell surface TfR as much as in CCDC93-KO and VPS35L-KO cells. This inconsistency should be discussed or validated.

      To address the Reviewer’s inquiry, we quantified COMMD3 expression levels in these cell lines using multiple independent experiments. The new data are presented in Figure S2 of the revised manuscript. These expanded datasets allowed us to more accurately determine the relationship between COMMD3 expression and our genetic data. Since the Commander complex remains intact in the COMMD3 rescue cells, a significant portion of COMMD3 proteins are expected to be incorporated into the Commander complex, which does not regulate TfR recycling. In contrast, because the Commander complex is disrupted in Ccdc93 and Vps35l KO cells, all COMMD3 proteins are available to regulate TfR recycling in a Commander-independent manner. These findings are fully consistent with the similar surface TfR levels observed in Ccdc93/Vps35l KO cells and COMMD3 overexpressing cells. We thank the Reviewer for this excellent suggestion.

      (4) Significance of NTD in COMMD3 Function: The conclusion that "the NTD of COMMD3 mediates its Commander-independent function and interacts with ARF1" (Page 12) is not fully supported without a side-by-side comparison of NTD, CTD, and FL COMMD3 in the same experiment (e.g., Figures 6B and 6G). Additional data is needed to strengthen this claim.

      We conducted the experiment suggested by the Reviewer and included the data in Figure S3. Our results indicate that the COMMD3 CTD cannot mediate the Commander-independent function of COMMD3 in endosomal retrieval. We appreciate the Reviewer’s suggestion.

      (5) ARF1 Stabilization Experiments: To substantiate the claim that COMMD3 binds and stabilizes the GTP-form of ARF1, the authors should include a comparative experiment showing GTP-form, GDPform, and wild-type ARF1 (e.g., Figures 6G and 7C).

      We fully agree with the Reviewer that it would be important to compare how the ARF1:COMMD3 interaction is influenced by the nucleotide-binding state. However, trapping ARF1 in its GDP-bound state remains unfeasible, and nucleotide-free small GTPases are inherently unstable. In addition, WT ARF1 likely exists as a mixture of GTP- and GDP-bound forms, further complicating the analysis. To address the Reviewer’s comment, we used AlphaFold3 predictions. Interestingly, we found that the ipTM score of GTP-ARF1:COMMD3 is significantly higher than that of GDP-ARF1:COMMD3 or apo-ARF1:COMMD3, supporting our conclusion that COMMD3 recognizes and stabilizes the active form of ARF1.

      (6) Validation of NTD Mutation (Figure 8): Co-immunoprecipitation or cellular co-localization experiments should be performed to confirm that the NTD mutation disrupts the interaction between COMMD3 and ARF1, as depicted in Figure 8.

      This is an important question, and the best approach to address it would be to measure the binding affinity of the WT and mutant proteins using ITC or SPR. However, this is currently unfeasible, as we have not yet obtained pure recombinant COMMD3 and GTP-ARF1 proteins. Co-IP, by nature, is a crude assay that often fails to detect changes in binding affinity. A previous study on other proteins showed that mutations in protein-binding interfaces strongly reduced binding affinity as measured by SPR, but these changes would have been missed by co-IP assays (PMID: 25500532). In agreement with this limitation, our co-IP experiments did not yield conclusive results. Instead, we focused on structure-guided genetic experiments, which unequivocally demonstrated the effects of targeted mutations on the Commander-independent function of COMMD3. 

      Reviewer #2 (Public review):

      (1) All existing data suggest that COMMD3 is a subunit of the Commander complex. Is there any evidence that COMMD3 can exist as a monomer?

      The Reviewer raised an intriguing point. Indeed, COMMD proteins, including COMMD3, can exist outside the Commander holo-complex and form homo- or hetero-oligomers, as monomeric COMMD proteins are likely unstable. These observations align well with the Commander-independent function identified in this study. We have revised the Discussion section of the manuscript to further elaborate on this point and thank the Reviewer for the suggestion.

      (2) In Figure 9, the author emphasizes COMMD3-dependent cargo and Commander-dependent cargo. Can the authors speculate what distinguishes these two types of cargo? Do they contain sequence-specific motifs?

      This is another important question. Our data clearly demonstrate that COMMD3 has a Commander-independent function in addition to its canonical role within the Commander holocomplex. Since cargo proteins typically possess multiple sorting signals that operate at different stages of the exocytic and endocytic pathways, identifying COMMD3-dependent sorting signals remains a challenge. ARF4 has been shown to specifically recognize the VXPX motif (PMID: 15728366), suggesting that ARF1 may similarly bind cytosolic sorting signals, with COMMD3 stabilizing this interaction. A key future direction is to systematically identify COMMD3-dependent cargo proteins and elucidate the mechanisms underlying their endosomal sorting. We have revised the Discussion section of the manuscript to explicitly address this point and thank the Reviewer for this important suggestion.

      (3) What could be the possible mechanism underlying the observation that the knockout of COMMD3 results in larger early endosomes? How is the disruption of cargo retrieval related to the increase in endosome size?

      The endosomal retrieval process is critical for recycling membrane proteins and lipids back to the plasma membrane or the trans-Golgi network. When this process is disrupted, cargo that should be recycled accumulates within endosomes, leading to their enlargement. For example, defects in retromer function can cause endosomal swelling due to cargo accumulation (PMID: 33380435). We added this citation to the revised manuscript and thank the Reviewer for the advice. 

      Reviewer 3 (Recommendations for the authors):

      (1) Figure 4: How do the authors define Commander-dependent vs. Commander-independent cargos?

      In Figure 4, the surface expression of ITGA6 is reduced to approximately 0.75 across all knockouts. However, there is a similar level of reduction for GLUT4-SPR in the commd5 knockout and for LAMP1 in the commd5 and commd1 knockouts. Are GLUT4-SPR and LAMP1 Commander-dependent or Commander-independent cargos? Additionally, how does COMMD3 specifically identify/distinguish these cargos?

      This is an excellent point. Our data suggest that TfR is a COMMD3-dependent but Commander-independent cargo, whereas ITGA6 is a Commander-dependent cargo that does not involve COMMD3-specific functions. The other two cargoes we examined—GLUT-SPR and LAMP1—primarily rely on COMMD3, with the Commander complex playing a minor role. Together, these observations clearly demonstrate that COMMD3 has a Commander-independent function in addition to its canonical role within the Commander holo-complex. Since cargo proteins typically possess multiple sorting signals that operate at different stages of the exocytic and endocytic pathways, identifying COMMD3-dependent sorting signals remains a challenge. ARF4 has been shown to specifically recognize the VXPX motif (PMID: 15728366), suggesting that ARF1 may similarly bind cytosolic sorting signals, with COMMD3 stabilizing this interaction. A key future direction is to systematically identify COMMD3-dependent cargo proteins and elucidate the mechanisms underlying their endosomal sorting. We have revised the Discussion section of the manuscript to explicitly address this point. We thank the Reviewer for this important suggestion.

      (2) There is an increase in the surface expression of GLUT4-SPR in the commd1 knockout. Is this increase significant? The figure suggests a significant increase, but the text states it remains unchanged. Clarification is needed.

      We found that surface levels of GLUT-SPR were slightly increased in Commd1 KO cells, in stark contrast to the strong reduction observed in Commd3 KO cells (Fig. 4B). This finding is consistent with our conclusion that COMMD3 has a distinct role from other Commander subunits. We have revised the Results section to more clearly describe these data and thank the Reviewer for the advice.

      (3) Figure 5A: To support the claim that COMMD3 is upregulated in the vps35l KO/Ccdc93 KO, the authors should quantify COMMD3 expression. Also, why is there a Vps35l band present in the Vps35l knockout cells?

      Based on the Reviewer’s suggestion, we quantified the total levels of COMMD3 and included these new data in Figure S2. In this study, gene deletion was achieved through the simultaneous introduction of two independent gRNAs. Based on our previous experience, this strategy typically results in the complete loss of gene expression. We posit that the residual band observed in Vps35l KO cells originates from background signals, such as nonspecific staining by the antibody.

      (4) Figure 7: It is intriguing that COMMD3 stabilizes Arf1-GTP and can compensate for COMMD3 in knockout cells. However, is this stabilization specific to TfR cargo only? The authors should test additional Commander-dependent and Commander-independent cargos to clarify this point.

      Based on our genetic data, we anticipate that all COMMD3-dependent cargoes will be similarly rescued in ARF1-overexpressing cells. In line with the Reviewer's comment, an important direction we are pursuing is the use of surface proteomics to systematically determine how surface protein levels are affected by COMMD3 KO and ARF1 overexpression.

      (5) Is Arf1 interaction specific to COMMD3? The authors should investigate the effects of Arf1 knockout on COMMD3 expression and test its role in regulating Commander-dependent and Commander-independent cargos.

      The Reviewer raised an excellent point. Since ARF1 is involved in cargo sorting at both the endosome and the trans-Golgi network, its KO would interfere with multiple trafficking routes and the data would be difficult to interpret. Thus, in this work, we focused on the function and mechanism of the COMMD3:ARF1 complex on the endosome. Based on the suggestion of the Reviewer, we used AlphaFold3 to predict ARF1 binding to COMMD proteins. Interestingly, the complex with the highest predicted ipTM score is COMMD3:ARF1, while other COMMD proteins have much lower predicted binding scores. These results are consistent with the results of our unbiased CRISPR screens and targeted gene KO, and further support the conclusion that the COMMD3:ARF1 binding is specific and physiologically important in endosomal trafficking.

    1. eLife Assessment

      This valuable study uses AlphaFold2 to guide the structural modelling of different states of the human voltage-gated potassium channel KV11.1, a key pharmacological drug target. Follow-up molecular dynamics and drug-docking simulations, combined with experimental characterization, offer convincing evidence supporting the models. The work shows potential for improving drug potency predictions in ion channel pharmacology.

    2. Reviewer #1 (Public review):

      Summary:

      Ngo et. al use several computational methods to determine and characterize structures defining the three major states sampled by the human voltage-gated potassium channel hERG: the open, closed and inactivated state. Specifically, they use AlphaFold and Rosetta to generate conformations that likely represent key features of the open, closed and inactivated states of this channel. Molecular dynamics simulations confirm that ion conduction for structure models of the open but not the inactivated state. Moreover, drug docking in silico experiments show differential binding of drugs to the conformation of the three states; the inactivated one being preferentially bound by many of them. Docking results are then combined with a Markov model to get state-weighted binding free energies that are compared with experimentally measured ones.

      Strengths:

      The study uses state-of-the-art modeling methods to provide detailed insights into the structure-function relationship of an important human potassium channel. AlphaFold modeling, MD simulations and Markov modeling are nicely combined to investigate the impact of structural changes in the hERG channel on potassium conduction and drug binding.

      Weaknesses:

      (1) Selection of inactivated conformations based on AlphaFold modeling seems a bit biased.<br /> The authors base their initial selection of the "most likely" inactivated conformation on the expected flipping of V625 and the constriction at G626 carbonyls. This follows a bit the "Streetlight effect". It would be better to have selection criteria that are independent of what they expect to find for the inactivated state conformations. Using cues that favour sampling/modeling of the inactivated conformation, such as the deactivated conformation of the VSD used in the modeling of the closed state, would be more convincing. There may be other conformations that are more accurately representing the inactivated state. In addition, I am not sure whether pLDDT is a good selection criterion. It reports on structural confidence, but that may not relate to functional relevance.

      (2) The comparison of predicted and experimentally measured binding affinities lacks of appropriate controls. Using binding data from open-state conformations only is not the best control. A much better control is the use of alternative structures predicted by AlphaFold for each state (e.g. from the outlier clusters or not considered clusters) in the docking and energy calculations. Importantly, labels for open, closed and inactivated state should be randomized to check robustness of the findings. Such a control would strengthen the overall findings significantly.

      (3) Figures where multiple datapoints are compared across states generally lack assessment of the statistical significance of observed trends (e,g. Figure 3d).

      The authors have successfully achieved their goal of providing new insights into the structural details of the three major conformational states sampled by the human voltage-gated potassium channel hERG, and linking these states to changes in drug-binding affinities. However, the study would benefit from more robust controls and orthogonal validation. Additionally, the generalizability of the approach remains to be demonstrated.

    3. Reviewer #2 (Public review):

      Summary:

      Ngo et al. use AlphaFold2 and Rosetta to model closed, open, and inactive states of the human ion channel hERG. Subsequent MD simulations and comparisons with experiment support the plausibility of their models.

      Strengths:

      Ngo et al. employ various computational methods to enhance AlphaFold2's prediction capabilities for the human voltage-gated potassium channel hERG. They guide AlphaFold2 to explore different protein conformations and states, including its open, closed, and inactivated forms, using targeted templates. Additionally, they applied the Rosetta FastRelax protocol with an implicit membrane to refine the conformation of each residue in the predictions and address steric clashes, along with molecular dynamics (MD) simulations to account for membrane-pore flexibility. The methodology is well-described, and the figures are clear and descriptive.

      The authors have addressed some of the concerns raised during the first round of reviews. For instance, to mitigate potential bias in selecting the inactivated conformation, they evaluated conformational variability via backbone dihedral angles at specific residues in the selectivity filter and the drug binding sites. They also evaluated the top representative model from inactivated-state-sampling Cluster 3 (termed "AF ic3"), which was initially excluded. This model is now included in the revised manuscript as Figure S9a, b. MD simulations confirmed that this state could be a potential alternative open-state conformation. The authors also acknowledged the limitation of their study by not incorporating other enhanced sampling methods and AF3.

      In the revised manuscript, the authors provided more extensive explanations of their methods. For example, they explained that their approach to template selection was guided by their experience-AlphaFold2 with larger templates often overly constraining predictions to the input structure, reducing its flexibility to explore alternative conformations. In contrast, smaller, targeted fragments increase the likelihood that AlphaFold2 will incorporate the desired structural features while predicting the rest of the protein. They also noted that pLDDT scores are not always reliable for selecting new or alternative conformations, citing proper references. They included a model from cluster 3 of the inactivated-state sampling process, which exhibited lower pLDDT scores to illustrate this further.

      Another point raised by the reviewers was the exclusion of the N-terminal PAS domain due to GPU memory limitations and its impact on the study. This omission may overlook the PAS domain's potential roles in gating kinetics and allosteric effects on drug binding. The authors acknowledged these limitations in the main text and highlighted the need for future studies to explore these regions in greater detail. They also alluded to potential future research to address these points. Additionally, they have made some of their analysis scripts and tools available on GitHub as a community resource.

      Weakness:

      The primary issue with the study is the lack of a general pipeline or strategy that can be universally applied to any system, even if limited to ion channels or membrane proteins. A related paper assessed the conformational variability in voltage-sensing domains (VSDs) by applying both the default MSA depth and a range of reduced MSA depths to enhance conformational diversity (please see https://doi.org/10.1101/2025.03.12.642934). They generated 600 models for 32 members of the voltage-gated cation channel superfamily and demonstrated that AlphaFold2 can predict a range of diverse structures of the VSDs, representing activated, deactivated, and intermediate conformations, with more diversity observed for some VSDs compared to others.

      The authors have addressed one of the reviewer's concerns about generalizability by including an example in Figure S14 of the modified text, showing how their approach can be applied to model another ion channel system. However, some outstanding questions remain: Is this method better suited for ion channels or membrane proteins with already solved structures and extensive research available? Can this pipeline be applied to other systems as well? Additionally, how does this method compare to other methods using MSA subsampling and other enhanced AF-based techniques to generate alternative conformations of proteins?

    4. Author response:

      The following is the authors’ response to the original reviews

      Reviewer #1 (Public review):

      Weaknesses:

      (1) The selection of inactivated conformations based on AlphaFold modeling seems a bit biased. The authors base their selection of the “most likely” inactivated conformation on the expected flipping of V625 and the constriction at G626 carbonyls. This follows a bit of the “Streetlight effect”. It would be better to have selection criteria that are independent of what they expect to find for the inactivated state conformations. Using cues that favour sampling/modeling of the inactivated conformation, such as the deactivated conformation of the VSD used in the modeling of the closed state, would be more convincing. There may be other conformations that are more accurately representing the inactivated state. I see no objective criteria that justify the non-consideration of conformations from cluster 3 of the inactivated state modeling. I am not sure whether pLDDT is a good selection criterion. It reports on structural confidence, but that may not relate to functional relevance.

      We sincerely thank the reviewer for their perceptive critique highlighting potential bias in selecting the inactivated conformation. We recognize that over-relying on preconceived traits could limit exploration of diverse inactivated states, and we appreciate the opportunity to address this concern.

      Although we selected the model with the flipped V625 in the selectivity filter (SF) from the first round of inactivated-state sampling as the template for the second round, the resulting models still exhibited substantial diversity in their SF conformations. This selection primarily served to steer predictions away from the open-state configuration observed in the PDB 5VA2 SF, and we have clarified this rationale in the Methodology section. To assess conformational variability, we examined backbone dihedral angles (phi φ and psi ψ) at key residues in the selectivity filter (S624 – G628) and drugbinding region on the pore-lining S6 segment (Y652, F656), of all 100 models sampled in the subsequent inactivatedstate-sampling attempt. By overlaying the φ and ψ dihedral angles from different models, including the open state (PDB 5VA2-based), the closed state, and representative models from AlphaFold inactivated-state-sampling Cluster 2 and Cluster 3, we found that these conformations consistently fall within or near high-probability regions of the dihedral angle distributions. This indicates that these structural states are well represented within the ensemble of conformations sampled by AlphaFold within the scope of this study, particularly at functionally critical positions.

      Following the analysis above and consistent with the reviewer’s suggestion, we evaluated the top representative model from inactivated-state-sampling Cluster 3 (named “AF ic3”), which we had initially excluded. This model demonstrated SF residue G626 carbonyl oxygen flipped away from the conduction pathway, hinting at potential impact on ion conduction, yet its pore region structurally resembled the open state (Figure S9a, b). To test this objectively, we ran molecular dynamics (MD) simulations (2 runs, 1 μs long each, with applied 750 mV voltage) with varied initial ion/water configurations in the SF, finding it consistently open and conducting throughout (Figure S9c, d), consistent with our previous observations in Figure S11 that ion conduction can still occur when the upper SF is dilated. Drug docking (Figure S12) further revealed that the model exhibited binding affinities similar to those for the PDB 5VA2-based openstate structure. These findings combined led us to classify it as a possible alternative open-state conformation.

      Models from Cluster 4 were not tested due to extensive steric clashes, where residues in the SF overlapped with neighboring residues from adjacent subunits. The remaining models displayed SF conformations that combined features from earlier clusters. However, due to subunit-to-subunit variability, where individual subunits adopted differing conformations, they were classified as outliers. This combination of features may be valuable to investigate further in a follow-up study.

      We acknowledge that our approach is just one of many ways to sample different states, and alternative strategies, such as generating more models, varying multiple sequence alignment (MSA) subsampling, or testing different templates, might reveal improved models. Given that hERG channel inactivation likely spans a spectrum of conformations, our resource limitations may have restricted us to exploring and validating only part of this diversity. Nevertheless, the putative inactivated (AlphaFold Cluster 2) model’s non-conductivity and improved affinity for drugs targeting the inactivated state observed in our study suggests that this approach may be capturing relevant features of the inactivated-state conformation. We look forward to investigating deeper other possibilities in a future study and are grateful for the reviewer’s feedback.

      (2) The comparison of predicted and experimentally measured binding affinities lacks an appropriate control. Using binding data from open-state conformations only is not the best control. A much better control is the use of alternative structures predicted by AlphaFold for each state (e.g. from the outlier clusters or not considered clusters) in the docking and energy calculations. Using these docking results in the calculations would reveal whether the initially selected conformations (e.g. from cluster 2 for the inactivated state) are truly doing a better job in predicting binding affinities. Such a control would strengthen the overall findings significantly.

      We appreciate the reviewer’s insightful suggestion. To address this, we extended our analysis by incorporating an alternative AlphaFold2-predicted model from inactivated-state-sampling cluster 3 as a structural control. This model was established in a previously discussed analysis to be open and conducting as a follow up to comment #1, so we will call it Open (AF ic3) to differentiate it from Open (PDB 5VA2). We evaluated this new model in single-state and multi-state contexts alongside our original open-state model based on the experimental PDB 5VA2 structure. Additionally, we expanded the drug docking procedure to explore a broader region around the putative drug binding site by increasing the sampling space, and we adopted an improved approach for selecting representative docking poses to better capture relevant binding modes.

      Shown in Figure 7 are comparisons of experimental drug potencies with the binding affinities from the molecular docking calculations under the following conditions:

      (a) Single-state docking using the experimentally derived open-state structure (PDB 5VA2)

      (b) Multi-state docking incorporating open (PDB 5VA2), inactivated, and closed-state conformations weighted by experimentally observed state distributions

      (c) Single-state docking using an alternative AlphaFold-predicted open-state (inactivated-state-sampling cluster 3, AF ic3)

      (d) Multi-state docking combining the AlphaFold-predicted open-state (inactivated-state-sampling cluster 3, AF ic3)

      Using only the open-state model (PDB 5VA2) yielded a moderate correlation with experimental data (R<sup>2</sup> = 0.43, r = 0.66, Figure 7a). Incorporating multi-state binding (weighted by their experimental distributions) improved the correlation substantially (R<sup>2</sup> = 0.63, r = 0.79, Figure 7b), boosting predictive power by 47% and underscoring the value of multi-state modeling. Importantly, this improvement was achieved without considering potential drug-induced allosteric effects on the hERG channel conformation and gating, which will be addressed in future work.

      Next, we substituted the PDB 5VA2-based open-state model with the AF ic3 open-state model. Docking to this alternative model alone produced similar performance (R<sup>2</sup> = 0.44, r = 0.66, Figure 7c), and incorporating it into the multi-state ensemble further improved the correlation with experiments (R<sup>2</sup> = 0.64, r = 0.80, Figure 7d), representing a 45% gain in R<sup>2</sup> and matching the performance of multi-state docking results based on the PDB 5VA2-derived model.

      These findings suggest that the predictive power of computational drug docking is enhanced not merely by the accuracy of individual models, but by the structural diversity and complementarity provided by an ensemble of protein conformations. Rather than relying solely on a single experimentally determined protein structure, the ensemble benefits from incorporating AlphaFold-predicted models that capture alternative conformations identified through our state-specific sampling approach. These diverse protein models reflect different structural features, which together offer a more comprehensive representation of the ion channel’s binding landscape and enhance the predictive performance of computational drug docking. Overall, these results reinforce that multi-state modeling offers a more realistic and predictive framework for understanding drug – ion channel interactions than traditional single-state approaches, emphasizing the value of both individual model evaluation and their collective integration. We are grateful for the reviewer’s suggestion.

      (3) Figures where multiple datapoints are compared across states generally lack assessment of the statistical significance of observed trends (e.g. Figure 3d).

      We appreciate the reviewer’s comment on the statistical significance assessment in Figure 3d. To clarify, the comparisons shown in the subpanels are based on three selected representative models for each state, rather than a broader population sample (similarly for Figure 3b). In the closed-state predicted models, the strong convergence of the voltagesensing domain (VSD), with an all-atom RMSD of 0.36 Å between cluster 1 and 2 closed-state sampling models and 0.95 Å to the outlier cluster, indicates minimal structural variation. Those RMSD values shown in the manuscript text demonstrates good convergence and by themselves represent statistical significance assessment of those models. This trend extends to open-state and inactivated-state AlphaFold models with similarly limited differences in the VSD regions among them. This convergence suggests that population-based statistical analysis may not reveal meaningful deviations, as the low variability among models limits the insights beyond those obtained from comparing representative structures.

      Nonetheless, we acknowledge this limitation. In future studies, we plan to explore alternative modeling approaches to introduce greater variability, enabling a more robust statistical evaluation of state-specific trends in the predictions.

      (4) Figure 3 and Figures S1-S4 compare structural differences between states. However, these differences are inferred from the initial models. The collection of conformations generated via the MD runs allow for much more robust comparisons of structural differences.

      We have explored these conformational state dynamics through MD simulations for the Open (5VA2-based), Inactivated (AlphaFold Cluster 2), and Closed-state models, as presented in Figures S7, S8, S10, S11. These figures provide detailed insights: Figure S7-S8 analyzes SF and pore conformation dynamics, including averaged pore radii with and without voltage and superimposed conformational ensembles; Figure S10 tracks cross-subunit distances between protein backbone carbonyl oxygens, revealing sequential SF dilation steps near residues F627 an G628; and Figure S11 illustrates this SF dilation process over time, highlighting residue F627 carbonyl flipping and SF expansion. We appreciate the opportunity to clarify our approach.

      Reviewer #2 (Recommendations for the authors):

      Major concerns:

      (1) Protein fragments are used to model the closed and inactivated states of hERG, but the choices of fragments are not well justified. For instance, in Figure 1a, helices from 8EP1 (deactivated voltage-sensing domain) and a helix+loop from 5VA2 (selectivity filter) are used. Why just the selectivity filter and not the cytosolic domain, for instance? Why not some parts of the helices attached to the selectivity filter, or the whole membrane inserted domain of 8EP1? Same for the inactivated conformation in Figure 1c: why the cytosolic domain only?

      We thank the reviewer for their thoughtful questions regarding our choice of protein fragments for modeling the closed and inactivated states of hERG in Figures 1a and 1c, and we appreciate the opportunity to justify these selections more clearly. Our approach to template selection was guided by our experience that providing AlphaFold2 with larger templates often leads it to overly constrain predictions to the input structure, reducing its flexibility to explore alternative conformations. In contrast, smaller, targeted fragments increase the likelihood that AlphaFold2 will incorporate the desired structural features while predicting the rest of the protein. We have provided a more detailed discussion of this in the methodology section.

      For the closed state (Figure 1a), we chose the deactivated voltage-sensing domain (VSD) from the rat EAG channel (PDB 8EP1) to inspire AlphaFold2 to predict a similarly deactivated VSD conformation characteristic of hERG channel closure, as this domain’s downward shift is a hallmark of potassium channel closure. We paired this with the selectivity filter (SF) and adjacent residues from the open-state hERG structure (PDB 5VA2) to maintain its conductive conformation, as it is generally understood that K<sup>+</sup> channel closure primarily involves the intracellular gate rather than significant SF distortion. Including additional helices (e.g., S5–S6) or the entire membrane domain from PDB 8EP1 risked biasing the model toward the EAG channel’s pore structure, which differs from hERG’s, while omitting the cytosolic domain ensured focus on the VSD-driven closure without over-constraining cytoplasmic domain interactions.

      For the inactivated state (Figure 1c), we initially used only the cytosolic domain from PDB 5VA2 to anchor the prediction while allowing AlphaFold2 to freely sample transmembrane domain conformations, particularly the SF, where the inactivation occurs via its distortion. Excluding the SF or attached helices at this stage avoided locking the model into the open-state SF, and the cytosolic domain alone provided a minimal scaffold to maintain hERG’s intracellular architecture without dictating pore dynamics. Following the initial prediction, we initiated more extensive sampling by using one of the predicted SFs that differs from the open-state SF (PDB 5VA2) as a structural seed, aiming to guide predictions away from the open-state configuration. The VSD and cytosolic domain were also included in this state to discourage pore closure during prediction. Using larger fragments, like the full membrane-spanning domains or additional cytosolic regions from the open-state structure might reduce AlphaFold2’s ability to deviate from the open-state conformation, undermining our goal of capturing more diverse, state-specific features.

      It is worth noting that multiple strategies could potentially achieve the predicted models in our study, and here we only present examples of the paths we took and validated. It is likely that many of the steps may be unnecessary and could be skipped, and future work building on our approach can further explore and streamline this process. A consistent theme underlies our choices: for the closed state, we know the VSD should adopt a deactivated (“down”) conformation, so we provide AlphaFold2 with a specific fragment to guide this outcome; for the inactivated state, we recognize that the SF must change to a non-conductive conformation, so we grant AlphaFold2 flexibility to explore diverse conformations by minimizing initial constraints on the transmembrane region.

      With greater sampling and computational resources, it is possible we could identify additional plausible, non-conductive conformations that might better represent an inactivated state, as hERG inactivation may encompass a spectrum of states. In this study, due to resource limitations, we focused on generating and validating a subset of conformations. Still, we acknowledge that broader exploration could further refine these models, which could be pursued in future studies. We updated the Methods and Discussion sections to reflect this perspective, and we are grateful for the reviewer’s input, which encourages us to clarify our rationale and highlight the adaptability of our approach.

      To demonstrate the broader feasibility of this approach, we applied it to another ion channel system, voltage-gated sodium channel Na<sub>V</sub> 1.5, as illustrated in Figure S14. In this example, a deactivated VSD II from the cryo-EM structure of a homologous ion channel Na<sub>V</sub>1.7 (PDB 6N4R) (DOI: 10.1016/j.cell.2018.12.018), which was trapped in a deactivated state by a bound toxin, was used as a structural template. This guided AlphaFold to generate a Na<sub>V</sub>1.5 model in which all four voltage sensor domains (VSD I–IV) exhibit S4 helices in varying degrees of deactivation. Compared to the cryo-EM openstate Na<sub>V</sub>1.5 structure (PDB 6LQA) (DOI: 10.1002/anie.202102196), the predicted model displays a visibly narrower pore, representing a plausible closed state. This example underscores the versatility of our strategy in modeling alternative conformational states across diverse ion channels.

      (2) While the authors rely on AF2 (ColabFold) for the closed and inactivated states, they use Rosetta to model loops of the open state. Why not just supply 5VA2 as a template to ColabFold and rebuild the loops that way? Without clear explanations, these sorts of choices give the impression that the authors were looking for specific answers that they knew from their extensive knowledge of the hERG system. While the modeling done in this paper is very nice, its generalizability is not obvious.

      We appreciate the reviewer’s question about our use of Rosetta to model loops in the open-state hERG channel (PDB

      5VA2) rather than rebuilding it entirely with ColabFold. In the study, we conducted a control experiment supplying parts of PDB 5VA2 to ColabFold to rebuild the loops, generating 100 models (Figure 2a: predicted open state). The top-ranked model (by pLDDT) differed from our Rosetta-modelled structure by only 0.5 Å RMSD, primarily due to the flexible extracellular loops as expected, with the pore and selectivity filter (our areas of focus) remaining nearly identical. We chose the Rosetta-refined cryo-EM structure as this structure and approach have been widely used as an open-state reference in our other hERG channel studies, such as by Miranda et al. (DOI: 10.1073/pnas.1909196117) and Yang et al. (DOI: 10.1161/CIRCRESAHA.119.316404), to ensure that our results are more directly comparable to prior work in the field. Nonetheless, as both models (with loops modeled by Rosetta or AlphaFold) were virtually identical, we would expect no significant differences if either were used to represent the open state in our study. We have incorporated this clarification into the main text.

      (3) pLDDT scores were used as a measure of reliable and accurate predictions, but plDDT is not always reliable for selecting new/alternative conformations (see https://doi.org/10.1038/s41467-024-515072 and https://www.nature.com/articles/s41467-024-51801-z).

      We acknowledge that while pLDDT is a valuable indicator of structural confidence in AlphaFold2 predictions, its limitations warrant consideration. In our revision, we mitigated this by not relying solely on pLDDT, but we also performed protein backbone dihedral angle analysis of the protein regions of focus in all predicted models to ensure comprehensive coverage of conformational variations. From our AlphaFold modeling results, we tested a model from cluster 3 of the inactivated-state sampling process, which exhibited lower pLDDT scores, and included these results in our revised analysis. We included a note in the revised manuscript’s Discussion section: “As noted in recent studies, pLDDT scores are not reliable indicators for selecting alternative conformations (DOI: 10.1038/s41467-024-51507-2 and DOI: 10.1038/s41467-024-51801-z). To address this, we performed a protein backbone dihedral angle analysis in the regions of interest to ensure that our evaluation captured a representative range of sampled conformations.”

      (4) Extensive work has been done using AF2 to model alternative protein conformations (https://www.biorxiv.org/content/10.1101/2024.05.28.596195v1.abstract, along with some references the authors cite, such as work by McHaourab); another group recently modeled the ion channel GLIC (https://www.biorxiv.org/content/10.1101/2024.09.05.611464v1.abstract). Therefore, this work, though generally solid and thorough, seems more like a variation on a theme than a groundbreaking new methodology, especially because of the generalizability issues mentioned above.

      We sincerely thank the reviewer for acknowledging the solidity of our study and for drawing our attention to the impressive recent efforts using AlphaFold2 to explore alternative protein conformations. These studies are valuable contributions that highlight the versatility of AlphaFold2, and we are grateful for their context in evaluating our work.

      Building on these efforts, our approach not only enhances the prediction of conformational diversity but also introduces a twist by incorporating structural templates to guide AlphaFold2 toward specific functional protein states. More significantly, our study advances beyond mere structural modeling by integrating these conformations with their rigorous validation by incorporating multiple simulation results tested against experimental data to reveal that AlphaFold-predicted conformations can align with distinct physiological ion channel states. A key finding is that drug binding predictions using AlphaFold-derived hERG channel states substantially improve correlation with experimental data, which is a longstanding challenge in computational screening of multi-state proteins like the hERG channel, for which previous structural models have been mostly limited to the open state based on the cryo-EM structures. Our approach not only captures this critical state dependence but also reveals potential molecular determinants underlying enhanced drug binding during hERG channel inactivation, a phenomenon observed experimentally but poorly understood. These insights advance drug safety assessment by improving predictive screening for hERG-related cardiotoxicity, a major cause of drug attrition and withdrawal.

      We view our methodology as a natural evolution of the advancements cited by the reviewer, offering an approach that predicts diverse hERG channel conformational states and links them to meaningful functional and pharmacological outcomes. To address the reviewer’s concern about generalizability, we have expanded the methodology section to make it easier to follow and include additional details. As an example, we show how our approach can be applied to model another ion channel system, Na<sub>V</sub>1.5, in Figure S14.

      Furthermore, to enhance the applicability of our methodology, we have uploaded the scripts for analyzing AlphaFoldpredicted models to GitHub (https://github.com/k-ngo/AlphaFold_Analysis), ensuring they are adaptable for a wide range of scenarios with extensive documentation. This enables users, even those not focused on ion channels, to effectively apply our tools to analyze AlphaFold predictions for their own projects and produce publication-ready figures.

      While it is likely that multiple modeling approaches could lead AlphaFold to model alternative protein conformations, the key challenge lies in validating the physiological relevance of those predicted states. This study is intended to support other researchers in applying our template-guided approach to different protein systems, and more importantly, in rigorously in silico testing and validation of the biological significance of the conformation-specific structural models they generate.

      Minor concerns:

      (1) The authors mention in the Introduction section that capturing conformational states, especially for membrane proteins that may be significant as drug targets, is crucial. It would be helpful to relate their work to the NMR studies domains of the hERG channel, particularly the N-terminal “eag” domain, which is crucial for channel function and can provide insights into conformational changes associated with different channel states (https://doi.org/10.1016/j.bbrc.2010.10.132 ).

      We appreciate the reviewer’s insightful comment regarding the PAS domain and the potential influence of other regions, such as the N-linker and distal C-region, on drug binding and state transitions.

      The PAS domain did appear in the starting templates used for initial structural modeling (as shown in Figure 1a, b, c), but it was not included in the final models used for subsequent analyses. The omission was primarily due to hardwareimposed constraints, as including these additional regions would exceed the memory capacity of our current graphics processing unit (GPU) card, leading to failures during the prediction step.

      The PAS domain, even if not serving as a conventional direct drug-binding site, can influence the gating kinetics of hERG channels. By altering the probability and duration with which channels occupy specific states, it can indirectly affect how well drugs bind. For example, if the presence of the PAS domain shifts hERG channel gating so that more channels enter (and remain in) the inactivated state as was shown previously (e.g., DOI: 10.1085/jgp.201210870), drugs with a higher affinity for that state would appear to bind more potently, as observed in previous electrophysiological experiments (e.g., DOI: 10.1111/j.1476-5381.2011.01378.x). It is also plausible that the PAS domain could exert allosteric effects that alter the conformational landscape of the hERG channel during gating transitions, potentially impacting drug accessibility or binding stability. This is an intriguing hypothesis and an important avenue for future research.

      With access to more powerful computational resources, it would be valuable to explore the full-length hERG channel, including the PAS domain and associated regions, to assess their potential contributions to drug binding and gating dynamics. We incorporated a discussion of these points into the main text, acknowledging the limitations of our current models and highlighting the need for future studies to explore these regions in greater detail. The addition reads: “…Our models excluded the N-terminal PAS domain due to GPU memory limitations, despite its inclusion in initial templates. This omission may overlook its potential roles in gating kinetics and allosteric effects on drug binding (e.g., PMID: 21449979, PMID: 23319729, PMID: 29706893, PMID: 30826123, DOI:10.4103/jpp.JPP_158_17). Future research will explore the full-length hERG channel with enhanced computational resources to assess these regions’ contributions to conformational state transitions and pharmacology.”

      (2) In the second-to-last paragraph of the Introduction, the authors describe how AlphaFold2 works. They write, “AlphaFold2 primarily requires the amino acid sequence of a protein as its input, but the method utilizes other key elements: in addition to the amino acid sequence, AlphaFold2 can also utilize multiple sequence alignments (MSAs) of similar sequences from different species, templates of related protein structures when available, and/or homologous proteins (Jumper et al., 2021a). Evolutionarily conserved regions over multiple isoforms and species indicated that the sequence is crucial for structural integrity”. The last sentence is confusing; if the authors mean that all information required to fold the protein into its 3D structure is present in its primary sequence, that has been the paradigm. It is unclear from this paragraph what the authors wanted to convey.

      We apologize for any confusion caused by this phrasing. Our intent was not to restate the well-established paradigm that a protein’s primary sequence contains the information needed for its 3D structure, but rather to emphasize how

      AlphaFold2 leverages evolutionary conservation, via multiple sequence alignments (MSAs), to infer structural constraints beyond what a single sequence alone might reveal. Specifically, we aimed to highlight that conserved regions across species and isoforms provide additional context that AlphaFold2 uses to enhance the accuracy of its predictions, complementing the use of templates and homologous structures as described in Jumper et al. (2021). To clarify this, we revised the sentence in the manuscript to read: “AlphaFold2 primarily requires a protein's amino acid sequence as input, but it also leverages other critical data sources. In addition to the sequence, it incorporates multiple sequence alignments (MSAs) of related proteins from different species, available structural templates, and information on homologous proteins. While the primary sequence encodes the 3D structure, AlphaFold2 harnesses evolutionary conservation from MSAs to reveal structural insights that extend beyond what a single sequence can provide.” We thank the reviewer for pointing out this ambiguity.

      (3) In the Results section, the authors state that the predictions generated by their method are evaluated by standard accuracy metrics, please elaborate - what standard metrics were used to judge the predictions and why (some references would be a nice addition). Further, on Page 6, the sentence “There are fewer differences between the open- and closed-state models (Figure S2b, d)” is confusing, fewer differences than what? or there are a few differences between the two states/models? Please clarify.

      The original sentence referring to “standard accuracy metrics” is somewhat misplaced, as our intent was not to apply any conventional “benchmarking” to judge the predictions, but rather to evaluate functional and structural relevance in a physiologically meaningful context. Specifically, we assessed drug binding affinities from molecular docking simulations (in Rosetta Energy Units, R.E.U.) against experimental drug potency data (e.g., IC<sub>50</sub> values converted to free energies in kcal/mol, Figure 7), analyzed differences in interaction networks across states in relation to known mutations affecting hERG inactivation (Figure 4, Table 2), validated ion conduction properties through MD simulations with the applied voltage against expected state-dependent hERG channel behavior (Figure 5), and compared predicted structural models to available experimental cryo-EM structures (Figure 3). We clarified in the text that our assessment emphasized the physiological plausibility of the generated conformations, drawing on evidence from existing computational and experimental studies at each step of the analysis above.

      As for the sentence on page 6, “There are fewer differences between the open- and closed-state models,” we apologize for the ambiguity; we meant that the hydrogen bond networks in the selectivity filter region exhibit fewer differences between the open and closed states compared to the more pronounced variations seen between the open and inactivated states. We revised this sentence to read: “The open- and closed-state models show fewer differences in their selectivity filter hydrogen bond networks compared to those between the open and inactivated states,” to enhance readability.

      (4) In the Discussion, the authors reiterate that this methodology can be extended to sample multiple protein conformations, and their system of choice was hERG potassium channel. I think this methodology can be applied to a system when there is enough knowledge of static structures, and some information on dynamics (through simulations) and mutagenesis analysis available. A well-studied system can benefit from such a protocol to gauge other conformational states.

      We agree that this approach is well-suited to systems with sufficient static structures, dynamic insights from simulations, and mutagenesis data, as seen with the hERG channel. We appreciate the reviewer’s implicit concern about generalizability to less-characterized systems and addressed this in the Discussion as a limitation, noting that the method’s effectiveness may depend on prior knowledge. Future studies can explore whether the advent of AlphaFold3 and other deep learning approaches can enhance its applicability to systems with more limited data. We have added this comment to the Discussion: “…A limitation of our methodology is its reliance on well-characterized systems with ample static structures, molecular dynamics simulation data, and mutagenesis insights, as demonstrated with the hERG channel, which may limit its applicability to less-studied proteins.”

      (5) The Methods section must be broken down into steps to make it easier to follow for the reader (if they want to implement these steps for themselves on their system of choice).

      a. Is possible to share example scripts and code used to piece templates together for AF2. Also, since the AF3 code is now available, the authors may comment on how their protocol can be applicable there or have plans to implement their protocol using AF3 (which is designed to work better for binding small molecules). Please see https://github.com/google-deepmind/alphafold3 for the recently released code for AF3.

      We appreciate the reviewer’s suggestion to improve the Methods section and their comments on scripts and AlphaFold3 (AF3). We revised the Methods to separate it into clear steps (e.g., template preparation, AF2 setup, clustering, and refinement) for better readability and reproducibility, and uploaded the sample scripts along with the instructions to GitHub (https://github.com/k-ngo/AlphaFold_Analysis).

      Regarding AF3’s recent code release, we plan to explore the applicability of our methodology to AF3 in a follow-up study, leveraging its advanced features to refine conformational predictions and state-specific drug docking, and added a brief comment to the Discussion to reflect this future direction: “…Following the recent release of AlphaFold3’s source code, we plan to explore the applicability of our template-guided methodology in a follow-up study, leveraging AF3’s advanced diffusion-based architecture to enhance protein conformational state predictions and state-specific drug docking, particularly given its improved capabilities for modeling small molecule – protein interactions…”

      b. The authors modified the hERG protein by removing a segment, the N-terminal PAS domain (residues M1 - R397) because of graphics card memory limitation. Would the removal of the PAS domain affect the structure and function of the channel protein? HERG and other members of the “eag K<sup>+</sup> channel” family contain a PAS domain on their cytoplasmic N terminus. Removal of this domain alters a physiologically important gating transition in HERG, and the addition of the isolated domain to the cytoplasm of cells expressing truncated HERG reconstitutes wild-type gating. (see https://doi.org/10.1371/journal.pone.0059265). Please elaborate on this.

      We thank the reviewer for raising an important point about the removal of the N-terminal PAS domain and for highlighting its physiological role in hERG channel gating transitions. In our study, unlike experimental settings where PAS removal alters gating, we believe this omission has minimal impact on our key analyses.

      The drug docking procedure focuses on optimizing drug binding poses with minor protein structural refinement around the putative drug binding site, which in our case is the hERG channel pore region, where hERG-blocking drugs predominantly bind. The cytoplasmic PAS domain, located distally from this site, remains outside the protein structure refinement zone during drug docking simulations. However, one aspect we have not yet considered is the potential effect of drug modulation of the hERG channel gating and vice versa particularly given the PAS domain’s role in gating. This interplay could be significant but requires investigation beyond our current drug docking framework. We plan to explore this in future studies using alternative simulation methodologies, such as extended MD simulations or enhanced sampling techniques, to comprehensively capture these dynamic protein - ligand interactions.

      Similarly, in our 1 μs long MD simulations assessing ion conductivity (Figure 4), the timescale is too short for PASmediated gating changes to propagate through the protein and meaningfully influence ion conduction and channel activation dynamics, which occurs on a millisecond time scale (see e.g., DOI: 10.3389/fphys.2018.00207). To fully address this limitation, we plan to explore the inclusion of the PAS domain in a follow-up study with enhanced computational resources, allowing us to investigate its structural and functional contributions more comprehensively.

      (6) The first paragraph of the Methods reads as though AF2 has layers that recycle structures. We doubt that the authors meant it that way. Please update the language to clarify that recycling is an iterative process in which the pairwise representation, MSA, and predicted structures are passed (“recycled”) through the model multiple times to improve predictions.

      We agree that the phrasing might suggest physical layers recycling structures, which was not our intent. Instead, we meant to describe AlphaFold2’s iterative refinement process, where intermediate outputs, such as the pairwise residue representations, multiple sequence alignments (MSAs), and predicted structures, are iteratively passed (or “recycled”) through the model to enhance prediction accuracy. To clarify this, we revised the relevant sentence to read: “A critical feature of AlphaFold2 is its iterative refinement, where pairwise residue representations, MSAs, and initial structural predictions are recycled through the model multiple times, improving accuracy with each iteration.”

      Reviewer #3 (Recommendations for the authors):

      The authors should integrate the very recently published CryoEM experimental data of hERG inhibition by several drugs (Miyashita et al., Structure, 2024; DOI: 10.1016/j.str.2024.08.021).

      We thank the reviewer for the suggestion. Here, we compare drug binding in our open-states (PDB 5VA2-derived and an additional AlphaFold-predicted model from Cluster 3 of inactivated-state-sampling attempt named “AF ic3”) and inactivated-state models, using the cationic forms of astemizole and E-4031, with the corresponding experimental structures (Figure S13). Drug binding in the closed state is excluded as the pore architecture deviates too much from those in the cryo-EM structures. Experimental data (DOI: 10.1124/mol.108.049056) indicate that both astemizole and E4031 bind more potently to the inactivated state of the hERG channel.

      Astemizole (Figure S13a):

      - In the PDB 5VA2-derived open-state model, astemizole binds centrally within the pore cavity, adopting a bent conformation that allows both aromatic ends of the molecule to engage in π–π stacking with the side chains of Y652 from two opposing subunits. Hydrophobic contacts are observed with S649 and F656 residues.

      - In the AF ic3 open-state model, the ligand is stabilized through multiple π–π stacking interactions with Y652 residues from three subunits, forming a tight aromatic cage around its triazine and benzimidazole rings. Hydrophobic interactions are observed with hERG residues T623, S624, Y652, F656, and S660.

      - In the inactivated-state model, astemizole adopts a compact, horizontally oriented pose deeper in the channel pore, forming the most extensive interaction network among all the states. The ligand is tightly stabilized by multiple π–π stacking interactions with Y652 residues across three subunits, and forms hydrogen bonds with residues S624 and Y652. Additional hydrophobic contacts are observed with residues F557, L622, S649, and Y652.

      - Consistent with our findings, electrophysiology study by Saxena et al. identified hERG residues F557 and Y652 as crucial for astemizole binding, as determined through mutagenesis (DOI: 10.1038/srep24182).

      - In the cryo-EM structure (PDB 8ZYO) (DOI: 10.1016/j.str.2024.08.021), astemizole is stabilized by π–π stacking with Y652 residues. However, no hydrogen bonds are detected which may reflect limitations in cryo-EM resolution rather than true absence of contacts. Additional hydrophobic interacts are observed with L622 and G648 residues.

      E-4031 (Figure S13b):

      - In the PDB 5VA2-derived open-state model, E-4031 binds within the central cavity primarily through polar interactions. It forms a π–π stacking interaction with residue Y652, anchoring one end of the molecule. Polar interactions are observed with residues A653 and S660. Additional hydrophobic contacts are observed with residues A652 and Y652.

      - In the AF ic3 open-state model, E-4031 adopts a slightly deeper pose within the central cavity stabilized by dual π–π stacking interactions between its aromatic rings and hERG residue Y652. Additional hydrogen bonds are observed with residues S624 and Y652, and hydrophobic contacts are observed with residues T623 and S624.

      - In the inactivated-state model, E-4031 adopts its deepest and most stabilized binding pose, consistent with its experimentally observed preference for this state. The ligand is stabilized by multiple π–π stacking interactions between its aromatic rings and hERG residues Y652 from opposing subunits. The sulfonamide nitrogen engages in hydrogen bonding with residue S649, while the piperidine nitrogen hydrogen bonds with residue Y652. Hydrophobic contacts with residues S624, Y652, and F656 further reinforce the binding, enclosing the ligand in a densely packed aromatic and polar environment.

      - Previous mutagenesis study showed that mutations involving hERG residues F557, T623, S624, Y652, and F656 affect E-4031 binding (DOI: 10.3390/ph16091204).

      - In the cryo-EM structure (PDB 8ZYP) (DOI: 10.1016/j.str.2024.08.021), E-4031 engages in a single π–π stacking interaction with hERG residue Y652, anchoring one end of the molecule. The remainder of the ligand is stabilized predominantly through hydrophobic contacts involving residues S621, L622, T623, S624, M645, G648, S649, and additional Y652 side chains, forming a largely nonpolar environment around the binding pocket.

      In both cryo-EM structures, astemizole and E-4031 adopt binding poses that closely resembles the inactivated-state model in our docking study, consistent with experimental evidence that these drugs preferentially bind to the inactivated state (DOI: 10.1124/mol.108.049056). This raises the possibility that the cryo-EM structures may capture an inactivatedlike channel state. However, closer examination of the SF reveals that the cryo-EM conformations more closely resemble the open-state PDB 5VA2 structure (DOI: 10.1016/j.cell.2017.03.048), which has been shown to be conductive here and in previous studies (DOI: 10.1073/pnas.1909196117, 10.1161/CIRCRESAHA.119.316404).

      The conformational differences between the cryo-EM and open-state docking results may reflect limitations of the docking protocol itself, as GALigandDock assumes a rigid protein backbone and cannot account for ligand-induced large conformational changes. In our open-state models, the hydrophobic pocket beneath the selectivity filter is too small to accommodate bulky ligands (Figure 3a, b), whereas the cryo-EM structures show a slight outward shift in the S6 helix that expands this space (Figure S13).These allosteric rearrangements, though small, falls outside the scope of the current docking protocol, which lacks flexibility to capture these local, ligand-induced adjustments (DOI: 10.3389/fphar.2024.1411428).

      In contrast, docking to the AlphaFold-predicted inactivated-state model reveals a reorganization beneath the selectivity filter that creates a larger cavity, allowing deeper ligand insertion. Notably, neither our inactivated-state docking nor the available cryo-EM structures show strong interactions with F656 residues. However, in the AlphaFold-predicted inactivated model, the more extensive protrusion of F656 into the central cavity may further occlude the drug’s egress pathway, potentially trapping the ligand more effectively. This could explain why mutation of F656 significantly reduces the binding affinity of E-4031 (DOI: 10.3390/ph16091204). These findings suggest that inactivation may trigger a series of modular structural rearrangements that influence drug access and binding affinity, with different aspects potentially captured in various computational and experimental studies, rather than resulting from a single, uniform conformational change.

      Discussion of the original Wang and Mackinnon finding, DOI: 10.1016/j.cell.2017.03.048 regarding C-inactivation, pore mutation S631A and F627 rearrangement is likely warranted. Since hERG inactivation is present at 0 mV in WT channels (the likely voltage for the CryoEM study) please discuss how this might affect interpretations of starting with this structure as a template for models presented here, perhaps as part of Figure S1.

      We sincerely thank the reviewer for bringing up the insightful findings from Wang and MacKinnon regarding hERG C-type inactivation as well as the voltage context of their cryo-EM structure (PDB 5VA2). We recognize that WT hERG exhibits inactivation at 0 mV, likely the condition of the cryo-EM study, raising the possibility that PDB 5VA2, while classified as an open state, might subtly reflect features of inactivation. Notably, PDB 5VA2 has been widely adopted in numerous studies and consistently found to represent a conducting state, such as in Yang et al. (DOI: 10.1161/CIRCRESAHA.119.316404) and Miranda et al. (DOI: 10.1073/pnas.1909196117). Our MD simulations further support this, showing K<sup>+</sup> conduction in the 5VA2-based open-state model (Figure 4a, c), consistent with its selectivity filter conformation (Figure S1a). Although we used PDB 5VA2 as a starting template for predicting inactivated and closed states, our AlphaFold2 predictions did not rigidly adhere to this structure, as evidenced by distinct differences in hydrogen bond networks, drug binding affinities, pore radii, and ion conductivity between our state-specific hERG channel models (Figures S2, 5, 3b, 4). Nevertheless, this does not preclude the possibility that PDB 5VA2’s certain potential inactivated-like traits at 0 mV could subtly influence our predictions elsewhere in the model, which warrants further exploration in future studies. In our revised analysis, we also tested an alternative AlphaFold-predicted conformation, referred to as Open (AlphaFold cluster 3), which, while sharing some similarities with PDB 5VA2, exhibits subtle differences in the selectivity filter and pore conformations. This structure was also found to be conducting ions and showed a drug binding profile similar to that of the PDB 5VA2-based open-state model. We greatly appreciate this feedback which helped us refine and strengthen our analysis.

      Page 8, the significance of 750 and 500 mV in terms of physiological role?

      We appreciate this opportunity to clarify the methodological rationale. Although these voltages significantly exceed typical physiological membrane potentials, their use in MD simulations is a well-established practice to accelerate ion conduction events. This approach helps overcome the inherent timescale limitations of conventional MD simulations, as demonstrated in previous studies of hERG and other ion channels. For instance, Miranda et al. (DOI: 10.1073/pnas.1909196117), Lau et al. (DOI: 10.1038/s41467-024-51208-w), Yang et al. (DOI: 10.1161/CIRCRESAHA.119.316404) applied similarly high voltages (500~750 mV) to study hERG K<sup>+</sup> conduction, which is notably small under physiological conditions at ~2 pS (DOI: 10.1161/01.CIR.94.10.2572), necessitating amplification to observe meaningful permeation within nanosecond-to-microsecond timescales. Likewise, studies of other K<sup>+</sup> ion channels, such as Woltz et al. (DOI: 10.1073/pnas.2318900121) on small-conductance calcium-activated K<sup>+</sup> channel SK2 and Wood et al. (DOI: 10.1021/acs.jpcb.6b12639) on Shaker K<sup>+</sup> channel, have used elevated voltages (250~750 mV) to probe ion conduction mechanisms via MD simulations. In addition, the typical timescale of these simulations (1 μs) is too short to capture major structural effects such as those leading to inactivation or deactivation which occur over milliseconds in physiological conditions.

      The abstract could be edited a bit to more clearly state the novel findings in this study.

      We thank the reviewer for their suggestion. We have revised the abstract to read: “To design safe, selective, and effective new therapies, there must be a deep understanding of the structure and function of the drug target. One of the most difficult problems to solve has been resolution of discrete conformational states of transmembrane ion channel proteins. An example is K<sub>V</sub>11.1 (hERG), comprising the primary cardiac repolarizing current, I<sub>kr</sub>. hERG is a notorious drug antitarget against which all promising drugs are screened to determine potential for arrhythmia. Drug interactions with the hERG inactivated state are linked to elevated arrhythmia risk, and drugs may become trapped during channel closure. While prior studies have applied AlphaFold to predict alternative protein conformations, we show that the inclusion of carefully chosen structural templates can guide these predictions toward distinct functional states. This targeted modeling approach is validated through comparisons with experimental data, including proposed state-dependent structural features, drug interactions from molecular docking, and ion conduction properties from molecular dynamics simulations. Remarkably, AlphaFold not only predicts inactivation mechanisms of the hERG channel that prevent ion conduction but also uncovers novel molecular features explaining enhanced drug binding observed during inactivation, offering a deeper understanding of hERG channel function and pharmacology. Furthermore, leveraging AlphaFold-derived states enhances computational screening by significantly improving agreement with experimental drug affinities, an important advance for hERG as a key drug safety target where traditional single-state models miss critical state-dependent effects. By mapping protein residue interaction networks across closed, open, and inactivated states, we identified critical residues driving state transitions validated by prior mutagenesis studies. This innovative methodology sets a new benchmark for integrating deep learning-based protein structure prediction with experimental validation. It also offers a broadly applicable approach using AlphaFold to predict discrete protein conformations, reconcile disparate data, and uncover novel structure-function relationships, ultimately advancing drug safety screening and enabling the design of safer therapeutics.”

      Many of the Supplemental figures would fit in better in the main text, if possible, in my opinion. For instance, the network analysis (Fig. S2) appears to be novel and is mentioned in the abstract so may fit better in the main text. The discussion section could be focused a bit more, perhaps with headers to highlight the key points.

      Yes, we agree with the reviewer and made the suggested changes. We moved Figure S2 as a new main-text figure.

      Additionally, we revised the Discussion section to improve focus and clarity.

    1. eLife Assessment

      In this important manuscript, the authors reveal novel findings on the role of exosomes in regulating filopodia formation. Filopodia are crucial for various cellular processes, including migration, polarization, directional sensing, and the formation of neuronal synapses. The authors convincingly demonstrate that exosomes, particularly those enriched with the protein THSD7A, play a significant role in promoting filopodia formation in both cancer cells and neurons.

    2. Joint Public Review:

      Summary:

      The authors identify a novel relationship between exosome secretion and filopodia formation in cancer cells and neurons. They observe that multivesicular endosomes (MVE)-plasma membrane (PM) fusion is associated with filopodia formation in HT1080 cells and that MVEs are present on filopodia in primary neurons. Using overexpression and knockdown (KD) of Rab27/HRS in HT1080 cells, melanoma cells and/or primary rat neurons, they find that decreasing exosome secretion reduces filopodia formation, while Rab27 overexpression leads to the opposite result. Furthermore, the decreased filopodia formation is rescued in the Rab27a/HRS KD melanoma cells by the addition of small extracellular vesicles (EVs) but not large EVs purified from control cells. The authors identify endoglin as a protein unique to small EVs secreted by cancer cells when compared to large EVs. KD of endoglin reduces filopodia formation and this is rescued by the addition of small EVs from control cells and not by small EVs from endoglin KD cells. Based on the role of filopodia in cancer metastasis, the authors then investigate the role of endoglin in cancer cell metastasis using a chick embryo model. They find that injection of endoglin KD HT1080 cells into chick embryos gives rise to less metastasis compared to control cells - a phenotype that is rescued by the co-injection of small EVs from control cells. Using quantitative mass spectrometry analysis, they find that thrombospondin type 1 domain containing 7a protein (THSD7A) is down regulated in small EVs from endoglin KD melanoma cells compared to those from control cells. They also report that THSD7A is more abundant in endoglin KD cell lysate compared to control HT1080 cells and less abundant in small EVs from endoglin KD cells compared to control cells, indicating a trafficking defect. Indeed, using immunofluorescence microscopy, the authors observe THSD7A-mScarlet accumulation in CD63-positive structures in endoglin KD HT1080 cells, compared to control cells. Finally, the authors determine that exosome-secreted THSD7A induces filopodia formation in a Cdc42-dependent mechanism.

      Strengths:

      Through proteomic analysis, the authors revealed that endoglin is an important player in the effective trafficking of THSD7A within exosomes. This study offers interesting insights into the dynamic interplay between exosome-mediated protein trafficking and essential cellular processes, emphasizing its significant relevance in both cancer progression and neural function. The authors communicated their findings clearly and effectively.

      (1) While exosomes are known to play a role in cell migration and autocrine signaling, the relationship between exosome secretion and the formation of filopodia is novel.

      (2) The authors identify an exosomal cargo protein, THSD7A, which is essential for regulating this function.

      (3) The data presented provide strong evidence of a role for endoglin in the trafficking of THSD7A in exosomes.

      (4) The authors associate this process with functional significance in cancer cell metastasis and neurological synapse formation, both of which involve the formation of filopodia.

      (5) The data are presented clearly, and their interpretation appropriately explains the context and significance of the findings.

      Weaknesses:

      While the authors showed the important role of exosomal cargo protein THSD7A in neurons, it will be interesting to conduct any in vivo studies to determine whether THSD7A plays a similar role in promoting filopodia and synapse formation in vivo. Some of the comments of the reviewers were not fully addressed, such as rigorous analysis and quantification through Live-cell imaging through TIRF microscopy tracking labeled THSD7A and filopodia formation, which would provide more clarity in timing and strengthen causality of this relationship. The authors need to consider fully characterizing the role of Cdc42. If the authors would like to fully elaborate on the role of Cdc42 in another manuscript, it is better not to mention at all the role of Cdc42 in filopodia formation in this paper.

    3. Author response:

      The following is the authors’ response to the original reviews

      Public Reviews:

      Reviewer #1 (Public review):

      Summary:

      The study significantly advances our understanding of how exosomes regulate filopodia formation. Filopodia play crucial roles in cell movement, polarization, directional sensing, and neuronal synapse formation. McAtee et al. demonstrated that exosomes, particularly those enriched with the protein THSD7A, play a pivotal role in promoting filopodia formation through Cdc42 in cancer cells and neurons. This discovery unveils a new extracellular mechanism through which cells can control their cytoskeletal dynamics and interaction with their surroundings. The study employs a combination of rescue experiments, live-cell imaging, cell culture, and proteomic analyses to thoroughly investigate the role of exosomes and THSD7A in filopodia formation in cancer cells and neurons. These findings offer valuable insights into fundamental biological processes of cell movement and communication and have potential implications for understanding cancer metastasis and neuronal development.

      Weaknesses:

      The conclusions of this study are in most cases supported by data, but some aspects of data analysis need to be better clarified and elaborated. Some conclusions need to be better stated and according to the data observed.

      We appreciate the reviewer's recognition of the impact of our study. We will address the concerns about data analysis and the statement of our conclusions in our full response to reviewers.

      Reviewer #2 (Public review):

      Summary:

      The authors show that small EVs trigger the formation of filopodia in both cancer cells and neurons. They go on to show that two cargo proteins, endoglin, and THSD7A, are important for this process. This possibly occurs by activating the Rho-family GTPase CDC42.

      Strengths:

      The EV work is quite strong and convincing. The proteomics work is well executed and carefully analyzed. I was particularly impressed with the chick metastasis assay that added strong evidence of in vivo relevance.

      Weaknesses:

      The weakest part of the paper is the Cdc42 work at the end of the paper. It is incomplete and not terribly convincing. This part of the paper needs to be improved significantly

      We appreciate the reviewer's recognition of the impact of our study. Indeed, more work needs to be done to clarify the role of Cdc42 in the induction of filopodia by exosome-associated THSD7A. We anticipate that this will be a separate manuscript, delving in-depth into how exosome-associated THSD7A interacts with recipient cells to activate Cdc42 and carrying out a variety of assays for Cdc42 activation.

      Reviewer #3 (Public review):

      Summary:

      The authors identify a novel relationship between exosome secretion and filopodia formation in cancer cells and neurons. They observe that multivesicular endosomes (MVE)-plasma membrane (PM) fusion is associated with filopodia formation in HT1080 cells and that MVEs are present in filopodia in primary neurons. Using overexpression and knockdown (KD) of Rab27/HRS in HT1080 cells, melanoma cells, and/or primary rat neurons, they found that decreasing exosome secretion reduces filopodia formation, while Rab27 overexpression leads to the opposite result. Furthermore, the decreased filopodia formation is rescued in the Rab27a/HRS KD melanoma cells by the addition of small extracellular vesicles (EVs) but not large EVs purified from control cells. The authors identify endoglin as a protein unique to small EVs secreted by cancer cells when compared to large EVs. KD of endoglin reduces filopodia formation and this is rescued by the addition of small EVs from control cells and not by small EVs from endoglin KD cells. Based on the role of filopodia in cancer metastasis, the authors then investigate the role of endoglin in cancer cell metastasis using a chick embryo model. They find that injection of endoglin KD HT1080 cells into chick embryos gives rise to less metastasis compared to control cells - a phenotype that is rescued by the co-injection of small EVs from control cells. Using quantitative mass spectrometry analysis, they find that thrombospondin type 1 domain containing 7a protein (THSD7A) is downregulated in small EVs from endoglin KD melanoma cells compared to those from control cells. They also report that THSD7A is more abundant in endoglin KD cell lysate compared to control HT1080 cells and less abundant in small EVs from endoglin KD cells compared to control cells, indicating a trafficking defect. Indeed, using immunofluorescence microscopy, the authors observe THSD7A-mScarlet accumulation in CD63-positive structures in endoglin KD HT1080 cells, compared to control cells. Finally, the authors determine that exosome-secreted THSD7A induces filopodia formation in a Cdc42-dependent mechanism.

      Strengths:

      (1) While exosomes are known to play a role in cell migration and autocrine signaling, the relationship between exosome secretion and the formation of filopodia is novel.

      (2) The authors identify an exosomal cargo protein, THSD7A, which is essential for regulating this function.

      (3) The data presented provide strong evidence of a role for endoglin in the trafficking of THSD7A in exosomes.

      (4) The authors associate this process with functional significance in cancer cell metastasis and neurological synapse formation, both of which involve the formation of filopodia.

      (5) The data are presented clearly, and their interpretation appropriately explains the context and significance of the findings.

      Weaknesses:

      (1) A better characterization of the nature of the small EV population is missing:

      It is unclear why the authors chose to proceed to quantitative mass spectrometry with the bands in the Coomassie from size-separated EV samples, as there are other bands present in the small EV lane but not the large EV lane. This is important to clarify because it underlies how they were able to identify THSD7A as a unique regulator of exosome-mediated filopodia formation. Is there a reason why the total sample fractions were not compared? This would provide valuable information on the nature of the small and large EV populations.

      We would like to clarify that there are two sets of proteomics data in the manuscript. The first was comparing bands from a colloidal Coomassie-stained gel from two samples: small EVs and large EVs from B16F1 cells. In this proteomics experiment, we identified endoglin as present in small EVs, but not large EVs. For this experiment, we only sent four bands from the small EV lane, chosen based on their obvious banding pattern difference on the Coomassie gel.

      In the second proteomics experiment, we used quantitative iTRAQ proteomics to compare small EVs purified from B16F1 control (shScr) and endoglin KD (shEng1 and shEng2) cell lines. In this experiment, we sent total protein extracted from small EV samples for analysis. So, these samples included the entire EV content, not just selected bands from a gel. In this experiment, we identified THSD7A as reduced in the shEng small EVs.

      (2) Data analysis and quantification should be performed with increased rigor:

      a) Figure 1C - The optical and temporal resolution are insufficient to conclusively characterize the association between exosome secretion and filopodia. Specifically, the 10-second interval used in the image acquisitions is too close to the reported 20-second median time between exosome secretion and filopodia formation. Two-5 sec intervals should be used to validate this. It would also be important to correlate the percentage of filopodia events that co-occur with exosome secretion. Is this a phenomenon that occurs with most or only a small number of filopodia? Additionally, resolution with typical confocal microscopy is subpar for these analyses. TIRF microscopy would offer increased resolution to parse out secretion events. As the TIRF objective is listed in the Methods section, figure legends should mention which images were acquired using TIRF microscopy.

      We acknowledge that the frame rate naturally limits our estimates of the timing of filopodia formation after exosome secretion. We set out to show a relationship between exosome secretion and filopodia formation, based on their proximity in timing. While our data set shows a median time interval of 20 seconds, the true median could be between 10-30 seconds, based on our frame rate. Regardless of the exact timing, our data show that exosome secretion is rapidly followed by filopodia formation events.

      To address the question of the percentage of filopodia events that are preceded by exosome secretion, the reviewer is correct in stating that we might need TIRF microscopy and a faster frame rate to observe all the MVB fusion events and get an accurate calculation of this number. The timing of the acquisition was based on the typical timing of filopodia formation, which is slow relative to MVB fusion. Thus, with the current dataset, we could miss secretion events taking place between the 10 second time intervals. Therefore, to address this question, we would need to acquire a new dataset with a much more rapid frame acquisition (multiple frames per second rather than one frame every ten seconds). Regardless, for the secretion events that we visualized with the current dataset, we always observed subsequent filopodia formation.

      No TIRF imaging was used in this manuscript. A TIRF objective was used for selected neuron imaging (see methods); however, it was used for spinning disk confocal microscopy, not for TIRF imaging. This is stated in the methods.

      b) Figure 2 - It would be important to perform further analysis to concretely determine the relationship between exosome secretion and filopodia stability. Are secretion events correlated with the stability of filopodia? Is there a positive feedback loop that causes further filopodia stability and length with increased secretion? Furthermore, is there an association between the proximity of secretion with stability? Quantification of filopodia more objectively (# of filopodia/cell) would be helpful.

      Our data show that manipulation of general exosome secretion, via Hrs knockdown, affects both de novo filopodia formation and filopodia stability (Fig 2g,h). Interestingly, knockdown of endoglin only affects de novo filopodia formation, while filopodia stability is unaffected (Fig 4g,h). These results suggest that filopodia stability is dependent upon exosome cargoes besides endoglin/THSD7A. Such cargoes might include other extracellular matrix molecules, such as fibronectin. We previously showed that exosomes promote nascent cell adhesion and rapid cell migration, through exosome-bound fibronectin (Sung et al., Nature Communications, 6:7164, 2015). We also previously found that inhibition of exosome secretion affects the persistence of invadopodia, which are filopodia-dependent structures (Hoshino et al., Cell Reports, 5:1159-1168, 2013). We agree that this is an interesting research direction, and perhaps future work could focus on exosomal factors that are responsible for filopodia persistence. This would possibly involve more proteomics analysis to identify candidate exosomal cargoes involved in this process.

      With regard to the way we plotted the filopodia data, we plotted the cancer cell data as filopodia per cell area so that it matched the neuron data, which was plotted as filopodia per 100 µm of dendrite distance. Since the neurons cannot be imaged as a whole cell, the quantification is based on the length of the dendrite in the image. We found that graphing the cancer cell data as filopodia per cell gave similar results as filopodia per cell area. To demonstrate that this quantification gives similar results, we have now plotted the filopodia per cell area data from Fig 2 as filopodia per cell and placed these new plots in Supp Fig 2.

      c) Figure 6 - Why use different gel conditions to detect THSD7A in small EVs from B16F1 cells vs HT1080 and neurons? Why are there two bands for THSD7A in panels C and E? It is difficult to appreciate the KD efficiency in E. The absence of a signal for THSD7A in the HT1080 shEng small EVs that show a signal for endoglin is surprising. The authors should provide rigorous quantification of the westerns from several independent experimental repeats.

      Detection of THSD7A via Western blot was, unfortunately, not straightforward and simple. Due to the large size (~260 kDa) of THSD7A, its low level of expression in cancer cells, as well as the inconsistency of commercially available THSD7A antibodies, we had to troubleshoot multiple conditions. We found that it was much easier to detect THSD7A in the human fibrosarcoma cell line HT1080 than in the mouse B16F1 cells, both in the cell lysates and in the small EVs. We were unable to detect THSD7A using the same (reducing) conditions for the mouse melanoma B16F1 samples but were successful using native gel conditions. We also detected THSD7A in rat primary neuron samples. All these samples were from different source organisms (human, mouse, rat) and from either cell lysates or extracellular vesicles, further complicating the analyses. Expression and maturation of THSD7A in these different cell types and compartments could involve different post-translational modifications, such as glycosylation, thus requiring different methods needed to detect THSD7A on Western blots and leading to different banding patterns.

      With regard to the level of knockdown of THSD7A in the Western blot shown in Figure 6E, the normalized level is quantitated below the bands. If you compare that quantitation to the filopodia phenotypes in the same panel, they are quite concordant. Figures 7B and 7C show quantification of triplicate Western blots, highlighting the significant accumulation of THSD7A in shEng cell lysates, as well as significant small EV secretion of THSD7A in control and WT rescued conditions.

      (3) The study lacks data on the cellular distribution of endoglin and THSD7A:

      a) Figure 6 - Is THSD7A expected to be present in the nucleus as shown in panel D (label D is missing in the Figure). It is not clear if this is observed in neurons. a Western of endogenous THSD7A on cell fractions would clarify this. The authors should further characterize the cellular distribution of THSD7A in both cell types. Similarly, the cellular distribution of endoglin in the cancer cells should be provided. This would help validate the proposed model in Figure 8.

      The image in figure 6D shows an HT1080 cell stained with phalloidin-Alexa Fluor 488 to visualize F-actin with or without expression of THSD7A-mScarlet. In order to fully visualize the thin filopodia protrusions, the cellular plane of focus of the images for this panel was purposely taken at the bottom of the cell, where the cell is attached to the coverslip glass. Thus, we interpret the red signal across the cell body as THSD7A-mScarlet expression on the plasma membrane underneath the cell, not in the nucleus. The neuron images only include the dendrite portion of the neurons; therefore, there is no nucleus present in the neuronal images. For the cellular distribution of endoglin, we agree that this is an important future direction to understand how endoglin regulates THSD7A trafficking. We have added the lack of these data to the “Limitations” section at the end of the manuscript.

      b) Figure 7 - Although the western blot provides convincing evidence for the role of endoglin in THSD7A trafficking, the microscopy data lack resolution as well as key analyses. While differences between shSCR and shEng cells are clear visually, the insets appear to be zoomed digitally which decreases resolution and interferes with interpretation. It would be crucial to show the colocalization of endoglin and THSD7A within CD63-postive MVE structures. What are the structures in Figure 7E shSCR zoom1? It would be important to rule out that these are migrasomes using TSPAN4 staining. More information on how the analysis was conducted is needed (i.e. how extracellular areas were chosen and whether the images are representative of the larger population). A widefield image of shSCR and shEng cells and DAPI or HOECHST staining in the higher magnification images should be provided. Additionally, the authors should quantify the colocalization of external CD63 and mScarlet signals from many independently acquired images (as they did for the internal signals in panel F). Is there no external THSD7A signal in the shEng cells?

      The images for Figure 7E were taken with high resolution on a confocal microscope. Insets for Figure 7E were digitally zoomed so that readers could see the tiny structures. Zoom 1 in Figure 7E shows areas of extracellular deposition, whereas Zoom 2 shows THSD7A colocalization with CD63 in MVE. In the extracellular areas (Zoom 1), we observe small punctate depositions that are positive for CD63 and/or THSD7A-mScarlet. Our interpretation of this staining is that the cells are secreting heterogeneous small EVs that are then attached to the glass coverslip. The images and zooms in Fig 7E were chosen to be representative and indeed reveal that there is more extracellular deposition of THSD7A-mScarlet outside the control shScr cells compared to the shEng cells, consistent with more secretion of THSD7A in small EVs from shScr cells when compared to those of shEng cells (Fig 7A,B). However, we did not quantify this difference, as these experiments were conducted with transient transfection of THSD7A-mScarlet, and it is challenging to determine which cell the extracellular THSD7A-mScarlet came from, complicating any quantitative analysis on a per-cell basis.

      Quantification of internal THSD7A localization is much more straightforward in this experimental regime. Indeed, in Figure 7F, we quantitated internal colocalization of THSD7A-mScarlet and CD63, which we obtained by choosing only cells that were visually positive for THSD7A-mScarlet in each transient transfection and omitting all extracellular signals. Quantifying the extracellular colocalization of THSD7A and CD63 could certainly be a future direction for this project and would require establishing cells that stably express THSD7A-mScarlet.

      With regard to whether the extracellular deposits are migrasomes, we have no reason to believe that they would be migrasomes. The preponderance of our evidence points to exosomes as carrying THSD7A and inducing filopodia. Furthermore, CD63 is an exosome marker (Sung et al., Nat Comm, 2020) and does not induce migrasomes, unlike many other tetraspanins (Huang et al., Nat Cell Bio, 2019).

      Recommendations for the authors:

      Reviewer #1 (Recommendations for the authors):

      The authors need to clarify the figure labeling and description and conclusions would be better to be drawn based on the findings. Some figures need to more clear e.g. Figure 1E needs to have information on what are green and red fluorescent proteins. Do all figures in 1A have the same scale bar or different? Figure 3A lacks a scale bar. In Figure 3, the GFP signal is in yellow, does it represent a merge or is it just the GFP alone? Figure 6D is missing a D. Figure 4D needs to be better explained. Additionally, both figures 8B and 8C since represent a model based on all the findings of the study would be better to stand alone as a separate figure from figure 8A.

      The figure legend for figure 1E notes that green corresponds to GFP-Rab27b and the red corresponds to mCherry filler. In addition, the labels are marked to the right of the figure. For Figure 1A, we have now indicated in the legend that all scale bars = 10 µm. In figure 3, neurons were co-transfected with GFP or GFP-Rab27b. Thus, the yellow signal in these images is the merge of the mCherry filler with either GFP (expression throughout the neuron body and dendrites) or GFP-Rab27b (punctate colocalization). We have added a scale bar to Fig 3A. Figure 6D has been corrected, with a “D” label added. Figure 4D shows representative images of cells with filopodia under the various conditions, including add-back of control or endoglin-KD EVs. We have clarified the conditions in the figure legend for 4D. For Figure 8, we have now split it into 2 figures: one with data (Fig 8) and one with the model (Fig 9).

      Reviewer #2 (Recommendations for the authors):

      For the most part, this story is strong and well-presented. The findings are interesting and will significantly advance our understanding of how EVs affect various processes such as cancer metastasis. However, the Cdc42 work is not great. They only indirectly implicate Cdc42 with a somewhat iffy inhibitor (ML141) and a constitutively active form transfected into cells. Both approaches have drawbacks such as off-target effects in the case of the inhibitor and possible cross-talk to other GTPases in the case of the active mutant. The activation of Cdc42 should be demonstrated by an activity assay. Several commercial kits are available. Inhibition of Cdc42 should be tested by knockdown in addition to the inhibitor.

      We appreciate the reviewer’s recognition of our work. To address the limitations of our study, particularly the Cdc42 mechanistic work, we have now added a “Limitations of the study” section at the end of the text. Here, we address our experimental limitations and future directions.

      Reviewer #3 (Recommendations for the authors):

      (1) Since the purified small EVs contain canonical exosomal markers and originate from MVEs, the authors should consider a more consistent use of the term "exosome" to avoid confusion.

      We acknowledge that the usage of both “exosomes” and “small extracellular vesicles” can seem confusing to many readers. Typically in the EV field, we use the term “exosome” when we can reliably determine that the EVs originate from the endocytic pathway. Thus, we use this term when we have specifically perturbed this pathway by targeting Hrs or Rab27. We use the term “small extracellular vesicles” or SEVs when referring to a purified heterogeneous population of SEVs from unknown or a variety of origins. Thus, when referring to vesicles isolated from the conditioned media, we call them SEVs because we cannot determine their origin. Clarification of this terminology has been added to the introduction of the paper.

      (2) 1st results section - expressing mCherry as a "filler" is confusing, clarify that this is meant to identify cellular background.

      This has now been clarified in the paper.

      (3) Figure 3 - Although Rab27a and Rab27b play a role in exosome secretion, Rab27b does not have redundant functions with Rab27a in every cellular context. The authors should mention the specific roles of Rab27a and Rab27b in promoting MVE fusion with the PM and in regulating the anterograde movement of MVEs to the PM, respectively (Ostrowski et al. 2010, Citation 52 in the ms). Although Rab27a is not highly expressed in neurons, it is not currently clear whether Rab27b has a redundant function with Rab27a or whether there is another unknown factor that plays this role. As neurons also do not express endoglin, the mechanisms that mediate how EVs regulate filopodia formation in these cells are most probably different than in cancer cells. This should be highlighted in the discussion.

      We have now added a couple of clarifying sentences about the roles of Rab27a and Rab27b to the results section, including the Ostrowski reference and another reference suggesting possible redundancy of Rab27a and Rab27b. With regard to endoglin not being expressed by neurons, that is one reason why we carried out the proteomics with control and endoglin-KD EVs to find a universal cargo that would directly induce filopodia formation. Indeed, THSD7A seems to be such a universal cargo, expressed in both cancer cell and neuron EVs and inducing filopodia in both cell types. This point, along with the requirement for regulation of THSD7A by other molecules in neurons, is discussed in the results and discussion sections.

      (4) As the authors note, the mechanistic link between endoglin-sorted, exosomal THSD7A and Cdc42-mediated filopodia formation remains unclear. While the findings on Cdc-42 are clear, they are not surprising. What is the role of mDia/ENA/VASP or BAR proteins in this? The authors should also consider an assay to determine whether exosomal THSD7A binds to the PM to cause the signaling or if the cargo is first internalized before performing its function. Since this process is both autocrine and paracrine, the authors could co-culture THSD7A-mScarlet cells with vector control cells and observe how THSD7A-mScarlet is localized in the non-expressing cells.

      As other reviewers also noted, the Cdc42 mechanistic data at the end of the paper has clear limitations that are now addressed within the manuscript in a “Limitations of the Study” section. Here we discuss our experimental troubleshooting and approach to assaying Cdc42 involvement in this process. We acknowledge there are many rigorous experiments that could be pursued in the future to strengthen our mechanism and proposed model.

      We also agree that elucidating how THSD7A specifically interacts with target cells would be very informative and insightful. This would be most effectively assayed using a cell line that is stably expressing THSD7A-mScarlet and could be a future direction of this project. However, it is out of the scope of this current publication.

    1. eLife Assessment

      This is a potentially valuable modeling study on sequence generation in the hippocampus in a variety of behavioral contexts. While the scope of the model is ambitious, its presentation is incomplete and would benefit from substantially more methodological clarity and better biological justification. The work will interest the broad community of researchers studying cortical-hippocampal interactions and sequences.

    2. Reviewer #2 (Public review):

      Summary:

      Ito and Toyoizumi present a computational model of context-dependent action selection. They propose a "hippocampus" network that learns sequences based on which the agent chooses actions. The hippocampus network receives both stimulus and context information from an attractor network that learns new contexts based on experience. The model is consistent with a variety of experiments, both from the rodent and the human literature, such as splitter cells, lap cells, and the dependence of sequence expression on behavioral statistics. Moreover, the authors suggest that psychiatric disorders can be interpreted in terms of over-/under-representation of context information.

      Strengths:

      This ambitious work links diverse physiological and behavioral findings into a self-organizing neural network framework. All functional aspects of the network arise from plastic synaptic connections: Sequences, contexts, and action selection. The model also nicely links ideas from reinforcement learning to neuronally interpretable mechanisms, e.g., learning a value function from hippocampal activity.

      Weaknesses:

      The presentation, particularly of the methodological aspects, needs to be majorly improved. Judgment of generality and plausibility of the results is hampered, but is essential, particularly for the conclusions related to psychiatric disorders. In its present form, it is unclear whether the claims and conclusions made are justified. Also, the lack of clarity strongly reduces the impact of the work in the larger field.

      More specifically:

      (1) The methods section is impenetrable. The specific adaptations of the model to the individual use cases of the model, as well as the posthoc analyses of the simulations, did not become clear. Important concepts are only defined in passing and used before they are introduced. The authors may consider a more rigorous mathematical reporting style. They also may consider making the methods part self-contained and moving it in front of the results part.

      (2) The description of results in the main text remains on a very abstract level. The authors may consider showing more simulated neural activity. It remains vague how the different stimuli and contexts are represented in the network. Particularly, the simulations and related statistical analyses underlying the paradigms in Figure 4 are incompletely described.

      (3) The literature review can be improved (laid out in the specific recommendations).

      (4) Given the large range of experimental phenomenology addressed by the manuscript, it would be helpful to add a Discussion paragraph on how much the results from mice and humans can be integrated, particularly regarding the nature of the context selection network.

      (5) As a minor point, the hippocampus is pretty much treated as a premotor network. Also, a Discussion paragraph would be helpful.

    3. Reviewer #1 (Public review):

      Summary:

      The manuscript by Ito and Toyozumi proposes a new model for biologically plausible learning of context-dependent sequence generation, which aims to overcome the predefined contextual time horizon of previous proposals. The model includes two interacting models: an Amari-Hopfield network that infers context based on sensory cues, with new contexts stored whenever sensory predictions (generated by a second hippocampal module) deviate substantially from actual sensory experience, which then leads to hippocampal remapping. The hippocampal predictions themselves are context-dependent and sequential, relying on two functionally distinct neural subpopulations. On top of this state representation, a simple Rescola-Wagner-type rule is used to generate predictions for expected reward and to guide actions. A collection of different Hebbian learning rules at different synaptic subsets of this circuit (some reward-modulated, some purely associative, with occasional additional homeostatic competitive heterosynaptic plasticity) enables this circuit to learn state representations in a set of simple tasks known to elicit context-dependent effects.

      Strengths:

      The idea of developing a circuit-level model of model-based reinforcement learning, even if only for simple scenarios, is definitely of interest to the community. The model is novel and aims to explain a range of context-dependent effects in the remapping of hippocampal activity.

      Weaknesses:

      The link to model-based RL is formally imprecise, and the circuit-level description of the process is too algorithmic (and sometimes discrepant with known properties of hippocampus responses), so the model ends up falling in between in a way that does not fully satisfy either the computational or the biological promise. Some of the problems stem from the lack of detail and biological justification in the writing, but the loose link to biology is likely not fully addressable within the scope of the current results. The attempt at linking poor functioning of the context circuit to disease is particularly tenuous.

    4. Reviewer #3 (Public review):

      Summary:

      This paper develops a model to account for flexible and context-dependent behaviors, such as where the same input must generate different responses or representations depending on context. The approach is anchored in the hippocampal place cell literature. The model consists of a module X, which represents context, and a module H (hippocampus), which generates "sequences". X is a binary attractor RNN, and H appears to be a discrete binary network, which is called recurrent but seems to operate primarily in a feedforward mode. H has two types of units (those that are directly activated by context, and transition/sequence units). An input from X drives a winner-take-all activation of a single unit H_context unit, which can trigger a sequence in the H_transition units. When a new/unpredicted context arises, a new stable context in X is generated, which in turn can trigger a new sequence in H. The authors use this model to account for some experimental findings, and on a more speculative note, propose to capture key aspects of contextual processing associated with schizophrenia and autism.

      Strengths:

      Context-dependency is an important problem. And for this reason, there are many papers that address context-dependency - some of this work is cited. To the best of my knowledge, the approach of using an attractor network to represent and detect changes in context is novel and potentially valuable.

      Weaknesses:

      The paper would be stronger, however, if it were implemented in a more biologically plausible manner - e.g., in continuous rather than discrete time. Additionally, not enough information is provided to properly evaluate the paper, and most of the time, the network is treated as a black box, and we are not shown how the computations are actually being performed.

    5. Author Response:

      We appreciate the reviewers’ thoughtful assessments and constructive feedback on our manuscript. The central goal of our study was to propose a simple and biologically inspired model-based reinforcement learning (MBRL) framework that draws on mechanisms observed in episodic memory systems. Unlike model-free approaches that require processing at each state transition, our model uses sequential activity (= transition model) to predict environmental changes in the long term by leveraging episode-like representations.

      While many prior studies have focused on optimizing task performance in MBRL, our primary aim is to explore how flexible, context-dependent behavior—reminiscent of that observed in biological systems—can be instantiated using simple, neurally plausible mechanisms. In particular, we emphasize the use of an Amari-Hopfield network for the context selection module. This network, governed by Hebbian learning, forms attractors that can correct for sensory noise and facilitate associative recall, allowing dynamic separation of prediction errors due to sensory noise versus those due to contextual mismatches. However, we acknowledge that our explanation of these mechanisms, especially in relation to sensory noise, was not sufficiently developed in the current manuscript. We plan to revise the text to clarify this limitation and to expand on the implications of these mechanisms in the context of psychiatric disorder-like behaviors, as illustrated in Figure 5. Several reviewers raised concerns about the clarity of our model. Our implementation is intentionally algorithmic rather than formal, designed to provide an accessible proof-of-concept model. We will revise the manuscript to better describe the core logic of the model—namely, the bidirectional interaction between the Hopfield network (X) and the hippocampal sequence module (H), where X sends the information on estimated current context to H, and H returns a future prediction based on the episode to X. This interaction forms a loop enabling the current context estimation and its reselection.

      The key advantage of this architecture is its ability to flexibly adjust the temporal span of episodes used for inference and control, providing a potential solution to the challenge of credit assignment over variable time scales in MBRL. Because our model forms and stores the variable length of episodes depending on the context, it can handle both short-horizon and long-horizon tasks simultaneously. Moreover, because each episode is organized by context, reselecting contexts enables rapid switching between these variable timescales. This flexibility addresses a challenge in MBRL—the assignment of credit across variable time scales—without requiring explicit optimization. To better illustrate this important feature, we plan to include additional experiments in the revised manuscript that demonstrate how context-dependent modulation of episode length enhances behavioral flexibility and task performance.

      Finally, we will address the comments on the presentation and the biological grounding of our model. To improve clarity and biological relevance, we will revise the Methods section to explicitly describe how the model is grounded in mechanisms observed in real neural systems. Also, we will clarify which parts of our figures represent computational results versus schematic illustrations and more clearly explain how each model component relates to known neural mechanisms. These revisions aim to improve both clarity and accessibility for a broad audience, while reinforcing the biological relevance of our approach.

      We thank the reviewers again for their insightful comments, which will help us substantially improve the manuscript. We look forward to submitting a revised version that more clearly conveys the contributions and implications of our work.

    1. eLife Assessment

      Building on previous structural studies, this work provides valuable new insights into the architecture of the autophagy initiation complex, comprising ULK1, ATG13, and FIP200. The authors present their findings with solid supporting evidence, making this study a significant contribution to the autophagy field.

    2. Reviewer #1 (Public review):

      In this study, Hama et al. investigated the molecular regulatory mechanisms underlying the formation of the ULK1 complex in mammalian cells. Their results showed that in mammalian cells, ULK1, ATG13, and FIP200 form a complex with a stoichiometry of 1:1:2. These predicted interaction regions were validated through both in vivo and in vitro experiments, providing deeper insight into the molecular basis of ULK1 complex assembly in mammalian cells.

      The revised manuscript has addressed the majority of my concerns, and I have no further questions. Overall, this is a solid and impactful study that significantly advances our understanding of how the ULK1 complex is formed.

    3. Reviewer #2 (Public review):

      Summary:

      This is important work that helps to uncover how the process of autophagy is initiated - via structural analyses of the initiating ULK1 complex. High resolution structural details and a mechanistic insight of this complex have been lacking and understanding how it assembles and functions is a major goal of a field that impacts many aspects of cell and disease biology. While we know components of the ULK1 complex are essential for autophagy, how they physically interact is far from clear. The work presented makes use of AlphaFold2 to structurally predict interaction sites between the different subunits of the ULK1 complex (namely ULK1, ATG13 and FIP200). Importantly, the authors go on to experimentally validate that these predicted sites are critical for complex formation by using site-directed mutagenesis and then go on to show that the three-way interaction between these components is necessary to induce autophagy in cells.

      Strengths:

      The data are very clear. Each binding interface of ATG13 (ATG13 with FIP300/ATG13 with ULK1) is confirmed biochemically with ITC and IP experiments from cells. Likewise, IP experiments with ULK1 and FIP200 also validate interaction domains. A real strength of the work is in the analyses of the consequences of disrupting ATG13's interactions in cells. The authors make CRISPR KI mutations of the binding interface point mutants. This is not a trivial task and is the best approach as everything is monitored under endogenous conditions. Using these cells the authors show that ATG13's ability to interact with both ULK1 and FIP200 is essential for a full autophagy response.

      Weaknesses:

      I think a main weakness here is the failure to acknowledge and compare results with an earlier preprint that shows essentially the same thing (https://doi.org/10.1101/2023.06.01.543278). Arguably, this earlier work is much stronger from a structural point of view as it relies not only on AlphaFold2 but also actual experimental structural determinations (and takes the mechanisms of autophagy activation further by providing evidence for a super complex between the ULK1 and VPS34 complexes). That is not to say that this work is not important, as in the least it independently helps to build a consensus for ULK1 complex structure. Another weakness is that the downstream "functional" consequences of disrupting the ULK1 complex are only minimally addressed. The authors perform a Halotag-LC3 autophagy assay, which essentially monitors the endpoint of the process. There are a lot of steps in between, knowledge of which could help with mechanistic understanding. Not in the least is the kinase activity of ULK1 - how is this altered by disrupting its interactions with ATG13 and/or FIP200?

      Update:

      I feel the authors have addressed my concerns in their revised manuscript

    4. Reviewer #3 (Public review):

      In this study, the authors employed the protein complex structure prediction tool AlphaFold-Multimer to obtain a predicted structure of the protein complex composed of ULK1-ATG13-FIP200 and validated the structure using mutational analysis. This complex plays a central role in the initiation of autophagy in mammals. The results obtained in this study reveal extensive binary interactions between ULK1 and ATG13, between ULK1 and FIP200, and between ATG13 and FIP200, and pinpoint the critical residues at each interaction interface. Mutating these critical residues led to the loss of binary interactions. Interestingly, the authors showed that the ATG13-ULK1 interaction and the ATG13-FIP200 interaction are partially redundant for maintaining the complex. The experimental data presented by the authors are of high quality and convincing. The revised manuscript offers enhanced details about the prediction procedure and results, along with additional experimental findings, significantly increasing the scientific value of this paper.

    5. Author response:

      The following is the authors’ response to the original reviews

      Public Reviews:

      Reviewer #1 (Public review):

      In this study, Hama et al. explored the molecular regulatory mechanisms underlying the formation of the ULK1 complex. By employing the AlphaFold structural prediction tool, they showed notable differences in the complex formation mechanisms between ULK1 in mammalian cells and Atg1 in yeast cells. Their findings revealed that in mammalian cells, ULK1, ATG13, and FIP200 form a complex with a stoichiometry of 1:1:2. These predicted interaction regions were validated through both in vivo and in vitro assays, enhancing our understanding of the molecular mechanisms governing ULK1 complex formation in mammalian cells. Importantly, they identified a direct interaction between ULK1 and FIP200, which is crucial for autophagy. However, some aspects of this manuscript require further clarification, validation, and correction by the authors.

      Thank you for your thorough evaluation of our manuscript. We have carefully revised the manuscript to address your concerns by performing extra experiments and providing additional clarifications, validations, and corrections as written below.

      Reviewer #2 (Public review):

      Summary:

      This is important work that helps to uncover how the process of autophagy is initiated - via structural analyses of the initiating ULK1 complex. High-resolution structural details and a mechanistic insight of this complex have been lacking and understanding how it assembles and functions is a major goal of a field that impacts many aspects of cell and disease biology. While we know components of the ULK1 complex are essential for autophagy, how they physically interact is far from clear. The work presented makes use of AlphaFold2 to structurally predict interaction sites between the different subunits of the ULK1 complex (namely ULK1, ATG13, and FIP200). Importantly, the authors go on to experimentally validate that these predicted sites are critical for complex formation by using site-directed mutagenesis and then go on to show that the three-way interaction between these components is necessary to induce autophagy in cells.

      Strengths:

      The data are very clear. Each binding interface of ATG13 (ATG13 with FIP300/ATG13 with ULK1) is confirmed biochemically with ITC and IP experiments from cells. Likewise, IP experiments with ULK1 and FIP200 also validate interaction domains. A real strength of the work in in their analyses of the consequences of disrupting ATG13's interactions in cells. The authors make CRISPR KI mutations of the binding interface point mutants. This is not a trivial task and is the best approach as everything is monitored under endogenous conditions. Using these cells the authors show that ATG13's ability to interact with both ULK1 and FIP200 is essential for a full autophagy response.

      Thank you for your thoughtful review and for highlighting the importance of our approach.

      Weaknesses:

      I think a main weakness here is the failure to acknowledge and compare results with an earlier preprint that shows essentially the same thing (https://doi.org/10.1101/2023.06.01.543278). Arguably this earlier work is much stronger from a structural point of view as it relies not only on AlphaFold2 but also actual experimental structural determinations (and takes the mechanisms of autophagy activation further by providing evidence for a super complex between the ULK1 and VPS34 complexes). That is not to say that this work is not important, as in the least it independently helps to build a consensus for ULK1 complex structure. Another weakness is that the downstream "functional" consequences of disrupting the ULK1 complex are only minimally addressed. The authors perform a Halotag-LC3 autophagy assay, which essentially monitors the endpoint of the process. There are a lot of steps in between, knowledge of which could help with mechanistic understanding. Not in the least is the kinase activity of ULK1 - how is this altered by disrupting its interactions with ATG13 and/or FIP200?

      Thank you for this valuable feedback. In response, we performed a detailed structural comparison between the cryo-EM structure reported in the referenced preprint and our AlphaFold-based model. We have summarized both the similarities and differences in newly included figures (revised Figure 2A, B, 3B, S1F) and provided an in-depth discussion in the main text. Furthermore, to address the downstream consequences of ULK1 complex disruption, we have investigated the impact on ULK1 kinase activity, specifically examining how mutations affecting ATG13 or FIP200 interaction alter ULK1’s phosphorylation of a key substrate ATG14. In addition, we analyzed the effect on ATG9 vesicle recruitment. We provide the corresponding data as Figure S3C-E and detailed discussions in the revised manuscript.

      Reviewer #3 (Public review):

      In this study, the authors employed the protein complex structure prediction tool AlphaFold-Multimer to obtain a predicted structure of the protein complex composed of ULK1-ATG13-FIP200 and validated the structure using mutational analysis. This complex plays a central role in the initiation of autophagy in mammals. Previous attempts at resolving its structure have failed to obtain high-resolution structures that can reveal atomic details of the interactions within the complex. The results obtained in this study reveal extensive binary interactions between ULK1 and ATG13, between ULK1 and FIP200, and between ATG13 and FIP200, and pinpoint the critical residues at each interaction interface. Mutating these critical residues led to the loss of binary interactions. Interestingly, the authors showed that the ATG13-ULK1 interaction and the ATG13-FIP200 interaction are partially redundant for maintaining the complex.

      We are grateful for your high evaluation of our work.

      The experimental data presented by the authors are of high quality and convincing. However, given the core importance of the AlphaFold-Multimer prediction for this study, I recommend the authors improve the presentation and documentation related to the prediction, including the following:

      (1) I suggest the authors consider depositing the predicted structure to a database (e.g. ModelArchive) so that it can be accessed by the readers.

      We have deposited the AlphaFold model to ModelArchive with the accession code ma-jz53c, which is indicated in the revised manuscript.

      (2) I suggest the authors provide more details on the prediction, including explaining why they chose to use the 1:1:2 stoichiometry for ULK1-ATG13-FIP200 and whether they have tried other stoichiometries, and explaining why they chose to use the specific fragments of the three proteins and whether they have used other fragments.

      We appreciate your suggestion. As we noted in the original manuscript, previous studies have shown that the C-terminal region of ULK1 and the C-terminal intrinsically disordered region of ATG13 bind to the N-terminal region of the FIP200 homodimer (Alers, Loffler et al., 2011; Ganley, Lam du et al., 2009; Hieke, Loffler et al., 2015; Hosokawa, Hara et al., 2009; Jung, Jun et al., 2009; Papinski and Kraft, 2016; Wallot-Hieke, Verma et al., 2018). We relied on these findings when determining the specific regions to include in our complex prediction and when selecting a 1:1:2 stoichiometry for ULK1–ATG13–FIP200 which was reported previously (Shi et al., 2020). We also used AlphaFold2 to predict the structures of the full-length ULK1–ATG13 complex and the complex of the FIP200N dimer with full-length ATG13, confirming that there were no issues with our choice of regions (revised Figure S1A-C). In the revised manuscript, we have provided a more detailed explanation of our rationale based on the previous reports and additional AlphaFold predictions.

      (3) I suggest the authors present the PAE plot generated by AlphaFold-Multimer in Figure S1. The PAE plot provides valuable information on the prediction.

      We provided the PAE plot in the revised Figure S1C.

      Recommendations for the authors:

      Reviewer #1 (Recommendations for the authors):

      (1) In Figure 1D, the labels for the input and IP of ATG13-FLAG should be corrected to ATG13-FLAG FIP3A.

      We thank the reviewer for pointing out these labeling mistakes. We revised the labels based on the suggestions.

      (2) In the discussion section, the authors should address why ATG13-FLAG ULK1 2A in Fig. 2D leads to a significantly lower expression of ULK1 and provide possible explanations for this observation.

      ATG13 and ATG101, both core components of the ULK1 complex, are known to stabilize each other through their mutual interaction. Loss or reduction of one protein typically leads to the destabilization of the other. In this context, ULK1 is similarly stabilized by binding to ATG13. Therefore, ATG13-FLAG ULK2A mutant, which has reduced binding to ULK1, likely loses this stabilizing activity and ULK1 becomes destabilized, resulting in the lower expression levels of ULK1. We added these discussions in the revised manuscript.

      (3) In Figure 4B, the authors should explain why Atg13-FLAG KI significantly affects the expression of endogenous ULK1. Could Atg13-FLAG KI be interfering with its binding to ULK1? Experimental evidence should be provided to support this. Additionally, does Atg13-FLAG KI affect autophagy? Wild-type HeLa cells should be included as a control in Figure 4C and 4D to address this question.

      Thank you for your constructive suggestion. We found a technical error in the ULK1 blot of Figure 4B. Therefore, we repeated the experiment. The results show that ULK1 expression did not significantly change in the ATG13-FLAG KI. These findings are consistent with Figure S3A. We have replaced Figure 4B with this new data.

      We agree that including wild-type HeLa cells as a control is essential to determine whether ATG13-FLAG KI affects autophagy. We performed the same experiments in wild-type HeLa cells and found that ATG13-FLAG KI does not significantly impact autophagic flux. Accordingly, we have replaced Figures 4D and 4E with these new data.

      (4) In Figure 3C, the authors used an in vitro GST pulldown assay to detect a direct interaction between ULK1 and FIP200, which was also confirmed in Figure 3E. However, since FLAG-ULK1 FIP2A affects its binding with ATG13 (Fig. 3E), it is possible that ULK1 FIP2A inhibits autophagy by disrupting this interaction. The authors should therefore use an in vitro GST pulldown assay to determine whether GST-ULK1 FIP2A affects its binding with ATG13. Additionally, the authors should investigate whether the interaction between ULK1 and FIP200 in cells requires the involvement of ATG13 by using ATG13 knockout cells to confirm if the ULK1-FIP200 interaction is affected in the absence of ATG13.

      Thank you for the valuable suggestion. We examined the effect of the FIP2A mutation on the ULK1–ATG13 interaction using isothermal titration calorimetry (ITC) to obtain quantitative binding data. The results showed that the FIP2A mutation does not markedly alter the affinity between ULK1 and ATG13 (revised Figure S2B), suggesting that FIP2A mainly weakens the ULK1–FIP200 interaction. Regarding experiments in ATG13 knockout cells, ULK1 becomes destabilized in the absence of ATG13, making it technically difficult to assess how the ULK1–FIP200 interaction is affected under those conditions.

      Reviewer #2 (Recommendations for the authors):

      I feel the manuscript would benefit from a more detailed comparison with the Hurely lab paper - are the structural binding interfaces the same, or are there differences?

      We appreciate the suggestion to compare our results more closely with the work from the Hurley lab. We performed a detailed structural comparison between the cryo-EM structure reported in the referenced preprint and our AlphaFold-based model (revised Figure 2A, B, 3B, S1F) and provided an in-depth discussion in the main text.

      As mentioned, what happens downstream of disrupting the ULK1 complex? How is ULK1 activity changed, both in vitro and in cells? Does disruption of the ULK1 complex binding sites impair VPS34 activity in cells (for example by looking at PtdIns3P levels/staining)?

      Thank you for your insightful comments. We focused on elucidating how disrupting the ULK1 complex leads to impaired autophagy. To assess ULK1 activity, we measured ULK1-dependent phosphorylation of ATG14 at Ser29 (PMID: 27046250; PMID: 27938392). In FIP3A and FU5A knock-in cells, ATG14 phosphorylation was significantly reduced, indicating decreased ULK1 activity (revised Figure S3D, E). This observation is consistent with previous work showing that FIP200 recruits the PI3K complex. Notably, in ATG13 knockout cells, ATG14 phosphorylation became almost undetectable, though the underlying mechanism remains to be fully investigated. Altogether, these data point to reduced ULK1 activity as a key factor explaining the autophagy deficiency observed in FU5A knock-in cells.

      We also explored possible downstream mechanisms. One well-established function of ATG13 is to recruit ATG9 vesicles (PMID: 36791199). These vesicles serve as an upstream platform for the PI3K complex, providing the substrate for phosphoinositide generation (PMID: 38342428). To clarify how our mutations impact this step, we starved ATG13-FLAG knock-in cells and observed ATG9 localization. Unexpectedly, even in FU5A knock-in cells where ATG13 is almost completely dissociated from the ULK1 complex, ATG9A still colocalized with FIP200 (revised Figure S3C). These puncta also overlapped with p62, likely because p62 bodies recruit both FIP200 and ATG9 vesicles. Although we suspect that ATG9 recruitment is nonetheless impaired under these conditions, we were unable to definitively demonstrate this experimentally and consider it an important avenue for future study.

      Reviewer #3 (Recommendations for the authors):

      Here are some additional minor suggestions:

      (1) The UBL domains are only mentioned in the abstract but not anywhere else in the manuscript. I suggest the authors add descriptions related to the UBL domains in the Results section.

      We thank the reviewer for pointing out the lack of description of UBL domains, which we added in Results in the revised manuscript.

      (2) The authors may want to consider adding a diagram in Figure 1A to show the domain organization of the three full-length proteins and the ranges of the three fragments in the predicted structure.

      We have added a proposed diagram as Figure 1A.

      (3) I suggest the authors consider highlighting in Figure 1A the positions of the binding sites shown in Figure 1B, for example, by adding arrows in Figure 1A.

      We have added arrows in the revised Figure 1B (which was Figure 1A in the original submission).

      (4) In Figure 1D, "Atg13-FLAG" should be "Atg13-FLAG FIP3A".

      We have revised the labeling in Figure 1D.

      (5) "the binding of ATG13 and ULK1 to the FIP200 dimer one by one" may need to be re-phrased. "One by one" conveys a meaning of "sequential", which is probably not what the authors meant to say.

      We have revised the sentence as “the binding of one molecule each of ATG13 and ULK1 to the FIP200 dimer”.

      (6) In "Wide interactions were predicted between the four molecules", I suggest changing "wide" to "extensive".

      We have changed “wide” to “extensive” in the revised manuscript.

      (7) In "which revealed that the tandem two microtubule-interacting and transport (MIT) domains in Atg1 bind to the tandem two MIT interacting motifs (MIMs) of ATG13", I suggest changing the two occurrences of "tandem two" to "two tandem" or simply "tandem".

      We simply used "tandem" in the revised manuscript.

    1. eLife Assessment

      This important study investigates how hummingbird hawkmoths integrate stimuli from across their visual field to guide flight behavior. Cue conflict experiments provide solid evidence for an integration hierarchy within the visual field: hawkmoths prioritize the avoidance of dorsal visual stimuli, potentially to avoid crashing into foliage, while they use ventrolateral optic flow to guide flight control. The paper will be of broad interest to enthusiasts of visual neuroscience and flight behavior.

    2. Reviewer #1 (Public review):

      Summary:

      Recent work has demonstrated that the hummingbird hawkmoth, Macroglossum stellatarum, like many other flying insects, use ventrolateral optic flow cues for flight control. However, unlike other flying insects, the same stimulus presented in the dorsal visual field, elicits a directional response. Bigge et al., use behavioral flight experiments to set these two pathways in conflict in order to understand whether these two pathways (ventrolateral and dorsal) work together to direct flight and if so, how. The authors characterize the visual environment (the amount of contrast and translational optic flow) of the hawkmoth and find that different regions of the visual field are matched to relevant visual cues in their natural environment and that the integration of the two pathways reflects a prioritization for generating behavior that supports hawkmoth safety rather than the prevalence for a particular visual cue that is more prevalent in the environment.

      Strengths:

      This study creatively utilizes previous findings that the hawkmoth partitions their visual field as a way to examine parallel processing. The behavioral assay is well-established and the authors take the extra steps to characterize the visual ecology of the hawkmoth habitat to draw exciting conclusions about the hierarchy of each pathway as it contributes to flight control.

    3. Reviewer #2 (Public review):

      Summary

      Bigge and colleagues use a sophisticated free-flight setup to study visuo-motor responses elicited in different parts of the visual field in the hummingbird hawkmoth. Hawkmoths have been previously shown to rely on translational optic flow information for flight control exclusively in the ventral and lateral parts of their visual field. Dorsally presented patterns, elicit a formerly completely unknown response - instead of using dorsal patterns to maintain straight flight paths, hawkmoths fly, more often, in a direction aligned with the main axis of the pattern presented (Bigge et al, 2021). Here, the authors go further and put ventral/lateral and dorsal visual cues into conflict. They found that the different visuomotor pathways act in parallel, and they identified a 'hierarchy': the avoidance of dorsal patterns had the strongest weight and optic flow-based speed regulation the lowest weight. The authors linked their behavioral results to visual scene statistics in the hawkmoths' natural environment. The partition of ventral and dorsal visuomotor pathways is well in line with differences in visual cue frequencies. The response hierarchy, however, seems to be dominated by dorsal features, that are less frequent, but presumably highly relevant for the animals' flight safety.

      Strengths

      The data are very interesting and unique. The manuscript provides a thorough analysis of free-flight behavior in a non-model organism that is extremely interesting for comparative reasons (and on its own). These data are both difficult to obtain and very valuable to the field.

      Weaknesses

      While the present manuscript clearly goes beyond Bigge et al, 2021, the advance could have perhaps been even stronger with a more fine-grained investigation of the visual responses in the dorsal visual field. Do hawkmoths, for example, show optomotor responses to rotational optic flow in the dorsal visual field?

      I find the majority of the data, which are also the data supporting the main claims of the paper, compelling. However, the measurements of flight height are less solid than the rest and I think these data should be interpreted more carefully.

    4. Reviewer #3 (Public review):

      The authors have significantly improved the paper in revising to make its contributions distinct from their prior paper. They have also responded to my concerns about quantification and parameter dependency of the integration conclusion. While I think there is still more that could be done in this capacity, especially in terms of the temporal statistics and quantification of the conflict responses, they have a made a case for the conclusions as stated. The paper still stands as an important paper with solid evidence a bit limited by these concerns.

    5. Author response:

      The following is the authors’ response to the original reviews

      Public Reviews:

      Reviewer #1 (Public review):

      Summary:

      Recent work has demonstrated that the hummingbird hawkmoth, Macroglossum stellatarum, like many other flying insects, use ventrolateral optic flow cues for flight control. However, unlike other flying insects, the same stimulus presented in the dorsal visual field elicits a directional response. Bigge et al., use behavioral flight experiments to set these two pathways in conflict in order to understand whether these two pathways (ventrolateral and dorsal) work together to direct flight and if so, how. The authors characterize the visual environment (the amount of contrast and translational optic flow) of the hawkmoth and find that different regions of the visual field are matched to relevant visual cues in their natural environment and that the integration of the two pathways reflects a priortiziation for generating behavior that supports hawkmoth safety rather than than the prevalence for a particular visual cue that is more prevalent in the environment.

      Strengths:

      This study creatively utilizes previous findings that the hawkmoth partitions their visual field as a way to examine parallel processing. The behavioral assay is well-established and the authors take the extra steps to characterize the visual ecology of the hawkmoth habitat to draw exciting conclusions about the hierarchy of each pathway as it contributes to flight control.

      Weaknesses:

      The work would be further clarified and strengthened by additional explanation included in the main text, figure legends, and methods that would permit the reader to draw their own conclusions more feasibly. It would be helpful to have all figure panels referenced in the text and referenced in order, as they are currently not. In addition, it seems that sometimes the incorrect figure panel is referenced in the text, Figure S2 is mislabeled with D-E instead of A-C and Table S1 is not referenced in the main text at all. Table S1 is extremely important for understanding the figures in the main text and eliminating acronyms here would support reader comprehension, especially as there is no legend provided for Table S1. For example, a reader that does not specialize in vision may not know that OF stands for optic flow. Further detail in figure legends would also support the reader in drawing their own conclusions. For example, dashed red lines in Figures 3 and 4 A and B are not described and the letters representing statistical significance could be further explained either in the figure legend or materials to help the reader draw their own conclusions.

      We appreciate the suggestions to improve the clarity of the manuscript. We have extensively re-structured the entire manuscript. Among others, we have referenced all figure panels in the text in the order they appear. To do so, we combined the optic flow and contrast measurements of our setup with the methods description of the behavioural experiments (formerly Figs. 5 and 2, respectively). This new figure 2 now introduces the methods of the study, while the remainder of Fig. 2, which presented the experiments that investigated the vetrolateral and dorsal response in more detail, is now a separate figure (Fig. 3). This arrangement also balances the amount of information contained  in each figure better.

      Reviewer #2 (Public review):

      Summary:

      Bigge and colleagues use a sophisticated free-flight setup to study visuo-motor responses elicited in different parts of the visual field in the hummingbird hawkmoth. Hawkmoths have been previously shown to rely on translational optic flow information for flight control exclusively in the ventral and lateral parts of their visual field. Dorsally presented patterns, elicit a formerly completely unknown response - instead of using dorsal patterns to maintain straight flight paths, hawkmoths fly, more often, in a direction aligned with the main axis of the pattern presented (Bigge et al, 2021). Here, the authors go further and put ventral/lateral and dorsal visual cues into conflict. They found that the different visuomotor pathways act in parallel, and they identified a 'hierarchy': the avoidance of dorsal patterns had the strongest weight and optic flow-based speed regulation the lowest weight.

      Strengths:

      The data are very interesting, unique, and compelling. The manuscript provides a thorough analysis of free-flight behavior in a non-model organism that is extremely interesting for comparative reasons (and on its own). These data are both difficult to obtain and very valuable to the field.

      Weaknesses:

      While the present manuscript clearly goes beyond Bigge et al, 2021, the advance could have perhaps been even stronger with a more fine-grained investigation of the visual responses in the dorsal visual field. Do hawkmoths, for example, show optomotor responses to rotational optic flow in the dorsal visual field?

      We thank the reviewer for the feedback, and the suggestions for improvement of the manuscript (our implementations are detailed below). We fully agree that this study raises several intriguing questions regarding the dorsal visual response, including how the animals perceive and respond to rotational optic flow in their dorsal visual field, particularly since rotational optic flow may be processed separately from translational optic flow.

      In our free-flight setup, it was not possible to generate rotational optic flow in a controlled manner. To explore this aspect more systematically, a tethered-flight setup would be ideal, or alternatively, a free-flight setup integrated with virtual reality. This would be a compelling direction for a follow-up study.

      Reviewer #3 (Public review):

      The central goal of this paper as I understand it is to extract the "integration hierarchy" of stimulus in the dorsal and ventrolateral visual fields. The segregation of these responses is different from what is thought to occur in bees and flies and was established in the authors' prior work. Showing how the stimuli combine and are prioritized goes beyond the authors' prior conclusions that separated the response into two visual regions. The data presented do indeed support the hierarchy reported in Figure 5 and that is a nice summary of the authors' work. The moths respond to combinations of dorsal and lateral cues in a mixed way but also seem to strongly prioritize avoiding dorsal optic flow which the authors interpret as a closed and potentially dangerous ecological context for these animals. The authors use clever combinations of stimuli to put cues into conflict to reveal the response hierarchy.

      My most significant concern is that this hierarchy of stimulus responses might be limited to the specific parameters chosen in this study. Presumably, there are parameters of these stimuli that modulate the response (spatial frequency, different amounts of optic flow, contrast, color, etc). While I agree that the hierarchy in Figure 5 is consistent for the particular stimuli given, this may not extend to other parameter combinations of the same cues. For example, as the contrast of the dorsal stimuli is reduced, the inequality may shift. This does not preclude the authors' conclusions but it does mean that they may not generalize, even within this species. For example, other cue conflict studies have quantified the responses to ranges of the parameters (e.g. frequency) and shown that one cue might be prioritized or up-weighted in one frequency band but not in others. I could imagine ecological signatures of dorsal clutter and translational positioning cues could depend on the dynamic range of the optic flow, or even having spatial-temporal frequency-dependent integration independent of net optic flow.

      We absolutely agree that in principle, an observed integration hierarchy is only valid for the stimuli tested. Yet, we do believe that we provide good evidence that our key observations are robust also for related stimuli to the ones tested:

      Most importantly, we found that both pathways act in parallel (and are not mutually exclusive, or winner-takes-all, for example), when the animals can enact the locomotion induced by the dorsal and ventrolateral pathway. We tested this with the same dorsal cue (the line switching direction), but different behavioural paradigms (centring vs unilateral avoidance), and different ventrolateral stimuli (red gratings of one spatial frequency, and 100% nominal contrast black-and-white checkerboard stimuli which comprised a range of spatial frequencies) – and found the same integration strategy.

      Certainly, if the contrast of the visual cues was reduced to the point that the dorsal or ventrolateral responses became weaker, we would expect this to be visible in the combined responses, with the respective reduction in response strength for either pathway, to the same degree as they would be reduced when stimuli were shown independently in the dorsal and ventrolateral visual field.

      For testing whether the animals would show a weighting of responses when it was not possible to enact locomotion to both pathways, we felt it was important to use similar external stimuli to be able to compare the responses. So we can confidently interpret their responses in terms of integration. Indeed, how this is translated to responses in the two pathways depends a) on the spatiotemporal tuning, contrast sensitivity and exact receptive fields of the two systems, b) the geometry of the setup and stimulus coverage, and therefore the ability of the animals to enact responses to both pathways independently and c) on the integration weights.

      It would indeed be fascinating to obtain this tuning and the receptive fields, and having these, test a large array of combinations of stimuli and presentation geometries, so that one could extract integration weights for different presentation scenarios from the resulting flight responses in a future study.

      We also expanded the respective discussion section to reflect these points: l. 391-417. We also updated the former Fig. 5, now Fig. 6 to reflect this discussion.

      The second part of this concern is that there seems to be a missed opportunity to quantify the integration, especially when the optic flow magnitude is already calculated. The discussion even highlights that an advantage of the conflict paradigm is that the weights of the integration hierarchy can be compared. But these weights, which I would interpret as stimulus-responses gains, are not reported. What is the ratio of moth response to optic flow in the different regions? When the moth balances responses in the dorsal and ventrolateral region, is it a simple weighted average of the two? When it prioritizes one over the other is the response gain unchanged? This plays into the first concern because such gain responses could strongly depend on the specific stimulus parameters rather than being constant.

      Indeed, we set up stimuli that are comparable, as they are all in the visual domain, and since we can calculate their external optic flow and contrast magnitudes, to control for imbalances in stimulus presentation, which is important for the interpretation of the resulting data.

      As we discussed above, we are confident that we are observing general principles of the integration of the two parallel pathways. However, we refrained from calculating integration weights, because these might be misleading for several reasons:

      (1) In situations where the animals can enact responses to both pathways, we show that they do so at the full original magnitudes. So there are no “weights” of the hierarchy in this case.

      (2) Only when responses to both systems are not possible in parallel, do we see a hierarchy. However, combined with point (1), this hierarchy likely depends on the geometry of the moths’ environment: it will be more pronounced the less both systems can be enacted in parallel.

      (3) The hierarchy also does not affect all features of the dorsal or ventrolateral pathway equally. The hawkmoths still regulate their perpendicular distance to ventral gratings with dorsal gratings present, to same degree as with only ventral grating - because perpendicular distance regulation is not a feature of the dorsal response. And while the hawkmoths show a significant reduction in their position adjustment to dorsal contrast when it is in conflict with lateral gratings (Fig. 4C), they show exactly the same amount of lateral movement and speed adjustment as for dorsal gratings alone, when not combined with lateral ones (Fig. 4D and Fig. S3A). So even for one particular setup geometry and stimulus combination, there clearly is not one integration weight for all features of the responses.

      We extended the discussion section to clarify these points “The benefit of our study system is that the same cues activate different control pathways in different regions of the visual field, so that the resulting behaviour can directly be interpreted in terms of integration weights” (l. 448-451)

      l. 391-417, we also updated the former Fig. 5, now Fig. 6 to reflect this discussion.

      The authors do explain the choice of specific stimuli in the context of their very nice natural scene analysis in Fig. 1 and there is an excellent discussion of the ecological context for the behaviors. However, I struggled to directly map the results from the natural scenes to the conclusions of the paper. How do they directly inform the methods and conclusions for the laboratory experiments? Most important is the discussion in the middle paragraph of page 12, which suggests a relationship with Figure 1B, but seems provocative but lacking a quantification with respect to the laboratory stimuli.

      We show that contrast cues and translational optic flow are not homogeneously distributed in the natural environments of hawkmoths. This directly related to our laboratory findings, when it comes to responses to these stimuli in different parts of their visual field. In order to interpret the results of these behavioural experiments with respect to the visual stimuli, we did perform measurements of translational optic flow and contrast cues in the laboratory setup. As a result, we make several predictions about the animals’ use of translational optic flow and contrast cues in natural settings:

      a) Hawkmoths in the lab responded strongest to ventral optic flow, even though it was not stronger in magnitude, given our measurements, than lateral optic flow. Thus, we propose that the stronger response to ventral optic flow might be an evolutionary adaptation to the natural distribution of translational optic flow cues.

      b) In the natural habitats of hawkmoths, dorsal coverage is much less frequent that ventrolateral structures generating translational optic flow, yet the hawkmoths responded with a much higher weight to the former. Moreover, in our flight tunnel experiments, the animals responded with the same or higher weights to dorsal cues, which had a lower magnitude of translational optic flow and contrast than the same cues in the ventrolateral visual field. So we showed, combining behavioural experiments and stimulus measurements in the lab that the weighting of dorsal and ventrolateral cues did not follow their stimulus magnitude in the lab. Moreover, comparing to the natural cue distributions, we suggest that the integration weights also did not evolve to match the prevalence of these cues in natural habitats.

      We integrated the measurements of natural visual scene statistics in the new Fig. 6, to relate the behavioural findings to the natural context also in the figure structure, and sequence logic of the text, as they are discussed here.

      The central conclusion of the first section of the results is that there are likely two different pathways mediating the dorsal and the ventrolateral response. This seems reasonable given the data, however, this was also the message that I got from the authors' prior paper (ref 11). There are certainly more comparisons being done here than in that paper and it is perfectly reasonable to reinforce the conclusion from that study but I think what is new about these results needs to be highlighted in this section and differentiated from prior results. Perhaps one way to help would be to be more explicit with the open hypotheses that remain from that prior paper.

      We appreciate the suggestion to highlight more clearly what the open questions that are addressed in this study are. As a result, we have entirely restructured the introduction, added sections to the discussion and fundamentally changed the graphical result summary in Fig. 6, to reflect the following new findings (and differences to the previous paper):

      The previous paper demonstrated that there are two different pathways in hummingbird hawkmoths that mediate visual flight guidance, and newly described one of them, the dorsal response. This established flight guidance in hummingbird hawkmoths as a model for the questions asked in the current study, which are very different in nature from the previous paper.  

      The main question addressed in the current study is how these two flight guidance pathways interact to generate consistent behaviour? Throughout the literature of parallel sensory and motor pathways guiding behaviour, there are different solutions – from winner-takes-all to equal mixed responses. We tested this fundamental question using the hummingbird hawkmoth flight guidance systems as a model.

      This is the main question addressed in the various conflict experiments in this study, and we show that indeed, the two systems operate in parallel. As long as the animals can enact both dorsal and optic-flow responses, they do so at the original strengths of the responses. Only when this is not possible, hierarchies become visible. We carefully measured the optic flow and contrast cues generated by the different stimuli to ensure that the hierarchies we observed were not generated by imbalances of the external stimuli.

      - Does the interaction hierarchy of the two pathways follow the statistics of natural environments?  We did show qualitatively previously how optic flow and contrast cues are distributed across the visual field in natural habitats of the hummingbird hawkmoth. In this study, we quantitatively analysed the natural image data, including a new analysis for the contrast edges, and statistically compared the results across conditions. This quantitative analysis supported the previous qualitative assessment that the prevalence of translational optic flow was highest in the ventral and lowest in the dorsal visual field in all natural habitat types. The distribution of contrast edges across the visual field did depend on habitat type much stronger than visible in the qualitative analysis in the previous paper. When compared to the magnitude of the behavioural responses, and considering that the hummingbird hawkmoth is predominantly found in open and semi-open habitats, the natural distributions of optic flow and contrast edges did not align with the response hierarchy observed in our laboratory experiments. Dorsal cues elicited much stronger responses relative to ventrolateral optic flow responses than would be expected.

      To provide a more complete picture of the dorsal pathway, which will be important to understand its nature, and also compare to other species, we conducted additional experiments that were specifically set up to test for response features known from the translational optic flow response. To compare and contrast the two systems. These experiments here allowed us to show that the dorsal response is not simply a translational optic flow reduction response that creates much stronger output than the ventrolateral optic flow response. We particularly show that the dorsal response was lacking the perpendicular distance regulation of the optic flow response, while it did provide alignment with prominent contrasts (possibly to reduce the perceived translational optic flow), which is not observed in the ventrolateral optic flow response. The strong avoidance of any dorsal contrast cues, not just those inducing translational optic flow, is another feature not found in the ventrolateral pathway.

      Recommendations for the authors:

      Reviewer #1 (Recommendations for the authors):

      Many comparisons between visual conditions are made and it was confusing at times to know which conditions the authors were comparing. Thinking of a way to label each condition with a letter or number so that the authors could specify which conditions are specifically being compared would greatly enhance comprehension and readability.

      We appreciate this concern. To be able to refer to the individual stimulus conditions in the analysis and results description, we gave each stimulus a unique identifier (see table S1), and provided these identifiers in the respective figures and throughout the text. We hope that this makes the identification of the individual stimuli easier.

      Consider adding in descriptive words to the y-axis labels for the position graphs that would help the reader quickly understand what a positive or negative value means with respect to the visual condition.

      We did now change the viewpoint on the example tracks in Figs. 2-5, to take a virtual viewpoint from the top, not as the camera recorded from below, which requires some mental rotation to reconcile the left and right sides. Moreover, we noticed that the example track axes were labelled in mm, while the axes for the plots showing median position in the tunnel were labelled in cm. We reconciled the units as well. This will make it easier to see the direct equivalent of the axis (as well as positive and negative values) in the example tracks in those figures, and the median positions, as well as the cross-index.

      There are no line numbers provided so it is a bit challenging to provide feedback on specific sentences but there are a handful of typos in the manuscript, a few examples:

      (1) Cue conflict section, first paragraph: "When both cues were presented to in combination, ..." (remove to)

      (2) The ecological relevance section, first paragraph, first sentence: "would is not to fly"

      (3) Figure S3 legend: explanation for C is labeled as B and B is not included with A

      We apologise for the missing line numbers. We added these and resolved the issues 1-3.

      Reviewer #2 (Recommendations for the authors):

      - The pictograms in Fig. 1a were at first glance not clear to me, maybe adding l, r, d, v to the first pictogram could make the figure more immediately accessible.

      We added these labels to make it more accessible.

      - I would suggest noting in the main text that the red patterns were chosen for technical reasons (see Methods), if this is correct.

      We added this information and a reference to the methods in the main text (lines 100-102).

      - "Thus, hawkmoths are currently the only insect species for which a partitioning of the visual field has been demonstrated in terms of optic-flow-based flight control [33-35]." I think that is a bit too strong and maybe it would be more interesting to connect the current data to connected data in other insects to perhaps discuss important similarities. Ref 32 for example shows that fruit flies weigh ventral translational optic flow considerably more than dorsal translational optic flow. Reichardt 1983 (Naturwissenschaften) showed that stripe fixation in large flies (a behaviour relying in part on the motion pathway) is confined to the ventral visual field, etc...

      We have changed this sentence to acknowledge partitioning in other insects, and motivating the use of our model species for this study: While fruit flies weight ventral translational optic flow stronger than dorsal optic flow, the most extreme partitioning of the visual field in terms of  optic-flow-based flight control has been observed in hawkmoths [33-35]. (lines 60-62)

      - I think the statistical differences group mean differences could be described in more detail at least in Fig. 2 (to me the description was not immediately clear, in particular with the double letters).

      We added an explanation of the letter nomenclature to all respective figure legends:

      Black letters show statistically significant differences in group means or median, depending on the normality of the test residuals (see Methods, confidence level: 5%). The red letters represent statistically significant differences in group variance from pairwise Brown–Forsythe tests (significance level 5%). Conditions with different letters were significantly different from each other. The white boxplots depict the median and 25% to 75% range, the whiskers represent the data exceeding the box by more than 1.5 interquartile ranges, and the violin plots indicate the distribution of the individual data points shown in black.

      - "When translational optic flow was presented laterally" I would use a more wordy description, since it is the hawkmoth that is controlling the optic flow and in addition to translational optic flow, there might also be rotational components, retinal expansion etc.

      We extended the description to explain that the moths were generating the optic flow percept based on stationary gratings in different orientations, by way of their flight through the tunnel. Lines 127-129

      - While it is clearly stated that the measure of the perpendicular distance from the ventral and dorsal pattern via the size of the insect as seen by the camera is indirect, I would suggest to determine the measurement uncertainty of distance estimate.

      - Connected to above - is the hawkmoth area averaged over the entire flight and is the variance across frames similar in all the stimuli conditions? Is it, in principle, conceivable that the hawkmoths' pitch (up or down) is different across conditions, e.g. with moths rising and falling more frequently in a certain condition, which could influence the area in addition to distance?

      There are a number of sources that generate variance in the distance estimate (which was based on the size of the moth in each video frame, after background subtraction): the size of the animal, the contrast with which the animal was filmed (which also depended on the type of pattern in the tunnel – it was lower with ventral or dorsal patterns as a background than with lateral ones), and the speed of the animal, as motion blur could impact the moth’s image on the video. The latter is hard to calibrate, but the uncertainty related to animal size and pattern types could theoretically be estimated. However, since we moved between finishing the data acquisition for this study and publishing the paper, the original setup has been dismantled. We could attempt to recreate it as faithfully as possible, but would be worried to introduce further noise. We therefore decided to not attempt to characterise the uncertainty, to not give a false impression of quantifiability of this measure. For the purpose of this study, it will have to remain a qualitative, rather than a quantitative measure. If we should use a similar measure again, we will make sure to quantify all sources of uncertainty that we have access to.

      The variance in area is different between conditions. Most likely, the animals vary their flight height different for different dorsal and ventral patterns, as they vary their lateral flight straightness with different lateral visual input. For the reasons mentioned above, we cannot disentangle the effects of variations in flight height and other sources of uncertainty relating to animal size in the video frames. We therefore averaged the extracted area across the entire flight, to obtain a coarse measure of their flight height. Future studies focusing specifically on the vertical component or filming in 3D will be required to determine the exact amount of vertical flight variation.

      - Results second paragraph, suggestion: pattern wavelength or spatial frequency instead of spatial resolution.

      - Same paragraph, suggestion: For an optimal wavelength/spatial frequency of XX

      We corrected these to spatial frequency.

      - Above Fig 3- "this strongly suggests a different visual pathway". In my opinion it would be better to say sensory-motor /visuomotor pathway or to more clearly define visual pathway? Could one in principle imagine a uniform set of local motion sensitive neurons across the entire visual field that connect differentially to descending/motor neurons.

      We appreciate this point and changed this, and further instances in the manuscript to visuomotor pathway.

      - If I understood correctly, you calculated the magnitude of optic flow in the different tunnel conditions based on the image of a fisheye camera moving centrally in the tunnel, equidistant from all walls. I did not understand why the magnitude of optic flow should differ between the four quadrants showing the same squarewave patterns. Apologies if I missed something, but maybe it is worth explaining this in more detail in the manuscript.

      We recognize that this point may not have been immediately clear and have therefore provided additional clarification in the Methods and results section (lines 106-111, 543-549). We anticipated differences in the magnitude of optic flow due to potential contrast variations arising from the way the stimuli were generated—being mounted on the inner surfaces of different tunnel walls while the light source was positioned above. On the dorsal wall, light from the overhead lamps passed through the red material. For laterally mounted patterns, the animals perceived mainly reflected light, as these tunnel walls were not transparent.

      A similar principle applied to the background, which consisted of a white diffuser allowing light to pass through dorsally, but white non-transmissive paper laterally, with a 5% contrast random checkerboard patterns. The ventral side presented a more complex scenario, as it needed to be partially transparent for the ventrally mounted camera. Consequently, the animals perceived a combination of light reflections from the red patterns and the white gauze covering the ventral tunnel side, against the much darker background of the surrounding room.

      To ensure that the observed flight responses were not artifacts of deviations in visual stimulation from an ideal homogeneous environment, we used the camera to quantify the magnitude of optic flow and contrast patterns under these real experimental conditions. This approach also allowed us to directly relate the optic flow measurements taken indoors to those recorded outdoors, as we employed the same camera and analytical procedures for both datasets.

      Reviewer #3 (Recommendations for the authors):

      In addition to the considerations above I had a few minor points:

      There are so many different directions of stimuli and response that it is quite challenging to parse the results. Can this be made a little easier for the reader?

      We appreciate this concern. To be able to refer to the individual stimulus conditions in the analysis and results description, we gave each stimulus a unique identifier (see table S1), and provided these identifiers in the respective figures and throughout the text. We hope that this makes the identification of the individual stimuli easier.

      One suggestion (only a suggestion): I found myself continuously rotating the violin plots in my head so that the lateral position axis lined up with the lateral position of the tunnel icons below. Consider if rotating the plots 90 degs would help interpretability. It was challenging to keep track of which side was side.

      We did discuss this with a number of test-readers, and tried multiple configurations. They all have advantages and drawbacks, but we decided that the current configuration for the majority of testers was the current one. To help the mental transformations from the example flight tracks in the figures, we now present the example flight tracks in Figs. 2-5 in the same reference frame as the figures showing median position (so positive and negative values on those axes correspond directly), and changed the view from a below the tunnel to an above the tunnel view, as this is the more typical depiction. We hope that this enhances readability.

      Are height measurements sensitive to the roll and pitch of the animal? I suspect this is likely small but worth acknowledging.

      They are indeed. These effects are likely small but contribute to the overall inaccuracy, which we could not quantify in this particular setup (see also response to reviewer 2 on that point), which is why the height measurements have to be considered a qualitative approximation rather than a quantification of flight height. We added text to acknowledge the effects of roll and pitch specifically (lines 657-658)

      The Brown-Forsythe test was reported as paired but this seems odd because the same moths were not used in each condition. Maybe the authors meant something different by "paired" than a paired statistical design?

      Indeed, the data was not paired in the sense that we could attribute individual datapoints to individual moths across conditions. We applied the Brown-Forsythe test in a pairwise manner, comparing the variance of each condition with another one in pairs each, to test if the variance in position differed across conditions. We did phrase this misleadingly, and have corrected it to „The variance in the median lateral position (in other words, the spread of the median flight position) was statistically compared between the groups using the pairwise Brown–Forsythe tests“ l. 187-188

      There is some concern about individual moth preferences and bias due to repeated measures. I appreciate that the individual moth's identity was not likely known in most cases, but can the authors provide an approximate breakdown of how many individual moths provided the N sample trajectories?

      This is a very valid concern, and indeed one we did investigate in a previous study with this setup. We confirmed that the majority of animals (70%, 68% and 53% out of 40 hawkmoths, measured on three consecutive days) crossed the tunnel within a randomly picked window of 3h (Stöckl et al. 2019). We now state this explicitly in the methods section (lines 594-597). Thus, for the sample sizes in our study, statistically, each moth would have contributed a small number of tracks compared to the overall number of tracks sampled.

      The statistics section of the methods said that both Tukey-Kramer (post-hoc corrected means) and Kruskal-Wallis (non-parametric medians) were done. It is sometimes not clear which test was done for which figure, and where the Kruskal-Wallis test was done there does not seem to be a corrected statistical significance threshold for the many multiple comparisons (Fig. 2). It is quite possible I am just missing the details and they need to be clarified. I think there also needs to be a correction for the Brown-Forsythe tests but I don't know this method well.

      We first performed an ANOVA, and if the test residuals were not normally distributed, we used a Kruskal-Wallis test instead. For the post-hoc tests of both we used Tukey-Kramer to correct for multiple comparisons. The figure legends did indeed miss this information. We added it to clarify our statistical analysis strategy and refer to the methods section for more details (i.e. l. 185-186). All statistical results, including the type of statistical test used, have been uploaded to the data repository as well.

      The connection to stimulus reliability in the discussion seems to conflate reliability with prevalence or magnitude.

      We have rephrased the respective discussion sections to clearly separate the prevalence and magnitude of stimuli, which was measured, from an implied or hypothesized reliability (lines 510-511).

      Line numbers would be helpful for future review.

      We apologize for missing the line numbers and have added them to the revised manuscript.

    1. eLife Assessment

      Using a unique cerebellar disruption approach in non-human primates, this study provides valuable new insight into how cerebellar inputs to the motor cortex contribute to reaching. The findings convincingly demonstrate that reaching movements following cerebellar disruption slow down because of both an acute deficit in producing muscle activity as well as a progressive decline in compensating for limb dynamics. This work will be of interest to neuroscientists and clinicians interested in cerebellar function and pathology.

    2. Reviewer #1 (Public review):

      Summary:

      In a previous work Prut and colleagues had shown that during reaching, high frequency stimulation of the cerebellar outputs resulted in reduced reach velocity. Moreover, they showed that the stimulation produced reaches that deviated from a straight line, with the shoulder and elbow movements becoming less coordinated. In this report they extend their previous work by addition of modeling results that investigate the relationship between the kinematic changes and torques produced at the joints. The results show that the slowing is not due to reductions in interaction torques alone, as the reductions in velocity occur even for movements that are single joint. More interestingly, the experiment revealed evidence for decomposition of the reaching movement, as well as an increase in the variance of the trajectory.

      Strengths:

      This is a rare experiment in a non-human primate that assessed the importance of cerebellar input to the motor cortex during reaching.

      Weaknesses:

      None

    3. Reviewer #2 (Public review):

      This manuscript asks an interesting and important question: what part of 'cerebellar' motor dysfunction is an acute control problem vs a compensatory strategy to the acute control issue? The authors use a cerebellar 'blockade' protocol, consisting of high frequency stimuli applied to the cerebellar peduncle which is thought to interfere with outflow signals. This protocol was applied in monkeys performing center out reaching movements and has been published from this laboratory in several preceding studies. I found the take-home-message broadly convincing and clarifying - that cerebellar block reduces muscle activation acutely particularly in movements that involve multiple joints and therefore invoke interaction torques, and that movements progressively slow down to in effect 'compensate' for these acute tone deficits. The manuscript was generally well written, data were clear, convincing and novel. The key strengths are differentiating acute from sub-acute (within session but not immediate) kinematic consequences of cerebellar block.

    4. Reviewer #3 (Public review):

      Summary:

      In their revised manuscript, Sinha and colleagues aim to identify distinct causes of motor impairments seen when perturbing cerebellar circuits. This goal is an important one, given the diversity of movement related phenotypes in patients with cerebellar lesion or injury, which are especially difficult to dissect given the chronic nature of the circuit damage. To address this goal, the authors use high-frequency stimulation (HFS) of the superior cerebellar peduncle in monkeys performing reaching movements. HFS provides an attractive approach for transiently disrupting cerebellar function previously published by this group. First, they find a reduction in hand velocities during reaching, which was more pronounced for outward versus inward movements. By modeling inverse dynamics, they find evidence that shoulder muscle torques are especially affected. Next, the authors examine the temporal evolution of movement phenotypes over successive blocks of HFS trials. Using this analysis, they find that in addition to the acute, specific effects on torques in early HFS trials, there was an additional progressive reduction in velocity during later trials, which they interpret as an adaptive response to the inability to effectively compensate for interaction torques during cerebellar block. Finally, the authors examine movement decomposition and trajectory, finding that even when low velocity reaches are matched to controls, HFS produces abnormally decomposed movements and higher than expected variability in trajectory.

      Strengths:

      Overall, this work provides important insight into how perturbation of cerebellar circuits can elicit diverse effects on movement across multiple timescales.

      The HFS approach provides temporal resolution and enables analysis that would be hard to perform in the context of chronic lesions or slow pharmacological interventions. Thus, this study describes an important advance over prior methods of circuit disruption in the monkey, and their approach can be used as a framework for future studies that delve deeper into how additional aspects of sensorimotor control are disrupted (e.g., response to limb perturbations).

      In addition, the authors use well-designed behavioral approaches and analysis methods to distinguish immediate from longer-term adaptive effects of HFS on behavior. Moreover, inverse dynamics modeling provides important insight into how movements with different kinematics and muscle dynamics might be differentially disrupted by cerebellar perturbation.

      Remaining comments:

      The argument that there are acute and adaptive effects to perturbing cerebellar circuits is compelling, but there seems to be a lost opportunity to leverage the fast and reversible nature of the perturbations to further test this idea and strengthen the interpretation. Specifically, the authors could have bolstered this argument by looking at the effects of terminating HFS - one might hypothesize that the acute impacts on joint torques would quickly return to baseline in the absence of HFS, whereas the longer-term adaptive component would persist in the form of aftereffects during the 'washout' period. As is, the reversible nature of the perturbation seems underutilized in testing the authors' ideas. While this experimental design was not implemented here, it seems like a good opportunity for future work using these approaches.

      The analysis showing that there is a gradual reduction in velocity during what the authors call an adaptive phase is convincing. While it is still not entirely clear why disruption of movement during the adaptive phase is not seen for inward targets, despite the fact that many of the inward movements also exhibit large interaction torques, the authors do raise potential explanations in the Discussion.

    5. Author response:

      The following is the authors’ response to the previous reviews

      Reviewer #1 (Public review):

      Summary:

      In a previous work Prut and colleagues had shown that during reaching, high frequency stimulation of the cerebellar outputs resulted in reduced reach velocity. Moreover, they showed that the stimulation produced reaches that deviated from a straight line, with the shoulder and elbow movements becoming less coordinated. In this report they extend their previous work by addition of modeling results that investigate the relationship between the kinematic changes and torques produced at the joints. The results show that the slowing is not due to reductions in interaction torques alone, as the reductions in velocity occur even for movements that are single joint. More interestingly, the experiment revealed evidence for decomposition of the reaching movement, as well as an increase in the variance of the trajectory.

      Strengths:

      This is a rare experiment in a non-human primate that assessed the importance of cerebellar input to the motor cortex during reaching.

      Weaknesses:

      None

      Reviewer #1 (Recommendations for the authors):

      The authors have answered my questions adequately and I have no further comments.

      Reviewer #2 (Public review):

      This manuscript asks an interesting and important question: what part of 'cerebellar' motor dysfunction is an acute control problem vs a compensatory strategy to the acute control issue? The authors use a cerebellar 'blockade' protocol, consisting of high frequency stimuli applied to the cerebellar peduncle which is thought to interfere with outflow signals. This protocol was applied in monkeys performing center out reaching movements and has been published from this laboratory in several preceding studies. I found the takehome-message broadly convincing and clarifying - that cerebellar block reduces muscle activation acutely particularly in movements that involve multiple joints and therefore invoke interaction torques, and that movements progressively slow down to in effect 'compensate' for these acute tone deficits. The manuscript was generally well written, data were clear, convincing and novel. The key strengths are differentiating acute from subacute (within session but not immediate) kinematic consequences of cerebellar block.

      Reviewer #2 (Recommendations for the authors):

      I think the manuscript is good as is. That said, it would have been nice to see more of the behavioral outcomes in Figure 5 (e.g. decomposition and trajectory variability) analyzed longitudinally like the velocity measurements in Fig. 4. This would clearly strengthen the insight into acute and compensatory components of cerebellar motor deficits.

      The two behavioral measures of motor noise used in our study are movement decomposition and trajectory variability (Figure 5). Since trajectory variability is measured across trials we could not analyze this measure longitudinally as a function of trial number. However, following the reviewer’s advice, we examined movement

      decomposition for successive trials in control vs. cerebellar block for movements to targets 2-4 similar to the analysis of  hand velocity in figure 4. We found no interaction effect between trial sequence x cerebellar block on movement decomposition. This result is consistent with our conclusion that noisy joint activation occurs independently of adaptive slowing of multi-joint movements. We have updated our main text (lines 293-299) and supplementary information (supplementary figure S5 and supplementary table S8) to include this result.  

      Reviewer #3 (Public review):

      Summary:

      In their revised manuscript, Sinha and colleagues aim to identify distinct causes of motor impairments seen when perturbing cerebellar circuits. This goal is an important one, given the diversity of movement related phenotypes in patients with cerebellar lesion or injury, which are especially difficult to dissect given the chronic nature of the circuit damage. To address this goal, the authors use high-frequency stimulation (HFS) of the superior cerebellar peduncle in monkeys performing reaching movements. HFS provides an attractive approach for transiently disrupting cerebellar function previously published by this group. First, they find a reduction in hand velocities during reaching, which was more pronounced for outward versus inward movements. By modeling inverse dynamics, they find evidence that shoulder muscle torques are especially affected. Next, the authors examine the temporal evolution of movement phenotypes over successive blocks of HFS trials. Using this analysis, they find that in addition to the acute, specific effects on torques in early HFS trials, there was an additional progressive reduction in velocity during later trials, which they interpret as an adaptive response to the inability to effectively compensate for interaction torques during cerebellar block. Finally, the authors examine movement decomposition and trajectory, finding that even when low velocity reaches are matched to controls, HFS produces abnormally decomposed movements and higher than expected variability in trajectory.

      Strengths:

      Overall, this work provides important insight into how perturbation of cerebellar circuits can elicit diverse effects on movement across multiple timescales.

      The HFS approach provides temporal resolution and enables analysis that would be hard to perform in the context of chronic lesions or slow pharmacological interventions. Thus, this study describes an important advance over prior methods of circuit disruption in the monkey, and their approach can be used as a framework for future studies that delve deeper into how additional aspects of sensorimotor control are disrupted (e.g., response to limb perturbations).

      In addition, the authors use well-designed behavioral approaches and analysis methods to distinguish immediate from longer-term adaptive effects of HFS on behavior. Moreover, inverse dynamics modeling provides important insight into how movements with different kinematics and muscle dynamics might be differentially disrupted by cerebellar perturbation.

      In this revised version of the manuscript, the authors have provided additional analyses and clarification that address several of the comments from the original submission.

      Remaining comments:

      The argument that there are acute and adaptive effects to perturbing cerebellar circuits is compelling, but there seems to be a lost opportunity to leverage the fast and reversible nature of the perturbations to further test this idea and strengthen the interpretation. Specifically, the authors could have bolstered this argument by looking at the effects of terminating HFS - one might hypothesize that the acute impacts on joint torques would quickly return to baseline in the absence of HFS, whereas the longer-term adaptive component would persist in the form of aftereffects during the 'washout' period. As is, the reversible nature of the perturbation seems underutilized in testing the authors' ideas. While this experimental design was not implemented here, it seems like a good opportunity for future work using these approaches.

      We agree with the reviewer that examining the effect of the cerebellar block on immediate post-block washout trials in future studies will be insightful.    

      The analysis showing that there is a gradual reduction in velocity during what the authors call an adaptive phase is convincing. While it is still not entirely clear why disruption of movement during the adaptive phase is not seen for inward targets, despite the fact that many of the inward movements also exhibit large interaction torques, the authors do raise potential explanations in the Discussion.

      The text in the Introduction and in the prior work developing the HFS approach overstates the selectivity of the perturbations. First, there is an emphasis on signals transmitted to the neocortex. As the authors state several times in the Discussion, there are many subcortical targets of the cerebellar nuclei as well, and thus it is difficult to disentangle target-specific behavioral effects using this approach. Second, the superior cerebellar peduncle contains both cerebellar outputs and inputs (e.g., spinocerebellar). Therefore, the selectivity in perturbing cerebellar output feels overstated. Readers would benefit from a more agnostic claim that HFS affects cerebellar communication with the rest of the nervous system, which would not affect the major findings of the study. In the revised manuscript, the authors do provide additional anatomical and evolutionary context and discuss potential limitations in the selectivity of HFS in the Materials and Methods. However, I feel that at least a brief mention of these caveats in the Introduction, where it is stated, "we then reversibly blocked cerebellar output to the motor cortex", would benefit the reader.

      Following the advice of the reviewer, we have now revised the introduction section of our manuscript in the following way (lines 61-67):

      “…We then reversibly disrupted cerebellar communication with other neural structures using high-frequency stimulation (HFS) of the superior cerebellar peduncle, assessing the impact of this perturbation on subsequent movements. Although our approach primarily affects cerebellar output to the motor cortex, it also disrupts fibers carrying input signals (e.g., spinocerebellar) and pathways to various subcortical targets (e.g., cerebellorubrospinal). Thus, our manipulation broadly interferes with cerebellar communication…”

      Reviewer #3 (Recommendations for the authors):

      Typo on line 102; "subs-sessions"

      We have corrected this typographical error in our revised manuscript (line 106).

    1. eLife Assessment

      The work presents a valuable extension of qFit-ligand, a computational method for modeling conformational heterogeneity of ligands in X-ray crystallography and cryo-EM density maps. The authors provide solid evidence of improved capabilities through careful validation against the previous version, particularly in expanding ligand sampling within conformational space. Such improvements suggest practical utility for challenging applications, including macrocyclic compound modeling and crystallographic drug fragment screening.

    2. Reviewer #1 (Public review):

      Summary:

      Flowers et al describe an improved version of qFit-ligand, an extension of qFit. qFit and qFit-ligand seek to model conformational heterogeneity of proteins and ligands, respectively, cryo-EM and X-ray (electron) density maps using multiconformer models-essentially extensions of the traditional alternate conformer approach in which substantial parts of the protein or ligand are kept in place. By contrast, ensemble approaches represent conformational heterogeneity through a superposition of independent molecular conformations.

      The authors provide a clear and systematic description of the improvements made to the code, most notably the implementation of a different conformer generator algorithm centered around RDKit. This approach yields modest improvements in the strain of the proposed conformers (meaning that more physically reasonable conformations are generated than with the "old" qFit-ligand) and real space correlation of the model with the experimental electron density maps, indicating that the generated conformers also better explain the experimental data then before. In addition, the authors expand the scope of ligands that can be treated, most notably allowing for multi conformer modeling of macrocyclic compounds.

      Strengths:

      The manuscript is well written, provides a thorough analysis, and represents a needed improvement of our collective ability to model small-molecule binding to macromolecules based on cryo-EM and X-ray crystallography, and can therefore has a positive impact on both drug discovery and general biological research.

      Weaknesses:

      Weaknesses were addressed during review. Overall, the demonstrated performance gains are modest.

      Specific comments:

      (1) The accuracy of initial placement may be critical. At the same time, in my experience ambiguous cases are quite common, for example with flat ligands with a few substituents sticking out or with ligands with highly mobile tails. There remain some questions regarding sensitivity to initial ligand placement, which individual users should check for.

    3. Reviewer #3 (Public review):

      Summary:

      The manuscript by Flowers et al. aimed to enhance the accuracy of automated ligand model building by refining the qFit-ligand algorithm. Recognizing that ligands can exhibit conformational flexibility even when bound to receptors, the authors developed a bioinformatic pipeline to model alternate ligand conformations while improving fitting and more energetically favorable conformations.

      Strengths:

      The authors present a computational pipeline designed to automatically model and fit ligands into electron density maps, identifying potential alternative conformations within the structures.

      Weaknesses:

      Ligand modeling, particularly in cases of poorly defined electron density, remains a challenging task. The procedure presented in this manuscript exhibits limitations in low-resolution electron density maps (lower than 2.0 Å) and low-occupancy scenarios. Considering that the maps used to establish the operational bounds of qFit-ligand were synthetically generated, it's likely that the resolution cutoff will be even stricter when applied to real-world data.

    4. Author response:

      The following is the authors’ response to the original reviews

      Public Reviews:

      Reviewer #1 (Public review):

      Summary:

      Flowers et al describe an improved version of qFit-ligand, an extension of qFit. qFit and qFit-ligand seek to model conformational heterogeneity of proteins and ligands, respectively, cryo-EM and X-ray (electron) density maps using multi-conformer models - essentially extensions of the traditional alternate conformer approach in which substantial parts of the protein or ligand are kept in place. By contrast, ensemble approaches represent conformational heterogeneity through a superposition of independent molecular conformations.

      The authors provide a clear and systematic description of the improvements made to the code, most notably the implementation of a different conformer generator algorithm centered around RDKit. This approach yields modest improvements in the strain of the proposed conformers (meaning that more physically reasonable conformations are generated than with the "old" qFit-ligand) and real space correlation of the model with the experimental electron density maps, indicating that the generated conformers also better explain the experimental data than before. In addition, the authors expand the scope of ligands that can be treated, most notably allowing for multi-conformer modeling of macrocyclic compounds.

      Strengths:

      The manuscript is well written, provides a thorough analysis, and represents a needed improvement of our collective ability to model small-molecule binding to macromolecules based on cryo-EM and X-ray crystallography, and can therefore have a positive impact on both drug discovery and general biological research.

      Weaknesses:

      There are several points where the manuscript needs clarification in order to better understand the merits of the described work. Overall the demonstrated performance gains are modest (although the theoretical ceiling on gains in model fit and strain energy are not clear!).

      We thank the reviewer for their thoughtful review. To address comments, we have added clarifying statements and discussion points around the extent of performance gains, our choice of benchmarking metrics, and the “standards” in the field for significance. We expanded our analysis to highlight how to use qFit ligand in “discovery” mode, which is aimed at supporting individual modeling efforts. As we now write in the discussion:

      “It is advisable to employ qFit-ligand selectively, focusing on cases with a moderate correlation between your input model and the experimental data, strong visual density in the binding pocket, high map resolution, or when your single-conformer ligand model is strained.”

      Additionally, we note in the discussion:

      “qFit-ligand primarily serves as a “thought partner” for manual modeling. Modelers still must resolve many ambiguities, including initial ligand placement, to fully take advantage of qFit capabilities. In active modeling workflows or large scale analyses, the workflow would only accept the output of qFit-ligand when it improves model quality. In cases where qFit-ligand degrades map-to-model fit and/or strain, we can simply revert to the input model. In practice, users can easily remove poorly fitting conformations using molecular modeling software such as COOT, while keeping the well modeled conformations, which is an advantage of the multiconformer approach over ensemble refinement methods.”

      Reviewer #2 (Public review):

      Summary:

      The manuscript by Flowers et al. aimed to enhance the accuracy of automated ligand model building by refining the qFit-ligand algorithm. Recognizing that ligands can exhibit conformational flexibility even when bound to receptors, the authors developed a bioinformatic pipeline to model alternate ligand conformations while improving fitting and more energetically favorable conformations.

      Strengths:

      The authors present a computational pipeline designed to automatically model and fit ligands into electron density maps, identifying potential alternative conformations within the structures.

      Weaknesses:

      Ligand modeling, particularly in cases of poorly defined electron density, remains a challenging task. The procedure presented in this manuscript exhibits clear limitations in low-resolution electron density maps (resolution > 2.0 Å) and low-occupancy scenarios, significantly restricting its applicability. Considering that the maps used to establish the operational bounds of qFit-ligand were synthetically generated, it's likely that the resolution cutoff will be even stricter when applied to real-world data.

      We thank Reviewer #2 for their comments on the role of conformational flexibility and how our tool addresses the complexity involved in modeling alternative conformations. We agree that there are limitations at low resolution, limiting the application of our algorithm. That is the case with all structural biology tools. Automatically finding alternative conformations of ligands in high-resolution structures is an enhancement to the toolbox of ligand fitting. Expanding the algorithm to work with fragment screening data is important in this realm, as almost all of this data fits in the high-resolution range where qFit-ligand works best.

      The reported changes in real-space correlation coefficients (RSCC) are not substantial, especially considering a cutoff of 0.1. Furthermore, the significance of improvements in the strain metric remains unclear. A comprehensive analysis of the distribution of this metric across the Protein Data Bank (PDB) would provide valuable insights.

      We agree that the changes are small, partially because the baseline (manually modeled ligands) is very high. To provide additional evidence, we added evaluations using EDIAm, which is a more sensitive metric. In Figure 2 (page 10), representing the development dataset, we see more improvements above 0.1. With this being said, it is unclear what constitutes a ‘substantial’ improvement for either of these metrics, especially considering alternative conformations may only change the coordinates of a subset of ligands, just slightly improving the fit to density.

      We agree that looking across the PDB on strain would provide valuable insight. To explore this, we looked to see how qFit-ligand could improve the fitting of deposited ligands with high strain (see section: Evaluating qFit-ligand on a set of structures known to be highly strained, Page 15). While only a subset of these structures had alternative conformers placed (24.6%), we observed that in this subset, the ligands often improved the RSCC and strain. This figure also demonstrates that while RSCC may not change much numerically, the alternative conformers explain previously unexplained density with lower energy conformers than what is currently deposited.

      To mitigate the risk of introducing bias by avoiding real strained ligand conformations, the authors should demonstrate the effectiveness of the new procedure by testing it on known examples of strained ligand-substrate complexes.

      See above.

      Recommendations for the authors:

      Reviewer #1 (Recommendations for the authors):

      A - Specific comments:

      (1) It appears necessary to provide qFit-ligand with an initial model with the ligand already placed. This is not clear from the start of the introduction on page 3. It appears that ligand position is only weakly adjusted fairly late in the process, in step F of Figure 1. It seems, therefore, that the accuracy of initial placement is rather critical (see the example discussed on page 21). At the same time, in my experience, ambiguous cases are quite common, for example with flat ligands with a few substituents sticking out or with ligands with highly mobile tails. It would be helpful for the authors to comment on the sensitivity to initial ligand placement, either in the discussion or, better yet, in the form of an analysis in which the starting model position is randomly perturbed.

      In our revised version, we have modified the introduction to clarify the necessity of including an initial ligand model (page 4).

      “The qFit-ligand algorithm takes as input a crystal or cryo-EM structure of an initial protein-ligand complex with a single conformer ligand in PDBx/mmCIF format, a density map or structure factors (encoded by a ccp4 formatted map or an MTZ), and a SMILES string for the ligand.”

      We also describe our sampling algorithm more clearly (see: Biasing Conformer Generation, page 6). Steps A-E generate many conformations (using RDKit), which are then selected/fit into experimental density (using quadratic programming). To help with additional shifting issues in the input ligand, after the first selection, we do additional rotation/translation of the generated conformers that are kept. We then do another round of fitting to the density (quadratic programming followed by mixed integer quadratic programming).

      Given this sampling, we have not elected to do an additional computational experiment to test the “radius of convergence” or dependence on initial conditions. However, we outline the fundamental procedure here so that someone can build on the work and test the idea:

      - Create single conformer models as we currently do

      - randomly perturb the coordinates of the ligand by 0.1-0.3Å

      - refine to convergence, creating a series of “perturbed, modified true positives” for each dataset

      - Run qFit ligand

      - Evaluate the variability in the resulting multi-conformer models

      (2) Top of page 6 ("Biasing Conformer Generation"): the authors say "as we only want to generate ligands that physically fit within the protein binding pocket, we bias conformation generation towards structures more likely to fit well within the receptor's binding site". Apart from the odd redundancy of this sentence, I am confused: at the stage that seems to be referred to here (A-C in Figure 1) is the fit to the electron density already taken into account, or does this only happen later (after step E)?

      Thank you for pointing this out. We have edited the statement to clarify it:

      “To guide the conformation generation from the Chem.rdDistGeom based on the ligand type and protein pocket, we developed a suite of specialized sampling functions to bias the conformational search towards structures more likely to fit well into the receptor’s binding site.”

      We do not consider the electron density during conformer generation (only selection from the generated conformers). The sampling is additionally biased by the type of ligand and the size of the binding pocket.

      (3) qFit-ligand appears to be quite slow. Are there prospects for speedup? Can the code take advantage of GPUs or multi-CPU environments?

      We agree with this. We have made some algorithmic improvements, most notably removing duplicate conformers based on root mean squared distance. This, along with parallelization, decreased the average runtime from ~19 minutes to ~8 minutes (see additional details: qFit-ligand runtime, page 8). We do not currently take advantage of GPU specific code.

      (4) Section: Detection of experimental true positive multi-conformer ligands:

      a) Why are carbohydrate ligands excluded? This seems like an important class of ligands that one would like qFit to be able to treat! Which brings me to a related question: can covalently attached groups (e.g., glycosylation sites!) be modeled using qFit-ligand, or is qFit-ligand restricted to non-covalently bound groups?

      Currently, qFit-ligand does not support covalently bound ligands, but this is an area of interest we are hoping to expand into. In the revised version, we added the non-covalently attached carbohydrates back into the true positive dataset. In Figure 4 (page 14), we show that qFit-ligand is able to improve fit to the experimental density in around 80% of structures, while also often reducing torsion strain (see additional details: qFit-ligand applied to unbiased dataset of experimental true positives, page 14).

      b) "as well as 758 cases where the ligand model's deposited alternate conformations (altlocs) were not bound in the same chain and residue number" - I do not understand what this means, or why it leads to the exclusion of so many structures. Likewise, a number of additional exclusions are described in Figure S3. Some more background on why these all happened would be helpful. Are you just left with the "easy" cases?

      Sometimes modelers will list the multiple conformations of a bound ligand as a separate residue within the PDB file, rather than as a single multiconformer model. For example, rather than writing a multiconformer LIG bound at A, 201 with altlocs ‘A’ and ‘B’, a modeler might write this instead as LIG, A, 201 and LIG A, 301. We initially excluded these kinds of structures. However, we agree that this choice resulted in the removal of many potentially valid true positives. We have since updated our data processing pipeline to include these cases, and they are examined in the updated manuscript.

      c) I do not follow the argument made at the end of this section (last two paragraphs on page 9): "when using a single average conformation to describe density from multiple conformations, the true low-energy states may be ignored". I get that, but the conformations in the "modified true positives" dataset derive directly from models in which two conformations were modeled, so this cannot be the explanation for why qFit-ligand models result in somewhat lower average strain. It would seem that the paper could be served by providing examples where single conformations were modeled in deposited structures, but qFit detects multiple conformations.

      We agree with this comment that the strain obtained from the modified true positives is likely higher than the deposited models. However, the modified structure is refined with a single conformation, and therefore changed from the deposited “A” conformation. Thus, the reduced strain observed in our qFit-ligand models relative to the modified true positives is not unexpected.

      To expand our dataset, we also looked at deposited structures with high strain, all of which were modeled as single conformers. Here, we saw a decrease in strain when alternative conformers were placed (see section: Evaluating qFit-ligand on a set of structures known to be highly strained, page 15). Further, we provide an example from the XGen macrocycle dataset where a ligand initially modeled as a single conformer exhibited relatively high strain. After qFit‐ligand modeled a second conformation, the overall strain was reduced (Figure 6C, page 19; Figure 6—figure supplement 1C, page 59).

      (5) Section: qFit-ligand applied to an unbiased dataset of experimental true positives Bottom of page 14: The paragraph starting with "qFit-ligand shows particular strength in scenarios with strong evidence..." is enigmatic: there's no illustration (unless it directly relates to the findings in Figure 4, in which case this should be more explicit). Since this points out when the reader will and will not benefit from using qFit-ligand, it should be clear what the authors are talking about.

      This claim considers all the evidence presented in the manuscript, not necessarily one particular aspect of it. We advise using qFit-ligand when there is a moderate correlation between the input model and the experimental data, strong visual density in the binding pocket, high map resolution, and/or when your single conformer ligand model is strained. We have made all of these points clearer in the updated manuscript.

      B  - Section: qFit-ligand can automatically detect and model multiple conformations of macrocycles:

      This is an exciting extension of qFit-ligand, but some aspects of the analysis strike me as worrisome. Of the initial dataset of 150 structures, fewer than half make it all the way through analysis. It's hard to believe that this is a fully representative subset. Why, for example, could 29 structures not be refined against the deposited structure factors? Why does strain calculation (in RDKit?) fail on 30 ligands? What about the other 18 cases--why did these fail (in PHENIX?).

      We agree that this is a striking number of failures, however, we note that they are not specific shortcomings of qFit-ligand (in fact, most are because standard structural biology and/or cheminformatics software fail on many PDB depositions). Therefore, these failures reflect broader limitations in standard bioinformatics and refinement restraint files when handling macrocycles. The strain calculator we used was not built for macrocycles, and after consulting with many experts in the field, the consensus was that no method works well with macrocycles. We discuss these issues in additional detail in the discussion (page 27):

      “Additionally, our algorithm’s placement within the larger refinement and ligand modeling ecosystem highlighted other areas that need improvement. We note that macrocycles, due to their complicated and interconnected degrees of freedom, suffer acutely from the refinement issues, as demonstrated by the failure of approximately one-third of datasets in our standard preparation or post-refinement pipelines due to ligand parameterization issues. Many of these stemmed from problematic ligand restraint files, highlighting the difficulty of encoding the geometric constraints of macrocycles using standard restraint libraries. Improved force-field or restraints for macrocycles are desperately needed to improve their modeling.”

      C  - Minor issues:

      (1) "Fragment-soaked event maps" - this is a semantically strange section title!

      We have updated the section title in our revised manuscript. The new title is ‘qFit-ligand recovers heterogeneity in fragment-soaked event maps’.

      (2) Too many digits! All over the manuscript, percentages are displayed with 0.01% precision, while these mostly refer to datasets with ~150 structures. Shifting just one structure from one category to another changes these percentages by nearly 1%.

      We have updated the sig figs in our revised manuscript.

      (3) The authors are keen to classify decreases in RSCC as significant only when these changes exceed 0.1, but do not apply the same standard for increases. For instance, in Figure 4B if we were to classify improvements as significant if ΔRSCC > 0.1, there would be fewer significant improvements than decreases in performance (although it is visually clear that for most datasets things get better. Similarly, in Figure 5A if we were to classify improvements as significant if ΔRSCC > 0.1, qFit-ligand would only yield significant improvements for two out of 73 cases-not a lot).

      We agree with the reviewer that there needs to be more consistency in our analysis of improvements/deteriorations. However, we note that operationally, when the decreases in model quality are observed, the modeler would simply reject the new model in favor of the input model. We have added to the discussion:

      “In active modeling workflows or large scale analyses, the workflow would only accept the output of qFit-ligand when it improves model quality. In cases where qFit-ligand degrades map-to-model fit and/or strain, we can simply revert to the input model. In practice, users can easily remove poorly fitting conformations using molecular modeling software such as COOT, while keeping the well modeled conformations, which is an advantage of the multiconformer approach over ensemble refinement methods.”

      There is generally no consensus in the field as to what might indicate a ‘significant’ change in RSCC, and any threshold we choose would be arbitrary. We note that in our manuscript, we had previously characterized a decrease in RSCC to be ‘significant’ if it exceeded 0.1. However, as there is no real scientific justification for this cutoff, or any cutoff, we moved away from this framing in the revised manuscript. Therefore, we just classify if we improve RSCC. For example, on page 9:

      “qFit-ligand modeled an alternative conformation in 72.5% (n=98) of structures. Compared with the modified true positive models, 83.7% (n=113) of qFit-ligand models have a better RSCC and 77.0% (n=104) structures saw an improvement in EDIAm, representing an improved fit to experimental data in the vast majority of structures.”

      In addition, we have conducted additional experiments using more sensitive metrics (EDIAm) to further illustrate qFit-ligand’s performance.

      (4) Small peptides are not discussed as a class of ligands, although these are quite common.

      Canonical peptides can be modeled with standard qFit. Non-canonical peptides present failure modes similar to the macrocycles discussed above, with a mix of ATOM and HETATM records and the need for custom cif definitions and link records. For these reasons we have not included an analysis outside of the macrocycle section. We have noted this caveat in the discussion:

      “We note that even linear non-canonical peptides present similar failure modes to macrocycles, with a mix of ATOM and HETATM records and the need for custom cif definitions and link records. For these reasons, we did not include analysis on small peptide ligands; however, canonical peptides can be modeled with standard qFit [8].”

      (5) Top of page 10: "while refinement improves": what kind of refinement does this refer to?

      This refers to refinement with Phenix. We have updated this language to reflect this (page 8). “We refer to these altered structures as our ‘modified true positives’, which we use as input to qFit-ligand, and subsequent refinement using Phenix.”

      (6) Bottom of page 11: "they often did" -> "it often did"

      We have made this change in the revised version.

      (7) Top of page 14: RMSDs and B factors do have units.

      We have added the units in our revision.

      (8) Top of page 24. In the generation of a composite omit map, why are new Rfree flags being generated? Did I misunderstand that?

      r_free_flags.generate=True only creates R-free flags if they are not present in the input file as is the case for many (especially older) PDB depositions.

      (9) Bottom of page 27: how large is the mask? Presumably when alt confs of the ligand are possible, it would be helpful for the mask to cover those?

      We agree that this mask should be updated. In our revision, we define the mask around the coordinates of the full qFit-ligand ensemble. The same mask is used to calculate the RSCC of the input (single conformer) model versus the qFit-ligand model.

      (10) Middle of page 29: "These structure factors are then used to compute synthetic electron density maps." - It is not clear whether the following three sentences are an explanation of the details of that statement or rather things that are done afterwards.

      We clarify this in the manuscript (page 36).

      “These structure factors are then used to compute synthetic electron density maps. To each of these maps, we generate and add random Gaussian noise values scaled proportionally to the resolution. This scaling reflects the escalation of experimental noise as resolution deteriorates, a common occurrence in real-life crystallographic data.”

      (11) Chemical synthesis: I am not qualified to assess this and am surprised to see some much detail here rather than in some other manuscript. Are the corresponding structures deposited anywhere?

      All of the structures we discuss in this manuscript are deposited in the PDB and listed in Supplementary Table 5.

      Reviewer #2 (Recommendations for the authors):

      The data should consistently present the number of structures that exhibit improvements or deterioration in particular metrics, like RSCC and strain, using a cutoff that should be significant. For instance, stating that "85.93% (n=116) of structures having a better RSCC in the qFit-ligand models compared to the modified true positive models" without clarifying the magnitude of improvement (e.g., a marginal increase of 0.01 in RSCC) lacks meaningful context. The figures should clearly indicate the specific cutoff values used for each metric. The accompanying text should provide a detailed explanation for the selection of these cutoff values, justifying their significance in the context of the study.

      Currently, there is no established consensus within the field on what constitutes a 'significant' improvement in RSCC or strain values. As such, we chose not to impose an arbitrary cutoff and just look at which structures improve RSCC. We also removed all language stating significance, as there isn’t a good standard in the field to assess significance. This is especially important as only improvements would be considered in an active modeling project. In cases where qFit ligand degrades the RSCC (or strain) to a large extent, the modeler would simply revert to the input model.

      In the first section of Results: "First, for all ligands, we perform an unconstrained search function allowing the generated conformers to only be constrained from the bounds matrix (Figure 1A). This is particularly advantageous for small ligands that benefit from less restriction to fully explore their conformational space. We then perform a fixed terminal atoms search function (Figure 1B)." It is unclear whether a fixed terminal atom search was conducted for each conformer generated in the initial step to further explore the conformational space. This aspect should be clarified to provide a more comprehensive understanding of the methodology.

      Each independent conformer generation function (A-E) is initialized with only the input ligand model and runs in parallel with the other functions. These functions do not build on each other, but rather perturb the input molecule independently of one another. In our updated manuscript, we have clarified the methodology (page 6).

      “First, in all cases, we perform an unconstrained search function (Figure 1A), a fixed terminal atoms search function (Figure 1B), and a blob search function (Figure 1C).”

      Phrase: "We randomly sampled 150 structures and, after manual inspection of the fit of alternative conformations, chose 135 crystal structures as a development set for improving qFit-ligand." The authors should explain why they filtered 10% of the structures.

      To develop qFit-ligand, we wanted to use a very high-quality dataset. We needed to know with some degree of certainty that if qFit-ligand failed to produce an alternate conformation (or generated conformations low in RSCC or high in strain), the failure was due to an algorithmic limitation rather than poor-quality input data. Therefore, after selection based on numerical metrics, we manually examined each ligand in Coot to observe if we believed the alternative conformers fit well into the density.

    1. eLife Assessment

      This important study reports a reanalysis of one experiment of a previously-published report to characterize the dynamics of neural population codes during visual working memory in the presence of distracting information. This paper presents solid evidence that working memory representations are dynamic and distinct from sensory representations of intervening distractions. This research will be of interest to cognitive neuroscientists working on the neural bases of visual perception and memory.

    2. Reviewer #1 (Public review):

      Summary:

      In this study, the authors re-analyzed a public dataset (Rademaker et al, 2019, Nature Neuroscience) which includes fMRI and behavioral data recorded while participants held an oriented grating in visual working memory (WM) and performed a delayed recall task at the end of an extended delay period. In that experiment, participants were pre-cued on each trial as to whether there would be a distracting visual stimulus presented during the delay period (filtered noise or randomly-oriented grating). In this manuscript, the authors focused on identifying whether the neural code in retinotopic cortex for remembered orientation was 'stable' over the delay period, such that the format of the code remained the same, or whether the code was dynamic, such that information was present, but encoded in an alternative format. They identify some timepoints - especially towards the beginning/end of the delay - where the multivariate activation pattern fails to generalize to other timepoints, and interpret this as evidence for a dynamic code. Additionally, the authors compare the representational format of remembered orientation in the presence vs absence of a distracting stimulus, averaged over the delay period. This analysis suggested a 'rotation' of the representational subspace between distracting orientations and remembered orientations, which may help preserve simultaneous representations of both remembered and viewed stimuli. Intriguingly, this rotation was a bit smaller for Expt 2, in which the orientation distractor had a greater behavioral impact on the participants' behavioral working memory recall performance, suggesting that more separation between subspaces is critical for preserving intact working memory representations.

      Strengths:

      (1) Direct comparisons of coding subspaces/manifolds between timepoints, task conditions, and experiments is an innovative and useful approach for understanding how neural representations are transformed to support cognition

      (2) Re-use of existing dataset substantially goes beyond the authors' previous findings by comparing geometry of representational spaces between conditions and timepoints, and by looking explicitly for dynamic neural representations

      (3) Simulations testing whether dynamic codes can be explained purely by changes in data SNR are an important contribution, as this rules out a category of explanations for the dynamic coding results observed

      Weaknesses:

      (1) Primary evidence for 'dynamic coding', especially in early visual cortex, appears to be related to the transition between encoding/maintenance and maintenance/recall, but the delay period representations seem overall stable, consistent with some previous findings. However, given the simulation results, the general result that representations may change in their format appears solid, though the contribution of different trial phases remains important for considering the overall result.

      (2) Converting a continuous decoding metric (angular error) to "% decoding accuracy" serves to obfuscate the units of the actual results. Decoding precision (e.g., sd of decoding error histogram) would be more interpretable and better related to both the previous study and behavioral measures of WM performance.

      Comments on revised version:

      The authors have addressed all my previous concerns.

    3. Author response:

      The following is the authors’ response to the previous reviews

      Reviewer #1:

      Reviewer #1 (Recommendations For The Authors):

      (1) At several places in the reply to reviewers and the manuscript, when discussing the new simulations conducted, the authors mention they break the 180 trials into a train/test split of 108/108 - is this value correct? If so, how? (pg 19 of updated manuscript)  

      Thank you for pointing this out; it was not clearly explained. We have now added the explanation to the Methods section: 

      “For each iteration, we randomly selected 108 responses from the full set of 180 for training, and then independently sampled another 108 from the same full set for testing. This ensured that the same orientation could appear in both sets, consistent with the structure of the original experiment.”

      (2) I appreciate the authors have added the variance explained of principal components to the axes of Fig. 3, though it took me a while to notice this, and this isn't described in the figure caption at all. It would likely help readers to directly explain what the % means on each axis of Fig. 3.

      Thank you, we have now added a description in both Fig. 2 and 3:

      “The axes represent the first two principal components, with labels indicating the percent of total explained variance.”

      (3) I believe there is a typo/missing word in the new paragraph on pg 15: "neural visual WM representations in the early visual cortices are [[biased]] towards distractors" (I think the bracketed word may be omitted as a typo)

      Thank you - fixed.

    1. eLife Assessment

      In this important study, the authors have performed a zebrafish drug screen to identify suppressors of atherogenic lipoproteins. They utilize a well-established LipoGlo assay to find molecules that modulate these lipoproteins, identifying 49 potential hits. They perform some validation experiments, including studies linking enoxolone to its likely inhibitory effect on a specific transcription factor, HNF4alpha. Overall, the results are convincing and robust, and will open up new areas of exploration for those investigators interested in in vivo lipid biology.

    2. Reviewer #1 (Public review):

      Summary:

      A whole-organism drug screen was performed to identify molecules that decrease Apolipoprotein B (ApoB) as a target for agents to reduce atherosclerosis. Kelpsch et al. used a zebrafish reporter line, LipoGlo, which is a fusion of the Nano-luciferase protein to the ApoB protein as a proxy for the presence of ApoB-containing lipoproteins (B-lps) in larval stages. The LipoGlo line was screened against a well-characterized drug library and identified 49 hits from their primary screen. Follow-up studies further refined this list to 19 molecules that reproducibly reduced B-lps significantly. The authors focused their studies on enoxolone, a licorice root extract, and showed that larvae treated with this agent can reduce the production of B-lps. As enoxolone has been reported to suppress Hepatocyte Nuclear factor 4a (HNF4a), the authors investigated whether loss-of-hnf4a or pharmacological inhibition of hnf4a in zebrafish also produced similar phenotypes as enoxolone treatment. Their studies showed that this was the case. Transcriptomic studies after enoxolone treatment resulted in altered expression of genes involved in cholesterol biosynthesis and in glucose/insulin signaling pathways. This study highlights the utility of a zebrafish whole-organism chemical screen for modifiers of B-lps production and/or its clearance. A significant finding is that enoxolone inhibits hnf4a in zebrafish to reduce B-lps production and supports targeting HNF4a as a therapeutic means to reduce the emergence of atherosclerosis.

      Strengths:

      The authors performed a whole-organism chemical screen with over 3000 agents. Such screens are challenging, and the authors used strict criteria for determining hits. The conclusions of this study are well supported by the presented data.

      Weaknesses:

      There are areas within the study and writing that can be improved and extended, specifically within the gene expression studies.

    3. Reviewer #2 (Public review):

      Summary:

      The authors aimed to develop a large-scale drug screen to identify B-lp modulators in a vertebrate whole-animal system. Using the zebrafish LipoGlo system that the authors had previously published and validated, the authors screened 2762 drug candidates to generate 49 hits and ultimately validated 19 drugs as genuine ApoB-lowering drugs. Using LipoGlo-Electrophoresis, the authors are able to obtain insights into the ApoB-lipoprotein size/subclass distribution. The authors further validate and study the mechanism of a strong hit, Enoxolone, known as also known as 18β-Glycyrrhetinic acid, which has previously been reported to modulate lipid metabolism. The authors also show that Enoxolone effects are mediated through HNF4⍺, which has been previously shown in the mouse system, but this is the first time it has been shown in the zebrafish.

      Strengths:

      The study was methodical and robust, using a published and well-validated zebrafish LipoGlo model. The authors validated the hits from the screen independently and considered the possibility that some drugs may have been detected as false positive results due to effects on the enzymatic activity of NanoLuciferase; only one hit, verteporfin, was shown to be a false positive. Using LipoGlo-Electrophoresis, the authors are able to obtain extra insights into the ApoB-lipoprotein size/subclass distribution. They showed that while enoxolone treatment reduces total B-lps, there are no overt changes in B-lp size distribution compared to vehicle-treated animals, other than a slight increase in the zero mobility (ZM) fraction, which contains very large particles and/or tissue aggregates. In contrast, the positive control, lomitapide, does show a change in B-lp size distribution compared to vehicle-treated animals - an increase in frequency of LDLs (low-density lipoprotein), but a decrease in VLDLs (very low-density lipoprotein). This study also assesses the LipoGlo-Electrophoresis profile of HNF4⍺ inhibitors. Work in the zebrafish larvae means that the effect on overall development and an entire vertebrate organism can also be assessed. Finally, the authors applied a thorough statistical measure to define a hit, using the Strictly Standardized Mean Difference (SSMD) method.

      Weaknesses:

      While the screen was thorough and well-validated, the authors missed a chance to provide a lot of extra significance to a wide range of readership. While the hits were thoroughly validated and displayed, the authors could have also presented the LipoGlo-Electrophoresis for all validated hits or at least a number of them. This would hugely increase the insights into these compounds. Also, the authors chose to validate and follow up a mechanism for Enoxolone, yet this hit was already known to modulate lipid metabolism through HNF4⍺, therefore, hugely limiting the impact of the paper. So what the authors have shown that is novel is only subtly added to this - consistent in vertebrate models, RNA sequencing of pathways, further validation of the HNF4⍺ pathway, and a profile of resulting B-lp size distribution. It seemed an easy way out to pick such a candidate, and they could have followed up by validating more thoroughly a completely novel drug. Also, the authors' prior paper showing the methodology also depicted complementary EM and LipoGlo-microscopy approaches. The microscopy especially, would have been an easy complementary add-on to the screen to really give extra insights into B-lp metabolism in a whole organism for all candidates. This felt like a missed opportunity.

    4. Reviewer #3 (Public review):

      Summary:

      In "A‬‭ whole-animal‬‭ phenotypic‬‭ drug‬‭ screen‬‭ identifies‬‭ suppressors‬‭ of‬‭ atherogenic‬ lipoproteins", Kelpsch et al seek to identify new, chemically targetable pathways that regulate ApoB function and could ultimately serve as treatments for elevated lipid disorders and/or cardiovascular disease. Given the interconnected nature of lipid regulation in the whole organism with interdependent organs and secreted components (i.e. lipoproteins), they use the vertebrate model zebrafish to screen a large library of ~3000 compounds for their ability to lower the important ApoB-containing lipoproteins. They find 49 hits with 19 compounds passing a higher level of scrutiny, and focus on the role of enoxolone in modulating B-Ip levels at least partly through the HNF4alpha transcription factor and, putatively, through downstream cholesterol/lipid biosynthetic pathways.

      Strengths:

      The study uses a well-validated in vivo stain (LipoGlo) for measuring lipoproteins in the context of a developing whole organism with a quantitative read-out on a high-throughput platform, allowing for screening of thousands of compounds altering the complex metabolic/physiologic functions necessary for lipoprotein production.

      The use of genetic mutant HNF4alpha to assign the mechanism of action to the prime candidate compound studied (enoxolone) is a powerful approach for this challenging aspect of chemical genetics studies. See caveats in weaknesses.

      Weaknesses:

      As shown in Figure 5A, the HNF4alpha mutant homozygous -/- already lowers lipoproteins. Is it just that the mutant level is already at a minimum in this homozygous mutant (and thus enoxolone can not induce even lower lipoprotein levels), or is it true that the enoxolone molecule is primarily acting through this TF (i.e. HNF4alpha homozygous mutant is truly epistatic to enoxolone function) as favored in the text.

      While it is definitely interesting to study enoxolone effects during whole embryo development, the link to HNF4alpha had previously been described in the literature, as pointed out by the authors. The generalizability of the approach to identify truly novel pathways remains to be fully realized, but sharing this available screen data to date will invite further inquiry and be very valuable to the community.

      Figure 5 - The same allele of HNF4alpha loss of function/hypomorph (rdu14) is used in both 5A and 5B, but labeled differently in each subpanel. This is explained in the figure legend, but could be updated to use the same nomenclature in both panels to clarify the Figure presentation.

    5. Author response:

      We would like to thank the editors and reviewers for their time and their helpful feedback. We largely agree with the reviewer recommendations and comments, which we will address for the next Version on Record of this manuscript. We plan to address reviewer comments in the following ways.

      Reviewers requested a more comprehensive analysis of our RNA-seq experiment comparing vehicle treatment to enoxolone treatment over time. We will improve our analysis by providing clear, accessible, and organized tables defining differentially expressed genes at each time point, gene set lists that comprise our gene ontology analysis, and the lists of shared differentially expressed genes from enoxolone treatment and HNF4⍺ knockout. While some of this data was provided in the supplementary files, we recognize that it should be more accessible for the reader. Furthermore, as suggested by the Reviewer, we will enhance our transcriptomic analysis by utilizing bioinformatic tools such as Enrichr.

      The Reviewers noted that we identified a number of lipoprotein-lowering compounds through our drug screen, but limited the impact of our manuscript by focusing on enoxolone, a known inhibitor of HNF4⍺ and modulator of lipid metabolism. While we understand with the sentiment that other novel compounds would be interesting to study, we aimed to demonstrate proof of concept in this manuscript. We view the characterization of novel compounds as beyond the direct scope of this manuscript. We did not perform LipoGlo imaging and electrophoresis experiments on each drug because these experiments are low-throughput given the number of drugs and doses we examined. In light of the Reviewer’s comments, we will add some additional characterizations of our validated hits with LipoGlo imaging and electrophoresis studies.

      The reviewers also identified a number of typos in text and figures that will be addressed in the next Version on Record. We believe that the recommended changes will strengthen our manuscript and broaden its appeal. We are grateful for the opportunity to improve our work based on the reviewers’ valuable suggestions.

    1. eLife Assessment

      This study provides useful information on the impact of Lamin A/C knockdown on gene expression using RNA-Seq analysis. In addition, the impact of Lamin A/C knockdown on telomere dynamics is explored using live cell imaging. The conclusions, however, are inadequately supported by the data presented. Weaknesses include excessive reliance on gene ontology analysis without further validation of direct versus indirect effects, use of only one shRNA, which may have off target effects, validation of knockdown only from gene expression rather than protein levels, lack of discussion on previous studies showing the presence of Lamin A/C in the nuclear interior among others.

    2. Reviewer #1 (Public review):

      This manuscript reports a descriptive study of changes in gene expression after knockdown of the nuclear envelope proteins lamin A/C and Nesprin2/SYNE2 in human U2OS cells. The readout is RNA-seq, which is analyzed at the level of gene ontology and focused investigation of isoform variants and non-coding RNAs. In addition, the mobility of telomeres is studied after these knockdowns, although the rationale in relation to the RNA-seq analyses is rather unclear.

      RNA-seq after knockdown of lamin proteins has been reported many times, and the current study does not provide significant new insights that help us to understand how lamins control gene expression. This is particularly because the vast majority of the observed effects on gene expression appear to occur in regions that are not bound by lamin A. It seems likely that these effects are indirect. There is also virtually no overlap between genes affected by laminA/C and by SYNE2, which remains unexplained; for example, it would be good to know whether laminA/C and SYNE2 bind to different genomic regions. The claim in the Title and Abstract that LMNA governs gene expression / acts through chromatin organization appears to be based only on an enrichment of gene ontology terms "DNA conformation change" and "covalent chromatin conformation" in the RNA-seq data. This is a gross over-interpretation, as no experimental data on chromatin conformation are shown in this study. The analyses of transcript isoform switching and ncRNA expression are potentially interesting but lack a mechanistic rationale: why and how would these nuclear envelope proteins regulate these aspects of RNA expression? The effects of lamin A on telomere movements have been reported before; the effects of SYNE2 on telomere mobility are novel (to my knowledge), but should be discussed in the light of previously documented effects of SUN1/2 on the dynamics of dysfunctional telomeres (Lottersberger et al, Cell 2015).

      As indicated below, I have substantial concerns about the experimental design of the knockdown experiments.

      Altogether, the results presented here are primarily descriptive and do not offer a significant advance in our understanding of the roles of LaminA and SYNE2 in gene regulation or chromatin biology, because the results remain unexplained mechanistically and functionally. Furthermore, the RNAseq datasets should be interpreted with caution until off-target effects of the shRNAs can be ruled out.

      Specific comments:

      (1) Knockdowns were only monitored by qPCR. Efficiency at the protein level (e.g., Western blots) needs to be determined.

      (2) For each knockdown, only a single shRNA was used. shRNAs are infamous for off-target effects; therefore, multiple shRNAs for each protein, or an alternative method such as CRISPR deletion or degron technology, must be tested to rule out such off-target effects.

      (3) It is not clear whether the replicate experiments are true biological replicates (i.e., done on different days) or simply parallel dishes of cells done in a single experiment (= technical replicates). The extremely small standard deviations in the RT-qPCR data suggest the latter, which would not be adequate.

    3. Reviewer #2 (Public review):

      Summary:

      This study focused on the roles of the nuclear envelope proteins lamin A and C, as well as nesprin-2, encoded by the LMNA and SYNE2 genes, respectively, on gene expression and chromatin mobility. It is motivated by the established role of lamins in tethering heterochromatin to the nuclear periphery in lamina-associated domains (LADs) and modulating chromatin organization. The authors show that depletion of lamin A, lamin A and C, or nesprin-2 results in differential effects of mRNA and lncRNA expression, primarily affecting genes outside established LADs. In addition, the authors used fluorescent dCas9 labeling of telomeric genomic regions combined with live-cell imaging to demonstrate that depletion of either lamin A, lamin A/C, or nesprin-2 increased the mobility of chromatin, suggesting an important role of lamins and nesprin-2 in chromatin dynamics.

      Strengths:

      The major strength of this study is the detailed characterization of changes in transcript levels and isoforms resulting from depletion of either lamin A, lamin A/C, or nesprin-2 in human osteosarcoma (U2OS) cells. The authors use a variety of advanced tools to demonstrate the effect of protein depletion on specific gene isoforms and to compare the effects on mRNA and lncRNA levels.

      The TIRF imaging of dCas9-labeled telomeres allows for high-resolution tracking of multiple telomeres per cell, thus enabling the authors to obtain detailed measurements of the mobility of telomeres within living cells and the effect of lamin A/C or nesprin-2 depletion.

      Weaknesses:

      Although the findings presented by the authors overall confirm existing knowledge about the ability of lamins A/C and nesprin to broadly affect gene expression, chromatin organization, and chromatin dynamics, the specific interpretation and the conclusions drawn from the data presented in this manuscript are limited by several technical and conceptual challenges.

      One major limitation is that the authors only assess the knockdown of their target genes on the mRNA level, where they observe reductions of around 70%. Given that lamins A and C have long half-lives, the effect at the protein level might be even lower. This incomplete and poorly characterized depletion on the protein level makes interpretation of the results difficult. The description for the shRNA targeting the LMNA gene encoding lamins A and C given by the authors is at times difficult to follow and might confuse some readers, as the authors do not clearly indicate which regions of the gene are targeted by the shRNA, and they do not make it obvious that lamin A and C result from alternative splicing of the same LMNA gene. Based on the shRNA sequences provided in the manuscript, one can conclude that the shLaminA shRNA targets the 3' UTR region of the LMNA gene specific to prelamin A (which undergoes posttranslational processing in the cell to yield lamin A). In contrast, the shRNA described by the authors as 'shLMNA' targets a region within the coding sequence of the LMNA gene that is common to both lamin A and C, i.e., the region corresponding to amino acids 122-129 (KKEGDLIA) of lamin A and C. The authors confirm the isoform-specific effect of the shLaminA isoform, although they seem somewhat surprised by it, but do not confirm the effect of the shLMNA construct. Assessing the effect of the knockdown on the protein level would provide more detailed information both on the extent of the actual protein depletion and the effect on specific lamin isoforms. Similarly, given that nesprin-2 has numerous isoforms resulting from alternative splicing and transcription initiation. In the current form of the manuscript, it remains unclear which specific nesprin-2 isoforms were depleted, and to what extent (on the protein level).

      Another substantial limitation of the manuscript is that the current analysis, with the exception of the chromatin mobility measurements, is exclusively based on transcriptomic measurements by RNA-seq and qRT-PCR, without any experimental validation of the predicted protein levels or proposed functional consequences. As such, conclusions about the importance of lamin A/C on RNA synthesis and other functions are derived entirely from gene ontology terms and are not sufficiently supported by experimental data. Thus, the true functional consequences of lamin A/C or nesprin depletion remain unclear. Statements included in the manuscript such as "our findings reveal that lamin A is essential for RNA synthesis, ..." (Lines 79-80) are thus either inaccurate or misleading, as the current data do not show that lamin A is ESSENTIAL for RNA synthesis, and lamin A/C and lamin A deficient cells and mice are viable, suggesting that they are capable of RNA synthesis.

      Another substantial weakness is that the data and analysis presented in the manuscript raise some concerns about the robustness of the findings. Given that the 'shLMNA' construct is expected to deplete both lamin A and C, i.e., its effect encompasses the depletion of lamin A, which is achieved by the 'shLaminA' construct, one would expect a substantial overlap between the DEGs in the shLMNA and shLaminA conditions, with the shLMNA depletion producing a broader effect as it targets both lamin A and C. However, the Venn Diagram in Figure 4a, the genomic loci distribution in Figure 4b, and the correlation analysis in Supplementary Figure S2 show little overlap between the shLMNA and shLaminA conditions, which is quite surprising. In the mapping of the DEGs shown in Figure 4b, it is also surprising not to see the gene targeted by the shRNA, LMNA, found on chromosome 1, in the results for the shLMNA and shLamin A depletion.

      The correlation analysis in Supplementary Figure S2 raises further questions. The authors use doc-inducible shRNA constructs to target lamin A (shLaminA), lamin A/C (shLMNA), or nesprin-2 (shSYNE2). Thus, the no-dox control (Ctr) for each of these constructs would be expected to be very similar to the non-target scrambled controls (Ctrl.shScramble and Dox.shScramble). However, in the correlation matrix, each of the no-dox controls clusters more closely with the corresponding dox-induced shRNA condition than with the Ctrl.shScramble or Dox.shScramble conditions, suggesting either a very leaky dox-inducible system, strong effects from clonal selection, or substantial batch effects in the processing. Either of these scenarios could substantially affect the interpretation of the findings. For example, differences between different clonal cell lines used for the studies, independent of the targeted gene, could explain the limited overlap between the different shRNA constructs and result in apparent differences when comparing these clones to the scrambled controls, which were derived from different clones.

      The manuscript also contains several factually inaccurate or incorrect statements or depictions. For example, the depiction of the nuclear envelope in Figure 1 shows a single bilipid layer, instead of the actual double bi-lipid layer of the inner and outer nuclear membranes that span the nuclear lumen. The depiction further lacks SUN domain proteins, which, together with nesprins, form the LINC complex essential to transmit forces across the nuclear envelope. The statement in line 214 that "Linker of nucleoskeleton and cytoskeleton (LINC) complex component nesprin-2 locates in the nuclear envelope to link the actin cytoskeleton and the nuclear lamina" is not quite accurate, as nesprin-2 also links to microtubules via dynein and kinesin.

      The statement that "Our data show that Lamin A knockdown specifically reduced the usage of its primary isoform, suggesting a potential role in chromatin architecture regulation, while other LMNA isoforms remained unaffected, highlighting a selective effect" (lines 407-409) is confusing, as the 'shLaminA' shRNA specifically targets the 3' UTR of lamin A that is not present in the other isoforms. Thus, the observed effect is entirely consistent with the shRNA-mediated depletion, independent of any effects on chromatin architecture.

      The premise of the authors that lamins would only affect peripheral chromatin and genes at LADs neglects the fact that lamins A and C are also found in the nuclear interior, where they form stable structure and influence chromatin organization, and the fact that lamins A and C and nesprins additionally interact with numerous transcriptional regulators such as Rb, c-Fos, and beta-catenins, which could further modulate gene expression when lamins or nesprins are depleted.

      The comparison of the identified DEGs to genes contained in LADs might be confounded by the fact that the authors relied on the identification of LADs from a previous study (ref #28), which used a different human cell type (human skin fibroblasts) instead of the U2OS osteosarcoma cells used in the present study. As LADs are often highly cell-type specific, the use of the fibroblast data set could lead to substantial differences in LADs.

      Another limitation of the current manuscript is that, in the current form, some of the figures and results depicted in the figures are difficult to interpret for a reader not deeply familiar with the techniques, based in part on the insufficient labeling and figure legends. This applies, for example, to the isoform use analysis shown in Figure 3d or the GenometriCorr analysis quantifying spatial distance between LADs and DEGs shown in Figure 4c.

      Overall appraisal and context:

      Despite its limitations, the present study further illustrates the important roles the nuclear envelope proteins lamin A, lamin C, and nesprin-2 have in chromatin organization, dynamics, and gene expression. It thus confirms results from previous studies (not always fully acknowledged in the current manuscript) previously reported for lamin A/C depletion. For example, the effect of lamin A/C depletion on increasing mobility of chromatin had already been demonstrated by several other groups, such as Bronshtein et al. Nature Comm 2015 (PMID: 26299252) and Ranade et al. BMC Mol Cel Biol 2019 (PMID: 31117946). Additionally, the effect of lamin A/C depletion on gene and protein expression has already been extensively studied in a variety of other cell lines and model systems, including detailed proteomic studies (PMIDs 23990565 and 35896617).

      The finding that that lamin A/C or nesprin depletion not only affects genes at the nuclear periphery but also the nuclear interior is not particularly surprising giving the previous studies and the fact that lamins A and C are also founding within the nuclear interior, where they affect chromatin organization and dynamics, and that lamins A/C and nesprins directly interact with numerous transcriptional regulators that could further affect gene expression independent from their role in chromatin organization.

      The authors provide a detailed analysis of isoform switching in response to lamin A/C or nesprin depletion, but the underlying mechanism remains unclear. Similarly, their analysis of the genomic location of the observed DEGs shows the wide-ranging effects of lamin A/C or nesprin depletion, but lets the reader wonder how these effects are mediated. A more in-depth analysis of predicted regulator factors and their potential interaction with lamins A/C or nesprin would be beneficial in gaining more mechanistic insights.

    4. Reviewer #3 (Public review):

      Summary:

      This manuscript describes DOX inducible RNAi KD of Lamin A, LMNA coded isoforms as a group, and the LINC component SYNE2. The authors report on differentially expressed genes, on differentially expressed isoforms, on the large numbers of differentially expressed genes that are in iLADs rather than LADs, and on telomere mobility changes induced by 2 of the 3 knockdowns.

      Strengths:

      Overall, the manuscript might be useful as a description for reference data sets that could be of value to the community.

      Weaknesses:

      The results are presented as a type of data description without formulation of models or explanations of the questions being asked and without follow-up. Thus, conceptually, the manuscript doesn't appear to break new ground.

      Not discussed is the previous extensive work by others on the nucleoplasmic forms of LMNA isoforms. Also not discussed are similar experiments- for instance, gene expression changes others have seen after lamin A knockdowns or knockouts, or the effect of lamina on chromatin mobility, including telomere mobility - see, for example, a review by Roland Foisner (doi.org/10.1242/jcs.203430) on nucleoplasmic lamina. The authors need to do a thorough search of the literature and compare their results as much as possible with previous work.

      The authors don't seem to make any attempt to explore the correlation of their findings with any of the previous data or correlate their observed differential gene expression with other epigenetic and chromatin features. There is no attempt to explore the direction of changes in gene expression with changes in nuclear positioning or to ask whether the genes affected are those that interact with nucleoplasmic pools of LMNA isoforms. The authors speculate that the DEG might be related to changing mechanical properties of the cells, but do not develop that further.

      The technical concerns include: 1) Use of only one shRNA per target. Use of additional shRNAs would have reduced concern about possible off-target knockdown of other genes; 2) Use of only one cell clone per inducible shRNA construct. Here, the concern is that some of the observed changes with shRNA KDs might show clonal effects, particularly given that the cell line used is aneuploid. 3) Use of a single, "scrambled" control shRNA rather than a true scrambled shRNA for each target shRNA.

    1. eLife Assessment

      This study reveals that PRMT1 overexpression drives tumorigenesis of acute megakaryocytic leukemia (AMKL) and that targeting PRMT1 is a viable approach for treating AMKL. After revision, both reviewers found that these findings are important and that the data supporting these findings are convincing. Furthermore, these findings likely have significant implications for the treatment of AMKL with PRMT1 overexpression in the future.

    2. Reviewer #1 (Public review):

      Summary:

      PRMT1 overexpression is linked to poor survival in cancers, including acute megakaryocytic leukemia (AMKL). This manuscript describes the important role of PRMT1 in the metabolic reprograming in AMKL. In a PRMT1-driven AMKL model, only cells with high PRMT1 expression induced leukemia, which was effectively treated with the PRMT1 inhibitor MS023. PRMT1 increased glycolysis, leading to elevated glucose consumption, lactic acid accumulation, and lipid buildup while downregulating CPT1A, a key regulator of fatty acid oxidation. Treatment with 2-deoxy-glucose (2-DG) delayed leukemia progression and induced cell differentiation, while CPT1A overexpression rescued cell proliferation under glucose deprivation. Thus, PRMT1 enhances AMKL cell proliferation by promoting glycolysis and suppressing fatty acid oxidation.

      Strengths:

      This study highlights the clinical relevance of PRMT1 overexpression with AMKL, identifying it as a promising therapeutic target. A key novel finding is the discovery that only AMKL cells with high PRMT1 expression drive leukemogenesis, and this PRMT1-driven leukemia can be effectively treated with the PRMT1 inhibitor MS023. The work provides significant metabolic insights, showing that PRMT1 enhances glycolysis, suppresses fatty acid oxidation, downregulates CPT1A, and promotes lipid accumulation, which collectively drive leukemia cell proliferation. The successful use of the glucose analogue 2-deoxy-glucose (2-DG) to delay AMKL progression and induce cell differentiation underscores the therapeutic potential of targeting PRMT1-related metabolic pathways. Furthermore, the rescue experiment with ectopic Cpt1a expression strengthens the mechanistic link between PRMT1 and metabolic reprogramming. The study employs robust methodologies, including Seahorse analysis, metabolomics, FACS analysis, and in vivo transplantation models, providing comprehensive and well-supported findings. Overall, this work not only deepens our understanding of PRMT1's role in leukemia progression but also opens new avenues for targeting metabolic pathways in cancer therapy.

      Comments on revisions:

      The reviewer's questions were adequately addressed.

    3. Reviewer #2 (Public review):

      Summary:

      The manuscript explores the role of PRMT1 in AMKL, highlighting its overexpression as a driver of metabolic reprogramming. PRMT1 overexpression enhances the glycolytic phenotype and extracellular acidification by increasing lactate production in AMKL cells. Treatment with the PRMT1 inhibitor MS023 significantly reduces AMKL cell viability and improves survival in tumor-bearing mice. Intriguingly, PRMT1 overexpression also increases mitochondrial number and mtDNA content. High PRMT1-expressing cells demonstrate the ability to utilize alternative energy sources dependent on mitochondrial energetics, in contrast to parental cells with lower PRMT1 levels.

      Strengths:

      This is a conceptually novel and important finding as PRMT1 has never been shown to enhance glycolysis in AMKL, and provides a novel point of therapeutic intervention for AMKL.

      Comments on revisions:

      The author has responded satisfactorily to the review comments and revised the manuscript accordingly.

    4. Author response:

      The following is the authors’ response to the original reviews

      Reviewer #1:

      We thank the reviewer for highlighting the strength in our manuscript  as quote: “Overall, this work not only deepens our understanding of PRMT1's role in leukemia progression but also opens new avenues for targeting metabolic pathways in cancer therapy.”

      Weakness :

      (1) The findings rely heavily on a single AMKL cell line, with no validation in patient-derived samples to confirm clinical relevance or even another type of leukemia line. Adding the discussion of PRMT1's role in other leukemia types will increase the impact of this work.

      We mentioned in the introduction that PRMT1 is known to be the driver for leukemia with diverse types of mutations. In a related paper published in Cell Reports (Su et al. 2021), we demonstrated that PRMT1 is upregulated in MDS myeloid dysplasia syndrome patient samples and that the inhibition of PRMT1 promotes megakaryocytic differentiation of a few MDS samples. AMKL is very rare. Via Children’s Oncology group consortium, we have obtained five AMKL samples with Down’s syndrome and AMKL with RBM15-MKL1 translocation out of 32 samples in the bank over the last 20 years. Interestingly, these patient samples also contain trisomy 19. As PRMT1 is localized on chromosome 19, we speculate that PRMT1 is the significant driver for AMKL leukemia, although we have very limited genetic evidence. However, these human frozen samples derived from peripheral blood cannot be grown in a cell culture system. Although we did not perform metabolic analysis for other AMKL cell lines, we did validate in our unpublished studies that PRMT1 drives down CPT1A expression in normal bone marrow cells and platelets in mice and in human leukemia cell line called MEG-01, which can be differentiated into megakaryocytes upon PMA (phorbol 12-myristate 13-acetate) treatment. Therefore, we expect that the PRMT1-mediated metabolic reprogramming we described here should apply to other types of hematological malignancies.

      (2) The observed heterogeneity in Prmt1 expression is noted but not further investigated, leaving gaps in understanding its broader implications.

      The expression level of PRMT1 is heterogeneous within leukemia cell populations, making it intriguing to study. We can sort the cells based on high versus low PRMT1 expression using a fluorescent dye called E84. However, we have not conducted transcriptome analysis on these two populations, mainly due to resource constraints. Theoretically, the E84 high-expression population may transiently utilize glucose more efficiently, as these cells do not ectopically express PRMT1. Therefore, when nutrient levels decline, these cells might switch to the low PRMT1 expression population. It will be interesting to see whether endogenous leukemia cells transiently expressing high levels of PRMT1 take advantage of their efficient usage of glucose and thus adapt to the niche environment successfully, as we observed in the Figure 1. I agree that this would be an interesting direction to pursue in the future.

      (3) Some figures and figure legends didn't include important details or had not matching information.

      We would like to thank the reviewer for pointing out these mistakes. Now we have corrected.

      (4) Some wording is not accurate, such as line 80 "the elevated level of PRMT1 maintains the leukemic stem cells", the study is using the cell line, not leukemia stem cells.

      Leukemic stem cells are often referred to as cells that can initiate leukemia when transplanted into recipient mice, a concept first proposed by John Dick. In this study, we found that even the 6133 cell line displays heterogeneity in terms of PRMT1 expression levels. We identified a subgroup of 6133 cells as leukemia stem cells due to their ability to initiate leukemia.

      (5) In the disease model, histopathology of blood, spleen, and BM should be shown.

      We did not conduct histopathology analysis. 6133 cells associated histopathology has been published in Mercher et al JCI 2009 and a recent preprint by Diane Krause’s group.

      (6) Can MS023 treatment reverse the metabolic changes in PRMT1 overexpression AMKL cells?

      Yes, We demonstrated in figure 4 in the seahorse assays that prmt1 inhibitor can increase the oxygen consumption.

      It would be helpful to provide a summary graph at the end of the manuscript.

      Yes, we now provide a graphic abstract.

      Reviewer #2 (Public review):

      We would like to thank the reviewer for finding the manuscript novel and important.

      Weaknesses:

      (1) The manuscript lacks detailed molecular mechanisms underlying PRMT1 overexpression, particularly its role in enhancing survival and metabolic reprogramming via upregulated glycolysis and diminished oxidative phosphorylation (OxPhos). The findings primarily report phenomena without exploring the reasons behind these changes.

      In the introduction, we highlighted that numerous studies have demonstrated how PMT1 directly interacts with several key enzymes involved in glycolysis. These studies provide a mechanism for the observed upregulation of PMT1 in leukemia. Additionally, our previous research published in eLife 2015 {Zhang, 2015 #5031} demonstrated that PRMT1 methylates the RNA-binding protein RBM15, which can bind to the 3' UTR of mRNAs encoding various metabolic enzymes. Therefore, we propose that PMT1 may also regulate metabolism indirectly through the RBM15 protein.

      (2) The article shows that PRMT1 overexpression leads to augmented glycolysis and low reliance on the OxPhos. However, the manuscript also shows that PMRT1 overexpression leads to increased mitochondrial number and mitochondrial DNA content and has an elevated NADPH/NAD+ ratio. Further, these overexpressing cells have the ability to better survive on alternative energy sources in the absence of glucose compared to low PMRT1-expressing parental cells. Surprisingly, the seashores assay in PRMT1 overexpressing cells showed no further enhancement in the ECAR after adding mitochondrial decoupler FCCP, indicating the truncated mitochondrial energetics. These results are contradicting and need a more detailed explanation in the discussion.

      We have explained the metabolic changes in more detail now. Increasing mitochondria number is not equivalent to increasing fatty acid oxidation and oxygen consumption, as the mitochondria have many other functions. PRMT1 only downregulates CPT1A, which is a rate-limiting step for long-chain fatty acid oxidation. The data suggest that PRMT1 promotes the biogenesis of mitochondria maybe via PGC1alpha as published by Stallcup’s group. The seahorse assays were performed in the high concentration of glucose instead of alternative carbon sources.  FCCP treatment under high glucose conditions did not increase the ECR and OCR, which is normal for leukemia cells as shown in other people’s publications {Sriskanthadevan, 2015 #3944}{Kreitz, 2019 #2133}. PRMT1 could dampen the activities of TCA cycle and the electron transportation chain as the proteomic data from our unpublished data and published data {Fong, 2019 #1185} suggested. The elevated NADPH/NAD+ ratio is another indication that glycolysis and anabolism are enhanced by PRMT1.

      (3) How was disease penetrance established following the 6133/PRMT1 transplant before MS023 treatment?

      Yes, the data was in figure 1f, demonstrating that the penetrance is 100%.  

      (4) The 6133/PRMT1 cells show elevated glycolysis compared to parental 6133; why did the author choose the 6133 cells for treatment with the MS023 and ECAR assay (Fig.3 b)? The same is confusing with OCR after inhibitor treatment in 6133 cells; the figure legend and results section description are inconsistent.

      Sorry for the mistakes while we are preparing the manuscript.  We used 6133/PRMT1 cells to be treated with MS023 in figure 4.

      (5) The discussion is too brief and incoherent and does not adequately address key findings. A comprehensive rewrite is necessary to improve coherence and depth.

      We agree with the reviewer. Now we added comprehensive review of PRMT1-mediated metabolism. The PRMT1 homolgous in yeast is called hmt1. In yeast, hmt1 is upregulated by glucose and enhance glycolysis. So PRMT1 enhanced glycolysis is a conserved pathway in eukaryocytic cells.

      (6) The materials and methods section lacks a description of statistical analysis, and significance is not indicated in several figures (e.g., Figures 1C, D, F; Figures 2D, E, F, I). Statistical significance must be consistently indicated. The methods section requires more detailed descriptions to enable replication of the study's findings.

      We have added extra details on the methods and statistical analysis for the figures.

      (7) Figures are hazy and unclear. They should be replaced with high-resolution images, ensuring legible text and data.

      We have prepared separate figure files with high resolution.

      (8) Correct the labeling in Figure 2I by removing the redundant "D."

      We would like to thank the reviewer and fixed the figure.

    1. eLife Assessment

      This study presents valuable findings on the regulation of survival and maintenance of brain-resident immune cells called microglia. Using compelling and sophisticated genetic tools, the authors demonstrate a gene dosage-dependent mechanism using which microglia are eliminated. This research on cell competition and survival will be of broad interest to the cell biology community.

    2. Reviewer #1 (Public review):

      Summary:<br /> The article entitled "Pu.1/Spi1 dosage controls the turnover and maintenance of microglia in zebrafish and mammals" by Wu et al., identifies a role for the master myeloid developmental regulator Pu.1 in the maintenance of microglial populations in the adult. Using a non-homologous end joining knock-in strategy, the authors generated a pu.1 conditional allele in zebrafish, which reports wildtype expression of pu.1 with EGFP and truncated expression of pu.1 with DsRed after Cre mediated recombination. When crossed to existing pu.1 and spi-b mutants, this approach allowed the authors to target a single allele for recombination and induce homozygous loss-of-function microglia in adults. This identified that although there is no short-term consequence to loss of pu.1, microglia lacking any functional copy of pu.1 are depleted over the course of months, even when spi-b is fully functional. The authors go on to identify reduced proliferation, increased cell death, and higher expression of tp53 in the pu.1 deficient microglia, as compared to the wildtype EGFP+ microglia. To extend these findings to mammals, the authors generated a conditional Pu.1 allele in mice and performed similar analyses, finding that loss of a single copy of Pu.1 resulted in similar long-term loss of Pu.1-deficient microglia. The conclusions of this paper are overall well supported by the data.

      Strengths:<br /> The genetic approaches here for visualizing recombination status of an endogenous allele are very clever, and by comparing the turnover of wildtype and mutant cells in the same animal the authors can make very convincing arguments about the effect of chronic loss of pu.1. Likely this phenotype would be either very subtle or non-existent without the point of comparison and competition with the wildtype cells.

      Using multiple species allows for more generalizable results, and shows conservation of the phenomena at play.

      The demonstration of changes to proliferation and cell death in concert with higher expression of tp53 is compelling evidence for the authors argument.

      Weaknesses:<br /> This paper is very strong. It would benefit from further investigating the specific relationship between pu.1 and tp53 specifically. Does pu.1 interact with the tp53 locus? Specific molecular analysis of this interaction would strengthen the mechanistic findings.<br /> Recommendations for the authors It would be useful to investigate the relationship between pu.1 and tp53. The data presented here show that pu.1 deficient cells have higher expression of tp53, but this could be an indirect effect. However, since pu.1 has known DNA binding motifs, it would be worthwhile to investigate if there are any direct interactions between pu.1 and the tp53 locus -- does pu.1 directly bind and repress tp53 expression? This could be directly investigated with Cut & Run or an EMSA.

      The paper would likely also benefit from more in-depth discussion of the relationship of the zebrafish alleles and their relationship to mammalian Pu.1 -- as presented here, the authors are implicitly arguing that zebrafish pu.1 and spi-b are both more closely related to mammalian Pu.1 than to mammalian Spi-b. Clear argument, perhaps backed up by sequence alignment and homology matching, would help readers, especially those less familiar with zebrafish genome duplications.

      Comments on Revised Version (from BRE):

      The authors performed in silico analyses to support a regulatory relationship between Pu.1 and Tp53. They identified three putative Pu.1 binding sites within the zebrafish tp53 promoter region. Furthermore, they cite prior evidence demonstrating a similar interaction between PU.1 and members of the P53 family through direct DNA binding.

    3. Reviewer #2 (Public review):

      Summary:<br /> In the presented work by Wu et al. the authors investigate the role of the transcription factor Pu.1 in the survival and maintenance of microglia, the tissue resident macrophage population in the brain. To this end they generated a sophisticated new conditional pu.1 allele in zebrafish using CRISPR mediated genome editing which allows visual detection of expression of the mutant allele through a switch from GFP to dsRed after Cre-mediated recombination. Using EdU pulse-chase labelling, they first estimate the daily turnover rate of microglia in the adult zebrafish brain which was found to be higher than rates previously estimated for mice and humans. After conditional deletion of pu.1 in coro1a positive cells, they do not find a difference in microglia number at 2 and 8 days or 1 month post injection of Tamoxifen. However, at 3 month post injection, a strong decrease in mutant microglia could be detected. While no change in microglia number was detected at 1mpi, an increase in apoptotic cells and decreased proliferation as observed. RNA-seq analysis of WT and mutant microglia revealed an upregulation of tp53, which was shown to play a role in the depletion of pu.1 mutant microglia as deletion in tp53-/- mutants did not lead to a decrease in microglia number at 3mpi. Through analysis of microglia number in pU.1 mutants, the authors further show that the depletion of microglia in the conditional mutants is dependent on the presence of WT microglia. To show that the phenomenon is conserved between species, similar experiments were also performed in mice.

      This work expands on previous in vitro studies using primary human microglia. The majority of conclusions are well supported by the data, addition of controls and experimental details would strengthen the conclusions and rigor of the paper.

      Strengths:

      Generation of an elegantly designed conditional pu.1 allele in zebrafish that allows for the visual detection of expression of the knockout allele.<br /> The combination of analysis of pu.1 function in two model systems, zebrafish and mouse, strengthens the conclusions of the paper.<br /> Confirmation of the functional significance of the observed upregulation of tp53 in mutant microglia through double mutant analysis provides some mechanistic insight.

      Weaknesses:

      (1) The presented RNA-Seq analysis of mutant microglia is underpowered and details on how the data was analyzed is missing. Only 9-15 cells were analyzed in total (3 pools of 3-5 cells each). Further the variability in relative gene expression of ccl35b.1, which was used as a quality control and inclusion criterion to define pools consisting of microglia, is extremely high (between ~4 and ~1600, Fig. S7A).

      (2) The authors conclude that the reduction of microglia observed in the adult brain after cKO of pu.1 in the spi-b mutant background is due to apoptosis (Lines 213-215). However, they only provide evidence of apoptosis in 3-5 dpf embryos, a stage at which loss of pu.1 alone does lead to a complete loss of microglia (Fig.2E). A control of pu.1 KI/d839 mutants treated with 4-OHT should be added to show that this effect is indeed dependent on the loss of spi-b. In addition, experiments should be performed to show apoptosis in the adult brain after cKO of pu.1 in spi-b mutants as there seems to be a difference in requirement of pu.1 in embryonic and adult stages.

      Comments on Revised Version (from BRE):

      The authors have elaborated on the details of the RNA-Seq procedure and clarified the distinct phenotypes observed with global versus condition pu.1 knockout. In addition, the authors' proposed collaborative relationship between Pu.1 and Spi-b has been expanded in the revised manuscript. The authors have addressed all the minor concerns raised by the reviewer.

    4. Author response:

      The following is the authors’ response to the original reviews

      Reviewer #1 (Public review):

      Strengths:

      The genetic approaches here for visualizing the recombination status of an endogenous allele are very clever, and by comparing the turnover of wildtype and mutant cells in the same animal the authors can make very convincing arguments about the effect of chronic loss of pu.1. Likely this phenotype would be either very subtle or nonexistent without the point of comparison and competition with the wildtype cells.

      Using multiple species allows for more generalizable results, and shows conservation of the phenomena at play.

      The demonstration of changes to proliferation and cell death in concert with higher expression of tp53 is compelling evidence for the authors' argument.

      Weaknesses:

      This paper is very strong. It would benefit from further investigating the specific relationship between pu.1 and tp53 specifically. Does pu.1 interact with the tp53 locus? Specific molecular analysis of this interaction would strengthen the mechanistic findings.

      We agree with the reviewer’s assessment regarding the significance of the relationship between PU.1 and TP53. To investigate the potential interaction between Pu.1 and Tp53 in zebrafish, we analyzed the promoter region of zebrafish tp53. Indeed, we found three PU.1 binding sites (GAGGAA) on tp53 promoter, which locate on the antisense strand from position -1047 to -1042, -1098 to -1093 and -1423 to -1418 relative to the transcriptional start site (Fig. S10). These potential Pu.1 binding sites indicate a direct interaction between Pu.1 and tp53 locus. Furthermore, a previous study by Tschan et al. (2008) elucidated the mechanism by which PU.1 attenuates the transcriptional activity of the P53 tumor suppressor family through direct binding to the DNA-binding and/or oligomerization domains of p53/p73 proteins. We have also cited this study (Line 399-401) and included all above information in the discussion of the revised manuscript (Line 399-405).

      Reviewer #2 (Public review):

      Strengths:

      Generation of an elegantly designed conditional pu.1 allele in zebrafish that allows for the visual detection of expression of the knockout allele.

      The combination of analysis of pu.1 function in two model systems, zebrafish and mouse, strengthens the conclusions of the paper.

      Confirmation of the functional significance of the observed upregulation of tp53 in mutant microglia through double mutant analysis provides some mechanistic insight.

      Weaknesses:

      (1) The presented RNA-Seq analysis of mutant microglia is underpowered and details on how the data was analyzed are missing. Only 9-15 cells were analyzed in total (3 pools of 3-5 cells each). Further, the variability in relative gene expression of ccl35b.1, which was used as a quality control and inclusion criterion to define pools consisting of microglia, is extremely high (between ~4 and ~1600, Figure S7A).

      We feel sorry for the unclearness of RNAseq procedures and have accordingly added the details about RNA-seq data analysis in the “Material and methods” section (Line 491-501). Briefly, reads were aligned to the zebrafish genome using the STAR package. Original counts were calculated with featureCounts package. Differential expression genes (DEGs) were identified with the DESeq2 package. Owing to the technical challenge of unambiguously distinguishing microglia from dendritic cells (DCs) in brain cell suspensions, we employed a strategy of isolating 3-5 cells per pool and quantifying the relative expression of the microglia-specific marker ccl34b.1 normalized to the DC-specific marker ccl19a.1. This approach aimed to reduce DC contamination in downstream analyses. Across all experimental groups subjected to RNA-seq analysis, the ccl34b.1/ccl19a.1 expression ratios exceeded 5, confirming microglia as the dominant cell population. Nonetheless, residual DC contamination in the RNA-seq data cannot be entirely ruled out. We have discussed this technical constraint in the revised manuscript to ensure methodological transparency (Line 498-501).

      (2) The authors conclude that the reduction of microglia observed in the adult brain after cKO of pu.1 in the spi-b mutant background is due to apoptosis (Lines 213-215). However, they only provide evidence of apoptosis in 3-5 dpf embryos, a stage at which loss of pu.1 alone does lead to a complete loss of microglia (Figure 2E). A control of pu.1 KI/d839 mutants treated with 4-OHT should be added to show that this effect is indeed dependent on the loss of spi-b. In addition, experiments should be performed to show apoptosis in the adult brain after cKO of pu.1 in spi-b mutants as there seems to be a difference in the requirement of pu.1 in embryonic and adult stages.

      We apologize for the omission of data regarding conditional pu.1 knockout alone in the embryos in our manuscript, which may have led to ambiguity. We would like to clarify that conditional pu.1 knockout alone at the embryonic stage does not induce microglial death (Fig S2). Microglial death occurs only in both embryonic and adult brains when Pu.1 is disrupted in the spi-b mutant background. The blebbing morphology of some microglia after pu.1 conditional knockout in adult spi-b mutant indicated microglia undergo apoptosis at both embryonic and adult stages (Figure S4 and Fig. S5). The reviewer’s concern likely arises from the distinct outcomes of global pu.1 knockout (Fig. 2) versus conditional pu.1 ablation (Fig. S2). Global knockout eliminates microglia during early development due to Pu.1’s essential role in myeloid lineage specification. We have included this clarification in the revised manuscript (Line 208-211).

      (3) The number of microglia after pu.1 knockout in zebrafish did only show a significant decrease 3 months after 4-OHT injection, whereas microglia were almost completely depleted already 7 days after injection in mice. This major difference is not discussed in the paper.

      We propose that zebrafish Pu.1 and Spi-b function cooperatively to regulate microglial maintenance, analogous to the role of PU.1 alone in mice. This cooperative mechanism likely explains the observed difference in microglial depletion kinetics between zebrafish and mice following pu.1 conditional knockout. Specifically, the compensatory activity of Spi-b in zebrafish may buffer the immediate loss of Pu.1, whereas in mice, the absence of Spi-b expression in microglia eliminates this redundancy, resulting in rapid microglial depletion. Furthermore, during evolution, SPI-B appears to have acquired lineage-specific roles, becoming absent in microglia. We have included the clarification in the revised manuscript (Line 302-305).

      (4) Data is represented as mean +/-.SEM. Instead of SEM, standard deviation should be shown in all graphs to show the variability of the data. This is especially important for all graphs where individual data points are not shown. It should also be stated in the figure legend if SEM or SD is shown

      We have represented our data as mean ± SD in the revised manuscript.

      Recommendations for the authors:

      Reviewing Editor:

      To further strengthen the manuscript, we ask the authors to address the reviewers' comments through additional experiments where necessary. In cases where certain experiments may be challenging, we encourage the authors to address these concerns within the text, such as by referencing any prior evidence of pu.1 and tp53 interactions or incorporating in silico analyses that support such interaction.

      As suggested, we have performed in-silico analysis of Pu.1 binding sites in zebrafish tp53 promoter and also cited previous paper showing how PU.1 attenuates the transcriptional activity of the P53 tumor suppressor family (Line 399-405).

      Reviewer #1 (Recommendations for the authors):

      It would be useful to investigate the relationship between pu.1 and tp53. The data presented here show that pu.1 deficient cells have higher expression of tp53, but this could be an indirect effect. However, since pu.1 has known DNA binding motifs, it would be worthwhile to investigate if there are any direct interactions between pu.1 and the tp53 locus -- does pu.1 directly bind and repress tp53 expression? This could be directly investigated with Cut & Run or an EMSA.

      The interaction between Pu.1 and Tp53 has been discussed in the public review section.

      The paper would likely also benefit from a more in-depth discussion of the relationship of the zebrafish alleles and their relationship to mammalian Pu.1 -- as presented here, the authors are implicitly arguing that zebrafish pu.1 and spi-b are both more closely related to mammalian Pu.1 than to mammalian Spi-b. A clear argument, perhaps backed up by sequence alignment and homology matching, would help readers, especially those less familiar with zebrafish genome duplications.

      We have conducted detailed sequence alignment in our previous work (Yu et al., 2017, Blood) and found zebrafish Spi-b shares the highest similarity with the mammalian SPI-B among Ets family transcription factors in zebrafish. A unique P/S/T-rich region known to be essential for mammalian SPI-B transactivation activity is present in zebrafish Spi-b. Our data do not support the interpretation that Spi-b is more closely related to mammalian Pu.1 than to Spi-b. Instead, functional compensation between pu.1 and spi-b in microglia maintenance likely reflects their shared role as Ets-family transcriptional regulators, rather than ortholog-driven redundancy.

      Reviewer #2 (Recommendations for the authors):

      (1) The nomenclature of the genes in the SPI family in zebrafish is somewhat confusing as genes were renamed several times. It would make it easier for the reader to understand if in the abstract and the main text, spi-b would be referred to as the zebrafish orthologue of mouse SPI-B (as determined by the authors in previous work) rather than the paralogue of zebrafish pu.1. To clarify which genes were analyzed in both zebrafish and mouse, Gene accession numbers should be added.

      Thanks for the recommendations. We have changed “the paralogue of zebrafish pu.1” to “the orthologue of mouse Spi-b” in the abstract (Line 22) and added gene accession numbers for both zebrafish and mouse gene (Line 105-106 and 301-302).

      (2) Methods RNA-seq: Details on how the aligned reads were analyzed to detect differentially expressed genes are missing and should be added. In addition, a table with read counts, fold changes and adjusted p values should be added.

      We have added details of RNA-seq analysis in the Material and Methods part (Line 491-501). A table generated by Deseq2 has been included as a supplemental file to show read counts, fold changes and adjusted p values (Supplemental file 2).

      (3) Figure 2H: It would be helpful to the reader if the KO splicing would be shown in comparison to WT splicing.

      Thank you for your suggestion. We have added the sequence result between exon 3 and exon 4 of pu.1 from wildtype cDNA to show WT splicing in Figure 2H.

      (4) Legend Figure 5C. Relative expression should be replaced with transcripts per million (TPM).

      We have corrected it in the figure legend of Figure 5C (Line 786-787).

      (5) In Figure S3. the label on the y-axis in panel B is not visible.

      We apologize for the mistake during figures assembling. We have corrected it and now the y-axis is visible.

      (6) In Figure S7B an explanation for the colors in the heat map is missing and should be added.

      Colors represent scaled TPM values. The red color represents high expression while the blue color represents low expression. We have added the information in the figure legend.

      (7) A justification for the use of male mice only should be added or additional experiments in female mice should be performed.

      Female mice were excluded to avoid variability associated with estrous cycle-dependent hormonal changes, which are known to influence microglial behavior (Habib P et al., 2015). We have added a justification in the revised manuscript (Line 547-548).

      (8) The manuscript would benefit from some language editing. A few examples are listed below:

      a) line 97: the rostral blood (RBI) should read the rostral blood island.

      b) line 373 typo: nucleus translocation should read nuclear translocation.

      c) line 393 typo: pu.1-dificent should read pu.1-deficient.

      We apologize for the typos or grammar mistakes in the manuscript. We have checked the manuscript thoroughly and revised those typos or grammar mistakes.

      Reference:

      Tschan MP, Reddy VA, Ress A, Arvidsson G, Fey MF, Torbett BE (2008) PU.1 binding to the p53 family of tumor suppressors impairs their transcriptional activity. Oncogene 27: 3489-93

      Yu T, Guo W, Tian Y, Xu J, Chen J, Li L, Wen Z (2017) Distinct regulatory networks control the development of macrophages of different origins in zebrafish. Blood 129: 509-519

      Habib P, Beyer C (2015) Regulation of brain microglia by female gonadal steroids. J Steroid Biochem Mol Biol 146: 3-14