10,000 Matching Annotations
  1. May 2025
    1. Reviewer #1 (Public review):

      Summary:

      In this manuscript, the authors used a leucine/pantothenate auxotrophic strain of Mtb to screen a library of FDA-approved compounds for their antimycobacterial activity and found significant antibacterial activity of the inhibitor semapimod. In addition to alterations in pathways, including amino acid and lipid metabolism and transcriptional machinery, the authors demonstrate that semapimod treatment targets leucine uptake in Mtb. The work presents an interesting connection between nutrient uptake and cell wall composition in mycobacteria.

      Strengths:

      (1) The link between the leucine uptake pathway and PDIM is interesting but has not been characterized mechanistically. The authors discuss that PDIM presents a barrier to the uptake of nutrients and shows binding of the drug with PpsB. However it is unclear why only the leucine uptake pathway was affected. We still do not know what PpsB actually does for amino acid uptake - is it a transporter? Does semapimod binding affect its activity? Does the auxotrophic Mtb have lower PDIM levels compared to wild-type Mtb?

      (2) The authors show an interesting result where they observed antibacterial activity of semapimod against H37Rv only in vivo and not in vitro. Why do the authors think this is the basis of this observation? It is possible semapimod has an immunomodulatory effect on the host since leucine is an essential amino acid in mice. The authors could check pro-inflammatory cytokine levels in infected mouse lungs with and without drug treatment.

      (3) The authors show that the semapimod-resistant auxotroph lacks PDIM. The conclusions would be further strengthened by including validations using PDIM mutants, including del-ppsB Mtb and other genes of the PDIM locus, whether in vivo this mutant would be more susceptible (or resistant) to semapimod treatment.

      (4) Prolonged subculturing can introduce mutations in PDIM, which can be overcome by supplementing with propionate (Mullholland et al, Nat Microbiol, 2024). Did the authors also supplement their cultures with propionate? It would be interesting to see what mutations would result in Semr strains with propionate supplementation along with prolonged semapimod treatment.

      Weaknesses:

      I have summarized the limitations above in my comments. Overall, it would be helpful to provide more mechanistic details to study the connection between leucine uptake and PDIM.

    2. Reviewer #2 (Public review):

      Summary

      This important study uncovers a novel mechanism for L-leucine uptake by M. tuberculosis and shows that targeting this pathway with 'Semapimod' interferes with bacterial metabolism and virulence. These results identify the leucine uptake pathway as a potential target to design new anti-tubercular therapy.

      Strengths

      The authors took numerous approaches to prove that L-leucine uptake of M. tuberculosis is an important physiological phenomenon and may be effectively targeted by 'Semapimod'. This study utilizes a series of experiments using a broad set of tools to justify how the leucine uptake pathway of M. tuberculosis may be targeted to design new anti-tubercular therapy.

      Weaknesses

      The study does not explain how L-leucine is taken up by M. tuberculosis, leaving the mechanism unclear. Even though 'Semapimod' binds to the PpsB protein, the relevant connection between changes in PDIM and amino acid transport remains incomplete. Also, the fact that the drug does not function on WT bacteria makes it a weak candidate to consider its usefulness for a therapeutic option.

    3. Reviewer #3 (Public review):

      Agarwal et al identified the small molecule semapimod from a chemical screen of repurposed drugs with specific antimycobacterial activity against a leucine-dependent strain of M. tuberculosis. To better understand the mechanism of action of this repurposed anti-inflammatory drug, the authors used RNA-seq to reveal a leucine-deficient transcriptomic signature from semapimod challenge. The authors then measured a decreased intracellular concentration of leucine after semapimod challenge, suggesting that semapimod disrupts leucine uptake as the primary mechanism of action. Unexpectedly, however, resistant mutants raised against semapimod had a mutation in the polyketide synthase gene ppsB that resulted in loss of PDIM synthesis. The authors believe growth inhibition is a consequence of decreased accumulation of leucine as a result of an impaired cell wall and a disrupted, unknown leucine transporter. This study highlights the importance of branched-chain amino acids for M. tuberculosis survival, and the chemical genetic interactions between semapimod and ppsB indicate that ppsB is a conditionally essential gene in a medium depleted of leucine.

      The conclusions regarding the leucine and PDIM phenotypes are moderately supported by experimental data. The authors do not provide experimental evidence to support a specific link between leucine uptake and impaired PDIM production. Additional work is needed to support these claims and strengthen this mechanism of action.

      (1) Since leucine uptake and PDIM synthesis are important concepts of the manuscript, experiments would benefit from exploring other BCAAs to know if the phenotypes observed are specific to leucine, and adding additional strains to the 2D TLC experiments to provide confidence in the absence of the PDIM band.

      (2) The intriguing observation that wild-type H37Rv is resistant to semapimod but the leucine-auxotroph is sensitive should be further explored. If the authors are correct and semapimod does inhibit leucine uptake through a specific transporter or disrupted cell wall (PDIM synthesis), testing semapimod activity against the leucine-auxotroph in various concentrations of BCAAs could highlight the importance of intracellular leucine. H37Rv is still able to synthesize endogenous leucine and is able to circumvent the effect of semapimod.

    4. Author response:

      Public Reviews:

      Reviewer #1 (Public review):

      Summary:

      n this manuscript, the authors used a leucine/pantothenate auxotrophic strain of Mtb to screen a library of FDA-approved compounds for their antimycobacterial activity and found significant antibacterial activity of the inhibitor semapimod. In addition to alterations in pathways, including amino acid and lipid metabolism and transcriptional machinery, the authors demonstrate that semapimod treatment targets leucine uptake in Mtb. The work presents an interesting connection between nutrient uptake and cell wall composition in mycobacteria.

      Strengths:

      The link between the leucine uptake pathway and PDIM is interesting but has not been characterized mechanistically. The authors discuss that PDIM presents a barrier to the uptake of nutrients and shows binding of the drug with PpsB. However it is unclear why only the leucine uptake pathway was affected.

      We observe interference of L-leucine, but not of pantothenate, uptake in mc2 6206 strain upon semapimod treatment. At present, we do not have any clue whether PDIM presents a barrier exclusively to the uptake of L-leucine. Further studies may shed a light on underlying mechanism(s) by which L-leucine uptake is modulated by this small molecule.

      We still do not know what PpsB actually does for amino acid uptake - is it a transporter?

      By BLI-Octet we do not find any interaction between L-leucine and PpsB. Therefore, we doubt that PpsB is a transporter of L-leucine.

      Does semapimod binding affect its activity?

      Our study suggests that semapimod treatment alters PDIM architecture which becomes restrictive to L-leucine. However, at present the exact mechanism is not clear. Further studies are required to thoroughly examine the effect of semapimod on Mtb PpsB activity and alterations in PDIM by mass spectrometry.

      Does the auxotrophic Mtb have lower PDIM levels compared to wild-type Mtb?

      As per the published report by Mulholland et al, and by vancomycin susceptibility phenotype in our study, both the strains appear to have comparable PDIM levels.

      The authors show an interesting result where they observed antibacterial activity of semapimod against H37Rv only in vivo and not in vitro. Why do the authors think this is the basis of this observation? It is possible semapimod has an immunomodulatory effect on the host since leucine is an essential amino acid in mice. The authors could check pro-inflammatory cytokine levels in infected mouse lungs with and without drug treatment.

      Semapimod inhibits production of proinflammatory cytokines such as TNF-α, IL-1β, and IL-6, which would indeed help pathogen establish chronic infection. However, a significant reduction in bacterial loads in lungs and spleen upon semapimod treatment despite inhibition of proinflammatory cytokines clearly indicates bacterial dependence on host-derived exogenous leucine during intracellular growth.

      The authors show that the semapimod-resistant auxotroph lacks PDIM. The conclusions would be further strengthened by including validations using PDIM mutants, including del-ppsB Mtb and other genes of the PDIM locus, whether in vivo this mutant would be more susceptible (or resistant) to semapimod treatment.

      PDIM is a virulence factor, and plays an important role in the intracellular survival of the TB pathogen. Mtb strains lacking PDIM are expected to show attenuated growth during infection, even without semapimod treatment. In such a case, it might be difficult to draw any conclusions about the effect of semapimod against PDIM(-) strains in vivo.

      Prolonged subculturing can introduce mutations in PDIM, which can be overcome by supplementing with propionate (Mullholland et al, Nat Microbiol, 2024). Did the authors also supplement their cultures with propionate? It would be interesting to see what mutations would result in Semr strains with propionate supplementation along with prolonged semapimod treatment.

      Considering the fact that extensive subculturing may result in loss of PDIM, we avoided prolonged subculturing of bacteria. As presented in Fig. 6b, the WT bacteria retain PDIM. While performing the initial screening of drugs, we did not anticipate such phenotype, and hence bacteria were cultured in regular 7H9-OADS medium without propionate supplementation.

      A comprehensive future study would help examining the effect of propionate on generation of semapimod resistant mutants in Mtb mc2 6206.

      Weaknesses:

      I have summarized the limitations above in my comments. Overall, it would be helpful to provide more mechanistic details to study the connection between leucine uptake and PDIM.

      Reviewer #2 (Public review):

      Summary

      This important study uncovers a novel mechanism for L-leucine uptake by M. tuberculosis and shows that targeting this pathway with 'Semapimod' interferes with bacterial metabolism and virulence. These results identify the leucine uptake pathway as a potential target to design new anti-tubercular therapy.

      Strengths

      The authors took numerous approaches to prove that L-leucine uptake of M. tuberculosis is an important physiological phenomenon and may be effectively targeted by 'Semapimod'. This study utilizes a series of experiments using a broad set of tools to justify how the leucine uptake pathway of M. tuberculosis may be targeted to design new anti-tubercular therapy.

      Weaknesses

      The study does not explain how L-leucine is taken up by M. tuberculosis, leaving the mechanism unclear. Even though 'Semapimod' binds to the PpsB protein, the relevant connection between changes in PDIM and amino acid transport remains incomplete.

      While Leucine uptake involves specific transporters in other bacteria, such transport system is not known in Mtb. By screening small molecule inhibitors, we came across a molecule, semapimod, which selectively kills the leucine auxotroph (mc2 6206), but not the WT Mtb. To understand the underlying mechanism of differential susceptibility of the WT and auxotrophic strains to this molecule, we evaluated the effect of restoration of leuCD and panCD expression on susceptibility of the auxotrophic strain to semapimod. Interestingly, our results demonstrated that upon endogenous expression of leuCD genes, mc2 6206 strain becomes resistant to killing by semapimod. In contrast, no effect of panCD expression was observed on semapimod susceptibility of mc2 6206. These findings were further substantiated by gene expression analysis of semapimod treated mc2 6206, which exhibits differential regulation of a set of genes that are altered upon leucine depletion in Mtb as well as in other bacteria. Overall results thus provide first evidence of perturbation of L-leucine uptake by semapimod treatment of the leucine auxotroph.

      To further gain mechanistic insights into the effect of semapimod on leucine uptake in Mtb, we generated the semapimod resistant strain which exhibits point mutation in 4 genes including ppsB. Interestingly, overexpression of wild-type ppsB, but not of other genes, restored susceptibility of the resistant bacteria to semapimod. Our observations that semapimod interacts with PpsB, and semapimod resistant strain accumulates mutation in PpsB resulting in loss of PDIM together support the involvement of cell-wall PDIM in regulation of L-leucine transport in Mtb.

      As mentioned above, we anticipate that semapimod treatment brings about certain modifications in PDIM which becomes more restrictive to L-leucine. A comprehensive future study will be helpful to examine the effect of semapimod on Mtb physiology.

      Also, the fact that the drug does not function on WT bacteria makes it a weak candidate to consider its usefulness for a therapeutic option.

      We agree that semapimod is not an appropriate drug candidate against TB owing to its inhibitory effect on production of proinflammatory cytokines such as TNF-α, IL-1β, and IL-6 that help pathogen establish chronic infection. However, a significant reduction in bacterial loads in lungs and spleen upon semapimod treatment despite inhibition of proinflammatory cytokines clearly indicates bacterial dependence on host-derived exogenous leucine during intracellular growth. Therefore targeting L-leucine uptake can be a novel therapeutic strategy against TB.

      Reviewer #3 (Public review):

      Agarwal et al identified the small molecule semapimod from a chemical screen of repurposed drugs with specific antimycobacterial activity against a leucine-dependent strain of M. tuberculosis. To better understand the mechanism of action of this repurposed anti-inflammatory drug, the authors used RNA-seq to reveal a leucine-deficient transcriptomic signature from semapimod challenge. The authors then measured a decreased intracellular concentration of leucine after semapimod challenge, suggesting that semapimod disrupts leucine uptake as the primary mechanism of action. Unexpectedly, however, resistant mutants raised against semapimod had a mutation in the polyketide synthase gene ppsB that resulted in loss of PDIM synthesis. The authors believe growth inhibition is a consequence of decreased accumulation of leucine as a result of an impaired cell wall and a disrupted, unknown leucine transporter. This study highlights the importance of branched-chain amino acids for M. tuberculosis survival, and the chemical genetic interactions between semapimod and ppsB indicate that ppsB is a conditionally essential gene in a medium depleted of leucine.

      The conclusions regarding the leucine and PDIM phenotypes are moderately supported by experimental data. The authors do not provide experimental evidence to support a specific link between leucine uptake and impaired PDIM production. Additional work is needed to support these claims and strengthen this mechanism of action.

      As mentioned above, overall results from this study provide first evidence of perturbation of L-leucine uptake by semapimod treatment of the leucine auxotroph. Our observations that semapimod interacts with PpsB, and semapimod resistant strain accumulates mutation in PpsB resulting in loss of PDIM together support the involvement of cell-wall PDIM in regulation of L-leucine transport in Mtb.

      As hitherto mentioned, it appears that semapimod treatment brings about certain modifications in PDIM which becomes restrictive to L-leucine. Future studies are required to gain detailed mechanistic insights into the effect of semapimod on Mtb physiology.

      Since leucine uptake and PDIM synthesis are important concepts of the manuscript, experiments would benefit from exploring other BCAAs to know if the phenotypes observed are specific to leucine, and adding additional strains to the 2D TLC experiments to provide confidence in the absence of the PDIM band.

      We thank the peer reviewer for this suggestion. We would be happy to analyse the effect of semapimod on the level of other amino acids including BCAA by mass spectrometry.

      The intriguing observation that wild-type H37Rv is resistant to semapimod but the leucine-auxotroph is sensitive should be further explored. If the authors are correct and semapimod does inhibit leucine uptake through a specific transporter or disrupted cell wall (PDIM synthesis), testing semapimod activity against the leucine-auxotroph in various concentrations of BCAAs could highlight the importance of intracellular leucine. H37Rv is still able to synthesize endogenous leucine and is able to circumvent the effect of semapimod.

      We thank the peer reviewer for this suggestion. We would explore the possibility of analysing the effect of increasing concentrations of BCAAs on mc2 6206 susceptibility to semapimod.

    1. eLife Assessment

      This useful study shows a protective role of type 1 IFN during Mycobacterium tuberculosis infection. It shows that the type 1 IFN response in human skin TST inversely correlates with TB severity, suggesting its protective role. Considering that type I IFN is usually shown to be pro-pathogenic, the higher vulnerability of zebrafish larvae lacking stat2 to M marinum infection is a strong result. However, the conclusion that IFN-I is protective during mycobacterial infection remains indirect and incomplete; the study requires additional mechanistic insights and validation.

    2. Reviewer #1 (Public review):

      Summary:

      The manuscript finds a negative relationship between tuberculin skin test-induced type I interferon activity with chest X-ray tuberculosis severity in humans. This evidence is between incomplete and solid. It needs a bioinfomatics/transcriptomics reviewer to make a more insightful judgement. The manuscript demonstrates a convincing role for Stat2 in controlling Mycobacterium marinum infection in zebrafish embryos, incomplete data are presented linking reduced leukocyte recruitment to the infection susceptibility phenotype.

      Strengths:

      (1) An interesting analysis of TST response correlated with chest X-ray pathology.

      (2) Novel data on a protective role for Stat2 in a natural host-mycobacterial species infection pairing.

      Weaknesses:

      (1) The transcriptional modules are very large sets of genes that do not present a clear picture of what is actually being measured relative to other biological pathways.

      (2) The link between infection-Stat2-leukocyte recruitment and containment of infection is plausible, but lacks a specific link to the first part of the manuscript.

      Major concerns

      (1) Line 158: The two transcriptional modules should be placed in the context of other DEG patterns. The macrophage type I interferon module, in particular, is quite large (361 genes). Can this be made more granular in terms of type I IFN ligands and STAT2-dependent genes?

      (2) The ifnphi1 injection into mxa:mCherry stat2 crispants is a nice experiment to demonstrate loss of type I IFN responsiveness. Further data is required to demonstrate if important mycobacterial control pathways (IFNy, TNF, il6?, etc) are intact in stat2 crispants before being able to conclude that these phenotypes are specific to type I IFN.

    3. Reviewer #2 (Public review):

      Summary:

      This study shows that type I interferon (IFN-I) signaling helps protect against mycobacterial infection. Using human gene expression data and a zebrafish model, the authors find that reduced IFN-I activity is linked to more severe disease. They also show that zebrafish lacking the IFN-I signaling gene stat2 are more vulnerable to infection due to poor macrophage migration. These results suggest a protective role for IFN-I in mycobacterial disease, challenging previous findings from other animal models.

      Strengths:

      Strengths of the manuscript include the use of human clinical samples to support relevance to disease, along with a genetically tractable zebrafish model that enables mechanistic insight.

      Weaknesses:

      (1) The manuscript presents intriguing human data showing an inverse correlation between IFN-I gene signatures and TB disease, but the findings remain correlative and may be cohort-specific. Given that the skin is not a primary site of TB and is relatively immunotolerant, the biological relevance of downregulated IFN-I-related genes in this tissue to systemic or pulmonary TB is unclear.

      (2) The reliance on stat2 CRISPants in zebrafish offers a limited view of IFN-I signaling. Including additional crispant lines targeting other key regulators (e.g., ifnar1, tyk2, irf3, irf7) would strengthen the interpretation and clarify whether the observed effects reflect broader IFN-I pathway disruption.

      (3) The conclusion that IFN-I is protective contrasts with established findings from murine and non-human primate models, where IFN-I is often detrimental. While the authors highlight species differences, the lack of functional human data and reliance on M. marinum in zebrafish limit the translational relevance. A more balanced discussion addressing these discrepancies would improve the manuscript.

      (4) Quantification of bacterial burden using fluorescence intensity alone may not accurately reflect bacterial viability. Complementary methods, such as qPCR for bacterial DNA, would provide a more robust assessment of antimicrobial activity.

      (5) Finally, the authors should clarify whether impaired macrophage recruitment in stat2 crispants results from defects in chemotaxis, differentiation, or survival, and address discrepancies between their human blood findings and prior studies.

    4. Reviewer #3 (Public review):

      Summary:

      In this manuscript, the authors presented an interesting study providing an insight into the role of Type-I interferon responses in tuberculosis (TB) pathogenesis by combining transcriptome analysis of PBMCs and TST from tuberculosis patients. The zebrafish model was used to identify the changes in the innate immune cell population of macrophages and neutrophils. The findings suggested that Type-I interferon signatures inversely correlated with disease severity in the TST transcriptome data. The authors validated the observations by CRISPR-mediated disruption of stat2 (a critical transcription factor for type I interferon signaling) in zebrafish larvae, showing increased susceptibility to M. marinum infection. Traditionally, type-I interferon responses have been viewed as detrimental in mycobacterial infections, with studies suggesting enhanced susceptibility in certain mouse models. The study tried to identify and further characterize the understanding of the role of type-I interferons in TB.

      Strengths:

      Traditionally, type-I interferon responses have been viewed as detrimental in mycobacterial infections, with studies suggesting enhanced susceptibility in certain mouse models. The study tried to further understand the role of type-I interferons in TB pathogenesis.

      Weaknesses:

      Though the study showed an inverse correlation of Type-I interferon with radiological features of TB, the molecular mechanism is largely unexplored in the study, which is making it difficult to understand the basis of the results shown in the manuscript by the authors.

    5. Author response:

      Public Reviews:

      Reviewer #1 (Public review):

      Summary:

      The manuscript finds a negative relationship between tuberculin skin test-induced type I interferon activity with chest X-ray tuberculosis severity in humans. This evidence is between incomplete and solid. It needs a bioinfomatics/transcriptomics reviewer to make a more insightful judgement. The manuscript demonstrates a convincing role for Stat2 in controlling Mycobacterium marinum infection in zebrafish embryos, incomplete data are presented linking reduced leukocyte recruitment to the infection susceptibility phenotype.

      Strengths:

      (1) An interesting analysis of TST response correlated with chest X-ray pathology.

      (2) Novel data on a protective role for Stat2 in a natural host-mycobacterial species infection pairing.

      We appreciate the reviewer’s positive comments.

      Weaknesses:

      (1) The transcriptional modules are very large sets of genes that do not present a clear picture of what is actually being measured relative to other biological pathways.

      The transcriptional module analysis is a major strength of our approach. These gene signatures are derived from independent experiments, most of which have been previously published/validated [1,2]. To clarify, they represent co-regulated gene sets downstream of signalling pathways. Increased number of genes in these modules increases their combinatorial specificity for a given biological pathway. In the human data, they serve as orthogonal validation for the bioinformatic analysis showing enrichment of the type I IFN pathway among TST transcriptome genes that are negatively correlated with radiographic disease severity in pulmonary TB (see Figure 2). Importantly, our modules confirm the relationship with type I IFN signalling (see Figure 2E) by discriminating from type II IFN signalling, which is not statistically significantly correlated with radiographic TB severity (see Figure S6C-E).

      (2) The link between infection-Stat2-leukocyte recruitment and containment of infection is plausible, but lacks a specific link to the first part of the manuscript.

      For clarification, the first part of the study seeks to identify immune response pathways that relate to severity of human disease, leading to the identification of type I IFN signalling. Since the human data are limited to an observational analysis in which we cannot test causality, the second part of our study uses a genetically tractable experimental model to test the hypothesis that type I IFN signalling is host-protective and explore possible mechanisms for a beneficial effect. This leads to the observation that type I IFN responses contribute to early myeloid cell recruitment to the site of infection, that has previously been shown to be crucial for containment of mycobacterial infection in zebrafish larvae. We will further evaluate the introduction and results sections to ensure a clear link between the human and zebrafish work.

      Major concerns

      (1) Line 158: The two transcriptional modules should be placed in the context of other DEG patterns. The macrophage type I interferon module, in particular, is quite large (361 genes). Can this be made more granular in terms of type I IFN ligands and STAT2-dependent genes?

      We respectfully disagree with this comment. For clarification, the 360 gene module reflects the zebrafish larval response to IFNphi1 protein [3]. Type I IFNs are known to induce hundreds of interferon stimulated genes [4]. As explained above, the size of the modules increases specificity for a given signalling pathway. In this case, we are most interested in discriminating type I and type II IFN signalling pathways that represent very different upstream biological processes. The discrimination we achieve with our modular approach is a major advance over previous reports of gene signatures in TB that do not discriminate between the two pathways. In this study, we did not discriminate between signalling downstream of type I IFN ligands and STAT2, consistent with existing literature showing that type I IFN signalling is STAT2 dependent [5,6].

      (2) The ifnphi1 injection into mxa:mCherry stat2 crispants is a nice experiment to demonstrate loss of type I IFN responsiveness. Further data is required to demonstrate if important mycobacterial control pathways (IFNy, TNF, il6?, etc) are intact in stat2 crispants before being able to conclude that these phenotypes are specific to type I IFN.

      Thank you for the positive comment. We acknowledge this point and will attempt to evaluate whether pro-inflammatory cytokine responses are intact in stat2 CRISPants by qPCR or bulk RNAseq. However, these experiments may prove inconclusive because of the limited sensitivity in this approach.

      Reviewer #2 (Public review):

      Summary:

      This study shows that type I interferon (IFN-I) signaling helps protect against mycobacterial infection. Using human gene expression data and a zebrafish model, the authors find that reduced IFN-I activity is linked to more severe disease. They also show that zebrafish lacking the IFN-I signaling gene stat2 are more vulnerable to infection due to poor macrophage migration. These results suggest a protective role for IFN-I in mycobacterial disease, challenging previous findings from other animal models.

      Strengths:

      Strengths of the manuscript include the use of human clinical samples to support relevance to disease, along with a genetically tractable zebrafish model that enables mechanistic insight.

      We welcome the reviewer’s positive summary of our study.

      Weaknesses:

      (1) The manuscript presents intriguing human data showing an inverse correlation between IFN-I gene signatures and TB disease, but the findings remain correlative and may be cohort-specific. Given that the skin is not a primary site of TB and is relatively immunotolerant, the biological relevance of downregulated IFN-I-related genes in this tissue to systemic or pulmonary TB is unclear.

      We agree with the reviewer that the observational human data are correlative. That is precisely why we extend the study to undertake mechanistic studies in a genetically tractable animal model, using M. marinum infection of zebrafish larvae. In the introduction, we already provide a detailed rationale for the strengths of the TST model to study human immune responses to a standardised mycobacterial challenge. This approach mitigates against the confounding of heterogeneity in bacterial burden and sampling different stages of the natural history of infection in conventional observational human studies. Therefore, the application of the TST is a major strength of this study. We do not understand the context in which the reviewer suggests the skin is immunotolerant. In the present study and previous work we provide molecular level analysis of the TST as a robust cell mediated immune response that reflects molecular perturbation in granuloma from the site of pulmonary TB disease 1.

      (2) The reliance on stat2 CRISPants in zebrafish offers a limited view of IFN-I signaling. Including additional crispant lines targeting other key regulators (e.g., ifnar1, tyk2, irf3, irf7) would strengthen the interpretation and clarify whether the observed effects reflect broader IFN-I pathway disruption.

      We respectfully disagree with this comment. Our objective was to test the role of type I IFN signalling in M. marinum infection of zebrafish. We show that stat2 deletion effectively disrupts type I IFN signalling (Figure S8). Therefore, we do not see a compelling rationale to evaluate other molecules in the signalling pathway.

      (3) The conclusion that IFN-I is protective contrasts with established findings from murine and non-human primate models, where IFN-I is often detrimental. While the authors highlight species differences, the lack of functional human data and reliance on M. marinum in zebrafish limit the translational relevance. A more balanced discussion addressing these discrepancies would improve the manuscript.

      We acknowledge that our findings contrast with the prevailing view in published literature to date. We will further review the discussion to see how we can elaborate on the potential strengths and weaknesses of different experimental approaches, which may underpin these discrepancies.

      (4) Quantification of bacterial burden using fluorescence intensity alone may not accurately reflect bacterial viability. Complementary methods, such as qPCR for bacterial DNA, would provide a more robust assessment of antimicrobial activity.

      We and others have previously validated the use of the quantitative measures of fluorescence, used here as a measure of bacterial load [7,8]. Importantly, our measurements do not rely purely on the total fluorescence signal, but also measures of dissemination of infection, for which we see consistent findings. It is also widely recognised that DNA measurements do not necessarily correlate well with bacterial viability. Therefore, we respectfully disagree that a PCR-based approach will add substantial value to our existing analysis.

      (5) Finally, the authors should clarify whether impaired macrophage recruitment in stat2 crispants results from defects in chemotaxis, differentiation, or survival, and address discrepancies between their human blood findings and prior studies.

      We acknowledge that these are important questions. Our data show that stat2 disruption does not impact total macrophage numbers at baseline (Figure 4A,B) and therefore do not support any effect of Stat2 signalling on steady state macrophage survival or differentiation. The downregulation of macrophage mpeg1 expression in M. marinum infection precludes long-term follow-up of these cells in the context of infection [9]. Therefore, we cannot currently test the hypothesis that Stat2 signalling may influence death of macrophages recruited to the site of infection or make them more susceptible to the cytopathic effects of direct mycobacterial infection. We will attempt to confirm using short-term time-lapse imaging that cellular migration to the site of hindbrain M. marinum infection is reduced in stat2 deficient zebrafish. On the strength of what is possible to test and the established role of type I IFNs in induction of several chemokines [10,11], the most likely effect is that Stat2 signalling increases recruitment through chemokine production. We are exploring the possibility of testing changes to the chemokine profile in stat2 CRISPants by qPCR or bulk RNAseq, but these experiments may prove inconclusive because of the limitations of sensitivity in this approach.

      We recognize that our finding of no relationship between peripheral blood type I IFN activity and severity of human TB contrasts with that of previous studies. As stated in the discussion, the most likely explanation for this is our use of transcriptional modules which reflect exclusive type I IFN responses. The signatures used in other studies include both type I and type II IFN inducible genes and therefore also reflect IFN gamma driven responses.

      Reviewer #3 (Public review):

      Summary:

      In this manuscript, the authors presented an interesting study providing an insight into the role of Type-I interferon responses in tuberculosis (TB) pathogenesis by combining transcriptome analysis of PBMCs and TST from tuberculosis patients. The zebrafish model was used to identify the changes in the innate immune cell population of macrophages and neutrophils. The findings suggested that Type-I interferon signatures inversely correlated with disease severity in the TST transcriptome data. The authors validated the observations by CRISPR-mediated disruption of stat2 (a critical transcription factor for type I interferon signaling) in zebrafish larvae, showing increased susceptibility to M. marinum infection. Traditionally, type-I interferon responses have been viewed as detrimental in mycobacterial infections, with studies suggesting enhanced susceptibility in certain mouse models. The study tried to identify and further characterize the understanding of the role of type-I interferons in TB.

      Strengths:

      Traditionally, type-I interferon responses have been viewed as detrimental in mycobacterial infections, with studies suggesting enhanced susceptibility in certain mouse models. The study tried to further understand the role of type-I interferons in TB pathogenesis.

      We thank the reviewer for their summary.

      Weaknesses:

      Though the study showed an inverse correlation of Type-I interferon with radiological features of TB, the molecular mechanism is largely unexplored in the study, which is making it difficult to understand the basis of the results shown in the manuscript by the authors.

      We respectfully disagree with this comment. The observations in the human data lead to the hypothesis that type I IFN responses may be host-protective, which we then test specifically in the zebrafish model, and explore candidate mechanisms, focussing on myeloid cell recruitment to the site of infection.

      References

      (1) Bell, L.C.K., Pollara, G., Pascoe, M., Tomlinson, G.S., Lehloenya, R.J., Roe, J., Meldau, R., Miller, R.F., Ramsay, A., Chain, B.M., et al. (2016). In Vivo Molecular Dissection of the Effects of HIV-1 in Active Tuberculosis. PLoS Pathog. 12, e1005469. https://doi.org/10.1371/journal.ppat.1005469.

      (2) Pollara, G., Turner, C.T., Rosenheim, J., Chandran, A., Bell, L.C.K., Khan, A., Patel, A., Peralta, L.F., Folino, A., Akarca, A., et al. (2021). Exaggerated IL-17A activity in human in vivo recall responses discriminates active tuberculosis from latent infection and cured disease. Sci. Transl. Med. 13, eabg7673. https://doi.org/10.1126/scitranslmed.abg7673.

      (3) Levraud, J.-P., Jouneau, L., Briolat, V., Laghi, V., and Boudinot, P. (2019). IFN-Stimulated Genes in Zebrafish and Humans Define an Ancient Arsenal of Antiviral Immunity. J. Immunol. Baltim. Md 1950 203, 3361–3373. https://doi.org/10.4049/jimmunol.1900804.

      (4) Schoggins, J.W. (2019). Interferon-Stimulated Genes: What Do They All Do? Annu. Rev. Virol. 6, 567–584. https://doi.org/10.1146/annurev-virology-092818-015756.

      (5) Blaszczyk, K., Nowicka, H., Kostyrko, K., Antonczyk, A., Wesoly, J., and Bluyssen, H.A.R. (2016). The unique role of STAT2 in constitutive and IFN-induced transcription and antiviral responses. Cytokine Growth Factor Rev. 29, 71–81. https://doi.org/10.1016/j.cytogfr.2016.02.010.

      (6) Begitt, A., Droescher, M., Meyer, T., Schmid, C.D., Baker, M., Antunes, F., Knobeloch, K.-P., Owen, M.R., Naumann, R., Decker, T., et al. (2014). STAT1-cooperative DNA binding distinguishes type 1 from type 2 interferon signaling. Nat. Immunol. 15, 168–176. https://doi.org/10.1038/ni.2794.

      (7) Stirling, D.R., Suleyman, O., Gil, E., Elks, P.M., Torraca, V., Noursadeghi, M., and Tomlinson, G.S. (2020). Analysis tools to quantify dissemination of pathology in zebrafish larvae. Sci. Rep. 10, 3149. https://doi.org/10.1038/s41598-020-59932-1.

      (8) Takaki, K., Davis, J.M., Winglee, K., and Ramakrishnan, L. (2013). Evaluation of the pathogenesis and treatment of Mycobacterium marinum infection in zebrafish. Nat. Protoc. 8, 1114–1124. https://doi.org/10.1038/nprot.2013.068.

      (9) Benard, E.L., Racz, P.I., Rougeot, J., Nezhinsky, A.E., Verbeek, F.J., Spaink, H.P., and Meijer, A.H. (2015). Macrophage-expressed perforins mpeg1 and mpeg1.2 have an anti-bacterial function in zebrafish. J. Innate Immun. 7, 136–152. https://doi.org/10.1159/000366103.

      (10) Lehmann, M.H., Torres-Domínguez, L.E., Price, P.J.R., Brandmüller, C., Kirschning, C.J., and Sutter, G. (2016). CCL2 expression is mediated by type I IFN receptor and recruits NK and T cells to the lung during MVA infection. J. Leukoc. Biol. 99, 1057–1064. https://doi.org/10.1189/jlb.4MA0815-376RR.

      (11) Buttmann, M., Merzyn, C., and Rieckmann, P. (2004). Interferon-beta induces transient systemic IP-10/CXCL10 chemokine release in patients with multiple sclerosis. J. Neuroimmunol. 156, 195–203. https://doi.org/10.1016/j.jneuroim.2004.07.016.

    1. eLife Assessment

      This study presents an alternative to conventional and UV-based tetramers, which are easy to use and reliable for the identification of antigen-specific CD8 T cells. The authors demonstrate that tetramers for HLA alleles A0301, A1101, B0702, and C0702 can be subjected to specific temperatures that facilitate peptide exchange, whilst maintaining structural integrity. Whilst the strength of the evidence is currently incomplete, further development and validation of this approach is likely to provide a useful alternative to generating reagents for examining T cell specificities.

    2. Reviewer #1 (Public review):

      Summary:

      A fundamental technique for the identification of peptide-specific CD8 T cells is the use of fluorophore-conjugated and peptide loaded MHC tetramers. Classically, refolding of specific peptides with MHC monomers can be labour intensive, and not optimal for screening large numbers of different peptides. Hence, UV-exchanged tetramers have been developed to upscale this, however, still has some associated challenges such as UV-mediated damage to peptide complexes. Here, Pothast, C.R. et al demonstrate the efficacy of using temperature exchanged tetramers for the prevalent alleles HLA-A*03:01, A*11:01, B*07:02, and C*07:02. Building upon their previous work with HLA-A*02:01, H-2Kb, and HLA-E. They first demonstrate the complex stability of tetramers with different affinity peptides at high temperature, showing complex destabilisation can be rescued with higher affinity peptides. This is followed by an optimisation of peptide exchange temperatures, tailored for each allele. The authors then demonstrate successful binding to clonal T cell lines, and then a step further with viral peptides against PBMCs from individuals with confirmed infection history. For the latter they compare to conventional tetramers and demonstrate comparable signal.<br /> Due to the prevalence of these 4 alleles, the ease-of-handling, and short time requirements, these tetramers are likely to show high utility.

      Strengths:

      The manuscript is well-written and the results are solid, although more detail may add clarity to some of the results, in particular Figures 1 and 2. Other than the points reported below, the study uses accurate controls to demonstrate the specificity of the tetramers, and the data are convincing.

      Overall, the interpretation of the results is accurate, and the discussion is thorough. Additional comments may be included to cover potential tetramer batch variability and differences in the stability of different alleles. Specifically, whether certain alleles require higher-affinity peptides to be stable, compared to others.

      Weaknesses:

      The authors demonstrate the equivalence of temperature-exchanged tetramers to conventional ones, however, as they are an advancement on UV-exchange, it would be useful to show data on how their stability, exchange efficacy, and binding to T cell lines compare to UV-based tetramers. It would be supportive to show that temperature does not impact fluorophore intensity as well.

    3. Reviewer #2 (Public review):

      Summary:

      The majority of CD8+ T cell responses rely on the proper presentation of antigens through stable MHC-I (but not requiring a stable immunological synapse). This work highlights a new approach to build an array of stable peptide MHC-I using temperature exchange, which can be used to identify antigen-specific CD8+ T cells.

      Strengths:

      In this work, the authors have proposed an alternative method to reload the peptide MHC-I molecule. Their temperature-exchange approach is distinct from current reloadable peptide MHC technologies involving photolabile peptide, empty MHC-I (Nat Commun 11, 1314 (2020). https://doi.org/10.1038/s41467-020-14862-4), tapasin/TAPBPR chaperone-assisted (eLife 7:e40126.), enzyme exchangeable (WO2020226570) and small alcohol (Curr Res Immunol. 2022 Aug 18;3:167-174. doi: 10.1016/j.crimmu.2022.08.002) approaches.

      Weaknesses:

      However, the proposed temperature-exchange approach does not substantially improve the quality of antigen-specific T cells that can be identified using the photolabile peptide MHC-I molecules.

      The time saved using the temperature-exchange protocol may not be a pull factor as the photolabile peptide MHC-I approach is not unreasonably laborious.

    4. Reviewer #3 (Public review):

      Summary:

      The study by Pothast and colleagues outlines an extension of their previously described temperature-based MHC-I peptide exchange method on 4 common HLA alleles, to enable the generation of peptide/MCH-I tetramers for characterization of antigen-specific T cells by flow cytometry.

      Strengths:

      This work outlines a protocol for generating MHC-I tetramers on 4 common HLA allotypes, which can then be applied to monitor T cell responses by flow cytometry studies. The work provides conditional ligands for exchange on each HLA and demonstrates proof of concept studies using clonotypic T cells and CD8+ PBMCs.

      The results support that the temperature-exchanged tetramers can perform similarly to conventional tetramers in some settings.

      Weaknesses:

      Given that there are several proposed methodologies addressing the same task (including UV-mediated, disulfide-bond based stabilization of empty MHC-I conformers, and chaperone-based methods), the relevance of the proposed temperature-mediated technology is questionable.

      More specifically, important limitations of the study include:

      (1) A lack of quantification of exchanged molecules relative to molecules that retain the original placeholder peptides, or completely empty molecules present in the same sample.

      (2) A lack of validation that peptide exchange has occurred in the absence of a reporter T cell line appears to be a significant limitation of the methodology for antigen / T cell discovery.

      (3) The sub-optimal exchange efficiency relative to conventional prepared pMHC-I molecules, shown in Figure 4, is a significant limitation of the approach.

      (4) There are no data to support that exchange proceeds through the generation of empty molecules during the temperature cycle, or by peptide binding on empty molecules that are already present in the sample. Understanding the mechanism of exchange is important for the necessary improvements to the methodology.

      (5) It is possible that the temperature cycle causes protein aggregation or other irreversible changes to the sample - this should be explicitly quantified and addressed in the paper, since misfolded MHC-I molecules can lead to high levels of background staining.

      (6) These potential limitations should limit detection of low-affinity/low-avidity interactions between TCRs and their cognate pMHC antigens - this should be addressed explicitly in a model antigen setting.

      (7) The approach appears to be limited to the HLAs showing high thermal stability, which have been explored in this study. However, a large fraction of HLAs show sub-optimal thermal stabilities. It seems that explicit validation of peptide exchange would be required for any new HLA allele introduced into this process.

      (8) Whether the approach can be used to load suboptimal peptides with lower thermal stabilities that are emerging immunotherapy targets is not addressed in the present study.

      Because of these limitations, the present manuscript does not conclusively support the claim that temperature-based exchange can be used as a robust methodology to generate pMHC-I tetramers with desired peptide specificities.

      As a result, the scope of applications using these suboptimal exchanged pHLA tetramers is limited, and should be addressed with further improvements of the methodology, including better characterization of exchange efficiency, demonstration of functionality across a broader range of HLA allotypes with varying thermal stability profiles, and validation with clinically relevant low-affinity peptides that would strengthen the potential utility of this approach in immunotherapy development and basic T cell biology research.

    1. eLife Assessment

      This study presents an important finding linking the bacterial metabolite trimethylamine and its receptor to circadian rhythms and olfaction. The current evidence supporting the claims of the authors is convincing, although further data and improvements to the presentation would further increase the impact of these results. This work will be of broad interest to researchers interested in nutrition, microbial metabolism, circadian rhythms, and host-microbiome interactions.

    2. Reviewer #1 (Public review):

      Summary:

      This study focuses on the bacterial metabolite TMA, generated from dietary choline. These authors and others have previously generated foundational knowledge about the TMA metabolite TMAO, and its role in metabolic disease. This study extends those findings to test whether TMAO's precursor, TMA, and its receptor TAAR5 are also involved and necessary for some of these metabolic phenotypes. They find that mice lacking the host TMA receptor (Taar5-/-) have altered circadian rhythms in gene expression, metabolic hormones, gut microbiome composition, and olfactory and innate behavior. In parallel, mice lacking bacterial TMA production or host TMA oxidation have altered circadian rhythms.

      Strengths:

      These authors use state-of-the-art bacterial and murine genetics to dissect the roles of TMA, TMAO, and their receptor in various metabolic outcomes (primarily measuring plasma and tissue cytokine/gene expression). They also follow a unique and unexpected behavioral/olfactory phenotype. Statistics are impeccable.

      Weaknesses:

      Enthusiasm for the manuscript is dampened by some ambiguous writing and the presentation of ideas in the introduction, both of which could easily be improved upon revision.

    3. Reviewer #2 (Public review):

      Summary:

      In the manuscript by Mahen et al., entitled "Gut Microbe-Derived Trimethylamine Shapes Circadian Rhythms Through the Host Receptor TAAR5," the authors investigate the interplay between a host G protein-coupled receptor (TAAR5), the gut microbiota-derived metabolite trimethylamine (TMA), and the host circadian system. Using a combination of genetically engineered mouse and bacterial models, the study demonstrates a link between microbial signaling and circadian regulation, particularly through effects observed in the olfactory system. Overall, this manuscript presents a novel and valuable contribution to our understanding of host-microbe interactions and circadian biology. However, several sections would benefit from improved clarity, organization, and mechanistic depth to fully support the authors' conclusions.

      Strengths:

      (1) The manuscript addresses an important and timely topic in host-microbe communication and circadian biology.

      (2) The studies employ multiple complementary models, e.g., Taar5 knockout mice, microbial mutants, which enhance the depth of the investigation.

      (3) The integration of behavioral, hormonal, microbial, and transcript-level data provides a multifaceted view of the observed phenotype.

      (4) The identification of olfactory-linked circadian changes in the context of gut microbes adds a novel perspective to the field.

      Weaknesses:

      While the manuscript presents compelling data, several weaknesses limit the clarity and strength of the conclusions.

      (1) The presentation of hormonal, cytokine, behavioral, and microbiome data would benefit from clearer organization, more detailed descriptions, and functional grouping to aid interpretation.

      (2) Some transitions-particularly from behavioral to microbiome data-are abrupt and would benefit from better contextual framing.

      (3) The microbial rhythmicity analyses lack detail on methods and visualization, and the sequencing metadata (e.g., sample type, sex, method) are not clearly stated.

      (4) Several figures are difficult to interpret due to dense layouts or vague legends, and key metabolites and gene expression comparisons are either underexplained or not consistently assessed across models.

      (5) Finally, while the authors suggest a causal role for TAAR5 and its ligand in circadian regulation, the current data remain correlative; mechanistic experiments or stronger disclaimers are needed to support these claims.

    4. Reviewer #3 (Public review):

      Summary:

      Deletion of the TMA-sensor TAAR5 results in circadian alterations in gene expression, particularly in the olfactory bulb, plasma hormones, and neurobehaviors.

      Strengths:

      Genetic background was rigorously controlled.

      Comprehensive characterization.

      Weaknesses:

      The weaknesses identified by this reviewer are minor.

      Overall, the studies are very nicely done. However, despite careful experimentation, I note that even the controls vary considerably in their gene expression, etc, across time (eg, compare control graphs for Cry 1 in IB, 4B). It makes me wonder how inherently noisy these measurements are. While I think that the overall point that the Taar5 KO shows circadian changes is robust, future studies to dissect which changes are reproducible over the noise would be helpful.

      Impact:

      These data add to the growing literature pointing to a role for the TMA/TMAO pathway in olfaction and neurobehavioral.

    1. eLife Assessment

      Endothelial cell-specific loss of TGF-beta signaling in mice leads to CNS vascular defects, specifically impairing retinal development and promoting immune cell infiltration. The data are solid, showing that loss of TGF-beta signaling triggers vascular inflammation and attracts immune cells specific to CNS vasculature, but there are issues with the single-nucleus RNA sequencing of immune cells. These findings are valuable, highlighting TGF-beta's role in maintaining vascular-immune homeostasis and its therapeutic potential in neurovascular inflammatory diseases.

    2. Reviewer #1 (Public review):

      Summary:

      This manuscript analyses primarily the effects of deleting the TgfbR1 and TgfbR2 receptors from endothelial cells at postnatal stages of vascular development and blood-retina barrier maturation in the retina. The authors find that deletion of these receptors affects vascular development in the retina, but importantly, it affects the infiltration of immune cells across the vessels in the retina. The findings demonstrate that Tgfb signaling through TgfbR1/R2 heterodimers regulates primarily the immune phenotypes of endothelial cells in addition to regulating vascular development. The data provided by the authors provide a solid support for their conclusions.

      Strengths:

      (1) The manuscript uses a variety of elegant genetic studies in mice to analyze the role of TgfbR1 and TgfbR2 receptors in endothelial cells at postnatal stages of vascular development and blood-retina barrier maturation in the retina.

      (2) The authors provide a nice comparison of the vascular phenotypes in endothelial-specific knockout of TgfbR1 and TgfbR2 in the retina (and to a lesser degree in the brain) with those from Npd KO mice (loss of Ndp/Fzd signaling) or loss of VEGF-A signaling to dissect the specific roles of Tgf signaling for vascular development in the retina.

      (3) The snRNAseq data of vessel segments from the brains of WT versus TgfbR1 -iECKO mice provides a nice analysis of pathways and transcripts that are regulated by Tgfb signaling in endothelial cells.

      Weaknesses:

      (1) The authors claim that choroidal neovascular tuft phenotypes are similar in TgfbrR1 KO and TgfbrR2 KO mice. However, the phenotypes look more severe in the TgfbrR1 KO rather than TgfbrR2 KO mice. Can the authors show a quantitative comparison of the number of choroidal neovascular tufts per whole eye cross-section in both genotypes?

      (2) In the analysis of Sulfo-NHS-Biotin leakage in the retina to assess blood-retina barrier maturation. The authors claim that there is increased vascular leakage in the TgfbR1 KO mice. However, it does not seem like Sulfo-NHS-biotin is leaking outside the vessels. Therefore, it cannot be increased vascular permeability. Can the authors provide a detailed quantification of the leakage phenotype?

      (3) The immune cell phenotyping by snRNAseq is premature, as the number of cells is very small. The authors should sort for CD45+ cells and perform single-cell RNA sequencing.

      (4) The analysis of BBB leakage phenotype in TgfbR1 KO mice needs to be more detailed and include tracers as well as serum IgG leakage.

      (5) A previous study (Zarkada et al., 2021, Developmental Cell) showed that EC-deletion of Alk5 affects the D tip cells. The phenotypes of those mice look very similar to those shown for TgfbrR1 KO mice. Are D-tip cells lost in these mutants by snRNAseq?

    3. Reviewer #2 (Public review):

      Summary:

      The authors meticulously characterized EC-specific Tgfbr1, Tgfbr2, or double knockout in the retina, demonstrating through convincing immunostaining data that loss of TGF-β signaling disrupts retinal angiogenesis and choroidal neovascularization. Compared to other genetic models (Fzd4 KO, Ndp KO, VEGF KO), the Tgfbr1/2 KO retina exhibits the most severe immune cell infiltration. The authors proposed that TGF-β signaling loss triggers vascular inflammation, attracting immune cells - a phenotype specific to CNS vasculature, as non-CNS organs remain unaffected.

      Strengths:

      The immunostaining results presented are clear and robust. The authors performed well-controlled analyses against relevant mouse models. snRNA-seq corroborates immune cell leakage in the retina and vascular inflammation in the brain.

      Weaknesses:

      The causal link between TGF-β loss, vascular inflammation, and immune infiltration remains unresolved. The authors' model posits that EC-specific TGF-β loss directly causes inflammation, which recruits immune cells. However, an alternative explanation is plausible: Tgfbr1/2 KO-induced developmental defects (e.g., leaky vessels) permit immune extravasation, subsequently triggering inflammation. The observations that vein-specific upregulation of ICAM1 staining and the lack of immune infiltration phenotypes in the non-CNS tissues support the alternative model. Late-stage induction of Tgfbr1/2 KO (avoiding developmental confounders) could clarify TGF-β's role in retinal angiogenesis versus anti-inflammation.

    1. eLife Assessment

      This important study provides converging results from complementary neuroimaging and behavioral experiments to identify human brain regions involved in representing regular geometric shapes. Geometric shape concepts are universally present across diverse human cultures and possibly essential for unique human capabilities such as numerical cognition and symbolic reasoning, and identifying the brain networks involved in geometric shape representation is of broad interest to researchers studying human visual perception, reasoning, and cognitive development. The provided experimental evidence regarding the presence of geometric shape regularity representation in dorsal parietal and prefrontal cortex is solid, but the claimed link with mathematical reasoning, the influence of experimental tasks, and the role of experience in driving geometric shape representation in both humans and artificial vision models require further elucidation.

    2. Reviewer #1 (Public review):

      Summary:

      This paper examines how geometric regularities in abstract shapes (e.g., parallelograms, kites) are perceived and processed in the human brain. The manuscript contains multimodal data (behavior, fMRI, MEG) from adults and additional fMRI data from 6-year-old children. The key findings show that (1) processing geometric shapes lead to reduced activity in ventral areas in comparison to complex stimuli and increased activity in intraparietal and inferior temporal regions, (2) the degree of geometric regularity modulates activity in intraparietal and inferior temporal regions, (3) similarity in neural representation of geometric shapes can be captured early by using CNN models and later by models of geometric regularity. In addition to these novel findings, the paper also includes a replication of behavioral data, showing that the perceptual similarity structure amongst the geometric stimuli used can be explained by a combination of visual similarities (as indexed by a feedforward CNN model of the ventral visual pathway) and geometric features.

      Strengths:

      (1) The study incorporates multi-modal data that uses more than one task and different populations of participants (adults and children).

      (2) It replicates behavioral findings of an earlier study in a larger cohort.

      (3) The paper comes with openly accessible code in a well-documented GitHub repository, and the data will be published with the paper on OpenNeuro.

      Weaknesses:

      I wonder how task difficulty and linguistic labels interact with the current findings. Based on the behavioral data, shapes with more geometric regularities are easier to detect when surrounded by other shapes. Do shape labels that are readily available (e.g., "square") help in making accurate and speedy decisions? Can the sensitivity to geometric regularity in intraparietal and inferior temporal regions be attributed to differences in task difficulty? Similarly, are the MEG oddball detection effects that are modulated by geometric regularity also affected by task difficulty?

    3. Reviewer #2 (Public review):

      Summary:

      The current study seeks to understand the neural mechanisms underlying geometric reasoning. Using fMRI with both children and adults, the authors found that contrasting simple geometric shapes with naturalistic images (faces, tools, houses) led to responses in the dorsal visual stream, rather than ventral regions that are generally thought to represent shape properties. The authors followed up on this result using computational modeling and MEG to show that geometric properties explain distinct variance in the neural response beyond what is captured by a CNN.

      Strengths:

      These findings contribute much-needed neural and developmental data to the ongoing debate regarding shape processing in the brain and offer additional insights into why CNNs may have difficulty with shape processing. The motivation and discussion for the study are appropriately measured, and I appreciate the authors' use of multiple populations, neuroimaging modalities, and computational models to explore this question.

      Weaknesses:

      Given that the primary take away from this study is that geometric shape information is found in the dorsal stream, rather than the ventral stream there is very little there is very little discussion of prior work in this area (for reviews, see Freud et al., 2016; Orban, 2011; Xu, 2018). Indeed, there is extensive evidence of shape processing in the dorsal pathway in human adults (Freud, Culham, et al., 2017; Konen & Kastner, 2008; Romei et al., 2011), children (Freud et al., 2019), patients (Freud, Ganel, et al., 2017), and monkeys (Janssen et al., 2008; Sereno & Maunsell, 1998; Van Dromme et al., 2016), as well as the similarity between models and dorsal shape representations (Ayzenberg & Behrmann, 2022; Han & Sereno, 2022).

      The presence of activation in aIPS led the authors to interpret their results to mean that geometric reasoning draws on the same processes as mathematical thinking. However, there is not enough evidence in the current study to support this claim.

    4. Reviewer #3 (Public review):

      Summary:

      The authors report converging evidence from several brain-imaging techniques that geometric figures, notably quadrilaterals, are processed differently in visual (lower activation) and spatial (greater) areas of the human brain than representative figures. Comparison of mathematical models to fit activity for geometric figures shows the best fit for abstract geometric features like parallelism and symmetry. The brain areas active for geometric figures are also active in processing mathematical concepts, even in blind mathematicians, linking geometric shapes to abstract math concepts. The effects are stronger in adults than in 6-year-old Western children. Similar phenomena do not appear in great apes, suggesting that this is uniquely human and developmental.

      Strengths:

      Multiple converging techniques of brain imaging and testing of mathematical models. Careful reasoning at every step of research and presentation of research, anticipating and addressing possible reservations. Connecting these findings to other findings, brain, behavior, and historical/anthropological, to suggest broad and important fundamental connections between abstract visual-spatial forms and mathematical reasoning, further suggesting visual-spatial origins of mathematical reasoning.

      Weaknesses:

      Perhaps the manuscript could emphasize that the areas recruited by geometric figures but not objects are spatial, with reduced processing in visual areas. It also seems important to say that the images of real objects are interpreted as representations of 3D objects, as they activate the same visual areas as real objects. By contrast, the images of geometric forms are not interpreted as representations of real objects but rather perhaps as 2D abstractions. The authors use the term "symbolic." That use of that term could usefully be expanded here.

      Pigeons have remarkable visual systems. According to my fallible memory, Herrnstein investigated visual categories in pigeons. They can recognize individual people from fragments of photos, among other feats. I believe pigeons failed at geometric figures and also at cartoon drawings of things they could recognize in photos. This suggests they did not interpret line drawings of objects as representations of objects.

      Categories are established in part by contrast categories; are quadrilaterals, triangles, and circles different categories?

      It would be instructive to investigate stimuli that are on a continuum from representational to geometric, e.g., table tops or cartons under various projections, or balls or buildings that are rectangular or triangular. Building parts, inside and out. like corners. Objects differ from geometric forms in many ways: 3D rather than 2D, more complicated shapes, and internal texture. The geometric figures used are flat, 2-D, but much geometry is 3-D (e. g. cubes) with similar abstract features. The feature space of geometry is more than parallelism and symmetry; angles are important, for example. Listing and testing features would be fascinating. Similarly, looking at younger or preferably non-Western children, as Western children are exposed to shapes in play at early ages.

      What in human experience but not the experience of close primates would drive the abstraction of these geometric properties? It's easy to make a case for elaborate brain processes for recognizing and distinguishing things in the world, shared by many species, but the case for brain areas sensitive to processing geometric figures is harder. The fact that these areas are active in blind mathematicians and that they are parietal areas suggests that what is important is spatial far more than visual. Could these geometric figures and their abstract properties be connected in some way to behavior, perhaps with fabrication and construction as well as use? Or with other interactions with complex objects and environments where symmetry and parallelism (and angles and curvature--and weight and size) would be important? Manual dexterity and fabrication also distinguish humans from great apes (quantitatively, not qualitatively), and action drives both visual and spatial representations of objects and spaces in the brain. I certainly wouldn't expect the authors to add research to this already packed paper, but raising some of the conceptual issues would contribute to the significance of the paper.

    1. eLife Assessment

      This fundamental study combines in vitro reconstitution experiments and molecular dynamics simulations to elucidate how membrane lipids are transported from the outer to the inner membrane of mitochondria. The authors provide convincing evidence that a positive membrane curvature is critical for membrane lipid extraction. The work will be of broad interest to cell biologists and biochemists.

    2. Reviewer #1 (Public review):

      Lipid transfer proteins (LTPs) play a crucial role in the intramembrane lipid exchange within cells. However, the molecular mechanisms that govern this activity remain largely unclear. Specifically, the way in which LTPs surmount the energy barrier to extract a single lipid molecule from a lipid bilayer is not yet fully understood. This manuscript investigates the influence of membrane properties on the binding of Ups1 to the membrane and the transfer of phosphatidic acid (PA) by the LTP. The findings reveal that Ups1 shows a preference for binding to membranes with positive curvature. Moreover, coarse-grained molecular dynamics simulations indicate that positive curvature decreases the energy barrier associated with PA extraction from the membrane. Additionally, lipid transfer assays conducted with purified proteins and liposomes in vitro demonstrate that the size of the donor membrane significantly impacts lipid transfer efficiency by Ups1-Mdm35 complexes, with smaller liposomes (characterized by high positive curvature) promoting rapid lipid transfer.

      This study offers significant new insights into the reaction cycle of phosphatidic acid (PA) transfer by Ups1 in mitochondria. Notably, the authors present compelling evidence that, alongside negatively charged phospholipids, positive membrane curvature enhances lipid transfer - an effect that is particularly relevant at the mitochondrial outer membrane. The experiments are technically robust, and my primary feedback pertains to the interpretation of specific results.

      (1) The authors conclude from the lipid transfer assays (Figure 5) that lipid extraction is the rate-limiting step in the transfer cycle. While this conclusion seems plausible, it should be noted that the authors employed high concentrations of Ups1-Mdm35 along with less negatively charged phospholipids in these reactions. This combination may lead to binding becoming the rate-limiting factor. The authors should take this point into consideration. In this type of assay, it is challenging to clearly distinguish between binding, lipid extraction, and membrane dissociation as separate processes.

      (2) The authors should discuss that variations in the size of liposomes will also affect the distance between them at a constant concentration, which may affect the rate of lipid transfer. Therefore, the authors should determine the average size and size distribution of liposomes after sonication (by DLS or nanoparticle analyzer, etc.).

      (3) The authors use NBD-PA in the lipid transfer assays. Does the size of the donor liposomes affect the transfer of NBD-PA and DOPA similarly? Since NBD-labeled lipids are somewhat unstable within lipid bilayers (as shown by spontaneous desorption in Figure 5B), monitoring the transfer of unlabeled PA in at least one setting would strengthen the conclusion of the swap experiments.

      (4) The present study suggests that membrane domains with positive curvature at the outer membrane may serve as starting points for lipid transport by Ups1-Mdm35. Is anything known about the mechanisms that form such structures? This should be discussed in the text.

    3. Reviewer #2 (Public review):

      Summary:

      Lipid transfer between membranes is essential for lipid biosynthesis across different organelle membranes. Ups1-Mdm35 is one of the best-characterized lipid transfer proteins, responsible for transferring phosphatidic acid (PA) between the mitochondrial outer membrane (OM) and inner membrane (IM), a process critical for cardiolipin (CL) synthesis in the IM. Upon dissociation from Mdm35, Ups1 binds to the intermembrane space (IMS) surface of the OM, extracts a PA molecule, re-associates with Mdm35, and moves through the aqueous IMS to deliver PA to the IM. Here, the authors analyzed the early steps of this PA transfer - membrane binding and PA extraction - using a combination of in vitro biochemical assays with lipid liposomes and purified Ups1-Mdm35 to measure liposome binding, lipid transfer between liposomes, and lipid extraction from liposomes. The authors found that membrane curvature, a previously overlooked property of the membrane, significantly affects PA extraction but not PA insertion into liposomes. These findings were further supported by MD simulations.

      Strengths:

      The experiments are well-designed, and the data are logically interpreted. The present study provides an important basis for understanding the mechanism of lipid transfer between membranes. 

      Weaknesses:

      The physiological relevance of membrane curvature in lipid extraction and transfer still remains open.

    4. Reviewer #3 (Public review):

      The manuscript by Sadeqi et al. studies the interactions between the mitochondrial protein Ups1 and reconstituted membranes. The authors apply synthetic liposomal vesicles to investigate the role of pH, curvature, and charge on the binding of Ups1 to membranes and its ability to extract PA from them. The manuscript is well written and structured. With minor exceptions, the authors provide all relevant information (see minor points below) and reference the appropriate literature in their introduction. The underlying question of how the energy barrier for lipid extraction from membranes is overcome by Ups1 is interesting, and the data presented by the authors could offer a valuable new perspective on this process. It is also certainly a challenging in vitro reconstitution experiment, as the authors aim to disentangle individual membrane properties (e.g., curvature, charge, and packing density) to study protein adsorption and lipid transfer. I have one major suggestion and a few minor ones that the authors might want to consider to improve their manuscript and data interpretation:

      Major Comments:

      The experiments are performed with reconstituted vesicles, which are incubated with recombinant protein variants and quantitatively assessed in flotation and pelleting assays. According to the Materials and Methods section, the lipid concentration in these assays is kept constant at 5 µM. However, the authors change the size of the vesicles to tune their curvature. Using the same lipid concentration but varying vesicle sizes results in different total vesicle concentrations. Moreover, larger vesicles (produced by freeze-thawing and extrusion) tend to form a higher proportion of multilamellar vesicles, thus also altering the total membrane area available for binding. Could these differences in the experimental system account for the variation in binding? To address this, the authors would need to perform the experiments either under saturation (excess protein) conditions or find an experimental approach to normalize for these differences.

    5. Author response:

      Reviewer #1:

      Lipid transfer proteins (LTPs) play a crucial role in the intramembrane lipid exchange within cells. However, the molecular mechanisms that govern this activity remain largely unclear. Specifically, the way in which LTPs surmount the energy barrier to extract a single lipid molecule from a lipid bilayer is not yet fully understood. This manuscript investigates the influence of membrane properties on the binding of Ups1 to the membrane and the transfer of phosphatidic acid (PA) by the LTP. The findings reveal that Ups1 shows a preference for binding to membranes with positive curvature. Moreover, coarse-grained molecular dynamics simulations indicate that positive curvature decreases the energy barrier associated with PA extraction from the membrane. Additionally, lipid transfer assays conducted with purified proteins and liposomes in vitro demonstrate that the size of the donor membrane significantly impacts lipid transfer efficiency by Ups1-Mdm35 complexes, with smaller liposomes (characterized by high positive curvature) promoting rapid lipid transfer.

      This study offers significant new insights into the reaction cycle of phosphatidic acid (PA) transfer by Ups1 in mitochondria. Notably, the authors present compelling evidence that, alongside negatively charged phospholipids, positive membrane curvature enhances lipid transfer - an effect that is particularly relevant at the mitochondrial outer membrane. The experiments are technically robust, and my primary feedback pertains to the interpretation of specific results.

      (1) The authors conclude from the lipid transfer assays (Figure 5) that lipid extraction is the rate-limiting step in the transfer cycle. While this conclusion seems plausible, it should be noted that the authors employed high concentrations of Ups1-Mdm35 along with less negatively charged phospholipids in these reactions. This combination may lead to binding becoming the rate-limiting factor. The authors should take this point into consideration. In this type of assay, it is challenging to clearly distinguish between binding, lipid extraction, and membrane dissociation as separate processes.

      We thank the reviewer for the constructive and positive evaluation of our manuscript. We agree that, while our data support the interpretation that the rate-limiting step occurs at the donor membrane, it is difficult to dissect in our assay which of the individual steps at the donor membrane - such as binding of Ups1, lipid extraction into the binding pocket, or dissociation of Ups1 - is rate-limiting. Nevertheless, although we cannot exclude contributions from membrane binding or dissociation, several observations suggest that lipid extraction is a rate-limiting step under our experimental conditions.

      The acceptor membrane has a similar lipid composition to the donor membrane (in tendency, the donor membrane is even a bit richer in binding-promoting lipids). If binding was ratelimiting, similar constraints would be expected at the acceptor membrane during lipid insertion. However, this is not observed.

      Regarding dissociation, if this step were rate-limiting, one would expect similar constraints to be evident at the acceptor vesicles as well. Nevertheless, membrane dissociation might be mechanistically coupled to lipid extraction and thus difficult to evaluate as an independent step.

      Based on our data and the considerations described above, we suggest that lipid extraction is the dominant rate-limiting step at the donor membrane under our conditions. However, we agree that a clear separation of these individual steps is not possible with the current experimental design. We will revise the corresponding passage to clarify that the rate-limiting step occurs at the donor membrane and, based on our observations, likely involves lipid extraction. Future studies aiming on dissecting these steps, will be important for elucidating the mechanism and regulation of Ups1-mediated lipid transfer both in vitro and in vivo.

      (2) The authors should discuss that variations in the size of liposomes will also affect the distance between them at a constant concentration, which may affect the rate of lipid transfer. Therefore, the authors should determine the average size and size distribution of liposomes after sonication (by DLS or nanoparticle analyzer, etc.)

      We agree that variations in liposome size will influence the average distance between vesicles at a given lipid concentration, which may in turn affect the rate of lipid transfer. As suggested, we will include DLS measurements to characterize the size distribution of our different liposome preparations.

      Our setup was designed to keep the total membrane surface area comparable across conditions. This approach ensures a comparable overall binding capacity for Ups1 and enables the comparison of membrane binding and lipid extraction from different membranes. However, we agree that vesicle spacing, which is affected by liposome size at constant lipid concentration, could potentially influence certain steps in the transfer process, such as the time required for Ups1 to travel between donor and acceptor membranes. Whether this intermembrane travel time contributes to rate limitation is indeed an interesting question, and we will address this point through further discussion in the revised manuscript.

      Investigating such effects in our current experimental system would require altering the vesicle concentration, which would in turn change the total membrane surface area and introduce additional variables. Nevertheless, exploring the influence of vesicle spacing and intermembrane distance on lipid transfer represents a promising direction for future studies aimed at dissecting the rate-limiting steps of the transfer cycle.

      (3) The authors use NBD-PA in the lipid transfer assays. Does the size of the donor liposomes affect the transfer of NBD-PA and DOPA similarly? Since NBD-labeled lipids are somewhat unstable within lipid bilayers (as shown by spontaneous desorption in Figure 5B), monitoring the transfer of unlabeled PA in at least one setting would strengthen the conclusion of the swap experiments.

      Ups1-mediated transfer of PA has been demonstrated both by mass spectrometry analysis of donor and acceptor vesicles (Connerth et al., 2012) and by NBD-fluorescence-based lipid transfer assays (Lu et al., 2020; Miliara et al., 2015; Miliara et al., 2019; Miliara et al., 2023; Potting et al., 2013; Watanabe et al., 2015). The fluorescence-based approach has been the most widely applied across multiple studies and has enabled detailed analysis of various aspects of lipid transfer by Ups1. It has been used to investigate mutants of key structural elements—such as the lipid-binding pocket and the α2–loop region. It has also been used to analyze fusion constructs between Ups1 and Mdm35, the influence of Mdm35 variants, and competition with excess Mdm35. Additionally, by comparing the transfer of NBD-labeled PA and NBD-labeled PS, this assay has provided insights into the determinants of the lipid specificity of Ups1. Hence, our experiments are based on the standard assay used to analyse lipid transfer in the field and thus can be corralated with the majority of published data.

      Nevertheless, we agree that it is important to keep in mind that NBD labeling may alter the biophysical properties of lipids and, consequently, affect their transfer efficiency. Moreover, NBD-labeled lipids are not suitable for comparing the transfer efficiency of different PA species, as the label itself may mask differences in acyl chain composition. Therefore, it will be valuable to establish complementary methods that do not rely on NBD-labeled PA. We aim to develop these non-standard methods for possible inclusion in the present study, but even if not fully implemented at this stage, they will certainly form an important part of future investigations.

      (4) The present study suggests that membrane domains with positive curvature at the outer membrane may serve as starting points for lipid transport by Ups1-Mdm35. Is anything known about the mechanisms that form such structures? This should be discussed in the text.

      The origin of positively curved membrane domains is indeed highly relevant in the context of our findings, and while not the primary focus of this work, we will place more emphasis on discussing how such curvature may arise. Mechanisms include the action of curvature-generating proteins, asymmetric lipid composition and curvature induced at membrane contact sites. We have so far included examples of proteins in the outer mitochondrial membrane that are expected to influence curvature in their vicinity, and we will expand on this aspect and other contributing factors more thoroughly in the revised text.

      Reviewer #2:

      Summary:

      Lipid transfer between membranes is essential for lipid biosynthesis across different organelle membranes. Ups1-Mdm35 is one of the best-characterized lipid transfer proteins, responsible for transferring phosphatidic acid (PA) between the mitochondrial outer membrane (OM) and inner membrane (IM), a process critical for cardiolipin (CL) synthesis in the IM. Upon dissociation from Mdm35, Ups1 binds to the intermembrane space (IMS) surface of the OM, extracts a PA molecule, re-associates with Mdm35, and moves through the aqueous IMS to deliver PA to the IM. Here, the authors analyzed the early steps of this PA transfer - membrane binding and PA extraction - using a combination of in vitro biochemical assays with lipid liposomes and purified Ups1-Mdm35 to measure liposome binding, lipid transfer between liposomes, and lipid extraction from liposomes. The authors found that membrane curvature, a previously overlooked property of the membrane, significantly affects PA extraction but not PA insertion into liposomes. These findings were further supported by MD simulations.

      Strengths:

      The experiments are well-designed, and the data are logically interpreted. The present study provides an important basis for understanding the mechanism of lipid transfer between membranes.  

      Weaknesses:

      The physiological relevance of membrane curvature in lipid extraction and transfer still remains open.

      We thank the reviewer for the constructive feedback on our work. We agree that the physiological relevance of membrane curvature in lipid extraction and transfer remains an open question. Our data show that Ups1 binding to native-like OM membranes under physiological pH conditions is curvature-dependent, supporting the idea that this mechanism may optimize lipid transfer in vivo. While the intricate biophysical basis of this behaviour can only be dissected in vitro, these findings offer valuable insight into how curvature may functionally regulate Ups1 activity in the cellular context. To directly test this, it will be important in future studies to identify Ups1 mutants that lack curvature sensitivity and assess their performance in vivo, which will help clarify the physiological importance of this mechanism.

      Reviewer #3:

      The manuscript by Sadeqi et al. studies the interactions between the mitochondrial protein Ups1 and reconstituted membranes. The authors apply synthetic liposomal vesicles to investigate the role of pH, curvature, and charge on the binding of Ups1 to membranes and its ability to extract PA from them. The manuscript is well wrifen and structured. With minor exceptions, the authors provide all relevant information (see minor points below) and reference the appropriate literature in their introduction. The underlying question of how the energy barrier for lipid extraction from membranes is overcome by Ups1 is interesting, and the data presented by the authors could offer a valuable new perspective on this process. It is also certainly a challenging in vitro reconstitution experiment, as the authors aim to disentangle individual membrane properties (e.g., curvature, charge, and packing density) to study protein adsorption and lipid transfer. I have one major suggestion and a few minor ones that the authors might want to consider to improve their manuscript and data interpretation:

      Major Comments:

      The experiments are performed with reconstituted vesicles, which are incubated with recombinant protein variants and quantitatively assessed in flotation and pelleting assays. According to the Materials and Methods section, the lipid concentration in these assays is kept constant at 5 µM. However, the authors change the size of the vesicles to tune their curvature. Using the same lipid concentration but varying vesicle sizes results in different total vesicle concentrations. Moreover, larger vesicles (produced by freeze-thawing and extrusion) tend to form a higher proportion of multilamellar vesicles, thus also altering the total membrane area available for binding. Could these differences in the experimental system account for the variation in binding? To address this, the authors would need to perform the experiments either under saturation (excess protein) conditions or find an experimental approach to normalize for these differences.

      We thank the reviewer for the constructive and positive comments. We agree that, since the total number of lipids was kept constant, the number of vesicles varied with vesicle size in our experiments. However, the setup was specifically designed to maintain a comparable total membrane surface area across conditions, ensuring a comparable number of available binding sites for Ups1. Because membrane surface area decreases with the square of the vesicle radius, keeping vesicle number constant would have led to a marked reduction in binding surface. Our approach was therefore aimed at preserving comparable binding capacity while varying membrane curvature.

      With respect to multilamellarity, we thank the reviewer for addressing this important point. As described above, we aimed to maintain a constant total membrane surface area across all conditions to ensure an equal number of potential binding sites. We agree that multilamellarity in large liposomes could restrict accessibility to part of the membrane surface. However, we see in our experiments that even when the total membrane surface area of the small liposomes is reduced to one quarter of the standard amount, binding to the small liposomes remained stronger than to the larger liposomes at the higher concentration. This strongly indicates that restricted accessibility cannot account for the curvature-specific effect observed. Nonetheless, we will further address this aspect experimentally and in the discussion of the revised manuscript.

      References

      Connerth, M., Tatsuta, T., Haag, M., Klecker, T., Westermann, B., & Langer, T. (2012). Intramitochondrial transport of phosphatidic acid in yeast by a lipid transfer protein. Science, 338(6108), 815-818. https://doi.org/10.1126/science.1225625 

      Lu, J., Chan, C., Yu, L., Fan, J., Sun, F., & Zhai, Y. (2020). Molecular mechanism of mitochondrial phosphatidate transfer by Ups1. Commun Biol, 3(1), 468. https://doi.org/10.1038/s42003-020-01121-x 

      Miliara, X., Garnef, J. A., Tatsuta, T., Abid Ali, F., Baldie, H., Perez-Dorado, I., Simpson, P., Yague, E., Langer, T., & Mafhews, S. (2015). Structural insight into the TRIAP1/PRELI-like domain family of mitochondrial phospholipid transfer complexes. EMBO Rep, 16(7), 824-835. https://doi.org/10.15252/embr.201540229 

      Miliara, X., Tatsuta, T., Berry, J. L., Rouse, S. L., Solak, K., Chorev, D. S., Wu, D., Robinson, C. V., Mafhews, S., & Langer, T. (2019). Structural determinants of lipid specificity within Ups/PRELI lipid transfer proteins. Nat Commun, 10(1), 1130. https://doi.org/10.1038/s41467-019-09089-x 

      Miliara, X., Tatsuta, T., Eiyama, A., Langer, T., Rouse, S. L., & Mafhews, S. (2023). An intermolecular hydrogen bonded network in the PRELID-TRIAP protein family plays a role in lipid sensing. Biochim Biophys Acta Proteins Proteom, 1871(1), 140867. https://doi.org/10.1016/j.bbapap.2022.140867 

      Posng, C., Tatsuta, T., Konig, T., Haag, M., Wai, T., Aaltonen, M. J., & Langer, T. (2013). TRIAP1/PRELI complexes prevent apoptosis by mediating intramitochondrial transport of phosphatidic acid. Cell Metab, 18(2), 287-295. https://doi.org/10.1016/j.cmet.2013.07.008 

      Watanabe, Y., Tamura, Y., Kawano, S., & Endo, T. (2015). Structural and mechanistic insights into phospholipid transfer by Ups1-Mdm35 in mitochondria. Nat Commun, 6, 7922. https://doi.org/10.1038/ncomms8922

    1. eLife Assessment

      This is a very important study in which the authors have modified ChIP-seq and 4C-seq with a urea step, which drastically changes the pattern of chromatin interactions observed for SATB1, but not other proteins (including CTCF). The study highlights that the urea protocols provide a complementary view of protein-chromatin interactions for some proteins, which can uncover previously hidden, functionally significant layers of chromatin organization. If applied more widely, these protocols may significantly further our understanding of chromatin organization. The study's findings are supported by a wealth of controls, making the evidence compelling.

    2. Reviewer #1 (Public review):

      Summary:

      The nuclear protein SATB1 was originally identified as a protein of the 'nuclear matrix', an aggregate of nuclear components that arose upon extracting nuclei with high salt. While the protein was assumed to have a global function in chromatin organization, it has subsequently been linked to a variety of pathological conditions, notably cancer. The mapping of the factor by conventional ChIP procedures showed strong enrichment in active, accessible chromatin, suggesting a direct role in gene regulation, perhaps in enhancer-promoter communication. These findings did not explain why SATB1-chromatin interaction resisted the 2 M salt extraction during early biochemical fractionation of nuclei.

      The authors, who have studied SATB1 for many years, now developed an unusual variation of the ChIP procedure, in which they purify crosslinked chromatin by centrifugation through 8 M urea. Remarkably, while they lose all previously mapped signals for SATB1 in active chromatin, they now gain many binding events in silent regions of the genome, represented by lamin-associated domains (LADs).

      SATB1 had previously been shown by the authors and others to bind to DNA with special properties, termed BUR for 'base-unpairing regions'). BURs are AT-rich and apparently enriched in equally AT-rich LADs. The 'urea-ChIP' pattern is essentially complementary to the classical ChIP pattern. The authors now speculate that the previously known SATB1 binding pattern determined by standard ChIP, which does not overlap BURs particularly well, is due to indirect chromatin binding, whereas they consider the urea-ChIP profile, which fits better to the BUR distribution on the chromosome, to be due to direct binding.

      Building on the success with urea-ChIP the authors adapted the 4C-procedure of chromosome conformation mapping to work with urea-purified chromatin. The data suggest a model according to which BUR-bound SATB1 mediates long-distance interaction between active loci and some kind of scaffold structure formed by SATB1. Because cell type-specific differences are observed, they suggest that the SATB1 interactions are functionally relevant.

      Strengths:

      Given the unusual findings of essentially mutually exclusive 'standard ChIP' and 'urea-ChIP' profiles, the authors conducted many appropriate controls. They showed that all SATB1 peaks in urea-ChIP and 96% of peaks in standard-ChIP represent true signals, as they are not observed in a SATB1 knockout cell line. They also show that the urea-ChIP and standard ChIP yield similar profiles for CTCF and polycomb complex subunits. The data appear reproducible judged by at least two replicates and triangulation. The SATB1 KO cells provide a nice control for the specificity of signals, including those that arise from their elaborately modified 4C protocol.

      In their revised manuscript the authors provide relevant background information concerning the effect of urea on the denaturation of macromolecules. Importantly, they argue convincingly that urea does not denature DNA under their conditions.

      Weaknesses:

      Despite the authors' efforts to explain their findings along with a lot of background information, some readers may be left confused due to the complexity of the system. BURs are found enriched in LADs, but are also present in active chromatin. SATB1 binds a subset of BURs, but the reason for discrimination remains unclear. SATB1 appears to bind chromatin in at least two modes with differing diffusion properties and exactly how this relates to the indirect and direct chromatin binding modes is mechanistically unclear.

      The authors resort to the term 'SATB1-enriched subnuclear structure' to describe the profile gained through denaturing ChIP, thus avoiding strong statements about involvement of known nuclear structures (such as LADs or heterochromatin) and about functional implications.

      The authors acknowledge a potential for RNA to be involved in modulating SATB1 interactions with chromatin, but leave this for future investigation.

      Comment on revised version:

      The authors revised their manuscript to my satisfaction.

    3. Reviewer #2 (Public review):

      Summary:

      This study describes the key observation that SATB1 binds directly to so-called BUR elements. This is in contrast to several other reports describing SATB1 binding to promoters and enhancers. This discrepancy is explained by the authors to depend on the features of the ChIP technique being used. Urea-ChIP, innovated by the authors, strips off protein-protein interactions that compound conventional ChIP methods. The authors convincingly make the case that SATB1 and a key genome organiser, CTCF, largely bind different sites, as particularly evident in Figure 2A. In contrast, standard ChIP shows considerable overlap between their sites (Figure 2-figure supplement 1). The report documents convincingly that SATB1 partitions the genome independent of so-called TADs to influence expression patterns. SATB1 controls long-range interactions in thymocytes, and knock down of SATB1 does not affect the TAD patterns.

      Strengths:

      A new and innovative adaptation of ChIP-seq (urea ChIP-seq) has enabled the authors to successfully question existing data on the patterns of SATB1 binding to the genome. The authors provide a wealth of data to reinforce their claims. This report thus rectifies misconceptions about SATB1 function, which is particularly important given its role in metastasising cancer cells.

      Weaknesses:

      None

    4. Author response:

      The following is the authors’ response to the original reviews

      Reviewer #1:

      (1) 8 molar urea not only denatures proteins but also denatures DNA. Obviously, this does not affect the ChIP, since antibodies often recognize small linear epitopes and the proteins are crosslinked. However, under high urea conditions the BUR elements should be rendered single-stranded, and one wonders whether this has any effect on the procedure. The authors should alert the reader of these circumstances.

      Thank you for raising this important question about the effects of 8M urea. We have added a brief paragraph explaining this point in the revised manuscript. Despite common misconceptions, 8M urea by itself does not actively convert double-stranded DNA to single-stranded DNA. For this conversion to occur, a heat denaturation step is required. Once DNA is heat-denatured to become single-stranded, urea can maintain this configuration. This is why the addition of 8M urea to acrylamide gel electrophoresis is a standard method for analyzing single-stranded oligonucleotides, but the DNA must first be denatured by heat (Summer et al., J. Vis. Exp. (32), e1485, DOI : 10.3791/1485). This is clearly described in published work comparing the status of DNA with and without heat treatment in an 8M urea-containing buffer (Hegedus et al., Nucl.Acids Res. 2009 (doi:10.1093/nar/gkp539).

      We have additional evidence supporting this conclusion in the context of our urea ultracentrifugation experiment. Both crosslinked and un-crosslinked genomic DNA purified by 8M urea centrifugation can be digested with restriction enzymes, which indicates that the DNA remains double-stranded. For instance, we previously published SATB1 ChIP-3C results using Sau3A-digested DNA after urea purification. In the current paper, we used HindIII to digest urea-purified DNA for urea4C-seq. The BUR reference map can also be generated after restriction digestion of urea-purified DNA and isolating and sequencing SATB1-bound restriction fragments in vitro. If genomic DNA were denatured by 8M urea ultracentrifugation, we would not have been able to digest it with restriction enzymes to obtain these results.

      We have now added a sentence noting that SATB1 is a double-stranded DNA-binding protein that does not bind to single-stranded DNA, as we have previously shown (Dickinson et al., 1992, Ref 32).

      (2) An important conclusion is that urea-ChIP reveals direct DNA binding events, whereas standard ChIP shows indirect binding (which is stripped off by urea). I do not see any evidence for direct binding. At low resolution, predicted BUR elements are enriched in domains where SATB-1 is mapped by urea-ChIP. A statement like 'In a zoomed-in view, covering a 430 kb region, SATB1 sites identified from urea ChIP-seq precisely coincided with BUR peaks' is certainly not correct: most BUR peaks do not show significant SATB-1 binding. The randomly chosen regions shown in Figure 4 – Supplement 1 show how poor the overlap of SATB-1 and BURs is; indeed, they show that SATB-1 binds DNA mostly at non-BUR sites. I see Figure 2D, but such cumulative plots can be highly biased by very few cases. I suggest showing these data in heat maps instead.

      We believe there may be some confusion regarding the interpretation of our figures. Looking at Track 3 (BUR reference map, RED peaks) and urea SATB1 Tracks 4 and 5 (replicas from two independent experiments) in Fig. 2B, the SATB1 peaks detected by urea ChIP-seq do indeed coincide with BUR peaks. In the revised manuscript, we have provided a further ‘zoomed-in’ view to better illustrate this point and also provided the underlying BUR sequence from one of these SATB1-bound regions (Figure 2—supplement figure 1).

      It is true that many more BURs exist than SATB1-bound BURs, especially in gene-poor regions where BURs are clustered. However, from the perspective of SATB1-bound peaks, the majority of these coincide with BURs, as shown by both deepTools analyses and new heatmap, as suggested (Figure 2E, and Figure 7—supplement figure 3).

      The results from our genome-wide quantitative analyses using deepTools to compare peaks from urea SATB1 ChIP-seq data and the BUR reference map shown in Supplementary Tables 1 and 2 are consistent with the heatmap analyses.

      We must apologize for an error in the scaling of the y-axis in Figure 4-supplement figure 1 that likely contributed to some confusion. We have corrected our mistake in the revised manuscript. As we were preparing our figures, when placed in the figure and axes relabeled for legibility, the BUR reference peaks were mislabeled on their y-axis. In the figure the peaks were erroneously labeled on a scale of 0.1-1 read counts/million reads, but the data shown is actually scaled at 0.1 to 2 read counts per million reads. Unfortunately, we did not realize this error and, using the figure as a guide for scaling, provided urea SATB1 ChIP-seq peaks at a scale of 0.1-1 read counts/million reads to match the mislabeled BUR reference track. This had the effect of reducing the signal/noise in the SATB1 ChIP-seq data (Figure 1). We have now standardized the y-axis for fair comparison using a scaling of the y-axis at 0.1-2 for all tracks.  This will more clearly show that there are indeed more BUR peaks than SATB1-bound sites, consistent with our quantitative analysis.

      We hope that these clarifications as well as the added heatmaps and binding site example allay the concerns about the specificity and overlap of SATB1 binding on BURS.

      (3) In Figure 6C 'peaks' are compared. However, looking at Figure 4 - Supplement 1 again it is clear that peak calling can yield a misleading impression. Figure 6D suggests that there are more BURs than SATB-1 peaks but this is not true from looking at the browser.

      We thank the reviewer for this observation. As noted in our response to point 2 above, the inconsistent y-axis scaling in Figure 4-supplement figure 1 created a misleading impression, which we have corrected in the revised manuscript. When properly displayed with consistent y-axis scaling, the browser view aligns with our quantitative data showing that there are indeed many more BURs than SATB1-bound sites. As mentioned under 2 above, we have performed genome-wide quantitative analysis by deepTools (Supplementary Tables 1 and 2) to confirm the results shown by bar graphs in Fig. 6C, 6D and Fig. 2D. 

      In Figure 6C, the bars show the percentage of SATB1-bound peaks in each cell type (denominator) that overlap with confirmed BUR sites in the BUR reference map (numerator). In Figure 6D, we show the percentage of total BUR sites in the BUR reference map (denominator) that are bound by SATB1 from urea ChIP-seq (numerator). To avoid any confusion, we have added brief subtitles to Figures 6C and 6D in the revised manuscript.

      (4) An important conclusion is that urea-ChIP reveals direct DNA binding events, whereas standard ChIP shows indirect binding (which is stripped off by urea). I do not yet see any evidence for direct binding. It cannot be excluded that the binding is RNA-mediated. The authors mention in passing that urea-ChIP material still contains (specific!) RNA. Given that this is a new procedure, the authors should document the RNA content of urea-ChIP and RNase-treat their samples prior to ChIP to monitor an RNA contribution.

      Thank you for raising this important point. The direct binding of SATB1 to BURs is well-established in our previous work. Indeed, this was the main motivation to explore the reason for the lack of evidence for genome-wide SATB1 binding to BURs in the DNA-binding profile by standard ChIP-seq. This has been a major point of confusion for us for many years.

      SATB1 was originally identified through a search for mammalian proteins that could recognize BURs specifically and not just any A+T-rich sequence. The Satb1 gene was originally cloned by an expression cDNA library and encoded SATB1 protein bound the BUR probe but not a mutated AT-rich BUR (control) probe.  Subsequent experiments confirmed that SATB1 specifically binds to many BURs without requiring additional factors. Furthermore, SATB1 recognizes BURs by binding in the minor groove of double-stranded DNA, presumably recognizing the altered phosphate backbone structure of BUR DNA, rather than accessing nucleotide bases (Dickinson et al, 1992).

      We do agree with the reviewer, however, that there is a possibility that RNA can redirect SATB1 to different subsets of BURs and/or to interact indirectly with different regulatory regions depending on cell type or developmental stage. Although urea ultracentrifugation clearly separates most RNA (found in the middle region of the tube) from genomic DNA (pelleted at the bottom) (de Belle et al., 1998), upon crosslinking cells, a small quantity of RNA is found co-pelleted with DNA (our recent unpublished results). This RNA, tightly associated with crosslinked chromatin, may have some impact on SATB1 function.

      Based on our preliminary data, we are currently planning to study the impact of RNA using RNase A as well as by targeting specific RNAs employing an anti-sense approach. We believe that thoroughly addressing the impact of RNA warrants a full paper, including the potential roles of specific non-coding RNAs in SATB1 function, and thus is beyond the scope of the current paper. However, we have now added discussion of this important point in the manuscript.

      (5) An important aspect of the model is that SATB1 tethers active genes to inactive LADs. However, in the 4C experiment the BUR elements used to anchor the looping are both in the accessible, active chromatin domain. If the authors want to maintain their statement, they must show a 4C result that connects the 2 distinct domains and transverses A/B domain boundaries. Currently, the data only show a looping within accessible chromatin.

      We appreciate REVIEWER 1 for bringing up the important point that our model could potentially be interpreted as “SATB1 tethers active genes to inactive LADs.” Since we describe that BURs are enriched in LADs and that SATB1 binds a subset of BURs, readers may assume that we aim to demonstrate, through urea 4C-seq, that SATB1 tethers active genes to transcriptionally-inactive LADs (via BURs). However, this is not our intention in the model (Figure 8). In the experiment we designed for our present study,  we selected BUR-1 and BUR-2 as viewpoints from a non-LAD gene-rich region (inter-LAD). Because these BURs are bound by SATB1, it indicates that these BURs are part of the “hard-to-access” SATB1-rich subnuclear structure, which resists extraction, in contrast to accessible chromatin. Thus, we illustrate in the model that BURs anchored to the SATB1-rich nuclear substructure make contact with accessible chromatin over long distances in a SATB1-dependent manner. Therefore, we do not intend to conclude that SATB1 mediates interactions between LADs and inter-LADs (accessible chromatin) from our current study: this would be a topic for future research. In the original model in the submitted manuscript, we used the terms “inaccessible” and “accessible.” In the revised version, we clarified this in the model by changing “inaccessible” to “SATB1-rich subnuclear structure” and carefully revised  the text in the Figure 8 legend to clarify the model. 

      At this time, we do not know exactly how LADs and SATB1 nuclear architecture are related spatially and functionally. While LADs are mapped as genomic domains in proximity to Lamin B1 by LaminB1-DamID, BURs are mapped at ~300-500 bp resolution by urea ChIP-seq. To gain further insight into this important question, a large body of DNA-FISH and immunoDNA-FISH experiments will be required, comparing different cell types to see whether and how specific BURs move between LADs and SATB1 nuclear architecture. Such experiments may benefit from testing the Gabrg1 and Gabra2 loci, where many BURs are anchored to SATB1 in neurons but not in thymocytes, for instance.  This is included in Discussion in the revised manuscript.

      Regarding the reviewer's second point about showing more extended domains for 4C interactions, we would like to highlight that Figure 5—supplement figure 3 in our submitted manuscript addresses this concern. This figure shows that BUR-interactions extend to multiple gene-rich regions across intervening gene-poor regions. Interestingly, BUR-1 and BUR-2 interactions skip a transcriptionally silent gene-rich region containing olfactory receptor genes but interact with subsequent gene-rich regions containing active genes. These data demonstrate that BUR-interactions do indeed traverse A- and B-compartment boundaries.  In the revised manuscript (in Figure 5—supplement figure 3), we newly added a Lamin B1-DamID (thymocyte) track.  Comparing with LADs, BUR-1 interactions occur mostly in non-LAD regions. Some minor overlap with LADs was detected in high resolution views (not shown). Future experiments testing BUR viewpoints that reside within LADs are required to assess whether SATB1 mediates interactions between B and A compartments.

      (6) The description of the urea-co-immunoprecipitation experiment (Figure 3C) could be improved to make it unequivocally clear that co-binding to chromatin is tested, not protein-protein interaction (which is destroyed by urea).

      Thank you for this helpful suggestion. We have revised the text in the manuscript by stating “Distinct from protein-protein co-immunoprecipitation (co-IP) using whole cell or nuclear extracts, we examined the direct co-binding status on chromatin in vivo of SATB1 and CTCF or cohesin by urea ChIP-Western”.

      Reviewer #2:

      (1) Since SATB1 has been described to interact with beta-catenin, I wonder if the authors have looked at TCF4/TCF7l2 binding patterns and their potential overlap with SATB1 binding patterns. This might appear a trivial request. However, uncontrolled WNT signalling is a major feature of cancer undergoing metastasis - a process that the authors have earlier associated with unscheduled SATB1 expression in triple-negative breast cancer.

      We thank the reviewer for highlighting this important point about the potential relationship between SATB1 and TCF4/TCF7l2 binding patterns. Based on published observations with other factors (Rad21, CTCF, BRG1, RUNX) that show substantial overlap with SATB1 in standard ChIP-seq peaks(Kakugawa et al., Cell Rep 19, 1176-1188 (2017). DOI: 10.1016/j.celrep.2017.04.038. Poterlowicz et al., PLoS Genet, 2017 DOI: 10.1371/journal.pgen.1006966), we would anticipate that TCF4 might also show significant overlap with SATB1. An important question is whether the DNA binding profile of TCF4 depends on SATB1.

      We have not yet generated ChIP-seq data for TCF4 in the presence and absence of SATB1, but we agree that such experiments could provide important insights into cancer progression as well as brain function. This represents an interesting direction for future work. We have added this point in our discussion based on your kind suggestion.

      (2) The CTCF sizes indicated in the western blot analyses of Figures 3C and Figure 3 - supplement figure 2 do not display the normal size, which is around 130 kDa. Either the issue is erroneous marking or a so-called salt effect to slow the migration in the gel. Alternatively, it reflects a slower migrating form of CTCF generated by for example PARylation (by PARP1) that is known to approach 180 kDa. It would be useful if the authors could clarify this minor issue.

      We appreciate the reviewer pointing out this discrepancy. As the reviewer correctly noted, CTCF can appear at a higher molecular weight due to post-translational modifications such as PARylation and O-GlcNAcylation, which alter its migration during electrophoresis.

      Upon re-examination of our raw data for Figure 3—supplement figure 2A, we discovered that the marker lane for the CTCF panel was broken, and the 150kDa band was erroneously assigned. This led to the 150kDa marker being placed below the CTCF migration position, which is clearly an error. We thank the reviewer for bringing this to our attention.

      We have checked our other data and consistently observe CTCF migrating below the 150kDa band, similar to the pattern shown on the Abcam website for the antibody we used (ab128873) (Figure 2). For Figure 3-supplement figure 2, we will use a marker lane from a parallel gel with identical composition and run time to correctly indicate the molecular weight. We havealso corrected the marker position in Figure 3C.

      Reviewing Editor (Recommendations for the authors):

      (1) The introduction states that urea ChIP-seq is "unbiased", which is difficult to unambiguously determine and therefore might be an overstatement. Maybe the authors could consider rephrasing.

      We agree with the reviewer's assessment and have rephrased our description of the urea ChIP-seq method to avoid using the term "unbiased."

      (2) The authors propose that in standard ChIP, most SATB1 is in the insoluble fraction. This seems easy to test and demonstrating it may help to further clarify the differences between the protocols.

      We appreciate this suggestion and would like to clarify our description. What we stated in the manuscript was:

      "We envision that SATB1 bound to inaccessible nuclear regions may be lost in the insoluble fraction."

      This refers specifically to a subpopulation of SATB1 that is bound to the high-salt extraction-resistant nuclear substructure, not to the total SATB1 protein. We also noted elsewhere in the manuscript that:

      "SATB1 proteins are found in high salt-resistant fraction as well as salt-extracted fraction (40). Thus, it is possible that soluble SATB1 may associate with open chromatin."

      Our unpublished results show that SATB1 proteins exist in at least two distinct forms based on protein mobility: SATB1 with high mobility and another with very low or no mobility. While we have identified the SATB1 domain responsible for each of these distinct mobility patterns, we have not yet identified biochemical differences that would allow us to distinguish them conclusively. Therefore, an experiment to test the distribution of SATB1 in soluble versus insoluble fractions would show SATB1 in both fractions but would not necessarily provide information about the functional significance of these different populations. We believe this is an important area for future research and are working to develop tools to specifically distinguish and characterize SATB1 in the soluble versus insoluble fractions.

    1. eLife Assessment

      This useful modeling study shows how spatial representations, similar to those seen in experimental data, emerge in a recurrent neural network trained on a navigation task. The training required path integration and decodability but did not rely on grid cell inputs. The network modeling is solid, though the link to experimental data could be strengthened.

    2. Reviewer #1 (Public review):

      Summary:

      This work studies representations in a network with one recurrent layer and one output layer that needs to path-integrate so that its position can be accurately decoded from its output. To formalise this problem, the authors define a cost function consisting of the decoding error and a regularisation term. They specify a decoding procedure that, at a given time, averages the output unit center locations, weighted by the activity of the unit at that time. The network is initialised without position information, and only receives a velocity signal (and a context signal to index the environment) at each timestep, so to achieve low decoding error it needs to infer its position and keep it updated with respect to its velocity by path integration.

      The authors take the trained network and let it explore a series of environments with different geometries while collecting unit activities to probe learned representations. They find localised responses in the output units (resembling place fields) and border responses in the recurrent units. Across environments, the output units show global remapping and the recurrent units show rate remapping. Stretching the environment generally produces stretched responses in output and recurrent units. Ratemaps remain stable within environments and stabilise after noise injection. Low-dimensional projections of the recurrent population activity forms environment-specific clusters that reflect the environment's geometry, which suggests independent rather than generalised representations. Finally, the authors discover that the centers of the output unit ratemaps cluster together on a triangular lattice (like the receptive fields of a single grid cell), and find significant clustering of place cell centers in empirical data as well.

      The model setup and simulations are clearly described, and are an interesting exploration of the consequences of a particular set of training requirements - here: path integration and decodability. But it is not obvious to what extent the modelling choices are a realistic reflection of how the brain solves navigation. Therefore, it is not clear whether the results generalize beyond the specifics of the setup here.

      Strengths:

      The authors introduce a very minimal set of model requirements, assumptions, and constraints. In that sense, the model can function as a useful 'baseline', that shows how spatial representations and remapping properties can emerge from the requirement of path integration and decodability alone. Moreover, the authors use the same formalism to relate their setup to existing spatial navigation models, which is informative.

      The global remapping that the authors show is convincing and well-supported by their analyses. The geometric manipulations and the resulting stretching of place responses, without additional training, are interesting. They seem to suggest that the recurrent network may scale the velocity input by the environment dimensions so that the exact same path integrator-output mappings remain valid (but maybe there are other mechanisms too that achieve the same).

      The simulations and analyses in the appendices serve as insightful controls for the main results.

      The clustering of place cell peaks on a triangular lattice is intriguing, given there is no grid cell input. It could have something to do with the fact that a triangular lattice provides optimal coverage of 2d space? The included comparison with empirical data is valuable as a first exploration, showing a promising example, but doesn't robustly support the modelling results.

      Weaknesses:

      The navigation problem that needs to be solved by the model is a bit of an odd one. Without any initial position information, the network needs to figure out where it is, and then path-integrate with respect to a velocity signal. As the authors remark in Methods 4.2, without additional input, the only way to infer location is from border interactions. It is like navigating in absolute darkness. Therefore, it seems likely that the salient wall representations found in the recurrent units are just a consequence of the specific navigation task here; it is unclear if the same would apply in natural navigation. In natural navigation, there are many more sensory cues that help inferring location, most importantly vision, but also smell and whiskers/touch (which provides a more direct wall interaction; here, wall interactions are indirect by constraining velocity vectors). There is a similar but weaker concern about whether the (place cell like) localised firing fields of the output units are a direct consequence of the decoding procedure that only considers activity center locations.

      The conclusion that 'representations are attractive' (heading of section 2) is not entirely supported. The authors show 'attractor-like behaviour' within a single context, but there could be alternative explanations for the recovery of stable ratemaps after noise injection. For example, the noise injection could scramble the network's currently inferred position, so that it would need to re-infer its position from boundary interactions along the trajectory. In that case the stabilisation would be driven by the input, not just internal attractor dynamics. Indeed, the useful control analysis in Appendix D suggests such a mechanism: without a velocity signal, only for small noise injections the network returns to a high correlation state. Correlated representations are recovered for larger noise injections due to the same mechanism that allow the network to determine its position upon from an uninformative initial hidden state upon entering a new environment, i.e. boundary interactions.

      The authors report empirical data that shows clustering of place cell centers like they find for their output units. They report that 'there appears to be a tendency for the clusters to arrange in hexagonal fashion, similar to our computational findings'. This is an interesting observation on the distribution of place field centres which seems justified based on the example animal shown, but not across the population of animals included.

    3. Reviewer #2 (Public review):

      Summary:

      The authors proposed a neural network model to explore the spatial representations of the hippocampal CA1 and entorhinal cortex (EC) and the remapping of these representations when multiple environments are learned. The model consists of a recurrent network and output units (a decoder) mimicking the EC and CA1, respectively. The major results of this study are: the EC network generates cells with their receptive fields tuned to a border of the arena; the decoder develops neuron clusters arranged in a hexagonal lattice. Thus, the model accounts for entrohinal border cells and CA1 place cells. It suggests that the remapping of place cells occurs between different environments through state transitions corresponding to unstable dynamical modes in the recurrent network.

      Strengths:

      The authors found a spatial arrangement of receptive fields similar to their model's prediction in experimental data recorded from CA1. Thus, the model proposes plausible mechanisms to generate hippocampal spatial representations without relying on grid cells. The model also suggests an interesting possibility that path integration is not the speciality of grid cells.

      Weaknesses:

      The role of grid cells in the proposed view, i.e., the boundary-to-place-to-grid model, remains elusive. The model can generate place cells without generating entorhinal grid cells. Moreover, the model can generate hexagonal grid patterns of place cells in a large arena. Whether and how the proposed model is integrated into the entire picture of the hippocampal-entorhinal memory processing remains elusive.

    4. Reviewer #3 (Public review):

      Summary:

      The authors used recurrent neural network modelling of spatial navigation tasks to investigate border and place cell behaviour during remapping phenomena.

      Strengths:

      The neural network training seemed for the most part (see comments later) well-performed, and the analyses used to make the points were thorough.

      The paper and ideas were well-explained.

      Figure 4 contained some interesting and strong evidence for map-like generalisation as environmental geometry was warped.

      Figure 7 was striking and potentially very interesting.

      It was impressive that the RNN path-integration error stayed low for so long (Fig A1), given that normally networks that only work with dead-reckoning have errors that compound. I would have loved to know how the network was doing this, given that borders did not provide sensory input to the network. I could not think of many other plausible explanations... It would be even more impressive if it was preserved when the network was slightly noisy.

      Update:

      The analysis of how the RNN remapped, using a context signal to switch between largely independent maps, and the examination of the border like tuning in the recurrent units of the RNN, were both thorough and interesting. Further, in the updated response I appreciated the additional appendix E which helped substantiate the claim that the RNN neurons were border cells.

      Weaknesses:

      The remapping results were also puzzling. The authors present convincing evidence that the recurrent units effectively form 6 different maps of the 6 different environments (e.g. the sparsity of the code, or fig 6a), with the place cells remapping between environments. Yet, as the authors point out, in neural data the finding is that some cells generalise their co-firing patterns across environments (e.g. grid cells, border cells), while place cells remap, making it unclear what correspondence to make between the authors network and the brain. There are existing normative models that capture both entorhinal's consistent and hippocampus' less consistent neural remapping behaviour (Whittington et al. and probably others), what have we then learnt from this exercise?

      Update: see summary below

      I felt that the neural data analysis was unconvincing. Most notably, the statistical effect was found in only one of seven animals. Random noise is likely to pass statistical tests 1 in 20 times (at 0.05 p value), this seems like it could have been something similar? Further, the data was compared to a null model in which place cell fields were randomly distributed. The authors claim place cell fields have two properties that the random model doesn't (1) clustering to edges (as experimentally reported) and (2) much more provocatively, a hexagonal lattice arrangement. The test seems to collude the two; I think that nearby ball radii could be overrepresented, as in figure 7f, due to either effect. I would have liked to see a computation of the statistic for a null model in which place cells were random but with a bias towards to boundaries of the environment that matches the observed changing density, to distinguish these two hypotheses.

      Update: the authors acknowledge these shortcomings and have appropriately tempered their data related claims.

      Some smaller weaknesses:<br /> - Had the models trained to convergence? From the loss plot it seemed like not, and when including regularisors recent work (grokking phenomena, e.g. Nanda et al. 2023) has shown the importance of letting the regularisor minimise completely to see the resulting effect. Else you are interpreting representations that are likely still being learnt, a dangerous business.<br /> Update: I understand that practical limitations make testing this thoroughly impossible, which is fair enough.

      - The claim that this work provided a mathematical formalism of the intuitive idea of a cognitive map seems strange, given that upwards of 10 of the works this paper cite also mathematically formalise a cognitive map into a similar integration loss for a neural network.<br /> Update: the introduction of these ideas hasn't changed, and my concerns above remain.

      Aim Achieved? Impact/Utility/Context of Work

      I think this is a thorough exploration of how this network with these losses is able to path-integrate its position and remap. This is useful, it is good to know how another neural network with slightly different constraints learns to perform these behaviours.

      In the updated version of the manuscript I am happy to say that I think there are few claims that are unsubstantiated (see weakness section above that has been significantly updated). The link to neuroscience remains the biggest shortcoming of this work in my view. The authors point to two main results in this direction. First, the ability for interactions only between border-type and place cells to produce many observed place-cell results, providing a new hypothesis. Second, a connection between grid cells, place cells, and border cells, in the production of hexagonal arrangements of place cells.

      Regarding the first, as the authors discuss, current evidence suggests border cells are invariant across environments whereas this work finds border cells for specific environments (they use the words rate-remapping boundary-type cells). It seems likely to me that there are many ways a neural network can path-integrate across different environments. In other models where the same base map is re-used (e.g. TEM) grid cells emerge, in this work where the maps for different environments are disjoint these border-like cells that do not match an observed cell type in their tuning to environment are involved. I find this a really interesting alternative (I think what an RNN does is interesting in its own right), but I don't see why I should think it is what the brain does, given that it appears to match observations less well (existence of grid cells, consistent firing patterns of border cells across environments). The smoking gun in favour of the author's hypothesis would be finding these sparse border like cells, or some other evidence of gating like interactions between border and place cells as they discuss. Finding such evidence sounds difficult (so not reasonable to ask for in a rebuttal), and to reiterate, I applaud the authors for clearly outlining an alternative, but I remain unconvinced.

      Regarding the second point, while the grid-like placement of field centres was cool, and I applaud the authors for including real neural data comparisons, as the authors say, the data is preliminary, and further evidence would be required to fully substantiate this claim.

      As such, in my mind it is an interesting alternative hypothesis. I look forward to seeing experimental predictions or comparisons that can tighten the link, substantiating the claim that what this particular RNN is doing reflects the algorithms at work in the brain.

    5. Author response:

      The following is the authors’ response to the original reviews

      Public Reviews:

      Reviewer #1 (Public Review):

      Summary:

      This work studies representations in a network with one recurrent layer and one output layer that needs to path-integrate so that its position can be accurately decoded from its output. To formalise this problem, the authors define a cost function consisting of the decoding error and a regularisation term. They specify a decoding procedure that at a given time averages the output unit center locations, weighted by the activity of the unit at that time. The network is initialised without position information, and only receives a velocity signal (and a context signal to index the environment) at each timestep, so to achieve low decoding error it needs to infer its position and keep it updated with respect to its velocity by path integration.

      The authors take the trained network and let it explore a series of environments with different geometries while collecting unit activities to probe learned representations. They find localised responses in the output units (resembling place fields) and border responses in the recurrent units. Across environments, the output units show global remapping and the recurrent units show rate remapping. Stretching the environment generally produces stretched responses in output and recurrent units. Ratemaps remain stable within environments and stabilise after noise injection. Low-dimensional projections of the recurrent population activity forms environment-specific clusters that reflect the environment's geometry, which suggests independent rather than generalised representations. Finally, the authors discover that the centers of the output unit ratemaps cluster together on a triangular lattice (like the receptive fields of a single grid cell), and find significant clustering of place cell centers in empirical data as well.

      The model setup and simulations are clearly described, and are an interesting exploration of the consequences of a particular set of training requirements - here: path integration and decodability. But it is not obvious to what extent the modelling choices are a realistic reflection of how the brain solves navigation. Therefore it is not clear whether the results generalize beyond the specifics of the setup here.

      Strengths:

      The authors introduce a very minimal set of model requirements, assumptions, and constraints. In that sense, the model can function as a useful 'baseline', that shows how spatial representations and remapping properties can emerge from the requirement of path integration and decodability alone. Moreover, the authors use the same formalism to relate their setup to existing spatial navigation models, which is informative.

      The global remapping that the authors show is convincing and well-supported by their analyses. The geometric manipulations and the resulting stretching of place responses, without additional training, are interesting. They seem to suggest that the recurrent network may scale the velocity input by the environment dimensions so that the exact same path integrator-output mappings remain valid (but maybe there are other mechanisms too that achieve the same).

      The clustering of place cell peaks on a triangular lattice is intriguing, given there is no grid cell input. It could have something to do with the fact that a triangular lattice provides optimal coverage of 2d space? The included comparison with empirical data is valuable, although the authors only show significant clustering - there is no analysis of its grid-like regularity.

      First of all, we would like to thank the reviewer for their comprehensive feedback, and their insightful comments. Importantly, as you point out, our goal with this model was to build a minimal model of place cell representations, where representations were encouraged to be place-like, but free to vary in tuning and firing locations. By doing so, we could explore what upstream representations facilitate place-like representations, and even remapping (as it turned out) with minimal assumptions. However, we agree that our task does not capture some of the nuances of real-world navigation, such as sensory observations, which could be useful extensions in future work. Then again, the simplicity of our setup makes it easier to interpret the model, and makes it all the more surprising that it learns many behaviors exhibited by real world place cells.

      As to the distribution of phases - we also agree that a hexagonal arrangement likely reflects some optimal configuration for decoding of location.

      And we agree that the symmetry within the experimental data is important; we have revised analyses on experimental phase distributions, and included an analysis of ensemble grid score, to quantify any hexagonal symmetries within the data.

      Weaknesses:

      The navigation problem that needs to be solved by the model is a bit of an odd one. Without any initial position information, the network needs to figure out where it is, and then path-integrate with respect to a velocity signal. As the authors remark in Methods 4.2, without additional input, the only way to infer location is from border interactions. It is like navigating in absolute darkness. Therefore, it seems likely that the salient wall representations found in the recurrent units are just a consequence of the specific navigation task here; it is unclear if the same would apply in natural navigation. In natural navigation, there are many more sensory cues that help inferring location, most importantly vision, but also smell and whiskers/touch (which provides a more direct wall interaction; here, wall interactions are indirect by constraining velocity vectors). There is a similar but weaker concern about whether the (place cell like) localised firing fields of the output units are a direct consequence of the decoding procedure that only considers activity center locations.

      Thank you for raising this point; we absolutely agree that the navigation task is somewhat niche. However, this was a conscious decision, to minimize any possible confounding from alternate input sources, such as observations. In part, this experimental design was inspired by the suggestion that grid cells support navigation/path integration in open-field environments with minimal sensory input (as they could, conceivably do so with no external input). This also pertains to your other point, that boundary interactions are necessary for navigation. In our model, using boundaries is one solution, but there is another way around this problem, which is conceivably better: to path integrate in an egocentric frame, starting from your initial position. Since the locations of place fields are inferred only after a trajectory has been traversed, the network is free to create a new or shifted representation every time, independently of the arena. In this case, one might have expected generalized solutions, such as grid cells to emerge. That this is not the case, seems to suggest that grid cells may somehow not be optimal for pure path integration, or at the very least, hard to learn (but may still play a part, as alluded to by place field locations). We have tried to make these points more evident in the revised manuscript.

      As for the point that the decoding may lead to place-like representations, this is a fair point. Indeed, we did choose this form of decoding, inspired by the localized firing of place cells, in the hope that it would encourage minimally constrained, place-like solutions. However, compared to other works (Sorscher and Xu) hand tuning the functional form of their place cells, our (although biased towards centralized tuning curves) allows for flexible functional forms such as the position of the place cell centers, their tuning width, whether or not it is center-surround activity, and how they should tune to different environments/rooms. This allows us to study several features of the place cell system, such as remapping and field formation. We have revised to make this more clear in the model description.

      The conclusion that 'contexts are attractive' (heading of section 2) is not well-supported. The authors show 'attractor-like behaviour' within a single context, but there could be alternative explanations for the recovery of stable ratemaps after noise injection. For example, the noise injection could scramble the network's currently inferred position, so that it would need to re-infer its position from boundary interactions along the trajectory. In that case the stabilisation would be driven by the input, not just internal attractor dynamics. Moreover, the authors show that different contexts occupy different regions in the space of low-dimensional projections of recurrent activity, but not that these regions are attractive.

      We agree that boundary interactions could facilitate the convergence of representations after noise injection. We did try to moderate this claim by the wording “attractor-like”, but we agree that boundaries could confound this result. We have therefore performed a modified noise injection experiment, where we let the network run for an extended period of time, before noise injection (and no velocity signal), see Appendix Velocity Ablation in the revised text. Notably, representations converge to their pre-scrambled state after noise injection, even without a velocity signal. However, place-like representations do not converge for all noise levels in this case, possibly indicating that boundary interactions do serve an error-correcting function, also. Thank you for pointing this out.

      As for the attractiveness of contexts, we agree that more analyses were required to demonstrate this. We have therefore conducted a supplementary analysis where we run the trained network with a mismatch in context/geometry, and demonstrate that the context signal fixes the representation, up to geometric distortions.

      The authors report empirical data that shows clustering of place cell centers like they find for their output units. They report that 'there appears to be a tendency for the clusters to arrange in hexagonal fashion, similar to our computational findings'. They only quantify the clustering, but not the arrangement. Moreover, in Figure 7e they only plot data from a single animal, then plot all other animals in the supplementary. Does the analysis of Fig 7f include all animals, or just the one for which the data is plotted in 7e? If so, why that animal? As Appendix C mentions that the ratemap for the plotted animal 'has a hexagonal resemblance' whereas other have 'no clear pattern in their center arrangements', it feels like cherrypicking to only analyse one animal without further justification.

      Thank you for pointing this out; we agree that this is not sufficiently explained and explored in the current version. We have therefore conducted a grid score analysis of the experimental place center distributions, to uncover possible hexagonal symmetries. The reason for choosing this particular animal was in part because it featured the largest number of included cells, while also demonstrating the most striking phase distribution, while including all distributions in the supplementary. Originally, this was only intended as a preliminary analysis, suggesting non-uniformity in experimental place field distributions, but we realize that these may all provide interesting insight into the distributional properties of place cells.

      We have explained these choices in the revised text, and expanded analyses on all animals to showcase these results more clearly.

      Reviewer #2 (Public Review):

      Summary:

      The authors proposed a neural network model to explore the spatial representations of the hippocampal CA1 and entorhinal cortex (EC) and the remapping of these representations when multiple environments are learned. The model consists of a recurrent network and output units (a decoder) mimicking the EC and CA1, respectively. The major results of this study are: the EC network generates cells with their receptive fields tuned to a border of the arena; decoder develops neuron clusters arranged in a hexagonal lattice. Thus, the model accounts for entorhinal border cells and CA1 place cells. The authors also suggested the remapping of place cells occurs between different environments through state transitions corresponding to unstable dynamical modes in the recurrent network.

      Strengths:

      The authors found a spatial arrangement of receptive fields similar to their model's prediction in experimental data recorded from CA1. Thus, the model proposes a plausible mechanisms to generate hippocampal spatial representations without relying on grid cells. This result is consistent with the observation that grid cells are unnecessary to generate CA1 place cells.

      The suggestion about the remapping mechanism shows an interesting theoretical possibility.

      We thank the reviewer for their kind feedback.

      Weaknesses:

      The explicit mechanisms of generating border cells and place cells and those underlying remapping were not clarified at a satisfactory level.

      The model cannot generate entorhinal grid cells. Therefore, how the proposed model is integrated into the entire picture of the hippocampal mechanism of memory processing remains elusive.

      We appreciate this point, and hope to clarify: From a purely architectural perspective, place-like representations are generated by linear combinations of recurrent unit representations, which, after training, appear border-like. During remapping, the network is simply evaluated/run in different geometries/contexts, which, it turns out, causes the network to exhibit different representations, likely as solutions to optimally encoding position in the different environments. We have attempted to revise the text to make some of these interpretations more clear. We have also conducted a supplementary analysis to demonstrate how representations are determined by the context signal directly, which helps to explain how recurrent and output units form their representations.

      We also agree that our model does not capture the full complexity of the Hippocampal formation. However, we would argue that its simplicity (focusing on a single cell type and a pure path integration task), acts as a useful baseline for studying the role of place cells during spatial navigation. The fact that our model captures a range of place cell behaviors (field formation, remapping and geometric deformation) without grid cells also point to several interesting possibilities, such that grid cells may not be strictly necessary for place cell formation and remapping, or that border cells may account for many of the peculiar behaviors of place cells. However, we wholeheartedly agree that including e.g. sensory information and memory storage/retrieval tasks would prove a very interesting extension of our model to more naturalistic tasks and settings. In fact, our framework could easily accommodate this, e.g. by decoding contexts/observations/memories from the network state, alongside location.

      Reviewer #3 (Public Review):

      Summary:

      The authors used recurrent neural network modelling of spatial navigation tasks to investigate border and place cell behaviour during remapping phenomena.

      Strengths:

      The neural network training seemed for the most part (see comments later) well-performed, and the analyses used to make the points were thorough.

      The paper and ideas were well explained.

      Figure 4 contained some interesting and strong evidence for map-like generalisation as environmental geometry was warped.

      Figure 7 was striking, and potentially very interesting.

      It was impressive that the RNN path-integration error stayed low for so long (Fig A1), given that normally networks that only work with dead-reckoning have errors that compound. I would have loved to know how the network was doing this, given that borders did not provide sensory input to the network. I could not think of many other plausible explanations... It would be even more impressive if it was preserved when the network was slightly noisy.

      Thank you for your insightful comments! Regarding the low path integration error, there is a slight statistical signal from the boundaries, as trajectories tend to turn away from arena boundaries. However, we agree, that studying path integration performance in the face of noise would make for a very interesting future development.

      Weaknesses:

      I felt that the stated neuroscience interpretations were not well supported by the presented evidence, for a few reasons I'll now detail.

      First, I was unconvinced by the interpretation of the reported recurrent cells as border cells. An equally likely hypothesis seemed to be that they were positions cells that are linearly encoding the x and y position, which when your environment only contains external linear boundaries, look the same. As in figure 4, in environments with internal boundaries the cells do not encode them, they encode (x,y) position. Further, if I'm not misunderstanding, there is, throughout, a confusing case of broken symmetry. The cells appear to code not for any random linear direction, but for either the x or y axis (i.e. there are x cells and y cells). These look like border cells in environments in which the boundaries are external only, and align with the axes (like square and rectangular ones), but the same also appears to be true in the rotationally symmetric circular environment, which strikes me as very odd. I can't think of a good reason why the cells in circular environments should care about the particular choice of (x,y) axes... unless the choice of position encoding scheme is leaking influence throughout. A good test of these would be differently oriented (45 degree rotated square) or more geometrically complicated (two diamonds connected) environments in which the difference between a pure (x,y) code and a border code are more obvious.

      Thank you for pointing this out. This is an excellent point, that we agree could be addressed more rigorously. Note that there is no position encoding in our model; the initial state of the network is a vector of zeros, and the network must infer its location from boundary interactions and context information alone. So there is no way for positional information to leak through to the recurrent layer directly. However, one possible reason for the observed symmetry breaking, is the fact that the velocity input signal is aligned with the cardinal directions. To investigate this, we trained a new model, wherein input velocities are rotated 45 degrees relative to the horizontal, as you suggest. The results, shown and discussed in appendix E (Learned recurrent representations align with environment boundaries), do indicate that representations are tuned to environment boundaries, and not the cardinal directions, which hopefully improves upon this point.

      Next, the decoding mechanism used seems to have forced the representation to learn place cells (no other cell type is going to be usefully decodable?). That is, in itself, not a problem. It just changes the interpretation of the results. To be a normative interpretation for place cells you need to show some evidence that this decoding mechanism is relevant for the brain, since this seems to be where they are coming from in this model. Instead, this is a model with place cells built into it, which can then be used for studying things like remapping, which is a reasonable stance.

      This is a great point, and we agree. We do write that we perform this encoding to encourage minimally constrained place-like representations (to study their properties), but we have revised to make this more evident.

      However, the remapping results were also puzzling. The authors present convincing evidence that the recurrent units effectively form 6 different maps of the 6 different environments (e.g. the sparsity of the code, or fig 6a), with the place cells remapping between environments. Yet, as the authors point out, in neural data the finding is that some cells generalise their co-firing patterns across environments (e.g. grid cells, border cells), while place cells remap, making it unclear what correspondence to make between the authors network and the brain. There are existing normative models that capture both entorhinal's consistent and hippocampus' less consistent neural remapping behaviour (Whittington et al. and probably others), what have we then learnt from this exercise?

      Thanks for raising this point! We agree that this finding is surprising, but we hold that it actually shows something quite important: that border-type units are sufficient to create place-like representations, and learns several of the behaviors associated with place cells and remapping (including global remapping and field stretching). In other words, a single cell type known to exist upstream of place cells is sufficient to explain a surprising range of phenomena, demonstrating that other cell types are not strictly necessary. However, we agree that understanding why the boundary type units sometimes rate remap, and whether that can be true for some border type cells in the brain (either directly, or through gating mechanisms) would be important future developments. Related to this point, we also expanded upon the influence of the context signal for representation selection (appendix F)

      Concerning the relationship to other models, we would argue that the simplicity of our model is one of its core strengths, making it possible to disentangle what different cell types are doing. While other models, including TEM, are highly important for understanding how different cell types and brain regions interact to solve complex problems, we believe there is a need for minimal, understandable models that allows us to investigate what each cell type is doing, and this is where we believe our work is important. As an example, our model not only highlights the sufficiency of boundary-type cells as generators of place cells, its lack of e.g. grid cells also suggest that grid cells may not be strictly necessary for e.g. open-field/sensory-deprived navigation, as is often claimed.

      One striking result was figure 7, the hexagonal arrangement of place cell centres. I had one question that I couldn't find the answer to in the paper, which would change my interpretation. Are place cell centres within a single clusters of points in figure 7a, for example, from one cell across the 100 trajectories, or from many? If each cluster belongs to a different place cell then the interpretation seems like some kind of optimal packing/coding of 2D space by a set of place cells, an interesting prediction. If multiple place cells fall within a single cluster then that's a very puzzling suggestion about the grouping of place cells into these discrete clusters. From figure 7c I guess that the former is the likely interpretation, from the fact that clusters appear to maintain the same colour, and are unlikely to be co-remapping place cells, but I would like to know for sure!

      This is a good point, and you are correct: one cluster tends to correspond to one unit. To make this more clear, we have revised Fig. 7, so that each decoded center is shaded by unit identity, which makes this more evident. And yes, this is, seemingly in line with some form of optimal packing/encoding of space, yes!

      I felt that the neural data analysis was unconvincing. Most notably, the statistical effect was found in only one of seven animals. Random noise is likely to pass statistical tests 1 in 20 times (at 0.05 p value), this seems like it could have been something similar? Further, the data was compared to a null model in which place cell fields were randomly distributed. The authors claim place cell fields have two properties that the random model doesn't (1) clustering to edges (as experimentally reported) and (2) much more provocatively, a hexagonal lattice arrangement. The test seems to collude the two; I think that nearby ball radii could be overrepresented, as in figure 7f, due to either effect. I would have liked to see a computation of the statistic for a null model in which place cells were random but with a bias towards to boundaries of the environment that matches the observed changing density, to distinguish these two hypotheses.

      Thanks for raising this point. We agree that we were not clear enough in our original manuscript. We included additional analyses in one animal, to showcase one preliminary case of non-uniform phases. To mitigate this, we have performed the same analyses for all animals, and included a longer discussion of these results (included in the supplementary material). We have also moderated the discussion on Ripley’s H to encompass only non-uniformity, and added a grid score analysis to showcase possible rotational symmetries in the data. We hope this gets our findings across more clearly

      Some smaller weaknesses:

      - Had the models trained to convergence? From the loss plot it seemed like not, and when including regularisors recent work (grokking phenomena, e.g. Nanda et al. 2023) has shown the importance of letting the regularisor minimise completely to see the resulting effect. Else you are interpreting representations that are likely still being learnt, a dangerous business.

      Longer training time did not seem to affect representations. However, due to the long trajectories and statefulness involved, training was time-intensive and could become unstable for very long training. We therefore stopped training at the indicated time.

      - Since RNNs are nonlinear it seems that eigenvalues larger than 1 doesn't necessarily mean unstable?

      This is a good point; stability is not guaranteed. We have updated the text to reflect this.

      - Why do you not include a bias in the networks? ReLU networks without bias are not universal function approximators, so it is a real change in architecture that doesn't seem to have any positives?

      We found that bias tended to have a detrimental effect on training, possibly related to the identity initialization used (see e.g. Le et al. 2015), and found that training improved when biases were fixed to zero.

      - The claim that this work provided a mathematical formalism of the intuitive idea of a cognitive map seems strange, given that upwards of 10 of the works this paper cite also mathematically formalise a cognitive map into a similar integration loss for a neural network.

      We agree that other works also provide ways of formalizing this concepts. However, our goal by doing so was to elucidate common features across these seemingly disparate models. We also found that the concept of a learned and target map made it easier to come up with novel models, such as one wherein place cells are constructed to match a grid cell label.

      Aim Achieved? Impact/Utility/Context of Work

      Given the listed weaknesses, I think this was a thorough exploration of how this network with these losses is able to path-integrate its position and remap. This is useful, it is good to know how another neural network with slightly different constraints learns to perform these behaviours. That said, I do not think the link to neuroscience was convincing, and as such, it has not achieved its stated aim of explaining these phenomena in biology. The mechanism for remapping in the entorhinal module seemed fundamentally different to the brain's, instead using completely disjoint maps; the recurrent cell types described seemed to match no described cell type (no bad thing in itself, but it does limit the permissible neuroscience claims) either in tuning or remapping properties, with a potentially worrying link between an arbitrary encoding choice and the responses; and the striking place cell prediction was unconvincingly matched by neural data. Further, this is a busy field in which many remapping results have been shown before by similar models, limiting the impact of this work. For example, George et al. and Whittington et al. show remapping of place cells across environments; Whittington et al. study remapping of entorhinal codes; and Rajkumar Vasudeva et al. 2022 show similar place cell stretching results under environmental shifts. As such, this papers contribution is muddied significantly.

      Thank you for this perspective; we agree that all of these are important works that arrive at complementary findings. We hold that the importance of our paper lies in its minimal nature, and its focus on place cells, via a purpose-built decoding that enables place-like representations. In doing so, we can point to possibly under explored relationships between cell types, in particular place cells and border cells, while challenging the necessity of other cell types for open-field navigation (i.e. grid cells). In addition, our work points to a novel connection between grid cells, place cells and even border cells, by way of the hexagonal arrangement of place unit centers. However, we agree that expanding our model to include more biologically plausible architectures and constraints would make for a very interesting extension in the future.

      Thank you again for your time, as well as insightful comments.  

      Recommendations for the authors:

      Reviewer #1 (Recommendations For The Authors):

      Even after reading Methods 5.3, I found it hard to understand how the ratemap population vectors that produce Fig 3e and Fig 5 are calculated. It's unclear to me how there can be a ratemap at a single timestep, because calculating a ratemap involves averaging the activity in each location, which would take a whole trajectory and not a single timestep. But I think I've understood from Methods 5.1 that instead the ratemap is calculated by running multiple 'simultaneous' trajectories, so that there are many visited locations at each timestep. That's a bit confusing because as far as I know it's not a common way to calculate ratemaps in rodent experiments (probably because it would be hard to repeat the same task 500 times, while the representations remain the same), so it might be worth explaining more in Methods 5.3.

      We understand the confusion, and have attempted to make this more clear in the revised manuscript. We did indeed create ratemaps over many trajectories for time-dependent plots, for the reasons you mentioned. We also agree that this would be difficult to do experimentally, but found it an interesting way to observe convergence of representations in our simulated scenario.

      Fig 3b-d shows multiple analyses to support output unit global remapping, but no analysis to support the claim that recurrent units remap by rate changes. The examples in Fig 3ai look pretty convincing, but it would be useful to also have a more quantitative result.

      We agree, and only showed that units turn off/become silent using ratemaps. We have therefore added an explicit analysis, showcasing rate remapping in recurrent units (see appendix G; Recurrent units rate remap)

      Reviewer #2 (Recommendations For The Authors):

      Some parts of the current manuscript are hard to follow. Particularly, the model description is not transparent enough. See below for the details.

      Major comments:

      (1) Mathematical models should be explained more explicitly and carefully. I had to guess or desperately search for the definitions of parameters. For instance, define the loss function L in eq.(1). Though I can assume L represents the least square error (in A.8), I could not find the definition in Model & Objective. N should also be defined explicitly in equation (3). Is this the number of output cells?

      Thank you for pointing this out, we have revised to make it more clear.

      (2) In Fig. 1d, how were the velocity and context inputs given to individual neurons in the network? The information may be described in the Methods, but I could not identify it.

      This was described in the methods section (Neural Network Architecture and Training), but we realize that we used confusing notation, when comparing with Fig. 1d. We have therefore changed the notation, and it should hopefully be clearer now. Thanks for pointing out this discrepancy.

      (3) I took a while to understand equations (3) and (4) (for instance, t is not defined here). The manuscript would be easier to read if equations (5) and (6) are explained in the main text but not on page 18 (indeed, these equations are just copies of equations 3 and 4). Otherwise, the authors may replace equations (3) and (4) with verbal explanations similar to figure legend for Fig. 1b.

      (4) Is there any experimental evidence for uniformly strong EC-to-CA1 projections assumed in the non-trainable decoder? This point should be briefly mentioned.

      Thank you for raising this point. The decoding from EC (the RNN) to CA1 (the output layer) consists of a trainable weight matrix, and may thus be non-uniform in magnitude. The non-trainable decoding acts on the resulting “CA1” representation only. We hope that improvements to the model description also makes this more evident.  

      (5) The explanation of Fig. 3 in the main text is difficult to follow because subpanels are explained in separate paragraphs, some of which are very short, as short as just a few lines.

      This presentation style makes it difficult to follow the logical relationships between the subpanels. This writing style is obeyed throughout the manuscript but is not popular in neuroscience.

      Thanks for pointing this out, we have revised to accommodate this.

      (6) Why do field centers cluster near boundaries? No underlying mechanisms are discussed in the manuscript.

      This is a good point; we have added a note on this; it likely reflects the border tuning of upstream units.

      (7) In Fig. 4, the authors presented how cognitive maps may vary when the shape and size of open arenas are modified. The results would be more interesting if the authors explained the remapping mechanism. For instance, on page 8, the authors mentioned that output units exhibit global remapping between contexts, whereas recurrent units mainly rate remapping.

      Why do such representational differences emerge?

      We agree! Thanks for raising this point. We have therefore expanded upon this discussion in section 2.4.

      (8) In the first paragraph of page 10, the authors stated ".. some output units display distinct field doubling (see both Fig. 4c), bottom right, and Fig. 4d), middle row)". I could not understand how Fig. 4d, middle row supports the argument. Similarly, they stated "..some output units reflect their main boundary input (with greater activity near one boundary)." I can neither understand what the authors mean to say nor which figures support the statement. Please clarify.

      This is a good point, there was an identifier missing; we have updated to refer to the correct “magnification”. Thanks!

      (9) The underlying mechanism of generating the hexagonal representation of output cells remains unclear. The decoder network uses a non-trainable decoding scheme based on localized firing patterns of output units. To what extent does the hexagonal representation depend on the particular decoding scheme? Similarly, how does the emergence of the hexagonal representation rely on the border representation in the upstream recurrent network? Showing several snapshots of the two place representations during learning may answer these questions.

      This is an interesting point, and we have added some discussion on this matter. In particular, we speculate whether it’s an optimal configuration for position reconstruction, which is demanded by the task and thus highly likely dependent on the decoding scheme. We have not reached a conclusive method to determine the explicit dependence of the hexagonal arrangement on the choice of decoding scheme. Still, it seems this would require comparison with other schemes. In our framework, this would require changing the fundamental operation of the model, which we leave as inspiration for future work. We have also added additional discussion concerning the relationship between place units, border units, and remapping in our model. As for exploring different training snapshots, the model is randomly initialized, which suggests that earlier training steps should tend to reveal unorganized/uninformative phase arrangements, as phases are learned as a way of optimizing position reconstruction. However, we do call for more analysis of experimental data to determine whether this is true in animals, which would strongly support this observation. We also hope that our work inspires other models studying the formation and remapping of place cells, which could serve as a starting point for answering this question in the future.

      (10) Figure 7 requires a title including the word "hexagonal" to make it easier to find the results demonstrating the hexagonal representations. In addition, please clarify which networks, p or g, gave the results shown here.

      We agree, and have added it!

      Minor comments:

      (11) In many paragraphs, conclusions appear near their ends. Stating the conclusion at the beginning of each paragraph whenever possible will improve the readability.

      We have made several rewrites to the manuscript, and hope this improves readability.

      (12) Figure A4 is important as it shows evidence of the CA1 spatial representation predicted by the model. However, I could not find where the figure is cited in the manuscript. The authors can consider showing this figure in the main text.

      We agree, and we have added more references to the experimental data analyses in the main text, as well as expanded this analysis.

      (13) The main text cites figures in the following format: "... rate mapping of Fig. 3a), i), boundary ...." The parentheses make reading difficult.

      We have removed the overly stringent use of double parentheses, thanks for letting us know.

      (14) It would be nice if the authors briefly explained the concept of Ripley's H function on page 14.

      Yes, we have added a brief descriptor.

    1. eLife Assessment

      The study investigated the effects of the peptide galanin on brain Ca2+ activity in zebrafish, which provides a useful model organism for whole-brain imaging because of its transparency. They found that galanin has distinct effects on hyperactivity and expression of galanin changes after activity increases. The strength of evidence was incomplete particularly for some of the conclusions regarding the use of convulsants and relevance to epilepsy because of limitations to the methods and interpretations of results.

    2. Reviewer #1 (Public review):

      Summary:

      In this study, authors explored how galanin affects whole-brain activity in larval zebrafish using wide-field Ca2+ imaging, genetic modifications, and drugs that increase brain activity. The authors conclude that galanin has a sedative effect on the brain under normal conditions and during seizures, mainly through the galanin receptor 1a (galr1a). However, acute "stressors(?)" like pentylenetetrazole (PTZ) reduce galanin's effects, leading to increased brain activity and more seizures. Authors claim that galanin can reduce seizure severity while increasing seizure occurrence, speculated to occur through different receptor subtypes. This study confirms galanin's complex role in brain activity, supporting its potential impact on epilepsy.

      Strengths:

      The overall strength of the study lies primarily in its methodological approach using whole-brain Calcium imaging facilitated by the transparency of zebrafish larvae. Additionally, the use of transgenic zebrafish models is an advantage, as it enables genetic manipulations to investigate specific aspects of galanin signaling. This combination of advanced imaging and genetic tools allows for addressing galanin's role in regulating brain activity.

      Weaknesses:

      We have carefully reviewed the revised manuscript and the authors' responses. While the authors have attempted to address the points raised, I find that the revisions and rebuttals are insufficient and not entirely adequate. The authors seem not to have modified the manuscript in any way to take our comments into account.

      In particular, many of the methodological and conceptual issues I initially raised remain unresolved. For example, the fundamental concern regarding the use of whole-brain calcium imaging - a method that may not effectively capture the localized and network-specific nature of seizure initiation and propagation - has not been adequately addressed. The authors acknowledge some limitations but do not sufficiently discuss how these affect the interpretation of their findings or propose mitigations. This could be added to the discussion section.

      Additionally, the characterization of PTZ as a "stressor" remains problematic. Although the authors have retained this terminology, PTZ is widely understood to act primarily as a proconvulsant agent rather than a general stressor, and framing it otherwise continues to appear like a model-fitting rather than evidence-driven decision. The authors should consider changing the terminology throughout the manuscript and address these concerns when discussing their choice of PTZ as "stressor".

      The discussion of the EAAT2 mutant model also remains incomplete. Although the authors mention preliminary transcriptome analyses, no new data were included, and it is stated that the evaluation is ongoing. Without thorough gene expression data, alternative explanations for the hypoactivity phenotype (such as changes in AMPA receptor or other critical neurotransmission-related genes) remain plausible and unaddressed. Moreover, the authors' acknowledgement that galanin upregulation is "at best one of a suite of regulatory mechanisms" further diminishes the centrality of their conclusions without sufficiently reworking the narrative of the study.

      Finally, the finding that double knockout animals for EAAT2 and galanin showed little difference in seizure susceptibility compared to EAAT2 knockouts alone suggests that galanin upregulation may not play a dominant functional role, yet this important implication is not adequately reflected in the interpretation of the results.

      Conclusion:

      In summary, although the authors have made some efforts to respond to the critiques, I do not believe the manuscript has been substantially improved in response in R2, and I do not see reason to change my original assessment made after R1. The major conceptual and methodological concerns remain largely unaddressed, limiting the impact and validity of the study's conclusions. These concerns should be addressed not only in the rebuttal letter but also in the manuscript.

    3. Reviewer #2 (Public review):

      This revised paper describes an investigation of galanin and galanin receptor signaling on whole-brain activity in the context of recurrent seizure activity or under homeostatic basal conditions. The authors primarily use calcium imaging to observe whole-brain neuronal activity accompanied by galanin qPCR to determine how manipulations of galanin or the galr1a receptor affect the activity of the whole-brain under non-ictal conditions or when seizure activity occurs. The authors use their eaat2a-/- model (introduced in their Glia 2022 paper, PMID 34716961) that shows recurrent seizure activity as well as suppression of neuronal activity and locomotion interictally. It is compared to the well-known pentylenetetrazole (PTZ) pharmacological model of seizures in zebrafish. Given the literature cited in their Introduction, the authors hypothesize that galanin will exert a net inhibitory effect on brain activity in models of seizures/epilepsy. They were surprised to find that this hypothesis was only moderately supported in their eaat2a-/- model. In contrast, after PTZ, fish with galanin overexpression showed increased seizure number and reduced duration while fish with galanin KO showed reduced seizure number and increased duration.

      Previous concerns about sex or developmental biological variables were addressed, as their model's seizure phenotype emerges rapidly and long prior to the establishment of zebrafish sexual maturity. However, it remains unclear whether all seizures detected via calcium imaging alone are also seizures that are detectable at the level of animal behavior. To confirm this, a validation of the threshold used for calcium imaging of "neuronal seizures" would be required to determine if this threshold detects only "neuronal seizures" that co-occur with behavioral seizures. Overall, this study is important and convincing, and carries clear value for understanding the multifaceted functions that neuronal galanin can perform under homeostatic and disease conditions.

      Additional Concerns:

      - The authors have validated their ability to measure behavioral seizures quantitatively in their 2022 Glia paper but the information provided on defining behavioral seizures as they map onto seizures detected via imaging alone was limited. The definition of behavioral seizure activity as it relates to calcium fluctuations is not expanded upon in this paper, but could provide detail about how the behavioral seizures relate to a seizure detected via calcium imaging alone.

    4. Reviewer #3 (Public review):

      Summary:

      The neuropeptide galanin is primarily expressed in the hypothalamus and has been shown to play critical roles in homeostatic functions such as arousal, sleep, stress, and brain disorders such as epilepsy. Previous work in rodents using galanin analogs and receptor-specific knockout have provided convincing evidence for anti-convulsant effects of galanin.

      In the present study, the authors sought to determine the relationship between galanin expression and whole-brain activity. The authors took advantage of the transparent nature of larval zebrafish to perform whole-brain neural activity measurements via widefield calcium imaging. Two models of seizures were used (eaat2a-/- and pentylenetetrazol; PTZ). In the eaat2a-/- model, spontaneous seizures occur and the authors found that galanin transcript levels were significantly increased and associated with reduced frequency of calcium events. Similarly, two hours after PTZ galanin transcript levels roughly doubled and the frequency and amplitude of calcium events were reduced, while the duration increased.

      The authors also used a heat shock protein line (hsp70I:gal) where galanin transcripts levels are induced by activation of heat shock protein, but this line also shows higher basal transcript levels of galanin. Due to problems with whole-brain activity in wild-type larvae, the authors used the line without heat shock. They found higher level of galanin in hsp70I:gal larval zebrafish resulted in a reduction in the number of calcium events and amplitude. In contrast, galanin knockout (gal-/-) significantly increased calcium activity, indicated by an increased number of calcium events, but a reduction in amplitude and duration. Antibody staining confirmed the absence of galanin expression in gal-/- knockouts. Knockout of the galanin receptor subtype galr1a via crispants also increased the frequency of calcium events without influencing amplitude or duration.

      In subsequent experiments in eaat2a-/- mutants were crossed with hsp70I:gal or gal-/- to modify galanin expression. These experiments showed modest effects, with eaat2a-/- x gal-/- knockouts showing an increased normalized area under the curve and seizure amplitude.

      Lastly, the authors attempted to study the relationship between galanin and brain activity during a PTZ challenge. The hsp70I:gal larva showed increased number of seizures and reduced seizure duration during PTZ. In contrast, gal-/- mutants showed increased normalized area under the curve and a stark reduction in number of detected seizures, a reduction in seizure amplitude, but an increase in seizure duration. The authors then ruled out the role galanin a1 receptor in modulating this effect during PTZ, since the number of seizures was unaffected, whereas the amplitude and duration of seizures was increased in galr1a knockouts.

      Strengths:

      (1) The gain- and loss-of function galanin manipulations provided convincing evidence that galanin influences brain activity (via calcium imaging) during interictal and/or seizure-free periods. The relationship between galanin transcript levels and brain activity in figures 1 & 2 was convincing. Antibody staining also supports the absence of galanin in gal-/- mutants. Moreover, galanin transcript levels were unchanged in galr1ako brains, suggesting the lack of compensatory effects.

      (2) The authors use two models of epilepsy (eaat2a-/- and PTZ).

      (3) Supplementary video files for calcium imaging support the observations.

      Weaknesses:

      (1) I disagree with the idea that PTZ is a 'stressor'. This was raised in previous reviews and has not been acknowledged sufficiently.

      (2) Although the relationship between galanin and brain activity during interictal or seizure-free periods was clear, the mechanisms that influence excitability during PTZ remain unclear. The authors show that galr1a does not mediate this effect, since seizure amplitude and duration were more severe in galr1a KO. Therefore, it remains unclear which galanin receptor is modulating this inhibitory effect.

      (3) The manuscript is heavily reliant on calcium imaging for interpretation.<br /> Additional methods could strengthen the data, translational relevance, and interpretation (e.g., acute pharmacology using selective galanin agonists or antagonists, brain or cell recordings, biochemistry, etc).

    5. Author response:

      The following is the authors’ response to the previous reviews

      Review 1:

      Weaknesses:

      The weaknesses of the study also stem from the methodological approach, particularly the use of whole-brain Calcium imaging as a measure of brain activity. While epilepsy and seizures involve network interactions, they typically do not originate across the entire brain simultaneously. Seizures often begin in specific regions or even within specific populations of neurons within those regions. Therefore, a whole-brain approach, especially with Calcium imaging with inherited limitations, may not fully capture the localized nature of seizure initiation and propagation, potentially limiting the understanding of Galanin's role in epilepsy.

      We agree with the reviewers that the whole brain imaging approach is both a strength and a weakness. This manuscript and our previously published paper (Hotz et al., 2022) show indeed that the seizures have a initiation point and spread throughout the brain, interestingly affecting the telencephalon last. Localized seizure initiation was not the scope of this manuscript, however also here we would have to rely on imaging techniques. Using cell type specific drivers for specific neuronal subpopulation are an interesting approach, but outside of the scope of this study. An interesting approach would also include a more detailed analysis of glia in the context of epilepsy.

      Furthermore, Galanin's effects may vary across different brain areas, likely influenced by the predominant receptor types expressed in those regions. Additionally, the use of PTZ as a "stressor" is questionable since PTZ induces seizures rather than conventional stress. Referring to seizures induced by PTZ as "stress" might be a misinterpretation intended to fit the proposed model of stress regulation by receptors other than Galanin receptor 1 (GalR1).

      We also agree, that a more regional approach, after having more reliable information on the expression domains of the different galanin receptors, including more information on their respective role, is an important future research direction.

      The description of the EAAT2 mutants is missing crucial details. EAAT2 plays a significant role in the uptake of glutamate from the synaptic cleft, thereby regulating excitatory neurotransmission and preventing excitotoxicity. Authors suggest that in EAAT2 knockout (KO) mice galanin expression is upregulated 15-fold compared to wild-type (WT) mice, which could be interpreted as galanin playing a role in the hypoactivity observed in these animals.

      However, the study does not explore the misregulation of other genes that could be contributing to the observed phenotype. For instance, if AMPA receptors are significantly downregulated, or if there are alterations in other genes critical for brain activity, these changes could be more important than the upregulation of galanin. The lack of wider gene expression analysis leaves open the possibility that the observed hypoactivity could be due to factors other than, or in addition to, galanin upregulation.

      We are in the process of preparing a manuscript describing a more detailed gene expression study of this and a chemically induced seizure model. Surprisingly we did not observe strong effects on glutamate receptor related genes. This does not preclude and indeed we deem it likely that additional factors play a role, e.g. other neuropeptides.

      Moreover, the observation that in double KO mice for both EAAT2 and galanin there was little difference in seizure susceptibility compared to EAAT2 KO mice alone further supports the idea that galanin upregulation might not be the reason to the observed phenotype. This indicates that other regulatory mechanisms or gene expressions might be playing a more pivotal role in the manifestation of hypoactivity in EAAT2 mutants.

      Yes, we agree that galanin is likely not the only player. This warrants further investigations.

      These methodological shortcomings and conceptual inconsistencies undermine the perceived strengths of the study, and hinders understanding of Galanin's role in epilepsy and stress regulation.

      Review 2:

      Previous concerns about sex or developmental biological variables were addressed, as their model's seizure phenotype emerges rapidly and long prior to the establishment of zebrafish sexual maturity. However, in the course of re-review, some additional concerns (below) were detected that, if addressed, could further improve the manuscript. These concerns relate to how seizures were defined from the measurement of fluorescent calcium imaging data. Overall, this study is important and convincing, and carries clear value for understanding the multifaceted functions that neuronal galanin can perform under homeostatic and disease conditions.

      We are pleased that we could dispel the initial concerns.

      Additional Concerns:

      - The authors have validated their ability to measure behavioral seizures quantitatively in their 2022 Glia paper but the information provided on defining behavioral seizures was limited. The definition of behavioral seizure activity is not expanded upon in this paper, but could provide detail about how the behavioral seizures relate to a seizure detected via calcium imaging.

      In this paper we indeed do not address behavioral seizures but focus completely on neuronal seizures as defined in the material and methods section (“seizures were defined as calcium fluctuations reaching at least 100% of ΔF/F0 in the whole brain.”). Epileptic seizures in zebrafish, either evoked by pharmacological means or the result of genetic mutations, evoke stereotyped locomotor behavior in zebrafish as described in multiple publications (e.g. Baraban et al., 2005, Berghmans et al., 2007, Baxendale et al., 2012 and references therein).

      - Related to the previous point, for the calcium imaging, the difference between an increase in fluorescence that the authors think reflects increased neuronal activity and the fluorescence that corresponds to seizures is not very clear. This detail is necessary because exactly when the term "seizure" describes a degree of increased activity can be difficult to distinguish objectively.

      In our material and methods section, we describe our working definition of a seizure. Seizures are easily distinguished from increased activity by being synchronized.

      - The supplementary movies that were added were very useful, but raised some questions. For example, what brain regions were pulsating? What areas seemed to constantly exhibit strong fluorescence and was this an artifact? It seemed that sometimes there was background fluorescence in the body. Perhaps an anatomical diagram could be provided for the readers. In addition, there were some movies with much greater fluorescence changes - are these the seizures? These are some reasons for our request for clarified definitions of the term "seizure".

      The ”pulsating” (or “flickering”) brain activity is spontaneous neuronal activity. Some areas may appear to be more active, probably by a denser packing of neurons and intrinsically more spontaneous neuronal activity. However, since we only use normalized data, this does not affect our measurements.

      - While it is not critical to change, I will again note the possible confusion that the use of the word "sedative" in this context may cause. However, I do understand this is a stylistic choice.

      - Supplementary Figure 1B: the N values along the x-axis appear to have been duplicated and the duplications are offset and overlapping with one another by mistake.

      Thank you for pointing this out. We have corrected the figure accordingly.

      Review 3:

      (1) Although the relationship between galanin and brain activity during interictal or seizure-free periods was clear, the revised manuscript still lacks mechanistic insight in the role of galanin during seizure-like activity induced by PTZ.

      We agree that the mechanistic role of galanin still needs to be defined. The role is more complex that we expected, mainly due to its negative feedback properties. A complete mechanistic understanding will require a number of additional studies and is unfortunately outside of the scope of this manuscript.

      (2) The revised manuscript continues to heavily rely on calcium imaging of different mutant lines. Confirmation of knockouts has been provided with immunostaining in a new supplementary figure. Additional methods could strengthen the data, translational relevance, and interpretation (e.g., acute pharmacology using galanin agonists or antagonists, brain or cell recordings, biochemistry, etc).

      Cell recordings and biochemistry is challenging in the small larval zebrafish brain. We deem the genetic manipulations that we describe to be more informative than pharmacological experiments due to specificity issues.

    1. eLife Assessment

      The authors investigated KLF Transcription Factor 16 (KLF16) as an inhibitor of osteogenic differentiation, which plays a critical role in bone development, metabolism and repair. The results of the study are valuable as they could help to facilitate future research on the regulation of osteogenesis in vitro and in vivo. However, the evidence overall is incomplete, as validation by knockout mouse models would help to strengthen the conclusions.

    2. Reviewer #1 (Public review):

      Summary:

      In this manuscript, Ru and colleagues investigated regulatory gene interactions during osteogenic differentiation. By profiling transcriptomic changes during mesenchymal stem cell differentiation, they identified KLF16 as a key transcription factor that inhibits osteogenic differentiation and mineralization. It was found that overexpression of KLF16 suppressed osteogenesis in vitro, while KLF16⁺/⁻ mice exhibited enhanced bone density, underscoring its regulatory role in bone formation.

      Strengths:

      (1) Bioinformatics is strong and comprehensive.

      (2) Identification of KLF16 in osteoblast differentiation is exciting and innovative.

      Weaknesses:

      (1) The mechanism of KLF16 function is not studied.

      (2) Studies of KLF16 in bone development, from both in vitro and in vivo perspectives, are descriptive.

      (3) Findings in bioinformatics analysis are mostly redundant with previous studies in the field, and can be simplified.

    3. Reviewer #2 (Public review):

      In their manuscript with the title "Integrated transcriptomic analysis of human induced pluripotent stem cell (iPSC)-derived osteogenic differentiation reveals a regulatory role of KLF16", Ru et al. have analyzed the gene expression changes during the osteogenic differentiation of iPSC-derived mesenchymal stem/stromal cells into preosteoblasts and osteoblasts. As part of the computational analyses, they have investigated the transcription factor regulatory network mediating this differentiation process, which has also led to the identification of the transcription factor KLF16. Overexpression experiments in vitro and the analysis of heterozygous KLF16 knockout mice in vivo indicate that KLF16 is an inhibitor of osteogenic differentiation.

      The integrated analysis of iPSC bulk transcriptomic data is a major strength of the study, and it is also great that the authors provide deeper functional characterization of the transcription factor KLF16, one of the newly identified candidate regulators of osteogenic differentiation.

      However, characterization of KLF16 expression in the mouse and validation of the knockout model are currently lacking. Alternative explanations for the mutant phenotype should be considered to improve the strength of the conclusions.

      If all issues can be addressed, the study would provide an important resource for the field that would facilitate future research on the regulation of osteogenesis in vitro and in vivo, with potential implications for preclinical and clinical research as well as bioengineering.

    4. Author response

      eLife Assessment

      The authors investigated KLF Transcription Factor 16 (KLF16) as an inhibitor of osteogenic differentiation, which plays a critical role in bone development, metabolism and repair. The results of the study are valuable as they could help to facilitate future research on the regulation of osteogenesis in vitro and in vivo. However, the evidence overall is incomplete, as validation by knockout mouse models would help to strengthen the conclusions.

      We appreciate the editors’ evaluation and recognition of the importance of our research. The primary goal and value of our study is to provide robust bioinformatics analyses of 20 independent iPSC lines, which can lead to the identification of novel genes involved in osteogenic differentiation. The identification of KLF16 serves to illustrate this goal. A thorough analysis of the function of any single gene both in vitro and in vivo is beyond the initial scope of this study. To validate KLF16’s inhibitory role in osteogenic differentiation, we provided evidence showing overexpression of Klf16 suppressed osteogenic differentiation in vitro, and Klf16<sup>+/-</sup> mice exhibited enhanced bone mineral content and density in vivo.

      Public Reviews:

      Reviewer #1 (Public review):

      Summary:

      In this manuscript, Ru and colleagues investigated regulatory gene interactions during osteogenic differentiation. By profiling transcriptomic changes during mesenchymal stem cell differentiation, they identified KLF16 as a key transcription factor that inhibits osteogenic differentiation and mineralization. It was found that overexpression of KLF16 suppressed osteogenesis in vitro, while Klf16<sup>+/-</sup> mice exhibited enhanced bone density, underscoring its regulatory role in bone formation.

      Strengths:

      (1) Bioinformatics is strong and comprehensive.

      (2) Identification of KLF16 in osteoblast differentiation is exciting and innovative.

      We appreciate the reviewer’s comments on our bioinformatic analyses of MSC osteogenic differentiation and the identification of KLF16 as a new osteogenesis regulator. The differentiation of iPSC-derived MSCs to OBs serves as a valuable model for investigating gene expression and regulatory networks in osteogenic differentiation. This study provides insights into the complex and dynamic regulation of the transcriptomic landscape in osteogenic differentiation and supplies a foundational resource for additional investigation into normal bone formation and the mechanisms underlying pathological conditions.

      Weaknesses:

      (1) The mechanism of KLF16 function is not studied.

      (2) Studies of KLF16 in bone development, from both in vitro and in vivo perspectives, are descriptive.

      Our study aims to apply rigorous bioinformatic analyses of 20 iPSC lines to identify novel genes involved in osteogenic differentiation. With this strategy, we successfully identified KLF16 as a regulator of osteogenic differentiation. We validated this with both in vitro and in vivo models even though we had limited availability of Klf16 knockout mice when the study was conducted. We demonstrated that overexpression of Klf16 suppressed osteogenesis in vitro, while Klf16<sup>+/-</sup> mice exhibited increased bone mineral density, trabecular number, and cortical bone area, highlighting its role in bone formation. With these mice now available, further investigation into the mechanism of KLF16's function is possible.

      (3) Findings in bioinformatics analysis are mostly redundant with previous studies in the field, and can be simplified.

      We compared our bulk RNA-seq data with our previously published single-cell RNA-seq (scRNA-seq) data generated from iPSC-induced cells during osteogenic differentiation (Housman et al., 2022). The purpose is to corroborate the expression patterns of the genes we focused on during osteogenic differentiation. We found similar differential expression patterns in a pseudobulk analysis of the scRNA-seq data, even though there are significant differences between these two studies, including: cell culture conditions, sequencing approaches (bulk vs. single cell), goals of the studies (key TF drivers of osteoblast differentiation vs. mapping differentiation stages and inter-species gene programs in human and chimp), and findings (identification of TFs vs. identification of interspecific regulatory differences) .

      Importantly, we performed network analyses to identify key transcription factors, which were not redundant with previous studies. We constructed a transcription factor regulatory network analysis during human osteogenic differentiation, and identified a network organized into five interactive modules. The most exciting finding was the identification of KLF16 as one of the strongest regulators in Module 5 (Figure 3), which previously was not demonstrated to be involved in bone formation. We also demonstrated known TF genes regulating osteogenic differentiation in these modules, and performed gene ontology (GO) and reactome pathway (RP) analyses for regulatory functions and pathways specific to each module. To clarify that our findings do not overlap with previous studies, we will revise the manuscript focusing on Module 5 and simplify the description of the bioinformatics analysis as the reviewer suggested.

      Reviewer #2 (Public review):

      In their manuscript with the title "Integrated transcriptomic analysis of human induced pluripotent stem cell (iPSC)-derived osteogenic differentiation reveals a regulatory role of KLF16", Ru et al. have analyzed the gene expression changes during the osteogenic differentiation of iPSC-derived mesenchymal stem/stromal cells into preosteoblasts and osteoblasts. As part of the computational analyses, they have investigated the transcription factor regulatory network mediating this differentiation process, which has also led to the identification of the transcription factor KLF16. Overexpression experiments in vitro and the analysis of heterozygous KLF16 knockout mice in vivo indicate that KLF16 is an inhibitor of osteogenic differentiation.

      The integrated analysis of iPSC bulk transcriptomic data is a major strength of the study, and it is also great that the authors provide deeper functional characterization of the transcription factor KLF16, one of the newly identified candidate regulators of osteogenic differentiation.

      We appreciate the reviewer’s summary and comments on the strength of our bioinformatic analyses of iPSC/MSC osteogenic differentiation and the deep functional characterization of the KLF16, as well as the novelty of our findings.

      However, characterization of KLF16 expression in the mouse and validation of the knockout model are currently lacking. Alternative explanations for the mutant phenotype should be considered to improve the strength of the conclusions.

      If all issues can be addressed, the study would provide an important resource for the field that would facilitate future research on the regulation of osteogenesis in vitro and in vivo, with potential implications for preclinical and clinical research as well as bioengineering.

      We appreciate the reviewer’s valuable suggestions. Klf16 is highly expressed in mandibular, maxillary and tail mesenchyme at embryonic Day 12 (D'Souza et al., 2002), indicating its role in early bone development. We will further characterize the expression of Klf16 in mice, especially in the developing bones.

      We identified Klf16 as a potential regulator of osteogenic differentiation, and then validated this with both in vitro and in vivo models. Overexpression of Klf16 suppressed osteogenesis in vitro, and Klf16<sup>+/-</sup> mice showed increased bone mineral content and density, indicating its regulatory role in bone formation. We agree with the reviewer that the bone phenotypes of Klf16 knockout mice potentially can be affected by other factors in addition to osteogenic differentiation. As both bone formation and resorption are critical for bone development, we evaluated osteoclastogenesis in the Klf16<sup>+/-</sup> mice by analyzing the expression of osteoclast marker CALCR and regulator RANKL in the femurs of the Klf16<sup>+/-</sup> mice. Neither CALCR nor RANKL decreased in the bone of Klf16<sup>+/-</sup> mice, indicating that osteoclastogenesis is not decreased; therefore, increased bone mineral content and density in the mutant mice is more likely attributed to enhanced bone formation rather than reduced resorption by osteoclasts. Additionally, we will discuss other alternative explanations for the bone phenotypes of Klf16 knockout mice as suggested by the reviewer.

      References

      D'Souza, U. M., Lammers, C.-H., Hwang, C. K., Yajima, S. and Mouradian, M. M. (2002). Developmental expression of the zinc finger transcription factor DRRF (dopamine receptor regulating factor). Mechanisms of Development 110, 197-201.

      Housman, G., Briscoe, E. and Gilad, Y. (2022). Evolutionary insights into primate skeletal gene regulation using a comparative cell culture model. PLOS Genetics 18, e1010073-e1010073.

    1. eLife Assessment

      This useful study presents a virtual reality-based contextual fear conditioning paradigm for head-fixed mice. Solid evidence supports the claim that the reported methods provide a reliable paradigm for studying contextual fear conditioning in head-fixed mice. The approach provides a way to perform multiphoton imaging of neural circuits, and other techniques that are typically performed in head-fixed animals, during behaviors that have traditionally been studied in freely moving animals.

    2. Reviewer #1 (Public review):

      The authors have developed a contextual fear learning (CFC) paradigm in head-fixed mice that produces freezing as the conditioned response. Typically, lick suppression is the conditioned response in such designs, but this 1) introduces a potential confounding influence of reward learning on neural assessments of aversion learning and 2) does not easily allow comparison of head-fixed studies with extensive previous work in freely moving animals, which use freezing as the primary conditioned response. This report describes 3 versions of this virtual reality CFC paradigm, its validation using place-cell remapping, and provides suggestions for further refinement and application.

      The first part of this study is a report on the development and outcomes of 3 variations of the CFC paradigm in a virtual reality environment. The fundamental design is strong, with head-fixed mice required to run down a linear virtual track to obtain a water reward. Once trained, the water reward is no longer necessary and mice will navigate virtual reality environments. There are rigorous performance criteria to ensure that mice that make it to the experimental stage show very low levels of inactivity prior to fear conditioning. These criteria do result in only 40% of the mice making it to the experimental stage, but high rates of activity in the VR environment is crucial for detecting learning-related freezing. It is possible that further adjustments to the procedure could improve attrition rates.

      Paradigm versions 1 and 2 vary the familiarity of the control context while paradigm versions 2 and 3 vary the inter-shock interval. Version 1 is the most promising, showing the greatest increase in conditioned freezing (~40%) and good discrimination between contexts (delta ~15-20%). Version 2 showed no clear evidence of learning - average freezing at recall day 1 was not different than pre-shock freezing. First lap freezing showed a difference, but this single lap effect is not useful for many of the neural circuit questions for which this paradigm is meant to facilitate. Version 3 produces greater freezing and slower extinction than version 2. While the magnitude of the context discrimination is less than that in version 1, further optimization of the VR CFC is likely to produce robust learning and extinction. The authors discuss several options for further optimization.

      The second part of the study is a validation of the head-fixed CFC VR protocol through demonstration that fear conditioning leads to remapping of dorsal CA1 place fields, similar to that observed in freely moving subjects. The results support this aim and largely replicate previous findings in freely moving subjects. One difference from previous work of note is that VR CFC led to remapping of the control environment, not just the conditioning context. The authors present several possible explanations for this lack of specificity to the shock context. While this experiment examined place cell remapping after fear conditioning, it did not attempt to link neural activity to the learned association or freezing behavior.

      In summary, this is an important methodological innovation and this study sets the initial parameters and neuronal validation needed to further optimize a head-fixed CFC paradigm that produces freezing. In the discussion, the authors note the limitations of this study, suggest next steps in refinement, and point to several future directions using this protocol to significantly advance our understanding of the neural circuits of threat-related learning and behavior.

      Comments on revisions:

      The manuscript is much stronger with the additions and revisions the authors provided in their revised submission.

    3. Reviewer #2 (Public review):

      Summary:

      In this manuscript, Krishnan et al devised three paradigms to perform contextual fear conditioning in head-fixed mice. Each of the paradigms relied on head-fixed mice running on a treadmill through virtual reality arenas. The authors tested the validity of three versions of the paradigms by using various parameters. The authors have addressed some of my initial concerns in their revised manuscript.

      Strengths:

      The authors have devised three new contextual fear conditioning paradigms in head-fixed mice. The authors tested a number of parameters towards optimization of this approach.

      Weaknesses:

      While some experimental parameters were tested in the manuscript, it appears that a large amount of additional testing and optimization will be required before reliable behavioral responses can be acquired and ultimately for the paradigm(s) to be useful for answering biological questions. One major factor will be optimizing parameters such that head-fixed mice in this paradigm can (largely) recapitulate what is observed in freely behaving mice. This may be challenging however, as they have previously published one of the three paradigms and the extensive additional testing they did in this current manuscript did not greatly improve the experimental setup. This may indicate limited immediate usefulness for the community as significant work likely remains for optimization.

      Achievement of Aims:

      The authors have put a significant amount of work in testing the paradigms, and as a result, progress has been made towards their usefulness in the field. However, a significant amount of optimization likely exists.

      Impact on the field:

      The development of a reliable paradigm for studying contextual fear in head-fixed animals would be a strong contribution to the field as it would enable sophisticated cell and circuit imaging analyses. This study is a good start towards this goal, but significant optimization is required for the paradigm(s) to fully benefit the field - especially to allow those who may have less experience in these approaches to use it in their own research.

    4. Reviewer #3 (Public review):

      Summary:

      Krishnan et al. present a novel contextual fear conditioning (CFC) paradigm using a virtual reality (VR) apparatus to evaluate whether conditioned context-induced freezing can be elicited in head-fixed mice. By combining this approach with two-photon imaging, the authors aim to provide high-resolution insights into the neural mechanisms underlying learning, memory, and fear. Their experiments demonstrate that head-fixed mice can discriminate between threat and non-threat contexts, exhibit fear-related behavior in VR, and show context-dependent variability during extinction. Supplemental analyses further explore alternative behaviors and the influence of experimental parameters, while hippocampal neuron remapping is tracked throughout the experiments, showcasing the paradigm's potential for studying memory formation and extinction processes.

      Strengths:

      Methodological Innovation: The integration of a VR-based CFC paradigm with real-time two-photon imaging offers a powerful, high-resolution tool for investigating the neural circuits underlying fear, learning, and memory.

      Versatility and Utility: The paradigm provides a controlled and reproducible environment for studying contextual fear learning, addressing challenges associated with freely moving paradigms.

      Potential for Broader Applications: By demonstrating hippocampal neuron remapping during fear learning and extinction, the study highlights the paradigm's utility for exploring memory dynamics, providing a strong foundation for future studies in behavioral neuroscience.

      Comprehensive Data Presentation: The inclusion of supplemental figures and behavioral analyses (e.g., licking behaviors and variability in extinction) strengthens the manuscript by addressing additional dimensions of the experimental outcomes.

      Weaknesses:

      Optimization: many parameters remain to be tested in the VR fear conditioning paradigm.

      Extended training and attrition rate: the paradigm requires weeks of training and only 40% of mice reach criteria.

    5. Author response:

      The following is the authors’ response to the original reviews

      We thank all the reviewers for their time and valuable feedback, which helped us improve our manuscript. Based on the comments, we have made several critical changes to the revised manuscript.

      (1) We have changed our threshold for detecting freezing epochs from 1 cm/s to 0 cm/s in this revised manuscript. This change allows us to capture periods when animals are completely still on the treadmill, better matching the "true freezing" behavior seen in freely moving set-ups. We have added a new supplementary video (Supplementary Video 2) that better demonstrates the freezing response we observe. All results and figures in the revised manuscript reflect this updated threshold (Figure 2-6, Supplementary Figures 16, Tables 1-6). Our main findings remain robust, demonstrating that freezing serves as a reliable conditioned response in our paradigms, comparable to freely moving animals. Specifically, freezing behavior increased reliably in the fear-conditioned environment following CFC across all paradigms. We have also added data from a no-shock control group (Supplementary Figure 2) which, when compared to the conditioned group, shows that freezing responses in the conditioned group result from fear conditioning rather than immobility. We do observe other avoidance behaviors unique to our treadmill-based task— such as hesitation, backward movement, and slow crawls. These conditioned behaviors are captured through a separate metric: the time taken to complete a lap.

      (2) As suggested by the reviewers, we have separately analyzed fear discrimination and extinction dynamics across recall days (Supplementary Figures 2, 5 and 6, Table 1-6). To assess fear discrimination, we use within-group comparisons to evaluate how well animals differentiate between the two VRs across days. For extinction, we use within-VR comparisons to examine freezing dynamics over time. Freezing across recall days is compared to baseline freezing (pre-conditioning) using a Linear Mixed Effects model (Tables 1-6), with recall days as fixed effects and mouse as a random effect, using baseline freezing as the reference.

      (3) We have expanded the behavioral dataset in Paradigm 1 to investigate the effect of shock amplitude on the conditioned fear response (Supplementary Figure 2 C-E). Consistent with findings in freely moving animals, our data show that increasing shock intensity from 0.6 mA to 1.0 mA leads to stronger freezing. For the revised manuscript, we specifically increased the sample size in the 0.6 mA group (n = 8) in Paradigm 1, as this intensity is used in Paradigm 3. These additional data demonstrate that combining a lower shock amplitude with shorter inter-shock intervals and retaining the tail-coat during recall can enhance freezing, suggesting that these parameters help compensate for lower shock intensity.

      (4) We have added more sample sizes to the imaging dataset (now n = 8, Figures 7-8).

      Finally, we acknowledge that many aspects of this paradigm still require optimization. The headfixed CFC paradigm is in its early stages compared to the decades of research dedicated to understanding fear learning parameters in freely moving CFC paradigms. While there are numerous parameters that could be tested—both those identified through our own discussions and those raised by the reviewers—it is not feasible for a single lab to conduct a full evaluation of all the possible factors that could influence CFC in the head-fixed prep. A key limitation is that our approach requires robust navigation behavior in the VR without rewards, which requires weeks of training per mouse. It also necessitates larger sample sizes at the outset as not all animals will make it through our behavioral criteria required for CFC. Another important consideration is scalability. Unlike freely moving CFC paradigms, which allow parallel testing of many animals with minimal pre-training, the VR-CFC setup requires several weeks of behavior training and involves a more complex integration of hardware and software to accurately track behavior in virtual space. The number of VR rigs that can be operated simultaneously in a single lab is often limited, making high-throughput testing more challenging. These factors mean that the testing of a single parameter in a group of animals requires approximately 3–4 months to complete. Despite these constraints, we are committed to continue refining this paradigm over time. With this manuscript, our main aim was to provide a detailed framework, initial parameters, and evidence for conditioned behavior in the head-fixed preparation. By doing so, we hope to facilitate the adoption of this paradigm by researchers interested in studying the neural correlates of learning and memory using multiphoton imaging and stimulation techniques. This approach enables investigations that are not possible in freely moving animals, while the presence of freezing as a conditioned response allows for direct comparisons to the extensive body of work done in freely moving paradigms. Moving forward, we anticipate that optimizing this paradigm and identifying the key parameters that drive learning will be a collaborative, community-led effort.

      Public Reviews:

      Reviewer #1 (Public review):

      The authors set out to develop a contextual fear learning (CFC) paradigm in head-fixed mice that would produce freezing as the conditioned response. Typically, lick suppression is the conditioned response in such designs, but this (1) introduces a potential confounding influence of reward learning on neural assessments of aversion learning and (2) does not easily allow comparison of head-fixed studies with extensive previous work in freely moving animals, which use freezing as the primary conditioned response.

      The first part of this study is a report on the development and outcomes of 3 variations of the CFC paradigm in a virtual reality environment. The fundamental design is strong, with headfixed mice required to run down a linear virtual track to obtain a water reward. Once trained, the water reward is no longer necessary and mice will navigate virtual reality environments. There are rigorous performance criteria to ensure that mice that make it to the experimental stage show very low levels of inactivity prior to fear conditioning. These criteria do result in only 40% of the mice making it to the experimental stage, but high rates of activity in the VR environment are crucial for detecting learning-related freezing. It is possible that further adjustments to the procedure could improve attrition rates.

      We acknowledge that further adjustments to the procedure could improve attrition rates, and we will continue to work on improving the paradigm.

      Paradigm versions 1 and 2 vary the familiarity of the control context while paradigm versions 2 and 3 vary the inter-shock interval. Paradigm version 1 is the most promising, showing the greatest increase in conditioned freezing (~40%) and good discrimination between contexts (delta ~15-20%). Paradigm version 2 showed no clear evidence of learning - average freezing at recall day 1 was not different than pre-shock freezing. First-lap freezing showed a difference, but this single-lap effect is not useful for many of the neural circuit questions for which this paradigm is meant to facilitate. Also, the claim that mice extinguished first-lap freezing after 1 day is weak. Extinction is determined here by the loss of context discrimination, but this was not strong to begin with. First-lap freezing does not appear to be different between Recall Day 1 and 2, but this analysis was not done.

      This is an important point. Following reviewer suggestions, we have replotted our figures for all paradigms to show within-VR freezing (see Supplementary Figures 2, 5 and 6) as the appropriate method for quantifying fear extinction across days. Using an LME model (Tables 16), we quantify freezing during recall days against baseline freezing levels measured before fear conditioning within each VR. In Paradigm 2, while some fear discrimination persists across days, extinction does occur rapidly. After the first lap in the CFC VR, we observed no significant differences in freezing compared to the baseline. These results are shown in the revised Supplementary Figure 5, and the revised text is in lines 393-399.

      Paradigm version 3 has some promise, but the magnitude of the context discrimination is modest (~10% difference in freezing). Thus, further optimization of the VR CFC will be needed to achieve robust learning and extinction. This could include factors not thoroughly tested in this study, including context pre-exposure timing and duration and shock intensity and frequency.

      We acknowledge that many aspects of this paradigm still need optimization, as virtual reality CFC is in its early stages, and we have not explored all of the parameter space. We describe above the reasoning for this. However, for this revised version of the paper we have added new behavioral data (Supplementary Figure 2 C-E) showing that increasing shock intensities from 0.6 mA to 1 mA enhances freezing, both in the first lap and on average. There are of course many other parameters that are likely important, like the ones pointed out here by the reviewer, but exploring the entire parameter space will take many years and will likely require many labs. The purpose of this paper is to show that VR-CFC fundamentally works and is a starting point from which the field can build on. We have now pointed out in the introduction (lines 54-58) and discussion (lines 730-737, 810-814) that there remains significant scope for improving this paradigm and optimizing parameters in the future.

      The second part of the study is a validation of the head-fixed CFC VR protocol through the demonstration that fear conditioning leads to the remapping of dorsal CA1 place fields, similar to that observed in freely moving subjects. The results support this aim and largely replicate previous findings in freely moving subjects. One difference from previous work of note is that VR CFC led to the remapping of the control environment, not just the conditioning context. The authors present several possible explanations for this lack of specificity to the shock context, further underscoring the need for further refinement of the CFC protocol before it can be widely applied. While this experiment examined place cell remapping after fear conditioning, it did not attempt to link neural activity to the learned association or freezing behavior.

      This is an interesting observation. We think that the remapping observed in the control context likely occurred due to the absence of reward in a previously rewarded environment. Our prior work has demonstrated that removal of reward causes increased remapping (Krishnan et al., 2022, Krishnan and Sheffield, 2023). In other words, the continued presence of reward within an environment stabilizes CA1 place fields. The Moita et al. (2004) paper, which showed remapping only in the fear conditioned context and not in the control context, provided rats with food pellets throughout the experimental session in both the control and conditioned context— likely to increase exploration necessary for identifying place cells. The presence of reward in the Moita et al experiment could explain the minimal remapping observed in their control context compared to our control context which lacked reward. Another possibility could lie in the differences in the intervals between place cell activity recordings in our study and that of Moita et al. While Moita et al. separated their recordings by just one hour, our recordings were separated by a full day, with a sleep period in between. The absence of sleep and the shorter time interval between conditioning and retrieval sessions in their study could explain the minimal remapping observed by Moita et al. compared to our findings. We have now addressed this discrepancy explicitly in lines 596-606.

      Although we agree with the reviewer that it would be informative to perform analysis of how neural activity correlates with freezing responses, we think this warrants its own stand-alone manuscript as the neural dynamics and methods to appropriately analyze them are complicated. We are in the midst of analyzing this data further and will present these findings in a separate publication.

      In summary, this is an important study that sets the initial parameters and neuronal validation needed to establish a head-fixed CFC paradigm that produces freezing behaviors. In the discussion, the authors note the limitations of this study, suggest the next steps in refinement, and point to several future directions using this protocol to significantly advance our understanding of the neural circuits of threat-related learning and behavior.

      Reviewer #2 (Public review):

      Summary:

      In this manuscript, Krishnan et al devised three paradigms to perform contextual fear conditioning in head-fixed mice. Each of the paradigms relied on head-fixed mice running on a treadmill through virtual reality arenas. The authors tested the validity of three versions of the paradigms by using various parameters. As described below, I think there are several issues with the way the paradigms are designed and how the data are interpreted. Moreover, as Paradigm 3 was published previously in a study by the same group, it is unclear to me what this manuscript offers beyond the validations of parameters used for the previous publication. Below, I list my concerns point-by-point, which I believe need to be addressed to strengthen the manuscript.

      Major comments

      (1) In the analysis using the LME model (Tables 1 and 2), I am left wondering why the mice had increased freezing across recall days as well as increased generalization (increased freezing to the familiar context, where shock was never delivered). Would the authors expect freezing to decrease across recall days, since repeated exposure to the shock context should drive some extinction? This is complicated by the analysis showing that freeing was increased only on retrieval day 1 when analyzing data from the first lap only. Since reward (e.g., motivation to run) is removed during the conditioning and retrieval tests, I wonder if what the authors are observing is related to decreased motivation to perform the task (mice will just sit, immobile, not necessarily freezing per se). I think that these aspects need to be teased out.

      This is an important point and we agree teasing out a lack of motivation versus fearful freezing would be useful. To address the possibility that reduced motivation to run without reward could contribute to the observed freezing behavior, we have now included a no-shock control group in the revised manuscript (n = 7; Supplementary Figure 2A-B, H–I). These control mice experienced the same protocol, including the wearing of a tail coat, but did not receive any shocks. We observed no increases in freezing across days in these controls, confirming that the increased freezing in the Familiar context of our experimental group stems from fear conditioning rather than the removal of reward from a previously rewarded context. If reduced motivation from reward removal were the primary driver, similar freezing patterns would have emerged in the no-shock controls. We have added lines 248-261 in the revised manuscript, discussing this point, and we thank the reviewer for motivating us to do this experiment and analysis.

      That said, the precise mechanisms underlying the fear generalization observed in the nonconditioned context—particularly its emergence during later recall days—remain unclear. Studies in freely moving animals have shown that fear memories initially specific to the conditioned context can become generalized with repeated exposures, which may be occurring here (Biedenkapp & Rudy, 2007; Wiltgen & Silva, 2007). Alternatively, it is possible that the combination of fear conditioning and the removal of expected reward contributes to a delayed generalization effect. This may reflect a limitation of our approach, which relies on reward to motivate initial training. As noted by another reviewer, we have now addressed this potential drawback of reward-based training in the discussion (see lines 809-817). Clearly, unique factors specific to the head-fixed VR paradigm may contribute to this phenomenon. Understanding the mechanisms underlying fear generalization in the head-fixed VR CFC paradigm will be a valuable direction for future research.

      (2) Related to point 1, the authors actually point out that these changes could be due to the loss of the water reward. So, in line 304, is it appropriate to call this freezing? I think it will be very important for the authors to exactly define and delineate what they consider as freezing in this task, versus mice just simply sitting around, immobile, and taking a break from performing the task when they realize there is no reward at the end.

      As noted in point 1 above, we have added a no-shock control group (n = 7; Supplementary Figure 2A-B, H–I) to determine whether the observed freezing was driven by fear conditioning or by reduced motivation to run in the absence of reward. The absence of increased freezing in these controls supports the interpretation that the behavior in the conditioned group is fearrelated. In future studies, incorporating additional physiological measures—such as heart rate monitoring—could further help distinguish fear-related freezing from other forms of immobility.

      (3) In the second paradigm, mice are exposed to both novel and (at the time before conditioning) neutral environments just before fear conditioning. There is a big chance that the mice are 'linking' the memories (Cai et al 2016) of the two contexts such that there is no difference in freezing in the shock context compared to the neutral context, which is what the authors observe (Lines 333-335). The experiment should be repeated such that exposure to the contexts does not occur on the conditioning day.

      This is an interesting idea. However, if memory linking were driving the observed freezing patterns, we would expect to see similarly reduced fear discrimination across all three paradigms, as mice experience both contexts sequentially in each case. However, this effect appears to be specific to Paradigm 2, suggesting this may be due to other factors. We agree it would be informative to eliminate pre-conditioning exposure to both environments—to assess whether this improves fear discrimination and helps clarify the potential contribution of memory linking. This is something we plan to do in future studies that are beyond the scope of this initial paper on VR-CFC.

      (4) On lines 360-361, the authors conclude that extinction happens rapidly, within the first lap of the VR trial. To my understanding, that would mean that extinction would happen within the first 5-10 seconds of the test (according to Figure S1E). That seems far too fast for extinction to occur, as this never occurs in freely behaving mice this quickly.

      We agree with the reviewer that extinction in Paradigm 2 appears to occur relatively rapidly.

      However, the average time to complete the first lap in the fear-conditioned context in Paradigm 2 is 25.68 ± 5.55 seconds (as stated in line 384), indicating that extinction occurs within approximately the first 30 seconds of context exposure—not within 5–10 seconds. This is specific to Paradigm 2 and does not happen in either of the other paradigms, as shown in Supplementary Figure 4. For clarification, Figure S1E pertains to baseline running in Paradigm 1 and does not apply to Paradigm 2.

      As the reviewer points out, even at 30 seconds, extinction seems to be happening more quickly in Paradigm 2 than seen in freely moving setups. This may be due to a key structural difference in our setup. The VR-CFC task is organized into discrete trials, with mice being teleported back to the start after reaching the end of the virtual track. Completing a full lap without receiving a shock could serve as a clear signal that the threat is no longer present within the environment as the completion of a lap means that the animals have surveyed all locations within the environment. This structure could accelerate extinction compared to freely moving setups, where animals take longer to explore their complete environment due to the lack of discrete trials. Although this is true for all our paradigms, the accelerated extinction seen in paradigm 2 versus 1 and 3 may be driven by other factors. As noted by the reviewers, other task parameters—such as context pre-exposure timing, shock intensity, and conditioning duration— are likely to play a role in shaping extinction dynamics. These factors warrant further investigation, and we plan to explore them in future studies to better understand the conditions influencing extinction in the VR-CFC paradigm.

      (5) Throughout the different paradigms, the authors are using different shock intensities. This can lead to differences in fear memory encoding as well as in levels of fear memory generalization. I don't think that comparisons can be made across the different paradigms as too many variables (including shock intensity - 0.5/0.6mA can be very different from 1.0 mA) are different. How can the authors pinpoint which works best? Indeed, they find Paradigm 3 'works' better than Paradigm 2 because mice discriminate better between the neutral and shock contexts. This can definitely be driven by decreased generalization from using a 0.6mA shock in Paradigm 3 compared to 1.0 mA shock in Paradigm 2.

      The reviewer brings up important points here. We have now added new data evaluating 0.6 mA shocks in Paradigm 1 (Supplementary Figure 2A–E, n=8). These data show that 1.0 mA shocks produced stronger conditioned responses and greater fear discrimination compared to 0.6 mA. Our goal in Paradigm 3 was to begin with a lower shock intensity and assess whether additional modifications—specifically the shorter ISI and retention of the tail-coat during recall—could enhance fear conditioning. Surprisingly, despite the weaker shock intensity, Paradigm 3 resulted in improved discrimination and freezing behavior relative to Paradigm 2. We have now clarified this point in the manuscript (lines 466-470), and we interpret this outcome as evidence that the shorter ISIs and contextual cue continuity (tail-coat) likely play a more significant role in enhancing learning and recall. However, as noted in the text (lines 511-514), further testing is needed to determine the individual contributions of each parameter to successful VR-CFC. Fully optimizing the parameter settings will take additional time and resources, and we aim to continually refine the parameter space in the future, as has been done over the years for freely moving animals.

      (6) There are some differences in the calcium imaging dataset compared to other studies, and the authors should perform additional testing to determine why. This will be integral to validating their head-fixed paradigm(s) and showing they are useful for modeling circuit dynamics/behaviors observed in freely behaving mice. Moreover, the sample size (number of mice) seems low.

      The one notable difference between our imaging study and that done in freely moving animals is that we observed remapping of place cells in the control context. In contrast, Moita et al. (2004) reported more stable place fields in the control context. A key distinction is that their study included rewards in the control context, which may have contributed to the spatial stability. We now discuss this difference in the manuscript (lines 599-605).

      It should be noted that there are many key distinctions among paradigms that study neural activity during fear conditioning in freely moving animals. These include varying exposure times to environments (1–6 days), the time interval between neural activity recordings, and the use of food rewards during the experiment stages in freely moving animals to encourage exploration for place cell identification. Although freely moving paradigms that investigate fear conditioning and place cells are heterogeneous, we were encouraged by the replication of several key findings. This validates VR-based CFC as a viable tool for neural circuit investigations. While future work will include more thorough analyses, our current findings demonstrate the paradigm's effectiveness for modeling circuit dynamics and behavior. We have now expanded our dataset, which includes four additional mice, further corroborating these original findings.

      (7) It appears that the authors have already published a paper using Paradigm 3 (Ratigan et al 2023). If they already found a paradigm that is published and works, it is unclear to me what the current manuscript offers beyond that initial manuscript.

      The reviewer is correct that we have published a paper using Paradigm 3. However, this manuscript goes beyond that one and provides a much more comprehensive description and fundamental analysis of the behavior and experimental parameters regarding VR-CFC, allowing the research community to adapt our paradigm reproducibly. While Ratigan et al. (2023) offered only a minimal description of behavior and included just Paradigm 3, we present two additional paradigms along with neuronal validation using hippocampal place cells. We have now explicitly stated this in the introduction (lines 50-55).

      (8) As written, the manuscript is really difficult to follow with the averages and standard error reported throughout the text. This reporting in the text occurred heterogeneously throughout the text, as sometimes it was reported and other times it was not. Cleaning this reporting up throughout the paper would greatly improve the flow of the text and qualitative description of the results.

      We completely agree with this point and have now cleaned up the text, leaving details only in a few places we felt were important.

      Reviewer #3 (Public review):

      Summary:

      Krishnan et al. present a novel contextual fear conditioning (CFC) paradigm using a virtual reality (VR) apparatus to evaluate whether conditioned context-induced freezing can be elicited in head-fixed mice. By combining this approach with two-photon imaging, the authors aim to provide high-resolution insights into the neural mechanisms underlying learning, memory, and fear. Their experiments demonstrate that head-fixed mice can discriminate between threat and non-threat contexts, exhibit fear-related behavior in VR, and show context-dependent variability during extinction. Supplemental analyses further explore alternative behaviors and the influence of experimental parameters, while hippocampal neuron remapping is tracked throughout the experiments, showcasing the paradigm's potential for studying memory formation and extinction processes.

      Strengths:

      Methodological Innovation: The integration of a VR-based CFC paradigm with real-time twophoton imaging offers a powerful, high-resolution tool for investigating the neural circuits underlying fear, learning, and memory.

      Versatility and Utility: The paradigm provides a controlled and reproducible environment for studying contextual fear learning, addressing challenges associated with freely moving paradigms.

      Potential for Broader Applications: By demonstrating hippocampal neuron remapping during fear learning and extinction, the study highlights the paradigm's utility for exploring memory dynamics, providing a strong foundation for future studies in behavioral neuroscience.

      Comprehensive Data Presentation: The inclusion of supplemental figures and behavioral analyses (e.g., licking behaviors and variability in extinction) strengthens the manuscript by addressing additional dimensions of the experimental outcomes.

      Weaknesses:

      Characterization of Freezing Behavior: The evidence supporting freezing behavior as the primary defensive response in VR is unclear. Supplementary videos suggest the observed behaviors may include avoidance-like actions (e.g., backing away or stopping locomotion) rather than true freezing. Additional physiological measurements, such as EMG or heart rate, are necessary to substantiate the claim that freezing is elicited in the paradigm.

      To strengthen our claim that freezing is a conditioned response in this task, we have taken three key steps:

      (1) We adjusted our freezing detection threshold from 1 cm/s to near 0 cm/s to capture only periods where the animal is virtually motionless on the treadmill. We validated this approach in Figure 2, particularly in the zoomed-in track position trace in Figure 2A, which clearly shows that the identified freezing epochs correspond to no change in track position. All analyses and figures have been updated to reflect this more stringent threshold.

      (2) We have added a no-shock control group in the revised manuscript (n = 7; Supplementary Figure 2A-B, H–I) where mice experienced the same protocol, including wearing a tail-coat, but received no shocks. These mice showed no increases in freezing behavior, which further demonstrates that the increased freezing we observe is a result of fear conditioning.

      (3) We have added a new supplementary video (Supplementary Video 2) that better illustrates the freezing behavior in our task.

      That said, we fully agree with the reviewer that freezing is not the only defensive response observed. Other behaviors—such as hesitation, backward movement, and slowing down—also emerge that are unique to our treadmill-based paradigm. We chose to focus on freezing in this manuscript to align with convention in freely moving fear conditioning studies and to facilitate direct comparisons. We agree that additional physiological measurements (e.g., EMG or heart rate) would provide further validation and could help distinguish between different forms of defensive responses. We view this as an important future direction and plan to incorporate such measures in upcoming studies. We highlight this in the results section (lines 175-179, 262-268) and in the discussion (lines 739-750).

      Analysis of Extinction: Extinction dynamics are only analyzed through between-group comparisons within each Recall day, without addressing within-group changes in behavior across days. Statistical comparisons within groups would provide a more robust demonstration of extinction processes.

      This is an important distinction and we have now added figures (Supplementary Figures 2H-I, 5C-D, 6C-D) showing within-VR behavior across Recall days, along with statistical comparisons and a description of the extinction process based on these results.

      Low Sample Sizes: Paradigm 1 includes conditions with very low sample sizes (N=1-3), limiting the reliability of statistical comparisons regarding the effects of shock number and intensity.

      Increasing sample sizes or excluding data from mice that do not match the conditions used in Paradigms 2 and 3 would improve the rigor of the analysis.

      While we included all conditions in Figure 2 for completeness, we have separated these conditions in Supplementary Figure 2 to ensure clarity. This allows researchers interested in this paradigm to see the approximate range of conditioned responses observed across different parameters. When comparing Paradigm 1 with Paradigms 2 and 3, we have only used data from 1mA, 6 shocks condition.

      Potential Confound of Water Reward: The authors critique the use of reward in conjunction with fear conditioning in prior studies but do not fully address the potential confound introduced by using water reward during the training phase in their own paradigm.

      We agree this is a point that needs discussion. We have now noted the limitation of using water rewards during training in the discussion section, particularly its effect on the animal’s motivation in the long term and on place cell activity (lines 814-820).

      Recommendations for the authors

      Reviewer #1 (Recommendations for the authors):

      I suggest changing "3 paradigms" to "3 versions of a CFC paradigm," as the paradigm is fundamentally the same, but parameters were adjusted towards finding an optimal protocol.

      We have changed this phrasing where applicable.

      Figure S2: There appear to be different sets of shock parameters for different mice, most with an n of 1 or 2. This is not reliable for making a decision for optimal shock parameters and should not be discussed in that way until a full-powered comparison is completed. Also, the N adds up to 19, yet only 18 are described as being included in the study.

      We thank the reviewer for this important point. We agree that the current study is not powered to definitively identify optimal parameter settings. We have been careful not to interpret it in that way in the text. Rather, we adopted a commonly used starting point from the freely moving literature—1 mA with six shocks—as our initial condition (lines 196-199). To provide context for others interested in pursuing this work, we have presented a range of conditioned responses from different parameter combinations to illustrate potential variability. In most cases, these data are intended for illustrative purposes only and are not meant to support firm conclusions. We agree that a systematic and fully powered investigation of each parameter would be highly valuable, and we plan to pursue this in future work (and hope other labs contribute to this goal, too), much like the iterative optimizations performed in freely moving paradigms over time.

      We thank the reviewer for catching the sample size discrepancy and have now corrected it.

      The number of animals for the no-shock condition should be included.

      Thank you. We have now included this.

      A possible explanation for the lower fear and poorer discrimination in versions 2 and 3 could be that 10 min pre-exposure to the CFC context on day -1 led to latent inhibition. Shorter (or eliminated) pre-exposure may improve outcomes.

      We agree that the exposure time is a parameter that we should explore. We have highlighted this in the discussion (lines 729-736) as a parameter that is worth testing in the future.

      For analysis of extinction, it is best to establish this within condition - is freezing to the CFC context significantly reduced compared with initial recall and similar to pre-training freezing? By using discrimination as your index of extinction, increases in control context freezing/inactivity can eliminate context discrimination without the conditioned response of freezing actually undergoing extinction.

      This is a good point, and we have now included analysis and conclusions based on a within-VR comparison for the analysis of fear extinction (Supplementary Figures 2H-I, 5C-D, 6C-D).

      Reviewer #3 (Recommendations for the authors):

      Clarification of Treadmill Shape: The manuscript describes the treadmill as "spherical" throughout. However, based on representative images and videos, the treadmill appears cylindrical. This discrepancy should be clarified to ensure consistency between the text and visuals.

      The reviewer is correct that the treadmill is cylindrical, and this was an error on our part. We have corrected it throughout.

      Figure and Legend Labeling: To improve clarity, all figures and their legends should be explicitly labeled with the corresponding paradigm (1, 2, or 3) to facilitate interpretation.

      We have now added a label on all figures that clarifies which Paradigm the figures are referring to. We have also explicitly added this to the figure legends.

      Objective Language: Subjective language, such as "since we wanted animals to" (Line 850), should be revised to reflect an objective tone (e.g., "to allow animals to"). Similarly, phrases like "We believe" (Line 896) should be avoided to maintain an unbiased presentation.

      We have removed subjective language from our text.

      Placement of Future Directions: Speculations on future experimental plans, such as the use of sex as a biological variable (Lines 895-903), should be included in the Discussion section rather than the Methods. Additionally, remarks about the responsiveness of female mice to tail shocks should be moved to the main text for proper contextualization.

      We have moved these lines as suggested by the reviewer.

    1. eLife Assessment

      This valuable study by Guo and colleagues reports the inhibitory activity of caffeic acid phenethyl ester (CAPE) against TcdB, a key toxin produced by Clostridioides difficile. C. difficile infections are a major public health concern, and this manuscript provides interesting data on toxin inhibition by CAPE, a potentially promising therapeutic alternative for this disease. The strength of the evidence to support the conclusions is solid, with some concerns about the moderate effects on the mouse infection model and direct binding assays of CAPE to the toxin.

    2. Reviewer #1 (Public review):

      Summary:

      In this manuscript, Guo and colleagues used a cell rounding assay to screen a library of compounds for inhibition of TcdB, an important toxin produced by Clostridioides difficile. Caffeic acid and derivatives were identified as promising leads, and caffeic acid phenethyl ester (CAPE) was further investigated.

      Strengths:

      Considering the high morbidity rate associated with C. difficile infections (CDI), this manuscript presents valuable research in the investigation of novel therapeutics to combat this pressing issue. Given the rising antibiotic resistance in CDI, the significance of this work is particularly noteworthy. The authors employed a robust set of methods and confirmatory tests, which strengthen the validity of the findings. The explanations provided are clear, and the scientific rationale behind the results is well-articulated. The manuscript is extremely well written and organized. There is a clear flow in the description of the experiments performed. Also, the authors have investigated the effects of CAPE on TcdB in careful detail, and reported compelling evidence that this is a meaningful and potentially useful metabolite for further studies.

      Weaknesses:

      Although the authors have made changes to the manuscript to address some of my comments, many of the comments were not satisfactorily addressed. Many of the changes are still superficial, and some concerns still need to be addressed. Important details are still missing from the description of some experiments. Authors should carefully revise the manuscript to ascertain that all details that could affect interpretation of their results are presented clearly.

      There is still very little discussion (none, really) in the manuscript about the fact that, because the authors observed a significant effect of CAPE on both bacterial growth and spore production, some of the phenotypes observed can no longer be attributed solely to toxin inhibition.

      The details about mass spectrometry are still insufficient. It is still unclear whether metabolite identifications were always based on MS1 or MS2. Instead, several details that are really secondary were included. Authors should be unequivocally clear as to how metabolite identities were obtained. They should also indicate which mass spectrometer was used, and there should be a section in the Materials and Methods describing these experiments.

      About the removal of carry-over compounds, the authors stated that ultrafiltration centrifugal partition was used. However, although the authors explained this in detail in their response to reviewers file, the details were omitted from the main text. Authors should clearly state in the manuscript text that "Due to the large molecular weight of TcdB, approximately 270 kDa, we selected a 100 kDa molecular weight cutoff ultrafiltration membrane. The centrifugation was performed at 4000 g for 5 min to eliminate the compounds that did not bind to TcdB."

      These are important details which need to be included.

    3. Reviewer #2 (Public review):

      I appreciate the author's responses to my original review. This is a comprehensive analysis of CAPE on C. difficile activity. It seems like this compound effects all aspects of C. difficile, which could make it effective during infection but also make it difficult to understand the mechanism. Even considering the authors responses, I think it is critical for the authors to work on the conclusions regarding the infection model. There is some protection from disease by CAPE but some parameters are not substantially changed. For instance, weight loss is not significantly different in the C. difficile only group versus the C. difficile + CAPE group. Histology analysis still shows a substantial amount of pathology in the C. difficile + CAPE group. This should be discussed more thoroughly using precise language.

      The authors did a good job addressing my concerns regarding the infection model by providing a more accurate descriptions in the Results section for histology. However, the weight loss improvement by CAPE does not look like a significant effect, although it is trending towards improvement. This should be more accurately described.

      Another minor concern is that the current Abstract is overstating the amount of disease attenuation. I would replace "remarkably reduces the pathology" with "reduces some of the pathology"

    4. Author response:

      The following is the authors’ response to the previous reviews

      Public Reviews:

      Reviewer #1 (Public review):

      Summary:

      In this manuscript, Guo and colleagues used a cell rounding assay to screen a library of compounds for inhibition of TcdB, an important toxin produced by Clostridioides difficile. Caffeic acid and derivatives were identified as promising leads, and caffeic acid phenethyl ester (CAPE) was further investigated.

      Strengths:

      Considering the high morbidity rate associated with C. difficile infections (CDI), this manuscript presents valuable research in the investigation of novel therapeutics to combat this pressing issue. Given the rising antibiotic resistance in CDI, the significance of this work is particularly noteworthy. The authors employed a robust set of methods and confirmatory tests, which strengthen the validity of the findings. The explanations provided are clear, and the scientific rationale behind the results is well-articulated. The manuscript is extremely well written and organized. There is a clear flow in the description of the experiments performed. Also, the authors have investigated the effects of CAPE on TcdB in careful detail, and reported compelling evidence that this is a meaningful and potentially useful metabolite for further studies.

      Weaknesses:

      The authors have made some changes in the revised version. However, many of the changes were superficial, and some concerns still need to be addressed. Important details are still missing from the description of some experiments. Authors should carefully revise the manuscript to ascertain that all details that could affect interpretation of their results are presented clearly. For instance, authors still need to include details of how the metabolomics analyses were performed. Just stating that samples were "frozen for metabolomics analyses" is not enough. Was this mass-spec or NMR-based metabolomics. Assuming it was mass-spec, what kind? How was metabolite identity assigned, etc? These are important details, which need to be included. Even in cases where additional information was included, the authors did not discuss how the specific way in which certain experiments were performed could affect interpretation of their results. One example is the potential for compound carryover in their experiments. Another important one is the fact that CAPE affects bacterial growth and sporulation. Therefore, it is critical that authors acknowledge that they cannot discard the possibility that other factors besides compound interactions with the toxin are involved in their phenotypes. As stated previously, authors should also be careful when drawing conclusions from the analysis of microbiota composition data, and changes to the manuscript should be made to reflect this. Ascribing causality to correlational relationships is a recurring issue in the microbiome field. Again, I suggest authors carefully revise the manuscript and tone down some statements about the impact of CAPE treatment on the gut microbiota.

      Thanks for your constructive suggestion. We have carefully revised the manuscript according to your suggestions.

      Reviewer #2 (Public review):

      I appreciate the author's responses to my original review. This is a comprehensive analysis of CAPE on C. difficile activity. It seems like this compound affects all aspects of C. difficile, which could make it effective during infection but also make it difficult to understand the mechanism. Even considering the authors responses, I think it is critical for the authors to work on the conclusions regarding the infection model. There is some protection from disease by CAPE but some parameters are not substantially changed. For instance, weight loss is not significantly different in the C. difficile only group versus the C. difficile + CAPE group. Histology analysis still shows a substantial amount of pathology in the C. difficile + CAPE group. This should be discussed more thoroughly using precise language.

      Thanks for your constructive suggestion. We have carefully revised the manuscript according to your suggestions.

      Reviewer #3 (Public review):

      Summary:

      The study is well written, and the results are solid and well demonstrated. It shows a field that can be explored for the treatment of CDI

      Strengths:

      Results are really good, and the CAPE shows a good and promising alternative for treating CDI.

      Weaknesses:

      Some references are too old or missing.

      Comments on revisions:

      I have read your study after comments made by all referees, and I noticed that all questions and suggestions addressed to the authors were answered and well explained. Some of the minor and major issues related to the article were also solved. I am satisfied with all the effort given by the authors to improve their manuscript.

      Thanks again for your review.

      Recommendations for the authors:

      Reviewer #1 (Recommendations for the authors):

      The legend of Figure 3SB is incorrect. It should read "Growth curves of C. difficile BAA-1870 in the presence of varying concentrations of CAPE (0-64 µg/mL)". Also, there is something wrong with the symbols in this figure. I suspect what is happening is that the symbols for the concentrations of 32 and 64 µg/mL are superimposing, but this is a problem because the lower line looks like a closed circle, which is supposed to represent the condition where no CAPE was added. The authors should change the symbols to allow clear distinction between each of the conditions.

      Thanks for your constructive suggestion. We have modified the panel and figure legend in Figure 3SB. The concentrations of 32 μg/mL and 64 μg/mL are quite similar, which makes it challenging to differentiate between the corresponding data points on the graph. To enhance clarity, we have utilized distinct colors to help distinguish these closely valued lines as effectively as possible.

      Since the authors observed a significant effect of CAPE on both bacterial growth and spore production, their discussion and conclusions need to reflect the fact that the effects observed can no longer be attributed solely to toxin inhibition.

      Thanks for your comments. We have modified the corresponding description according to your suggestions.

      In lines 43-45, authors state that "CAPE treatment of C. difficile-challenged mice induces a remarkable increase in the diversity and composition of the gut microbiota (e.g., Bacteroides spp.)". It is still unclear to this reviewer why mention Bacteroides between parentheses. Does this mean that there was an increase in the abundance of Bacteroides? If that is the case this needs to be stated more clearly.

      Thanks for your comments. Treatment with CAPE indeed significantly increased the abundance of Bacteroides spp. in the gut microbiota (Figure 7H-J). However, to avoid ambiguity in the abstract, we have chosen to delete the specific mention of Bacteroides spp. within the parentheses.

      The modifications made to lines 132-135 still do not address my concern. Authors stated in the manuscript that "compounds that were not bound to TcdB were removed". But how was this done? This needs to be clearly explained in the manuscript. In the response to reviewers document, authors state that this was done through centrifugation. But given that the goal here is to separate excess of small molecule from a protein target, just stating that centrifugation was used is not enough. Did the authors use ultracentrifugation? What were the conditions employed. This is critical so that the reader can assess the degree of compound carryover that may have occurred. Also, authors need to clearly acknowledge the caveats of their experimental design by stating that they cannot rule out the contribution of compound carryover to their results.

      Thanks for your comments. We employed ultrafiltration centrifugal partition to remove the unbound small molecule compounds. Due to the large molecular weight of TcdB, approximately 270 kDa, we selected a 100 kDa molecular weight cutoff ultrafiltration membrane. The centrifugation was performed at 4000 g for 5 min to eliminate the compounds that did not bind to TcdB. We have incorporated the relevant methods and discussed the potential impacts on the respective sections of the manuscript.

      In line 142, authors added the molar concentration of caffeic acid, as requested. Although this helps, it is even more important that molar concentrations are added every time a compound concentration is mentioned. For instance, just 2 lines down there is another mention of a compound concentration. It would be informative if authors also added molar concentrations here and throughout the manuscript.

      Thanks for your comments. In our initial test design, we have utilized the concentration unit of μg/mL. However, during the conversion to μM using the dilution method, some values do not result in neat, whole numbers. For instance, the conversion of 32 μg/mL of caffeic acid phenyl ethyl ester yields 112.55 μM, which appears somewhat irregular when expressed in this manner.

      Line 277. For the sake of clarity, I would strongly suggest that authors use the term "control mice" instead of "model mice".

      Thanks for your comments. We have modified “model mice” to “control mice” throughout the manuscript.

      In line 302, the word taxa should not be capitalized. I capitalized it in my original comments simply to draw attention to it.

      Thanks for your comments. We have modified this word.

      In the section starting in line 318, authors still need to include details of how the metabolomics analyses were performed. Just stating that samples were "frozen for metabolomics analyses" is not enough. Was this mass-spec or NMR-based metabolomics. Assuming it was mass-spec, what kind? How was metabolite identity assigned? Etc, etc. These are important details, which need to be included.

      Thanks for your comments. We have added some metabolomics methods in the corresponding section.

      In line 338, the authors misunderstood my original comment. This sentence should read "...the final product of purine degradation, were markedly decreased in mice after...".

      Thanks for your comments. We have modified this sentence.

      Panels of figure 3 are still incorrectly labeled. The secondary structure predictions are shown in A and C, not A and B as is currently stated in the legend.

      Thanks for your comments. We have modified the figure legend in Figure 3.

      About Figure 5C, I think the authors for the clarification, but this explanation should be included in the figure legend.

      Thanks for your comments. We have added the relevant information to the figure legend.

    1. eLife Assessment

      This manuscript provides an important biochemical analysis of p53 isoforms, highlighting their aggregation propensity, interaction with chaperones, and dominant-negative effects on p53 family members. The authors have substantially strengthened the original manuscript by incorporating new mass spectrometry data and clarifying isoform-specific oligomerization behavior. Although the use of high expression levels limits direct physiological interpretation, the work is carefully framed as an investigation of protein misfolding and stability. Overall, this study offers convincing insights into p53 isoform biophysics with broad implications for cancer biology.

    2. Reviewer #1 (Public review):

      Summary:

      Brdar, Osterburg, Munick, et al. present an interesting cellular and biochemical investigation of different p53 isoforms. The authors investigate the impact of different isoforms on the in-vivo transcriptional activity, protein stability, induction of the stress response, and hetero-oligomerization with WT p53. The results are logically presented and clearly explained. Indeed, the large volume of data on different p53 isoforms will provide a rich resource for researchers in the field to begin to understand the biochemical effects of different truncations or sequence alterations.

      Strengths:

      The authors achieved their aims to better understand the impact/activity of different p53 is-forms, and their data well support their statements. Indeed, the major strengths of the paper lie in its comprehensive characterization of different p53 isoforms and the different assays that are measured. Notably, this includes p53 transcriptional activity, protein degradation, induction of the chaperone machinery, and hetero-oligomerization with wtp53. This will provide a valuable dataset where p53 researchers can evaluate the biological impact of different isoforms in different cell lines. The authors went to great lengths to control and test for the effect of (1) p53 expression level, (2) promotor type, and (3) cell type. I applaud their careful experiments in this regard.

      Comments on revised version:

      The authors have addressed all of my concerns convincingly, including with a new mass spectrometry experiment to quantify p53 peptides specifically.

    3. Author response:

      The following is the authors’ response to the original reviews

      Public Reviews:

      Reviewer #1 (Public review):

      Summary:

      Brdar, Osterburg, Munick, et al. present an interesting cellular and biochemical investigation of different p53 isoforms. The authors investigate the impact of different isoforms on the in-vivo transcriptional activity, protein stability, induction of the stress response, and hetero-oligomerization with WT p53. The results are logically presented and clearly explained. Indeed, the large volume of data on different p53 isoforms will provide a rich resource for researchers in the field to begin to understand the biochemical effects of different truncations or sequence alterations.

      Strengths:

      The authors achieved their aims to better understand the impact/activity of different p53 is-forms, and their data will support their statements. Indeed, the major strengths of the paper lie in its comprehensive characterization of different p53 isoforms and the different assays that are measured. Notably, this includes p53 transcriptional activity, protein degradation, induction of the chaperone machinery, and hetero-oligomerization with wtp53. This will provide a valuable dataset where p53 researchers can evaluate the biological impact of different isoforms in different cell lines. The authors went to great lengths to control and test for the effect of (1) p53 expression level, (2) promotor type, and (3) cell type. I applaud their careful experiments in this regard.

      Weaknesses:

      One thing that I would have liked to see more of is the quantification of the various pull-down/gel assays - to better quantify the effect of, e.g., hetero-oligomerization among the various isoforms. In addition, a discussion about the role of isoforms that contain truncations in the IDRs is not available. It is well known that these regions function in an auto-inhibitory manner (e.g. work by Wright/Dyson) and also mediate many PPIs, which likely have functional roles in vivo (e.g. recruiting p53 to various complexes). The discussion could be strengthened by focusing on some of these aspects of p53 as well.

      Thank you for these comments. In this paper we have focused on the importance of the integrity of the folded domains of p53 for their function. The unfolded regions in the N- and the C-terminus have not been our main target but the reviewer is right that they play important regulatory functions that are lost in the corresponding isoforms. We have, therefore, added a few sentences in the Discussion section.

      With respect to a better quantification, we have re-evaluated the quantification and adjusted where necessary (see also reviewer 2). With respect to the hetero-oligomerization we have run a new mass spectrometry experiment in which we only focus on the p53 peptides. These have been now quantitatively evaluated and the results are provided in this manuscript Fig. 5.

      Reviewer #2 (Public review):

      Summary:

      In this manuscript entitled "p53 isoforms have a high aggregation propensity, interact with chaperones and lack 1 binding to p53 interaction partners", the authors suggest that the p53 isoforms have high aggregation propensity and that they can co-aggregate with canonical p53 (FLp53), p63 and p73 thus exerting a dominant-negative effect.

      Strengths:

      Overall, the paper is interesting as it provides some characterization of most p53 isoforms DNA binding (when expressed alone), folding structure, and interaction with chaperones. The data presented support their conclusion and bring interesting mechanistic insight into how p53 isoforms may exert some of their activity or how they may be regulated when they are expressed in excess.

      Weaknesses:

      The main limitation of this manuscript is that the isoforms are highly over-expressed throughout the manuscript, although the authors acknowledge that the level of expression is a major factor in the aggregation phenomenon and "that aggregation will only become a problem if the expression level surpasses a certain threshold level" (lines 273-274 and results shown in Figures S3D, 6E). The p53 isoforms are physiologically expressed in most normal human cell types at relatively low levels which makes me wonder about the physiological relevance of this phenomenon.

      Furthermore, it was previously reported that some isoforms clearly induce transcription of target genes which are not observed here. For example, p53β induces p21 expression (Fujita K. et al. p53 isoforms Delta133p53 and p53beta are endogenous regulators of replicative cellular senescence. Nat Cell Biol. 2009 Sep;11(9):1135-42), and Δ133p53α induces RAD51, RAD52, LIG4, SENS1 and SOD1 expression (Gong, L. et al. p53 isoform D113p53/D133p53 promotes DNA double-strand break repair to protect cell from death and senescence in response to DNA damage. Cell Res. 2015, 25, 351-369. / Gong, L. et al. p53 isoform D133p53 promotes the efficiency of induced pluripotent stem cells and ensures genomic integrity during reprogramming. Sci. Rep. 2016, 6, 37281. / Horikawa, I. et al. D133p53 represses p53-inducible senescence genes and enhances the generation of human induced pluripotent stem cells. Cell Death Differ. 2017, 24, 1017-1028. / Gong, L. p53 coordinates with D133p53 isoform to promote cell survival under low-level oxidative stress. J. Mol. Cell Biol. 2016, 8, 88-90. / Joruiz et al. Distinct functions of wild-type and R273H mutant Δ133p53α differentially regulate glioblastoma aggressiveness and therapy-induced senescence. Cell Death Dis. 2024 Jun 27;15(6):454.) which demonstrates that some isoforms can induce target genes transcription and have defined normal functions (e.g. Cellular senescence or DNA repair).

      However, in this manuscript, the authors conclude that isoforms are "largely unfolded and not capable of fulfilling a normal cellular function" (line 438), that they do not have "well defined physiological roles" (line 456), and that they only "have the potential to inactivate members of the p53 protein family by forming inactive hetero complexes with wtp53" (line 457-458).

      Therefore, I think it is essential that the authors better discuss this major discrepancy between their study and previously published research.

      This manuscript is not about hunting for the next “signal transduction pathway” that is “regulated” by a specific p53 isoform. For such a project work has indeed to be conducted at the endogenous level. However, our manuscript is about the basic thermodynamic behavior of these isoforms in in vitro assays and in some cell culture assays.

      What, however, depends on the expression level is the interaction with chaperones as well as the tendency to aggregate. And this we actually show in our manuscript by using two different promotors with very different strength: Strong overexpression leads to aggregation, much weaker expression to soluble isoforms. For the mass spectrometry experiments we have established stable expressing cell lines and not used transiently overexpressing ones.

      The level from which on the chaperone systems of the cell cannot keep these isoforms soluble and they start to aggregate is certainly an important question, and we have experimental evidence that if we use different chaperone inhibitors the percentage of the aggregating isoforms in the insoluble fraction increases.

      Proteins have to follow the basic physicochemical rules also in cells. And this manuscript sets the stage for re-interpreting the observed cellular effects – not in terms of specific interaction with certain promoters but as causing a stress response and non-specific interaction with other not-well folded domains of other proteins.

      With respect to this discussion about the physiological relevance, it is interesting to look at a study that was published in Cell:

      Rohaly, G., Chemnitz, J., Dehde, S., Nunez, A.M., Heukeshoven, J., Deppert, W. and Dornreiter, I. (2005) A novel human p53 isoform is an essential element of the ATR-intra-S phase checkpoint. Cell, 122, 21-32.

      This manuscript describes how a specific isoform regulates an important pathway. Two other studies also focused on the same isoform but showed that it lacks the nuclear localization signal and therefore does not enter the nucleus. And even if it would, it would have no transcriptional activity due to the unfolding of the DBD.

      Chan, W.M. and Poon, R.Y. (2007) The p53 Isoform Deltap53 lacks intrinsic transcriptional activity and reveals the critical role of nuclear import in dominant-negative activity. Cancer Res, 67, 1959-1969.

      Garcia-Alai, M.M., Tidow, H., Natan, E., Townsley, F.M., Veprintsev, D.B. and Fersht, A.R. (2008) The novel p53 isoform "delta p53" is a misfolded protein and does not bind the p21 promoter site. Protein Sci, 17, 1671-1678.

      This example shows that it is important to re-consider the basic principles of protein structure and protein folding. And that is exactly what this manuscript is about.

      Recommendations for the authors:

      Reviewer #1 (Recommendations for the authors):

      (1) Does the p53g C-terminus (322-346) form cross-beta amyloid structures? The strong fluorescence signal in the presence of ThT suggests this may be forming amyloid. I wonder if any amyloid sequence predictors identify this region as amyloidogenic.

      Using the Waltz predictor (https://doi.org/10.1038/nmeth.1432), the amino acids 339-346 have been identified as potentially amyloidogenic. We have added this information to the manuscript.

      (2) The chaperone binding results in Figure 5 are interesting and indeed suggest that many p53 isoforms interact with chaperones in vivo to counteract their destabilized nature. For the 5 p53 isoforms shown in Figure 5D, do they present any HSP70-binding motifs that may not exist in wtp53? These motifs can be predicted from the sequence with established software in a similar manner as the authors performed for TANGO.

      Author response image 1.

      Predicted Chaperon binding sites using the LIMBO prediction tool. (http://www.ncbi.nlm.nih.gov/pubmed/19696878)

      We have analyzed the sequence of p53 and the isoforms for potential HSP70 binding sites using the LIMBO prediction tool. The results are shown in the figure above. Wild type p53 has a very strong site that is lost in the β- and ɣ-isoforms. The ɣ-isoform in addition loses another predicted binding site which is replaced with a ɣ-specific one. Overall, this analysis does not provide a very clear picture due to the loss of some and the creation of new, isoform-specific binding sites. We have, therefore, not included this analysis in the manuscript but show it here for the reviewers.

      (3) The mixed hetero-tetramers detected by the MS is very interesting. Also the pull-down experiments in Figure 6. However, the extent of hetero-oligomerization is at times hard to follow. Could you more clearly summarize and/or quantify the results of the hetero-oligomerization experiments?

      We have conducted a new mass spectrometry experiment that was focused only on the analysis of p53 peptides. These data are now shown in Figure 5 and Supplementary Figure 6. They show that peptides not present in the Δ133p53α isoform and therefore must come from wild type p53 can be detected. For the Δ133p53β isoform these peptides are absent, suggesting that this isoform does not hetero-oligomerize with wild type p53. Furthermore, all β- and ɣ- isoforms do not show peptides derived from wild type p53, again suggesting that they cannot hetero-oligomerize due to the lack of a functional oligomerization domain.

      (4) There is a typo in Figure 5. The figure title (top of page) says "Figure 4: Chaperons". Also, "chaperons" appears in the legend.

      Thank you for making us aware of this problem. This has been corrected.

      (5) The figures are often quite small with a lot of white space. Figure 4 in particular is arranged in a confusing way with A, D, B, C, E, F, G in T->B L->R order. Perhaps some figures could be expanded or re-arranged to make better use of the available space. E.g. could move B, C above panel D, and then shift F, G to be next to E. This would give you A, [B, C, D], [E, F, G] in a 2x2 format.

      We have rearranged figures 2, 4, 5 and 6 to be able to enlarge the individual figure panels.

      Reviewer #2 (Recommendations for the authors):

      (1) Figure 2C: Why is the p21-Luc reporter assay performed in SAOS-2 cells when all other assays are performed in H1299?

      The assays we have performed in this study are independent of the cell type because we investigate very basic principles of protein folding and stability. If one removes a third of a folded domain, this domain will no longer fold, independent of the cell type it is in. However, to show, that the cell type indeed does not play any role, we have repeated the experiments in H1299 cells. These data are now shown in Figure 2C and the original data in SAOS cells we have moved to Supplementary Figure 1E.

      (2) Figure 3: I find the statistics on this figure very confusing... It looks like every isoform is compared to the "WT", but in that case, in Figure 3B for example, how can the Δ40p53β be ****, Δ133p53γ be *** while the Δ133p53α, more different to WT and narrower error bars is non-specific? I guess this comes from the normalization of the GST expression of each isoform but in this case, the isoforms should not be compared to the WT, but to their respective GST sample.

      There was indeed a mistake in the statistics, thank you for pointing this out.

      We repeated the statistical analysis and the relative protein level within each sample is now calculated using the ratio between the respective GST sample and the sample containing E6. Significance for each isoform was assessed by comparing the relative protein level to the protein level of the WT.

      (3) Figures 3D and 3E: the authors did not perform the assays on Δ40p53 isoforms because they "contain a fully folded DBD" (lines 218-219). This may be true for Δ40p53α as shown by the pAB240 binding figure 3C, but it is speculative for Δ40p53β and Δ40p53γ since these were not tested in Figure 3C either... Furthermore, Figure 3B suggests that there may be differences between Δ40p53α, Δ40p53β and Δ40p53γ and therefore these two isoforms should be tested for pAB240 IP at least (and DARPin as well if the pAB240 IP shows differences). Also, why were the TAp53β and TAp53γ not tested in Figures 3D and 3E?

      Here we disagree with the reviewer. The PDB is full of structures of the p53 DNA binding domain. All of them – including many structures of the same domain from other species – span residues ~90 to 294 (or the equivalent residues in other species). That means that the β- and ɣ- versions of p53 contain the full DNA binding domain. In contrast to the DNA binding domain, the oligomerization domain, however, is truncated and therefore does not form functional tetramers. This is the reason for the reduced binding affinity to DNA.

      The pAB240 antibody recognizes and binds to an epitope that becomes exposed upon the unfolding of the DBD. This manuscript shows by multiple experiments that the DBD of the β- and the ɣ-isoforms are not compromised but that the oligomerization domain is not functional. In figures 3D and 3E we have not included the TA β- and the ɣ-isoforms, because, again, they have a folded DBD and their inclusion would not provide any additional information compared to TAp53α.

      (4) Figures 4B and 4C are small and extremely difficult to read.

      We agree and have rearranged and enlarged these and other figures. Please see also answer to comment (5) of reviewer 1.

      (5) Figure 5C: the authors claim that "the isoform induced cellular stress that triggers the expression of chaperones" (line 320). However, if the induction of the HSP70 promoter is shown, there is no evidence that this is due to cellular stress. Evidence to support that claim should be shown.

      The expression and accumulation of unfolded, aggregation prone sequences is a stress situation for the cell which triggers the expression of chaperones. The expression of isoforms that are not well folded or of p53 mutants that are not well folded increases expression both from the HSP70 promoter and the heat shock promoter. This shows that the expression of unfolded isoforms induces cellular stress.

      (6) Figure 5D: why was this experiment performed in SAOS2 cells when the whole paper was otherwise performed in H1299 cells?<br /> Also, about this figure, the authors write "In addition to this common set, Δ133p53α and Δ40p53α showed only very few additional interaction partners. This situation was very different for Δ133α, Δ133β and TAp53γ." (lines 331 to 333). My feeling is that we should instead read "In addition to this common set, TAp53β and Δ40p53α showed only very few additional interaction partners. This situation was very different for Δ133p53α, Δ133p53β and TAp53γ"

      Thank you for spotting this mistake. Indeed, the correct wording is TAp53β and Δ40p53α and we have corrected the manuscript.

      The mass spectrometry experiments were actually not carried out in SAOS cells, but in U2OS cells. The reason for not using the H1299 cell line was that these cells do not contain functional p53. In contrast, U2OS cells express wild type p53. We have repeated the mass spectrometry analysis and analyzed the data with a special focus on p53 peptides. This information is now added as Figure 5E. In this analysis we show that the Δ133p53α samples contain peptides from the DBD that are not part of this truncated isoform and must therefore originate from wild type p53 with which this isoform hetero-oligomerizes. The corresponding peptides are absent from Δ133p53β, showing that without a functional oligomerization domain this isoform does not interact with wild type p53. Likewise, the data demonstrate that the β- and the ɣ-isoforms do not form hetero-oligomers.

      (7) Supplementary Table 2: the authors claim "For Δ133p53α we could identify peptides between amino acids 102 and 132 that must originate from wild type p53". SAOS2 has a WT TP53 gene and expresses all isoforms endogenously. Therefore, peptides between amino acids 102 and 132 can actually originate from "WT p53" but also TAp53β, TAp53γ, Δ40p53α, Δ40p53β or Δ40p53γ (most likely a mix of these).

      We have not used SAOS cells but U2OS cells. As mentioned above the data show that the Δ133p53α sample contains peptides from wild type p53 and that these peptides cannot be found in the Δ133p53β sample. In addition, peptides originating from the oligomerization domain are only found in the samples of isoforms containing an oligomerization domain but not in samples of β- and ɣ-isoforms. The data are presented in Figure 5 E-G and Supplementary Figure S5.

      Since the Biotin ligase is directly fused to a specific isoform, peptides from other isoforms can only be detected if these directly interact with the isoform fused to the ligase (and contain unique peptides, not present in the isoform fused to the ligase). The data confirm that only isoforms that have a functional oligomerization domain can interact with wild type p53 (or potentially other isoforms with a functional oligomerization domain).

      (8) Figure 6: Why not conduct these luciferase reporter assays using the MDM-2 and p21 promoters like in Figure 2B and 2C since there may be promoter-specific regulation?

      This would be particularly important for the p21 promoter as TAp53β is known to induce it (Fujita K. et al. p53 isoforms Delta133p53 and p53beta are endogenous regulators of replicative cellular senescence. Nat Cell Biol. 2009 Sep;11(9):1135-42) and the Δ133p53α, Δ133p53β and Δ133p53γ isoforms were shown to reduce p21 transcription by TAp73β when co-expressed in H1299 cells (Zorić A. et al. Differential effects of diverse p53 isoforms on TAp73 transcriptional activity and apoptosis. Carcinogenesis. 2013 Mar;34(3):522-9.). Neither of these regulations appears here on the pBDS2 reporter, which is puzzling.

      The main point of this paper is that all isoforms without a complete DNA binding domain and without a complete oligomerization domain do not bind to DNA with high affinity and do not show transcriptional activity and that is independent of the promotor. There might be effects of expressing certain isoforms in some cells, but that is most likely by inducing a stress response via expression of chaperones etc. High affinity sequence specific DNA binding does not play a role here (see results in Figure 2) and we have therefore not conducted these suggested experiments.

    1. eLife Assessment

      This study presents an advance in efforts to use histone post-translational modification (PTM) data to model gene expression and to predict epigenetic editing activity. Such models are broadly useful to the research community, especially ones that can model and predict epigenetic editing activity, which is novel; additionally, the authors have nicely integrated datasets across cell types into their model. The work is mostly solid, but it would be strengthened by performing further comparisons to existing methods that predict gene expression from PTM data and from more comprehensive functional validation of model-predicted epigenome editing outcomes beyond dCas9-p300 based perturbations. This work will be of interest to the epigenetics and computational modeling communities.

    2. Reviewer #1 (Public review):

      Batra, Cabrera and Spence et al. present a model which integrates histone posttranslational modification (PTM) data across cell models to predict gene expression with the goal of using this model to better understand epigenetic editing. This gene expression prediction model approach is useful if a) it predicts gene expression in specific cell lines b) it predicts expression values rather than a rank or bin, c) if it helps us to better understand the biology of gene expression or d) it helps us to understand epigenome editing activity. Problematically for points a) and b) it is easier to directly measure gene expression than to measure multiple PTMs and so the real usefulness of this approach mostly relates to c) and d).

      Other approaches have been published that use histone PTM to predict expression (e.g. PMID 27587684, 36588793). Is this model better in some way? No comparisons are made, although a claim is made that direct comparisons are difficult. I appreciate that the authors have not used the histone PTM data to predict gene expression levels of an "average cell" but rather that they are predicting expression within specific cell types or for unseen cell types. Approaches that predict expression levels are much more useful, whereas some previous approaches have only predicted expressed or not expressed or a rank order or bin-based ranking. The paper does not seem to have substantial novel insights into understanding the biology of gene expression.

      The approach of using this model to predict epigenetic editor activity on transcription is interesting and to my knowledge novel although only examined in the context of a p300 editor. As the author point out the interpretation of the epigenetic editing data is convoluted by things like sgRNA activity scoring and to fully understand the results likely would require histone PTM profiling and maybe dCas9 ChIP-seq for each sgRNA which would be a substantial amount of work.

      Furthermore from the model evaluation of H3K9me3 is seems the model is performing modestly for other forms of epigenetic or transcriptional editing- e.g. we know for the best studied transcriptional editor which is CRISPRi (dCas9-KRAB) that recruitment to a locus is associated with robust gene repression across the genome and is associated with H3K9me3 deposition by recruitment of KAP1/HP1/SETDB1 (PMID: 35688146, 31980609, 27980086, 26501517).

      One concern overall with this approach is that dCas9-p300 has been observed to induce sgRNA independent off target H3K27Ac (https://www.ncbi.nlm.nih.gov/pmc/articles/PMC8349887/ see Figure S5D) which could convolute interpretation of this type of experiment for the model.

      Comments on revisions: This resubmission adds a comparison to existing gene prediction methods, but add no new confirmation experiments with predicting epigenome editing efficiency and had only one minor text edit.

    3. Reviewer #2 (Public review):

      Summary:

      The authors build a gene expression model based on histone post-translational modifications, and find that H3K27ac is correlated with gene expression. They compare to other gene prediction methods such as DeepChrome. They proceed to perturb H3K27ac at 13 gene promoters in two cell types, and measure gene expression changes to test their model.

      Strengths:

      The combination of multiple methods to model expression, along with utilizing 6 histone datasets in 13 cell types allowed the authors to build a model that correlates between 0.7-0.79 with gene expression.<br /> They compare three cells types to other prediction models, and this figure should be included in the main figures.<br /> They use dCas9-p300 fusions to perturb H3K27ac and monitor gene expression to test their model. Ranked correlations of the HEK293 data showed some support for the predictions after perturbation of H3K27ac.

      Weaknesses:

      The authors state in the latest submission that the primary use case of this work is related to predicting epigenome editing outcomes, not predicting gene expression from chromatin. However the first four figures all relate to gene expression prediction. The only main figure that shows epigenome editing prediction is panel 6E. If this authors wish to highlight the use case of this work they should redo figures, including moving panels from current supplemental figures to show this.

      The perturbation of 5 genes in K562 with perturb-seq data shows a modest correlation of ~0.5 and is still only shown in supplemental figures, which is odd as this is the true test case of their model in my opinion. The authors are then left to speculate the reasons why the outcome of epigenome editing doesn't fit their predictions, which highlights the limited value in the current version of this method.<br /> As mentioned before, testing genes that were not expressed being most activated by dCas9-p300 weaken the correlations vs. looking at a broad range of different gene expression as the original model was trained on.

      If the authors want this method to be used to predict outcomes of epigenome editing, expanding to dCas9-KRAB and other CRISPRa methods (SAM and VPR) would be useful. Those datasets are published and could be analyzed for this manuscript and show how the model holds up across cell types and epigenome editing methods.

      The utility of this method as described here, to predict gRNA outcomes seems modest and limited. It is fairly trivial to test 10 or more gRNAs for a single gene to find the best one, and the authors show limited prediction and occasionally no benefit. For example, with CHD8 and CD79 the gRNA with the highest prediction had the lowest actual impact on gene expression of the gRNAs tested. For many other genes the gRNA's prediction and gene expression outcome show no correlation.

    4. Author response:

      The following is the authors’ response to the previous reviews

      Reviewer #1 (Public Review):

      Batra, Cabrera and Spence et al. present a model which integrates histone posttranslational modification (PTM) data across cell models to predict gene expression with the goal of using this model to better understand epigenetic editing. This gene expression prediction model approach is useful if a) it predicts gene expression in specific cell lines b) it predicts expression values rather than a rank or bin, c) if it helps us to better understand the biology of gene expression or d) it helps us to understand epigenome editing activity. Problematically for point a) and b) it is easier to directly measure gene expression than to measure multiple PTMs and so the real usefulness of this approach mostly relates to c) and d).

      We appreciate this point from Reviewer #1 and the instructive comments and helpful feedback on our study. We designed our approach keeping in mind that the primary use case is to understand how epigenome editing would affect gene expression.

      Other approaches have been published that use histone PTM to predict expression (e.g. PMID 27587684, 36588793). Is this model better in some way? No comparisons are made although a claim is made that direct comparisons are difficult. I appreciate that the authors have not used the histone PTM data to predict gene expression levels of an "average cell" but rather that they are predicting expression within specific cell types or for unseen cell types. Approaches that predict expression levels are much more useful whereas some previous approaches have only predicted expressed or not expressed or a rank order or bin-based ranking. The paper does not seem to have substantial novel insights into understanding the biology of gene expression.

      We thank Reviewer #1 again for this insightful comment. We have included citations for a series of papers (PMIDs: 27587684, 30147283, 36588793) that performed gene expression prediction using histone PTM data. However, each of these methods performs classification of gene expression as opposed to predicting the actual gene expression value via regression. Additionally, the referenced studies all work with Roadmap Epigenomics read-depth data as opposed to p-values obtained from the ENCODE pipelines, making it difficult to make direct comparisons. We outline in the Discussion section that by creating a comprehensive dataset of epigenome editing outcomes, which include quantification of histone PTMs before and after in situ 1 perturbations, will improve our understanding of the effects of dCas9-p300 on gene expression and assist in the design of gRNAs for achieving fine-tuned control over gene expression levels. In this revised version of our study, we have also added new data (Figure 3 – figure supplement 3) to further benchmark our model against others.

      The approach of using this model to predict epigenetic editor activity on transcription is interesting and to my knowledge novel although only examined in the context of a p300 editor. As the author point out the interpretation of the epigenetic editing data is convoluted by things like sgRNA activity scoring and to fully understand the results likely would require histone PTM profiling and maybe dCas9 ChIP-seq for each sgRNA which would be a substantial amount of work.

      We agree with the Reviewer and view these experiments as important components of future studies.

      Furthermore from the model evaluation of H3K9me3 is seems the model is performing modestly for other forms of epigenetic or transcriptional editing- e.g. we know for the best studied transcriptional editor which is CRISPRi (dCas9-KRAB) that recruitment to a locus is associated with robust gene repression across the genome and is associated with H3K9me3 deposition by recruitment of KAP1/HP1/SETDB1 (PMID: 35688146, 31980609, 27980086, 26501517).

      This is an interesting point. We have included new data (Figure 4 – figure supplement 1), that quantifies how sensitive the trained gene expression model is to perturbations in H3K9me3. Indeed our data suggests that the model predictions are sensitive to perturbations in H3K9me3. For instance, there is a clear decrease and a gradual increase as the position where the perturbation is performed moves from upstream to downstream of the TSS. Additionally, the magnitude of the predicted fold-change is a function of how much the H3K9me3 is perturbed and hence the magnitude of change would be even higher if the perturbation magnitude is increased. However, this precise magnitude is hard to estimate In the absence of experimental perturbation data for H3K9me3. Leveraging our model in combination with KRAB-based CRISPRi is an exciting and important aspect of future studies.

      One concern overall with this approach is that dCas9-p300 has been observed to induce sgRNA independent off target H3K27Ac (https://www.ncbi.nlm.nih.gov/pmc/articles/PMC8349887/ see Figure S5D) which could convolute interpretation of this type of experiment for the model.

      This remains an excellent point and indeed, we and others have observed that dCas9-p300 can result in off-target H3K27ac levels (both increased and suppressed) across the genome. Our study focused on p300, because the molecule is one of the few known proteins that can catalyze H3K27ac in the human genome, and H3K27ac remains a proxy for active genomic regulatory elements. Nevertheless, any off target activity of dCas9-p300 could certainly convolute our analyses. We have included language to address this caveat in our discussion.

      Reviewer #2 (Public review):

      Summary:

      The authors build a gene expression model based on histone post-translational modifications, and find that H3K27ac is correlated with gene expression. They proceed to perturb H3K27ac at 13 gene promoters in two cell types, and measure gene expression changes to test their model.

      We remain appreciative of the constructive feedback and input from Reviewer #2 on our manuscript.

      Strengths:

      The combination of multiple methods to model expression, along with utilizing 6 histone datasets in 13 cell types allowed the authors to build a model that correlates between 0.7-0.79 with gene expression. They use dCas9-p300 fusions to perturb H3K27ac and monitor gene expression to test their model. Ranked correlations of the HEK293 data showed some support for the predictions after perturbation of H3K27ac.

      Weaknesses:

      The perturbation of 5 genes in K562 with perturb-seq data shows a modest correlation of ~0.5 and isn't included in the main figures. The authors are then left to speculate reasons why the outcome of epigenome editing doesn't fit their predictions, which highlights the limited value in the current version of this method.

      We agree with the reviewer’s suggestion and highlight in our conclusion that generating epigenome editing data across a variety of cell types and across many genes will help uncover the underlying mechanisms of gene expression modulation.

      As mentioned before, testing genes that were not expressed being most activated by dCas9-p300 weaken the correlations vs. looking at a broad range of different gene expression as the original model was trained on.

      We appreciate this comment from Reviewer #2. We note that the data generated from this dCas9-p300 perturb-seq experiment used gRNAs from a pre-existing library published previously (PMID: 37034704). While this library enabled deeper interrogation of dCas9-p300 driven effects compared to our previous revision, the gRNAs in this library were designed against genes associated with haploinsufficiency in neuronal cell types, and which were generally lowly-expressed in K562 cells. Further, we restricted our analysis here to promoter-proximal gRNAs (as opposed to enhancer-targeted gRNAs in the library), focusing our scope even more so. Thus the genes ultimately used for analysis are enriched for low expression.

      If the authors want this method to be used to predict outcomes of epigenome editing, expanding to dCas9-KRAB and other CRISPRa methods (SAM and VPR) would be useful. Those datasets are published and could be analyzed for this manuscript.

      This is an exciting suggestion from Reviewer #2. We agree, and view this as a component of future work in this area.

      The authors don't compare their method to other prediction methods.

      In this revised version of our study, we have also added new data (Figure 3 – figure supplement 3) to further benchmark our model against others. These data demonstrate that our CNN model outperforms existing approaches across multiple cell types.

      Recommendations for the authors:

      Reviewer #2 (Recommendations for the authors):

      Looking at the individual genes in K562 shows a random looking range of predictions and observed, with the exception of Bcl11A which is one of two genes in this set of 5 that are not expressed. I will repeat my earlier comment, that epigenome editing and CRISPRa methods generally show the most upregulation with the lowest expressed genes. I speculate that plotting endogenous expression vs. outcome (assuming using all gRNAs within a reasonable and similar distance to TSS) would produce a correlation of -0.5 or greater and be as useful as this method.

      We agree, and believe that this demonstrates more work is needed in this emerging research area.

      The methods describe Perturb-seq analysis but not the bench experiments.

      We have added the bench methods related to our Perturb-seq experiments to our revised manuscript under the Experimental Methods section in the Appendix.

      I don't understand why the authors can't compare to other methods as that is fairly standard in new prediction papers. I get that others used REMC vs. ENCODE, and were rank or binary based, but the authors could use REMC data and/or convert their data to ranked or binary and still compare. Lacking that it's hard to judge this manuscript.

      We have added benchmarking against existing methods as Figure 3 – figure supplement 3.

    1. eLife Assessment

      This study, which includes additional experiments in response to the reviewer comments, presents valuable findings illustrating the role of PI3Kα in heterotopic ossification in FOP model mice. The methods, data, and analyses are solid and generally support the claims although as noted by one of the reviewers, there is no data demonstrating the effect of BYL79 on cell growth, and it remains unclear whether BYL79 also inhibits the Smad2/3 pathway. While this study provides new insights into the role of the PI3Kα pathway as a therapeutic target for FOP, questions about the mechanism of BYL79 still exist.

    2. Reviewer #1 (Public review):

      Summary:

      In the present study, the authors examined the possibility of using phosphatidyl-inositol kinase 3-kinase alpha (PI3Ka) inhibitors for heterotopic ossification in fibrodysplasia ossificans progressiva. Administration of BYL719, a chemical inhibitor of PI3Ka, prevented heterotopic ossification in a mouse model of FOP that expressed a mutated ACVR1 receptor. Genetic ablation of PI3Ka also suppressed heterotopic ossification in mice. BYL719 blocked osteo/chondroprogenitor specification and reduced inflammatory responses by reducing the number of fibro-adipogenic progenitors (FAPs) and promoting muscle fibre regeneration in vivo. The authors claimed that inhibition of PI3Ka is a safe and effective therapeutic strategy for heterotopic ossification.

      Strengths:

      Taking together previous reports on the specificity of BY718 in PI3K, it was suggested that BYL719 inhibits heterotopic ossification by reducing FAPs and promoting muscle regeneration through the PI3K pathway in vivo.

      Weaknesses:

      In the original manuscript, there was the possibility that BYL719 inhibited heterotopic ossification through non-specific and toxic effects rather than the PI3k pathway.

      However, the authors added new data and explanations in the revision to solve the possibility. The findings of the authors would be useful and would provide an additional direction to develop a therapeutic strategy for heterotopic ossification.

    3. Reviewer #2 (Public review):

      Summary:

      Authors in this study previously reported that BYL719, an inhibitor of PI3Kα, suppressed heterotopic ossification in mice model of a human genetic disease, fibrodysplasia ossificans progressive, which is caused by the activation of mutant ACVR1/R206H by Activin A. The aim of this study is to identify the mechanism of BYL719 for the inhibition of heterotopic ossification. They found that BYL719 suppressed heterotopic ossification in two ways: one is to inhibit the specification of precursor cells for chondrogenic and osteogenic differentiation and the other is to suppress the activation of inflammatory cells.

      Strengths:

      This study is based on authors' previous reports and the experimental procedures including the animal model are established. In addition, to confirm the role of PI3Kα, authors used the conditional knock-out mice of the subunit of PI3Kα. They clearly demonstrated the evidence indicating that the targets of PI3Kα is not members of TGFBR by a newly established experimental method.

      Weaknesses:

      Overall, the presented data were closely related to those previously published by authors' group or others and there were very few new findings. The molecular mechanisms through which BYL719 inhibits HO remain unclear, even in the revised manuscript.<br /> Heterotopic ossification in mice model was not stable and inappropriate for the scientific evaluation.<br /> The method for chondrogenic differentiation was not appropriate, and the scientific evidence of successful differentiation was lacking.<br /> The design of gene expression profile comparison was not appropriate and failed to obtain the data for the main aim of this study.<br /> The experiments of inflammatory cells were performed cell lines without ACVR1/R206H mutation, and therefore the obtained data were not precisely related to the inflammation in FOP.

      Comments on revisions:

      In the R2 version, the authors performed additional experiments using mice with inducible human R206H ACVR1A. BM-MSCs isolated from these mice were used to investigate the effect of Activin-A. The results again suggested that BYL79 inhibited the chondrogenic differentiation of BM-MSCs. However, there are still no data demonstrating the effect of BYL79 on cell growth in these in vitro experiments. In Figures 7A-D, 10 μM BYL79 strongly inhibited the proliferation of inflammatory cells, suggesting that growth inhibition may have contributed to the results shown in Figure 5.

      The main point of discussion concerns the significance of the comparisons made. The fundamental disagreement arises from the role of Activin-A in R206H cells and its effect on chondrogenic differentiation. The authors' rebuttal regarding my comments on the RNA-seq analyses should be reconsidered. The core issue lies in the interpretation of Activin-A's role in R206H cells and the distinction between chondrogenic differentiation and ossification.

      A key feature of R206H mutant cells is that they respond to Activin-A by activating Smad1/5 signaling-comparable in quality to the signaling induced by BMP6 in WT cells. Another important point, as also acknowledged by the authors, is that Activin-A can transduce Smad2/3 signaling via its canonical receptor, ACVR1B. These dual signaling pathways synergistically contribute to chondrogenic differentiation in precursor cells such as FAPs. Several reports have demonstrated that the combined activation of TGF-β and BMP signaling promotes chondrogenesis more strongly than either pathway alone.

      Since the PI3Kα inhibition effect on HO is already known, a critical question in this study is whether BYL79 also inhibits the Smad2/3 pathway. A straightforward experiment would be to compare WT cells treated with Activin-A alone versus Activin-A plus BYL79, and to perform GO term enrichment analyses related specifically to chondrogenic differentiation, not ossification. Additionally, comparing R206H cells treated with Activin-A/BYL79 and WT cells treated with BMP6/BYL79 could help identify gene sets inhibited by BYL79 via Smad2/3 signaling. If these comparisons reveal no specific effect on genes related to chondrogenesis, the effect of BYL79 may be limited to suppression of BMP-mediated osteogenesis. Unfortunately, the authors appear to show little interest in addressing this issue.

      Regarding Figure 7, the authors' rebuttal should also be reconsidered. Since the R2 version employed FOP model mice, it would have been possible to evaluate the effects of BYL79 on inflammatory cells harboring the R206H mutation. This could have enabled a more precise assessment of BYL79's influence on inflammatory signaling. While the authors repeatedly claim that BYL79's effect is not specific to any particular ligand or the presence of the FOP mutation, the role of TGF-β signaling in the development of endochondral heterotopic ossification is well recognized. Therefore, the mechanism of BYL79 should be clarified before considering its therapeutic application

    4. Author response:

      The following is the authors’ response to the previous reviews

      Our revised manuscript thoroughly addresses all comments and suggestions raised by the reviewers, as detailed in our point-by-point response. To strengthen our findings, we have conducted additional in vivo experiments to evaluate the presence of fibro-adipogenic progenitors (FAPs) at different time points during HO formation in control and BYL719-treated mice. Our results indicate that BYL719 reduces the accumulation of FAPs and promotes muscle fiber regeneration in vivo. We have also expanded our discussion on BYL719’s effects on mTOR signaling, further clarifying key points raised by Reviewer #1, and have addressed all minor comments.

      Additionally, in response to Reviewer #2, we have employed an orthogonal and complementary approach using a new model. We conducted chondrogenic differentiation experiments with murine MSCs expressing either ACVR1wt or ACVR1<sup>R206H</sup>. qPCR analysis of chondrogenic gene markers (Sox9, Acan, Col2a1) demonstrates that Activin A enhances their expression in ACVR1<sup>R206H</sup> cells, whereas BYL719 strongly suppresses their expression, regardless of ACVR1 mutational status. These new data further confirm that BYL719 effectively inhibits genes involved in ossification and osteoblast differentiation, independent of the ACVR1 mutation. We have also expanded our discussion to further clarify points raised by Reviewer #2 and have addressed all remaining minor comments.

      Below, we provide a detailed point-by-point response to the reviewers’ comments:

      Rreviewer #1:

      Point 1: In this revised manuscript, the authors clearly showed that BYL719 suppressed the proliferation and differentiation of murine myoblasts, C2C12 cells, in addition to human MSCs in vitro. Furthermore, BYL719 decreased migratory activity in vitro in monocytes and macrophages without suppressing proliferation. Overall, these data suggested that BYL719 is not a specific chemical compound for cell types or signaling pathways as mentioned in the manuscript by the authors themselves. Therefore, it was still unclear how to explain the molecular mechanisms in inhibition of HO by the compound in a specific signaling pathway in a specific cell type, MSCs, contradicting many other possibilities. The authors should add logical explanations in the manuscript.

      Regarding its selectivity, BYL719 is a potent and highly selective inhibitor of PI3Kα. It has been demonstrated in multiple studies and in several in vitro kinase assay panels (Furet et al. PMID: 23726034, Fritsch et al. PMID: 24608574). The IC50 or Kd values for BYL719 against PI3Kα were at least 50 times lower than for most of other kinases tested. Moreover, BYL719 is also highly selective for PI3Kα (IC50 = 4.6 nmol/L) compared to other class I PI3K (PI3Kβ (IC50 = 1,156 nmol/L), PI3Kδ (IC50 = 290 nmol/L), PI3Kγ (IC50 = 250 nmol/L)) (Fritsch et al). Consistent with these data, we show that, at the concentrations tested, BYL719 does not have a direct effect on any kinase receptor within the TGF-b superfamily, including ACVR1 or ACVR1<sup>R206H</sup>.

      Rather than blocking ACVR1 kinase activity, in our manuscript we provide evidence that BYL719 has the potential to inhibit osteochondroprogenitor specification and prevent an exacerbated inflammatory response in vivo (Valer et al., 2019a PMID: 31373426, and this manuscript) through different mechanisms, such as (i) increasing SMAD1/5 degradation, (ii) reducing transcriptional responsiveness to BMPs and Activin, (iii) blocking non-canonical ACVR1 responses such as the activation of AKT/mTOR. All these defined molecular mechanisms contribute to suppress HO in vitro and in vivo, as we report and explain throughout the manuscript. Selective PI3Kα inhibition is at the core of the different molecular pathways described. As such, PI3Kα blockade inhibits the phosphorylation of GSK3 and compromises SMAD1 protein stability, thereby altering canonical responsiveness and osteochondroprogenitor specification (Gamez et al PMID: 26896753; Valer et al PMID: 31373426). Moreover, PI3Kα blockade downregulates Akt/mTOR signalling, which is critical for FOP and non‐genetic (trauma induced) HO in preclinical models (Hino et al, 2017 PMID: 28758906; Hino et al. PMID: 30392977). Finally, PI3Kα inhibition hampers a number of proinflammatory pathways, thereby limiting the expression of pro-inflammatory cytokines, reducing the proliferation of monocytes, macrophages and mast cells, and partially blocking the migration of monocytes. As we suggest in the discussion of the manuscript, this effect likely causes a poor recruitment of monocytes and macrophages at injury sites and throughout the in vivo ossification process.

      Noteworthy, in our manuscript we do not refer to a “specific chemical compound for cell types”. Rather, in the Discussion we write “the administration of BYL719 prevented an exacerbated inflammatory response in vivo, possibly due to specific effects observed on immune cell populations.” This sentence did not intend to imply that BYL719 only affects these specific cell types, but aimed to emphasize the effects observed on those cell populations, even though systemic BYL719 may affect all populations. We rephrased it to “the administration of BYL719 prevented an exacerbated inflammatory response in vivo, possibly due to the effects observed on immune cell populations.” to provide a clearer message as suggested by the reviewer. We thank the reviewer for these questions and hope that these explanations and changes in the text improve the clarity of the message.

      Mesenchymal stem/stromal cells (MSCs) are osteochondroprogenitor cells that can follow distinct differentiation paths. In this study, we use these cells as an in vitro model for the study of osteochondrogenitor specification. MSCs, and induced MSCs (iMSCs), have been widely used as in vitro cellular models of osteochondroprogenitor specification for the analysis of markers, signaling, modulation, and differentiation potential or capacity. Their use as models for this purpose has been extensively studied in wild type MSCs, and in the presence of FOP mutations (Boeuf and Richter PMID: 20959030; Schwartzl et al. PMID: 37923731).

      Point 2: Related to comment #1, the effects of BYL719 on the proliferation and differentiation of fibro-adipogenic cells in skeletal muscle, which are potential progenitor cells of HO, should be important to support the claim of the authors.

      We have performed additional in vivo experiments to assess the presence of fibro-adipogenic precursors (FAPs) at different time-points during HO formation in control and BYL719-treated in the mouse model of heterotopic ossification. We analyzed the number of fibro-adipogenic progenitor (FAPs) during the progression of the HO. These data are shown in the new Figure3-Figure Supplement 1. We demonstrate that BYL719 reduces the number of PDGFRA+ cells (FAPs, red) throughout the ossification process in vivo. Moreover, now we also show an enlargement of the diameter of myofibers (labelled with wheat germ agglutinin, green) when animals were treated with BYL719, indicating improved muscle regeneration and further validating the data reported as supplementary figures that were added in the first revision of this manuscript.

      Point 3: BYL719 inhibited signaling through not only ACVR1-R206H and ACVR1-Q207D but also wild type ACVR1 and suppressed the chondrogenic differentiation of parental MSCs regardless of the expression of wild type or mutant ACVR1. Again, these findings suggest that BYL719 inhibits HO through a multiple and nonspecific pathway in multiple types of cells in vivo. The authors are encouraged to explain logically the use of bone marrow-derived MSCs to examine the effects of BYL719.

      As detailed in main point 1, we consider that the main target, molecular mechanisms and inhibited pathways by BYL719 are specific and well characterised in other research articles and further defined in this manuscript, including the generation of PI3Ka deficient mice in an FOP background, that undoubtedly demonstrates an essential role for PI3Ka in ACVR1-driven heterotopic ossification in vivo. Altogether, we are confident that BYL719 inhibits HO through multiple and specific pathways that arise from the PI3Kα inhibition. As a systemically administrated drug, BYL719 affects the multiple types of cells in vivo that express PI3Kα. It is well known that PI3Kα is exquisitely required for chondrogenesis and osteogenesis (Zuscik et al. PMID; Gamez et al PMID: 26896753 1824619). Accordingly, throughout the manuscript we refrain from suggesting a specific effect on ACVR1-R206H cells but instead an inhibitory effect on cell number and differentiation regardless on the ACVR1 form expressed.

      Similarly, as detailed in main point 1, MSCs and hiPSCs have been extensible used as in vitro cellular models of osteochondroprogenitor specification for the analysis of markers, signaling, modulation, and differentiation potential or capacity (Barruet et al., PMID: 28716551; Kan et al., PMID: 39308190).

      Point 4: BYL719 clearly inhibits an mTOR pathway. Is there a possibility that BYL719 suppresses HO by inhibiting mTOR rather than PI3K? The authors are encouraged to show the unique role of PI3K in BYL719-suppressed HO formation.

      As clarified above, BYL719 is a potent and selective inhibitor of PI3Kα, with minimal off-target inhibition against other kinases, as it has been demonstrated in multiple studies and in several in vitro kinase assay panels. In the same study, while IC50 of BYL719 against PI3Kα was (IC50 = 4.6 nmol/L), IC50 against mTOR was (IC50= >9,100 nmol/L), indicating that it was not directly inhibited. mTOR is one of the well-known pathways that are activated downstream of PI3K. Therefore, there is no surprise that blocking PI3Kα will block mTOR signalling. This potential effect was already demonstrated in previous publications (Valer et al., 2019a PMID: 31373426) and discussed throughout the first revision. We consider that the additive effect of mTOR inhibition and other molecular mechanisms downstream of PI3Kα, including reduced SMAD1/5 protein levels, contribute to the in vivo HO inhibition by BYL719.

      Reviewer #2:

      Point 1: It is also important to note that, in most of the data, there is no significant difference between cells with wild-type ACVR1 and those with the R206H mutation. The authors demonstrated that ACVR1 is not a target of BYL719 based on NanoBRET assay data, suggesting that BYL719's effect is not specific to FOP cells, even though they used an FOP mouse model to show in vivo effects.

      The main effect of R206H mutation is the gain of function in response to Activin A. For most of the responses to other ACVR1 ligands (e.g. BMP6/7), we observe a slightly increased response in the presence of the mutation (which is consistent with previous research, usually labelling RH as a “weak activating mutant” unless Activin A is added (Song et al., PMID: 20463014)). Therefore, as expected, most of the differences between WT and RH mutant cells can be observed mostly upon Activin A addition, as observed, for example, in Figure 3 of our manuscript.

      We agree with the reviewer that, at the concentrations used, BYL719 does not specifically target FOP cells. However, we believe that it targets downstream pathways of PI3Kα inhibition that are essential for osteochondrogenic specification, regardless of mutation status. This therapeutic strategy aligns with other experimental drugs, including Palovarotene (validated for FOP) and Garetosmab and Saracatinib (in advanced clinical trials), which target Activin A function, ACVR1 activity, or osteochondrogenic differentiation irrespective of the mutant allele. Unlike these molecules, BYL719 has been chronically administered to patients (including children) without major side effects (Gallagher et al.; PMID: 38297009), further supporting its potential for safe long-term use.

      The authors should consider that the effect of Activin A on R206H cells is not identical to that of BMP6 on WT cells. If the authors aim to identify the target of BYL719 in FOP cells, they should compare R206H cells treated with Activin A/BYL719 to WT cells treated with BMP6/BYL719.

      We use Activin A and BMP6, both high-affinity ACVR1 ligands, to demonstrate, as observed in figure 6, that PI3Kα inhibition can inhibit the expression of genes within GO terms ossification and osteoblast differentiation. It is important to note, however, that Activin A canonical signaling receptor is ACVR1B. Since BYL719 blocks the induction of a heterotopic ossification gene expression signature common to Activin A and BMP6, in the context of the FOP mutation R206H, our results indicate that BYL719 inhibition affects a signaling pathway downstream of ACVR1, activated by either BMP6 (wild type receptor, relevant for non-genetic heterotopic ossifications) or Activin (R206H mutant receptor, relevant for FOP).

      We consider that the comparison (RH ACTA BYL vs WT BMP6 BYL) would provide confounding results raised from intrinsic model differences in basal expression programs (WT vs RH), and differences in the quantitative level of signaling of the different ligands at these specific doses. First, if we only consider SMAD1/5 signaling, Activin A and BMP6 won’t have identical signaling, and differences will arise from the strength of that signaling. Secondly, in the suggested comparison we would find, mostly, all the differential gene expression promoted by Activin A canonical signaling through type I receptors ACVR1B/ALK4 in complex with ACVR2A or ACVR2B, promoting SMAD2/3 activation (in addition to the altered signaling that ACVR1-R206H could promote). Examples of differential response in pSMAD1/5 in ACVR1-WT or RH with BMP ligands and R206H with Activin A ligand, and examples of pSMAD2/3 canonical signaling in R206H cells have been described in Ramachandran et al, PMID: 34003511; Hatsell et al., PMID: 26333933).

      Point 2: The interpretation of the data in the new Figure 5 is inappropriate. Based on the expression levels of SOX9, COL2A1, and ACAN, it is unclear whether the effect of BYL719 is due to the inhibition of differentiation or proliferation. The addition of Activin A showed no difference between ACVR1/WT and ACVR1/R206H cells, suggesting that these cells did not accurately replicate the FOP condition.

      To gain consistency in our manuscript, we decided to use an orthogonal and complementary approach in a completely new model. We performed new experiments of chondrogenic differentiation using murine MSCs from UBC-Cre-ERT2/ACVR1<sup>R206H</sup> knock-in mice. These cells, when treated with 4OH-tamoxifen, express the intracellular exons of human ACVR1<sup>R206H</sup> in the murine Acvr1 locus. Therefore, we can compare differentiation of wild type and R206H MSCs isolated form the same mice. We initiated the chondrogenic differentiation assay from confluent cells to minimize changes in cell proliferation throughout the process. These new results are shown in the new Figure 5F. Mutant (RH) cells display an enhanced chondrogenic response to activin A compared to wild type cells. The treatment with BYL719 decreased the expression of chondrogenic markers irrespective of the mutational status of ACVR1 in the cells, further supporting our previous results in this manuscript and published article (Valer et al., 2019a PMID: 31373426).

      Point 3: The additional investigation of RNA-seq data provided useful information but was insufficient to fully address the purpose of this study. The authors should identify downregulated genes by comparing WT cells treated with Activin A/BYL719 and Activin A alone and then compare these identified genes with those shown in Figure 5E. Additionally, they should compare R206H cells treated with Activin A/BYL719 to WT cells treated with BMP6/BYL719. These comparisons will clarify whether there are FOP-specific BYL719-regulated genes.

      We thank the reviewer for considering that RNAseq data provides useful information. As already discussed in our answer above, our results indicate that regardless of the ligand (Activin A or BMP6) and regardless of the ACVR1 mutation (WT, relevant for non-genetic heterotopic ossifications or RH, relevant for FOP), BYL719 can inhibit the expression of the genes relevant to endochondral ossification. In our opinion, this is a very relevant conclusion of this study.

      We have deeply considered the strategy proposed by the reviewer, comparing “WT cells treated with Activin A/BYL719 and Activin A alone and then compare these identified genes with those shown in Figure 5E” and/or comparing “R206H cells treated with Activin A/BYL719 to WT cells treated with BMP6/BYL719”. While we have discussed why we do not consider appropriate the first comparison proposed, there are a number of reasons why we are not confident that the second comparison would provide a straightforward conclusion.

      Regarding the second suggested comparison already in Main point 1, we consider that it would provide confounding results due to all the arguments detailed in Main point 1. Regarding the first suggested comparison, we also consider that it would provide confounding results. There are several reasons why we do not consider that the genes only found in the RH comparison can be confidently considered genes that are only affected by BYL719 in RH cells.

      First, the effect of BYL719 in an osteogenic-prone sample (for example, RH-ActA) is higher than the effect that we can observe in absence of this activation (for example, WT-ActA), as observed in the higher number of significantly downregulated genes in RH ActA BYL vs RH ActA comparison, compared to WT ActA BYL vs WT ActA. Similar results are observed in figure 3C, where the expressions of the genes are significantly inhibited in RH ActA compared to RH ActA BYL. This inhibition is not significantly observed in in WT ActA compared to WT ActA BYL because the osteogenic expression of these genes is already very weak in the absence of ACVR1 R206H. This weak signaling of pSMAD1/5 in the absence of osteogenic signaling (RH without ligand or, especially, WT with Activin A) has already been described (Ramachandran et al. MID: 34003511). Therefore, even though the inhibition is present in both comparisons, as observed in figure 6C, the extent of the observed effect is different. Second, we are comparing a different number of DEGs for each comparison between them. If we compare the 67 downregulated genes from one comparison and 38 downregulated genes from the other comparison, the unequal list size may inflate the number of unique genes in the group with more downregulated genes. To prove these concerns, we performed the comparison that the reviewer suggested and we found, for example, that amongst the 38 differentially downregulated ossification genes in (WT_ActA_BYL vs WT_ActA) and 67 differentially downregulated ossification genes in (RH_ActA_BYL vs RH_ActA), 39 genes were only found in the RH comparison, while 10 were only found in the WT comparison, and 28 were found in both.

      These effects are present, for example, when studying the ID genes, well-known downstream mediators of BMP signaling. In this case, ID1 is downregulated in both comparisons, while ID2, ID3, and ID4, are downregulated only in the RH-group, despite the fact that all ID1, ID2, ID3, and ID4 are similarly regulated and increase their expression with similar time curves upon BMP signaling activation (Yang et al., PMID: 23771884). Therefore, we consider that the comparisons proposed will not help us to identify specific BYL719-regulated genes relevant for FOP and/or ACVR1 R206H signaling. Again, we consider that BYL719 effect is not specific of FOP cells. Our results show that regardless of the ligand (Activin A or BMP6) and regardless of the ACVR1 mutation (WT, relevant for non-genetic heterotopic ossifications or RH, relevant for FOP), BYL719 can inhibit the expression of the genes linked to ossification and osteoblast differentiation, which could be important for the treatment of FOP and non-genetic heterotopic ossifications.

      Point 4: The data in Figure 7 are not relevant to the aim of this study because the cell lines used in these experiments did not have ACVR1/R206H mutations. The authors mentioned that BMP6 is a ligand for ACVR1 and, therefore, these experiments reflect the situation of inflammatory cells in FOP. This is inappropriate and not rational. As mentioned above, the effect of Activin A on FOP cells is not identical to the effect of BMP6 in wild-type cells. The data in Figure 7 indicated that the effect of BYL719 is unrelated to the presence of BMP6, clearly demonstrating that these experiments are not related to the activation of ACVR1. In the gene expression analyses, almost all genes showed no changes with the addition of BMP6. Only TGF and CCL2 showed upregulation in THP1 cells, and the treatment with BYL719 failed to inhibit the effect of BMP6, suggesting that these experiments merely demonstrate the effect of BYL719 on inflammatory cells irrespective of the presence of the HO signal.

      We consider that Figure 7 is relevant to the aim of this study. As shown in Fig. 8, treatment of FOP mice with BYL719 led to a decreased recruitment of immune cells within the FOP lesions, suggesting a direct effect of BYL719 in immune cells. This is very relevant for the FOP pathology, since flare-ups have been linked with inflammatory episodes since the very early characterization of the disease (Mejias-Rivera et al., PMID: 38672135). Given the technical difficulties to transduce THP1, RAW264 and HMC1 cell lines with lentiviral particles carrying ACVR1 R206H, we decided to partially recapitulate ACVR1 R206H activation with recombinant BMP6 and to test the effect of BYL719 in these conditions. In these models, we found that BYL719 inhibited the expression of key genes driving immune cell activation, in a cell-type and ligand independent manner. To clarify this rationale, we have swapped Figures 7 and 8 and adjusted our conclusions accordingly. We have softened our interpretations, emphasizing the absence of the ACVR1 R206H mutant receptor in these experiments.

    1. eLife Assessment

      Using a unique cerebellar disruption approach in non-human primates, this study provides valuable new insight into how cerebellar inputs to the motor cortex contribute to reaching. The findings convincingly demonstrate that reaching movements following cerebellar disruption slow down because of both an acute deficit in producing muscle activity as well as a progressive decline in compensating for limb dynamics. This work will be of interest to neuroscientists and clinicians interested in cerebellar function and pathology.

    2. Reviewer #1 (Public review):

      Summary:

      In a previous work Prut and colleagues had shown that during reaching, high frequency stimulation of the cerebellar outputs resulted in reduced reach velocity. Moreover, they showed that the stimulation produced reaches that deviated from a straight line, with the shoulder and elbow movements becoming less coordinated. In this report they extend their previous work by addition of modeling results that investigate the relationship between the kinematic changes and torques produced at the joints. The results show that the slowing is not due to reductions in interaction torques alone, as the reductions in velocity occur even for movements that are single joint. More interestingly, the experiment revealed evidence for decomposition of the reaching movement, as well as an increase in the variance of the trajectory.

      Strengths:

      This is a rare experiment in a non-human primate that assessed the importance of cerebellar input to the motor cortex during reaching.

      Weaknesses:

      None

    3. Reviewer #2 (Public review):

      This manuscript asks an interesting and important question: what part of 'cerebellar' motor dysfunction is an acute control problem vs a compensatory strategy to the acute control issue? The authors use a cerebellar 'blockade' protocol, consisting of high frequency stimuli applied to the cerebellar peduncle which is thought to interfere with outflow signals. This protocol was applied in monkeys performing center out reaching movements and has been published from this laboratory in several preceding studies. I found the take-home-message broadly convincing and clarifying - that cerebellar block reduces muscle activation acutely particularly in movements that involve multiple joints and therefore invoke interaction torques, and that movements progressively slow down to in effect 'compensate' for these acute tone deficits. The manuscript was generally well written, data were clear, convincing and novel. The key strengths are differentiating acute from sub-acute (within session but not immediate) kinematic consequences of cerebellar block.

    4. Reviewer #3 (Public review):

      Summary:

      In their revised manuscript, Sinha and colleagues aim to identify distinct causes of motor impairments seen when perturbing cerebellar circuits. This goal is an important one, given the diversity of movement related phenotypes in patients with cerebellar lesion or injury, which are especially difficult to dissect given the chronic nature of the circuit damage. To address this goal, the authors use high-frequency stimulation (HFS) of the superior cerebellar peduncle in monkeys performing reaching movements. HFS provides an attractive approach for transiently disrupting cerebellar function previously published by this group. First, they find a reduction in hand velocities during reaching, which was more pronounced for outward versus inward movements. By modeling inverse dynamics, they find evidence that shoulder muscle torques are especially affected. Next, the authors examine the temporal evolution of movement phenotypes over successive blocks of HFS trials. Using this analysis, they find that in addition to the acute, specific effects on torques in early HFS trials, there was an additional progressive reduction in velocity during later trials, which they interpret as an adaptive response to the inability to effectively compensate for interaction torques during cerebellar block. Finally, the authors examine movement decomposition and trajectory, finding that even when low velocity reaches are matched to controls, HFS produces abnormally decomposed movements and higher than expected variability in trajectory.

      Strengths:

      Overall, this work provides important insight into how perturbation of cerebellar circuits can elicit diverse effects on movement across multiple timescales.

      The HFS approach provides temporal resolution and enables analysis that would be hard to perform in the context of chronic lesions or slow pharmacological interventions. Thus, this study describes an important advance over prior methods of circuit disruption in the monkey, and their approach can be used as a framework for future studies that delve deeper into how additional aspects of sensorimotor control are disrupted (e.g., response to limb perturbations).

      In addition, the authors use well-designed behavioral approaches and analysis methods to distinguish immediate from longer-term adaptive effects of HFS on behavior. Moreover, inverse dynamics modeling provides important insight into how movements with different kinematics and muscle dynamics might be differentially disrupted by cerebellar perturbation.

      In this revised version of the manuscript, the authors have provided additional analyses and clarification that address several of the comments from the original submission.

      Remaining comments:

      The argument that there are acute and adaptive effects to perturbing cerebellar circuits is compelling, but there seems to be a lost opportunity to leverage the fast and reversible nature of the perturbations to further test this idea and strengthen the interpretation. Specifically, the authors could have bolstered this argument by looking at the effects of terminating HFS - one might hypothesize that the acute impacts on joint torques would quickly return to baseline in the absence of HFS, whereas the longer-term adaptive component would persist in the form of aftereffects during the 'washout' period. As is, the reversible nature of the perturbation seems underutilized in testing the authors' ideas. While this experimental design was not implemented here, it seems like a good opportunity for future work using these approaches.

      The analysis showing that there is a gradual reduction in velocity during what the authors call an adaptive phase is convincing. While it is still not entirely clear why disruption of movement during the adaptive phase is not seen for inward targets, despite the fact that many of the inward movements also exhibit large interaction torques, the authors do raise potential explanations in the Discussion.

      The text in the Introduction and in the prior work developing the HFS approach overstates the selectivity of the perturbations. First, there is an emphasis on signals transmitted to the neocortex. As the authors state several times in the Discussion, there are many subcortical targets of the cerebellar nuclei as well, and thus it is difficult to disentangle target-specific behavioral effects using this approach. Second, the superior cerebellar peduncle contains both cerebellar outputs and inputs (e.g., spinocerebellar). Therefore, the selectivity in perturbing cerebellar output feels overstated. Readers would benefit from a more agnostic claim that HFS affects cerebellar communication with the rest of the nervous system, which would not affect the major findings of the study. In the revised manuscript, the authors do provide additional anatomical and evolutionary context and discuss potential limitations in the selectivity of HFS in the Materials and Methods. However, I feel that at least a brief mention of these caveats in the Introduction, where it is stated, "we then reversibly blocked cerebellar output to the motor cortex", would benefit the reader.

    5. Author response:

      The following is the authors’ response to the original reviews

      Summary of Revisions

      We sincerely thank the editors and reviewers for their thorough assessment and constructive feedback, which has greatly improved our manuscript. We have carefully addressed all concerns as summarized below:

      In response to the requests made by Reviewer #1:

      • Clarified task design and acknowledged its limitations regarding endpoint accuracy control.

      • Included analysis comparing the effects of cerebellar block on within-trial versus inter-trial movements.

      • Clearly defined target groupings, replacing the term “single-joint” with “movements with low coupling torques” and “multi-joint” with “movements with high coupling torques”: definitions which are now supported by a supplementary material describing the net torque data as a function of the targets.

      • Added detailed descriptions of trial success criteria, based on timing, and positional constraints.

      • Expanded figures illustrating the effect of the cerebellar block on movement decomposition and variability in joint space and across different target directions.

      In response to the requests made by Reviewer #2:

      • Included an explicit discussion highlighting why the acute reduction in muscle torque during cerebellar block is likely due to agonist weakness rather than cocontraction, emphasizing the rationale behind our torque-centric analysis.

      • Clearly defined trial success criteria and included the timing and accuracy constraints used in our study.

      • Clarified our rationale for grouping targets based on shoulder flexion/extension, clearly justified by interaction torque analysis.

      • Revised the caption and legend of Figure 3d for clarity and included partial correlation results to account for the variability across monkeys for the analysis of reduction in hand velocity vs. coupling torque in control. 

      In response to the requests made by Reviewer #3:

      • Included electrophysiological validation of the accuracy of targeting the superior cerebellar peduncle from one of the monkeys used in the experiment.

      • Provided new analyses comparing movement decomposition and variability between slower and faster movements within the cerebellar block condition.

      • Revised manuscript text to clarify terminology and clearly explained the rationale behind target groupings and torque analyses.

      • Expanded discussion sections to better explain the relationships between timing deficits, movement decomposition, trajectory variability, and faulty motor commands.

      • Clarified methodological choices regarding our analysis timeframe and acknowledged limitations related to the distinction between feedforward and feedback control.

      Reviewer #1 (Public review): 

      Summary:

      In a previous work, Prut and colleagues had shown that during reaching, high-frequency stimulation of the cerebellar outputs resulted in reduced reach velocity. Moreover, they showed that the stimulation produced reaches that deviated from a straight line, with the shoulder and elbow movements becoming less coordinated. In this report, they extend their previous work by the addition of modeling results that investigate the relationship between the kinematic changes and torques produced at the joints. The results show that the slowing is not due to reductions in interaction torques alone, as the reductions in velocity occur even for movements that are single joints. More interestingly, the experiment revealed evidence for the decomposition of the reaching movement, as well as an increase in the variance of the trajectory.

      Strengths:

      This is a rare experiment in a non-human primate that assessed the importance of cerebellar input to the motor cortex during reaching.

      We thank the reviewer for their positive feedback on our study. We particularly appreciate their recognition of the novelty and importance of our experimental approach in non-human primates, as well as their insightful summary of our key findings.

      Weaknesses:

      My major concerns are described below.

      If I understand the task design correctly, the monkeys did not need to stop their hand at the target. I think this design may be suboptimal for investigating the role of the cerebellum in control of reaching because a number of earlier works have found that the cerebellum's contributions are particularly significant as the movement ends, i.e., stopping at the target. For example, in mice, interposed nucleus neurons tend to be most active near the end of the reach that requires extension, and their activation produces flexion forces during the reach (Becker and Person 2019). Indeed, the inactivation of interposed neurons that project to the thalamus results in overshooting of reaching movements (Low et al. 2018). Recent work has also found that many Purkinje cells show a burst-pause pattern as the reach nears its endpoint, and stimulation of the mossy fibers tends to disrupt endpoint control (Calame et al. 2023). Thus, the fact that the current paper has no data regarding endpoint control of the reach is puzzling to me.

      We appreciate the reviewer’s point that cerebellar contributions can be particularly critical near the endpoint of a reach. In our task design, monkeys were indeed required to hold at the target briefly—100 ms for Monkeys S and P, and 150 ms for Monkeys C and M—before receiving the reward. However,  given the size of the targets and the velocity of movements, it often happened that the monkeys didn’t have to stop their movements fully to obtain the reward. Importantly, we relaxed the task’s requirements (by increasing the target size and reducing the temporal constraints) to enable the monkeys to perform a sufficient number of successful trials under both the control and the cerebellar block conditions. This was necessary as we found that strict criteria regarding these parameters yielded a very low success rate in the cerebellar block condition. Nevertheless, as we appreciate now, this task design is suboptimal for studying endpoint accuracy which is an important aspect of cerebellar control. In the methods section of our revised manuscript, we have clarified this aspect of the task design and acknowledged that it is sub-optimal for examining the role of the cerebellum in end-point control (lines 475-485). The task design of our future studies will explicitly address this point more carefully.

      Because stimulation continued after the cursor had crossed the target, it is interesting to ask whether this disruption had any effects on the movements that were task-irrelevant. The reason for asking this is because we have found that whereas during task-relevant eye or tongue movements the Purkinje cells are strongly modulated, the modulations are much more muted when similar movements are performed but are task-irrelevant (Pi et al., PNAS 2024; Hage et al. Biorxiv 2024). Thus, it is interesting to ask whether the effects of stimulation were global and affected all movements, or were the effects primarily concerned with the task-relevant movements.

      This is an insightful suggestion. The behavioral task in the present study was designed with a focus on task-relevant, reward-associated reaching movements. Nevertheless, we also have data on the inter-trial movements (e.g., return-to-center reaches) under continued cerebellar stimulation, which were not directly associated with reward. In response to the reviewer’s comment, we compared the effects of cerebellar block on endpoint velocities between these two types of movements. We found that reductions in peak hand velocity during inter-trial movements were significantly smaller than those observed during the target directed reaches. We have updated the Results section of our manuscript (lines 125-137) and expanded our supplementary document (Supplementary Figure S1) to include this analysis. 

      If the schematic in Figure 1 is accurate, it is difficult for me to see how any of the reaching movements can be termed single joint. In the paper, T1 is labeled as a single joint, and T2T4 are labeled as dual-joint. The authors should provide data to justify this.

      The reviewer is correct. Movements to all targets involved both shoulder and elbow joints, but the degree to which each joint participated varied in a targetspecific manner. In our original manuscript, we used the term “single-joint” to refer to movements in which one joint was nearly stationary, resulting in minimal coupling torque at the adjacent joint. Specifically, for Targets 1 and 5, the net torque—and thus acceleration— at the elbow was negligible, causing the shoulder to experience low coupling torques (as illustrated in Figure 3c of our revised manuscript). Following this comment and  to avoid confusion, we have now explained this explicitly in the revised manuscript (lines 178-187). This is supported by Supplementary Figure S2 demonstrating the net torques at the shoulder and elbow for movements to each target. We have also replaced the term ‘singlejoint movements’  and ‘multi-joint movements’  with  ‘movements with low coupling torques’ and ‘movements with high coupling torques’ respectively in our revised manuscript (lines 178-180, 204-207, 225-227, 230-232, 305-307, and 362-365).  

      Because at least part of this work was previously analyzed and published, information should be provided regarding which data are new.

      While some of the same animals and stimulation protocol were presented in prior work, the inverse-dynamics modeling, the analyses exploring progressive velocity changes across trials under a cerebellar block, and the relationship of motor noise to movement velocity are newly reported in this manuscript. We have included a clear statement in the Methods section specifying which components of the dataset and analyses are entirely new (lines 582-589).

      Reviewer #1 (Recommendations for the authors):

      (1) Before the results are presented, it is useful to present the experimental paradigm in more detail. For example, after the center-out movement was completed, was the monkey required to hold at the target location? How did the next trial begin (re-centering movement)? Next, specify the stimulation protocol, noting that each session was divided into 3-4 blocks of stimulation and not stimulation, with each block 50-80 trials.

      We have updated the results section of our revised manuscript (lines 91-104) to present the experimental paradigm in more detail according to the reviewer’s advice.

      (2) Figure 1. Hand velocity does not show how the reach was completed. Did the subjects stop at the target or simply shoot through it and turn around without stopping? Why are the traces cut off?

      Monkeys were indeed required to hold at the target briefly (100-150 ms) before receiving the reward. However,  given the size of the targets and the velocity of movements, it often happened that the monkeys didn’t have to stop their movements fully to obtain the reward. The hand velocity profile shown in Figure 1b and the torque profiles shown in Figures 2a and 2b correspond to the period from movement onset to the entry of the control cursor into the peripheral target which marked the end of the movement for the trial. Since the monkeys didn’t have to stop their movements fully for the trial to end, the traces appear cut off at the beginning of the deceleration/stopping phase of the movement. We have updated the captions of Figures 1b, 2a, and 2b to include this information (lines 869-872 and 882-884).  

      (3) Maybe state that the data regarding reaction times are not presented because of the task design in which the go signal was predictable.

      In monkeys M and C, the timing of the go signal was fixed and therefore predictable. Furthermore, they were also allowed a grace period of 200 ms before the go signal to facilitate predictive timing which often resulted in negative reaction times. However, in Monkeys S and P, the go signal was variable in timing and the monkeys were not allowed to initiate the movements before the go signal. In our previous studies (Nashef et al., 2019; Israely et al. 2025), we reported increased reaction times under cerebellar block. However, since the present study focuses specifically on execution-related motor deficits, we did not analyze reaction time data. 

      (4) Please provide the data and analysis regarding the entire reach, including the period after the cursor crosses the target and returns to the center position.

      We compared the peak hand velocity of the target-directed movements to the inter-trial return-to-center movements. Cerebellar block produced significantly smaller reductions in peak hand velocity during inter-trial movements compared to within-trial reaches. The results section of our revised manuscript (lines 125137) and the supplementary material (Supplementary Figure S1) have been updated accordingly. While the behavioral task in the present study was designed with a focus on task-relevant, reward-associated reaching movements, it will be interesting to examine in detail the effect of cerebellar block on spontaneous movements in a future study.

      (5) Figure 5. To illustrate the decomposition of multijoint movements into a sequence of single joint movements, I suggest plotting movements in joint space (in addition to Cartesian space as you have done now). The results in Figure 5 are most interesting and thus should be expanded. Please provide this data using the format in Figure 1C, that is, as a function of direction.

      Following the reviewer’s suggestion, we have plotted sample trajectories in joint-velocity (Supplementary Figures 3a and b) and position space (Supplementary Figures 4a and b) to highlight the decomposition of multi-joint movements and increased inter-trial trajectory variability respectively during the cerebellar block. Additionally, we also analyzed movement decomposition and trajectory variability as a function of target direction (Supplementary Figures 3c and 4c respectively). The corresponding text in the Results section has been updated accordingly (lines 256-261, 267-271, 277-278 and 280-288).

      Reviewer #2 (Public review):

      This manuscript asks an interesting and important question: what part of 'cerebellar' motor dysfunction is an acute control problem vs a compensatory strategy to the acute control issue? The authors use a cerebellar 'blockade' protocol, consisting of high-frequency stimuli applied to the cerebellar peduncle which is thought to interfere with outflow signals. This protocol was applied in monkeys performing center outreaching movements and has been published from this laboratory in several preceding studies. I found the takehome-message broadly convincing and clarifying - that cerebellar block reduces muscle activation acutely particularly in movements that involve multiple joints and therefore invoke interaction torques, and that movements progressively slow down to in effect 'compensate' for these acute tone deficits. The manuscript was generally well written, and the data was clear, convincing, and novel. My comments below highlight suggestions to improve clarity and sharpen some arguments.

      We thank the reviewer for their thoughtful and constructive feedback. We are grateful for their recognition of the significance of our findings regarding acute and compensatory motor responses following a cerebellar block.

      Primary comments:

      (1) Torque vs. tone: Is it known whether this type of cerebellar blockade is reducing muscle tone or inducing any type of acute co-contraction that could influence limb velocity through mechanisms different than 'atonia'? If so, the authors should discuss this information in the discussion section starting around line 336, and clarify that this motivates (if it does) the focus on 'torques' rather than muscle activation. Relatedly, besides the fact that there are joints involved, is there a reason there is so much emphasis on torque per se? If the muscle is deprived of sufficient drive, it would seem that it would be more straightforward to conceptualize the deficit as one of insufficient timed drive to a set of muscles than joint force. Some text better contextualizing the choices made here would be sufficient to address this concern. I found statements like those in the introduction "hand velocity was low initially, reflecting a primary muscle torque deficit" to be lacking in substance. Either that statement is self-evident or the alternative was not made clear. Finally, emphasize that it is a loss of self-generated torque at the shoulder that accounts for the velocity deficits. At times the phrasing makes it seem that there is a loss of some kind of passive torque.

      We appreciate the reviewer's emphasis on distinguishing between reduced muscle tone and altered co-contraction patterns as potential explanations for decreased limb velocity. Our focus on torques per se arises from previous studies suggesting that a core deficit in cerebellar ataxia is impaired prediction of passive coupling torques (Bastian et al., 1996). In our study, we demonstrate that motor deficits in cerebellar ataxia result in fact from both the inability to compensate for passive coupling torques and an acute insufficiency in the ability to generate active muscle torques.

      The muscle torque, representing the sum of all muscle forces acting at a joint, can indeed be reduced by any of the two mechanisms: (i) co-contraction of agonist and antagonist muscles, and/or (ii) insufficient agonist muscle activity (i.e., agonist weakness). In cerebellar ataxia, co-contraction has been proposed as a simplifying strategy to stabilize stationary joints during decomposed multi-joint movements (Bastian et al., 1996). In our experiments, this strategy would likely emerge gradually following cerebellar block similar to the adaptive slowing of movements aimed at reducing inter-joint interactions. However, we found that irrespective of the magnitude of coupling torques involved, reduction in the velocity of movements also occurred immediately following cerebellar block—a pattern less consistent with gradually emerging compensatory strategies. We therefore argue that this acute onset of movement slowing was mainly driven by agonist weakness. Our argument is further supported by previous studies which attributed reduced agonist muscle activity as a cause for the slowing of voluntary movements in individuals with cerebellar lesions (Hallet et al. 1991; Wild et al., 1996). Additionally, early studies have also reported muscle weakness (asthenia) and hypotonia acutely following cerebellar injury in humans (Haines et al., 2007) and experimental lesions in animals (Luciani, 1893; Bremer et al., 1935; Fulton & Dow, 1937; Granit et al., 1955).

      We have modified the discussion section of our revised manuscript (lines 366-376) to explain/clarify this. Additionally, we have also underscored that the observed velocity deficits primarily reflect a reduction of self-generated torque at the shoulder (whether acute or adaptive), rather than any reduction in passive torque (lines 350-352).

      (2) Please clarify some of the experimental metrics: Ln 94 RESULTS. The success rate is used as a primary behavioral readout, but what constitutes success is not clearly defined in the methods. In addition to providing a clear definition in the methods section, it would also be helpful for the authors to provide a brief list of criteria used to determine a 'successful' movement in the results section before the behavioral consequences of stimulation are described. In particular, the time and positional error requirements should be clear.

      Successful trials were defined as trials in which monkeys didn’t leave the center position before the “Go” signal and entered the peripheral target within a permitted movement time. We have updated the results (lines 91-104) and methods (lines 475-485) section of our revised manuscript to include (i) the timing criteria of each phase of the trials and (ii) the size of the peripheral targets indicating the tolerance for endpoint accuracy.  

      (3) Based on the polar plot in Figure 1c, it seemed odd to consider Targets 1-4 outward and 5-8 inward movements, when 1 and 5 are side-to-side. Is there a rationale for this grouping or might results be cleaner by cleanly segregating outward (targets 2-4) and inward (targets 6-8) movements? Indeed, by Figure 3 where interaction torques are measured, this grouping would seem to align with the hypothesis much more cleanly since it is with T2,T3,and T4 where clear coupling torques deficits are seen with cerebellar block.

      We acknowledge the reviewer's observation regarding the classification of targets 1 and 5 as side-to-side movements rather than strictly "outward" or "inward." In the initial section of our results, we grouped the targets based on shoulder joint movements: "outward" targets involved shoulder flexion, while "inward" targets involved shoulder extension. This classification highlighted the more pronounced effect of cerebellar block on movements requiring shoulder flexion compared to those requiring shoulder extension. For subsequent analyses, we focused on the effects of cerebellar block on movements to "outward" targets, which included directions involving low (target 1) or high (targets 2–4) coupling torques. To clarify this aspect, we have revised our manuscript to explain our definition of "outward" (targets 1–4) and "inward" (targets 5–8) target groupings based on shoulder  flexion and extension movements respectively (lines 117-120).

      (4) I did not follow Figure 3d. Both the figure axis labels and the description in the main text were difficult to follow. Furthermore, the color code per animal made me question whether the linear regression across the entire dataset was valid, or would be better performed within animal, and the regressions summarized across animals. The authors should look again at this section and figure.

      We have revised the legend of Figure 3d to include a detailed explanation of how the value along each axis is computed  (lines 908-920 of the revised manuscript). Please note that  the color coding of the data points is as per the target number (T1-T4) and not the monkey number (as denoted in the figure legend). Also, pooling of data across monkeys was done after confirming that data from each animal expressed a similar trend. Specifically, the correlation coefficients were all positive but statistically significant in 3 out of the 4 monkeys. Following the reviewers’ feedback, we now performed  a partial correlation analysis (which controls for the variability across monkeys) and found a significant correlation (r = 0.32, p < 0.001) between reduction in peak hand velocities during cerebellar block and the net coupling torque impulse. We have updated the manuscript to include the result of the partial correlation analysis (lines 173-176).  

      (5) Line 206+ The rationale for examining movement decomposition with a cerebellar block is presented as testing the role of the cerebellum in timing. Yet it is not spelled out what movement decomposition and trajectory variability have to do with motor timing per se.

      The reviewer is right and the relations between timing, decomposition and variability need to be explicitly explained. In the results  section of our revised manuscript, we have explained how decomposed movements and trajectory variability may reflect impaired temporal coordination across multiple joints—a critical cerebellar function (lines 235-244).

      Reviewer #2 (Recommendations for the authors):

      (1) Rephrase the findings, starting Line 232. Here the authors state, "Next, we asked whether movement decomposition was mainly due to lower hand velocities. We therefore selected a subset of control trials that matched the cerebellar block trials in their peak velocity. However, even though movement decomposition in these control trials was higher compared to all control trials, it was still significantly lower than velocity matched cerebellar block trials." I suggest inverting the final sentence to: "Movement decomposition in control trials was significantly lower than velocity-matched cerebellar block trials, even though these control trials themselves had somewhat higher decomposition indices than all control trials together." A similar issue pops up with trajectory variability below that simply requires some editing to be less clunky.

      Following the reviewer’s suggestion, we have revised the sentences related to movement decomposition and trajectory variability. These sentences now reads as follows: 

      (lines 267-271 in the revised manuscript): “Movement decomposition in control trials was significantly lower than velocity-matched cerebellar block trials (p < 0.001; Figure 5c), even though these control trials themselves had 11.0% (CI [5.2, 17.0], p = 0.03) higher decomposition than the mean value calculated across all control trials.” 

      (lines 280-288 in the revised manuscript): “ When we compared the subset of velocitymatched control and cerebellar block trials, we found that cerebellar block trials exhibited 34.6% (CI [26.2, 43.2], p < 0.001) higher trajectory variability (Figure 5e). Normally, slower movements are also less variable due to the speed-accuracy tradeoff (Plamondon and Alimi 1997). Indeed, the trajectory variability in this subset of slower control trials was 5.5% (CI [0.9, 9.9], p = 0.02) lower than that of all control trials. In other words, despite slower movements, cerebellar block led to increased trajectory variability.”

      (2) Typo: Ln 73 sequences, not sequence.

      Typo error was corrected (line 75 of revised manuscript). 

      Reviewer #3 (Public review):

      Summary:

      In their manuscript, "Disentangling acute motor deficits and adaptive responses evoked by the loss of cerebellar output," Sinha and colleagues aim to identify distinct causes of motor impairments seen when perturbing cerebellar circuits. This goal is an important one, given the diversity of movement-related phenotypes in patients with cerebellar lesions or injuries, which are especially difficult to dissect given the chronic nature of the circuit damage. To address this goal, the authors use high-frequency stimulation (HFS) of the superior cerebellar peduncle in monkeys performing reaching movements. HFS provides an attractive approach for transiently disrupting cerebellar function previously published by this group. First, they found a reduction in hand velocities during reaching, which was more pronounced for outward versus inward movements. By modeling inverse dynamics, they find evidence that shoulder muscle torques are especially affected. Next, the authors examine the temporal evolution of movement phenotypes over successive blocks of HFS trials. Using this analysis, they find that in addition to the acute, specific effects on muscle torques in early HFS trials, there was an additional progressive reduction in velocity during later trials, which they interpret as an adaptive response to the inability to effectively compensate for interaction torques during cerebellar block. Finally, the authors examine movement decomposition and trajectory, finding that even when low-velocity reaches are matched to controls, HFS produces abnormally decomposed movements and higher than expected variability in trajectory.

      Strengths:

      Overall, this work provides important insight into how perturbation of cerebellar circuits can elicit diverse effects on movement across multiple timescales.

      The HFS approach provides temporal resolution and enables analysis that would be hard to perform in the context of chronic lesions or slow pharmacological interventions. Thus, this study describes an important advance over prior methods of circuit disruption, and their approach can be used as a framework for future studies that delve deeper into how additional aspects of sensorimotor control are disrupted (e.g., response to limb perturbations).

      In addition, the authors use well-designed behavioral approaches and analysis methods to distinguish immediate from longer-term adaptive effects of HFS on behavior. Moreover, inverse dynamics modeling provides important insight into how movements with different kinematics and muscle dynamics might be differentially disrupted by cerebellar perturbation.

      We thank the reviewer for their detailed assessment and thoughtful comments and greatly appreciate their positive feedback.  

      Weaknesses:

      The argument that there are acute and adaptive effects to perturbing cerebellar circuits is compelling, but there seems to be a lost opportunity to leverage the fast and reversible nature of the perturbations to further test this idea and strengthen the interpretation. Specifically, the authors could have bolstered this argument by looking at the effects of terminating HFS - one might hypothesize that the acute impacts on muscle torques would quickly return to baseline in the absence of HFS, whereas the longer-term adaptive component would persist in the form of aftereffects during the 'washout' period. As is, the reversible nature of the perturbation seems underutilized in testing the authors' ideas.

      We agree that our approach could more explicitly exploit the rapid reversibility of high-frequency stimulation (HFS) by examining post-stimulation ‘washout’ periods. However, for the present dataset, we ended the session after the set of cerebellar block trials without using an explicit washout period. We plan to study the effect of the cerebellar block on immediate post-block washout trials in the future.    

      The analysis showing that there is a gradual reduction in velocity during what the authors call an adaptive phase is convincing. That said, the argument is made that this is due to difficulty in compensating for interaction torques. Even if the inward targets (i.e., targets 68) do not show a deficit during the acute phase, these targets still have significant interaction torques (Figure 3c). Given the interpretation of the data as presented, it is not clear why disruption of movement during the adaptive phase would not be seen for these targets as well since they also have large interaction torques. Moreover, it is difficult to delve into this issue in more detail, as the analyses in Figures 4 and 5 omit the inward targets.

      The reviewer is right and  movements to Targets 6–8 (inward) were seemingly unaffected despite also involving significant interaction torques. Specifically, we noted that while outward targets (2–4) tend to involve higher coupling torque impulses on average, this alone does not fully explain the differential impact of cerebellar block, as illustrated by discrepancies at the individual target level (e.g., target 7 vs. target 1). We propose two possible explanations: (1) a bias toward shoulder flexion in the effect of cerebellar block—consistent with earlier studies showing ipsilateral flexor activation or tone changes following stimulation or lesioning of the deep cerebellar nuclei; and (2) posture-related facilitation of inward (shoulder extension) movements from the central starting position. This point is addressed in the Discussion section (lines 404-433  in the revised manuscript).

      The text in the Introduction and in the prior work developing the HFS approach overstates the selectivity of the perturbations. First, there is an emphasis on signals transmitted to the neocortex. As the authors state several times in the Discussion, there are many subcortical targets of the cerebellar nuclei as well, and thus it is difficult to disentangle target-specific behavioral effects using this approach. Second, the superior cerebellar peduncle contains both cerebellar outputs and inputs (e.g., spinocerebellar). Therefore, the selectivity in perturbing cerebellar output feels overstated. Readers would benefit from a more agnostic claim that HFS affects cerebellar communication with the rest of the nervous system, which would not affect the major findings of the study.

      The reviewer is right that the superior cerebellar peduncle carries both descending and ascending fibers, and that cerebellar nuclei project to subcortical as well as cortical targets. Therefore, we cannot rule out the fact that the effect of HFS  may be mediated in part through pathways other than the cerebello-thalamo-cortical pathway (as mentioned in the Discussion section). However, it is also important to note that in primates the cerebellar-thalamo-cortical (CTC) pathway greatly expanded (at the expense of the cerbello-rubro-spinal tract) in mediating cerebellar control of voluntary movements (Horne and Butler, 1995). The cerebello-subcortical pathways diminished in importance over the course of evolution (Nathan and Smith, 1982, Padel et al., 1981, ten Donkelaar, 1988). Previously we found that the ascending spinocerebellar axons which enter the cerebellum through the superior cerebellar peduncle (SCP) are weakly task-related and the descending system is quite small (Cohen et al, 2017). We have clarified these points and acknowledged that HFS disrupts cerebellar communication broadly, rather than solely the cerebellothalamo-cortical pathway in the methods section of our revised manuscript (lines 531544).  

      The text implies that increased movement decomposition and variability must be due to noise. However, this assumption is not tested. It is possible that the impairments observed are caused by disrupted commands, independent of whether these command signals are noisy. In other words, commands could be low noise but still faulty.

      We recognize the reviewer’s concern about linking movement decomposition and trial-to-trial trajectory variability with motor noise. We interpret these motor abnormalities as a form of motor noise in the sense that they are generated by faulty motor commands. We draw our interpretation from the findings of previous research work which show that the cerebellum aids in the state estimation of the limb and subsequent generation of accurate feedforward commands. Therefore, disruption of the cerebellar output may lead to faulty motor commands resulting in the observed asynchronous joint activations (i.e., movement decomposition) and unpredictable trajectories (i.e., increased trial-to-trial variability). Both observed deficits resemble increased motor noise. This point is presented in our Discussion section (lines 436-458 of the revised manuscript),

      Throughout the text, the use of the term 'feedforward control' seems unnecessary. To dig into the feedforward component of the deficit, the authors could quantify the trajectory errors only at the earliest time points (e.g., in Figure 5d), but even with this analysis, it is difficult to disentangle feedforward- and feedback-mediated effects when deficits are seen throughout the reach. While outside the scope of this study, it would be interesting to explore how feedback responses to limb perturbation are affected in control versus HFS conditions. However, as is, these questions are not explored, and the claim of impaired feedforward control feels overstated.

      We agree that to strictly focus on feedforward control, we could have examined the measured variables in the first 50-100 ms of the movement which has been shown to be unaffected by feedback responses (Pruszynski et al. 2008, Todorov and Jordan 2002,  Pruszynski  and Scott 2012, Crevecoeur  et al. 2013). However, in our task, the amplitude of movements made by the monkeys was small, and therefore the response measures in the first 50-100 ms were too small for a robust estimation. Also, fixing a time window led to an unfair comparison between control and cerebellar block trials, in which velocity was significantly reduced and therefore movement time was longer.  Therefore, we used the peak velocity, torque impulse at the peak velocity, and maximum deviation of the hand trajectory as response measures. We have acknowledged this point in the methods section of our revised manuscript (lines 590-600). We have also refrained from using the term feedforward control throughout the text of our revised manuscript as suggested by the reviewer.

      The terminology 'single-joint' movement is a bit confusing. At a minimum, it would be nice to show kinematics during different target reaches to demonstrate that certain targets are indeed single joint movements. More of an issue, however, is that it seems like these are not actually 'single-joint' movements. For example, Figure 2c shows that target 1 exhibits high elbow and shoulder torques, but in the text, T1 is described as a 'single-joint' reach (e.g. lines 155-156). The point that I think the authors are making is that these targets have low interaction torques. If that is the case, the terminology should be changed or clarified to avoid confusion.

      Indeed, as reviewer #1 also noted, movements to targets 1 and 5 are not purely single-joint but rather have relatively low coupling torques. Movements to all targets involved both shoulder and elbow joints, but the degree to which each joint participated varied in a target-specific manner. In our original manuscript, we used the term “single-joint” to refer to movements in which one joint was largely stationary, resulting in minimal coupling torque at the adjacent joint. Specifically, for Targets 1 and 5, the net torque—and thus acceleration—at the elbow was negligible, causing the shoulder to experience low coupling torques (as illustrated in Figure 3c of our revised manuscript). Following this comment and  to avoid confusion, we have now explained this explicitly in the revised manuscript (lines 178-187). This is supported by Supplementary Figure S2 demonstrating the net torques at the shoulder and elbow for movements to each target. We have also replaced the term ‘single-joint movements’  and ‘multi-joint movements’  with  ‘movements with low coupling torques’ and ‘movements with high coupling torques’ respectively in our revised manuscript (lines 178-180, 204-207, 225-227, 230-232, 305-307, and 362-365).

      The labels in Figure 3d are confusing and could use more explanation in the figure legend. In Figure 3d, it is stated that data from all monkeys is pooled. However, if there is a systematic bias between animals, this could generate spurious correlations. Were correlations also calculated for each animal separately to confirm the same trend between velocity and coupling torques holds for each animal?

      We have revised the legend of Figure 3d to include a detailed explanation of how the values along each axis are computed  (lines 908-920 of the revised manuscript). Please note that the pooling of data across monkeys was done after confirming that data from each animal expressed a similar trend. Specifically, the correlation coefficients were all positive but statistically significant in 3 out of the 4 monkeys. Moreover, following the reviewers’ feedback, we also did a partial correlation analysis (which controls for the variability across monkeys) and found a significant correlation (r = 0.32, p < 0.001) between reduction in peak hand velocities during cerebellar block and the net coupling torque impulse. We have updated the manuscript to include the result of the partial correlation analysis (lines 173-176).  

      In Table S1, it would be nice to see target-specific success rates. The data would suggest that targets with the highest interaction torques will have the largest reduction in success rates, especially during later HFS trials. Is this the case?

      The breakdown of the percentage increase in failure rate due to cerebellar block as a function of target direction is shown in Author response image 1 inserted to this response. 

      Author response image 1.

      Effect of cerebellar block on failure rate. The change in failure rate for the cerebellar block trials was computed relative to the control trials per session per target. The depicted values are the mean ± 95% confidence intervals across all sessions pooled from all four monkeys. The individual means of each monkey are overlaid. Statistical significance is denoted as follows: p ≥ 0.05NS, p < 0.05*, p < 0.01**, p < 0.001*** [T1-8: Targets 1-8]

      The increase in failure rate due to cerebellar block was not affected by the target direction (linear mixed model analysis,  target x trial-type interaction effect: p  = 0.44).  However, it should be noted that success/failure depends on several factors beyond just the execution related impaired limb dynamics. In a previous study (Nashef et al. 2019) we identified several causes of failure such as (i) not entering the central target in time, (ii) premature exit from the central target before the ‘go’ signal,  (iii) reaction time longer than the time permitted to reach the peripheral target after the ‘go’ signal, or (iv) not holding at the peripheral target for the required time at the end of the movement.   

      Reviewer #3 (Recommendations for the authors):

      (1) It would be helpful to provide some supplemental information on electrophysiological validation of the targeting in each monkey. Was any variability in targeting observed (e.g., some targeting was more effective at eliciting cortical responses)? If so, does targeting variability relate to any of the variability in behavioral effects of HFS across monkeys?

      Although we currently do not have an exact measure of the proportion of fibers blocked by HFS, our targeting approach consistently elicited robust cortical responses across monkeys. Specifically, we implanted the stimulating electrode at the location that produced the maximum peak-to-peak evoked responses in the primary motor cortex. Author response image 2 in this response demonstrates that even a slight deviation (~0.5 mm) from this optimal site reduced these responses substantially.:

      Author response image 2.

      Evoked responses in the primary motor cortex as a function of the location of the stimulation site. [LEFT] Coronal T2-weighted MRI showing the planned trajectory to target the superior cerebellar peduncle (location marked by the tip of the arrowhead) through a round chamber suitably positioned over the skull. [RIGHT] Evoked multi-unit (300-7500 Hz) responses from one of the recording electrodes in the primary motor cortex are used to guide the stimulating electrode to the correct implant site. As the stimulating electrode was lowered deeper, maximum peak-to-peak evoked responses were obtained at a depth of 32.5 mm relative to the cortical surface. This was chosen as the implant site. Elevating or lowering the electrode by ~0.5 mm from this depth reduced the peak-to-peak response amplitude. 

      (2) The emphasis in the Introduction that HFS provides direct insight into deficits seen in patients with cerebellar disease or injury is a bit overstated. Patients have very diverse etiologies, only a modest number of which might be faithfully mimicked by SCP HFS. I would suggest some text acknowledging that this is only a limited model for cerebellar disease or injury.

      We agree with the reviewer that the high-frequency stimulation of the superior cerebellar peduncle provides a limited model that does not fully replicate the diverse pathologies seen in cerebellar disease or injury. In fact, in the introduction section (lines 53-59 of our revised manuscript) we have mentioned that the discrepancy in the conclusions of various clinical studies may reflect the heterogeneity of the individuals with cerebellar lesions who often have differences in lesion etiology and associated damage beyond the cerebellum itself. While this may preclude the generalization of our findings to the wider clinical population per se, our approach offers a precise and controlled method to investigate the immediate and adaptive changes in motor behavior following the disruption of cerebellar signals.

      (3) Do animals with HFS show less decomposition and trajectory variability in their slower movements when compared to their faster movements? Comparisons are only made with velocity-matched control blocks, but the comparison of slower vs. faster reaches during HFS blocks would also be informative.

      To answer this point we classified movements during cerebellar block as either slow or fast based on the median peak hand velocity of the cerebellar block trials per target per session. We then computed the decomposition index and trajectory variability for the fast and slow movements during cerebellar block relative to control in the same way as in Figure 5 of our manuscript (i.e., the percentage change relative to control). Our analysis revealed significantly lower movement decomposition (p < 0.001) and reduced trajectory variability (p < 0.001) for slower movements compared to faster ones within the cerebellar block condition (Author response image 3).

      Author response image 3.

      Effect of slow and fast movements during cerebellar block on movement decomposition and trajectory variability. [LEFT] Change in decomposition index (i.e., the proportion of the movement time during which the movement was decomposed) for slow and fast cerebellar block trials relative to all control trials. The change in median decomposition was computed per session per target and then averaged across all eight targets to arrive at one value per session. The depicted values are the mean ± 95% confidence intervals across all sessions pooled from all four monkeys. The individual means of each monkey are overlaid. [RIGHT] Change in inter-trial trajectory variability for slow and fast cerebellar block trials relative to all control trials. The trajectory variability was measured as the standard deviation of the maximum perpendicular distance of the trajectories from the Y-axis after transforming them as in Figure 5d of the main text. The change in trajectory variability for the fast and slow cerebellar block trials was then computed per session per target and averaged across all eight targets to arrive at one value per session. The depicted values are the mean ± 95% confidence intervals across all sessions pooled from all four monkeys. The individual means of each monkey are overlaid. Statistical significance is denoted as follows: p ≥ 0.05NS, p < 0.05*, p < 0.01**, p < 0.001***. [Cbl: Cerebellar block].

      (4) Line 220- 'velocity' should be 'speed' or 'absolute velocity'?

      The term velocity was changed to speed in  the revised manuscript (line 255).

    1. eLife Assessment

      By using sparse Cre-dependent deletion of GluN1 subunit, in vitro quadruple patch clamp recordings, and pharmacological interventions, the authors show that spike timing dependent plasticity at between L5 synapses in the mouse visual cortex is: (i) dependent on presynaptic NMDA receptors; (ii) mediated by non-ionotropic NMDA receptor signaling, and (iii) reliant on presynaptic JNK2/Syntaxin-1a interactions. These fundamental findings advance our understanding of the molecular mechanisms underlying spike time dependent plasticity. The data are compelling and are supported by the elegant application of sophisticated experimental approaches.

    2. Reviewer #2 (Public review):

      Summary:

      The study characterized the dependence of spike timing-dependent long-term depression (tLTD) on presynaptic NMDA receptors and the intracellular cascade after NMDAR activation possibly involved in the observed decrease in glutamate probability release at L5-L5 synapses of the visual cortex in mouse brain slices.

      Strengths:

      The genetic and electrophysiological experiments are thorough. The experiments are well reported and mainly support the conclusions. This study confirms and extends current knowledge by elucidating additional plasticity mechanisms at cortical synapses, complementing existing literature.

      Weaknesses:

      No direct testing for ions passing trough standard NMDAR, mainly sodium and calcium is shown.

    3. Reviewer #3 (Public review):

      Summary:

      In this manuscript, "Neocortical Layer-5 tLTD Relies on Non-Ionotropic Presynaptic NMDA Receptor Signaling", Thomazeau et al. seek to determine the role of presynaptic NMDA receptors and the mechanism by which they mediate expression of frequency-independent timing-dependent long-term depression (tLTD) between layer-5 (L5) pyramidal cells (PCs) in the developing mouse visual cortex. By utilizing sophisticated methods, including sparse Cre-dependent deletion of GluN1 subunit via neonatal iCre-encoding viral injection, in vitro quadruple patch clamp recordings, and pharmacological interventions, the authors elegantly show that L5 PC->PC tLTD is 1) dependent on presynaptic NMDA receptors, 2) mediated by non-ionotropic NMDA receptor signaling, and 3) is reliant on JNK2/Syntaxin-1a (STX1a) interaction (but not RIM1αβ) in the presynaptic neuron. The study elegantly and pointedly addresses a long-standing conundrum regarding the lack of frequency dependence of tLTD.

      Strengths:

      The authors did a commendable job presenting a very polished piece of work with high-quality data that this Reviewer feels enthusiastic about. The manuscript has several notable strengths. Firstly, the methodological approach used in the study is highly sophisticated and technically challenging, and successfully produced high-quality data that were easily accessible to a broader audience. Secondly, the pharmacological interventions used in the study targeted specific players and their mechanistic roles, unveiling the mechanism in question step-by-step. Lastly, the manuscript is written in a well-organized manner that is easy to follow. Overall, the study provides a series of compelling evidence that leads to a clear illustration of mechanistic understanding.

      Weakness:

      No major weaknesses were noted.

    4. Author response:

      The following is the authors’ response to the original reviews

      Reviewer 1 (Public review)

      Summary

      The results offer compelling evidence that L5-L5 tLTD depends on presynaptic NMDARs, a concept that has previously been somewhat controversial. It documents the novel finding that presynaptic NMDARs facilitate tLTD through their metabotropic signaling mechanism.

      We thank Reviewer 1 for their kind words and thoughtful feedback!

      Strengths

      The experimental design is clever and clean. The approach of comparing the results in cell pairs where NMDA is deleted either presynaptically or postsynaptically is technically insightful and yields decisive data. The MK801 experiments are also compelling.

      We are very grateful for this kind feedback!

      Weaknesses

      No major weaknesses were noted by this reviewer.

      We were happy to see that Reviewer 1 had no concerns in the Public Review. We address their Recommendations here below.

      Reviewer #1 (Recommendations for the authors):

      There is one minor issue that the authors might want to address. In Figure 6C, the average time course of the controls (blue symbols) shows a clear decline in the baseline. The rate of this decline appears to be similar to the initial decline rate observed after inducing tLTD.

      Sorry, the x-axis was truncated so the first data points were not visible. We fixed Fig 6C as well as 6G, which suffered from the same problem.

      Reviewer 2 (Public review)

      Summary

      The study characterized the dependence of spike-timing-dependent long-term depression (tLTD) on presynaptic NMDA receptors and the intracellular cascade after NMDAR activation possibly involved in the observed decrease in glutamate probability release at L5-L5 synapses of the visual cortex in mouse brain slices.

      We are grateful for Reviewer 2’s thoughtful and detailed feedback!

      Strengths

      The genetic and electrophysiological experiments are thorough. The experiments are well-reported and mainly support the conclusions. This study confirms and extends current knowledge by elucidating additional plasticity mechanisms at cortical synapses, complementing existing literature.

      We were thrilled to see that the reviewer thinks our experiments are “thorough”, “well-reported” and they “mainly support the conclusions”!

      Weaknesses

      While one of the main conclusions (preNMDARs mediating presynaptic LTD) is resolved in a very convincing genetic approach, the second main conclusion of the manuscript (non-ionotropic preNMDARs) relies on the use of a high concentration of extracellular blockers (MK801, 2 mM; 7-clorokinurenic acid: 100 microM), but no controls for the specific actions of these compounds are shown.

      We thank the reviewer for calling our genetic approach “very convincing”!

      Regarding the pharmacological controls: for MK-801, we deliberately used a high extracellular concentration in the mM-range to match the intracellular concentrations used both in our own experiments and in prior studies (Berretta and Jones, 1996; Brasier and Feldman, 2008; Buchanan et al., 2012; Corlew et al., 2007; Humeau et al., 2003; Larsen et al., 2011; Rodríguez-Moreno et al., 2011; Rodríguez-Moreno and Paulsen, 2008). Our goal was to isolate the variable of application site (internal vs. external) while keeping concentration constant. If we had used the lower, more conventional µM-range extracellular concentrations (e.g., Huettner and Bean, 1988; Kemp et al., 1988; Tovar and Westbrook, 1999), differences in outcome might have reflected differences in drug efficacy rather than localization — particularly since failure to observe an effect at low concentrations would be hard to interpret.

      We now clarify this rationale in the revised manuscript (lines 578-585).

      As for 7-chlorokynurenic acid (7-CK), the 100 µM concentration we used is standard for effectively blocking the glycine-binding site of NMDARs (e.g., Nabavi et al., 2013).

      We also added two supplementary figures to show the effects of washing in MK-801 and 7-CK. In MK-801, responses are stable at low frequency (clarified in the manuscript lines 155-157 and Supp Fig 1 caption text). However, 7-CK suppresses responses appreciably, which takes time to stabilize. We clarify in the revised manuscript that in 7-CK experiments, we waited for this stabilization before inducing tLTD (lines 167-172 and Supp Fig 2 caption text). This additional suppression is consistent with 7-CK also acting as a potent competitive inhibitor of L-glutamate transport into synaptic vesicles (Bartlett et al., 1998).

      In addition, no direct testing for ions passing through preNMDAR has been performed.

      Sorry for being unclear, we have previously tested directly for ions passing through preNMDARs. For example, we showed blockade with Mg<sup>2+</sup> before (Abrahamsson et al., 2017; Wong et al., 2024), and we showed preNMDAR Ca<sup>2+</sup> supralinearities before (Abrahamsson et al., 2017; Buchanan et al., 2012). To improve the manuscript, we clarified the text accordingly (lines 140-141).

      It is not known if the results can be extrapolated to adult brain as the data were obtained from 11-18 days-old mice slices, a period during which synapses are still maturing and the cortex is highly plastic.

      Thank you, this is a good point. We address this point in the revised manuscript (lines 428-432). While our study focuses on the early postnatal period (P11–P18), when plasticity mechanisms are prominent and synaptic maturation is ongoing, we agree that extrapolation to the adult brain should be made with caution.

      Reviewer #2 (Recommendations for the authors):

      Points 1-3 were also found in the Public Review so are not addressed again here.

      (4) Results seem to be obtained in the absence of inhibition blocking and the role of inhibition in tLTD is not described. It should be indicated whether present results are obtained with or without the functional inhibitory synapse activation. If GABAergic synapses are not blocked authors need to show what happens when this inhibition is blocked.

      We agree that extracellular stimulation can inadvertently recruit inhibitory circuits. However, in our paired whole-cell recordings, synaptic responses are always subthreshold and exclusively reflect the direct connection between the two recorded neurons (Chou et al., 2024; Song et al., 2005). Under these conditions, inhibitory synapses are not activated, and we therefore did not apply GABAergic blockers. We thank the reviewer for raising this, which is now clarified in the Methods (lines 539-541) of the revised manuscript.

      (5) In some figures, the number of experiments seems to be low, and this number of experiments might be increased (Figures 1C, 3C, 4B).

      We acknowledge that the number of experiments in these figures is modest, but these recordings are technically demanding, and the data are carefully curated. Importantly, the observed effects were statistically significant, indicating that the sample sizes were sufficient. We also note that concerns about statistical power are typically more critical in the case of negative or null results, whereas our findings were positive.

      (6) The discussion is detailed but it is not clear that the activation of JNK2 needs to be achieved by a non-ionotropic action of NMDAR as activation after ionotropic NMDAR activation has been described in the literature. This point needs to be clarified and expanded.

      Sorry that we were unclear on this point. We clarified this on lines 371-372 of the manuscript.

      (7) Adding a cartoon/schematic summarizing the proposed mechanism for tLTD would help the reading of the manuscript.

      We appreciate this suggestion and agree that a schematic would be helpful. However, we prefer to hold off on including one at this stage, as aspects of the underlying mechanism — particularly the role of CB1 receptors in presynaptic pyramidal cells (Sjöström et al., 2003) — are currently under active investigation in a separate project. To avoid potentially misleading oversimplifications, we would prefer to revisit a summary schematic once these uncertainties have been resolved.

      Minor:

      (1) Concentration of compounds is recommended to be included in the figures or in the text. This would make it easy to follow the results.

      We appreciate the suggestion. However, we avoid repeating concentrations to emphasize that conditions are consistent unless otherwise stated. All compound concentrations are clearly listed in the Methods and remain unchanged across experiments. We believe this streamlined approach avoids redundancy while keeping the results clear.

      (2) In some figures, failures in synaptic transmission can be observed (and changes after tLTD). The authors may analyse changes in a number of failures in synaptic transmission after tLTD as an additional indication of a presynaptic expression of this form of tLTD. PPR may also be included in all figures.

      While failures in synaptic transmission are occasionally visible, we chose to focus on CV analysis, which is mathematically equivalent to failure rate analysis, as both rely on the same underlying variability in synaptic responses (Brock et al., 2020). Provided failures are reliably extracted (which requires sufficient signal-to-noise), CV and failure rate analyses should yield consistent conclusions.

      In contrast, PPR analysis is not mathematically equivalent to CV analysis and may offer complementary insights into presynaptic mechanisms. However, the presence of preNMDARs complicates the use of paired-pulse stimulation during baseline: preNMDARs enhance release during high-frequency activity (Abrahamsson et al., 2017; Sjöström et al., 2003; Wong et al., 2024), so repeated stimulation can suppress synaptic responses when preNMDARs are blocked, potentially confounding interpretation. For this reason, we limited PPR analysis to Figures 5 and 6, where conditions were appropriate.

      Admittedly, our manuscript was previously not clear on when we did paired-pulse stimulation and when we did not. We have clarified this in the revised manuscript (lines 548- 551 and lines 569-574).

      (3) Discussion: Line 363-64, hippocampal (SC-CA1 synapses) results exist where postsynaptic MK801 blocks presynaptic tLTD, this may be added here and in the references.

      While we acknowledge that postsynaptic MK-801 has been shown to block presynaptic tLTD at hippocampal SC–CA1 synapses, we note that the hippocampus is part of the archicortex, whereas our study focuses on neocortical circuits, as highlighted in the manuscript title. Given the substantial anatomical and functional differences between these regions, we prefer to keep our discussion focused on the neocortex to maintain conceptual coherence.

      (4) Discussion: While authors indicate "non-ionotropic" they do not discuss whether this action can be named properly "metabotropic" and whether G-proteins may be in fact needed for this action. The authors may briefly discuss this point.

      We previously referred to non-ionotropic NMDAR signaling as “metabotropic,” but reconsidered after discussions with colleagues, including Juan Lerma, who pointed out that the term typically implies G-protein coupling, which has not been definitively shown in this context. While the term “metabotropic” is used inconsistently in the literature (Heuss and Gerber, 2000; Heuss et al., 1999) — sometimes broadly to indicate non-ion flow signaling — we prefer to avoid potential confusion and therefore use “non-ionotropic” unless and until G-protein involvement is clearly demonstrated. We clarified this on lines 423-427 of the Discussion.

      (5) Page 19, line 451 NMDR needs to be corrected to NMDAR.

      Thanks! This was corrected.

      Reviewer 3 (Public review)

      Summary

      In this manuscript, "Neocortical Layer-5 tLTD Relies on Non-Ionotropic Presynaptic NMDA Receptor Signaling", Thomazeau et al. seek to determine the role of presynaptic NMDA receptors and the mechanism by which they mediate expression of frequency-independent timing-dependent long-term depression (tLTD) between layer-5 (L5) pyramidal cells (PCs) in the developing mouse visual cortex. By utilizing sophisticated methods, including sparse Cre-dependent deletion of GluN1 subunit via neonatal iCre-encoding viral injection, in vitro quadruple patch clamp recordings, and pharmacological interventions, the authors elegantly show that L5 PC->PC tLTD is (1) dependent on presynaptic NMDA receptors, (2) mediated by non-ionotropic NMDA receptor signaling, and (3) is reliant on JNK2/Syntaxin-1a (STX1a) interaction (but not RIM1αβ) in the presynaptic neuron. The study elegantly and pointedly addresses a long-standing conundrum regarding the lack of frequency dependence of tLTD.

      We thank the reviewer for calling our methods “sophisticated” and our study “elegant”! We appreciate the kind feedback!

      Strengths

      The authors did a commendable job presenting a very polished piece of work with high-quality data that this Reviewer feels enthusiastic about. The manuscript has several notable strengths. Firstly, the methodological approach used in the study is highly sophisticated and technically challenging and successfully produced high-quality data that were easily accessible to a broader audience. Secondly, the pharmacological interventions used in the study targeted specific players and their mechanistic roles, unveiling the mechanism in question step-by-step. Lastly, the manuscript is written in a well-organized manner that is easy to follow. Overall, the study provides a series of compelling evidence that leads to a clear illustration of mechanistic understanding.

      We are elated that the reviewer described our study with words such as “polished”, “high-quality”, “sophisticated”, and “compelling”!

      Minor comments

      (1) For the broad readership, a brief description of JNK2-mediated signaling cascade underlying tLTD, including its intersection with CB1 receptor signaling may be desired.

      Thank you, this is a great suggestion for improving clarity. We briefly address this point in the revised manuscript (lines 360-363).

      (2) The authors used juvenile mice, P11 to P18 of age. It is a typical age range used for plasticity experiments, but it is also true that this age range spans before and after eye-opening in mice (~P13) and is a few days before the onset of the classical critical period for ocular dominance plasticity in the visual cortex. Given the mechanistic novelty reported in the study, can authors comment on whether this signaling pathway may be age-dependent?

      Thanks, Reviewer 2 also raised this point. In the revised manuscript, we discuss this point (lines 428-432).

      Reviewer #3 (Recommendations for the authors):

      (1) Minor typos: page 4 line 101: sensitivity -> sensitive.

      We fixed this typo.

      (2) Page 15 line 333: sensitivity -> sensitive.

      We fixed this typo.

      (3) Minor aesthetic suggestion: On the scale bars for all examples, LTP and LTD data are easily confused with the letter L. I'd suggest flipping them left to right.

      We thank the reviewer for the suggestion. We flipped the scale bars in all figures.

      References

      Abrahamsson, T., Chou, C.Y.C., Li, S.Y., Mancino, A., Costa, R.P., Brock, J.A., Nuro, E., Buchanan, K.A., Elgar, D., Blackman, A.V., et al. 2017. Differential Regulation of Evoked and Spontaneous Release by Presynaptic NMDA Receptors. Neuron 96: 839-855 e835

      Bartlett, R.D., Esslinger, C.S., Thompson, C.M., and Bridges, R.J. 1998. Substituted quinolines as inhibitors of L-glutamate transport into synaptic vesicles. Neuropharmacology 37: 839-846

      Berretta, N., and Jones, R.S. 1996. Tonic facilitation of glutamate release by presynaptic N-methyl-D-aspartate autoreceptors in the entorhinal cortex. Neuroscience 75: 339-344.

      Brasier, D.J., and Feldman, D.E. 2008. Synapse-specific expression of functional presynaptic NMDA receptors in rat somatosensory cortex. J Neurosci 28: 2199-2211

      Brock, J.A., Thomazeau, A., Watanabe, A., Li, S.S.Y., and Sjöström, P.J. 2020. A Practical Guide to Using CV Analysis for Determining the Locus of Synaptic Plasticity. Frontiers in Synaptic Neuroscience 12:11 10.3389/fnsyn.2020.00011

      Buchanan, K.A., Blackman, A.V., Moreau, A.W., Elgar, D., Costa, R.P., Lalanne, T., Tudor Jones, A.A., Oyrer, J., and Sjöström, P.J. 2012. Target-Specific Expression of Presynaptic NMDA Receptors in Neocortical Microcircuits. Neuron 75: 451-466

      Chou, C.Y.C., Wong, H.H.W., Guo, C., Boukoulou, K.E., Huang, C., Jannat, J., Klimenko, T., Li, V.Y., Liang, T.A., Wu, V.C., and Sjöström, P.J. 2024. Principles of visual cortex excitatory microcircuit organization. The Innovation 6: 1-11

      Corlew, R., Wang, Y., Ghermazien, H., Erisir, A., and Philpot, B.D. 2007. Developmental switch in the contribution of presynaptic and postsynaptic NMDA receptors to long-term depression. J Neurosci 27: 9835-9845

      Heuss, C., and Gerber, U. 2000. G-protein-independent signaling by G-protein-coupled receptors. Trends in Neurosciences 23: 469-475

      Heuss, C., Scanziani, M., Gähwiler, B.H., and Gerber, U. 1999. G-protein-independent signaling mediated by metabotropic glutamate receptors. Nature Neuroscience 2: 1070-1077

      Huettner, J.E., and Bean, B.P. 1988. Block of N-methyl-D-aspartate-activated current by the anticonvulsant MK-801: selective binding to open channels. PNAS 85: 1307-1311.

      Humeau, Y., Shaban, H., Bissière, S., and Lüthi, A. 2003. Presynaptic induction of heterosynaptic associative plasticity in the mammalian brain. Nature 426: 841-845

      Kemp, J.A., Foster, A.C., Leeson, P.D., Priestley, T., Tridgett, R., Iversen, L.L., and Woodruff, G.N. 1988. 7-Chlorokynurenic acid is a selective antagonist at the glycine modulatory site of the N-methyl-D-aspartate receptor complex. PNAS 85: 6547-6550

      Larsen, R.S., Corlew, R.J., Henson, M.A., Roberts, A.C., Mishina, M., Watanabe, M., Lipton, S.A., Nakanishi, N., Perez-Otano, I., Weinberg, R.J., and Philpot, B.D. 2011. NR3A-containing NMDARs promote neurotransmitter release and spike timing-dependent plasticity. Nat Neurosci 14: 338-344

      Nabavi, S., Kessels, H.W., Alfonso, S., Aow, J., Fox, R., and Malinow, R. 2013. Metabotropic NMDA receptor function is required for NMDA receptor-dependent long-term depression. PNAS 110: 4027-4032

      Rodríguez-Moreno, A., Kohl, M.M., Reeve, J.E., Eaton, T.R., Collins, H.A., Anderson, H.L., and Paulsen, O. 2011. Presynaptic induction and expression of timing-dependent long-term depression demonstrated by compartment-specific photorelease of a use-dependent NMDA receptor antagonist. J Neurosci 31: 8564-8569

      Rodríguez-Moreno, A., and Paulsen, O. 2008. Spike timing-dependent long-term depression requires presynaptic NMDA receptors. Nat Neurosci 11: 744-745

      Sjöström, P.J., Turrigiano, G.G., and Nelson, S.B. 2003. Neocortical LTD via coincident activation of presynaptic NMDA and cannabinoid receptors. Neuron 39: 641-654

      Song, S., Sjöström, P.J., Reigl, M., Nelson, S., and Chklovskii, D.B. 2005. Highly nonrandom features of synaptic connectivity in local cortical circuits. PLoS biology 3: e68

      Tovar, K.R., and Westbrook, G.L. 1999. The incorporation of NMDA receptors with a distinct subunit composition at nascent hippocampal synapses in vitro. J Neurosci 19: 4180-4188

      Wong, H.H., Watt, A.J., and Sjöström, P.J. 2024. Synapse-specific burst coding sustained by local axonal translation. Neuron 112: 264-276 e266

    1. eLife Assessment

      This study presents valuable findings that advance our understanding of mural cell dynamics and vascular pathology in a zebrafish model of cerebral small vessel disease. The authors provide compelling evidence that partial loss of foxf2 function leads to progressive, cell-intrinsic defects in pericytes and associated endothelial abnormalities across the lifespan, leveraging powerful in vivo imaging and genetic tools. The strength of evidence could be further improved by additional mechanistic insight and quantitative or lineage-tracing analyses to clarify how pericyte number and identity are affected in the mutant model.

    2. Reviewer #1 (Public review):

      Summary:

      The paper by Graff et al. investigates the function of foxf2 in zebrafish to understand the progression of cerebral small vessel disease. The authors use a partial loss of foxf2 (zebrafish possess two foxf2 genes, foxf2a and foxf2b, and the authors mainly analyze homozygous mutants in foxf2a) to investigate the role of foxf2 signaling in regulating pericyte biology. They find that the number of pericytes is reduced in foxf2a mutants and that the remaining pericytes display alterations in their morphologies. The authors further find that mutant animals can develop to adulthood, but that in adult animals, both endothelial and pericyte morphologies are affected. They also show that mutant pericytes can partially repopulate the brain after genetic ablation.

      Strengths:

      The paper is well written and easy to follow.

      Weaknesses:

      The results are mainly descriptive, and it is not clear how they will advance the field at their current state, given that a publication on mice has already examined the loss of foxf2 phenotype on pericyte biology (Reyahi, 2015, Dev. Cell).

      (1) Reyahi et al. showed that loss of foxf2 in mice leads to a marked downregulation of pdgfrb expression in perivascular cells. In contrast to expectation, perivascular cell numbers were higher in mutant animals, but these cells did not differentiate properly. The authors use a transgenic driver line expressing gal4 under the control of the pdgfrb promoter and observe a reduction in pericyte (pdgfrb-expressing) cells in foxf2a mutants. In light of the mouse data, this result might be due to a similar downregulation of pdgfrb expression in fish, which would lead to a downregulation of gal4 expression and hence reduced labelling of pericytes. The authors show a reduction of pdgfrb expression also in zebrafish in foxf2b mutants (Chauhan et al., The Lancet Neurology 2016). It would be important to clarify whether, also in zebrafish, foxf2a/foxf2b mutants have reduced or augmented numbers of perivascular cells and how this compares to the data in the mouse. The authors should perform additional characterization of perivascular cells using marker gene expression (for a list of markers, see e.g., Shih et al. Development 2021) and/or genetic lineage tracing.

      (2) The authors motivate using foxf2a mutants as a model of reduced foxf2 dosage, "similar to human heterozygous loss of FOXF2". However, it is not clear how the different foxf2 genes in zebrafish interact with each other transcriptionally. Is there upregulation of foxf2b in foxf2a mutants and vice versa? This is important to consider, as Reyahi et al. showed that foxf2 gene dosage in mice appears to be important, with an increase in foxf2 gene dosage (through transgene expression) leading to a reduction in perivascular cell numbers.

      (3) Figures 3 and 4 lack data quantification. The authors describe the existence of vascular defects in adult fish, but no quantifiable parameters or quantifications are provided. This needs to be added.

      (4) The analysis of pericyte phenotypes and morphologies is not clear. On page 6, the authors state: "In the wildtype brain, adult pericytes have a clear oblong cell body with long, slender primary processes that extend from the cytoplasm with secondary processes that wrap around the circumference of the blood vessel." Further down on the same page, the authors note: "In wildtype adult brains, we identified three subtypes of pericytes, ensheathing, mesh and thin-strand, previously characterized in murine models." In conclusion, not all pericytes have long, slender primary processes, but there are at least three different sub-types? Did the authors analyze how they might be distributed along different branch orders of the vasculature, as they are in the mouse? Which type of pericyte is affected in foxf2a mutant animals? Can the authors identify the branch order of the vasculature for both wildtype and mutant animals and compare which subtype of pericyte might be most affected? Are all subtypes of pericytes similarly affected in mutant animals? There also seems to be a reduction in smooth muscle cell coverage.

      (5) Regarding pericyte regeneration data (Figure 7): Are the values in Figure 7D not significantly different from each other (no significance given)?

      (6) In the discussion, the authors state that "pericyte processes have not been studied in zebrafish". Ando et al. (Development 2016) studied pericyte processes in early zebrafish embryos, and Leonard et al. (Development 2022) studied zebrafish pericytes and their processes in the developing fin.

    3. Reviewer #2 (Public review):

      Summary:

      This study investigates the developmental and lifelong consequences of reduced foxf2 dosage in zebrafish, a gene associated with human stroke risk and cerebral small vessel disease (CSVD). The authors show that a ~50% reduction in foxf2 function through homozygous loss of foxf2a leads to a significant decrease in brain pericyte number, along with striking abnormalities in pericyte morphology-including enlarged soma and extended processes-during larval stages. These defects are not corrected over time but instead persist and worsen with age, ultimately affecting the surrounding endothelium. The study also makes an important contribution by characterizing pericyte behavior in wild-type zebrafish using a clever pericyte-specific Brainbow approach, revealing novel interactions such as pericyte process overlap not previously reported in mammals.

      Strengths:

      This work provides mechanistic insight into how subtle, developmental changes in mural cell biology and coverage of the vasculature can drive long-term vascular pathology. The authors make strong use of zebrafish imaging tools, including longitudinal analysis in transgenic lines to follow pericyte number and morphology over larval development, and then applied tissue clearing and whole brain imaging at 3 and 11 months to further dissect the longitudinal effects of foxf2a loss. The ability to track individual pericytes in vivo reveals cell-intrinsic defects and process degeneration with high spatiotemporal resolution. Their use of a pericyte-specific Zebrabow line also allows, for the first time, detailed visualization of pericyte-pericyte interactions in the developing brain, highlighting structural features and behaviors that challenge existing models based on mouse studies. Together, these findings make the zebrafish a valuable model for studying the cellular dynamics of CSVD.

      Weaknesses:

      While the findings are compelling, several aspects could be strengthened. First, quantifying pericyte coverage across distinct brain regions (forebrain, midbrain, hindbrain) would clarify whether foxf2a loss differentially impacts specific pericyte lineages, given known regional differences in developmental origin, with forebrain pericytes being neural crest-derived and hindbrain pericytes being mesoderm-derived. Second, measuring foxf2b expression in foxf2a mutants would better support the interpretation that total FOXF2 dosage is reduced in a graded fashion in heterozygote and homozygote foxf2a mutants. Finally, quantifying vascular density in adult mutants would help determine whether observed endothelial changes are a downstream consequence of prolonged pericyte loss. Correlating these vascular changes with local pericyte depletion would also help clarify causality.

    4. Reviewer #3 (Public review):

      Summary:

      The goal of the work by Graff et al. is to model CSVD in the zebrafish using foxf2a mutants. The mutants show loss of cerebral pericyte coverage that persists through adulthood, but it seems foxf2a does not regulate the regenerative capacity of these cells. The findings are interesting and build on previous work from the group. Limitations of the work include little mechanistic insight into how foxf2a alters pericyte recruitment/differentiation/survival/proliferation in this context, and the overlap of these studies with previous work in fox2a/b double mutants. However, the data analysis is clean and compelling, and the findings will contribute to the field.

    1. eLife Assessment

      This study identifies 53BP1 as an interaction partner of GMCL1 (a likely CUL3 substrate receptor). The study seeks to link this finding to regulation of the mitotic surveillance pathway and paclitaxel resistance in cancer. The evidence for these claims is currently inadequate; concerns include the use of cell lines that have been reported to lack the mitotic surveillance pathway, insufficient consideration of paclitaxel mechanisms of action, and an overinterpretation of correlative results.

    2. Reviewer #1 (Public review):

      In this manuscript, Pagano and colleagues test the idea that the protein GMCL1 functions as a substrate receptor for a Cullin RING 3 E3 ubiquitin ligase (CUL3) complex. Using a pulldown approach, they identify GMCL1 binding proteins, including the DNA damage scaffolding protein 53BP1. They then focus on the idea that GMCL1 recruits 53BP1 for CUL3-dependent ubiquitination, triggering subsequent proteasomal degradation of ubiquitinated 53BP1.

      In addition to its DNA damage signalling function, in mitosis, 53BP1 is reported to form a stopwatch complex with the deubiquitinating enzyme USP28 and the transcription factor p53 (PMID: 38547292). These 53BP1-stopwatch complexes generated in mitosis are inherited by G1 daughter cells and help promote p53-dependent cell cycle arrest independent from DNA damage (PMID: 38547292). Several studies show that knockout of 53BP1 overcomes G1 cell cycle arrest after mitotic delays caused by anti-mitotic drugs or centrosome ablation (PMID: 27432897, 27432896). In this model, it is crucial that 53BP1 remains stable in mitosis and more stopwatch complex is formed after delayed mitosis.

      Pagano and coworkers suggest that 53BP1 levels can sometimes be suppressed in mitosis if the cells overexpress GMCL1. They carry out a bioinformatic analysis of available public data for p53 wild-type cancer cell lines resistant to the anti-mitotic drug paclitaxel and related compounds. Stratifying GMCL1 into low and high expression groups reveals a weak (p = 0.05 or ns) correlation with sensitivity to taxanes. It is unclear on what basis the authors claim paclitaxel-resistant and p53 wild-type cancer cell lines bypass the mitotic surveillance/timer pathway. They have not tested this. Figure 3 is a correlation assembled from public databases but has no experimental tests. Figure 4 looks at proliferation but not cell cycle progression or the length of mitosis. The main conclusions relating to cell cycle progression and specifically the link to mitotic delays are therefore not supported by experimental data. There is no imaging of the cell cycle or cell fate after mitotic delays, or analysis of where the cells arrest in the cell cycle. Most of the cell lines used have been reported to lack a functional mitotic surveillance pathway in the recent work by Meitinger. To support these conclusions, the stability of endogenous 53BP1 under different conditions in cells known to have a functional mitotic surveillance pathway needs to be examined. A key suggestion in the work is that the level of GMCL1 expression correlates with resistance to taxanes. For the mitotic surveillance pathway, the type of drug (nocodazole, taxol, etc) used to induce a delay isn't thought to be relevant, only the length of the delay. Do GMCL1-overexpressing cells show resistance to anti-mitotics in general?

      Importantly, if GMCL1 specifically degrades 53BP1 during prolonged mitotic arrests, the authors should show what happens during normal cell divisions without any delays or drug treatments. How much 53BP1 is destroyed in mitosis under those conditions? Does 53BP1 destruction depend on the length of mitosis, drug treatment, or does 53BP1 get degraded every mitosis regardless of length? Testing the contribution of key mitotic E3 ligase activities on mitotic 53BP1 stability, such as the anaphase-promoting complex/cyclosome (APC/C) is important in this regard. One previous study reported an analysis of putative APC/C KEN-box degron motifs in 53BP1 and concluded these play a role in 53BP1 stability in anaphase (PMID: 28228263).

      There is no direct test of the proposed mechanism, and it is therefore unclear if 53BP1 is ubiquitinated by a GMCL1-CUL3 ligase in cells, and how efficient this process would be at different cell cycle stages. A key issue is the lack of experimental data explaining why the proposed mechanism would be restricted to mitosis. Indirect effects, such as loss of 53BP1 from the chromatin fraction during M phase upon GMCL1 overexpression, do not necessarily mean that 53BP1 is degraded. PLK1-dependent chromatin-cytoplasmic shuttling of 53BP1 during mitotic delays has been described previously (PMID: 38547292, 37888778). These papers are cited in the text, but the main conclusions of those papers on 53BP1 incorporation into a stopwatch complex during mitotic delays have been ignored. Are the authors sure that 53BP1 is destroyed in mitosis and not simply re-localised between chromatin and non-chromatin fractions? At the very least, these reported findings should be discussed in the text.

      The authors use a variety of cancer cell line models throughout their study, most of which have been reported to lack a functional mitotic surveillance pathway. U2OS and HCT116 cells do not respond normally to mitotic delays, despite being annotated as p53 WT. Other studies have used p53 wild-type hTERT RPE-1 cells to study the mitotic surveillance pathway. If the model is correct, then over-expressing GMCL1 in hTERT-RPE1 cells should suppress cell cycle arrest after mitotic delays, and GMCL1 KO should make the cells more sensitive to delays. These experiments are needed to provide an adequate test of the proposed model.

      To conclude, while the authors propose a potentially interesting model on how GMCL1 overexpression could regulate 53BP1 stability to limit p53-dependent cell cycle arrest, it is unclear what triggers this pathway or when it is relevant. 53BP1 is known to function in DNA damage signalling, and GMCL1 might be relevant in that context. The manuscript contains the initial description of GMCL1-53BP1 interaction but lacks a proper analysis of the function of this interaction and is therefore a preliminary report.

    3. Reviewer #2 (Public review):

      Summary:

      This study investigates the role of GMCL1 in regulating the mitotic surveillance pathway (MSP), a protective mechanism that activates p53 following prolonged mitosis. The authors identify a physical interaction between 53BP1 and GMCL1, but not with GMCL2. They propose that the ubiquitin ligase complex CRL3-GMCL1 targets 53BP1 for degradation during mitosis, thereby preventing the formation of the "mitotic stopwatch" complex (53BP1-USP28-p53) and subsequent p53 activation. The authors show that high GMCL1 expression correlates with resistance to paclitaxel in cancer cell lines that express wild-type p53. Importantly, loss of GMCL1 restores paclitaxel sensitivity in these cells, but not in p53-deficient lines. They propose that GMCL1 overexpression enables cancer cells to bypass MSP-mediated p53 activation, promoting survival despite mitotic stress. Targeting GMCL1 may thus represent a therapeutic strategy to re-sensitize resistant tumors to taxane-based chemotherapy.

      Strengths:

      This manuscript presents potentially interesting observations. The major strength of this article is the identification of GMCL1 as a 53BP1 interaction partner. The authors identified relevant domains and showed that GMCL1 controls 53BP1 stability. The authors further show a potentially interesting link between GMCL1 status and sensitivity to Taxol.

      Weaknesses:

      However, the manuscript is significantly weakened by unsubstantiated mechanistic claims, overreliance on a non-functional model system (U2OS), and overinterpretation of correlative data. To support the conclusions of the manuscript, the authors must show that the GMCL1-dependent sensitivity to Taxol depends on the mitotic surveillance pathway.

    4. Reviewer #3 (Public review):

      Summary:

      In this study, Kito et al follow up on previous work that identified Drosophila GCL as a mitotic substrate recognition subunit of a CUL3-RING ubiquitin ligase (CRL3) complex.

      Here they characterize mutants of the human ortholog of GCL, GMCL1, that disrupt the interaction with CUL3 (GMCL1E142K) and that lack the substrate interaction domain (GMCL1 BBO). Immunoprecipitation followed by mass spectrometry identified 9 proteins that interacted with wild-type FLAG-GMCL1 and GMCL1 EK but not GMCL1 BBO. These proteins included 53BP1, which plays a well-characterized role in double-strand break repair but also functions in a USP28-p53-53BP1 "mitotic stopwatch" complex that arrests the cell cycle after a substantially prolonged mitosis. Consistent with the IP-MS results, FLAG-GMCL1 immunoprecipitated 53BP1. Depletion of GMCL1 during mitotic arrest increased protein levels of 53BP1, and this could be rescued by wild-type GMCL1 but not the E142K mutant or a R433A mutant that failed to immunoprecipitate 53BP1.

      Using a publicly available dataset, the authors identified a relatively small subset of cell lines with high levels of GMCL1 mRNA that were resistant to the taxanes paclitaxel, cabazitaxel, and docetaxel. This type of analysis is confounded by the fact that paclitaxel and other microtubule poisons accumulate to substantially different levels in various cell lines (DOI: 10.1073/pnas.90.20.9552 , DOI: 10.1091/mbc.10.4.947 ), so careful follow-up experiments are required to validate results. The correlation between increased GMCL1 mRNA and taxane resistance was not observed in lung cancer cell lines. The authors propose this was because nearly half of lung cancers harbor p53 mutations, and lung cancer cell lines with wild-type but not mutant p53 showed the correlation between increased GMCL1 mRNA and taxane resistance. However, the other cancer cell types in which they report increased GMCL1 expression correlates with taxane sensitivity also have high rates of p53 mutation. Furthermore, p53 status does not predict taxane response in patients (DOI: 10.1002/1097-0142(20000815)89:4<769::aid-cncr8>3.0.co;2-6 , DOI: 10.1002/(SICI)1097-0142(19960915)78:6<1203::AID-CNCR6>3.0.CO;2-A , PMID: 10955790).

      The authors then depleted GMCL1 and reported that it increased apoptosis in two cell lines with wild-type p53 (MCF7 and U2OS) due to activation of the mitotic stopwatch. This is surprising because the mitotic stopwatch paper they cite (DOI: 10.1126/science.add9528 ) reported that U2OS cells have an inactive stopwatch and that activation of the stopwatch results in cell cycle arrest rather than apoptosis in most cell types, including MCF7. Beyond this, it has recently been shown that the level of taxanes and other microtubule poisons achieved in patient tumors is too low to induce mitotic arrest (DOI: 10.1126/scitranslmed.3007965 , DOI: 10.1126/scitranslmed.abd4811 , DOI: 10.1371/journal.pbio.3002339 ), raising concerns about the relevance of prolonged mitosis to paclitaxel response in cancer. The findings here demonstrating that GMCL1 mediates degradation of 53BP1 during mitotic arrest are solid and of interest to cell biologists, but it is unclear that these findings are relevant to paclitaxel response in patients.

      Strengths:

      This study identified 53BP1 as a target of CRL3GMCL1-mediated degradation during mitotic arrest. AlphaFold3 predictions of the binding interface, followed by mutational analysis, identified mutants of each protein (GMCL1 R433A and 53BP1 IEDI1422-1425AAAA) that disrupted their interaction. Knock-in of a FLAG tag into the C-terminus of GMCL1 in HCT116 cells, followed by FLAG immunoprecipitation, confirmed that endogenous GMCL1 interacts with endogenous CUL3 and 53BP1 during mitotic arrest.

      Weaknesses:

      The clinical relevance of the study is overinterpreted. The authors have not taken relevant data about the clinical mechanism of taxanes into account. Supraphysiologic doses of microtubule poisons cause mitotic arrest and can activate the mitotic stopwatch. However, in physiologic concentrations of clinically useful microtubule poisons, cells proceed through mitosis and divide their chromosomes on mitotic spindles that are at least transiently multipolar. Though these low concentrations may result in a brief mitotic delay, it is substantially shorter than the arrest caused by high concentrations of microtubule poisons, and the one mimicked here by 16 hours of 0.4 mg/mL nocodazole, which is not used clinically and does not induce multipolar spindles. Resistance to mitotic arrest occurs through different mechanisms than resistance to multipolar spindles. No evidence is presented in the current version of the manuscript that GMCL1 affects cellular response to clinically relevant doses of paclitaxel.

    1. eLife Assessment

      This valuable study expands the inventory of polyadenylated RNAs cleaved by the double-stranded RNA endonuclease Rnt1 in budding yeast, using solid methodology based on high-throughput sequencing. Previous studies had anecdotally discovered mRNA substrates, and this global characterization is comprehensive with multiple complementary controls. However, the study would be stronger with a deeper investigation into the biological function of Rnt1, as well as experiments directly probing the interaction between Rnt1 and its putative substrates.

    2. Reviewer #1 (Public review):

      Strengths:

      Sarpaning et al. provide a thorough characterization of putative Rnt1 cleavage of mRNA in S. cerevisiae. Previous studies have discovered Rnt1 mRNA substrates anecdotally, and this global characterization expands the known collection of putative Rnt1 cleavage sites. The study is comprehensive, with several types of controls to show that Rnt1 is required for several of these cleavages.

      Weaknesses:

      Formally speaking, the authors do not show a direct role of Rnt1 in mRNA cleavage - no studies were done (e.g., CLIP-seq or similar) to define direct binding sites. Is the mutant Rnt1 expected to trap substrates? Without direct binding studies, the authors rely on genetics and structure predictions for their argument, and it remains possible that a subset of these sites is an indirect consequence of rnt1. This aspect should be addressed in the discussion.

      The comprehensive list of putative Rnt1 mRNA cleavage sites is interesting insofar as it expands the repertoire of Rnt1 on mRNAs, but the functional relevance of the majority of these sites remains unknown. Along these lines, the authors should present a more thorough characterization of putative Rnt1 sites recovered from in vitro Rnt1 cleavage.

      The authors need to corroborate the rRNA 3'-ETS tetraloop mutations with a northern analysis of 3'-ETS processing to confirm an ETS processing defect (which might need to be done in decay mutants to stabilize the liberated ETS fragment). They state that the tetraloop mutation does not yield a growth defect and use this as the basis for concluding that rRNA cleavage is not the major role of Rnt1 in vivo, which is a surprising finding. But it remains possible that tetraloop mutations did not have the expected disruptive effect in vivo; if the ETS is processed normally in the presence of tetraloop mutations, it would undermine this interpretation. This needs to be more carefully examined.

      To support the assertion that YDR514C cleavage is required for normal "homeostasis," and more specifically that it is the major contributor to the rnt1∆ growth defect, the authors should express the YDR514C-G220S mutant in the rDNA∆ strains with mutations in the 3'-ETS (assuming they disrupt ETS processing, see above). This simple experiment should provide a relative sense of "importance" for one or the other cleavage being responsible for the rnt1∆ defect. Given the accepted role of Rnt1 cleavage in rRNA processing and a dogmatic view that this is the reason for the rnt1∆ growth defect, such a result would be surprising and elevate the functional relevance and significance of Rnt1 mRNA cleavage.

      Given that some Rnt1 mRNA cleavage is likely nuclear, it is possible that some of these targets are nascent mRNA transcripts, as opposed to mature but unexported mRNA transcripts, as proposed in the manuscript. A role for Rnt1 in co-transcriptional mRNA cleavage would be conceptually similar to Rnt1 cleavage of the rRNA 3'-ETS to enable RNA Pol I "torpedo" termination by Rat1, described by Proudfoot et al (PMID 20972219). To further delineate this point, the authors could e.g., examine the poly-A tails on abundant Rnt1 targets to establish whether they are mature, polyadenylated mRNAs (e.g., northern analysis of oligo-dT purified material). A more direct test would be PARE analysis of oligo-dT enriched or depleted material to determine the poly-A status of the cleavage products. Alternatively, their association with chromatin could be examined.

      While laboratory strains of budding yeast have a single RNase III ortholog Rnt1, several other budding yeast have a functional RNAi system with Dcr and Ago (PMID 19745116), and laboratory yeast strains are a derived state due to pressure from the killer virus to lose the RNAi system (PMID 21921191). The current study could provide new insight into the relative substrate preferences of Rnt1 and budding yeast Dicer, which could be experimentally confirmed by expressing Dcr in RNT1 and rnt1∆ strains. In lieu of experiments, discussion of the relevance of Rnt1 cleavage compared to yeast RNAi should be included in the discussion before the "human implications" section.

      For SNR84 in Figure S3D, it appears that the TSS may be upstream of the annotated gene model. Does RNA-seq coverage (from external datasets) extend upstream to these additional mapped cleavages? The assertion that the mRNA is uncapped is concerning; an alternative explanation is that the nascent mRNA has a cap initially but is subsequently cleaved by Rnt1. This point should be clarified or reworded for accuracy.

    3. Reviewer #2 (Public review):

      The yeast double-stranded RNA endonuclease Rnt1, a homolog of bacterial RNAse III, mediates the processing of pre-rRNA, pre-snRNA, and pre-snoRNA molecules. Cells lacking Rnt1 exhibit pronounced growth defects, particularly at lower temperatures. In this manuscript, Notice-Sarpaning examines whether these growth defects can be attributed at least in part to a function of Rnt1 in mRNA degradation. To test this, the authors apply parallel analysis of RNA ends (PARE), which they developed in previous work, to identify polyA+ fragments with 5' monophosphates in RNT1 yeast that are absent in rnt1Δ cells. Because such RNAs are substrates for 5' to 3' exonucleolytic decay by Rat1 in the nucleus or Xrn1 in the cytoplasm, these analyses were performed in a rat1-ts xrn1Δ background. The data recapitulate known Rtn1 cleavage sites in rRNA, snRNAs, and snoRNAs, and identify 122 putative novel substrates, approximately half of which are mRNAs. Of these, two-thirds are predicted to contain double-stranded stem loop structures with A/UGNN tetraloops, which serve as a major determinant of Rnt1 substrate recognition. Rtn1 resides in the nucleus, and it likely cleaves mRNAs there, but cleavage products seem to be degraded after export to the cytoplasm, as analysis of published PARE data shows that some of them accumulate in xrn1Δ cells. The authors then leverage the slow growth of rnt1Δ cells for experimental evolution. Sequencing analysis of thirteen faster-growing strains identifies mutations predominantly mapping to genes encoding nuclear exosome co-factors. Some of the strains have mutations in genes encoding a larat-debranching enzyme, a ribosomal protein nuclear import factor, poly(A) polymerase 1, and the RNA-binding protein Puf4. In one of the puf4 mutant strains, a second mutation is also present in YDR514C, which the authors identify as an mRNA substrate cleaved by Rnt1. Deletion of either puf4 or ydr514C marginally improves the growth of rnt1Δ cells, which the authors interpret as evidence that mRNA cleavage by Rnt1 plays a role in maintaining cellular homeostasis by controlling mRNA turnover.

      While the PARE data and their subsequent in vitro validation convincingly demonstrate Rnt1-mediated cleavage of a small subset of yeast mRNAs, the data supporting the biological significance of these cleavage events is substantially less compelling. This makes it difficult to establish whether Rnt1-mediated mRNA cleavage is biologically meaningful or simply "collateral damage" due to a coincidental presence of its target motif in these transcripts.

      (1) A major argument in support of the claim that "several mRNAs rely heavily on Rnt1 for turnover" comes from comparing number of PARE reads at the transcript start site (as a proxy for fraction of decapped transcripts) and at the Rnt1 cleavage site (as a proxy for fraction of Rnt1-cleaved transcripts). The argument for this is that "the major mRNA degradation pathway is through decapping". However, polyA tail shortening usually precedes decapping, and transcripts with short polyA tails would be strongly underrepresented in PARE sequencing libraries, which were constructed after two rounds of polyA+ RNA selection. This will likely underestimate the fraction of decapped transcripts for each mRNA. There is a wide range of well-established methods that can be used to directly measure differences in the half-life of Rnt1 mRNA targets in RNT1 vs rnt1Δ cells. Because the PARE data rely on the presence of a 5' phosphate to generate sequencing reads, they also cannot be used to estimate what fraction of a given mRNA transcript is actually cleaved by Rnt1.

      (2) Rnt1 is almost exclusively nuclear, and the authors make a compelling case that its concentration in the cytoplasm would likely be too low to result in mRNA cleavage. The model for Rnt1-mediated mRNA turnover would therefore require mRNAs to be cleaved prior to their nuclear export in a manner that would be difficult to control. Alternatively, the Rnt1 targets would need to re-enter prior to cleavage, followed by export of the cleaved fragments for cytoplasmic decay. These processes would need to be able to compete with canonical 5' to 3' and 3' to 5' exonucleolytic decay to influence mRNA fate in a biologically meaningful way.

      (3) The experimental evolution clearly demonstrates that mutations in nuclear exosome factors are the most frequent suppressors of the growth defects caused by Rnt1 loss. This can be rationalized by stabilization of nuclear exosome substrates such as misprocessed snRNAs or snoRNAs, which are the major targets of Rnt1. The rescue mutations in other pathways linked to ribosomal proteins (splicing, ribosomal protein import, ribosomal mRNA binding) support this interpretation. By contrast, the potential suppressor mutation in YDR514C does not occur on its own but only in combination with a puf4 mutation; it is also unclear whether it is located within the Rnt1 cleavage motif or if it impacts Rnt1 cleavage at all. This can easily be tested by engineering the mutation into the endogenous YDR514C locus with CRISPR/Cas9 or expressing wild-type and mutant YDR514C from a plasmid, along with assaying for Rnt1 cleavage by northern blot. Notably, the growth defect complementation of YDR514C deletion in rnt1Δ cells is substantially less pronounced than the growth advantage afforded by nuclear exosome mutations (Figure S9, evolved strains 1 to 5). These data rather argue for a primary role of Rnt1 in promoting cell growth by ensuring efficient ribosome biogenesis through pre-snRNA/pre-snoRNA processing.

    1. eLife Assessment

      Complex traits are influenced by genes and the environment, but especially the latter is difficult to pin down. This important study uses C. elegans to demonstrate that non-genetic differences in gene expression, partly influenced by the environment, correlate with individual differences in two reproductive traits. This supports the use of gene expression data as a key intermediate for understanding complex traits. The clever study design makes for compelling evidence, which is further strengthened by experimental confirmation that identified differentially expressed genes indeed influence these traits.

    2. Reviewer #1 (Public review):

      Summary:

      Genome-wide association studies have been an important approach to identifying the genetic basis of human traits and diseases. Despite their successes, for many traits, a substantial amount of variation cannot be explained by genetic factors, indicating that environmental variation and individual 'noise' (stochastic differences as well as unaccounted for environmental variation) also play important roles. The authors' goal was to address whether gene expression variation in genetically identical individuals, driven by historical environmental differences and 'noise', could be used to predict reproductive trait differences.

      Strengths:

      To address this question, the authors took advantage of genetically identical C. elegans individuals to transcriptionally profile 180 adult hermaphrodite individuals that were also measured for two reproductive traits. A major strength of the paper is its experimental design. While experimenters aim to control the environment that each worm experiences, it is known that there are small differences that each worm experiences even when they are grown together on the same agar plate - e.g. the age of their mother, their temperature, the amount of food they eat, and the oxygen and carbon dioxide levels depending on where they roam on the plate. Instead of neglecting this unknown variation, the authors design the experiment up front to create two differences in the historical environment experienced by each worm: 1) the age of its mother and 2) 8 8-hour temperature difference, either 20 or 25 {degree sign}C. This helped the authors interpret the gene expression differences and trait expression differences that they observed.

      Using two statistical models, the authors measured the association of gene expression for 8824 genes with the two reproductive traits, considering both the level of expression and the historical environment experienced by each worm. Their data supports several conclusions. They convincingly show that gene expression differences are useful for predicting reproductive trait differences, predicting ~25-50% of the trait differences depending on the trait. Using RNAi, they also show that the genes they identify play a causal role in trait differences. Finally, they demonstrate an association with trait variation and the H3K27 trimethylation mark, suggesting that chromatin structure can be an important causal determinant of gene expression and trait variation.

      Overall, this work supports the use of gene expression data as an important intermediate for understanding complex traits. This approach is also useful as a starting point for other labs in studying their trait of interest.

      Weaknesses:

      There are no major weaknesses that I have noted. Some important limitations of the work (that I believe the authors would agree with) are worth highlighting, however:

      (1) A large remaining question in the field of complex traits remains in splitting the role of non-genetic factors between environmental variation and stochastic noise. It is still an open question which role each of these factors plays in controlling the gene expression differences they measured between the individual worms.

      (2) The ability of the authors to use gene expression to predict trait variation was strikingly different between the two traits they measured. For the early brood trait, 448 genes were statistically linked to the trait difference, while for egg-laying onset, only 11 genes were found. Similarly, the total R2 in the test set was ~50% vs. 25%. It is unclear why the differences occur, but this somewhat limits the generalizability of this approach to other traits.

      (3) For technical reasons, this approach was limited to whole worm transcription. The role of tissue and cell-type expression differences is important to the field, so this limitation is important.

    3. Reviewer #2 (Public review):

      Summary:

      This paper measures associations between RNA transcript levels and important reproductive traits in the model organism C. elegans. The authors go beyond determining which gene expression differences underlie reproductive traits, but also (1) build a model that predicts these traits based on gene expression and (2) perform experiments to confirm that some transcript levels indeed affect reproductive traits. The clever study design allows the authors to determine which transcript levels impact reproductive traits, and also which transcriptional differences are driven by stochastic vs environmental differences. In sum, this is a rather comprehensive study that highlights the power of gene expression as a driver of phenotype, and also teases apart the various factors that affect the expression levels of important genes.

      Strengths:

      Overall, this study has many strengths, is very clearly communicated, and has no substantial weaknesses that I can point to. One question that emerges for me is about the extent to which these findings apply broadly. In other words, I wonder whether gene expression levels are predictive of other phenotypes in other organisms. I think this question has largely been explored in microbes, where some studies (PMID: 17959824) but not others (PMID: 38895328) find that differences in gene expression are predictive of phenotypes like growth rate. Microbes are not the primary focus here, and instead, the discussion is mainly focused on using gene expression to predict health and disease phenotypes in humans. This feels a little complicated since humans have so many different tissues. Perhaps an area where this approach might be useful is in examining infectious single-cell populations (bacteria, tumors, fungi). But I suppose this idea might still work in humans, assuming the authors are thinking about targeting specific tissues for RNAseq.

      In sum, this is a great paper that really got me thinking about the predictive power of gene expression and where/when it could inform about (health-related) phenotypes.

    4. Reviewer #3 (Public review):

      Summary:

      Webster et al. sought to understand if phenotypic variation in the absence of genetic variation can be predicted by variation in gene expression. To this end they quantified two reproductive traits, the onset of egg laying and early brood size in cohorts of genetically identical nematodes exposed to alternative ancestral (two maternal ages) and same generation life histories (either constant 20C temperature or 8-hour temperature shift to 25C upon hatching) in a two-factor design; then they profiled genome-wide gene expression in each individual.

      Using multiple statistical and machine learning approaches, they showed that, at least for early brood size, phenotypic variation can be quite well predicted by molecular variation, beyond what can be predicted by life history alone.

      Moreover, they provide some evidence that expression variation in some genes might be causally linked to phenotypic variation.

      Strengths:

      (1) Cleverly designed and carefully performed experiments that provide high-quality datasets useful for the community.

      (2) Good evidence that phenotypic variation can be predicted by molecular variation.

      Weaknesses:

      What drives the molecular variation that impacts phenotypic variation remains unknown. While the authors show that variation in expression of some genes might indeed be causal, it is still not clear how much of the molecular variation is a cause rather than a consequence of phenotypic variation.

    1. eLife Assessment

      This useful study presents the potentially interesting concept that LRRK2 regulates cellular BMP levels and their release via extracellular vesicles, with GCase activity further modulating this process in mutant LRRK2-expressing cells. However, the evidence supporting the conclusions remains incomplete, and certain statistical analyses are inadequate. This work would be of interest to cell biologists working on Parkinson's disease.

    2. Reviewer #1 (Public review):

      Summary:

      Even though mutations in LRRK2 and GBA1 (which encodes the protein GCase) increase the risk of developing Parkinson's disease (PD), the specific mechanisms driving neurodegeneration remain unclear. Given their known roles in lysosomal function, the authors investigate how LRRK2 and GCase activity influence the exocytosis of the lysosomal lipid BMP via extracellular vesicles (EVs). They use fibroblasts carrying the PD-associated LRRK2-R1441G mutation and pharmacologically modulate LRRK2 and GCase activity.

      Strengths:

      The authors examine both proteins at endogenous levels, using MEFs instead of cancer cells. The study's scope is potentially interesting and could yield relevant insights into PD disease mechanisms.

      Weaknesses:

      Many of the authors' conclusions are overstated and not sufficiently supported by the data. Several statistical errors undermine their claims. Pharmacological treatment is very long, leading to potential off-target effects. Additionally, the authors should be more rigorous when using EV markers.

    3. Reviewer #2 (Public review):

      Summary:

      In this paper, the authors used MEFs expressing the R1441G mutant of leucine-rich repeat kinase 2 (LRRK2), a mutant associated with the early onset of Parkinson's disease. They report that in these cells LAMP2 fluorescence is higher but BMP fluorescence is lower, MVE size is reduced, and that MVEs contain less ILVs. They also report that LAMP2-positive EVs are increased in mutant cells in a process sensitive to LRRK2 kinase inhibition but are further increased by glucocerebrosidase (GCase) inhibition, and that total di-22:6-BMP and total di-18:1-BMP are increased in mutant LRRK2 MEFs compared to WT cells by mass spectrometry. They also report that LRRK2 kinase inhibition partially restores cellular BMP levels, and that GCase inhibition further increases BMP levels, and that in EVs from the LRRK2 mutant, LRRK2 inhibition decreases BMP while GCase inhibition has the opposite effect. Moreover, they report that the BMP increase is not due to increased BMP synthesis, although the authors observe that CLN5 is increased in LRRK2 mutant cells. Finally, they report that GW4869 decreases EV release and exosomal BMP, while bafilomycin A1 increases EV release. They conclude that LRRK2 regulates BMP levels (in cells) and release (via EVs). They also conclude that the process is modulated by GCase in LRRK2 mutant cells, and that these studies may contribute to the use of BMP-positive EVs as a biomarker for Parkinson's disease and associated treatments.

      Strengths:

      This is an interesting paper, which provides novel insights into the biogenesis of exosomes with exciting biomedical potential. However, I have comments that authors need to address to clarify some aspects of their study.

      Weaknesses:

      (1) The intensity of LAMP2 staining is increased significantly in cells expressing the R1441G mutant of LRRK2 when compared to WT cells (Figure 1C). Yet mutant cells contain significantly smaller MVEs with fewer ILVs, and the MVE surface area is reduced (Figure 1D-F). This is quite surprising since LAMP2 is a major component of the limiting membrane of late endosomes. Are other proteins of endo-lysosomes (eg, LAMP1, CD63, RAB7) or markers (lysotracker) also decreased (see also below)?

      (2) LRRK2 has been reported to interact with endolysosomal membranes. Does the R1441G mutant bind LAMP2- and/or BMP-positive membranes? Does the mutant affect endolysosomes?

      (3) Immunofluorescence data indicate that BMP is decreased in mutant LRRK2-expressing cells compared to WT (Figure 1A-B), but mass spec data indicate that di-22:6-BMP and di-18:1-BMP are increased (Figure 3). Authors conclude that the BMP pool detected by mass spec in mutant cells is less antibody-accessible than that present in wt cells, or that the anti-BMP antibody is less specific and that it detects other analytes. This is an awkward conclusion, since the IF signal with the antibody is lower (not higher): why would the antibody be less specific? Could it be that the antibody does not see all BMP isoforms equally well? Moreover, the observations that mutant cells contain smaller MVEs (Figure 1D-F) with fewer ILVs are consistent with the IF data and reduced BMP amounts. This needs to be clarified.

      Mass spectrometry data are only shown for two BMP species (di-22:6, di-18:1). What are the major BMP isoforms in WT cells? The authors should show the complete analysis for all BMP species if they wish to draw quantitative conclusions about the amounts of BMP in wt and mutant cells. Finally, BMP and PG are isobaric lipids. Fragmentation of BMPs or PGs results in characteristic fingerprints, but the presence of each daughter ion is not absolutely specific for either lipid. This should be clarified, e.g., were BMP and PG separated before mass spec analysis? Was PG affected? The authors should also compare the BMP data with mass spec data obtained with a control lipid, e.g., PC.

      (4) It is quite surprising that the amounts of labeled BMP continue to increase for up to 24h after a short 25min pulse with heavy BMP precursors (Figure 4B).

      (5) It is argued that upregulation of CLN5 may be due to an overall upregulation of lysosomal enzymes, as LAMP2 levels were also increased (Figure 2A, C, E). Again, this is not consistent with the observed decrease in MVE size and number (Figure 1D-F). As mentioned above, other independent markers of endo-lysosomes should be analyzed (eg, LAMP1, CD63, RAB7), and/or other lysosomal enzymes (e.g. cathepsin. D).

      (6) The authors report that the increase in BMP is not due to an increase in BMP synthesis (Figure 4), although they observe a significant increase in CLN5 (Figure 5A) in LRRK2 mutant cells. Some clarification is needed.

      (7) Authors observe that both LAMP2 and BMP are decreased in EVs by GW4869 and increased by bafilomycin (Figure 6). Given my comments above on Figure 1, it would also be nice to illustrate/quantify the effects of these compounds on cells by immunofluorescence.

    1. eLife Assessment

      This fundamental study advances our understanding of the role that energy metabolism, specifically anaerobic glycolysis, plays during retinal development. Convincing in vitro genetic and pharmacological evidence demonstrates that glycolytic flux controls retinal progenitor cell proliferation rates and the timing of photoreceptor maturation. Interesting evidence suggests potential downstream roles for intracellular pH and Wnt/β-catenin signaling; however, more direct evidence is needed to show they are the key mechanisms through which glycolytic flux regulates retinogenesis in vivo. This work is expected to stimulate broad interest and possible future studies investigating the link between metabolism and development in other tissue systems.

      [Editors’ note: Primary data for this manuscript are not available due to a corrupted hard drive that occurred during the course of peer review. However, preprocessed data are available.]

    2. Reviewer #1 (Public review):

      Summary:

      This paper seeks to understand the upstream regulation and downstream effectors of glycolysis in retinal progenitor cells, using mouse retinal explants as the main model system. The paper presents evidence that high glycolysis in retinal progenitor cells is required for their proliferation and timely differentiation into photoreceptors. Retinal glycolysis increases after deletion of Pten. The authors suggest that high glycolysis controls cell proliferation and differentiation by promoting intracellular alkalinization, beta-catenin acetylation and stabilization and consequent activation of the canonical Wnt pathway.

      Strengths:

      - The experiments showing that PFKFB3 overexpression is sufficient to increase proliferation of retinal progenitors (which are already highly dividing cells) and photoreceptor differentiation are striking and the result unanticipated. It suggests that glycolytic flux is normally limiting for proliferation in embryos.<br /> - Likewise the result that an increase in pH from 7.4 to 8.0 is sufficient to increase proliferation implies that pH regulation may have instructive roles in setting the tempo of retinal development and embryonic cell proliferation. Similarly for the results showing that acetate supplementation increases proliferation (I think this result should be moved to the main figures).

      Weaknesses:

      - Epistatic experiments to test if changes in pH mediate the effects of glycolysis on photoreceptor differentiation, or if Wnt activation is the main downstream effector of glycolysis in controlling differentiation are not presented.<br /> - It is likely that metabolism changes ex vivo vs in vivo, and therefore stable isotope tracing experiments in the explants may not reflect in vivo metabolism.<br /> - The retina at P0 is composed of both progenitors and differentiated cells. It is not clear if the results of the RNA-seq and metabolic analysis reflect changes in the metabolism of progenitors, or of mature cells, or changes in cell type composition rather than direct metabolic changes in a specific cell type.<br /> - The biochemical links between elevated glycolysis and pH and beta-catenin stability are unclear. White et al found that higher pH decreased beta-catenin stability (JCB 217: 3965) in contrast to the results here. Oginuma et al found that inhibition of glycolysis or beta-catenin acetylation does not affect beta-catenin stability (Nature 584:98), again in contrast to these results. Another paper showed that acidification inhibits Wnt signaling by promoting the expression of a transcriptional repressor and not via beta-catenin stability (Cell Discovery 4:37). There are also additional papers showing increased pH can promote cell proliferation via other mechanisms (e.g. Nat Metab 2:1212). It is possible that there is organ-specificity in these signaling pathways however some clarification of these divergent results is warranted.<br /> - The gene expression analysis is not completely convincing. E.g. expression of additional glycolytic genes should be shown in Fig. 1. It is not clear why Hk1 and Pgk1 are specifically shown, and conclusions about changes in glycolysis are difficult to draw from expression of these two genes. The increase in glycolytic gene expression in the Pten-deficient retina is generally small.<br /> - Is it possible that glycolytic inhibition with 2DG slows down development and production of most new differentiated cells rather than specifically affecting photoreceptor differentiation?<br /> - Are the prematurely-born cells caused by PFKFB3 overexpression photoreceptors as assessed by morphology or markers (in addition to position)?

    3. Reviewer #3 (Public review):

      Summary:

      This study examines the metabolic regulation of progenitor proliferation and differentiation in the developing retina. The authors observe dynamic changes in glycolytic gene expression in retinal progenitors and use various strategies to test the role of glycolysis. They find that elevated glycolysis in Pten-cKO retinas results in alteration of RPC fate, while inhibition of glycolysis has converse effects. They specifically test the role of elevated glycolysis using dominant active cytoPFKB3, which demonstrates the selective effects of elevated glycolysis on progenitor proliferation and rod differentiation. They then show that elevated glycolysis modulates both pHi and Wnt signaling, and provide evidence that these pathways impact proliferation and differentiation of progenitors, particularly affecting rod photoreceptor differentiation.

      Strengths:

      This is a compelling and rigorous study that provides an important advance in our understanding of metabolic regulation of retina development, addressing a major gap in knowledge. A key strength is that the study utilizes multiple genetic and pharmacological approaches to address how both increased or decreased glycolytic flux affect retinal progenitor proliferation and differentiation. They discover elevated Wnt signaling pathway genes in Pten cKO retina, revealing a potential link between glycolysis and Wnt pathway activation. Altogether the study is comprehensive and adds to the growing body of evidence that regulation of glycolysis plays a key role in tissue development.

      Weaknesses:

      (1) Following expression of cytoPFKB3, which results in increased glycolytic flux, BrDU labeling was performed at e12.5 and increased labeled cells were detected in the outer nuclear layer. But whether these are cones or rods is not established. The rest of the analysis is focused on the precocious maturation of rhodopsin-labelled outer segments, and the major conclusions emphasize rod photoreceptor differentiation. Therefore it is unclear whether there is an effect on cone differentiation for either Pten cKO or cytoPFKB3 transgenic retina. It is also not established whether rods are born precociously. Presumably this would be best detected by BrDU labeling at later embryonic stages.

      (2) The authors find that there is upregulation of multiple Wnt pathway components in Pten cKO retina. They further show that inhibiting Wnt signaling phenocopies the effects of reducing glycolysis. However, they do not test whether pharmacological inhibition of Wnt signaling reverses the effects of high glycolytic activity in Pten cKO retinas. Thus the argument that Wnt is a key downstream effector pathway regulating rod photoreceptor differentiation is weak.

      (3) The use of sodium acetate to force protein acetylation is quite non-specific and will have effects beyond beta-catenin acetylation (which the authors acknowledge). Thus it is a stretch to state that "forced activation of beta-catenin acetylation" mimics the impact of Pten<br /> loss/high glycolytic activity in RPCs since the effects could be due to acetylation of other proteins.

    4. Author response:

      The following is the authors’ response to the original reviews

      Reviewer 1 (Public review):

      (1) “It is likely that metabolism changes ex vivo vs in vivo, and therefore stable isotope tracing experiments in the explants may not reflect in vivo metabolism.”

      We agree with the reviewer that metabolic changes may differ ex vivo versus in vivo. We now state: “Lastly, an important caveat to our study is that metabolism changes ex vivo versus in vivo, and thus, in the future, in vivo studies can be performed to assess metabolic changes.” (lines 591-593).

      (2) “The retina at P0 is composed of both progenitors and differentiated cells. It is not clear if the results of the RNA-seq and metabolic analysis reflect changes in the metabolism of progenitors, or of mature cells, or changes in cell type composition rather than direct metabolic changes in a specific cell type.”

      We have clarified that the metabolic changes may be in RPCs or in other retinal cell types on lines 149-152: “Since these measurements were performed in bulk, and the ratio of RPCs to differentiated cells declines as development proceeds, it is not clear whether glycolytic activity is temporally regulated within RPCs or in other retinal cell types.”

      However, since we mined a single cell (sc) RNA-seq dataset, we are able to attribute gene expression specifically within RPCs (Figure 1).

      (3) “The biochemical links between elevated glycolysis and pH and beta-catenin stability are unclear. White et al found that higher pH decreased beta-catenin stability (JCB 217: 3965) in contrast to the results here. Oginuma et al found that inhibition of glycolysis or beta-catenin acetylation does not affect beta-catenin stability (Nature 584:98), again in contrast to these results. Another paper showed that acidification inhibits Wnt signaling by promoting the expression of a transcriptional repressor and not via beta-catenin stability (Cell Discovery 4:37). There are also additional papers showing increased pH can promote cell proliferation via other mechanisms (e.g. Nat Metab 2:1212). It is possible that there is organ-specificity in these signaling pathways however some clarification of these divergent results is warranted.”

      We have added the information and references brought up by the reviewer in our discussion (lines 529-549 and 570-574). We have also suggested future experiments to further analyse our system in line with the studies now referenced (lines 580-589).

      (4) The gene expression analysis is not completely convincing. E.g. the expression of additional glycolytic genes should be shown in Figure 1. It is not clear why Hk1 and Pgk1 are specifically shown, and conclusions about changes in glycolysis are difficult to draw from the expression of these two genes. The increase in glycolytic gene expression in the Pten-deficient retina is generally small.

      We have expanded the list of glycolytic genes analysed, in modified Figure 1B, and expanded the description of these results on lines 156-166.

      (5) Is it possible that glycolytic inhibition with 2DG slows down the development and production of most newly differentiated cells rather than specifically affecting photoreceptor differentiation?

      We added a comment to this effect to the discussion: “It is possible that glycolytic inhibition with 2DG slows down the development and production of most newly differentiated cells rather than specifically affecting photoreceptor differentiation, which we could assess in the future.“ (lines 600-603).

      (6) “Likewise the result that an increase in pH from 7.4 to 8.0 is sufficient to increase proliferation implies that pH regulation may have instructive roles in setting the tempo of retinal development and embryonic cell proliferation. Similarly, the results show that acetate supplementation increases proliferation (I think this result should be moved to the main figures).”

      We have added the acetate data to main Figure 7E.

      We added a supplemental data table that was inadvertently not included in our last submission. Figure 2– Data supplement 1.

      Reviewer #2 (Recommendations for the authors):

      Major points

      (1) Assuming that increased glycolysis gets RPCs to exit from the proliferative stage earlier, the total number of retinal cells, notably that of the rod photoreceptors, should be reduced since the pool of proliferating cells is depleted earlier. Is that really the case for a mature retina? To address this question, the authors should perform quantifications of photoreceptors at a stage where most developmental cell death has concluded (i.e. at P14 or later; Young, J. Comp. Neurol. 229:362-373, 1984) and check whether or not there are more or less photoreceptors present.

      We have previously quantified numbers of each cell type in Pten RPC-cKO retinas, and as suggested by the reviewer, there are fewer rod photoreceptors at P7 (Tachibana et al. 2016. J Neurosci 36 (36) 9454-9471) and P21 (Hanna et al. 2025. IOVS. Mar 3;66(3):45). We have edited the following sentence: “Using cellular birthdating, we previously showed that Pten-cKO RPCs are hyperproliferative and differentiate on an accelerated schedule between E12.5 and E18.5, yet fewer rod photoreceptors are ultimately present in P7 (Tachibana et al., 2016) and P21 (Hanna et al., 2025) retinas, suggestive of a developmental defect. (lines 184-187).

      (2) Figure 1B, 1H: On what data are these two figures based? The plots suggest that a high-density time series of gene expression and rod photoreceptor birth was performed, yet it is not clear where and how this was done. The authors should provide the data, plot individual data points, and, if applicable perform a statistical analysis to support their idea that glycolytic gene expression (as a surrogate for glycolysis) overlaps in time with rod photoreceptor birth (Figure 1B) and that in Pten KO the glycolytic gene expression is shifted forward in time (Figure 1H). If the data required to construct these plots (min. 5 data points, min 3 repeats each) does not exist or cannot be generated (e.g. from reanalysis of previously published datasets), then these graphs should be removed.

      We have removed the previous Figure 1B and Figure 1H.

      (3) Figure 2E: Which PKM isozyme was analyzed here? Does the genetic analysis allow us to distinguish between PKM1 and PKM2? Since PKM governs the key rate-limiting step of glycolysis but was not significantly upregulated, does this not contradict the authors' main hypothesis? If PKM at some point was inhibited (see also below comment to Figure 5) one would expect an accumulation of glycolytic intermediates, including phosphoenolpyruvate. Was such an effect observed?

      The data in Figure 2E is bulk RNA-seq data. Since there is only a single Pkm gene that is alternatively spliced, the RNA-sequencing data cannot distinguish between the four PK isozymes that arise from alternative splicing. Specifically, we used Illumina NextSeq 500 for sequencing of 75bp Single-End reads that will sequence transcripts for alternatively spliced Pkm1 and Pkm2 mRNAs, which carry a common 3’end. We added a statement to this effect: “However, since we employed 75 bp single-end sequencing, we could not distinguish between alternatively spliced Pkm1 and Pkm2 mRNAs.“ (lines 215-216).

      We have not performed metabolic analyses of glycolytic intermediates, but we have proposed such a strategy as an important avenue of investigation for future studies in the Discussion: “Lastly, an important caveat to our study is that metabolism changes ex vivo versus in vivo, and thus, in the future, in vivo studies can be performed to assess metabolic changes.” (lines 591-593).

      (4) Figure 3 and materials & methods: For the retinal explant cultures, was the RPE included in the cultured explants? If so, how can the authors distinguish drug effects on neuroretina and RPE? If the RPE was not included, then the authors should discuss how the missing RPE - neuroretina interaction could have influenced their results.

      We remove the RPE from the retinal explants, as indicated in the Methods section. The RPE is a metabolic hub that allows transport of nutrients for the retina, so in the absence of the RPE, there is not an immediate source of energy, such as glucose, to the retina. However, the media (DMEM) contains 25 mM glucose to replace the RPE as an energy source, and we now show that RPCs express GLUT1, which allows uptake of glucose (see new Figure 3A).

      We added the following sentence “P0 explants were mounted on Nucleopore membranes and cultured on top of retinal explant media, providing a source of nutrients, growth factors and glucose. “(lines 241-243).

      (5) Figure 3: It seems rather odd that, if glycolysis was so important for retinal proliferation, differentiation, and metabolism in general, the inhibition of glycolysis with 2DG should not produce a strong degeneration. However, since 2DG competes with glucose, and must be used at nearly equimolar concentration to block glycolysis in a meaningful way, it is possible that the 2DG concentration used simply was not high enough to substantially inhibit glycolysis. Since the inhibitory effect of 2DG depends on the glucose concentration, the authors should measure and provide the concentration of glucose in the explant culture medium. This value should be given either in results or materials and methods.

      We recently published a manuscript showing that 2DG treatments at the same concentrations employed in this study are effective at reducing lactate production in the developing retina in vivo, which is the expected effect of reduced glycolysis (Hanna et al. 2025. IOVS). However, in this study, we did not observe an impact on cell survival.

      We do not agree that it is necessary to measure glucose in the media since the anti-proliferative effect of 2DG is well known, and we are working in the effective range established by multiple groups. We have clarified that we are in the effective range by adding the following sentences: “2DG is typically used in the range of 5-10 mM in cell culture studies and in general, has anti-proliferative effects. To test whether 2DG treatment was in the effective range, explants were exposed to BrdU, which is incorporated into S-phase cells, for 30 minutes prior to harvesting. 2DG treatment resulted in a dose-dependent inhibition of RPC proliferation as evidenced by a reduction in BrdU<sup>+</sup> cells (Figure 3D), indicating that our treatment was in the effective range.” (lines 246-251).

      (6) Figure 3F: The authors use immunostaining for cleaved, activated caspase-3 to assess the amount of apoptotic cell death. However, there are many different possible mechanisms for neuronal cells to die, the majority of which are caspase-independent. To assess the amount of cell death occurring, the authors should perform a TUNEL assay (which labels apoptotic and non-apoptotic forms of cell death; Grasl-Kraupp et al., Hepatology 21:1465-8, 1995), quantify the numbers of TUNEL-positive cells in the retina, and compare this to the numbers of cells positive for activated caspase-3.

      We agree with the reviewer that there are more ways for a cell to die than just apoptosis, and TUNEL would pick up dying cells that may undergo apoptosis or necrosis, for example, our data with cleaved caspase-3, an executioner protease for apoptosis, provides us with clear evidence of cell death in our different conditions. Since this manuscript is not focused on cell death pathways, we have not performed the additional TUNEL assay.

      (7) Figure 4F and 4I: At post-natal day P7 the rod outer segments (OSs) only just start to grow out and the characteristic, rhodopsin-filled disk stacks are not yet formed. To test whether the PFKB3 gain-of function or the Pten KO has a marked effect on OS formation and length, the authors should perform the same tests on older, more mature retina at a time when rod OS show their characteristic disk structures (e.g. somewhere between P14 to P30). The same applies to the 2DG inhibition on the Pten KO retina.

      The precocious differentiation of rod outer segments observed in P7 Pten-cKO retinas does not persist in adulthood, and instead reflects a developmental acceleration. Indeed, we found that in Pten cKO retinas at 3-, 6- and 12-months of age, rod and cone photoreceptors degenerate, and cone outer segments are shorter (Hanna et al., 2025; Tachibana et al., 2016). These data demonstrate that Pten is required to support rod and cone survival.

      (8) Figure 5: Lowering media pH is a rather coarse and untargeted intervention that will have multiple metabolic consequences independent of PKM2. It is thus hardly possible to attribute the effects of pH manipulation to any specific enzyme. To assess this and possibly confirm the results obtained with low pH, the authors should perform a targeted inhibition experiment, for instance using Shikonin (Chen et al., Oncogene 30:4297-306, 2011), to selectively inhibit PKM2. If the retinal explant cultures contained the RPE, an additional question would be how the changes in RPE would alter lactate flux and metabolization between RPE and neuroretina (see also question 4 above).

      We have reframed the rationale for the pH manipulation experiments, highlighting the importance of pH in cell fate specification, and indicating that the aggregation of PKM2 is only one possible effect of lower pH.

      We wrote: “Given that altered glycolysis influences intracellular pH, which in turn controls cell fate decisions, we set out to assess the impact of manipulating pH on cell fate selection in the retina. One of the expected impacts of lowering pH was the aggregation of PKM2, a rate-limiting enzyme for glycolysis, which aggregates in reversible, inactive amyloids (Cereghetti et al., 2024).” (lines 362-366). 

      We have also added a discussion point “Whether pH manipulations also impact the stability of other retinal proteins, such as PKM2, can be further investigated in the future using specific PKM2 inhibitors, such as Shikonin (Chen et al., 2011). (lines 545-547).

      (9) Figure 5G: As for Figure 3F, the authors should perform TUNEL assays to assess the number of cells dying independent of caspase-3.

      Please see response to point 6.

      (10) Figure 7E: In the figure legend "K" should read "E". From the figure and the legend, it is not clear to which cell type this diagram should refer. This must be specified. Importantly, the insulin-dependent glucose-transporter 4 (GLUT4) highlighted in Figure 7E, while expressed on inner retinal vasculature endothelial cells, is not expressed in retinal neurons. What GLUTs exactly are expressed in what retinal neurons may still be to some extent contentious (cf. Chen et al., elife, https://doi.org/10.7554/eLife.91141.3 ; and reviewer comments therein), yet RPE cells clearly express GLUT1, photoreceptors likely express GLUT3, Müller glia cells may express GLUT1, while horizontal cells likely express GLUT2 (Yang et al., J Neurochem. 160:283-296, 2022).’

      We have removed this summary schematic for simplicity.

      (11) Materials and methods: The retinal explant culture system must be described in more detail. Important questions concern the use of medium and serum for which the providers, order numbers, and batch/lot numbers (whichever is applicable) must be given. The glucose concentration in the medium (including the serum content) should be measured. A key concern is whether the explants were cultivated submerged into the medium - this would prevent sufficient oxygenation and drive metabolism towards glycolysis (i.e. the Pasteur effect) - or whether they were cultivated on top of the liquid medium, at the interface between air and liquid (i.e. a situation that would favor OXPHOS).

      We have added further detail to the methods section for the explant assay (lines 686-689). We cultured the retinal explants on membranes on top of the media, which is the standard methodology in the field and in our laboratory (Cantrup et al., 2012; Tachibana et al., 2016; Touahri et al., 2024). Typically, RPCs undergo aerobic glycolysis, meaning that even in the presence of oxygen, they still prefer glycolysis rather than OXPHOS. We demonstrated that 2DG blocks RPC proliferation when treated with 2DG, indicating that RPCs are indeed favoring glycolysis in our assay system.

      (12) A point the authors may want to discuss additionally is the potential relevance of their data for the pathogenesis of human diseases, especially early developmental defects such as they occur in oxygen-induced retinopathy of prematurity.

      We would like to thank the reviewer for their valuable comment. Given that retinopathy of prematurity (ROP) is primarily vascular in nature, and we have not investigated vascular defects in this study, we have elected not to add a discussion of ROP to our manuscript.

      Minor points

      (1) Please add a label indicating the ages of the retina to images showing the entire retina (i.e. "P7"; e.g. in Figures 1F, 3, 4D, 5, etc.).

      Figure 1:

      1D: E18.5 indicated at the bottom of the two panels

      1F – P0 is indicated at the bottom of the two panels.

      Figure 3C-H: P0 explant stage and days of culture indicated

      Figure 4D: E12.5 BrdU and P7 harvest date indicated

      Figure 5C-H: P0 explant stage and days of culture indicated

      Figure 7A-E: P0 explant stage and days of culture indicated

      (2) The term Ctnnb1 should be introduced also in the abstract.

      We now state that Ctnnb1 encodes for b-catenin in the abstract.

      (3) Line 249: "...remaining..." should probably read "...remained...".

      Changed (now line 260).

      (4) Line 381: The sentence "...correlating with the propensity of some RPCs to continue to proliferate while others to differentiate.", should probably be rewritten to something like "...correlating with the propensity of some RPCs to continue to proliferate while others differentiate.".

      We have corrected this sentence.

      (5) The structure of the discussion might benefit from the introduction of subheadings.

      We have introduced subheadings.

      Reviewer #3 (Recommendations for the authors):

      (1) Figure 1H shows the kinetics of rod photoreceptor production as accelerated, but does not represent the fact that fewer rods are ultimately produced, which appears to be the case from the data. If so, the Pten cKO curve should probably be lower than WT to reflect that difference.

      We have removed this graph (as per Reviewer #2, point 2).

      (2) KEGG analysis also showed that the HIF-1 signaling pathway is altered in the Pten cKO retina. What is the significance of that, and is it related to metabolic dysregulation? It has been shown that lactate can promote vessel growth, which initiates at birth in the mouse retina.

      We have added some information on HIF-1 to the Discussion. “The increased glycolytic gene expression in Pten-cKO retinas is likely tied to the increased expression of hypoxia-induced-factor-1-alpha (Hif1a), a known target of mTOR signaling that transcriptionally activates Slc1a3 (GLUT1) and glycolytic genes (Hanna et al., 2022). Indeed, mTOR signaling is hyperactive in Pten-cKO retinas (Cantrup et al., 2012; Tachibana et al., 2016; Tachibana et al., 2018; Touahri et al., 2024), and likewise, in Tsc1-cKO retinas, which also increase glycolysis via HIF-1A (Lim et al., 2021).” (lines 489-494).

      Cantrup, R., Dixit, R., Palmesino, E., Bonfield, S., Shaker, T., Tachibana, N., Zinyk, D., Dalesman, S., Yamakawa, K., Stell, W. K., Wong, R. O., Reese, B. E., Kania, A., Sauve, Y., & Schuurmans, C. (2012). Cell-type specific roles for PTEN in establishing a functional retinal architecture. PLoS One, 7(3), e32795. https://doi.org/10.1371/journal.pone.0032795

      Cereghetti, G., Kissling, V. M., Koch, L. M., Arm, A., Schmidt, C. C., Thüringer, Y., Zamboni, N., Afanasyev, P., Linsenmeier, M., Eichmann, C., Kroschwald, S., Zhou, J., Cao, Y., Pfizenmaier, D. M., Wiegand, T., Cadalbert, R., Gupta, G., Boehringer, D., Knowles, T. P. J., Mezzenga, R., Arosio, P., Riek, R., & Peter, M. (2024). An evolutionarily conserved mechanism controls reversible amyloids of pyruvate kinase via pH-sensing regions. Dev Cell. https://doi.org/10.1016/j.devcel.2024.04.018

      Chen, J., Xie, J., Jiang, Z., Wang, B., Wang, Y., & Hu, X. (2011). Shikonin and its analogs inhibit cancer cell glycolysis by targeting tumor pyruvate kinase-M2. Oncogene, 30(42), 4297-4306. https://doi.org/10.1038/onc.2011.137

      Hanna, J., Touahri, Y., Pak, A., David, L. A., van Oosten, E., Dixit, R., Vecchio, L. M., Mehta, D. N., Minamisono, R., Aubert, I., & Schuurmans, C. (2025). Pten Loss Triggers Progressive Photoreceptor Degeneration in an mTORC1-Independent Manner. Invest Ophthalmol Vis Sci, 66(3), 45. https://doi.org/10.1167/iovs.66.3.45

      Tachibana, N., Cantrup, R., Dixit, R., Touahri, Y., Kaushik, G., Zinyk, D., Daftarian, N., Biernaskie, J., McFarlane, S., & Schuurmans, C. (2016). Pten Regulates Retinal Amacrine Cell Number by Modulating Akt, Tgfbeta, and Erk Signaling. J Neurosci, 36(36), 9454-9471. https://doi.org/10.1523/JNEUROSCI.0936-16.2016

      Touahri, Y., Hanna, J., Tachibana, N., Okawa, S., Liu, H., David, L. A., Olender, T., Vasan, L., Pak, A., Mehta, D. N., Chinchalongporn, V., Balakrishnan, A., Cantrup, R., Dixit, R., Mattar, P., Saleh, F., Ilnytskyy, Y., Murshed, M., Mains, P. E., Kovalchuk, I., Lefebvre, J. L., Leong, H. S., Cayouette, M., Wang, C., Sol, A. D., Brand, M., Reese, B. E., & Schuurmans, C. (2024). Pten regulates endocytic trafficking of cell adhesion and Wnt signaling molecules to pattern the retina. Cell Rep, 43(4), 114005. https://doi.org/10.1016/j.celrep.2024.114005

    1. eLife Assessment

      This landmark study describes the structure of the human RAD51 filament with a recombination intermediate called the displacement loop (D-loop). Using cryogenic structural, biochemical, and single-molecule analyses, the authors provide compelling evidence on how the RAD51 filament promotes strand exchange between single-stranded and double-stranded DNAs. The work will be of interest to the community of homologous recombination and DNA repair, as well as genome stability more generally.

    2. Reviewer #1 (Public review):

      Summary:

      The paper describes the cryoEM structure of RAD51 filament on the recombination intermediate. In the RAD51 filament, the insertion of a DNA-binding loop called the L2 loop stabilizes the separation of the complementary strand for the base-pairing with an incoming ssDNA and the non-complementary strand, which is captured by the second DNA-binding channel called the site II. The molecular structure of the RAD51 filament with a recombination intermediate provides a new insight into the mechanism of homology search and strand exchange between ssDNA and dsDNA.

      Strengths:

      This is the first human RAD51 filament structure with a recombination intermediate called the D-loop. The work has been done with great care, and the results shown in the paper are compelling based on cryo-EM and biochemical analyses. The paper is really nice and important for researchers in the field of homologous recombination, which gives a new view on the molecular mechanism of RAD51-mediated homology search and strand exchange.

      Weaknesses:

      The authors need more careful text writing. Without page and line numbers, it is hard to give comments.

    3. Reviewer #2 (Public review):

      Summary:

      Homologous recombination (HR) is a critical pathway for repairing double-strand DNA breaks and ensuring genomic stability. At the core of HR is the RAD51-mediated strand-exchange process, in which the RAD51-ssDNA filament binds to homologous double-stranded DNA (dsDNA) to form a characteristic D-loop structure. While decades of biochemical, genetic, and single-molecule studies have elucidated many aspects of this mechanism, the atomic-level details of the strand-exchange process remained unresolved due to a lack of atomic-resolution structure of RAD51 D-loop complex.<br /> In this study, the authors achieved this by reconstituting a RAD51 mini-filament, allowing them to solve the RAD51 D-loop complex at 2.64 Å resolution using a single particle approach. The atomic resolution structure reveals how specific residues of RAD51 facilitate the strand exchange reaction. Ultimately, this work provides unprecedented structural insight into the eukaryotic HR process and deepens the understanding of RAD51 function at the atomic level, advancing the broader knowledge of DNA repair mechanisms.

      Strengths:

      The authors overcame the challenge of RAD51's helical symmetry by designing a minifilament system suitable for single-particle cryo-EM, enabling them to resolve the RAD51 D-loop structure at 2.64 Å without imposed symmetry. This high resolution revealed precise roles of key residues, including F279 in Loop 2, which facilitates strand separation, and basic residues on site II that capture the displaced strand. Their findings were supported by mutagenesis, strand exchange assays, and single-molecule analysis, providing strong validation of the structural insights.

      Weaknesses:

      Despite the detailed structural data, some structure-based mutagenesis data interpretation lacks clarity. Additionally, the proposed 3′-to-5′ polarity of strand exchange relies on assumptions from static structural features, such as stronger binding of the 5′-arm-which are not directly supported by other experiments. This makes the directional model compelling but contradicts several well-established biochemical studies that support a 5'-to-3' polarity relative to the complementary strand (e.g., Cell 1995, PMID: 7634335; JBC 1996, PMID: 8910403; Nature 2008, PMID: 18256600).

      Overall:

      The 2.6 Å resolution cryoEM structure of the RAD51 D-loop complex provides remarkably detailed insights into the residues involved in D-loop formation. The high-quality cryoEM density enables precise placement of each nucleotide, which is essential for interpreting the molecular interactions between RAD51 and DNA. Particularly, the structural analysis highlights specific roles for key domains, such as the N-terminal domain (NTD), in engaging the donor DNA duplex.

      This structural interpretation is further substantiated by single-molecule fluorescence experiments using the KK39,40AA NTD mutant. The data clearly show a significant reduction in D-loop formation by the mutant compared to wild-type, supporting the proposed functional role of the NTD observed in the cryoEM model.

      However, the strand exchange activity interpretation presented in Figure 5B could benefit from a more rigorous experimental design. The current assay measures an increase in fluorescence intensity, which depends heavily on the formation of RAD51-ssDNA filaments. As shown in Figure S6A, several mutants exhibit reduced ability to form such filaments, which could confound the interpretation of strand exchange efficiency. To address this, the assay should either: (1) normalize for equivalent levels of RAD51-ssDNA filaments across samples, or (2) compare the initial rates of fluorescence increase (i.e., the slope of the reaction curve), rather than endpoint fluorescence, to better isolate the strand exchange activity itself.

      Based on the structural features of the D-loop, the authors propose that strand pairing and exchange initiate at the 3'-end of the complementary strand in the donor DNA and proceed with a 3'-to-5' polarity. This conclusion, drawn from static structural observations, contrasts with several well-established biochemical studies that support a 5'-to-3' polarity relative to the complementary strand (e.g., Cell 1995, PMID: 7634335; JBC 1996, PMID: 8910403; Nature 2008, PMID: 18256600). While the structural model is compelling and methodologically robust, this discrepancy underscores the need for further experiments.

    4. Reviewer #3 (Public review):

      Summary:

      Built on their previous pioneer expertise in studying RAD51 biology, in this paper, the authors aim to capture and investigate the structural mechanism of human RAD51 filament bound with a displacement loop (D-loop), which occurs during the dynamic synaptic state of the homologous recombination (HR) strand-exchange step. As the structures of both pre- and post-synaptic RAD51 filaments were previously determined, a complex structure of RAD51 filaments during strand exchange is one of the key missing pieces of information for a complete understanding of how RAD51 functions in the HR pathway. This paper aims to determine the high-resolution cryo-EM structure of RAD51 filament bound with the D-loop. Combined with mutagenesis analysis and biophysical assays, the authors aim to investigate the D-loop DNA structure, RAD51-mediated strand separation and polarity, and a working model of RAD51 during HR strand invasion in comparison with RecA.

      Strengths:

      (1) The structural work and associated biophysical assays in this paper are solid, elegantly designed, and interpreted.  These results provide novel insights into RAD51's function in HR.

      (2) The DNA substrate used was well designed, taking into consideration the nucleotide number requirement of RAD51 for stable capture of donor DNA. This DNA substrate choice lays the foundation for successfully determining the structure of the RAD51 filament on D-loop DNA using single-particle cryo-EM.

      (3) The authors utilised their previous expertise in capping DNA ends using monomeric streptavidin and combined their careful data collection and processing to determine the cryo-EM structure of full-length human RAD51 bound at the D-loop in high resolution. This interesting structure forms the core part of this work and allows detailed mapping of DNA-DNA and DNA-protein interaction among RAD51, invading strands, and donor DNA arms (Figures 1, 2, 3, 4). The geometric analysis of D-loop DNA bound with RAD51 and EM density for homologous DNA pairing is also impressive (Figure S5). The previously disordered RAD51's L2-loop is now ordered and traceable in the density map and functions as a physical spacer when bound with D-loop DNA. Interestingly, the authors identified that the side chain position of F279 in the L2_loop of RAD51_H differs from other F279 residues in L2-loops of E, F, and G protomers. This asymmetric binding of L2 loops and RAD51_NTD binding with donor DNA arms forms the basis of the proposed working model about the polarity of csDNA during RAD51-mediated strand exchange.

      (4) This work also includes mutagenesis analysis and biophysical experiments, especially EMSA, single-molecule fluorescence imaging using an optical tweezer, and DNA strand exchange assay, which are all suitable methods to study the key residues of RAD51 for strand exchange and D-loop formation (Figure 5).

      Weaknesses:

      (1) The proposed model for the 3'-5' polarity of RAD51-mediated strand invasion is based on the structural observations in the cryo-EM structure. This study lacks follow-up biochemical/biophysical experiments to validate the proposed model compared to RecA or developing methods to capture structures of any intermediate states with different polarity models.

      (2) The functional impact of key mutants designed based on structure has not been tested in cells to evaluate how these mutants impact the HR pathway.

      The significance of the work for the DNA repair field and beyond:

      Homologous recombination (HR) is a key pathway for repairing DNA double-strand breaks and involves multiple steps. RAD51 forms nucleoprotein filaments first with 3' overhang single-strand DNA (ssDNA), followed by a search and exchange with a homologous strand. This function serves as the basis of an accurate template-based DNA repair during HR. This research addressed a long-standing challenge of capturing RAD51 bound with the dynamic synaptic DNA and provided the first structural insight into how RAD51 performs this function. The significance of this work extends beyond the discovery of biology for the DNA repair field, into its medical relevance. RAD51 is a potential drug target for inhibiting DNA repair in cancer cells to overcome drug resistance. This work offers a structural understanding of RAD51's function with the D-loop and provides new strategies for targeting RAD51 to improve cancer therapies.

    5. Author response:

      Public Reviews:

      Reviewer #1 (Public review):

      Summary:

      The paper describes the cryoEM structure of RAD51 filament on the recombination intermediate. In the RAD51 filament, the insertion of a DNA-binding loop called the L2 loop stabilizes the separation of the complementary strand for the base-pairing with an incoming ssDNA and the non-complementary strand, which is captured by the second DNA-binding channel called the site II. The molecular structure of the RAD51 filament with a recombination intermediate provides a new insight into the mechanism of homology search and strand exchange between ssDNA and dsDNA.

      Strengths:

      This is the first human RAD51 filament structure with a recombination intermediate called the D-loop. The work has been done with great care, and the results shown in the paper are compelling based on cryo-EM and biochemical analyses. The paper is really nice and important for researchers in the field of homologous recombination, which gives a new view on the molecular mechanism of RAD51-mediated homology search and strand exchange.

      Weaknesses:

      The authors need more careful text writing. Without page and line numbers, it is hard to give comments.

      We would like to thank the reviewer for their kind words of appreciation of our work.

      Reviewer #2 (Public review):

      Summary:

      Homologous recombination (HR) is a critical pathway for repairing double-strand DNA breaks and ensuring genomic stability. At the core of HR is the RAD51-mediated strand-exchange process, in which the RAD51-ssDNA filament binds to homologous double-stranded DNA (dsDNA) to form a characteristic D-loop structure. While decades of biochemical, genetic, and single-molecule studies have elucidated many aspects of this mechanism, the atomic-level details of the strand-exchange process remained unresolved due to a lack of atomic-resolution structure of RAD51 D-loop complex.

      In this study, the authors achieved this by reconstituting a RAD51 mini-filament, allowing them to solve the RAD51 D-loop complex at 2.64 Å resolution using a single particle approach. The atomic resolution structure reveals how specific residues of RAD51 facilitate the strand exchange reaction. Ultimately, this work provides unprecedented structural insight into the eukaryotic HR process and deepens the understanding of RAD51 function at the atomic level, advancing the broader knowledge of DNA repair mechanisms.

      Strengths:

      The authors overcame the challenge of RAD51's helical symmetry by designing a minifilament system suitable for single-particle cryo-EM, enabling them to resolve the RAD51 D-loop structure at 2.64 Å without imposed symmetry. This high resolution revealed precise roles of key residues, including F279 in Loop 2, which facilitates strand separation, and basic residues on site II that capture the displaced strand. Their findings were supported by mutagenesis, strand exchange assays, and single-molecule analysis, providing strong validation of the structural insights.

      Weaknesses:

      Despite the detailed structural data, some structure-based mutagenesis data interpretation lacks clarity. Additionally, the proposed 3′-to-5′ polarity of strand exchange relies on assumptions from static structural features, such as stronger binding of the 5′-arm-which are not directly supported by other experiments. This makes the directional model compelling but contradicts several well-established biochemical studies that support a 5'-to-3' polarity relative to the complementary strand (e.g., Cell 1995, PMID: 7634335; JBC 1996, PMID: 8910403; Nature 2008, PMID: 18256600).

      Overall:

      The 2.6 Å resolution cryoEM structure of the RAD51 D-loop complex provides remarkably detailed insights into the residues involved in D-loop formation. The high-quality cryoEM density enables precise placement of each nucleotide, which is essential for interpreting the molecular interactions between RAD51 and DNA. Particularly, the structural analysis highlights specific roles for key domains, such as the N-terminal domain (NTD), in engaging the donor DNA duplex.

      This structural interpretation is further substantiated by single-molecule fluorescence experiments using the KK39,40AA NTD mutant. The data clearly show a significant reduction in D-loop formation by the mutant compared to wild-type, supporting the proposed functional role of the NTD observed in the cryoEM model.

      However, the strand exchange activity interpretation presented in Figure 5B could benefit from a more rigorous experimental design. The current assay measures an increase in fluorescence intensity, which depends heavily on the formation of RAD51-ssDNA filaments. As shown in Figure S6A, several mutants exhibit reduced ability to form such filaments, which could confound the interpretation of strand exchange efficiency. To address this, the assay should either: (1) normalize for equivalent levels of RAD51-ssDNA filaments across samples, or (2) compare the initial rates of fluorescence increase (i.e., the slope of the reaction curve), rather than endpoint fluorescence, to better isolate the strand exchange activity itself.

      Based on the structural features of the D-loop, the authors propose that strand pairing and exchange initiate at the 3'-end of the complementary strand in the donor DNA and proceed with a 3'-to-5' polarity. This conclusion, drawn from static structural observations, contrasts with several well-established biochemical studies that support a 5'-to-3' polarity relative to the complementary strand (e.g., Cell 1995, PMID: 7634335; JBC 1996, PMID: 8910403; Nature 2008, PMID: 18256600). While the structural model is compelling and methodologically robust, this discrepancy underscores the need for further experiments.

      We would like to thank the reviewer for highlighting the importance of our findings to our understanding of the mechanism of homologous recombination.

      We agree with the reviewer that the reduced filament-forming ability of some of the RAD51 mutants complicates a straightforward interpretation of their strand-exchange assay. Interestingly, the RAD51 mutants that appear most impaired are the esDNA-capture mutants that do not contact the ssDNA in the structure of the pre-synaptic filament. However, the RAD51 NTD mutants, that display the most severe defect in strand-exchange, have a near-WT filament forming ability.

      The reviewer correctly points out that the polarity of strand exchange by RecA and RAD51 is an extensively researched topic that has been characterised in several authoritative studies. In our paper, we simply describe the mechanistic insights obtained from the structural D-loop models of RAD51 (our work) and RecA (Yang et al, PMID: 33057191).The structures illustrate a very similar mechanism of D-loop formation that proceeds with opposite polarity of strand exchange for RAD51 and RecA. Comparison of the D-loop structures for RecA and RAD51 provides an attractive explanation for the opposite polarity, as caused by the different positions of their dsDNA-binding domains in the filament structure. We agree with the reviewer that further investigation will be needed for an adequate rationalisation of the available evidence. We will mention the relevant literature in the revised version of the manuscript.

      Reviewer #3 (Public review):

      Summary:

      Built on their previous pioneer expertise in studying RAD51 biology, in this paper, the authors aim to capture and investigate the structural mechanism of human RAD51 filament bound with a displacement loop (D-loop), which occurs during the dynamic synaptic state of the homologous recombination (HR) strand-exchange step. As the structures of both pre- and post-synaptic RAD51 filaments were previously determined, a complex structure of RAD51 filaments during strand exchange is one of the key missing pieces of information for a complete understanding of how RAD51 functions in the HR pathway. This paper aims to determine the high-resolution cryo-EM structure of RAD51 filament bound with the D-loop. Combined with mutagenesis analysis and biophysical assays, the authors aim to investigate the D-loop DNA structure, RAD51-mediated strand separation and polarity, and a working model of RAD51 during HR strand invasion in comparison with RecA.

      Strengths:

      (1) The structural work and associated biophysical assays in this paper are solid, elegantly designed, and interpreted.  These results provide novel insights into RAD51's function in HR.

      (2) The DNA substrate used was well designed, taking into consideration the nucleotide number requirement of RAD51 for stable capture of donor DNA. This DNA substrate choice lays the foundation for successfully determining the structure of the RAD51 filament on D-loop DNA using single-particle cryo-EM.

      (3) The authors utilised their previous expertise in capping DNA ends using monomeric streptavidin and combined their careful data collection and processing to determine the cryo-EM structure of full-length human RAD51 bound at the D-loop in high resolution. This interesting structure forms the core part of this work and allows detailed mapping of DNA-DNA and DNA-protein interaction among RAD51, invading strands, and donor DNA arms (Figures 1, 2, 3, 4). The geometric analysis of D-loop DNA bound with RAD51 and EM density for homologous DNA pairing is also impressive (Figure S5). The previously disordered RAD51's L2-loop is now ordered and traceable in the density map and functions as a physical spacer when bound with D-loop DNA. Interestingly, the authors identified that the side chain position of F279 in the L2_loop of RAD51_H differs from other F279 residues in L2-loops of E, F, and G protomers. This asymmetric binding of L2 loops and RAD51_NTD binding with donor DNA arms forms the basis of the proposed working model about the polarity of csDNA during RAD51-mediated strand exchange.

      (4) This work also includes mutagenesis analysis and biophysical experiments, especially EMSA, single-molecule fluorescence imaging using an optical tweezer, and DNA strand exchange assay, which are all suitable methods to study the key residues of RAD51 for strand exchange and D-loop formation (Figure 5).

      Weaknesses:

      (1) The proposed model for the 3'-5' polarity of RAD51-mediated strand invasion is based on the structural observations in the cryo-EM structure. This study lacks follow-up biochemical/biophysical experiments to validate the proposed model compared to RecA or developing methods to capture structures of any intermediate states with different polarity models.

      (2) The functional impact of key mutants designed based on structure has not been tested in cells to evaluate how these mutants impact the HR pathway.

      The significance of the work for the DNA repair field and beyond:

      Homologous recombination (HR) is a key pathway for repairing DNA double-strand breaks and involves multiple steps. RAD51 forms nucleoprotein filaments first with 3' overhang single-strand DNA (ssDNA), followed by a search and exchange with a homologous strand. This function serves as the basis of an accurate template-based DNA repair during HR. This research addressed a long-standing challenge of capturing RAD51 bound with the dynamic synaptic DNA and provided the first structural insight into how RAD51 performs this function. The significance of this work extends beyond the discovery of biology for the DNA repair field, into its medical relevance. RAD51 is a potential drug target for inhibiting DNA repair in cancer cells to overcome drug resistance. This work offers a structural understanding of RAD51's function with the D-loop and provides new strategies for targeting RAD51 to improve cancer therapies.

      We thank the reviewer for their positive comments on the significance of our work. Concerning the proposed polarity of strand exchange based on our structural finding, please see our reply to the previous reviewer; we agree with the reviewer that further experimentation will be needed to reach a settled view on this.

      Testing the functional effects of the RAD51 mutants on HR in cells was not an aim of the current work but we agree that it would be a very interesting experiment, which would likely provide further important insights into the mechanism of strand exchange at the core of the HR reaction.

    1. eLife Assessment

      This important study by Lee et al. investigates the heterogeneous response of non-growing bacteria to the antimicrobial peptide (AMP) tachyplesin. In this response, a subpopulation of bacteria limits the accumulation of a fluorescent analog of the AMP, avoiding lethal damage. The study provides compelling evidence of the reduced susceptibility to the antimicrobial peptide antibiotic tachyplesin in a subpopulation of cells characterized by reduced drug accumulation. The evidence on the underlying molecular mechanisms is solid.

    2. Reviewer #1 (Public review):

      Summary:

      This work contributes several important and interesting observations regarding the heterotolerance of non-growing Escherichia coli and Pseudomonas aeruginosa to the antimicrobial peptide tachyplesin. The primary mechanism of action of tachyplesin is thought to be disruption of the bacterial cell envelope, leading to leakage of cellular contents after a threshold level of accumulation. Although the MIC for tachyplesin in exponentially growing E. coli is just 1 ug/ml, the authors observe that a substantial fraction of a stationary phase population of bacteria survives much higher concentrations, up to 64 ug/ml. By using a fluorescently labelled analogue of tachyplesin, the authors show that the amount of per-cell intracellular accumulation of tachyplesin displays a bimodal distribution, and that the fraction of "low accumulators" correlates with the fraction of survivors. Using a microfluidic device, they show that low accumulators exclude propidium iodide, suggesting that their cell envelopes remain largely intact, while high accumulators of tachyplesin also stain with propidium iodide. They show that this phenomenon holds for several clinical isolates of E. coli with different genetic determinants of antibiotic resistance, and for a strain of Pseudomonas aeruginosa. However, the bimodal distribution does not occur in these organisms for several other antimicrobial peptides, or for tachyplesin in Klebsiella pneumoniae or Staphylococcus aureus, indicating some degree of specificity in the interaction between AMP and bacterial cell envelope. They next explore the dynamics of the fluorescent tachyplesin accumulation and show interestingly that a high degree of accumulation is initially seen in all cells, but that the "low accumulator" subpopulation manages to decrease the amount of intracellular fluorescence over time, while the "high accumulator"subpopulation continues to increase its intracellular fluorescence. Focusing on increased efflux as a hypothesised mechanism for the "low accumulator" phenotype, based on transcriptomic analysis of the two subpopulations, the authors screen putative efflux inhibitors to see if they can block the formation of the low accumulator subpopulation. They find that both the protonophore CCCP and the SSRI sertraline can block the formation of this subpopulation and that a combination of sertraline plus tachyplesin kills a greater fraction of the stationary phase cells than either agent alone, similar to the killing observed when growing cells are treated with tachyplesin.

      Strengths:

      This study provides new insight into the heterogeneous behaviours of non-growing bacteria when exposed to an antimicrobial peptide, and into the dynamics of their response. The single-cell analysis by FACS and microscopy is compelling. The results provide a much-needed single cell perspective on the phenomenon of tolerance to AMPs and a good starting point for further exploration.

      Weaknesses:

      The authors have substantially improved the clarity of the manuscript and have added additional experiments to probe further the location of the AMP relative to low and high accumulators, and the physiological states of these sub-populations. These experiments strengthen the assertion that low accumulators keep the AMP at the cell surface while high accumulators permit intracellular access to the AMP.

      However, many questions still remain about the physiological characterisation of the "low accumulator" cells. While the evidence presented does support an induced response that removes the AMP from the interior of the cell, no clear mechanism for this is favoured by the experiments presented.

      A double deletion of acrA and tolC (two out of the three components of the major constitutive RND efflux pump) reduces the appearance of the low accumulator phenotype, but interestingly, the single deletions have no effect, and a well-characterised inhibitor of RND efflux pumps also has no effect. The authors identify a two-component system, qseCB, that appears necessary for the appearance of low accumulators, but this system has pleiotropic effects on many cellular systems, with only tenuous connections to efflux. The selected pharmacological agents that could prevent the appearance of low accumulators do not offer clear insight into the mechanism by which low accumulators arise, because they have diverse modes of action.

      The transcriptomics data collected for low and high accumulator sub-populations are interesting, but in my opinion, the conclusions that can be drawn from these data remain overstated. It is not possible to make any claims about the total amount of "protein synthesis, energy production, and gene expression" on the basis of RNA-Seq data. The reads from each sample are normalised, so there is no information about the total amount of transcript. Many elements of total cellular activity are post-transcriptionally regulated, so it is impossible to assess from transcriptomics alone. Finally, the transcriptomic data are analysed in aggregated clusters of genes that are enriched for biological processes, for example: "Cluster 2 included processes involved in protein synthesis, energy production, and gene expression that were downregulated to a greater extent in low accumulators than high accumulators". However, this obscures the fact that these clusters include genes that are generally inhibitory of the process named, as well as genes that facilitate the process.

      The authors have added an experiment to attempt to assess overall metabolic activity in the low accumulator and high accumulator populations, which is a welcome addition. They apply the redox dye resazurin and observe lower resorufin (reduced form) fluorescence in the low accumulator population, which they take to indicate a lower respiration rate. This seems possible, however, an important caveat is that they have shown the low accumulator population to retain substantially lower amounts of multiple different fluorescent molecules (tachyplesin-NBD, propidium iodide, ethidium bromide) intracellularly compared to the high accumulator population. It seems possible that the low accumulator population is also capable of removing resazurin or resorufin from the intracellular space, regardless of metabolic rate. Indeed, it has previously been shown that efflux by RND efflux pumps influences resazurin reduction to resorufin in both P. aeruginosa and E. coli. By measuring only the retained redox dye using flow cytometry, the results may be confounded by the demonstrated ability of the low accumulator population to remove various fluorescent dyes. More work is needed to strongly support broad conclusions about the physiological states of the low and high accumulator populations.

      The phenomenon of the emergence of low accumulators, which are phenotypically tolerant to the antimicrobial peptide tachyplesin, is interesting and important even if there is still work to be done to understand the mechanism by which it occurs.

    3. Reviewer #2 (Public review):

      Summary:

      This study reports on the existence of subpopulations of isogenic E. coli and P. aeruginosa cells that are tolerant to the antimicrobial peptide tachyplesin and are characterized by accumulation of low levels of a fluorescent tachyplesin-NBD conjugate. The authors then set out to address the molecular mechanisms, providing interesting insights even though the mechanism remains incompletely defined: The work demonstrates that increased efflux may cause this phenotype, putatively together with other changes in membrane lipid composition. The authors further demonstrate that pharmacological manipulation can prevent generation of tolerance. The authors are cautious in their interpretation and the claims made are largely justified by the data.

      Strengths:

      Going beyond the commonly used bulk techniques for studying susceptibility to AMPs , Lee et al. used of fluorescent antibiotic conjugates in combination with flow cytometry analysis to study variability in drug accumulation at the single cell level. This powerful approach enabled the authors to expose bimodal drug accumulation pattern that were condition dependent, but conserved across a variety of E. coli clinical isolates. Using cell sorting in combination with colony-forming unit assays as well as quantitative fluorescence microscopic analysis in a microfludics-setup the authors compellingly demonstrate that low accumulators (where fluorescence signal is mostly restricted to the membrane), can survive antibiotic treatment, whereas high accumulators (with high intracellular fluorescence) were killed.

      The relevance of efflux for the ´low accumulator´ phenotype and its survival is convincingly demonstrated by the following lines of evidence: i) A time-course experiment on tachyplesin-NBD pre-loaded cells revealed that all cells initially were high accumulators, before a subpopulation of cells subsequently managed to reduce signal intensity, demonstrating that the ´low accumulator´ phenotype is an induced response and not a pre-existing property. Ii) Double-mutants deficient in the delta acrA delta tolC double-KO, which showed reduced levels of low accumulators´. Interestingly, ´low accumulator´populations were nearly abrogated in bacteria deficient in the qse quorum sensing system, suggesting its centrality for the tachyplesin response. Even though this system may control acrA, the strength of the phenotype may suggest that it may control additional as-of-yet unidenitified factors relevant in the response to tachyplesin. Iii) treatment with efflux pump inhibitor sertraline and verapamil (even though some caution needs to be taken since it is not perfectly selective, see weakness) prevents generation of low accumulators. The observation that sertraline enhances tachyplesin-based killing is an important basis for developing combination therapies.

      The study convincingly illustrates how susceptibility to tachyplesin adaptively changes in a heterogeneous way dependent on the growth phases and nutrient availability. This is highly relevant also beyond the presented example of tachyplesin and similar subpopulation-based adaptive changes to the susceptibility towards antimicrobial peptides or other drugs may occur during infections in vivo and they would likely be missed by standardized in vitro susceptibility testing.

      Weaknesses:

      Some mechanistic questions regarding tachyplesin-accumulation and survival remain. One general shortcoming of the setup of the transcriptomics experiment is that the tachyplesin-NBD probe itself has antibiotic efficacy and induces phenotypes (and eventually cell death) in the ´high accumulator´ cells. As the authors state themselves, this makes it challenging to interpret whether any differences seen between the two groups are causative for the observed accumulation pattern of if they are a consequence of differential accumulation and downstream phenotypic effects.

      I have a few minor concerns regarding new data that was added during the revision:

      - The statement ´ Moreover, we found that the fluorescence of low accumulators decreased over time when bacteria were treated with 20 μg mL´ is, in my opinion, not supported by the data shown in Figure S4C. That figure shows that the abundance of ´low accumulator´ cells decreases over time. Following the rationale that protease K treatment may cleave surface-associated/extracellular tachyplesin-NDB, this should lead to a shift of ´low accumulator´population to the left, indicating reduced fluorescence intensity per cell. This is not so case, but the population just disappears. However, after 120 min of treatment more cells appear in the ´high accumulator´ state. This result is somewhat puzzling.

      - The authors used the metabolic dye resazurin to measure the metabolic activity of low vs. high accumulators. I am not entirely convinced that the lower fluorescence resorufin-fluorescence in tachyplesin-NBD accumulators really indicates lower metabolic activity, since a cell's fluorescence levels would also be affected by the cellular uptake and efflux. It appears plausible that the lower resorufin-fluorescence may result from reduced accumulation/increased efflux in the´low-tachyplesin NBD´ population.

      Comment on revisions: All my previous comments have been satisfactorily addressed by the authors.

    4. Reviewer #3 (Public review):

      Summary:

      This important study shows that stationary phase bacteria survive antimicrobial peptide treatment by switching on efflux pumps, generating low accumulating subpopulations that evade killing-a finding with clear implications for the design of peptide based antibiotics and for researchers studying antimicrobial resistance. The evidence is solid and frequently convincing, as diverse single cell assays, genetics and chemical inhibition coherently link reduced intracellular peptide to survival, even though a few mechanistic details warrant further exploration.

      Strengths:

      The authors investigate how Escherichia coli (and, to a lesser extent, Pseudomonas aeruginosa) survive exposure to the antimicrobial peptide (AMP) tachyplesin. Because resistance to AMPs is thought to rely heavily on non genetic adaptations rather than on classical mutation based mechanisms, the study focuses on phenotypic heterogeneity and seeks to pinpoint the cellular processes that protect a subset of cells. Using fluorescently labelled tachyplesin, single cell imaging, flow cytometry, transcriptomics, targeted genetics, and chemical perturbations, the authors report that stationary phase cultures harbor two phenotypic states: high accumulating cells that die and low accumulating cells that survive. They further propose and show that inducible efflux activity is the primary driver of survival and show that either efflux inhibition (sertraline, verapamil) or nutrient supplementation prevents the emergence of low accumulators and boosts killing.<br /> The experiments unambiguously reveal that the cells respond to stress heterogeneously, with two distinct subpopulations - one with better survival than the other. This primary phenotype is convincingly shown across various E. coli strains, including clinical isolates. The authors probed the underlying mechanism from several angles, with important additional experiments in the revised version that strengthens the original conclusions in several ways. Newly added efflux assays with ethidium bromide, together with proteinase treatment experiments and ΔacrAΔtolC and ΔqseB/qseC mutant data, illustrate that the low accumulating subpopulation can actively export intracellular compounds. The authors took great care to temper their language to acknowledge other potential alternatives that could explain some of the data such as altered influx, vesicle release or proteolysis, metabolic activity of the cells, indirect effects of sertraline treatment, etc. Additional metabolic dye measurements confirm that low accumulators are less metabolically active, and a new data on nutrient supplementation shows that forcing growth increases peptide uptake and lethality. The authors clarify the crucial point of where antimicrobial peptides actually bind on the cell within the broader survival mechanism and present their conclusions, along with potential caveats, with commendable clarity.

      Weaknesses:

      Despite these advances, the contribution of efflux may require more direct evidence to further dissect whether efflux is necessary, sufficient, or contributory. The facts that the key low-efflux mutant still retains a small fraction of survivors and that the inhibitors used may cause other physiological changes leading to higher efflux are still unaccounted for. The lipidomic and vesicle findings, while intriguing, remain descriptive, and direct tests of their functional relevance would further solidify the mechanistic models.

      Conclusion:

      Even with these limitations, the study provides valuable insight into non genetic resistance mechanisms to AMPs and highlights inducible heterogeneity as a critical obstacle to peptide therapeutics. In a much broader context, this study also underscores the importance of efflux physiology even for those antimicrobials that seemingly would not have intracellular targets.

    5. Author response:

      The following is the authors’ response to the original reviews

      Reviewer 1:

      (1) The initial high accumulation by all cells followed by the emergence of a sub-population that has reduced its intracellular levels of tachyplesin is a key observation and I agree with the authors' conclusion that this suggests an induced response to the AMP is important in facilitating the bimodal distribution. However, I think the conclusion that upregulated efflux is driving the reduction in signal in the "low accumulator" subpopulation is not fully supported. Steady-state amounts of intracellular fluorescent AMP are determined by the relative rates of influx and efflux and a decrease could be caused by decreasing influx (while efflux remained unchanged), increasing efflux (while influx remained unchanged), or both decreasing influx and increasing efflux. Given the transcriptomic data suggest possible changes in the expression of enzymes that could affect outer membrane permeability and outer membrane vesicle formation as well as efflux, it seems very possible that changes to both influx and efflux are important. The "efflux inhibitors" shown to block the formation of the low accumulator subpopulation have highly pleiotropic or incompletely characterised mechanisms of action so they also do not exclusively support a hypothesis of increased efflux.

      We agree with the reviewer that the emergence of low accumulators after 30 min in the presence of extracellular tachyplesin-NBD (Figure 4A) could be due to either decreased influx while efflux remained unchanged, increased efflux while influx remained unchanged, or both decreasing influx and increasing efflux. Increased proteolytic activity or increased secretion of OMVs could also play a role.

      We have now acknowledged that “Reduced intracellular accumulation of tachyplesin-NBD in the presence of extracellular tachyplesin-NBD could be due to decreased drug influx, increased drug efflux, increased proteolytic activity or increased secretion of OMVs.” (lines 313-315).

      However, the emergence of low accumulators after 60 min in the absence of extracellular tachyplesin-NBD in our efflux assays (Figure 4C) cannot be due to decreased influx while efflux remained unchanged because of the absence of extracellular tachyplesin-NBD. We acknowledge that in our original manuscript we did not explicitly state that the efflux assays reported in Figure 4C-D were performed in the absence of tachyplesin-NBD in the extracellular environment. We have now clarified this point in our manuscript, we have added illustrations in Figure 4A, 4C-D and we have also carried out efflux assays using ethidium bromide (EtBr) to further support our conclusions about the primary role played by efflux in reducing tachyplesin accumulation in low accumulators. We have added the following paragraphs to our revised manuscript:

      “Next, we performed efflux assays using ethidium bromide (EtBr) by adapting a previously described protocol [62]. Briefly, we preloaded stationary phase E. coli with EtBr by incubating cells at a concentration of 254 µM EtBr in M9 medium for 90 min. Cells were then pelleted and resuspended in M9 to remove extracellular EtBr. Single-cell EtBr fluorescence was measured at regular time points in the absence of extracellular EtBr using flow cytometry. This analysis revealed a progressive homogeneous decrease of EtBr fluorescence due to efflux from all cells within the stationary phase E. coli population (Figure S13A). In contrast, when we performed efflux assays by preloading cells with tachyplesin-NBD (46 μg mL<sup>-1</sup> or 18.2 μM), followed by pelleting and resuspension in M9 to remove extracellular tachyplesin-NBD, we observed a heterogeneous decrease in tachyplesin-NBD fluorescence in the absence of extracellular tachyplesin-NBD: a subpopulation retained high tachyplesin-NBD fluorescence, i.e. high accumulators; whereas another subpopulation displayed decreased tachyplesin-NBD fluorescence, 60 min after the removal of extracellular tachyplesin-NBD (Figure 4B). Since these assays were performed in the absence of extracellular tachyplesin-NBD, decreased tachyplesin-NBD fluorescence could not be ascribed to decreased drug influx or increased secretion of OMVs in low accumulators, but could be due to either enhanced efflux or proteolytic activity in low accumulators.

      Next, we repeated efflux assays using EtBr in the presence of 46 μg mL<sup>-1</sup> (or 20.3 µM) extracellular tachyplesin-1. We observed a heterogeneous decrease of EtBr fluorescence with a subpopulation retaining high EtBr fluorescence (i.e. high tachyplesin accumulators) and another population displaying reduced EtBr fluorescence (i.e. low tachyplesin accumulators, Figure S14B) when extracellular tachyplesin-1 was present. Moreover, we repeated tachyplesin-NBD efflux assays in the presence of M9 containing 50 μg mL<sup>-1</sup> (244 μM) carbonyl cyanide m-chlorophenyl hydrazone (CCCP), an ionophore that disrupts the proton motive force (PMF) and is commonly employed to abolish efflux and found that all cells retained tachyplesin-NBD fluorescence (Figure S15B). However, it is important to note that CCCP does not only abolish efflux but also other respiration-associated and energy-driven processes [63].

      Taken together, our data demonstrate that in the absence of extracellular tachyplesin, stationary phase E. coli homogeneously efflux EtBr, whereas only low accumulators are capable of performing efflux of intracellular tachyplesin after initial tachyplesin accumulation. In the presence of extracellular tachyplesin, only low accumulators can perform efflux of both intracellular tachyplesin and intracellular EtBr. However, it is also conceivable that besides enhanced efflux, low accumulators employ proteolytic activity, OMV secretion, and variations to their bacterial membrane to hinder further uptake and intracellular accumulation of tachyplesin in the presence of extracellular tachyplesin.”

      These amendments can be found on lines 316-350 and in the new Figure S13 and Figure 4. We have also carried out more tachyplesin-NBD accumulation assays using single and double gene-deletion mutants lacking efflux components, please see Response 3 to reviewer 2 and the data reported in Figure 4B.

      (2) A conclusion of the transcriptomic analysis is that the lower accumulating subpopulation was exhibiting "a less translationally and metabolically active state" based on less upregulation of a cluster of genes including those involved in transcription and translation. This conclusion seems to borrow from well-described relationships referred to as bacterial growth laws in which the expression of genes involved in ribosome production and translation is directly related to the bacterial growth (and metabolic) rate. However, the assumptions that allow the formulation of the bacterial growth laws (balanced, steady state, exponential growth) do not hold in growth arrest. A non-growing cell could express no genes at all or could express ribosomal genes at a very low level, or efflux pumps at a high level. The distribution of transcripts among the functional classes of genes does not reveal anything about metabolic rates within the context of growth arrest - it only allows insight into metabolic rates when the constraint of exponential growth can be assumed. Efflux pumps can be highly metabolically costly; for example, Tn-Seq experiments have repeatedly shown that mutants for efflux pump gene transcriptional repressors have strong fitness disadvantages in energy-limited conditions. There are no data presented here to disprove a hypothesis that the low accumulators have high metabolic rates but allocate all of their metabolic resources to fortifying their outer membranes and upregulating efflux. This could be an important distinction for understanding the vulnerabilities of this subpopulation. Metabolic rates can be more directly estimated for single cells using respiratory dyes or pulsed metabolic labelling, for example, and these data could allow deeper insight into the metabolic rates of the two subpopulations. My main recommendation for additional experiments to strengthen the conclusions of the paper would be to attempt to directly measure metabolic or translational activity in the high- and low-accumulating populations. I do not think that the transcriptomic data are sufficient to draw conclusions about this but it would be interesting to directly measure activity. Otherwise, it might be reasonable to simply soften the language describing the two populations as having different activity levels. They do seem to have different transcriptional profiles, and this is already an interesting observation.

      We agree with the reviewer that it might be misleading to draw conclusions on bacterial metabolic states solely based on transcriptomic data. We have therefore removed the statement “low accumulators displayed a less translationally and metabolically active state”. We have instead stated the following: “Our transcriptomics analysis showed that low tachyplesin accumulators downregulated protein synthesis, energy production, and gene expression processes compared to high accumulators”. Moreover, we have employed the membrane-permeable redox-sensitive dye C<sub>12</sub>-resazurin, which is reduced to the fluorescent C<sub>12</sub>-resorufin in metabolically active cells, to obtain a more direct estimate of the metabolic state of low and high accumulators of tachyplesin. We have added the following paragraph reporting our new data:

      “Our transcriptomics analysis also showed that low tachyplesin accumulators downregulated protein synthesis, energy production, and gene expression compared to high accumulators. To gain further insight on the metabolic state of low tachyplesin accumulators, we employed the membrane-permeable redox-sensitive dye, resazurin, which is reduced to the highly fluorescent resorufin in metabolically active cells. We first treated stationary phase E. coli with 46 μg mL<sup>-1</sup> (18.2 μM) tachyplesin-NBD for 60 min, then washed the cells, and then incubated them in 1 μM resazurin for 15 min and measured single-cell fluorescence of resorufin and tachyplesin-NBD simultaneously via flow cytometry. We found that low tachyplesin-NBD accumulators also displayed low fluorescence of resorufin, whereas high tachyplesin-NBD accumulators also displayed high fluorescence of resorufin (Figure S16), suggesting lower metabolic activity in low tachyplesin-NBD accumulators.”

      These amendments can be found on lines 398-408 and in Figure S16.

      (3) The observation that adding nutrients to the stationary phase cultures pushes most of the cells to the "high accumulator" state is presented as support of the hypothesis that the high accumulator state is a higher metabolism/higher translational activity state. However, it is important to note that adding nutrients will cause most or all of the cells in the population to start to grow, thus re-entering the familiar regime in which bacterial growth laws apply. This is evident in the slightly larger cell sizes seen in the nutrient-amended condition. In contrast to stationary phase cells, growing cells largely do not exhibit the bimodal distribution, and they are much more sensitive to tachyplesin, as demonstrated clearly in the supplement. Growing cells are not necessarily the same as the high-accumulating subpopulation of non-growing cells.

      Following the reviewer’s suggestion, we are no longer using the nutrient supplementation data to support the hypothesis that high accumulators possess higher metabolism or translational activity.

      The nutrient supplementation data is now only used to investigate whether tachyplesin-NBD accumulation and efficacy can be increased, and not to show that high tachyplesin-NBD accumulators are more metabolically or translationally active.

      Furthermore, our previous statement “Our data suggests that such slower-growing subpopulations might display lower antibiotic accumulation and thus enhanced survival to antibiotic treatment.” has now been removed from the discussion.

      (4) It might also be worth adding some additional context around the potential to employ efflux inhibitors as therapeutics. It is very clear that obtaining sufficient antimicrobial drug accumulation within Gram-negative bacteria is a substantial barrier to effective treatments, and large concerted efforts to find and develop therapeutic efflux pump inhibitors have been undertaken repeatedly over the last 25 years. Sufficiently selective inhibitors of bacterial efflux pumps with appropriate drug-like properties have been challenging to find and none have entered clinical trials. Multiple psychoactive drugs have been shown to impact efflux in bacteria but usually using concentrations in the 10-100 uM range (as here). Meanwhile, the Ki values for their human targets are usually in the sub- to low-nanomolar range. The authors rightly note that the concentration of sertraline they have used is higher than that achieved in patients, but this is by many orders of magnitude, and it might be worth expanding a bit on the substantial challenge of finding efflux inhibitors that would be specific and non-toxic enough to be used therapeutically. Many advances in structural biology, molecular dynamics, and medicinal chemistry may make the quest for therapeutic efflux inhibitors more fruitful than it has been in the past but it is likely to remain a substantial challenge.

      We agree with this comment and we have now added the following statement:

      “This limitation underscores the broader challenge of identifying EPIs that are both effective and minimally toxic within clinically achievable concentrations, while also meeting key therapeutic criteria such as broad-spectrum efficacy against diverse efflux pumps, high specificity for bacterial targets, and non-inducers of AMR [117]. However, advances in biochemical, computational, and structural methodologies hold the potential to guide rational drug design, making the search for effective EPIs more promising [118]. Therefore, more investigation should be carried out to further optimise the use of sertraline or other EPIs in combination with tachyplesin and other AMPs.”

      This amendment can be found on lines 535-542.

      (5) My second recommendation is that the transcriptomic data should be made available in full and in a format that is easier for other researchers to explore. The raw data should also be uploaded to a sequence repository, such as the NCBI Geo database or the EMBL ENA. The most useful format for sharing transcriptomic data is a table (such as an excel spreadsheet) of transcripts per million counts for each gene for each sample. This allows other researchers to do their own analyses and compare expression levels to observations from other datasets. When only fold change data are supplied, data cannot be compared to other datasets at all, because they are relative to levels in an untreated control which are not known. The cluster analysis is one way of gaining insight into biological function revealed by transcriptional profile, but it can hide interesting additional complexities. For example, rpoS is named as one of the transcription-associated genes that are higher in the high accumulator subpopulation and evidence of generally increased activity. But RpoS is the stress sigma factor that drives much lower levels of expression generally than the housekeeping sigma factor RpoD, even though it recognises many of the same promoters (and some additional stress-specific promoters). Therefore, increased RpoS occupancy of RNAP would be expected to result in overall lower levels of transcription. However, it is also true that the transcript level for the rpoS gene is a particularly poor indicator of expression - rpoS is largely post-transcriptionally regulated. More generally, annotations are always evolving and key functional insights related to each gene might change in the future, so the results are a more durable resource if they are presented in a less analysed form as well as showing the analysis steps. It can also be important to know which genes were robustly expressed but did not change, versus genes that were not detected.

      Sequencing data associated with this study have now been uploaded and linked under NCBI BioProject accession number PRJNA1096674 (https://www.ncbi.nlm.nih.gov/bioproject/PRJNA1096674).

      We have added this link to the methods under subheading “Accession Numbers” on lines 858-860. Additionally, transcripts per million counts for each gene for each sample have been added to the Figure 3 - Source Data file as requested by the reviewer.

      (6) In the introduction, the susceptibility of AMP efficacy to resistance mechanisms is discussed:

      "However, compared to small molecule antimicrobials, AMP resistance genes typically confer smaller increases in resistance, with polymyxin-B being a notable exception 7, 8. Moreover, mobile resistance genes against AMPs are relatively rare, and horizontal acquisition of AMP resistance is hindered by phylogenetic barriers owing to functional incompatibility with the new host bacteria9, again with plasmid-transmitted polymyxin resistance being a notable exception."

      It seems worth pointing out that polymixins are the only AMPs that can reasonably be compared with small molecule antibiotics in terms of resistance acquisition since they are the only AMPs that have been widely used as drugs and therefore had similar chances to select for resistance among diverse global microbial populations.

      We have now clarified that we are referring to laboratory evolutionary analyses of resistance towards small molecule antibiotics and AMPs (Spohn et al., 2019) and that polymyxins are the only AMPs that have been used in antibiotic treatment to date.

      We have added the following statement to address this point:

      “Bacteria have developed genetic resistance to AMPs, including proteolysis by proteases, modifications in membrane charge and fluidity to reduce affinity, and extrusion by AMP transporters. However, compared to small molecule antimicrobials, AMP resistance genes typically confer smaller increases in resistance in experimental evolution analyses, with polymyxin-B and CAP18 being notable exceptions [8]. Moreover, mobile resistance genes against AMPs are relatively rare and horizontal acquisition of AMP resistance is hindered by phylogenetic barriers owing to functional incompatibility with the new host bacteria [9]. Plasmid-transmitted polymyxin resistance constitutes a notable exception [10], possibly because polymyxins are the only AMPs that have been in clinical use to date [9].”

      This amendment can be found on lines 57-65.

      (7) In the description of Figure 4, " tachyplesin monotherapy" is mentioned. It is not really appropriate to describe the treatment of a planktonic culture of bacteria in a test tube as a therapy since there is no host that is benefitting.

      We have now replaced “tachyplesin monotherapy” with “tachyplesin treatment”.

      (8) In the discussion, it is stated that " tachyplesin accumulates intracellularly only in bacteria that do not survive tachyplesin exposure" but this is clearly not true. All bacteria accumulate tachyplesin intracellularly initially, but if the bacteria are non-growing during the exposure, some of them are able to reduce their intracellular levels. The fraction of survivors is roughly correlated with the fraction of bacteria that do not maintain high intracellular levels of tachyplesin and that do not stain with propidium iodide, but for any given cell it seems that there is no clear point at which a high intracellular level of tachyplesin means that it will definitely not survive.

      We have now clarified this statement as follows: “We show that after an initial homogeneous tachyplesin accumulation within a stationary phase E. coli population, tachyplesin is retained intracellularly by bacteria that do not survive tachyplesin exposure, whereas tachyplesin is retained only in the membrane of bacteria that survive tachyplesin exposure.”

      This amendment can be found on lines 443-446.

      (9) Also in the discussion: " Our data suggests that such slower-growing subpopulations might display lower antibiotic accumulation and thus enchanced [sic] survival to antibiotic treatment." This does not really relate to the results here because the bimodal distributions were primarily studied in the absence of growth. In the LB/exponential growth situations where the population was growing but a very small subpopulation of low accumulators was observed, no measurements were made to indicate subpopulation growth rates.

      We have now removed this statement from the manuscript.

      (10) In discussion, L-Ara4N appears to be referred to as both positively charged and negatively charged; this should be clarified.

      We have now clarified that L-Ara4N is positively charged.

      This amendment can be found on line 496.

      (11) Discussion of TF analysis seems to overstate what is supported by the evidence. The correlation of up- and downregulated genes with previously described TF regulons (probably measured in very different conditions) does not really demonstrate TF activity. This could be measured directly with additional experiments but in the absence of those experiments claims about detecting TF activity should probably be avoided. The attempts to directly demonstrate the importance of those transcription factors to the observed accumulation activity were not successful.

      We have now removed from the discussion the previous paragraph related to the TF analysis. We have also modified the results section reported the TF analysis as follows: “Next, we sought to infer transcription factor (TF) activities via differential expression of their known regulatory targets [61]. A total of 126 TFs were inferred to exhibit differential activity between low and high accumulators (Data Set S4). Among the top ten TFs displaying higher inferred activity in low accumulators compared to high accumulators, four regulate transport systems, i.e. Nac, EvgA, Cra, and NtrC (Figure S12). However, further experiments should be carried out to directly measure the activity of these TFs.”

      Finally, we have also moved the TFs’ data from Figure 3 to Figure S12 in the Supplementary information.

      These amendments can be found on lines 288-293.

      (12) When discussing the possibility of nutrient supplementation versus efflux inhibition as a potential therapeutic strategy, it could be noted that nutrient supplementation cannot be done in many infection contexts. The host immune system and host/bacterial cell density control nutrient access.

      We have now added the following statement: “Moreover, nutrient supplementation as a therapeutic strategy may not be viable in many infection contexts, as host density and the immune system often regulate access to nutrients [3]”.

      These amendments can be found on lines 553-555.

      Reviewer 2:

      (1) Some questions regarding the mechanism remain. One shortcoming of the setup of the transcriptomics experiment is that the tachyplesin-NBD probe itself has antibiotic efficacy and induces phenotypes (and eventually cell death) in the ´high accumulator´cells. This makes it challenging to interpret whether any differences seen between the two groups are causative for the observed accumulation pattern or if they are a consequence of differential accumulation and downstream phenotypic effects.

      We agree with the reviewer and we have now acknowledged that “tachyplesin-NBD has antibiotic efficacy (see Figure 2) and has an impact on the E. coli transcriptome (Figure 3). Therefore, we cannot conclude whether the transcriptomic differences reported between low and high accumulators of tachyplesin-NBD are causative for the distinct accumulation patterns or if they are a consequence of differential accumulation and downstream phenotypic effects.”

      These amendments can be found on lines 283-287.

      (2) It would be relevant to test and report the MIC of sertraline for the strain tested, particularly since in Figure 4G an initial reduction in CFUs is observed for sertraline treatment, which suggests the existence of biological effects in addition to efflux inhibition.

      We have now measured the MIC of sertraline against E. coli BW25113 finding the MIC value to be 128 μg mL<sup>-1</sup> (418 µM). This value is more than four times higher compared to the sertraline concentration employed in our study, i.e. 30 μg mL<sup>-1</sup> (98 μM).

      These amendments can be found on lines 389-391 and data has been added to Figure 4 – Source Data.

      (3) The role of efflux systems is further supported by the finding that efflux pump inhibitors sensitize E. coli to tachyplesin and prevent the occurrence of the tolerant ´low accumulator´ subpopulations. In principle, this is a great way of validating the role of efflux pumps, but the limited selectivity of these inhibitors (CCCP is an uncoupling agent, and for sertraline direct antimicrobial effects on E. coli have been reported by Bohnert et al.) leaves some ambiguity as to whether the synergistic effect is truly mediated via efflux pump inhibition. To strengthen the mechanistic angle of the work analysis of tachyplesin-NBD accumulation in mutants of the identified efflux components would be interesting.

      We have now performed tachyplesin-NBD accumulation assays using 28 single and 4 double E. coli BW25113 gene-deletion mutants of efflux components and transcription factors regulating efflux. While for the majority of the mutants we recorded bimodal distributions of tachyplesin-NBD accumulation similar to the distribution recorded for the E. coli BW25113 parental strain (Figure 4B and Figure S13), we found unimodal distributions of tachyplesin-NBD accumulation constituted only of high accumulators for both DqseB and DqseBDqseC mutants as well as reduced numbers of low accumulators for the DacrADtolC mutant (Figure 4B). Considering that the AcrAB-TolC tripartite RND efflux system is known to confer genetic resistance against AMPs like protamine and polymyxin-B [29,30] and that the quorum sensing regulators qseBC might control the expression of acrA [64] , these data further corroborate the hypothesis that low accumulators can efflux tachyplesin and survive treatment with this AMP.

      These amendments can be found on lines 351-361, in the new Figure 4B and in the new Figure S14.

      Moreover, we have also carried out further efflux assays with both ethidium bromide and tachyplesin-NBD to further demonstrate the role of efflux in reduced accumulation of tachyplesin as well as acknowledging that other mechanisms (i.e reduced influx, increased protease activity or increased secretion of OMVs) could play an important role, please see Response 1 to Reviewer 1.

      (4) The authors imply that protease could contribute to the low accumulator mechanism. Proteases could certainly cleave and thus inactivate AMPs/tachyplesin, but would this effect really lead to a reduction in fluorescence levels since the fluorophore itself would not be affected by proteolytic cleavage?

      We agree with the reviewer that nitrobenzoxadiazole (NBD) might not be cleaved by proteases that inactivate tachyplesin and other AMPs. Therefore, inactivation of tachyplesin by proteases might not affect cellular fluorescence levels unless efflux of NBD is possible following the cleavage of tachyplesin-NBD. We have therefore removed the statement “Conversely, should efflux or proteolytic activities by proteases underpin the functioning of low accumulators, we should observe high initial tachyplesin-NBD fluorescence in the intracellular space of low accumulators followed by a decrease in fluorescence due to efflux or proteolytic degradation.” We have now stated the following: “Low accumulators displayed an upregulation of peptidases and proteases compared to high accumulators, suggesting a potential mechanism for degrading tachyplesin (Table S1 and Data Set S3).”

      These amendments can be found on lines 280-282.

      (5) To facilitate comparison with other literature (e.g. papers on sertraline) it would be helpful to state compound concentrations also as molar concentrations.

      We have now added the molar concentrations alongside all instances where concentrations are stated in μg mL<sup>-1</sup>.

      (6) The authors tested a series of efflux pump inhibitors and found that CCCP and sertraline prevented the generation of the low accumulator subpopulation, whereas other inhibitors did not. An overview and discussion of the known molecular targets and mode of action of the different selected inhibitors could reveal additional insights into the molecular mechanism underlying the synergy with tachyplesin.

      We have now added molecular targets and mode of action of the different inhibitors where known. “Moreover, we repeated tachyplesin-NBD efflux assays in the presence of M9 containing 50 μg mL<sup>-1</sup> (244 μM) carbonyl cyanide m-chlorophenyl hydrazone (CCCP), an ionophore that disrupts the proton motive force (PMF) and is commonly employed to abolish efflux and found that all cells retained tachyplesin-NBD fluorescence (Figure S15B). However, it is important to note that CCCP does not only abolish efflux but also other respiration-associated and energy-driven processes [63].” And “Interestingly, M9 containing 30 µg mL<sup>-1</sup> (98 μM) sertraline (Figure 4D and S15C), an antidepressant which inhibits efflux activity of RND pumps, potentially through direct binding to efflux pumps [65] and decreasing the PMF [66], or 50 µg mL<sup>-1</sup> (110 μM) verapamil (Figure S15D), a calcium channel blocker that inhibits MATE transporters [67] by a generally accepted mechanism of PMF generation interference [68,69], was able to prevent the emergence of low accumulators. Furthermore, tachyplesin-NBD cotreatment with sertraline simultaneously increased tachyplesin-NBD accumulation and PI fluorescence levels in individual cells (Figure 4E and F, p-value < 0.0001 and 0.05, respectively). The use of berberine, a natural isoquinoline alkaloid that inhibits MFS transporters [70] and RND pumps [71], potentially by inhibiting conformational changes required for efflux activity [70], and baicalein, a natural flavonoid compound that inhibits ABC [72] and MFS [73,74] transporters, potentially through PMF dissipation [75], prevented the formation of a bimodal distribution of tachyplesin accumulation, however displayed reduction in fluorescence of the whole population (Figure S15E and F). Phenylalanine-arginine beta-naphthylamide (PAbN), a synthetic peptidomimetic compound that inhibits RND pumps [76] through competitive inhibition [77], reserpine, an indole alkaloid that inhibits ABC and MFS transporters, and RND pumps [78], by altering the generation of the PMF [69], and 1-(1-naphthylmethyl)piperazine (NMP), a synthetic piperazine derivative that inhibits RND pumps [79], through non-competitive inhibition [80], did not prevent the emergence of low accumulators (Figure S15G-I).”

      These amendments can be found on lines 337-342 and 367-385.

      (7) Page 8. The term ´medium accumulators´ for a 1:1 mix of low and high accumulators is misleading.

      We have now replaced the term “medium accumulators” with “a 1:1 (v/v) mixture of low and high accumulators”.

      These amendments to the description can be found on lines 238-239.

      (8) Figure 3. It may be more appropriate to rephrase the title of the figure to ´biological processes associated with low tachyplesin accumulation´ (rather than ´facilitate accumulation´). The same applies to the section title on page 8.

      We have amended the title of Figure 3 as requested by the reviewer.

      (9) The fact that the low accumulation phenotype depends on the growth media and conditions and can be prevented by nutrients is highly relevant. I would encourage the authors to consider showing the corresponding data in the main manuscript rather than in the SI.

      We have created a new Figure 5, displaying the impact of the nutritional environment and bacterial growth phase on both tachyplesin-NBD accumulation and efficacy.

      (10) In the discussion the authors state´ Heterogeneous expression of efflux pumps within isogenic bacterial populations has been reported 29,32,33,67-69. However, recent reports have suggested that efflux is not the primary mechanism of antimicrobial resistance within stationary-phase bacteria 31,70.´. In light of the authors´ findings that the response to tachyplesin is induced by exposure and is not pre-selected, could they speculate on why this specific response can be induced in stationary, but not exponential cells? Could there be a combination of pre-existing traits and induced responses at play? Could e.g. the reduced growth rate/metabolism in these cells render these cells less susceptible to the intracellular effects of tachyplesin and slow down the antibiotic efficacy, giving the cells enough time to mount additional protective responses that then lead to the low accumulation phenotype?

      We have now acknowledged that it is conceivable that other pre-existing traits of low accumulators also contribute to reduced tachyplesin accumulation. For example, reduced protein synthesis, energy production and gene expression in low accumulators could slow down tachyplesin efficacy, giving low accumulators more time to mount efflux as an additional protective response.

      “As our accumulation assay did not require the prior selection for phenotypic variants, we have demonstrated that low accumulators emerge subsequent to the initial high accumulation of tachyplesin-NBD, suggesting enhanced efflux as an induced response. However, it is conceivable that other pre-existing traits of low accumulators also contribute to reduced tachyplesin accumulation. For example, reduced protein synthesis, energy production, and gene expression in low accumulators could slow down tachyplesin efficacy, giving low accumulators more time to mount efflux as an additional protective response.”

      This amendment can be found on lines 482-489.

      (11) In the abstract: Is it true that low accumulators ´sequester´ the drug in their membrane? In my understanding ´sequestering´ would imply that low accumulators would bind higher levels of tachyplesin-NBD in their membrane compared to high accumulators (and thereby preventing it from entering the cells). According to Figure 1 J, K, it rather seems that the fluorescent signal around the membrane is also stronger in high accumulators.

      We have now removed the sentence “low accumulators sequester the drug in their membrane” from the abstract. We have instead stated: “These phenotypic variants display enhanced efflux activity to limit intracellular peptide accumulation.”

      These amendments can be found on lines 34-35.

      Reviewer 3:

      (1) The authors' claims about high efflux being the main mechanism of survival are unconvincing, given the current data. There can be several alternative hypotheses that could explain their results, such as lower binding of the AMP, lower rate of internalization, metabolic inactivity, etc. It is unclear how efflux can be important for survival against a peptide that the authors claim binds externally to the cell. The addition of efflux assays would be beneficial for clear interpretations. Given the current data, the authors' claims about efflux being the major mechanism in this resistance are unconvincing (in my humble opinion). Some direct evidence is necessary to confirm the involvement of efflux. The data with CCCP in Figure 4C can only indicate accumulation, not efflux. The authors are encouraged to perform direct efflux assays using known methods (e.g., PMIDs 20606071, 30981730, etc.). Figure 4A: The data does not support the broad claims about efflux. First, if the peptide is accumulated on the outside of the outer membrane, how will efflux help in survival? The dynamics shown in 4A may be due to lower binding, lower entry, or lower efflux. These mechanisms are not dissected here. Second, the heterogeneity can be preexisting or a result of the response to this stress. Either way, whether active efflux or dynamic transcriptomic changes are responsible for these patterns is not clear. Direct efflux assays are crucial to conclude that efflux is a major factor here.

      This important comment is similar in scope to the first comment of reviewer 1 and it is partly due to the fact that we had not clearly explained our efflux assays reported in Figure 4 in the original manuscript. We kindly refer this reviewer to our extensive response 1 to reviewer 1 and corresponding amendments on lines 316-350 and in the new Figure S13 and Figure 4 (reported in the response 1 to reviewer 1 above), where we have now fully addressed this reviewer’s and reviewer 1 concerns, as well as performing new experiments following their important suggestions and the methods described in PMIDs 20606071 suggested by this reviewer.

      (2) The fluorescent imaging experiments can be conducted in the presence of externally added proteases, such as proteinase K, which has multiple cleavage sites on tachyplesin. This would ensure that all the external peptides (both free and bound) are removed. If the signal is still present, it can be concluded that the peptide is present internally. If the peptide is primarily external, the authors need to explain how efflux could help with externally bound peptides. Figure 1J-K: How are the authors sure about the location of the intensity? The peptide can be inside or outside and still give the same signal. To prove that the peptide is inside or outside, a proteolytic cleavage experiment is necessary (proteinase K, Arg-C proteinase, clostripain, etc.).

      We thank the reviewer for this important suggestion.

      We have now performed experiments where stationary phase E. coli was incubated in 46 μg mL<sup>-1</sup> (18.2 μM) tachyplesin-NBD in M9 for 60 min. Next, cells were pelleted and washed to remove extracellular tachyplesin-NBD and then incubated in either M9 or 20 μg mL<sup>-1</sup> (0.7 μΜ) proteinase K in M9 for 120 min. We found that the fluorescence of low accumulators decreased over time in the presence of proteinase K; in contrast, the fluorescence of high accumulators did not decrease over time in the presence of proteinase K. These data therefore suggest that tachyplesin-NBD is present only on the cell membrane of low accumulators and both on the membrane and intracellularly in high accumulators.

      Moreover, confocal microscopy using tachyplesin-NBD along with the membrane dye FM™ 4-64FX further confirmed that tachyplesin-NBD is present only on the cell membrane of low accumulators and both on the membrane and intracellularly in high accumulators.

      These amendments can be found on lines 173-179, lines 188-192 and in the new Figures S4 and S6.

      (3) Further genetic experiments are necessary to test whether efflux genes are involved at all. The genetic data presented by the authors in Figure S11 is crucial and should be further extended. The problem with fitting this data to the current hypothesis is as follows: If specific efflux pumps are involved in the resistance mechanism, then single deletions would cause some changes to the resistance phenotype, and the data in Figure S11 would look different. If there is redundancy (as is the case in many efflux phenotypes), the authors may consider performing double deletions on the major RND regulators (for example, evgA and marA). Additionally, the deletion of pump components such as TolC (one of the few OM components) and adaptors (such as acrA/D) might also provide insights. If the peptide is present in the periplasm, then deletions involving outer components would become important.

      This important comment is similar in scope to the third comment of reviewer 2. We have now performed tachyplesin-NBD accumulation assays using 28 single and 4 double E. coli BW25113 gene-deletion mutants of efflux components and transcription factors regulating efflux. While for the majority of the mutants we recorded bimodal distributions of tachyplesin-NBD accumulation similar to the distribution recorded for the E. coli BW25113 parental strain (Figure 4B and Figure S13), we found unimodal distributions of tachyplesin-NBD accumulation constituted only of high accumulators for both DqseB and DqseBDqseC mutants as well as reduced numbers of low accumulators for the DacrADtolC mutant.

      These amendments can be found on lines 351-361, in the new Figure 4B and in the new Figure S14, please also see our response to comment 3 of reviewer 2.

      (4) Line numbers would have been really helpful. Please mention the size of the peptide (length and spatial) for readers.

      We have now added line numbers to the revised manuscript. The length and molecular weight of tachyplesin-1 have now been added on lines 75.

      (5) Figure S4 is unclear. How were the low accumulators collected? What prompted the low-temperature experiment? The conclusion that it accumulates at the outer membrane is unjustified. Where is the data for high accumulators?

      We have now corrected the results section to state that tachyplesin-NBD accumulates on the cell membranes, rather than at the outer membrane of E. coli cells.

      These amendments can be found on lines 178 and 190.

      We would like to clarify that in Figure S4 we compare the distribution of tachyplesin-NBD single-cell fluorescence at low temperature versus 37 °C across the whole stationary phase E. coli population, we did not collect low accumulators only.

      The low-temperature experiment was prompted by a previous publication paper (Zhou Y et al. 2015: doi: 10.1021/ac504880r. Epub 2015 Mar 24. PMID: 25753586) that showed non-specific adherence of antimicrobials to the bacterial surface occurs at low temperatures and that passive and active transport of antimicrobials across the membrane is significantly diminished. Additionally, there are previous reports that suggest low temperatures inhibit post-binding peptide-lipid interactions, but not the primary binding step (PMID: 16569868; PMCID: PMC1426969; PMID: 3891625; PMCID: PMC262080).

      Therefore, the low-temperature experiment was performed to quantify the fluorescence of cells due to non-specific binding. This quantification allowed us to deduce that fluorescence levels of high accumulators are above the measured non-specific binding fluorescence (measured in the low-temperature experiment for the whole stationary phase E. coli population) is the result of intracellular tachyplesin-NBD accumulation. In contrast, the comparable fluorescence levels between all the cells in the low-temperature experiment and the low accumulator subpopulation at 37 °C suggest that tachyplesin-NBD is predominantly accumulated on the cell membranes of low accumulators instead of intracellularly.

      Please also see our response to comment 2 above for further evidence supporting that tachyplesin-NBD accumulates only on the cell membranes of low accumulators and both on the cell membranes and intracellularly in low accumulators.

      (6) Figure S5: Describe the microfluidic setup briefly. Why did the distribution pattern change (compared to Figure 1A)? Now, there are more high accumulators. Does the peptide get equally distributed between daughter cells?

      We have now added a brief description of the microfluidic setup on lines 182-184.

      The difference in the abundance of low and high accumulators between the microfluidics and flow cytometry measurements is likely due to differences in cell density, i.e. a few cells per channel vs millions of cells in a tube. A second major difference is that tachyplesin-NBD is continuously supplied in the microfluidic device for the entire duration of the experiment, therefore, the extracellular concentration of tachyplesin-NBD does not decrease over time. In contrast, tachyplesin-NBD is added to the tube only at the beginning of the experiment, therefore, the extracellular concentration of tachyplesin-NBD likely decreases in time as it is accumulated by the bacteria. The relative abundance of low and high accumulators changes with the extracellular concentration of tachyplesin-NBD as shown in Figure 1A.

      We have added a sentence to acknowledge this discrepancy on lines 186-187.

      No instances of cell division were observed in stationary phase E. coli in the absence of nutrients in all microfluidics assays. Therefore, we cannot comment on the distribution of tachyplesin-NBD across daughter cells.

      (7) How did the authors conclude this: "tachyplesin accumulation on the bacterial membrane may not be sufficient for bacterial eradication"? It is completely unclear to this reviewer.

      We presented this hypothesis at the end of the section “Tachyplesin accumulates primarily in the membranes of low accumulators” as a link to the following section “Tachyplesin accumulation on the bacterial membranes is insufficient for bacterial eradication” where we test this hypothesis. For clarity, we have now moved this sentence to the beginning of the section “Tachyplesin accumulation on the bacterial membranes is insufficient for bacterial eradication”.

      (8) What is meant by membrane accumulation? Outside, inside, periplasm? Where? Figure 2H conclusions are unjustified. Bacterial killing with many antibiotics is associated with membrane damage, which is an aftereffect of direct antibiotic action. How can the authors state that "low accumulators primarily accumulate tachyplesin-NBD on the bacterial membrane, maintaining an intact membrane, strongly contributing to the survival of the bacterial population"? This reviewer could not find justifications for the claims about the location of the accumulation or cells actively maintaining an intact membrane. Also, PI staining reports damage both membranes.

      Based on the experiments that we have carried out after this reviewer’s suggestions, please see response 2 above, it is likely that tachyplesin-NBD is present only on the bacterial surface, i.e. in or on the outer membrane of low accumulators, considering that their fluorescence decreases during treatment with proteinase K. However, to take a more conservative approach we have now written on the cell membranes throughout the manuscript, i.e. either the outer or the inner membrane.

      We have also rephrased the statement reported by the reviewer as follows:

      “Taken together with PI staining data indicating membrane damage caused by high tachyplesin accumulation, these data demonstrate that low accumulators, which primarily accumulate tachyplesin-NBD on the bacterial membranes, maintain membrane integrity and strongly contribute to the survival of the bacterial population in response to tachyplesin treatment.”

      These amendments can be found on lines 228-232.

      (9) Figure 3: The findings about cluster 2 and cluster 4 genes do not correlate logically. If the cells are in a metabolically low active state, how are the cells getting enough energy for active efflux and membrane transport? This scenario is possible, but the authors must confirm the metabolic activity by measuring respiration rates. Also, metabolically less-active cells may import a lower number of peptides to begin with. That also may contribute to cell survival. Additionally, lowered metabolism is a known strategy of antibiotic survival that is distinctly different from efflux-mediated survival.

      Following this reviewer’s comment and comment 2 of reviewer 1, we have now carried out further experiments to estimate the metabolic activity of low and high accumulators. Please see our response to comment 2 of reviewer 1 above.

      (10) Figure S10: How did the authors test their hypothesis that cardiolipin is involved in the binding of the peptide to the membrane? The transcriptome data does not confirm it. Genetic experiments are necessary to confirm this claim.

      We would like to clarify that we have not set out to test the hypothesis that cardiolipin is involved in the binding of tachyplesin-NBD. We have only stated that cardiolipin could bind tachyplesin due to its negative charge. We have now cited two previous studies that suggest that tachyplesin has an increased affinity for lipids mixtures containing either cardiolipin (Edwards et al. ACS Inf Dis 2017) or PG lipids (Matsuzaki et al. BBA 1991), i.e. the main constituents of cardiolipins.

      These amendments can be found on lines 264-267.

      (11) Figure 4B-F: There are several controls missing. For Sertraline treatment, the authors must test that the metabolic profile, transcriptomic changes, or import of the peptide are not responsible for enhanced survival. CCCP will not only abolish efflux but also many other respiration-associated or all other energy-driven processes.

      Figure 4D presents data acquired in efflux assays in the absence of extracellular tachyplesin-NBD. Therefore, altered tachyplesin-NBD import cannot contribute to the lack of formation of the low accumulator subpopulation.

      We have now acknowledged that it is conceivable that increased tachyplesin efficacy is due to metabolic and transcriptomic changes induced by sertraline.

      These amendments can be found on lines 396-397.

      We have also acknowledged that CCCP does not only abolish efflux but also other respiration-associated and energy-driven processes.

      These amendments can be found on lines 341-342.

    1. eLife Assessment

      This is a well-written important paper on the recovery of fauna and flora following the end-Permian extinction event in several continental sites in northern China. The convincing conclusion, a rapid recovery in tropical riparian ecosystems following a short phase of hostile environments and depauperate biota, is supported by an impressive amount of data from sedimentology, body fossils of animals and plants, and especially trace fossils.

    2. Reviewer #1 (Public review):

      Summary:

      This is a very well-written paper presenting interesting findings related to the recovery following the end-Permian event in continental settings, from N China. The finding is timely as the topic is actively discussed in the scientific community. The data provides additional insights into the faunal, and partly, floral global recovery following the EPE, adding to the global picture.

      Strengths:

      The conclusions are supported by an impressive amount of sedimentological and paleontological data (mainly trace fossils) and illustrations.

    3. Reviewer #2 (Public review):

      Summary:

      The authors made a thorough revision of the manuscript, strengthening the message. They also considered all the comments made by the reviewers and provided appropriate and convincing arguments.

      Strengths:

      The revised manuscript clarifies all the major points raised by the reviewers, and the way the information is presented (in the text, figures and tables) is clear.

      Weaknesses:

      The authors provided an appropriate and convincing rebuttal regarding the potential weakness I pointed out in the first review of the manuscript. Therefore, I do not see any major issue in their work.

    4. Reviewer #3 (Public review):

      Summary:

      The manuscript by Guo and colleagues features the documentation and interpretation of three successions of continental to marginal marine deposits spanning the P/T transition and their respective ichnofaunas. Based on these new data inferences concerning end-Permian mass extinction and Triassic recovery in the tropical realm are discussed.

      Strengths:

      The manuscript is well written and organized and includes a large amount of new lithological and ichnological data that illuminate ecosystem evolution in a time of large scale transition. The lithological documentations, facies interpretations and ichnotaxonomic assignments look alright (with few exceptions).

    5. Author response:

      The following is the authors’ response to the previous reviews

      Public Reviews:

      Reviewer #1 (Public review):

      Summary:

      This is a very well-written paper presenting interesting findings related to the recovery following the end-Permian event in continental settings, from N China. The finding is timely as the topic is actively discussed in the scientific community. The data provides additional insights into the faunal, and partly, floral global recovery following the EPE, adding to the global picture.

      Strengths:

      The conclusions are supported by an impressive amount of sedimentological and paleontological data (mainly trace fossils) and illustrations.

      We thank Reviewer #1 for the positive assessments.

      Weaknesses: [eliminated in revision]

      We thank Reviewer #1.

      Reviewer #2 (Public review):

      Summary:

      The authors made a thorough revision of the manuscript, strengthening the message. They also considered all the comments made by the reviewers and provided appropriate and convincing arguments.

      Strengths:

      The revised manuscript clarifies all the major points raised by the reviewers, and the way the information is presented (in the text, figures and tables) is clear.

      We thank Reviewer #2 for the positive comments on our work.

      Weaknesses:

      The authors provided an appropriate and convincing rebuttal regarding the potential weakness I pointed out in the first review of the manuscript. Therefore, I do not see any major issue in their work.

      Introduction

      (1) P. 2, L. 32: Replace "to migrated" with "to migrate".

      Revised as suggested.

      (2) P. 3, L. 43-44: We recently published a review article on the tetrapod terrestrial record from the Central European Basin, showing that Olenekian tetrapod faunas (and ichnofaunas) were already quite rich and diverse. Article: https://doi.org/10.1016/j.earscirev.2025.105085

      Yes, we have read this paper. This summary is very important for the understanding of the biotic recovery after the PTME, especially in the early stage. We have added the new result in our manuscript.

      (3) P. 3, L. 57: Replace "recovered terrestrial ecosystems in tropical" with "recovered tropical terrestrial ecosystems".

      Revised as suggested.

      Results and Discussion

      (4) P. 6, L. 118: Replace "declined" with "decline".

      Revised as suggested.

      (5) P. 7, L. 131: Replace "microbial" with "microbially".

      Revised as suggested.

      Conclusions

      (6) P. 11, L. 224: Replace "as little as" with "as early as".

      Revised as suggested.

      (7) P. 11, L. 227: Replace "not only results in" with "not only result in".

      Revised as suggested.

      (8) 11, L. 230: Replace "suggesting" with "suggest".

      Revised as suggested.

      Reviewer #3 (Public review):

      Summary:

      This manuscript by Guo and colleagues features the documentation and interpretation of three successions of continental to marginal marine deposits spanning the P/T transition and their respective ichnofaunas. Based on these new data inferences concerning end-Permian mass extinction and Triassic recovery in the tropical realm are discussed.

      Strengths:

      The manuscript is well-written and organized and includes a large amount of new lithological and ichnological data that illuminate ecosystem evolution in a time of large-scale transition. The lithological documentations, facies interpretations, and ichnotaxonomic assignments look okay (with a few exceptions).

      We thank Reviewer #3 for the positive assessments.

      Weaknesses:

      Weaknesses: [all eliminated in revision]

      We thank Reviewer #3.

    1. eLife Assessment

      This study provides a comprehensive exploration of the role of hypothermia of mitigating IL1beta induction and NETosis in the context of lung injury induced by mechanical ventilation. The data are convincing, and the study is important for the field.

    2. Reviewer #1 (Public review):

      Summary:

      The authors found that IL-1b signaling is pivotal for hypoxemia development and can modulate NETs formation in LPS+HVV ALI model.

      Strengths:

      They used IL1R1 ko mice and proved that IL1R1 is involved in ALI model proving that IL1b signalling leads towards ARDS. In addition, hypothermia reduces this effect, suggesting a therapeutic option.

      Comments on revised version:

      The authors have addressed this Reviewer's concerns. The manuscript is much stronger in the current form and can be published.

    3. Reviewer #2 (Public review):

      Summary:

      The manuscript by Nosaka et al is a comprehensive study exploring the involvement of IL1beta signaling in a 2-hit model of lung injury + ventilation, with a focus on modulation by hypothermia.

      Strengths:

      The authors demonstrate quite convincingly that interleukin 1 beta plays a role in the development of ventilator-induced lung injury in this model, and that this role includes the regulation of neutrophil extracellular trap formation. The authors use a variety of in vivo animal-based and in vitro cell culture work, and interventions including global gene knockout, cell-targeted knockout and pharmacological inhibition, which greatly strengthen the ability to make clear biological interpretations.

      Comments on revised version:

      The authors have addressed my concerns/queries.

    4. Author response:

      The following is the authors’ response to the original reviews

      Public Reviews: 

      Reviewer #1 (Public review): 

      Summary: 

      The authors found that IL-1b signaling is pivotal for hypoxemia development and can modulate NETs formation in LPS+HVV ALI model.  

      Strengths: 

      They used IL1R1 ko mice and proved that IL1R1 is involved in ALI model proving that IL1b signalling leads towards ARDS. In addition, hypothermia reduces this effect, suggesting a therapeutic option.  

      We thank the Reviewer for recognizing the strengths of our study and their positive feedback.

      Weaknesses: 

      (1) IL1R1 binds IL1a and IL1b. What would be the role of IL1a in this scenario? 

      Thank you for asking this question. We have addressed this in our previous paper (Nosaka et al. Front Immunol 2020;11; 207) where we used  anti-IL-1a and IL-1a KO mice (Nosaka et al. Front Immunol 2020;11; 207) in our model and found that neither anti-IL-1a treated mice nor IL-1a KO mice were protected. Thus, IL-1b plays a role in inducing hypoxemia during LPS+HVV but not IL-1a. We will now add this point in our revised manuscript discussion.

      (2) The authors depleted neutrophils using anti-Ly6G. What about MDSCs? Do these latter cells be involved in ARDS and VILI?  

      Anti-Ly6G neutrophils depletion may potentially affect G-MDSCs as well (Blood Adv 2022 Jul 29;7(1):73–86), however, we have not looked directly at G-MDSCs.  If these cells were depleted we would have expected to see an increase in inflammation, which we did not.   Instead, anti-Ly6G treated mice were protected. Thus, we can not comment on any presumed role of G-MDSCs in LPS+HVV induced severe ALI model that we used.  

      (3) The authors found that TH inhibited IL-1β release from macrophages led to less NETs formation and albumin leakage in the alveolar space in their lung injury model. A graphical abstract could be included suggesting a cellular mechanism.  

      Thanks for summarizing our findings and the suggestion. Unfortunately, eLIFE does not publish a graphical abstract.  

      (4) If Macrophages are responsible for IL1b release that via IL1R1 induces NETosis, what happens if you deplete macrophages? what is the role of epithelial cells?  

      Previous studies have found that macrophage depletion is protective in several models of ALI (Eyal. Intensive Care Med. 2007;33:1212–1218., Lindauer.  J Immunol. 2009;183:1419–1426.), and other researchers have found that airway epithelial cells did not contribute to IL-1β secretion (Tang. PLoS ONE. 2012;7:e37689.). We have previously reported that epithelial cells produce IL-18 without LPS priming signal during LPS+HVV (Nosaka et al. Front Immunol 2020;11; 207). Thus, IL-18 is not sufficient to induce Hypoxemia as Saline+HVV treated mice do not develop hypoxemia (Nosaka et al. Front Immunol 2020;11; 207). We will now add this point to the revised discussion of the manuscript.

      Reviewer #2 (Public review): 

      Summary: 

      The manuscript by Nosaka et al is a comprehensive study exploring the involvement of IL1beta signaling in a 2-hit model of lung injury + ventilation, with a focus on modulation by hypothermia. 

      Strengths: 

      The authors demonstrate quite convincingly that interleukin 1 beta plays a role in the development of ventilator-induced lung injury in this model, and that this role includes the regulation of neutrophil extracellular trap formation. The authors use a variety of in vivo animal-based and in vitro cell culture work, and interventions including global gene knockout, cell-targeted knockout and pharmacological inhibition, which greatly strengthen the ability to make clear biological interpretations. 

      We thank the Reviewer for their positive feedback 

      Weaknesses: 

      A primary point for open discussion is the translatability of the findings to patients. The main model used, one of intratracheal LPS plus mechanical ventilation is well accepted for research exploring the pathogenesis and potential treatments for acute respiratory distress syndrome (ARDS). However, the interpretation may still be open to question - in the model here, animals were exposed to LPS to induce inflammation for only 2 hours, and seemingly displayed no signs of sickness, before the start of ventilation. This would not be typical for the majority of ARDS patients, and whether hypothermia could be effective once substantial injury is already present remains an open question. The interaction between LPS/infection and temperature is also complicated - in humans, LPS (or infection) induces a febrile, hyperthermic response, whereas in mice LPS induces hypothermia (eg. Ganeshan K, Chawla A. Nat Rev Endocrinol. 2017;13:458-465). Given this difference in physiological response, it is therefore unclear whether hypothermia in mice and hypothermia in humans are easily comparable. Finally, the use of only young, male animals such as in the current study has been typical but may be criticised as limiting translatability to people. 

      Therefore while the conclusions of the paper are well supported by the data, and the biological pathways have been impressively explored, questions still remain regarding the ultimate interpretations.  

      We agree with the reviewer that at two hours post LPS, there is only minimal pulmonary inflammation at that time (Dagvadorj et al Immunity 42, 640–653). This is a limitation to the experimental model we used in our study. Additionally, as the reviewer pointed out that LPS induces hyperthermia in human, but it is also well-established that physiological hypothermia occurs in humans with severe infections and sepsis (Baisse. Am J Emerg Med. 2023 Sep: 71: 134-138., Werner.  Am J Emerg Med. 2025 Feb;88:64-78.). Therefore, the difference between human and mouse responses to sepsis or infections may be more nuanced.  Furthermore, it is important to distinguish between physiological hypothermia (just <36°C) and therapeutic hypothermia (typically 32-34°C). We will add to the discussion whether hypothermia serves as a protective response, and the transition from normothermia to hyperthermia could have detrimental effects. We only used young male mice in our study as the Reviewer points out; we will also add this point to the revised discussion as a limitation of our study.

      Recommendations for the authors: 

      (i) With hypothermia, metabolic activity would be expected to be reduced and therefore presumably impact on CO2/pH. These may have an impact on outcomes from ventilation, so could the authors include this data and discuss as appropriate? 

      We have now included these data in Suppl Fig 6.  While we observed significant differences in blood pH and  PaCO<sub>2</sub> in Hypothermia treatment group, these values remained within clinically normal range (PaCO<sub>2</sub> : 35 - 45 mmHg, pH : 7.35 - 7.45). Neither Alkalosis (PaCO<sub>2</sub> < 35 mmHg , pH> 7.45) nor Acidosis (PaCO<sub>2</sub> > 45 mmHg, pH < 7.35) was observed.

      (ii) It is noticeable that there are quite large differences in experimental numbers between groups - typically 7-12, 5-12 in Figure 2. How were these N determined? For example is there a reason why there is apparently N = 8 for BALF neutrophils in the saline + HVV group (Figure 1c) but N = 12 for LPS + HVV group? Did any animals die during any of the protocols for example? 

      We conducted experiments with 4 mice per experiment (2 mice per group x2  or 4 mice per group) for ventilation experiments, and pooled data from 5-6 independent experiments or 3-4 independent experiments, respectively. No mouse mortality was observed (unless otherwise noted). However, in the severe ARDS group, some mice were dehydrated by the endpoint of experiments, preventing blood or BALF collections. As a result sample sizes were unequal in some case. Nevertheless, no data were selectively excluded.

      (iii) Discussion - On page 13 you refer to data involving Cl-amidine administration. This does not seem to be related to any experiments reported in the manuscript. 

      We apology for this mistake and have removed it.

      (iv) Methods - authors state that BALF was obtained after 150 minutes of ventilation, yet the experiments apparently lasted for 180 minutes. Presumably this is an error? 

      We apology for this inconsistency.  We collected blood for measuring blood gas at 30 min and 150 min after ventilation. However, mice were kept on ventilator 30 min longer, and then mice were euthanized and BALF were collected.  Thus, BALF were collected at 180 min, 30 minutes after the final blood draw. We have corrected the methods in revised manuscript.  

      (v) Statistical methods - authors state that sometimes Mann-Whitney U-test was used and sometimes unpaired t-test, presumably reflecting that some data were normally distributed and some were not. Could the authors please describe the tests used to confirm distribution of data. 

      We have clarified which stattistcal methods were used in our revised manuscript. 

      Briefly, Normality within the groups was assessed using the Shapiro-Wilk and KolmogorovSmirnov tests. Three-way ANOVA (Figure 1B; Supplemental Figure 1B-D; Supplemental Figure 6), one-way ANOVA (Supplemental Figure 4D-E; Supplemental Figure 5C), and two-way ANOVA were performed for data with more than two groups, followed by Tukey's post hoc test. Some groups analyzed by two-way ANOVA in Figure 1 and Supplemental Figure 1 failed the normality tests due to zero values (analyte not detected by ELISA) or the relatively small sample size, as samples were distributed across multiple measurements. However, the primary group of interest, LPS+HVV, showed significant differences from other groups with consistently low P-values in most datasets, supporting the decision to retain the ANOVA analyses. For comparisons between two groups, the Mann-Whitney U test was used when one or both groups failed the Shapiro-Wilk normality test, while the unpaired Student's t-test was applied to the remaining normally distributed data.

    1. eLife Assessment

      This important work advances our understanding of CHMP5's role in regulating osteogenesis through its impact on cellular senescence. The evidence supporting the conclusion is convincing and the revised manuscript is largely improved. This paper holds potential interest for skeletal biologists who study the pathogenesis of age-associated skeletal disorders.

    2. Reviewer #1 (Public review):

      Summary:

      The manuscript presents a significant and rigorous investigation into the role of CHMP5 in regulating bone formation and cellular senescence. The study provides compelling evidence that CHMP5 is essential for maintaining endolysosomal function and controlling mitochondrial ROS levels, thereby preventing the senescence of skeletal progenitor cells.

      Strengths:

      The authors demonstrate that the deletion of Chmp5 results in endolysosomal dysfunction, elevated mitochondrial ROS, and ultimately enhanced bone formation through both autonomous and paracrine mechanisms. The innovative use of senolytic drugs to ameliorate musculoskeletal abnormalities in Chmp5-deficient mice is a novel and critical finding, suggesting potential therapeutic strategies for musculoskeletal disorders linked to endolysosomal dysfunction.

      Comments on the latest version:

      My concerns were addressed.

    3. Reviewer #3 (Public review):

      Summary:

      In this study, Zhang et al., reported that CHMP5 restricts bone formation by controlling endolysosome-mitochondrion-mediated cell senescence. Zhang et al., report a novel role of CHMP5 on osteogenesis through affecting cell senescence. Overall, it is an interesting study and provides new insights in the field of cells senescence and bone.

      Strengths:

      Analyzed the bone phenotype OF CHMP5-periskeletal progenitor-CKO mouse model and found the novel role of senescent cells on osteogenesis and migration.

      Weaknesses:

      (1) The role and mechanism of CHMP5 gene deletion in enhancing osteogenesis via cellular senescence remain insufficiently elucidated.

      (2) The use of the ADTC5 cell line as a skeletal precursor/progenitor model is suboptimal.

      Overall, the results support their conclusions.

      The impact of this work on the field is its proposal that cellular senescence may exert either inhibitory or promotive effects on osteogenic capacity, depending on cell type and context.

      The revised manuscript has addressed most of the concerns raised during the initial review.

    4. Author response:

      The following is the authors’ response to the original reviews

      Public Reviews:

      Reviewer #1 (Public review):

      Summary:

      The manuscript presents a significant and rigorous investigation into the role of CHMP5 in regulating bone formation and cellular senescence. The study provides compelling evidence that CHMP5 is essential for maintaining endolysosomal function and controlling mitochondrial ROS levels, thereby preventing the senescence of skeletal progenitor cells.

      Strengths:

      The authors demonstrate that the deletion of Chmp5 results in endolysosomal dysfunction, elevated mitochondrial ROS, and ultimately enhanced bone formation through both autonomous and paracrine mechanisms. The innovative use of senolytic drugs to ameliorate musculoskeletal abnormalities in Chmp5-deficient mice is a novel and critical finding, suggesting potential therapeutic strategies for musculoskeletal disorders linked to endolysosomal dysfunction.

      Weaknesses:

      The manuscript requires a deeper discussion or exploration of CHMP5's roles and a more refined analysis of senolytic drug specificity and effects. This would greatly enhance the comprehensiveness and clarity of the manuscript.

      We thank the reviewer for these insightful comments. In the revised manuscript, we have expanded the discussion of the distinct roles of CHMP5 in different cell types. Specifically, we add the following sentences (Lines 433-439 in the combined manuscript):

      “Also, a previous study by Adoro et al. did not detect endolysosomal abnormalities in Chmp5 deficient developmental T cells [1]. Since both osteoclasts and T cells are of hematopoietic origin, and meanwhile osteogenic cells and MEFs, which show endolysosomal abnormalities after CHMP5 deficiency, are of mesenchymal origin, it turns out that the function of CHMP5 in regulating endolysosomal pathway could be cell lineage-specific, which remains clarified in future studies.”

      In addition, we tested another senolytic drug Navitoclax (ABT-263), which is a BCL-2 family inhibitor and induces apoptosis of senescent cells, in Chmp5<sup>Ctsk</sup> mice. Micro-CT analysis showed that ABT-263 could also improve periskeletal bone overgrowth in Chmp5<sup>Ctsk</sup> mice (Fig. 5F). Furthermore, we have also discussed the potential off-target effects of senolytic drugs in Chmp5<sup>Ctsk</sup> mice in the revised manuscript. Specifically, we added the following paragraph (Lines 441-451):

      “Furthermore, it is unclear whether the effect of senolytic drugs in Chmp5<sup>Ctsk</sup> mice involves targeting osteoclasts other than osteogenic cells, as osteoclast senescence has not yet been evaluated. However, the efficacy of Q + D in targeting osteogenic cells, which is the focus of the current study, was confirmed in Chmp5<sup>Dmp1</sup> mice (Fig. 5C-E). Additionally, Q + D caused a higher cell apoptotic ratio in Chmp5<sup>Ctsk</sup> compared to wild-type periskeletal progenitors in ex vivo culture (Fig. 5A), demonstrating the effectiveness of Q + D in targeting osteogenic cells in the Chmp5<sup>Ctsk</sup> model. Furthermore, an alternative senolytic drug ABT-263 could also ameliorate periskeletal bone overgrowth in Chmp5<sup>Ctsk</sup> mice (Fig. 5F). Together, these results confirm that osteogenic cell senescence is responsible for the bone overgrowth in Chmp5<sup>Ctsk</sup> and Chmp5<sup>Dmp1</sup> mice, and senolytic treatments are effective in alleviating these skeletal disorders.”

      Reviewer #2 (Public review):

      Summary:

      The authors try to show the importance of CHMP5 for skeletal development.

      Strengths:

      The findings of this manuscript are interesting. The mouse phenotypes are well done and are of interest to a broader (bone) field.

      Weaknesses:

      The mechanistic insights are mediocre, and the cellular senescence aspect poor.

      In total, it has not been shown that there are actual senescent cells that are reduced after D+Qtreatment. These statements need to be scaled back substantially.

      We thank the reviewer for these suggestive comments. We have added additional results to strengthen the senescent phenotypes of Chmp5-deficient skeletal progenitor cells, including significant enrichment of the SAUL_SEN_MAYO geneset (positively correlated with cell senescence) and the KAMMINGA_SENESCENCE geneset (negatively correlated with cell senescence) at the transcriptional level by GSEA analysis of RNA-seq data (Fig. S3C), and the increase of γH2Ax<sup>+</sup>;GFP<sup>+</sup> cells at periskeletal overgrowth in Chmp5<sup>Ctsk</sup>;Rosa26<sup>26mTmG/+</sup> mice vs. the periosteum of Chmp5<sup>Ctsk/+</sup>;Rosa26<sup>26mTmG/+</sup> control mice (Fig. 3E). These results further advocate for the senescent phenotypes of Chmp5-deficient skeletal progenitors.

      Furthermore, the combination of Q + D caused a higher cell apoptotic ratio in Chmp5<sup>Ctsk</sup> vs. wildtype periskeletal progenitors in ex vivo culture (Fig. 5A), suggesting their effectiveness in targeting periskeletal progenitor cell senescence in Chmp5<sup>Ctsk</sup> mice. Furthermore, we tested an alternative senolytic drug ABT-263, which is an inhibitor of the BCL-2 family and induces apoptosis of senescent cells, in Chmp5<sup>Ctsk</sup> mice, and ABT-263 could also alleviate periskeletal bone overgrowth in Chmp5<sup>Ctsk</sup> mice (Fig. 5F). Together, these results demonstrate that osteogenic cell senescence is responsible for abnormal bone overgrowth in Chmp5-deficient mice and that senolytic drugs are effective in improving these skeletal disorders.

      Reviewer #3 (Public review):

      Summary:

      In this study, Zhang et al. reported that CHMP5 restricts bone formation by controlling endolysosomemitochondrion-mediated cell senescence. The effects of CHMP5 on osteoclastic bone resorption and bone turnover have been reported previously (PMID: 26195726), in which study the aberrant bone phenotype was observed in the CHMP5-ctsk-CKO mouse model, using the same mouse model, Zhang et al., report a novel role of CHMP5 on osteogenesis through affecting cell senescence. Overall, it is an interesting study and provides new insights in the field of cell senescence and bone.

      Strengths:

      Analyzed the bone phenotype OF CHMP5-periskeletal progenitor-CKO mouse model and found the novel role of senescent cells on osteogenesis and migration.

      Weaknesses:

      (1) There are a lot of papers that have reported that senescence impairs osteogenesis of skeletal stem cells. In this study, the author claimed that Chmp5 deficiency induces skeletal progenitor cell senescence and enhanced osteogenesis. Can the authors explain the controversial results?

      Different skeletal stem cell populations in time and space have been identified and reported [2-6]. The present study shows that Chmp5 deficiency in periskeletal (Ctsk-Cre) and endosteal (Dmp1-Cre) osteogenic cells causes cell senescence and aberrant bone formation. Although cell senescence during aging can impair the osteogenesis of marrow stromal cells (MSCs), which contributes to diseases with low bone mass such as osteoporosis, aging can also increase heterotopic ossification or mineralization in musculoskeletal soft tissues such as ligaments and tendons [7]. Notably, the abnormal periskeletal bone overgrowth in Chmp5<sup>Ctsk</sup> mice was mainly mapped to insertion sites of tendons and ligaments on the bone (Fig. 1A and E), consistent with changes during aging. More broadly, aging can also cause abnormal ossification or mineralization in other body tissues, such as the heart valve [8, 9]. These different results reflect an aberrant state of ossification or mineralization in musculoskeletal tissues and throughout the body during aging. Based on the reviewer’s comment, we have discussed these results in the revised manuscript. Specifically, we add the following paragraph (Lines 453-462 in the combined manuscript):

      “Notably, aging is associated with decreased osteogenic capacity in marrow stromal cells, which is related to conditions with low bone mass, such as osteoporosis. Rather, aging is also accompanied by increased ossification or mineralization in musculoskeletal soft tissues, such as tendons and ligaments [7]. In particular, the abnormal periskeletal overgrowth in Chmp5<sup>Ctsk</sup> mice was predominantly mapped to insertion sites of tendons and ligaments on the bone (Fig. 1A and E), which is consistent with changes during aging and suggests that mechanical stress at these sites could contribute to the aberrant bone growth. These results suggest that skeletal stem/progenitor cells at different sites of musculoskeletal tissues could demonstrate different, even opposite outcomes in osteogenesis, due to cell senescence.”

      (2) Co-culture of Chmp5-KO periskeletal progenitors with WT ones should be conducted to detect the migration and osteogenesis of WT cells in response to Chmp5-KO-induced senescent cells. In addition, the co-culture of WT periskeletal progenitors with senescent cells induced by H2O2, radiation, or from aged mice would provide more information.

      In the present study, the increased proliferation and osteogenesis of CD45-;CD31-;GFP- periskeletal progenitors were shown as paracrine mechanisms of Chmp5-deficient periskeletal progenitors to promote bone overgrowth in Chmp5<sup>Ctsk</sup> mice (Figs. 4F, G, and S4C-E). According to the reviewer’s suggestion, we have carried out the coculture experiment and the coculture of Chmp5<sup>Ctsk</sup> with wild-type skeletal progenitors could promote osteogenesis of wild-type cells (Fig. S4B), which further supports the paracrine effect of Chmp5-deficient periskeletal progenitors.

      In addition, the cause and outcome of cell senescence could be highly heterogeneous, and different causes of cell senescence can cause significantly distinct, even opposite outcomes. Although the coculture experiments of WT periskeletal progenitors with senescent cells induced by H2O2, radiation, or from aged mice are very interesting, these are beyond the scope of the current study.

      (3) Many EVs were secreted from Chmp5-deleted periskeletal progenitors, compared to the rarely detected EVs around WT cells. Since EVs of BMSCs or osteoprogenitors show strong effects of promoting osteogenesis, did the EVs contribute to the enhanced osteogenesis induced by Chmp5defeciency? Author’s response:

      This is an interesting question. Although we did not separately test the effect of EVs from Chmp5-deficient periskeletal progenitors on the osteogenesis of WT skeletal progenitors, the CD45-;CD31-;GFP- skeletal progenitor cells from Chmp5<sup>Ctsk</sup> mice have an increased capacity of osteogenesis compared to corresponding cells from control animals (Figs. 4G and S4D). Also, the coculture of Chmp5-deficient with wild-type skeletal progenitors could enhance the osteogenesis of wild-type cells (Fig. S4B). These results suggest that EVs from Chmp5-deficient periskeletal progenitors could promote osteogenesis of neighboring WT skeletal progenitors. The specific functions of EVs of Chmp5-deficient periskeletal progenitors in regulating osteogenesis will be further investigated in future studies.

      (4) EVs secreted from senescent cells propagate senescence and impair osteogenesis, why do EVs secreted from senescent cells induced by Chmp5-defeciency have opposite effects on osteogenesis?

      The question is similar to comments #1 and #3 from this reviewer. First, the manifestations (including the secretory phenotype) and outcomes of cell senescence could be highly heterogeneous depending on inducers, tissue and cell contexts, and other factors such as “time”. Different causes of cell senescence could lead to different manifestations and outcomes, which have been discussed in the manuscript (Lines 381-383). Similarly, as mentioned above, skeletal stem/progenitor cells at different sites of musculoskeletal tissues could also demonstrate distinct, even opposite outcomes, as a result of cell senescence (Line 453-462). Second, CD45-;CD31-;GFP- periskeletal progenitor cells from Chmp5<sup>Ctsk</sup>;Rosa26<sup>26mTmG/+</sup> mice have an increased capacity of proliferation and osteogenesis compared to corresponding cells from control animals (Figs. 4F, G and S4C-E). Furthermore, the conditioned medium of Chmp5-deficient skeletal progenitors promoted the proliferation of ATDC5 cells (Fig. 4E) and the coculture of Chmp5<sup>Ctsk</sup> and wild-type periskeletal progenitors could enhance the osteogenesis of wild-type cells (Fig. S4B). Taken together, these results show paracrine actions of Chmp5-deficient periskeletal progenitors in promoting aberrant bone growth in Chmp5 conditional knockout mice. We also refer the reviewer to our responses to comments #1 and #3.

      (5) The Chmp5-ctsk mice show accelerated aging-related phenotypes, such as hair loss and joint stiffness. Did Ctsk also label cells in hair follicles or joint tissue?

      This is an interesting question. Although we did not check the expression of CHMP5 in hair follicles, which is outside the scope of the present study, the result in Fig. 1E showed the expression of Ctsk in joint ligaments, tendons, and their insertion sites on the bone (Lines 108-111). Notably, the periskeletal bone overgrowth in Chmp5<sup>Ctsk</sup> mice was mainly mapped to insertion sites of ligaments and tendons on the bone, which have been discussed in the revised manuscript (Lines 456-460).

      (6) Fifteen proteins were found to increase and five proteins to decrease in the cell supernatant of Chmp5<sup>Ctsk</sup> periskeletal progenitors. How about SASP factors in the secretory profile?

      The SASP phenotype and related factors of senescent cells could be highly heterogeneous depending on inducers, cell types, and timing of senescence [10, 11]. Most of the proteins we identified in the secretome analysis have previously been reported in the secretory profile of osteoblasts or involved in the regulation of osteogenesis. Although we were interested in changes in common SASP factors, such as cytokines and chemokines, the experiment did not detect these factors, probably due to their small molecular weights and the technical limitations of the mass-spec analysis. We have clarified this in the revised manuscript. Specifically, we add the following sentences (Lines 258-261):

      “Notably, the secretome analysis did not detect common SASP factors, such as cytokines and chemokines, in the secretory profile of Chmp5<sup>Ctsk</sup> periskeletal progenitors, probably due to their small molecular weights and the technical limitations of the mass-spec analysis.”

      (7) D+Q treatment mitigates musculoskeletal pathologies in Chmp5 conditional knockout mice. In the previously published paper (CHMP5 controls bone turnover rates by dampening NF-κB activity in osteoclasts), inhibition of osteoclastic bone resorption rescues the aberrant bone phenotype of the Chmp5 conditional knockout mice. Whether the effects of D+Q on bone overgrowth is because of the inhibition of bone resorption?

      This is an important question. We have discussed the potential off-target effect of senolytic drugs in Chmp5<sup>Ctsk</sup> mice in the revised manuscript. Specifically, we add the following paragraph (Lines 441451):

      “Furthermore, it is unclear whether the effect of senolytic drugs in Chmp5<sup>Ctsk</sup> mice involves targeting osteoclasts other than osteogenic cells, as osteoclast senescence has not yet been evaluated. However, the efficacy of Q + D in targeting osteogenic cells, which is the focus of the current study, was confirmed in Chmp5<sup>Dmp1</sup> mice (Fig. 5C-E). Additionally, Q + D caused a higher cell apoptotic ratio in Chmp5<sup>Ctsk</sup> compared to wild-type periskeletal progenitors in ex vivo culture (Fig. 5A), demonstrating the effectiveness of Q + D in targeting osteogenic cells in the Chmp5<sup>Ctsk</sup> model. Furthermore, an alternative senolytic drug ABT-263 could also ameliorate periskeletal bone overgrowth in Chmp5<sup>Ctsk</sup> mice (Fig. 5F). Together, these results confirm that osteogenic cell senescence is responsible for the bone overgrowth in Chmp5<sup>Ctsk</sup> and Chmp5<sup>Dmp1</sup> mice and senolytic treatments are effective in alleviating these skeletal disorders.”

      (8) The role of VPS4A in cell senescence should be measured to support the conclusion that CHMP5 regulates osteogenesis by affecting cell senescence.

      We thank the reviewer for this suggestion. The current study mainly reports the function of CHMP5 in the regulation of skeletal progenitor cell senescence and osteogenesis. The roles of VPS4A in cell senescence and skeletal biology will be further explored in future studies. We have discussed this in the revised manuscript. Specifically, we add the following sentence (Lines 407-409):

      “The roles of VPS4A in regulating musculoskeletal biology and cell senescence should be further explored in future studies.”

      (9) Cell senescence with markers, such as p21 and H2AX, co-stained with GFP should be performed in the mouse models to indicate the effects of Chmp5 on cell senescence in vivo.

      According to the reviewer’s suggestion, we have already performed immunostaining of γH2AX and colocalization with GFP in Chmp5<sup>Ctsk</sup>;Rosa26<sup>26mTmG/+</sup> and Chmp5<sup>Ctsk/+</sup>;Rosa26<sup>26mTmG/+</sup> mice. The results showed that there are more γH2AX+;GFP+ cells in the periskeletal overgrowth in Chmp5<sup>Ctsk</sup>;Rosa26<sup>26mTmG/+</sup> mice compared to the periosteum of Chmp5<sup>Ctsk/+</sup>;Rosa26<sup>26mTmG/+</sup> control animals. Because the γH2AX staining could stand as one of the critical results supporting the senescent phenotype of Chmp5-deficient periskeletal progenitors. We have added these results to Fig. 3E and put Fig. 3F in the original manuscript into Fig. S3E due to the space limitation in Figure 3. In sum, these results further enrich the senescent manifestations of Chmp5-deficient periskeletal progenitors.

      (10) ADTC5 cell as osteochondromas cells line, is not a good cell model of periskeletal progenitors.

      Maybe primary periskeletal progenitor cell is a better choice.

      ATDC5 cells are typically used as a chondrocyte progenitor cell line. However, our previous study showed that ATDC5 cells could also be used as a reasonable cell model for periskeletal progenitors [12], which was mentioned in the manuscript (Lines 202-204). In addition, the results of ATDC5 cells were also verified in primary periskeletal progenitor cells in this study.

      Recommendations for the authors:

      Reviewer #1 (Recommendations for the authors):

      Despite the robust experimental framework and intriguing findings, there are several areas that require further attention to enhance the manuscript's overall quality and clarity:

      (1) The manuscript could benefit from a more in-depth discussion of the tissue-specific roles of CHMP5, particularly in addressing why CHMP5 deficiency results in distinct outcomes in osteogenic cells as opposed to other cell types, such as osteoclasts. Expanding the discussion would greatly enhance the comprehensiveness and clarity of the manuscript.

      Based on the reviewer’s suggestion, we have expanded the discussion of the distinct roles of CHMP5 in different cell types. Specifically, we state (Lines 433-439):

      “Also, a previous study by Adoro et al. did not detect endolysosomal abnormalities in _Chmp5_deficient developmental T cells [1]. Since both osteoclasts and T cells are of hematopoietic origin, and meanwhile osteogenic cells and MEFs, which show endolysosomal abnormalities after CHMP5 deficiency, are of mesenchymal origin, it turns out that the function of CHMP5 in regulating the endolysosomal pathway could be cell lineage-specific, which remains clarified in future studies.”

      (2) Given that Figures 1 and 2 suggest that the absence of Chmp5 (CHMP5Ctsk & CHMP5Dmp1) leads to disordered proliferation or mineralization of bone or osteoblasts, the manuscript should delve deeper into the potential links between these findings and aging-related processes, such as age-associated fibrosis. Providing clearer explanations and discussion on these connections would help present a more cohesive understanding of the results in the context of aging.

      We thank the reviewer for this favorable suggestion. A feature of aging is heterotopic ossification or mineralization in musculoskeletal soft tissues, including tendons and ligaments [7]. Notably, the abnormal periskeletal bone formation in Chmp5<sup>Ctsk</sup> mice in this study was mostly mapped to the insertion sites of tendons and ligaments on the bone (Fig. 1A and E), which is consistent with changes during aging and suggests that mechanical stress at these sites could be a contributor to periskeletal overgrowth. We have discussed these results in the revised manuscript. Specifically, we add the following paragraph (Lines 453-462):

      “Notably, aging is associated with decreased osteogenic capacity in marrow stromal cells, which is related to conditions with low bone mass, such as osteoporosis. Rather, aging is also accompanied by increased ossification or mineralization in musculoskeletal soft tissues, such as tendons and ligaments [7]. In particular, the abnormal periskeletal overgrowth in Chmp5<sup>Ctsk</sup> mice was predominantly mapped to the insertion sites of tendons and ligaments on the bone (Fig. 1A and E), which is consistent with changes during aging and suggests that mechanical stress at these sites could contribute to the aberrant bone growth. These results suggest that skeletal stem/progenitor cells at different sites of musculoskeletal tissues could demonstrate different, even opposite outcomes in osteogenesis, due to cell senescence.”

      (3) The manuscript would be improved by a more refined analysis in Figures 3 and 5, particularly in relation to the use of senolytic drugs. Furthermore, a detailed discussion of the specificity and potential off-target effects of quercetin and dasatinib treatments in Chmp5-deficient mice would strengthen the therapeutic claims of these drugs.

      In Figure 3, we have added additional experiments and results to strengthen the senescent phenotypes of Chmp5-deficient periskeletal progenitors, including significant enrichment of the SAUL_SEN_MAYO geneset (positively correlated with cell senescence) and the KAMMINGA_SENESCENCE geneset (negatively correlated with cell senescence) at the transcriptional level by GSEA analysis of RNA-seq data (Fig. S3F), and an increase of γH2AX+;GFP+ cells at the site of periskeletal overgrowth in Chmp5<sup>Ctsk</sup>;Rosa26<sup>26mTmG/+</sup> mice compared to the periosteum of Chmp5<sup>Ctsk/+</sup>;Rosa26<sup>26mTmG/+</sup> control mice (Fig. 3E). These results further enrich the senescent molecular manifestations of Chmp5-deficient periskeletal progenitors.

      In Figure 5, we used an alternative senolytic drug ABT-263 to treat Chmp5<sup>Ctsk</sup> mice, and this antisenescence treatment could also alleviate periskeletal bone overgrowth in this mouse model (Fig. 5F). Furthermore, we have also discussed the potential off-target effects of senolytic drugs in Chmp5<sup>Ctsk</sup> mice. Specifically, we add the following paragraph (Lines 441-451):

      “Furthermore, it is unclear whether the effect of senolytic drugs in Chmp5<sup>Ctsk</sup> mice involves targeting osteoclasts other than osteogenic cells, as osteoclast senescence has not yet been evaluated. However, the efficacy of Q + D in targeting osteogenic cells, which is the focus of the current study, was confirmed in Chmp5<sup>Dmp1</sup> mice (Fig. 5C-E). Additionally, Q + D caused a higher cell apoptotic ratio in Chmp5<sup>Ctsk</sup> compared to wild-type periskeletal progenitors in ex vivo culture (Fig. 5A), demonstrating the effectiveness of Q + D in targeting osteogenic cells in the Chmp5<sup>Ctsk</sup> model. Furthermore, an alternative senolytic drug ABT-263 could also ameliorate periskeletal bone overgrowth in Chmp5<sup>Ctsk</sup> mice (Fig. 5F). Together, these results confirm that osteogenic cell senescence is responsible for the bone overgrowth in Chmp5<sup>Ctsk</sup> and Chmp5<sup>Dmp1</sup> mice and senolytic treatments are effective in alleviating these skeletal disorders.”

      (4) The manuscript could be further enhanced by providing more details into how CHMP5 specifically regulates VPS4A protein levels. Notably, this is a central aspect of the paper linking CHMP5 to endolysosomal dysfunction.

      We thank the reviewer for this important suggestion. One of the novel findings of this study is that CHMP5 regulates the protein level of VPS4A without affecting its RNA transcription. The mechanism of CHMP5 in the regulation of VPS4A protein will be reported in a separate study. However, we have discussed the potential mechanism in the manuscript (Lines 399-409). Specifically, we state:

      “However, the mechanism of CHMP5 in the regulation of the VPS4A protein has not yet been studied. Since CHMP5 can recruit the deubiquitinating enzyme USP15 to stabilize IκBα in osteoclasts by suppressing ubiquitination-mediated proteasomal degradation [13], it is also possible that CHMP5 stabilizes the VPS4A protein by recruiting deubiquitinating enzymes and regulating the ubiquitination of VPS4A, which needs to be clarified in future studies. Notably, mutations in the VPS4A gene in humans can cause multisystemic diseases, including musculoskeletal abnormalities [14] (OMIM: 619273), suggesting that normal expression and function of VPS4A are important for musculoskeletal physiology. The roles of VPS4A in regulating musculoskeletal biology and cell senescence should be further explored in future studies.”

      (5) The discussion section could be enriched by more thoroughly integrating the current findings with previous studies on CHMP5, particularly those exploring its role in osteoclast differentiation and NF-κB signaling.

      The comment is similar to comment #1 of this reviewer. We have expanded the discussion of the distinct functions of CHMP5 in osteoclasts and osteogenic cells (Lines 424-439). We also refer the reviewer to our response to comment #1.

      (6) Figure S4 D is incorrectly arranged and should be revised accordingly.

      Sorry for the confusion. We have added additional annotations to make the images clearer. Now it is Fig. S4E in the revised manuscript.

      Reviewer #2 (Recommendations for the authors):

      (1) Abstract A clinical perspective or at least an outline is desirable.

      The clinical importance of the findings of this study in understanding and treating musculoskeletal disorders of lysosomal storage diseases has been highlighted at the end of the abstract (Line 38).

      (2) Introduction Header missing.

      The protein name is BCL2, not Bcl2.

      These have been corrected in the revised manuscript (Lines 41, 66).

      (3) Results

      The mouse phenotype experiments are well done.

      Hmga1, Hmga2, Trp53, Ets1, and Txn1 are no typical senescence-associated genes. How about

      Cdkn2a and Cdkn1a? These could easily be highlighted in Figure 3B.

      Hmga1, Hmga2, Trp53, Ets1, and Txn1 are within the geneset of Reactome Cellular Senescence. Notably, only the protein levels of CDKN2A (p16) and CDKN1A (p21) showed significant changes (Fig. 3D) and the mRNA levels of Cdkn2a and Cdkn1a did not show significant changes according to RNAseq data. We have added the result of Cdkn2a and Cdkn1a mRNA levels to Fig. S3D in the revised manuscript. Also, we add the following sentences in the text (Lines 193-195):

      “However, the mRNA levels of Cdkn2a (p16) and Cdkn1a (p21) did not show significant changes according to the RNA-seq analysis (Fig. S3D).”

      Figure 3C: Which gene set was used for SASP?

      The SASP geneset in Fig. 3C was from the Reactome database. We have clarified this in the figure legend of Fig. 3 in the revised manuscript (Line 1013).

      The symptom "joint stiffness/contracture" could also be due to skeletal abnormalities related to Chmp5Ctsk.

      Joint stiffness/contracture during aging is mainly the result of heterotopic ossification or mineralization in musculoskeletal soft tissues, including ligaments, tendons, joint capsules, and their insertion sites on the bone. Notably, the periskeletal bone overgrowth in Chmp5<sup>Ctsk</sup> mice was mainly mapped to the insertion sites of tendons, ligaments, and joint capsules on the bone, which are consistent with changes during aging. These results have been discussed in the revised manuscript (Lines 456-460).

      Overall, cellular senescence needs at least Cdkn2a and/or Cdkn1a and another marker, i.e. SenMayo or telomere-associated foci or senescence-associated distortion of satellites.

      We have run GSEA with the SenMayo geneset and the result is added in Fig. S3F in the revised manuscript. Also, we ran another geneset KAMMINGA_SENESCENCE which includes genes downregulated in cell senescence. Both genesets are significantly enriched in Chmp5-deficient periskeletal progenitors based on RNA-seq data (Fig. S3F).

      In addition, we also performed immunostaining for another senescence marker γH2AX and the results showed that there are more γH2AX+;GFP+ cells in periskeletal overgrowth in Chmp5<sup>Ctsk</sup>;Rosa26<sup>mTmG/+</sup> mice compared to the periosteum of Chmp5<sup>Ctsk/+</sup>;Rosa26<sup>26mTmG/+</sup> control animals (Fig. 3E).

      Together, these results further support the senescent phenotypes of Chmp5-deficient periskeletal progenitors.

      For Figure 4A: What is the NES?

      The value of NES has been added in Fig. 4A.

      The existence of vesicles does not necessarily indicate more SASP. Author’s response:

      We agree with the reviewer that the secretion of extracellular vesicles is not directly correlated with the SASP. In this study, the increased secretory vesicles around Chmp5<sup>Ctsk</sup> periskeletal progenitors represent a secretory phenotype of Chmp5-deficient periskeletal progenitors and have paracrine effects in the abnormal bone growth in Chmp5 conditional knockout mice as shown in Figs. 4 and S4.

      The Chmp5-deficient cells COULD promote the proliferation and osteogenesis of other progenitors, but they might as well not. And if this is through the SASP, is completely unresolved.

      CD45<sup>-</sup>;CD31<sup>-</sup>;GFP<sup>-</sup> periskeletal progenitor cells from Chmp5<sup>Ctsk</sup>;Rosa26<sup>26mTmG/+</sup> mice showed an increased capacity of proliferation and osteogenesis compared to the corresponding cells from control animals (Figs. 4F, G, and S4C-E). Also, the conditioned medium of Chmp5-deficient skeletal progenitors promoted the proliferation of ATDC5 cells (Fig. 4E). In addition, the coculture of Chmp5<sup>Ctsk</sup> and wild-type periskeletal progenitors could enhance the osteogenesis of wild-type cells (Fig. S4B). These results demonstrate the paracrine actions of Chmp5-deficient periskeletal progenitors in promoting aberrant bone growth in Chmp5<sup>Ctsk</sup> and Chmp5<sup>Dmp1</sup> mice. However, factors that mediate the paracrine effects of Chmp5-deficient periskeletal progenitors remain further clarified in future studies.

      This has been mentioned in the revised manuscript (Lines 263-265).

      Figure 5C: The time points are not labelled.

      The time point of 16 weeks was mentioned in the Method section and now it has been added in the legend of Fig. 5C (Line 1063).

      Figure B: Was the bone's overall thickness quantified?

      In Fig. 5B, bone morphology in Chmp5<sup>Ctsk</sup> mice is irregular and difficult to quantify. Therefore, we did not qualify the overall bone thickness in these animals. However, the thickness of the cortical bone was measured by micro-CT analysis in Chmp5<sup>Dmp1</sup> mice after treatment with Q + D (Fig. 5E). Also, we have added the image of the gross femur thickness of Chmp5<sup>Dmp1</sup> mice before and after treatment with Q + D in Fig. 5E.

      It needs to be demonstrated that the actual cell number was reduced after D+Q treatment.

      The Q + D treatment caused a higher cell apoptotic ratio in Chmp5<sup>Ctsk</sup> vs. wild-type skeletal progenitors in ex vivo culture (Fig. 5A), suggesting its effectiveness in targeting the senescent periskeletal progenitors.

      Figure 7A: What is the NES?

      The value of NES has been added in Fig. 7A.

      Reviewer #3 (Recommendations for the authors):

      (1) The WB analysis should be quantified in the Figure 3D.

      In Fig. 3D, the numbers above the lanes of p16 and p21 are the results of the quantification of the band intensity after normalization by β-Actin, which has been indicated in the Figure legend (Lines 10151017).

      (2) The osteoblast detection should be measured with antibody against osteocalcin.

      This comment did not specify what result the reviewer was referring to. However, most of the experiments in this study were performed in primary skeletal progenitor cells or cell lines. Osteoblasts were not specifically involved in the current study.

      (3) Co-culture of Chmp5-KO periskeletal progenitors with WT ones should be conducted to detect the migration and osteogenesis of WT cell in response to Chmp5-KO induced senescent cells. In addition, co-culture of WT periskeletal progenitors with senescent cells induced by H2O2, radiation, or from aged mice would provide more information.

      This comment is the same as comment #2 in the Public Reviews of this Reviewer. We already carried out the coculture experiment of Chmp5-deficient and wild-type periskeletal progenitors and the result was added in Fig. S4B. We refer the reviewer to our response to comment #2 in the Public Reviews for more details.

      (4) D+Q treatment mitigates musculoskeletal pathologies in Chmp5 conditional knockout mice. In the previously published paper (CHMP5 controls bone turnover rates by dampening NF-κB activity in osteoclasts), inhibition of osteoclastic bone resorption rescues the aberrant bone phenotype of the Chmp5 conditional knockout mice. Is the effect of D+Q on bone overgrowth because of the inhibition of bone resorption?

      This comment is the same as comment #7 in the Public Reviews of this Reviewer, where we already address this question.

      (5) The role of VPS4A in cell senescence should be measured to support the conclusion that CHMP5 regulates osteogenesis through affecting cell senescence.

      This comment is the same as comment #8 in the Public Reviews of this Reviewer. We refer the reviewer to our response to that comment.

      (6) Cell senescence with the markers, such as p21 and H2AX, co-stained with GFP should be performed in the mouse models to indicate the effects of Chmp5 on cell senescence in vivo.

      This comment is the same as comment #9 in the Public Reviews of this Reviewer. We have performed immunostaining of γH2AX and colocalization with GFP in Chmp5<sup>Ctsk</sup>;Rosa26<sup>26mTmG/+</sup> mice and Chmp5<sup>Ctsk/+</sup>;Rosa26<sup>26mTmG/+</sup> mice. The results showed that there were more γH2AX+;GFP+ cells at the site of periskeletal overgrowth in Chmp5<sup>Ctsk</sup>;Rosa26<sup>26mTmG/+</sup> mice compared to the periosteum of Chmp5<sup>Ctsk/+</sup>;Rosa26<sup>26mTmG/+</sup> control mice (Fig. 3E). We also refer the reviewer to our response to comment #9 in Public Reviews.

      (7) ADTC5 cell as osteochondromas cells line, is not a good cell model of periskeletal progenitors.

      Maybe primary periskeletal progenitor cell is a better choice.

      This comment is the same as comment #10 in the Public Reviews of this Reviewer. Our previous study showed that ATDC5 cells could be used as a reasonable cell model for periskeletal progenitors [12]. Also, most of the results of ATDC5 cells in the current study were verified in primary periskeletal progenitors.

      References

      (1) Adoro S, Park KH, Bettigole SE, Lis R, Shin HR, Seo H, et al. Post-translational control of T cell development by the ESCRT protein CHMP5. Nat Immunol. 2017;18(7):780-90. doi: 10.1038/ni.3764. PubMed PMID: 28553951.

      (2) Kassem M, Bianco P. Skeletal stem cells in space and time. Cell. 2015;160(1-2):17-9. doi: 10.1016/j.cell.2014.12.034. PubMed PMID: 25594172.

      (3) Chan CKF, Gulati GS, Sinha R, Tompkins JV, Lopez M, Carter AC, et al. Identification of the Human Skeletal Stem Cell. Cell. 2018;175(1):43-56 e21. doi: 10.1016/j.cell.2018.07.029. PubMed PMID: 30241615.

      (4) Debnath S, Yallowitz AR, McCormick J, Lalani S, Zhang T, Xu R, et al. Discovery of a periosteal stem cell mediating intramembranous bone formation. Nature. 2018;562(7725):133-9. Epub 20180924. doi: 10.1038/s41586-018-0554-8. PubMed PMID: 30250253; PubMed Central PMCID: PMCPMC6193396.

      (5) Mizuhashi K, Ono W, Matsushita Y, Sakagami N, Takahashi A, Saunders TL, et al. Resting zone of the growth plate houses a unique class of skeletal stem cells. Nature. 2018;563(7730):254-8. doi: 10.1038/s41586-018-0662-5. PubMed PMID: 30401834; PubMed Central PMCID: PMCPMC6251707.

      (6) Zhang F, Wang Y, Zhao Y, Wang M, Zhou B, Zhou B, et al. NFATc1 marks articular cartilage progenitors and negatively determines articular chondrocyte differentiation. Elife. 2023;12. Epub 20230215. doi: 10.7554/eLife.81569. PubMed PMID: 36790146; PubMed Central PMCID: PMCPMC10076019.

      (7) Dai GC, Wang H, Ming Z, Lu PP, Li YJ, Gao YC, et al. Heterotopic mineralization (ossification or calcification) in aged musculoskeletal soft tissues: A new candidate marker for aging. Ageing Res Rev. 2024;95:102215. Epub 20240205. doi: 10.1016/j.arr.2024.102215. PubMed PMID: 38325754.

      (8) Mohler ER, 3rd, Adam LP, McClelland P, Graham L, Hathaway DR. Detection of osteopontin in calcified human aortic valves. Arterioscler Thromb Vasc Biol. 1997;17(3):547-52. doi: 10.1161/01.atv.17.3.547. PubMed PMID: 9102175.

      (9) Mohler ER, 3rd, Gannon F, Reynolds C, Zimmerman R, Keane MG, Kaplan FS. Bone formation and inflammation in cardiac valves. Circulation. 2001;103(11):1522-8. doi: 10.1161/01.cir.103.11.1522. PubMed PMID: 11257079.

      (10) Paramos-de-Carvalho D, Jacinto A, Saude L. The right time for senescence. Elife. 2021;10. Epub 2021/11/11. doi: 10.7554/eLife.72449. PubMed PMID: 34756162; PubMed Central PMCID: PMCPMC8580479.

      (11) Wiley CD, Campisi J. The metabolic roots of senescence: mechanisms and opportunities for intervention. Nat Metab. 2021;3(10):1290-301. Epub 2021/10/20. doi: 10.1038/s42255-021-00483-8. PubMed PMID: 34663974; PubMed Central PMCID: PMCPMC8889622.

      (12) Ge X, Tsang K, He L, Garcia RA, Ermann J, Mizoguchi F, et al. NFAT restricts osteochondroma formation from entheseal progenitors. JCI Insight. 2016;1(4):e86254. doi: 10.1172/jci.insight.86254. PubMed PMID: 27158674; PubMed Central PMCID: PMCPMC4855520.

      (13) Greenblatt MB, Park KH, Oh H, Kim JM, Shin DY, Lee JM, et al. CHMP5 controls bone turnover rates by dampening NF-kappaB activity in osteoclasts. J Exp Med. 2015;212(8):1283-301. Epub 20150720. doi: 10.1084/jem.20150407. PubMed PMID: 26195726; PubMed Central PMCID: PMCPMC4516796.

      (14) Rodger C, Flex E, Allison RJ, Sanchis-Juan A, Hasenahuer MA, Cecchetti S, et al. De Novo VPS4A Mutations Cause Multisystem Disease with Abnormal Neurodevelopment. Am J Hum Genet. 2020;107(6):1129-48. Epub 20201112. doi: 10.1016/j.ajhg.2020.10.012. PubMed PMID: 33186545; PubMed Central PMCID: PMCPMC7820634.

    1. eLife Assessment

      This manuscript introduces a useful protein-stability-based fitness model for simulating protein evolution and unifying non-neutral models of molecular evolution with phylogenetic models. The model is applied to four viral proteins that are of structural and functional importance. The justification of some hypotheses regarding fitness is incomplete, as well as the evidence for the model's predictive power, since it shows little improvement over neutral models in predicting protein evolution.

    2. Reviewer #1 (Public review):

      Summary:

      Ferreiro et al. present a method to simulate protein sequence evolution under a birth-death model where sequence evolution is constrained by structural constraints on protein stability. The authors then use this model to explore the predictability of sequence evolution in several viral structural proteins. In principle, this work is of great interest to molecular evolution and phylodynamics, which have struggled to couple non-neutral models of sequence evolution to phylodynamic models like birth-death. Unfortunately, though, the model shows little improvement over neutral models in predicting protein evolution, and this ultimately appears to be due to fundamental conceptual problems with how fitness is modeled and linked to the phylodynamic birth-death model.

      Major concerns:

      (1) Fitness model: All lineages have the same growth rate r = b-d because the authors assume b+d=1. But under a birth-death model, the growth r is equivalent to fitness, so this is essentially assuming all lineages have the same absolute fitness since increases in reproductive fitness (b) will simply trade off with decreases in survival (d). Thus, even if the SCS model constrains sequence evolution, the birth-death model does not really allow for non-neutral evolution such that mutations can feed back and alter the structure of the phylogeny.

      (2) Predictive performance: Similar performance in predicting amino acid frequencies is observed under both the SCS model and the neutral model. I suspect that this rather disappointing result owes to the fact that the absolute fitness of different viral variants could not actually change during the simulations (see comment #1).

      (3) Model assessment: It would be interesting to know how much the predictions were informed by the structurally constrained sequence evolution model versus the birth-death model. To explore this, the authors could consider three different models: 1) neutral, 2) SCS, and 3) SCS + BD. Simulations under the SCS model could be performed by simulating molecular evolution along just one hypothetical lineage. Seeing if the SCS + BD model improves over the SCS model alone would be another way of testing whether mutations could actually impact the evolutionary dynamics of lineages in the phylogeny.

      (4) Background fitness effects: The model ignores background genetic variation in fitness. I think this is particularly important as the fitness effects of mutations in any one protein may be overshadowed by the fitness effects of mutations elsewhere in the genome. The model also ignores background changes in fitness due to the environment, but I acknowledge that might be beyond the scope of the current work.

      (5) In contrast to the model explored here, recent work on multi-type birth-death processes has considered models where lineages have type-specific birth and/or death rates and therefore also type-specific growth rates and fitness (Stadler and Bonhoeffer, 2013; Kunhert et al., 2017; Barido-Sottani, 2023). Rasmussen & Stadler (eLife, 2019) even consider a multi-type birth-death model where the fitness effects of multiple mutations in a protein or viral genome collectively determine the overall fitness of a lineage. The key difference with this work presented here is that these models allow lineages to have different growth rates and fitness, so these models truly allow for non-neutral evolutionary dynamics. It would appear the authors might need to adopt a similar approach to successfully predict protein evolution.

    3. Reviewer #2 (Public review):

      Summary:

      In this study, "Forecasting protein evolution by integrating birth-death population models with structurally constrained substitution models", David Ferreiro and co-authors present a forward-in-time evolutionary simulation framework that integrates a birth-death population model with a fitness function based on protein folding stability. By incorporating structurally constrained substitution models and estimating fitness from ΔG values using homology-modeled structures, the authors aim to capture biophysically realistic evolutionary dynamics. The approach is implemented in a new version of their open-source software, ProteinEvolver2, and is applied to four viral proteins from HIV-1 and SARS-CoV-2.

      Overall, the study presents a compelling rationale for using folding stability as a constraint in evolutionary simulations and offers a novel framework and software to explore such dynamics. While the results are promising, particularly for predicting biophysical properties, the current analysis provides only partial evidence for true evolutionary forecasting, especially at the sequence level. The work offers a meaningful conceptual advance and a useful simulation tool, and sets the stage for more extensive validation in future studies.

      Strengths:

      The results demonstrate that fitness constraints based on protein stability can prevent the emergence of unrealistic, destabilized variants - a limitation of traditional, neutral substitution models. In particular, the predicted folding stabilities of simulated protein variants closely match those observed in real variants, suggesting that the model captures relevant biophysical constraints.

      Weaknesses:

      The predictive scope of the method remains limited. While the model effectively preserves folding stability, its ability to forecast specific sequence content is not well supported. Only one dataset (HIV-1 MA) is evaluated for sequence-level divergence using KL divergence; this analysis is absent for the other proteins. The authors use a consensus Omicron sequence as a representative endpoint for SARS-CoV-2, which overlooks the rich longitudinal sequence data available from GISAID. The use of just one consensus from a single time point is not fully justified, given the extensive temporal and geographical sampling available. Extending the analysis to include multiple timepoints, particularly for SARS-CoV-2, would strengthen the predictive claims. Similarly, applying the model to other well-sampled viral proteins, such as those from influenza or RSV, would broaden its relevance and test its generalizability.

      It would also be informative to include a retrospective analysis of the evolution of protein stability along known historical trajectories. This would allow the authors to assess whether folding stability is indeed preserved in real-world evolution, as assumed in their model.

      Finally, a discussion on the impact of structural templates - and whether the fixed template remains valid across divergent sequences - would be valuable. Addressing the possibility of structural remodeling or template switching during evolution would improve confidence in the model's applicability to more divergent evolutionary scenarios.

    4. Author response:

      eLife Assessment

      This manuscript introduces a useful protein-stability-based fitness model for simulating protein evolution and unifying non-neutral models of molecular evolution with phylogenetic models. The model is applied to four viral proteins that are of structural and functional importance. The justification of some hypotheses regarding fitness is incomplete, as well as the evidence for the model's predictive power, since it shows little improvement over neutral models in predicting protein evolution.

      We thank for the constructive comments that helped improve our study. Regarding the comment about justification of fitness, we will include in the revised manuscript additional information to support the relevance of modeling protein evolution accounting for protein folding stability. We agree that increasing the parameterization of the developed birth-death model is interesting, if it does not lead to overfitting. The model presented considers the fitness of protein variants to determine their reproductive success through the corresponding birth and death rates, varying among lineages, and it is biologically meaningful and technically correct (Harmon 2019). Following a suggestion of the first reviewer to allow variation of the global birth-death rate among lineages, we will additionally incorporate this aspect into the model and evaluate its performance with the data for the evaluation of the models. The integration of structurally constrained substitution models of protein evolution, as Markov models, into the birth-death process was made following standards approaches of molecular evolution in population genetics (Yang 2006; Carvajal-Rodriguez 2010; Arenas 2012; Hoban, et al. 2012) and we will provide more information about it in the revised manuscript. Regarding the predictive power, our study showed good accuracy in predicting the real folding stability of forecasted protein variants. On the other hand, predicting the exact sequences proved to be more challenging, indicating needs in the field of substitution models of molecular evolution. Altogether, we believe our findings provide a significant contribution to the field, as accurately forecasting the folding stability of future real proteins is fundamental for predicting their protein function and enabling a variety of applications. Additionally, we implemented the models into a freely available computer framework, with detailed documentation and diverse practical examples.

      Public Reviews:

      Reviewer #1 (Public review):

      Summary:

      Ferreiro et al. present a method to simulate protein sequence evolution under a birth-death model where sequence evolution is constrained by structural constraints on protein stability. The authors then use this model to explore the predictability of sequence evolution in several viral structural proteins. In principle, this work is of great interest to molecular evolution and phylodynamics, which have struggled to couple non-neutral models of sequence evolution to phylodynamic models like birth-death. Unfortunately, though, the model shows little improvement over neutral models in predicting protein evolution, and this ultimately appears to be due to fundamental conceptual problems with how fitness is modeled and linked to the phylodynamic birth-death model.

      We thank the reviewer for the positive comments about our work.

      Regarding predictive power, the study showed a good accuracy in predicting the real folding stability of forecasted protein variants under a selection model, but not under a neutral model. However, predicting the exact sequences was more challenging. For example, amino acids with similar physicochemical properties can result in similar folding stability while differ in the specific sequence, more accurate substitution models of molecular evolution are required in the field. We consider that forecasting the folding stability of future real proteins is an important advancement in forecasting protein evolution, given the essential role of folding stability in protein function and its variety of applications. Regarding the conceptual concerns related to fitness modeling, we clarify this issue in detail in our responses to the specific comments below.

      Major concerns:

      (1) Fitness model: All lineages have the same growth rate r = b-d because the authors assume b+d=1. But under a birth-death model, the growth r is equivalent to fitness, so this is essentially assuming all lineages have the same absolute fitness since increases in reproductive fitness (b) will simply trade off with decreases in survival (d). Thus, even if the SCS model constrains sequence evolution, the birth-death model does not really allow for non-neutral evolution such that mutations can feed back and alter the structure of the phylogeny.

      We thank the reviewer for this comment that aims to improve the realism of our model. In the model presented (but see later for another model derived from the proposal of the reviewer and that we are now implementing into the framework and applying to the data used for the evaluation of the models), the fitness predicted from a protein variant is used to obtain the corresponding birth rate of that variant. In this way, protein variants with high fitness have high birth rates leading to overall more birth events, while protein variants with low fitness have low birth rates resulting in overall more extinction events, which has biological meaning for the study system. The statement “All lineages have the same growth rate r = b-d” in our model is incorrect because, in our model, b and d can vary among lineages according to the fitness. For example, a lineage might have b=0.9, d=0.1, r=0.8, while another lineage could have b=0.6, d=0.4, r=0.2. Indeed, the statement “this is essentially assuming all lineages have the same absolute fitness” is incorrect. Clearly, assuming that all lineages have the same fitness would not make sense, in that situation the folding stability of the forecasted protein variants would be similar under any model, which is not the case as shown in the results. In our model, the fitness affects the reproductive success, where protein variants with a high fitness have higher birth rates leading to more birth events, while those with lower fitness have higher death rates leading to more extinction events. This parameterization is meaningful for protein evolution because the fitness of a protein variant can affect its survival (birth or extinction) without necessarily affecting its rate of evolution. While faster growth rate can sometimes be associated with higher fitness, a variant with high fitness does not necessarily accumulate substitutions at a faster rate. Regarding the phylogenetic structure, the model presented considers variable birth and death events across different lineages according to the fitness of the corresponding protein variants, and this alters the derived phylogeny (i.e., protein variants selected against can go extinct while others with high fitness can produce descendants). We are not sure about the meaning of the term “mutations can feed back” in the context of our system. Note that we use Markov models of evolution, which are well-stablished in the field (despite their limitations), and substitutions are fixed mutations, which still could be reverted later if selected by the substitution model (Yang 2006). Altogether, we find that the presented birth-death model is technically correct and appropriate for modeling our biological system. Its integration with structurally constrained substitution (SCS) models of protein evolution, as Markov models, is correct following general approaches of molecular evolution in population genetics (Yang 2006; Carvajal-Rodriguez 2010; Arenas 2012; Hoban, et al. 2012). We will provide a more detailed description of the model in the revised manuscript.

      Apart from these clarifications about the birth-death model used, we understand the point of the reviewer and following the suggestion we are now incorporating an additional birth-death model that accounts for variable global birth-death rate among lineages. Specifically, we are following the model proposed by Neher et al (2014), where the death rate is considered as 1 and the birth rate is modeled as 1 + fitness. In this model, the global birth-death rate varies among lineages. We are now implementing this model into the computer framework and applying it to the data used for the evaluation of the models. Preliminary results, which will be finally presented in the revised manuscript, indicate that this model yields similar predictive accuracy compared to the previous birth-death model. If this is confirmed, accounting for variability in the global birth-death rate does not appear to play a major role in the studied systems of protein evolution. We will present this additional birth-death model and its results in the revised manuscript.

      (2) Predictive performance: Similar performance in predicting amino acid frequencies is observed under both the SCS model and the neutral model. I suspect that this rather disappointing result owes to the fact that the absolute fitness of different viral variants could not actually change during the simulations (see comment #1).

      The study shows similar performance in predicting the sequences of the forecasted proteins under both the SCS model and the neutral model, but shows differences in predicting the folding stability of the forecasted proteins between these models. Indeed, as explained in the previous answer, the birth-death model accounts for variation in fitness among lineages, leading to differences among lineages in reproductive success. The new birth-death model that we are now implementing, which incorporates variation of the global birth-death rate among lineages, is producing similar preliminary results. In addition to these considerations, it is known that SCS models applied to phylogenetics (such as ancestral molecular reconstruction) can model protein evolution with high accuracy in terms of folding stability. However, inferring sequences (i.e., ancestral sequences) is considerably more challenging even for ancestral molecular reconstruction (Arenas, et al. 2017; Arenas and Bastolla 2020). The observed sequence diversity is much greater than the observed structural diversity (Illergard, et al. 2009; Pascual-Garcia, et al. 2010), and substitutions among amino acids with similar physicochemical properties can result in protein variants with similar folding stability but different specific amino acid sequences; further work is demanded in the field of substitution models of molecular evolution. We will expand the discussion of this aspect in the revised manuscript.

      (3) Model assessment: It would be interesting to know how much the predictions were informed by the structurally constrained sequence evolution model versus the birth-death model. To explore this, the authors could consider three different models: 1) neutral, 2) SCS, and 3) SCS + BD. Simulations under the SCS model could be performed by simulating molecular evolution along just one hypothetical lineage. Seeing if the SCS + BD model improves over the SCS model alone would be another way of testing whether mutations could actually impact the evolutionary dynamics of lineages in the phylogeny.

      In the present study, we compare the neutral model + birth-death (BD) with the SCS model + BD. Markov substitution models Q are applied upon an evolutionary time (i.e., branch length, t) and this allows to determine the probability of substitution events during that time period [P(t) = exp (Qt)]. This approach is traditionally used in phylogenetics to model the incorporation of substitutions over time. Therefore, to compare the neutral and SCS models, an evolutionary time is required, in this case it is provided by the birth-death process. The suggestions 1) and 2) cannot be compared without an underlined evolutionary history. However, comparisons in terms of likelihood, and other aspects, between models that ignore the protein structure and the implemented SCS models are already available in our previous studies based on coalescent simulations or given phylogenetic trees (Arenas, et al. 2013; Arenas, et al. 2015). There, SCS models produced proteins with more realistic folding stability than models that ignore evolutionary constraints from the protein structure, and those findings are consistent with the results from the present study where we explore the application of these models to forecasting protein evolution. We would like to emphasize that forecasting the folding stability of future real proteins is a significant and novel finding, folding stability is fundamental to protein function and has diverse implications. While accurately forecasting the exact sequences would indeed be ideal, this remains a challenging task with current substitution models. In this regard, we will discuss in the revised manuscript the need of developing more accurate substitution models.

      (4) Background fitness effects: The model ignores background genetic variation in fitness. I think this is particularly important as the fitness effects of mutations in any one protein may be overshadowed by the fitness effects of mutations elsewhere in the genome. The model also ignores background changes in fitness due to the environment, but I acknowledge that might be beyond the scope of the current work.

      This comment made us realize that more information about the features of the implemented SCS models should be included in the manuscript. In particular, the implemented SCS models consider a negative design based on the observed residue contacts in nearly all proteins available in the Protein Data Bank (Arenas, et al. 2013; Arenas, et al. 2015). This data is provided as an input file and it can be updated to incorporate new structures (see the framework documentation and the practical examples). Therefore, the prediction of folding stability is a combination of positive design (direct analysis of the target protein) and negative design (consideration of background proteins to reduce biases), thus incorporating background molecular diversity. This important feature was not sufficiently described in the manuscript, and we will add more details in the revised version. Regarding the fitness caused by the environment, we agree with the reviewer. This is a challenge for any method aiming to forecast evolution, as future environmental shifts are inherently unpredictable and may impact the accuracy of the predictions. Although one might attempt to incorporate such effects into the model, doing so risks overparameterization, especially when the additional factors are uncertain or speculative. We will include a discussion in the revised manuscript about our perspective on the potential effects of environmental changes on forecasting evolution.

      (5) In contrast to the model explored here, recent work on multi-type birth-death processes has considered models where lineages have type-specific birth and/or death rates and therefore also type-specific growth rates and fitness (Stadler and Bonhoeffer, 2013; Kunhert et al., 2017; Barido-Sottani, 2023). Rasmussen & Stadler (eLife, 2019) even consider a multi-type birth-death model where the fitness effects of multiple mutations in a protein or viral genome collectively determine the overall fitness of a lineage. The key difference with this work presented here is that these models allow lineages to have different growth rates and fitness, so these models truly allow for non-neutral evolutionary dynamics. It would appear the authors might need to adopt a similar approach to successfully predict protein evolution.

      We agree with the reviewer that robust birth-death models have been developed applying statistics and, in many cases, the primary aim of those studies is the development and refinement of the model itself. Regarding the study by Rasmussen and Stadler 2019, it incorporates an external evaluation of mutation events where the used fitness is specific for the proteins investigated in that study, which may pose challenges for users interested in analyzing other proteins. In contrast, our study takes a different approach. We implement a fitness function that can be predicted and evaluated for any type of protein (Goldstein 2013), making it broadly applicable. In addition, we provide a freely available and well-documented computational framework to facilitate its use. The primary aim of our study is not the development of novel or complex birth-death models. Rather, we aim to explore the integration of a standard birth-death model with structurally constrained substitution models for the purpose of predicting protein evolution. In the context of protein evolution, substitution models are a critical factor (Liberles, et al. 2012; Wilke 2012; Bordner and Mittelmann 2013; Echave, et al. 2016; Arenas, et al. 2017; Echave and Wilke 2017), and their combination with a birth-death model constitutes a first approximation upon which next studies can build to better understand this biological system. We will include these considerations in the revised manuscript.

      Reviewer #2 (Public review):

      Summary:

      In this study, "Forecasting protein evolution by integrating birth-death population models with structurally constrained substitution models", David Ferreiro and co-authors present a forward-in-time evolutionary simulation framework that integrates a birth-death population model with a fitness function based on protein folding stability. By incorporating structurally constrained substitution models and estimating fitness from ΔG values using homology-modeled structures, the authors aim to capture biophysically realistic evolutionary dynamics. The approach is implemented in a new version of their open-source software, ProteinEvolver2, and is applied to four viral proteins from HIV-1 and SARS-CoV-2.

      Overall, the study presents a compelling rationale for using folding stability as a constraint in evolutionary simulations and offers a novel framework and software to explore such dynamics. While the results are promising, particularly for predicting biophysical properties, the current analysis provides only partial evidence for true evolutionary forecasting, especially at the sequence level. The work offers a meaningful conceptual advance and a useful simulation tool, and sets the stage for more extensive validation in future studies.

      We also thank this reviewer for the positive comments on our study. Regarding the predictive power, our results showed good accuracy in predicting the folding stability of the forecasted protein variants. However, predicting the specific sequences of these variants is more challenging. For example, forecasting in amino acids with similar physicochemical properties can result in different sequences but in similar folding stability. We believe that these findings are realistic and interesting as they indicate that while forecasting folding stability is feasible, forecasting the specific sequence evolution is more complex that one could anticipate.

      Strengths:

      The results demonstrate that fitness constraints based on protein stability can prevent the emergence of unrealistic, destabilized variants - a limitation of traditional, neutral substitution models. In particular, the predicted folding stabilities of simulated protein variants closely match those observed in real variants, suggesting that the model captures relevant biophysical constraints.

      We agree with the reviewer and appreciate the consideration that forecasting the folding stability of future real proteins is a relevant finding. For instance, folding stability is fundamental for protein function and affects several other molecular properties.

      Weaknesses:

      The predictive scope of the method remains limited. While the model effectively preserves folding stability, its ability to forecast specific sequence content is not well supported.

      It is known that structurally constrained substitution (SCS) models applied to phylogenetics (such as ancestral molecular reconstruction) can model protein evolution with high accuracy in terms of folding stability, while inferring sequences (i.e., ancestral sequences) remains considerably more challenging (Arenas, et al. 2017; Arenas and Bastolla 2020). The observed sequence diversity is much higher than the observed structural diversity (Illergard, et al. 2009; Pascual-Garcia, et al. 2010), and substitutions between amino acids with similar physicochemical properties can result in protein variants with similar folding stability but with different specific amino acid composition. We will expand the discussion of this aspect in the manuscript.

      Only one dataset (HIV-1 MA) is evaluated for sequence-level divergence using KL divergence; this analysis is absent for the other proteins. The authors use a consensus Omicron sequence as a representative endpoint for SARS-CoV-2, which overlooks the rich longitudinal sequence data available from GISAID. The use of just one consensus from a single time point is not fully justified, given the extensive temporal and geographical sampling available. Extending the analysis to include multiple timepoints, particularly for SARS-CoV-2, would strengthen the predictive claims. Similarly, applying the model to other well-sampled viral proteins, such as those from influenza or RSV, would broaden its relevance and test its generalizability.

      The evaluation of forecasting evolution using real datasets is complex due to several conceptual and practical aspects. In contrast to traditional phylogenetic reconstruction of past evolutionary events and ancestral sequences, forecasting evolution often begins with a variant that is evolved forward in time and requires a rough fitness landscape to select among possible future variants (Lässig, et al. 2017). Another concern for validating the method is the need to know the initial variant that gives rise to the corresponding forecasted variants, and it is not always known. Thus, we investigated systems where the initial variant, or a close approximation, is known, such as scenarios of in vitro monitored evolution. In the case of SARS-CoV-2, the Wuhan variant is commonly used as the starting variant of the pandemic. Next, since forecasting evolution is highly dependent on the used model of evolution, unexpected external factors can be dramatic for the predictions. For this reason, systems with minimal external influences provide a more controlled context for evaluating forecasting evolution. For instance, scenarios of in vitro monitored virus evolution avoid some external factors such as host immune response. Another important aspect is the availability of data at two (i.e., present and future) or more time points along the evolutionary trajectory, with sufficient genetic divergence between them to identify clear evolutionary signatures. Additionally, using consensus sequences can help mitigate effects from unfixed mutations, which should not be modeled by a substitution model of evolution. Altogether, not all datasets are appropriate to properly evaluate forecasting evolution. We will include these considerations in the revised manuscript.

      Sequence comparisons based on the KL divergence require, at the studied time point, an observed distribution of amino acid frequencies among sites and an estimated distribution of amino acid frequencies among sites. In the study datasets, this is only the case for the HIV-1 MA dataset, which belongs to a previous study from one of us and collaborators where we obtained at least 20 independent sequences at each sampling point (Arenas, et al. 2016). We will provide additional information on this aspect in the manuscript.

      Regarding the Omicron dataset, we used 384 curated sequences of the Omicron variant of concern to construct the study dataset and we believe that it is a representative sample. The sequence used for the initial time point was the Wuhan variant (Wu, et al. 2020), which is commonly assumed to be the origin of the pandemic in SARS-CoV-2 studies. As previously indicated, the use of consensus sequences is convenient to avoid variants with unfixed mutations. Regarding extending the analysis to other timepoints (other variants of concern), we kindly disagree because Omicron is the variant of concern with the highest genetic distance to the Wuhan variant, and a high genetic distance is required to properly evaluate the prediction method. We noted that earlier variants of concern show a small number of fixed mutations in the study proteins, despite the availability of large numbers of sequences in databases such as GISAID.

      Additionally, we investigated the evolutionary trajectories of HIV-1 protease (PR) in 12 intra-host viral populations.

      Next, following the proposal of the reviewer, we will incorporate the analysis of an additional viral dataset (probably influenza following the suggestion of the reviewer) to further assess the generalizability of the method. Still, as previously indicated, not all datasets are suitable for a proper evaluation of forecasting evolution. Factors such as the shape of the fitness landscape and the amount of genetic variation over time can influence the accuracy of predictions. We will present the results of the analysis of the new data in the revised manuscript.

      It would also be informative to include a retrospective analysis of the evolution of protein stability along known historical trajectories. This would allow the authors to assess whether folding stability is indeed preserved in real-world evolution, as assumed in their model.

      Our present study is not focused on investigating the evolution of the folding stability over time, although it provides this information indirectly at the studied time points. Instead, the present study shows that the folding stability of the forecasted protein variants is similar to the folding stability of the corresponding real protein variants for diverse viral proteins, which is an important evaluation of the method. Next, the folding stability can indeed vary over time in both real and modeled evolutionary scenarios, and our present study is not in conflict with this. In that regard, which is not the aim of our present study, some previous phylogenetic-based studies have reported temporal fluctuations in folding stability for diverse data (Arenas, et al. 2017; Olabode, et al. 2017; Arenas and Bastolla 2020; Ferreiro, et al. 2022).

      Finally, a discussion on the impact of structural templates - and whether the fixed template remains valid across divergent sequences - would be valuable. Addressing the possibility of structural remodeling or template switching during evolution would improve confidence in the model's applicability to more divergent evolutionary scenarios.

      This is an important point. For the datasets that required homology modeling (in several cases it was not necessary because the sequence was present in a protein structure of the PDB), the structural templates were selected using SWISS-MODEL, and we applied the best-fitting template. We will include additional details about the parameters of the homology modeling in the revised version. Indeed, our method assumes that the protein structure is maintained over the studied evolutionary time, which can be generally reasonable for short timescales where the structure is conserved (Illergard, et al. 2009; Pascual-Garcia, et al. 2010). Over longer evolutionary timescales, structural changes may occur, and in such cases, modeling the evolution of the protein structure would be necessary. To our knowledge, modeling the evolution of the protein structure remains a challenging task that requires substantial methodological developments. Recent advances in artificial intelligence, particularly in protein structure prediction from sequence, may offer promising tools for addressing this challenge. However, we believe that evaluating such approaches in the context of structural evolution would be difficult, especially given the limited availability of real data with known evolutionary trajectories involving structural change. In any case, this is probably an important direction for future research. We will include this discussion in the revised manuscript.

      Cited references

      Arenas M. 2012. Simulation of Molecular Data under Diverse Evolutionary Scenarios. PLoS Comput Biol 8:e1002495.

      Arenas M, Bastolla U. 2020. ProtASR2: Ancestral reconstruction of protein sequences accounting for folding stability. Methods Ecol Evol 11:248-257.

      Arenas M, Dos Santos HG, Posada D, Bastolla U. 2013. Protein evolution along phylogenetic histories under structurally constrained substitution models. Bioinformatics 29:3020-3028.

      Arenas M, Lorenzo-Redondo R, Lopez-Galindez C. 2016. Influence of mutation and recombination on HIV-1 in vitro fitness recovery. Molecular Phylogenetics and Evolution 94:264-270.

      Arenas M, Sanchez-Cobos A, Bastolla U. 2015. Maximum likelihood phylogenetic inference with selection on protein folding stability. Molecular Biology and Evolution 32:2195-2207.

      Arenas M, Weber CC, Liberles DA, Bastolla U. 2017. ProtASR: An Evolutionary Framework for Ancestral Protein Reconstruction with Selection on Folding Stability. Systematic Biology 66:1054-1064.

      Bordner AJ, Mittelmann HD. 2013. A new formulation of protein evolutionary models that account for structural constraints. Molecular Biology and Evolution 31:736-749.

      Carvajal-Rodriguez A. 2010. Simulation of genes and genomes forward in time. Current Genomics 11:58-61.

      Echave J, Spielman SJ, Wilke CO. 2016. Causes of evolutionary rate variation among protein sites. Nature Reviews Genetics 17:109-121.

      Echave J, Wilke CO. 2017. Biophysical Models of Protein Evolution: Understanding the Patterns of Evolutionary Sequence Divergence. Annu Rev Biophys 46:85-103.

      Ferreiro D, Khalil R, Gallego MJ, Osorio NS, Arenas M. 2022. The evolution of the HIV-1 protease folding stability. Virus Evol 8:veac115.

      Goldstein RA. 2013. Population Size Dependence of Fitness Effect Distribution and Substitution Rate Probed by Biophysical Model of Protein Thermostability. Genome Biol Evol 5:1584-1593.

      Harmon LJ. 2019. Introduction to birth-death models. In. Phylogenetic Comparative Methods. p. https://lukejharmon.github.io/pcm/chapter10_birthdeath/.

      Hoban S, Bertorelle G, Gaggiotti OE. 2012. Computer simulations: tools for population and evolutionary genetics. Nature Reviews Genetics 13:110-122.

      Illergard K, Ardell DH, Elofsson A. 2009. Structure is three to ten times more conserved than sequence--a study of structural response in protein cores. Proteins 77:499-508.

      Lässig M, Mustonen V, Walczak AM. 2017. Predicting evolution. Nature Ecology & Evolution 1:0077.

      Liberles DA, Teichmann SA, Bahar I, Bastolla U, Bloom J, Bornberg-Bauer E, Colwell LJ, de Koning AP, Dokholyan NV, Echave J, et al. 2012. The interface of protein structure, protein biophysics, and molecular evolution. Protein Science 21:769-785.

      Neher RA, Russell CA, Shraiman BI. 2014. Predicting evolution from the shape of genealogical trees. Elife 3.

      Olabode AS, Kandathil SM, Lovell SC, Robertson DL. 2017. Adaptive HIV-1 evolutionary trajectories are constrained by protein stability. Virus Evol 3:vex019.

      Pascual-Garcia A, Abia D, Mendez R, Nido GS, Bastolla U. 2010. Quantifying the evolutionary divergence of protein structures: the role of function change and function conservation. Proteins 78:181-196.

      Wilke CO. 2012. Bringing molecules back into molecular evolution. PLoS Comput Biol 8:e1002572.

      Wu F, Zhao S, Yu B, Chen YM, Wang W, Song ZG, Hu Y, Tao ZW, Tian JH, Pei YY, et al. 2020. A new coronavirus associated with human respiratory disease in China. Nature 579:265-269.

      Yang Z. 2006. Computational Molecular Evolution. Oxford, England.: Oxford University Press.

    1. eLife Assessment

      This study presents a valuable assessment of increased similarity in visual appearance combined with an increased chemical difference between two butterfly species in sympatry compared with differences between three populations of one of the two species in allopatry. While the evidence is solid, its interpretation in terms of evolutionary responses to shared predators (visual signals) and avoiding between-species mating (chemical signals) is overstated due to the lack of direct experimental evidence.

    2. Reviewer #1 (Public review):

      Summary:

      In this study, Ledamoisel et al. examined the evolution of visual and chemical signals in closely related Morpho butterfly species to understand their role in species coexistence. Using an integrative, state-of-the-art approach combining spectrophotometry, visual modeling, and behavioral mate choice experiments, they quantified differences in wing iridescence and assessed its influence on mate preference in allopatry and sympatry. They also performed chemical analyses to determine whether sympatric species exhibit divergent chemical cues that may facilitate species recognition and mate discrimination. The authors found iridescent coloration to be similar in sympatric Morpho species. Furthermore, male mate choice experiments revealed that in sympatry, males fail to discriminate conspecific females based on coloration, reinforcing the idea that visual signal convergence is primarily driven by predation pressure. In contrast, the divergence of chemical signals among sympatric species suggests their potential role in facilitating species recognition and mate discrimination. The authors conclude that interactions between ecological pressures and signal evolution may shape species coexistence.

      Strengths:

      The study is well-designed and integrates multiple methodological approaches to provide a thorough assessment of signal evolution in the studied species. I appreciate the authors' careful consideration of multiple selective pressures and their combined influence on signal divergence and convergence. Additionally, the inclusion of both visual and chemical signals adds an interesting and valuable dimension to the study, enhancing its importance. Beyond butterflies, this research broadens our understanding of multimodal communication and signal evolution in the context of species coexistence.

      Weaknesses:

      (1) The broader significance of the findings needs to be better articulated. While the authors emphasize that comparing adaptive traits in sympatry and allopatry provides insights into selective processes shaping reproductive isolation and coexistence, it is unclear what key conceptual or theoretical questions are being addressed. Are these patterns expected under certain evolutionary scenarios? Have they been empirically demonstrated in other systems? The authors should explicitly state the overarching research question, incorporate some predictions, and better contextualize their findings within the existing literature. If the results challenge or support previous work, that should be highlighted to strengthen the study's importance in a broader context.

      (2) The motivation for studying visual signals and mate choice in allopatric populations (i.e., at the intraspecific level) is not well articulated, leaving their role in the broader narrative unclear. In particular, the rationale behind experiments 1, 2, and 3 is not well defined, as the authors have not made a strong case for the need for these intraspecific comparisons in the introduction. This issue is further compounded by the authors' primary focus on signal evolution in sympatry throughout both the results and the discussion. For instance, the divergence of iridescence in allopatry is a potentially interesting result. But the authors have not discussed its implications.

      Overall, given that the primary conclusions are based on results and analyses in sympatry, the role of allopatric populations in shaping these conclusions needs to be better integrated and justified. Without a stronger link between the comparative framework and the study's key takeaways, the use of allopatric populations feels somewhat peripheral rather than central to the study's aim. Since the primary conclusions remain valid even without the allopatric comparisons, their inclusion requires a clearer rationale.

      (3) While the authors demonstrate that iridescence is indistinguishable to predators in sympatry, they overstate the role of predation in driving convergence. The present study does not experimentally demonstrate that iridescence in this species has a confusion effect or contributes to evasive mimicry. Alternatively, convergence could result from other selective forces, such as signal efficacy due to environmental conditions, rather than being solely driven by predation.

    3. Reviewer #2 (Public review):

      This study presents an investigation of the visual and chemical properties and mating behaviour in Morpho butterflies, aimed at addressing the nature of divergence between closely related species in sympatry. The study species consists of three subspecies of Morpho helenor (bristowi, theodorus, and helenor), and the conspecific Morpho achilles achilles. The authors postulate that whereas the iridescent blue signals of all (sub)species should function as a predator reduction signal (similar to aposematism) and therefore exhibit convergence, the same signals should indicate divergence if used as a mating signal, particularly in sympatric populations. They also assess chemical profiles among the species to assess the potential utility of scent in mediating species/sex discrimination.

      The authors first used reflectance spectrometry to calculate hue, brightness, and chroma, plus two measures of "iridescence" (perhaps better phrased as angular dependence) in each (sub)species. This indicated the ubiquitous presence of sexual dimorphism in brightness (males brighter), which also appears to be the case for iridescence (Figure 3A-B). Analysis of these data also indicated that whereas there is evidence for divergence among subspecies in allopatry, the same evidence is lacking for species in sympatry (P = 0.084). This was supported further by visual modelling, which showed that both conspecifics and birds should be (theoretically) capable of perceiving the colour difference among allopatric populations of M. helenor, whereas the same is not true for the sympatric species.

      The authors then conducted mate choice trials, first using live individuals and second using female dummies. The live experiments indicated the presence of assortative mating among the two subspecies of M. helenor (bristowi and theodorus). The dummy presentations indicated (a) bristowi males prefer conspecific wings, whereas theodorus have no preference, (b) bristowi males prefer the con(sub)specific colour pattern, (c) theodorus prefer the con(sub)specific iridescence when the pattern is manipulated to be similar among female dummies. A fourth experiment, using sympatric M. achilles and M. helenor, indicated no preference for conspecific female dummies. Finally, chemical analysis indicated substantial differences between these two species in putative pheromone compounds, and especially so in the males.

      The authors conclude that the similarity of iridescence among species in sympatry is suggestive of convergence upon a common anti-predation signal. Despite some behavioural evidence in favour of colour (iridescence)-based mate discrimination, chemical differences between Achilles and Helenor are posed as more likely to function for species isolation than visual differences.

      Overall, I enjoyed reading this manuscript, which presents a valiant attempt at studying visual, chemical and behavioural divergence in this iconic group of butterflies.

      Major comments

      My only major comment concerns the authors' favoured explanation for aposematism (or evasive mimicry) for convergence among species, which is based upon the you-can't-catch-me hypothesis first presented by Young 1971. Although there is supporting work showing that iridescent-like stimuli are more difficult to precisely localize by a range of viewers, most of the evidence as applied to the Morpho system is circumstantial, and I'm not certain that there is widespread acceptance of this hypothesis. Given that the present study deals with closely-related (sub)species, one alternative explanation - a "null" hypothesis of sorts - is for a lack of divergence (from a common starting point) as opposed to evolutionary convergence per se. in other words, two subspecies are likely to retain ancestral character states unless there is selection that causes them to diverge. I feel that the manuscript would benefit from a discussion of this alternative, if not others. Signalling to predators could very well be involved in constraining the extent of convergence, but this seems a little premature to state as an up-front conclusion of this work. There is also the result of a *dorsal* wing manipulation by Vieira-Silva et al. 2024 (https://doi.org/10.1111/eth.13517), which seems difficult to reconcile in light of this explanation. Whereas this paper is cited by the authors, a more nuanced discussion of their experimental results would seem appropriate here.

    4. Reviewer #3 (Public review):

      The authors investigated differences in iridescence wing colouration of allopatric (geographically separated) and sympatric (coexisting) Morpho butterfly (sub)species. Their aim was to assess if iridescence wing colouration of Morpho (sub)species converged or diverged depending on coexistence and if iridescence wing colouration was involved in mating behaviour and reproductive isolation. The authors hypothesize that iridescence wing colouration of different (sub)species should converge in sympatry and diverge in allopatry. In sympatry, iridescence wing colouration can act as an effective antipredator defence with shared benefits if multiple (sub)species share the same colouration. However, shared wing colouration can have potential costs in terms of reproductive interference since wing colouration is often involved in mate recognition. If the benefits of a shared antipredator defence outweigh the costs of reproductive interference, iridescence wing colouration will show convergence and alternative mate recognition strategies might evolve, such as chemical mate recognition. In allopatry, iridescence wing colouration is expected to diverge due to adaptation to different local conditions and no alternative mate recognition is expected.

      Strengths:

      (1) Using allopatric and sympatric (sub)species that are closely related is a powerful way to test evolutionary hypotheses.

      (2) By clearly defining iridescence and measuring colour spectra from a variety of angles, applying different methods, a very comprehensive dataset of iridescence wing colouration is achieved.

      (3) By experimentally manipulating wing coloration patterns, the authors show visual mate recognition for M. h. bristowi and could, in theory, separate different visual aspects of colouration (patterns VS iridescence strength).

      (4) Measurements of chemical profiles to investigate alternative mate recognition strategies in case of convergence of visual signals.

      Weaknesses:

      In my opinion, studies should be judged on the methods and data included, and not on additional measurements that could have been taken or additional treatments/species that should be included, since in most ecological and evolutionary studies, more measurements or treatments/species can always be included. However, studies do need to ensure appropriate replication and appropriate measurements to test their hypothesis AND support their conclusions. The current study failed to ensure appropriate replication, and in various cases, the results do not support the conclusions.

      First, when using allopatric and sympatric (sub)species pairs to test evolutionary hypotheses, replication is important. Ideally, multiple allopatric and sympatric (sub)species pairs are compared to avoid outlier (sub)species or pairs that lead to biased conclusions. Unfortunately, the current study compares 1 allopatric and 1 sympatric (sub)species pair, hence having poor (no) replication on the level of allopatric and sympatric (sub)species pairs.

      Second, chemical profiles were only measured for sympatric species and not for allopatric (sub)species, which limits the interpretation of this data. The allopatric (sub)species could have been measured as non-coexistence "control". If coexistence and convergence in wing colouration drives the evolution of alternative mate recognition signals, such alternative signals should not evolve/diverge for allopatric (sub)species where wing colouration is still a reliable mate recognition cue. More importantly, no details are provided on the quantification of butterfly chemical profiles, which is essential to understand such data. It is unclear how the chemical profiles were quantified and what data (concentrations, ratios, proportions) were used to perform NDMS and generate Figure 5 and the associated statistical tests.

      Third, throughout the discussion, the authors mention that their results support natural selection by predators on iridescent wing colouration, without measuring natural selection by predators or any other measure related to predation. It is unclear by what predators any of the butterfly species are predated on at this point.

      To continue on the interpretation of the data related to selection on specific traits by specific selection agents: This study did not measure any form of selection or any selection agent. Hence, it is not known if iridescent wing colouration is actually under selection by predators and/or mates, if maybe other selection agents are involved or if these traits converge due to genetic correlations with other traits under selection. For example, Iridescent colouration in ground beetles has functions as antipredator defence but also thermo- and water regulation. None of these issues are recognized or discussed.

      Finally, some of the results are weakly supported by statistics or questionable methodology.

      Most notably, the perception of the iridescence coloration of allopatric subspecies by bird visual systems. Although for females, means and errors (not indicated what exactly, SD, SE or CI) are clearly above the 1 JND line, for males, means are only slightly above this line and errors or CIs clearly overlap with the 1 JND line. Since there is no additional statistical support, higher means but overlap of SD, SE or CI with the baseline provides weak statistical support for differences.

      Regarding the assortative mating experiment, the results are clearly driven by M. bristowi. For M. theodorus, females mate equally often with conspecifics (6 times) as with M. bristowi (5 times). For males, the ratio is slightly better (6 vs 3), but with such low numbers, I doubt this is statistically testable. Overall low mating for M. bristowi could indicate suboptimal experimental conditions, and hence results should be interpreted with care.

      Regarding the wing manipulation experiment, M. theodorus does not show a preference when dummies with non-modified wings are presented and prefers non-modified dummies over modified dummies. This is acknowledged by the authors but not further discussed. Certainly, some control treatment for wing modification could have been added.

      Overall, the fact that certain measurements only provide evidence for 1 of the 2 (sub)species (assortative mating, wing manipulation) or one sex of one of the species (bird visual systems) means overall interpretation and overgeneralization of the results to both allopatric or sympatric species should be done with care, and such nuances should ideally be discussed.

      The aim of the authors, "to investigate the antagonistic effects of selective pressures generated by mate recognition and shared predation" has not been achieved, and the conclusions regarding this aim are not supported by the results. Nevertheless, the iridescence colour measurements are solid, and some of the behavioural experiments and chemical profile measurements seem to yield interesting results. The study would benefit from less overinterpretation of the results in the framework of predation and more careful consideration of methodological difficulties, statistical insecurities, and nuances in the results.

    5. Author response:

      Reviewer #1 (Public review):

      (1) The broader significance of the findings needs to be better articulated. While the authors emphasize that comparing adaptive traits in sympatry and allopatry provides insights into selective processes shaping reproductive isolation and coexistence, it is unclear what key conceptual or theoretical questions are being addressed. Are these patterns expected under certain evolutionary scenarios? Have they been empirically demonstrated in other systems? The authors should explicitly state the overarching research question, incorporate some predictions, and better contextualize their findings within the existing literature. If the results challenge or support previous work, that should be highlighted to strengthen the study's importance in a broader context.

      We thank the reviewer for their valuable feedback. We understand that the framing of the results and the discussion did not allow to highlight the broader significance of our findings. In the revised version of the manuscript, we will explicitly mention the theoretical questions asked and our hypotheses in the introduction, and better compare our results to pre-existing examples from the literature.

      (2) The motivation for studying visual signals and mate choice in allopatric populations (i.e., at the intraspecific level) is not well articulated, leaving their role in the broader narrative unclear. In particular, the rationale behind experiments 1, 2, and 3 is not well defined, as the authors have not made a strong case for the need for these intraspecific comparisons in the introduction. This issue is further compounded by the authors' primary focus on signal evolution in sympatry throughout both the results and the discussion. For instance, the divergence of iridescence in allopatry is a potentially interesting result. But the authors have not discussed its implications.

      Overall, given that the primary conclusions are based on results and analyses in sympatry, the role of allopatric populations in shaping these conclusions needs to be better integrated and justified.

      Without a stronger link between the comparative framework and the study's key takeaways, the use of allopatric populations feels somewhat peripheral rather than central to the study's aim.

      Since the primary conclusions remain valid even without the allopatric comparisons, their inclusion requires a clearer rationale.

      We recognize that the current manuscript places more emphasis on the sympatric Morpho population, and that the analysis and the discussion of the results regarding the allopatric Morpho population were underdeveloped. In the revised version, we plan to address this by (1) developing the rationale behind the male choice experiments performed on the allopatric population. We will argue that intraspecific comparison helps identify the traits involved in mate preference within species (iridescent color and/or wing pattern) and that those results can be compared to the interspecific mate choice results to identify the traits involved in species recognition. To explain the relevance of the comparison with the allopatric population, we will also (2) strengthen expectations on the effect of species interactions on the evolution of traits and mate recognition in sympatric populations vs. allopatric populations.

      (3) While the authors demonstrate that iridescence is indistinguishable to predators in sympatry, they overstate the role of predation in driving convergence. The present study does not experimentally demonstrate that iridescence in this species has a confusion effect or contributes to evasive mimicry. Alternatively, convergence could result from other selective forces, such as signal efficacy due to environmental conditions, rather than being solely driven by predation.

      We acknowledge that this study neither demonstrates that iridescence contributes to evasive mimicry nor that predation is the driver of the convergence in iridescence. We will tone down the interpretation of the results in the discussion and state that predation is not the only selective pressure that could have promoted a convergent evolution of iridescence in sympatric species, although this observation is consistent with the evasive mimicry hypothesis.

      Reviewer #2 (Public review):

      My only major comment concerns the authors' favoured explanation for aposematism (or evasive mimicry) for convergence among species, which is based upon the you-can't-catch-me hypothesis first presented by Young 1971. Although there is supporting work showing that iridescent-like stimuli are more difficult to precisely localize by a range of viewers, most of the evidence as applied to the Morpho system is circumstantial, and I'm not certain that there is widespread acceptance of this hypothesis. Given that the present study deals with closely-related (sub)species, one alternative explanation - a "null" hypothesis of sorts - is for a lack of divergence (from a common starting point) as opposed to evolutionary convergence per se. in other words, two subspecies are likely to retain ancestral character states unless there is selection that causes them to diverge. I feel that the manuscript would benefit from a discussion of this alternative, if not others. Signalling to predators could very well be involved in constraining the extent of convergence, but this seems a little premature to state as an up-front conclusion of this work. There is also the result of a *dorsal* wing manipulation by Vieira-Silva et al. 2024 (https://doi.org/10.1111/eth.13517), which seems difficult to reconcile in light of this explanation. Whereas this paper is cited by the authors, a more nuanced discussion of their experimental results would seem appropriate here.

      We thank the reviewer for their constructive comments on our manuscript. We appreciate the reviewer’s concern regarding the way iridescence convergence between sympatric species is discussed in our manuscript, which aligns with similar concerns raised by Reviewer 1. We will improve the discussion on the different evolutionary forces that could have favored this convergent iridescent signal in sympatry to bring more nuance to the discussion.

      Reviewer #3 (Public review):

      First, when using allopatric and sympatric (sub)species pairs to test evolutionary hypotheses, replication is important. Ideally, multiple allopatric and sympatric (sub)species pairs are compared to avoid outlier (sub)species or pairs that lead to biased conclusions. Unfortunately, the current study compares 1 allopatric and 1 sympatric (sub)species pair, hence having poor (no) replication on the level of allopatric and sympatric (sub)species pairs.

      We would like to thank the reviewer for their constructive feedbacks. We agree that replication is important to test evolutionary hypotheses and that our study lacks replication for allopatric and sympatric Morpho populations. Ideally, one would require several allopatric and sympatric replicates pointing respectively toward divergence and convergence of Morpho iridescence to conclude on the effect of species interaction in trait evolution. Our study is a first attempt at answering this question, covering few Morpho populations but proposing a broad assessment of iridescence and mate preference for those populations. We will make sure to mention this limitation more clearly in the revised version of our manuscript.

      Second, chemical profiles were only measured for sympatric species and not for allopatric (sub)species, which limits the interpretation of this data. The allopatric (sub)species could have been measured as non-coexistence "control". If coexistence and convergence in wing colouration drives the evolution of alternative mate recognition signals, such alternative signals should not evolve/diverge for allopatric (sub)species where wing colouration is still a reliable mate recognition cue. More importantly, no details are provided on the quantification of butterfly chemical profiles, which is essential to understand such data. It is unclear how the chemical profiles were quantified and what data (concentrations, ratios, proportions) were used to perform NDMS and generate Figure 5 and the associated statistical tests.

      We recognize that having the chemical profiles of the genitalia of the Morpho from the allopatric population would have made a stronger case arguing in favor of reinforcement acting on the divergence of the chemical compounds found on the genitalia of the sympatric Morpho species. Due to limited access to the biological material needed by the time of the chromatography, we could not test for lower divergence in the chemical profiles of allopatric Morpho butterflies. We will mention this limitation in the results, and clarify the protocol used to extract the chemical profiles, by mentioning the use of concentration data to generate Figure 5 and the associated statistical tests.

      Third, throughout the discussion, the authors mention that their results support natural selection by predators on iridescent wing colouration, without measuring natural selection by predators or any other measure related to predation. It is unclear by what predators any of the butterfly species are predated on at this point.

      We will mention in the next version of the manuscript previous predation experiments performed on Morpho and other butterflies showing evidence that birds can be predators for those species. Those observations lead us to test for the putative effect of predation on the evolution of their color pattern, without directly testing predatory rates. We will make sure this information is transparent in the revised manuscript.

      To continue on the interpretation of the data related to selection on specific traits by specific selection agents: This study did not measure any form of selection or any selection agent. Hence, it is not known if iridescent wing colouration is actually under selection by predators and/or mates, if maybe other selection agents are involved or if these traits converge due to genetic correlations with other traits under selection. For example, Iridescent colouration in ground beetles has functions as antipredator defence but also thermo- and water regulation. None of these issues are recognized or discussed.

      We acknowledge that the lack of discussion on alternative evolutionary forces involved in the evolution of iridescence has been highlighted by all reviewers. We will discuss how environmental factors, genetic factors or the correlation with others traits as explanatory variables might explain the convergent signal of iridescence found in sympatric Morpho species, and not only focus on the putative effect of predation.

      Finally, some of the results are weakly supported by statistics or questionable methodology. Most notably, the perception of the iridescence coloration of allopatric subspecies by bird visual systems. Although for females, means and errors (not indicated what exactly, SD, SE or CI) are clearly above the 1 JND line, for males, means are only slightly above this line and errors or CIs clearly overlap with the 1 JND line. Since there is no additional statistical support, higher means but overlap of SD, SE or CI with the baseline provides weak statistical support for differences.

      We thank the reviewer for bringing interpretation issues concerning the chromatic distances of allopatric Morpho species measured with a bird vision model. We will make sure to bring nuance to the interpretation of this graph, and clearly mention in the figure’s legend that the error bars represent the confidence intervals obtained after performing a bootstrap analysis.

      Regarding the assortative mating experiment, the results are clearly driven by M. bristowi. For M. theodorus, females mate equally often with conspecifics (6 times) as with M. bristowi (5 times). For males, the ratio is slightly better (6 vs 3), but with such low numbers, I doubt this is statistically testable. Overall low mating for M. bristowi could indicate suboptimal experimental conditions, and hence results should be interpreted with care.

      Regarding the wing manipulation experiment, M. theodorus does not show a preference when dummies with non-modified wings are presented and prefers non-modified dummies over modified dummies. This is acknowledged by the authors but not further discussed. Certainly, some control treatment for wing modification could have been added.

      We recognize that the tetrad experiment results are mainly driven by M. bristowi’s behavior. This experiment would have benefited from more replicates. We will mention that the conclusions we draw for this experiment are mainly driven by male M. bristowi behavior, and that it is more difficult to test for assortative or disassortative mating in M. theodorus, adding more nuance to our interpretation. We will also make sure to discuss further the effect of wing modification in the discussion.

      Overall, the fact that certain measurements only provide evidence for 1 of the 2 (sub)species (assortative mating, wing manipulation) or one sex of one of the species (bird visual systems) means overall interpretation and overgeneralization of the results to both allopatric or sympatric species should be done with care, and such nuances should ideally be discussed.

      The aim of the authors, "to investigate the antagonistic effects of selective pressures generated by mate recognition and shared predation" has not been achieved, and the conclusions regarding this aim are not supported by the results. Nevertheless, the iridescence colour measurements are solid, and some of the behavioural experiments and chemical profile measurements seem to yield interesting results. The study would benefit from less overinterpretation of the results in the framework of predation and more careful consideration of methodological difficulties, statistical insecurities, and nuances in the results.

      Overall, we would like to thank all reviewers for their thorough assessment of our work. We understand that the imbalance between mate choice data, visual model data and chemical data only give us a partial assessment of species recognition in Morpho butterflies, thus requiring more precision in the interpretation and the discussion of our results. We will implement all the comments made by the reviewers in the next version of our manuscript.

    1. eLife Assessment

      This study presents a valuable advance for the analysis of gene expression variation at the level of individual cells by introducing a novel reference-free framework that can detect splicing, fusion, editing, immune-receptor diversity and repeated elements in sequencing data. The evidence supporting these claims is solid, with rigorous validation on simulated datasets and extensive analysis of full-length single-cell sequencing data demonstrating improved performance over existing methods. This work will be of particular interest to researchers developing methods for high-resolution transcriptome analysis and to those studying cellular heterogeneity in health and disease.

    2. Reviewer #1 (Public review):

      Summary:

      In this work, the authors have developed SPLASH+, a micro-assembly and biological interpretation framework that expands on their previously published reference-free statistical approach (SPLASH) for sequencing data analysis.

      Strengths:

      (1) The methodology developed by the authors seems like a promising approach to overcome many of the challenges posed by reference-based single-cell RNA-seq analysis methods.

      (2) The analysis of the RNU6 repetitive small nuclear RNA provides a very compelling example of a type of transcript that is very challenging to analyze with standard reference-based methods (e.g., most reads from this gene fail to align with STAR, if I understood the result correctly).

      Weaknesses:

      (1) The manuscript presents a number of case studies from very diverse domains of single-cell RNA-seq analysis. As a result, the manuscript has been challenging to review, because it requires domain expertise in centromere biology, RNA splicing, RNA editing, V(D)J transcript diversity, and repeat polymorphisms.

      (2) Although the paper focuses on SmartSeq2 full-length single-cell RNA-seq data analysis, the vast majority of single-cell RNA-seq data that is currently being generated comes from droplet-based methods (e.g., 10x Genomics) that sequence only the 3' or 5' ends of transcripts. As a result, it is unclear if SPLASH+ is also applicable to these types of data.

      (3) The criteria used for the selection of the 10 'core genes' have not been sufficiently justified.

      (4) It is currently unclear how the splicing diversity discovered in this paper relates to the concept of noisy splicing (i.e., there are likely many low-frequency transcripts and splice junctions that are unlikely to have a significant functional impact beyond triggering nonsense-mediated decay).

      (5) The paper presents only a very superficial discussion of the potential weaknesses of the SPLASH+ method.

      (6) The cursory mention of metatranscriptome in the conclusion of the paper is confusing, as it might suggest the presence of microbial cells in sterile human tissues (which has recently been discredited in cancer, see e.g. https://www.science.org/content/article/journal-retracts-influential-cancer-microbiome-paper).

    3. Reviewer #2 (Public review):

      The authors extend their SPLASH framework with single-cell RNA-seq in mind, in two ways. First, they introduce "compactors", which are possible paths branching out from an anchor. Second, they introduce a workflow to classify compactors according to the type of biological sequence variation represented (splicing, SNV, etc). They focus on simulated data for fusion detection, and then focus on analyzing the Tabula sapiens Smart-seq2 data, showing extensive results on alternative splicing analysis, VDJ, and repeat elements.

      This is strong work with an impressive array of biological investigations and results for a methods paper. I have various concerns about terminology and comparisons, as follows (in a somewhat arbitrary order, apologies).

      (1) The discussion of the weaknesses of the consensus sequence approach of SPLASH is an odd way to motivate SPLASH+ in my opinion, in that SPLASH is not yet so widely used, so the baseline for SPLASH+ is really standard alignment-based approaches. It is fine to mention consensus sequence issues briefly, but it felt belabored.

      (2) Regarding compactors reducing alignment cost: the comparison should really be between compactor construction and alignment vs read alignment (and maybe vs modern contig construction algorithms and alignment).

      (3) The language around "compactors" is a bit confusing, where the authors sometimes refer to the tree of possibilities from an anchor as a "compactor", and sometimes a compactor is a single branch. Presumably, ideally, compactors should be DAGs, not trees, i.e., they can connect back together. Perhaps the authors could comment on whether this matters/would be a valuable extension.

      (4) The main oddness of the splicing analysis to me is not using cell-type/state in any way in the statistical testing. This need not be discrete cell types: psiX, for example, tested whether exonic PSI was variable with reference to a continuous gene expression embedding. Intuitively, such transcriptome-wide signal should be valuable for a) improving power and b) distinguishing cell-type intrinsic/"noisy" from cell-type specific splicing variation. A straightforward way of doing this would be pseudobulking cell types. Possibly a more sophisticated hierarchical model could be constructed also.

      (5) A secondary weakness is that some informative reads will not be used, for example, unspliced reads aligning to an alterantive exons. This relates to the broader weakness of SPLASH that it is blind to changes in coverage that are not linked to a specific anchor (which should be acknowledged somewhere, maybe in the Discussion). In the deeply sequenced SS2 data, this is likely not an issue, but might be more limiting in sparser data. A related issue is that coverage change indicative of, e.g., alternative TSS or TES (that do not also include a change in splice junction use) will not be detected. In fairness, all these weaknesses are shared by LeafCutter. It would be valuable to have a comparison to a more "traditional" splicing analysis approach (pick your favorite of rMATS, MISO, SUPPA).

      (6) "We should note that there is no difference between gene fusions and other RNA variants (e.g., RNA splicing) from a sequence assembly viewpoint". Maybe this is true in an abstract sense, but I don't think it is in reality. AS can produce hundreds of isoforms from the same gene, and be variable across individual cells. Gene fusions are generally less numerous/varied and will be shared across clonal populations, so the complexity is lower. That simplicity is balanced against the challenge that any genes could, in principle, fuse.

      (7) For the fusion detection assessment, SPLASH+ is given the correct anchor for detection. This feels like cheating since this information wouldn't usually be available. Can the authors motivate this? Are the other methods given comparable information? Also, TPM>100 seems like a very high expression threshold for the assessment.

      (8) Why are only 3'UTRs considered and not 5'? Is this because the analysis is asymmetric, i.e., only considering upstream anchors and downstream variation? If so, that seems like a limitation: how much additional variation would you find if including the other direction?

      (9) I don't find the theoretical results very meaningful. Assuming independent reads (equivalently binomial counts) has been repeatedly shown to be a poor assumption in sequencing data, likely due to various biases, including PCR. This has motivated the use of overdispersed distributions such as the negative Binomial and beta binomial. The theory would be valuable if it could say something at a specified level of overdispersion. If not, the caveat of assuming no overdispersion should be clearly stated.

    4. Author response:

      Reviewer #1 (Public review):

      Summary:

      In this work, the authors have developed SPLASH+, a micro-assembly and biological interpretation framework that expands on their previously published reference-free statistical approach (SPLASH) for sequencing data analysis.

      Thank you for this thorough overview of our work.

      Strengths:

      (1) The methodology developed by the authors seems like a promising approach to overcome many of the challenges posed by reference-based single-cell RNA-seq analysis methods.

      Thank you for your positive comment on the potential of our approach to address the limitations of reference-based methods for scRNA-Seq analysis.

      (2) The analysis of the RNU6 repetitive small nuclear RNA provides a very compelling example of a type of transcript that is very challenging to analyze with standard reference-based methods (e.g., most reads from this gene fail to align with STAR, if I understood the result correctly).

      We thank the reviewer for their positive comment. We agree that the variation in RNU6 detected by SPLASH+ underscores the potential of our reference-free method to make discoveries in cases where reference-based approaches fall short.

      Weaknesses:

      (1) The manuscript presents a number of case studies from very diverse domains of single-cell RNA-seq analysis. As a result, the manuscript has been challenging to review, because it requires domain expertise in centromere biology, RNA splicing, RNA editing, V(D)J transcript diversity, and repeat polymorphisms.

      We appreciate the reviewer’s effort in thoroughly evaluating this manuscript, especially given the broad range of biological domains discussed. Our main goal in presenting a wide range of applications was to highlight the key strength of the SPLASH+ framework: its ability to unify diverse biological discoveries within a single method that operates directly on sequencing reads.

      (2) Although the paper focuses on SmartSeq2 full-length single-cell RNA-seq data analysis, the vast majority of single-cell RNA-seq data that is currently being generated comes from droplet-based methods (e.g., 10x Genomics) that sequence only the 3' or 5' ends of transcripts. As a result, it is unclear if SPLASH+ is also applicable to these types of data.

      We thank the reviewer for this comment. Due to the specific data format of barcoded single-cell sequencing platforms such as 10x Genomics, extending the SPLASH framework to support 10x analysis required engineering a specialized preprocessing tool. We have addressed this in a recent work, which is now available as a preprint (https://doi.org/10.1101/2024.12.24.630263).

      (3) The criteria used for the selection of the 10 'core genes' have not been sufficiently justified.

      We chose these genes as SPLASH+ detected regulated splicing for them in nearly all tissues (18 out of 19)  analyzed in our study (i.e., identifying anchors classified as splicing anchors in those tissues). Our subsequent analysis showed that all these genes are involved in either splicing regulation or histone modification. We will further clarify this selection criterion in the revision. 

      (4) It is currently unclear how the splicing diversity discovered in this paper relates to the concept of noisy splicing (i.e., there are likely many low-frequency transcripts and splice junctions that are unlikely to have a significant functional impact beyond triggering nonsense-mediated decay).

      In our analysis, to ensure sufficient read coverage, we considered significant anchors supported by more than 50 reads and detected in over 10 cells. Additionally, our downstream analyses (including splicing analysis) are based on assembled sequences (compactors) generated through our micro-assembly step. This process effectively acts as a denoising step by filtering out sequences likely caused by sequencing errors or with very low read support. However, we agree that the detected splice variants have not been fully functionally characterized, and further functional experiments may be needed.

      (5) The paper presents only a very superficial discussion of the potential weaknesses of the SPLASH+ method.

      We discussed two potential limitations of SPLASH+ in the Conclusions section: (1) it is not suitable for differential gene expression analysis, and (2) although we provide a framework for interpreting and analyzing SPLASH results, further work is still needed to improve the annotation of calls lacking BLAST matches. We will add more discussion for these in the revision. 

      (6) The cursory mention of metatranscriptome in the conclusion of the paper is confusing, as it might suggest the presence of microbial cells in sterile human tissues (which has recently been discredited in cancer, see e.g. https://www.science.org/content/article/journal-retracts-influential-cancer-microbiome-paper).

      We will remove the mention of metatranscriptome in the revised manuscript.

      Reviewer #2 (Public review):

      The authors extend their SPLASH framework with single-cell RNA-seq in mind, in two ways. First, they introduce "compactors", which are possible paths branching out from an anchor. Second, they introduce a workflow to classify compactors according to the type of biological sequence variation represented (splicing, SNV, etc). They focus on simulated data for fusion detection, and then focus on analyzing the Tabula sapiens Smart-seq2 data, showing extensive results on alternative splicing analysis, VDJ, and repeat elements.

      This is strong work with an impressive array of biological investigations and results for a methods paper. I have various concerns about terminology and comparisons, as follows (in a somewhat arbitrary order, apologies).

      Thank you for this thorough overview of our work and your positive comment on the strength of our work.

      (1) The discussion of the weaknesses of the consensus sequence approach of SPLASH is an odd way to motivate SPLASH+ in my opinion, in that SPLASH is not yet so widely used, so the baseline for SPLASH+ is really standard alignment-based approaches. It is fine to mention consensus sequence issues briefly, but it felt belabored.

      We thank the reviewer and agree that the primary comparison for SPLASH+ is with reference-based methods. However, since SPLASH+ builds upon SPLASH, we also aimed to highlight the limitations of the consensus step in original SPLASH and how SPLASH+ addresses them. To maintain the main focus of the paper on comparison with reference-based methods and biological investigations, this discussion with consensus was provided in a Supplementary Figure. We will shorten this discussion in the revision.

      (2) Regarding compactors reducing alignment cost: the comparison should really be between compactor construction and alignment vs read alignment (and maybe vs modern contig construction algorithms and alignment).

      Since the SPLASH framework is fundamentally reference-free and does not require read alignment, we compared the number of sequence alignments for compactors to the total read alignments required by a reference-based method to show that while compactors are aligned to the reference, the number of alignments needed is still orders of magnitude less than a reference-based approach requiring alignment of all the reads.

      (3) The language around "compactors" is a bit confusing, where the authors sometimes refer to the tree of possibilities from an anchor as a "compactor", and sometimes a compactor is a single branch. Presumably, ideally, compactors should be DAGs, not trees, i.e., they can connect back together. Perhaps the authors could comment on whether this matters/would be a valuable extension.

      We thank the reviewer for their comment. We refer to each generated assembled sequence as “a compactor”, and we attempted to make this clear in the paper. We will review the text further to ensure this definition is clear in the revised version.

      (4) The main oddness of the splicing analysis to me is not using cell-type/state in any way in the statistical testing. This need not be discrete cell types: psiX, for example, tested whether exonic PSI was variable with reference to a continuous gene expression embedding. Intuitively, such transcriptome-wide signal should be valuable for a) improving power and b) distinguishing cell-type intrinsic/"noisy" from cell-type specific splicing variation. A straightforward way of doing this would be pseudobulking cell types. Possibly a more sophisticated hierarchical model could be constructed also.

      We appreciate the reviewer’s concern regarding SPLASH+ not using cell type metadata. SPLASH, which performs the core statistical inference in SPLASH+, is an unsupervised tool specifically designed to make biological discoveries without relying on metadata (such as cell type annotations in scRNA-Seq). This is particularly useful in scRNA-seq, where cell type labels could be missing, imprecise, or may miss important within-cell-type variation. As shown in the paper, even without using metadata, SPLASH+ demonstrated improved performance than both SpliZ and Leafcutter (two metadata-dependent tools) in terms of achieving higher concordance and identifying more differentially spliced genes. Regarding pseudobulking, as has been shown in the SpliZ paper (https://doi.org/10.1038/s41592-022-01400-x), pseudobulking requires multiple pseudobulked replicates per cell type for reliable inference, which is often not feasible in scRNA-seq settings, making such methods statistically suboptimal for single-cell studies. We will add a discussion on pseudobulking in the revision. 

      (5) A secondary weakness is that some informative reads will not be used, for example, unspliced reads aligning to an alterantive exons. This relates to the broader weakness of SPLASH that it is blind to changes in coverage that are not linked to a specific anchor (which should be acknowledged somewhere, maybe in the Discussion). In the deeply sequenced SS2 data, this is likely not an issue, but might be more limiting in sparser data. A related issue is that coverage change indicative of, e.g., alternative TSS or TES (that do not also include a change in splice junction use) will not be detected. In fairness, all these weaknesses are shared by LeafCutter. It would be valuable to have a comparison to a more "traditional" splicing analysis approach (pick your favorite of rMATS, MISO, SUPPA).

      We thank the reviewer for their comment. As noted in the Conclusion, the SPLASH framework is not designed for differential gene expression analysis, which relies on quantifying read coverage. Rather, it focuses on detecting differential sequence diversity arising from mechanisms like alternative splicing or RNA editing. We will clarify this limitation further in the revised Conclusion. 

      Regarding splicing evaluation, we have performed extensive comparisons with two widely used and recent methods—SpliZ and Leafcutter—for both bulk and single-cell splicing analysis. While we appreciate the reviewer’s suggestion to include an additional method, given the current length of the paper and the fact that leafcutter has previously been shown to outperform rMATS, MAJIQ, and Cufflinks2

      (https://www.nature.com/articles/s41588-017-0004-9), we believe the current comparisons provide sufficient support for the evaluation of the splicing detection by SPLASH+.

      (6) "We should note that there is no difference between gene fusions and other RNA variants (e.g., RNA splicing) from a sequence assembly viewpoint". Maybe this is true in an abstract sense, but I don't think it is in reality. AS can produce hundreds of isoforms from the same gene, and be variable across individual cells. Gene fusions are generally less numerous/varied and will be shared across clonal populations, so the complexity is lower. That simplicity is balanced against the challenge that any genes could, in principle, fuse.

      We selected the fusion benchmarking dataset solely to evaluate how well compactors reconstruct sequences. Since our goal was to assess the accuracy of reconstructed compactor sequences, we needed a benchmarking dataset with ground truth sequences, which this dataset provides. We had explained our main reason and purpose for selecting fusion dataset in the text, but we will clarify it further in the revision.

      (7) For the fusion detection assessment, SPLASH+ is given the correct anchor for detection. This feels like cheating since this information wouldn't usually be available. Can the authors motivate this? Are the other methods given comparable information? Also, TPM>100 seems like a very high expression threshold for the assessment.

      We agree with the reviewer that the fusion benchmarking dataset should not be used to assess the entire SPLASH+ framework. In fact, we did not use this dataset to evaluate SPLASH+; it was used exclusively to evaluate the performance of compactors as a standalone module. Specifically, we tested how well compactors can reconstruct fusion sequences when provided with seed sequences corresponding to fusion junctions. This aligns with our expectation from compactors in SPLASH+, that they should correctly reconstruct the sequence context for the detected anchors. As noted in our previous response, since our goal was to assess the accuracy of reconstructed compactor sequences, we required a benchmarking dataset with ground truth sequences, which this dataset provides. We will clarify this further in the revision.

      We appreciate the reviewer’s concern that a TPM of 100 is high. In Figure 1C, we presented the full TPM distribution for fusions missed or detected by compactors. The 100 threshold was an arbitrary benchmark to illustrate the clear difference in TPM profiles between these two sets of fusions. We will clarify this point in the revised manuscript.

      (8) Why are only 3'UTRs considered and not 5'? Is this because the analysis is asymmetric, i.e., only considering upstream anchors and downstream variation? If so, that seems like a limitation: how much additional variation would you find if including the other direction?

      We thank the reviewer for their comment. SPLASH+ can, in principle, detect variation in 5’ UTR regions, as demonstrated by the variations observed in the 5’ UTRs of the genes ANPC16 and ARPC2. If sequence variation exists in the 5′ UTR, SPLASH+ can still detect it by identifying an anchor upstream of the variable region, as it directly parses sequencing reads to find anchors with downstream sequence diversity. Even when the variation occurs near the 5′ end of the 5′ UTR, SPLASH+ can still capture this diversity if the user selects a shorter anchor length.

      (9) I don't find the theoretical results very meaningful. Assuming independent reads (equivalently binomial counts) has been repeatedly shown to be a poor assumption in sequencing data, likely due to various biases, including PCR. This has motivated the use of overdispersed distributions such as the negative Binomial and beta binomial. The theory would be valuable if it could say something at a specified level of overdispersion. If not, the caveat of assuming no overdispersion should be clearly stated.

      We appreciate the reviewer’s comment. We will clarify this in the revised paper.

    1. eLife Assessment

      This important study applies an innovative multi-model strategy to implicate the ribosomal protein (RP) encoding genes as candidates causing Hypoplastic Left Heart Syndrome. The evidence from the screen in stem cell-derived cardiomyocytes and whole genome sequencing of human patients, followed by functional analyses of RP genes in fly and fish models, is convincing and supports the authors' claims. This work and methodology applied would be of broad interest to medical biologists working on congenital heart diseases.

    2. Reviewer #1 (Public review):

      Nielsen et al have identified a new disease mechanism underlying hypoplastic left heart syndrome due to variants in ribosomal protein genes that lead to impaired cardiomyocyte proliferation. This detailed study starts with an elegant screen in stem-cell-derived cardiomyocytes and whole genome sequencing of human patients and extends to careful functional analysis of RP gene variants in fly and fish models. Striking phenotypic rescue is seen by modulating known regulators of proliferation, including the p53 and Hippo pathways. Additional experiments suggest that the cell type specificity of the variants in these ubiquitously expressed genes may result from genetic interactions with cardiac transcription factors. This work positions RPs as important regulators of cardiomyocyte proliferation and differentiation involved in the etiology of HLHS, although the downstream mechanisms are unclear.

    3. Reviewer #2 (Public review):

      Tanja Nielsen et al. present a novel strategy for the identification of candidate genes in Congenital Heart Disease (CHD). Their methodology, which is based on comprehensive experiments across cell models, Drosophila and zebrafish models, represents an innovative, refreshing and very useful set of tools for the identification of disease genes, in a field which are struggling with exactly this problem. The authors have applied their methodology to investigate the pathomechanisms of Hypoplastic Left Heart Syndrome (HLHS) - a severe and rare subphenotype in the large spectrum of CHD malformations. Their data convincingly implicates ribosomal proteins (RPs) in growth and proliferation defects of cardiomyocytes, a mechanism which is suspected to be associated with HLHS.

      By whole genome sequencing analysis of a small cohort of trios (25 HLHS patients and their parents), the authors investigated a possible association between RP encoding genes and HLHS. Although the possible association between defective RPs and HLHS needs to be verified, the results suggest a novel disease mechanism in HLHS, which is a potentially substantial advance in our understanding of HLHS and CHD. The conclusions of the paper are based on solid experimental evidence from appropriate high- to medium-throughput models, while additional genetic results from an independent patient cohort are needed to verify an association between RP encoding genes and HLHS in patients.

    1. eLife Assessment

      This study presents an important finding on the role of GATA4 in aging and OA-associated cartilage pathology. The evidence supporting the conclusions is compelling, with rigorous in vitro and in vivo data. The work will be of broad interest to cell biologists and orthopedic clinicians.

    2. Reviewer #1 (Public review):

      Summary:

      This manuscript assesses the differences between young and aged chondrocytes. Through transcriptomic analysis and further assessments in chondrocytes, GATA4 was found to be increased in aged chondrocyte donors compared to young donors. Subsequent mechanistic analysis with lentiviral vectors, siRNAs, and a small molecule was used to study the role of GATA4 in young and old chondrocytes. Lastly, an in vivo study was used to assess the effect of GATA4 expression on osteoarthritis progression in a DMM mouse model.

      Strengths:

      This work linked the overexpression of GATA4 to NF-kB signaling pathway activation, alterations to the TGF-b signaling pathway, and found that GATA4 increased the progression of OA compared to the DMM control group. This indicates that GATA4 contributes to the onset and progression of OA in aged individuals.

      Weaknesses:

      (1) A couple of sentences should be added to the introduction, to emphasize the role GATA4 plays, such as the alterations to the TGF-b signaling pathway and the increased activation of the NF-kB pathway.

      (2) Figure 1F, the GATA4 histology image should be bigger.

      (3) Further discussion should be conducted regarding the reasoning as to why GATA4 increases the phosphorylation of SMAD1/5.

      (4) More information should be included to clarify why GATA4 is thought to be linked to DNA damage and the pathway that is associated with that.

      (5) Please add further information regarding the limitations of the animal study conducted in this work and future plans to assess this.

      (6) In Figure 5, GATA4 should be changed to Gata4 in the graphed portions for consistency.

    3. Reviewer #2 (Public review):

      Summary:

      This study elucidated the impact of GATA4 on aging- and injury-induced cartilage degradation and osteoarthritis (OA) progression, based on the team's finding that GATA expression is positively correlated with aging in human chondrocytes. By integrating cell culture of human chondrocytes, gene manipulation tools (siRNA, lentivirus), biological/biochemical analyses and murine models of post-traumatic OA, the team found that increasing GATA4 levels reduced anabolism and increased catabolism of chondrocytes from young donors, likely through upregulation of the BMP pathway, and that this impact is not correlated with TGF-β stimulation. Conversely, silencing GATA4 by siRNA attenuated catabolism and elevated aggrecan/collagen II biosynthesis of chondrocytes from old donors. The physiological relevance of GATA4 was further validated by the accelerated OA progression observed in lentivirus-infected mice in the DMM model.

      Strengths:

      This is a highly significant and innovative study that provides new molecular insights into cartilage homeostasis and pathology in the context of aging and disease. The experiments were performed in a comprehensive and rigorous manner. The data were interpreted thoroughly in the context of the current literature.

      Weaknesses:

      (1) While it is convincing that GATA4 expression is elevated in elderly individuals, and that it has a detrimental impact on cartilage health, the authors might want to add further discussion on the variability among individual human donors, especially given the finding that the elevation of GATA4 was not observed in chondrocytes from donor O1 (Figure 1G).

      (2) It might also be worth adding additional discussion on the interplay between senescent chondrocytes and the dysfunctional ECM during aging. As noted by the authors, aging is associated with decreased sGAG content and likely degenerative changes in the collagen II network, so the microniche of chondrocytes, and thus cell-matrix crosstalk through the pericellular matrix, is also altered or impaired.

    4. Reviewer #3 (Public review):

      Summary:

      This is an exciting, comprehensive paper that demonstrates the role of GATA4 on OA-like changes in chondrocytes. The authors present elegant reverse translational experiments that justify this mechanism and demonstrate the sufficiency of GATA4 in a mouse model of osteoarthritis (DMM), where GATA4 drove cartilage degeneration and pain in a manner that was significantly worse than DMM alone. This could pave the way for new therapies for OA that account for both structural changes and pain.

      Strengths:

      (1) GATA4 was identified in human chondrocytes.

      (2) IHC and sequencing confirmed GATA4 presence.

      (3) Activation of SMADs is clearly shown in vitro with GATA4 overexpression.

      (4) The role of GATA4 was functionally assessed in vivo using the mouse DMM model, where the authors uncovered that GATA4 worsens OA structure and hyperalgesia in male mice.

      (5) It is interesting that GATA4 is largely known to be found in cardiac cells and to have a role in cardiac repair, metabolism, and inflammation, among other things listed by the authors in the discussion (in liver, lung, pancreas). What could this new knowledge of GATA4 mean for OA as a potentially systemically mediated disease, where cardiac disease and metabolic syndrome are often co-morbid?

      Weaknesses:

      (1) It would be useful to explain why GATA4 was chosen over HIF1a, which was the most differentially expressed.

      (2) In Figure 5, it would be useful to demonstrate the non-surgical or naive limbs to help contextualize OARSI scores and knee hyperalgesia changes.

      (3) While there appear to be GATA4 small-molecule inhibitors in various stages of development that could be used to assess the effects in age-related OA, those experiments are out of scope for the current study.

    1. eLife Assessment

      This important study investigated whether the nuclear receptor Nur77 is regulated by a non-canonical mechanism of ligand-induced disruption of its interaction with RXRg, similar to the family member Nurr1. The overall evidence is solid, but additional mechanisms that have not been fully explored in this study might contribute as well. This manuscript will be of interest to scientists focusing on mechanisms of transcriptional regulation.

    2. Reviewer #1 (Public review):

      Summary:

      This foundational study builds on prior work from this group to reveal the complexities underlying ligand-dependent RXRγ-Nur77 heterodimer formation, offering a compelling re-evaluation of their earlier conclusions. The authors examine how a library of RXR ligands influences the biophysical, structural, and functional properties of Nur77. They find that although the Nur77-RXRγ heterodimer shares notable functional similarities with the Nurr1-RXRα complex, it also exhibits unique features, notably, both dimer dissociation and classical agonist-driven activities. This work advances our understanding of the nuanced behaviors of nuclear receptor heterodimers, which have important implications for health and disease.

      Strengths:

      (1) Builds on previous work by providing a comprehensive analysis that examines whether Nur77-RXRγ heterodimer formation parallels that of the Nurr1-RXRα complex.

      (2) Systematic evaluation of a library of RXR ligands provides a broad survey of functional outputs.

      (3) Careful reanalysis of previous work sheds new light on how NR4A heterodimers function.

      Weaknesses:

      (1) Some conclusions appear overstated or are not well substantiated by the work presented. It's unclear how the data support a non-classical mode of agonism, for example, based on the data shown.

      (2) Some assays have relatively few replicates, with only two in some cases.

    3. Reviewer #1 (Public review):

      Summary:

      This foundational study builds on prior work from this group to reveal the complexities underlying ligand-dependent RXRγ-Nur77 heterodimer formation, offering a compelling re-evaluation of their earlier conclusions. The authors examine how a library of RXR ligands influences the biophysical, structural, and functional properties of Nur77. They find that although the Nur77-RXRγ heterodimer shares notable functional similarities with the Nurr1-RXRα complex, it also exhibits unique features, notably, both dimer dissociation and classical agonist-driven activities. This work advances our understanding of the nuanced behaviors of nuclear receptor heterodimers, which have important implications for health and disease.

      Strengths:

      (1) Builds on previous work by providing a comprehensive analysis that examines whether Nur77-RXRγ heterodimer formation parallels that of the Nurr1-RXRα complex.

      (2) Systematic evaluation of a library of RXR ligands provides a broad survey of functional outputs.

      (3) Careful reanalysis of previous work sheds new light on how NR4A heterodimers function.

      Weaknesses:

      (1) Some conclusions appear overstated or are not well substantiated by the work presented. It's unclear how the data support a non-classical mode of agonism, for example, based on the data shown.

      (2) Some assays have relatively few replicates, with only two in some cases.

    1. eLife Assessment

      This study clarifies that stalled RNA pol II is not sufficient for AID targeting, which is important to the field. The authors provide solid experimental evidence that RNA poll II stalling is not the driving mechanism for AID targeting, and even though the results are generally "negative", they are highly relevant to our current understanding of SHM. The authors propose premature transcription termination as a possible mechanism to determine V gene mutability, but the study does not experimentally address such possibilities. This paper makes investigators rethink the model with which AID finds single-strand DNA in the genome.

    2. Reviewer #1 (Public review):

      Summary:

      In this study, the authors take a closer look at whether AID-mediated SHM occurs at stalled RNA polII complexes. Through experimental and bioinformatic overlaps, authors observe that AID target sites really do not overlap with RNA polII stalling, convergent transcription, or H3K27Ac marks. Rather, AID target sites just exist around transcription start sites. The authors thus bring up an important argument, that RNA poll II stalling is not the driving mechanism for AID targeting. This is important since research groups work with the assumption that transcription stalling drives AID access to single-strand DNA. The authors are also clarifying their previous studies, where they suggested that stalled Spt5-associated RNA polII recruits AID DNA deamination activity.

      Comments:

      Transcription start sites (TSS) of promoter genes. Most AID mutations occur at the first 500 pbs to 1 kb from the TSS of promoters or enhancers, but not in the rest of the transcription module or gene body. To this end, existing literature (including work done by the author(s)) has suggested that transcription stalling or pausing of elongating RNA polymerase and/or chromatin modifications such as H3K27Ac (markers of promoters and enhancers) have something to do with helping AID see single-strand DNA substrates for SHM. These conclusions, initially being drawn from AID's functional interaction with Spt5 and RNA exosome -two factors involved in the resolution of stalled RNA polII - and further supported through co-relative data of AID SHM sites overlapping S2-P RNA polII. As with genomics data, these observations were drawn through the bioinformatic window of overlap by the respective authors of the previously published studies.

      In this study, the authors take a closer look at these overlaps and observe that AID target sites really do not overlap with RNA polII stalling, convergent transcription, or H3K27Ac marks. Rather, AID target sites just exist around transcription start sites that accumulate promoter-proximal terminated transcripts. The authors thus bring up an important argument, that RNA poll II stalling is not the driving mechanism for AID targeting. This is important since research groups work with the assumption that transcription stalling drives AID access to single-strand DNA.

      The authors are clarifying the models and literature that they themselves had set earlier, and are doing this with quite detailed analyses, with some well-done experiments. I feel they need to be heard. The experiments are well done, and the text is well written. Since the study is associative (versus being directly mechanistic) due to constant use of bioinformatics overlaps of SHM genomics data with ChIP data, some concerns will remain (and have been outlined by the authors), but that will be future work.

    3. Reviewer #2 (Public review):

      Summary:

      In this manuscript, Pavri and colleagues examine in-depth how the local transcriptional landscape affects somatic hypermutation (SHM) of variable region genes. They use the human Burkitt lymphoma Ramos cell line as a model system to examine AID-induced SHM.

      The authors delete Emu and demonstrate that the epigenetic marks at the Ig loci do not correlate with their mutability. They define algorithms to map the V gene promoters and their mutational load in Ramos cells overexpressing AID and failed to find a correlation between mutation frequency and nascent transcription or transcription strength or between mutation frequency and polII stalling. Additionally, the authors show that convergent transcription may not be a major player for SHM. The authors additionally knock-in two other human V genes into the endogenous Vh gene in Ramos cells, and again failed to observe any significant correlation between PolII stalling and SHM. The authors also observe a similar lack of correlation between SHM (at the B-18 gene) and nascent transcription features in germinal center B cells. Overall, the authors conclude that mutation patterns in V genes are not linked to transcriptional features but are rather hard-wired into the sequence. The authors propose that premature transcription termination might have a role in promoting AID recruitment and activity at Ig genes.

      Strengths:

      The mechanisms that allow AID recruitment to Ig genes during SHM are very poorly understood. Many mechanisms have been proposed, with most invoking transcriptional features, including stalling, convergent transcription, etc. This work, demonstrating the lack of correlation with the proposed models, is of much importance to the field. The experiments are well done, and even though the results are generally "negative", they are highly relevant to our current understanding of SHM.

      Weaknesses:

      The authors propose premature transcription termination as a possible mechanism to determine V gene mutability, but the study does not experimentally address such possibilities.

      Comments:

      (1) It would be important for the authors to compare their results in Figure S1 at the B1-8 locus with those reported several years ago by Schatz and colleagues (Odegard et al, Immunity, 2005) and discuss if the results are different from what the authors report here. This is important as the first two figures essentially corroborate previous results that the Emu enhancer is important for transcription through the V genes.

      (2) The authors mention that AID recruitment is facilitated by Ig enhancers. Is endogenous AID recruited to the V genes in the absence of Emu in the Ramos cells?

      (3) The authors should explain how their results are different from those reported by the Schatz lab in their recent study (Wu et al, Mol Cell, 2025), demonstrating that ELOF1-mediated transcriptional pausing might promote SHM.

    4. Reviewer #3 (Public review):

      Summary:

      The manuscript by Schoeberlet et al. aims to elucidate the relationship between somatic transcription and nascent transcription. Using PRO-seq data across V regions and 275 non-immunoglobulin targets, the authors show that there is no statistically significant correlation with SHM hotspots and localized Pol II enrichment within V regions. They further confirm this conclusion by comparing SHM levels with reduced transcription and reduced activating epigenetic marks. They have revised the model for SHM regulation to emphasize transcription-independent targeting.

      Comments:

      (1) The sum of the mutation class percentages in Figure 3G should be one hundred percent.

      (2) A quantitative bar of transcription and mutation levels could be added to make it clear across these V regions.

      (3) The authors propose that transcriptional termination may contribute to the boundaries of the SHM (e.g., the ~2 kb from the V promoters). If this is the case, the slowing of Pol II velocity prior to termination would theoretically provide more opportunities for AID to access ssDNA, which should lead to higher mutation rates in regions upstream of termination sites (3-4 kb from TSSs). However, the observed SHM peaks in the V(D)J region, and declines exponentially within 1-2 kb downstream, which seems contradictory. The related statement could be revised.

      (4) Recent ELOF1 stories published by the Schatz and Meng labs should be discussed. ELOF1 could be listed in the model in Figure 7.

    1. eLife Assessment

      This useful study presents a biologically realistic, large-scale cortical model of the rat's non-barrel somatosensory cortex, investigating synaptic plasticity of excitatory connections under varying patterns of external activations and characterizing relations between network architecture and plasticity outcomes. The model offers an impressive level of biological detail, addressing many aspects of the cellular and network anatomy and properties, and investigating their relationships to the biologically plausible plasticity. The numerical simulations appear to be well executed and documented, providing an excellent resource to the community. The evidence supporting the main conclusions is solid with results being more observational in nature, and minor weaknesses relating to the lack of explanatory power of causal relationships and mechanisms.

    2. Reviewer #1 (Public review):

      This paper investigates the dynamics of excitatory synaptic weights under a calcium-based plasticity rule, in long (up to 10 minutes) simulations of a 211,000-neuron biophysically detailed model of a rat cortical network.

      Strengths

      (1) A very detailed network model, with a large number of neurons, connections, synapses, etc., and with a huge number of biological considerations implemented in the model.

      (2) A carefully developed calcium-based plasticity rule, which operates with biologically relevant variables like calcium concentration and NMDA conductances.

      (3) The study itself is detailed and thorough, covering many aspects of the cellular and network anatomy and properties and investigating their relationships to plasticity.

      (4) The model remains stable over long periods of simulations, with the plasticity rule maintaining reasonable synaptic weights and not pushing the network to extremes.

      (5) The variety of insights the authors derive in terms of relationships between the cellular and network properties and dynamics of the synaptic weights are potentially interesting for the field.

      (6) Sharing the model and the associated methods and tools is a big plus.

      Weaknesses

      (1) Conceptually, there seems to be a missed opportunity here in that it is not clear what the network learns to do. The authors present 10 different input patterns, the network does some plasticity, which is then analyzed, but we do not know whether the learning resulted in anything functionally significant. Did the network learn to discriminate the patterns much better than at the beginning, to capture or anticipate the timing of pattern presentation, detect similarities between patterns, etc.? This is important to understand if one wants to assess the significance of synaptic changes due to plasticity. For example, if the network did not learn much new functionally, relative to its initial state, then the observed plasticity could be considered minor and possibly insufficient. In that case, were the network to learn something substantial, one would potentially observe much more extensive plasticity, and the results of the whole study could change, possibly including the stability of the network. While this could be a whole separate study, this issue is of central importance, and it is hard to judge the value of the results when we do not know what the network learned to do, if anything.

      (2) In this study, plasticity occurs only at E-to-E connections but not at others. However, it is well known that inhibitory connections in the cortex exhibit at the very least a substantial short-term plasticity. One would expect that not including these phenomena would have substantial consequences on the results.

      (3) Lines 134-135: "We calibrated layer-wise spontaneous firing rates and evoked activity to brief VPM inputs matching in vivo data from Reyes-Puerta et al. (2015)."

      (4) Can the authors show these results? It is an important comparison, and so it would be great to see firing rates (ideally, their distributions) for all the cell types and layers vs. experimental data, for the evoked and spontaneous conditions.

      (5) That being said, the Reyes-Puerta et al. paper reports firing rates for the barrel cortex, doesn't it? Whereas here, the authors are simulating a non-barrel cortex. Is such a comparison appropriate?

      (6) Comparison with STDP on pages 5-7 and Figure 2: if I got this right, the authors applied STDP to already generated spikes, that is, did not run a simulation with STDP. That seems strange. The spikes they use here were generated by the system utilizing their calcium-based plasticity rule. Obviously, the spikes would be different if STDP was utilized instead. The traces of synaptic weights would then also be different. The comparison therefore is not quite appropriate, is it?

      (7) Section 2.3 and Figure 5: I am not sure this analysis adds much. The main finding is that plasticity occurs more among cells in assemblies than among all cells. But isn't that expected given what was shown in the previous figures? Specifically, the authors showed that for cells that fire more, plasticity is more prominent. Obviously, cells that fire little or not at all won't belong to any assemblies. Therefore, we expect more plasticity in assemblies.

      (8) Section 2.4 and Figure 6: It is not clear that the results truly support the formulation of the section's title ("Synapse clustering contributes to the emergence of cell assemblies, and facilitates plasticity across them") and some of the text in the section. What I can see is that the effect on rho is strong for non-clustered synapses (Figure 6C and Figure S8A). In some cases, it is substantially higher than what is seen for clustered synapses. Furthermore, the wording "synapse clustering contributes to the emergence of cell assemblies" suggests some kind of causal role of clustered synapses in determining which neurons form specific cell assemblies. I do not see how the data presented supports that. Overall, it appears that the story about clustered synapses is quite complicated, with both clustered and non-clustered synapses driving changes in rho across the board.

      (9) Section 2.5 and Figure 7: Can we be certain that it is the edge participation that is a particularly good predictor of synaptic changes and/or strength, as opposed to something simpler? For example, could it be the overall number of synapses, excitatory synapses, or something along these lines, that the source and/or target neurons receive, that determine the rho dynamics? And then, I do not understand the claim that edge participation allows one to "delineate potentiation from depression". The only related data I can find is in Figure 7A3, about which the authors write "this effect was stronger for potentiation than depression". But I don't see what they mean. For both depression and facilitation, the changes observed are in the range of ~12% of probability values. And even if the effect is stronger, does it mean one can "delineate" potentiation from depression better? What does it mean, to "delineate"? If it is some kind of decoding based on the edge participation, then the authors did not show that.

      (10) "test novel predictions in the MICrONS (2021) dataset, which while pushing the boundaries of big data neuroscience, was so far only analyzed with single cells in focus instead of the network as a whole (Ding et al., 2023; Wang et al., 2023)." That is incorrect. For example, the whole work of Ding et al. analyzes connectivity and its relation to the neuron's functional properties at the network level.

      Comments on revisions:

      The authors addressed all my concerns from the previous review, primarily via textual changes such as improved Discussion. Thus, most of the weaknesses raised in the original review are not eliminated - in particular, points 1, and 5-9 - but they are acknowledged and described better. This remains a useful study that should be of interest to researchers in the field.

    3. Reviewer #2 (Public review):

      Summary:

      This paper aims at understanding the effects of plasticity in shaping dynamics and structure of cortical circuits, as well as on how that depends on aspects as network structure and dendritic processing.

      Strengths:

      The level of biological detail included is impressive, and the numerical simulations appear to be well executed. Additionally, they have done a commendable job in open-sourcing the model.

      Weaknesses (after revision):

      - As noted in my initial review, the observation that network activity remains stable without an explicit homeostatic mechanism-while acknowledged by the authors as consistent with previous findings (e.g., Higgins et al., 2014)-is not clearly framed as a replication or validation step in the current manuscript. For instance, the abstract states: "In our exploratory simulations, plasticity acted sparsely and specifically, firing rates and weight distributions remained stable without additional homeostatic mechanisms," without noting that this outcome has been previously reported, albeit in models with different levels of biological detail. Furthermore, in the general response to reviewers, the authors list this as the first item in their summary of phenomena accounted for by the model, which gives the impression that it is being presented as a primary result.<br /> If this finding is instead meant to serve as a necessary validation that prior results continue to hold under the authors' extended modeling framework-including multicompartmental neurons, stochastic synaptic transmission, and a modified calcium-based plasticity rule-this should be made more explicit in both the abstract and main text. Unless there were specific reasons to suspect that these model extensions might disrupt previously observed stability, the conceptual contribution of this validation step remains unclear.<br /> I would encourage the authors to revise the manuscript to clarify the role and novelty of this result in the context of existing literature and to briefly motivate why confirming this property in their model was an important step.

      - While the revised manuscript includes improvements in the discussion of the generality and specificity of the findings, it still offers limited interpretability and mechanistic insight. As it stands, the simulations provide limited understanding of the underlying principles or mechanisms at play, which constrains the broader conclusions that can be drawn from the work.

      - In my first review, I suggested that the comparison with the MICrONS dataset could be made more informative-specifically by showing the same quantification of Figure 7D (7B in the previous version) in a version of the model without plasticity and clarifying the interpretation of Figure 8B, where the data appears to align closely with the model before plasticity.<br /> In their response, the authors explain that several of these features remain largely unchanged before and after plasticity. For example, they note that total $g_{\text{AMPA}}$ increases with $k$-edge indegree even in the initial model configuration. I appreciate this clarification, but it highlights a conceptual point that should be more clearly addressed in the manuscript. If the aspects of the model that align with MICrONS data are already present before plasticity, then these similarities reflect properties of the initial network architecture or baseline dynamics, rather than outcomes shaped by the plasticity process itself.<br /> If this interpretation is correct, it represents an interesting and potentially important finding. However, it is not currently articulated in the text. The manuscript places strong emphasis on the role of plasticity in shaping network structure and dynamics, yet the comparisons with MICrONS data appear to reflect features that do not depend on plasticity. Clarifying this distinction would help readers better appreciate the implications of the model-data comparison and discern which conclusions are genuinely supported by the data.

    4. Reviewer #3 (Public review):

      Summary:

      Ecker et al. utilized a biologically realistic, large-scale cortical model of the rat's non-barrel somatosensory cortex, incorporating a calcium-dependent plasticity rule to examine how various factors influence synaptic plasticity under in vivo-like conditions. Their analysis characterized the resulting plastic changes and revealed that key factors, including the co-firing of stimulus-evoked neuronal ensembles, the spatial organization of synaptic clusters, and the overall network topology, play an important role in affecting the extent of synaptic plasticity.

      Strengths:

      The detailed, large-scale model employed in this study enables the evaluation of diverse factors across various levels that influence the extent of plastic changes. Specifically, it facilitates the assessment of synaptic organization at the subcellular level, network topology at the macroscopic level, and the co-activation of neuronal ensembles at the activity level. Moreover, modeling plasticity under in vivo-like conditions enhances the model's relevance to experiments.

      Weaknesses:

      The paper lacks mechanistic insights into the observed phenomena, particularly regarding aspects that are typically inaccessible in traditional simplified models, such as layer-specific and layer-to-layer pathway-specific plasticity changes.

    5. Author response:

      The following is the authors’ response to the original reviews

      General response 

      Our modeling study integrates recent experimental advances on dendritic physiology, biophysical plasticity rules, and network connectivity motifs into a single model, aiming to clarify their hypothesized inseparable functional roles in neocortical learning. By modelling excitatory plasticity in multi-synaptic connections on dendrites within a network with biologically constrained higher-order structure, we show these aspects are sufficient to account for a wide range of interesting phenomena: First, the calcium-based plasticity rule acted sparsely and specifically, keeping the network stable without requiring homeostatic mechanisms or inhibitory plasticity, as usually employed for models based on STDP rules. Most importantly, simulations of the network initiated in a recurrent-excitation induced synchronous state transitioned to an in vivo-like asynchronous state, and remained there. Second, plastic changes were stimulus-dependent and could be predicted by neurons’ membership in functional assemblies, spatial clustering of synapses on dendrites, and the topology of the network’s connectivity. Several of our predictions could be confirmed by comparison to the MICrONS dataset.

      Our study thus aims to provide a first broad exploration of these phenomena and their interactions in a model, as well as a foundation for future studies that examine specific aspects more deeply. Specific concerns of the reviewers about parameter choices (reviewer 2’s 2nd point - 2.2), claims about stability (2.1 and 3.1), the STDP control (1.5), and the motivation behind network metrics (1.8, 2.3) are addressed in detail below and in the revised manuscript.

      Reviewer #1 (Public review): 

      This paper investigates the dynamics of excitatory synaptic weights under a calcium-based plasticity rule, in long (up to 10 minutes) simulations of a 211,000-neuron biophysically detailed model of a rat cortical network. 

      Strengths 

      (1) A very detailed network model, with a large number of neurons, connections, synapses, etc., and with a huge number of biological considerations implemented in the model. 

      (2) A carefully developed calcium-based plasticity rule, which operates with biologically relevant variables like calcium concentration and NMDA conductances. 

      (3) The study itself is detailed and thorough, covering many aspects of the cellular and network anatomy and properties and investigating their relationships to plasticity. 

      (4) The model remains stable over long periods of simulations, with the plasticity rule maintaining reasonable synaptic weights and not pushing the network to extremes. 

      (5) The variety of insights the authors derive in terms of relationships between the cellular and network properties and dynamics of the synaptic weights are potentially interesting for the field. 

      (6) Sharing the model and the associated methods and tools is a big plus. 

      We thank the reviewer for their comments.

      Weaknesses 

      (1) Conceptually, there seems to be a missed opportunity here in that it is not clear what the network learns to do. The authors present 10 different input patterns, the network does some plasticity, which is then analyzed, but we do not know whether the learning resulted in anything functionally significant. Did the network learn to discriminate the patterns much better than at the beginning, to capture or anticipate the timing of pattern presentation, detect similarities between patterns, etc.? This is important to understand if one wants to assess the significance of synaptic changes due to plasticity. For example, if the network did not learn much new functionally, relative to its initial state, then the observed plasticity could be considered minor and possibly insufficient. In that case, were the network to learn something substantial, one would potentially observe much more extensive plasticity, and the results of the whole study could change, possibly including the stability of the network. While this could be a whole separate study, this issue is of central importance, and it is hard to judge the value of the results when we do not know what the network learned to do, if anything. 

      (1.1) The reviewer raises a very interesting point of discussion. As they remarked, it is very hard to judge what the network learned to do. However, our model was not designed to solve a specific task and even defining precisely what "learning" entails in a primary sensory region is still an open question. As many before us, we hypothesized that one of the roles of the primary somatosensory cortex would be to represent stimuli features and that most of the learning process would happen in an unsupervised manner. This is indeed what we have demonstrated by showing the stimulus-specificity of changes as well as an increase of reliability of assembly sequences between repetitions after plasticity. We have added this to the Discussion in lines 523-525.

      (2) In this study, plasticity occurs only at E-to-E connections but not at others. However, it is well known that inhibitory connections in the cortex exhibit at the very least a substantial short-term plasticity. One would expect that not including these phenomena would have substantial consequences on the results.

      (1.2) This is indeed well known. Please consider that we do have short-term plasticity (called synapse dynamics in the manuscript) at all connections, including inhibitory ones. We thank the reviewer for pointing out this potential confusion in the wording. We have now clarified this  in the Methods in lines: 691-697. Furthermore, we have listed not having long-term plasticity at inhibitory connections in the limitations part of the Discussion in line: 593.

      (3) Lines 134-135: "We calibrated layer-wise spontaneous firing rates and evoked activity to brief VPM inputs matching in vivo data from Reyes-Puerta et al. (2015)."

      (4) Can the authors show these results? It is an important comparison, and so it would be great to see firing rates (ideally, their distributions) for all the cell types and layers vs. experimental data, for the evoked and spontaneous conditions. 

      (1.3) The layer- and cell type specific spontaneous firing rates were indeed hidden in the Methods and on Supplementary Figure S3. We now reference that figure in the Results in line: 136. Furthermore, we have amended Supplementary Figure S3 (panel A2), to show these rates in the evoked state as well.

      (5) That being said, the Reyes-Puerta et al. paper reports firing rates for the barrel cortex, doesn't it? Whereas here, the authors are simulating a non-barrel cortex. Is such a comparison appropriate?

      (1.4) As correctly pointed out by the reviewer, we made the assumption that these rates would generalize to the whole S1 because of the sparsity of experimental data. This assumption is discussed in length in Isbister et al. (2023) and now in the limitations part of the Discussion in lines: 564-568.

      (6) Comparison with STDP on pages 5-7 and Figure 2: if I got this right, the authors applied STDP to already generated spikes, that is, did not run a simulation with STDP. That seems strange. The spikes they use here were generated by the system utilizing their calcium-based plasticity rule. Obviously, the spikes would be different if STDP was utilized instead. The traces of synaptic weights would then also be different. The comparison therefore is not quite appropriate, is it?

      (1.5) Yes, the reviewer's understanding is correct. However, considering the findings of Morrison et al. 2007 [PMID: 17444756], and Zenke et al. 2017 [PMID: 28431369] (cited in the manuscript in lines: 165-166), running STDP in a closed loop simulation would most likely make the network “blow up” because of the positive feedback loop. Thus, we argue that our comparison is more conservative, since by using pre-generated spikes, we opened the loop and avoided positive feedback. This is now further explained in lines: 166-167.

      (7) Section 2.3 and Figure 5: I am not sure this analysis adds much. The main finding is that plasticity occurs more among cells in assemblies than among all cells. But isn't that expected given what was shown in the previous figures? Specifically, the authors showed that for cells that fire more, plasticity is more prominent. Obviously, cells that fire little or not at all won't belong to any assemblies. Therefore, we expect more plasticity in assemblies.

      (1.6) We thank the reviewer for this comment. We added additional panels (G1 and G2) to Figure 5 (and describe their content in lines: 329-337) showing that this is not the case. Firing-rate alone is indeed predictive of plastic changes, but co-firing in assemblies is even more so.

      (8) Section 2.4 and Figure 6: It is not clear that the results truly support the formulation of the section's title ("Synapse clustering contributes to the emergence of cell assemblies, and facilitates plasticity across them") and some of the text in the section. What I can see is that the effect on rho is strong for non-clustered synapses (Figure 6C and Figure S8A). In some cases, it is substantially higher than what is seen for clustered synapses. Furthermore, the wording "synapse clustering contributes to the emergence of cell assemblies" suggests some kind of causal role of clustered synapses in determining which neurons form specific cell assemblies. I do not see how the data presented supports that. Overall, it appears that the story about clustered synapses is quite complicated, with both clustered and non-clustered synapses driving changes in rho across the board. 

      (1.7) We agree with the reviewer, it is “quite complicated” and we also see that the writing could have been better/more precise and supported by the data shown on the Figure. We updated both the section title and a big chunk of the text to take the suggestions into account in lines: 361-373.

      (9) Section 2.5 and Figure 7: Can we be certain that it is the edge participation that is a particularly good predictor of synaptic changes and/or strength, as opposed to something simpler? For example, could it be the overall number of synapses, excitatory synapses, or something along these lines, that the source and/or target neurons receive, that determine the rho dynamics? And then, I do not understand the claim that edge participation allows one to "delineate potentiation from depression". The only related data I can find is in Figure 7A3, about which the authors write "this effect was stronger for potentiation than depression". But I don't see what they mean. For both depression and facilitation, the changes observed are in the range of ~12% of probability values. And even if the effect is stronger, does it mean one can "delineate" potentiation from depression better? What does it mean, to "delineate"? If it is some kind of decoding based on the edge participation, then the authors did not show that.  

      (1.8) We thank the reviewer for this comment. We have included an analysis of the predictive power of indegree of the pre and postsynaptic neuron of a connection on the rho dynamics in Figure 7 (panel B). Please consider, that the rho dynamics are described on the level of connections, while properties like indegree are on the level of nodes. Any procedure transferring a node based property to an edge based property involves choices e.g., should the values be added, multiplied, should one be preferential over the other, or should they be considered independently? As edge-based metrics avoid these arbitrary choices, we would argue that they are - ultimately - the simpler and more natural choice in this context.

      Though we believe that the metric of edge participation is simple, we recognize it is perhaps not common. Thus, we have switched to using a version of it that is perhaps more intuitive for the community at large i.e., as a metric of common innervation.  Moreover, we have changed the name “(k+2) edge participation” to “(k)-edge indegree”, to make it even more accessible. For k=0, this is the number of neurons that commonly innervate the connection, i.e., a common neighbour. And for k=1, this is the number of connections that commonly innervate the connection.  This is equivalent to edge participation from the next to last to the last neuron in a simplex.  Furthermore, in lines: 391-418 we have added additional text and references explaining the intuition of why we think this metric is relevant, as it has been shown to affect correlated activity of pairs of neurons, as well as assembly formation.

      Furthermore, we have clarified the language referring to potentiation and depression in lines: 420-422 and 448.

      (10) "test novel predictions in the MICrONS (2021) dataset, which while pushing the boundaries of big data neuroscience, was so far only analyzed with single cells in focus instead of the network as a whole (Ding et al., 2023; Wang et al., 2023)." That is incorrect. For example, the whole work of Ding et al. analyzes connectivity and its relation to the neuron's functional properties at the network level. 

      (1.9) We thank the reviewer for pointing this out. Indeed, the sentence was improperly worded. We have appropriately changed this phrasing in lines: 616-618.

      Reviewer #2 (Public review): 

      Summary: 

      This paper aims to understand the effects of plasticity in shaping the dynamics and structure of cortical circuits, as well as how that depends on aspects such as network structure and dendritic processing. 

      Strengths: 

      The level of biological detail included is impressive, and the numerical simulations appear to be well executed. Additionally, they have done a commendable job in open-sourcing the model.

      We thank the reviewer for their comments.

      Weaknesses: 

      The main result of this work is that activity in their network model remains stable without the need for a homeostatic mechanism. However, as the authors acknowledge, this has been  demonstrated in previous studies (e.g., Higgins et al. 2014). In those studies, stability was attributed to calcium-based rules combined with calcium concentrations at in vivo levels and background neuronal activity. Since the authors use the same calcium-based rule, it is unclear what new result, if any, is being presented. If the authors are suggesting that the mechanism in their simulations differs, that should be stated clearly, and evidence supporting that claim should be provided. 

      (2.1) We do not see this as the main result of our study, but rather a critical validation step, since our calcium rule, while similar to previous ones, is not exactly the same (see equations (1) and especially (2) in Methods). This has been clarified in the text in lines: 150-151. Note in particular, that one of the main differences is the stochastic synaptic transmission and the role of calcium concentration on the release probability. Furthermore, our model involves multicompartmental neurons instead of point neuron models, which to our knowledge was never tested before with calcium-based plasticity rules at the network level. Moreover, determining the time required for stability to be reached is a necessary step to set up the simulation parameters to test the main hypotheses about rules governing the plastic changes.

      The other findings discussed in the paper are related to a characterization of the dependency of plastic changes on network structure. While this analysis is potentially interesting, it has the following limitations. 

      First, I believe the authors should include an analysis of the generality and specificity of their results. All the findings seem to be derived from a single run of the simulation. How do the results vary with different network initializations, simulation times, or parameter choices? 

      (2.2) All simulations were run with 3 different random seeds (mentioned in the Methods) and now shown in Supplementary Figure S8 for some selected analyses. The maximum duration of our simulations were limited by our hardware constraints.  However, from the long (10 minutes) simulation we concluded that most changes happen within the first minute. This is how we determined 2 minutes as the simulation time for all other experiments. Parameters determining both the spontaneous and evoked network state are discussed in length in Isbister et al. (2023) and while we acknowledge that they are only shown in Supplementary Figure S3, we did not want to lengthen the manuscript with redundant details but rather refer to reader to the manuscript where this is discussed at large. 

      Crucially, we tried slightly different parameters of the plasticity model in the early phases of the research, and while they changed the exact numerical values of our results, the main trends (i.e., stabilization time, assemblies, synapse clustering, and network topology influencing plastic changes) remained unchanged. This is now shown in Supplementary Figure S13 and referenced in the Discussion in lines: 572-575.

      Second, the presentation of the results is difficult to follow. The characterization comes across as a long list of experiments, making it hard to identify a central message or distinguish key findings from minor details. The authors provide little intuition about why certain outcomes arise, and the complexity of the simulation makes it challenging - if not impossible - to determine which model elements are essential for specific results and which mechanisms drive emergent properties. Additionally, the text often lacks crucial details. For instance, the description of k-edge participation should be expanded, and an explanation of what this method quantifies should be included. Overall, I believe the authors should focus on a smaller set of significant results and provide a more in-depth discussion. 

      (2.3) We acknowledge the complexity of these large-scale simulations and the interpretation of their results. We appreciate the reviewer's feedback on the areas that needed more detail. To address this, we have extended the Results section describing k-edge indegree with more background and intuition in lines: 391-418. See also our reply to reviewer 1 (1.8) above. 

      While the manuscript may appear to be "a long list of experiments," it is actually guided by the following logic: We choose a calcium-based rule because it was the natural choice in a multicompartmental model which already included calcium dynamics and NMDA receptors. After setting up the main network state, verifying stability (Figure 2), doing traditional basic analysis (Figure 3), and verifying that the changes are non-random (Figure 4); we elaborated on long-standing ideas about co-firing in cell assemblies (Figure 5) and spatial clustering of synapse on dendrites (Figure 6) interacting with plasticity. Finally as we had access to the network’s non-random connectivity we tried to link the network's topology to the observed plastic changes. This was done with a higher order perspective, given that there was previous evidence for the relevance of these structures on cofiring and correlated activity.

      While we understand the frustration, we would highlight that the study is the first of its kind at this scale and level of biological detail. Our goal was to offer a broad exploration of the factors influencing plasticity and their interactions at this scale. Thus, laying the groundwork for future studies to investigate specific aspects more deeply. 

      The comparison of the model with the MICrONS dataset could be improved. In Figure 7B, the authors should show how the same quantification looks in a network model without plasticity. In Figure 8B, the data aligns with the model before plasticity, so it's unclear how this serves as a verification of the theoretical predictions.

      (2.4) Our only claim is that by being used to working with both functional and structural data we were able to develop a metric (k-edge indegree) that could be utilized to study the non-random, high-order topology of the MICrONS connectivity as well. On Figure 8, spike correlations in MICrONS more or less align with both cases (before vs. after plasticity); the only difference is that spike correlations looked different enough in the model so we thought they are worth showing for both cases. Moreover, as the changes are sparse (Figure 2 and 3) the synapse strength panel of Figure 7(D) looks almost exactly the same before plasticity (see first two panels of Author response image 1). In line with our results, the small and significant changes increase as k-edge indegree increases (last panel of Author response image 1). As the first two panels look almost the same and the third one is shown in a slightly different way (Figure 7C2) we would prefer not to include this in the manuscript, but only in our response.

      Author response image 1.

      Reviewer #3 (Public review): 

      Summary: 

      Ecker et al. utilized a biologically realistic, large-scale cortical model of the rat's non-barrel somatosensory cortex, incorporating a calcium-dependent plasticity rule to examine how various factors influence synaptic plasticity under in vivo-like conditions. Their analysis characterized the resulting plastic changes and revealed that key factors, including the co-firing of stimulus-evoked neuronal ensembles, the spatial organization of synaptic clusters, and the overall network topology, play an important role in affecting the extent of synaptic plasticity. 

      Strengths: 

      The detailed, large-scale model employed in this study enables the evaluation of diverse factors across various levels that influence the extent of plastic changes. Specifically, it facilitates the assessment of synaptic organization at the subcellular level, network topology at the macroscopic level, and the co-activation of neuronal ensembles at the activity level. Moreover, modeling plasticity under in vivo-like conditions enhances the model's relevance to experiments. 

      We thank the reviewer for their comments.

      Weaknesses: 

      (1) The authors claimed that, under in vivo-like conditions and in the presence of plasticity, firing rates and weight distributions remain stable without additional homeostatic mechanisms during a 10-minute stimulation period. However, the weights do not reach the steady state immediately after the 10-minute stimulation. Therefore, extended simulations are necessary to substantiate the claim. 

      (3.1) We thank the reviewer for this comment, as it gave us the opportunity to clarify in the text our stabilization criteria. Indeed, the dynamical system of weight changes has not reached a zero-change steady state because the changes, while small, are non-zero. However, in a stochastic system with ongoing activity (stimulus- or noise-driven), non-zero changes are expected. Thus, we consider the system to be at steady state when changes become negligible relative to a null model given by a random walk. Our results show that this condition is met around the 2-minute mark, with negligible changes in the subsequent 8 minutes.

      Moreover, for spontaneous activity, we showed that an unstable network exhibiting synchronous activity can be stabilized into an asynchronous regime by the calcium-based plasticity rule within 10 minutes. These results show that the system reaches a stochastic steady state within 10 minutes without requiring homeostatic mechanisms. Our work reveals that incorporating more biological detail (i.e. calcium-based plasticity), reduces the need for additional mechanisms to stabilize network activity (e.g. fast homeostatic mechanisms).

      Interestingly, one might argue that after 10 minutes of stimulation the network might transition to a different weight configuration if the stimuli change or cease. We agree this is an intriguing question, which we added to the Discussion in lines 611-613. However, this scenario concerns continuous learning, not the system’s steady-state dynamics.

      (2) Another major limitation of the paper lies in its lack of mechanistic insights into the observed phenomena (particularly on aspects that are typically impossible to assess in traditional simplified models, like layer-specific and layer-to-layer pathways-specific plasticity changes), as well as the absence of discussions on the potential computational implications of the corresponding observed plastic changes.

      (3.2) Our study integrates recent experimental advances aiming to clarify their hypothesized inseparable functional roles in neocortical learning. In particular, we study three different kinds of mechanistic insight: co-firing in assemblies (Figure 5), synapse clustering on postsynaptic dendrites (Figure 6), and high-order network topology (Figure 7). Furthermore, layer specificity is shown (Figure 3A1, B1, B2, D1) and so is layer-to-layer specificity (Figure 4A2). In addition we also describe synapse clustering on postsynaptic dendrites (Figure 6) which is not available in simplified models either.

      As such, the mechanistic insights provided in our work are integrative in nature and aim to provide a first broad exploration of these phenomena and their interactions-which are rarely considered together in experimental or modelling studies.  This foundation paves the way for future studies that examine specific aspects more deeply in this level of biological detail.

      Reviewer #1 (Recommendations for the authors):

      (1) I would suggest the authors explain more explicitly that their study uses plasticity for E-to-E connections and not others. Doing so in multiple places in the paper, but certainly in Methods and early in Results, would be helpful. This is stated in lines 117-119 ("To simulate long-term plasticity, we integrated our recently published calcium-based plasticity model that was used to describe functional long-term potentiation and depression between pairs of pyramidal cells"), but could be highlighted more.

      We have added it to several lines in the Methods: 621, 648, 649.

      (2) "Simulations were always repeated at least three times to assess the consistency of the results." This sounds important. How is this used for the analysis? Do the results reported combine the data from the 3 simulations? How did the authors check the "consistency of the results"? Did they run any statistical tests comparing the results between the 3 simulations or was it more of a visual check?

      The reported results come from a single simulation. Three simulations were run to check that no obvious qualitative differences could be found, such as a change of network regime, association between stimuli and assemblies. No statistical tests can be run with samples of size three. These are now shown in Supplementary Figure S8, and additional clarifying text has been added in Methods line: 722. 

      (3) "We needed 12M core hours to run the simulation presented in this manuscript." The Methods section mentions ~2.4 M core hours for a 10-minute simulation, which may be confusing. It might be helpful to provide a table with all the simulations run for this study.

      We wanted to provide a rough estimate of the runtime, but did not run a deep profiling of all campaigns. The results depend on the actual hardware and configurations used (e.g., temporal resolution of synapse reporting).  We understand the potential source of confusion and have clarified this in the Methods in lines 719-721 (and took it out from the Discussion).

      Reviewer #2 (Recommendations for the authors):

      (1) I found the paper somewhat challenging to follow, as there are many small points, making it unclear what the main message is. It sometimes feels like a list of 'we did this and found that.' It might be helpful if the authors focused on a smaller number of key results with more in-depth discussion. For instance, the discussion of network topology on page 9 is intriguing but condensed into a single, dense paragraph that is hard to follow. Clarifying how the random control is generated would also be beneficial.

      See our response to the public review’s third point (2.3).

      (2) Line 245: typo? "Furthermore, the maximal simplex dimension found in the subgraph was two higher than expected by chance.".

      We changed the grammar in line: 249.

      (3) Line 410: typo? "It has been previously shown before that  assemblies have many edges".

      Noted and fixed in line: 463.

      Reviewer #3 (Recommendations for the authors):

      (1) The authors claimed that plasticity operates in a sparse and specific manner, with firing rates and weight distributions remaining stable without additional homeostatic mechanisms. However, as shown in Figure 2D inset, the weights do not reach their steady-state values immediately after the 10-minute stimulation. A similar issue is observed in Figure 2G. It would be necessary to show the claim is indeed true as the weights reach the steady states.

      See our response to the public review’s first point (3.1).

      (2) In the model, synapses undergo both short- and long-term plasticity, but the contribution of short-term plasticity to the stated claim is unclear. It would be helpful to demonstrate how the results of Figure 2 are affected when short-term plasticity is excluded.

      STP is needed to achieve the asynchronous in vivo-like firing state in our model (and is intimately linked to the fitting procedure of the plasticity rules - mean-field approximation is not possible due to the important role of synaptic failures in thresholded plasticity outcomes), thus it cannot be excluded. We have added this to the Methods in lines: 691-697.

      (3) It would be helpful to include a supplementary plot, similar to Figure 2F, illustrating the corresponding results for STDP.

      This is not possible as we did not run a different simulation with STDP, only evaluated the changes in connections with an STDP model using spikes from our simulation. We did not incorporate the STDP equations into our detailed network, as there is no canonical or unambiguous way for doing so (e.g., one would need to handle the fact the connections are multi-synaptic). Note however, that considering the findings of Morrison et al. 2007 [PMID: 17444756], and Zenke et al. 2017 [PMID: 28431369] (cited in the manuscript in lines: 165-166), running STDP in a closed loop simulation would most likely make the network “blow up” because of the positive feedback loop.

      (4) It would be helpful to provide mechanistic insights into the current observations and to discuss the potential computational implications of the observed plastic changes. Particularly on aspects that are typically impossible to examine in traditional models, like layer-specific plastic changes presented in Fig. 3A1, B1, B2, D1, and layer-to-layer pathways-specific plastic changes illustrated in Figure 4A2.

      See our response to the public review’s second point (3.2).

      (5) The use of the term 'assembly' in most places of the manuscript may cause confusion. To enhance clarity and foster effective discussions in the field, I would recommend replacing it with 'ensemble,' as suggested in Miehl et al. (2023), 'Formation and computational implications of assemblies in neural circuits' (The Journal of Physiology, 601(15), 3071-3090), which should also be cited.

      We read the mentioned manuscript when it was published (and appreciated it a lot), now reference it, and explain why we did not exactly follow the suggestion in lines: 293-299.

      (6) The title of Figure 5 is not directly supported by the current figure. To strengthen the alignment, it would be helpful to present the results from lines 303-306 in bar plots and incorporate them into Figure 5 to better substantiate the figure title.

      While the mentioned lines compare maximum values to those within the whole dataset, we think those 2*12*12 values are better presented in condensed matrices than bar plots (while the maximum values are still easily grasped from the colorbars). We have added panel G2 to the figure to address a comment by reviewer 1 (1.7), we believe that this further supports the title of the Figure.

      (7) Line 326, cite "Kirchner, J. H., & Gjorgjieva, J. (2021). Emergence of local and global synaptic organization on cortical dendrites. Nature Communications, 12(1), 4005." and "Kirchner, J. H., & Gjorgjieva, J. (2022). Emergence of synaptic organization and computation in dendrites. Neuroforum, 28(1), 21-30."

      Although we were aware of the mentioned manuscripts, we did not include them originally because they are models of a different species. However, we have now cited these in line: 347.

      (8) The contrast results for ensembles 11 and 12 do not appear to support the claims made in lines 339-341. Clarification on this point would be helpful.

      The reviewer is right, we have updated lines: 360-361, to clarify the difference between the two late assemblies.

      (9) For Figure 6C and 6D in Section 2.4, rather than presenting the results for individual ensembles (which could be moved to the supplementary materials), it would be easier if the authors could summarize the results by grouping them into three categories: early, middle, and late ensembles.

      We agree with the reviewer’s suggestion and tried it before, but as the results slightly depend on functional assembly size as well (not only temporal order) averaging them loses information (see different xlims of the panels). Given that the issue is complex we decided to show all the data on the Figure, but we have revised the text now to provide  a more high-level interpretation.

    1. eLife Assessment

      This study presents a valuable description of the cellular and transcriptional landscape of the tumor microenvironment in 27 gastric cancer (GC) patients based on their H. pylori status (HpGC, ex-HpGC, non-HpGC). The single-cell RNA sequencing dataset and computational analysis are convincing and provide a starting point that is of value for understanding H pylori-associated GC cell type composition, cell transitions, and mechanisms of response to therapy. The section correlating immunotherapy outcomes with GC cell type compositions from bulk RNAseq would have been strengthened by further comparing H. pylori GC versus non H. pylori GC.

    2. Reviewer #1 (Public review):

      In this study, the authors conducted a single-cell RNA sequencing analysis of the cellular and transcriptional landscape of the gastric cancer tumor microenvironment, stratifying patients according to their H. pylori status into currently infected, previously infected and non-infected patients. The authors comprehensively dissect various cellular compartments, including epithelial, stromal and immune cells and describe specific cell types and signatures to be associated with H. pylori infection, including i) inflammatory and EMT signatures in malignant epithelial cells, ii) inflammatory CAFs in stromal cells, iii) Angio-TAMs, TREM2+ TAMs, exhausted and suppressive T cells in immune cells. Looking at ligand-receptor interactions as well as correlations between cell type abundances, they suggest that iCAFs interact with immunosuppressive T cells via a NECTIN2-TIGIT axis, as well as Angio-TAMs through a VEGFA/B-VEGFR1 axis and thereby promote immune escape, tumor angiogenesis and resistance to immunotherapy.

      The authors conduct a comprehensive and thorough analysis of the complex tumor microenvironment of gastric cancer, both single-cell RNA sequencing data as well as the analysis seem of high quality and according to best practices. The authors validate their findings using external datasets and include some prognostic value of the identified signatures and cell types. Furthermore, they validate some of their findings using immunofluorescence. While the authors confirm key transcriptional signatures in external cohorts comparing HP infected and non-infected cases, the main conclusions drawn from their own patient cohort are based on the comparison between HPGC and healthy controls. This approach does not fully resolve which signatures and cell types are specifically driven by H. pylori infection. As the authors also acknowledge in the limitations of their studies, their conclusions would benefit from functional validation.

      In summary, this study provides a valuable resource of the cellular and transcriptional heterogeneity of the tumor microenvironment in gastric cancers, distinguishing between positive, negative and previously positive HP infected gastric cancer patients. Given that HP is the main risk factor for gastric cancer development, the study provides valuable insights into potential HP driven transcriptional signatures and how these might contribute to this increased risk. However, the study would highly benefit from a clearer and more systematic comparison between HPGC and non-HPGC to better delineate infection-specific effects.

    3. Reviewer #2 (Public review):

      Summary:

      This study aims the describe the single-cell transcriptomes of H pylori-associated (Hp) gastric cancers and tumour microenvironment (TME), as a starting point to understand TME diversity stratified by Hp status.<br /> RNAseq was performed for gastric cancers with current Hp+ (from N=9 people), ex-Hp+ (N=6), non-Hp (N=6), and healthy gastric tissue (N=6).<br /> The study expands on previous single-cell transcriptomic studies of gastric cancers and was motivated by previous observations about the effect of H pylori status on therapeutic outcomes. The study includes a brief review of previous work and provides valuable context for this study.

      Strengths:

      The observations are supported by solid RNAseq study design and analysis. The authors describe correlations between Hp status and inferred molecular characteristics including cell lineages, enrichment for cell subclusters identifed as tumour-infiltrating lyphocyte cell types, tumour-infiltrating myeloid cells and cancer-associated fibroblasts.<br /> The observed correlations between Hp status and enrichment of cell subclusters were broadly corroborated using comparisons to deconvolved bulk RNAseq from publicly available gastric cancer data, providing a convincing starting point for understanding the diversity of tumour microenvironment by Hp-status.

      Weaknesses:

      The authors acknowledge several limitations of this study.<br /> The correlations with HP-status are based on a small number of participants per Hp category (N=9 with current Hp+; N=6 for ex-HP+ and non-HP), and would benefit from further validation to establish reproducibility in other cohorts.<br /> The ligand-receptor cross-talk analysis and the suggestion that suppressive T cells could interact with the malignant epithelium through TIGIT-NECTIN2/PVR pairs, are preliminary findings based on transcriptomic analysis and immunostaining and will require further validation.

    4. Author response:

      The following is the authors’ response to the original reviews

      Public Reviews:

      Reviewer #1 (Public Review):

      In this study, the authors conducted a single-cell RNA sequencing analysis of the cellular and transcriptional landscape of the gastric cancer tumor microenvironment, stratifying patients according to their H. pylori status into currently infected, previously infected, and non-infected patients. The authors comprehensively dissect various cellular compartments, including epithelial, stromal, and immune cells, and describe specific cell types and signatures to be associated with H. pylori infection, including i) inflammatory and EMT signatures in malignant epithelial cells, ii) inflammatory CAFs in stromal cells, iii) Angio-TAMs, TREM2+ TAMs, exhausted and suppressive T cells in immune cells. Looking at ligand-receptor interactions as well as correlations between cell type abundances, they suggest that iCAFs interact with immunosuppressive T cells via a NECTIN2-TIGIT axis, as well as Angio-TAMs through a VEGFA/B-VEGFR1 axis and thereby promote immune escape, tumor angiogenesis and resistance to immunotherapy.

      We sincerely appreciate the Reviewer's interest in our study and their valuable insights on how we can further enhance our work.

      The authors conduct a comprehensive and thorough analysis of the complex tumor microenvironment of gastric cancer, both single-cell RNA sequencing data as well as the analysis seem of high quality and according to best practices. The authors validate their findings using external datasets, and include some prognostic value of the identified signatures and cell types. However, most of their conclusions throughout the manuscript are based on the comparison between HPGC and healthy controls, which is not a valid comparison to determine which of the phenotypes are specifically driven by HP infection, e.g. Tregs are high in all GC types, independent of HP status. The same holds true for TREM+ TAMs and iCAFs, which are higher in GC in general. This makes it very difficult to assess the actual HP-driven signatures and cell types. Also, when looking at the correlation/transcriptional differences across different cell types and cellular interactions, the authors do not explicitly define if they are looking at the whole dataset (including healthy controls?) or only at certain patients (HPGC?), which again makes it difficult to interpret the results.

      We sincerely appreciate the reviewer's thorough assessment and valuable feedback on our study. During our analysis, although we did not specifically identify cell types unique to non-HpGC, ex-HpGC, or HpGC, we found that TREM+ TAMs and iCAFs were enriched in H. pylori-infected GC, with an even higher proportion in HpGC. This suggests that the enrichment of TREM+ TAMs and iCAFs is correlated with H. pylori infection status.

      However, gastric cancer is driven by multiple complex factors, including environmental influences, genetic mutations, and pathogenic infections. As single factor, the H. pylori infection does not significantly alter T cell proportions at the cellular level; rather, it affects the expression of immune checkpoint molecules (Author response image 1A-B). Importantly, we evaluated key molecules mediating the interaction among the iCAF with the angio-TAM and Tregs, the results show that the expression of NECTIN, PVR, VEGF, IL11 and IL24 are higher in ex-HpGC compared to the non-HpGC, with the highest expression observed in HpGC, which further validate the H. pylori -driven signatures (Author response image 1C).

      The correlation analysis among different cell types was conducted within different groups based on their H. pylori infection status (Author response image 1C). However, transcriptional differences across different cell types and cellular interactions were analyzed using the entire dataset, including healthy controls. This approach ensured an unbiased identification of molecular and cellular-level differences among cell subtypes before determining whether these subtypes originated from HpGC or ex-HpGC.

      Author response image 1.

      A. The dot plot illustrates the enrichment of the TIGIT-PVR/NECTIN axis in the interaction between malignant epithelial cells and immunosuppressive T cells. B. T Dotplot showing the expression of NECTIN2 and PVR in non-HpGC, ex-HpGC, and HpGC cells. C. The bubble plot showing the expression of NECTIN, PVR, VEGF, IL11 and IL24 in the CAF within non-HpGC, ex-HpGC, and HpGC sample. D. The correlation of cell type (percentage) between Tregs, Angio-TAM, TREM2+ TAM and iCAF.

      The authors aim to confirm some of their findings via immunofluorescence, which in principle is a great approach to validate their results. However, to be able to conclude that e.g. suppressive TIGIT+ T cells are located close to NECTIN2+ malignant epithelium and that this might facilitate immune escape in HPGC (Figure 4K), the authors should include stains that show that this is not the case in the other groups (nonHPGC, exHPGC and HC). The same holds true for Figure 5G.

      Thank you for your valuable feedback. We have add the immunostaining of the ligand TIGIT and the receptor NECTIN2 on suppressive T cells and on the malignant epithelium, as well as signature marker of Angio-TAM and TREM2+ TAM including TREM2, SPP1, VEGF and CD68, in the non-HpGC, ex-HpGC and HC sample (Figure S3, Figure S5). We could find that TIGIT and NECTIN2 exclusively express in HpGC and ex-HpGC samples compared with non-HpGC and HC, with extremely higher in HpGC. Furthermore, the Angio-TAM and TREM2+ TAM were exclusively enriched in HpGC and ex-HpGC samples, barely expressed in non-HpGC and HC. The above results also support our finding that the H.p infection statue determinate the enrichment of Angio-TAM and TREM2+ TAM, also the interaction between suppressive T cells and malignant epithelium guided by TIGIT-NECTIN.

      In summary, this study provides a valuable resource on the cellular and transcriptional heterogeneity of the tumor microenvironment in gastric cancers, distinguishing between positive, negative, and previously positive HP-infected gastric cancer patients. Given that HP is the main risk factor for gastric cancer development, the study provides valuable insights into HP-driven transcriptional signatures and how these might contribute to this increased risk, however, the study would highly benefit from a clearer and more stringent comparison between HPGC and nonHPGC.

      Reviewer #2 (Public Review):

      Summary:

      This study aims to describe the single-cell transcriptomes of H pylori-associated (Hp) gastric cancers and tumor microenvironment (TME), as a starting point to understand TME diversity stratified by Hp status.  RNA-seq was performed for gastric cancers with current Hp+ (from N=9 people), ex-Hp+ (N=6), non-Hp (N=6), and healthy gastric tissue (N=6).

      The study expands on previous single-cell transcriptomic studies of gastric cancers and was motivated by previous observations about the effect of H pylori status on therapeutic outcomes. The study includes a brief review of previous work and provides valuable context for this study.

      We thank the Reviewer for recognizing the interest of the topic, and for sharing their views on how we might further strengthen our work.

      Strengths:

      The observations are supported by solid RNAseq study design and analysis. The authors describe correlations between Hp status and inferred molecular characteristics including cell lineages, enrichment for cell subclusters identified as tumour-infiltrating lymphocyte cell types, tumour-infiltrating myeloid cells, and cancer-associated fibroblasts.

      The observed correlations between Hp status and enrichment of cell subclusters were broadly corroborated using comparisons to deconvolved bulk RNAseq from publicly available gastric cancer data, providing a convincing starting point for understanding the diversity of tumour microenvironment by Hp-status.

      Weaknesses:

      The authors acknowledge several limitations of this study.<br /> The correlations with HP-status are based on a small number of participants per Hp category (N=9 with current Hp+; N=6 for ex-HP+ and non-HP), and would benefit from further validation to establish reproducibility in other cohorts.

      Thank you for your valuable suggestions. We acknowledge that this may limit the generalizability and statistical power of our findings. However, despite the limited sample size, our analysis revealed statistically significant trends (e.g., p-value < 0.05) or consistent patterns in the data. The sample size in this study was constrained by the availability of participants meeting the inclusion criteria, particularly in the ex-HP+ and non-HP groups. We view these findings as hypothesis-generating and aim to validate them in future studies with larger cohorts.

      The ligand-receptor cross-talk analysis and the suggestion that suppressive T cells could interact with the malignant epithelium through TIGIT-NECTIN2/PVR pairs, are preliminary findings based on transcriptomic analysis and immunostaining and will require further validation.

      We appreciate the reviewer's comment and agree that the ligand-receptor cross-talk analysis and the proposed interaction between suppressive T cells and malignant epithelium via TIGIT-NECTIN2/PVR pairs are preliminary findings. These insights were derived from transcriptomic data and immunostaining, which provide valuable but indirect evidence of potential interactions. Our analysis revealed co-expression patterns of TIGIT in suppressive T cells and NECTIN2/PVR in malignant epithelial cells, and immunostaining demonstrated spatial proximity between these cell types. Previous studies have established the functional significance of TIGIT-NECTIN2/PVR interactions in immune regulation (PMID: 19815499, 27978489), supporting the biological plausibility of our observations. While our current data provide a foundation for this hypothesis, future studies involving functional assays or in vivo models would be valuable to confirm the biological relevance of these interactions. We view these findings as exploratory and aimed at guiding future research into the role of suppressive T cells in the tumor microenvironment.

      Recommendations for the authors:

      Reviewer #2 (Recommendations For The Authors):

      (1) Software versions are missing from the scRNAseq section of the Methods.

      Thank you for your feedback. The bioinformation analysis are performed by Seurat 4.1 version, we have annotated the software version in the revised manuscript.

      (2) There is a data link to a deposit in Zenodo, subject to data access request to the authors. Do the authors intend to publish the scRNAseq data?

      Thank you for your inquiry regarding the data availability. We fully intend to make the scRNA-seq data publicly accessible. Currently, the dataset has been deposited in Zenodo and is available upon request to ensure compliance with institutional and ethical guidelines. We are in the process of finalizing the necessary approvals for unrestricted public release. Once completed, we will update the Raw data with an open-access link to facilitate direct download.

    1. eLife Assessment

      This study provides important insights into the role of polyUbiquitination in neurodegenerative diseases, elucidating how pUb promotes neurodegeneration by affecting proteasomal function. The findings not only offer a new perspective on the pathophysiology of neurodegenerative diseases but also provide potential targets for developing new therapeutic strategies. The experiments in the revised submission provide solid evidence to support the conclusions.

    2. Reviewer #1 (Public review):

      Summary:

      The manuscript discusses the role of phosphorylated ubiquitin (pUb) by PINK1 kinase in neurodegenerative diseases. It reveals that elevated levels of pUb are observed in aged human brains and those affected by Parkinson's disease (PD), as well as in Alzheimer's disease (AD), aging, and ischemic injury. The study shows that increased pUb impairs proteasomal degradation, leading to protein aggregation and neurodegeneration. The authors also demonstrate that PINK1 knockout can mitigate protein aggregation in aging and ischemic mouse brains, as well as in cells treated with a proteasome inhibitor. While this study provided some interesting data, several important points should be addressed before being further consideration.

      Strengths:

      (1) Reveals a novel pathological mechanism of neurodegeneration mediated by pUb, providing a new perspective on understanding neurodegenerative diseases.

      (2) The study covers not only a single disease model but also various neurodegenerative diseases such as Alzheimer's disease, aging, and ischemic injury, enhancing the breadth and applicability of the research findings.

      Comments on revisions:

      This study, through a systematic experimental design, reveals the crucial role of pUb in forming a positive feedback loop by inhibiting proteasome activity in neurodegenerative diseases. The data are comprehensive and highly innovative. However, some of the results are not entirely convincing, particularly the staining results in Figure 1.

      In Figure 1A, the density of DAPI staining differs significantly between the control patient and the AD patient, making it difficult to conclusively demonstrate a clear increase in PINK1 in AD patients. Quantitative analysis is needed. In Fig 1C, the PINK1 staining in the mouse brain appears to resemble non-specific staining.

    3. Author response:

      The following is the authors’ response to the original reviews

      Reviewer #1 (Public review):

      Summary:

      The manuscript discusses the role of phosphorylated ubiquitin (pUb) by PINK1 kinase in neurodegenerative diseases. It reveals that elevated levels of pUb are observed in aged human brains and those affected by Parkinson's disease (PD), as well as in Alzheimer's disease (AD), aging, and ischemic injury. The study shows that increased pUb impairs proteasomal degradation, leading to protein aggregation and neurodegeneration. The authors also demonstrate that PINK1 knockout can mitigate protein aggregation in aging and ischemic mouse brains, as well as in cells treated with a proteasome inhibitor. While this study provided some interesting data, several important points should be addressed before being further considered.

      Strengths:

      (1) Reveals a novel pathological mechanism of neurodegeneration mediated by pUb, providing a new perspective on understanding neurodegenerative diseases.

      (2) The study covers not only a single disease model but also various neurodegenerative diseases such as Alzheimer's disease, aging, and ischemic injury, enhancing the breadth and applicability of the research findings.

      Weaknesses:

      (1) PINK1 has been reported as a kinase capable of phosphorylating Ubiquitin, hence the expected outcome of increased p-Ub levels upon PINK1 overexpression. Figures 5E-F do not demonstrate a significant increase in Ub levels upon overexpression of PINK1 alone, whereas the evident increase in Ub expression upon overexpression of S65A is apparent. Therefore, the notion that increased Ub phosphorylation leads to protein aggregation in mouse hippocampal neurons is not yet convincingly supported.

      Indeed, overexpression of sPINK1 alone resulted in minimal changes in Ub levels in the soluble fraction (Figure 5E), which is expected given that the soluble Ub pool remains relatively stable and buffered. However, sPINK1* overexpression led to a marked increase in Ub levels in the insoluble fraction, indicative of increased protein aggregation (Figure 5F). The molecular weight distribution of Ub in the insoluble fraction was predominantly below 70 kDa, suggesting that phosphorylation inhibits Ub chain elongation.

      To further validate this mechanism, we utilized the Ub/S65A mutant to antagonize Ub phosphorylation and observed a significant reduction in the intensity of aggregated bands at low molecular weights, indicating restored proteasomal activity. The observed increase in Ub levels in the soluble fraction upon Ub/S65A overexpression is likely due to enhanced ubiquitination driven by elevated Ub-S65A, and notably, Ub/S65A was also detectable using an antibody against wild-type Ub.

      Consistent with these findings, overexpression of Ub/S65E resulted in a further increase in Ub levels in the insoluble fraction, with intensified low molecular weight bands. The effect was even more pronounced than that observed with sPINK1 transfection, likely resulting from the complete phosphorylation mimicry achieved by Ub/S65E, compared to the relatively low levels of phosphorylation by PINK1.

      These findings collectively support the conclusion that sPINK1 promotes protein aggregation via Ub phosphorylation. We have updated the Results and Discussion sections to more clearly present the data and explain the various controls.

      (2) The specificity of PINK1 and p-Ub antibodies requires further validation, as a series of literature indicate that the expression of the PINK1 protein is relatively low and difficult to detect under physiological conditions.

      We acknowledge the challenges in achieving high specificity with commercially available and customgenerated antibodies targeting PINK1 and pUb, particularly given their low endogenous expression under physiological conditions. However, in our study, we observed robust immunofluorescent staining for PINK1 (Figures 1A, 1C, and 1G) and pUb (Figures 1B, 1D, and 1G) in human brain samples from Alzheimer's disease (AD) patients, as well as in mouse models of AD and cerebral ischemia. The clear visualization can be partly attributed to the pathological upregulation of PINK1 and pUb under disease conditions. Importantly, the images from pink1<sup>-/-</sup> mice exhibit much weaker staining.

      Additionally, we detected a significant elevation in the pUb levels in aged mouse brains compared to younger ones (Figures 1E and 1F). In contrast, pink1<sup>-/-</sup> mice showed no change in pUb levels with aging, despite some background signals, demonstrating that pUb accumulation during aging is PINK1dependent. Collectively, these results support the specificity of the antibodies used in detecting pathophysiological changes in PINK1 and pUb levels.

      For cultured cells, pink1<sup>-/-</sup> cells served as a negative control for both PINK1 (Figures 2B and 2C) and pUb (Figures 2D and 2E). While the pUb Western blot exhibited some nonspecific background, pUb levels in pink1<sup>-/-</sup> cells remained unchanged across all MG132 treatment conditions (Figures 2D and 2E), further attesting the usability of the antibodies in conjunction with appropriated controls.

      We have updated the manuscript with higher-resolution images; individual image files have been uploaded separately.

      (3) In Figure 6, relying solely on Western blot staining and Golgi staining under high magnification is insufficient to prove the impact of PINK1 overexpression on neuronal integrity and cognitive function. The authors should supplement their findings with immunostaining results for MAP2 or NeuN to demonstrate whether neuronal cells are affected.

      We included NeuN immunofluorescent staining at 10, 30, and 70 days post transfection in Figure 5— figure supplement 2. The results clearly demonstrate a significant loss of NeuN-positive cells in the hippocampus following Ub/S65E overexpression, while no apparent reduction was observed with sPINK1 transfection alone. 

      We have also quantified MAP2 protein levels via Western blotting and examined morphology of neuronal dendrite and synaptic structure using Golgi staining. These analyses revealed a significant reduction in MAP2 levels and synaptic damage upon sPINK1 or Ub/S65E overexpression (Figures 6F and 6H), consistent with the proteomics analysis (Figure 5—figure supplementary 5). Notably, these detrimental effects could be rescued by co-expression of Ub/S65A, reinforcing the role of pUb in mediating these structural changes.

      Together, our findings from NeuN immunostaining, MAP2 protein analysis, proteomics analysis, and Golgi staining provide strong evidence for the impact of PINK1 overexpression and pUb elevation on neuronal integrity and synaptic structure.

      (4) The authors should provide more detailed figure captions to facilitate the understanding of the results depicted in the figures.

      Figure captions have been updated with more details incorporated in the revised manuscript.

      (5) While the study proposes that pUb promotes neurodegeneration by affecting proteasomal function, the specific molecular mechanisms and signaling pathways remain to be elucidated.

      The molecular mechanisms and signaling pathways through which pUb promotes neurodegeneration are likely multifaceted and interconnected. Our findings suggest that mitochondrial dysfunction plays a central role following sPINK1* overexpression. This is supported by (1) an observed increase in full-length PINK1, indicative of impaired mitochondrial quality control, and (2) proteomic data showing enhanced mitophagy at 30 days post-transfection, followed by substantial mitochondrial injuries at 70 days post-transfection (Figure 5—figure supplement 5 and Supplementary Data). The progressive mitochondrial damage caused by protein aggregates would exacerbate neuronal injury and degeneration.

      Additionally, reduced proteasomal activity may lead to the accumulation of inhibitory proteins that are normally degraded by the ubiquitin-proteasome system. Our proteomics analysis identified a >50fold increase in CamK2n1 (UniProt ID: Q6QWF9), an endogenous inhibitor of CaMKII activation, following sPINK1* overexpression. The accumulation of CamK2n1 suppresses CaMKII activation, thereby inhibiting the CREB signaling pathway (Figure 7), which is essential for synaptic plasticity and neuronal survival. This disruption can further contribute to neurodegenerative processes.

      Thus, our findings underscore the complexity of pUb-mediated neurodegeneration and call for further investigation into downstream consequences.

      Reviewer #1 (Recommendations for the authors):

      Suggestions for improved or additional experiments, data or analyses.

      We have performed additional experiments to investigate how the impairment of ubiquitinproteasomal activity contributes to neurodegeneration. Specifically, we investigated CamK2n1, an endogenous inhibitor of CaMKII, which is normally degraded by the proteasome to allow CaMKII activation. Our proteomics analysis revealed a significant (>50-fold) elevation of CamKI2n1 following sPINK1 overexpression (Figure 5—figure supplement 5 and Supplementary Data).

      To validate this mechanism, we conducted immunofluorescence and Western blot analyses, demonstrating reduced levels of phosphorylated CaMKII (pCaMKII) and phosphorylated CREB (pCREB), as well as reduced levels of downstream proteins such as BDNF and ERK. These results have been incorporated into the revised manuscript (Figure 7).

      As the proteasome is crucial in maintaining proteostasis, its dysregulation would trigger neurodegeneration through multiple pathways, contributing to a broad cascade of pathological events.

      Reviewer #2 (Public review):

      Summary:

      The manuscript makes the claim that pUb is elevated in a number of degenerative conditions including Alzheimer's Disease and cerebral ischemia. Some of this is based on antibody staining which is poorly controlled and difficult to accept at this point. They confirm previous results that a cytosolic form of PINK1 accumulates following proteasome inhibition and that this can be active. Accumulation of pUb is proposed to interfere with proteostasis through inhibition of the proteasome. Much of the data relies on over-expression and there is little support for this reflecting physiological mechanisms.

      Weaknesses:

      The manuscript is poorly written. I appreciate this may be difficult in a non-native tongue, but felt that many of the problems are organizational. Less data of higher quality, better controls and incision would be preferable. Overall the referencing of past work is lamentable. Methods are also very poor and difficult to follow.

      Until technical issues are addressed I think this would represent an unreliable contribution to the field.

      (1) Antibody specificity and detection under pathological conditions

      We recognize the limitations of commercially available antibodies for detecting PINK1 and pUb. Nevertheless, our findings reveal a significant elevation in PINK1 and pUb levels under pathological conditions, such as Alzheimer's disease (AD) and ischemia. Additionally, we observed an increase in pUb level during brain aging, further demonstrating its relevance and a potentially causative role for this special pathological condition. Similarly, elevated pUb levels were observed for cultured cells following pharmacological treatment or oxygen-glucose deprivation (OGD).

      In contrast, in pink1<sup>-/-</sup> mice and HEK293 cells used as negative controls, PINK1 and pUb levels remained consistently low. Therefore, the observed elevation of PINK1 and pUb are associated with special pathological conditions, rather than an antibody-detection anomaly.

      (2) Overexpression as a model for pathological conditions

      To investigate whether the inhibitory effects of sPINK1 on the ubiquitin-proteasome system (UPS) depend on its kinase activity, we employed a kinase-dead version of sPINK1* as a negative control. Given that PINK1 targets multiple substrates, we also investigated whether its effects on UPS inhibition were specifically mediated by ubiquitin phosphorylation. To this end, we used Ub/S65A (a phospho-null mutant) to block Ub phosphorylation by sPINK1, and Ub/S65E (a phospho-mimetic mutant) to mimic phosphorylated Ub. These well-defined controls ensured the robustness of our conclusions.

      Although overexpression does not perfectly replicate physiological conditions, it provides a valuable model for studying pathological scenarios such as neurodegeneration and brain aging, where pUb levels are elevated. For example, we observed a 30.4% increase in pUb levels in aged mouse brains compared to young brains (Figure 1F). Similarly, in our sPINK1 overexpression model, pUb levels increased by 43.8% and 59.9% at 30- and 70-days post-transfection, respectively, compared to controls (Figures 5A and 5C). Notably, co-expression of sPINK1* with Ub/S65A almost entirely prevented sPINK1* accumulation (Figure 5B), indicating that an active UPS can efficiently degrade this otherwise stable variant of sPINK1.

      Together, our findings demonstrate that sPINK1 accumulation inhibits UPS activity, an effect that can be reversed by the phospho-null Ub mutant. The overexpression model mimics pathological conditions and provides valuable insights into pUb-mediated proteasomal dysfunction.

      (3) Organization of the manuscript

      Following your suggestion, we have restructured the manuscript to present the key findings in a more logical and cohesive sequence:

      (a) Evidence for elevated PINK1 and pUb levels across a broad spectrum of pathological and neurodegenerative conditions;

      (b) The effects of pUb elevation in cultured cells, focusing on the proteasome;

      (c) Mechanistic insights into how pUb elevation inhibits proteasomal activity;

      (d) The absence of PINK1 and pUb alleviates protein aggregation;

      (e) Evidence for the causative relationship between elevated pUb levels and proteasomal inhibition;

      (f) Demonstration that pUb elevation directly contributes to neuronal degeneration;

      (g) Give an additional evidence to explain the mechanism of neuronal degeneration post sPINK1* over-expression. The downstream effects of elevated CamK2n1, an inhibitor of CaMKII, resulting from proteasomal inhibition.

      This reorganization should ensure a clear and progressive narrative, and enhance the overall coherence and impact of the revised manuscript.

      (4) Revisions to writing, referencing, and methodology

      We have made a great effort to enhance the clarity and flow of the manuscript, including the addition of references to appropriately acknowledge prior work. We have also expanded the Methods section with additional details to improve readability and ensure reproducibility. We believe these revisions effectively address the concerns raised and strengthen the overall quality of the manuscript.

      Reviewer #2 (Recommendations for the authors):

      Figure 1: PINK1 is a poorly expressed protein and difficult to detect by Western blot let alone by immunofluorescence. I have direct experience of the antibody used in this study and do not consider it reliable. There are much cleaner reagents out there, although they still have many challenges. The minimal requirement here is for the PINK1 antibody staining to be compared in wild-type and knockout mice. One would also expect to see a mitochondrial staining which would require higher magnification to be definitive, but it does not look like it to me. This is a key foundational figure and is unreliable. The pUb antibody also has a high background, see for example figure 2E.

      Under physiological conditions, PINK1 and pUb levels are indeed low, making their detection challenging. However, under pathological conditions, their expression is significantly elevated, correlating with disease severity. Given the limitations of available reagents, using appropriate controls is a standard approach in biological research.

      Nevertheless, we observed robust immunofluorescent staining for PINK1 (Figures 1A, 1C, and 1G) and pUb (Figures 1B, 1D, and 1G) in human brain samples from Alzheimer’s disease (AD) patients and mouse models of AD and cerebral ischemia. Compared to healthy controls, the significant elevation of PINK1 and pUb under these pathological conditions accounts for their clear visualization. To validate antibody specificity, we have included images from pink1<sup>-/-</sup> mice as negative controls (Figure 1C and 1D, third panel).

      Furthermore, we analyzed pUb levels in both young and aged mice, using pink1<sup>-/-</sup> mice as controls.

      Our results revealed a significant increase in pUb levels in aged wild-type mice (Figures 1E and 1F), In contrast, pink1<sup>-/-</sup> mice exhibited relatively low pUb levels, with no notable change between young and aged groups. These findings reinforce the conclusion that pUb accumulation during aging is dependent on PINK1.Furthermore, we analyzed pUb levels in both young and aged mice, using pink1<sup>-/-</sup> mice as controls.

      For HEK293 cells, pink1<sup>-/-</sup> cells were used as a negative control for assessing PINK1 (Figures 2B and 2C) and pUb levels (Figures 2D and 2E). While the pUb Western blot did show some nonspecific background, as you have noted, pUb levels significantly increased following MG132 treatment of the wildtype cells. In contrast, no such increase was observed in pink1<sup>-/-</sup> cells (Figure 2D and 2E). These results further validate the reliability of our findings.

      Regarding mitochondrial staining, we recognize that PINK1 localization can vary depending on the pathological context. For example, in Alzheimer’s disease, PINK1 exhibits relatively high nuclear staining, while in cerebral ischemia and brain aging, it is predominantly cytoplasmic and punctate. In contrast, in young, healthy mouse brains, PINK1 is more uniformly distributed. The observed elevation in pUb levels could arise from mitochondrial PINK1 or soluble sPINK1 in the cytoplasm, and it remains unclear whether nuclear PINK1 contributes to pUb accumulation. Investigating the role of PINK1 in different forms and subcellular localizations will be an important avenue for future research.

      To enhance clarity, we have updated our images and replaced them with higher-resolution versions in the revised manuscript.

      Please also confirm that the GAPDH loading controls represent the same gels, to my eye they do not match.

      We have reviewed all the bands, and confirmed that the GAPDH loading controls correspond to the same gels. For different gels, we use separate GAPDH loading controls. There are two experimental scenarios to consider:

      (1) When there is a large difference in molecular weight between target proteins, we cut the gel into sections and incubate each section with different antibodies separately.

      (2) When the molecular weight difference is small and cutting is not feasible, we first probe the membrane with one antibody, strip it, and then re-incubate the membrane with a second antibody.

      These approaches ensure accurate and reliable detection of target proteins with various molecular weights relative to GAPDH.

      1H. Ponceau.

      We have corrected the spelling.

      Figure 2 many elements are confirmation of work already reported and this must be made clearer in the text. 

      Indeed, the elevation of sPINK1 and pUb upon proteasomal inhibition has been previously reported, and these studies have been acknowledged (Gao, et al, 2016; Dantuma, et al, 2000). In the present study, we expand on these findings by conducting a detailed analysis of the time- and concentrationdependent effects of MG132 on sPINK1 and pUb levels, establishing a causative relationship between pUb accumulation and proteasomal inhibition. Furthermore, we demonstrate that sPINK1 overexpression and MG132-induced proteasomal inhibition exhibit no additive effect, indicating that both converge on the same pathway, resulting in the impairment of proteasomal activity.

      It has been established that ubiquitin phosphorylation inhibits Ub chain elongation (Wauer, et al, 2015). However, our study provides novel insights by identifying an additional mechanism: phosphorylated Ub also interferes with the noncovalent interactions between Ub chain and Ub receptors in the proteasome, which further contributes to the impairment of UPS function.

      The PINK1 kinase-dead mutant construction (Figure 2F) and the use of Ub-GFP as a proteasomal substrate were based on established methodologies, which have been appropriately cited in the manuscript (Beilina, etal 2005 for KD sPINK1; Yamano, et al for endogenous PINK1; Samant, et al, 2018 and Dantuma, et al, 2000 for Ub-GFP probe). Similarly, our use of puromycin and BALA treatments follows previously reported protocols (Gao, et al, 2016), which allowed us to dissect the relative contributions of sPINK1* overexpression to proteasomal vs. autophagic dysfunction.

      As you have noted, our study has built upon prior findings while introducing new mechanistic insights into sPINK1 and pUb-mediated proteasomal dysfunction.

      2C 24h MG132 not recommended, most cells are dead by then.

      We used MG132 treatment for 24 hours to evaluate the time-course effects of proteasomal inhibition on PINK1 and pUb levels in HEK293 cells (Figures 2C and 2E). We did observe some decrease in both PINK1 and pUb levels at 24 hours compared to 12 hours, which may result from some extend of cell death at the longer treatment duration.

      In SH-SY5Y cells, we collected cells at 24 hours after MG132 administration (Figure 5—figure supplementary 1). Though protein aggregation was evident in these cells, we did not observe pronounced cell death under these conditions, justifying our treatment.

      Our findings are consistent with previous studies demonstrating that MG132 at 5 µM for 24 hours effectively induces proteasomal inhibition without substantial cytotoxicity. For example, studies using human esophageal squamous cancer cells have reported that this treatment condition inhibits cell proliferation while maintaining cell viability, with cell viability >70% after 24-hour treatment with 5 µM MG132 (Int J Mol Med 33: 1083-1088, 2014). 

      MG132 has been commonly used at concentrations ranging from 5 to 50 µM for durations of 1 to 24 hours, as stated at the vendor’s website (https://www.cellsignal.com/products/activatorsinhibitors/mg-132/2194).

      2I what is BALA do they mean bafilomycin. This is a v-ATPase inhibitor, not just an autophagy inhibitor.

      We appreciate the reviewer’s comment regarding the use of BALA in Figure 2I. To clarify, BALA refers to bafilomycin A1, a well-established v-ATPase inhibitor that blocks lysosomal acidification. While bafilomycin A1 is commonly used as an autophagy inhibitor, its primary mechanism involves inhibiting lysosomal function, which is critical for autophagosome-lysosome fusion and subsequent degradation of autophagic cargo.

      In our study, we used bafilomycin A1 in conjunction with puromycin to dissect the relative contributions of sPINK1 overexpression on proteasomal and autophagic activities. Puromycin induces protein misfolding and aggregation, causing stress on both degradation pathways. By inhibiting lysosomal function with bafilomycin A1 and blocking the protein degradation load at various stages, we can tell the relative contributions of autophagy and UPS pathways.

      We acknowledge that bafilomycin A1’s effects extend beyond autophagy, as it also inhibits v-ATPase activity. However, its inhibition of lysosomal degradation is integral to distinguishing autophagy’s contribution under the experimental conditions, and BALA treatment has been used in extensively in previous studies (Mauvezin and Neufeld, 2015). 

      We have further clarified this treatment in the revised manuscript.

      Figure 3. Legend or text needs to be more explicit about how chains have been produced. From what I can gather from methods only a single E2 has been trialed. Authors should use at least one of the criteria used by Wauer et al. (2014) to confirm the stoichiometry of phosphorylation. The concept that pUb can interfere with E2 discharging is not new, but not universal across E2s.

      We have cited in the manuscript that PINK1-mediated ubiquitin phosphorylation can interfere with ubiquitin chain elongation for certain E2 enzymes (Wauer et al., 2015). 

      To clarify, the focus of our current work is on how elevation of Ub phosphorylation impacts UPS activity, rather than exploring the broader effects of Ub phosphorylation on Ub chain elongation. For this reason, we have used the standard E2 that is well-established for generating K48-linked polyUb chain (Pickart CM, 2005). Moreover, our findings go further and by demonstrate that phosphorylated K48-linked polyubiquitin exhibits weaker non-covalent interactions with proteasomal ubiquitin receptors. This dual effect—on both covalent chain elongation and non-covalent interactions— contributes to the observed reduction in ubiquitin-proteasome activity, a novel aspect of our study.

      To address the reviewer’s concerns, we have added details in the Methods section and figure legends regarding the generation of ubiquitin chains. Specifically, we used ubiquitin-activating enzyme E1 (UniProt ID: P22314) and ubiquitin-conjugating enzyme E2-25K (UniProt ID: P61086) to generate K48-linked ubiquitin chains. 

      Our ESI-MS analysis showed that only 1–2 phosphoryl groups were incorporated into the K48-linked tetra-ubiquitin chains (Figure 3—figure supplement 2). This is consistent with our in vivo findings, where pUb levels increased by 30.4% in aged mouse brains compared to young brains (Figure 1F). Notably, even sub-stoichiometric phosphorylation onto the K48-linked ubiquitin chain significantly weakens the non-covalent interactions with the proteasome (Figures 3E and 3H).

      Figure 4. I could find no definition of the insoluble fraction, nor details on how it is prepared.

      The insoluble fraction primarily contains proteins that are aggregated or associated with hydrophobic interactions and cannot be solubilized by RIPA buffer. We have provided more details in the Methods of the revised manuscript about how the insoluble fraction was prepared. Our approach was based on established protocols for fractionating soluble and insoluble proteins from brain tissues (Wirths, 2017). Here is an outline of the procedure, which enables the separation and subsequent analysis of distinct protein populations:

      • Lysis and preparation of soluble fraction: Cells and brain tissues were lysed using RIPA buffer (Beyotime Biotechnology, cat# P0013B) containing protease (P1005) and phosphatase inhibitors (P1081) on ice for 30 minutes, with gentle vortexing every 10 minutes. Brain samples were homogenized using a precooled TissuePrep instrument (TP-24, Gering Instrument Company). Lysates were centrifuged at 12,000 rpm for 30 minutes at 4°C. The supernatant was collected as the soluble protein fraction.

      • Preparation of insoluble fraction: The pellet was resuspended in 20 µl of SDS buffer (2% SDS, 50 mM Tris-HCl, pH 7.5) and subjected to ultrasonic pyrolysis at 4°C for 8 cycles (10 seconds ultrasound, 30 seconds interval). The samples were then centrifuged at 12,000 rpm for 30 minutes at 4°C. The supernatant obtained after this step was designated as the insoluble protein fraction.

      • Protein quantification: Protein concentrations for both soluble and insoluble fractions were determined using the BCA Protein Assay Kit (Beyotime Biotechnology, cat# P0009).

      Figure 5. What is the transfection efficiency? How many folds is sPINK1 over-expressed? Typically, a neuron will have only a few hundred copies of PINK1 at the basal state. How much mutant ubiquitin is expressed relative to wild type, seeing the free ubiquitin signals on the gels might be helpful here, but they seem to have been cut off. 

      We appreciate the reviewer's insightful comments regarding transfection efficiency, the extent of sPINK1 overexpression, and the expression levels of mutant ubiquitin relative to wild-type ubiquitin. Below, we provide detailed responses to each point:

      Transfection Efficiency: Our immunofluorescent staining for NeuN, a neuronal marker, demonstrated that over 90% of NeuN-positive cells were co-localized with GFP (Figure 5—figure supplement 2), indicating a high transfection efficiency in our neuronal cultures.

      Extent of sPINK1 Overexpression: Quantifying the exact fold increase of sPINK1 upon overexpression is inherently difficult due to its low basal expression under physiological conditions, making the relative increase difficult to measure (small denominator effect). However, our Western blot analysis shows that ischemic events can cause a substantial elevation of PINK1 levels, including both full-length and cleaved forms (Figure 1H). This suggests that our overexpression model recapitulates the pathological increase in PINK1, making it a relevant system for studying disease mechanisms.

      From Figure 5B, it is evident that sPINK1 levels differ significantly between neurons overexpressing sPINK1 alone and those co-expressing sPINK1 + Ub/S65A (70 days post-transfection). Overexpression of sPINK1 alone results in multiple PINK1 bands, consistent with sPINK1, endogenous PINK1 (induced by mitochondrial damage), and ubiquitinated sPINK1. In comparison, co-expressing Ub/S65A leads to faint PINK1 bands, suggesting that in the presence of a functionally restored proteasome, overexpressed sPINK1 is rapidly degraded. Therefore, actual accumulation of sPINK1 depends on proteasomal activity, and the “over-expressed” PINK1 level can be comparable to levels observed under native, pathological conditions.

      Expression Levels of Mutant Ubiquitin Relative to Wild-Type: Assessing the expression levels of mutant versus wild-type ubiquitin is indeed valuable. In Figure 5E, we observed a 38.9% increase in high-molecular-weight ubiquitin conjugates in the soluble fraction when comparing the sPINK1+Ub/S65A group to the control. This increase suggests that mutant ubiquitin is actively incorporated into polyubiquitin chains.

      Regarding free monomeric ubiquitin, its low abundance and rapid incorporation into polyubiquitin chains make it difficult to visualize in Western blots. Additionally, its low molecular weight and lower antibody binding valency further reduce its visibility.

      General: a number of effects are shown following over-expression but no case is made that these levels of pUb are ever attained physiologically. I am very unconvinced by these findings and think the manuscript needs to be improved at multiple levels before being added to the record.

      We understand the reviewer’s concerns regarding the relevance of pUb levels observed in our overexpression model. To clarify, our study is not focused on physiological levels of pUb, but rather on pathologically elevated levels, which have been documented in various neurodegenerative conditions. While overexpression is not a perfect replication of pathological states, it provides a valuable tool to investigate mechanisms that become relevant under disease conditions. Moreover, we have taken steps to ensure the validity of our findings and to address potential limitations associated with overexpression models:

      Pathological Relevance: Besides several reported literatures, we observed significant increases in PINK1 and pUb levels in human brain samples from Alzheimer's disease (AD) patients, as well as in mouse models of AD, cerebral ischemia (including mouse middle cerebral artery occlusion ischemic model and oxygen glucose deprivation cell model), and aging (e.g., Figures 1E, 1F, and 1H). All these data show that pUb levels are elevated under pathological conditions. Our overexpression model mimics these pathological scenarios by recreating the high levels of pUb, which lead to the impairment of proteasomal activity and subsequent disruption of proteostasis.

      Use of Robust Controls: To ensure the reliability of our results and interpretations, we employed multiple controls for our experiments. We have used pink1<sup>-/-</sup> mice and cells to confirm that pUb accumulation is PINK1-dependent (Figures 1C and 2C). We have also included kinase-dead sPINK1 mutant and Ub/S65A phospho-null mutants to negate/counteract the specific roles of PINK1 activity and pUb in proteasomal dysfunction. On the other hand, we have used Ub/S65E for phosphomimetic mutant, corresponding to a 100% Ub phosphorylation.

      Importantly, we have compared sPINK1 overexpression with both baseline and disease-mimicking conditions, thus to ensure that the observed effects are consistent with pathological changes. Furthermore, our findings are supported by complementary evidences from human brain samples, model animals, cell cultures, and molecular assays. Integrating the different controls and various approaches, we have provided mechanistic insights into how elevated pUb levels causes proteasomal impairment and contributes to neurodegeneration.

      Our findings elucidate how elevated pUb level contributes to the disruption of proteostasis in neurodegenerative conditions. While overexpression may have limitations, it remains a powerful tool for dissecting pathological mechanisms and testing hypotheses. Our results align with and expand upon previous studies suggesting pUb as a biomarker of neurodegeneration (Hou, et al, 2018; Fiesel, et al, 2015), and provide mechanistic insights into how elevated pUb and sPINK1 drive a viscous feedforward cycle, ultimately leading to proteasomal dysfunction and neurodegeneration. 

      We hope these clarifications highlight the relevance and rigor of our study, and welcome additional suggestions to improve the manuscript.

      Reviewer #3 (Public review):

      Summary:

      This study aims to explore the role of phosphorylated ubiquitin (pUb) in proteostasis and its impact on neurodegeneration. By employing a combination of molecular, cellular, and in vivo approaches, the authors demonstrate that elevated pUb levels contribute to both protective and neurotoxic effects, depending on the context. The research integrates proteasomal inhibition, mitochondrial dysfunction, and protein aggregation, providing new insights into the pathology of neurodegenerative diseases.

      Strengths:

      - The integration of proteomics, molecular biology, and animal models provides comprehensive insights.

      - The use of phospho-null and phospho-mimetic ubiquitin mutants elegantly demonstrates the dual effects of pUb.

      - Data on behavioral changes and cognitive impairments establish a clear link between cellular mechanisms and functional outcomes.

      Weaknesses:

      - While the study discusses the reciprocal relationship between proteasomal inhibition and pUb elevation, causality remains partially inferred.

      It has been well-established that protein aggregates, particularly neurodegenerative fibrils, can impair proteasomal activity (McDade, et al., 2024; Kinger, et al., 2024; Tseng, et al., 2008). Other contributing factors, including ATP depletion, reduced proteasome component expression, and covalent modifications of proteasomal subunits, can also lead to declined proteasomal function. Additionally, mitochondrial injury serves as an important source of elevated PINK1 and pUb levels. Recent studies have demonstrated that efficient mitophagy is essential to prevent pUb accumulation, whereas partial mitophagy failure results in elevated PINK1 levels (Chin, et al, 2023; Pollock, et al. 2024).

      While pathological conditions can impair proteasomal function and slow sPINK1 degradation, leading to its accumulation, our results demonstrate that overexpression of sPINK1 or PINK1 can initiate this cycle as well. Once this cycle is initiated, it becomes self-perpetuating, as sPINK1 and pUb accumulation progressively impair proteasomal function, leading to more protein aggregates and mitochondrial damages.

      Importantly, we show that co-expression of Ub/S65A effectively rescues cells from this cycle, which further illustrates the pivotal role of pUb in driving proteasomal inhibition and the causality between pUb elevation and proteasomal inhibition. At the animal level, pink1 knockout prevents protein aggregation under aging and cerebral ischemia conditions (Figures 1E and 1G). 

      Together, by controlling at protein, cell, and animal levels, our findings support this self-reinforcing and self-amplifying cycle of pUb elevation, proteasomal inhibition, protein aggregation, mitochondrial damage, and ultimately, neurodegeneration.

      - The role of alternative pathways, such as autophagy, in compensating for proteasomal dysfunction is underexplored.

      Indeed, previous studies have shown that elevated sPINK1 can enhance autophagy (Gao, et al., 2016,), potentially compensating for impaired UPS function. One mechanism involves PINK1mediated phosphorylation of p62, which enhances autophagic activity.

      In our study, we observed increased autophagic activity upon sPINK1 overexpression, as shown in Figure 2I (middle panel, without BALA). This increase in autophagy may facilitate the degradation of ubiquitinated proteins induced by puromycin, partially mitigating proteasomal dysfunction. This compensation might also explain why protein aggregation, though statistically significant, increased only slightly at 70 days post-sPINK1 transfection (Figure 5F). Additionally, we detected a mild but statistically insignificant increase in LC3II levels in the hippocampus of mouse brains at 70 days postsPINK1 transfection (Figure 5—figure supplement 6), further supporting the notion of autophagy activation.

      However, while autophagy may provide some compensation, its effect is likely limited. The UPS and autophagy serve distinct roles in protein degradation:

      • Autophagy is a bulk degradation pathway, primarily targeting damaged organelles, intracellular pathogens, and protein aggregates, often in a non-selective manner.

      • The UPS, in contrast, is highly selective, degrading short-lived regulatory proteins, misfolded proteins, and proteins tagged for degradation via ubiquitination.

      Thus, while sPINK1 overexpression enhances autophagy-mediated degradation, it simultaneously impairs UPS-mediated degradation. This suggests that autophagy partially compensates for proteasomal dysfunction but is insufficient to counterbalance the UPS's selective degradation function. We have incorporated additional discussion in the revised manuscript.

      - The immunofluorescence images in Figure 1A-D lack clarity and transparency. It is not clear whether the images represent human brain tissue, mouse brain tissue, or cultured cells. Additionally, the DAPI staining is not well-defined, making it difficult to discern cell nuclei or staging. To address these issues, lower-magnification images that clearly show the brain region should be provided, along with improved DAPI staining for better visualization. Furthermore, the Results section and Figure legends should explicitly indicate which brain region is being presented. These concerns raise questions about the reliability of the reported pUb levels in AD, which is a critical aspect of the study's findings.

      We have taken steps to address the concerns regarding clarity and transparency in Figure 1A-D. We have already addressed the source of tissues at the left of each images. For example, we have written “human brain with AD” at the left side of Figure 1A, and “mouse brains with AD” at the left side of Figure 1C.

      Briefly, the human brain samples in Figure 1 originate from the cingulate gyrus of Alzheimer’s disease (AD) patients. Our analysis revealed that PINK1 is primarily localized within cell bodies, whereas pUb is more abundant around Aβ plaques, likely in nerve terminals. For the mouse brain samples, we have now explicitly indicated in the figure legends and Results section that the images represent the neocortex of APP/PS1 mice, a mouse model relevant to AD pathology, as well as the corresponding regions in wild-type and pink1<sup>-/-</sup> mice. We have ensured that the brain regions and sources are clearly stated throughout the manuscript.

      Regarding image clarity, we have uploaded higher-resolution versions of the images in the revised manuscript to improve visualization of key features, including DAPI staining. We believe these revisions enhance the reliability and interpretability of our findings, particularly in relation to the reported pUb levels in AD. 

      - Figure 4B should also indicate which brain region is being presented.

      The images were taken for layer III-IV in the neocortex of mouse brains. We have included this information in the figure legend of the revised manuscript.

      Reviewer #3 (Recommendations for the authors):

      - Expand on the potential compensatory role of autophagy in response to proteasomal dysfunction.

      Upon proteasomal inhibition, cells may activate autophagy as an alternative pathway of degradation to help clear damaged or misfolded proteins. Autophagy is a bulk degradation process that targets long-lived proteins, damaged organelles, and aggregated proteins for lysosomal degradation. While this pathway can provide some compensation, it is distinct from the ubiquitin-proteasome system (UPS), which specializes in the selective degradation of short-lived regulatory proteins and misfolded proteins.

      In our study, we observed increased autophagic activity following sPINK1 overexpression (Figure 2J, middle panel, without BALA) and a slight, though statistically insignificant, increase in LC3II levels in the hippocampus of mouse brains at 70 days post-sPINK1 transfection (Figure 5—figure supplement 6). These findings suggest that autophagy is indeed upregulated as a compensatory response to proteasomal dysfunction, potentially facilitating the degradation of aggregated ubiquitinated proteins. Additionally, gene set enrichment analysis (GSEA) revealed similar enrichment of autophagy pathways at 30 and 70 days post-sPINK1 overexpression (Figure 5—figure supplement 5).

      However, the compensatory capacity of autophagy is likely limited. While autophagy can reduce protein aggregation, it is an inherently non-selective process and cannot fully replace the targeted functions of the UPS. Moreover, as we illustrate in Figure 7 of the revised manuscript, UPS is essential for degrading specific regulatory and inhibitory proteins and plays a critical role in cellular proteostasis, particularly in signaling regulation, cell cycle control, and stress responses.

      Together, while autophagy activation provides some degree of compensation, it cannot fully restore cellular proteostasis. The interplay between these two degradation pathways is an important area for future investigation. For the present study, our focus is on how pUb elevations impact proteasomal activity and elicits downstream effects.

      We have incorporated these additional discussions on this topic in the revised manuscript.

      - Simplify the discussion of complex mechanisms to improve accessibility for readers.

      We have revised the Discussion to present the mechanisms in a more coherent and accessible manner, ensuring clarity for a broader readership. These revisions should make the discussion more intuitive while preserving the depth of our findings.

      - Statistical analyses could benefit from clarifying how technical replicates and biological replicates were accounted for across experiments.

      We have clarified our statistical analysis in the Methods section and figure legends, explicitly detailing how many biological replicates were accounted for across experiments. These revisions should enhance transparency and clarity, ensuring that our findings are robust and reproducible.

      - The image in Figure 3D is too small to distinguish any signals. A larger and clearer image should be presented.

      We have expanded the images in Figure 3D. Additionally, we have replaced figures with version of better resolutions throughout the manuscript.

      - NeuN expression in Figure 4B differs between wildtype and pink-/- mice. Additional validation is needed to determine whether pink-/- enhances NeuN expression.

      The difference in NeuN immunofluorescence intensity between wild-type and pink1<sup>-/-</sup> mice in Figure 4B may simply result from variations in image acquisition rather than an actual difference in NeuN expression.

      Our single nuclei RNA-seq analyses of wild-type and pink1<sup>-/-</sup> mice at 3 and 18 months of age reveal no significant differences in NeuN expression at the transcript level (data provided below). This confirms that the observed variation in fluorescence intensity is unlikely to reflect an authentic upregulation of NeuN expression. Thus, factors like the concentration of antibody, image exposure and processing may contribute to differences in staining intensity.

      Author response image 1.

    1. eLife Assessment

      This manuscript provides valuable mechanistic insight into NSCLC progression, both in terms of tumour metastasis and the development of chemoresistance. The authors draw upon a range of techniques and assays and the evidence shown is solid and has been strengthened by incorporation of suggestions by the two reviewers. The work presented will be of interest to cancer biologists and more broadly to those interested in NSCLC translational studies.

    2. Reviewer #1 (Public review):

      Summary:

      The manuscript entitled "Phosphodiesterase 1A Physically Interacts with YTHDF2 and Reinforces the Progression of Non-Small Cell Lung Cancer" explores the role of PDE1A in promoting NSCLC progression by binding to the m6A reader YTHDF2 and regulating the mRNA stability of several novel target genes, consequently activating the STAT3 pathway and leading to metastasis and drug resistance.

      Strengths:

      The study addresses a novel mechanism involving PDE1A and YTHDF2 interaction in NSCLC, contributing to our understanding of cancer progression.

    3. Reviewer #2 (Public review):

      Summary:

      This revised manuscript investigates the role and the mechanism by which PDE1 impacts NSCLC progression, providing solid data to demonstrate that PDE1 binds to m6A reader YTHDF2, in turn, regulating STAT3 signaling pathway through its interaction, promoting metastasis and angiogenesis. The study provides a valuable information to lung cancer field.

      Strength:

      The study uncovers a novel PDE1A/YTHDF2/SOCS2/STAT3 pathway in NSCLC progression and the findings provide a potential treatment strategy for NSCLC patients with metastasis.

      Weakness:

      Given that physical interaction of PDE1A and YTHDF2 plays a critical role in PDE1A-mediated NSCLC metastasis, the in vivo data to show that YTHDF2 mimics the effect of PDE1A in metastasis will strength the manuscript although this point was mentioned in the revised manuscript.

    4. Author response:

      The following is the authors’ response to the previous reviews

      Public Reviews:

      Reviewer #1 (Public review):

      Summary:

      The manuscript entitled "Phosphodiesterase 1A Physically Interacts with YTHDF2 and Reinforces the Progression of Non-Small Cell Lung Cancer" explores the role of PDE1A in promoting NSCLC progression by binding to the m6A reader YTHDF2 and regulating the mRNA stability of several novel target genes, consequently activating the STAT3 pathway and leading to metastasis and drug resistance.

      Strengths:

      The study addresses a novel mechanism involving PDE1A and YTHDF2 interaction in NSCLC, contributing to our understanding of cancer progression.

      Reviewer #2 (Public review):

      Summary

      This revised manuscript investigates the role and the mechanism by which PDE1 impacts NSCLC progression. They provide evidence to demonstrate that PDE1 binds to m6A reader YTHDF2, in turn, regulating STAT3 signaling pathway through its interaction, promoting metastasis and angiogenesis.

      Strength:

      The study uncovers a novel PDE1A/YTHDF2/SOCS2/STAT3 pathway in NSCLC progression and the findings provide a potential treatment strategy for NSCLC patients with metastasis.

      Weakness:

      In discussion, it is stated in the revised version that "the role of YTHDF2 in PDE1A-driven tumor metastasis should be elucidated in future studies", however, given that physical interaction of PDE1A and YTHDF2 plays a critical role in PDE1A-mediated NSCLC metastasis, whether YTHDF2 mimicking the effect of PDE1A in metastasis will strength the manuscript.

      Recommendations for the authors:

      Reviewer #2 (Recommendations for the authors):

      (1) In Figure 1A, the y-axis should be "IOD/Area" instead of "IDO/Area".

      Figure 1A was revised as suggested.

      (2) Figure 3A legend for (F) and (G) was switched.

      Figure 3A legend was revised as suggested “(F-G) The mRNA (F) and protein (G) levels of indicated genes were determined in P3 and P0 NSCLC cells.”.

      (3) The statistical analysis should be performed for Figure 3H.

      Figure 3H was revised as suggested.

      (4) Figure 4F, Y-axis has a typo for "vessels" and statistical analysis should be performed on this data.

      Figure 4F was revised as suggested.

      (5) Figure 6 E, typo for "migrated" on the y-axis.

      Figure 6E was revised as suggested.

      (6) Figure 7 C, typos for "expression" on y-aixs in both figures need to be fixed.

      Figure 7C was revised as suggested.

      (7) P-values for Figure 7B need to be stated.

      Figure 7B was revised as suggested.

      (8) m6A should be consistent throughout the manuscript.

      m6A was consistent throughout the manuscript.

    1. eLife Assessment

      This study presents fundamental findings that could redefine the specificity and mechanism of action of the well-studied Ser/Thr kinase IKK2 (a subunit of inhibitor of nuclear factor kappa-B kinase (IkB) that propagates cellular response to inflammation). Solid evidence supports the claim that IKK2 exhibits dual specificity that allows tyrosine autophosphorylation and the authors further show that auto-phosphorylated IKK2 is involved in an unanticipated relay mechanism that transfers phosphate from an IKK2 tyrosine onto the IkBa substrate. The findings are a starting point for follow-up studies to confirm the unexpected mechanism and further pursue functional significance.

    2. Reviewer #1 (Public review):

      IKK is the key signaling node for inflammatory signaling. Despite the availability of molecular structures, how the kinase achieves its specificity remains unclear. This paper describes a dynamic sequence of events in which autophosphorylation of a tyrosine near the activate site facilitates phosphorylation of the serine on the substrate via a phosphor-transfer reaction. The proposed mechanism is conceptually novel in several ways, suggesting that the kinase is dual specificity (tyrosine and serine) and that it mediates a phospho-transfer reaction. While bacteria contain phosphorylation-transfer enzymes, this is unheard of for mammalian kinases. However, what the functional significance of this enzymatic activity might remain unaddressed.

      The revised manuscript adequately addresses all the points I suggested in the review of the first submission.

    3. Reviewer #2 (Public review):

      The authors investigate the phosphotransfer capacity of Ser/Thr kinase IκB kinase (IKK), a mediator of cellular inflammation signaling. Canonically, IKK activity is promoted by activation loop phosphorylation at Ser177/Ser181. Active IKK can then unleash NF-κB signaling by phosphorylating repressor IκBα at residues Ser32/Ser26. Noting the reports of other IKK phosphorylation sites, the authors explore the extent of autophosphorylation.

      Semi-phosphorylated IKK purified from Sf9 cells, exhibits the capacity for further autophosphorylation. Anti-phosphotyrosine immunoblotting indicated unexpected tyrosine phosphorylation. Contaminating kinase activity was tested by generating a kinase-dead K44M variant, supporting the notion that the unexpected phosphorylation was IKK-dependent. In addition, the observed phosphotyrosine signal required phosphorylated IKK activation loop serines.

      Two candidate IKK tyrosines were examined as the source of the phosphotyrosine immunoblotting signal. Activation loop residues Tyr169 and Tyr188 were each rendered non-phosphorylatable by mutation to Phe. The Tyr variants decreased both autophosphorylation and phosphotransfer to IκBα. Likewise, Y169F and Y188F IKK2 variants immunoprecipitated from TNFa-stimulated cells also exhibited reduced activity in vitro.

      The authors further focus on Tyr169 phosphorylation, proposing a role as a phospho-sink capable of phosphotransfer to IκBα substrate. This model is reminiscent of the bacterial two-component signaling phosphotransfer from phosphohistidine to aspartate. Efforts are made to phosphorylate IKK2 and remove ATP to assess the capacity for phosphotransfer. Phosphorylation of IκBα is observed after ATP removal, although there are ambiguous requirements for ADP.

      Strengths:

      Ultimately, the authors draw together the lines of evidence for IKK2 phosphotyrosine and ATP-independent phosphotransfer to develop a novel model for IKK2-mediated phosphorylation of IκBα. The model suggests that IKK activation loop Ser phosphorylation primes the kinase for tyrosine autophosphorylation. With the assumption that IKK retains the bound ADP, the phosphotyrosine is conformationally available to relay the phosphate to IκBα substrate. The authors are clearly aware of the high burden of evidence required for this unusual proposed mechanism. Indeed, many possible artifacts (e.g., contaminating kinases or ATP) are anticipated and control experiments are included to address many of these concerns. The analysis hinges on the fidelity of pan-specific phosphotyrosine antibodies, and the authors have probed with two different anti-phosphotyrosine antibody clones. Taken together, the observations are thought-provoking, and I look forward to seeing this model tested in a cellular system.

      Weaknesses:

      Multiple phosphorylated tyrosines in IKK2 were apparently identified by mass spectrometric analyses. LC-MS/MS spectra are presented, but fragments supporting phospho-Y188 and Y325 are difficult to distinguish from noise. It is common to find non-physiological post-translational modifications in over-expressed proteins from recombinant sources. Are these IKK2 phosphotyrosines evident by MS in IKK2 immunoprecipitated from TNFa-stimulated cells? Identifying IKK2 phosphotyrosine sites from cells would be especially helpful in supporting the proposed model.

    4. Reviewer #3 (Public review):

      Summary:

      The authors investigate the kinase activity of IKK2, a crucial regulator of inflammatory cell signaling. They describe a novel tyrosine kinase activity of this well-studied enzyme and a highly unusual phosphotransfer from phosphorylated IKK2 onto substrate proteins in the absence of ATP as a substrate.

      Strengths:

      The authors provide an extensive biochemical characterization of the processes with recombinant protein, western blot, autoradiography, protein engineering and provide MS data now.

      Weaknesses:

      The identity and purity of the used proteins has improved in the revised work. Since the findings are so unexpected and potentially of wide-reaching interest - this is important. Similar specific detection of phospho-Ser/Thr vs phospho-Tyr relies largely on antibodies which can have varying degrees of specificity. Using multiple antibodies and MS improves the quality of the data.

    5. Author response:

      The following is the authors’ response to the previous reviews

      Public Reviews:

      Reviewer #1 (Public review):

      IKK is the key signaling node for inflammatory signaling. Despite the availability of molecular structures, how the kinase achieves its specificity remains unclear. This paper describes a dynamic sequence of events in which autophosphorylation of a tyrosine near the activate site facilitates phosphorylation of the serine on the substrate via a phosphor-transfer reaction. The proposed mechanism is conceptually novel in several ways, suggesting that the kinase is dual specificity (tyrosine and serine) and that it mediates a phospho-transfer reaction. While bacteria contain phosphorylation-transfer enzymes, this is unheard of for mammalian kinases. However, what the functional significance of this enzymatic activity might remain unaddressed.

      The revised manuscript adequately addresses all the points I suggested in the review of the first submission.

      Response: Authors thank the reviewer for their valuable comments and constructive criticisms for the betterment of the manuscript. We also thank them for appreciating our work. We agree with the reviewer that the functional significance of this particular enzymatic activity of IKK2 is yet to be fully realized. 

      Reviewer #2 (Public review):

      The authors investigate the phosphotransfer capacity of Ser/Thr kinase IkB kinase (IKK), a mediator of cellular inflammation signaling. Canonically, IKK activity is promoted by activation loop phosphorylation at Ser177/Ser181. Active IKK can then unleash NF-kB signaling by phosphorylating repressor IkBα at residues Ser32/Ser26. Noting the reports of other IKK phosphorylation sites, the authors explore the extent of autophosphorylation.

      Semi-phosphorylated IKK purified from Sf9 cells, exhibits the capacity for further autophosphorylation. Anti-phosphotyrosine immunoblotting indicated unexpected tyrosine phosphorylation. Contaminating kinase activity was tested by generating a kinase-dead K44M variant, supporting the notion that the unexpected phosphorylation was IKK-dependent. In addition, the observed phosphotyrosine signal required phosphorylated IKK activation loop serines.

      Two candidate IKK tyrosines were examined as the source of the phosphotyrosine immunoblotting signal. Activation loop residues Tyr169 and Tyr188 were each rendered non-phosphorylatable by mutation to Phe. The Tyr variants decreased both autophosphorylation and phosphotransfer to IkBα. Likewise, Y169F and Y188F IKK2 variants immunoprecipitated from TNFa-stimulated cells also exhibited reduced activity in vitro.

      The authors further focus on Tyr169 phosphorylation, proposing a role as a phospho-sink capable of phosphotransfer to IkBα substrate. This model is reminiscent of the bacterial two-component signaling phosphotransfer from phosphohistidine to aspartate. Efforts are made to phosphorylate IKK2 and remove ATP to assess the capacity for phosphotransfer. Phosphorylation of IkBα is observed after ATP removal, although there are ambiguous requirements for ADP.

      Strengths:

      Ultimately, the authors draw together the lines of evidence for IKK2 phosphotyrosine and ATP-independent phosphotransfer to develop a novel model for IKK2-mediated phosphorylation of IkBα. The model suggests that IKK activation loop Ser phosphorylation primes the kinase for tyrosine autophosphorylation. With the assumption that IKK retains the bound ADP, the phosphotyrosine is conformationally available to relay the phosphate to IkBα substrate. The authors are clearly aware of the high burden of evidence required for this unusual proposed mechanism. Indeed, many possible artifacts (e.g., contaminating kinases or ATP) are anticipated and control experiments are included to address many of these concerns. The analysis hinges on the fidelity of pan-specific phosphotyrosine antibodies, and the authors have probed with two different anti-phosphotyrosine antibody clones. Taken together, the observations are thought-provoking, and I look forward to seeing this model tested in a cellular system.

      Weaknesses:

      Multiple phosphorylated tyrosines in IKK2 were apparently identified by mass spectrometric analyses. LC-MS/MS spectra are presented, but fragments supporting phospho-Y188 and Y325 are difficult to distinguish from noise. It is common to find non-physiological post-translational modifications in over-expressed proteins from recombinant sources. Are these IKK2 phosphotyrosines evident by MS in IKK2 immunoprecipitated from TNFa-stimulated cells? Identifying IKK2 phosphotyrosine sites from cells would be especially helpful in supporting the proposed model.

      Authors thank the reviewer for their elaborate comments and constructive criticisms that helped enrich the manuscript. We also thank them for pointing out the critical points in the model. We agree with the reviewer that testing this model in a cellular system is required to bolster this concept. However, an appropriate cellular assay system to investigate and monitor this mode of phosphotransfer is still elusive. We agree with the reviewer’s concerns on the identification of Y188 and Y325 as potential phosphosites. They have been omitted in the current version and relevant changes have been incorporated. IKK2’s tyrosine phosphorylation status in cells is reported earlier. Although we have not analyzed IKK2 from TNF-a treated cells in this study, a different study of phospho-status of cellular IKK2 indicated tyrosine phosphorylation (Meyer et al 2013).   

      Reviewer #3 (Public review):

      Summary:

      The authors investigate the kinase activity of IKK2, a crucial regulator of inflammatory cell signaling. They describe a novel tyrosine kinase activity of this well-studied enzyme and a highly unusual phosphotransfer from phosphorylated IKK2 onto substrate proteins in the absence of ATP as a substrate.

      Strengths:

      The authors provide an extensive biochemical characterization of the processes with recombinant protein, western blot, autoradiography, protein engineering and provide MS data now.

      Weaknesses:

      The identity and purity of the used proteins has improved in the revised work. Since the findings are so unexpected and potentially of wide-reaching interest - this is important. Similar specific detection of phospho-Ser/Thr vs phospho-Tyr relies largely on antibodies which can have varying degrees of specificity. Using multiple antibodies and MS improves the quality of the data.

      Authors thank the reviewer for their crisp comments and constructive criticisms that helped improve the manuscript.

      Recommendations for the authors:

      Reviewer #1 (Recommendations for the authors):

      Generally, the paper is well written, but the first 4 figures are slow going and could be condensed to show the key points, so that reader gets to Figure 6 and 7 which contain the "meat" of the paper.

      Specific points:

      Several figures should be quantified and experimental reproducibility is not always clear.

      I understand that Figure 3 shows that K44M abolishes both S32/26 phosphorylation and tyrosine phosphorylation, but not PEST region phosphorylation. This suggests that autophosphorylation is reflective of its known specific biological role in signal transduction. But I do not understand why "these results strongly suggest that IKK2-autophosphorylation is critical for its substrate specificity". That statement would be supported by a mutant that no longer autophosphorylates, and as a result shows a loss of substrate specificity, i.e. phosphorylates non-specific residues more strongly. Is that the case? Maybe Darwech et al 2010 or Meyer et al 2013 showed this? Later figures seem to address this point, so maybe this conclusion should be stated later in the paper.

      Page 10: mentions DFG+1 without proper introduction. The Chen et al 2014 paper appears to inform the author's interest in Y169 phosphorylation, or is just an additional interesting finding? Does this publication belong in the Introduction or the Discussion?

      To understand the significance of Figure 4D, we need a WT IKK2 control: or is there prior literature to cite?

      This is relevant for the conclusion that Y169 phosphorylation is particularly important for S32 phosphorylation.

      The cold ATP quenching experiment is nice for testing the model that Y169 functions as a phospho sink that allows for a transfer reaction. However, there is only a single timepoint and condition, which does not allow for a quantitative analysis. Furthermore, a positive control would make this experiment more compelling, and Y169F mutant should show that cold ATP quenching reduces the phosphorylation of IkBa.

      Note after revision: I thank the authors for addressing these points. The manuscript is thereby improved.

      We thank the reviewer for appreciating our efforts in addressing their concerns.

      Reviewer #2 (Recommendations for the authors):

      In the revisions, the authors provide LC-MS/MS spectra for putative phospho-Y325 and phospho-Y188. The details are hard to see at the scale provided, but the fragment ions for pY188 and pY325 peptides are unconvincing. Phospho-Y169, on the other hand, is much more credible. In addition, the revision rebuttal clarifies that Y188 would be packed into a catalytically important core, and Y188F is likely to disrupt the fold. Taken together, it seems doubtful that Y188 is subject to any significant autophosphorylation, and presenting the Y188F data (and discussion) seems like a distraction.

      We agree with the reviewer’s concerns on the identification of Y188 and Y325 as potential phosphosites. They have been omitted in the current version and relevant sections in the manuscript text and figures have been edited.

    1. eLife Assessment

      This manuscript addresses the role of alpha oscillations in sensory gain control. The authors use an attention-cuing task in an initial EEG study followed by a separate MEG replication study to demonstrate that whilst (occipital) alpha oscillations are increased when anticipating an auditory target, so is visual responsiveness as assessed with frequency tagging. The authors propose that their results demonstrate a general vigilance effect on sensory processing and offer a re-interpretation of the inhibitory role of the alpha rhythm. While some concerns remain about the interpretation of the alpha inhibition hypothesis, these results are valuable, and the provided evidence is solid.

    2. Reviewer #1 (Public review):

      In this study, Brickwedde et al. leveraged a cross-modal task where visual cues indicated whether upcoming targets required visual or auditory discrimination. Visual and auditory targets were paired with auditory and visual distractors, respectively. The authors found that during the cue-to-target interval, posterior alpha activity increased along with auditory and visual frequency-tagged activity when subjects were anticipating auditory targets. The authors conclude that their results disprove the alpha inhibition hypothesis, and instead implies that alpha "regulates downstream information transfer." However, as I detail below, I do not think the presented data irrefutably disproves the alpha inhibition hypothesis. Moreover, the evidence for the alternative hypothesis of alpha as an orchestrator for downstream signal transmission is weak. Their data serves to refute only the most extreme and physiologically implausible version of the alpha inhibition hypothesis, which assumes that alpha completely disengages the entire brain area, inhibiting all neuronal activity.

      (1) Authors assign specific meanings to specific frequencies (8-12 Hz alpha, 4 Hz intermodulation frequency, 36 Hz visual tagging activity, 40 Hz auditory tagging activity), but the results show that spectral power increases in all of these frequencies towards the end of the cue-to-target interval. This result is consistent with a broadband increase, which could simply be due to additional attention required when anticipating auditory target (since behavioral performance was lower with auditory targets, we can say auditory discrimination was more difficult). To rule this out, authors will need to show a power spectral density curve with specific increases around each frequency band of interest. In addition, it would be more convincing if there was a bump in the alpha band, and distinct bumps for 4 vs 36 vs 40 Hz band.<br /> (2) For visual target discrimination, behavioral performance with and without the distractor is not statistically different. Moreover, the reaction time is faster with distractor. Is there any evidence that the added auditory signal was actually distracting?<br /> (3) It is possible that alpha does suppress task-irrelevant stimuli, but only when it is distracting. In other words, perhaps alpha only suppresses distractors that are presented simultaneously with the target. Since the authors did not test this, they cannot irrefutably reject the alpha inhibition hypothesis.<br /> (4) In the abstract and Figure 1, the authors claim an alternative function for alpha oscillations; that alpha "orchestrates signal transmission to later stages of the processing stream." In support, the authors cite their result showing that increased alpha activity originating from early visual cortex is related to enhanced visual processing in higher visual areas and association areas. This does not constitute a strong support for the alternative hypothesis. The correlation between posterior alpha power and frequency-tagged activity was not specific in any way; Fig. 10 shows that the correlation appeared on both 1) anticipating-auditory and anticipating-visual trials, 2) the visual tagged frequency and the auditory tagged activity, and 3) was not specific to the visual processing stream. Thus, the data is more parsimonious with a correlation than a causal relationship between posterior alpha and visual processing.

    3. Reviewer #2 (Public review):

      Brickwedde et al. investigate the role of alpha oscillations in allocating intermodal attention. A first EEG study is followed up with an MEG study that largely replicates the pattern of results (with small to be expected differences). They conclude that a brief increase in the amplitude of auditory and visual stimulus-driven continuous (steady-state) brain responses prior to the presentation of an auditory - but not visual - target speaks to the modulating role of alpha that leads them to revise a prevalent model of gating-by-inhibition.

      Overall, this is an interesting study on a timely question, conducted with methods and analysis that are state-of-the-art. I am particularly impressed by the author's decision to replicate the earlier EEG experiment in MEG following the reviewer's comments on the original submission. Evidently, great care was taken to accommodate the reviewers suggestions.

      In an earlier version, I was struggling with the report for two main reasons: It was difficult to follow the rationale of the study, due to structural issues with the narrative and missing information or justifications for design and analysis decisions, and I was not convinced that the evidence is strong, or even relevant enough for revising the mentioned alpha inhibition theory.

      The authors have addressed my concerns through extensive revisions, and I find that it is now easier to follow, and makes a better case for rethinking how alpha may influence sensory processing through a clearer presentation of results and additional arguments.

    4. Reviewer #3 (Public review):

      Brickwedde et al. attempt to clarify the role of alpha in sensory gain modulation by exploring the relationship between attention-related changes in alpha and attention-related changes in sensory-evoked responses, which surprisingly few studies have explicitly examined. The authors find evidence against the alpha-inhibition account, at least in early sensory processing, adding valuable data to the field to support our understanding of the alpha-inhibition hypothesis.

      Due to task and measurement considerations, the EEG task is not sufficiently compelling to support the authors' claims that alpha inhibition does not occur in early sensory processing. However, the findings are bolstered by the additional MEG study which included changes in task design and a source-localization analysis. Importantly, the MEG results are aligned with the EEG study's key findings and support the authors' initial results, making a stronger case for their claims.

      It is important to note that task designs can have great implications for the assessment of alpha inhibition, particularly with the use of stimuli that evoke a steady-state response, and the authors review these considerations during their discussion and interpretation of the theory. Overall, this paper is an excellent contribution to the alpha-inhibition literature and will hopefully motivate additional research on the specific relationship between these attention-related changes using both frequency-tagged and non-frequency-tagged stimuli in different task contexts.

    5. Author response:

      The following is the authors’ response to the original reviews

      Reviewer #1 (Public review):

      (1) Potential bleed-over across frequencies in the spectral domain is a major concern for all of the results in this paper. The fact that alpha power, 36Hz and 40Hz frequency-tagged amplitude and 4Hz intermodulation frequency power is generally correlated with one another amplifies this concern. The authors are attaching specific meaning to each of these frequencies, but perhaps there is simply a broadband increase in neural activity when anticipating an auditory target compared to a visual target?

      We appreciate the reviewer’s insightful comment regarding the potential bleed-over across frequencies in the spectral domain. We fully acknowledge that the trade-off between temporal and frequency resolution is a challenge, particularly given the proximity of the frequencies we are examining.

      To address this concern, we performed additional analyses to investigate whether there is indeed a broadband increase in neural activity when anticipating an auditory target as compared to a visual target, as opposed to distinct frequency-specific effects. Our results show that the bleed-over between frequencies is minimal and does not significantly affect our findings. Specifically, we repeated the analyses using the same filter and processing steps for the 44 Hz frequency. At this frequency, we did not observe any significant differences between conditions.

      These findings suggest that the effects we report are indeed specific to the 40 Hz frequency band and not due to a general broadband increase in neural activity. We hope this addresses the reviewer’s concern and strengthens the validity of our frequency-specific results. We have now added this analysis to the methods section of our manuscript.

      Line 730: To confirm that 4 Hz is a sufficient distance between tagging frequencies, we repeated to analysis for 43.5 to 44.5. We found no indication of frequency-bleeding over, as the effects observed at 40 Hz, were not present at 44 Hz (see SUPPL Fig. 11).

      We do, however, not specifically argue against the possibility of a broadband increase in sensory processing when anticipating an auditory compared to a visual target. But even a broadband-increase would directly contradict the alpha inhibition hypothesis, which poses that an increase in alpha completely disengage the whole cortex. We have made this clearer in the text now.

      Line 491: As auditory targets were significantly more difficult than visual targets in our first study and of comparable difficulty in our second study, these results strongly speak to a vigilance increase of sensory processing independent of modality and an inability to selectively disengage one sensory modality in anticipation of a demanding task. This view is consistent with previous work in which visual SSEPs elicited by irrelevant background stimulation increased with task load in an auditory discrimination task (Jacoby et al., 2012).

      (2) Moreover, 36Hz visual and 40Hz auditory signals are expected to be filtered in the neocortex. Applying standard filters and Hilbert transform to estimate sensory evoked potentials appears to rely on huge assumptions that are not fully substantiated in this paper. In Figure 4, 36Hz "visual" and 40Hz "auditory" signals seem largely indistinguishable from one another, suggesting that the analysis failed to fully demix these signals.

      We appreciate the reviewer’s insightful concern regarding the filtering and demixing of the 36 Hz visual and 40 Hz auditory signals, and we share the same reservations about the reliance on standard filters and the Hilbert transform method.

      To address this, we would like to draw attention to SUPPL Fig. 11, which demonstrates that a 4 Hz difference is sufficient to effectively demix the signals using our chosen filtering and Hilbert transform approach. We argue that the reason the 36 Hz visual and 40 Hz auditory signals show similar topographies lies not in incomplete demixing but rather in the possibility that this condition difference reflects sensory integration, rather than signal contamination.

      This interpretation is further supported by our findings with the intermodulation frequency at 4 Hz, which also suggests cross-modal integration. Furthermore, source localization analysis revealed that the strongest condition differences were observed in the precuneus, an area frequently associated with sensory integration processes. We have now expanded on this in the discussion section to better clarify this point.

      Line 578: Previous research has shown that simultaneous frequency-tagging at multiple frequencies can evoke a response at the intermodulation frequency (f1 – f2), which in multimodal settings is thought to reflect cross-modal integration (Drijvers et al., 2021). This concept aligns closely with our findings, where increased vigilance in the sensory system, prompted by anticipation of a difficult auditory target, resulted in an increase in the intermodulation frequency. Similarly, our data shows that visual signal enhancement was localized in the precuneus, further supporting the role of this region in sensory integration (Al-Ramadhani et al., 2021; Xie et al., 2019).

      (3) The asymmetric results in the visual and auditory modalities preclude a modality-general conclusion about the function of alpha. However, much of the language seems to generalize across sensory modalities (e.g., use of the term 'sensory' rather than 'visual').

      We agree that in some cases we have not made a sufficient distinction between visual and sensory. We have now made sure, that when using ‘sensory’, we either describe overall theories, which are not visual-exclusive or refer to the possibility of a broad sensory increase. However, when directly discussing our results and the interpretation thereof, we now use ‘visual’.

      (4) In this vein, some of the conclusions would be far more convincing if there was at least a trend towards symmetry in source-localized analyses of MEG signals. For example, how does alpha power in primary auditory cortex (A1) compare when anticipating auditory vs visual target? What do the frequency tagged visual and auditory responses look like when just looking at primary visual cortex (V1) or A1?

      We thank the reviewer for this important suggestion and have added a virtual channel analysis. We were however, not interested in alpha power in primary auditory cortex, as we were specifically interested in the posterior alpha, which is usually increased when expecting an auditory compared to a visual target (and used to be interpreted as a blanket inhibition of the visual cortex). We have now improved upon the clarity concerning this point in the manuscript.

      We have however, followed the reviewer’s suggestion of a virtual channel analysis, showing that the condition differences are not observable in primary visual cortex for the 36 Hz visual signal and in primary auditory cortex for the 40 Hz auditory signal. Our data clearly shows that there is an alpha condition difference in V1, while there no condition difference for 36 Hz in V1 and for 40 Hz in Heschl’s Gyrus.

      Line 356: Additionally, we replicated this effect with a virtual channel analysis in V1 (see SUPPL Fig. 12)

      Line 403: Furthermore, a virtual channel analysis in V1 and Heschl’s gyrus confirmed that there were no condition differences in primary visual and auditory areas (see SUPPL Fig. 12).

      (5) Blinking would have a huge impact on the subject's ability to ignore the visual distractor. The best thing to do would be to exclude from analysis all trials where the subjects blinked during the cue-to-target interval. The authors mention that in the MEG experiment, "To remove blinks, trials with very large eye-movements (> 10 degrees of visual angle) were removed from the data (See supplement Fig. 5)." This sentence needs to be clarified, since eye-movements cannot be measured during blinking. In addition, it seems possible to remove putative blink trials from EEG experiments as well, since blinks can be detected in the EEG signals.

      We agree with the reviewer that this point has been phrased in a confusing way. From the MEG-data, we removed eyeblinks using ICA. Along for the supplementary Fig. 5 analysis, we used the eye-tracking data to make sure that participants were in fact fixating the centre of the screen. For this analysis, we removed trials with blinks (which can be seen in the eye-tracker as huge amplitude movements or as large eye-movements in degrees of visual angle; see figure below to show a blink in the MEG data and the according eye-tracker data in degrees of visual angle). We have now clarified this in the methods section.

      As for the concern closed eyes to ignore visual distractors, in both experiments we can observe highly significant distractor cost in accuracy for visual distractors, which we hope will convince the reviewer that our visual distractors were working as intended.

      Author response image 1.

      Illustration of eye-tracker data for a trial without and a trial with a blink. All data points recorded during this trial are plottet. A, ICA component 1, which reflects blinks and its according data trace in a trial. No blink is visible. B, eye-tracker data transformed into degrees of visual angle for the trial depicted in A. C, ICA component 1, which reflects blinks and its according data trace in a trial. A clear blink is visible. D, eye-tracker data transformed into degrees of visual angle for the trial depicted in C.

      Line 676: To confirm that participants had focused on the fixation cross during the cue-to-target interval, we incorporated eye-tracking into our MEG-experiment (EyeLink 1000 Plus). Correct trials of the second block were analysed for vertical and horizontal eye-movements. To exclude blinks from this analysis, trials with very large eye-movements (> 10 degrees of visual angle) were removed from the eye-tracking data (See suppl Fig. 5).

      (6) It would be interesting to examine the neutral cue trials in this task. For example, comparing auditory vs visual vs neutral cue conditions would be indicative of whether alpha was actively recruited or actively suppressed. In addition, comparing spectral activity during cue-to-target period on neutral-cue auditory correct vs incorrect trials should mimic the comparison of auditory-cue vs visual-cue trials. Likewise, neutral-cue visual correct vs incorrect trials should mimic the attention-related differences in visual-cue vs auditory-cue trials.

      We have analysed the neutral cue trials in the EEG dataset (see suppl. Fig. 1). There were no significant differences to auditory or visual cues, but descriptively alpha power was higher for neutral cues compared to visual cues and lower for neutral cues compared to auditory cues. While this may suggest that for visual trials alpha is actively suppressed and for auditory trials actively recruited, we do not feel comfortable to make this claim, as the neutral condition may not reflect a completely neutral state. The neutral task can still be difficult, especially because of the uncertainty of the target modality.

      As for the analysis of incorrect versus correct trials, we appreciate the idea, but unfortunately the accuracy rate was quite high so that the number of incorrect trials is insufficient to perform a reliable analysis.

      (7) In the abstract, the authors state that "This implies that alpha modulation does not solely regulate 'gain control' in early sensory areas but rather orchestrates signal transmission to later stages of the processing stream." However, I don't see any supporting evidence for the latter claim, that alpha orchestrates signal transmission to later stages of the processing stream. If the authors are claiming an alternative function to alpha, this claim should be strongly substantiated.

      We thank the reviewer for pointing out, that we have not sufficiently explained our case. The first point refers to gain control as elucidated by the alpha inhibition hypothesis, which claims that increases in alpha disengage an entire cortical area. Since we have confirmed the alpha increase in our data to originate from primary visual cortex through source analysis, this should lead to decreased visual processing. The increase in 36 Hz visual processing therefore directly contradicts the alpha inhibition hypothesis. We propose an alternative explanation for the functionality of alpha activity in this task. Through pulsed inhibition, information packages of relevant visual information could be transmitted down the processing stream, thereby enhancing relevant visual signal transmission. We argue the fact that the enhanced visual 36 Hz signal we found correlated with visual alpha power on a trial-by-trial basis, and did not originate from primary visual cortex, but from areas known for sensory integration supports our claim.

      We have now tried to make this point clearer by rephrasing our manuscript. Additionally, we have also now further clarified this point in our discussion.

      Line 527: Our data provides evidence in favour of this view, as we can show that early sensory alpha activity covaries over trials with SSEP magnitude in higher order sensory areas. If alpha activity exerted gain control in early visual regions, increased alpha activity would have to lead to a decrease in SSEP responses. In contrast, we observe that increased alpha activity originating from early visual cortex is related to enhanced visual processing. Source localization confirmed that this enhancement was not originating from early visual areas, but from areas associated with later stages of the processing stream such as the precuneus, which has been connected to sensory integration (Al-Ramadhani et al., 2021; Xie et al., 2019). While we cannot completely rule out alternative explanations, it seems plausible to assume that inhibition of other task-irrelevant communication pathways leads to prioritised and thereby enhanced processing over relevant pathways. In line with previous literature (Morrow et al., 2023; Peylo et al., 2021; Zhigalov & Jensen, 2020b), we therefore suggest that alpha activity limits task-irrelevant feedforward communication, thereby enhancing processing capabilities in relevant downstream areas (see Fig. 1A).

      Reviewer #1 (Recommendations for the authors):Minor Concerns:

      (1) I suggest adding more details about the task in the Results and/or Figure 1 legend. Specifically, when describing the task, I think it would help the readers if the authors specified what the participants had to do to get a trial correct (e.g., press left / down / right arrow if the tone pitch was low (500Hz) / medium (1000Hz) / high (2000Hz).)

      (2) Please clarify whether Gaboar patch was drifting.

      (3) Figure 2C-D: I suggest clarifying in the X-tick labels that + and - trials are in separate blocks (e.g., put 'Block1 visual-' instead of 'visual-').

      We followed the suggestions of the reviewer detailed in point 1-3, which indeed greatly improves the clarity and readability of these parts.

      (4) "Interestingly, auditory distractors reduced reaction times to visual targets, which could be explained by a generally faster processing of auditory targets (Jain et al., 2015), possibly probing faster responses in visual tasks (Naue et al., 2011)." - Please elaborate on how faster processing of auditory targets could lead to the probing of faster responses in visual tasks. Further, if I understand correctly, this should result in a speed-accuracy trade-off, which is not observed in the MEG experiments. If there is a learning effect due to the blocked structure in the MEG experiments, why is it not observed on auditory trials?

      We thank the reviewer for suggesting clarifying this paragraph. We have now rephrased this part and added additional information.

      Concerning the reviewer’s theory, intersensory facilitation can occur in the absence of a speed-accuracy trade-off, as it can affect the motor execution after a decision has been made. Nevertheless, learning effects could also have led to this result in the MEG experiment. Our difficulty calibration did not lead to comparable accuracies in block 1, where auditory targets wetre now less difficult than visual targets. Whith the addition of distractors in block 2, accuracy for auditory targets decreased, while it increased for visual targets. Indeed, one interpretation could be that there was a learning effect for visual targets, which was not prevalent for auditory targets. However, the speed increase when visual targets are coupled with auditory distractors is prevalent in both experiments. Accordingly, we find the intersensory facilitation account more likely.

      line 148: Interestingly, auditory distractors reduced reaction times to visual targets, which could be explained by a generally faster processing of auditory targets (Jain et al., 2015). As such, the auditory distractor possibly caused intersensory facilitation (Nickerson., 1973), whereby reaction times to a target can be facilitated when accompanied by stimuli of other sensory modalities, even if they are irrelevant or distracting.

      (5) Please briefly describe the cluster permutation analysis in the results section.

      We have now added a brief description of the cluster permutation analysis we performed in the results section.

      Line 166: We then applied cluster permutation analysis, whereby real condition differences were tested against coincidental findings by randomly permutating the condition labels to the data and testing for condition differences 1000 times (Maris & Oostenveld, 2007).

      (6) Figure 4A legend: "auditory steady-state evoked potential (ASSEP) averaged over 6 central electrodes displaying the highest 40 Hz power (Fz, FC1, FC2, F11, F2, FCz)." - I suggest marking these 6 electrodes in the scalp map on the figure panel.

      We have followed the suggestion of the reviewer and marked the electrodes/sensors used to illustrate the steady-state responses.

      (7) Lines 281-283: "It was highly significant for the visual 36 Hz response (Fig. 5A, middle columns, p = .033; t(19) = 2.29; BF(10) = 1.91) but did not reach significance for the visual 40 Hz response (Fig. 5B, middle column; p = 0.20; t(19) = 1.32; BF(10) = 0.49)." - Was "visual 40Hz response" a typo? I believe 40Hz pertains to auditory, not visual?

      We thank the reviewer for pointing out this error and agree that the phrasing was sometimes confusing. We have now used the terms VSSEP and ASSEP to make things clearer throughout the manuscript.

      L. 224-229: The median split was highly significant for the 36 Hz VSSEP response (Fig. 5A, middle columns, p \= .033; t<sub>(19)</sub> = 2.29; BF<sub>(10)</sub> = 1.91) but did not reach significance for the 40 Hz ASSEP response (Fig. 5B, middle column; p = 0.20; t<sub>(19)</sub> = 1.32; BF<sub>(10)</sub> = 0.49).

      Reviewer #2 (Public review):

      Brickwedde et al. investigate the role of alpha oscillations in allocating intermodal attention. A first EEG study is followed up with an MEG study that largely replicates the pattern of results (with small to be expected differences). They conclude that a brief increase in the amplitude of auditory and visual stimulus-driven continuous (steady-state) brain responses prior to the presentation of an auditory - but not visual - target speaks to the modulating role of alpha that leads them to revise a prevalent model of gating-by-inhibition.

      Overall, this is an interesting study on a timely question, conducted with methods and analysis that are state-of-the-art. I am particularly impressed by the author's decision to replicate the earlier EEG experiment in MEG following the reviewer's comments on the original submission. Evidently, great care was taken to accommodate the reviewers suggestions.

      We thank the reviewer for the positive feedback and expression of interest in the topic of our manuscript.

      Nevertheless, I am struggling with the report for two main reasons: It is difficult to follow the rationale of the study, due to structural issues with the narrative and missing information or justifications for design and analysis decisions, and I am not convinced that the evidence is strong, or even relevant enough for revising the mentioned alpha inhibition theory. Both points are detailed further below.

      We have now revised major parts of the introduction and results in line with the reviewer’s suggestions, hoping that our rationale is now easier to follow and that our evidence will now be more convincing. We have separated our results section into the first study (EEG) and to second study (MEG), to enhance the rationale of our design choices and readability. We have clarified all mentioned ambiguous parts in our methods section. Additionally, we have revised the introduction to now explain more clearly what results to expect under the alpha inhibition theory in contrast to our alternative account.

      Strength/relevance of evidence for model revision: The main argument rests on 1) a rather sustained alpha effect following the modality cue, 2) a rather transient effect on steady-state responses just before the expected presentation of a stimulus, and 3) a correlation between those two. Wouldn't the authors expect a sustained effect on sensory processing, as measured by steady-state amplitude irrespective of which of the scenarios described in Figure 1A (original vs revised alpha inhibition theory) applies? Also, doesn't this speak to the role of expectation effects due to consistent stimulus timing? An alternative explanation for the results may look like this: Modality-general increased steady-state responses prior to the expected audio stimulus onset are due to increased attention/vigilance. This effect may be exclusive (or more pronounced) in the attend-audio condition due to higher precision in temporal processing in the auditory sense or, vice versa, too smeared in time due to the inferior temporal resolution of visual processing for the attend-vision condition to be picked up consistently. As expectation effects will build up over the course of the experiment, i.e., while the participant is learning about the consistent stimulus timing, the correlation with alpha power may then be explained by a similar but potentially unrelated increase in alpha power over time.

      We thank the reviewer for raising these insightful questions and suggestions.

      It is true that our argument rests on a rather sustained alpha effect and a rather transient effect on steady-state responses ,and a correlation between the two. However, this connection would not be expected under the alpha inhibition hypothesis, which states that alpha activity would inhibit a whole cortical area (when irrelevant to the task), exerting “gain control”. This notion directly contradicts our results of the “irrelevant” visual information a) being transmitted at all and b) increasing.

      However, it has been shown in various reports (see for instance Dugué et al., 2011; Haegens et al., 2011; Spaak et al., 2012) that alpha activity exerts pulsed inhibition, so we proposed an alternative theory of an involvement in signal transmission. In this case, the cyclic inhibition would serve as an ordering system, which only allows for high-priority information to pass, resulting in higher signal-to-noise ratio. We do not make a claim about how fast or when these signals are transmitted in relation to alpha power. For instance, it could be that alpha power increases as a preparatory state even before signal is actually transmitted.  Zhigalov (2020 Hum. Brain M.) has shown that in V1, frequency-tagging responses were up-and down regulated with attention – independent of alpha activity.

      However, we do believe that visual alpha power correlates on a trial-by-trial level with visual 36 Hz frequency-tagging increases (see Fig. 5 and 10 in our manuscript) - a relationship which has not been found in V1 by us and others (see SUPPL Fig. 12 and Zhigalov 2020, Hum. Brain Mapp.) suggest a strong connection. Furthermore, the fact that the alpha modulation originates from early visual areas and occurs prior to any frequency-tagging changes, while the increase in frequency-tagging can be observed in areas which are later in the processing stream (such as the precuneus) is strongly indicative for an involvement of alpha power in the transmission of this signal. We cannot fully exclude alternative accounts and mechanisms which effect both alpha power and frequency-tagging responses.  

      The alternative account described by the reviewer does not contradict our theory, as we argue that the alpha power modulation reflects an expectation effect (and the idea that it could be related to the resolution of auditory versus visual processing is very interesting!). It is also possible that this expectation is, as the reviewer suggests, related to attention/vigilance and might result in a modality-general signal increase. By way of support, we observed an increase in the frequency-tagging response in sensory integration areas. Accordingly, we argue that the alternative explanation provided by the reviewer contradicts the alpha inhibition hypothesis, but not necessarily our alternative theory.

      We have now revised the discussion and are confident our case is now stronger and easier to follow. Additionally, we mentioned the possibility for alternative explanations as well as the possibility, that alpha networks fulfil different roles in different locations/task environments.

      Line 523: Here we propose that alpha activity, rather than modulating early primary sensory processing, exhibits its inhibitory effects at later stages of the processing stream (Antonov et al., 2020; Gundlach et al., 2020; Zhigalov & Jensen, 2020a; Zumer et al., 2014), gating feedforward or feedback communication between sensory areas (Bauer et al., 2020; Haegens et al., 2015; Uemura et al., 2021). Our data provides evidence in favour of this view, as we can show that early sensory alpha activity covaries over trials with SSEP magnitude in higher order sensory areas. If alpha activity exerted gain control in early visual regions, increased alpha activity would have to lead to a decrease in SSEP responses. In contrast, we observe that increased alpha activity originating from early visual cortex is related to enhanced visual processing. Source localization confirmed that this enhancement was not originating from early visual areas, but from areas associated with later stages of the processing stream such as the precuneus, which has been connected to sensory integration (Al-Ramadhani et al., 2021; Xie et al., 2019). While we cannot completely rule out alternative explanations, it seems plausible to assume that inhibition of other task-irrelevant communication pathways leads to prioritised and thereby enhanced processing over relevant pathways. In line with previous literature (Morrow et al., 2023; Peylo et al., 2021; Zhigalov & Jensen, 2020b), we therefore suggest that alpha activity limits task-irrelevant feedforward communication, thereby enhancing processing capabilities in relevant downstream areas (see Fig. 1A).

      References:

      Dugué, L., Marque, P., & VanRullen, R. (2011). The phase of ongoing oscillations mediates the causal relation between brain excitation and visual perception. Journal of Neuroscience, 31(33), 11889–11893. https://doi.org/10.1523/JNEUROSCI.1161-11.2011

      Haegens, S., Nácher, V., Luna, R., Romo, R., & Jensen, O. (2011). α-Oscillations in the monkey sensorimotor network influence discrimination performance by rhythmical inhibition of neuronal spiking. Proceedings of the National Academy of Sciences, 108(48), 19377–19382. https://doi.org/10.1073/PNAS.1117190108

      Spaak, E., Bonnefond, M., Maier, A., Leopold, D. A., & Jensen, O. (2012). Layer-Specific Entrainment of Gamma-Band Neural Activity by the Alpha Rhythm in Monkey Visual Cortex. Current Biology, 22(24), 2313–2318. https://doi.org/10.1016/J.CUB.2012.10.020

      Zhigalov, A., & Jensen, O. (2020). Alpha oscillations do not implement gain control in early visual cortex but rather gating in parieto-occipital regions. Human Brain Mapping, 41(18), 5176–5186. https://doi.org/10.1002/hbm.25183

      Structural issues with the narrative and missing information: Here, I am mostly concerned with how this makes the research difficult to access for the reader. I list the some major, followed by more specific points below:

      In the introduction the authors pit the original idea about alpha's role in gating against some recent contradictory results. If it's the aim of the study to provide evidence for either/or, predictions for the results from each perspective are missing. Also, it remains unclear how this relates to the distinction between original vs revised alpha inhibition theory (Fig. 1A). Relatedly, if this revision is an outcome rather than a postulation for this study, it shouldn't be featured in the first figure.

      We agree with the reviewer that we have not sufficiently clarified our goal as well as how different functionalities of alpha oscillations would lead to different outcomes. We have revised the introduction and restructured the results part and hope that it is now easier to follow. The results part now follows study 1 (EEG) and study 2 (MEG) chronologically, so that results can more easily be differentiated and our design choices for the second study can be explained better.

      Line 50: Recent evidence challenged a direct connection between alpha activity and visual information processing in early visual cortex. As such, both visual steady-state responses and alpha power were modulated by attention, but did not covary when investigating individual trials (Zhigalov & Jensen, 2020). Unfortunately, very few studies have investigated direct connections between alpha activity, attention and sensory signals, especially over trials. Furthermore, results seem to depend on timing of alpha activity in relation to sensory responses as well as stimulus type and outcome measure (Morrow et al., 2023).

      Accordingly, the objective of the current study is to test the alpha inhibition hypothesis compared to an alternative theory. Based on the alpha inhibition hypothesis, alpha modulation is connected to ‘gain control’ in early visual areas through modulation of excitability (Foxe & Snyder, 2011; Jensen & Mazaheri, 2010; Van Diepen et al., 2019).  In contrast, we propose that inhibitory effects of alpha modulation are exhibited at later stages of the processing stream (Peylo et al., 2021; Yang et al., 2023; Zhigalov & Jensen, 2020a; Zumer et al., 2014), gating feedforward or feedback communication between sensory areas (see Fig. 1B; Bauer et al., 2020; Haegens et al., 2015; Uemura et al., 2021).

      Line 80: The aim of our study was to directly test the alpha inhibition hypothesis by investigating if cue-induced modulation of alpha activity coincides with the suppression of frequency-tagging responses in task-irrelevant modalities.

      Line 99: In brief, while we observed the expected cue-induced early-visual alpha modulation, the amplitude of auditory and visual SSEP/SSEFs as well as their intermodulation frequency increased just prior to the onset of the auditory target, contradicting the alpha inhibition hypothesis. The difference between conditions of visual SSEP/SSEFs originated from sensory integration areas and correlated with early sensory alpha activity on a trial-by-trial basis, speaking to an effect of alpha modulation on signal transmission rather than inhibition of early visual areas.

      The analysis of the intermodulation frequency makes a surprise entrance at the end of the Results section without an introduction as to its relevance for the study. This is provided only in the discussion, but with reference to multisensory integration, whereas the main focus of the study is focussed attention on one sense. (Relatedly, the reference to "theta oscillations" in this sections seems unclear without a reference to the overlapping frequency range, and potentially more explanation.) Overall, if there's no immediate relevance to this analysis, I would suggest removing it.

      We thank the reviewer for pointing this out and have now added information about this frequency to the introduction. We believe that the intermodulation frequency analysis is important, as it potentially supports the notion that condition differences in the visual-frequency tagging response are related to downstream processing rather than overall visual information processing in V1. We would therefore prefer to leave this analysis in the manuscript.

      Line 75: Furthermore, when applying two different frequencies for two different sensory modalities, their intermodulation frequency (f1-f2) has been suggested to reflect cross-modal integration (Drijvers et al., 2021). Due to distinct responses, localisation and attention-dependence, frequency-tagging provides an optimal tool to study sensory signal processing and integration over time.

      Reviewer #2 (Recommendations for the authors):

      As detailed in several points below, I found that I didn't get the information I needed to fully understand design/analysis decisions. In some cases, this may just be a case of re-organising the manuscript, in others crucial info should be added:

      Specific issues:

      Page 2, line 51: How does recent evidence contradict this? Please explain.

      We have added a section that describes the results contradicting the alpha inhibition hypothesis.

      Line 50: Recent evidence challenged a direct connection between alpha activity and visual information processing in early visual cortex. As such, both visual steady-state responses and alpha power were modulated by attention, but did not covary when investigating individual trials (Zhigalov & Jensen, 2020).

      Page 3, line 78-80: "... also interested in relationships [...] on a trial-by-trial basis" - why? Please motivate.

      We thank the reviewer for highlighting this section, which we feel was not very well phrased. We have rewritten this whole paragraph and hope that our motivation for this study is now clear.

      Line 50: Recent evidence challenged a direct connection between alpha activity and visual information processing in early visual cortex. As such, both visual steady-state responses and alpha power were modulated by attention, but did not covary when investigating individual trials (Zhigalov & Jensen, 2020). Unfortunately, very few studies have investigated direct connections between alpha activity, attention and sensory signals, especially over trials. Furthermore, results seem to depend on timing of alpha activity in relation to sensory responses as well as stimulus type and outcome measure (Morrow et al., 2023).

      Page 4, line 88-92: "... implementing a blocked design" - unclear why? This is explained to some extent in the next few lines but remains unclear without knowing outcomes of the EEG experiment with more detail. Overall, it seems like this methodological detail may be better suited for a narrative in the Results section, that follows a more chronological order from the findings of the EEG experiment to the design of the MEG study.

      More generally, and maybe I missed it, I couldn't find a full account of why a block design was chosen and what the added value was. I believe that re-organising the Results section would allow precisely stating how that was an improvement over the EEG experiment.

      In line with the reviewer’s suggestion, we have now restructured the results section. The first section of the study 2 results now explains our design choices with direct reference to the results of the EEG experiment.

      Line 298: To test the robustness of our results and to employ additional control analyses, we replicated our experiment using MEG (see Fig. 7A). While an increase in visual information processing parallel to an increase in alpha modulation already contradicts the notion of alpha inhibition exerting “gain control”, affecting the whole visual cortex, our claim that alpha modulation instead affects visual information at later processing stages still required further validation. As such, our goal was to perform source analyses showing alpha modulation originating from primary visual areas affected visual information at later processing stages (e.g. not in primary visual cortex). Additionally, to exclude that the uncertainty over possible distractors affected our results, we employed a block design, where block 1 consisted only of trials without distractors and in block 2 targets were always accompanied by a distractor. Furthermore, we aligned the visual and auditory task to be more similar, both of them now featuring frequency-discrimination, which related to sound pitch (frequency) in the auditory condition and stripe-frequency of the Gabor patch in the visual condition. Lastly, to make sure our effects were driven by sensory modality-differences rather than task-difficulty differences, we included a short calibration phase. Prior to the experiment, difficulty of pitch sounds, and Gabor patch frequency were calibrated for each individual, ascertaining a success rate between 55% to 75%.

      The point above also applies to lines 95-97 where it's unclear what "aligning the visual with the auditory task" means. Also, what would be the predictions for "more nuanced interactions [...]"

      We agree that this phrasing was more than confusing and in the process of restructuring our results section, we have now revised this passage (see cited text from our manuscript to the point just above).

      Page 9, line 207-209: One of the few mentions of the "ambivalent" condition (attention to audio+vision?). To what end was that condition added to the experiment originally? The explanation that this condition was dropped from analysis because it did not show significant results does not seem methodologically sound.

      We thank the reviewer for pointing this out, as we had changed the name from ambivalent to non-specific, but this word had slipped our attention. The condition was added to the experiment as a control, which enables us to verify that our cues as well as our distractors work as intended. While interesting to analyse (and we did not drop it completely, the condition comparisons are in the supplementary material), we felt that further analysis of this condition would not contribute to addressing our research question. To be specific, the prerequisite to analysing the effect of alpha modulation is a significant effect of alpha modulation in the first place. We have now clarified the rationale for this condition, as well as our reasoning for omitting it from correlation and source analysis.

      Line 173 When presenting unspecified cues, alpha power changes were not significant, but descriptively larger compared to visual target conditions and lower compared to auditory target conditions (see suppl Fig. 2). However as significant alpha modulation was a prerequisite to test our hypotheses, we excluded this condition from further analysis.

      Page 9, line 209-212: "condition differences in alpha were only significant in block 2 [...] therefore we performed the [...] analysis [...] only for the second half of the experiment." This sounds like double-dipping. Maybe just an issue of phrasing?

      We thank the reviewer for pointing out that it may appear like ‘double dipping’. The reasoning was the same as the point above, we require a significant alpha modulation to test the effect of alpha modulation on further processing. We have revised this part to be clearer.

      Line 345: In line with previous studies (van Diepen & Mazaheri, 2017), condition differences in alpha activity were only significant in block 2, where distractors were present. As alpha modulation was a prerequisite to test our hypotheses, we performed the following analyses solely with data from block 2 (see Fig. 8).

      Page 12, line 281: Bayes factors are used here (and elsewhere), in addition to NHST. May be worthwhile to mention that briefly before use and give an intro sentence on its use, value and interpretation, and why these are added sometimes but not for all tests reported.

      We agree that we did not introduce this at all and have now added a section, which explains the inclusion as well as the interpretation of the Bayes factor.

      Line 218: To estimate the robustness of these results, we additionally conducted median split analyses between trials with high and low alpha power for each participant, as well as averaged the correlation coefficient of each participant and calculated a one-sample t-test against 0. For each analysis we provided the Bayes Factor, which estimates the strength of support for or against the null hypothesis (BF > 3.2 is considered as substantial evidence and BF > 10 is considered as strong evidence; Kass & Raftery, 1995).

      Throughout the Results section, it's not always clear which results are from the EEG or from the MEG study. Adopting the recommendation in point c) may help with that.

      According to the reviewer’s recommendation, we have restructured our results section and first present the EEG study and afterwards the MEG study.

      Similarly, it seems pivotal to add "visual" and "auditory" when mentioning the 36/40-Hz steady-state responses (or stimulation) to help the reader.

      We agree that visual/auditory 36 Hz / 40 Hz frequency-tagging responses, expecting visual/auditory target becomes lengthy and confusing very quickly. We therefore decided to introduce the abbreviation of visual steady-state evoked potentials/fields (VSSEP/VSSEF) and auditory steady-state evoked potentials/fields (ASSEP/ASSEF).

      Figure 5 - showing the same cluster as "early" and "late" in the margin for the MEG data is potentially confusing.

      We thank the reviewer for pointing this out and have now adapted the figure to just show one cluster, as we only found this one cluster in our MEG analysis.

      Reviewer #3 (Public review):

      This paper seems very strong, particularly given that the follow-up MEG study both (a) clarifies the task design and separates the effect of distractor stimuli into other experimental blocks, and (b) provides source-localization data to more concretely address whether alpha inhibition is occurring at or after the level of sensory processing, and (c) replicates most of the EEG study's key findings.

      We thank the reviewer for their positive feedback and evaluation of our work.

      There are some points that would be helpful to address to bolster the paper. First, the introduction would benefit from a somewhat deeper review of the literature, not just reviewing when the effects of alpha seem to occur, but also addressing how the effect can change depending on task and stimulus design (see review by Morrow, Elias & Samaha (2023).

      We thank the reviewer for this suggestion and agree. We have now added a paragraph to the introduction that refers to missing correlation studies and the impact of task design.

      Line 53: Unfortunately, very few studies have investigated direct connections between alpha activity, attention and sensory signals, especially over trials. Furthermore, results seem to depend on timing of alpha activity in relation to sensory responses as well as stimulus type and outcome measure (Morrow et al., 2023).

      Additionally, the discussion could benefit from more cautionary language around the revision of the alpha inhibition account. For example, it would be helpful to address some of the possible discrepancies between alpha and SSEP measures in terms of temporal specificity, SNR, etc. (see Peylo, Hilla, & Sauseng, 2021). The authors do a good job speculating as to why they found differing results from previous cross-modal attention studies, but I'm also curious whether the authors think that alpha inhibition/modulation of sensory signals would have been different had the distractors been within the same modality or whether the cues indicated target location, rather than just modality, as has been the case in so much prior work?

      We thank the reviewer for suggesting these interesting discussion points and have included a paragraph in our discussion that clarifies these issues.

      Line 543: It should be noted, the comparison between modulation in alpha activity and in SSEP/SSEFs is difficult, especially concerning timing. This is largely owed to differences in signal-to-noise due to trial averaging in the frequency versus the time domain and temporal and frequency lag in the estimation of alpha activity (Peylo et al., 2021). It is further noteworthy, that the majority of evidence for the alpha inhibition hypothesis focused on the effect of pre-target alpha modulation on behaviour and target-related potentials (Morrow et al., 2023). However, in our data alpha modulation occurs clearly ahead of SSVEP/SSVEF modulation on a scale that could not be simply explained by temporal or frequency smearing. Additionally, significant trial-by-trial correlations, which occur in the frequency domain for both signal types, underline the strong relationship between both measurements.

      Interestingly, we could show that the magnitude of the correlation between alpha power and visual information processing varied between conditions, suggesting a dynamic and adaptive regime. This notion supports the view that alpha oscillations represent a mechanism rather than a specific function, which can fulfil different roles depending on task demand and network location, which has been confirmed in a recent study revealing functionally distinct alpha networks (Clausner et al., 2024). As such, it is conceivable that alpha oscillations can in some cases inhibit local processing, while in other cases, depending on network location, connectivity and demand, alpha oscillation can facilitate signal transmission. In different contexts, utilizing unimodal targets and distractors, spatial cueing, or covert attention, different functional processes could be involved (Morrow et al., 2023). Future research should intensify efforts to disentangle these effects, investigating localized alpha networks intracranially or through combinations of fMRI, EEG and MEG, to clearly measure their effects on sensory processing and behaviour.

      Overall, the analyses and discussion are quite comprehensive, and I believe this paper to be an excellent contribution to the alpha-inhibition literature.

      Reviewer #3 (Recommendations for the authors):

      Overall, the paper is well-written, and the analyses and interpretations are strong. I think that the end of the introduction would feel more complete and more read more easily if you outlined all of your main hypotheses (not just trials signaling an auditory stimulus, but visual trials too, and what about distractor trials? This could help justify changes to task design in the MEG study), and then the key findings that motivated the follow-up design, which you then discuss (as opposed to introducing a new aim in this paragraph).

      We thank the reviewer for this positive evaluation. Based on feedback und suggestions from all reviewers, we have revised the structure of the manuscript. The introduction now states more clearly which results would be expected under the alpha inhibition theory and how our results contradict this. The results section has now been divided into two studies, which will make the rationale for our follow-up design easier to follow.

      Line 80: The aim of our study was to directly test the alpha inhibition hypothesis by investigating if cue-induced modulation of alpha activity coincides with the suppression of frequency-tagging responses in task-irrelevant modalities.

      Line 96: In brief, while we observed the expected cue-induced early-visual alpha modulation, the amplitude of auditory and visual SSEP/SSEFs as well as their intermodulation frequency increased just prior to the onset of the auditory target, contradicting the alpha inhibition hypothesis. The difference between conditions of visual SSEP/SSEFs originated from sensory integration areas and correlated with early sensory alpha activity on a trial-by-trial basis, speaking to an effect of alpha modulation on signal transmission rather than inhibition of early visual areas.

      Minor issues:

      L84 - "is" should be "was"

      L93 - "allows" should be "allowed"

      L113 - I think "changed" would suffice

      Fig 1A (text within figure on top) - "erea" should be "area" and caption title should include "of" (Illustration of the...)

      L213 - time window could be clarified

      Fig 4 -captions inconsistently capitalize words and use ) and , following the caption letters

      L253-255 - give you are looking at condition differences, do you mean the response was larger before an auditory target than before a visual target? It currently reads as if you mean that it was larger in that window right before the target as opposed to other time windows

      L368 - "behaviorally" should be "behavioral"

      L407-408 - I think auditory SSEP/SSVEFs should be auditory or visual SSEP/SSEFs, unless you are specifically only talking about auditory SSEPs and visual SSEFs

      L411 - also uses SSVEFs

      L413 - "frequently, or in the case of..."

      L555 - "predicting" should be predicted? Or do you mean only cues that correctly predicted the target?

      We are very grateful for the reviewer for pointing out these mistakes, all of which we have remedied in our manuscript.

    1. eLife Assessment

      In this work, the authors characterize the synaptic adhesion molecule RTN4RL2, demonstrating its critical involvement in the development and function of auditory synapses between inner hair cells and spiral ganglion neurons. This study is important because it offers potential insights into therapeutic strategies for hearing loss associated with synaptic dysfunction. The findings are solid, because they are supported by the use of multiple advanced techniques, including FISH and SBEM imaging.

    2. Reviewer #1 (Public review):

      Hearing and balance rely on specialized ribbon synapses that transmit sensory stimuli between hair cells and afferent neurons. Synaptic adhesion molecules that form and regulate transsynaptic interactions between inner hair cells (IHCs) and spiral ganglion neurons (SGNs) are crucial for maintaining auditory synaptic integrity and, consequently, for auditory signaling. Synaptic adhesion molecules such as neurexin-3 and neuroligin-1 and -3 have recently been shown to play vital roles in establishing and maintaining these synaptic connections ( doi: 10.1242/dev.202723 and DOI: 10.1016/j.isci.2022.104803). However, the full set of molecules required for synapse assembly remains unclear.

      Karagulan et al. highlight the critical role of the synaptic adhesion molecule RTN4RL2 in the development and function of auditory afferent synapses between IHCs and SGNs, particularly regarding how RTN4RL2 may influence synaptic integrity and receptor localization. Their study shows that deletion of RTN4RL2 in mice leads to enlarged presynaptic ribbons and smaller postsynaptic densities (PSDs) in SGNs, indicating that RTN4RL2 is vital for synaptic structure. Additionally, the presence of "orphan" PSDs-those not directly associated with IHCs-in RTN4RL2 knockout mice suggests a developmental defect in which some SGN neurites fail to form appropriate synaptic contacts, highlighting potential issues in synaptic pruning or guidance. The study also observed a depolarized shift in the activation of CaV1.3 calcium channels in IHCs, indicating altered presynaptic functionality that may lead to impaired neurotransmitter release. Furthermore, postsynaptic SGNs exhibited a deficiency in GluA2/3 AMPA receptor subunits, despite normal Gria2 mRNA levels, pointing to a disruption in receptor localization that could compromise synaptic transmission. Auditory brainstem responses showed increased sound thresholds in RTN4RL2 knockout mice, indicating impaired hearing related to these synaptic dysfunctions.

      The findings reported here significantly enhance our understanding of synaptic organization in the auditory system, particularly concerning the molecular mechanisms underlying IHC-SGN connectivity. The implications are far-reaching, as they not only inform auditory neuroscience but also provide insights into potential therapeutic targets for hearing loss related to synaptic dysfunction.

      Comments on the Latest Version:

      In the revised manuscript, the authors have addressed my previous comments and incorporated my recommendations by adding missing experimental details, using color-blind-friendly figure colors, and discussing the differences between GluA3 KO and RTN4RL2 KO phenotypes. They also clarified why the animals needed for additional experiments are no longer available. Although these specific animals are unavailable, the authors made an effort to address my concerns by performing

    3. Reviewer #3 (Public review):

      In this study, the authors used RNAscope to explore the expression of RTN4RL2 RNA in hair cells and spiral ganglia. Through RTN4RL2 gene knockout mice, they demonstrated that the absence of RTN4RL2 leads to pre-synaptic changes of an increase in the size of presynaptic ribbons and a depolarized shift in the activation of calcium channels in inner hair cells. Additionally, they observed a post-synaptic reduction in GluA2-4 AMPA receptors and identified additional "orphan PSDs" not paired with presynaptic ribbons via immunostaining and an increased number of type I SGNs that are not connected with a ribbon synapse via serial block face imaging. These synaptic alterations ultimately resulted in an increased hearing threshold in mice, confirming that the RTN4RL2 gene is essential for normal hearing. These data are intriguing as they suggest that RTN4RL2 contributes to the proper formation and function of auditory afferent synapses and is critical for normal hearing. Most strikingly, the post-synaptic changes and hearing threshold changes are similar to recently published results by Carlton et al, 2024 on a mutation in Bai1, which is a potential binding partner for RTN4RL2. Overall this work provides some clues to the function of RTN4RL2 in the cochlea, but further studies are required to elucidate the function.

      A few points would improve the manuscript and the strength of the data presented.

      (1) A quantitative assessment is necessary in Figure 1 when discussing RNA scope data. It would be beneficial to show that expression levels are quantitatively reduced in KO mice compared to wild-type mice. This suggestion also applies to Figure 3D, which examines expression levels of Gria2. Data is provided for KO reduction in SGN, but not showing that hair cell labeling is specific. If slides are not available for the young ages, showing hair cell expression at P40 would be sufficient along with a loss of labeling at in the KO at P40.

      (2) In Figure 2, the authors present a morphological analysis of synapses and discuss the presence of "orphan PSDs." I agree that Homer1 not juxtaposed with Ctbp2 is increased in KO mice compared to the control group. However, in quantifying this, they opted to measure the number of Ctbp2 puncta with Homer 1 juxtaposed, which indicates the percentages of orphan ribbons rather than directly quantifying the number of Homer1 not juxtaposed with Ctbp2. Quantifying the number of Homer1 not juxtaposed with Ctbp2 would more clearly represent "orphan PSDs" and provide stronger support for the discussion surrounding their presence. A measurement of these was provided in the rebuttal letter, and while this number much more clearly demonstrates the increase in the number of orphan puncta, this analysis is not provided in the manuscript. This number also suggests the number of orphan receptors may be quite high, outnumbering ribbons 2:1.

      (3) In Figure 3, the authors discuss GluA2/3 puncta reduction and note that Gria2 RNA expression remains unchanged. However, the GluA2/3 labeling is done at 1-1.5 months, whereas the Gria2 RNAscope is done at P4. Additionally, there is a lack of quantification for Gria2 RNA expression due to their tissue being processed separately. RNA scope at a comparable age to the GluA2/3 would be stronger support for their statement that Gria2 expression is comparable despite a reduction in GluA2/3 puncta.

      (4) In Figure 4, the authors indicate that RTN4RL2 deficiency reduces the number of type 1 SGNs connected to ribbons. Given that the number of ribbons remains unchanged (Figure 2), it is important to clearly explain the implications of this finding. It is already known that each type I SGN forms a single synaptic contact with a single IHC. The fact that the number of ribbons remains constant while additional "orphan PSDs" are present suggests that the overall number of SGNs might need to increase to account for these findings, however, the authors noted no change in the number of SGN soma. This discrepancy is important to point out.

    4. Author response:

      The following is the authors’ response to the original reviews

      Public Reviews:

      Reviewer #1 (Public review):

      Hearing and balance rely on specialized ribbon synapses that transmit sensory stimuli between hair cells and afferent neurons. Synaptic adhesion molecules that form and regulate transsynaptic interactions between inner hair cells (IHCs) and spiral ganglion neurons (SGNs) are crucial for maintaining auditory synaptic integrity and, consequently, for auditory signaling. Synaptic adhesion molecules such as neurexin-3 and neuroligin-1 and -3 have recently been shown to play vital roles in establishing and maintaining these synaptic connections ( doi: 10.1242/dev.202723 and DOI: 10.1016/j.isci.2022.104803). However, the full set of molecules required for synapse assembly remains unclear.

      Karagulan et al. highlight the critical role of the synaptic adhesion molecule RTN4RL2 in the development and function of auditory afferent synapses between IHCs and SGNs, particularly regarding how RTN4RL2 may influence synaptic integrity and receptor localization. Their study shows that deletion of RTN4RL2 in mice leads to enlarged presynaptic ribbons and smaller postsynaptic densities (PSDs) in SGNs, indicating that RTN4RL2 is vital for synaptic structure. Additionally, the presence of "orphan" PSDs-those not directly associated with IHCs-in RTN4RL2 knockout mice suggests a developmental defect in which some SGN neurites fail to form appropriate synaptic contacts, highlighting potential issues in synaptic pruning or guidance. The study also observed a depolarized shift in the activation of CaV1.3 calcium channels in IHCs, indicating altered presynaptic functionality that may lead to impaired neurotransmitter release. Furthermore, postsynaptic SGNs exhibited a deficiency in GluA2/3 AMPA receptor subunits, despite normal Gria2 mRNA levels, pointing to a disruption in receptor localization that could compromise synaptic transmission. Auditory brainstem responses showed increased sound thresholds in RTN4RL2 knockout mice, indicating impaired hearing related to these synaptic dysfunctions.

      The findings reported here significantly enhance our understanding of synaptic organization in the auditory system, particularly concerning the molecular mechanisms underlying IHC-SGN connectivity. The implications are far-reaching, as they not only inform auditory neuroscience but also provide insights into potential therapeutic targets for hearing loss related to synaptic dysfunction.

      We would like to thank the reviewer for appreciating the work and the advice that helped us to further improve the manuscript. We have carefully addressed all concerns, please see our point-per-point response below and the revised manuscript.

      Reviewer #2 (Public review):

      Summary:

      Kargulyan et al. investigate the function of the transsynaptic adhesion molecule RTN4RL2 in the formation and function of ribbon synapses between type I spiral ganglion neurons (SGNs) and inner hair cells. For this purpose, they study constitutive RTN4RL2 knock-out mice. Using immunohistochemistry, they reveal defects in the recruitment of protein to ribbon synapses in the knockouts. Serial block phase EM reveals defects in SGN projections in mutants. Electrophysiological recordings suggest a small but statistically significant depolarized shift in the activation of Cav1.3 Ca<sup>2+</sup> channels. Auditory thresholds are also elevated in the mutant mice. The authors conclude that RTN4RL2 contributes to the formation and function of auditory afferent synapses to regulate auditory function.

      We would like to thank the reviewer for appreciating the work and the advice that helped us to further improve the manuscript. We have carefully addressed all concerns, please see our point-per-point response below and the revised manuscript.

      Strengths:

      The authors have excellent tools to analyze ribbon synapses.

      Weaknesses:

      However, there are several concerns that substantially reduce my enthusiasm for the study.

      (1) The analysis of the expression pattern of RTN4RL2 in Figure 1 is incomplete. The authors should show a developmental time course of expression up into maturity to correlate gene expression with major developmental milestones such as axon outgrowth, innervation, and refinement. This would allow the development of models supporting roles in axon outgrowth versus innervation or both.

      We agree that it would be valuable to show the developmental time course of RTN4RL2 expression. In response to the reviewer’s comment, we are providing RNAscope data from developmental ages E11.5, E12.5 and E16 in Figure 1. RTN4RL2 shows expression at E11.5/E12.5 both in the spiral ganglion and hair cell region, with first onset in the hair cells. We conclude that RTN4RL2 is expressed highest during fiber growth at embryonic stages and is downregulated during postnatal development maintaining low levels of expression during adulthood.

      (2) It would be important to improve the RNAscope data. Controls should be provided for Figure 1B to show that no signal is observed in hair cells from knockouts. The authors apparently already have the sections because they analyzed gene expression in SGNs of the knock-outs (Figure 1C).

      In Figure 1C gene expression in SGNs was assessed at p40, while the expression in hair cells is provided for p1 animals. Unfortunately, we do not have KO controls for p1 animals. However, as indicated in our manuscript, previously published RNA expression datasets do find RTN4RL2 expression in hair cells. Therefore, we think it is unlikely that our results are unspecific.

      (3) It is unclear from the immunolocalization data in Figure 1D if all type I SGNs express RTN4RL2. Quantification would be important to properly document the presence of RTN4RL2 in all or a subset of type I SGNs. If only a subset of SGNs express RTN4RL2, it could significantly affect the interpretation of the data. For example, SGNs selectively projecting to the pillar or modiolar side of hair cells could be affected. These synapses significantly differ in their properties.

      According to already published single cell RNAseq dataset from Shrestha et al., 2018, RTN4RL2 expression does not seem to show a clear type I SGN subtype specificity (Author response image 1). In response to the reviewer’s comment, we have further performed anti-Parvalbumin (PV) and anti-calretinin (CR) immunostainings in mid-modiolar cryosections of RTN4RL2<sup>+/+</sup> and RTN4RL2<sup>-/-</sup> cochleae. Parvalbumin was chosen to label all SGNs and CALB2 was chosen primarily as a type Ia SGN marker (Sun et al., 2018). We present the data from all analyzed samples below (figure 2 of this rebuttal letter). Cell segmentation masks of PV positive cells were obtained using Cellpose 2.0 and the average CR intensity was calculated in those masks. While the distributions of CR intensity and the ratio of CR and PV intensities are slightly shifted in RTN4RL2<sup>-/-</sup> cochleae, we take the data to suggest that the composition of the spiral ganglion by molecular type I SGN subtypes is largely unchanged in RTN4RL2<sup>-/-</sup> mice.

      Author response image 1.

      Author response image 1 cites single cell RNAseq data of Brikha R Shrestha, Chester Chia, Lorna Wu, Sharon G Kujawa, M Charles Liberman, Lisa V Goodrich. Sensory neuron diversity in the inner ear is shaped by activity. Cell. 2018 Aug 23; 174(5):1229-1246.e17. doi: 10.1016/j.cell/2018.07.007

      Author response image 2.

      Calretinin intensity distribution in spiral ganglion of RTN4RL2<sup>+/+</sup> and RTN4RL2<sup>-/-</sup> mice. (A) Mid-modiolar cochlear cryosections from RTN4RL2<sup>+/+</sup> (top) and RTN4RL2<sup>-/-</sup> (bottom) mice immunolabeled against Parvalbumin (PV) and Calretinin (CR). Scale bar = 20 mm. (B) Distribution of CR intensity in PV positive cells (N = 3 for each genotype). (C) Distribution of the ratio of CR and PV intensities (N = 3 for each genotype).

      (4) It is important to show proper controls for the RTN4RL2 immunolocalization data to show that no staining is observed in knockouts.

      Unfortunately, our recent attempts to perform RTN4RL2 immunostainings on cryosections failed and therefore, we decided to remove the RTNr4RL2 immunostainings from Figure 1. We have adjusted the results section accordingly.

      (5) The authors state in the discussion that no staining for RTN4RL2 was observed at synaptic sites. This is surprising. Did the authors stain multiple ages? Was there perhaps transient expression during development? Or in axons indicative of a role in outgrowth, not synapse formation?

      We thank the reviewer for the comment. We have now tried RTN4RL2 immunostainings on cryosections at several developmental stages, but unfortunately this time did not succeed to obtain reproducible and reliable results. Therefore, we decided to also remove the previous immunostainings from Figure 1. We have adjusted the results section as well as removed our statement of not detecting RTN4RL2 near the synaptic regions from the discussion.

      (6) In Figure 2 it seems that images in mutants are brighter compared to wildtypes. Are exposure times equivalent? Is this a consistent result?

      Yes, the samples were prepared in parallel, imaged and analyzed in the same manner.

      No, we did not observe consistent differences in brightness and also did not find it in the exemplary images of figure 2.

      (7) The number of synaptic ribbons for wildtype in Figure 2 is at 10/IHCs, and in Figure 2 Supplementary Figure 2 at 20/IHCs (20 is more like what is normally reported in the literature). The value for mutant similarly drastically varies between the two figures. This is a significant concern, especially because most differences that are reported in synaptic parameters between wild-type and mutants are far below a 2-fold difference.

      The key message is that there is no difference in the numbers of ribbons and synapses between the genotypes for the cochlear apex (~10 ribbons/IHCs, Figure 2 and Figure 2-figure supplement 2) and the mid- and base of the cochlea (more ribbons/IHCs, Figure 2-figure supplement 2). Figure 2-figure supplement 3 (now Figure 3) shows that there is a massive reduction of postsynaptic GluA2, while both Figure 2 and Figure 2-figure supplement 2 indicate that the number synapses is normal. These are two different data sets and while we closely collaborated and also shared the Moser lab protocols and analysis routines, we agree that there is a difference in the absolute synapse count, which most likely was an observer difference and different choice of tonotopic positions of analysis. In Figure 2 only the apical hair cells have been analyzed. The Moser lab, since establishing the immunofluorescence-based quantification of synapse number (Khimich et al., 2005) reported tonotopic differences in synapse counts (focus of Meyer et al., 2009 and reported by others: e.g. Kujawa and Liberman, 2009): apical and basal IHCs lower synapse numbers than mid-cochlear IHCs.

      (8) The authors report differences in ribbon volume between wild-type and mutant. Was there a difference between the modiolar/pillar region of hair cells? It is known that synaptic size varies across the modiolar-pillar axis. Maybe smaller synapses are preferentially lost?

      We thank the reviewer for the comment. Unfortunately, our already acquired datasets from 3-week-old mice did not allow us to check whether the previously described modiolar-pillar gradient of the ribbon size was collapsed in RTN4RL2<sup>-/-</sup> mice due to the not so well-preserved morphology of the inner hair cells in our preparations. However, since the number of the ribbons is not changed in the RTN4RL2 KO mice, we do not think that the increase in the ribbon size is due to the loss of small ribbons. In response to the reviewers comment we have analyzed the modiolar-pillar gradient of the ribbon size in IHCs of middle turn of the cochlea form a newly acquired dataset of 14-week-old mice. We took the fluorescence intensity of Ctbp2 positive puncta as a proxy for the ribbon size. In these older mice we found a preserved modiolar-pillar gradient of the ribbon size (larger ribbons at the modiolar side). We summarized the results in the below Author response image 3.

      Author response image 3.

      The modiolar-pillar gradient of ribbon size is preserved in RTN4RL2<sup>-/-</sup> IHCs. (A) Maximum intensity projections of approximately 2 IHCs stained against Vglut3 and Ctbp2 from 14-week-old RTN4RL2<sup>+/+</sup> (left) and RTN4RL2<sup>-/-</sup> (right) mice. Scale bar = 5 mm. (B) Synaptic ribbons on the modiolar side show higher fluorescence intensity than the ones on the pillar side of mid-cochlear IHCs in both RTN4RL2<sup>+/+</sup> (left, N=2) RTN4RL2<sup>-/-</sup> (right, N=2) mice. (C) Average fluorescence intensity of modiolar ribbons per IHC is higher than the average fluorescence intensity of pillar ribbons (paired t-test, p < 0.001).

      (9) The authors show in Figure 2 - Supplement 3 that GluA2/3 staining is absent in the mutants. Are GluA4 receptors upregulated? Otherwise, synaptic transmission should be abolished, which would be a dramatic phenotype. Antibodies are available to analyze GluA4 expression, the experiment is thus feasible. Did the authors carry out recordings from SGNs?

      In response to the reviewer’s comment, we have performed GluA4 stainings in RTN4LR2<sup>-/-</sup> mice and did not detect any GluA4 positive signal in the mutants (new Figure 3-figure supplement 1). Unfortunately, our animal breeding license was expired at the time we received the reviews and that is why our results are from 14-week-old animals. To verify that the absence of GluA4 signal is not due to potential PSD loss in 14-week-old RTN4RL2<sup>-/-</sup>, we have additionally performed anti-Ctbp2, anti-Homer1 and anti-Vglut3 stainings in 14-week-old animals. Despite the reduced number, we still observed juxtaposing pre- and postsynaptic puncta. We assume that the reviewer asks for patch-clamp recordings from SGNs, which are, as we are confident the reviewer is aware of, technically very challenging and beyond the scope of the present study but an important objective for future studies.  In response to the reviewers comment we have added a statement to the discussion pointing to these patch-clamp recordings from SGNs as important objective for future studies.

      (10) The authors use SBEM to analyze SGN projections and synapses. The data suggest that a significant number of SGNs are not connected to IHCs. A reconstruction in Figure 3 shows hair cells and axons. It is not clear how the outline of hair cells was derived, but this should be indicated. Also, is this a defect in the formation of synapses and subsequent retraction of SGN projections? Or could RTN4RL2 mutants have a defect in axonal outgrowth and guidance that secondarily affects synapses? To address this question, it would be useful to sparsely label SGNs in mutants, for example with AAV vectors expression GFP, and to trace the axons during development. This would allow us to distinguish between models of RTN4RL2 function. As it stands, it is not clear that RTN4RL2 acts directly at synapses.

      We agree with the reviewer on the value of a developmental study of afferent connectivity but consider this beyond the scope of the present study. In response to the reviewer's comment, we have replaced the IHC outlines with volume-reconstructed IHCs in Figure 3B (now Figure 4B). Moreover, as shown in Figure 3F (now Figure 4F), most if not all type-I SGNs (both with and without ribbon) were unbranched in the mutants just like in wildtype (also shown for a larger sample in Hua et al., 2021), arguing against morphological abnormality during development.

      (11) The authors observe a tiny shift in the operation range of Ca<sup>2+</sup> channels that has no effect on synaptic vesicle exocytosis. It seems very unlikely that this difference can explain the auditory phenotype of the mutant mice.

      We assume that the statement refers to the normal exocytosis of mutant IHCs at the potential of maximal Ca<sup>2+</sup> influx (Figure 3G and H, now Figure 4G and H). We would like to note that this experiment was performed to probe for a deficit of synapse function beyond that of the Ca<sup>2+</sup> channel activation, but did not address the impact of the altered voltage—dependence of Ca<sup>2+</sup> channel activation. In response to the reviewer’s comment, we have now added further discussion to more clearly communicate that for the range of receptor potentials achieved near sound threshold we expect impaired IHC exocytosis as the Ca<sup>2+</sup> channels require slightly more depolarization for activation in the mutant IHCs.

      (12) ABR recordings were conducted in whole-body knockouts. Effects on auditory thresholds could be a secondary consequence of perturbation along the auditory pathway. Conditional knockouts or precisely designed rescue experiments would go a long way to support the authors' hypothesis. I realize that this is a big ask and floxed mice might not be available to conduct the study.

      Thanks for this helpful comment and, indeed, unfortunately, we do not have conditional KO mice at our disposal. We totally agree that this will be important also for clarifying the role of IHC vs. SGN expression of RTN4RL2. In response to the reviewer’s comment, we now discussed the shortcoming of using constitutive RTN4RL2<sup>-/-</sup> mice and added this important experiment on IHC and SGN specific deletion of RTN4RL2 as an objective of future studies.

      Reviewer #3 (Public review):

      In this study, the authors used RNAscope and immunostaining to confirm the expression of RTN4RL2 RNA and protein in hair cells and spiral ganglia. Through RTN4RL2 gene knockout mice, they demonstrated that the absence of RTN4RL2 leads to an increase in the size of presynaptic ribbons and a depolarized shift in the activation of calcium channels in inner hair cells. Additionally, they observed a reduction in GluA2/3 AMPA receptors in postsynaptic neurons and identified additional "orphan PSDs" not paired with presynaptic ribbons. These synaptic alterations ultimately resulted in an increased hearing threshold in mice, confirming that the RTN4RL2 gene is essential for normal hearing. These data are intriguing as they suggest that RTN4RL2 contributes to the proper formation and function of auditory afferent synapses and is critical for normal hearing. However, a thorough understanding of the known or postulated roles of RTN4Rl2 is lacking.

      We would like to thank the reviewer for appreciating the work and the advice that helped us to further improve the manuscript. We have carefully addressed all concerns, please see our point-per-point response below and the revised manuscript.

      While the conclusions of this paper are generally well supported by the data, several aspects of the data analysis warrant further clarification and expansion.

      (1) A quantitative assessment is necessary in Figure 1 when discussing RNA and protein expression. It would be beneficial to show that expression levels are quantitatively reduced in KO mice compared to wild-type mice. This suggestion also applies to Figure 2-supplement 3.D, which examines expression levels.

      The processing of our control and KO samples for RNAscope was not strictly done in parallel and therefore we would like to refrain from quantitative comparison.

      (2) In Figure 2, the authors present a morphological analysis of synapses and discuss the presence of "orphan PSDs." I agree that Homer1 not juxtaposed with Ctbp2 is increased in KO mice compared to the control group. However, in quantifying this, they opted to measure the number of Homer1 juxtaposed with Ctbp2 rather than directly quantifying the number of Homer1 not juxtaposed with Ctbp2. Quantifying the number of Homer1 not juxtaposed with Ctbp2 would more clearly represent "orphan PSDs" and provide stronger support for the discussion surrounding their presence.

      We appreciate the reviewer’s comment. We did not perform this analysis primarily because “orphan” Homer1 puncta, as seen in our immunostainings, are distributed away from hair cells in diverse morphologies and sizes. This makes distinguishing them from unspecific immunofluorescent spots—also present in wild-type samples—challenging. In response to the reviewer’s request, we analyzed the number of “orphan” Homer1 puncta in our previously acquired RTN4RL2<sup>+/+</sup> and RTN4RL2<sup>-/-</sup> samples. Using the surface algorithm in Imaris software, we applied identical parameters across all samples to create surfaces for Homer1-positive puncta (total Homer1 puncta). We quantified “orphan” Homer1 puncta as the difference between total and ribbon-juxtaposing Homer1 puncta and normalized this number to the IHC count. Our results showed 4.3 vs. 26.8 “orphan” Homer1 puncta per IHC in RTN4RL2<sup>+/+</sup> and RTN4RL2<sup>-/-</sup> samples, respectively. We note that variations in acquired volumes between samples may introduce confounding effects.

      (3) In Figure 2, Supplementary 3, the authors discuss GluA2/3 puncta reduction and note that Gria2 RNA expression remains unchanged. However, there is an issue with the lack of quantification for Gria2 RNA expression. Additionally, it is noted that RNA expression was measured at P4. While the timing for GluA2/3 puncta assessment is not specified, if it was assessed at 3 weeks old as in Figure 2's synaptic puncta analysis, it would be inappropriate to link Gria2 RNA expression with GluA2/3 protein expression at P4. If RNA and protein expression were assessed at P4, please indicate this timing for clarity.

      GluA2/3 immunostainings were performed in 1 to 1.5-month-old animals. We apologize for not indicating this before and have now included it in Figure 3 legend. The processing of our control and KO samples for RNAscope was not strictly done in parallel and therefore we would like to refrain from quantitative comparison.

      (4) In Figure 3, the authors indicate that RTN4RL2 deficiency reduces the number of type 1 SGNs connected to ribbons. Given that the number of ribbons remains unchanged (Figure 2), it is important to clearly explain the implications of this finding. It is already known that each type I SGN forms a single synaptic contact with a single IHC. The fact that the number of ribbons remains constant while additional "orphan PSDs" are present suggests that the overall number of SGNs might need to increase to account for these findings. An explanation addressing this would be helpful.

      In Figure 3 (now Figure 4), we found additional type-1 SGNs that are unconnected to IHC, in good agreement with “orphan PSDs” observed under the light microscope. Indeed, we also confirmed monosynaptic, unbranched fiber morphology (Figure 3F, now Figure 4F). Together, these results imply about a 20% increase in the overall number of SGNs, which however we did not observe in SGN soma counting.

      (5) In Figure 4F and 5Cii, could you clarify how voltage sensitivity (k) was calculated? Additionally, please provide an explanation for the values presented in millivolts (mV).

      Voltage sensitivity (k) was calculated as the slope of the Boltzmann fit to the fractional activation curves: , Where G is conductance, G<sub>max</sub> is the maximum conductance, V<sub>m</sub> is the membrane potential, V<sub>half</sub> is the voltage corresponding to the half maximal activation of Ca<sup>2+</sup> channels and k (slope of the curve) is the voltage sensitivity of Ca<sup>2+</sup> channel activation. We have now added this to our Materials and Methods section.

      (6) In Figure 6, the author measured the threshold of ABR at 2-4 months old. Since previous figures confirming synaptic morphology and function were all conducted on 3-week-old mice, it would be better to measure ABR at 3 weeks of age if possible.

      ABR measurements for comparisons in a cohort of age-matched mice require fully developed individuals. 3 weeks is the minimum age that is regarded for a mature ear. However, variation in developmental differences among one litter is very frequent that affects normal hearing thresholds. From our own experience we do not regard the ear fully functional before 6 weeks of age. Then hearing thresholds are lowest indicating full functionality. Since the C57BL/6 background strain has a genetic defect in the Cadherin 23-coding gene (Cdh23) at the ahl locus of mouse chromosome 10 these mice exhibit early onset and progression of age-related hearing loss starting at 5–8 months (Hunter & Willott, 1987). Therefore, we chose a “safe” time window for stable and unaffected ABR recordings of 2-4 months to provide most representative data.

      Recommendations for the authors:

      Reviewer #1 (Recommendations for the authors):

      (1) Please include information on the validation of all the antibodies used in this study, or reference the relevant work where the antibodies were previously validated.

      In response to the reviewer’s comment, we have now included a table listing all primary antibodies used in this study. Where possible, we provide references for knockout (KO) validation. Otherwise, we refer to the manufacturer’s information, as provided in the respective datasheets.

      (2) Figure 2 illustrates the pre- and postsynaptic changes observed in RTN4RL2 knockout (KO) mice. Please specify the age of the mice and the cochlear region depicted and analyzed in Figure 2.

      We thank the reviewer for the comment. The IHCs of apical cochlear region were analyzed in mice at 3 weeks of age. We have now added this to the figure legend.

      (3) The discovery of orphan SGN neurites in RTN4RL2 KO mice is particularly intriguing. I wonder whether the additional Homer1-positive puncta illustrated in Figure 2 are present in these orphan SGN neurites, which would suggest that they may be functional. Conducting immunohistochemistry (IHC) labeling for type I SGN neurites using an anti-Tuj1 antibody, along with Homer1, would help localize the additional Homer1 puncta shown in Figure 2. Additionally, the "extra" Homer1 puncta appears less striking in the data presented in Figure 2-Supplement 2. Quantifying the number of Homer1 puncta in wild-type versus KO mice across different cochlear regions will help visualize the Figure 2-Supplement 2 data and relate the presence of extra neurites to the increased auditory brainstem response (ABR) thresholds observed at all frequencies.

      We thank the reviewer for the comment and we agree that localizing orphan PSDs on the SGN neurites would be very useful. Unfortunately, the animal breeding license in the Göttingen lab had expired. At the time we received the reviews we only had access to 14-week-old animals and could not perform the stainings in animals which would have comparable age range to the rest of the study (3-4 weeks). The phenotype of extra Homer1 puncta was not as drastic in 14-week-old animals as it was in previously stained 3-week-old animals. Nevertheless, we still tried NF200, Homer1 and Vglut3 immunostainings in 14-week-old animals. We present representative single imaging planes of NF200, Homer1 and Vglut3 stainings in Author response image 4. Additionally, we provide exemplary images from 7-week-old RTN4RL2<sup>-/-</sup>, where it looks like that the orphan Homer1 puncta are found on calretinin positive neurites.

      Author response image 4.

      Attempts to localize “orphan” Homer1 patches on type I SGN neurites. (A) Single exemplary imaging planes of apical IHC region from RTN4RL2<sup>+/+</sup> (left) and RTN4RL2<sup>-/-</sup> (right) mice immunolabeled against NF200, Vglut3 and Homer1. White arrows show putative “orphan” Homer1 puncta on NF200 positive neurites. Scale bar = 5 mm. (B) Maximum intensity projections of representative confocal stacks of IHCs from RTN4RL2<sup>-/-</sup> mice immunolabeled against Calretinin and Homer1. Scale bars = 5 mm. White arrows show possible “orphan” Homer1 puncta on Calretinin positive boutons.

      (4) The authors noted a reduction in the number of GluA2/3-positive puncta in RTN4RL2 KOs, as shown in Figure 2-Supplement 3. However, in the Results section (page 5, line 124), it is unclear whether the authors refer to a reduction in fluorescence intensity or the number of puncta. Please clarify this.

      We thank the reviewer for the comment. We refer to the number and have now added this to the manuscript.

      (5) I find it particularly interesting that, despite the presence of smaller but synaptically engaged Homer1-positive SGN neurites, these appear to lack or present a reduction in the number of GluA2/3 puncta, and that GluA2/3 puncta are observed in non-ribbon juxtaposed neurites. Therefore, I suggest including GluA2/3 (Fig2 supplement 3) data in the main figure. It would be valuable to determine whether the orphan neurites express both Homer1 and GluA2/3, which could indicate that the defect is not solely due to reduced GluA2/3 expression at the formed synapses, but also to the presence of additional orphan synapses. I would also mention in the discussion how the phenotype of the RTN4L2 KO compares to the GluA2/3 KO and if the lack of GluA2/3 at the AZ could explain the increase in ABR threshold. Quantification of GluA2/3 puncta at the apical, middle, and basal region would also help understand the auditory phenotype of the KO mice.

      We have changed Figure2-figure supplement 3 to become a main figure (Figure 3) based on the recommendation of the reviewer. We agree, that it would be valuable to perform immunohistochemistry combining anti-GluA2/3 and anti-Homer1 and anti-Ctbp2 antibodies to see if the “orphan” Homer1 patches house GluA2/3 not juxtaposing synaptic ribbons. Unfortunately, as mentioned above, due to the expiration of our animal breeding and experimentation licenses we did not manage to do those experiments. We have however performed stainings with anti-GluA4 antibodies and could not detect GluA4 signal in RTN4RL2<sup>-/-</sup> mice (Figure 3-figure supplement 1). This potentially could explain the more drastic ABR threshold elevation in RTN4RL2<sup>-/-</sup> mice compared to e.g. GluA3 KO mice. We have now made this clearer in our discussion.

      (6) I suggest considering the use of color-blind friendly palettes for figures and graphs in this manuscript to enhance clarity and ensure that the findings are accessible to a wider audience and improve the overall effectiveness of the presentation. Please use color-blind-friendly schemes in Figure 1 and Figure 2 Supplement 3.

      Done.

      (7) Could you please explain what "XX {plus minus} Y, SD = W" means in the figure legends?

      Mean ± SEM (standard error of the mean), SD (standard deviation) are indicated in the legends. In response to the reviewer comment we have now added an explanation in the Materials and Methods –> Data analysis and statistics section.

      (8) Please include information about the ear tested (left or right or both).

      Both ears were tested. Since there was no significant difference between right and left ear we did not further consider this factor. We will add this fact more precisely in the Material and methods section.

      Reviewer #3 (Recommendations for the authors):

      (1) Line 90: Why not show this control, it is a nice control.

      Unfortunately, our recent attempts to perform RTN4RL2 immunostaining on cryosections were unsuccessful. Therefore, we decided to remove RTN4RL2 immunostaining from Figure 1 and have adjusted the results section accordingly.

      (2) Line 94: Please provide a reference for these interactions.

      Done.

    1. eLife Assessment

      This study provides an important contribution to our understanding of the mechanisms underlying the limited capacity to process rapid sequences of visual stimuli. It reports convincing evidence that the attentional blink affects neurally separable processes of visual detection and discrimination. The study will be of interest to neuroscientists and psychologists investigating perception and attention.

    2. Reviewer #1 (Public review):

      Summary:

      In this study, the authors used a multi-alternative decision task and a multidimensional signal-detection model to gain further insight into the cause of perceptual impairments during the attentional blink. The model-based analyses of behavioural and EEG data show that such perceptual failures can be unpacked into distinct deficits in visual detection and discrimination, with visual detection being linked to the amplitude of late ERP components (N2P and P3) and discrimination being linked to coherence of fronto-parietal brain activity.

      Strengths:

      The strength of this paper lies in the fact that it presents a novel perspective on the cause of perceptual failures during the attentional blink. The multidimensional signal-detection modelling approach is explained clearly, and the results of the study show that this approach offers a powerful method to unpack behavioural and EEG data into distinct processes of detection and discrimination. The discussion of the paper addresses how the findings of separable neural processes involved in detection and discrimination might be linked to extant findings on object recognition and the question of whether the attentional blink involves an all-or-none or gradual impairment in perception.

      Weakness:

      A minor, unnecessary weakness of the paper is that the authors introduce their study with the aim of determining whether the attentional blink might be due to a criterion shift or to reduced sensitivity in the perceptual process. The criterion shift account remains to be no more than a strawman as the argumentation for this account is weak and easily refuted based on many previous findings. Specifically, the authors suggest that criterion shift might explain the lag-dependent AB effect because participants might be able to infer the lag of a specific trial, thus raising their criterion in case of a short-lag trial, based on factors such as the length of the trial sequence. Importantly, however, attentional blinks have also been observed in many studies in which the sequence length was not indicative of the T1-T2 lag, including - for instance - the many experiments reported in the seminal study by Chun and Potter (1995). The criterion shift account was and remains, therefore, highly implausible and should not have deserved such a prominent role in describing the theoretical motivation for the study.

    3. Reviewer #2 (Public review):

      Summary:

      The authors had two aims: First, to decompose the attentional blink (AB) deficit into the two components of signal detection theory: sensitivity and bias. Second, the authors aimed to assess the two subcomponents of sensitivity: detection and discrimination. They observed that the AB is only expressed in sensitivity. Furthermore, detection and discrimination were doubly dissociated. Detection modulated N2p and P3 ERP amplitude, but not frontoparietal beta-band coherence, whereas this pattern was reversed for discrimination.

      Strengths:

      The experiment is elegantly designed, and the data -both behavioral and electrophysiological- are aptly analyzed. The outcomes, in particular the dissociation between detection and discrimination blinks, are very consistently and clearly supported by the results. The discussion of the results is also appropriately balanced.

      Weaknesses:

      The lack of an effect of stimulus contrast does not seem very surprising from what we know of the nature of AB already. Low-level perceptual factors are not thought to cause the AB. This is fine, as there are also other, novel findings reported. In their revision, the authors have bolstered the importance of these (null) findings by referring to AB-specific papers that would have predicted different outcomes in this regard.

      The ERP analyses are extended in the revised manuscript, including those of the N1 component, which is now more appropriately analyzed at more lateral electrode sites.

      Impact & Context:<br /> The results of this study will likely influence how we think about selective attention in the context of the AB phenomenon. In their revision, the authors have further extended their theoretical framing by referring to recent work on the nature of the AB deficit, showing that it can be discrete (all-or-none) and gradual.

    4. Reviewer #3 (Public review):

      In the present study, the authors aimed to achieve a better understanding of the mechanisms underlying the attentional blink, that is, a deficit in processing the second of two target stimuli when they appear in rapid succession. Specifically, they used a concurrent detection and identification task in- and outside of the attentional blink and decoupled effects of perceptual sensitivity and response bias using a novel signal detection model. They conclude that the attentional blink selectively impairs perceptual sensitivity but not response bias, and link established EEG markers of the attentional blink to deficits in stimulus detection (N2p, P3) and discrimination (fronto-parietal high-beta coherence), respectively. Taken together, their study suggests distinct mechanisms mediating detection and discrimination deficits in the attentional blink.

      This innovative study appears to have been carefully conducted and the overall conclusions seem warranted given the results. In my opinion, the manuscript is a valuable contribution to the current literature on the attentional blink. Moreover, the novel paradigm and signal detection model are likely to stimulate future research.

      Major strengths of the present study include its innovative approach to investigating the mechanisms underlying the attentional blink, an elegant, carefully calibrated experimental paradigm, a novel signal detection model, multifaceted data analyses using state-of-the-art model comparisons and robust statistical tests, and an interesting discussion on the neural mechanisms underlying detection versus identification.

      Weaknesses concern a lack of clarity regarding specific statistical hypotheses and correction for multiple comparisons (e.g., across or within the multiple classes of tests) in the Methods, relatively low statistical power (N = 24/18 for behavioral/ERP data, respectively), unusual and heavy EEG filtering (0.5-18 Hz bandpass and 9-11 Hz bandstop), data-driven analyses (e.g., pooling of lag 1 and 3 trials a posteriori), and the absence of a discussion of limitations.

    5. Author response:

      The following is the authors’ response to the original reviews

      Reviewer #1 (Public review):

      Summary:

      In this study, the authors used a multi-alternative decision task and a multidimensional signaldetection model to gain further insight into the cause of perceptual impairments during the attentional blink. The model-based analyses of behavioural and EEG data show that such perceptual failures can be unpacked into distinct deficits in visual detection and discrimination, with visual detection being linked to the amplitude of late ERP components (N2P and P3) and discrimination being linked to the coherence of fronto-parietal brain activity.

      Strengths:

      The main strength of this paper lies in the fact that it presents a novel perspective on the cause of perceptual failures during the attentional blink. The multidimensional signal detection modelling approach is explained clearly, and the results of the study show that this approach offers a powerful method to unpack behavioural and EEG data into distinct processes of detection and discrimination.

      Thank you.

      Weaknesses:

      (1.1) While the model-based analyses are compelling, the paper also features some analyses that seem misguided, or, at least, insufficiently motivated and explained. Specifically, in the introduction, the authors raise the suggestion that the attentional blink could be due to a reduction in sensitivity or a response bias. The suggestion that a response bias could play a role seems misguided, as any response bias would be expected to be constant across lags, while the attentional blink effect is only observed at short lags. Thus, it is difficult to understand why the authors would think that a response bias could explain the attentional blink.

      In the revision, we seek to better motivate the bias component. A deficit in T2 identification accuracy could arise from either sensitivity or criterion effects at short lags. For example, in short T1-T2 lag trials participants may adopt a more conservative choice criterion for reporting the presence of T2 thereby yielding lower accuracies for short lags. Criterion effects need not be uniform across lags: A participant could infer the T1-T2 lag on each trial based on various factors, such as trial length, and systematically adjust their choice criterion across lags, prior to making a response.

      Below, we present a simple schematic for how a conservative choice criterion impacts accuracy. Consider a conventional attentional blink paradigm where the task is to detect and report T2's presence. For simplicity, we assume that prior probabilities for T2’s occurrence are equal, such that the number of “T2 present” and “T2 absent” trials are equal.

      We model this task with a one-dimensional signal detection theory (SDT) model (left panel). Here, ψ represents the decision variable and the red and gray Gaussians represent the conditional density of ψ for the T2 present (“signal”) and T2 absent (“noise”) conditions, respectively. We increase the criterion from its optimal value (here, midpoint of signal and noise means), to reflect increasingly conservative choices. As the criterion increases and deviates further from its optimal value – here, reflecting a conservative bias – accuracy drops systematically (right panel).

      Author response image 1.

      We have revised the Introduction as follows:

      “Distinguishing between sensitivity and criterion effects is crucial because a change in either of these parameters can produce a change in the proportion of correct responses[41,42]. A lower proportion of correct T2 detections may reflect not only a lower detection d’ at short lags but also a sub-optimal choice criterion corresponding, for instance, to a conservative detection bias (Fig. 1, right, top). Importantly, such criterion effects need not be uniform across intertarget lags: the lag on each trial could be inferred based on various factors, such as trial length, allowing participants to adopt different choice criteria for the different lags prior to making a response.”

      (1.2) A second point of concern regards the way in which the measures for detection and discrimination accuracy were computed. If I understand the paper correctly, a correct detection was defined as either correctly identifying T2 (i.e., reporting CW or CCW if T2 was CW or CCW, respectively, see Figure 2B), or correctly reporting T2's absence (a correct rejection).

      Here, it seems that one should also count a misidentification (i.e., incorrect choice of CW or CCW when T2 was present) as a correct detection, because participants apparently did detect T2, but failed to judge/remember its orientation properly in case of a misidentification. Conversely, the manner in which discrimination performance is computed also raises questions. Here, the authors appear to compute accuracy as the average proportion of T2present trials on which participants selected the correct response option for T2, thus including trials in which participants missed T2 entirely. Thus, a failure to detect T2 is now counted as a failure to discriminate T2. Wouldn't a more proper measure of discrimination accuracy be to compute the proportion of correct discriminations for trials in which participants detected T2?

      Indeed, detection and discrimination accuracies were computed with precisely the same procedure, and under the same conditions, as described by the Reviewer. We regret our poor description. For clarity, we have revised the following line in the Results section; we have also updated the Methods (section on Behavioral data analysis: Measuring attentional blink effects on psychometric quantities).

      “Detection accuracies were calculated based on the proportion of trials in which T2 was correctly detected (Methods). Briefly, we computed the average proportion of hits, misidentifications, and correct rejections; misidentifications were included because, although incorrectly identified, the target was nevertheless correctly detected. In contrast, discrimination accuracies were derived from T2 present trials, based on the proportion of correct identifications alone (Methods).”

      (1.3) My last point of critique is that the paper offers little if any guidance on how the inferred distinction between detection and discrimination can be linked to existing theories of the attentional blink. The discussion mostly focuses on comparisons to previous EEG studies, but it would be interesting to know how the authors connect their findings to extant, mechanistic accounts of the attentional blink. A key question here is whether the finding of dissociable processes of detection and discrimination would also hold with more meaningful stimuli in an identification task (e.g., the canonical AB task of identifying two letters shown amongst digits).

      There is evidence to suggest that meaningful stimuli are categorized just as quickly as they are detected (Grill-Spector & Kanwisher, 2005; Grill-Spector K, Kanwisher N. Visual recognition: as soon as you know it is there, you know what it is. Psychol Sci. 2005 Feb;16(2):152-60. doi: 10.1111/j.0956-7976.2005.00796.x. PMID: 15686582.). Does that mean that the observed distinction between detection and discrimination would only apply to tasks in which the targets consist of otherwise meaningless visual elements, such as lines of different orientations?

      Our results are consistent with previous literature suggested by the reviewer. Specifically, we model detection and discrimination not as sequential processes, but as concurrent computations (Figs. 3A-B). Yet, our results suggest that these processes possess distinct neural bases. We have further revised the Discussion in context of this literature in the revised manuscript.

      “…Interestingly, we found no evidence indicating that these two computations (detection and discrimination) were sequential; in fact, the modulation of beta coherence occurred almost immediately after T2 onset, and lasted well afterwards (>400 ms from T2 onset) (Fig. 5A-B) suggesting that an analysis of T2’s features proceeded in parallel with its detection and consolidation. We also modeled detection and discrimination as concurrent computations in our SDT model (Fig. 3A-B). Previous work suggests that while object detection and categorization processes proceed in parallel, detection and identification processes occur sequentially[77]. Our results are in line with this literature, if we consider T2’s discrimination judgement – clockwise versus counterclockwise of vertical – to be a categorization, rather than an identification judgement. Moreover, this earlier study[75] observed significant trial-wise correlations between detection and categorization responses, suggesting that the two processes involve the operation of the same perceptual filters (“analyzers”). Our study, on the other hand, reports distinct neural bases for detection and discrimination computations. Yet, the two sets of findings are not mutually contradictory.

      In many conventional attentional blink tasks[3,20,25], complex visual stimuli, like letters, must be detected among a stream of background distractors with closely similar features, such as digits. In this case, target detection would require the operation of shape-selective perceptual filters for feature analysis. These same shape-selective filters would be involved also for discriminating between distinct, but related target stimuli (e.g., two designated candidate letters). In our task, target gratings needed to be distinguished in a stream of plainly distinct background distractors (plaids), whereas the discrimination judgement involved analysis of grating orientation. As a result, our task design likely precludes the need for the same perceptual filters in the detection and the discrimination judgements. Absent this common feature analysis, our results suggest distinct electrophysiological correlates for the detection and discrimination of targets.”

      Reviewer #2 Public review):

      Summary:

      The authors had two aims: First, to decompose the attentional blink (AB) deficit into the two components of signal detection theory; sensitivity and bias. Second, the authors aimed to assess the two subcomponents of sensitivity; detection and discrimination. They observed that the AB is only expressed in sensitivity. Furthermore, detection and discrimination were doubly dissociated. Detection modulated N2p and P3 ERP amplitude, but not frontoparietal beta-band coherence, whereas this pattern was reversed for discrimination.

      Strengths:

      The experiment is elegantly designed, and the data - both behavioral and electrophysiological - are aptly analyzed. The outcomes, in particular the dissociation between detection and discrimination blinks, are consistently and clearly supported by the results. The discussion of the results is also appropriately balanced.

      Thank you.

      Weaknesses:

      (2.1) The lack of an effect of stimulus contrast does not seem very surprising from what we know of the nature of AB already. Low-level perceptual factors are not thought to cause AB. This is fine, as there are also other, novel findings reported, but perhaps the authors could bolster the importance of these (null) findings by referring to AB-specific papers, if there are indeed any, that would have predicted different outcomes in this regard.

      While there is consensus that the low-level perceptual factors are not affected by the attentional blink, other studies have suggested evidence to the contrary (e.g., Chua et al, Percept. Psychophys., 2005)[1]. We have mentioned the significance of our findings in the context of such conflicting evidence in literature, in the revised Discussion.

      “Surprisingly, we found no significant effect of contrast on either type of deficit (Figs. 2A-B). In other words, high (100%) contrast T2 stimuli were also strongly susceptible to the detection and discrimination bottlenecks associated with the attentional blink. Thus, despite a clear contrast-dependent encoding of T2 in early sensory cortex, the attentional blink produced a significant deficit with downstream processing, even for targets of high contrast. While at odds with some earlier work, which suggest an early-stage perceptual bottleneck [82–84], these results are largely consistent with findings from the majority of previous studies [3,7,9,11,19,20,82,85,86] which suggest a late-stage bottleneck.”

      (2.2) On an analytical note, the ERP analysis could be finetuned a little more. The task design does not allow measurement of the N2pc or N400 components, which are also relevant to the AB, but the N1 component could additionally be analyzed. In doing so, I would furthermore recommend selecting more lateral electrode sites for both the N1, as well as the P1. Both P1 and N1 are likely not maximal near the midline, where the authors currently focused their P1 analysis.

      We performed these suggested analysis. Whereas in the original submission we had used the O1, O2 and Oz electrodes, we now estimate the P1 and N1 with the more lateral P7 and P8 electrodes[2], as suggested by the reviewer.

      Even with these more lateral electrodes, we did not observe a significant N1 component in a 90-160 ms window[3] in the long lag trials (p=0.207, signed rank test for amplitude less than zero); a one-tailed Bayes factor (BF=1.35) revealed no clear evidence for or against an N1 component. Analysis of the P1 component with these more lateral electrodes also yielded no statistically significant blink-induced modulation (P1(short lag-long lag) = 0.25 ± 0.16, uV, p=0.231, BF=0.651) (SI Figure S3, revised).

      These updated analyses are now reported in the revised Results (lines 317-319) and Methods (lines 854-855). In addition, we have revised SI Table S2 with the new P1 component analysis.

      (2.3) Impact & Context:

      The results of this study will likely influence how we think about selective attention in the context of the AB phenomenon. However, I think its impact could be further improved by extending its theoretical framing. In particular, there has been some recent work on the nature of the AB deficit, showing that it can be discrete (all-or-none) and gradual (Sy et al., 2021; Karabay et al., 2022, both in JEP: General). These different faces of target awareness in the AB may be linked directly to the detection and discrimination subcomponents that are analyzed in the present paper. I would encourage the authors to discuss this potential link and comment on the bearing of the present work on these behavioural findings.

      Thank you. We have now discussed our findings in the context of these recent studies in the revised manuscript.

      “…In line with this hypothesis, we discovered that the attentional blink induced dissociable detection and discrimination deficits. There was no statistically significant correlation between these two types of deficits within and across participants and evidence for such a correlation was weak, at best. Unlike previous target identification designs that conflated attentional blink’s effect on detection versus discrimination performance[3,4,9,25,37], our 3-AFC task, and associated signal detection model enabled quantifying each of these deficits separately and identifying a double dissociation between their respective neural correlates. Our dissociation of the attentional blink into distinct subcomponents is complementary to recent studies, which examined whether the attentional blink reflects an all-or-none phenomenon[73,74]. For example, the T2 deficit induced by the attentional blink can be either all-or-none or graded, depending on whether T1 and T2 judgements involve distinct or common features, respectively[73]. While a graded change in precision could reflect sensitivity effects, an all-or-none change in guess rates – without a concomitant change in precision – may reflect a criterion increase (conservative detection bias) effect. Future experiments that incorporate a three-alternative response, with concurrent detection and discrimination, along with key task elements of these earlier studies, may further help resolve these findings.”

      Reviewer #3 (Public review):

      Summary:

      In the present study, the authors aimed to achieve a better understanding of the mechanisms underlying the attentional blink, that is, a deficit in processing the second of two target stimuli when they appear in rapid succession. Specifically, they used a concurrent detection and identification task in- and outside of the attentional blink and decoupled effects of perceptual sensitivity and response bias using a novel signal detection model. They conclude that the attentional blink selectively impairs perceptual sensitivity but not response bias, and link established EEG markers of the attentional blink to deficits in stimulus detection (N2p, P3) and discrimination (fronto-parietal high-beta coherence), respectively. Taken together, their study suggests distinct mechanisms mediating detection and discrimination deficits in the attentional blink.

      Strengths:

      Major strengths of the present study include its innovative approach to investigating the mechanisms underlying the attentional blink, an elegant, carefully calibrated experimental paradigm, a novel signal detection model, and multifaceted data analyses using state-of-the art model comparisons and robust statistical tests. The study appears to have been carefully conducted and the overall conclusions seem warranted given the results. In my opinion, the manuscript is a valuable contribution to the current literature on the attentional blink. Moreover, the novel paradigm and signal detection model are likely to stimulate future research.

      Thank you.

      Weaknesses:

      Weaknesses of the present manuscript mainly concern the negligence of some relevant literature, unclear hypotheses, potentially data-driven analyses, relatively low statistical power, potential flaws in the EEG methods, and the absence of a discussion of limitations. In the following, I will list some major and minor concerns in detail.

      (3.1) Hypotheses: I appreciate the multifaceted, in-depth analysis of the given dataset including its high amount of different statistical tests. However, neither the Introduction nor the Methods contain specific statistical hypotheses. Moreover, many of the tests (e.g., correlations) rely on selected results of previous tests. It is unclear how many of the tests were planned a priori, how many more were performed, and how exactly corrections for multiple tests were implemented. Thus, I find it difficult to assess the robustness of the results.

      We hypothesized that neural computations associated with target detection would be characterized by regional (local) neuronal markers (e.g., parietal or occipital ERPs), whereas computations linked to feature discrimination would involve neural coordination across multiple brain regions (e.g. fronto-parietal coherence) (lines 135-138). We planned and conducted our statistical tests based on this hypothesis. All multiple comparison corrections (Bonferroni-Holm correction, see Methods) were performed separately for each class of analyses.

      Based on this overarching hypothesis, the following tests were planned and conducted.

      ERP analysis: Based on an extensive review of recent literature[4] (Zivony et al., 2022 we performed the following tests: i) We tested whether four ERP component amplitudes (parietal P1, fronto-central P2, occipito-parietal N2p, and parietal P3) were significantly different between short and long lags with a Wilcoxon signed rank test followed by Bonferroni-Holm multiple comparison correction; ii) We correlated the ERPs whose amplitudes showed a significant difference in analysis (i) with detection and discrimination d’ deficits (six correlations) using robust (bend) correlations[5]; again, this was followed by a Bonferroni-Holm multiple comparison correction. Note that there is no circularity with planning analysis (ii) based on the results of analysis (i) because the latter is agnostic to detection versus discrimination blink deficits. In case (i), where no a priori hypothesis about directionality were available, all p-values were based on two-tailed tests but for case (ii), where we had an a priori directional hypothesis, p-values were computed from one-tailed tests. This has now been clarified in the revised Methods lines 937-940 and 950-952.

      Coherence analysis: Based on a seminal study of long-range synchrony modulation by the attentional blink[6], we examined fronto-parietal coherence in the beta (13-30 Hz) band, separately for the left and right hemispheres, and performed the following comparisons. i) We computed differences between the fronto-parietal coherogram (time-frequency representation of coherence, Fig. 5A-D) between short-lag and long-lag conditions, and performed a twodimensional cluster-based permutation test[7]; this method inherently corrects for multiple comparisons across time-frequency windows. ii) Because the analysis in (i) revealed the clearest evidence for coherence differences in the canonical high-beta (20-30 Hz band) in the left fronto-parietal electrodes (Figs. 5C-D; 0-300 ms following target onset), we correlated power in this band with detection and discrimination d’ deficits; this was followed by a Bonferroni-Holm multiple comparison correction. As before there is no circularity with planning analysis (ii) based on the results of analysis (i) because the latter is agnostic to detection versus discrimination blink deficits. Again, in case (i), where no a priori hypothesis about directionality was made, all p-values were based on two-tailed tests but for case (ii), where we had an a priori directional hypothesis, p-values were computed from one-tailed tests.

      For completeness, we performed all of the other correlations, for example, correlations with coherence in the low-beta band or with the right fronto-parietal electrodes (SI Table 3). These latter analyses were not planned, nor did they yield significant results.

      Neural distance analysis: This was a novel analysis designed to test the hypothesis that detection and discrimination deficits would be correlated with neural distances along distinct dimensions. i) First, we compared neural distances across lag conditions at different timepoints following target onset with a one-dimensional cluster-based permutation test[7] ; ii) Next, we correlated the neural distances along the detection and discrimination dimension with the detection and discrimination d’ deficits (Fig. 6E-F, 6G-H), as well as with the ERP and coherence markers (Fig. 7A-B, 7C-D). For each of these analyses, we employed robust (bend) correlations[5] followed by a Bonferroni-Holm multiple comparison correction. As before, pvalues were computed using two-tailed tests for case (i) and one-tailed tests for case (ii), based on the absence or presence of an a priori directional hypothesis.

      (3.2) Power: Some important null findings may result from the rather small sample sizes of N = 24 for behavioral and N = 18 for ERP analyses. For example, the correlation between detection and discrimination d' deficits across participants (r=0.39, p=0.059) (p. 12, l. 263) and the attentional blink effect on the P1 component (p=0.050, no test statistic) (p. 14, 301) could each have been significant with one more participant. In my opinion, such results should not be interpreted as evidence for the absence of effects.

      We have modified these claims in the revised Results. In addition, we now compute and report Bayes factors, which enable evaluating evidence for the presence versus absence of effects.

      “Detection and discrimination d’ deficits were not statistically significantly correlated (r=0.39, t=2.28, p=0.059); Bayes factor analysis revealed no clear evidence for or against a correlation between these subcomponent deficits (BF=1.18) (SI Fig. S2, left).”

      “Discrimination accuracy deficits were not statistically significantly different between high and low detection accuracy deficit blocks (z=1.97, p=0.067), and the Bayes factor revealed no strong evidence for or against such a difference (BF=1.42) (Fig. 3G).”

      In addition, the results are interpreted as follows (lines 294-296):

      “Moreover, detection and discrimination d’ deficits were not significantly correlated both within and across participants, with no clear evidence for or against a correlation, based on the Bayes factor.”

      The null result on the P1 has changed because of the analysis with the alternative electrode set suggested by Reviewer #2 (see comment #2.2). We now report these results as follows:

      “By contrast, the P1, an early sensory component, showed no statistically significant blinkinduced modulation (P1= 0.25 ± 0.16µV, z = 1.19, p=0.231, BF = 0.651) (SI Fig. S3).”

      (3.3) Neural basis of the attentional blink: The introduction (e.g., p. 4, l. 56-76) and discussion (e.g., p. 19, 427-447) do not incorporate the insights from the highly relevant recent review by Zivony & Lamy (2022), which is only cited once (p. 19, l. 428). Moreover, the sections do not mention some relevant ERP studies of the attentional blink (e.g., Batterink et al., 2012; Craston et al., 2009; Dell'Acqua et al., 2015; Dellert et al., 2022; Eiserbeck et al., 2022; Meijs et al., 2018).

      We have now cited these previous studies at the appropriate places in the revised Introduction.

      “The effect of the attentional blink on the processing of the second target is well studied. In particular, previous studies have investigated the stage at which attentional blink affects T2’s processing (early or late) [14–17] and the neural basis of this effect, including the specific brain regions involved[15,18–20]. Several theoretical frameworks characterize a sequence of phases of the attentional blink, including target selection based on relevance, detection, feature processing, and encoding into working memory[9,21]. Overall, there is little support for attentional blink deficits at an early, sensory encoding[14] stage; by contrast, the vast majority of literature suggests that T2’s processing is affected at a late stage[8,10]. Consistent with these behavioral results, scalp electroencephalography (EEG) studies have reported partial or complete suppression of late event-related potential (ERP) components, particularly those linked to attentional engagement (P2, N2, N2pc or VAN)[15,22–25], working memory (P3) [20,26–30] or semantic processing (N400)[31]; early sensory components (P1/N1) are virtually unaffected[20,24] (reviewed in detail in Zivony and Lamy, 2022[32]) .”

      (3.4) Detection versus discrimination: Concerning the neural basis of detection versus discrimination (e.g., p. 6, l. 98-110; p. 18, l. 399-412), relevant existing literature (e.g., Broadbent & Broadbent, 1987; Hillis & Brainard, 2007; Koivisto et al., 2017; Straube & Fahle, 2011; Wiens et al., 2023) is not included.

      Thank you for these suggestions. We have now cited these studies in the revised Discussion.

      “It is increasingly clear that detection and discrimination are separable processes, each mediated by distinct neural mechanisms. Behaviorally, accurately identifying the first target, versus merely detecting it, produces stronger deficits with identifying the second target[59]. Moreover, dissociable mechanisms have been reported to mediate object detection and discrimination in visual adaptation contexts[60]. Neurally, shape detection and identification judgements produce activations in non-overlapping clusters in various brain regions in the visual cortex, inferior parietal cortex, and the medial frontal lobe[61]. Similarly, occipital ERPs associated with conscious awareness also show clear differences between detection and discrimination. For instance, an early posterior negative component (200-300 ms) was significantly modulated in amplitude by success in detection, but not in identification[62]. The closely related visual awareness negativity (VAN) was substantially stronger at the detection, compared to the discrimination, threshold[63].

      Furthermore, a significant body of previous work has reported dissociable behavioural and neural mechanisms underlying attention’s effects on target detection versus discrimination. Behavioral studies have reported distinct effects on target detection versus discrimination in both endogenous[64] and exogenous[65] attention tasks.”

      (3.5) Pooling of lags and lags 1 sparing: I wonder why the authors chose to include 5 different lags when they later pooled early (100, 300 ms) and late (700, 900 ms) lags, and whether this pooling is justified. This is important because T2 at lag 1 (100 ms) is typically "spared" (high accuracy) while T2 at lag 3 (300 ms) shows the maximum AB (for reviews, see, e.g., Dux & Marois, 2009; Martens & Wyble, 2010). Interestingly, this sparing was not observed here (p. 43, Figure 2). Nevertheless, considering the literature and the research questions at hand, it is questionable whether lag 1 and 3 should be pooled.

      Lag-1 sparing is not always observed in attentional blink studies; there are notable exceptions to reports of lag-1 sparing[8,9]. Our statistical tests revealed no significant difference in accuracies between short lag (100 and 300 ms) trials or between long lag (700 and 900 ms) trials but did reveal significant differences between the short and long lag trials (ANOVA, followed by post-hoc tests). To simplify the presentation of the findings, we pooled together the short lag (100 and 300 ms) and, separately, the long lag (700 and 900 ms) trials. We have presented these analyses, and clarified the motivation for pooling these lags in the revised Methods.

      “Based on these psychometric measures, we computed detection and discrimination accuracies as follows. Detection accuracies were computed as the average proportion of the hits, misidentification and correct rejection responses; misidentifications were included because not missing the target reflected accurate detection. By contrast, discrimination accuracies were computed based on the average proportion of the two correct identifications (hits) on T2 present trials alone. We performed 2-way ANOVAs on both detection and discrimination accuracies with the inter-target lag (5 values) and T2 contrast independent factors. We found main effects of both lag (F(4,92)=18.81, p<0.001) and contrast (F(1,92)=21.78, p<0.001) on detection accuracy, but no interaction effect between lag and contrast (F(4,92)=1.92, p=0.113). Similarly, we found main effects of both lag (F(4,92)=25.08, p<0.001) and contrast (F(1,92)=16.58, p<0.001) on discrimination accuracy, but no interaction effect between lag and contrast (F(4,92)=0.93, p=0.450). Post-hoc tests based on Tukey’s HSD revealed a significant difference in discrimination accuracies between the two shortest lags (100 ms and 300 ms) and the two longest lags (700 and 900 ms) for both low and high contrast targets, and for both detection and discrimination accuracies (p<0.01). But they revealed no significant difference between the two shortest lags (p>0.25) or the two longest lags (p>0.40) for either target contrast or for either accuracy type. As a result, for subsequent analyses, we pooled together the “short lag” (100 ms and 300 ms) and the “long lag” (700 ms and 900 ms) trials. We quantified the effect of the attentional blink on each of the psychometric measures as well as detection and discrimination accuracies by comparing their respective, average values between the short lag and long lag trials, separately for the high and low T2 contrasts.”

      (3.6) Discrimination in the attentional blink. Concerning the claims that previous attentional blink studies conflated detection and discrimination (p. 6, l. 111-114; p. 18, l. 416), there is a recent ERP study (Dellert et al., 2022) in which participants did not perform a discrimination task for the T2 stimuli. Moreover, since the relevance of all stimuli except T1 was uncertain in this study, irrelevant distractors could not be filtered out (cf. p. 19, l. 437). Under these conditions, the attentional blink was still associated with reduced negativities in the N2 range (cf. p. 19, l. 427-437) but not with a reduced P3 (cf. p. 19, l 439-447).

      We have addressed the relationship between our findings and those of Dellert et al (2022)[10] in the revised Discussion.

      “… In the present study, we observed that the parietal P3 amplitude was correlated selectively with detection, rather than discrimination deficits. This suggests that the P3 deficit indexes a specific bottleneck with encoding and consolidating T2 into working memory, rather than an inability to reliably maintain its features. In this regard, a recent study[22] measured ERP correlates of the perceptual awareness of the T2 stimulus whose relevance was uncertain at the time of its presentation. In contrast to earlier work, this study observed no change in P3b amplitude across seen (detected) and unseen targets. Taken together with this study, our findings suggest that rather than indexing visual awareness, the P3 may index detection, but only when information about the second target, or a decision about its appearance, needs to be maintained in working memory. Additional experiments, involving targets of uncertain relevance, along with our behavioral analysis framework, may help further evaluate this hypothesis.”

      (3.7) General EEG methods: While most of the description of the EEG preprocessing and analysis (p. 31/32) is appropriate, it also lacks some important information (see, e.g., Keil et al., 2014). For example, it does not include the length of the segments, the type and proportion of artifacts rejected, the number of trials used for averaging in each condition, specific hypotheses, and the test statistics (in addition to p-values).

      We regret the lack of details. We have included these in the revised Methods, and expanded on the description of the trial rejection (SCADS) algorithm.

      The revised Methods section on EEG Preprocessing mentions the type and proportion of artifacts rejected:

      “We then epoched the data into trials and applied SCADS (Statistical Control of Artifacts in Dense Array EEG/MEG Studies[90]) to identify bad epochs and artifact contaminated channels. SCADS detects artifacts based on three measures: maximum amplitude over time, standard deviation over time, and first derivative (gradient) over time. Any electrode or trial exhibiting values outside the specified boundaries for these measures was excluded. The boundaries were defined as M ± n*λ, where M is the grand median across electrodes and trials for each of the three measures, and λ is the root mean square (RMS) of the deviation of medians across sensors relative to the grand median. We set n to 3, allowing data within three boundaries to be retained. The percentage of electrodes per participant rejected was 6.3 ± 0.43% (mean ± s.e.m. across participants), whereas the percentage of trials rejected per electrode and participant was 3.4 ± 0.33% (mean ± s.e.m.).”

      The revised Methods section on ERP analysis mentions the number of trials for averaging in each condition and the length of the segments:

      “First trials were sorted based on inter-target lags (100, 300, 500, 700 and 900 ms). This yielded an average of (200±13, 171±9.71, 145 ± 7.54, 117 ± 5.43, 87 ± 4.51 ) (mean ± s.e.m. across participants) trials for each of the 5 lags, respectively.”

      “Then, EEG traces were epoched from -300 ms before to +700 ms after either T1 onset or T2 onset and averaged across trials to estimate T1-evoked and T2-evoked ERPs, respectively.”

      Specific hypotheses are mentioned in response #3.1; we also now mention the test statistic associated with each test at the appropriate places in the Results. For example:

      “Among these ERP components, the N2p component and the P2 component were both significantly suppressed during the blink (∆amplitude, short-lag – long-lag: N2p=-0.47 ± 0.12 µV, z=-3.20, p=0.003, BF=40, P2=-0.19 ± 0.07 µV, z=-2.54, p=0.021, BF=4.83, signed rank test) (Fig. 4A, right). Similarly, the parietal P3 also showed a significant blink-induced suppression (P3= -0.45 ± 0.09µV, z=-3.59, p < 0.001, BF>10<sup>2</sup>) (Fig. 4B, right).”

      “Neural inter-class distances (||η||) along both the detection and discrimination dimensions decreased significantly during the blink (short lag-long lag: ∆||ηdet|| = -1.30 ± 0.70, z=-3.68, p=0.006, BF=20; ∆||ηdis|| = -1.23 ± 0.42, z=-3.54, p<0.001, BF>10<sup>2</sup>) (Figs. 6C-D).”

      (3.8) EEG filters: P. 31, l. 728: "The data were (...) bandpass filtered between 0.5 to 18 Hz (...). Next, a bandstop filter from 9-11 Hz was applied to remove the 10 Hz oscillations evoked by the RSVP presentation." These filter settings do not follow common recommendations and could potentially induce filter distortions (e.g., Luck, 2014; Zhang et al., 2024). For example, the 0.5 high-pass filter could distort the slow P3 wave. Mostly, I am concerned about the bandstop filter. Since the authors commendably corrected for RSVP-evoked responses by subtracting T2-absent from T2-present ERPs (p. 31, l. 746), I wonder why the additional filter was necessary, and whether it might have removed relevant peaks in the ERPs of interest.

      Thank you for this suggestion. Originally, the 9-11 Hz bandstop filter was added to remove the strong 10 Hz evoked oscillation from the EEG response for obtaining a cleaner signal for the other analyses, like the analysis of neural dimensions (Fig. 6)

      We performed two control ERP analyses to address the reviewers’ concern:

      (1) We removed the bandstop filter and re-evaluated the P1, P2, N2pc and P3 ERP amplitudes. We observed no statistically significant difference in the modulation of any of the 4 ERP components (P1: p=0.031, BF=0.692, P2: p=0.038, BF=1.21, N2pc: p=0.286, BF=0.269, P3: p=0.085, BF=0.277). In particular, Bayes Factor analysis revealed substantial evidence against a difference in the N2pc and P3 amplitudes before versus after the bandstop filter removal (BF<0.3).

      (2) We removed the bandstop filter and repeated all of the same analyses as reported in the Results and summarized in SI Table S2. We observed a virtually identical pattern of results, summarized in an analogous table, below (compare with SI Table S2, revised, in the Supplementary Information).

      Author response table 2.

      We have now mentioned this control analysis briefly in the Methods (lines 863-865).

      (3.9) Coherence analysis: P. 33, l. 786: "For subsequent, partial correlation analyses of coherence with behavioral metrics and neural distances (...), we focused on a 300 ms time period (0-300 ms following T2 onset) and high-beta frequency band (20-30 Hz) identified by the cluster-based permutation test (Fig. 5A-C)." I wonder whether there were any a priori criteria for the definition and selection of such successive analyses. Given the many factors (frequency bands, hemispheres) in the analyses and the particular shape of the cluster (p. 49, Fig 5C), this focus seems largely data-driven. It remains unclear how many such tests were performed and whether the results (e.g., the resulting weak correlation of r = 0.22 in one frequency band and one hemisphere in one part of a complexly shaped cluster; p. 15, l. 327) can be considered robust.

      Please see responses to comments #3.1 and #3.2 (above). In addition to reporting further details regarding statistical tests, their hypotheses, and multiple comparisons corrections, we computed Bayes factors to quantify the strength of the evidence for correlations, as appropriate. Interpretations have been rephrased depending on whether the evidence for the null or alternative hypothesis is strong or equivocal. For example:

      “Bayes factor analysis revealed no clear evidence for or against a correlation between these subcomponent deficits (BF=1.18) (SI Fig. S2, left).”

      “Discrimination accuracy deficits were not statistically significantly different between high and low detection accuracy deficit blocks (z=1.97, p=0.067), and the Bayes factor revealed no strong evidence for or against such a difference (BF=1.42) (Fig. 3G).”

      Recommendations for the authors:

      Reviewer #1 (Recommendations for the authors):

      (1.a) Line 76-79: "Despite this extensive literature, previous studies have essentially treated the attentional blink as a unitary, monolithic phenomenon. As a result, fundamental questions regarding the component mechanisms of the attentional blink remain unanswered." This statement seems antithetical to the fact that theories of the AB suggest a variety of different mechanisms as possible causes of the effect.

      The statement has been revised as follows:

      “Despite this extensive literature, many previous studies have[ studied the attentional blink as a unitary phenomenon. While some theoretical models9,21,32] and experimental studies[38,39] have explored distinct mechanisms underlying the attentional blink, several fundamental questions about its distinct component mechanisms remain unanswered.”

      (1.b) Line 95-97: Here, the authors should explain in more detail how a response bias could fluctuate across lags.

      Addressed in response to public reviews, #1.1.

      (1.c) Line 98: I found this second question a much more compelling motivation for the study than the earlier stated question of whether the AB reflects a reduction in sensitivity or a fluctuation (?) of response bias.

      Thank you.

      (1.d) Line 143: What do the authors mean by "geometric" distribution of lags? In virtually all AB studies, the distribution of lags is uniform. Wasn't that the case in this study?

      We employed a geometric distribution for the trials of different lags, and verified that the sampled distribution of lags was well fit by this distribution (χ<sup>2</sup>(3, 312)=0.22, p=0.974). We chose a geometric distribution – with a flat hazard function[11] – over the uniform distribution to avoid conflating the effects of temporal expectation with those of the attention blink on criterion[12] at different lags.

      (1.e) Line 158-160: Explain why incorrect discrimination responses were not counted as correct detection. Explain why failure to detect T2 was counted as a discrimination error.

      Addressed in response to public reviews, #1.2.

      (1.f) Line 167: The results do not show lag-1 sparing, which is a typical property of the AB.

      The authors should report this, and explain why their paradigm did not show a sparing effect.

      Addressed in response to public reviews, #3.5.

      (1.g) Line 262-263: With only 24 participants, the study appears to be underpowered to reliably detect correlations. This should be noted as a limitation.

      Addressed in response to public reviews, #3.2.

      (1.h) Line 399-412: This section could be moved to the introduction to explain and motivate the aim of examining the distinct contributions of detection and discrimination to the AB.

      We have revised the Introduction to better motivate the aims of the study.

      Reviewer #2 (Recommendations for the authors):

      (2.a) A small note about the writing: as a matter of style, I would advise editing the generic phrasing (e.g., "shedding new light", "complex interplay") in abstract and general discussion.

      These are now revised as follows (for example):

      Line 26 - “These findings provide detailed insights into the subcomponents of the attentional blink….”

      Line 596 - “More broadly, these findings contribute to our understanding of the relationship between attention and perception….”

      (2.b) Some references appear double and/or without volume or page numbers (e.g., 44/61).

      Thank you. Amended now.

      Reviewer #3 (Recommendations for the authors):

      (3.a) Suggestions for additional analyses:

      I appreciate that the authors have quantified the evidence for null effects in simple comparisons using Bayes factors. In my opinion, the study would additionally benefit from Bayesian ANOVAs, which can also easily be implemented in JASP (Keysers et al., 2020), which the authors have already used for the other tests. As a result, they could further substantiate some of their claims related to null effects (e.g., p. 9, l. 175; p. 12, l. 246).

      Thank you. We have added Bayes factor values for ANOVAs (implemented in JASP[13]) wherever applicable in the revised manuscript. For example:

      “While we found a main effect of both lag (detection: F(1,23)=29.8, p<0.001, BF >10<sup>3</sup> discrimination: F(1,23)=54.1, p<0.001, BF >10<sup>3</sup>) and contrast (detection: F(1,23)=21.02, p<0.001, BF>10<sup>2</sup>, discrimination: F(1,23) =13.75, p=0.001, BF=1.22), we found no significant interaction effect between lag and contrast (detection: F(1,23)=1.92, p=0.113, BF=0.49, discrimination: F(1,23) = 0.93, p=0.450, BF=0.4).”

      “A two-way ANOVA with inter-target lag and T2 contrast as independent factors revealed a main effect of lag on both d’<sub>det</sub> (F(1,23)=30.3, p<0.001, BF>10<sup>3</sup>) and d’<sub>dis</sub> (F(1,23)=100.3, p<0.001, BF>10<sup>3</sup>). Yet, we found no significant interaction effect between lag and contrast for d’<sub>det</sub> (F(1,23)=2.3, p=0.141, BF=0.44).”

      Minor points

      (3.b) Statistics: Many p-values are reported without the respective test statistics (e.g., p. 9, l. 164; p. 12, l. 241-244 and 252-258; p. 13, l. 271, etc.).

      Addressed in response to public reviews, #3.7.

      (3.c) P. 4, l. 58: It is not entirely clear how the authors define "early or late". For example, while they consider the P2/N2/N2pc complex as "late" (l. 62-64), these ERP components are considered "early" in the debate on "early vs. late" neural correlates of consciousness (for a review, see Förster et al., 2020).

      We appreciate the debate. Our naming convention follows these seminal works[3,14–16].

      (3.d) P. 5., l. 77: "previous studies have essentially treated the attentional blinks as a unitary, monolithic phenomenon": There are previous studies in which both the presence and identity of T2 were queried (e.g., Eiserbeck et al., 2022; Harris et al., 2013).

      Addressed in response to recommendations for authors, #1.a.

      (3.e) P. 9, l. 169-177: The detection and discrimination accuracies are analyzed using twoway ANOVAs with the factors lags and contrast. I wonder why the lag effects are additionally analyzed using Wilcoxon signed rank tests using data pooled across the T2 contrasts (p., 9, l. 161-168)? If I understand it correctly, these tests should correspond to the main effects of lag in the ANOVAs. Indeed, both analyses lead to the same conclusions (l. 167 and l. 176).

      Our motivation was to first establish the attentional blink effect, with data pooled across contrasts. The subsequent ANOVA allowed delving deeper into contrast and interaction effects. Indeed, the results were consistent across both tests.

      (3.f) P. 12, l. 242: I wonder why the T2 contrasts are pooled in the statistical tests (but plotted separately, p. 45, Figure 3C).

      Model selection analysis distinct d’<sub>det</sub> parameter values across contrasts, as reflected in Fig. 3C. As mentioned in response #3.e contrasts effects were analyzed with an ANOVA.

      (3.g) P. 13, l. 287: "high and low contrast T2 trials were pooled to estimate reliable ERPs". The amount of trials per condition is not provided.

      Addressed in response to public reviews, #3.7.

      (3.h) P. 45, Figure 3D/F: In my opinion, plotting the contrasts and lags separately (despite the results of the model selection) would have provided a better idea of the data.

      We appreciate the reviewer’s suggestion, but followed the results of model selection for consistency.

      (3.i) P. 21, l. 470: "the left index finger to report clockwise orientations and the right index finger to report counter-clockwise orientations": This left/right mapping seems counterintuitive to me, and the authors also used the opposite mapping in Figures 1 and 2. It is not described in the Methods (p. 25) and thus is unclear.

      We regret the typo. Revised as follows:

      “...the left index finger to report counter-clockwise orientations and the right index finger to report clockwise orientations.”

      (3.j) P. 22, l. 514: "Taken together, these results suggest the following, testable schema (SI Figure S5)." Figure S5 seems to be missing.

      Amended. This is Fig. 8 in the revised manuscript.

      (3.k) P. 25, l. 559: I do not understand why the circular placeholders around the stimuli were included, and they are not mentioned in Figure 2A (p. 43). When I saw the figure and read the inscription, I wondered whether they were actually part of the stimulus presentation or symbolized something else.

      The placeholder was described in the earlier Methods section. We have now also mentioned it in caption for Fig. 2A.

      “All plaids were encircled by a circular placeholder. The fixation dot and the placeholder were present on the screen throughout the trial.”

      This avoided spatial uncertainty with estimating stimulus dimensions during the presentation.

      (3.l) P. 32, l. 754: The interval of interest for the P1 from 40 to 140 ms seems unusually early to me. The component usually peaks at 100 ms (e.g., at 96 ms in the cited study by Sergent et al., 2005), which also seems to be the case in the present study (Fig. S3, p. 57). I wonder how they were defined.

      For our analyses, we employed the peak value of the P1 ERP component in a window from 40-140 ms. The peak occurred around 100 ms (SI Fig. S3), which aligns with the literature.

      Additional minor comments:

      These comments have been all addressed, and typos corrected, by revising the manuscript at the appropriate places.

      3.m.1. L. 14: In my opinion, this sentence is difficult to read due to the nested combination of singular and plural forms. Importantly, as the authors also acknowledge (e.g., l. 83), perceptual sensitivity and choice bias could both be compromised, so I would suggest using plural and adding "or both" as a third option for clarity. See also p. 10, l. 204.

      3.m.2. L. 14: The comma before "As a result" should be replaced by a period.

      3.m.3. L. 45 "to guide Behavior" should be lowercase.

      3.m.4. L. 67: "Activity in the parietal, lateral prefrontal cortex and anterior cingulate cortex" could be read as if there was a "parietal, prefrontal cortex", so I would suggest removing the first "cortex".

      Revised/amended.

      3.m.5. L. 77: "fundamental questions regarding the component mechanisms of the attentional blink remain unanswered": The term "component mechanisms" is a bit unclear to me.

      We elaborate on this term in the very next set of paragraphs in the Introduction.

      3.m.6. L. 88: "a lower proportion of correct T2 detections can arise from a lower detection d'". "Arise from" sounds a bit off given that d' is a function of hits and false alarms.

      3.m.7. L. 95: I would suggest citing the updated edition of the classic "Detection Theory: A User's Guide" by Hautus, Macmillan & Creelman (2021).

      3.m.8. L. 102: "a oriented grating" should be "an".

      3.m.9. L. 126: "key neural markers - a local neural marker (event-related potentials) potentials" should be rephrased/corrected.

      3.m.10. L. 129: There are inconsistent tenses (mostly past tense but "we synthesize").

      3.m.11. L. 138: Perhaps the abbreviations (e.g., dva, cpd) should be introduced here (first mention) rather than in the Methods below.

      3.m.12. L. 148: "at the end of each trial participants first, indicated": The comma position should be changed.

      3.m.13. L. 176 "attentional blink-induced both a ...": The hyphen should be removed.

      3.m.14. L. 396: I think "but neither of them affects" would be better here.

      3.m.15. L. 383: "Detection deficits were signaled by ERP components such as the occipitoparietal N2p and the parietal P3": In my opinion, "such as" is too vague here.

      Revised/amended.

      3.m.16. L. 403: "Neurally, improved detection of attended targets is accompanied by (...) higher ERP amplitudes". Given the different mechanisms underlying the ERP, this section would benefit from more details.

      Addressed in response to public reviews, #3.4.

      3.m.17.    L. 924: References 18 and 46 seem to be the same.

      3.m.18.    L. 1181: I think d'det should be d'dis here.

      3.m.19.    L. 1284: "détection" should be "detection".

      3.m.20.    I found some Figure legends a bit confusing. For example, 5E refers to 4E, but 4E refers to 4C.

      3.m.21.    In Figures 4A/B and 6C/D, some conditions are hidden due to the overlap of CIs. Could they be made more transparent?

      Revised/amended.

      References:

      (1) Fook K.Chua. The effect of target contrast on the attentional blink. Percept Psychophys 5, 770–788 (2005).

      (2) Chmielewski, W. X., Mückschel, M., Dippel, G. & Beste, C. Concurrent information affects response inhibition processes via the modulation of theta oscillations in cognitive control networks. Brain Struct Funct 221, 3949–3961 (2016).

      (3) Sergent, C., Baillet, S. & Dehaene, S. Timing of the brain events underlying access to consciousness during the attentional blink. Nat Neurosci 8, 1391–400 (2005).

      (4) Zivony, A. & Lamy, D. What processes are disrupted during the attentional blink? An integrative review of event-related potential research. Psychon Bull Rev 29, 394–414 (2022).

      (5) Pernet, C. R., Wilcox, R. & Rousselet, G. A. Robust Correlation Analyses: False Positive and Power Validation Using a New Open Source Matlab Toolbox. Front Psychol 3, (2013).

      (6) Gross, J. et al. Modulation of long-range neural synchrony reflects temporal limitations of visual attention in humans. Proceedings of the National Academy of Sciences 101, 13050–13055 (2004).

      (7) Eric Maris and Robert Oostenveld. Nonparametric statistical testing of EEG and MEG data. J Neurosci Methods 164, 177–190 (2007).

      (8) Hommel, B. & Akyürek, E. G. Lag-1 sparing in the attentional blink: Benefits and costs of integrating two events into a single episode. The Quarterly Journal of Experimental Psychology Section A 58, 1415–1433 (2005).

      (9) Livesey, E. J. & Harris, I. M. Target sparing effects in the attentional blink depend on type of stimulus. Atten Percept Psychophys 73, 2104–2123 (2011).

      (10) Dellert, T. et al. Neural correlates of consciousness in an attentional blink paradigm with uncertain target relevance. Neuroimage 264, 119679 (2022).

      (11) Nobre, A., Correa, A. & Coull, J. The hazards of time. Curr Opin Neurobiol 17, 465– 470 (2007).

      (12) Bang, J. W. & Rahnev, D. Stimulus expectation alters decision criterion but not sensory signal in perceptual decision making. Sci Rep 7, 17072 (2017).

      (13) JASP Team. JASP (version 0.19.0.) [Computer Software]. Preprint at (2022).

      (14) Luck, S. J. Electrophysiological Correlates of the Focusing of Attention within Complex Visual Scenes: N2pc and Related ERP Components. (Oxford University Press, 2011). doi:10.1093/oxfordhb/9780195374148.013.0161.

      (15) Brydges, C. R., Fox, A. M., Reid, C. L. & Anderson, M. Predictive validity of the N2 and P3 ERP components to executive functioning in children: a latent-variable analysis. Front Hum Neurosci 8, (2014).

      (16) Michalewski, H. J., Prasher, D. K. & Starr, A. Latency variability and temporal interrelationships of the auditory event-related potentials (N1, P2, N2, and P3) in normal subjects. Electroencephalography and Clinical Neurophysiology/Evoked Potentials Section 65, 59–71 (1986).

    1. eLife Assessment

      Using several hundreds of samples and cutting-edge genomic methods, including BioNano, PacBio, HiFi, and advanced bioinformatic pipelines, the authors identify six large chromosomal inversions segregating in over 100 species of Lake Malawi cichlids. This important study provides compelling evidence for the presence of these six inversions, their differential distribution among populations, and the association of chromosome 10 inversion with a sex-determination locus. This work also provides a starting point for further investigating the role of these inversions with respect to local adaptation, speciation, sex determination, hybridization, and ILS in cichlids, which represent ~5% of the extant vertebrate species and are one of the most prominent examples of adaptive radiations.

    2. Reviewer #2 (Public review):

      Summary:

      Chromosomal inversions have been predicted to play a role in adaptive evolution and speciation because of their ability to "lock" together adaptive alleles in genomic regions of low recombination. In this study, the authors use a combination of cutting-edge genomic methods, including BioNano and PacBio HiFi sequencing, to identify six large chromosomal inversions segregating in over 100 species of Lake Malawi cichlids, a classic example of adaptive radiation and rapid speciation. By examining the frequencies of these inversions present in species from six different linages, the authors show that there is an association between the presence of specific inversions with specific lineages/habitats. Using a combination of phylogenetic analyses and sequencing data, they demonstrate that three of the inversions have been introduced to one lineage via hybridization. Finally, genotyping of laboratory crosses suggests that two inversions are associated with XY sex determination systems in a subset of species. The data add to a growing number of systems in which inversions have been associated with adaptation to divergent environments. However, like most of the other recent studies in the field, this study does not go beyond describing the presence of the inversions to demonstrate that the inversions are under sexual or natural selection or that they contribute to adaptation or speciation in this system.

      Strengths:

      All analyses are very well done, and the conclusions about the presence of the six inversions in Lake Malawi cichlids, the frequencies of the inversions in different species, and the presence of three inversions in the benthic lineages due to hybridization are well-supported. Genotyping of 48 individuals resulting from laboratory crosses provides strong support that the chromosome 10 inversion is associated with a sex-determination locus.

      Weaknesses:

      The evidence supporting a role for the chromosome 11 inversion is based on relatively few individuals and therefore remains suggestive. The authors are mostly cautious in their interpretations of the data, although there are places where the language is imprecise and therefore a little misleading.

    3. Author response:

      The following is the authors’ response to the original reviews

      We thank the reviewers for the careful review of our manuscript. Overall, they were positive about our use of cutting-edge methods to identify six inversions segregating in Lake Malawi. Their distribution in ~100 species of Lake Malawi species demonstrated that they were differentially segregating in different ecogroups/habitats and could potentially play a role in local adaptation, speciation, and sex determination. Reviewers were positive about our finding that the chromosome 10 inversion was associated with sex-determination in a deep benthic species and its potential role in regulating traits under sexual selection. They agree that this work is an important starting point in understanding the role of these inversions in the amazing phenotypic diversity found in the Lake Malawi cichlid flock.

      There were two main criticisms that were made which we summarize:

      (1) Lack of clarity. It was noted that the writing could be improved to make many technical points clearer. Additionally, certain discussion topics were not included that should be.

      We will rewrite the text and add additional figures and tables to address the issues that were brought up in a point-by-point response. We will improve/include (1) the nomenclature to understand the inversions in different lineages, (2) improved descriptions for various genomic approaches, (3) a figure to document the samples and technologies used for each ecogroup, and 4) integration of LR sequences to identify inversion breakpoints to the finest resolution possible.

      (2) We overstate the role that selection plays in the spread of these inversions and neglect other evolutionary processes that could be responsible for their spread.

      We agree with the overarching point. We did not show that selection is involved in the spread of these inversions and other forces can be at play. Additionally, there were concerns with our model that the inversions introgressed from a Diplotaxodon ancestor into benthic ancestors and incomplete lineage sorting or balancing selection (via sex determination) could be at play. Overall, we agree with the reviewers with the following caveats. 1. Our analysis of the genetic distance between Diplotaxodons and benthic species in the inverted regions is more consistent with their spread through introgression versus incomplete lineage sorting or balancing selection. 2. Further the role of these inversions is likely different in different species. For example, the inversion of 10 and 11 play a role in sex determination in some species but not others and the potential pressures acting on the inverted and non-inverted haplotypes will be very different. These are very interesting and important questions booth for understanding the adaptive radiations in Lake Malawi and in general, and we are actively studying crosses to understand the role of these inversions in phenotypic variation between two species. We will modify the text to make all of these points clearer.

      Public Reviews:

      Reviewer #1 (Public review):

      Summary:

      Using high-quality genomic data (long-reads, optical maps, short-reads) and advanced bioinformatic analysis, the authors aimed to document chromosomal rearrangements across a recent radiation (Lake Malawi Cichlids). Working on 11 species, they achieved a high-resolution inversion detection and then investigated how inversions are distributed within populations (using a complementary dataset of short-reads), associated with sex, and shared or fixed among lineages. The history and ancestry of the inversions is also explored.

      On one hand, I am very enthusiastic about the global finding (many inversions well-characterized in a highly diverse group!) and impressed by the amount of work put into this study. On the other hand, I have struggled so much to read the manuscript that I am unsure about how much the data supports some claims. I'm afraid most readers may feel the same and really need a deep reorganisation of the text, figures, and tables. I reckon this is difficult given the complexity brought by different inversions/different species/different datasets but it is highly needed to make this study accessible.

      The methods of comparing optical maps, and looking at inversions at macro-evolutionary scales can be useful for the community. For cichlids, it is a first assessment that will allow further tests about the role of inversions in speciation and ecological specialisation. However, the current version of the manuscript is hardly accessible to non-specialists and the methods are not fully reproducible.

      Strengths:

      (1) Evidence for the presence of inversion is well-supported by optical mapping (very nice analysis and figure!).

      (2) The link between sex determination and inversion in chr 10 in one species is very clearly demonstrated by the proportion in each sex and additional crosses. This section is also the easiest to read in the manuscript and I recommend trying to rewrite other result sections in the same way.

      (3) A new high-quality reference genome is provided for Metriaclima zebra (and possibly other assemblies? - unclear).

      (4) The sample size is great (31 individuals with optical maps if I understand well?).

      (5) Ancestry at those inversions is explored with outgroups.

      (6) Polymorphism for all inversions is quantified using a complementary dataset.

      Weaknesses:

      (1) Lack of clarity in the paper: As it currently reads, it is very hard to follow the different species, ecotypes, samples, inversions, etc. It would be useful to provide a phylogeny explicitly positioning the samples used for assembly and the habitat preference. Then the text would benefit from being organised either by variant or by subgroups rather than by successive steps of analysis.

      We have extensively rewritten the paper to improve the clarity. With respect to this point, we moved Figure 6 to Figure 1, which places the phylogeny of Lake Malawi cichlids at the beginning of the paper. We incorporated information about samples/technologies by ecogroup into this figure to help the reader gain an overview of the technologies involved. We added information about habitat for each ecogroup as well. While we considered a change to the text organization suggested here, we thought it was clearer to keep the original headings.

      (2) Lack of information for reproducibility: I couldn't find clearly the filters and parameters used for the different genomic analyses for example. This is just one example and I think the methods need to be re-worked to be reproducible. Including the codes inside the methods makes it hard to follow, so why not put the scripts in an indexed repository?

      We now provide a link to a github repository (https://github.com/ptmcgrat/CichlidSRSequencing/tree/Kumar_eLife) containing the scripts used for the major analysis in the paper. Because our data is behind a secure Dropbox account, readers will not be able to run the analysis, however, they can see the exact programs, filters, and parameters used for manuscript embedded within each script.

      (3) Further confirmation of inversions and their breakpoints would be valuable. I don't understand why the long-reads (that were available and used for genome assembly) were not also used for SV detection and breakpoint refinement.

      We did use long reads to confirm the presence of the inversions by creating five new genome assemblies from the PacBio HiFi reads: two additional Metriaclima zebra samples and three Aulonocara samples. Alignment of these five genomes to the MZ_GT3 reference is shown in Figures S2 – S7. These genome assemblies were also used to identify the breakpoints of the inversions. However, because of the extensive amount of repetitive DNA at the breakpoints (which is known to be important for the formation of large inversions), our ability to resolve the breakpoints was limited.

      (4) Lack of statistical testing for the hypothesis of introgression: Although cichlids are known for high levels of hybridization, inversions can also remain balanced for a long time. what could allow us to differentiate introgression from incomplete lineage sorting?

      The coalescent time between the inversions between Diplotaxodons and benthics should allow us to distinguish these two mechanisms. Our finding that the genetic distance, which is related to coalescent time, is closer within the inversions than the whole genome is supportive of introgression. However, we did not perform any simulations or statistical tests. We make it clearer in the text that incomplete lineage sorting remains a possible mechanism for the distribution of inversions within these ecogroups.

      (5) The sample size is unclear: possibly 31 for Bionano, 297 for short-reads, how many for long-reads or assemblies? How is this sample size split across species? This would deserve a table.

      We have included this information in the new Figure 1.

      (6) Short read combines several datasets but batch effect is not tested.

      We do not test for batch effect. However, we do note that all of the datasets were analyzed by the same pipeline starting from alignment so batch effects would be restricted to aspects of the reads themselves. Additionally, samples from the different data sets clustered as expected by lineage and inferred inversion, so for these purposes unlikely to have affected analysis.

      (7) It is unclear how ancestry is determined because the synteny with outgroups is not shown.

      Ancestry analysis was determined using the genome alignments of two outgroups from outside of Lake Malawi. This is shown in Figure S8.

      (8) The level of polymorphism for the different inversions is difficult to interpret because it is unclear whether replicated are different species within an eco-group or different individuals from the same species. How could it be that homozygous references are so spread across the PCA? I guess the species-specific polymorphism is stronger than the ancestral order but in such a case, wouldn't it be worth re-doing the PCa on a subset?

      The genomic PCA plots reflect the evolutionary histories that are observed in the whole genome phylogenies. Because the distribution of the inverted alleles violate the species tree, they form separate clusters on the PCA plots that can be used to genotype specific species. We have also performed this analysis on benthics (utaka/shallow benthics/deep benthics) and the distribution matches the expectation.

      Reviewer #2 (Public review):

      Summary:

      Chromosomal inversions have been predicted to play a role in adaptive evolution and speciation because of their ability to "lock" together adaptive alleles in genomic regions of low recombination. In this study, the authors use a combination of cutting-edge genomic methods, including BioNano and PacBio HiFi sequencing, to identify six large chromosomal inversions segregating in over 100 species of Lake Malawi cichlids, a classic example of adaptive radiation and rapid speciation. By examining the frequencies of these inversions present in species from six different linages, the authors show that there is an association between the presence of specific inversions with specific lineages/habitats. Using a combination of phylogenetic analyses and sequencing data, they demonstrate that three of the inversions have been introduced to one lineage via hybridization. Finally, genotyping of wild individuals as well as laboratory crosses suggests that three inversions are associated with XY sex determination systems in a subset of species. The data add to a growing number of systems in which inversions have been associated with adaptation to divergent environments. However, like most of the other recent studies in the field, this study does not go beyond describing the presence of the inversions to demonstrate that the inversions are under sexual or natural selection or that they contribute to adaptation or speciation in this system.

      Strengths:

      All analyses are very well done, and the conclusions about the presence of the six inversions in Lake Malawi cichlids, the frequencies of the inversions in different species, and the presence of three inversions in the benthic lineages due to hybridization are well-supported. Genotyping of 48 individuals resulting from laboratory crosses provides strong support that the chromosome 10 inversion is associated with a sex-determination locus.

      Weaknesses:

      The evidence supporting a role for the chromosome 11 inversion and the chromosome 9 inversion in sex determination is based on relatively few individuals and therefore remains suggestive. The authors are mostly cautious in their interpretations of the data. However, there are a few places where they state that the inversions are favored by selection, but they provide no evidence that this is the case and there is no consideration of alternative hypotheses (i.e. that the inversions might have been fixed via drift).

      We have removed mention of chromosome 9’s potential role in sex determination from the paper. While our analysis of sex association with chromosome 11 was limited compared to our analysis of chromosome 10, it was still statistically significant, and we believe it should be left in the paper. The role of 11 (and 9 and 10) in sex determination was also demonstrated using an independent dataset by Blumer et al (https://doi.org/10.1101/2024.07.28.605452)

      We agree that we did not properly consider alternative hypothesis in the original submission and have rewritten the Discussion substantially to consider various alternative hypothesis.

      Reviewer #3 (Public review):

      This is a very interesting paper bringing truly fascinating insight into the genomic processes underlying the famous adaptive radiation seen in cichlid fishes from Lake Malawi. The authors use structural and sequence information from species belonging to distinct ecotypic categories, representing subclades of the radiation, to document structural variation across the evolutionary tree, infer introgression of inversions among branches of the clade, and even suggest that certain rearrangements constitute new sex-determining loci. The insight is intriguing and is likely to make a substantial contribution to the field and to seed new hypotheses about the ecological processes and adaptive traits involved in this radiation.

      I think the paper could be clarified in its prose, and that the discussion could be more informative regarding the putative roles of the inversions in adaptation to each ecotypic niche. Identifying key, large inversions shared in various ways across the different taxa is really a great step forward. However, the population genomics analysis requires further work to describe and decipher in a more systematic way the evolutionary forces at play and their consequences on the various inversions identified.

      The model of evolution involving multiple inversions putatively linking together co-adapted "cassettes" could be better spelled out since it is not entirely clear how the existing theory on the recruitment of inversions in local adaptation (e.g. Kirkpatrick and Barton) operates on multiple unlinked inversions. How such loci correspond to distinct suites of integrated traits, or not, is not very easy to envision in the current state of the manuscript.

      This is a very interesting point, and we agree creates complications for a simple model of local adaptation. We imagine though that the actual evolutionary history was much more complicated than a single Rhamphochromis-type species separating from a single Diplotaxodon-type species and could have occurred sequentially involving multiple species that are now extinct. A better understanding of the role each of these inversions play in phenotypic diversity could potentially help us determine if different inversions carry variation that could be linked to distinct habit differences. We have added a line to the discussion.

      The role of one inversion in sex determination is apparent and truly intriguing. However, the implication of such locus on ecological adaptation is somewhat puzzling. Also, whether sex determination loci can flow across species via introgression seems quite important as a route to chromosomal sex determination, so this could be discussed further.

      Another very interesting point. If the inversions are involved in ecological adaptation (an important caveat), then potentially the inverted and non-inverted haplotypes play dual roles in the Aulonocara animals with the inverted haplotype carrying adaptive alleles to deep water and the non-inverted haplotype carrying alleles resolving sexual conflict. We have broadened our discussion about their function at the origin including non-adaptive roles.

      Recommendations for the authors:

      Reviewer #2 (Recommendations for the authors):

      Overall, the paper is well-written and clear. I do have a few suggestions for changes that would help the reader:

      (1) Figure 1: the figure legend could be expanded here to help the reader; what are the blue and yellow lines? Why are there two lines for the GT3a assembly? And, I had to somehow read the legend a few times to understand that the top line is the UMD2a reference assembly, and the next line is the new Bionano map.

      Fixed in what is now Figure 2

      (2) Paragraph starting on line 133: you use the word "test" to refer to the Bionano analyses; it is not clear whether anything is being tested. Perhaps "analyse the maps" or just "map" would be more clear? Or more explanation?

      The text has been modified to address this point

      (3) L145-146: perhaps change "a single inversion" and "a double inversion" to "single inversions" and "double inversions".

      The text has been modified to address this point

      (4) L157: suppression of recombination in inversion heterozygotes is "textbook" material and perhaps does not need a reference. Or, you could reference an empirical paper that demonstrates this point. Though I love the Kirkpatrick and Barton paper, it certainly is not the correct reference for this point.

      The Kirkpatrick reference was incorrectly included here. The correct reference was an empirical demonstration (Conte) that there were regions of suppressed recombination that have been observed in the location of the inversions. We have also moved this reference further up in the sentence to a more appropriate position

      (5) L173: how do you know this is an assembly error and not polymorphism?

      The text has been modified to address this point

      (6) L277(?): "currently growing in the lab" is probably unnecessary.

      The text has been modified to address this point

      (7) L298: "the inversion on 10 acts as an XY sex determiner": the inversion itself is not the sex determination gene; rather, it is linked. I think it would be more precise, here and throughout the paper, to say that these inversions likely harbor the sex determination locus (for example, the wording on lines 369-370 is misleading).

      We agree with the larger point that the inversion might not be causal for sex determination, however, it could still be causal through positional effects. We have modified the text to make it clear that it could also carry the causal locus (or loci).

      (8) Figure 6: overall, this figure is very helpful! However, it contains several problematic statements. In no case do you have evidence that these inversions are "favored by selection"; such statements should be deleted. Also, in point 3, you state that inversions 9, 11, and 20 are transferred to benthic lineages, and then that these inversions are involved in sex determination. But, your data suggests that it is chromosomes 9, 10, and 11 that are linked to sex determination.

      This figure is now Figure 1. We have remove these problematic statements.

      (9) L356-360: I would move the references that are currently at the end of the sentence to line 357 after the statement about the previous work on hybridization. Otherwise, it reads as if these previous papers demonstrated what you have demonstrated in your work.

      The text has been modified to address this point

      (10) Overall, the discussion focuses completely on adaptive explanations for your results, and I would like to see at least an acknowledgement that drift could also be involved unless you have additional data to support adaptive explanations.

      We have rewritten the text to account for the possibility of drift (line 404 and 405).
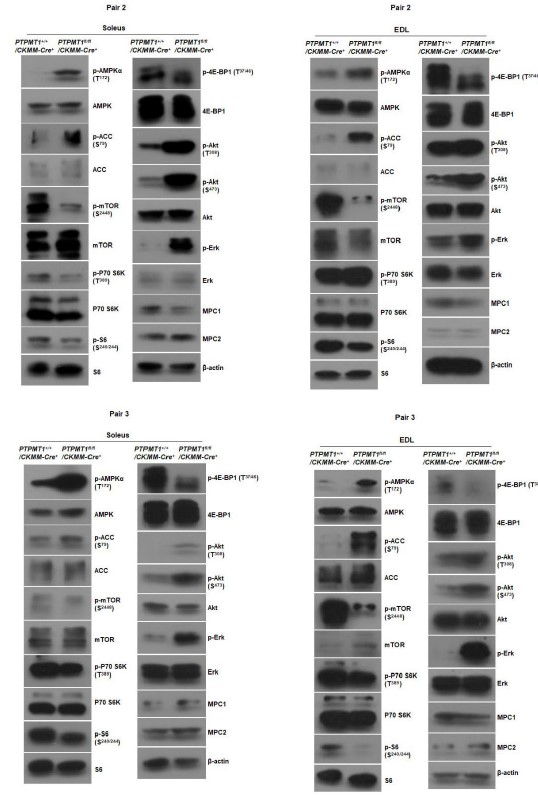
      Reviewer #3 (Recommendations for the authors):

      The paper utilizes heterogeneous datasets coming from different sources, and it is not always clear which specimens were used to generate structural information (bionano) or sequence information. A diagram summarizing the sequence data, methodologies, and research questions would be beneficial for the reader to navigate in this paper.

      Much of this information has been added to what is now Figure 1. All of this data is also found in Table S2.

      The authors performed genome alignments to analyze and homologize inversion, but this process is not clearly described. For the PCA, SNP information likely involves mapping onto a common reference genome. However, it is not clear how this was achieved given the different species and varying divergence times involved.

      We now include a link to the github that contains the commands that were run. Because the overall level of sequence divergence between cichlid species is quite low (2*10^-3 – Milansky et al), mapping different species onto a common reference is commonly performed in Lake Malawi cichlids.

      The introgression scenario is very intriguing but its role in local adaptation of the ecogroup types is not easy to understand. I understand this is still an outstanding question, but it is unclear how the directionality of introgressions was estimated. This can be substantiated using tree topology analysis, comparative estimates of sequence divergence, and accumulation of DNA insertions. The diagram does not clearly indicate which ones are polymorphic. In some cases, polymorphic inversions could result from the coexistence of native and introgressed haplotypes.

      We agree that this analysis would be interesting but is beyond the scope of this paper.

      The alternative model of introgression proposed in the cited preprint is interesting and should deserve a formal analysis here. The authors consider unclear what would drive "back" introgressions of non-inverted haplotypes, but this would depend on the selection regimes acting on the inversions themselves, which can include forms of balancing selection and a role for recessive lethals (heterozygote advantage). For instance, a standard haplotype could be favored if it shelters deleterious mutations carried by an inversion. Testing the introgression history over a wider range of branches and directions would provide further insights.

      We agree that this analysis would be interesting but is beyond the scope of this paper.

      The prose in the paper is occasionally muddled and somewhat unclear. Referring to chromosomes solely by their numbers (e.g.. "inversion on 11") complicates readability.

      This is the standard way to refer to chromosomes in cichlids and we believe while it complicates readability, any other method would be inconsistent with other papers. Changes to nomenclature might improve the readability of this paper, but would make it more difficult to compare results for these chromosomes from other papers with what we have found.

    1. eLife Assessment

      This study presents a useful characterisation of the topographical organisation of the human pulvinar, an associative thalamic subregion crucial for visual perception and attention. The evidence supporting the conclusions is solid given the multimodal validation and replication across datasets, although even higher-resolution imaging data would have strengthened the study. In their revised manuscript, the authors elaborated further on the motivation for their study and conducted several robustness checks. Nevertheless, there remains an opportunity for a more fully integrated interpretation of the findings. The work would be of interest to neuroscientists, neurologists, and neuropsychiatrists working on pulvinar functioning in health and disease.

    2. Reviewer #1 (Public review):

      Summary:

      The current work explored the link between the pulvinar intrinsic organisation and its functional and structural connectivity patterns of the cortex using different dimensional reduction techniques. Overall they find relationships between pulvinar-cortical organization and cortico-cortical organization, and little evidence for clustered organization. Moreover they investigate PET maps to understand how neurotransmitter/receptor distributions vary within the pulvinar and along its structural and functional connectivity axes.

      Strengths:

      (1) There is a replication dataset and different modalities are compared against each other to understand the structural and functional organisation of the pulvinar complex

      In their revision, the authors further detailed the motivation of their study and performed various robustness checks, answering my concerns. Nevertheless, further work is needed to fully understand the role of the pulvinar nuclei and the rest of the thalamic nuclei as well as the rest of the brain, including more diverse datasets and techniques.

    3. Reviewer #2 (Public review):

      Summary:

      The authors aimed to explore and better understand the complex topographical organization of the human pulvinar, a brain region crucial for various high-order functions such as perception and attention. They sought to move beyond traditional histological subdivisions by investigating continuous 'gradients' of cortical connections along the dorsoventral and mediolateral axes. Using advanced imaging techniques and a comprehensive PET atlas of neurotransmitter receptors, the study aimed to identify and characterize these gradients in terms of structural connections, functional coactivation, and molecular binding patterns. Ultimately, the authors targeted to provide a more nuanced understanding of pulvinar anatomy and its implications for brain function in both healthy and diseased states.

      Strengths:

      A key strength of this study lies in the authors' effort to comprehensively combine multimodal data, encompassing both functional and structural connectomics, alongside the analysis of major neurotransmitter distributions. This approach enabled a more nuanced understanding of the overarching organizational principles of the pulvinar nucleus within the broader context of whole-brain connectivity. By employing cortex-wide correlation analyses of multimodal embedding patterns derived from 'gradients,' which provide spatial maps reflecting the underlying connectomic and molecular similarities across voxels, the study offers a thorough characterization of the functional neuroanatomy of the pulvinar.

      Weaknesses:

      Despite its strengths, the current manuscript falls short in presenting the authors' unique perspectives on integrating the diverse biological principles derived from the various neuroimaging modalities. The findings are predominantly reported as correlations between different gradient maps, without providing the in-depth interpretations that would allow for a more comprehensive understanding of the pulvinar's role as a central hub in the brain's network.

    4. Author response:

      The following is the authors’ response to the original reviews

      Public Reviews:

      Reviewer #1 (Public review):

      Summary:

      The current work explored the link between the pulvinar intrinsic organisation and its functional and structural connectivity patterns of the cortex using different dimensional reduction techniques. Overall they find relationships between pulvinar-cortical organization and cortico-cortical organization, and little evidence for clustered organization. Moreover, they investigate PET maps to understand how neurotransmitter/receptor distributions vary within the pulvinar and along its structural and functional connectivity axes.

      Strengths:

      There is a replication dataset and different modalities are compared against each other to understand the structural and functional organisation of the pulvinar complex.

      Weaknesses:

      (1) What is the motivation of the study and how does this work extend previous assessments of the organization of the complete thalamus within the gradient framework?

      Thank you for raising this central question. As already mentioned in the main text, pulvinar is one of the largest and prototypical associative nuclei, yet its organizational principles in the human brain remain relatively unexplored. The substantial body of anatomical research conducted in primate species suggests the coexistence of multiple coexisting and overlapping corticotopic representations on the pulvinar complex.

      Existing connectivity-based parcellation studies of pulvinar organization often overlook these organizational principles, as the resulting parcellation may reflect a linear combination of single overlapping connectopies rather than accurately capturing their distinct and unique spatial arrangement.

      Investigations of thalamic connectivity have already revealed overarching organizational principles within the thalamus, which are partially reflected in its cytoarchitecture subdivision. These principles are associated with core and matrix thalamic neuronal subpopulation, and their distinct contributions to large-scale connectivity networks.

      Since gradient selection relies on the explained variance of the diffusion embeddings, and pulvinar-cortical connectivity likely accounts for only a limited portion of the variance in thalamocortical connectivity, we chose to focus specifically on the pulvinar nucleus. This approach was intended to ensure that the local connectivity principles of the pulvinar are not overshadowed by the broader connectotopical organization of the entire thalamus.

      This rationale aligns with findings in topographically organized regions of the cerebral cortex, such as M1, S1 or visual areas. In these regions, distinct principles of topographical organization are not readily apparent when analyzing whole-brain connectivity embedding but emerge when dimensionality reduction is applied to region-specific connectivity data.

      (2) Why is the current atlas chosen for the delineation of the pulvinar and individualized maps not considered? Given the size of the pulvinar, more validation of the correctness of the atlas may be helpful.

      To improve signal-to-noise ratio and in alignment with previous studies, we performed diffusion embedding on the group-level, averaged connectivity matrices rather than estimating gradients at the individual subject level.

      The decision to use a standard-space atlas for pulvinar delineation, rather than individualized parcellation, was driven by technical considerations: 1) functional MRI data were already transformed to MNI space; and 2) individualized parcellation of thalamic nuclei can result in varying pulvinar volumes across subjects, complicating the averaging of connectivity data. By using a standard-space atlas, we ensured that connectivity was consistently extracted from the same set of voxels across all subjects.

      We selected the AAL3 atlas (Rolls et al., 2020)over other existing thalamic atlases for practical reasons: the atlas incorporates an ex-vivo thalamic parcellation (Iglesias et al., 2018) with a specific delineation of pulvinar nuclei, which was necessary for subsequent analyses. In the revised version of the manuscript, to validate our findings, we replicated the pulvinar gradient using a different pulvinar delineation from a recent, thalamus-specific atlas (Su et al., 2019). Notably, the spatial distribution of pulvinar connectivity and coexpression gradients remained consistent, regardless of the choice of the thalamic atlas, underscoring the robustness of our results.

      (3) Overall the study feels a little incremental and a repetition of what others have done already in the thalamus. It would be good to know how focusing only on the pulvinar changes interpretation, for example by comparing thalamic and pulvinar gradients?

      The authors acknowledge the existing body of literature that has examined thalamic connectivity under the lens of the connectivity gradient framework. While these studies may provide valuable insights into the functional topography of the pulvinar complex -given its prominent role within the thalamus - we contend that a focused analysis of pulvinar connectivity offers a unique opportunity to uncover the specific organization principles of this nuclear complex. By isolating the pulvinar, we aimed to avoid the potential overshadowing of its local connectivity patterns by the broader connectotopical organization of the entire thalamus. However, as we believe that our findings are best interpreted within the broader context of general thalamic connectivity organization, we have included an additional paragraph in the Discussion section, which explores the similarities and differences between thalamic and pulvinar gradients, offering a more integrative perspective on our results.

      “In recent years, different works have explored the spatial arrangement of thalamic connectivity within a connectivity gradient framework. Diffusion embedding of thalamocortical functional connectivity has revealed a principal, medio-lateral gradient that was found correlated to thalamic structural subdivisions, and a secondary, antero-posterior gradient associated with thalamic functional subfields, and showing progression from unimodal sensorimotor cortical networks to multimodal attention and associative networks. Interestingly, the principal thalamic gradient shows a medio-lateral arrangement on the pulvinar axis while the secondary gradients correspond more to a ventral-dorsal pulvinar axis (Yang et al. 2020). In particular, further independent investigations have suggested that the progressing pattern of thalamic connectivity from unimodal to transmodal cortices is strongly associated to the local density of core and matrix cell types, thus establishing a link between molecular properties and functional connectivity dynamics (Müller et al. 2020; Huang et al. 2024). Our findings complement and expand the existing literature by revealing a similar arrangement of cortical connectivity patterns on the pulvinar complex, and elucidating its relationship to in-vivo estimates of molecular markers of neurotransmission. We found that the gradient associated to unimodal-transmodal cortical connectivity accounted for the highest percentage of variance of variance in cortico-pulvinar connectivity, in line with its well-acknowledged role of associative nucleus. It is noteworthy that, in analyses of thalamocortical gradients, the pulvinar complex is situated towards the “sensorimotor” extreme of the unimodal-to-transmodal thalamic gradient (Yang et al., 2020). This likely reflects its prominent connectivity to visual and sensory areas compared to other thalamic nuclei. Nevertheless, the extensive and intricate association of pulvinar with multiple cortical networks emerges is strongly evident in various functional connectivity investigations (Basile et al., 2021; Kumar et al., 2017, 2022). By isolating pulvinar-cortical from broader thalamocortical connectivity, our analysis was able to provide additional insights into the spatial organization of its connectivity with different cortical networks, highlighting the pulvinar's remarkable functional diversity and complexity.”

      (4) Could it be that the gradient patterns stem from lacking anatomical and functional resolutions (or low SNR) therefore generating no sharp boundaries?

      The gradient organization described in our results is aligns with anatomical evidence on non-human primates (Shipp, 2003), and with existing neuroimaging studies in humans, which report limited correspondence between connectivity-based hard clustering solutions and histological delineation of pulvinar nuclei. However, we recognize the critical importance of assessing the impact of SNR on connectivity measures derived from functional and structural MRI. In the revised manuscript, we have included an additional analysis to investigate the potential impact of local noise on gradient reconstruction. This analysis involved sampling voxel-wise SNR estimates in the pulvinar from both BOLD and diffusion-weighted MRI data, averaging these estimates to generate group-level, modality-specific SNR maps. We then assessed spatial correlations between these maps and the gradient embeddings using the same methodological framework employed throughout the study. Our findings indicate that functional connectivity gradients are weakly, but significantly correlated to SNR, with the strongest correlation observed for the third gradient (left hemisphere G<sub>FC</sub>1 r= -0.30, SA-corrected p < 0.001, G<sub>FC</sub>2 r= 0.22, SA-corrected p = 0.05, G<sub>FC</sub>3 r= 0.55, SA-corrected p < 0.001; right hemisphere G<sub>FC</sub>1 r= -0.41, SA-corrected p < 0.001, G<sub>FC</sub>2 r= 0.22, SA-corrected p = 0.008, G<sub>FC</sub>3 r= 0.52, SA-corrected p = 0.017). In contrast, structural connectivity gradients showed no significant correlation with SNR (left hemisphere G<sub>SC</sub>1 r= 0.06, SA-corrected p = 0.82, G<sub>SC</sub>2 r= -0.33, SA-corrected p = 0.01; right hemisphere G<sub>SC</sub>1 r= 0.40, SA-corrected p = 0.28, G<sub>SC</sub>2 r=-0.19, SA-corrected p = 0.31).

      Reviewer #1 (Recommendations for the authors):

      (1) Please add more literature on thalamus gradients and interpret this with care.

      Thank you for the suggestion. We have added the following paragraph in the Discussion section:

      “In recent years, different works have explored the spatial arrangement of thalamic connectivity within a connectivity gradient framework. Diffusion embedding of thalamocortical functional connectivity has revealed a principal, medio-lateral gradient that was found correlated to thalamic structural subdivisions, and a secondary, antero-posterior gradient associated with thalamic functional subfields, and showing progression from unimodal sensorimotor cortical networks to multimodal attention and associative networks. Interestingly, the principal thalamic gradient shows a medio-lateral arrangement on the pulvinar axis while the secondary gradients correspond more to a ventral-dorsal pulvinar axis (Yang et al. 2020). In particular, further independent investigations have suggested that the progressing pattern of thalamic connectivity from unimodal to transmodal cortices is strongly associated to the local density of core and matrix cell types, thus establishing a link between molecular properties and functional connectivity dynamics (Müller et al. 2020; Huang et al. 2024). Our findings complement and expand the existing literature by revealing a similar arrangement of cortical connectivity patterns on the pulvinar complex, and elucidating its relationship to in-vivo estimates of molecular markers of neurotransmission. We found that the gradient associated to unimodal-transmodal cortical connectivity accounted for the highest percentage of variance of variance in cortico-pulvinar connectivity, in line with its well-acknowledged role of associative nucleus. It is noteworthy that, in analyses of thalamocortical gradients, the pulvinar complex is situated towards the “sensorimotor” extreme of the unimodal-to-transmodal thalamic gradient (Yang et al., 2020). This likely reflects its prominent connectivity to visual and sensory areas compared to other thalamic nuclei. Nevertheless, the extensive and intricate association of pulvinar with multiple cortical networks emerges is strongly evident in various functional connectivity investigations (Basile et al., 2021; Kumar et al., 2017, 2022). By isolating pulvinar-cortical from broader thalamocortical connectivity, our analysis was able to provide additional insights into the spatial organization of its connectivity with different cortical networks, highlighting the pulvinar's remarkable functional diversity and complexity.

      As regards structural connectivity, existing accounts describe a medio-lateral organization of thalamocortical connections, corresponding to an antero-posterior gradient on the cortical mantle. This gradient organization appears to be anchored to genetic markers of different cell types (Oldham and Ball 2023). In line with their findings, we describe a principal axis of structural connectivity in the pulvinar complex that is arranged on the mediolateral axis, and we enforce the notion of a deep relationship between structural connections and molecular expression of neurotransmission markers. On the other hand, the patterns of connectivity with the cerebral cortex do not correspond to a clear antero-posterior axis on the cerebral cortex, probably showing the predominance of local connectivity over the global thalamic structural topography. Further investigations are warranted to ascertain whether the structural gradients of the pulvinar complex may be in continuity with this general cortico-thalamic connectivity gradient.”

      (2) Please state the motivation of the work more clearly and what makes it different from related literature.

      Thank you for pointing us to this lack of clarity. We have added the following paragraph in the Introduction section:

      “In particular, investigations of thalamic connectivity within the gradient framework have uncovered general organizational principles within the thalamus, which are partially reflected in thalamic cytoarchitecture subdivisions. These principles have been linked to core and matrix thalamic neuronal subpopulation, and to their differential contribution to large-scale connectivity networks (Müller et al., 2020; Yang et al., 2020). However, given the remarkable functional complexity and diversity of the pulvinar complex, these global spatial organization patterns likely capture only part of its functional topography. With this in mind, isolating pulvinar connectivity from the remaining thalamocortical connectome would ensure that local organizational principles are not obscured by the global connectotopic structure of the entire thalamus.”

      (3) Why did the authors opt for a whole brain labelling atlas, would a thalamus-specific atlas not be more suitable?

      Despite being a large-scale whole brain atlas, the labeling atlas of choice (AAL3) incorporates a thalamus-specific parcellation from previous work (Iglesias et al., 2018), derived from ex-vivo data and including subdivision of the pulvinar complex into anterior, inferior, lateral and medial nuclei. In the revised version of the manuscript, to validate our findings, we replicated the pulvinar gradient using a different pulvinar delineation from a recent, thalamus-specific atlas (Su et al., 2019). We show these results in Supplementary Figure 1. Notably, the spatial distribution of pulvinar connectivity and coexpression gradients remained consistent, regardless of the choice of the thalamic atlas, underscoring the robustness of our results.

      (4) How did the authors account for the potential low sensitivity of subcortical signals in the PET data?

      We acknowledge the inherent limitations in spatial sensitivity that are a common drawback of PET imaging. However, the PET data employed in the present study were derived from a high-quality dataset collected across multiple studies, predominantly acquired using high resolution scanners (Hansen et al., 2022; see supplementary material at https://static-content.springer.com/esm/art%3A10.1038%2Fs41593-022-01186-3/MediaObjects/41593_2022_1186_MOESM3_ESM.xlsx for technical details). Furthermore, the reliability of neurotransmission markers measurements at the subcortical level has been validated against genetic transcription markers (Hansen, Markello, et al., 2022; Hansen, Shafiei, et al., 2022), ensuring robust and biologically meaningful results.

      (5) What about SNR of the metrics within the pulvinar?

      The referee raises a crucial and complex point, prompting us to conduct additional analyses. We recognize the critical importance of assessing the impact of SNR on connectivity measures derived from functional and structural MRI. In the revised manuscript, we have included an additional analysis to investigate the potential impact of local noise on gradient reconstruction. Therefore, we have incorporated the following text into the manuscript:

      Results (5. Reliability and Reproducibility):

      “To assess the influence of local noise on functional and structural connectivity gradients, we calculated the spatial correlation between gradient values and averaged voxel-wise estimates of signal-to-noise ratio (SNR) from functional and structural MRI data, respectively. We found that functional connectivity gradients are weakly, but significantly correlated with the SNR, with the strongest correlation observed for the third gradient (left hemisphere G<sub>FC</sub>1 r= -0.30, SA-corrected p < 0.001, G<sub>FC</sub>2 r= 0.22, SA-corrected p = 0.05, G<sub>FC</sub>3 r= 0.55, SA-corrected p < 0.001; right hemisphere G<sub>FC</sub>1 r= -0.41, SA-corrected p < 0.001, G<sub>FC</sub>2 r= 0.22, SA-corrected p = 0.008, G<sub>FC</sub>3 r= 0.52, SA-corrected p = 0.017). In contrast, structural connectivity gradients were not significantly associated with SNR (left hemisphere G<sub>SC</sub>1 r= 0.06, SA-corrected p = 0.82, G<sub>SC</sub>2 r= -0.33, SA-corrected p = 0.01; right hemisphere G<sub>SC</sub>1 r= 0.40, SA-corrected p = 0.28, G<sub>SC</sub>2 r=-0.19, SA-corrected p = 0.31) (Supplementary Figure 5).”

      Methods (4. Reliability and reproducibility assessment):

      “To evaluate the possible influence of SNR on connectivity-derived diffusion embeddings, we have performed a voxel-wise,

      modality-specific, SNR assessment to investigate correlation between spatial distribution of noise and diffusion embeddings. For each subject, we separately calculated voxel-wise SNR maps for the left and right pulvinar, using both functional (BOLD) volumes and DWI data. For BOLD volumes, we employed the widely accepted definition of temporal signal to noise (tSNR) (Murphy et al., 2006):

      where T<sub>mean</sub> and T<sub>std</sub> are, respectively, the mean and the standard deviation of each voxel’s signal across the time series.

      For the DWI data, we applied a similar approach (Cai et al., 2021) that allows estimation of SNR from multiple b=0 diffusion weighted volumes:

      where S is the voxel’s signal intensity, and the mean (S<sub>mean</sub>) and standard deviation (S<sub>std</sub>) were computed across all the b0-weighted volumes (18 for HCP dataset; 7 for LEMON dataset). Individual pulvinar SNR maps were then averaged to generate group-level estimates of SNR spatial distribution. The resulting, modality-specific average SNR maps were correlated with the diffusion gradients derived from the corresponding modality, following the same approach described in the previous section (Pearson’s correlation; p-values corrected using spatial null models for spatial autocorrelation, and Benjamini-Hochberg correction for FWE).”

      (6) The numbers of the screeplot / numbers in figures are quite small and not so easy to read.

      Thank you for highlighting this point. We have fixed this issue in the revised version of the Figures.

      (7) How do you know the pulvinar mask is not also picking up on the cortical spinal tract?

      To ensure that pulvinar masks did not pick up streamlines from the corticospinal tracts, we performed a thorough visual inspection of the tractograms that were employed for structural connectivity estimation. For each subject-specific tractogram, we randomly subsampled 10000 streamlines after transformation into MNI standard space and summed up these results to generate a group-level tractogram in standard space. The resulting track-density images (Author response image 1) demonstrate only minimal involvement of descending/ascending tracts from/to the brainstem and spinal cord, confirming the specificity of the pulvinar masks.

      Author response image 1.

      Group-level structural connectivity of the pulvinar complex. Track-density images have been normalized and overlaid on the MNI152 standard template.

      (8) There is no mention of the within pulvinar gradients that then are correlated with PET patterns or across gradients are tested to spatial autocorrelation? I believe it is only mentioned for the cortex.

      Thanks for providing us with the opportunity to clarify this important aspect, which is mentioned in the Methods section (3. Gradient analysis and statistics):

      “To account for the spatial autocorrelation (SA) properties of gradient maps, for all the correlations described, statistical significance was assessed using the permutational approach described in Burt et al. (2020). Briefly, this method takes as input geometric distance matrices for SA estimation and involves the generation of a given number of SA-preserving permuted surrogate maps, which are then employed as nulls to estimate a permutational null distribution of the test statistic (Burt et al. 2020). Pairwise Euclidean distances between left or right pulvinar voxel coordinates were employed for pulvinar null models, while for cortical parcellated connectivity data Euclidean distances were estimated between centroids of each cortical ROI. In both cases, 1000 surrogates were generated to estimate the null distribution. Statistical tests were controlled for false discovery rate (FDR) using Benjamini and Hochberg’s correction.”

      However, to enhance readability, we have highlighted this concept in the Results section (3. The unimodal-to-transmodal gradient (G<sub>FC</sub>1) aligns with receptor expression on the dorso-ventral pulvinar axis):

      “To take into account the effects of spatial autocorrelation, we corrected the resulting p-values using a method based on SA-preserving spatial null models (Burt et al. 2020)”.

      (9) I don't fully understand why the mappings are so patchy of the structural connectivity gradient? Maybe some normalisation went wrong? Other papers on thalamic gradients show smoother patterns.

      We thank the Reviewer for the observation. After thoroughly reviewing the related codes, we found no normalization errors. However, we identified a visualization issue, which has been addressed in the revised version. Specifically, the structural gradient representations showed in the figures were based on the averaged values of left and right pulvinar gradients both of which include structural connectivity to either the ipsilateral or contralateral cerebral cortex. Since ipsilateral connectivity is more prominently represented than contralateral connectivity, this led to asymmetric gradient patterns between ipsilateral and contralateral cortical gradients, resulting in a patchy representation when gradients were averaged between left and right pulvinar. To resolve this, we adjusted the visualization by flipping the right pulvinar gradient representations along the x axis, aligning all the ipsilateral cortical connectivity on the left side and all the contralateral connectivity on the right. This adjustment produced smoother, more readable, and interpretable visualizations. Additionally, it allowed the asymmetry between ipsilateral and contralateral connections to be more clearly appreciated.

      (10) The final statement of the abstract is misleading as we at this point don't know how making spatial pattern maps in the pulvinar may help understand the role of the pulvinar in health and disease.

      We appreciate the Reviewer’s suggestion and have updated the expression accordingly:

      “Our findings represent a significant step forward in advancing the understanding of pulvinar anatomy and function, offering an exploratory framework to investigate the role of this structure in both health and disease.”

      Reviewer #2 (Public review):

      Summary:

      The authors aimed to explore and better understand the complex topographical organization of the human pulvinar, a brain region crucial for various high-order functions such as perception and attention. They sought to move beyond traditional histological subdivisions by investigating continuous 'gradients' of cortical connections along the dorsoventral and mediolateral axes. Using advanced imaging techniques and a comprehensive PET atlas of neurotransmitter receptors, the study aimed to identify and characterize these gradients in terms of structural connections, functional coactivation, and molecular binding patterns. Ultimately, the authors targeted to provide a more nuanced understanding of pulvinar anatomy and its implications for brain function in both healthy and diseased states.

      Strengths:

      A key strength of this study lies in the authors' effort to comprehensively combine multimodal data, encompassing both functional and structural connectomics, alongside the analysis of major neurotransmitter distributions. This approach enabled a more nuanced understanding of the overarching organizational principles of the pulvinar nucleus within the broader context of whole-brain connectivity. By employing cortex-wide correlation analyses of multimodal embedding patterns derived from 'gradients,' which provide spatial maps reflecting the underlying connectomic and molecular similarities across voxels, the study offers a thorough characterization of the functional neuroanatomy of the pulvinar.

      Weaknesses:

      Despite its strengths, the current manuscript falls short in presenting the authors' unique perspectives on integrating the diverse biological principles derived from the various neuroimaging modalities. The findings are predominantly reported as correlations between different gradient maps, without providing the in-depth interpretations that would allow for a more comprehensive understanding of the pulvinar's role as a central hub in the brain's network. Another limitation of the study is the lack of clarity regarding the application of pulvinar and its subnuclei segmentation maps to individual brains prior to BOLD signal extraction and gradient reconstruction. This omission raises concerns about the precision and reproducibility of the findings, leaving their robustness less transparently evaluable.

      We thank the Reviewer for the valuable comments. While commonalities and discrepancies between structural and functional connectivity have been extensively explored in the literature, the relationship between functional connectivity and modulatory neurotransmission remains poorly understood. Specifically, while the role of thalamic modulatory neurotransmission has been thoroughly investigated in experimental animal models from an electrophysiological perspective, it remains relatively underexplored in the human brain. In our study, we identified significant associations between the spatial distribution of serotonergic, noradrenergic, dopaminergic and mu-opioid systems and functional pulvinar-cortical connectivity to specific functional networks. Evidence from pharmacological challenge studies using resting-state fMRI suggests that these neurotransmission systems may modulate network-specific thalamocortical connectivity directly or influence neural gain in cortico-cortical connectivity, a process partially dependent on thalamocortical connections to associative thalamic nuclei. However, the limitations of spatial and receptor specificity inherent to this approach, coupled with the predominantly correlational nature of our study design, prevented us from drawing more definitive conclusions on the biological relationship between neurotransmitter expression and functional connectivity. As regards the lack of clarity concerning signal extraction, we have now clarified that all the relevant steps of time series extraction were performed in standard space, without any further registration to individual subjects.

      Reviewer #2 (Recommendations for the authors):

      In line with the weaknesses that I raised above, my recommendation to authors are two-fold:

      (1) Please provide readers with a more holistic viewpoint to better digest all the correlation analyses. For instance, in p18, the summary says:

      "G<sub>FC</sub>1, GRC1, and G<sub>SC</sub>2 substantially delineate multiscale differences between the ventral and dorsal aspects of the pulvinar. Moving along the ventral-dorsal axis of the pulvinar complex, more ventral regions showed higher functional connectivity to unimodal sensory processing networks, higher levels of 5HTT and NAT expression, and preferentially higher structural connectivity to modality-independent or low-level sensory processing cortices."

      We already knew somehow the existence of the dorsoventral axis in the pulvinar, as the authors already specified in the introduction. Beyond this simple report on phenomenological observation, one may provide a more integrated discussion to pinpoint what commonality or discrepancy the GFC, GRC, and GSC map show and potential common principles explaining their biological relationship (e.g., the 5HTT and NAT's high expression and functional connectivity). Such digested perspectives will grant the study unique insights into the functional system of the pulvinar.

      We have expanded on this topic in the Discussion section (Neurochemical correlates of pulvinar-cortical topographical organization) as follows:

      “Indeed, while commonalities and discrepancies between structural and functional connectivity have been extensively investigated, the relationship between functional connectivity and modulatory neurotransmission remains poorly understood. Our findings reveal stronger associations between pulvinar-cortical connectivity to specific functional networks and the spatial distribution of markers of serotonergic, noradrenergic, dopaminergic and opioid systems. Pharmacological challenge studies using resting-state functional MRI suggest that each of these neurotransmission systems may either directly modulate thalamocortical connectivity or influence neuronal gain in cortico-cortical functional connectivity, which is known to depend, in part, on cortical connections to associative thalamic nuclei, including the pulvinar.”

      (2) Specify the details if there was a QC procedure to check the signal extraction from the pulvinar subnuclei by applying the segmentation atlas at each individual.

      Preprocessed BOLD volumes were available in standard-space, and time series were extracted for each voxel within a standard-space mask of the pulvinar complex. All volumes underwent visual inspection to ensure the accuracy of the registration process. Regarding the pulvinar subnuclei, these structures were not segmented at the individual level.

      Reviewer #3 (Public review):

      Summary of the Study:

      The authors investigate the organization of the human pulvinar by analyzing DWI, fMRI, and PET data. The authors explore the hypothesis of the "replication principle" in the pulvinar.

      Strengths and Weaknesses of the Methods and Results:

      The study effectively integrates diverse imaging modalities to provide a view of the pulvinar's organization. The use of analysis techniques, such as diffusion embedding-driven gradients combined with detailed interpretations of the pulvinar, is a strength.

      Even though the study uses the best publicly available resolution possible with current MR-technology, the pulvinar is densely packed with many cell bodies, requiring even higher spatial resolution. In addition, the model order selection of gradients may vary with the acquired data quality. Therefore, the pulvinar's intricate organization needs further exploration with even higher spatial resolution to capture gradients closer to the biological organization of the pulvinar.

      Appraisal of the Study's Aims and Conclusions:

      The authors delineate the gradient organization of the pulvinar. The study provides a basis for understanding the pulvinar's role in mediating brain network communication.

      Impact and Utility of the Work:

      This work contributes to the field by offering insights into pulvinar organization.

      We thank the Reviewer for their positive assessment and constructive feedback. The Authors agree with the Reviewer that the spatial resolution of currently available in-vivo imaging methods is limited, and that gradient representation would indeed benefit from higher resolution data. However, we also note that the resolution of structural and functional volumes used in our study is consistent with existing literature on pulvinar connectivity. Additionally, the PET data employed in our work include multi-centric studies collected worldwide from healthy populations, and are primarily acquired using high-resolution scanners that allow spatial resolution up to 2 mm<sup>2</sup>. Notwithstanding, further investigations employing finer resolution imaging techniques, such as ultra-high field fMRI, may provide more detailed insights into pulvinar topographical organization at a finer scale.

      Reviewer #3 (Recommendations for the authors):

      (1) The HCP data contains genetically related datasets. Please mention whether the data-selection criteria for the selected 210 healthy subjects followed the genetically unrelated criteria.

      The HCP sample employed in this study consists of an initial cohort of 100 unrelated subjects, as provided in the HCP database, along with an additional random sample of 110 subjects. Subjects were selected without following a genetic criterion, as the family structure of the HCP dataset was part of a restricted access subset that we did not have access to at the time of processing. Subsequently, we obtained access to this information and determined that 178 out of 210 subjects (85%) are genetically unrelated. Of the remaining, genetically related subjects, 22 (~10% of the total sample) were included with another subject from the same family group (11 pairs); 6 (3%) were included with two other family members (2 triplets) and 4 (2%) were all parts of the same family group. This information has been included in the Methods section for clarity.
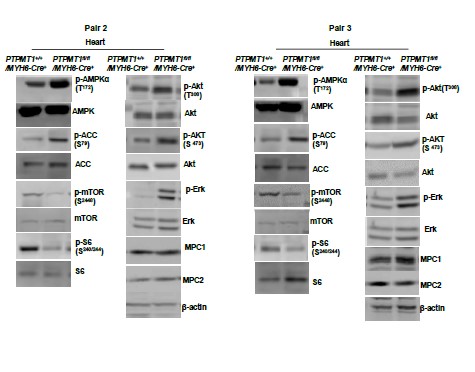
      (2) The study uses HCP data with an fMRI resolution of 2mm isotropic and diffusion MRI with 1.25mm. Additionally, the LEMON dataset includes 1.7mm isotropic DWI data and fMRI with 2.3mm isotropic resolution. Furthermore, the available PET data from the Hansen et al. 2022b study has a rather coarser spatial resolution. Therefore, it may be important to mention in the discussion that the pulvinar is densely packed with cell bodies and that their gradient organization might be better reflected with even higher spatial resolution or improved measurement techniques used in the study.

      We have revised the conclusive section of the Discussion into a paragraph title “Future perspectives and limitations”, and added the following text:

      “One notable limitation of this study lies in the relatively small size of the pulvinar complex compared to other larger cortical or subcortical structures. The high cellular density of the pulvinar poses a challenge for the relatively coarse resolution of currently available imaging techniques. Although the generally high quality of both the main and validation datasets, including rs-fMRI data (Uǧurbil et al. 2013; Babayan et al. 2019), align with current standards for imaging investigations of pulvinar connectivity, higher-resolution imaging approaches may offer more granular insights. Advanced techniques, such as ultra-high-field fMRI, hold promise for uncovering the fine-scale topographical organization of the pulvinar complex.”

      (3) The functional multiplicity of the Pulvinar nuclei among other thalamus nuclei is also illustrated in https://doi.org/10.1038/s42003-022-04126-w

      We thank the Reviewer for suggesting this important reference. We have added the following text in the Discussion section:

      “It is noteworthy that, in analyses of thalamocortical gradients, the pulvinar complex is situated towards the “sensorimotor” extreme of the unimodal-to-transmodal thalamic gradient (Yang et al., 2020). This likely reflects its prominent connectivity to visual and sensory areas compared to other thalamic nuclei. Nevertheless, the extensive and intricate association of pulvinar with multiple cortical networks emerges is strongly evident in various functional connectivity investigations (Basile et al., 2021; Kumar et al., 2017, 2022). By isolating pulvinar-cortical from broader thalamocortical connectivity, our analysis was able to provide additional insights into the spatial organization of its connectivity with different cortical networks, highlighting the pulvinar's remarkable functional diversity and complexity.”

      (4) In addition to DWI/DSI and PET, the study also uses fMRI, which allows for functional interaction in time. It may be worth reflecting in the discussion that the observed gradient organization of the pulvinar could have detailed aspects in the temporal domain, which might not be fully captured in the time-averaged embeddings.

      We thank the Reviewer for their insightful observation. The authors recognize that the exploration of brain temporal dynamics is a compelling area of research due to its extensive correlation with multiple hierarchical aspects of brain information processing. Examining the functional organization of the pulvinar complex lies beyond the scope of the present work and will be subject of further investigation. On the other hand, it is possible that certain aspects of the spatial organization of pulvinar connectivity may be influenced by temporal dynamics of cortico-thalamic information processing. Intrinsic timescales have been consistently showed to progressively increase from unimodal to multimodal associative cortical regions. Furthermore, cortico-thalamic connectivity in matrix-rich regions has been correlated with cortical time scales.

      To address this point, we have added the following lines to the Discussion section:

      “In this context, it could be hypothesized that the observed gradient organization of the pulvinar may also exhibit specific patterns in the temporal domain. Indeed, multiple investigations have linked the temporal dynamics of cortical regions to different aspects of information processing (Rossi-Pool et al., 2021; Soltani et al., 2021). Notably, intrinsic neural timescales of functional activity have been associated with the functional specialization and gradient organization of the cerebral cortex (Golesorkhi et al., 2021), with shorter timescales in unimodal sensory regions and longer ones in transmodal networks (Ito et al., 2020; Murray et al., 2014). Moreover, thalamocortical connectivity has been showed to correlate with these patterns of intrinsic time scale (Müller et al., 2020). In addition, modulatory neurotransmitters such as serotonin and dopamine have been demonstrated to play a significant role in modulating functional cortical dynamics across different timescales (Hansen, Shafiei, et al., 2022; Luppi et al., 2023). Exploring how the spatial organization of the pulvinar relates to temporal dynamics and timescale modulation could provide valuable insights and represents a promising avenue for future investigations.”

      (5) The K-means clustering (Supplementary Figure 1) used has limitations, particularly with respect to the structure of the data. Another aspect is the reproducibility of the model-order selection. Did the reliability and reproducibility assessment produce a similar number of clusters with the LEMON data as with the HCP data?

      We acknowledge the limitations of k-means clustering, particularly regarding the stability and reproducibility of the model order. To address the concerns, we iteratively ran the clustering algorithm 50 times on bootstrap resamples to enhance the stability of the silhouette score estimates. In addition, we have now replicated the analysis on the secondary dataset, as suggested by the Reviewer (Author response image 2). The Silhouette plots show similar number of clusters between the two different datasets for functional connectivity gradients, with minor differences observed in the results for structural connectivity gradients and multimodal gradient clustering. Notably, we did not find high a high degree of similarity between the results of gradient clustering and histologically defined nuclei, further underscoring the distinct organizational patterns identified through our analysis.

      This reinforces the relevance of using gradient-based approaches to reveal insights into the functional and structural organization of the pulvinar complex that may not align strictly with discrete, histologically defined subdivisions.

      Author response image 2.

      K-means clustering of pulvinar gradients on the secondary dataset (LEMON) and their correspondence with histological pulvinar nuclei. Panels on the left show the silhouette plots for left and right pulvinar clustering solutions; error bars are standard error calculated across 50 resamples. Panels on the right show matrix plots of Dice similarity coefficients for pulvinar clusters against histological nuclei (AAL3 atlas). INF: inferior; ANT: anterior; LAT: lateral; MED: medial.

      (6) The pulvinar correlates of the unimodal-transmodal cortical gradient (Figure 4) show an association with almost the entire brain (Figure 4C, violin plot). It would be interesting to back this association with known anatomical connectivity studies in animals that show connections to these network areas. To my limited knowledge, I am not aware of pulvinar tracer studies showing such extensive connectivity across the entire cortex.

      As our structural connectivity estimates are based on tractography, they are subject to the known limitation of potentially overestimating anatomical connectivity. A technical clarification is warranted: since structural connectivity is grouped by networks, it is strongly influenced by connections to specific cortical regions within each network. This explains the uneven and asymmetric distribution of structural gradient-weighted connectivity observed in our results and does not imply widespread connectivity across the entire cortex.

      Nonetheless, structural connectivity of the pulvinar to cortical regions in primates encompasses a remarkably broad array of cortical areas, including predominantly occipital (Adams et al., 2000; Benevento, 1976; Casanova et al., 1989), temporal (Berman & Wurtz, 2010; Gattass et al., 2018; Homman-Ludiye et al., 2020) and parietal cortices (Asanuma et al., 1985; Baleydier & Morel, 1992). Additionally, to a more limited extent, connections to the cingulate gyrus, and portions of the lateral prefrontal cortex have also been documented (Baleydier & Mauguiere, 1985; Baleydier & Mauguire, 1987). These connectivity patterns are in line with prior accounts of structural connectivity of the human pulvinar (Arcaro et al., 2015; Basile et al., 2021; Leh et al., 2008; Tamietto et al., 2012), and with the patterns identified in our work (Author response image 1). Such findings provide further validation of the structural connectivity profiles explored in the present study.

      References

      Adams, M. M., Hof, P. R., Gattass, R., Webster, M. J., & Ungerleider, L. G. (2000). Visual cortical projections and chemoarchitecture of macaque monkey pulvinar. The Journal of Comparative Neurology, 419(3), 377–393. https://doi.org/10.1002/(SICI)1096-9861(20000410)419:3<377::AID-CNE9>3.0.CO;2-E

      Arcaro, M. J., Pinsk, M. A., & Kastner, S. (2015). The anatomical and functional organization of the human visual pulvinar. Journal of Neuroscience. https://doi.org/10.1523/JNEUROSCI.1575-14.2015

      Asanuma, C., Andersen, R. A., & Cowan, W. M. (1985). The thalamic relations of the caudal inferior parietal lobule and the lateral prefrontal cortex in monkeys: Divergent cortical projections from cell clusters in the medial pulvinar nucleus. Journal of Comparative Neurology, 241(3), 357–381. https://doi.org/10.1002/cne.902410309

      Baleydier, C., & Mauguiere, F. (1985). Anatomical evidence for medial pulvinar connections with the posterior cingulate cortex, the retrosplenial area, and the posterior parahippocampal gyrus in monkeys. Journal of Comparative Neurology. https://doi.org/10.1002/cne.902320207

      Baleydier, C., & Mauguiere, F. (1987). Network organization of the connectivity between parietal area 7, posterior cingulate cortex and medial pulvinar nucleus: A double fluorescent tracer study in monkey. Experimental Brain Research, 66(2). https://doi.org/10.1007/BF00243312

      Baleydier, C., & Morel, A. (1992). Segregated thalamocortical pathways to inferior parietal and inferotemporal cortex in macaque monkey. Visual Neuroscience, 8(5), 391–405. https://doi.org/10.1017/S0952523800004922

      Basile, G. A., Bertino, S., Bramanti, A., Anastasi, G. P., Milardi, D., & Cacciola, A. (2021). In Vivo Super-Resolution Track-Density Imaging for Thalamic Nuclei Identification. Cerebral Cortex. https://doi.org/10.1093/cercor/bhab184
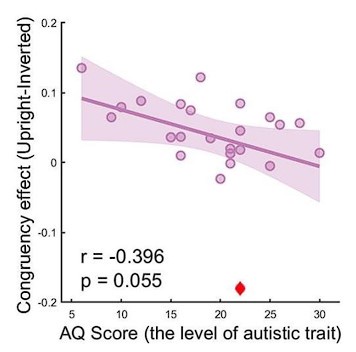
      Benevento. (1976). The Cortical Projections of the Inferior Pulvinar and Adjacent Lateral Pulvinar in the Rhesus Monkey ( Macaca. October, 108, 1–24.

      Berman, R. A., & Wurtz, R. H. (2010). Functional Identification of a Pulvinar Path from Superior Colliculus to Cortical Area MT. The Journal of Neuroscience, 30(18), 6342–6354. https://doi.org/10.1523/JNEUROSCI.6176-09.2010

      Cai, L. Y., Yang, Q., Hansen, C. B., Nath, V., Ramadass, K., Johnson, G. W., Conrad, B. N., Boyd, B. D., Begnoche, J. P., Beason-Held, L. L., Shafer, A. T., Resnick, S. M., Taylor, W. D., Price, G. R., Morgan, V. L., Rogers, B. P., Schilling, K. G., & Landman, B. A. (2021). PreQual: An automated pipeline for integrated preprocessing and quality assurance of diffusion weighted MRI images. Magnetic Resonance in Medicine, 86(1), 456. https://doi.org/10.1002/mrm.28678

      Casanova, C., Freeman, R. D., & Nordmann, J. P. (1989). Monocular and binocular response properties of cells in the striate-recipient zone of the cat’s lateral posterior-pulvinar complex. Journal of Neurophysiology. https://doi.org/10.1152/jn.1989.62.2.544

      Gattass, R., Soares, J. G. M., & Lima, B. (2018). Comparative Pulvinar Organization Across Different Primate Species (pp. 37–37). https://doi.org/10.1007/978-3-319-70046-5_8

      Golesorkhi, M., Gomez-Pilar, J., Tumati, S., Fraser, M., & Northoff, G. (2021). Temporal hierarchy of intrinsic neural timescales converges with spatial core-periphery organization. Communications Biology, 4(1), 277. https://doi.org/10.1038/s42003-021-01785-z

      Hansen, J. Y., Markello, R. D., Tuominen, L., Nørgaard, M., Kuzmin, E., Palomero-Gallagher, N., Dagher, A., & Misic, B. (2022). Correspondence between gene expression and neurotransmitter receptor and transporter density in the human brain. NeuroImage, 264, 119671. https://doi.org/10.1016/j.neuroimage.2022.119671

      Hansen, J. Y., Shafiei, G., Markello, R. D., Smart, K., Cox, S. M. L., Nørgaard, M., Beliveau, V., Wu, Y., Gallezot, J.-D., Aumont, É., Servaes, S., Scala, S. G., DuBois, J. M., Wainstein, G., Bezgin, G., Funck, T., Schmitz, T. W., Spreng, R. N., Galovic, M., … Misic, B. (2022). Mapping neurotransmitter systems to the structural and functional organization of the human neocortex. Nature Neuroscience, 25(11), 1569–1581. https://doi.org/10.1038/s41593-022-01186-3

      Homman-Ludiye, J., Mundinano, I. C., Kwan, W. C., & Bourne, J. A. (2020). Extensive Connectivity Between the Medial Pulvinar and the Cortex Revealed in the Marmoset Monkey. Cerebral Cortex, 30(3), 1797–1812. https://doi.org/10.1093/cercor/bhz203

      Iglesias, J. E., Insausti, R., Lerma-Usabiaga, G., Bocchetta, M., Van Leemput, K., Greve, D. N., van der Kouwe, A., Fischl, B., Caballero-Gaudes, C., & Paz-Alonso, P. M. (2018). A probabilistic atlas of the human thalamic nuclei combining ex vivo MRI and histology. NeuroImage, 183, 314–326. https://doi.org/10.1016/j.neuroimage.2018.08.012

      Ito, T., Hearne, L. J., & Cole, M. W. (2020). A cortical hierarchy of localized and distributed processes revealed via dissociation of task activations, connectivity changes, and intrinsic timescales. NeuroImage, 221, 117141. https://doi.org/10.1016/j.neuroimage.2020.117141

      Kumar, V. J., Beckmann, C. F., Scheffler, K., & Grodd, W. (2022). Relay and higher-order thalamic nuclei show an intertwined functional association with cortical-networks. Communications Biology, 5(1), 1–17. https://doi.org/10.1038/s42003-022-04126-w

      Kumar, V. J., van Oort, E., Scheffler, K., Beckmann, C. F., & Grodd, W. (2017). Functional anatomy of the human thalamus at rest. NeuroImage, 147, 678–691. https://doi.org/10.1016/j.neuroimage.2016.12.071

      Leh, S. E., Chakravarty, M. M., & Ptito, A. (2008). The Connectivity of the Human Pulvinar: A Diffusion Tensor Imaging Tractography Study. International Journal of Biomedical Imaging, 2008, 1–5. https://doi.org/10.1155/2008/789539

      Luppi, A. I., Hansen, J. Y., Adapa, R., Carhart-Harris, R. L., Roseman, L., Timmermann, C., Golkowski, D., Ranft, A., Ilg, R., Jordan, D., Bonhomme, V., Vanhaudenhuyse, A., Demertzi, A., Jaquet, O., Bahri, M. A., Alnagger, N. L. N., Cardone, P., Peattie, A. R. D., Manktelow, A. E., … Stamatakis, E. A. (2023). In vivo mapping of pharmacologically induced functional reorganization onto the human brain’s neurotransmitter landscape. Science Advances, 9(24), eadf8332. https://doi.org/10.1126/sciadv.adf8332

      Müller, E. J., Munn, B., Hearne, L. J., Smith, J. B., Fulcher, B., Arnatkevičiūtė, A., Lurie, D. J., Cocchi, L., & Shine, J. M. (2020). Core and matrix thalamic sub-populations relate to spatio-temporal cortical connectivity gradients. NeuroImage, 222, 117224. https://doi.org/10.1016/j.neuroimage.2020.117224

      Murphy, K., Bodurka, J., & Bandettini, P. A. (2006). How long to scan? The relationship between fMRI temporal signal to noise and necessary scan duration. NeuroImage, 34(2), 565. https://doi.org/10.1016/j.neuroimage.2006.09.032

      Murray, J. D., Bernacchia, A., Freedman, D. J., Romo, R., Wallis, J. D., Cai, X., Padoa-Schioppa, C., Pasternak, T., Seo, H., Lee, D., & Wang, X.-J. (2014). A hierarchy of intrinsic timescales across primate cortex. Nature Neuroscience, 17(12), 1661–1663. https://doi.org/10.1038/nn.3862

      Oldham, S., & Ball, G. (2023). A phylogenetically-conserved axis of thalamocortical connectivity in the human brain. Nature Communications, 14(1), 6032. https://doi.org/10.1038/s41467-023-41722-8

      Rolls, E. T., Huang, C.-C., Lin, C.-P., Feng, J., & Joliot, M. (2020). Automated anatomical labelling atlas 3. NeuroImage, 206, 116189. https://doi.org/10.1016/j.neuroimage.2019.116189

      Rossi-Pool, R., Zainos, A., Alvarez, M., Parra, S., Zizumbo, J., & Romo, R. (2021). Invariant timescale hierarchy across the cortical somatosensory network. Proceedings of the National Academy of Sciences, 118(3), e2021843118. https://doi.org/10.1073/pnas.2021843118

      Shipp, S. (2003). The functional logic of cortico-pulvinar connections. Philosophical Transactions of the Royal Society B: Biological Sciences, 358(1438), 1605–1624. https://doi.org/10.1098/rstb.2002.1213

      Soltani, A., Murray, J. D., Seo, H., & Lee, D. (2021). Timescales of cognition in the brain. Current Opinion in Behavioral Sciences, 41, 30–37. https://doi.org/10.1016/j.cobeha.2021.03.003

      Su, J. H., Thomas, F. T., Kasoff, W. S., Tourdias, T., Choi, E. Y., Rutt, B. K., & Saranathan, M. (2019). Thalamus Optimized Multi Atlas Segmentation (THOMAS): Fast, fully automated segmentation of thalamic nuclei from structural MRI. NeuroImage, 194, 272–282. https://doi.org/10.1016/j.neuroimage.2019.03.021

      Tamietto, M., Pullens, P., de Gelder, B., Weiskrantz, L., & Goebel, R. (2012). Subcortical Connections to Human Amygdala and Changes following Destruction of the Visual Cortex. Current Biology, 22(15), 1449–1455. https://doi.org/10.1016/j.cub.2012.06.006

      Yang, S., Meng, Y., Li, J., Li, B., Fan, Y.-S., Chen, H., & Liao, W. (2020). The thalamic functional gradient and its relationship to structural basis and cognitive relevance. NeuroImage, 218, 116960. https://doi.org/10.1016/j.neuroimage.2020.116960

    1. eLife Assessment

      This useful study describes expression profiling by scRNA-seq of thousands of cells of recombinant yeast genotypes from a system that models natural genetic variation. The rigorous new method presented here shows promise for improving the efficiency of genotype-to-phenotype mapping in yeast, providing convincing evidence for its efficacy. This manuscript focuses on overcoming technical challenges with this approach and identifies several new biological insights that build upon the field of genotype-to-phenotype mapping, a central question of interest to geneticists and evolutionary biologists.

    2. Reviewer #1 (Public review):

      In the revision of their paper, N'Guessan et al have improved the report of their study of expression QTL (eQTL) mapping in yeast using single cells. The authors make use of advances in single cell RNAseq (scRNAseq) in yeast to increase the efficiency with which this type of analysis can be undertaken. Building on prior research led by the senior author that entailed genotyping and fitness profiling of almost 100,000 cells derived from a cross between two yeast strains (BY and RM) they performed scRNAseq on a subset of ~5% (n = 4,489) individual cells. To address the sparsity of genotype data in the expression profiling they used a Hidden Markov Model (HMM) to infer genotypes and then identify the most likely known lineage genotype from the original dataset. To address the relationship between variance in fitness and gene expression the authors partition the variance to investigate the sources of variation. They then perform eQTL mapping and study the relationship between eQTL and fitness QTL identified in the earlier study.

      This paper seeks to address the question of how quantitative trait variation and expression variation are related. scRNAseq represents an appealing approach to eQTL mapping as it is possible to simultaneously genotype individual cells and measure expression in the same cell. As eQTL mapping requires large sample sizes to identify statistical relationships, the use of scRNAseq is likely to dramatically increase the statistical power of such studies. However, there are several technical challenges associated with scRNAseq and the authors' study is focused on addressing those challenges. My main suggestion from my review of the revised version of the manuscript has been addressed in the revised figure 3. I agree with the authors that they have successfully demonstrated their stated goal of developing, and illustrating the benefit of, a one-pot scRNA-seq experiment and analysis for eQTL mapping.

    3. Reviewer #2 (Public review):

      This work describes the single-cell expression profiling of thousands of cells of recombinant genotypes from a model natural-variation system, a cross between two divergent yeast strains.

      I appreciate the addition of lines 282-291, which now makes the authors' point about one advantage of the single-cell technique for eQTL mapping clearly: the authors don't need to normalize for culture-to-culture variation the way standard bulk methods do (e.g. in Albert et al., 2018 for the current yeast cross), and without this normalization, they can integrate analyses of expression with those of estimates of growth behaviors from the abundance of a genotype in the pool. The main question the manuscript addresses with the latter, in Figure 3, is how much variation in growth appears to have nothing to do with expression, for which the answer the authors given is 30%. I agree that this represents a novel finding. The caveats are (1) the particular point will perhaps only be interesting to a small slice of the eQTL research community; (2) the authors provide no statistical controls/error estimate or independent validation of the variance partitioning analysis in Figure 3, and (3) the authors don't seem to use the single-cell growth/fitness estimates for anything else, as Figure 4 uses loci mapped to growth from a previously published, standard culture-by-culture approach. It would be appropriate for the manuscript to mention these caveats.

      I also think it is not appropriate for the manuscript to avoid a comparison between the current work and Boocock et al., which reports single-cell eQTL mapping in the same yeast system. I recommend a citation and statement of the similarities and differences between the papers.

      I appreciate the new statement about the single-cell technique affording better power in eQTL mapping (lines 445-453).

    4. Author response:

      The following is the authors’ response to the previous reviews

      Reviewer #1:

      This paper seeks to address the question of how quantitative trait variation and expression variation are related. scRNAseq represents an appealing approach to eQTL mapping as it is possible to simultaneously genotype individual cells and measure expression in the same cell. As eQTL mapping requires large sample sizes to identify statistical relationships, the use of scRNAseq is likely to dramatically increase the statistical power of such studies. However, there are several technical challenges associated with scRNAseq and the authors' study is focused on addressing those challenges. Most of the points raised by my review of the initial version have been addressed. However, one point remains and one additional point should be considered. In this version the authors have introduced the use of data imputation using a published algorithm, DISCERN. This has greatly increased the variation explained by their model as presented in figure 3. However, it is possible that the explained variance is now an overestimation as a result of using the imputed expression data. I think that it would be appropriate to present figure 3 using the sparse data presented in the initial version of the paper and the newly presented imputed data so that the reader can draw their own conclusions about the interpretation.

      We thank the reviewer for pointing this out and decided to present the results obtained from the sparse data in the main Figure 3 to avoid any overestimation. We also performed the variance partitioning at different sample sizes and used an optimized implementation of the GREML method to be able to handle high sample sizes instead of having to use a bootstrap estimate. As for the benefits of denoising the expression data, we illustrated it in the supplementary figure S6 so that people can draw their own conclusions about this imputation method. The imputation generally increases the contribution of the expressiongenotype interaction and decreases the residuals of the model by up to 8%.

      Reviewer #1:

      Given that the authors overcame many technical and analytical challenges in the course of this research, the study would be greatly strengthened through analysis of at least one, and ideally several, more conditions which would expand the conclusions that could be drawn from the study and demonstrate the power of using scRNAseq to efficiently quantify expression in different environments.

      Our aim was to illustrate the benefit of one-pot scRNA-seq for eQTL mapping and the association of transcriptomic variation to trait variation. We think we have reached this goal with the current study. We understand that performing another scRNA-seq experiment in a new environment would help expand/validate our conclusions, but we think this would be a better fit for a future study. 

      Reviewer #2:

      The authors now say the main take-home for their work is (1) they have established methods for linkage mapping with scRNA-seq and that these (2) "can help gain insights about the genotype-phenotype map at a broader scale." My opinion in this revision is much the same as it was in the first round: I agree that they have met the first goal, and the second theme has been so well explored by other literature that I'm not convinced the authors' results meet the bar for novelty and impact. To my mind, success for this manuscript would be to support the claim that the scRNA-seq approach helps "reveal hidden components of the yeast genotype-to-phenotype map." I'm not sure the authors have achieved this. I agree that the new Figure 3 is a nice addition-a result that apparently hasn't been reported elsewhere (30% of growth trait variation can't be explained by expression). The caveats are that this is a negative result that needs to be interpreted with caution; and that it would be useful for the authors to clarify whether the ability to do this calculation is a product of the scRNA-seq method per se or whether they could have used any bulk eQTL study for it. Beside this, I regret to say that I still find that the results in the revision recapitulate what the bulk eQTL literature has already found, especially for the authors' focal yeast cross: heritability, expression hotspots, the role of cis and transacting variation, etc.

      We agree with the reviewer that this study does not reveal new modes of transcription regulation or phenomena that were not highlighted or hypothesized in the literature. To avoid confusion, we refrained from using the word “reveal” for such cases. However, we provide convincing evidence that one-pot scRNA-seq helps refining our understanding of genotype-phenotype map in two ways. First, the larger scalability of this approach allowed us to find a median number of eQTL per gene that is ~4 times higher than the largest bulk-eQTL mapping in the same genetic background. For 60% of these genes, i.e. the ones with higher expression heritability in our dataset, the ability to explain their transcriptomic variation from SNPs increased by ~16% on average, which is substantial. This gain in power can thus improve our understanding of the gene network by highlighting new downstream effects of mutations or transcriptome variation. Second, by performing one-pot eQTL as opposed to large-scale bulk eQTL, thousands of transcriptomes can be collected simultaneously without having to use batching strategies. This enables the association between phenotype, genotype and expression variation, which we show in figure 3 through variance partitioning. While it is possible that the growth trait variation not being fully explained by expression could be an artifact of scRNA-seq, we do not believe this is the case because most transcriptional variation is explained by genotype (~76%).

      Furthermore, we show that by having to control expression for growth, by missing some hotspots of regulation and by missing multiple eQTL for each gene, previous bulk-eQTL analysis could not replicate the significant association between eQTL hotspots and QTL hotspot, which this study highlights. Thus, we agree in general that many of the insights about transcriptional regulation have been obtained through ‘brute-force’, bulk RNA-seq, which fundamentally can reach tens of thousands of transcriptomes as well, but we believe the one-pot scRNA-seq approach is much easier and expedient once genotyping the single-cells and other challenges regarding denoising and low coverage have been solved (which we believe we did). There is indeed another reviewed preprint [Boocock et al, eLife] that has used similar approaches as our study since the publication of our manuscript (in October 2023).

      Likewise, when in the first round of review I recommended that the authors repeat their analyses on previous bulk RNA-seq data from Albert et al., my point was to lead the authors to a means to provide rigorous, compelling justification for the scRNA-seq approach. The response to reviewers and the text (starting on line 413) says the comparison in its current form doesn't serve this purpose because Albert et al. studied fewer segregants. Wouldn't down-sampling the current data set allow a fair comparison? Again, to my mind what the current manuscript needs is concrete evidence that the scRNA-seq method per se affords truly better insights relative to what has come before.

      We agree that down-sampling the current dataset would allow for a fair comparison. Thus, we illustrate the results of the variance partitioning at different sample sizes. While the total variance explained is similar, the contribution of the genotype-expression interaction increases with sample size, highlighting the increase in the confidence of the associations between expression and genotype that contributed to trait variation. We also showed that a lot of important low-effect sizes eQTL are missing at a sample size of 1000 compared to a sample size 4000. Indeed, by increasing the scale of eQTL mapping by ~4, about 60% of genes have increased heritability and this increase is due to eQTLs that cumulatively explain more than 15% of transcript level variation.

      I also recommend that the authors take care to improve the main text for readability and professionalism. It would benefit from further structural revision throughout (especially in the figure captions) to allow high-impact conclusions to be highlighted and low-impact material to be eliminated. Figure 4 and the results text sections from line 319 onward could be edited for concision or perhaps moved to supplementary if they obscure the authors' case for the scRNA-seq approach. The text could also benefit from copy editing (e.g. three clauses starting with "while" in the paragraph starting on line 456; "od ratio" on line 415). I appreciate the authors' work on the discussion, including posing big picture questions for the field (lines 426-429), but I don't see how they have anything to do with the current scRNA-seq method.

      We thank the reviewer for their suggestions for improving the readability of the text. We edited some of the figure captions and result section titles to better highlight the main results. However, we do not think that the last result section obscures our findings but rather supports the fact that scRNA-seq refines our understanding of the GPM. Indeed, we discovered many new eQTLs that are related to both expression and trait variation, highlighting the potential for understanding the downstream effects of mutations on the gene network and on trait variation through multiple trans-regulation paths.

    1. eLife Assessment

      This paper presents a valuable software package, named "Virtual Brain Inference" (VBI), that enables faster and more efficient inference of parameters in dynamical system models of whole-brain activity, grounded in artificial network networks for Bayesian statistical inference. The authors have provided solid evidence, across several case studies, for the utility and validity of the methods using simulated data from several commonly used models, but more thorough benchmarking could be used to demonstrate the reliability, generalizability, and practical utility of the toolkit. This work will be of interest to computational neuroscientists interested in modelling large-scale brain dynamics.

    2. Reviewer #1 (Public review):

      This work provides a new Python toolkit for combining generative modeling of neural dynamics and inversion methods to infer likely model parameters that explain empirical neuroimaging data. The authors provided tests to show the toolkit's broad applicability and accuracy; hence, it will be very useful for people interested in using computational approaches to better understand the brain.

      Strengths:

      The work's primary strength is the tool's integrative nature, which seamlessly combines forward modelling with backward inference. This is important as available tools in the literature can only do one and not the other, which limits their accessibility to neuroscientists with limited computational expertise. Another strength of the paper is the demonstration of how the tool can be applied to a broad range of computational models popularly used in the field to interrogate diverse neuroimaging data, ensuring that the methodology is not optimal to only one model. Moreover, through extensive in-silico testing, the work provided evidence that the tool can accurately infer ground-truth parameters, which is important to ensure results from future hypothesis testing are meaningful.

      Weaknesses:

      Although the tool itself is the main strength of the work, the paper lacked a thorough analysis of issues concerning robustness and benchmarking relative to existing tools.

      The first issue is the robustness to the choice of features to be included in the objective function. This choice significantly affects the training and changes the results, as the authors even acknowledged themselves multiple times (e.g., Page 17 last sentence of first paragraph or Page 19 first sentence of second paragraph). This brings the question of whether the accurate results found in the various demonstrations are due to the biased selection of features (possibly from priors on what worked in previous works). The robustness of the neural estimator and the inference method to noise was also not demonstrated. This is important as most neuroimaging measurements are inherently noisy to various degrees.

      The second issue is on benchmarking. Because the tool developed is, in principle, only a combination of existing tools specific to modeling or Bayesian inference, the work failed to provide a more compelling demonstration of its added value. This could have been demonstrated through appropriate benchmarking relative to existing methodologies, specifically in terms of accuracy and computational efficiency.

    3. Reviewer #2 (Public review):

      Summary:

      Whole-brain network modeling is a common type of dynamical systems-based method to create individualized models of brain activity incorporating subject-specific structural connectome inferred from diffusion imaging data. This type of model has often been used to infer biophysical parameters of the individual brain that cannot be directly measured using neuroimaging but may be relevant to specific cognitive functions or diseases. Here, Ziaeemehr et al introduce a new toolkit, named "Virtual Brain Inference" (VBI), offering a new computational approach for estimating these parameters using Bayesian inference powered by artificial neural networks. The basic idea is to use simulated data, given known parameters, to train artificial neural networks to solve the inverse problem, namely, to infer the posterior distribution over the parameter space given data-derived features. The authors have demonstrated the utility of the toolkit using simulated data from several commonly used whole-brain network models in case studies.

      Strengths:

      (1) Model inversion is an important problem in whole-brain network modeling. The toolkit presents a significant methodological step up from common practices, with the potential to broadly impact how the community infers model parameters.

      (2) Notably, the method allows the estimation of the posterior distribution of parameters instead of a point estimation, which provides information about the uncertainty of the estimation, which is generally lacking in existing methods.

      (3) The case studies were able to demonstrate the detection of degeneracy in the parameters, which is important. Degeneracy is quite common in this type of model. If not handled mindfully, they may lead to spurious or stable parameter estimation. Thus, the toolkit can potentially be used to improve feature selection or to simply indicate the uncertainty.

      (4) In principle, the posterior distribution can be directly computed given new data without doing any additional simulation, which could improve the efficiency of parameter inference on the artificial neural network if well-trained.

      Weaknesses:

      (1) While the posterior estimator was trained with a large quantity of simulated data, the testing/validation is only demonstrated with a single case study (one point in parameter space) per model. This is not sufficient to demonstrate the method's accuracy and reliability, but only its feasibility. Demonstrating the accuracy and reliability of the posterior estimation in large test sets would inspire more confidence.

      (2) The authors have only demonstrated validation of the method using simulated data, but not features derived from actual EEG/MEG or fMRI data. So, it is unclear if the posterior estimator, when applied to real data, would produce results as sensible as using simulated data. Human data can often look quite different from the simulated data, which may be considered out of distribution. Thus, the authors should consider using simulated test data with out-of-distribution parameters to validate the method and using real human data to demonstrate, e.g., the reliability of the method across sessions.

      (3) The z-scores used to measure prediction error are generally between 1-3, which seems quite large to me. It would give readers a better sense of the utility of the method if comparisons to simpler methods, such as k-nearest neighbor methods, are provided in terms of accuracy.

      (4) A lot of simulations are required to train the posterior estimator, which seems much more than existing approaches. Inferring from Figure S1, at the required order of magnitudes of the number of simulations, the simulation time could range from days to years, depending on the hardware. Although once the estimator is well-trained, the parameter inverse given new data will be very fast, it is not clear to me how often such use cases would be encountered. Because the estimator is trained based on an individual connectome, it can only be used to do parameter inversion for the same subject. Typically, we only have one session of resting state data from each participant, while longitudinal resting state data where we can assume the structural connectome remains constant, is rare. Thus, the cost-efficiency and practical utility of training such a posterior estimator remains unclear.

    4. Author response:

      Public Reviews:

      Reviewer #1 (Public review):

      This work provides a new Python toolkit for combining generative modeling of neural dynamics and inversion methods to infer likely model parameters that explain empirical neuroimaging data. The authors provided tests to show the toolkit's broad applicability and accuracy; hence, it will be very useful for people interested in using computational approaches to better understand the brain.

      Strengths:

      The work's primary strength is the tool's integrative nature, which seamlessly combines forward modelling with backward inference. This is important as available tools in the literature can only do one and not the other, which limits their accessibility to neuroscientists with limited computational expertise. Another strength of the paper is the demonstration of how the tool can be applied to a broad range of computational models popularly used in the field to interrogate diverse neuroimaging data, ensuring that the methodology is not optimal to only one model. Moreover, through extensive in-silico testing, the work provided evidence that the tool can accurately infer ground-truth parameters, which is important to ensure results from future hypothesis testing are meaningful.

      We are happy to hear the positive feedback on our effort to provide an open-source and widely accessible tool for both fast forward simulations and flexible model inversion, applicable across popular models of large-scale brain dynamics.

      Weaknesses:

      Although the tool itself is the main strength of the work, the paper lacked a thorough analysis of issues concerning robustness and benchmarking relative to existing tools.

      The first issue is the robustness to the choice of features to be included in the objective function. This choice significantly affects the training and changes the results, as the authors even acknowledged themselves multiple times (e.g., Page 17 last sentence of first paragraph or Page 19 first sentence of second paragraph). This brings the question of whether the accurate results found in the various demonstrations are due to the biased selection of features (possibly from priors on what worked in previous works). The robustness of the neural estimator and the inference method to noise was also not demonstrated. This is important as most neuroimaging measurements are inherently noisy to various degrees.

      The second issue is on benchmarking. Because the tool developed is, in principle, only a combination of existing tools specific to modeling or Bayesian inference, the work failed to provide a more compelling demonstration of its added value. This could have been demonstrated through appropriate benchmarking relative to existing methodologies, specifically in terms of accuracy and computational efficiency.

      We fully agree with the reviewer that the VBI estimation heavily depends on the choice of data features, and this is the core of the inference procedure, not its weakness. We have demonstrated different scenarios showing how the informativeness of features (commonly used in the literature) results in varying uncertainty quantification. For instance, using summary statistics of functional connectivity (FC) and functional connectivity dynamics (FCD) matrices to estimate global coupling parameter leads to fast convergence; however, it is not sufficient to accurately estimate the whole-brain heterogeneous excitability parameter, which requires features such as statistical moments of time series. VBI provides a taxonomy of data features that users can employ to test their hypotheses. It is important to note that one major advantage of VBI is its ability to make estimation using a battery of data features, rather than relying on a limited set (such as only FC or FCD) as is often the case in the literature. In the revised version, we will elaborate further by presenting additional scenarios to demonstrate the robustness of the estimation. We will also evaluate the robustness of the neural density estimators to (dynamical/additive) noise.

      More importantly, relative to benchmarking, we would like to draw attention to a key point regarding existing tools and methods. The literature often uses optimization for fitting whole-brain network models, and its limitations for reliable causal hypothesis testing have been pointed out in the Introduction/Discussion. As also noted by the reviewer under strengths, and to the best of our knowledge, there are no existing tools other than VBI that can scale and generalize to operate across whole-brain models for Bayesian model inversion. Previously, we developed Hamiltonian Monte Carlo (HMC) sampling for Epileptor model in epilepsy (Hashemi et al., 2020, Jha et al., 2022). This phenomenological model is very well-behaved in terms of numerical integration, gradient calculation, and dynamical system properties (Jirsa et al., 2014). However, this does not directly generalize to other models, particularly the Montbrió model for resting-state, which exhibits bistability with noise driving transitions between states. As shown in Baldy et al., 2024, even at the level of a single neural mass model (i.e., one brain region), gradient-based HMC failed to capture such switching behaviour, particularly when only one state variable (membrane potential) was observed while the other (firing rate) was missing. Our attempts to use other methods (e.g., the second-derivative-based Laplace approximation used in Dynamic Causal Modeling) also failed, due to divergence in gradient calculation. Nevertheless, reparameterization techniques (Baldy et al., 2024) and hybrid algorithms (Gabrié et al., 2022) could offer improvements, although this remains an open problem for these classes of computational models.

      In sum, for oscillatory systems, it has been shown previously that SBI approach used in VBI substantially outperforms both gradient-based and gradient-free alternative methods (Gonçalves et al., 2020, Hashemi et al., 2023, Baldy et al., 2024). Importantly, for bistable systems with switching dynamics, gradient-based methods fail to converge, while gradient-free methods do not scale to the whole-brain level (Hashemi et al., 2020). Hence, the generalizability of VBI relies on the fact that neither the model nor the data features need to be differentiable. We will clarify this point in the revised version. Moreover, we will provide better explanations for some terms mentioned by the reviewer in Recommendations.

      Hashemi, M., Vattikonda, A. N., Sip, V., Guye, M., Bartolomei, F., Woodman, M. M., & Jirsa, V. K. (2020). The Bayesian Virtual Epileptic Patient: A probabilistic framework designed to infer the spatial map of epileptogenicity in a personalized large-scale brain model of epilepsy spread. NeuroImage, 217, 116839.

      Jha, J., Hashemi, M., Vattikonda, A. N., Wang, H., & Jirsa, V. (2022). Fully Bayesian estimation of virtual brain parameters with self-tuning Hamiltonian Monte Carlo. Machine Learning: Science and Technology, 3(3), 035016.

      Jirsa, V. K., Stacey, W. C., Quilichini, P. P., Ivanov, A. I., & Bernard, C. (2014). On the nature of seizure dynamics. Brain, 137(8), 2210-2230.

      Baldy, N., Breyton, M., Woodman, M. M., Jirsa, V. K., & Hashemi, M. (2024). Inference on the macroscopic dynamics of spiking neurons. Neural Computation, 36(10), 2030-2072.

      Baldy, N., Woodman, M., Jirsa, V., & Hashemi, M. (2024). Dynamic Causal Modeling in Probabilistic Programming Languages. bioRxiv, 2024-11.

      Gabrié, M., Rotskoff, G. M., & Vanden-Eijnden, E. (2022). Adaptive Monte Carlo augmented with normalizing flows. Proceedings of the National Academy of Sciences, 119(10), e2109420119.

      Gonçalves, P. J., Lueckmann, J. M., Deistler, M., Nonnenmacher, M., Öcal, K., Bassetto, G., ... & Macke, J. H. (2020). Training deep neural density estimators to identify mechanistic models of neural dynamics. eLife, 9, e56261.

      Hashemi, M., Vattikonda, A. N., Jha, J., Sip, V., Woodman, M. M., Bartolomei, F., & Jirsa, V. K. (2023). Amortized Bayesian inference on generative dynamical network models of epilepsy using deep neural density estimators. Neural Networks, 163, 178-194.

      Reviewer #2 (Public review):

      Summary:

      Whole-brain network modeling is a common type of dynamical systems-based method to create individualized models of brain activity incorporating subject-specific structural connectome inferred from diffusion imaging data. This type of model has often been used to infer biophysical parameters of the individual brain that cannot be directly measured using neuroimaging but may be relevant to specific cognitive functions or diseases. Here, Ziaeemehr et al introduce a new toolkit, named "Virtual Brain Inference" (VBI), offering a new computational approach for estimating these parameters using Bayesian inference powered by artificial neural networks. The basic idea is to use simulated data, given known parameters, to train artificial neural networks to solve the inverse problem, namely, to infer the posterior distribution over the parameter space given data-derived features. The authors have demonstrated the utility of the toolkit using simulated data from several commonly used whole-brain network models in case studies.

      Strengths:

      (1) Model inversion is an important problem in whole-brain network modeling. The toolkit presents a significant methodological step up from common practices, with the potential to broadly impact how the community infers model parameters.

      (2) Notably, the method allows the estimation of the posterior distribution of parameters instead of a point estimation, which provides information about the uncertainty of the estimation, which is generally lacking in existing methods.

      (3) The case studies were able to demonstrate the detection of degeneracy in the parameters, which is important. Degeneracy is quite common in this type of model. If not handled mindfully, they may lead to spurious or stable parameter estimation. Thus, the toolkit can potentially be used to improve feature selection or to simply indicate the uncertainty.

      (4) In principle, the posterior distribution can be directly computed given new data without doing any additional simulation, which could improve the efficiency of parameter inference on the artificial neural network if well-trained.

      We thank the reviewer for the careful consideration of important aspects of the VBI tool, such as uncertainty quantification, degeneracy detection, parallelization, and amortization strategy.

      Weaknesses:

      (1) While the posterior estimator was trained with a large quantity of simulated data, the testing/validation is only demonstrated with a single case study (one point in parameter space) per model. This is not sufficient to demonstrate the method's accuracy and reliability, but only its feasibility. Demonstrating the accuracy and reliability of the posterior estimation in large test sets would inspire more confidence.

      (2) The authors have only demonstrated validation of the method using simulated data, but not features derived from actual EEG/MEG or fMRI data. So, it is unclear if the posterior estimator, when applied to real data, would produce results as sensible as using simulated data. Human data can often look quite different from the simulated data, which may be considered out of distribution. Thus, the authors should consider using simulated test data with out-of-distribution parameters to validate the method and using real human data to demonstrate, e.g., the reliability of the method across sessions.

      (3) The z-scores used to measure prediction error are generally between 1-3, which seems quite large to me. It would give readers a better sense of the utility of the method if comparisons to simpler methods, such as k-nearest neighbor methods, are provided in terms of accuracy.

      (4) A lot of simulations are required to train the posterior estimator, which seems much more than existing approaches. Inferring from Figure S1, at the required order of magnitudes of the number of simulations, the simulation time could range from days to years, depending on the hardware. Although once the estimator is well-trained, the parameter inverse given new data will be very fast, it is not clear to me how often such use cases would be encountered. Because the estimator is trained based on an individual connectome, it can only be used to do parameter inversion for the same subject. Typically, we only have one session of resting state data from each participant, while longitudinal resting state data where we can assume the structural connectome remains constant, is rare. Thus, the cost-efficiency and practical utility of training such a posterior estimator remains unclear.

      We agree with the reviewer that it is necessary to show results on larger synthetic test sets, and we will elaborate further by presenting additional scenarios to demonstrate the robustness of the estimation. However, there are some points raised by the reviewer that we need to clarify.

      The validation on empirical data was beyond the scope of this study, as it relates to model validation rather than the inversion algorithms. This is also because we aimed to avoid repetition, given that we have previously demonstrated model validation on empirical data using these techniques, for invasive sEEG (Hashemi et al., 2023), MEG (Sorrentino et al., 2024), EEG (Angiolelli et al., 2025) and fMRI (Lavanga et al., 2024, Rabuffo et al., 2025). Note that if the features of the observed data are not included during training, VBI ignores them, as it requires an invertible mapping function between parameters and data features.

      We have used z-scores and posterior shrinkage to measure prediction performance, as these are Bayesian metrics that take into account the variance of both prior and posterior rather than only the mean value or thresholding for ranking of the prediction used in k-NN or confusion matrix methods. This helps avoid biased accuracy estimation, for instance, if the mean posterior is close to the true value but there is no posterior shrinkage. Although shrinkage is bounded between 0 and 1, we agree that z-scores have no upper bound for such diagnostics.

      Finally, the number of required simulations depends on the dimensionality of the parameter space and the informativeness of the data features. For instance, estimating a single global scaling parameter requires around 100 simulations, whereas estimating whole-brain heterogeneous parameters requires substantially more simulations. Nevertheless, we have provided fast simulations, and one key advantage of VBI is that simulations can be run in parallel (unlike MCMC sampling, which is more limited in this regard). Hence, with commonly accessible CPUs/GPUs, the fast simulations and parallelization capabilities of the VBI tool allow us to run on the order of 1 million simulations within 2–3 days on desktops, or in less than half a day on supercomputers at cohort level, rather than over several years! It has been previously shown that the SBI method used in VBI provides an order-of-magnitude faster inversion than HMC for whole-brain epilepsy spread (Hashemi et al., 2023). Moreover, after training, the amortized strategy is critical for enabling hypothesis testing within seconds to minutes. We agree that longitudinal resting-state data under the assumption of a constant structural connectome is rare; however, this strategy is essential in brain diseases such as epilepsy, where experimental hypothesis testing is prohibitive.

      We will clarify these points and better explain some terms mentioned by the reviewer in the revised manuscript.

      Hashemi, M., Vattikonda, A. N., Jha, J., Sip, V., Woodman, M. M., Bartolomei, F., & Jirsa, V. K. (2023). Amortized Bayesian inference on generative dynamical network models of epilepsy using deep neural density estimators. Neural Networks, 163, 178-194.

      Sorrentino, P., Pathak, A., Ziaeemehr, A., Lopez, E. T., Cipriano, L., Romano, A., ... & Hashemi, M. (2024). The virtual multiple sclerosis patient. Iscience, 27(7).

      Angiolelli, M., Depannemaecker, D., Agouram, H., Regis, J., Carron, R., Woodman, M., ... & Sorrentino, P. (2025). The virtual parkinsonian patient. npj Systems Biology and Applications, 11(1), 40.

      Lavanga, M., Stumme, J., Yalcinkaya, B. H., Fousek, J., Jockwitz, C., Sheheitli, H., ... & Jirsa, V. (2023). The virtual aging brain: Causal inference supports interhemispheric dedifferentiation in healthy aging. NeuroImage, 283, 120403.

      Rabuffo, G., Lokossou, H. A., Li, Z., Ziaee-Mehr, A., Hashemi, M., Quilichini, P. P., ... & Bernard, C. (2025). Mapping global brain reconfigurations following local targeted manipulations. Proceedings of the National Academy of Sciences, 122(16), e2405706122.

    1. eLife Assessment

      This study presents valuable findings on the patterned loss of Purkinje cells in the mouse cerebellum during aging. Convincing evidence shows that Purkinje cell loss with aging occurs in a pattern of parasagittal stripes in relationship with the zebrin-II expression pattern. Further evidence supporting the Purkinje cell aging loss pattern as it relates to human cerebellar aging would strengthen the study.

    2. Reviewer #1 (Public review):

      Summary:

      In this study, Donofrio et al. investigated cerebellar Purkinje cell (PC) degeneration during normal aging using both mouse and human samples. They found that PC loss followed a stripe pattern rather than occurring randomly. Although this pattern resembled the pattern of zebrin II expression in the anterior cerebellum, the overall pattern was different from zebrin II expression. Surviving PCs exhibited severe degeneration, including thickened axons, axonal torpedoes, and shrunken dendrites. These structural changes were accompanied by functional deficits in motor coordination and tremor. Understanding why certain PC subpopulations are more vulnerable than others may provide insight into regional susceptibility (or resilience) to aging and inform potential therapeutic strategies for age-related neurological disorders. Overall, the findings are novel and significant, supported by compelling evidence from structural and functional analyses. However, I have several concerns about the results and hope that my comments will help improve the clarity and impact of this paper.

      Strengths:

      The cerebellum is often overlooked in aging research, despite its increasingly recognized role in motor and non-motor functions. This study, which examines the pattern of PC loss during normal aging, offers a new perspective on the aging process.

      The finding that PC loss follows a stripe pattern is a major conceptual advance, challenging the previous assumption that PC loss occurs uniformly in the cerebellum.

      The analyses using wholemount immunohistochemistry, PC-specific reporter mice, and light-sheet imaging of cleared brain tissue are meticulous. By visualizing PCs in three dimensions, this study provides strong evidence for the patterned loss of PCs across different cerebellar subdivisions during aging.

      The inclusion of human samples along with the animal model strengthens the impact and translational relevance of these findings.

      The data are clearly presented, and the manuscript is very well written.

      Weaknesses:

      While the authors have largely ruled out zebrin II as the key protein underlying PC vulnerability or resistance to age-related loss, the molecular basis of this phenomenon remains unidentified. This reviewer acknowledges the complexity of this investigation and considers it a minor issue, as the manuscript thoughtfully discusses the gap and highlights it as a future direction.

      In cases where no PC loss is observed in aged mice (Figure 1F), it is unclear whether these PCs undergo morphological degeneration, such as thickened axons and shrunken dendrites. Further characterization of these resilient PCs would help understand why the aged mice without PC loss still exhibit motor deficits (Figure 7).

      The histologic analysis is based on mice with different genetic backgrounds. For example, the PC-specific reporter mice include two strains: Pcp2-Cre; Ai32 and Pcp2-Cre; Ai40D. These genetic variations may contribute to the heterogeneity of PC loss (Figure 1). To improve clarity, please add the genetic background details to Table 1.

      Please indicate from which lobule in the anterior or posterior human cerebellum the images in Figure 8 were taken.