10,000 Matching Annotations
  1. Aug 2025
    1. Reviewer #1 (Public review):

      Summary

      This manuscript describes a haemogenic gastruloid system that the authors claim recapitulates early mouse embryonic development to produce sequential waves of yolk sac and AGM-like haematopoiesis, with spatial and temporal accuracy. The model claims to reproduce mouse development to 'beyond' the E9.0 stage and apply its use to the aetiology of infant leukaemia.

      Strengths

      Gastruloids models are useful systems for studying early embryonic development, recapitulating aspects of gastrulation, anteroposterior regionalisation and somitogenesis. Gastruloid models that specifically mimic particular regions of the embryo could provide insights into how these regions form during development.

      Weaknesses

      There are a couple of major issues with this manuscript that I feel need to be addressed.

      Firstly, the authors acknowledge that the proportion of blood cells that are produced by their haemogenic gastruloid system is very low - there are fewer than 2% of either blood or endothelium produced. The authors argue however, that this is because they have developed a hematopoietic organoid that captures much more of the essence of the developing embryo and therefore has a broader tissue representation and a more relevant spatial representation.

      In order to prosecute this argument, this reviewer needs to understand how the differentiation protocol achieves this end, ie what is notable about the combination of factors and other media components. Also, they need to know what the evidence is to support this claim, in other words, what are the tissues that make up the organoid and is it truly representative of what would be expected in a developing embryo over this time. Does it pass from epiblast to primitive streak and then to cells of the germ layers? And how do haemGXs at different times map onto the developing mouse embryo?

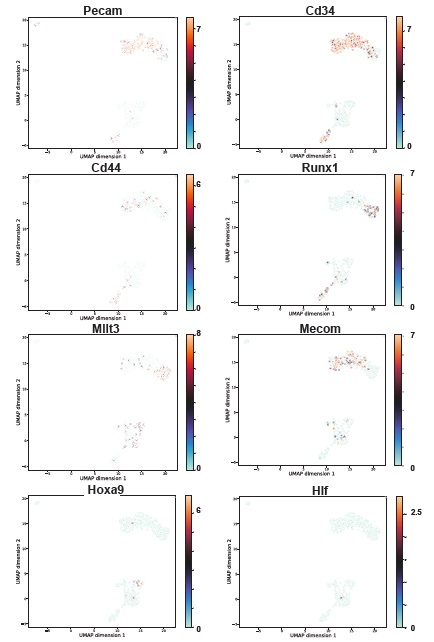
      Secondly, the point is repeatedly made by the authors that the distinction between non-engrafting yolk sac hematopoiesis and AGM-like hematopoiesis from which repopulating HSCs first derive is not really possible without spatial cues. This is really not true. It has been shown by a number of investigators, and summarised in a recent review (Abuhantash et al 2021), that the expression of HOXA cluster genes - most prominently HOXA9 - clearly distinguishes AGM-derived, from yolk sac derived cells. In this manner, it is evident from the UMAP provided that the is no HOXA9 expressed in either endothelium or blood cells. This argues very strongly against the proposition that AGM-type hematopoiesis is generated. Indeed, given the duration of the organoid culture of only 9 days (216hrs), it would be highly unlikely that development would even reach the stage of AGM hematopoiesis (E11.5 in the mouse), even with a 1:1 concordance between embryonic time and in vitro differentiation. Finally, if there is recapitulation of the normal pattern of embryogenesis, it would be expected that there would be a prominent phase of yolk sac hematopoiesis antedating AGM-associated hematopoiesis, which should be observed in the haemGx.

      I feel that these are major conceptual points that need to be addressed in this manuscript.

    2. Reviewer #2 (Public review):

      Summary:

      In this manuscript, the authors describe the development of a new hemogenic gastruloid (hGX) system, which they claim recapitulates the sequential generation of various hematopoietic cell types. A key proposed advantage of this system is its ability to more faithfully model the spatiotemporal emergence of hematopoietic progenitors within a physiologically relevant niche, as compared to existing in vitro platforms. While the authors provide some initial characterisation and demonstrate the utility of the system in studying infant leukemia, the presented data are not fully conclusive and fall short of robustly supporting several of their key assertions.

      Strengths:

      The development of a novel in vitro system to model hematopoietic development is innovative and could potentially address important limitations of existing platforms.

      Weaknesses:

      The characterization of the hematopoietic progenitors generated by the hGX system is not fully convincing. The evidence supporting the emergence of late yolk sac (YS) progenitors, including lymphoid cells, and AGM-like pre-hematopoietic stem cells (pre-HSCs), is incomplete and relies heavily on transcriptomic profiling and a limited set of markers.

      The identification of lymphoid or pre-HSC-like populations is primarily inferred from scRNA-seq data. The lack of robust functional validation (e.g., lymphoid differentiation assays or long-term repopulation experiments) significantly weakens the manuscript's main claims.

      In the revised manuscript, the authors incorporate single-cell RNA-seq analyses indicating that their cells resemble AGM-derived endothelial-to-hematopoietic transition (EHT) populations. However, they do not test whether these cells might more closely resemble YS-derived EHT, which remains an unresolved and critical question. Additionally, the claim in line 263 that Cluster 8 (CD45⁺ cells at 192-216 h) expresses lymphoid markers is not clearly supported by the provided supplemental data (Supplemental File S1-S2).

      While the authors respond that they did not claim to generate bona fide HSCs, they do state at the end of the Introduction (lines 116-121) that their system captures AGM hematopoiesis. The current data do not support this conclusion and instead suggest that the system recapitulates the generation of multipotent lymphoid progenitors (MLPs) akin to those found in the YS.

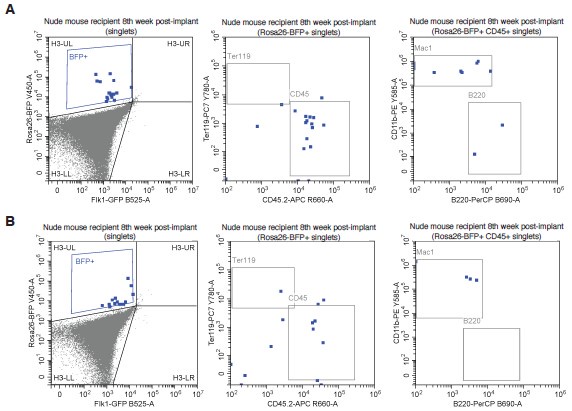
      The engraftment data presented are not particularly convincing. It is unclear why the analysis was terminated at 8 weeks post-transplant, especially given that a minimum of 12 weeks is generally required to meaningfully assess the presence of pre-HSCs or bona fide HSCs with long-term repopulating potential.

      Given the uncertainties discussed above, the interpretability of the MNX1 overexpression study is limited.

      The authors could have more directly tested their claim of capturing multiple hematopoietic waves by performing kinetic analyses of colony-forming potential, with the expectation that more multipotent colonies would emerge at later time points. Additionally, isolating and characterizing the potential of hemogenic endothelium at different time points corresponding to the putative waves would have strengthened their conclusions. In the absence of such data, it remains unclear whether the system recapitulates sequential waves of hematopoiesis or merely reflects the progressive maturation of cells originating from a single wave.

    3. Reviewer #3 (Public review):

      The authors present a revised version of their manuscript (Ragusa et al.) describing a hemogenic gastruloid (haemGx) model, used to investigate stages of blood production in vitro and for modeling a rare type of infant leukemia. The revisions address several major concerns raised during the initial round of review, and new data have been provided that overall improve the clarity and rigour of the study. In particular, the additional flow cytometry, single-cell RNA-seq analyses, and benchmarking against in vivo datasets help, to some extent, to substantiate the claims of developmental relevance of haemGx to yolk sac (YS)- and AGM-like hematopoietic waves. Nonetheless, some issues remain, particularly regarding the claims of short-term engraftment, novelty of the model, and the extent to which AGM-like HSPC are truly captured.

      Major Points:

      (1) The authors have clarified the novelty of their haemGx protocol relative to existing gastruloid models, including the importance of the Activin A pulse and protocol extension to 216h. Flow cytometry and scRNA-seq analyses support the emergence of endothelial and hematopoietic populations with dynamic marker expression. However, direct side-by-side comparisons with previously published protocols (e.g., Rossi et al., 2022) remain limited. The claim of "spatio-temporal accuracy" should be more cautiously phrased.

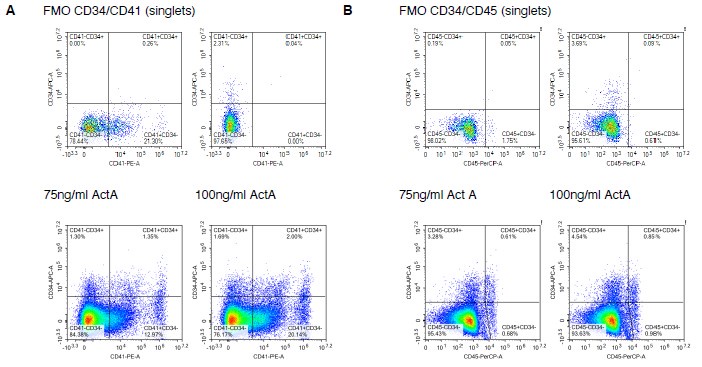
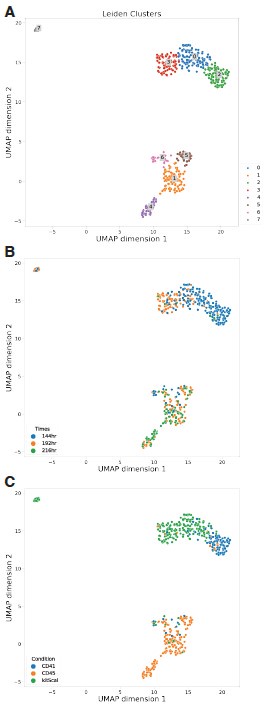
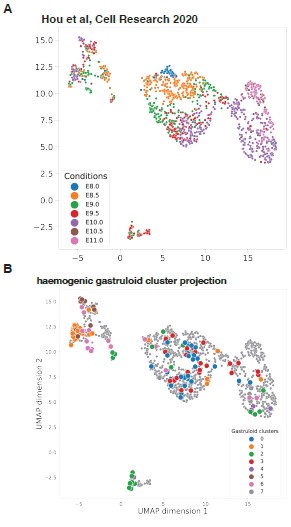
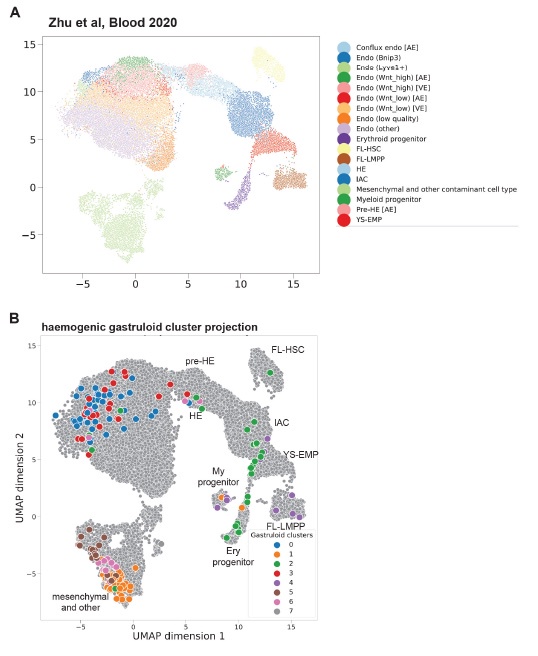
      (2) The characterization of the identity of the hematopoietic waves generated in the haemGx system has been improved in the revised manuscript. Flow cytometry analysis now includes CD31/CD34 co-expression in CD41+ and CD45+ subsets, and scRNA-seq re-clustering supports two hematopoietic waves with distinct marker sets (e.g., Gata2/Myb vs. Hoxa9/Ikzf1). Projection onto multiple embryonic reference datasets (Hou et al., Zhu et al., Thambyrajah et al.) is a valuable addition. The case for YS-like EMP and AGM-like HSPC precursors is reasonably made, though further functional distinctions (e.g., lineage output differences) would strengthen the claims.

      (3) The authors have now provided additional evidence for low-level engraftment following adrenal implantation of whole haemGx. Although technically demanding, this in vivo result remains marginal and should be interpreted with caution. Crucially, this still does not demonstrate HSC-level repopulation capacity. The revised manuscript has softened the claims accordingly, now referring to "progenitor" activity rather than "pre-HSC." We agree that this adjusted claim is more suitable, though the reproducibility of this experiment is still unclear.

      (4) The MNX1 overexpression experiments are generally convincing in showing early expansion of a putative HE-to-EMP-like population and transcriptional resemblance to MNX1-r AML. However, the evidence for transformation is still solely based on in vitro data and lacks any evidence of in vivo leukaemia engraftment. The ability to perturb the system would add translational value to the haemGx platform, although future studies are needed to better define transformation dynamics and leukemogenic progression.

    1. eLife Assessment

      This valuable study presents findings linking prophage carriage to lifestyle regulation in the marine bacterium Shewanella fidelis, with potential implications for niche occupation within a host (Ciona robusta) and mediation of host immune responses. The study leverages a unique animal model system that offers distinct advantages in identifying select phenotypes to present overall solid evidence that supports findings relating to the impact of a prophage on host-microbe interaction. Understanding the role of integrated lysogenic phages in bacterial fitness, both within a host and in the environment, is a significant concept in bacterial eco-physiology, potentially contributing to the success of certain strains.

    2. Reviewer #1 (Public review):

      Summary:

      The manuscript aims to elucidate the impact of a prophage within the genome of Shewanella fidelis on its interaction with the marine tunicate Ciona robusta. The authors made a deletion mutant of S. fidelis that lacks one of its two prophages. This mutant exhibited an enhanced biofilm phenotype, as assessed through crystal violet staining, and showed reduced motility. The authors examined the effect of prophage deletion on several genes that could modulate cyclic-diGMP levels. While no significant changes were observed under in vitro conditions, the gene for one protein potentially involved in cyclic-diGMP hydrolysis was overexpressed during microbe-host interactions. The mutant was retained more effectively within a one-hour timeframe, whereas the wild-type (WT) strain became more abundant after 24 hours. Fluorescence microscopy was used to visualize the localization patterns of the two strains, which appeared to differ. Additionally, a significant difference in the expression of one immune protein was noted after one hour, but this difference was not evident after 23 hours. An effect of VCBC-C addition on the expression of one prophage gene was also observed.

      Strengths:

      I appreciate how the authors integrate diverse expertise and methods to address questions regarding the impact of prophages on gut microbiome-host interactions. The chosen model system is appropriate, as it allows for high-throughput experimentation and the application of simple imaging techniques.

      Weaknesses:

      My primary concern is that the manuscript primarily describes observations without providing insight into the molecular mechanisms underlying the observed differences. It is particularly unclear how the presence of the prophage leads to the phenotypic changes related to bacterial physiology and host-microbe interactions. Which specific prophage genes are critical, or is the insertion at a specific site in the bacterial genome the key factor? While significant effects on bacterial physiology are reported under in vitro conditions, there is no clear attribution to particular enzymes or proteins. In contrast, when the system is expanded to include the tunicate, differences in the expression of a cyclic-diGMP hydrolase become apparent. Why do we not observe such differences under in vitro conditions, despite noting variations in biofilm formation and motility? Furthermore, given that the bacterial strain possesses two prophages, I am curious as to why the authors chose to target only one and not both.

      Regarding the microbe-host interaction, it is not clear why the increased retention ability of the prophage deletion strain did not lead to greater cell retention after 24 hours, especially since no differences in the immune response were observed at that time point.

      Concerning the methodological approach, I am puzzled as to why the authors opted for qPCR instead of transcriptomics or proteomics. The latter approaches could have provided a broader understanding of the prophage's impact on both the microbe and the host.

      Comments on revisions:

      While the authors were able to solve some of my issues, I see that other questions were not tackled.

    3. Reviewer #2 (Public review):

      Summary:

      In the manuscript, "Prophage regulation of Shewanella fidelis 3313 motility and biofilm formation: implications for gut colonization dynamics in Ciona robusta", the authors are experimentally investigating the idea that integrated viruses (prophages) within a bacterial colonizer of the host Ciona robusta affect both the colonizer and the host. They found a prophage within the Ciona robusta colonizing bacterium Shewanella fidelis 3313, which affected both the bacteria and host. This prophage does so by regulating the phosphodiesterase gene pdeB in the bacterium when the bacterium has colonized the host. The prophage also regulates the activity of the host immune gene VCBP-C during early bacterial colonization. Prophage effects on both these genes affect the precise localization of the colonizing bacterium, motility of the bacterium, and bacterial biofilm formation on the host. Interestingly, VCBP-C expression also suppressed a prophage structural protein, creating a tripartite feedback loop in this symbiosis. This is exciting research that adds to the emerging body of evidence that prophages can have beneficial effects not only on their host bacteria but also on how that bacteria interacts in its environment. This study establishes the evolutionary conservation of this concept with intriguing implications of prophage effects on tripartite interactions.

      Strengths:

      This research effectively shows that a prophage within a bacterium colonizing a model ascidian affects both the bacterium and the host in vivo. These data establish the prophage effects on bacterial activity and expand these effects to the natural interactions within the host animal. The effects of the prophage through deletion on a suite of host genes are a strength, as shown by striking microscopy.

      Weaknesses:

      Unfortunately, global transcriptomics of the bacteria and the host during colonization by the prophage-containing and prophage-deleted bacteria (1 hour and 24 hours) would be suggested to better understand the tripartite interactions.

      Impact:

      The authors are correct to speculate that this research can have a significant impact on many animal microbiome studies, since bacterial lysogens are prevalent in most microbiomes. Screening for prophages, determining whether they are active, and "curing" the host bacteria of active prophages are effective tools for understanding the effects these mobile elements have on microbiomes. There are many potential effects of these elements in vivo, both positive and negative, this research is a good example of why this research should be explored.

      Context:

      The research area of prophage effects on host bacteria in vitro has been studied for decades, while these interactions in combination with animal hosts in vivo have been recent. The significance of this research shows that there could be divergent effects based on whether the study is conducted in vitro or in vivo. The in vivo results were striking. This is particularly so with the microscopy images. The benefit of using Ciona is that it has a translucent body which allows for following microbial localization. This is in contrast to mammalian studies where following microbial localization would either be difficult or near impossible.

      Comments on revisions:

      I am satisfied with the great amount of work that went into the comments provided by the reviewers. The figure presentations are more compelling for the story, and this latest revision is a very interesting read that should be considered for future microbiome studies.

    4. Reviewer #3 (Public review):

      In this manuscript, Natarajan and colleagues report on the role of a prophage, termed SfPat, in the regulation of motility and biofilm formation by the marine bacterium Shewanella fidelis. The authors investigate the in vivo relevance of prophage carriage by studying the gut occupation patterns of Shewanella fidelis wild-type and an isogenic SfPat- mutant derivative in a model organism, juveniles of the marine tunicate Ciona robusta. The role of bacterial prophages in regulating bacterial lifestyle adaptation and niche occupation is a relatively underexplored field, and efforts in this direction are appreciated.

      Comments on revisions:

      The authors have addressed my main concerns. While some responses remain somewhat ambiguous or defer key clarifications to future studies, I appreciate that not everything can be resolved within a single manuscript.

    1. eLife Assessment

      This work provides valuable insights by introducing a post-translational extrusion mechanism that could reshape how we understand the coupling between DnaA activity and DNA-replication initiation. While solid evidence is presented for some of the key results, other claims rest on indirect proxies and could be improved.

    2. Reviewer #1 (Public review):

      Summary:

      The study by Li and coworkers addresses the important and fundamental question of replication initiation in Escherichia coli, which remains open, despite many classic and recent works. It leverages single-cell mRNA-FISH experiments in strains with titratable DnaA and novel DnaA activity reporters to monitor DNA activity peaks versus size. The authors find oscillations in DnaA activity and show that their peaks correlate well with the estimated population-average replication initiation volume across conditions and imposed dnaA transcription levels. The study also proposes a novel extrusion model where DNA-binding proteins regulate free DnaA availability in response to biomass-DNA imbalance. Experimental perturbations of H-NS support the model validity, addressing key gaps in current replication control frameworks.

      Strengths:

      I find the study interesting and well conducted, and I think its main strong points are:

      (1) the novel reporters obtained with systematic synthetic biology methods, and combined with a titratable dnaA strain.

      (2) the interesting perturbations (titration, production arrest, and H-NS).

      (3) the use of single-cell mRNA FISH to monitor transcripts directly.

      The proposed extrusion model is also interesting, though not fully validated, and I think it will contribute positively to the future debate.

      Weaknesses and Limitations:

      (1) A relevant limitation in novelty is that DnaA activity and concentration oscillations have been reported by the cited Iuliani and coworkers previously by dynamic microscopy, and to a smaller extent by the other cited study by Pountain and coworkers using mRNA FISH.

      (2) An important limitation is that the study is not dynamic. While monitoring mRNA is interesting and relevant, the current study is based on concentrations and not time variations (or nascent mRNA). Conversely, the study by Iuliani and coworkers, while having the drawback of monitoring proteins, can directly assess production rates. It would be interesting for future studies or revisions to monitor the strains and reporters dynamically, as well as using (as a control) the technique of this study on the chromosomal reporters used by Iuliani et al.

      (3) Regarding the mathematical models, a lot of details are missing regarding the definitions and the use of such models, which are only presented briefly in the Methods section. The reader is not given any tools to understand the predictions of different models, and no analytical estimates are used. The falsification procedures are not clear. More transparency and depth in the analysis are needed, unless the models are just used as a heuristic tool for qualitative arguments (but this would weaken the claims). The Berger model, for example, has many parameters and many regimes and behaviors. When models are compared to data (e.g., in Figure 2G), it is not clear which parameters were used, how they were fixed, and whether and how the model prediction depends on parameters.

      (4) Importantly, the main statement about tight correlations of peak volumes and average estimated initiation volume does not establish coincidence, and some of the claims by the authors are unclear in these respects (e.g., when they say "we resolve a 1:1 coupling between DnaA activity thresholds and replication initiation", the statement could be correct but is ambiguous). Crucially, the data rely on average initiation volumes (on which there seems to be an eternally open debate, also involving the authors), and the estimate procedure relies on assumptions that could lead to biases and uncertainties added to the population variability (in any case, error bars are not provided).

      (5) The delays observed by the authors (in both directions) between the peaks of DnaA-activity conditional averages with respect to volume and the average estimated initiation volumes are not incompatible with those observed dynamically by Iuliani and coworkers. The direct experiment to prove the authors' point would be to use a direct proxy of replication initiation, such as SeqA or DnaN, and monitor initiations and quantify DnaA activity peaks jointly, with dynamic measurements.

      (6) While not being an expert, I had some doubt that the fact that the reporters are on plasmid (despite a normalization control that seems very sensible) might affect the measurements. Also, I did not understand how the authors validated the assumptions that the reporters are sensitive to DnaA-ATP specifically. It seems this assumption is validated by previous studies only.

      Overall Appraisal:

      In summary, this appears as a very interesting study, providing valuable data and a novel hypothesis, the extrusion model, open to future explorations. However, given several limitations, some of the claims appear overstated. Finally, the text contains some self-evaluations, such as "our findings redefine the paradigm for replication control", etc., that appear exaggerated.

    3. Reviewer #2 (Public review):

      Summary:

      The authors show that in E. coli, the initiator protein DnaA oscillates post-translationally: its activity rises and peaks exactly when DNA replication begins, even if dnaA transcription is held constant. To explain this, they propose an "extrusion" mechanism in which nucleoid-associated proteins such as H-NS, whose amount grows with cell volume, dislodge DnaA from chromosomal binding sites; modelling and H-NS perturbations reproduce the observed drop in initiation mass and extra initiations seen after dnaA shut-down. Together, the data and model link biomass growth to replication timing through chromosome-driven, post-translational control of DnaA, filling gaps left by classic titration and ATP/ADP-switch models.

      Strengths:

      (1) Introduces an "extrusion" model that adds a new post-translational layer to replication control and explains data unexplained by classic titration or ATP/ADP-switch frameworks.

      (2) A major asset of the study is that it bridges the longstanding gap between DnaA oscillations and DNA-replication initiation, providing direct single-cell evidence that pulses of DnaA activity peak exactly at the moment of initiation across multiple growth conditions and genetic perturbations.

      (3) A tunable dnaA strain and targeted H-NS manipulations shift initiation mass exactly as the model predicts, giving model-driven validation across growth conditions.

      (4) A purpose-built Psyn66 reporter combined with mRNA-FISH captures DnaA-activity pulses with cell-cycle resolution, providing direct, compelling data.

      Weaknesses:

      (1) What happens to the (C+D) period and initiation time as the dnaA mRNA level changes? This is not discussed in the text or figure and should be addressed.

      (2) It is unclear what is meant by "relative dnaA mRNA level." Relative to what? Wild-type expression? Maximum expression? This should be explicitly defined.

      (3) It would be helpful to provide some intuition for why an increase in dnaA mRNA level leads to a decrease in initiation mass per ori and an increase in oriC copy number.

      (4) The titration and switch models do not explicitly include dnaA mRNA in the dynamics of DnaA protein. Yet, in Figure 2G, initiation mass is shown to decrease linearly with dnaA mRNA level in these models. How was dnaA mRNA level represented or approximated in these simulations?

      (5) Is Schaechter's law (i.e., exponential scaling of average cell size with growth rate) still valid under the different dnaA mRNA expression conditions tested?

      (6) The manuscript should explain more explicitly how the extrusion model implements post-translational control of DnaA and, in particular, how this yields the nonlinear drop in relative initiation mass versus dnaA mRNA seen in Figure 6E. Please provide the governing equation that links total DnaA, the volume-dependent "extruder" pool, and the threshold of free DnaA at initiation, and show - briefly but quantitatively - how this equation produces the observed concave curve.

      (7) Does this Extrusion model give well well-known adder per origin, i.e., initiation to initiation is an adder.

      (8) DnaA protein or activity is never measured; mRNA is treated as a linear proxy. Yet the authors' own narrative stresses post-translational (not transcriptional) control of DnaA. Without parallel immunoblots or activity readouts, it is impossible to know whether a six-fold mRNA increase truly yields a proportional rise in active DnaA.

      (9) Figure 2 infers both initiation mass and oriC copy number from bulk measurements (OD₆₀₀ per cell and rifampicin-cephalexin run-out) instead of measuring them directly in single cells. Any DnaA-dependent changes in cell size, shape, or antibiotic permeability could skew these bulk proxies, so the plotted relationships may not accurately reflect true initiation events.

    1. eLife Assessment

      This paper reports the development of proteins and small molecules that drive bridge LMO2, an oncogenic transcription factor in T-ALL, to E3 ligases (Cereblon and VHL), and demonstrates their effectiveness in degrading FMO2, causing growth arrest and inducing apoptosis in T cell lines in vitro. The findings are valuable because they provide evidence that intrinsically disordered proteins can be targeted for degradation by PROTAC-type chemicals. The paper also provides a route for rational PROTAC design based on intracellular antibody paratopes. Overall, the paper is supported by solid evidence and will be of interest to chemical biologists and cancer pharmacologists.

    2. Reviewer #1 (Public review):

      Summary:

      The authors describe the degradation of an intrinsically disordered transcription factor (LMO2) via PROTACs (VHL and CRBN) in T-ALL cells. Given the challenges of drugging transcription factors, I find the work solid and a significant scientific contribution to the field.

      Strengths:

      (1) Validation of LMO2 degradation by starting with biodegraders, then progressing to chemical degrades.

      (2) interrogation of the biology and downstream pathways upon LMO2 degradation (collateral degradation and apoptotic markers).

      (3) Cell line models that are dependent/overexpression of LMO2 vs LMO2 null cell lines.

      (4) CRBN and VHL-derived PROTACs were synthesized and evaluated.

      Weaknesses:

      (1) The conventional method used to characterize PROTACs in the literature is to calculate the DC50 and Dmax of the degraders, I did not find this information in the manuscript.

      (2) The proteomics data is not very convincing, and it is not clear why LMO2 does not show in the volcano plot (were higher concentrations of the PROTAC tested? and why only VHL was tested and not CRBN-based PROTAC?).

      (3) The correlation between degradation potency and cell growth is not well-established (compare Figure 4C: P12-Ichikawa blots show great degradation at 24 and 48 hrs, but it is unclear if the cell growth in this cell line is any better than in PF-382 or MOLT-16) - Can the authors comment on the correlation between degradation and cell growth?

      (4) The PROTACs are not very potent (double-digit micromolar range?) - can the authors elaborate on any challenges in the optimization of the degradation potency?

      (5) The authors mentioned trying six iDAb-E3 ligase proteins; I would recommend listing the E3 ligases tried and commenting on the results in the main text.

    3. Reviewer #2 (Public review):

      Summary:

      Sereesongsaeng et al. aimed to develop degraders for LMO2, an intrinsically disordered transcription factor activated by chromosomal translocation in T-ALL. The authors first focused on developing biodegraders, which are fusions of an anti-LMO2 intracellular domain antibody (iDAb) with cereblon. Following demonstrations of degradation and collateral degradation of associated proteins with biodegraders, the authors proceeded to develop PROTACs using antibody paratopes (Abd) that recruit VHL (Abd-VHL) or cereblon (Abd-CRBN). The authors show dose-dependent degradation of LMO2 in LMO2+ T-ALL cell lines, as well as concomitant dose-dependent degradation of associated bHLH proteins in the DNA-binding complex. LMO2 degradation via Abd-VHL was also determined to inhibit proliferation and induce apoptosis in LMO2+ T-ALL cell lines.

      Strengths:

      The topic of degrader development for intrinsically disordered proteins is of high interest, and the authors aimed to tackle a difficult drug target. The authors evaluated methods, including the development of biodegraders, as well as PROTACs that recruit two different E3 ligases. The study includes important chemical control experiments, as well as proteomic profiling to evaluate selectivity.

      Weaknesses:

      The overall degradation is relatively weak, and the mechanism of potential collateral degradation is not thoroughly evaluated. In addition, experiments comparing the authors' prior work with their anti-LMO2 iDAb or Abl-L are lacking, which would improve our understanding of the potential advantages of a degrader strategy for LMO2.

    1. eLife Assessment

      This well-designed, valuable study uses isotope tracing to analyse how iron limitation alters TCA cycle metabolism in Mycobacterium tuberculosis, revealing potential antibiotic targets for non-replicating bacteria in the host. The findings provide insights into metabolic remodelling under iron-limited conditions. Whilst some of the evidence is solid, the data around the GABA shunt is incomplete, requiring genetic validation, as was done for the glyoxylate shunt. Questions remain about the underlying mechanisms and their specific role in M. tuberculosis pathogenesis.

    2. Reviewer #1 (Public review):

      M. tuberculosis exhibits metabolic flexibility, enabling it to adapt to various environmental stresses, including antibiotic treatment. In this manuscript, Serafini et al. investigate the metabolic remodeling of M. tuberculosis used to survive iron-limited conditions by employing LC-MS metabolomics and 13C isotope tracing experiments. The results demonstrate that metabolic activity in the oxidative branch of the TCA cycle slows down, while the reductive branch is reverted to facilitate the biosynthesis of malate, which is subsequently secreted.

      Overall, this study is experimentally well-designed, particularly the use of 13C isotope tracing to monitor TCA cycle remodeling under iron-limited conditions. The findings are valuable as they offer potential new targets for antibiotics aimed at non-replicating M. tuberculosis occurring in the hosts. However, despite these strengths, the reviewer has concerns regarding the mechanistic basis underlying the observed metabolic remodeling and its role in M. tuberculosis pathogenesis.

      Major Comments:

      The authors argue that iron starvation is a physiologically relevant stressor encountered by M. tuberculosis post-infection. Using Erdman and H37Rv strains under DFO conditions, Erdman loses viability, whereas H37Rv maintains it. Nonetheless, both strains exhibit similar metabolic remodeling in the TCA cycle based upon metabolomics and isotope tracing data. The authors should clarify the specific metabolic adaptations in H37Rv that enable it to sustain viability under DFO conditions.

      The authors report no significant changes in NAD/NADH and ATP levels in H37Rv and Erdman exposed to DFO conditions. They observe TCA cycle remodeling, particularly the reversal of the reaction between OAA and MAL, catalyzed by malate dehydrogenase, an enzyme that uses NAD+ and NADH as cofactors. The directionality of this reaction likely depends on the relative levels of NAD+ and NADH. Additionally, other dehydrogenases, such as pyruvate DH and aKG DH, also require NAD+/NADH cofactors. In Figure 1I, NAD+ and NADH levels are monitored only at day 3 post-exposure to DFO conditions. Since Erdman loses viability after 2-3 weeks, the authors should include measurements of NAD+, NADH, and ATP levels at weekly intervals up to 3 weeks. Furthermore, glycine levels - which are linked to NAD+ recycling via the conversion of glyoxylate - should be measured under both HI and DFO conditions as an indirect indicator of the NAD+/NADH ratio.

      In Figure 2A, it is unclear why a 100-fold accumulation of aKG does not correspond proportionally to the accumulation of (iso)citrate.

      The authors state that fumarate, aKG, (iso)citrate, malate, and pyruvate are secreted under DFO conditions. While the secretion of aKG and pyruvate makes sense, given their marked intracellular accumulation, it is puzzling why (iso)citrate, malate, and fumarate are secreted even though there are no changes in their intracellular abundance. To rule out the possibility that these metabolites are released due to bacterial lysis rather than active secretion, the authors should analyze the 13C-labeled fractions of these metabolites in the culture filtrate using the M. tuberculosis culture in media containing 13C glycerol.

      To validate the role of the PCK-mediated reductive TCA cycle in malate biosynthesis and secretion under DFO conditions, the authors should generate a malate dehydrogenase (MDH) knockdown strain, considering that MDH is essential, and examine the 13C labeling patterns and NAD/NADH under DFO conditions.

      The authors also observe decreased GABA abundance and overall 13C labeling in DFO conditions, suggesting that the GABA shunt is the primary route for Succinate biosynthesis under DFO conditions. Thus, it is strongly recommended that the authors perform a 13C glutamate tracing experiment to directly track labeling in aKG and GABA shunt metabolites, providing more definitive evidence for the involvement of the GABA shunt.

    3. Reviewer #2 (Public review):

      Summary:

      The authors investigated the effect of prolonged iron limitation (which does stop growth but does not lead to cell death), altering central metabolism in M. tuberculosis. The major tool they used is metabolomics combined with stable isotope tracing. They show that the Krebs cycle is still active, despite the fact that it is dependent on some iron-dependent enzymes. They show that carbon flux through the oxidative branch of the Krebs cycle is stalled, resulting in the accumulation of metabolites, such as malate and alpha-ketoglutarate, that are partially secreted. Apparently, the carbon flux from glycolysis is partially diverted to the reductive branch of the Krebs cycle. This is not achieved by using the glyoxylate shunt but probably through the GABA shunt. This unprecedented split of the Krebs cycle and malate secretion allows a continuous flow of carbon through the core of carbon metabolism, overcoming the metabolic stalling triggered by iron starvation.

      Strengths:

      Novel insight into the central metabolism of a major pathogen and its adaptation to iron starvation. Carefully conducted experimentation. The paper ends with a clear and helpful model.

      Weaknesses:

      The authors show some surprising and important findings, but they would need a little more effort to really substantiate these. Especially the role of the GABA shunt should be genetically tested, as they did for ICL and the glyoxylate shunt.

      Also, dataset 1 is not very convincing, it is only based on transcriptomics and shown with up or down; this is not a strong base for major conclusions. As a minimum, one would want actual differences, preferably on the protein level, where it really counts.

    1. eLife Assessment

      This important paper reports the discovery of calcarins, a protein family that seems to be involved in calcification in the calcareous sponge Sycon ciliatum, significantly enhancing our understanding of the molecular and cellular mechanisms underlying spicule formation in sponges and the evolution of carbonate biomineralization. The conclusions are supported by compelling evidence based on an integrated analysis that combines transcriptomics, genomics, proteomics, and precise in situ hybridization. These findings will be of broad interest to cell biologists, biochemists, and evolutionary biologists.

    2. Reviewer #1 (Public review):

      To elucidate the mechanisms and evolution of animal biomineralization, Voigt et al. focused on the sponge phylum-the earliest branching extant metazoan lineages exhibiting biomineralized structures-with a particular emphasis on deciphering the molecular underpinnings of spicule formation. This study centered on calcareous sponges, specifically Sycon ciliatum, as characterized in previous work by Voigt et al. In S. ciliatum, two morphologically distinct spicule types are produced by set of two different types of cells that secrete extracellular matrix proteins, onto which calcium carbonate is subsequently deposited. Comparative transcriptomic analysis between a region with active spicule formation and other body regions identified 829 candidate genes involved in this process. Among these, the authors focused on the calcarine gene family, which is analogous to the Galaxins, the matrix proteins known to participate in coral calcification. The authors performed three-dimensional structure prediction using AlphaFold, examined mRNA expression of Calcarin genes in spicule-forming cell types via in situ hybridization, conducted proteomic analysis of matrix proteins isolated from purified spicules, and carried out chromosome arrangement analysis of the Calcarin genes. Based on these analyses, it was revealed that the combination of Calcarin genes expressed during spicule formation differs between the founder cells-responsible for producing diactines and triactines-and the thickener cells that differentiate from them, underscoring the necessity for precise regulation of Calcarin gene expression in proper biomineralization. Furthermore, the observation that 4 Calcarin genes are arranged in tandem arrays on the chromosome suggests that two rounds of gene duplication followed by neofunctionalization have contributed to the intricate formation of S. ciliatum spicules. Additionally, similar subtle spatiotemporal expression patterns and tandem chromosomal arrangements of Galaxins during coral calcification indicate parallel evolution of biomineralization genes between S. ciliatum and aragonitic corals.

      Strength:

      The study presents detailed and convincing insights that point to parallel evolution of biomineralization in calcitic sponges and corals. This is supported by a comprehensive analysis employing a wide range of experimental approaches including protein tertiary structure predictions, gene expression profiling during calcification (RNA seq and Whole-mount in situ hybridization), and chromosomal sequence analysis.

      An integrative research approach, encompassing transcriptomic, genomic, and proteomic analyses as well as detailed FISH.

      High-quality FISH images of Calcarin genes, along with a concise summary clearly illustrating their expression patterns, is appreciated.

      It was suggested that thickener cells originate from founder cells. To the best of my knowledge, this is the first study to demonstrate trans-differentiation of sponge cells based on the cell-type specific gene expression, as determined by in situ hybridization.

      Overall, this is a high-quality piece of work that proposes a compelling scenario for biomineralization.

      Weaknesses:

      I found no significant weakness in this manuscript.

      Comments on revisions:

      The authors have addressed all of the questions and recommendations from the prior review.

    3. Reviewer #2 (Public review):

      Summary:

      This paper reports on the discovery of calcarins, a protein family that seems involved in calcification in the sponge Sycon ciliatum, based on specific expression in sclerocytes and detection by mass spectrometry within spicules. Two aspects stand out: (1) the unexpected similarity between Sycon calcarins and the galaxins of stony corals, which are also involved in mineralization, suggesting a surprising, parallel co-option of similar genes for mineralization in these two groups; (2) the impressively cell-type-specific expression of specific calcarins, many of which are restricted to either founder or thickener cells, and to either diactines, triactines, or tetractines. The finding that calcarins likely diversified at least partly by tandem duplications (giving rise to gene clusters) is a nice bonus.

      Strengths:

      I enjoyed the thoroughness of the paper, with multiple lines of evidence supporting the hypothesized role of calcarins: spatially and temporally resolved RNAseq, mass spectrometry, and whole-mount in situ hybridization using CISH and HCR-FISH (the images are really beautiful and very convincing). The structural predictions and the similarity to galaxins are very surprising and extremely interesting, as they suggest parallel evolution of biomineralization in sponges and cnidarians during the Cambrian explosion by co-option of the same "molecular bricks".

      Weaknesses:

      I did not detect any major weakness, beyond those inherent to working with sponges (lack of direct functional inhibition of these genes) or with fast-evolving gene families with complex evolutionary histories (lack of a phylogenetic tree that would clarify the history of galaxins/calcarins and related proteins).

      Comments on revisions:

      I am fully satisfied with the revision, and notably with the new Figure 3 which is now extremely informative and readable. Congratulations on a job well done.

    4. Reviewer #3 (Public review):

      Summary:

      Voigt et al. present a comprehensive study exploring the molecular mechanisms and evolution of biomineralization in the calcareous sponge Sycon ciliatum. Using a multi-omics approach, including comparative transcriptomics, proteomics, genomic analyses, and high-resolution in situ hybridization, the authors identify 829 candidate biomineralization genes, with a special focus on the calcarin gene family. These calarains, structurally analogous to galaxin in stony corals, show cell-type- and spicule-type-specific expression patterns, revealed through meticulous FISH imaging. Chromosomal analysis further uncovers that several calcarin genes are arranged in tandem arrays, suggesting diversification via gene duplication and neofunctionalization. Notably, the study finds striking parallels between the calcarins of S. ciliatum and galaxins of aragonitic corals in terms of gene arrangement, tertiary structure predictions, and expression dynamics, pointing to a remarkable case of parallel evolution during the emergence of biomineralized skeletons in early metazoans.

      Strengths:

      The study is methodologically robust, integrating transcriptomic, proteomic, and genomic data with detailed cell biological analysis.

      High-quality, carefully annotated FISH images convincingly demonstrate the spatial expression patterns of calcarins.

      Novel evidence of sponge cell trans-differentiation is presented through cell-type-specific gene expression.

      The comparative perspective with coral galaxins is well-executed and biologically insightful, supported by structural predictions and chromosomal data.

      Figures and supplementary materials are thoughtfully revised for clarity and accessibility, addressing reviewer feedback.

      Weaknesses:

      Direct functional validation of calcarin roles in biomineralization is lacking, a limitation acknowledged by the authors and inherent to sponge models.

      The evolutionary history of calcarins and galaxins remains only partially resolved due to challenges in reconstructing phylogenies of fast-evolving gene families.

      Some initial figure annotations and definitions (e.g., "radial tube") required clarification, although these were addressed in revision.

      Overall, the work significantly advances our understanding of biomineralization´s molecular basis and its parallel evolution in early diverging metazoans.

      Comments on revisions:

      I would like to thank the authors for addressing all my comments/suggestions. I am OK with the revised version of the manuscript

    5. Author response:

      The following is the authors’ response to the original reviews.

      Reviewer #1 (Public review): 

      To elucidate the mechanisms and evolution of animal biomineralization, Voigt et al. focused on the sponge phylum - the earliest branching extant metazoan lineages exhibiting biomineralized structures - with a particular emphasis on deciphering the molecular underpinnings of spicule formation. This study centered on calcareous sponges, specifically Sycon ciliatum, as characterized in previous work by Voigt et al. In S. ciliatum, two morphologically distinct spicule types are produced by a set of two different types of cells that secrete extracellular matrix proteins, onto which calcium carbonate is subsequently deposited. Comparative transcriptomic analysis between a region with active spicule formation and other body regions identified 829 candidate genes involved in this process. Among these, the authors focused on the calcarine gene family, which is analogous to the Galaxins, the matrix proteins known to participate in coral calcification. The authors performed three-dimensional structure prediction using AlphaFold, examined mRNA expression of Calcarin genes in spiculeforming cell types via in situ hybridization, conducted proteomic analysis of matrix proteins isolated from purified spicules, and carried out chromosome arrangement analysis of the Calcarin genes.

      Based on these analyses, it was revealed that the combination of Calcarin genes expressed during spicule formation differs between the founder cells-responsible for producing diactines and triactinesand the thickener cells that differentiate from them, underscoring the necessity for precise regulation of Calcarin gene expression in proper biomineralization. Furthermore, the observation that 4 Calcarin genes are arranged in tandem arrays on the chromosome suggests that two rounds of gene duplication followed by neofunctionalization have contributed to the intricate formation of S. ciliatum spicules. Additionally, similar subtle spatiotemporal expression patterns and tandem chromosomal arrangements of Galaxins during coral calcification indicate parallel evolution of biomineralization genes between S. ciliatum and aragonitic corals. 

      Strengths: 

      (1) An integrative research approach, encompassing transcriptomic, genomic, and proteomic analyses as well as detailed FISH. 

      (2) High-quality FISH images of Calcarin genes, along with a concise summary clearly illustrating their expression patterns, is appreciated. 

      (3) It was suggested that thickener cells originate from founder cells. To the best of my knowledge, this is the first study to demonstrate trans-differentiation of sponge cells based on the cell-typespecific gene expression, as determined by in situ hybridization. 

      (4) The comparison between Calcarins of Calcite sponge and Galaxins of aragonitic corals from various perspective-including protein tertiary structure predictions, gene expression profiling during calcification, and chromosomal sequence analysis to reveal significant similarities between them. 

      We thank the reviewer for this assessment. 

      (1) The conclusions of this paper are generally well supported by the data; however, some FISH images require clearer indication or explanation.

      We have modified Fig. 3 by including some insets indicating the depicted part of the sponge body and to change the color-scheme as suggested by reviewer3 for the FISH images. In accordance to the following comment, we decided to remove single-channel views in Fig. 3 A. 

      (2) Figure S2 (B, C, D): The fluorescent signals in these images are difficult to discern. If the authors choose to present signals at such low magnification, enhancing the fluorescence signals would improve clarity. Additionally, incorporating Figure S2A as an inset within Figure S2E may be sufficient to convey the necessary information about signal localization. 

      We changed the figure according to the suggestions.

      (3) Figure S3A: The claim that Cal2-expressing spherical cells are closely associated with the choanoderm at the distal end of the radial tube is difficult to follow. Are these Cal2-expressing spherical cells interspersed among choanoderm cells, or are they positioned along the basal surface of the choanoderm? Clarifying their precise localization and indicating it in the image would strengthen the interpretation. 

      In the figure, the view is on the choanoderm that lines the inner surface of the radial tube. Our interpretation is that the spherical cells are positioned at the basal surface of the choanoderm. We updated Fig. S3, which now includes another view to support our interpretation and also indicate some choanocytes.

      (4) To further highlight the similarities between S.ciliatum and aragonitic corals in the molecular mechanisms of calcification, consider including a supplementary figure providing a concise depiction of the coral calcification process. This would offer valuable context for readers.

      We considered this suggestion, and have included such a supplementary figure (Fig. S9).

      Reviewer #2 (Public review): 

      Summary: 

      This paper reports on the discovery of calcarins, a protein family that seems involved in calcification in the sponge Sycon ciliatum, based on specific expression in sclerocytes and detection by mass spectrometry within spicules. Two aspects stand out: (1) the unexpected similarity between Sycon calcarins and the galaxins of stony corals, which are also involved in mineralization, suggesting a surprising, parallel co-option of similar genes for mineralization in these two groups; (2) the impressively cell-type-specific expression of specific calcarins, many of which are restricted to either founder or thickener cells, and to either diactines, triactines, or tetractines. The finding that calcarins likely diversified at least partly by tandem duplications (giving rise to gene clusters) is a nice bonus. 

      Strengths: 

      I enjoyed the thoroughness of the paper, with multiple lines of evidence supporting the hypothesized role of calcarins: spatially and temporally resolved RNAseq, mass spectrometry, and whole-mount in situ hybridization using CISH and HCR-FISH (the images are really beautiful and very convincing). The structural predictions and the similarity to galaxins are very surprising and extremely interesting, as they suggest parallel evolution of biomineralization in sponges and cnidarians during the Cambrian explosion by co-option of the same "molecular bricks". 

      Weaknesses: 

      I did not detect any major weakness, beyond those inherent to working with sponges (lack of direct functional inhibition of these genes) or with fast-evolving gene families with complex evolutionary histories (lack of a phylogenetic tree that would clarify the history of galaxins/calcarins and related proteins). 

      We thank the reviewer for this assessment and the detailed comments be addressed below.

      Reviewer #3 (Public review):

      Summary: 

      The study explores the extent to which the biomineralization process in the calcitic sponge Sycon ciliatum resembles aragonitic skeleton formation in stony corals. To investigate this, the authors performed transcriptomic, genomic, and proteomic analyses on S. ciliatum and examined the expression patterns of biomineralization-related genes using in situ hybridization. Among the 829 differentially expressed genes identified in sponge regions associated with spicule formation, the authors focused on calcarin genes, which encode matrix proteins analogous to coral galaxins. The expression patterns of calcarins were found to be diverse but specific to particular spicule types. Notably, these patterns resemble those of galaxins in stony corals. Moreover, the genomic organization of calcarine genes in S. ciliatum closely mirrors that of galaxin genes in corals, suggesting a case of parallel evolution in carbonate biomineralization between calcitic sponges and aragonitic corals. 

      Strengths: 

      The manuscript is well written, and the figures are of high quality. The study design and methodologies are clearly described and well-suited to addressing the central research question. Particularly noteworthy is the authors´ integration of various omics approaches with molecular and cell biology techniques. Their results support the intriguing conclusion that there is a case of parallel evolution in skeleton-building gene sets between calcitic sponges and aragonitic corals. The conclusions are well supported by the data and analyses presented. 

      Weaknesses: 

      The manuscript is strong, and I have not identified any significant weaknesses in its current form. 

      We thank the reviewer for the insight and addressed the detailed comments below.

      Reviewer #1 (Recommendations for the authors): 

      The description of the region "radial tube" is unclear. Please define and explain it at its first mention in the manuscript, and, if possible, refer to the appropriate figure(s) (e.g., Figure 1A). 

      We now explain radial tubes at the beginning of the results and added a label in figure 1A. “Sycon ciliatum is a tube-shaped sponge with a single apical osculum and a sponge wall of radial tubes around the central atrium (Fig. 1A). The radial tubes are internally lined with choanoderm, which forms elongated chambers in an angle of approximately 90° to the tube axis”. 

      Reviewer #2 (Recommendations for the authors): 

      Scientific suggestions: 

      (1) Page 13: "Despite their presence in the same orthogroups, the octocoral and stony coral proteins were only distantly related to the calcareous sponge calcarins (e.g., 12-24% identity between octocoral and calcareous sequences in orthogroup Cal 2-4-6), resulting in poor alignment. Their homology to calcarins, therefore, remains to be determined." Could 3D structures of these coral proteins be predicted with AlphaFold to substantiate (or nuance) the comparison with calcarins? 

      We run additional alphafold predictions for two octocoral and two scleractinian galaxins. A galaxin-like sequence from Pinnigorgia flava was only a short fragment and therefore we did not attempt any structure predictions. The result shows that the octocoral galaxin-like proteins show some structural similarity (12 beta-harpins), while the scleractinian galaxin-like proteins differ from the sponge counterparts of the same orthogroup. We added this information to the results and in the new Fig. S7.

      Minor improvements to the text: 

      (1)  Page 7 : "The expression of Cal1 to Cal8 was investigated using chromogenic in situ hybridization (CISH) and hairpin-chain reaction fluorescence in situ hybridization (HCR-FISH), confirming their presence in sclerocytes." - Figure 3 should be cited here. 

      We refer to the figure now.

      (2) Page 8-9: "Cal6 expression mirrors that of Cal2, occurring in rounded cells at the distal tip of radial tubes and in a ring of cells around the oscular ring." - Please cite a figure here. 

      We refer now to Fig. 3K

      (3) Page 11-12: Please define eigengene, this term is not necessarily common knowledge. 

      We provide now a short definition in this sentence: “ The analysis provided eight meta-modules, of which four showed significant changes in expression module eigengenes —summary profiles that capture the overall expression pattern of each module— between samples with high spicule formation context (osculum region and regeneration stages older than four days) and samples with low spicule formation (sponge-wall and early regeneration stages until day 3-4) (Fig. S5).” 

      (4) Page 13: "Species without skeletons, such as the cnidarians Hydra, Actinia, Exaiptasia, and Nematostella, also possess galaxin-like proteins." This is too concise - can you explain what evidence was used? PANTHER, AlphaFold, OrthoFinder, Blastp...? 

      The evidence used is from PANTHER, and we enhanced clarification of this by modifying the last sentence of the section.

      (5) Page 20: "We have identified calcarins, galaxin-like proteins, as crucial components of the biomineralization toolkit in calcareous sponges." I'm not sure you showed they are crucial (this would require functional evidence). Perhaps "novel" components or some other adjective would fit better. 

      We changed the adjective to “novel”.

      Suggestions for the figures: 

      (1) Figure 1A: radial tubes should be labelled. 

      A label was added.

      (2) Figure 3 is beautiful but hard to parse. The name of all markers should be written on each panel (notably B, C, and D) and ideally placed in a consistent position (top right corner?) so that the reader's eye doesn't have to look for them anew in each panel. Consider depicting the same gene with the same color in all panels if possible (confocal imaging gives virtual colors anyway, there's no reason to be bound to the real-life color of the fluorophores used - if that was the original intent). Finally, the red/green color scheme is not colorblind-readable, so please consider switching to another scheme (white/cyan/magenta, for example).

      We have updated the figure according to the suggestions. The names of all markers are now included on each panel. Placing them in the upper right corner was not feasible for all panels, so we adjusted their placement as needed. Reoccurring genes are shown in the same color where possible. To improve accessibility for individuals with red/green color vision deficiency, we adopted a cyan/magenta/yellow color scheme. Each HCR-FISH image was processed in ImageJ by splitting the image into channels, applying cyan, magenta, or yellow lookup tables, converting each channel to RGB, and then stacking and blending them using the Z-Project function with maximum intensity projection. Since the original channel information is not preserved after this processing, we provide the original red/green/blue version of the figure in the supplementary material in Fig S11. Additionally, we added small sketches of Figure 1A to indicate the sponge body regions depicted, where relevant.

      (3) Figure S3: the blue staining is not explained. It is also unclear where choanocytes are - could individual choanocytes be indicated with arrows or lines? 

      We added the information to the figure legend. The blue channel shows “Autofluorescence detected with the Leica TXR filter (approx. 590–650 nm), included to help distinguish true signal from background autofluorescence observed in the FITC channel (used for Spiculin detection).”

      Reviewer #3 (Recommendations for the authors): 

      I have no major concerns about the manuscript - only minor edits and comments, which are listed below: 

      (1) On page 13, the authors refer to Figure S8; however, I believe this should be Figure S7. 

      We now refer to the correct Figure. Because of introducing a new Fig. S7, now the correct reference is Fig. S8.

      (2) On page 16, please correct "Spciulin" to "Spiculin". 

      Now corrected.

      (3) On page 17, there are two commas following "(Sycon)"; please remove one. 

      Corrected.

      (4) In the Data Accessibility section, none of the provided links appear to work. Please ensure all links are functional. 

      We apologize for this oversight and now provide working links. 

      (5) In Figure 3, the description of panel L is missing from the figure legend. 

      We added the description of this panel.

      (6) On page 39, change "Fig. 4" to "Figure 4" to maintain consistency throughout the manuscript. 

      Changed.

      (7) Figure S7 is not cited in the main text. Please, address this. 

      Corrected (see above at point 1)

      (8) In the legend for Table S2, the reference to Soubigou et al. (3) is incorrect, as it is not listed in the SI reference section. Please correct this. 

      Soubigou et al. (2020) is now included in the SI reference list.

    1. eLife Assessment

      This revised study provides fundamental insights into the differences in migratory primordial germ cells based on their anterior or posterior location. Through convincing methodology and analysis of single-cell RNA sequencing of an exceptionally large number of migratory primordial germ cells and surrounding somatic cells, the novel findings and datasets generated from this study provide many hypotheses of interest to germ cell biologists.

    2. Reviewer #1 (Public review):

      Summary:

      Migration of the primordial germ cells (PGCs) in mice is asynchronous, such that leading and lagging populations of migrating PGCs emerge. Prior studies found that interactions between the cells the PGCs encounter along their migration routes regulates their proliferation. In this study, the authors used single cell RNAseq to investigate PGC heterogeneity and to characterize their niches during their migration along the AP axis. Unlike prior scRNAseq studies of mammalian PGCs, the authors conducted a time course covering 3 distinct stages of PGC migration (pre, mid, and post migration) and isolated PGCs from defined somite positions along the AP axis. In doing so, this allowed the authors to uncover differences in gene expression between leading and lagging PGCs and their niches and to investigate how their transcript profiles change over time. Among the pathways with the biggest differences were regulators of actin polymerization and epigenetic programming factors and Nodal response genes. In addition, the authors report changes in somatic niches, specifically greater non-canonical WNT in posterior PGCs compared to anterior PGCs. This relationship between the hindgut epithelium and migrating PGCs was also detected in reanalysis of a previously published dataset of human PGCs. Using whole mount immunofluorescence, the authors confirmed elevated Nodal signaling based on detection of the LEFTY antagonists and targets of Nodal during late stage PGC migration. Taken together, the authors have assembled a temporal and spatial atlas of mouse PGCs and their niches. This resource and the data herein provide support for the model that interactions of migrating mouse PGCs with their niches influences their proliferation, cytoskeletal regulation, epigenetic state and pluripotent state.

      Overall, the findings provide new insights into heterogeneity among leading and lagging PGC populations and their niches along the AP axis, as well as comparisons between mouse and human migrating PGCs. The data are clearly presented, and the text is clear and well-written. This atlas resource will be valuable to reproductive and developmental biologists as a tool for generating hypotheses and for comparisons of PGCs across species.

      Strengths:

      (1) High quality atlas of individual PGCs prior to, during and post migration and their niches at defined positions along the AP axis.

      (2) Comparisons to available datasets, including human embryos, provide insight into potentially conserved relationships among PGCs and the identified pathways and gene expression changes.

      (3) Detailed picture of PGC heterogeneity.

      (4) Valuable resource for the field.

      (5) Some validation of Nodal results and further support for models in the literature based on less comprehensive expression analysis.

    3. Reviewer #2 (Public review):

      Summary:

      Germ cells go on to form sperm and eggs and are, therefore, critical for the survival of the species. This work addresses the question of how 'leading' and 'lagging' PGCs differ, molecularly, during their migration to the mouse genital ridges/gonads during fetal life (E9.5, E10.5, E11.5), and how this is regulated by different somatic environments encountered during the process of migration. E9.5 and E10.5 cells differed in expression of genes involved in canonical WNT signaling and focal adhesions. Differences in cell adhesion, actin cytoskeletal dynamics were identified between leading and lagging cells, at E9.5, before migration into the gonads. At E10.5, when some PGCs have reached the genital ridges, differences in Nodal signaling response genes and reprogramming factors were identified. This last point was verified by whole mount IF for proteins downstream of Nodal signaling, Lefty1/2. At E11.5, there was upregulation of genes associated with chromatin remodeling and oxidative phosphorylation. Some aspects of the findings were also found to be likely true in human development, established via analysis of a dataset previously published by others.

      Strengths:

      The work is strong in that a large number of PGCs were isolated and sequenced, along with associated somatic cells. The authors dealt with the problem of a very small number of migrating mouse PGCs by pooling cells from embryos (after ascertaining age matching using somite counting). 'Leading' and 'lagging' populations were separated by anterior and posterior embryo halves and the well-established Oct4-deltaPE-eGFP reporter mouse line was used.

      The most likely possible use of this fundamental information will be the incorporation of some aspects (e.g. the potential importance of Nodal signaling) into protocols for generation of in vitro derived gametes.

    4. Reviewer #3 (Public review):

      Summary:

      The migration of primordial germ cells (PGCs) to the developing gonad is a poorly understood yet essential step in reproductive development. Here, the authors examine whether there are differences in leading and lagging migratory PGCs using single-cell RNA sequencing of mouse embryos. Cleverly, the authors dissected embryonic trunks along the anterior-to-posterior axis prior to scRNAseq in order to distinguish leading and lagging migratory PGCs. After batch corrections, their analyses revealed several known and novel differences in gene expression within and around leading and lagging PGCs, intercellular signaling networks, as well as number of genes upregulated upon gonad colonization. The authors then compared their datasets with publicly available human datasets to identify common biological themes. Altogether, this rigorous study reveals several differences between leading and lagging migratory PGCs, hints at signatures for different fates among the population of migratory PGCs, and provides new potential markers for post-migratory PGCs in both humans and mice. While many of the interesting hypotheses that arise from this work are not extensively tested, these data provide a rich platform for future investigations.

      Strengths:

      The authors have successfully navigated significant technical challenges to obtain a substantial number of mouse migratory primordial germ cells for robust transcriptomic analysis. Here, the authors were able to collect quality data on ~13,000 PGCs and ~7,800 surrounding somatic cells, which is ten times more PGCs than previous studies.

      The decision to physically separate leading and lagging primordial germ cells was clever and well-validated based on expected anterior-to-posterior transcriptional signatures.

      Within the PGCs and surrounding tissues, the authors found many gene expression dynamics they would expect to see both along the PGC migratory path as well as across developmental time, increasing confidence in the new differentially expressed genes they found.

      The comparison of their mouse-based migratory PGC datasets with existing human migratory PGC datasets is appreciated.

      The quality control, ambient RNA contamination elimination, batch correction, cell identification and analysis of scRNAseq data were thorough and well-done such that the new hypotheses and markers found through this study are dependable.

      The subsetting of cells in their trajectory analysis is appreciated, further strengthening their cell terminal state predictions.

      Weaknesses:

      There were a few validation experiments within this study. For one such experiment, whether there is a difference in pSMAD2/3 along the AP axis is unclear and not quantified, as was nicely done for Lefty1/2.

    5. Author response:

      The following is the authors’ response to the original reviews.

      Reviewer #1 (Public review):

      Summary:

      Migration of the primordial germ cells (PGCs) in mice is asynchronous, such that leading and lagging populations of migrating PGCs emerge. Prior studies found that interactions between the cells the PGCs encounter along their migration routes regulates their proliferation. In this study, the authors used single cell RNAseq to investigate PGC heterogeneity and to characterize their niches during their migration along the AP axis. Unlike prior scRNAseq studies of mammalian PGCs, the authors conducted a time course covering 3 distinct stages of PGC migration (pre, mid, and post migration) and isolated PGCs from defined somite positions along the AP axis. In doing so, this allowed the authors to uncover differences in gene expression between leading and lagging PGCs and their niches and to investigate how their transcript profiles change over time. Among the pathways with the biggest differences were regulators of actin polymerization and epigenetic programming factors and Nodal response genes. In addition, the authors report changes in somatic niches, specifically greater non-canonical WNT in posterior PGCs compared to anterior PGCs. This relationship between the hindgut epithelium and migrating PGCs was also detected in reanalysis of a previously published dataset of human PGCs. Using whole mount immunofluorescence, the authors confirmed elevated Nodal signaling based on detection of the LEFTY antagonists and targets of Nodal during late stage PGC migration. Taken together, the authors have assembled a temporal and spatial atlas of mouse PGCs and their niches. This resource and the data herein provide support for the model that interactions of migrating mouse PGCs with their niches influences their proliferation, cytoskeletal regulation, epigenetic state and pluripotent state.

      Overall, the findings provide new insights into heterogeneity among leading and lagging PGC populations and their niches along the AP axis, as well as comparisons between mouse and human migrating PGCs. The data are clearly presented, and the text is clear and well-written. This atlas resource will be valuable to reproductive and developmental biologists as a tool for generating hypotheses and for comparisons of PGCs across species.

      Strengths:

      (1) High quality atlas of individual PGCs prior to, during and post migration and their niches at defined positions along the AP axis.

      (2) Comparisons to available datasets, including human embryos, provide insight into potentially conserved relationships among PGCs and the identified pathways and gene expression changes.

      (3) Detailed picture of PGC heterogeneity.

      (4) Valuable resource for the field.

      (5) Some validation of Nodal results and further support for models in the literature based on less comprehensive expression analysis.

      Weaknesses:

      (1) No indication of which sex(es) were used for the mouse data and whether or not sex-related differences exist or can excluded at the stages examined. This should be clarified.

      We have added: “Embryos of both sexes were pooled without genotyping, as the timepoints analyzed were prior to sex specification” to both the Animals section of the Materials and Methods and the Figure 1 legend. In addition, bioinformatic evaluation of potential sex biases in Nodal-Lefty signaling using Y-chromosome gene expression is reported in supplementary figure 4 and discussed in Discussion paragraph 2.

      Reviewer #2 (Public review):

      Summary:

      This work addresses the question of how 'leading' and 'lagging' PGCs differ, molecularly, during their migration to the mouse genital ridges/gonads during fetal life (E9.5, E10.5, E11.5), and how this is regulated by different somatic environments encountered during the process of migration. E9.5 and E10.5 cells differed in expression of genes involved in canonical WNT signaling and focal adhesions. Differences in cell adhesion, actin cytoskeletal dynamics were identified between leading and lagging cells, at E9.5, before migration into the gonads. At E10.5, when some PGCs have reached the genital ridges, differences in Nodal signaling response genes and reprogramming factors were identified. This last point was verified by whole mount IF for proteins downstream of Nodal signaling, Lefty1/2. At E11.5, there was upregulation of genes associated with chromatin remodeling and oxidative phosphorylation. Some aspects of the findings were also found to be likely true in human development, established via analysis of a dataset previously published by others.

      Strengths:

      The work is strong in that a large number of PGCs were isolated and sequenced, along with associated somatic cells. The authors dealt with problem of very small number of migrating mouse PGCs by pooling cells from embryos (after ascertaining age matching using somite counting). 'Leading' and 'lagging' populations were separated by anterior and posterior embryo halves and the well-established Oct4-deltaPE-eGFP reporter mouse line was used.

      Weaknesses:

      The work seems to have been carefully done, but I do not feel the manuscript is very accessible, and I do not consider it well written. The novel findings are not easy to find. The addition of at least one figure to show the locations of putative signaling etc. would be welcome.

      Thank you for the excellent suggestion. Fig. 6 has been added to highlight the main novel findings of this work and integrate them among contributions of earlier studies to provide a more complete view of signaling pathways and cell behaviors governing PGC migration.

      (1) The initial discussion of CellRank analysis (under 'Transcriptomic shifts over developmental time...' heading) is somewhat confusing - e.g. If CellRank's 'pseudotime analysis' produces a result that seems surprising (some E9.5 cells remain in a terminal state with other E9.5 cells) and 'realtime analysis' produces something that makes more sense, is there any point including the pseudotime analysis (since you have cells from known timepoints)? Perhaps the 'batch effects' possible explanation (in Discussion) should be introduced here. Do we learn anything novel from this CellRank analysis? The 'genetic drivers' identified seem to be genes already known to be key to cell transitions during this period of development.

      Thank you for this important observation. We have clarified the text in this section and added “This discrepancy may reflect differences in differentiation potential of some E9.5 PGCs that end in a terminal state among anterior E9.5 PGCs, but could also result from technical batch effects generated during library preparation. These possible interpretations are further discussed in the Discussion section.” to the pertinent results section and added additional relevant thoughts on the implications of this finding in Discussion paragraphs 4 and 7. We feel that it is important to include both results to the reader, as it is challenging to differentiate between heterogeneous developmental and migratory potential among E9.5 anterior PGCs and differential influence of batch effects across sequencing libraries with the data available.

      (2) In Discussion - with respect to Y-chromosome correlation, it is not clear why this analysis would be done at E10.5, when E11.5 data is available (because some testis-specific effect might be more apparent at the later stage).

      Since we had identified autocrine Nodal signaling primarily in anterior late migratory PGCs at E10.5 and knew that Nodal signaling was involved in sex specification of testicular germ cells into prospermatogonia by E12.5, we wanted to determine whether the Nodal signaling in late migratory PGCs at E10.5 was likely to be a sex-specific effect or was common to PGCs in both sexes. This was assessed in supplementary figure 4 and determined unlikely to be related to sex specification of PGCs as Nodal signaling was not strongly correlated with Y-chromosome transcripts in migratory PGCs. Assessing the relationship between Nodal signaling and Y-chromsome transcription at E11.5, when migration is complete, would be unlikely to help us further understand the dynamics of Nodal signaling during late PGC migration.

      (3) Figure 2A - it seems surprising that there are two clusters of E9.5 anterior cells

      Thank you for the interesting observation! One possibility is that the two states represent differential developmental competence as is suggested by the presence of one E9.5 anterior cluster along the differentiation trajectory in Fig 2A and one not within this differentiation trajectory. Another is that technical aspects of generating these sequencing libraries affected some cells more than others, resulting in clustering of highly affected and less affected cells, which would also be consistent with some E9.5 anterior cells lying within the differentiation trajectory and some not. Since it is challenging to differentiate between these possibilities with the data available, we have intentionally avoided overstating interpretations of this result in the manuscript text. We have included discussion of the potential implications of the transcriptional divergence you identify in Discussion paragraphs 4 and 7.

      (4) Figure 5F - there does seem to be more LEFTY1/2 staining in the anterior region, but also more germ cells as highlighted by GFP

      This is true; based on our selected anatomic landmarks for “anterior” and “posterior” as indicated in Methods, the “anterior” compartment typically contains more PGCs. Thus, we have included violin plots with all data points shown of signal intensities of both LEFTY1/2 and pSMAD2/3 in Fig. 5G and 5I so that the reader can evaluate the entire distribution of PGC signal intensities for each embryo.

      Reviewer #3 (Public review):

      Summary:

      The migration of primordial germ cells (PGCs) to the developing gonad is a poorly understood, yet essential step in reproductive development. Here, the authors examine whether there are differences in leading and lagging migratory PGCs using single-cell RNA sequencing of mouse embryos. Cleverly, the authors dissected embryonic trunks along the anterior-to-posterior axis prior to scRNAseq in order to distinguish leading and lagging migratory PGCs. After batch corrections, their analyses revealed several known and novel differences in gene expression within and around leading and lagging PGCs, intercellular signaling networks, as well as number of genes upregulated upon gonad colonization. The authors then compared their datasets with publicly available human datasets to identify common biological themes. Altogether, this rigorous study reveals several differences between leading and lagging migratory PGCs, hints at signatures for different fates among the population of migratory PGCs, and provides new potential markers for post-migratory PGCs in both humans and mice. While many of the interesting hypotheses that arise from this work are not extensively tested, these data provide a rich platform for future investigations.

      Strengths:

      The authors have successfully navigated significant technical challenges to obtain a substantial number of mouse migratory primordial germ cells for robust transcriptomic analysis. Here the authors were able to collect quality data on ~13,000 PGCs and ~7,800 surrounding somatic cells, which is ten times more PGCs than previous studies.

      The decision to physically separate leading and lagging primordial germ cells was clever and well-validated based on expected anterior-to-posterior transcriptional signatures.

      Within the PGCs and surrounding tissues, the authors found many gene expression dynamics they would expect to see both along the PGC migratory path as well as across developmental time, increasing confidence in the new differentially expressed genes they found.

      The comparison of their mouse-based migratory PGC datasets with existing human migratory PGC datasets is appreciated.

      The quality control, ambient RNA contamination elimination, batch correction, cell identification and analysis of scRNAseq data were thorough and well-done such that the new hypotheses and markers found through this study are dependable.

      The subsetting of cells in their trajectory analysis is appreciated, further strengthening their cell terminal state predictions.

      Weaknesses:

      Although it is useful to compare their mouse-based dataset with human datasets, the authors used two different analysis pipelines for each dataset. While this may have been due to the small number of cells in the human dataset as mentioned, it does make it difficult to compare them.

      Direct comparisons between findings in human and mouse focused on CellChat cell-cell communication prediction results, which were conducted in an identical fashion using the same analysis methods for both datasets.

      There were few validation experiments within this study. For one such experiment, whether there is a difference in pSMAD2/3 along the AP axis is unclear and not quantified as was nicely done for Lefty1/2.

      Additional validation of the pSMAD2/3 signal intensity along the AP axis was performed and is now included in Fig. 5.

    1. eLife Assessment

      This valuable study highlights how the diversity of the malaria parasite population diminishes following the initiation of effective control interventions but quickly rebounds as control wanes. It also demonstrates that the asymptomatic reservoir is unevenly distributed across host age groups. The data presented are convincing and the work shows how genetic studies could be used to monitor changes in disease transmission.

    2. Reviewer #2 (Public review):

      In this manuscript, Tiedje and colleagues longitudinally track changes in parasite number across four time points as a way of assessing the effect of malaria control interventions in Ghana. Some of the study results have been reported previously, and in this publication, the authors focus on age-stratification of the results. Malaria prevalence was lower in all age groups after IRS. Follow-up with SMC, however, maintained lower parasite prevalence in the targeted age group but not the population as a whole. Additionally, they observe that diversity measures rebound more slowly than prevalence measures. This adds to a growing literature that demonstrates the relevance of asymptomatic reservoirs.

      Overall, I found these results clear, convincing, and well presented. There is growing interest in developing an expanded toolkit for genomic epidemiology in malaria, and detecting changes in transmission intensity is one major application. As the authors summarize, there is no one-size-fits-all approach, and the Bayesian MOIvar estimate developed here has the potential to complement currently used methods, particularly in regions with high diversity/transmission. I find its extension to a calculation of absolute parasite numbers appealing as this could serve as both a conceptually straightforward and biologically meaningful metric.

      As the authors address, their use of the term "census population size" is distinct from how the term is used in the population genetics literature. I therefore anticipate that parasite count will be most useful in an epidemiological context where the total number of sampled parasites can be contrasted with other metrics to help us better understand how parasites are divided across hosts, space, and time.

    3. Author response:

      The following is the authors’ response to the previous reviews

      Reviewer #2 (Public review): 

      In this manuscript, Tiedje and colleagues longitudinally track changes in parasite numbers across four time points as a way of assessing the effect of malaria control interventions in Ghana. Some of the study results have been reported previously, and in this publication, the authors focus on age-stratification of the results. Malaria prevalence was lower in all age groups after IRS. Follow-up with SMC, however, maintained lower parasite prevalence in the targeted age group but not the population as a whole. Additionally, they observe that diversity measures rebound more slowly than prevalence measures. This adds to a growing literature that demonstrates the relevance of asymptomatic reservoirs. 

      Strengths:  

      Overall, I found these results clear, convincing, and well-presented. There is growing interest in developing an expanded toolkit for genomic epidemiology in malaria, and detecting changes in transmission intensity is one major application. As the authors summarize, there is no one-size-fits-all approach, and the Bayesian MOIvar estimate developed here has the potential to complement currently used methods, particularly in regions with high diversity/transmission. I find its extension to a calculation of absolute parasite numbers appealing as this could serve as both a conceptually straightforward and biologically meaningful metric.

      We thank the reviewer for this positive review of our results and approach.

      Weaknesses:

      While I understand the conceptual importance of distinguishing among parasite prevalence, mean MOI, and absolute parasite number, I am not fully convinced by this manuscript's implementation of "census population size".

      This reviewer remains unconvinced of the use of the term “census population size”. This appears to be due to the dependence of the term on sample size rather than representing a count of a whole population. To give context to our use we are clear in the study presented that the term describes a count of the parasite “strains” in an age-specific sample of a human population in a specified location undergoing malaria interventions. 

      They have suggested instead using “sample parasite count”.  We argue that this definition is too specific and less applicable when we extrapolate the same concept to a different denominator, such as the population in a given area. Importantly, our ecological use of a census allows us to count the appearance of the same strain more than once should this occur in different people. 

      The authors reference the population genetic literature, but within the context of that field, "census population size" refers to the total population size (which, if not formally counted, can be extrapolated) as opposed to "effective population" size, which accounts for a multitude of demographic factors. There is often interesting biology to be gleaned from the magnitude of difference between N and Ne.

      As stated in the introduction we have been explicit in saying that we are not using a population genetic framework. Exploration of N and Ne in population genetics has merit. How this is reconciled when using a “strain” definition and not neutral markers would need to be assessed.  

      In this manuscript, however, "census population size" is used to describe the number of distinct parasites detected within a sample, not a population. As a result, the counts do not have an immediate population genetic interpretation and cannot be directly compared to Ne. This doesn't negate their usefulness but does complicate the use of a standard population genetic term.

      We are clear we are defining a census of parasite strains in an age-specific sample of a population living in two catchment areas of Bongo District. We appreciate the concern of the reviewer and have now further edited the relevant paragraphs in both the Introduction (Lines 75-80) and the Discussion (Lines 501-506) to make very clear the dependence of the reported quantity on sample size, but also its feasible extrapolation consistent with the census of a population. 

      In contrast, I think that sample parasite count will be most useful in an epidemiological context, where the total number of sampled parasites can be contrasted with other metrics to help us better understand how parasites are divided across hosts, space and time. However, for this use, I find it problematic that the metric does not appear to correct for variations in participant number. For instance, in this study, participant numbers especially varied across time for 1-5 year-olds (N=356, 216, 405, and 354 in 2012, 2014, 2015, and 2017 respectively).

      The reviewer has made an important point that for the purpose of comparisons across the four surveys or study time points (i.e., 2012, 2014, 2015, and 2017), we should "normalize" the number of individuals considered for the calculation of the "census population size".  Given that this quantity is a sum of the estimated MOI<sub>var,,</sub> we need to have constant numbers for its values to be compared across the surveys, within age group and the whole population. This is needed not only to get around the issue of the drop in 1-5 year olds surveyed in 2014 but to also stabilize the total number of individuals for the whole sample and for specific age groups. One way to do this is to use the smaller sample size for each age group across time, and to use that value to resample repeatedly for that number of individuals for surveys where we have a larger sample size. This has now been updated included in the manuscript as described in the Materials and Methods (Lines 329-341) and in the Results (Lines 415-430; see updated Figure 4 and Table supplement 7). This correction produces very similar results to those we had presented before (see updated Figure 4 and Table supplement 7).   

      As stated in our previous response we have used participant number in an interrupted time series where the population was sampled by age to look at age-specific effects of sequential interventions IRS and SMC. As shown in Table supplement 1 of the 16 age-specific samples of the total population, we have sampled very similar proportions of the population by age group across the four surveys. The only exception was the 1-5 year-old age group during the survey in 2014. We are happy to provide additional details to further clarify the lower number (or percentage) of 1-5 year olds (based on the total number of participants per survey) in 2014 (~12%; N = 216) compared to the other surveys conducted 2012, 2015, and 2017 (~18-20%; N = 356, 405, and 354, respectively). Please see Table supplement 1 for the total number of participants surveyed in each of the four surveys (i.e., 2012, 2014, 2015, and 2017).   

      This sample size variability is accounted for with other metrics like mean MOI. 

      We agree that mean MOI by age presents a way forward with variable samples to scale up. Please see updated Figure supplement 8.  

      In sum, while the manuscript opens up an interesting discussion, I'm left with an incomplete understanding of the robustness and interpretability of the new proposed metric.”

      We thank you for your opinion. We have further edited the manuscript to make clear our choice of the term and the issue of sample size.  We believe the proposed terminology is meaningful as explained above.

      Reviewer #3 (Public review): 

      Summary

      The manuscript coins a term "the census population size" which they define from the diversity of malaria parasites observed in the human community. They use it to explore changes in parasite diversity in more than 2000 people in Ghana following different control interventions. 

      Strengths:

      This is a good demonstration of how genetic information can be used to augment routinely recorded epidemiological and entomological data to understand the dynamics of malaria and how it is controlled. The genetic information does add to our understanding, though by how much is currently unclear (in this setting it says the same thing as age stratified parasite prevalence), and its relevance moving forward will depend on the practicalities and cost of the data collection and analysis. Nevertheless, this is a great dataset with good analysis and a good attempt to understand more about what is going on in the parasite population.

      Thank you to the reviewer for their supportive assessment of our research.

      Weaknesses

      None

      Reviewer #3 (Recommendations for the authors): 

      New figure supplement 8 - x-axis says percentage but goes between 0-1, so is a proportion

      We thank the reviewer for bringing this to our attention. We have amended the x-axis labels accordingly for Figure supplement 8.

    1. eLife Assessment

      This study presents fundamental new findings introducing a new approach for the reprogramming of brain glial cells to corticospinal neurons. The data is highly compelling, with multiple lines of evidence demonstrating the success of this new assay. These exciting findings set the stage for future studies of the potential of these reprogrammed cells to form functional connections in vivo and their utility in clinical conditions where corticospinal neurons are compromised.

    2. Reviewer #1 (Public review):

      Summary:

      The manuscript by Ozcan et al., presents compelling evidence demonstrating the latent potential of glial precursors of the adult cerebral cortex for neuronal reprogramming. The findings substantially advance our understanding of the potential of endogenous cells in the adult brain to be reprogrammed. Moreover, they describe a molecular cocktail that directs reprogramming toward corticospinal neurons (CSN).

      Strengths:

      Experimentally, the work is compelling and beautifully designed. The work provides a characterization of endogenous progenitors, genetic strategies to isolate them, and proof of concept of exploiting these progenitors' potential to produce a specific desired neuronal type with "a la carte" combination of transcription factors.

      Weaknesses:

      This study demonstrates reprogramming in vitro. Future research will need to assess how these reprogrammed corticospinal neurons integrate and function under physiological conditions and in models of trauma or neurodegeneration.

      Although still in its early stages, neural reprogramming holds significant promise. This study reinforces the hope that, in the future, it may be possible to restore lost or damaged neurons through targeted cellular reprogramming.

    3. Reviewer #2 (Public review):

      Summary:

      Here the authors show a novel direct neuronal reprogramming model using a very pure culture system of oligodendrocyte progenitor cells and demonstrate hallmarks of corticospinal neurons to be induced when using Neurogenin2, a dominant-negative form of Olig2 in combination with the CSN master regulator Fezf2.

      Strengths:

      This is a major achievement as the specification of reprogrammed neurons towards adequate neuronal subtypes is crucial for repair and is still largely missing. The work is carefully done, and the comparison of the neurons induced only by Neurogenin 2 versus the NVOF cocktail is very interesting and convincingly demonstrates a further subtype specification by the cocktail.

      Weaknesses:

      As carefully as it is done in vitro, the identity of projection neurons can best be assessed in vivo. If this is not possible, it could be interesting to co-culture different brain regions and see if these neurons reprogrammed with the cocktail, indeed preferentially send out axons to innervate a co-cultured spinal cord versus other brain region tissue.

    4. Author response:

      The following is the authors’ response to the original reviews.

      Reviewer #1 (Public Review):

      Summary:

      The manuscript by Ozcan et al., presents compelling evidence demonstrating the latent potential of glial precursors of the adult cerebral cortex for neuronal reprogramming. The findings substantially advance our understanding of the potential of endogenous cells in the adult brain to be reprogrammed. Moreover, they describe a molecular cocktail that directs reprogramming toward corticospinal neurons (CSN).

      Strengths:

      Experimentally, the work is compelling and beautifully designed, with no major caveats. The main conclusions are fully supported by the experiments. The work provides a characterization of endogenous progenitors, genetic strategies to isolate them, and proof of concept of exploiting these progenitors' potential to produce a specific desired neuronal type with "a la carte" combination of transcription factors.

      Weaknesses:

      Some issues need to be addressed or clarified before publication. The manuscript requires editing. It is dense and rich in details while in other parts there are a few mistakes.

      We thank the reviewer for their excellent summary and for their extremely positive review of our paper. We are pleased that the experimental design and conclusions were judged to be wellsupported.

      We have revised the paper to enhance clarity, include additional relevant citations, and refine terminology in some sections of the original version.

      We appreciate the reviewer’s thoughtful review and agree that these revisions enhance the paper.

      Reviewer #2 (Public Review):

      Summary:

      Here the authors show a novel direct neuronal reprogramming model using a very pure culture system of oligodendrocyte progenitor cells and demonstrate hallmarks of corticospinal neurons to be induced when using Neurogenin2, a dominant-negative form of Olig2 in combination with the CSN master regulator Fezf2.

      Strengths:

      This is a major achievement as the specification of reprogrammed neurons towards adequate neuronal subtypes is crucial for repair and still largely missing. The work is carefully done and the comparison of the neurons induced only by Neurogenin 2 versus the NVOF cocktail is very interesting and convincingly demonstrates a further subtype specification by the cocktail.

      Weaknesses:

      As carefully as it is done in vitro, the identity of projection neurons can best be assessed in vivo. If this is not possible, it could be interesting to co-culture different brain regions and see if these neurons reprogrammed with the cocktail, indeed preferentially send out axons to innervate a co-cultured spinal cord versus other brain region tissue.

      We appreciate the reviewer’s positive evaluation of our work and their recognition of its significance in advancing neuronal subtype specification through directed differentiation of endogenous progenitors. 

      We agree with the reviewer’s suggestion that a very interesting future stage of this work would be to investigate the projection neuron identity in vivo. We aim to pursue follow-up studies to investigate in vivo integration and connectivity of such neurons generated by directed differentiation from endogenous SOX6+/NG2+ cortical progenitors. As the reviewer insightfully suggests, co-culturing different brain regions with these neurons could offer an alternative strategy to partially assess potential preferential connectivity into cultured spinal cord vs. alternate tissue.

      We agree with the reviewer that future investigation in vivo will further strengthen the implications of this work.

      Reviewer #3 (Public Review):

      Summary:

      Ozkan, Padmanabhan, and colleagues aim to develop a lineage reprogramming strategy towards generating subcerebral projection neurons from endogenous glia with the specificity needed for disease modelling and brain repair. They set out by targeting specifically Sox6-positive NG2 glia. This choice is motivated by the authors' observation that the early postnatal forebrain of Sox6 knockout mice displays marked ectopic expression of the proneural transcription factor (TF) Neurog2, suggesting a latent neurogenic program may be derepressed in NG2 cells, which normally express Sox6. Cultured NG2 glia transfected with a construct ("NVOF") encoding Neurog2, the corticofugal neuron-specifying TF Fezf2, and a constitutive repressor form of Olig2 are efficiently reprogrammed to neurons. These acquire complex morphologies resembling those of mature endogenous neurons and are characterized by fewer abnormalities when compared to neurons induced by Neurog2 alone. NVOF-induced neurons, as a population, also express a narrower range of cortical neuron subtype-specific markers, suggesting narrowed subtype specification, a potential step forward for Neurog2-driven neuronal reprogramming. Comparison of NVOF- and Neurog2-induced neurons to endogenous subcerebral projection neurons (SCPN) also indicates Fezf2 may aid Neurog2 in directing the generation of SCPN-like neurons at the expense of other cortical neuronal subtypes.

      Strengths:

      The report describes a novel, highly homogeneous in vitro system amenable to efficient reprogramming. The authors provide evidence that Fezf2 shapes the outcome of Neurog2-driven reprogramming towards a subcerebral projection neuron identity, consistent with its known developmental roles. Also, the use of the modified RNA for transient expression of Neurog2 is very elegant.

      Weaknesses:

      The molecular characterization of NVOF-induced neurons is carried out at the bulk level, therefore not allowing to fully assess heterogeneity among NVOF-induced neurons. The suggestion of a latent neurogenic potential in postnatal cortical glia is only partially supported by the data from the Sox6 knockout. Finally, some of the many exciting implications of the study remain untested.

      Discussion:

      The study has many exciting implications that could be further tested. For example, an ultimate proof of the subcerebral projection neuron identity would be to graft NVOF cells into neonatal mice and study their projections. Another important implication is that Sox6-deficient NG2 glia may not only express Neurog2 but activate a more complete neurogenic programme, a possibility that remains untested here.

      Also, is the subcerebral projection neuron dependent on the starting cell population? Could other NG2 glia, not expressing Sox6, also be co-axed by the NVOF cocktail into subcerebral projection neurons? And if not, do they express other (Sox) transcription factors that render them more amenable to reprogramming into other cortical neuron subtypes? The authors state that SOX6-positive NG2 glia are a quiescent progenitor population. Given that NG2 glia is believed to undergo proliferation as a whole, are Sox6-positive NG2 glia an exception from this rule? Finally, the authors seem to imply that subcerebral projection neurons and Sox6-positive NG2 glia are lineage-related. However, direct evidence for this conjecture seems missing.

      We appreciate the reviewer’s thoughtful and detailed review of this work. We especially appreciate the positive evaluation of the work and the highlighting of multiple strengths of our approach, including the role of Fezf2 in refining neuronal subtype identity and the use of modified RNA to enable transient expression of Neurog2.

      We acknowledge the reviewer’s comment that single-cell transcriptomic analysis would indeed provide a more granular view of likely heterogeneity. This current study focuses on investigating the feasibility of directed differentiation of corticospinal-like neurons from endogenous progenitors. Future work employing single-cell sequencing could indeed help delineate the heterogeneity of neurons generated by directed differentiation, and potentially contribute toward identification of potential molecular roadblocks in different subsets.

      Regarding the suggestion that SOX6-deficient NG2+ progenitors might activate a broader neurogenic program, we agree that this is an intriguing possibility. We are currently conducting indepth investigation of the loss of SOX6 function in NG2+ progenitors, and we aim to submit this quite distinct work for separate publication.

      The reviewer raises an important point about whether SOX6+/NG2+ progenitors and subcerebral projection neurons are indeed normally lineage-related. In the current work, we utilized postnatal cortical SOX6+/NG2+ progenitors that are thought to be largely derived from EMX1+ and GSH2+ ventricular zone neural progenitors. Our unpublished data from the separate study noted above indicate that SOX6 is expressed by both these lineages in vivo. Since subcerebral projection neurons are derived from EMX1+ ventricular zone progenitors (SOX6-expressing), at least some of the SOX6+/NG2+ progenitors are expected to share a lineage relationship with subcerebral projection neurons. While our data strongly suggest such a link, we agree that direct lineagetracing could be pursued in future work. 

      Finally, we agree with the reviewer’s suggestion that in vivo transplantation to assess the identity and connectivity of neurons generated by directed differentiation would be very interesting, and is a natural next phase of this work. We aim to pursue such work in future investigations.

      We again thank the reviewer for their insightful comments.

      Reviewer #1 (Recommendations For The Authors): 

      The most important clarification for me concerns the initial description of the progenitors. I think there is a mistake with the transgenic line NG2. The dsRed mouse used in Figure 1 C is not described until later in the results describing Figure 2. This was confusing. Moreover, perhaps this is a reason why I get confused and do not understand how the authors conclude that SOX6+ cells are a subset of NG2positive cells. Panel C shows the opposite. Please correct the description and show the quantification of data in panel 1C.

      We thank the reviewer for their thoughtful review and for highlighting this important point. We appreciate the reviewer pointing out the benefit of further clarity regarding the NG2.DsRed transgenic mouse description in Figure 1C. We have revised the text to clarify the use of the transgenic line and ensure that the DsRed mouse is properly introduced. Additionally, we have further clarified the description explaining the basis for concluding that SOX6+ cells are a subset of NG2+ cells and further integrate this conclusion with the data presented.

      During cell sorting from the cortices of NG2.DsRed mice, we observe two distinct populations of NG2-DsRed+ cells based on fluorescence intensity in FACS: NG2-DsRed “bright” and NG2-DsRed “dim” populations. The NG2-DsRed “dim” population consists of a heterogenous mix of NESTIN+ progenitors, GFAP+ astrocytes/progenitors, a subset of NG2+ cells, and other unidentified cells. In contrast, the DsRed “bright” population includes a broader group of progenitors that also give rise to oligodendrocytes (please see Zhu, Bergles, and Nishiyama 2008), along with pericytes. 

      Previous studies have shown that, while dorsal/pallial VZ progenitors express SOX6 during embryonic development, SOX6 expression becomes restricted to interneurons postnatally (these do not express NG2 proteoglycan; Azim et al., 2009) and to the broader group of NG2+ progenitors that also give rise to oligodendrocytes. The ICC image in Fig. 1C shows bright NG2+ cells in the cortex, many of which express SOX6. Thus, we conclude that SOX6+ cells constitute a subset of NG2-DsRed+ cells. 

      In a similar line, the work is beautiful, but the manuscript can gain a lot from shortening and some more editing. for example:

      (1) In the abstract, the word inappropriate should be removed. It seems to me that is an unnecessary subjective qualification - it is hardly possible that in biology we found repression of something inappropriate.

      We have removed the word “inappropriate”.

      (2) FACS-purify these genetically accessible....establish a pure culture. Genetically accessible is nice, and I understand that it conveys that they can be traced in the mouse, but everything is genetically accessible with the right tool, and perhaps it is more informative to explain which gene or report is used for the isolation. These cells are not accessible in humans. Also, I consider it best to remove pure- the culture is pure (purified by FACS) cells.

      We have revised the text to specify the gene/reporter used for isolation instead of using "genetically accessible", and we removed "pure", since FACS purification is already explicitly mentioned.

      (3) In the initial paragraph in the results: "They are exposed to the same morphogen gradients throughout embryonic development, and thus, compared to distant cell types, have similar epigenomic and transcription landscapes." This is proven in the cited publication, but the way is stated here seems a bit of an unnecessary overstatement. The hypothesis stated after this paragraph is as good as it is with or without this argument.

      We have revised the text and simplified the statement. We agree that the hypothesis remains clear and well-supported without this emphasis.

      (4) In the result sections, "two distinct populations of DsREd-positive cells were identified based on fluorescence intensity"- I know it is correct, but when reading the percentages, I was confused because those percentages divided the population into three fractions. What the authors do not explain is that they discard the intermediate-expressing population.

      We appreciate the reviewer highlighting this inadvertent point of confusion. We erred by discussing only the two populations of central interest to us (DsRed-bright and DsRed-dim), and did not explicitly mention the DsRed-negative population. We have now clarified the text to include all three cell populations and their percentages of the total cells in all three populations (in the original manuscript and still now, ~75-78% were DsRed-negative). We have also further clarified that only DsRed-Bright cells (identified as progenitors) were used for all subsequent experiments.

      These examples illustrate the type of editing that would be appreciated but which is entirely up to the authors.

      We thank the reviewer for their thoughtful suggestions toward improving clarity and precision. We have incorporated these recommendations, along with suggestions from the other two reviewers, in the revised paper.

      Reviewer #2 (Recommendations For The Authors):

      (1)  The authors start their results section by showing in situ Hybridization for Ngn2 in control and Sox6KO mice. These control sections do not look convincing, as there is not even some signal in the adult VZSVZ region and virtually no background. Please show sections where some positive signal can also be detected in the control sections.

      We agree with the reviewer that making direct comparisons in ISH experiments is an important point. In our ISH experiments, to ensure consistency and appropriate comparisons, we process WT and KO sections together and stop the signal development simultaneously. We could have extended the development time to enhance WT signal to a detectable level, but that would have led to excessive background and over-saturated signal in the KO sections.

      To address the reviewer’s point, we have added a new supplementary figure with an additional pair of WT and KO sections, along with reference data from the Allen Brain Atlas. The WT section shows faint Neurog2 expression in the dentate gyrus region of the hippocampus, while the KO section confirms very substantial upregulation of Neurog2 in the absence of SOX6 function. These additional data enhance the clarity and depth of our results.

      Please see the following link for the Allen Brain Atlas ISH data demonstrating that Neurog2 expression in the postnatal (P4) SVZ/SGZ is inherently low. (https://developingmouse.brainmap.org/experiment/show/100093831). 

      (2) As a hallmark of projection neurons is where they send their axons, it would be important to include a biological assay for this. Of course, in vivo experiments would be great, but if this is not possible, the authors could co-culture sections from the late embryonic cortex, striatum, and spinal cord to see if the reprogrammed neurons preferentially extend their axons towards one of these targets (as normally developing neurons would, see e.g. Bolz et al., 1990).

      We agree with the reviewer’s suggestion that a very interesting future stage of this work would be to investigate the projection neuron identity including connectivity in vivo. We aim to pursue follow-up studies to investigate in vivo integration and connectivity of such neurons generated by directed differentiation from endogenous SOX6+/NG2+ cortical progenitors. As the reviewer insightfully suggests, co-culturing different brain regions with these neurons could offer an alternative strategy to partially assess potential preferential connectivity into cultured spinal cord vs. alternate tissue. This area of investigation is of substantial interest to our lab, and we aim to pursue it in the coming years– it is a very large undertaking by either approach.

      (3) However, if the loss of Sox6 is sufficient for Ngn2 to be upregulated, why did the authors not pursue this approach in their reprogramming experiments? Are these endogenous levels sufficient for reprogramming? Please add some OPC cultures from WT and KO mice to explore their conversion to neurons and possibly combine them with Olig2VP16 and Fezf2.

      We thank the reviewer for this insightful comment and for raising this broader area of inquiry regarding whether SOX6 might be down-regulated to enhance induction of neurogenesis. We are writing a separate manuscript regarding function of SOX6 in these progenitors during normal or molecularly manipulated development. We investigate function of SOX6 using both whole body null mice and a series of conditional null mice. We aim to post that work as a preprint and submit it for review and publication in the coming months. Beyond that work, the potential strategy of downregulating SOX6 function while simultaneously upregulating other molecular controls to refine directed neuronal differentiation is also of substantial interest to us, and we aim to pursue this in follow-up work. Though these are both interesting questions/topics, we respectfully submit that these broad areas of parallel, complex, and future investigation would substantially expand the scope of work in this paper, so we aim to address them in separate studies.

      (4) Please indicate independent biological replicates as individual data points in all histograms, i.e. also in Figure 2K, Figure 4I, S2H.

      We have updated the figure legends indicating the biological replicates, and explained the broad media optimization that was used successfully in all further experiments.

      (5) GFP labelling in Figures S2K-N is not convincing - too high background. Please optimize.

      We have redesigned this figure and now present it as a new supplementary figure, with GFP pseudocolored in gray and enlarged subpanels for improved visualization of cell morphology.

      Reviewer #3 (Recommendations For The Authors):

      This is an extremely well-written manuscript with very exciting implications. Obviously, not all can be tested here. Some of the suggestions are relatively easy and may be worth testing right away, others may require more extensive study in the future. In my view, completing some of the points below could make this paper a landmark study.

      I start with the key questions:

      (1) Do grafted NVOF cells give rise to subcerebral projection neurons in vivo?

      We agree with the reviewer’s suggestion that a very interesting future stage of this work would be to investigate the projection neuron identity including connectivity in vivo. As noted above in response to Reviewer 2, we aim to pursue follow-up studies to investigate in vivo integration and connectivity of such neurons generated by directed differentiation from endogenous SOX6+/NG2+ cortical progenitors. This question is of substantial interest to us, and we aim to pursue it in the coming years– as the reviewer notes, this is a very large undertaking, and beyond the scope of this paper.

      (2) What is the fate of the Sox6 deficient NG2 glia that express Neurog2? One could isolate these cells and subject them to scRNA sequencing to see how far neurogenesis proceeds without addition of exogenous factors.

      We thank the reviewer for this insightful question. As noted in our response to Reviewer 2, we are writing a separate manuscript regarding function of SOX6 in these progenitors during normal or molecularly manipulated development. We investigate function of SOX6 using both whole body null mice and a series of conditional null mice. We aim to post that work as a preprint and submit it for review and publication in the coming months, likely in early summer. We respectfully submit that this broad area of parallel, complex investigation would substantially expand the scope of work in this paper and make this paper too complex and multi-directional, so we aim to publish them as separate papers for the benefit of clarity for readers.

      (3) Obviously, what happens to Sox6-deficient (or non-deficient cells) when forced to express NVOF? In this context, it might be fair to cite Felske et al (PLoS Biol, 2023) who report Neurog2 and Fezf2-induced reprogramming in the postnatal brain. In their model, these authors did not distinguish between converted astrocytes and NG2 glia. Thus, some of the reprogrammed cells may comprise the SOX6positive cells described here.

      We thank the reviewer for highlighting for us that we inadvertently omitted referencing the important paper by Felske et al., 2023. We have now included this citation. 

      We thank the reviewer for raising this broader area of inquiry regarding whether SOX6 might be down-regulated to enhance induction of neurogenesis. Beyond the work noted above regarding function of SOX6 in these progenitors during normal or molecularly manipulated development, the potential strategy of downregulating SOX6 function while simultaneously upregulating other molecular controls to refine directed neuronal differentiation is of substantial interest to us, and we aim to pursue this in follow-up work. We again respectfully submit that this area of complex, future investigation should be addressed in future studies.

      Very interesting unaddressed questions include:

      (1) Are Sox6+ NG glia of dorsal origin? This is implied but not shown. One could use Emx1Cre lines to assess this. Are Sox6+ glia and subcerebral projection neurons clonally related? This may be more challenging. In this context, it might be again fair to refer to Herrero-Navarro et al (Science Advances 2021) who show that glia lineage related to nearby neurons gives rise to induced neurons with regional specificity.

      The reviewer raises an important question regarding the competence of SOX6+/NG2+ progenitors from distinct origins to generate corticospinal-like neurons by directed differentiation. In ongoing unpublished work, we have identified SOX6 expression by NG2+ progenitors of the three lineages derived from ventricular zone progenitors that express either Emx1, Gsh2, or Nkx2.1 transcription factors. The EMX1+ lineage-derived SOX6+/NG2+ progenitors are directly lineage related to cortical projection neurons. As the reviewer suggests, future experiments could explore potential differences in competence between these three populations.

      We again thank the reviewer for highlighting for us that we also inadvertently omitted referencing the exciting study by Herrero-Navarro that addresses the question of regional heterogeneity within astrocytes and the differential reprogramming potential related to their origins. We have now cited this paper in the manuscript.

      (2) Do other NG2 glia not give rise to subcerebral projection neurons when challenged with NVOF? Thus, how important is Sox6 expression really?

      The question of the specific competence of dorsal/cortical SOX6+/NG2+ progenitors to differentiate into corticospinal-like neurons, and the strategy of downregulating SOX6 function while simultaneously upregulating other molecular controls to direct neuronal differentiation, are both of great interest to us. In pilot experiments, we observed reduced competence of ventrallyderived SOX6+/NG2+ progenitors to generate similar neurons. We plan to pursue the SOX6 manipulation in follow up work.

      (3) Do Sox6+ NG2 glia proliferate like other NG2 glia and thereby represent a replenishable pool of progenitors?

      Yes; as noted in the text shortly after Figure 1, and as presented in Figure S3l-L, these progenitors proliferate robustly in response to the mitogens PDGF-A and FGF2.

      (4) How heterogenous are the NVOF-induced neurons? The bulk highlights the overall specificity, but does not tell whether all cells make it equally well.

      We agree with the reviewer that this is an interesting question. ICC analysis (Fig. 4G-4H) presents the variation in the levels of a few functionally important proteins in the population of NVOFinduced neurons. This could be due to any or all of at least three potential possibilities: 1) potential diversity in the population of purified SOX6+/NG2+ progenitors; 2) technical variability in the amount of NVOF plasmid delivered to individual progenitors during transfection; and/or 3) natural stochastic TF-level variations generating closely-related neuron types, that also occurs during normal development. Future experiments could explore these questions.

    1. eLife Assessment

      The authors use a range of techniques to examine the role of Aurora Kinase A (AurA) in trained immunity. The study is hypothesis driven, it uses solid experimental approaches, and the data are presented in a logical manner. The findings are valuable to the trained immunity field because they provide an in-depth look at a common inducer of trained immunity, beta-glucan.

    2. Reviewer #1 (Public review):

      In this updated and improved manuscript, the authors investigate the role of Aurora Kinase A (AurA) in trained immunity, following a broader drug screening aimed at finding inhibitors of training. They show AurA is important for trained immunity by looking at the different aspects and layers of training using broad omics screening, followed up by a more detailed investigation of specific mechanisms. The authors finalised the investigation with an in vivo MC-38 cancer model where AurA inhibition reduces beta-glucan's antitumour effects.

      Strengths:

      The experimental methods are generally well-described. I appreciate the authors' broad approach to studying different key aspects of trained immunity (from comprehensive transcriptome/chromatin accessibility measurements to detailed mechanistic experiments). Approaching the hypothesis from many different angles inspires confidence in the results. Furthermore, the large drug-screening panel is a valuable tool as these drugs are readily available for translational drug-repurposing research.

      In response to the rebuttal, I would like to compliment and thank the authors for the large amount of work they have done to improve this manuscript. They have removed most of my previous concerns and confusions, and explained some of their approaches in a way that I now agree with them - a great learning opportunity for me as well.

      Weaknesses:

      (1) The authors have adequately responded to my comments and updated the manuscript accordingly.

      (2) The authors have removed most of my concerns. Regarding the use of unpaired tests because that is what is often done in the literature: I still don't agree with this, nor do I think that 'common practice' is a solid argument to justify the approach. However, we can agree to disagree, as I know indeed that many people argue over when paired tests are appropriate in these types of experiments. I appreciate that n=2 for sequencing experiments is justifiable in the way these analyses are used as exploratory screening methods with later experimental validation. I also want to thank the authors for reporting biological replicates where relevant and (I should have mentioned this in my original review also) I appreciate they validate some findings in a separate cell line - many papers neglect this important step.

      (3) The authors have adequately responded to my comments and updated the manuscript accordingly.

      (4) The authors have adequately responded to my comments and updated the manuscript accordingly.

      (5) The authors have adequately responded to my comments and updated the manuscript accordingly.

      (6) The authors have adequately responded to my comments and updated the manuscript accordingly. They have actually gone above and beyond.

      (7) I would like to thank the authors for highlighting this information and taking away my confusion. The authors have adequately responded to my comments and updated the manuscript accordingly.

      (8) The authors have adequately responded to my comments and updated the manuscript accordingly.

      (9) I still think adding the 'alisertib alone' control would be of great added value, but I can see how it is unreasonable to ask the authors to redo those experiments.

      (10) The authors have adequately responded to my comments and updated the manuscript accordingly.

      (11) The authors have adequately responded to my comments and updated the manuscript accordingly.

      (12) I thank the authors for their work to repeat this experiment with my suggestions included. I am convinced by this nice data. I would recommend that the authors put the data from New Figure 4 also in the manuscript as it adds value to the manuscript (unless I just missed it, I don't see it in Figure 6 or the supplement). Not every reader may look at the reviewer comments/rebuttal documents.

    3. Reviewer #2 (Public review):

      Summary:

      This manuscript investigates the inhibition of Aurora A and its impact on β-glucan-induced trained immunity via the FOXO3/GNMT pathway. The study demonstrates that inhibition of Aurora A leads to overconsumption of SAM, which subsequently impairs the epigenetic reprogramming of H3K4me3 and H3K36me3, effectively abolishing the training effect.

      Strengths:

      The authors identify the role of Aurora A through small molecule screening and validation using a variety of molecular and biochemical approaches. Overall, the findings are interesting and shed light on the previously underexplored role of Aurora A in the induction of β-glucan-driven epigenetic change.

      Weaknesses:

      Given the established role of histone methylations, such as H3K4me3, in trained immunity, it is not surprising that depletion of the methyl donor SAM impairs the training response. Nonetheless, this study provides solid evidence supporting the role of Aurora A in β-glucan-induced trained immunity in murine macrophages. The part of in vivo trained immunity antitumor effect is insufficient to support the final claim as using Alisertib could inhibits Aurora A other cell types other than myeloid cells.

      Revision:

      The authors have satisfactorily addressed the majority of my concerns. In particular, the new bone marrow transplantation data convincingly demonstrate that Aurora A inhibition with Alisertib abolishes the β-glucan-trained antitumor effect-an essential finding supporting the manuscript's conclusions.

    4. Author response:

      The following is the authors’ response to the original reviews.

      Reviewer#1 (Public review):

      This work regards the role of Aurora Kinase A (AurA) in trained immunity. The authors claim that AurA is essential to the induction of trained immunity. The paper starts with a series of experiments showing the effects of suppressing AurA on beta-glucan-trained immunity. This is followed by an account of how AurA inhibition changes the epigenetic and metabolic reprogramming that are characteristic of trained immunity. The authors then zoom in on specific metabolic and epigenetic processes (regulation of S-adenosylmethionine metabolism & histone methylation). Finally, an inhibitor of AurA is used to reduce beta-glucan's anti-tumour effects in a subcutaneous MC-38 model.

      Strengths:<br /> With the exception of my confusion around the methods used for relative gene expression measurements, the experimental methods are generally well-described. I appreciate the authors' broad approach to studying different key aspects of trained immunity (from comprehensive transcriptome/chromatin accessibility measurements to detailed mechanistic experiments). Approaching the hypothesis from many different angles inspires confidence in the results (although not completely - see weaknesses section). Furthermore, the large drug-screening panel is a valuable tool as these drugs are readily available for translational drug-repurposing research.

      We thank the reviewer for the positive and encouraging comments.

      Weaknesses:

      (1) The manuscript contains factual inaccuracies such as:

      (a) Intro: the claim that trained cells display a shift from OXPHOS to glycolysis based on the paper by Cheng et al. in 2014; this was later shown to be dependent on the dose of stimulation and actually both glycolysis and OXPHOS are generally upregulated in trained cells (pmid 32320649).

      We appreciate the reviewer for pointing out this inaccuracy, and we have revised our statement to ensure accurate and updated description in manuscript. We are aware that trained immunity involves different metabolic pathways, including both glycolysis and oxidative phosphorylation [1, 2]. We also detected Oxygen Consumption Rate (please see response to comment 8 of reviewer#1) but observed no obvious increase of oxygen consumption in trained BMDMs in our experiment setting. As the reviewer pointed out, it might be dependent on the dose of stimulation.

      (b) Discussion: Trained immunity was first described as such in 2011, not decades ago.

      We are sorry for the inaccurate description, and we have corrected the statement in our revised manuscript as “Although the concept of ‘trained immunity’ has been proposed since 2011, the detailed mechanisms that regulate trained immunity are still not completely understood.”

      (2) The authors approach their hypothesis from different angles, which inspires a degree of confidence in the results. However, the statistical methods and reporting are underwhelming.

      (a) Graphs depict mean +/- SEM, whereas mean +/- SD is almost always more informative. (b) The use of 1-tailed tests is dubious in this scenario. Furthermore, in many experiments/figures the case could be made that the comparisons should be considered paired (the responses of cells from the same animal are inherently not independent due to their shared genetic background and, up until cell isolation, the same host factors like serum composition/microbiome/systemic inflammation etc). (c) It could be explained a little more clearly how multiple testing correction was done and why specific tests were chosen in each instance.

      We sincerely thank the reviewer for this thoughtful comment. (a) The data from animal experiments in which trained immunity was induced in vivo are presented as mean ± SD, while the statistical results from cell-based experiments are presented as mean ± SEM in the revised manuscript. (b) We have replaced one-tailed test with two-tailed test (see Figure 3J in revised manuscript, with updated P value label). We agree that cells derived from the same animal and subjected to different treatment conditions may be deemed paired data. We reanalyzed our data using paired statistical tests. While this led to a slight reduction in statistical significance for some comparisons, the overall trends remained consistent, and our biological interpretation remains unchanged. For in vitro experiments unpaired statistical tests are commonly used in literature [3, 4]. Thus, we still used unpaired test results here. (c) We have provided a detailed description of how multiple comparisons were performed in revised figure legends.

      (d) Most experiments are done with n = 3, some experiments are done with n = 5. This is not a lot. While I don't think power analyses should be required for simple in vitro experiments, I would be wary of drawing conclusions based on n = 3. It is also not indicated if the data points were acquired in independent experiments. ATAC-seq/RNA-seq was, judging by the figures, done on only 2 mice per group. No power calculations were done for the in vivo tumor model.

      We are sorry for the confusion in our description in figure legends. For the in vivo experiment, we determined the sample size (n=5, n refers to number of mice used as biological replicates) by referring to the animal numbers used for similar experiments in literatures. And according to a reported resource equation approach for calculating sample size in animal studies [5], n=5-7 is suitable for most of our mouse experiments. The in vitro cell assay was performed at least three independent experiments (BMs isolated from different mice), and each experiment was independently replicated at least three times and points represents biological replicates in our revised manuscript. In Figure 1A, 5 biological replicates of these experiments are presented to carefully determine a working concentration of alisertib that would not significantly affect the viability of trained macrophages, and that was subsequently used in all related cell-based experiments. As for seq data, we acknowledge the reviewer's concern regarding the small sample size (n=2) in our RNA-seq/ATAC-seq experiment. We consider the sequencing experiment mainly as an exploratory/screening approach, and performed rigorous quality control and normalization of the sequencing data to ensure the reliability of our findings. For RNA-seq data analysis, we referred to the DESeq2 manual, which specifies that its statistical framework is based on the Negative Binomial Distribution and is capable of robustly inferring differential gene expression with a minimum of two replicates per group. Therefore, the inclusion of two replicates per group was deemed sufficient for our analysis. Nevertheless, the genomic and transcriptome sequencing data were used primarily for preliminary screening, where the candidates have been extensively validated through additional experiments. For example, we conducted ChIP followed by qPCR for detecting active histone modification enrichment in Il6 and Tnf region to further verify the increased accessibility of trained immunity-induced inflammatory genes.

      (e) Furthermore, the data spread in many experiments (particularly BMDM experiments) is extremely small. I wonder if these are true biological replicates, meaning each point represents BMDMs from a different animal? (disclaimer: I work with human materials where the spread is of course always much larger than in animal experiments, so I might be misjudging this.).

      Thanks for your comments. In our initially submitted manuscript, some of the statistical results were presented as the representative data (technical replicates) from one of three independent biological replicates (including BMDMs experiments showing the suppression and rescue experiments of trained immunity under different inhibitors or activators, see original Figure 1B-C, Figure 5D, and Figure 5H, also related to Figure 1B-C, Figure 5D, and Figure 5H respectively in our revised manuscript) while other experimental data are biological replicates including CCK8 experiment, metabolic assay and ChIP-qPCR. In response to your valuable suggestion, we have revised the manuscript to present all statistical results as biological replicates from three independent experiments (presented as mean ± SEM), and we have provided all the original data for the statistical analysis results (please see Appendix 2 in resubmit system).

      (3) Maybe the authors are reserving this for a separate paper, but it would be fantastic if the authors would report the outcomes of the entire drug screening instead of only a selected few. The field would benefit from this as it would save needless repeat experiments. The list of drugs contains several known inhibitors of training (e.g. mTOR inhibitors) so there must have been more 'hits' than the reported 8 Aurora inhibitors.

      Thank you for your suggestion and we have briefly reported the outcomes of the entire drug screening in the revised manuscript. The targets of our epigenetic drug library are primarily categorized into several major classes, including Aurora kinase family, histone methyltransferase and demethylase (HMTs and KDMs), acetyltransferase and deacetylase (HDACs and SIRTs), JAK-STAT kinase family, AKT/mTOR/HIF, PARP family, and BRD family (see New Figure 1, related to Figure 1-figure supplement 1B in revised manuscript). Notably, previous studies have reported that inhibition of mTOR-HIF1α signaling axis suppressed trained immunity[6]. Our screening results also indicated that most inhibitors targeting mTOR-HIF1α signaling exhibit an inhibitory effect on trained immunity. Additionally, cyproheptadine, a specific inhibitor for SETD7, which was required for trained immunity as previously reported [7], was also identified in our screening.

      JAK-STAT signaling is closely linked to the interferon signaling pathway, and certain JAK kinase inhibitors also target SYK and TYK kinases. A previous drug library screening study has reported that SYK inhibitors suppressed trained immunity [8]. Consistently, our screening results reveal that most JAK kinase inhibitors exhibit suppressive effects on trained immunity.

      BRD (Bromodomain) and Aurora are well-established kinase families in the field of oncology. Compared to BRD, the clinical applications of the Aurora kinase inhibitor are still at early stage. In previous studies using inflammatory arthritis models where trained immunity was established, both adaptive and innate immune cells exhibited upregulated expression of AurA [9, 10]. Our study provides further evidence supporting an essential role of AurA in trained immunity, showing that AurA inhibition leads to the suppression of trained immunity.

      (4) Relating to the drug screen and subsequent experiments: it is unclear to me in supplementary figure 1B which concentrations belong to secondary screens #1/#2 - the methods mention 5 µM for the primary screen and "0.2 and 1 µM" for secondary screens, is it in this order or in order of descending concentration?

      Thank you for your comments and we are sorry for unclear labelled results in original manuscript (related to Figure 1-supplement 1C). We performed secondary drug screen at two concentrations, and drug concentrations corresponding to secondary screen#1 and #2 are 0.2 and 1 μM respectively. It was just in this order, but not in an order of descending concentration.

      (a) It is unclear if the drug screen was performed with technical replicates or not - the supplementary figure 1B suggests no replicates and quite a large spread (in some cases lower concentration works better?)

      Thank you for your question. The drug screen was performed without technical replicates for initial screening purpose, and we need to verify any hit in the following experiment individually. Yes, we observed that lower concentration works better in some cases. We speculate that it might be due to the fact that the drug's effect correlates positively with its concentration only within a specific range. But in our primary screening, we simply choose one concentration for all the drugs. This is a limitation for our screening, and we acknowledge this limitation in our discussion part.

      (5) The methods for (presumably) qPCR for measuring gene expression in Figure 1C are missing. Which reference gene was used and is this a suitably stable gene?

      We are sorry for this omission. The mRNA expression of Il6 and Tnf in trained BMDMs was analyzed by a quantitative real-time PCR via a DDCt method, and the result was normalized to untrained BMDMs with Actb (β-actin) as a reference gene, a well-documented gene with stable expression in macrophages. We have supplemented the description for measuring gene expression in Material and Methods in our revised manuscript.

      (6) From the complete unedited blot image of Figure 1D it appears that the p-Aurora and total Aurora are not from the same gel (discordant number of lanes and positioning). This could be alright if there are no/only slight technical errors, but I find it misleading as it is presented as if the actin (loading control to account for aforementioned technical errors!) counts for the entire figure.

      We are very sorry for this omission. In the original data, p-Aurora and total Aurora were from different gels. In this experiment the membrane stripping/reprobing after p-Aurora antibody did not work well, so we couldn’t get all results from one gel, and we had to run another gel using the same samples to blot with anti-aurora antibody and used β-tubulin as loading control for total AurA (please see New Figure 2A, also related to original Figure 1D). We have provided the source data for β-tubulin from the same membrane of total AurA (please see Figure 1-source data). To avoid any potential misleading, we have repeated this experiment and updated this Figure (please see New Figure 2B, also related to Figure 1D in revised manuscript) with phospho-AurA, total AurA and β-actin from the same gel. The bands for phospho AurA (T288) were obtained using a new antibody (Invitrogen, 44-1210G) and we have revised this information in Material and Methods. We have provided data of three biological replicates to confirm the experiment result also see New Figure 2B, related to Figure 1D in revised manuscript, and the raw data have been added in source data for Figure 1)

      (7) Figure 2: This figure highlights results that are by far not the strongest ones - I think the 'top hits' deserve some more glory. A small explanation on why the highlighted results were selected would have been fitting.

      We appreciate the valuable suggestion. Figure 2 (see also Figure 2 in revised manuscript) presented information on the chromatin landscape affected by AurA inhibition to confirm that AurA inhibition impaired key gene activation involved in pro-inflammatory macrophage activation by β-glucan. In Figure 2B we highlighted a few classical GO terms downregulated including “regulation of growth”, “myeloid leukocyte activation” and “MAPK cascade” (see also Figure 2B in revised manuscript), among which “regulation of growth” is known function of Aurora A, just to show that alisertib indeed inhibited Aurora A function in vivo as expected. “Myeloid leukocyte activation” and “MAPK cascade” were to show the impaired pro-inflammatory gene accessibility. We highlighted KEGG terms downregulated like “JAK-STAT signaling pathway”, “TNF signaling pathway” and “NF-kappa B signaling pathway” in Figure 2F (see also Figure 2F in revised manuscript), as these pathways are highly relevant to trained immunity. Meanwhile, KEGG terms “FOXO signaling pathway” (see also Figure 2G in revised manuscript) was highlighted to confirm the anti-inflammation effect of alisertib in trained BMDMs, which was further illustrated in Figure 5 (see also Figure 5 in revised manuscript, illustrating FOXO3 acts downstream of AurA). Some top hits in Figure 2B like “positive regulation of cell adhesion”, and “pathway of neurodegeneration” and "ubiquitin mediated proteolysis" in Figure 2F and 2G, is not directly related to trained immunity, thus we did not highlight them, but may provide some potential information for future investigation on other functions of Aurora A.

      (8) Figure 3 incl supplement: the carbon tracing experiments show more glucose-carbon going into TCA cycle (suggesting upregulated oxidative metabolism), but no mito stress test was performed on the seahorse.

      We appreciate this question raised by the reviewer. We previously performed seahorse XF analyze to measure oxygen consumption rate (OCR) in β-glucan-trained BMDMs. The results showed no obvious increase in oxidative phosphorylation (OXPHOS) indicated by OCR under β-glucan stimulation (related to Figure 3-figure supplement 1 A) although the carbon tracing experiments showed more glucose-carbon going into TCA cycle. We speculate that the observed discrepancy between increased glucose incorporation into TCA cycle and unchanged OXPHOS may reflect a characteristic metabolic reprogramming induced by trained immunity. The increased incorporation of glucose-derived carbon into the TCA cycle likely serves a biosynthetic purpose—supplying intermediates for anabolic processes—rather than augmenting mitochondrial respiration[6]. Moreover, the unchanged OXPHOS may be attributed to a reduced reliance on fatty acid oxidation- “catabolism”, with glucose-derived acetyl-CoA becoming the predominant substrate. Thus, while overall OXPHOS remains stable, the glucose contribution to the TCA cycle increases. This is in line with reports showing that trained immunity promotes fatty acid synthesis- “anabolism”[11]. Alternatively, the partial decoupling of the TCA cycle from OXPHOS could result from the diversion of intermediates such as fumarate out of the cycle. Oxygen consumption rate (OCR) after a mito stress test upon sequential addition of oligomycin (Oligo, 1 μM), FCCP (1 mM), and Rotenone/antimycin (R/A, 0.5 μM), in BMDMs with different treatment for 24 h. β-glucan, 50 μg/mL; alisertib, 1 μM.

      (9) Inconsistent use of an 'alisertib-alone' control in addition to 'medium', 'b-glucan', 'b-glucan + alisertib'. This control would be of great added value in many cases, in my opinion.

      Thank you for your comment. We appreciate that including “alisertib-alone” group throughout all the experiments may further solidify the results. We set the aim of the current study to investigate the role of Aurora kinase A in trained immunity. Therefore, in most settings, we did not include the group of alisertib only without β-glucan stimulation.

      (10) Figure 4A: looking at the unedited blot images, the blot for H3K36me3 appears in its original orientation, whereas other images appear horizontally mirrored. Please note, I don't think there is any malicious intent but this is quite sloppy and the authors should explain why/how this happened (are they different gels and the loading sequence was reversed?)

      Thank you for pointing out this error. After checking the original data, we found that we indeed misassembled the orientation of several blots in original data submitted. We went through the assembling process and figured out that the orientation of blots in original data was assembled according to the loading sequences, but not saved correctly, so that the orientations in Figure 4A were not consistent with the unedited blot image. We are sorry for this careless mistake, and we have double checked to make sure all the blots are correctly assembled in the revised manuscript. We also provided three replicates of for the Western blot results showing the level of H3K36me3 in trained BMDMs was inhibited by alisertib (as seen in New Figure 7 at recommendation 2 of reviewer#2).

      (11) For many figures, for example prominently figure 5, the text describes 'beta-glucan training' whereas the figures actually depict acute stimulation with beta-glucan. While this is partially a semantic issue (technically, the stimulation is 'the training-phase' of the experiment), this could confuse the reader.

      Thanks for the reviewer’s suggestion and we have reorganized our language to ensure clarity and avoid any inconsistencies that might lead to misunderstanding.

      (12) Figure 6: Cytokines, especially IL-6 and IL-1β, can be excreted by tumour cells and have pro-tumoral functions. This is not likely in the context of the other results in this case, but since there is flow cytometry data from the tumour material it would have been nice to see also intracellular cytokine staining to pinpoint the source of these cytokines.

      Thanks for the reviewer’s suggestion. In Figure 6, we performed assay in mouse tumor model and found that trained immunity upregulated cytokines level like IL-6 in tumor tissue, which was downregulated by alisertib administration. In order to rule out the possibility that the detected cytokines such as IL-6 was from tumor cells, we performed intracellular cytokine staining of single cells isolated from tumor tissues (please see New Figure 4). The result showed that only a small fraction of non-immune cells (CD45<sup>-</sup> population) expressed IL-6 (0.37% ± 0.11%), whereas a significantly higher proportion of IL-6-positive cells was observed among CD45<sup>+</sup> population (deemed as immune cells, 13.66% ± 1.82%), myeloid cells (CD45<sup>+</sup>CD11b<sup>+</sup>, 15.60% ± 2.19%), and in particular, macrophages (CD45<sup>+</sup>CD11b<sup>+</sup>F4/80<sup>+</sup>37.24% ± 3.04%). These findings strongly suggest that immune cells, especially macrophages, are the predominant source of IL-6 cytokine within the tumor microenvironment. Moreover, we also detected higher IL-6 positive population in myeloid cells and macrophages (please see Figure 6I in revised manuscript).

      Reviewer#2 (Public review):

      Summary:

      This manuscript investigates the inhibition of Aurora A and its impact on β-glucan-induced trained immunity via the FOXO3/GNMT pathway. The study demonstrates that inhibition of Aurora A leads to overconsumption of SAM, which subsequently impairs the epigenetic reprogramming of H3K4me3 and H3K36me3, effectively abolishing the training effect.

      Strengths:

      The authors identify the role of Aurora A through small molecule screening and validation using a variety of molecular and biochemical approaches. Overall, the findings are interesting and shed light on the previously underexplored role of Aurora A in the induction of β-glucan-driven epigenetic change.

      We thank the reviewer for the positive and encouraging comments.

      Weaknesses:

      Given the established role of histone methylations, such as H3K4me3, in trained immunity, it is not surprising that depletion of the methyl donor SAM impairs the training response. Nonetheless, this study provides solid evidence supporting the role of Aurora A in β-glucan-induced trained immunity in murine macrophages. The part of in vivo trained immunity antitumor effect is insufficient to support the final claim as using Alisertib could inhibits Aurora A other cell types other than myeloid cells.

      We appreciate the question raised by the reviewer. Though SAM generally acts as a methyl donor, whether the epigenetic reprogram in trained immunity is directly linked to SAM metabolism was not formally tested previously. In our study, we provided evidence suggesting the necessity of SAM maintenance in supporting trained immunity. As for in vivo tumor model, we agree that alisertib may inhibits Aurora A in many cell types besides myeloid cells. To further address the reviewer’s concern, we have performed the suggested bone marrow transplantation experiment (trained mice as donor and naïve mice as recipient) to verify the contribution of myeloid cell-mediated trained immunity for antitumor effect (please see New Figure 8, also related to Figure 6C, 6D and Figure 6-figure supplement 1B and 1C in revised manuscript).

      Reviewer #1 (Recommendations for the authors):

      Some examples of spelling errors and other mistakes (by far not a complete list):

      (a) Introduction, second sentence: reads as if Candida albicans (which should be italicised and capitalised properly) and BCG are microbial polysaccharide components.

      (b) Methods: ECAR is ExtraCellular Acidification Rate, not 'Extracellular Acid Ratio'

      (c) Figure 2C: β-glucan is misspelled in the graph title.

      (d) TNFα has been renamed to 'TNF' for a long time now.

      (e) Inconsistent use of Tnf and Tfnα (the correct gene symbol is Tnf) (NB: this field does not allow me to italicise gene symbols)

      (f) Figure supplement 1B: 'secdonary'

      (g) Caption of figure 4: "Turkey's multiple-comparison test"

      (h) etc

      I would ask the authors that they please go over the entire manuscript very carefully to correct such errors.

      We apologize for these errors and careless mistakes. We greatly appreciate your suggestions, and have carefully proofread the revised manuscript to make sure no further mistakes.

      Please also address the points I raised in the public review about statistical approaches. Even more important than the relatively low 'n' is my question about biological replicates. Please clarify what you mean by 'biological replicate'.If you are able to repeat at least the in vitro experiments (if this is too much work pick the most important ones) a few more times this would really strengthen the results.

      Thank you for your comment. Our biological replicates refer to independently repeated experiments using bone marrow cells isolated from different mice, and n represents the number of mice used. We repeated each experiment at least three times using BMDMs isolated from different mice (n =3, biological replicates). Specifically, we repeated several in vitro experiments showing inhibition of AurA upregulated GNMT in trained BMDMs and showing transcription factor FOXO3 acted as a key protein in AurA-mediated GNMT expression to control trained immunity as well as showing mTOR agonist rescued trained immunity inhibited by alisertib (see New Figure 5, related to Figure 5B-C, Figure 5H in revised manuscript). Additionally, we have provided data with three biological replicates to show the β-glucan induced phosphorylation of AurA (see comment 6 of reviewer#1) and changes of histone modification marker under AurA inhibition and GNMT deficiency (see recommendation 2 of reviewer#2). We also repeated in vivo tumor model to analysis intratumor cytokines (see recommendation 12 of reviewer#1).

      Finally: the authors report 'no funders' during submission, but the manuscript contains funding details. Please modify this in the eLife submission system if possible.

      Thank you for your kind reminder and we have modified funding information in the submission system.

      Reviewer #2 (Recommendations for the authors):

      (1) I have the following methodological and interpretative comments for consideration:

      Aurora A has been previously implicated in M1 macrophage differentiation and NF-κB signaling. What is the effect of Aurora A inhibition on basal LPS stimulation? Considering that β-glucan + Ali also skews macrophage priming towards an M2 phenotype, as shown in Fig. 2E, further clarification on this point would strengthen the study.

      Thanks for your suggestion. Previous study showed AurA was upregulated in LPS-stimulated macrophages and the inhibition of AurA downregulated M1 markers of LPS-stimulated macrophages through NF-κB pathway but did not affect IL-4-induced M2 macrophage polarization [12]. Consistently, we also found that AurA inhibition downregulated inflammatory response upon basal LPS stimulation as shown by decreased IL-6 level (see New Figure 6). In original Figure 2E (also related to Figure 2E in revised manuscript), we showed an increased accessibility of Mrc1 and Chil3 under “β-glucan +Ali” before re-challenge, both of which are typical M2 macrophage markers. Motif analysis showed that AurA inhibition would upregulate genes controlled by PPARγ (STAT6 was not predicted). Different from STAT6, a classical transcriptional factor in controlling M2 polarization (M2a) dependent on IL-4 or IL-13, PPARγ mediates M2 polarization toward M2c and mainly controls cellular metabolism on anti-inflammation independent on IL-4 or IL-13. Thus, we speculate that inhibition of AurA might promote non-classical M2 polarization, and the details warrant future investigation.

      (2) In Figure 4A, it looks like that H3K27me3 is also significantly upregulated by β-glucan and inhibited by Ali. How many biological replicates were performed for these experiments? It would be beneficial to include densitometric analyses to visualize differences across multiple Western blot experiments for better reproducibility and quantitative assessment. In addition, what is the effect of treatment of Ali alone on the epigenetic profiling of macrophages?

      We are sorry for this confusion. Each experiment was performed with at least three independent biological replicates. In original Figure 4-figure supplement 1 (also related to Figure 4-figure supplementary 1 in the revised manuscript), we presented the densitometric analysis results from three independent Western blot experiments, which showed that β-glucan did not affect H3K27me3 levels under our experimental conditions. Three biological replicates data for histone modification were shown as follows (New Figure 7, as related to Figure 4-figure supplement 1 in revised manuscript). We appreciate that assay for “Ali alone” in macrophages may add more value to the findings. We set the aim of the current study to investigate the role of Aurora kinase A in trained immunity, and we know that alisertib itself would not induce or suppress trained immunity. Therefore, in most settings, we did not test the effect of Alisertib alone without β-glucan stimulation.

      (3) The IL-6 and TNF concentrations exhibit considerable variability (Fig. 3K and Fig. 5H), ranging from below 10 pg/mL to 500-1000 pg/mL. Please specify the number of replicates for these experiments and provide more detail on how variability was managed. Including this information would enhance the robustness of the conclusions.

      Thank you for your comment. These experiments were replicated as least three times using BMDMs isolated from different mice. The observed variations in cytokines concentration may be attributed to factors such as differences in cell density, variability among individual mice, and the passage number of the MC38 cells used for supernatant collection. We have prepared new batch of BMDMs and repeated the experiment and provided consistent results in the revised manuscript (please see Figure 5H in revised manuscript). Data for biological replicates have been provided (please see Appendix 2 in resubmit system).

      (4) The impact of Aurora A inhibition on β-glucan-induced anti-tumor responses appears complex. Specifically, GNMT expression is significantly upregulated in F4/80- cells, with stronger effects compared to F4/80+ cells as seen in Fig. 6D. To discern whether this is due to the abolishment of trained immunity in myeloid cells or an effect of Ali on tumor cells which inhibit tumor growth, I suggest performing bone marrow transplantation. Transplant naïve or trained donor BM into naïve recipients, followed by MC38 tumor transplantation, to clarify the mechanistic contribution of trained immunity versus off-target effects.

      Thanks for your valuable suggestion. Following your suggestion, we have performed bone marrow transplantation to clarify that alisertib acts on the BM cells to inhibit anti-tumor effect induced by trained immunity (see New Figure 8, related to Figure 6C-D in revised manuscript). As the results shown below, transplantation of trained BM cells conferred antitumor activity in recipient mice, while transplantation of trained BM cells with alisertib treatment lost such activity, further demonstrating that alisertib inhibited AurA in trained BM cells to impair their antitumor activity.

      References

      (1) Ferreira, A.V., et al., Metabolic Regulation in the Induction of Trained Immunity. Semin Immunopathol, 2024. 46(3-4): p. 7.

      (2) Keating, S.T., et al., Rewiring of glucose metabolism defines trained immunity induced by oxidized low-density lipoprotein. J Mol Med (Berl), 2020. 98(6): p. 819-831.

      (3) Cui, L., et al., N(6)-methyladenosine modification-tuned lipid metabolism controls skin immune homeostasis via regulating neutrophil chemotaxis. Sci Adv, 2024. 10(40): p. eadp5332.

      (4) Yu, W., et al., One-Carbon Metabolism Supports S-Adenosylmethionine and Histone Methylation to Drive Inflammatory Macrophages. Mol Cell, 2019. 75(6): p. 1147-1160 e5.

      (5) Arifin, W.N. and W.M. Zahiruddin, Sample Size Calculation in Animal Studies Using Resource Equation Approach. Malays J Med Sci, 2017. 24(5): p. 101-105.

      (6) Cheng, S.C., et al., mTOR- and HIF-1α-mediated aerobic glycolysis as metabolic basis for trained immunity. Science, 2014. 345(6204): p. 1250684.

      (7) Keating, S.T., et al., The Set7 Lysine Methyltransferase Regulates Plasticity in Oxidative Phosphorylation Necessary for Trained Immunity Induced by β-Glucan. Cell Rep, 2020. 31(3): p. 107548.

      (8) John, S.P., et al., Small-molecule screening identifies Syk kinase inhibition and rutaecarpine as modulators of macrophage training and SARS-CoV-2 infection. Cell Rep, 2022. 41(1): p. 111441.

      (9) Glant, T.T., et al., Differentially expressed epigenome modifiers, including aurora kinases A and B, in immune cells in rheumatoid arthritis in humans and mouse models. Arthritis Rheum, 2013. 65(7): p. 1725-35.

      (10) Jeljeli, M.M. and I.E. Adamopoulos, Innate immune memory in inflammatory arthritis. Nat Rev Rheumatol, 2023. 19(10): p. 627-639

      (11) Ferreira, A.V., et al., Fatty acid desaturation and lipoxygenase pathways support trained immunity. Nat Commun, 2023. 14(1): p. 7385.

      (12) Ding, L., et al., Aurora kinase a regulates m1 macrophage polarization and plays a role in experimental autoimmune encephalomyelitis. Inflammation, 2015. 38(2): p. 800-11.

    1. eLife Assessment

      This manuscript reports a large series of experiments to investigate specific aspects of plant adaptation, leveraging genetic and genomic resources of Arabidopsis thaliana. The study provides convincing evidence for local adaptation in this highly selfing plant. This is an important dataset contributing to the developing understanding of non-linear selection in plants and beyond.

    2. Reviewer #1 (Public review):

      Summary:

      As a general phenomenon, adaptation of populations to their respective local conditions is well-documented, though not universally. In particular, local adaptation has been amply demonstrated in Arabidopsis thaliana, the focal species of this research, which is naturally highly selfing. Here, the authors report assays designed to evaluate the spatial scale of fitness variation among source populations and sites, as well as temporal variability in fitness expression. Further, they endeavor to identify traits and genomic regions that contribute to the demonstrated variation in fitness.

      Strengths:

      With many (200) inbred accessions drawn from throughout Sweden, the study offers an unusually fine sampling of genetic variation within this much-studied species, and through assays in multiple sites and years, it amply demonstrates the context-dependence of fitness expression. It supports the general phenomenon of local adaptation, with multiple nuances. Other examples exist, but it is of value to have further cases illustrating not only the context-dependence of fitness expression but also the sometimes idiosyncratic nature of fitness variation. I commend the authors on their cautionary language in relation to inferences about the roles of particular genomic regions (e.g.l.140-144; l.227)

      Weaknesses:

      To my mind, the manuscript is written primarily for the Arabidopsis community. This community is certainly large, but there are many evolutionary biologists who could appreciate this work but are not invited to do so. The authors could address the broader evolution community by acknowledging more of the relevant work of others (I've noted a few references in my comments to the authors). At least as important, the authors could make clearer the fact that A. thaliana is (almost) strictly selfing and how this feature of its biology both enables such a study and also limits inferences from it. Further, it seems to me that though I could be wrong, readers would appreciate a more direct, less discursive style of writing, and one that makes the broader import of the focal questions clearer.

      As a reader, I would value seeing estimates of the overall fitness of the accessions in the different conditions, i.e., by combining the survival and fecundity results of the common garden experiments.

    3. Reviewer #2 (Public review):

      Summary:

      The goal of this study was to find evidence for local adaptation in survival and fecundity of the model plant Arabidopsis thaliana. The authors grew a large set of Swedish Arabidopsis accessions at four common garden sites in northern and southern Sweden. Accessions were grown from seed in trays, which were laid on the ground at each site in late summer, screened for survival in fall and the following spring, and fecundity was determined from rosette size and seed production in spring. Experiments were complemented by 'selection experiments', in which seeds of the same accessions were sown in plots, and after two years of growth, plants were sampled to determine fitness from genotype frequencies, providing a more comprehensive evaluation of lifetime fitness than can be gleaned from fecundity alone.

      As the main result, southern accessions had higher mortality in northern sites in one of two years, but also suffered more slug damage in southern sites in one year, indicating a potential link between frost tolerance and herbivore resistance. Fecundity of accession was highest when growing close to the 'home' environment, but while accessions from one sand dune population in southern Sweden had among the lowest fecundities overall, they consistently had the highest fitness in the selection experiment. Accessions from this population had large seed size and rapid root growth, which might be related to establishment success when arriving in a new, partially occupied habitat. However, neither trait could fully explain the very high fitness of this population, suggesting the presence of other, unmeasured traits.

      Overall, the authors could provide clear evidence of local adaptation in different traits for some of their experiments, but they also highlight high temporal and spatial variability that makes prediction of microevolutionary change so challenging.

      Strengths:

      A major strength of this study is the highly comprehensive evaluation of different fitness-related traits of Arabidopsis under natural conditions. The evaluation of survival and fecundity in common garden experiments across four sites and two years provides an estimate of variability and consistency of results. The addition of the 'selection experiment' provides an extended view on plant fitness that is both original and interesting, in particular highlighting potential limitations of 'fitness-proxies' such as seed production that don't take into account seedling establishment and competitive exclusion.

      Throughout the study, the authors have gone to impressive depths in exploring their data, and particularly the discovery of 'native volunteers' in selection experiment plots and their statistical treatment is very elegant and has resulted in compelling conclusions. Also, while the authors are careful in the interpretation of their GWAS results, they nonetheless highlight a few interesting gene candidates that may be underlying the observed plant adaptations, and which likely will stimulate further research.

      Overall, the authors provide a rich new resource that is relevant and interesting both in the context of general evolutionary theory as well as more specifically for molecular biology.

      Weaknesses:

      While the repetition of the common garden experiments over two years is certainly better than no repetition (hence its mention also under 'strengths'), the very high variability found between the two years highlights the need for more extensive temporal replication. In this context, two temporal replicates are the bare minimum, and more repeats in time would be necessary to draw any kind of conclusion about the role of 'high mortality' and 'low mortality' years for the microevolution of Arabidopsis. It also seems that the authors missed an opportunity to explore potentially causal variation among years, as they did not attempt to relate winter mortality to actual climatic variables, even though they discuss winter harshness as a potential predictor.

      The low temporal variation also makes the accidental slug herbivory appear somewhat random. Potted plants are notoriously susceptible to slug herbivory, and while it is certainly nice that slug damage predominantly affected one group of accessions, it nonetheless raises the question whether this reflects a 'real' selection pressure that plants commonly face in their respective local environments.

      The addition of the 'selection experiment' is certainly original and provides valuable additional insights, but again, it seems a bit questionable which natural process really has affected this outcome. While the genetic and statistical analysis of this experiment seems to be state-of-the-art, the experimental design is rather rudimentary compared to more standard selection experiments. Specifically, the authors added seeds from greenhouse-grown mothers to experimental plots and only sampled plants two years later. This means that, potentially,y the first very big bottleneck was germination under natural conditions, which may have already excluded many of the accessions before they had a chance to grow. While this certainly is one type of selection, it is not exactly the type of selection that a 2-year selection experiment is set up to measure. Either initially establishing the selection experiment from plants instead of seeds, or genotyping the population over several generations, would have substantially strengthened the conclusions that could be drawn from this experiment. Also, the complete lack of information on population density is a bit problematic. It is not clear if there were other (non-Arabidopsis) plants present in the plots, how many Arabidopsis plants were established, if numbers changed over the year, etc. Given all of these limitations, calling this a 'selection experiment' is in fact somewhat misleading.

      Despite these weaknesses, the authors could achieve their main goals, and despite the somewhat minimal temporal replication, they were lucky to sample two fairly distinct years that provided them with interesting variation, which they could partially explain using the variation among their accessions. Overall, this study will likely make an important contribution to the field of evolutionary biology, and it is another very strong example of how the extensive molecular tools in Arabidopsis can be leveraged to address fundamental questions in evolution and ecology, to an extent that is not (yet) possible in other plant systems.

    4. Reviewer #3 (Public review):

      Summary:

      The manuscript presents a large common garden experiment across Sweden using solely local germplasm. Additionally, there is a collection of selection experiments that begin investigating the factors shaping fecundity in these populations. This provides an impressive amount of data and analysis investigating the underlying factors involved. Together, this helps support the data showing that fluctuations and interactions are key components determining Arabidopsis fitness and are more broadly applicable across plant and non-plant species.

      Strengths:

      The field trials are well conducted with extensive effort and sampling. Similarly while the genetic analysis is complex it is well conducted and reflects the complexity of dealing with population structure that may be intricately linked to adaptive structure. This has no real solution and the option of presenting results with and without correction is likely the only appropriate option.

      Weaknesses:

      A significant finding from this study was that fecundity is shaped more by yearly fluctuations and their interaction with genotype than it is by the main effect of location or genotype. Another significant finding is that the strength of selection can be quite strong, with nearly 5x ranges across accessions. It should be noted that there are a number of other studies using Arabidopsis in the wild with multiple years and locations that found similar observations beyond the Oakley citation. In general, the context of how these findings relate to existing knowledge in Arabidopsis is a bit underdeveloped.

      The effects of the populations across the locations seem to rely on individual tests and PC analysis. It would seem to be possible to incorporate these tests more directly in the linear modeling analysis, and it isn't quite clear why this wasn't conducted.

      I'm a bit puzzled by the discussion on how to find causative loci. This seems to focus solely on GWAS as the solution, with a goal to sequence vast individuals. But the loci that the manuscript discussed were found by a combination of structured mapping populations followed by molecular validation that then informed the GWAS. As such, I'm unsure if the proposed future approach of more sequencing is the best when a more balanced approach integrating diverse methods and population types will be more useful.

    5. Author response:

      Reviewer #1 (Public review):

      Summary: 

      As a general phenomenon, adaptation of populations to their respective local conditions is well-documented, though not universally. In particular, local adaptation has been amply demonstrated in Arabidopsis thaliana, the focal species of this research, which is naturally highly selfing. Here, the authors report assays designed to evaluate the spatial scale of fitness variation among source populations and sites, as well as temporal variability in fitness expression. Further, they endeavor to identify traits and genomic regions that contribute to the demonstrated variation in fitness.  

      Strengths: 

      With many (200) inbred accessions drawn from throughout Sweden, the study offers an unusually fine sampling of genetic variation within this much-studied species, and through assays in multiple sites and years, it amply demonstrates the context-dependence of fitness expression. It supports the general phenomenon of local adaptation, with multiple nuances. Other examples exist, but it is of value to have further cases illustrating not only the context-dependence of fitness expression but also the sometimes idiosyncratic nature of fitness variation. I commend the authors on their cautionary language in relation to inferences about the roles of particular genomic regions (e.g.l.140-144; l.227)  

      Weaknesses: 

      To my mind, the manuscript is written primarily for the Arabidopsis community. This community is certainly large, but there are many evolutionary biologists who could appreciate this work but are not invited to do so. The authors could address the broader evolution community by acknowledging more of the relevant work of others (I've noted a few references in my comments to the authors). At least as important, the authors could make clearer the fact that A. thaliana is (almost) strictly selfing and how this feature of its biology both enables such a study and also limits inferences from it. Further, it seems to me that though I could be wrong, readers would appreciate a more direct, less discursive style of writing, and one that makes the broader import of the focal questions clearer. 

      we agree that connecting the paper better to the broader field is desirable, and will try to do this in the revision. As for how selfing matters, there certainly are some things we can discuss, but a general discussion is probably a suitable topic for a review/opinion article!

      As a reader, I would value seeing estimates of the overall fitness of the accessions in the different conditions, i.e., by combining the survival and fecundity results of the common garden experiments.

      Combining estimates would be possible in the common garden experiments, and would bring us somewhat closer to total fitness estimates, although as noted by another reviewer (and also emphasized by us), the time scale of our experiment is not sufficient to evaluate the trade-off between survival and fecundity. Furthermore, we would still be missing the establishment component of fitness, which we found to be extremely important. Therefore little would be gained by combining the estimates, while at the same time losing resolution to disentangle the fitness components. We thus decided to focus on the individual fitness components and leave consideration of their joint effect for the Discussion.

      Reviewer #2 (Public review):

      Summary: 

      The goal of this study was to find evidence for local adaptation in survival and fecundity of the model plant Arabidopsis thaliana. The authors grew a large set of Swedish Arabidopsis accessions at four common garden sites in northern and southern Sweden. Accessions were grown from seed in trays, which were laid on the ground at each site in late summer, screened for survival in fall and the following spring, and fecundity was determined from rosette size and seed production in spring. Experiments were complemented by 'selection experiments', in which seeds of the same accessions were sown in plots, and after two years of growth, plants were sampled to determine fitness from genotype frequencies, providing a more comprehensive evaluation of lifetime fitness than can be gleaned from fecundity alone. 

      To clarify, fecundity was determined from total plant area using photos of the mature stems, not the rosettes or direct counting of seeds. That said, it is true that our fecundity estimate was well correlated with rosette area. Furthermore, we validate our fecundity estimates by showing they were highly correlated with seed production estimated by measuring and counting siliques on a separate set of plants grown under common garden conditions in one of our sites (Brachi et al.2022). 

      As the main result, southern accessions had higher mortality in northern sites in one of two years, but also suffered more slug damage in southern sites in one year, indicating a potential link between frost tolerance and herbivore resistance. Fecundity of accession was highest when growing close to the 'home' environment, but while accessions from one sand dune population in southern Sweden had among the lowest fecundities overall, they consistently had the highest fitness in the selection experiment. Accessions from this population had large seed size and rapid root growth, which might be related to establishment success when arriving in a new, partially occupied habitat. However, neither trait could fully explain the very high fitness of this population, suggesting the presence of other, unmeasured traits. 

      Overall, the authors could provide clear evidence of local adaptation in different traits for some of their experiments, but they also highlight high temporal and spatial variability that makes prediction of microevolutionary change so challenging. 

      Strengths: 

      A major strength of this study is the highly comprehensive evaluation of different fitness-related traits of Arabidopsis under natural conditions. The evaluation of survival and fecundity in common garden experiments across four sites and two years provides an estimate of variability and consistency of results. The addition of the 'selection experiment' provides an extended view on plant fitness that is both original and interesting, in particular highlighting potential limitations of 'fitness-proxies' such as seed production that don't take into account seedling establishment and competitive exclusion. 

      Throughout the study, the authors have gone to impressive depths in exploring their data, and particularly the discovery of 'native volunteers' in selection experiment plots and their statistical treatment is very elegant and has resulted in compelling conclusions. Also, while the authors are careful in the interpretation of their GWAS results, they nonetheless highlight a few interesting gene candidates that may be underlying the observed plant adaptations, and which likely will stimulate further research. 

      Overall, the authors provide a rich new resource that is relevant and interesting both in the context of general evolutionary theory as well as more specifically for molecular biology. 

      Weaknesses:

      While the repetition of the common garden experiments over two years is certainly better than no repetition (hence its mention also under 'strengths'), the very high variability found between the two years highlights the need for more extensive temporal replication. In this context, two temporal replicates are the bare minimum, and more repeats in time would be necessary to draw any kind of conclusion about the role of 'high mortality' and 'low mortality' years for the microevolution of Arabidopsis. It also seems that the authors missed an opportunity to explore potentially causal variation among years, as they did not attempt to relate winter mortality to actual climatic variables, even though they discuss winter harshness as a potential predictor.

      We agree that two years is insufficient to understand how variation in selective pressures compound over time to generate micro-evolutionary change. The eight-year data in Oakley et al. (2023), which we discuss in the paper, support this. Our results are nonetheless sufficient to demonstrate the idiosyncratic nature of selection. In the revision, we will further emphasize that far longer time series would be needed for definitive conclusions.

      Our short time series is also why we do not try to correlate with climate data, as this would amount to doing statistics with four data points (mostly two groups of accession N vs S, with mostly homogenous climates within groups, and two years).

      The low temporal variation also makes the accidental slug herbivory appear somewhat random. Potted plants are notoriously susceptible to slug herbivory, and while it is certainly nice that slug damage predominantly affected one group of accessions, it nonetheless raises the question whether this reflects a 'real' selection pressure that plants commonly face in their respective local environments. 

      We agree with this point as well. The evidence for selection on glucosinolates by generalist herbivores such as slugs is fairly strong, but the precise agent is not known, and probably varies over time and space. Our results merely demonstrate one possibility (and we will clarify this in the revision).

      The addition of the 'selection experiment' is certainly original and provides valuable additional insights, but again, it seems a bit questionable which natural process really has affected this outcome. While the genetic and statistical analysis of this experiment seems to be state-of-the-art, the experimental design is rather rudimentary compared to more standard selection experiments. Specifically, the authors added seeds from greenhouse-grown mothers to experimental plots and only sampled plants two years later. This means that, potentially,y the first very big bottleneck was germination under natural conditions, which may have already excluded many of the accessions before they had a chance to grow. While this certainly is one type of selection, it is not exactly the type of selection that a 2-year selection experiment is set up to measure. Either initially establishing the selection experiment from plants instead of seeds, or genotyping the population over several generations, would have substantially strengthened the conclusions that could be drawn from this experiment.

      We agree that more data would have been beneficial, and we do not make strong claims about the nature of selection. Among other phenotypes, we mention dormancy, and note that existing dormancy estimates do not predict fitness in our selection experiments. In addition the same seed batches germinated uniformly in the common-garden experiments with minimal stratification (we will note this in the revision).

      Also, the complete lack of information on population density is a bit problematic. It is not clear if there were other (non-Arabidopsis) plants present in the plots, how many Arabidopsis plants were established, if numbers changed over the year, etc. Given all of these limitations, calling this a 'selection experiment' is in fact somewhat misleading. 

      Seeds were introduced into sites that appeared appropriate for A. thaliana, leaving the background community intact. We provided information on sowing density; the density of plants (A. thaliana and other species) that we obtained during the course of the experiments varied considerably between sites, much like in natural populations, although we lack systematic measurements. We will provide more information (including photos) in the revision.  

      Despite these weaknesses, the authors could achieve their main goals, and despite the somewhat minimal temporal replication, they were lucky to sample two fairly distinct years that provided them with interesting variation, which they could partially explain using the variation among their accessions. Overall, this study will likely make an important contribution to the field of evolutionary biology, and it is another very strong example of how the extensive molecular tools in Arabidopsis can be leveraged to address fundamental questions in evolution and ecology, to an extent that is not (yet) possible in other plant systems. 

      Reviewer #3 (Public review)

      Summary: 

      The manuscript presents a large common garden experiment across Sweden using solely local germplasm. Additionally, there is a collection of selection experiments that begin investigating the factors shaping fecundity in these populations. This provides an impressive amount of data and analysis investigating the underlying factors involved. Together, this helps support the data showing that fluctuations and interactions are key components determining Arabidopsis fitness and are more broadly applicable across plant and non-plant species. 

      Strengths: 

      The field trials are well conducted with extensive effort and sampling. Similarly while the genetic analysis is complex it is well conducted and reflects the complexity of dealing with population structure that may be intricately linked to adaptive structure. This has no real solution and the option of presenting results with and without correction is likely the only appropriate option. 

      Weaknesses: 

      A significant finding from this study was that fecundity is shaped more by yearly fluctuations and their interaction with genotype than it is by the main effect of location or genotype. Another significant finding is that the strength of selection can be quite strong, with nearly 5x ranges across accessions. It should be noted that there are a number of other studies using Arabidopsis in the wild with multiple years and locations that found similar observations beyond the Oakley citation. In general, the context of how these findings relate to existing knowledge in Arabidopsis is a bit underdeveloped. 

      We shall remedy this in the revision (see also comments by Reviewer #1).

      The effects of the populations across the locations seem to rely on individual tests and PC analysis. It would seem to be possible to incorporate these tests more directly in the linear modeling analysis, and it isn't quite clear why this wasn't conducted. 

      The fecundity estimates were modelled for all experiments simultaneously and the results are presented in Figure 6 to explore the relative importance of genotype effects and interaction terms including genotypes. For survival and fecundity, the BLUPS are generated from linear mixed models fitted for all experiments simultaneously including a random intercept effect for the genotypes within experiments. A principal component analysis is used to explore the pattern of accession effects (BLUPS) on fecundity (Figure 7); this will be explained in the Methods.  

      I'm a bit puzzled by the discussion on how to find causative loci. This seems to focus solely on GWAS as the solution, with a goal to sequence vast individuals. But the loci that the manuscript discussed were found by a combination of structured mapping populations followed by molecular validation that then informed the GWAS. As such, I'm unsure if the proposed future approach of more sequencing is the best when a more balanced approach integrating diverse methods and population types will be more useful. 

      We are puzzled by this comment in return. Our statement about more sequencing (penultimate sentence of discussion) was referring to achieving a better understanding of the history of migration and selection rather than identifying causative loci. Happy for clarification!

      References

      Brachi, Benjamin, Daniele Filiault, Hannah Whitehurst, Paul Darme, Pierre Le Gars, Marine Le Mentec, Timothy C. Morton, et al. 2022. “Plant Genetic Effects on Microbial Hubs Impact Host Fitness in Repeated Field Trials.” Proceedings of the National Academy of Sciences of the United States of America 119 (30): e2201285119.

      Oakley, Christopher G., Douglas W. Schemske, John K. McKay, and Jon Ågren. 2023. “Ecological Genetics of Local Adaptation in Arabidopsis: An 8-Year Field Experiment.” Molecular Ecology, June. https://doi.org/10.1111/mec.17045.

    1. eLife Assessment

      This valuable study provides a 3D standardised anatomical atlas of the brain of an orb-weaving spider. The authors describe the brain's shape and its inner compartments - the neuropils - and add information on the distribution of a number of neuroactive substances such as transmitters and neuropeptides. Through the use of histological and microscopy methods, the authors provide a more complete view of an arachnid brain than previous studies and also present convincing evidence about the organisation and homology of brain regions. The work will serve as a reference for future studies on spider brains and will enable comparisons of brain regions with insects so that the evolution of these structures can be inferred across arthropods.

    2. Reviewer #1 (Public review):

      Summary:

      Artiushin et al. establish a comprehensive 3D atlas of the brain of the orb-web building spider Uloborus diversus. First, they use immunohistochemistry detection of synapsin to mark and reconstruct the neuropils of the brain of six specimens and they generate a standard brain by averaging these brains. Onto this standard 3D brain, they plot immunohistochemical stainings of major transmitters to detect cholinergic, serotonergic, octopaminergic/taryminergic and GABAergic neurons, respectively. Further, they add information on the expression of a number of neuropeptides (Proctolin, AllatostatinA, CCAP, and FMRFamide). Based on this data and 3D reconstructions, they extensively describe the morphology of the entire synganglion, the discernible neuropils, and their neurotransmitter/neuromodulator content.

      Strengths:

      While 3D reconstruction of spider brains and the detection of some neuroactive substances have been published before, this seems to be the most comprehensive analysis so far, both in terms of the number of substances tested and the ambition to analyze the entire synganglion. Interestingly, besides the previously described neuropils, they detect a novel brain structure, which they call the tonsillar neuropil.<br /> Immunohistochemistry, imaging, and 3D reconstruction are convincingly done, and the data are extensively visualized in figures, schemes, and very useful films, which allow the reader to work with the data. Due to its comprehensiveness, this dataset will be a valuable reference for researchers working on spider brains or on the evolution of arthropod brains.

      Weaknesses:

      As expected for such a descriptive groundwork, new insights or hypotheses are limited, apart from the first description of the tonsillar neuropil. A more comprehensive labeling in the panels of the mentioned structures would help to follow the descriptions. The reconstruction of the main tracts of the brain would be a very valuable complementary piece of data.

    3. Reviewer #2 (Public review):

      Summary

      Artiushin et al. created the first three-dimensional atlas of a synganglion in the hackled orb-weaver spider, which is becoming a popular model for web-building behavior. Immunohistochemical analysis with an impressive array of antisera reveals subcompartments of neuroanatomical structures described in other spider species as well as two previously undescribed arachnid structures, the protocerebral bridge, hagstone, and paired tonsillar neuropils. The authors describe the spider's neuroanatomy in detail and discuss similarities and differences from other spider species. The final section of the discussion examines the homology between onychophoran and chelicerate arcuate bodies and mandibulate central bodies.

      Strengths

      The authors set out to create a detailed 3D atlas and accomplished this goal.

      Exceptional tissue clearing and imaging of the nervous system reveal the three-dimensional relationships between neuropils and some connectivity that would not be apparent in sectioned brains.

      A detailed anatomical description makes it easy to reference structures described between the text and figures.

      The authors used a large palette of antisera which may be investigated in future studies for function in the spider nervous system and may be compared across species.

      Weaknesses

      It would be useful for non-specialists if the authors would introduce each neuropil with some orientation about its function or what kind of input/output it receives, if this is known for other species. Especially those structures that are not described in other arthropods, like the opisthosomal neuropil. Are there implications for neuroanatomical findings in this paper on the understanding of how web-building behaviors are mediated by the brain?

      Likewise, where possible, it would be helpful to have some discussion of the implications of certain neurotransmitters/neuropeptides being enriched in different areas. For example, GABA would signal areas of inhibitory connections, such as inhibitory input to mushroom bodies, as described in other arthropods. In the discussion section on relationships between spider and insect midline neuropils, are there similarities in expression patterns between those described here and in insects?

    4. Reviewer #3 (Public review):

      Summary:

      This is an impressive paper that offers a much-needed 3D standardized brain atlas for the hackled-orb weaving spider Uloborus diversus, an emerging organism of study in neuroethology. The authors used a detailed immunohistological whole-mount staining method that allowed them to localize a wide range of common neurotransmitters and neuropeptides and map them on a common brain atlas. Through this approach, they discovered groups of cells that may form parts of neuropils that had not previously been described, such as the 'tonsillar neuropil', which might be part of a larger insect-like central complex. Further, this work provides unique insights into the previously underappreciated complexity of higher-order neuropils in spiders, particularly the arcuate body, and hints at a potentially important role for the mushroom bodies in vibratory processing for web-building spiders.

      Strengths:

      To understand brain function, data from many experiments on brain structure must be compiled to serve as a reference and foundation for future work. As demonstrated by the overwhelming success in genetically tractable laboratory animals, 3D standardized brain atlases are invaluable tools - especially as increasing amounts of data are obtained at the gross morphological, synaptic, and genetic levels, and as functional data from electrophysiology and imaging are integrated. Among 'non-model' organisms, such approaches have included global silver staining and confocal microscopy, MRI, and, more recently, micro-computed tomography (X-ray) scans used to image multiple brains and average them into a composite reference. In this study, the authors used synapsin immunoreactivity to generate an averaged spider brain as a scaffold for mapping immunoreactivity to other neuromodulators. Using this framework, they describe many previously known spider brain structures and also identify some previously undescribed regions. They argue that the arcuate body - a midline neuropil thought to have diverged evolutionarily from the insect central complex - shows structural similarities that may support its role in path integration and navigation.

      Having diverged from insects such as the fruit fly Drosophila melanogaster over 400 million years ago, spiders are an important group for study - particularly due to their elegant web-building behavior, which is thought to have contributed to their remarkable evolutionary success. How such exquisitely complex behavior is supported by a relatively small brain remains unclear. A rich tradition of spider neuroanatomy emerged in the previous century through the work of comparative zoologists, who used reduced silver and Golgi stains to reveal remarkable detail about gross neuroanatomy. Yet, these techniques cannot uncover the brain's neurochemical landscape, highlighting the need for more modern approaches-such as those employed in the present study.

      A key insight from this study involves two prominent higher-order neuropils of the protocerebrum: the arcuate body and the mushroom bodies. The authors show that the arcuate body has a more complex structure and lamination than previously recognized, suggesting it is insect central complex-like and may support functions such as path integration and navigation, which are critical during web building. They also report strong synapsin immunoreactivity in the mushroom bodies and speculate that these structures contribute to vibratory processing during sensory feedback, particularly in the context of web building and prey localization. These findings align with prior work that noted the complex architecture of both neuropils in spiders and their resemblance (and in some cases greater complexity) compared to their insect counterparts. Additionally, the authors describe previously unrecognized neuropils, such as the 'tonsillar neuropil,' whose function remains unknown but may belong to a larger central complex. The diverse patterns of neuromodulator immunoreactivity further suggest that plasticity plays a substantial role in central circuits.

      Weaknesses:

      My major concern, however, is that some of the authors' neuroanatomical descriptions rely too heavily on inference rather than what is currently resolvable from their immunohistochemistry stains alone.

    1. eLife Assessment

      This manuscript presents an in-depth analysis of gene expression across multiple brown algal species with differing life histories, providing convincing evidence for the conservation of life cycle-specific gene expression. While largely descriptive, the study is an important step forward in understanding the core cellular processes that differ between life cycle phases, and its findings will be of broad interest to developmental and evolutionary biologists.

    2. Reviewer #1 (Public review):

      Summary:

      The authors have examined gene expression between life cycle stages in a range of brown macroalgae to examine whether there are conserved aspects of biological features.

      Strengths:

      The manuscript incorporates large gene expression datasets from 10 different species and therefore enables a comprehensive assessment of the degree of conservation of different aspects of gene expression and underlying biology.

      The findings represent an important step forward in our understanding of the core aspects of cell biology that differ between life cycle phases and provide a substantial resource for further detailed studies in this area. Convincing evidence is provided for the conservation of life-cycle-specific gene expression between species, particularly in core housekeeping gene modules.

      Weaknesses:

      I found a few weaknesses in the methodology and experimental design. I think the manuscript could have been clearer when linking the findings to the biology of the brown algae.

    3. Reviewer #2 (Public review):

      Summary:

      The manuscript by Ratchinski et al presents a comprehensive analysis of developmental and life history gene expression patterns in brown algal species. The manuscript shows that the degree of generation bias or generation-specific gene expression correlates with the degree of dimorphism. It also reports conservation of life cycle features within generations and marked changes in gene expression patterns in Ectocarpus in the transition between gamete and early sporophyte. The manuscript also reports considerable conservation of gene expression modules between two representative species, particularly in genes associated with conserved functional characteristics.

      Strengths:

      The manuscript represents a considerable "tour de force" dataset and analytical effort. While the data presented is largely descriptive, it is likely to provide a very useful resource for studies of brown algal development and for comparative studies with other developmental and life cycle systems.

      Weaknesses:

      Notwithstanding the well-known issues associated with inferring function from transcriptomics-only studies, no major weaknesses were identified by this reviewer.

    1. eLife Assessment

      This study presents useful findings on how the transient absence of visual input (i.e., darkness) affects tactile neural encoding in the somatosensory cortex. The evidence supporting the authors' claims is incomplete, as key conclusions rely on subtle differences in surface roughness discriminability between sensory conditions, whose physiological underpinnings remain unclear. Potential methodological confounds are also not fully addressed. With additional analyses and methodological clarifications, this work could substantially inform neuroscientists studying cross-modal interactions.

    2. Reviewer #1 (Public review):

      Summary:

      The authors aimed to investigate how short-term visual deprivation influences tactile processing in the primary somatosensory cortex (S1) of sighted rats. They justify the study based on previous studies that have shown that long-term blindness can enhance tactile perception, and aim to investigate the neural mechanisms underlying rapid, short-term cross-modal plasticity. The authors recorded local field potentials from S1 as rats encountered different tactile textures (smooth and rough sandpaper) under light and dark conditions. They used deep learning techniques to decode the neural signals and assess how tactile representations changed across the four different conditions. Their goal was to uncover whether the absence of visual cues leads to a rapid reorganization of tactile encoding in the brain.

      Strengths:

      The study effectively integrates high-density local field potential (LFP) recordings with convolutional neural network (CNN) analysis. This combination allows for decoding high-dimensional population-level signals, revealing changes in neural representations that traditional analyses (e.g., amplitude measures) failed to detect. The custom treadmill paradigm permits independent manipulation of visual and tactile inputs under stable locomotion conditions. Gait analysis confirms that motor behavior was consistent across conditions, strengthening the conclusion that neural changes are due to sensory input rather than movement artifacts.

      Weaknesses:

      (1) While the study interprets the emergence of more distinct texture representations in the dark as evidence of rapid cross-modal plasticity, the claim rests on correlational data from a short-term manipulation and decoding analysis. The authors show that CNN-derived feature embeddings cluster more clearly by texture in the dark, but this does not directly demonstrate plasticity in the classical sense (e.g., synaptic or circuit-level reorganization).

      (2) Although gait was controlled, changes in arousal or exploratory behavior in light versus dark conditions might contribute to the observed neural differences. These factors are acknowledged but not directly measured (e.g., via pupillometry or cortical state indicators).

      (3) Moreover, the time course of the observed changes (within 10 minutes) is quite rapid, and while intriguing, the study does not include direct evidence that the underlying circuits were reorganized - only that population-level signals become more discriminable. As such, the term "plasticity" may overstate the conclusions and should be interpreted with caution unless validated by additional causal or longitudinal data.

      (4) The study highlights the forelimb region of S1 and a post-contact temporal window as particularly important for decoding texture, based on occlusion and integrated gradient analyses. However, this finding may be somewhat circular: The LFPs were aligned to forelimb contact, and the floor textures were sensed primarily via the forelimbs, making it unsurprising that forelimb electrodes were most informative. The observed temporal window corresponds directly to the event-aligned epoch, and while it may shift slightly in duration in the dark, this could reflect general differences in sensory gain or arousal, rather than changes in stimulus-specific encoding. Thus, while these findings are consistent with somatotopy and context-dependent dynamics, they do not provide strong independent evidence for novel spatial or temporal organization.

      (5) While the neural data suggest enhanced tactile representations, the study does not assess whether rats' actual tactile perception improved. Without a behavioral readout (e.g., discrimination accuracy), claims about perceptual enhancement remain speculative.

      (6) In addition to point 4, the authors discuss implications for sensory rehabilitation, including Braille training and haptic feedback enhancement. However, the lack of actual chronic or even more acute pathological sensory deprivation, behavioral data, or subsequent intervention in this study limits the ability to draw translational conclusions. It remains unknown whether the more distinct neural representations observed actually translate into better tactile performance, discriminability, or perception. Additionally, extrapolating from rats walking on sandpaper in the dark to human rehabilitative contexts is speculative without a clearer behavioral or mechanistic bridge. The potential is certainly there, but the claim is currently aspirational rather than empirically grounded.

      (7) While the CNN showed good performance, details on generalization robustness and validation (e.g., cross-validation folds, variance across animals) are not deeply discussed. Also, while explainability tools were used, interpretability of CNNs remains limited, and more transparent models (e.g., linear classifiers or dimensionality reduction) could offer complementary insights.

      Therefore, while the authors raise interesting hypotheses around rapid plasticity, somatotopic dynamics, and rehabilitation, the evidence for each is indirect. Stronger claims would require causal experiments, behavioral readouts, and mechanistic specificity beyond what the current data can provide.

    3. Reviewer #2 (Public review):

      Summary:

      Yamashiro et al. investigated how the transient absence of visual input (i.e., darkness) impacts tactile neural encoding in the rat primary somatosensory cortex (S1). They recorded local field potentials (LFPs) using a 32-channel array implanted in forelimb and hindlimb primary somatosensory cortex while rats walked on smooth or rough textures under illuminated and dark conditions. Employing a convolutional neural network (CNN), they successfully decoded both texture and lighting conditions from the LFPs. The authors conclude that the subtle differences in LFP patterns underlie tactile representation of surface roughness and become more distinct in darkness, suggesting a rapid cross-modal reorganization of the neural code for this sensory feature.

      Strengths:

      (1) The manuscript addresses a valuable question regarding how sensory cortices adapt dynamically to changes in sensory context.

      (2) Utilization of machine learning (CNNs) allowed the authors to go beyond conventional amplitude-based analyses, potentially uncovering a subtle but interesting phenomenon.

      Weaknesses:

      (1) Despite applying explainability techniques to the CNN-based decoder, the study does not clearly demonstrate the precise "subtle, high-dimensional patterns" exploited by the CNN for surface roughness decoding, limiting the physiological interpretability of the results. Additional analyses (e.g., detailed waveform morphology analysis on grand averages, time-frequency decompositions, or further use of explainability methods) are necessary to clarify the exact nature of the discriminative activity features enabling the CNN to decode surface roughness and how these change with the sensory context (i.e., in light or darkness).

      (2) The claim regarding cross-modal representation reorganization heavily relies on a silhouette analysis (Figure 5C), which shows a modest effect size and borderline statistical significance (p≈0.05 with n=9+2). More rigorous statistical quantification, such as permutation tests and reporting underlying cluster distances for all animals, would strengthen confidence in this finding.

      (3) While the authors recorded in the somatosensory cortex, primarily known for its tactile responsivity, I would be cautious not to rule out a priori the presence of crossmodal (visual) responses in the area. In this case, the stronger texture separation in darkness might be explained by the absence of some visually-evoked potentials (VEPs) rather than genuine cross-modal reorganization. Clarification is needed to rule out visual interference and this would strengthen the claim.

      (4) Behavioural controls are limited to gross gait parameters; more detailed analyses of locomotor behavior and additional metrics (e.g., pupil size or locomotor variance) would robustly rule out potential arousal or motor confounds.

      (5) The consistent ordering of trials (10 minutes of light then 10 minutes of dark) could introduce confounds such as fatigue or satiation (and also related arousal state), which should be controlled by analyzing sessions with reversed condition ordering.

      (6) The focus on forelimb-aligned LFP analyses raises the possibility that hindlimb-aligned data might yield different conclusions, suggesting alignment effects might bias the results.

      (7) The authors' dismissal of amplitude-based metrics as ineffective is inadequately substantiated. A clearer demonstration (e.g., event-related waveforms averaged by conditions, presented both spatially and temporally) would support this claim.

      (8) Wording ambiguity regarding "attribution score" versus "activation amplitude" (Figure 5) complicates the interpretation of key findings. This distinction must be clarified for proper assessment of the results.

      (9) Generalization across animals remains unaddressed. The current within-subject decoding setup limits conclusions regarding shared neural representations across individuals. Adopting cross-validation strategies and exploring between-animal analyses would add significant value to the manuscript.

    1. eLife Assessment

      This important study addresses how wing morphology and kinematics change across hoverflies of different body sizes. The authors provide convincing evidence that there is no significant correlation between body size and wing kinematics across 28 species and instead argue that non-trivial changes in wing size and shape evolved to support flight across the size range. Overall, this paper illustrates the power and beauty of an integrative approach to animal biomechanics and will be of broad interest to biologists, physicists and engineers.

    2. Reviewer #2 (Public review):

      Summary

      Le Roy et al quantify wing morphology and wing kinematics across twenty eight and eight hoverfly species, respectively; the aim is to identify how weight support during hovering is ensured across body sizes. Wing shape and relative wing size vary non-trivially with body mass, but wing kinematics are reported to be size-invariant. On the basis of these results, it is concluded that weight support is achieved solely through size-specific variations in wing morphology, and that these changes enabled hoverflies to decrease in size. Adjusting wing morphology may be preferable compared to the alternative strategy of altering wing kinematics, because kinematics may be subject to stronger evolutionary and ecological constraints, dictated by the highly specialised flight and ecology of the hoverflies.

      Strengths

      The study deploys a vast array of challenging techniques, including flight experiments, morphometrics, phylogenetic analyses, and numerical simulations; it so illustrates both the power and beauty of an integrative approach to animal biomechanics. The question is well motivated, the methods appropriately designed, and the discussion elegantly places the results in broad biomechanical, ecological, and evolutionary context. In many ways, this work provides a blueprint for work in evolutionary biomechanics; the breadth of both the methods and the discussion reflects outstanding scholarship.

      Weaknesses

      The work presents a mechanical analysis that is focused solely on aerodynamics; but these aerodynamic demands impose no less relevant demands on the primary engine that drives wing movement: muscle. The relation between the assumed null hypotheses, the observed empirical allometric relations, and the power and work demand they place on muscle remains unclear. Though this is clearly a minor weakness, future work will have to address the link between aerodynamics, wing shape, wing dynamics, and musculoskeletal system in more detail, as discussed briefly by the authors.

    3. Author response:

      The following is the authors’ response to the previous reviews.

      Reviewer #1 (Public review):

      The paper is well written and the figures well laid out. The methods are easy to follow, and the rational and logic for each experiment easy to follow. The introduction sets the scene well, and the discussion is appropriate. The summary sentences throughout the text help the reader.

      The authors have done a lot of work addressing my previous concerns and those of the other Reviewers.

      We are pleased that the revised manuscript satisfactorily addresses the previous concerns of the reviewer.

      Reviewer #2 (Public review):

      Summary

      Le Roy et al quantify wing morphology and wing kinematics across twenty eight and eight hoverfly species, respectively; the aim is to identify how weight support during hovering is ensured across body sizes. Wing shape and relative wing size vary non-trivially with body mass, but wing kinematics are reported to be size-invariant. On the basis of these results, it is concluded that weight support is achieved solely through size-specific variations in wing morphology, and that these changes enabled hoverflies to decrease in size. Adjusting wing morphology may be preferable compared to the alternative strategy of altering wing kinematics, because kinematics may be subject to stronger evolutionary and ecological constraints, dictated by the highly specialised flight and ecology of the hoverflies.

      Strengths

      The study deploys a vast array of challenging techniques, including flight experiments, morphometrics, phylogenetic analyses, and numerical simulations; it so illustrates both the power and beauty of an integrative approach to animal biomechanics. The question is well motivated, the methods appropriately designed, and the discussion elegantly places the results in broad biomechanical, ecological, and evolutionary context.

      We thank the reviewer for appreciating the strengths of our study.

      Weaknesses

      (1) In assessing evolutionary allometry, it is key to pinpoint the variation expected from changes in size alone. The null hypothesis for wing morphology is well-defined (isometry), but the equivalent predictions for kinematic parameters, although specified, are insufficiently justified, and directly contradict classic scaling theory. A detailed justification of the "kinematic similarity" assumption, or a change in the null hypothesis, would substantially strengthen the paper, and clarify its evolutionary implications.

      We agree with the reviewer that a clearly articulated null hypothesis is crucial for interpreting scaling relationships. In fact, when carefully reviewing our manuscript, we realized that we nowhere did so, and which might have led to a misinterpretation of this. In the revised manuscript, we therefore now explicitly state our newly defined null hypotheses (lines 120–125, 340-352), and how we tested these (lines 359-360).

      In fact, we define two alternative null hypotheses: (1) weight support is maintained across sizes using allometric scaling of wing morphology only, and thus wingbeat kinematics are kept constant (kinematic similarity); (2) weight support is maintained across sizes using allometric scaling of wingbeat kinematics, while wing morphology scales isometrically (morphological similarity).

      According to the first null hypothesis, the second-moment-of-area of the wing should scale linearly with body mass, resulting in negative allometry of S<sub>2</sub> relative to body mass (S<sub>2</sub>∼m<sup>1</sup> <m<sup>4/3</sup>). According to the second null hypothesis, the product of wingbeat frequency and amplitude should scale with mass under negative allometry (ω∼ƒ A<sub>ϕ</sub>∼m<sup>-1/6</sup>). We test these alternative null hypotheses using Phylogenetic Generalized Least Square (PGLS) regressions of the morphology and kinematics metrics against the body mass.

      Furthermore, in our revised manuscript, we now also better explain the use of "kinematic similarity" assumption as a theoretical scenario, that is physically, biomechanically nor physiological sustainable across sizes, but that we merely use to define our null hypotheses (lines 340-351). This is made particularly explicit in a new subsection named “Theoretical considerations” (lines 448–461). Note that our second null hypothesis is thus not that hoverflies fly under "kinematic similarity", but that wingbeat kinematics scales under negative allometry (ω∼ƒ A<sub>ϕ</sub>∼m<sup>-1/6</sup>), which we assume is in line with the classic scaling theory that the reviewer refers to.

      We sincerely thank the reviewer for making us aware that we did not explicitly state our null hypotheses, and that introducing these new null hypotheses removed the confusion about the assumptions in our study.

      (2) By relating the aerodynamic output force to wing morphology and kinematics, it is concluded that smaller hoverflies will find it more challenging to support their body mass--a scaling argument that provides the framework for this work. This hypothesis appears to stand in direct contrast to classic scaling theory, where the gravitational force is thought to present a bigger challenge for larger animals, due to their disadvantageous surface-to-volume ratios. The same problem ought to occur in hoverflies, for wing kinematics must ultimately be the result of the energy injected by the flight engine: muscle. Much like in terrestrial animals, equivalent weight support in flying animals thus requires a positive allometry of muscle force output. In other words, if a large hoverfly is able to generate the wing kinematics that suffice to support body weight, an isometrically smaller hoverfly should be, too (but not vice versa). Clarifying the relation between the scaling of muscle mechanical input, wing kinematics, and weight support would help resolve the conflict between these two contrasting hypotheses, and considerably strengthen the biomechanical motivation and evolutionary interpretation.

      We agree with the reviewer that, due to disadvantageous surface-to-volume ratios, larger animals are more challenged to maintain weight-support, and that this is also the case for hovering hoverflies. In the current manuscript, we do not aim to challenge this universal scaling law of muscle force with body mass.

      Instead, we here focus merely on how the flight propulsion system (wing morphology and kinematics) scale with size, and how this allows hovering hoverflies to maintain weight support. We also fully agree with the reviewer that in theory, “if a large hoverfly is able to generate the wing kinematics that suffice to support body weight, an isometrically smaller hoverfly should be, too”. This aligns in fact with our second null hypothesis where wingbeat frequency should scale as ƒ∼m<sup>-1/6</sup>, to maintain weight support under morphological isometry.

      In our study, we show that this null hypothesis is rejected (lines 511-517, and line 525), and thus hoverflies primarily adjust their wing morphology to maintain in-hovering weight-support across sizes, and wingbeat kinematics is in fact highly conserved. Why this specific flight kinematics is so strongly conserved is not known, and thus a key topic in the discussion section of our manuscript.

      We agree with the reviewer that muscle physiology might be an important driver for this conserved kinematics, but also aerodynamic efficiency and maneuverability could be key aspects here. In our revised manuscript, we now discuss these three aspects in more detail (lines 762-775). Also, we here now also mention that we aim to address this outstanding question in future studies, by including muscle physiology in our animal flight studies, and by studying the aerodynamics and maneuver kinematic of hoverflies in more detail. 

      Moreover, in our revised introduction section, we now also mention explicitly that the capability for maintaining in-flight weight-support scales inversely with animal size, due to the negative isometric scaling of muscle force with body mass (line 52-56). Furthermore, we removed all statements that might suggest the opposite. We hope that these adjustments helped resolve the apparent conflict between our null hypotheses and general muscle scaling laws.

      Finally, in the Discussion section (lines 770-775), we now more explicitly acknowledge that wing motion is ultimately driven by the flight motor musculature, and that a full biomechanical interpretation must consider the scaling of muscle mechanical input alongside wing kinematics and morphology. While we decided to keep the focus primarily on aerodynamic constraints in this study, we agree that future work integrating both aerodynamic and physiological scaling will be essential to fully resolve these contrasting perspectives.

      (3) One main conclusion-- that miniaturization is enabled by changes in wing morphology--is insufficiently supported by the evidence. Is it miniaturization or "gigantism" that is enabled by (or drives) the non-trivial changes in wing morphology? To clarify this question, the isolated treatment of constraints on the musculoskeletal system vs the "flapping-wing based propulsion" system needs to be replaced by an integrated analysis: the propulsion of the wings, is, after all, due to muscle action. Revisiting the scaling predictions by assessing what the engine (muscle) can impart onto the system (wings) will clarify whether non-trivial adaptations in wing shape or kinematics are necessary for smaller or larger hovering insects (if at all!).

      In many ways, this work provides a blueprint for work in evolutionary biomechanics; the breadth of both the methods and the discussion reflects outstanding scholarship.

      In response to the first review round, we have removed all references to “miniaturization,” as our data does not allow us to infer evolutionary trajectories of body size (i.e., whether lineages have become smaller or larger over time). We now frame our conclusion more conservatively: that changes in wing morphology enable small hoverflies to maintain weight support despite the aerodynamic disadvantages imposed by isometric scaling.

      We fully agree that an integrated biomechanical framework, explicitly linking muscle mechanical output with wing kinematics and morphology, would significantly strengthen the study. However, we believe that performing an integrated analysis assessing the scaling of muscle input into the wing is beyond the current scope, which focuses specifically on the aerodynamic consequences of morphological and kinematic variation (see reply above).

      Reviewer #3 (Public review):

      This paper addresses an important question about how changes in wing morphology vs. wing kinematics change with body size across an important group of high-performance insects, the hoverflies. The biomechanics and morphology convincingly support the conclusions that there is no significant correlation between wing kinematics and size across the eight specific species analyzed in depth and that instead wing morphology changes allometrically. The morphological analysis is enhanced with phylogenetically appropriate tests across a larger data set incorporating museum specimens.

      The authors have made very extensive revisions that have significantly improved the manuscript and brought the strength of conclusions in line with the excellent data. Most significantly, they have expanded their morphological analysis to include museum specimens and removed the conclusions about evolutionary drivers of miniaturization. As a result, the conclusion about morphological changes scaling with body size rather than kinematic properties is strongly supported and very nicely presented with a strong complementary set of data. I only have minor textual edits for them to consider.

      We thank the reviewer for this positive feedback. We are pleased to hear that the revised manuscript is satisfactory.

      Reviewer #2 (Recommendations For The Authors):

      My main remaining qualm remains the null hypothesis for the scaling of kinematic parameters - all weaknesses come back to this point. I appreciate that the authors now specify an expectation, but they offer no justification. This is a problem, because the expectation dictates the interpretation of the results and is thus crucial to some of the key claims (including one in the paper title!): the choice made by the authors indeed implies that hovering is harder for small hoverflies, so that the reported changes in size-specific wing morphology are to be interpreted as an adaptation that enables miniaturization. However, why is this choice appropriate over alternatives that would predict the exact opposite, namely that hovering is harder for larger hoverflies?

      In my original review, I suggested that the authors may address this key question by considering the scaling of muscle mechanical output, and provided a quick sketch of what such an argument would look like, both in classic textbook scaling theory, and in the framework of more recent alternative approaches. The authors have decided against an implementation of this suggestion, providing various version of the following justification in their reply: "our study focuses precisely on this constraint on the wing-based propulsion system, and not on the muscular motor system." I am puzzled by this distinction, which also appears in the paper: muscle is the engine responsible for wing propulsion. How can one be assessed independent of the other? The fact that the two must be linked goes straight to the heart of the difficulty in determining the null hypotheses for the allometry of kinematic and dynamic parameters: they must come from assertions on how muscle mechanical output is expected to vary with size, and so couple muscle mechanical output to the geometry of the wing-based propulsion system. What if not muscle output dictates wing kinematics?

      I fully agree with the authors that null hypotheses on kinematic parameters are debatable. But then the authors should debate their choice, and at least assess the plausibility of its implications (note that the idea of "similarity" in scaling does not translate to equal or invariant, but is tied closely to dimensional analysis - so one cannot just proclaim that kinematic similarity implies no change in kinematic parameters). I briefly return to the same line of argument I laid out in the initial review to provide such an assessment:

      Conservation of energy implies:

      W = 1/2 I ω2

      where I is the mass moment of inertia and W is the muscle work output. Under isometry, I ∝m5/3, the authors posit ω ∝m0, and it follows at once that they predict W ∝m5/3. That is, the "kinematic similarity" hypothesis presented in the paper implies that larger animals can do substantially more work per unit body mass than small animals (unless the author have an argument why wing angular velocity is independent of muscle work capacity, and I cannot think of one). This increase in work output is in contradiction with the textbook prediction, going all the way back to Borelli and Hill: isogeometric and isophysiological animals ought to have a constant mass-specific work output. So why, according to the authors, is this an incorrect expectation, ie how do they justify the assumption ω ∝m0 and its implication W ∝m5/3? How can larger animals do more mass-specific work, or, equivalently, what stops smaller animals from delivering the same mass-specific work? If non-trivial adaptations such as larger relative muscle mass enable larger animals to do more work, how does this fit within the interpretation suggested by the authors that the aerodynamics of hovering require changes in small animals?

      A justification of the kinematic similarity hypothesis, alongside answers to the above questions, is necessary, not only to establish a relation to classic scaling theory, but also because a key claim of the paper hinges on the assumed scaling relationship: that changes in wing morphology enable hovering in small hoverflies. If I were to believe Borelli, Hill and virtually all biomechanics textbooks, the opposite should be the case: combing constant mass-specific work output with eq. 1, one retrieves F∝m2/3, so that weight support presents a bigger challenge for larger animals; the allometry of wing morphology should then be seen as an adaptation that enables hovering in larger hoverflies - the exact opposite of the interpretation offered by the authors.

      Now, as it so happens, I disagree with classic scaling theory on this point, and instead believe that there are good reasons to assume that muscle work output varies non-trivially with size. The authors can find a summary of the argument for this disagreement in the initial review, or in any of the following references:

      Labonte, D. A theory of physiological similarity for muscle-driven motion. PNAS, 2023, 120, e2221217120

      Labonte, D.; Bishop, P.; Dick, T. & Clemente, C. J. Dynamics similarity and the peculiar allometry of maximum running speed. Nat Comms., 2024, 15, 2181

      Labonte, D. & Holt, N. Beyond power limits: the kinetic energy capacity of skeletal muscle. J Exp Bio, 2024, 227, jeb247150

      Polet, D. & Labonte, D. Optimal gearing of musculoskeletal systems. Integr Org Biol, 2024, 64, 987-10062024

      I am asking neither that the authors agree with the above references nor that they cite them. But I do expect that they critically discuss and justify their definition of kinematic similarity, its relation to expectation from classic scaling theory, and the implications for their claim that hovering is harder for small animals. I do note that the notion of "physiological similarity" introduced in the above references predicts a size-invariant angular velocity for small animals, that small animals should be able to do less mass-specific work, and that average muscle force output can grow with positive allometry even for isogeometric systems. These predictions appear to be consistent with the data presented by the authors.

      We agree with the reviewer that our null hypothesis was not clearly articulated in our previous version of the manuscript, and that this might have led to a misinterpretation of the merits and limitations of our study. In the revised manuscript, we therefore now explicitly introduce our null hypotheses in the Introduction (lines 120–125), we define these in the Methods section (lines 340–360), test these in the Results section (lines 511–517), and reflect on the results in the Discussion (lines 602–610). We thank the reviewer for pointing out this unclarity in our manuscript, because revising it clarified the study significantly. See our replies in the “Public Review” section for details.

      Minor points

      L56: This is somewhat incomplete and simplistic; to just give one alternative option, weight support with equivalent muscle effort could also be ensured by a change in gearing (see eg Biewener's work). It is doubtful whether weight support is a strong selective force, as any animal that can move will be able to support its weight. The impact of scaling on dynamics is thus arguably more relevant.

      We thank the reviewer for pointing out that our original sentence may be too simplistic. We now briefly mention alternative mechanisms (suggested by the reviewer) to provide more nuance (line 56-58).

      L58: I am not aware of any evidence that smaller animals have reduced the musculature dedicated to locomotion beyond what is expected from isometry; please provide a reference for this claim or remove it.

      We removed that claim.

      The authors use both isometry and geometric similarity. As they also talk about muscle, solely geometric similarity (or isogeometry) may be preferable, to avoid confusion with isometric muscle contractions.

      To avoid confusion, we now use “geometric similarity” wherever the use of isometry might be ambiguous.

      L86: negative allometry only makes sense if there is a justified expectation for isometry - I suggest to change to "The assumed increase in wingbeat frequency in smaller animals" or similar, or to clarify the kinematic similarity hypothesis.

      We edited the sentence as suggested.

      L320: This assertion is somewhat misleading. Musculoskeletal systems are unlikely to be selected for static weight support. Instead, they need to allow movement. Where movement is possible, weight support is trivially possible, and so weight support should rarely, if ever, be a relevant constraint. At most, the negative consequence of isometry on weight support would be that a larger fraction of the muscle mass needs to be active in larger animals to support the weight.

      We fully agree with the reviewer that musculoskeletal systems are unlikely not selected for static loads, as the ability to move dynamically in the real world is crucial for survival. That said, we here look at hovering flight, which is far from static. In fact, hovering flight is among the energetic most costly movement patterns found in nature, due to the required high-frequency wingbeat motions (Dudley 2002). Rapid maneuvers are of course more power demanding, but hovering is a good proxy for this. For example, in fruit flies maximum force production in rapid evasive maneuvers are only two times the force produced during hovering (Muijres et al., 2014).

      We agree with the reviewer that it is important to explicitly mention the differences in functional demands on the motor system in hovering and maneuvering flight, and thus we now do so in both the introduction and discussion sections (lines 116-118 and 762-765, respectively).

      Dudley, Robert. The biomechanics of insect flight: form, function, evolution. Princeton university press, 2002.Muijres, F. T., et al. "Flies evade looming targets by executing rapid visually directed banked turns." Science 344.6180 (2014): 172-177.

      Reviewer #3 (Recommendations For The Authors):

      Throughout, check use of "constrains" vs. "constraints"

      Thank you for pointing this out. We have corrected these errors.

      Line 52 do you mean lift instead of thrust?

      We agree with the reviewer that the use of “thrust” might be confusing in the context of hovering flight, and thus we replaced “flapping-wing-based aerodynamic thrust-producing system” with the “flapping-wing-based propulsion system”. This way, we no longer use the word thrust in this context, and only use lift as the upward-directed force required for weight-support.

      Line 60 "face also constrains" wording

      Corrected.

      Line 79 Viscous forces only "dominate" at Re<1 and so this statement only refers to very very small insects which I suspect are far below the scale of the hoverflies considered (likely Re ~100) although maybe not for the smallest 3 mg ones?

      Indeed, viscous forces do not “dominate” force production at the Reynolds numbers of our flying insects. We thank the reviewer for pointing out this incorrect statement, which we corrected in the revised manuscript.

      Line 85 again thrust doesn't seem to be right

      Agreed. See reply 3.2.

      533 "maximized" should probably be "increased"

      We now use “increased”.

      Line 705-710 The new study by Darveau might help resolve this a bit because of the reliability of this relationship across and between orders. Darveau, C.-A. (2024). Insect Flight Energetics And the Evolution of Size, Form, And Function. Integrative And Comparative Biology icae028.

      We thank the reviewer for this highly relevant reference, which was unfortunately not included in the original manuscript. In connection with this work, we now further discuss the relationship between wing size allometry and deviations from the expected scaling of wingbeat frequency (lines 730-735).

    1. eLife Assessment

      This valuable observational study was conducted in Dar es Salaam, Tanzania, to investigate potential associations between genetic variation in Mycobacterium tuberculosis and human host vs. disease severity. The authors conclude that human genetic ancestry did not contribute to tuberculosis severity and the evidence supporting this is generally convincing. The findings have significance for the understanding of the influence of host/bacillary genetics on tuberculosis disease.

    2. Reviewer #2 (Public review):

      Summary:

      This manuscript reports the results of an observational study conducted in Dar es Salaam, Tanzania, investigating potential associations between genetic variation in M. tuberculosis and human host vs. disease severity. The headline finding is that no such associations were found, either for host / bacillary genetics as main effects or for interactions between them.

      Strengths:

      Strengths of the study include its large size and rigorous approaches to classification of genetic diversity for host and bacillus.

      Comments on revisions:

      The authors have responded satisfactorily to comments raised.

    3. Author response:

      The following is the authors’ response to the original reviews.

      Reviewer #1 (Public review):

      Summary:

      This Tanzanian study focused on the relationship between human genetic ancestry, Mycobacterium tuberculosis complex (MTBC) diversity, and tuberculosis (TB) disease severity. The authors analyzed the genetic ancestry of 1,444 TB patients and genotyped the corresponding MTBC strains isolated from the same individuals. They found that the study participants predominantly possess Bantu-speaking genetic ancestry, with minimal European and Asian ancestry. The MTBC strains identified were diverse and largely resulted from introductions from South or Central Asia. Unfortunately, no associations were identified between human genetic ancestry, the MTBC strains, or TB severity. The authors suggest that social and environmental factors are more likely to contribute to TB severity in this setting.

      Strengths:

      In comparison to other studies investigating the role of human genetics in TB phenotypes, this study is relatively large, with more than 1,400 participants.

      The matched human-MTBC strain collection is valuable and offers the opportunity to address questions about human-bacterium co-evolution.

      Weaknesses:

      Although the authors had genome-wide genotyping and whole genome sequencing data, they only compared the associations between human ancestry and MTBC strains. Given the large sample size, they had the opportunity to conduct a genome-wide association study similar to that of Muller et al. (https://doi.org/10.1016/j.ygeno.2021.04.024).

      Thank you very much for taking the time to carefully review our manuscript and for your suggestions and comments. In another published study using the same cohort (https://doi.org/10.1101/2023.05.11.23289848), we performed a genome-wide association analysis between the genome-wide SNPS of the host and the genome-wide SNPs from the paired MTBC strains. In the current work we were interested in testing specifically if host ancestry and pathogen genotype family, as well as their interaction, were associated with differences in disease severity, a clinical phenotype with direct consequences for both host and pathogen fitness. The study of Müller et al, referred to by the reviewer, investigates whether MTBC families of strains causing disease in two patient cohorts (South Africa and Ghana) were associated with particular human SNPS assessed genome-wide. In that study, clinical phenotypes were not assessed and human ancestries, in a much broader sense than the ones used in our current study, were used as covariates. To leverage the genome-wide information and the clinical variables collected in our study, we have now added a genome-wide association analysis of all the human SNPs with disease severity measures while adjusting for co-variates (age, sex,  smoking, cough duration, socioeconomic status, history of previous TB, malnutrition, education level, and drug resistance status) and for human population stratification . Yet, no significant statistical associations were detected (L243-249).

      The authors tested whether human genetic ancestry is associated with TB severity. However, the basis for this hypothesis is unclear. The studies cited as examples all focused on progression to active TB (from a latent infection state), which should not be conflated with disease severity. It is difficult to ascertain whether the role of genetic ancestry in disease severity would be detectable through this study design, as some participants might simply have been sicker for longer before being diagnosed (despite the inquiry about cough duration). This delay in diagnosis would not be influenced solely by human genetics, which is the conclusion of the study.

      Evidence that mortality and natural recovery from TB vary by disease presentation spectrum come from studies carried out before the introduction of anti-TB chemotherapy. Patients with mild disease presentation, as measured by radiology at the time of diagnosis had higher odds of recovering naturally compared to those with advanced disease (doi: 10.5588/ijtld.23.0254, doi: 10.1164/arrd.1960.81.6.839). Given the deleterious effects of an MTBC infection leading to symptomatic disease on human fitness, we hypothesized that natural selection has acted on human traits underlying TB disease severity. If those traits are heritable one would expect to find underlying genetic variation in human populations. In addition, because certain MTBC genotype families and human populations have co-existed since a least a few centuries to a few millennia, we hypothesized that some of that genetic variation could be related to human ancestry. We have added more details to the introduction to make our rational clearer (L118-127).  In our patient cohort, we observed a large variation in disease severity using as approximations; TB-Score, X-Ray score and bacterial burden in sputa (Ct-value as determined with GeneXpert). However, the reviewer is absolutely correct in that patients in our study are being diagnosed at different stages of disease confounding our analysis. This is a limitation of our study which cannot be fully accounted for by including cough duration, as we also acknowledged in the manuscript (L343-346).

      Additionally, the study only included participants who attended the TB clinic.

      Yes, this is related to the previous point, our study only considers patients that felt ill enough to visit the TB clinic potentially not including patients that had less severe disease as acknowledged.

      Including healthy controls from the general population would have provided an interesting comparison to see if ancestry proportions differ.

      We agree that it would be interesting to compare the ancestries of healthy controls to the ancestries of TB patients from the same population. However, that would be especially informative with respect to TB susceptibility and would not necessarily be informing disease severity traits and its underlying genetics. The similarities between the ancestry proportions of our cohort with those of neighboring countries such as Kenya, Malawi and Mozambique publicly available genomic data, suggests that there would be no major differences between TB patients and healthy controls.

      Although the authors suggest that social and environmental factors contribute to TB severity, only age, smoking, and HIV status were characterised in the study.

      Based on the comments of both reviewers, we added the following additional variables as covariates in the regression models: the socioeconomic status representing the ratio between the household income and the number of individuals in the household, malnutrition, the education level and whether it was a relapse/reinfection or a new case.

      Reviewer #2 (Public review):

      Summary:

      This manuscript reports the results of an observational study conducted in Dar es Salaam, Tanzania, investigating potential associations between genetic variation in M. tuberculosis and human host vs. disease severity. The headline finding is that no such associations were found, either for host / bacillary genetics as main effects or for interactions between them.

      Strengths:

      Strengths of the study include its large size and rigorous approaches to classification of genetic diversity for host and bacillus.

      Weaknesses:

      (1) There are some limitations of the disease severity read-outs employed: X-ray scores and Xpert cycle thresholds from sputum analysis can only take account of pulmonary disease. CXR is an insensitive approach to assessing 'lung damage', especially when converted to a binary measure. What was the basis for selection of Ralph score of 71 to dichotomise patients? If outcome measures were analysed as continuous variables, would this have been more sensitive in capturing associations of interest?

      Thank you very much for taking the time to carefully review our manuscript and for your suggestions and comments.  

      We recruited active TB patients with pulmonary TB disease that were sputum smear-positive and GeneXpert-positive. In this study we aimed at obtaining paired samples from both the patient and the strain, and in the current analysis we aimed at testing if human ancestry and its interaction with the strain genotype could explain differences in disease severity. It is often difficult to obtain microbiological cultures from extra-pulmonary cases and including those cases would have not been possible at the scale of this cohort. We believe as well that extra-pulmonary TB is of less relevance for the question we are addressing because in exclusively extrapulmonary cases, disease severity is not linked with bacterial transmission. However, extra-pulmonary TB can be extremely severe, and it would be very interesting to explore the potential role of human genetic variation underlying extra-pulmonary TB in future studies.

      As to the insensitivity of CXR to measure lung damage, we would argue that it depends on what is being assed. As a rationale for the Ralph score, its inventors argue that as in other grading methods, the proportion of affected lung and or cavitation is important to assess severity. It has been described as a “validated method for grading CXR severity in adults with smear-positive pulmonary TB that correlates with baseline clinical and microbiological severity and response to treatment, and is suitable for use in clinical trials” (https://thorax.bmj.com/content/thoraxjnl/65/10/863.full.pdf). While the validation of the score is convincing in that study, and the score has been used in several TB studies and trials, the low proportion of HIV co-infections might have been a limitation. Indeed, as shown in our previous publication, in our cohort of patients, chest X-ray scores were significantly lower in HIV infected TB patients https://doi.org/10.1371/journal.ppat.1010893. In the current analysis, regression analyses performed for the CXR severity and for the other severity measures did not include HIV co-infected patients.

      We obtained the same pattern of results using a continuous outcome. However, an assumption of linear regression was violated. The residuals were not normally distributed stemming from the bimodal distribution of the scores in our dataset. The threshold of 71 for the Ralph score has been used by others in previous studies; in its original description it has been suggested as the optimal cut-off point for predicting a positive sputum smear status after two months, which in turn has been shown to predict unfavorable outcomes (https://doi.org/10.1136/thx.2010.136242). Another study showed that a Ralph score higher than 71 was significantly associated with a longer duration of symptoms, higher clinical scores and a lower BMI (doi: 10.5603/ARM.2018.0032).

      (2) There is quite a lot of missing data, especially for TB scores - could this have introduced bias? This issue should be mentioned in the discussion.

      While we have a TB-score available for each patient, the chest X-ray score is missing for many patients. However, this is random and due both to the absence of an X-ray picture or to the bad quality of X-ray pictures that the radiologists could not assess. When stating that there is a lot of missing data for the TB scores, we assume that the reviewer was referring to the “missing N” columns in Table 1. There, the number of observations missing in each of the disease severity measures actually relates to the explanatory variables (i.e MTBC genotype and human ancestries). This table includes all patients that either had a bacterial genome available or a human genome/genotype (N = 1904). As an example for the TB-score as outcome variable, for 1471 patients the MTBC genotype was determined while it was missing for 433 patients. On the other hand for X-ray scores, 177 had a severe X-ray score, 849 a mild one and for 878 patients, there was no X-ray score available.  As for the Ct-value, despite the fact that the patients were recruited based on positive GeneXpert by the clinical team, these results were not always available to us.

      (3) The analysis adjusted for age, sex, HIV status, age, smoking and cough duration - but not for socio-economic status. This will likely be a major determinant of disease severity. Was adjustment made for previous TB (i.e. new vs repeat episode) and drug-sensitivity of the isolate? Cough duration will effectively be a correlate/consequence of more severe disease - thus likely highly collinear with disease severity read-outs - not a true confounder. How does removal of this variable from the model affect results? Data on socioeconomic status should be added to models, or if not possible then lack of such data should be noted as a limitation.

      Out of the 1904 patients that have either human or bacterial genomic data available, 48 were relapses (2.5%). The mean of the disease severity measures suggest that relapses have a higher CXR score but the TB-score and Ct-values did not differ. Based on the comments of both reviewers, we added the following additional variables as covariates to the regression models: the socioeconomic status representing the ratio between the household income and the number of individuals in the household, malnutrition examined by a doctor, the education level, and whether it was a relapse/reinfection or a new case and if the causative strain had any resistance to any anti-TB drugs. The results did not change. Cough duration could also be a consequence of more severe disease, as pointed out by the reviewer. We present now the results excluding cough duration as a variable from the model, however this also did not affect the results.

      (4) Recruitment at hospitals may have led to selection bias due to exclusion of less severe, community cases. The authors already acknowledge this limitation in the Discussion however.

      (5) Introduction: References refer to disease susceptibility, but the authors should also consider the influences of host/pathogen genetics on host response - both in vitro (PMIDs 11237411, 15322056) and in vivo (PMID 23853590). The last of these studies encompassed a broader range of ethnic variation than the current study, and showed associations between host ancestry and immune response - null results from the current study may reflect the relative genetic homogeneity of the population studied.

      We thank the reviewer for these suggestions which we have added to the introduction. 

      Reviewer #1 (Recommendations for the authors):

      Minor Comments:

      (1) The authors should be careful when using the term "Bantu" as opposed to "Bantu-speaking". (i.e. referring to the language group). The term is considered offensive in some settings.

      We thanks the reviewer for this important concern, we have revised throughout the manuscript.

      (2) There are several "(Error! Reference source not found)" phrases in the place of references throughout the document.

      We thank the reviewer for pointing this out, this has been corrected in the revised version.

      (3) Please correct line 365: "... sequencing (WGS) the patient...." to "... sequencing (WGS) of the patient...."

      (4) The figures in the supplementary PDF are not numbered and some are cut-off (I think it is Supplementary Figure S2).

      This has been corrected in the revised version.

      Reviewer #2 (Recommendations for the authors):

      Typographical errors

      (1) There are multiple instances where references have not pulled through to the text, e.g. line 126 (Error! Reference source not found.)

      We thank the reviewer for pointing this out, this has been corrected in the revised version.

      (2) Line 239: have been show - have been shown?

      Thank you, this mistake has been corrected in the revised version.

    1. eLife Assessment

      This important study shows that the activity of hypothalamic hypocretin/orexin neurons (HONs) correlates with body movement over multiple behaviors. Compelling evidence, supported by sophisticated, cutting-edge tools and data analyses, highlights a link that appears to be unique to HONs. This work should be of interest to scientists studying peptidergic neurons, movement, energy regulation, and brain-body coordination.

    2. Reviewer #1 (Public review):

      Summary:

      This manuscript by Tesmer and colleagues uses fiber photometry recordings, sophisticated analysis of movement, and deep learning algorithms to provide compelling evidence that activity in hypothalamic hypocretin/orexin neurons (HONs) correlates with net body movement over multiple behaviors. By examining projection targets, the authors show that hypocretin/orexin release differs in projection targets to the locus coeruleus and substantia nigra, pars compacta. Ablation of HONs does not cause differences in the power spectra of movements. Movement tracking ability of HONs is independent of HON activity that correlates with blood glucose levels. Finally, the authors show that body movement is not encoded to the same extent in other neural populations.

      Strengths:

      The major strengths of the study are the combination of fiber photometry recordings, analysis of movement in head-fixed mice, and sophisticated classification of movement using deep learning algorithms. The experiments seem to be well performed, and the data are well presented, visually. The data support the main conclusions of the manuscript.

      Weaknesses:

      To some degree, it is already known that hypocretin/orexin neurons correlate with movement and arousal, although this manuscript studies this correlation with unprecedented sophistication and scale.

      Taken together, this study is likely to be impactful to the field and our understanding of HONs across behavioral states.

    3. Reviewer #4 (Public review):

      Summary:

      Using head-fixed approach, the authors show a rapid impact of movement on the activity level of hypothalamic orexin/hypocretin neurons.

      Strengths:

      The head-fixed approach is great to isolate specific movements and their impact on neuronal activity.

      Weaknesses:

      Many of the weaknesses that were noted in the previous round of review have been addressed.

    4. Reviewer #5 (Public review):

      Summary:

      Hypothalamic hypocretin/orexin neurons are well-known to be involved in arousal, muscle tone and energy metabolism. Using a combination of fiber photometry, video-based movement assessments, and deep learning algorithms, the authors provide compelling evidence that the activity of these neurons correlates with net body movement over multiple behaviors and is independent of nutritional state. The authors also demonstrate that hypocretin/orexin release differs between two downstream projection sites, the locus coeruleus and substantia nigra, and are able to distinguish the activity in these sites that is due to inputs from these hypothalamic neurons vs. from other subcortical populations. The authors also convincingly show that the correlation between body movement and hypocretin/orexin neuron activity is much stronger compared to other subcortical regions. However, hypocretin/orexin neuron ablation does not affect the power spectra of movements, an observation that appears at odds with their overall conclusions.

      Strengths:

      The multidisciplinary approach using multiple state-of-the-art tools is supported by a rigorous experimental design and strong statistical analyses. The authors have been highly responsive to previous critiques. Concerns of another reviewer regarding the confound between arousal and movement have been addressed by new pupillometry data as a measure of arousal and multivariate analyses to distinguish between the contributions of arousal vs. movement to hypocretin/orexin neuron activity. The new data in Figure 2H added in response to a suggestion by Reviewer 3 particularly strengthens the paper.

      Weaknesses:

      Reviewer 2 mentioned that previous studies using orexin antagonists in rodents have largely found inconsistent effect of antagonizing orexin signaling on simple motor activity and points out that these studies are not referenced here. The authors respond that "orexin antagonism - or optogenetic silencing of HONs - evokes either reduced locomotion, or no effect on locomotor movements" and add references to paragraph 4 of the Discussion. Aside from the fact that 2 of the 3 references added are from the senior author, none address the fact that orexin antagonists induce sleep and that optogenetic silencing of these cells creates a condition where sleep can ensue with short latency - results that certainly affect body movement/locomotor activity.

    1. eLife Assessment

      This manuscript describes a novel approach for assessing cognitive function in freely moving mice in their home-cage, without human involvement. The authors provide convincing evidence in support of the tasks they developed to capture a variety of complex behaviors and demonstrate the utility of a machine learning approach to expedite the acquisition of task demands. This work is important given its potential utility for other investigators interested in studying mouse cognition.

    2. Reviewer #1 (Public review):

      Summary:

      This is a new and important system that can efficiently train mice to perform a variety of cognitive tasks in a flexible manner. It is innovative and opens the door to important experiments in the neurobiology of learning and memory.

      Strengths:

      Strengths include: high n's, a robust system, task flexibility, comparison of manual-like training vs constant training, circadian analysis, comparison of varying cue types, long-term measurement, and machine teaching.

      Weaknesses:

      I find no major problems with this report.

      Comments on revisions:

      My concerns have been addressed now.

    3. Reviewer #2 (Public review):

      Summary:

      The manuscript by Yu et al. describes a novel approach for collecting complex and different cognitive phenotypes in individually housed mice in their home cage. The authors report a simple yet elegant design that they developed for assessing a variety of complex and novel behavioral paradigms autonomously in mice.

      Strengths:

      The data are strong, the arguments are convincing, and I think the manuscript will be highly cited given the complexity of behavioral phenotypes one can collect using this relatively inexpensive ($100/box) and high-throughput procedure (without the need of human interaction). Additionally, the authors include a machine learning algorithm to correct for erroneous strategies that mice develop which is incredibly elegant and important for this approach, as mice will develop odd strategies when given complete freedom.

      Weaknesses:

      A limitation to this approach is that it requires mice to be individually housed for days to months. This is now adequately addressed in the discussion.

      A major issue with continuous self-paced tasks such as the autonomous d2AFC used by the authors is that the inter-trial intervals can vary significantly. Mice may do a few trials, lose interest and disengage from the task for several hours. This is problematic for data analysis that relies on trial duration to be similar between trials (e.g., reinforcement learning algorithms). The authors now provide information regarding task engagement of the mice across a 24 hour cycle (e.g., trials started, trials finished across a 24 h period).

      Movies - it would be beneficial for the authors to add commentary to the video (hit, miss trials). It was interesting watching the mice but not clear whether they were doing the task correctly or not. The new videos adequately address these concerns.

      The strength of this paper (from my perspective) is the potential utility it has for other investigators trying to get mice to do behavioral tasks. However, not enough information was provided about the construction of the boxes, interface, and code for running the boxes. If the authors are not willing to provide this information through eLife, GitHub, or their own website then my evaluation of impact and significance of this paper would go down significantly. This information is now available to readers.

      Minor concerns

      Learning rate is confusing for Figure 3 results as it actually refers to trials to reach criterion, and not the actual rate of learning (e.g., slope). This has been modified in the manuscript.

      Comments on revisions:

      The authors have addressed all my concerns regarding this very exciting manuscript.

    4. Reviewer #3 (Public review):

      Summary:

      In this set of experiments, the authors describe a novel research tool for studying complex cognitive tasks in mice, the HABITS automated training apparatus, and a novel "machine teaching" approach they use to accelerate training by algorithmically providing trials to animals that provide the most information about the current rule state for a given task.

      Strengths:

      There is much to be celebrated in an inexpensively constructed, replicable training environment that can be used with mice, which have rapidly become the model species of choice for understanding the roles of distinct circuits and genetic factors in cognition. Lingering challenges in developing and testing cognitive tasks in mice remain, however, and these are often chalked up to cognitive limitations in the species. The authors' findings, however, suggest that instead we may need to work creatively to meet mice where they live. In some cases it may be that mice may require durations of training far longer than laboratories are able to invest with manual training (up to over 100k trials, over months of daily testing) but that the tasks are achievable. The "machine teaching" approach further suggests that this duration could be substantially reduced by algorithmically optimizing each trial presented during training to maximize learning.

      Weaknesses:

      Cognitive training and testing in rodent models fill a number of roles. Sometimes, investigators are interested in within-subjects questions - querying a specific circuit, genetically defined neuron population, or molecule/drug candidate, by interrogating or manipulating its function in a highly trained animal. In this scenario, a cohort of highly trained animals which have been trained via a method that aims to make their behavior as similar as possible is a strength.

      However, often investigators are interested in between-subjects questions - querying a source of individual differences that can have long term and/or developmental impacts, such as sex differences or gene variants. This is likely to often be the case in mouse models especially, because of their genetic tractability. In scenarios where investigators have examined cognitive processes between subjects in mice who vary across these sources of individual difference, the process of learning a task has been repeatedly shown to be different. The authors recognize that their approach is currently optimized for testing within-subjects questions, but begin to show how between-subjects questions might be addressed with this system.

      The authors have perhaps shown that their main focus is highly-controlled within-subjects questions, as their dataset is almost exclusively made up of several hundred young adult male mice, with the exception of 6 females in a supplemental figure. It is notable that these female mice do appear to learn the two-alternative forced choice task somewhat more rapidly than the males in their cohort, and the authors suggest that future work with this system could be used to uncover strategies that differ across individuals.

      Considering the implications for mice modeling relevant genetic variants, it is unclear to what extent the training protocols and especially the algorithmic machine teaching approach would be able to inform investigators about the differences between their groups during training. For investigators examining genetic models, it is unclear whether this extensive training experience would mitigate the ability to observe cognitive differences, or select for the animals best able to overcome them - eliminating the animals of interest. Likewise, the algorithmic approach aims to mitigate features of training such as side biases, but it is worth noting that the strategic uses of side biases in mice, as in primates, can benefit learning, rather than side biases solely being a problem. However, the investigators may be able to highlight variables selected by the algorithm that are associated with individual strategies in performing their tasks, and this would be a significant contribution.

      A final, intriguing finding in this manuscript is that animal self-paced training led to much slower learning than "manual" training, by having the experimenter introduce the animal to the apparatus for a few hours each day. Manual training resulted in significantly faster learning, in almost half the number of trials on average, and with significantly fewer omitted trials. This finding does not necessarily argue that manual training is universally a better choice, because it led to more limited water consumption. However, it suggests that there is a distinct contribution of experimenter interactions and/or switching contexts in cognitive training, for example, by activating an "occasion setting" process to accelerate learning for a distinct period of time. Limiting experimenter interactions with mice may be a labor saving intervention, but may not necessarily improve performance. This could be an interesting topic of future investigation, of relevance to understanding how animals of all species learn.

    5. Author response:

      The following is the authors’ response to the original reviews.

      Reviewer #1 (Public review): 

      Summary: 

      This is a new and important system that can efficiently train mice to perform a variety of cognitive tasks in a flexible manner. It is innovative and opens the door to important experiments in the neurobiology of learning and memory. 

      Strengths: 

      Strengths include: high n's, a robust system, task flexibility, comparison of manual-like training vs constant training, circadian analysis, comparison of varying cue types, long-term measurement, and machine teaching. 

      Weaknesses: 

      I find no major problems with this report. 

      Minor weaknesses: 

      (1)  Line 219: Water consumption per day remained the same, but number of trails triggered was more as training continued. First, is this related to manual-type training? Also, I'm trying to understand this result quantitatively, since it seems counter-intuitive: I would assume that with more trials, more water would be consumed since accuracy should go up over training (so more water per average trial). Am I understanding this right? Can the authors give more detail or understanding to how more trials can be triggered but no more water is consumed despite training? 

      Thanks for the comment. We would like to clarify the phenomenon described in Line 219: As the training advanced, the number of trials triggered by mice per day decreased (rather than increased as you mentioned in the comment) gradually for both manual and autonomous groups of mice (Fig. 2H left). The performance, as you mentioned, improved over time (Fig. 2D and 2E), leading to an increased probability of obtaining water and thus relatively stable daily water intake (Fig. 2H middle). We believe the stable daily intake is the minimum amount of water required by the mice under circumstance of autonomous behavioral training. To make the statement more clearly, we indicated the corresponding figure numbers in the text.

      Results “… As shown in Fig. 2H, autonomous training yielded significantly higher number of trial/day (980 ± 25 vs. 611 ± 26, Fig. 2H left) and more volume of water consumption/day (1.65 ± 0.06 vs. 0.97 ± 0.03 ml, Fig. 2H middle), which resulted in monotonic increase of body weight that was even comparable to the free water group (Fig.2H right). In contrast, the body weight in manual training group experienced a sharp drop at the beginning of training and was constantly lower than autonomous group throughout the training stage (Fig. 2H right).”

      (2) Figure 2J: The X-axis should have some label: at least "training type". Ideally, a legend with colors can be included, although I see the colors elsewhere in the figure. If a legend cannot be added, then the color scheme should be explained in the caption.

      Thanks for the suggestion. The labels with corresponding colors for x-axis have been added for Fig. 2J.

      (3) Figure 2K: What is the purple line? I encourage a legend here. The same legend could apply to 2J.

      Thanks for the suggestion. The legend has been added for Fig. 2K.

      (4) Supplementary Figure S2 D: I do not think the phrase "relying on" is correct. Instead, I think "predicted by" or "correlating with" might be better. 

      We thank the reviewer for the valuable suggestion. The phrase has been changed to ‘predicted by’ for better suitability.

      Figure S2 “(D), percentage of trials significantly predicted by different regressors during task learning. …”

      Reviewer #2 (Public review): 

      Summary: 

      The manuscript by Yu et al. describes a novel approach for collecting complex and different cognitive phenotypes in individually housed mice in their home cage. The authors report a simple yet elegant design that they developed for assessing a variety of complex and novel behavioral paradigms autonomously in mice. 

      Strengths: 

      The data are strong, the arguments are convincing, and I think the manuscript will be highly cited given the complexity of behavioral phenotypes one can collect using this relatively inexpensive ($100/box) and high throughput procedure (without the need for human interaction). Additionally, the authors include a machine learning algorithm to correct for erroneous strategies that mice develop which is incredibly elegant and important for this approach as mice will develop odd strategies when given complete freedom. 

      Weaknesses:

      (1) A limitation of this approach is that it requires mice to be individually housed for days to months. This should be discussed in depth. 

      Thank you for raising this important point. We agree that the requirement for individual housing of mice during the training period is a limitation of our approach, and we appreciate the opportunity to discuss this in more depth. In the manuscript, we add a section to the Discussion to address this limitation, including the potential impact of individual housing on the mice, the rationale for individual housing in our study, and efforts or alternatives made to mitigate the effects of individual housing.

      Discussion “… Firstly, our experiments were confined to single-housed mice, which is known to influence murine behavior and physiology, potentially affecting social interaction and stress levels [76]. In our study, individual housing was necessary to ensure precise behavioral tracking, eliminate competitive interactions during task performance, and maintain consistent training schedules without disruptions from cage-mate disturbances. However, the potential of group-housed training has been explored with technologies such as RFID [28,29,32–34] to distinguish individual mice, which potentially improving the training efficiency and facilitating research of social behaviors [77]. Notably, it has shown that simultaneous training of group-housed mice, without individual differentiation, can still achieve criterion performance [25].”

      (2) A major issue with continuous self-paced tasks such as the autonomous d2AFC used by the authors is that the inter-trial intervals can vary significantly. Mice may do a few trials, lose interest, and disengage from the task for several hours. This is problematic for data analysis that relies on trial duration to be similar between trials (e.g., reinforcement learning algorithms). It would be useful to see the task engagement of the mice across a 24-hour cycle (e.g., trials started, trials finished across a 24-hour period) and approaches for overcoming this issue of varying inter-trial intervals. 

      Thank you for your insightful comment regarding the variability in inter-trial intervals and its potential impact on data analysis. We agree that this is an important consideration for continuous self-paced tasks.

      In our original manuscript, we have showed the general task engagement across 24-hour cycle (Fig. 2K), which revealed two peaks of engagements during the dark cycle with relatively fewer trials during the light cycle. To facilitate analyses requiring consistent trial durations, we defined trial blocks as sequences between two no-response trials. Notably, approximately 66.6% of trials occurred within blocks of >5 consecutive trials (Fig. 2L), which may be particularly suitable for such analyses.

      In the revised manuscript, we also added the analysis of the histogram of inter-trial-interval for both the autonomous and manual training paradigms in HABITS (Fig. S2H), which shows that around 55.2% and 77.5% of the intervals are less than 2 seconds in autonomous and manual training, respectively.

      Results “… We found more than two-third of the trials was done in >5-trial blocks (Fig. 2L left) which resulted in more than 55% of the trials were with inter-trial-interval less than 2 seconds (Fig. S2H).”

      Regarding the approaches to mitigate the issue of varying inter-trial interval, we observed that manual training (i.e., manually transferring to HABITS for ~2 hr/day) in Fig. S2H resulted in more trials with short inter-trial-interval, suggesting that constrained access time promotes task engagement and reduces interval variability. Fig. 2L also indicated that the averaged correct rate increased and the earlylick rate decreased as the length of block increased. This approach could be valuable for studies where consistent trial timing is critical. In the context of our study, we could actually introduce a light, for example, to serve as the cue that prompt the animals to engage during a fixed time duration in a day.

      Discussion “… In contrast, the self-paced nature of autonomous training may permit greater variability in attentional engagement 83 and inter-trial-intervals, which could be problematic for data analysis relaying on consistent intervals and/or engagements. Future studies should explore how controlled contextual constraints enhance learning efficiency and whether incorporating such measures into HABITS could optimize its performance.”

      (3) Movies - it would be beneficial for the authors to add commentary to the video (hit, miss trials). It was interesting watching the mice but not clear whether they were doing the task correctly or not. 

      Thanks for the reminder. We have added subtitles to both of the videos. Since the supplementary video1 was not recorded with sound, the correctness of the trials was hard to judge. We replaced the video with another one with clear sound recordings, and the subtitles were commented in detail.

      (4) The strength of this paper (from my perspective) is the potential utility it has for other investigators trying to get mice to do behavioral tasks. However, not enough information was provided about the construction of the boxes, interface, and code for running the boxes. If the authors are not willing to provide this information through eLife, GitHub, or their own website then my evaluation of the impact and significance of this paper would go down significantly. 

      Thanks for this important comment. We would like to clarify that the construction methods, GUI, code for our system, PCB and CAD files (newly uploaded) have already been made publicly available on https://github.com/Yaoyao-Hao/HABITS. Additionally, we have open-sourced all the codes and raw data for all training protocols (https://doi.org/10.6084/m9.figshare.27192897). We will continue to maintain these resources in the future.

      Minor concerns: 

      (5) Learning rate is confusing for Figure 3 results as it actually refers to trials to reach the criterion, and not the actual rate of learning (e.g., slope).

      Thanks for pointing this out. The ‘learning rate’ which refers to trial number to reach criterion has been changed to ‘the number of trials to reach criterion’.

      Reviewer #3 (Public review): 

      Summary: 

      In this set of experiments, the authors describe a novel research tool for studying complex cognitive tasks in mice, the HABITS automated training apparatus, and a novel "machine teaching" approach they use to accelerate training by algorithmically providing trials to animals that provide the most information about the current rule state for a given task. 

      Strengths: 

      There is much to be celebrated in an inexpensively constructed, replicable training environment that can be used with mice, which have rapidly become the model species of choice for understanding the roles of distinct circuits and genetic factors in cognition. Lingering challenges in developing and testing cognitive tasks in mice remain, however, and these are often chalked up to cognitive limitations in the species. The authors' findings, however, suggest that instead, we may need to work creatively to meet mice where they live. In some cases, it may be that mice may require durations of training far longer than laboratories are able to invest with manual training (up to over 100k trials, over months of daily testing) but the tasks are achievable. The "machine teaching" approach further suggests that this duration could be substantially reduced by algorithmically optimizing each trial presented during training to maximize learning. 

      Weaknesses: 

      (1) Cognitive training and testing in rodent models fill a number of roles. Sometimes, investigators are interested in within-subjects questions - querying a specific circuit, genetically defined neuron population, or molecule/drug candidate, by interrogating or manipulating its function in a highly trained animal. In this scenario, a cohort of highly trained animals that have been trained via a method that aims to make their behavior as similar as possible is a strength. 

      However, often investigators are interested in between-subjects questions - querying a source of individual differences that can have long-term and/or developmental impacts, such as sex differences or gene variants. This is likely to often be the case in mouse models especially, because of their genetic tractability. In scenarios where investigators have examined cognitive processes between subjects in mice who vary across these sources of individual difference, the process of learning a task has been repeatedly shown to be different. The authors do not appear to have considered individual differences except perhaps as an obstacle to be overcome. 

      The authors have perhaps shown that their main focus is highly-controlled within-subjects questions, as their dataset is almost exclusively made up of several hundred young adult male mice, with the exception of 6 females in a supplemental figure. It is notable that these female mice do appear to learn the two-alternative forced-choice task somewhat more rapidly than the males in their cohort.

      Thank you for your insightful comments and for highlighting the importance of considering both within-subject and between-subject questions in cognitive training and testing in rodent models. We acknowledge that our study primarily focused on highly controlled within-subject questions. However, the datasets we provided did show preliminary evidences for the ‘between-subject’ questions. Key observations include:

      The large variability in learning rates among mice observed in Fig. 2I;

      The overall learning rate difference between male and female subjects (Fig. 2D vs. Fig. S2G);

      The varying nocturnal behavioral patterns (Fig. 2K), etc.

      We recognize the value of exploring between-subjects differences in mouse model and discussed more details in the Discussion part.

      Discussion “Our study was designed to standardize behavior for the precise interrogation of neural mechanisms, specifically addressing within-subject questions. However, investigators are often interested in between-subject differences—such as sex differences or genetic variants—which can have long-term behavioral and cognitive implications [72,74]. This is particularly relevant in mouse models due to their genetic tractability [75]. Although our primary focus was not on between-subject differences, the dataset we generated provides preliminary evidence for such investigations. Several behavioral readouts revealed individual variability among mice, including large disparities in learning rates across individuals (Fig. 2I), differences in overall learning rates between male and female subjects (Fig. 2D vs. Fig. S2G), variations in nocturnal behavioral patterns (Fig. 2K), etc.”

      (2) Considering the implications for mice modeling relevant genetic variants, it is unclear to what extent the training protocols and especially the algorithmic machine teaching approach would be able to inform investigators about the differences between their groups during training. For investigators examining genetic models, it is unclear whether this extensive training experience would mitigate the ability to observe cognitive differences, or select the animals best able to overcome them - eliminating the animals of interest. Likewise, the algorithmic approach aims to mitigate features of training such as side biases, but it is worth noting that the strategic uses of side biases in mice, as in primates, can benefit learning, rather than side biases solely being a problem. However, the investigators may be able to highlight variables selected by the algorithm that are associated with individual strategies in performing their tasks, and this would be a significant contribution.

      Thank you for the insightful comments. We acknowledge that the extensive training experience, particularly through the algorithmic machine teaching approach, could potentially influence the ability to observe cognitive differences between groups of mice with relevant genetic variants. However, our study design and findings suggest that this approach can still provide valuable insights into individual differences and strategies used by the animals during training. First, the behavioral readout (including learning rate, engagement pattern, etc.) as mentioned above, could tell certain number of differences among mice. Second, detailed modelling analysis (with logistical regression modelling) could further dissect the strategy that mouse use along the training process (Fig. S2B). We have actually highlighted some variables selected by the regression that are associated with individual strategies in performing their tasks (Fig. S2C) and these strategies could be different between manual and autonomous training groups (Fig. S2D). We included these comments in the Discussion part for further clearance.

      Discussion “… Furthermore, a detailed logistic regression analysis dissected the strategies mice employed during training (Fig. S2B). Notably, the regression identified variables associated with individual task-performance strategies (Fig. S2C), which also differed between manually and autonomously trained groups (Fig. S2D). Thus, our system could facilitate high-throughput behavioral studies exploring between-subject differences in the future.”

      (3) A final, intriguing finding in this manuscript is that animal self-paced training led to much slower learning than "manual" training, by having the experimenter introduce the animal to the apparatus for a few hours each day. Manual training resulted in significantly faster learning, in almost half the number of trials on average, and with significantly fewer omitted trials. This finding does not necessarily argue that manual training is universally a better choice because it leads to more limited water consumption. However, it suggests that there is a distinct contribution of experimenter interactions and/or switching contexts in cognitive training, for example by activating an "occasion setting" process to accelerate learning for a distinct period of time. Limiting experimenter interactions with mice may be a labor-saving intervention, but may not necessarily improve performance. This could be an interesting topic of future investigation, of relevance to understanding how animals of all species learn.

      Thank you for your insightful comments. We agree that the finding that manual training led to significantly faster learning compared to self-paced training is both intriguing and important. One of the possible reasons we think is due to the limited duration of engagement provided by the experimenter in the manual training case, which forced the mice to concentrate more on the trials (thus with fewer omitting trials) than in autonomous training. Your suggestion that experimenter interactions might activate an "occasion setting" process is particularly interesting. In the context of our study, we could actually introduce, for example, a light, serving as the cue that prompt the animals to engage; and when the light is off, the engagement was not accessible any more for the mice to simulate the manual training situation. We agree that this could be an interesting topic for future investigation that might create a more conducive environment for learning, thereby accelerating the learning rate.

      Discussion “… Lastly, while HABITS achieves criterion performance in a similar or even shorter overall days compared to manual training, it requires more trials to reach the same learning criterion (Fig. 2G). We hypothesize that this difference in trial efficiency may stem from the constrained engagement duration imposed by the experimenter in manual training, which could compel mice to focus more intensely on task execution, resulting in less trial omissions (Fig. 2F). In contrast, the self-paced nature of autonomous training may permit greater variability in attentional engagement 83 and inter-trial-intervals, which could be problematic for data analysis relaying on consistent intervals and/or engagements. Future studies should explore how controlled contextual constraints enhance learning efficiency and whether incorporating such measures into HABITS could optimize its performance.”

      Reviewer #2 (Recommendations for the authors):

      As I mentioned in the weaknesses, I did not see code or CAD drawings for their home cages and how these interact with a computer.

      Thanks for the comment. We would like to clarify that the construction methods, GUI, code for our system, PCB and CAD files (newly uploaded) have already been made publicly available on https://github.com/Yaoyao-Hao/HABITS.

    1. eLife Assessment

      This important study explores the power of computational methods to predict lifespan-extending small molecules, demonstrating that while these methods significantly increase hit rates, experimental validation remains essential. The study uses all-trans retinoic acid in Caenorhabditis elegans as a model, providing genetic and transcriptomic insights into its longevity effects. The data are compelling in describing a robust, computationally informed screening process for discovering compounds that extend lifespan in this species.

    2. Reviewer #1 (Public review):

      Summary:

      This study highlights the strengths of using predictive computational models to inform C. elegans screening studies of compounds' effects on aging and lifespan. The authors primarily focus on all-trans retinoic acid (atRA), one of the 5 compounds (out of 16 tested) that extended C. elegans lifespan in their experiments. They show that atRA has positive effects on C. elegans lifespan and age-related health, while it has more modest and inconsistent effects (i.e., some detrimental impacts) for C. briggsae and C. tropicalis. In genetic experiments designed to evaluate contributing mediators of lifespan extension with atRA exposure, it was found that 150 µM of atRA did not significantly extend lifespan in akt-1 or akt-2 loss-of-function mutants, nor in animals with loss of function of aak-2, or skn-1 (in which atRA had toxic effects); these genes appear to be required for atRA-mediated lifespan extension. hsf-1 and daf-16 loss-of-function mutants both had a modest but statistically significant lifespan extension with 150 µM of atRA, suggesting that these transcription factors may contribute towards mediating atRA lifespan extension, but that they are not individually required for some lifespan extension. RNAseq assessment of transcriptional changes in day 4 atRA-treated adult wild type worms revealed some interesting observations. Consistent with the study's genetic mutant lifespan observations, many of the atRA-regulated genes with the greatest fold-change differences are known regulated targets of daf-2 and/or skn-1 signaling pathways in C. elegans. hsf-1 loss-of-function mutants show a shifted atRA transcriptional response, revealing a dependence on hsf-1 for ~60% of the atRA-downregulated genes. On the other hand, RNAseq analysis in aak-2 loss-of-function mutants revealed that aak-2 is only required for less than a quarter of the atRA transcriptional response. All together, this study is a proof of the concept that computational models can help optimize C. elegans screening approaches that test compounds' effects on lifespan, and provides comprehensive transcriptomic and genetic insights into the lifespan-extending effects of all-trans retinoic acid (atRA).

      Strengths:

      A clearly described and well-justified account describes the approach used to prioritize and select compounds for screening, based on using the top candidates from a published list of computationally ranked compounds (Fuentealba et al., 2019) that were cross-referenced with other bioinformatics publications to predict anti-aging compounds, after de-selecting compounds previously evaluated in C. elegans as per the DrugAge database. 16 compounds were tested at 4-5 different concentrations to evaluate effects on C. elegans lifespan.

      Robust experimental design was undertaken evaluating the lifespan effects of atRA, as it was tested on three strains each of C. elegans, C. briggsae, and C. tropicalis, with trial replication performed at three distinct laboratories. These observations extended beyond lifespan to include evaluations of health metrics related to swimming performance.

      In-depth analyses of the RNAseq data of whole-worm transcriptional responses to atRA revealed interesting insights into regulator pathways and novel groups of genes that may be involved in mediating lifespan-extension effects (e.g., atRA-induced upregulation of sphingolipid metabolism genes, atRA-upregulation of genes in a poorly-characterized family of C. elegans paralogs predicted to have kinase-like activity, and disproportionate downregulation of collagen genes with atRA).

      Weaknesses:

      The authors' computational-based compound screening approach led to a ~30% prediction success rate for compounds that could extend the median lifespan of C. elegans. However, follow-up experiments on the top compounds highlighted the fact that some of these observed "successes" could be driven by indirect, confounding effects of these compounds on the bacterial food source, rather than direct beneficial effects on C. elegans physiology and lifespan. For instance, this appeared to be the case for the "top" hit of propranolol. Other compounds were not tested with metabolically inert or killed bacteria to preclude the possibility of bacteria-produced metabolites exerting observed effects; this might be a useful future direction to consider.

      Transcriptomic analyses of atRA effects were extensive in this study, but discussions of potential non-transcriptional effects of key proposed regulators (such as AMPK) were limited. For instance, other outputs of aak-2/AMPK (non-transcriptional changes to metabolic balance, autophagy, etc.) might account for its requirement for mediating lifespan extension effects, since aak-2 was not required for a major proportion of atRA transcriptional responses.

      Comments on revisions:

      In their revisions, the authors resolved all of my initial recommendations, and I have no additional suggestions.

    3. Reviewer #2 (Public review):

      Summary:

      In this manuscript, Banse et al. experimentally validate the power of computational approaches that predict anti-aging molecules using the multi-species approach of the Caenorhabditis Intervention Testing Program (CITP). Filtering candidate molecules based on transcriptional profiles, ML models, literature searches, and the DrugAge database, they selected 16 compounds for testing. Of those, eight did not affect C. elegans' lifespan, three shortened it, and five extended C. elegans' lifespan, resulting in a hit rate of over 30%. Of those five, they then focused on all-trans-retinoic acid (atRA), a compound that has previously resulted in contradictory effects. The lifespan-extending effect of atRA was consistent in all C. elegans strains tested, was absent in C. briggsae, and a small effect was observed in some C. tropicalis strains. Similar results were obtained for measures of healthspan. The authors then investigated the mechanism of action of atRA and showed that it was only partially dependent on daf-16 but required akt-1, akt-2, skn-1, hsf-1, and, to some degree, pmk-1. The authors further investigate the downstream effects of atRA exposure by conducting RNAseq experiments in both wild-type and mutant animals to show that some, but surprisingly few, of the gene expression changes that are observed in wild-type animals are lost in the hsf-1 and aak-2 mutants

      Strengths:

      Overall, this study is well-conceived and executed as it investigates the effect of atRA across different concentrations, strains, and species, including life and health span. Revealing the variability between sites, assays, and the method used is a powerful aspect of this study. It will do a lot to dispel the nonsensical illusion that we can determine a per cent increase in lifespan to the precision of two floating point numbers.

      An interesting and potentially important implication arises from this study. The computational selection of compounds was agnostic regarding strain or species differences and was predominantly based on observations made in mammalian systems. The hit rate calculated is based on the results of C. elegans and not on the molecules' effectiveness in Briggsae or Tropicalis. If it were, the hit rate would be much lower. How is that? It would suggest that ML models and transcriptional data obtained from mammals have a higher predictive value for C. elegans than for the other two species. This selectivity for C.elegans over C.tropicalis and C.Briggsae seems both puzzling and unexpected. The predictions for longevity were based on the transcriptional data in cell lines. Would it be feasible to compare the mammalian data to the transcriptional data in Fig. 5 and see how well they match? While this is clear beyond the focus of this study, an implied prediction is that running RNAseqs for all these strains exposed to atRA would reveal that the transcriptional changes observed in the strains where it extends lifespan the most should match the mammalian data best. Otherwise, how could the mammalian datasets be used to predict the effects for C.elegans over C.Briggsae or C.Tropicalis have more predictive for one species than the other? There are a lot of IFs in this prediction, but such an experiment would reconsider and validate the basis on which the original predictions were made.

      Weaknesses:

      Many of the most upregulated genes, such as cyps and pgps are xenobiotic response genes upregulated in many transcriptional datasets from C.elegans drug studies. Their expression might be necessary to deal with atRA breakdown metabolites to prevent toxicity rather than confer longevity. Because atRA is very light sensitive and has toxicity of breakdown, metabolites may explain some of the differences observed with the lifespan of machine effects compared to standard assay practices. However, the authors provide a potential explanation for that observation.

      Comments on revisions:

      The authors have adequately addressed my concerns and the paper is suitable for publication.

    4. Reviewer #3 (Public review):

      Summary:

      In this study, Banse et al., demonstrate that combining computer prediction with genetic analysis in distinct Caenorhabditis species can streamline the discovery of aging interventions by taking advantage of the diverse pool of compounds that are currently available. They demonstrate that through careful prioritization of candidate compounds, they are able to accomplish a 30% positive hit rate for interventions that produce significant lifespan extensions. Within the positive hits, they focus on all-trans retinoic acid (atRA) and discover that it modulates lifespan through conserved longevity pathways such as AKT-1 and AKT-2 (and other conserved Akt-targets such as Nrf2/SKN-1 and HSF1/HSF-1) as well as through AAK-2, a conserved catalytic subunit of AMPK. To better understand the genetic mechanisms behind lifespan extension upon atRA treatment, the authors perform RNAseq experiments using a variety of genetic backgrounds for cross comparison and validation. Using this current state-of-the-art approach for studying gene expression, the authors determine that atRA treatment produces gene expression changes across a broad set of stress-response and longevity-related pathways. Overall, this study is important since it highlights the potential of combining traditional genetic analysis in the genetically tractable organism C. elegans with computational methods that will become even more powerful with the swift advancements being made in artificial intelligence. The study possesses both theoretical and practical implications not only in the field of aging, but also in related fields such as health and disease. Most of the claims in this study are supported by solid evidence, but the conclusions can be refined with a small set of additional experiments or re-analysis of data.

      Strengths:

      (1) The criteria for prioritizing compounds for screening are well-defined and is easy to replicate (Figure 1), even for scientists with limited experience in computational biology. The approach is also adaptable to other systems or model organisms.

      (2) I commend the researchers for doing follow-up experiments with the compound propranolol to verify its effect of lifespan (Figure 2- figure supplement 2), given the observation that it affected the growth of OP50. To prevent false hits in the future, the reviewer recommends the use of inactivated OP50 for future experiments to remove this confounding variable.

      (3) The sources of variation (Figure 3-figure supplement 2) are taken into account and demonstrates the need for advancing our understanding of the lifespan phenotype due to inter-individual variation.

      (4) The addition of the C. elegans swim test in addition to the lifespan assays provides further evidence of atRA-induced improvement in longevity.

      (5) The RNAseq approach was performed in a variety of genetic backgrounds, which allowed the authors to determine the relationship between AAK-2 and HSF-1 regulation of the retinoic acid pathway in C. elegans, specifically, that the former functions downstream of the latter.

      Weaknesses:

      (1) The authors demonstrate that atRA extends lifespan in a species-specific manner (Figure 3). Specifically, this extension only occurs in the species C. elegans yet, the title implies that atRA-induced lifespan extension occurs in different Caenorhabditis species when it is clearly not the case. While the authors state that failure to observe phenotypes in C. briggsae and C. tropicalis is a common feature of CITP tests, they do not speculate as to why this phenomenon occurs.

      (2) There are discrepancies between the lifespan curves by hand (Figure 3-Figure supplement 1) and using the automated lifespan machine (Figure 3-supplement 3). Specifically, in the automated lifespan assays, there are drastic changes in the slope of the survival curve which do not occur in the manual assays and may be suggestive that confounding factors may still operate or produce additional variation in ALM experiments despite relatively well-controlled environmental conditions.

    5. Author response:

      The following is the authors’ response to the original reviews.

      Reviewer #1 (Public review):

      Summary:

      This study highlights the strengths of using predictive computational models to inform C. elegans screening studies of compounds' eCects on aging and lifespan. The authors primarily focus on all-trans retinoic acid (atRA), one of the 5 compounds (out of 16 tested) that extended C. elegans lifespan in their experiments. They show that atRA has positive eCects on C. elegans lifespan and age-related health, while it has more modest and inconsistent eCects (i.e., some detrimental impacts) for C. briggsae and C. tropicalis. In genetic experiments designed to evaluate contributing mediators of lifespan extension with atRA exposure, it was found that 150 µM of atRA did not significantly extend lifespan in akt1 or akt-2 loss-of-function mutants, nor in animals with loss of function of aak-2, or skn-1 (in which atRA had toxic eCects); these genes appear to be required for atRA-mediated lifespan extension. hsf-1 and daf-16 loss-of-function mutants both had a modest but statistically significant lifespan extension with 150 µM of atRA, suggesting that these transcription factors may contribute towards mediating atRA lifespan extension, but that they are not individually required for some lifespan extension. RNAseq assessment of transcriptional changes in day 4 atRA-treated adult wild-type worms revealed some interesting observations. Consistent with the study's genetic mutant lifespan observations, many of the atRA-regulated genes with the greatest fold-change diCerences are known regulated targets of daf-2 and/or skn-1 signaling pathways in C. elegans. hsf-1 loss-offunction mutants show a shifted atRA transcriptional response, revealing a dependence on hsf-1 for ~60% of the atRA-downregulated genes. On the other hand, RNAseq analysis in aak-2 loss-of-function mutants revealed that aak-2 is only required for less than a quarter of the atRA transcriptional response. All together, this study is proof of the concept that computational models can help optimize C. elegans screening approaches that test compounds' eCects on lifespan, and provide comprehensive transcriptomic and genetic insights into the lifespan-extending eCects of all-trans retinoic acid (atRA).

      Strengths:

      (1) A clearly described and well-justified account describes the approach used to prioritize and select compounds for screening, based on using the top candidates from a published list of computationally ranked compounds (Fuentealba et al., 2019) that were crossreferenced with other bioinformatics publications to predict anti-aging compounds, after de-selecting compounds previously evaluated in C. elegans as per the DrugAge database. 16 compounds were tested at 4-5 diCerent concentrations to evaluate eCects on C. elegans lifespan.

      (2) Robust experimental design was undertaken evaluating the lifespan eCects of atRA, as

      it was tested on three strains each of C. elegans, C. briggsae, and C. tropicalis, with trial replication performed at three distinct laboratories. These observations extended beyond lifespan to include evaluations of health metrics related to swimming performance.

      (3) In-depth analyses of the RNAseq data of whole-worm transcriptional responses to atRA revealed interesting insights into regulator pathways and novel groups of genes that may be involved in mediating lifespan-extension eCects (e.g., atRA-induced upregulation of sphingolipid metabolism genes, atRA-upregulation of genes in a poorly-characterized family of C. elegans paralogs predicted to have kinase-like activity, and disproportionate downregulation of collagen genes with atRA).

      We thank the reviewer for highlighting the strengths of our paper.

      Weaknesses:

      (1) The authors' computational-based compound screening approach led to a ~30% prediction success rate for compounds that could extend the median lifespan of C.elegans. However, follow-up experiments on the top compounds highlighted the fact that some of these observed "successes" could be driven by indirect, confounding eCects of these compounds on the bacterial food source, rather than direct beneficial eCects on C. elegans physiology and lifespan. For instance, this appeared to be the case for the "top" hit of propranolol; other compounds were not tested with metabolically inert or killed bacteria. In addition, there are no comparative metrics provided to compare this study's ~30% success rate to screening approaches that do not use computational predictions.

      We do test whether compounds have a direct e:ect on bacterial growth. We have the text to clarify that fact. There may be potential lifespan e:ects from atRA due to changes in bacterial metabolites, however exploring that more fully is beyond the scope of the current work. 

      We very much appreciate the question regarding relative success. An appropriate benchmark for “hit rate” is perhaps best provided by Petrascheck, Ye & Buck (2007), who conducted a large-scale screen of 88,000 compounds for e:ects on adult lifespan in C. elegans. They found an initial screening hit rate of 1.2% (1083/88000), which were then retested for a verified hit rate of 0.13% (115/88000), with a retest failure rate of 89% (968/1083). Similarly, Lucanic et al. (2016) screened 30,000 compounds, with an initial hit rate of approximately 1.7% (~500/30000), or these 180 were selected for retesting, resulting in a final verified hit rate of 0.19% (57/29680), which is comparable to the Petrascheck et al. result. The text in the discussion has been modified to include these studies.

      (2)Transcriptomic analyses of atRA eCects were extensive in this study, but evaluations and discussions of non-transcriptional eCects of key proposed regulators (such as AMPK) were limited. For instance, non-transcriptional eCects of aak-2/AMPK might account for its requirement for mediating lifespan extension eCects, since aak-2 was not required for a major proportion of atRA transcriptional responses.

      We naturally agree with the reviewer that non-transcriptional e:ects are possible and well worth pursuing in future work. However, these e:ects will still show within our study, as any upstream non-transcriptional e:ects are likely to reveal themselves in downstream transcriptional changes, as measured here.  

      Reviewer #2 (Public review):

      Summary:

      In this manuscript, Banse et al. experimentally validate the power of computational approaches that predict anti-aging molecules using the multi-species approach of the Caenorhabditis Intervention Testing Program (CITP). Filtering candidate molecules based on transcriptional profiles, ML models, literature searches, and the DrugAge database, they selected 16 compounds for testing. Of those, eight did not aCect C.elegan's lifespan, three shortened it, and five extended C.elegan's lifespan, resulting in a hit rate of over 30%. Of those five, they then focused on all-trans-retinoic acid (atRA), a compound that has previously resulted in contradictory eCects. The lifespan-extending eCect of atRA was consistent in all C. elegans strains tested, was absent in C. briggsae, and a small eCect was observed in some C. tropicalis strains. Similar results were obtained for measures of healthspan. The authors then investigated the mechanism of action of atRA and showed that it was only partially dependent on daf-16 but required akt-1, akt-2, skn-1, hsf-1, and, to some degree, pmk-1. The authors further investigate the downstream eCects of atRA exposure by conducting RNAseq experiments in both wild-type and mutant animals to show that some, but surprisingly few, of the gene expression changes that are observed in wild-type animals are lost in the hsf-1 and aak-2 mutants.

      Strengths:

      Overall, this study is well conceived and executed as it investigates the eCect of atRA across diCerent concentrations, strains, and species, including life and health span. Revealing the variability between sites, assays, and the method used is a powerful aspect of this study. It will do a lot to dispel the nonsensical illusion that we can determine a percent increase in lifespan to the precision of two floating point numbers.

      An interesting and potentially important implication arises from this study. The computational selection of compounds was agnostic regarding strain or species diCerences and was predominantly based on observations made in mammalian systems. The hit rate calculated is based on the results of C. elegans and not on the molecules' eCectiveness in Briggsae or Tropicalis. If it were, the hit rate would be much lower. How is that? It would suggest that ML models and transcriptional data obtained from mammals have a higher predictive value for C. elegans than for the other two species. This selectivity for C.elegans over C.tropicalis and C.Briggsae seems both puzzling and unexpected. The predictions for longevity were based on the transcriptional data in cell lines.

      This is a common observation in the CITP for which we do not currently have a satisfying explanation. For whatever reason, C. elegans is much more responsive to compounds than other species, much like it is more responsive to RNAi and other environmental interventions. It may be less active in detoxifying external agents than the other species, although this is just speculation at the moment. We continue to investigate this question, but that work is beyond the scope of the present paper.

      Would it be feasible to compare the mammalian data to the transcriptional data in Figure 5 and see how well they match? While this is clear beyond the focus of this study, an implied prediction is that running RNAseqs for all these strains exposed to atRA would reveal that the transcriptional changes observed in the strains where it extends lifespan the most should match the mammalian data best. Otherwise, how could the mammalian datasets be used to predict the eCects of C.elegans over C.Briggsae or C.Tropicalis have more predictive for one species than the other? There are a lot of IFs in this prediction, but such an experiment would reconsider and validate the basis on which the original predictions were made.

      These questions are worth pursuing in the future but are beyond the scope of the current work.

      Weaknesses:

      Many of the most upregulated genes, such as cyps and pgps are xenobiotic response genes upregulated in many transcriptional datasets from C. elegans drug studies. Their expression might be necessary to deal with atRA breakdown metabolites to prevent toxicity rather than confer longevity. Because atRA is very light sensitive and has toxicity of breakdown, metabolites may explain some of the diCerences observed with the lifespan of machine eCects compared to standard assay practices.

      This is certainly a possibility, although we often observe longer lifespans on the ALM, perhaps because they themselves are stressful, thereby providing a more sensitive background environment for detecting positive stress response modulators.

      Reviewer #3 (Public review):

      Summary:

      In this study, Banse et al., demonstrate that combining computer prediction with genetic analysis in distinct Caenorhabditis species can streamline the discovery of aging interventions by taking advantage of the diverse pool of compounds that are currently available. They demonstrate that through careful prioritization of candidate compounds, they are able to accomplish a 30% positive hit rate for interventions that produce significant lifespan extensions. Within the positive hits, they focus on all-trans retinoic acid (atRA) and discover that it modulates lifespan through conserved longevity pathways such as AKT-1 and AKT-2 (and other conserved Akt-targets such as Nrf2/SKN-1 and HSF1/HSF-1) as well as through AAK-2, a conserved catalytic subunit of AMPK. To better understand the genetic mechanisms behind lifespan extension upon atRA treatment, the authors perform RNAseq experiments using a variety of genetic backgrounds for cross-comparison and validation. Using this current state-of-the-art approach for studying gene expression, the authors determine that atRA treatment produces gene expression changes across a broad set of stress-response and longevity-related pathways. Overall, this study is important since it highlights the potential of combining traditional genetic analysis in the genetically tractable organism C. elegans with computational methods that will become even more powerful with the swift advancements being made in artificial intelligence. The study possesses both theoretical and practical implications not only in the field of aging but also in related fields such as health and disease. Most of the claims in this study are supported by solid evidence, but the conclusions can be refined with a small set of additional experiments or re-analysis of data.

      Strengths:

      (1) The criteria for prioritizing compounds for screening are well-defined and easy to replicate (Figure 1), even for scientists with limited experience in computational biology. The approach is also adaptable to other systems or model organisms.

      (2) I commend the researchers for doing follow-up experiments with the compound propranolol to verify its eCect on lifespan (Figure 2 Supplement 2), given the observation that it aCected the growth of OP50. To prevent false hits in the future, the reviewer recommends the use of inactivated OP50 for future experiments to remove this confounding variable.

      (3) The sources of variation (Figure 3, Figure Supplement 2) are taken into account and demonstrate the need for advancing our understanding of the lifespan phenotype due to inter-individual variation.

      (4) The addition of the C. elegans swim test in addition to the lifespan assays provides further evidence of atRA-induced improvement in longevity.

      (5) The RNAseq approach was performed in a variety of genetic backgrounds, which allowed the authors to determine the relationship between AAK-2 and HSF-1 regulation of the retinoic acid pathway in C. elegans, specifically, that the former functions downstream of the latter.

      We thank the reviewer for highlighting these strengths.

      Weaknesses:

      (1) The filtering of compounds for testing using the DrugAge database requires that the database is consistently updated. In this particular case, even though atRA does not appear in the database, the authors themselves cite literature that has already demonstrated atRA-induced lifespan extension, which should have precluded this compound from the analysis in the first place.

      As often happens in science, this work was initiated before Statzer et al. (2021) was published. As such, it is included in the test set.

      (2) The threshold for determining positive hits is arbitrary, and in this case, a 30% positive hit rate was observed when the threshold is set to a lifespan extension of around 5% based on Figure 1B (the authors fail to explicitly state the cut-oC for what is considered a positive hit).

      Any compound that statistically increases lifespan is considered a positive hit by the CITP. The CITP in general is powered to detect minimum e:ect sizes of 5%.

      (3) The authors demonstrate that atRA extends lifespan in a species-specific manner (Figure 3). Specifically, this extension only occurs in the species C. elegans yet, the title implies that atRA-induced lifespan extension occurs in diCerent Caenorhabditis species when it is clearly not the case. While the authors state that failure to observe phenotypes in C. briggsae and C. tropicalis is a common feature of CITP tests, they do not speculate as to why this phenomenon occurs.

      Please see the comment above.

      (4) There are discrepancies between the lifespan curves by hand (Figure 3 Figure Supplement 1) and using the automated lifespan machine (Figure 3 Supplement 3). Specifically, in the automated lifespan assays, there are drastic changes in the slope of the survival curve which do not occur in the manual assays. This may be due to improper filtering of non-worm objects, improper annotation of death times, or improper distribution of plates in each scanner.

      Our storyboarding SOP ensures that discrepancies in the shape of the curve are unlikely to be due to annotation errors. We check every page of the storyboard by hand, so all non-worm objects are excluded. Furthermore, the first and last ~10% of deaths are checked by hand (as we observed that these time points are the most likely to be wrongly called by the software), with a few deaths chosen at random from the middle to ensure that the software is calling death times accurately. If we find a high amount of inaccurately called deaths, the entire plate is annotated by hand. For this specific experiment, 18% of the total deaths were hand annotated. Plates are randomly distributed across each scanner in an e:ort to prevent bias. As noted above, it does appear that the ALM environment and the “by hand” environment are somewhat di:erent.

      (5) The authors miss an opportunity to determine whether the lifespan extension phenotype attributed to the retinoic acid pathway is mostly transcriptional in nature or whether some of it is post-transcriptional. The authors even state "that while aak-2 is absolutely required for the longevity eCects of atRA, aak-2 is required only for a small proportion (~1/4) of the transcriptional response", suggesting that some of the eCects are post-transcriptional. Further information could have been obtained had the authors also performed RNAseq analysis on the tol-1 mutant which exhibited an enhanced response to atRA compared to wild-type animals, and comparing the magnitude of gene expression changes between the tol-1 mutant and all other genetic backgrounds for which RNAseq was performed.

      Reviewer #1 (Recommendations for the authors):

      (1) Will the raw RNA-seq data be publicly deposited? Please clarify. This would strengthen the value of the study.

      All data is available. We have clarified this in the text.

      (2) Since all-trans retinoic acid is a metabolite of vitamin A, it seems important to include a discussion of and reference to the recent study SKN-1/NRF2 upregulation by vitamin A is conserved from nematodes to mammals and is critical for lifespan extension in Caenorhabditis elegans (Sirakawin et al Cell Reports 2024). Sirakawin et al include data that corroborates and expands on the findings of the current study, including the observation that vitamin A reduces whole-body lipid deposition (agrees with some of the transcriptional findings in the current study); that vitamin A protects against oxidative stress; that vitamin A elevates expression of gst-5, skn-1, and pmk-1; and that loss-offunction mutation of skn-1 has similar eCects to the current study, in terms of suppressing lifespan-extending eCects of vitamin A. In addition, adding some discussion of oxidative stress would strengthen this work, in light of widespread perceptions of the antioxidant properties of vitamin A (and its metabolites).

      Thank you for this suggestion. We have added this citation to the discussion.

      (3) Minor typo: Lines 341-342 - After a sentence that contains the phrase "collagen and neuropeptide related genes", the next sentence uses the term "the latter" in reference to the collagen genes (should be "the former").

      Edited in text.

      (4) Minor correction: In Figure 6, the information in the figure legend is swapped for figure panels A) and B).

      Edited in figure caption.

      (5) To me, the subtitle heading "Loss of AMPK leads to a unique transcriptional profile in response to atRA treatment" (Line 403) is misleading, considering the contents of the text in that section, and the data presented in Figure 6.

      We have altered this heading to reflect this comment.

      Reviewer #2 (Recommendations for the authors):

      Using diCerent colors for the diCerent testing sites would make Figure 3 more readable.

      Edited so that each lab is represented by a di:erent shade of green.

      Reviewer #3 (Recommendations for the authors):

      It would be interesting to investigate the eCect of even higher concentrations of atRA as it has been reported that atRA accumulation is associated with deleterious phenotypes in mice (Snyder et al., 2020, FASEB J).

      We tested the highest concentration (150 uM) based on the solubility of the compound using our standardized plate treatment protocol, so we are unable to test higher concentrations.  

      A good first guess for a downstream retinoid receptor is nhr-23 which is the homolog of the vertebrate ROR genes. Stehlin-Gaon et al. (2003, Nat Struct Mol Biol) have shown that atRA is a ligand for the orphan nuclear receptor RORβ. It might be interesting to study the eCects of atRA on an nhr-23::AID (auxin inducible degron) background. This would allow you to circumvent the developmental phenotypes as a result of nhr-23 knockdown. Patrick/Stephen

      A few notes on the text/figures:

      Line 342: I believe the authors meant "former" instead of "latter".

      Corrected in text.

      Line 346: Can you also highlight col-144 in Fig. 5 S1?

      This is not really feasible, as it is in the cluster near the where the axes meet (red arrow).

      Line 400: CUB pathogen - based on Figure 6 Supp 1, this occurs in aak-2 and not in hsf-1.

      Great catch by the reviewer. We have updated the figure with the correct information.

      Line 414: hedgehog-like signaling - occurs in hsf-1 instead of aak-2. Similar inconsistencies occur in lines 415 (sterol), 417 (C-type lectin), and 418 (unassigned pathogens)

      We have updated the text to eliminate potential conflicts/confusion in the presentation here.

      Line 434: I believe the authors meant Figure "6" instead of "7"

      Edited in text.

      Line 475: Is it "fifteen" or "sixteen" compounds initially targeted?

      Edited in text.

      Can you please include the population sizes for the lifespan assays if not yet included in the detailed protocol to be published in FigShare (to which I currently do not have access to)?

      Added “50 animals per petri plate” to Lifespan Assay methods section; additionally, all sample sizes are included as a summary tab in each dataset on figshare.com (10.6084/m9.figshare.c.6320690).

    1. eLife Assessment

      The authors of this important study investigate how telomere length regulates hTERT expression via non-telomeric binding of the telomere-associated protein TRF2. They conclusively show that TRF2 binding to long telomeres results in a reduction in its binding to the hTERT promoter, while short telomeres restore TRF2 binding in the hTERT promoter, recruiting repressor complexes like PRC2, and suppressing hTERT expression. There is convincing support for the claims and the findings should be of broad interest for cell biologists and those working in fields where telomeres alter function, such as cancer and aging.

    2. Reviewer #1 (Public review):

      Summary:

      The authors in this study extensively investigate how telomere length (TL) regulates hTERT expression via non-telomeric binding of the telomere-associated protein TRF2. They conclusively show that TRF2 binding to long telomeres results in a reduction in its binding to the hTERT promoter. In contrast, short telomeres restore TRF2 binding in the hTERT promoter, recruiting repressor complexes like PRC2, and suppressing hTERT expression. The study presents several significant findings revealing a previously unknown mechanism of hTERT regulation by TRF2 in a TL-dependent manner

      Strengths:

      (1) A previously unknown mechanism linking telomere length and hTERT regulation through the non-telomeric TRF2 protein has been established, strengthening our understanding of telomere biology.

      (2) The authors used both cancer cell lines and iPSCs to showcase their hypothesis and multiple parameters to validate the role of TRF2 in hTERT regulation.

      (3) Comprehensive integration of the recent literature findings and implementation in the current study.

      (4) In vivo validation of the findings.

      (5) Rigorous controls and well-designed assays have been used.

      Comments on current version:

      The current version of the manuscript has addressed all the reviewers' concerns to the best of its ability. However, understanding the limitations of the authors, exploring ALT cell lines for the current mechanism would be desirable in the future.

    3. Author response:

      The following is the authors’ response to the original reviews.

      Reviewer #1 (Public review):

      Summary:

      The authors in this study extensively investigate how telomere length (TL) regulates hTERT expression via non-telomeric binding of the telomere-associated protein TRF2. They conclusively show that TRF2 binding to long telomeres results in a reduction in its binding to the hTERT promoter. In contrast, short telomeres restore TRF2 binding in the hTERT promoter, recruiting repressor complexes like PRC2, and suppressing hTERT expression. The study presents several significant findings revealing a previously unknown mechanism of hTERT regulation by TRF2 in a TL-dependent manner

      Strengths:

      (1) A previously unknown mechanism linking telomere length and hTERT regulation through the non-telomeric TRF2 protein has been established strengthening the telomere biology understanding.

      (2) The authors used both cancer cell lines and iPSCs to showcase their hypothesis and multiple parameters to validate the role of TRF2 in hTERT regulation.

      (3) Comprehensive integration of the recent literature findings and implementation in the current study.

      (4) In vivo validation of the findings.

      (5) Rigorous controls and well-designed assays have been use.

      Weaknesses:

      (1) The authors should comment on the cell proliferation and morphology of the engineered cell lines with ST or LT.

      The cell proliferation and morphology of the engineered cells were monitored during experiments. With a doubling time within 16-18 hours, all the cancer cell line pairs used in the study were counted and seeded equally before experiments.

      No significant difference in morphology or cell count (before harvesting for experiments) was noted for the stable cell lines, namely, HT1080 ST-HT1080 LT, HCT116 p53 null scrambled control-HCT116 p53 null hTERC knockdown.

      MDAMB 231 cells which were treated with guanine-rich telomere repeats (GTR) over a period of 12 days, as per the protocol mentioned in Methods. Due to the alternate day of GTR treatment in serum-free media followed by replenishment with serum-supplemented media, we noted that cells would undergo periodic delay in their proliferation (or transient arrest) aligning with the GTR oligo-feeding cycles and appeared somewhat larger in comparison to their parental untreated cells.

      Next, the cells with Cas9-telomeric sgRNA mediated telomere trimming were maintained transiently (till 3 days after transfection). During this time, no significant change in morphology or cell proliferation was observed in any of the cell lines, namely HCT116 or HEK293T Gaussia Luciferase reporter cells. iPSCs were also monitored. However, no change in morphology or cellular proliferation was observed during the 5 days post-transfection and antibiotic selection.  

      (2) Also, the entire study uses engineered cell lines, with artificially elongated or shortened telomeres that conclusively demonstrate the role of hTERT regulation by TRF2 in telomere-length dependent manner, but using ALT negative cell lines with naturally short telomere length vs those with long telomeres will give better perspective. Primary cells can also be used in this context.

      The reviewer correctly highlights (as we also acknowledge in the Discussion) that our study primarily utilizes engineered cell lines with artificially elongated or shortened telomeres. We agree that using ALT-negative cells with naturally short versus long telomeres would provide additional perspective. However, a key challenge in this experimental setup is the inherent variation in TRF2 protein levels among these cell types—a parameter central to our hypothesis. Comparing observations across such non-isogenic cell line pairs presents experimental limitations as these would require extensive normalization for multiple factors and introduce additional complexities, which would be difficult to interpret with clarity.

      We had also explored primary cells, specifically foreskin fibroblasts and MRC5 lung fibroblasts, as suggested by the reviewer. However, we encountered two significant challenges. To achieve a notable telomere length difference of at least 20%, these primary cells had to undergo a minimum of 25 passages. During this period, we observed a substantial decline in their proliferation capacity and an increased tendency toward replicative senescence. Additionally, we noted a significant reduction in TRF2 protein levels as the primary cells aged, consistent with findings from Fujita K et al., 2010 (Nat Cell Biol.), which reported p53-induced, Siah-1-mediated proteasomal degradation of TRF2. Due to these practical limitations, we focused on cancer cell lines with respective isogenic backgrounds, ensuring a controlled experimental framework. On the other hand, this opens new avenues for future research to explore broader implications. Investigating other primary cell types that may not present these challenges could be a valuable direction for future studies.

      (3) The authors set up time-dependent telomere length changes by dox induction, which may differ from the gradual telomere attrition or elongation that occurs naturally during aging, disease progression, or therapy. This aspect should be explored.

      In this study, we utilized a Doxycycline-inducible hTERT expression system to modulate telomere length in cancer cells, aiming to capture any gradual changes that might occur upon steady telomerase induction or overexpression—an event frequently observed in cancer progression. We monitored telomere length and telomerase activity at regular intervals (Supplementary Figure 2), noting a gradual increase until a characteristic threshold was reached, followed by a reversal to the initial telomere length.

      While this model provides interesting insights in context of cancer cells, it does not replicate the conditions of aging or therapeutic intervention. We agree that exploring telomere length-dependent regulation of hTERT in normal aging cells is an important avenue for future research. Investigating TRF2 occupancy on the hTERT promoter in response to telomere length alterations through therapeutic interventions—such as telomestatin or imetelstat (telomerase inhibitors) and 6-thio-2’-deoxyguanosine (telomere damage inducer)—would provide valuable insights and warrants further exploration.

      (4) How does the hTERT regulation by TRF2 in a TL-dependent manner affect the ETS binding on hTERT mutant promoter sites?

      In our previous study (Sharma et al., 2021, Cell Reports), we have experimentally demonstrated that GABPA and TRF2 do not compete for binding at the mutant hTERT promoter (Figure 4M-R). Silencing GABPA in various mutant hTERT promoter cells did not increase TRF2 binding. While GABPA has been reported to show increased binding at the mutant promoter compared to the wild-type (Bell et al., 2015, Science), no telomere length (TL) sensitivity has been noted yet. In the current manuscript we show that telomere alterations in hTERT mutant cells (that do not form promoter G-quadruplex) does not significantly affect TRF2 occupancy at the promoter, reinforcing our earlier findings that G-quadruplex formation is crucial for TRF2 recruitment. Since TRF2 binding is not affected this would not impact GABPA binding. Therefore change in TL is unlikely to influence ETS binding by GABPA.

      (5) Stabilization of the G-quadruplex structures in ST and LT conditions along with the G4 disruption experimentation (demonstrated by the authors) will strengthen the hypothesis.

      We agree with the reviewer’s suggestion that stabilizing G-quadruplex (G4) structures in mutant promoter cells under ST and LT conditions would further strengthen our hypothesis. From our ChIP experiments on hTERT promoter mutant cells following G4 stabilization with ligands, as reported in Sharma et al. 2021 (Figure 5G), we observed that TRF2 occupancy was regained in the telomere-length unaltered versions of -124G>A and -146G>A HEK293T Gaussia luciferase cells (referred to as LT cells in the current manuscript).

      (6) The telomere length and the telomerase activity are not very consistent (Figure 2A, and S1A, Figure 4B and S3). Please comment.

      In this study, we employed both telomerase-dependent and independent methods for telomere elongation.

      HT1080 model: Telomere elongation resulted from constitutive overexpression of hTERC and hTERT, leading to a direct correlation with telomerase activity.

      HCT116 (p53-null) model: hTERC silencing in ST cells, a known limiting factor for telomerase activity, resulted in significantly lower telomerase activity and a 1.5-fold telomere length difference.

      MDAMB231 model: Guanine-rich telomeric repeat (GTR) feeding induced telomere elongation through recombinatorial mechanisms (Wright et al., 1996), leading to significant telomere length gain but no notable change in telomerase activity.

      HCT116 Cas9-telomeric sgRNA model: Telomere shortening occurred without modifying telomerase components, resulting in a minor, insignificant increase in telomerase activity (Figure 2A, S1).

      Regarding xenograft-derived HT1080 ST and LT cells (Figure 4B, S3), the observed variability in telomere length and telomerase activity may stem from infiltrating mouse cells, which naturally have longer telomeres and higher telomerase activity than human cells. Since in the reported assay tumour masses were not sorted to exclude mouse cells, using species-specific markers or fluorescently labelled HT1080 cells in future experiments would minimize bias. However, even though telomere length and telomerase activity assays cannot differentiate for cross-species differences, mRNA analysis and ChIP experiments performed specifically for hTERT and hTERC mRNA levels, TRF2 occupancy, and H3K27me3 enrichment on hTERT promoter (Figure 4B–E) strongly support our conclusions.

      (7) Please comment on the other telomere-associated proteins or regulatory pathways that might contribute to hTERT expression based on telomere length.

      The current study provides experimental evidence that TRF2, a well-characterized telomere-binding protein, mediates crosstalk between telomeres and the regulatory region of the hTERT gene in a telomere length-dependent manner. Given the observed link between hTERT expression and telomere length, it is likely that additional telomere-associated proteins and regulatory pathways contribute to this regulation.

      The remaining shelterin complex components—POT1, hRap1, TRF1, TIN2, and TPP1—may play crucial roles in this context, as they are integral to telomere maintenance and protection (Stewart J et al., 2012 Mutat Res.). Additionally, several DNA damage response (DDR) proteins, which interact with telomere-binding factors and help preserve telomere integrity, could potentially influence hTERT regulation in a telomere length-dependent manner (Longhese M, 2008 Genes & Development). However, direct interactions or regulatory roles would require further experimental validation. Another group of proteins with potential relevance in this mechanism are the sirtuins, which directly associate with telomeres and are known to positively regulate telomere length, undergoing repression upon telomere shortening (Amano H et al., 2019 Cell Metabolism, Amano H, Sahin E 2019 Molecular & Cellular Oncology). Notably, SIRT1 has been reported to interact with telomerase (Lee SE et al., 2024, Biochem Biophys Res Commun.), while SIRT6 has been implicated in TRF2 degradation (Rizzo et al. 2017) and telomerase activation (Chen J et al. 2021, Aging) . Given their roles in telomere homeostasis, sirtuins may serve as key mediators of telomere length-dependent hTERT regulation.

      Based on this suggestion, we have included the above in Discussion.

      Reviewer #2 (Public review):

      Summary:

      Telomeres are key genomic structures linked to everything from aging to cancer. These key structures at the end of chromosomes protect them from degradation during replication and rely on a complex made up of human telomerase RNA gene (hTERC) and human telomerase reverse transcriptase (hTERT). While hTERC is expressed in all cells, the amount of hTERT is tightly controlled. The main hypothesis being tested is whether telomere length itself could regulate the hTERT enzyme. The authors conducted several experiments with different methods to alter telomere length and measured the binding of key regulatory proteins to this gene. It was generally observed that the shortening of telomere length leads to the recruitment of factors that reduce hTERT expression and lengthening of telomeres has the opposite effect. To rule out direct chromatin looping between telomeres and hTERT as driving this effect artificial constructs were designed and inserted a significant distance away and similar results were obtained.

      Overall, the claims of telomere length-dependent regulation of hTERT are supported throughout the manuscript.

      Strengths:

      The paper has several important strengths. Firstly, it uses several methods and cell lines that consistently demonstrate the same directionality of the findings. Secondly, it builds on established findings in the field but still demonstrates how this mechanism is separate from that which has been observed. Specifically, designing and implementing luciferase assays in the CCR5 locus supports that direct chromatin looping isn't necessary to drive this effect with TRF2 binding. Another strength of this paper is that it has been built on a variety of other studies that have established principles such as G4-DNA in the hTERT locus and TRF2 binding to these G4 sites.

      Weaknesses:

      The largest technical weakness of the paper is that minimal replicates are used for each experiment. I understand that these kinds of experiments are quite costly, and many of the effects are quite large, however, experiments such as the flow cytometry or the IPSC telomere length and activity assays appear to be based on a single sample, and several are based upon two maximum three biological replicates. If samples were added the main effects would likely hold, and many of the assays using GAPDH as a control would result in significant differences between the groups. This unnecessarily weakens the strength of the claims.

      We appreciate the reviewer’s recognition of the resource-intensive nature of our experiments, and we are confident in the robustness of the observed results. Due to the project’s timeline constraints and the need for consistency across experiments, we have reported findings based on 3 biological replicates with appropriate statistical analysis.

      Regarding the fibroblast-iPSC model, we would like to clarify that we have presented data from two independent biological replicates, each consisting of a fibroblast and its derived iPS cell pair, rather than a single sample. Additionally, the Tel-FACS assays involved analysing at least 10,000 events, ensuring statistical significance in all cases.

      Another detail that weakens the confidence in the claims is that throughout the manuscript there are several examples of the control group with zero variance between any of the samples: e.g. Figure 2K, Figure 3N, and Figure 6G. It is my understanding that a delta delta method has been used for calculation (though no exact formula is reported and would assist in understanding). If this is the case, then an average of the control group would be used to calculate that fold change and variance would exist in the group. The only way I could understand those control group samples always set to 1 is if a tube of cells was divided into conditions and therefore normalized to the control group in each case. A clearer description in the figure legend and methods would be required if this is what was done and repeated measures ANOVA and other statistics should accompany this.

      The above point has been raised by the reviewer in the 'Recommendations for Authors' section as well. We have addressed it in detail in that section, citing each figure where the reviewer noted a concern regarding the lack of variance. Changes made in the manuscript have also been highlighted there.

      We would like to clarify that, throughout the manuscript, fold changes were previously calculated independently for each biological replicate by normalizing treated conditions to their corresponding control (untreated or Day 0) sample within the same replicate. This means that the control group is normalized to 1 individually in each replicate, resulting in an apparent lack of variance in the control when plotted. The normalization was not performed using an averaged control value across replicates. As such, the absence of visible variance in the control group reflects the normalization method rather than a true lack of variability in the underlying data.

      In the revised version of the manuscript, we have carefully considered the reviewer’s comments and applied changes wherever appropriate. For example (detailed response in the ‘Recommendations for Authors’ section), in datasets where two distinct stable cell lines are compared (e.g., HT1080 ST/LT and HCT p53-null ST/LT), unpaired statistical analysis is more appropriate. Hence, we have updated these panels accordingly and indicated the statistical methods used in the figure legends and Methods section. However, in experiments where cells were indeed seeded separately and subsequently subjected to experimental conditions—representing paired samples—we have chosen not to make any changes. A clearer description of this procedure has, however, been added to the Methods and figure legends to ensure full transparency.

      We believe this approach accurately reflects the experimental design, appropriately addresses the reviewer’s concerns regarding variance and statistical analysis, and ensures clarity and rigor in data reporting.

      A final technical weakness of the paper is the data in Figure 5 where the modified hTERT promoter was inserted upstream of the luciferase gene. Specifically, it is unclear why data was not directly compared between the constructs that could and could not form G4s to make this point. For this reason, the large variance in several samples, and minimal biological replicates, this data was the least convincing in the manuscript (though other papers from this laboratory and others support the claim, it is not convincing standalone data).

      We appreciate the reviewer's thoughtful feedback on the presentation of the luciferase assay data in Figure 5. The data for the wild-type hTERT promoter (capable of forming G4 structures) was previously reported in Figure 2G-K. To avoid redundancy in data presentation, we initially chose to report the results of the mutated promoter separately. However, we recognize that directly comparing the wild-type and mutated promoter constructs within the same figure would provide clearer context and strengthen the interpretation of the results. In light of this, we have updated Figure 5 in the revised manuscript to include the data for both constructs, ensuring a more comprehensive and informative comparison.

      The second largest weakness of the paper is formatting.

      When I initially read the paper without a careful reading of the methods, I thought that the authors did not have appropriate controls meaning that if a method is applied to lengthen, there should be one that is not lengthened, and when a method is applied to shorten, one which is not shortened should be analysed as well. In fact, this is what the authors have done with isogenic controls. However, by describing all samples as either telomere short or telomere long, while this simplifies the writing and the colour scheme, it makes it less clear that each experiment is performed relative to an unmodified. I would suggest putting the isogenic control in one colour, the artificially shortened in another, and the artificially lengthened in another.

      Similarly, the graphs, in general, should be consistent with labelling. Figure 2 was the most confusing. I would suggest one dotted line with cell lines above it, and then the method of either elongation or shortening below it. I.e. HT1080 above, hTERC overexpression below, MDAMB-231 above guanine terminal repeats below, like was done on the right. Figure 2 readability would also be improved by putting hTERT promoter GAPDH (-ve control) under each graph that uses this (Panel B and Panel C not just Panel C). All information is contained in the manuscript but one must currently flip between figure legends, methods, and figures to understand what was done and this reduces clarity for the reader.

      We thank the reviewer again for their thoughtful suggestions regarding figure formatting and colour coding to improve clarity. We fully understand the rationale for proposing separate colours for unmodified, telomere-shortened, and telomere-lengthened groups, as this could make the experimental design more immediately apparent. However, after careful consideration, we believe that implementing this change across all figures may unintentionally reduce clarity in other aspects  (presented in other figures) of the data presentation. This is further explained below.

      Specifically, applying three distinct colours throughout would make it harder to visually track key biological trends—such as changes in chromatin occupancy—across different models. For instance, the same colour could represent opposing regulatory patterns in distinct contexts (e.g., upregulation in one model and downregulation in another), which will make these figures difficult to understand. We feel that maintaining a consistent colour scheme based on telomere status—i.e., long telomeres (LT) vs short telomeres (ST)—across figures facilitates better comparison of biological outcomes across different experimental systems.

      Nevertheless, to address the reviewer’s concern about clarity in experimental design, we have added more detailed descriptions of the methodology and model systems used, in both the Methods and figure legend sections. These updates aim to make it easier for the reader to follow which groups serve as isogenic controls versus modified samples, without disrupting the consistency of data visualization.

      We hope this strikes a balance between improving clarity and preserving the interpretability of the broader biological trends presented in our manuscript.

      Please note, we have incorporated the reviewer’s suggestion to indicate details of model generation for HT1080 and MDAMB 231 cell lines in Figure 2. To quote the reviewer,  

      “I would suggest one dotted line with cell lines above it, and then the method of either elongation or shortening below it. I.e. HT1080 above, hTERC overexpression below, MDAMB-231 above guanine terminal repeats below, like was done on the right.”

      We have also put hTERT promoter GAPDH (-ve control) under each graph and not at the end of Panel C in Figure 2, as suggested by reviewer.

      Reviewer #1 (Recommendations for the authors):

      (1) Please check for grammatical errors throughout the manuscript.

      We have gone through the manuscript thoroughly, checked and corrected it for grammatical errors if and where detected.

      (2) Please use both the FACS and qPCR-based assays to check telomere length in all the experiments to strengthen the observations.

      We would like to thank the reviewer for this valuable suggestion. We confirm that both FACS- and qPCR-based assays were performed to assess telomere length in our experiments. In the original submission, we chose to present primarily the FACS-based data in the main figures. This decision was based on the inherent differences in the measurement principles of the two methods, which can lead to discrepancies in the reported fold changes. We were concerned that presenting both datasets side by side in the main figures might lead to confusion for readers who are not directly familiar with the nuances of telomere length assays.

      However, in light of the reviewer’s suggestion, we have now included the qPCR-based data as Supplementary Figure 1A, and updated the manuscript text and figure legends accordingly to reflect this addition.

      (3) Correct the labeling in the legend (Figure 2).

      We have corrected legend of Figure 2. Thanks to the reviewer for pointing it out.

      (4) In Figure 6B, why TRF WT condition have higher hTERT expression than the UT condition?

      We thank the reviewer for noting that the hTERT mRNA levels, as estimated by FISH in Figure 6B, appear slightly higher in TRF2 WT overexpressing HT1080 cells compared to the untransfected (UT) condition. Specifically, the average mean intensity values (a.u.) were 53 for UT and 57 for WT. Although this difference was not statistically significant, we acknowledge the reviewer's observation. Currently, we do not have a clear explanation for this small, non-significant variation.

      Importantly, using the same FISH-based method, we observed a significant upregulation of hTERT mRNA levels upon TRF2 R17H overexpression compared to both UT and TRF2 WT conditions, supporting our key conclusions.

      Additionally, qRT-PCR analysis of hTERT mRNA levels in cells stably expressing TRF2 WT (induced by doxycycline) consistently showed a significant downregulation compared to the uninduced (equivalent to UT in the microscopy experiments) state. These results were robust and reproducible across three different cell lines, including HT1080. Consistently, TRF2 R17H expression led to significant upregulation of hTERT mRNA levels upon induction.

      Together, these complementary findings strengthen the validity of our observations.

      (5) In telomere length between ST and LT in Fig. 5B significant? (especially the right panel -146G>A).

      We consistently worked with approximately 20–30% telomere shortening in HEK293 cells across all three cell types (WT promoter, -124G>A, and -146G>A), as this range was reproducibly achieved within the experimental timeframe without risking excessive telomere trimming. The reported telomere length differences are based on FACS analysis of more than 10,000 events per condition, providing strong statistical significance. Importantly, while the absolute differences in telomere length may appear modest, their biological impact is evident in the distinct cellular characteristics observed between ST and LT cell pairs.

      Reviewer #2 (Recommendations for the authors):

      As mentioned above it was somewhat unclear why so many instances of control groups had no variance between them. A more complete reporting of the formulas used to calculate the results, and methods (if samples were divided from a single source into different conditions) would be appreciated.

      We thank the reviewer for their valuable and detailed feedback. The instances where the control groups appeared to lack variance were mainly mRNA data (Figure 2D, 3G,3N), luciferase activity (Figure 2K), and in vitro methyltransferase activity (Figure 6G). We shall try to categorically address them all. 

      In Figure 2D, for the MDA-MB-231  GTR oligo and HCT116 telomere trimming datasets, the untreated cells were seeded separately and subsequently used to generate the treated conditions within the same experiment. Thus, these two datasets represent paired experimental conditions. Fold changes were calculated independently for each replicate (paired samples), and the fold changes across replicates were plotted. Because the control group serves as a common baseline within each pair and fold changes are normalized individually, minimal variance appears across controls. Given the experimental design, we believe no change is necessary for these panels. However, we have provided additional clarification regarding the calculation formulas and sample handling in the Methods section to avoid any ambiguity.

      For the ST/LT versions in HT1080 and HCT p53-null background cells, while each replicate could technically be treated as paired, these could be treated as four distinct stable cell lines. Hence, we agree it would be appropriate to apply unpaired statistical analysis for these datasets. We have updated the plots accordingly and described the statistical methods in detail in the figure legends and Methods section.

      Figure 3G and 3N depict the doxycycline-induced cells which follow the design: untreated and dox-treated conditions were seeded from the same batch of cells into separate flasks and treated differently. Hence, these are also paired cases, and fold changes were calculated per replicate before plotting. Therefore, we believe no changes are necessary for these panels. However, we have provided more details regarding sample handling in the Methods section to avoid any ambiguity.

      In Figure 2K, previously we had plotted fold change in luciferase activity over short telomere (ST) cells, for each independent biological replicates. However, to address the reviewer’s concern of not showing variance in control group, we have now plotted the luminescence signal (normalised over total protein). We have also updated Figure 5E accordingly, and also included WT promoter data along with the mutant cell line data- as was suggested in public reviewer’s comment.

      In Figure 6G, as each replicate of the in vitro methyltransferase activity used different batches of purified protein, there are inherent batch differences that were accounted for by normalizing each replicate internally. Fold changes were then determined for each replicate separately, as previously described. The fold changes across replicates were plotted, and significance between different conditions was tested using two-way ANOVA. To address the reviewer’s comment to show variance in the control, we have now plotted individual replicates.

      We believe these revisions, along with the expanded methods clarification, will fully address the reviewer's concerns and accurately reflect the experimental design and statistical analysis applied.

      Many times, in the manuscript a / is used to indicate both directions. For example: "Genes distal from telomeres (for instance 60 Mb from the nearest telomere) were activated/repressed in a TL-dependent way"... "Resulting increase/decrease in non-telomeric promoter-bound TRF2 affected gene expression". For readability, either this can be replaced with a directionless word like altered, changed, etc, or the writer can list both directions.

      We thank the reviewer for the careful reading and thoughtful suggestions. In the manuscript, we have used the ‘/’ symbol to indicate opposing directions, followed by the word ‘respectively’ to relate these directions to their corresponding outcomes, wherever appropriate. However, as rightly pointed out, certain sentences would benefit from alternative constructions for improved clarity and readability. We have therefore reviewed the manuscript and revised such sentences, making minor modifications wherever necessary, as outlined below.

      We found hTERT was transcriptionally altered depending on telomere length (TL).

      Notably, another conceptually distinct mechanism of TL-dependent gene regulation was reported which influenced genes spread throughout the genome: expression of genes distal from telomeres (for instance 60 Mb from the nearest telomere) was altered in a TL-dependent way, but without physical telomere looping interactions.

      Second, the shortening or elongation of telomeres led to the release or sequestration of telomeric TRF2, respectively, thereby increasing or decreasing the availability of TRF2 at non-telomeric promoters and affecting gene expression.

      A non-necessary, but potentially extra convincing experiment to perform would be to use a combination of light-activated, or ligand-activated cas9 telomere trimming and guanine terminal repeat additions in the same cell line. Like the dox experiments, this would show over time how altering telomere length alters the recruitment of heterochromatin factors and hTERT levels. Executing the experiment this way would be more definitive as it does not rely on changing hTERT itself. Authors do already have examples that support their claims.

      We thank the reviewer for suggesting this additional experiment (reviewer mentions as non-necessary), which would indeed provide valuable insights into the relationship between telomere length, heterochromatin factor recruitment, and hTERT levels. While we recognize the potential of this approach, due to constraints on resources, we are currently unable to execute this experiment. However, we believe that the existing data presented in the manuscript already supports our conclusions effectively.

    1. eLife Assessment

      This study provides valuable insights into the anti-senescence effects of enalapril, identifying pSmad1/5/9 signaling and associated antioxidant pathways as key mediators of its physiological benefits in aged mice. The authors present solid experimental evidence across both in vitro and in vivo systems, demonstrating improved organ function and reduced senescence markers following treatment. Overall, the work supports the repurposing potential of enalapril in aging research and expands understanding of its molecular targets.

    2. Reviewer #1 (Public review):

      Summary:

      In this study, the authors showed that enalapril was able to reduce cellular senescence and improve health status in aged mice. The authors further showed that phosphorylated Smad1/5/9 was significantly elevated and blocking this pathway attenuated the protection of cells from senescence. When middle-aged mice were treated with enalapril, the physiological performance in several tissues, including memory capacity, renal function and muscle strength, exhibited significant improvement.

      Strengths:

      The strength of the study lies in the identification of pSMAD1/5/9 pathway as the underlying mechanism mediating the anti-senescence effects of enalapril with comprehensive evaluation both in vitro and in vivo.

      Weaknesses:

      The major weakness of the study is the in vivo data. Despite the evidence shown in the in vitro study, there is no data to show that blocking the pSmad1/5/9 pathway is able to attenuate the anti-aging effects of enalapril in the mice. In addition, the aging phenotypes mitigation by enalapril is not evidenced by the extension of lifespan. If it is necessary to show that NAC is able to attenuate enalapril effects in the aging mice. In addition, it would be beneficial to test if enalapril is able to achieve similar rescue in a premature aging mouse model.

      Comments on revisions:

      The revised manuscript provided additional in vivo data that addressed my questions accordingly. I think the authors have done an excellent job in demonstrating that enalapril improved physiological phenotypes in aged mice through pSmad1/5/9 pathway.

      Their response to my question regarding the test in HGPS mice was not satisfactory. Premature aging and physiological aging share substantial similarities in their pathways. Given that this is not the focus of current study and the manuscript does not provide data on HGPS mice, I think this does not affect the conclusion of the current study.

    3. Reviewer #2 (Public review):

      This manuscript presents an interesting study of enalapril for its potential impact on senescence through the activation of Smad1/5/9 signaling with a focus on antioxidative gene expression. Repurposing enalapril in this context provides a fresh perspective on its effects beyond blood pressure regulation. The authors make a strong case for the importance of Smad1/5/9 in this process, and the inclusion of both in vitro and in vivo models adds value to the findings. Below, I have a few comments and suggestions which may help improve the manuscript.

      A major finding in the study is that phosphorylated Smad1/5/9 mediates the effects of enalapril. However, the manuscript focused on the Smad pathway relatively abruptly, and the rationale behind targeting this specific pathway is not fully explained. What makes Smad1/5/9 particularly relevant to the context of this study?

      Furthermore, their finding that activation of Smad1/5/9 leads to a reduction of senescence appears somewhat contradictory to the established literature on Smad1/5/9 in senescence. For instance, studies have shown that BMP4-induced senescence involves activation of Smad1/5/8 (Smad1/5/9), leading to the upregulation of senescence markers like p16 and p21 (JBC, 2009, 284, 12153). Similarly, phosphorylated Smad1/5/8 has been shown to promote and maintain senescence in Ras-activated cells (PLOS Genetics, 2011, 7, e1002359). Could the authors provide more detailed mechanistic insights into why enalapril seems to reverse the typical pro-senescent role of Smad1/5/9 in their study?

      While the authors showed that enalapril increases pSmad1/5/9 phosphorylation, what are the expression levels of other key and related factors like Smad4, pSmad2, pSmad3, BMP2, and BMP4 in both senescent and non-senescent cells? These data will help clarify the broader signaling effects.

      They used BMP receptor inhibitor LDN193189 to pharmacologically inhibit BMP signaling, but it would be more convincing to also include genetic validation (e.g., knockdown or knockout of BMP2 or BMP4). This will help confirm that the observed effects are truly due to BMP-Smad signaling and not off-target effects of the pharmacological inhibitor LDN.

      I don't see the results on the changes in senescence markers p16 and p21 in the mouse models treated with enalapril. Similarly, the effects of enalapril treatment on some key SASP factors, such as TNF-α, MCP-1, IL-1β, and IL-1α, are missing, particularly in serum and tissues. These are important data to evaluate the effect of enalapril on senescence.

      Given that enalapril is primarily known as an antihypertensive, it would be helpful to include data on how it affects blood pressure in the aged mouse models, such as systolic and diastolic blood pressure. This will clarify whether the observed effects are independent of or influenced by changes in blood pressure.

    4. Author response:

      The following is the authors’ response to the original reviews.

      Reviewer #1 (Public review):

      Summary:

      In this study, the authors showed that enalapril was able to reduce cellular senescence and improve health status in aged mice. The authors further showed that phosphorylated Smad1/5/9 was significantly elevated and blocking this pathway attenuated the protection of cells from senescence. When middle-aged mice were treated with enalapril, the physiological performance in several tissues, including memory capacity, renal function, and muscle strength, exhibited significant improvement.

      Strengths:

      The strength of the study lies in the identification of the pSMAD1/5/9 pathway as the underlying mechanism mediating the anti-senescence effects of enalapril with comprehensive evaluation both in vitro and in vivo.

      Thank you for your patient reading and great efforts to advance our research! Your comments are shown in bold font below, and specific concerns have been numbered. Our point-by-point answers are provided in standard blue font, with all modifications and additions to the MS highlighted in red text.

      Weaknesses:

      (1) The major weakness of the study is the in vivo data. Despite the evidence shown in the in vitro study, there is no data to show that blocking the pSmad1/5/9 pathway is able to attenuate the anti-aging effects of enalapril in the mice. In addition, the aging phenotypes mitigation by enalapril is not evidenced by the extension of lifespan.

      Many thanks for your careful reading and valuable comments! We fully agree with this comment. In accordance with your suggestion, we administered LDN193189 to investigate its suppressive effects on pSmad1/5/9 signaling in vivo. Notably, pharmacological inhibition of pSmad1/5/9 resulted in upregulation of enalapril-suppressed SASP factors, while conversely leading to marked decrease of downstream antioxidant genes expression across multiple organ systems (Revised Fig. S7). These analyses and corresponding sentences have been added in the Result section of the revised MS (Revised Fig.S7, Lines 222–223, 444–448).

      Additionally, aging-related behavioral phenotypes were also examined following pSmad1/5/9 inhibition, including decreased muscle strength and endurance, impaired spatial memory and increased anxiety behaviors (Revised Fig. S8). These analyses and corresponding sentences have been added in the Result section of the revised MS (Revised Fig.S8, Lines 476–480). Collectively, these findings demonstrate that the anti-aging effects of enalapril in mice are mediated through the pSmad1/5/9 pathway.

      In this study, we focused exclusively on assessing the improvement in the health status of aged mice, which indicates that enalapril can extend the healthspan of aged mice. While we agree that lifespan extension is an important indicator of anti-aging potential, recent studies have emphasized that healthspan, rather than lifespan alone, provides a more relevant and translational measure of aging interventions, particularly in the context of chronic disease and quality of life in aged individuals (Kennedy et al., 2014; Lopez-Otin et al., 2023). Moreover, given the strong influence of genetic background, environmental factors and stochastic events on lifespan, focusing on functional rejuvenation and delayed onset of aging-related pathologies may offer a more practical and mechanistically informative approach. Our study aims to elucidate how enalapril enhances healthy phenotypes in aged mice, however, we acknowledge the critical need for direct lifespan evaluation and intend to address this limitation in subsequent research. We sincerely hope that these explanations address your concerns.

      (2) If it is necessary to show that NAC is able to attenuate enalapril effects in the aging mice. In addition, it would be beneficial to test if enalapril is able to achieve similar rescue in a premature aging mouse model.

      Thanks for your suggestion. We apologize for any confusion that may have arisen due to the wording in the original manuscript. N-acetylcysteine (NAC) is widely reported as an antioxidant that scavenges reactive oxygen species (ROS) (Huang et al., 2020; Zafarullah et al., 2003). In our study, enalapril was also observed to reduce ROS levels. Therefore, NAC is unlikely to antagonize the effects of enalapril in this context, as both compounds act in a similar direction with respect to oxidative stress mitigation. To avoid potential misunderstanding, we have carefully reviewed the relevant statements in the MS and revised the text to clarify this point.

      We sincerely appreciate this valuable suggestion to evaluate enalapril in a premature aging mouse model; however, the premature aging mouse models represent a pathological form of aging, whereas the naturally aged mouse models used in our study reflect physiological aging processes. While we observed beneficial effects of enalapril in naturally aged mice, these effects may not necessarily extend to premature aging models due to fundamental differences in the underlying mechanisms and progression of aging. Natural aging is characterized by the gradual accumulation of cellular damage, driven by multifactorial processes such as inflammaging and mitochondrial dysfunction. In this context, enalapril appears effective, in part by modulating SASP factors and reducing oxidative stress through the BMP-Smad signaling axis (Revised Fig. 4, 5) (Lopez-Otin et al., 2023). In contrast, premature aging models are driven by distinct mechanisms like nuclear lamina defects, which may not respond similarly to BMP-Smad axis. Moreover, genetic background, strain variability, and specific model characteristics can significantly influence treatment outcomes (Mitchell et al., 2016). For instance, rapamycin extends lifespan in wild-type mice but shows limited effects on aging, underscoring the challenge of extrapolating findings across distinct aging models (Neff et al., 2013). We sincerely hope that these explanations address your concerns. Thank you again for your great efforts in advancing our research!

      Reviewer #2 (Public review):

      This manuscript presents an interesting study of enalapril for its potential impact on senescence through the activation of Smad1/5/9 signaling with a focus on antioxidative gene expression. Repurposing enalapril in this context provides a fresh perspective on its effects beyond blood pressure regulation. The authors make a strong case for the importance of Smad1/5/9 in this process, and the inclusion of both in vitro and in vivo models adds value to the findings. Below, I have a few comments and suggestions which may help improve the manuscript.

      We appreciate your great efforts in advancing our research! Your comments are shown in bold font below, and specific concerns have been numbered. Our point-by-point answers are provided in standard blue font, with all modifications and additions to the MS highlighted in red text.

      (1) A major finding in the study is that phosphorylated Smad1/5/9 mediates the effects of enalapril. However, the manuscript focused on the Smad pathway relatively abruptly, and the rationale behind targeting this specific pathway is not fully explained. What makes Smad1/5/9 particularly relevant to the context of this study?

      Thank you for your informative guidance, and we regret for the unclear description. As stated in the MS, after we found that enalapril could improve the cellular senescence phenotype, we screened and examined key targets in important aging-related signaling pathways, such as AKT, mTOR, ERK, Smad2/3 and Smad1/5/9 (Revised Fig. S2A, Revised Fig. 2A). We found that only the phosphorylation levels of Smad1/5/9 significantly increased after enalapril treatment. Therefore, the subsequent focus of this study is on pSmad1/5/9. We sincerely hope that these explanations address your concerns.

      (2) Furthermore, their finding that activation of Smad1/5/9 leads to a reduction of senescence appears somewhat contradictory to the established literature on Smad1/5/9 in senescence. For instance, studies have shown that BMP4-induced senescence involves the activation of Smad1/5/8 (Smad1/5/9), leading to the upregulation of senescence markers like p16 and p21 (JBC, 2009, 284, 12153). Similarly, phosphorylated Smad1/5/8 has been shown to promote and maintain senescence in Ras-activated cells (PLOS Genetics, 2011, 7, e1002359). Could the authors provide more detailed mechanistic insights into why enalapril seems to reverse the typical pro-senescent role of Smad1/5/9 in their study?

      Many thanks for your helpful comments! The downstream regulatory network of BMP-pSmad1/5/9 is highly complex. The BMP-SMAD-ID axis has been mentioned in many studies, and its downstream signaling inhibits the expression of p16 and p21 (Hayashi et al., 2016; Ying et al., 2003). Additionally, studies have also found that the Smad1-Stat1-P21 axis inhibits osteoblast senescence (Xu et al., 2022). In our study, enalapril was found to increase the expression of ID1, which is a classic downstream target of pSmad1/5/9 (Genander et al., 2014). Therefore, pSmad1/5/9 inhibits cellular senescence markers such as p16, p21 and SASP through ID1, thereby promoting cell proliferation (Revised Fig. 3). Furthermore, we also found that pSmad1/5/9 increases the expression of antioxidant genes and reduces ROS levels, exerting antioxidant effects (Revised Fig. 4). Together, ID1 and antioxidant genes enable pSmad1/5/9 to exert its anti-senescence effects. We sincerely hope that these explanations address your concerns.

      (3) While the authors showed that enalapril increases pSmad1/5/9 phosphorylation, what are the expression levels of other key and related factors like Smad4, pSmad2, pSmad3, BMP2, and BMP4 in both senescent and non-senescent cells? These data will help clarify the broader signaling effects.

      Thanks for your insightful suggestions. We observed an increase in pSmad1/5/9 and Smad4 expression, while the levels of pSmad2 and pSmad3 remained unchanged after enalapril treatment (Revised Fig. 2A). Consistently, we found that the levels of pSmad1/5/9 and Smad4 were markedly reduced in senescent cells, aligning with the upregulation of these proteins by enalapril (Revised Fig. S2B). In contrast, pSmad2 and pSmad3 showed a slight increase during senescence, while BMP2 and BMP4 were slightly decreased, though these changes were not statistically significant (Revised Fig. S2B). These findings suggest that enalapril primarily exerts its effects by enhancing pSmad1/5/9 and Smad4 levels, thereby regulating downstream target genes and contributing to the restoration of a more youthful cellular state. These analyses and corresponding sentences have been added in the Result section of the revised MS (Revised Fig.S2B, Lines 303–306, 311–313).

      (4) They used BMP receptor inhibitor LDN193189 to pharmacologically inhibit BMP signaling, but it would be more convincing to also include genetic validation (e.g., knockdown or knockout of BMP2 or BMP4). This will help confirm that the observed effects are truly due to BMP-Smad signaling and not off-target effects of the pharmacological inhibitor LDN.

      Many thanks for your careful reading and valuable comments! We used shRNA to knockdown the BMP receptor BMPR1A, which led to a reduction in Smad1/5/9 phosphorylation (Revised Fig. S4D, E). This was accompanied by senescence-associated phenotypes, including increased expression of p16 and SA-β-gal and decreased Ki67 staining (Revised Fig. S4F, G). Notably, the addition of enalapril failed to reverse these senescence phenotypes under BMPR1A knockdown conditions, mirroring the results observed with the BMP receptor inhibitor LDN193189 (Revised Fig. S4F, G, Revised Fig. 2F, G). Furthermore, knockdown of BMPR1A also resulted in a marked decrease in the expression of downstream targets, such as ID1 and antioxidative genes (Revised Fig. S4D). These findings strongly support the notion that enalapril exerts its anti-senescence effects through BMP-Smad signaling. These analyses and corresponding sentences have been added in the Result section of the revised MS (Revised Fig.S4D–G, Lines 323–329, 335–337, 348–351, 416–418).

      (5) I don't see the results on the changes in senescence markers p16 and p21 in the mouse models treated with enalapril. Similarly, the effects of enalapril treatment on some key SASP factors, such as TNF-α, MCP-1, IL-1β, and IL-1α, are missing, particularly in serum and tissues. These are important data to evaluate the effect of enalapril on senescence.

      Thanks for your comments. As for the markers p16 and p21, we observed no change in p16, while the changes in p21 varied across different organs and tissues. Nevertheless, behavioral experiments and physiological and biochemical indicators at the individual level consistently demonstrated the significant anti-aging effects of enalapril (Revised Fig. 6).

      We also examined the changes in SASP factors in the serum of mice after enalapril treatment. Notably, SASP factors such as CCL (MCP), CXCL and TNFRS11B showed significant decreases (Revised Fig. 5C). The expression changes of SASP factors varied across different organs. In the liver, kidneys and spleen, the expression of IL1a and IL1b decreased, while TNFRS11B expression decreased in both the liver and muscles (Revised Fig. 5B). Additionally, CCL (MCP) levels decreased in all organs (Revised Fig. 5B). We sincerely hope that these explanations address your concerns.

      (6) Given that enalapril is primarily known as an antihypertensive, it would be helpful to include data on how it affects blood pressure in the aged mouse models, such as systolic and diastolic blood pressure. This will clarify whether the observed effects are independent of or influenced by changes in blood pressure.

      Thanks for your comments. While enalapril is primarily recognized for its antihypertensive properties, in our experimental setting involving aged, normotensive mice, we did not observe notable changes in systolic or diastolic blood pressure following enalapril administration. This observation aligns with previous reports indicating that enalapril does not significantly affect blood pressure in similar non-hypertensive aging models (Keller et al., 2019). Based on these findings, we cautiously interpret that the beneficial effects of enalapril observed in our study are unlikely to be driven by changes in blood pressure. We sincerely hope that these explanations address your concerns. Again, thank you for the constructive comments to advance the understanding of our work!

      Reviewer #1 (Recommendations for the authors):

      This is an interesting study that reveals enalapril is able to elevate the pSmad1/5/9 pathway to reduce ROS and inflammation to improve the health status in vitro and in vivo. While the pathway is clearly shown in cells to be involved in the enalarpril-mediated mitigation of aging, little was done to demonstrate this pathway is responsible for the in vivo effects in the physiological improvements. This can be done by ROS-reduction chemicals such as NAC and also the use of BMP receptor inhibitor LDN193189 (LDN). It is critical to show the lifespan extension in enalapril-treated animals given that the significantly improved physiological functions.

      Thanks very much for your constructive recommendations. This part has already been addressed in our response to the public review.

      Reviewer #2 (Recommendations for the authors):

      The term "anti-aging" appears frequently throughout the manuscript, including in the title. However, the study doesn't directly address lifespan or a comprehensive range of aging symptoms, which are also difficult to define and measure. Many of the observed effects appeared to be driven by senescence. To be more accurate, I recommend avoiding terms like "anti-aging" and "mitigates aging", and instead replacing them with more specific phrases such as "anti-senescence", "senescence reduction/suppression", or "mitigates age-related symptoms" to better reflect the scope of the study and avoid overstating the findings.

      Thanks very much for your constructive recommendations. In accordance with your suggestion, we have revised all uses of the term “aging” in the MS. To facilitate review, all changes have been clearly marked in red text.

      Please provide detailed information on the antibodies used, particularly those targeting pSmad1/5/9 and other Smads.

      Thanks for your helpful comment. In response, we have now provided detailed information regarding the antibodies used in this study in Revised Table S4 (Revised MS, Page 120–121).

    1. eLife Assessment

      This valuable study provides solid evidence that MgdE, a conserved mycobacterial nucleomodulin, downregulates inflammatory gene transcription by interacting with the histone methyltransferase COMPASS complex and altering histone H3 lysine methylation. There are areas where the evidence could be strengthened, for example, GFP immunoblotting and examining MgdE localization during infection. To enhance impact, the authors could consider Mycobacterium tuberculosis infection experiments and/or reworking the manuscript to emphasize general relevance to microbiologists and cell biologists.

    2. Reviewer #1 (Public review):

      Summary:

      This fundamental study identifies a new mechanism that involves a mycobacterial nucleomodulin manipulation of the host histone methyltransferase COMPASS complex to promote infection. Although other intracellular pathogens are known to manipulate histone methylation, this is the first report demonstrating the specific targeting of the COMPASS complex by a pathogen. The rigorous experimental design using state-of-the art bioinformatic analysis, protein modeling, molecular and cellular interaction, and functional approaches, culminating with in vivo infection modeling, provides convincing, unequivocal evidence that supports the authors' claims. This work will be of particular interest to cellular microbiologists working on microbial virulence mechanisms and effectors, specifically nucleomodulins, and cell/cancer biologists that examine COMPASS dysfunction in cancer biology.

      Strengths:

      (1) The strengths of this study include the rigorous and comprehensive experimental design that involved numerous state-of-the-art approaches to identify potential nucleomodulins, define molecular nucleomodulin-host interactions, cellular nucleomodulin localization, intracellular survival, and inflammatory gene transcriptional responses, and confirmation of the inflammatory and infection phenotype in a small animal model.

      (2) The use of bioinformatic, cellular, and in vivo modeling that are consistent and support the overall conclusions is a strength of the study. In addition, the rigorous experimental design and data analysis, including the supplemental data provided, further strengthen the evidence supporting the conclusions.

      Weaknesses:

      (1) This work could be stronger if the MgdE-COMPASS subunit interactions that negatively impact COMPASS complex function were better defined. Since the COMPASS complex consists of many enzymes, examining the functional impact on each of the components would be interesting.

      (2) Examining the impact of WDR5 inhibitors on histone methylation, gene transcription, and mycobacterial infection could provide additional rigor and provide useful information related to the mechanisms and specific role of WDR5 inhibition on mycobacterial infection.

      (3) The interaction between MgdE and COMPASS complex subunit ASH2L is relatively undefined, and studies to understand the relationship between WDR5 and ASH2L in COMPASS complex function during infection could provide interesting molecular details that are undefined in this study.

      (4) The AlphaFold prediction results for all the nuclear proteins examined could be useful. Since the interaction predictions with COMPASS subunits range from 0.77 for WDR5 and 0.47 for ASH2L, it is not clear how the focus on COMPASS complex over other nuclear proteins was determined.

    3. Reviewer #2 (Public review):

      Summary:

      The manuscript by Chen et al addresses an important aspect of pathogenesis for mycobacterial pathogens, seeking to understand how bacterial effector proteins disrupt the host immune response. To address this question, the authors sought to identify bacterial effectors from M. tuberculosis (Mtb) that localize to the host nucleus and disrupt host gene expression as a means of impairing host immune function.

      Strengths:

      The researchers conducted a rigorous bioinformatic analysis to identify secreted effectors containing mammalian nuclear localization signal (NLS) sequences, which formed the basis of quantitative microscopy analysis to identify bacterial proteins that had nuclear targeting within human cells. The study used two complementary methods to detect protein-protein interaction: yeast two-hybrid assays and reciprocal immunoprecipitation (IP). The combined use of these techniques provides strong evidence of interactions between MgdE and SET1 components and suggests that the interactions are, in fact, direct. The authors also carried out a rigorous analysis of changes in gene expression in macrophages infected with the mgdE mutant BCG. They found strong and consistent effects on key cytokines such as IL6 and CSF1/2, suggesting that nuclear-localized MgdE does, in fact, alter gene expression during infection of macrophages.

      Weaknesses:

      There are some drawbacks in this study that limit the application of the findings to M. tuberculosis (Mtb) pathogenesis. The first concern is that much of the study relies on ectopic overexpression of proteins either in transfected non-immune cells (HEK293T) or in yeast, using 2-hybrid approaches. Some of their data in 293T cells is hard to interpret, and it is unclear if the protein-protein interactions they identify occur during natural infection with mycobacteria. The second major concern is that pathogenesis is studied using the BCG vaccine strain rather than virulent Mtb. However, overall, the key findings of the paper - that MgdE interacts with SET1 and alters gene expression are well-supported.

    4. Reviewer #3 (Public review):

      In this study, Chen L et al. systematically analyzed the mycobacterial nucleomodulins and identified MgdE as a key nucleomodulin in pathogenesis. They found that MgdE enters into host cell nucleus through two nuclear localization signals, KRIR108-111 and RLRRPR300-305, and then interacts with COMPASS complex subunits ASH2L and WDR5 to suppress H3K4 methylation-mediated transcription of pro-inflammatory cytokines, thereby promoting mycobacterial survival. This study is potentially interesting, but there are several critical issues that need to be addressed to support the conclusions of the manuscript.

      (1) Figure 2: The study identified MgdE as a nucleomodulin in mycobacteria and demonstrated its nuclear translocation via dual NLS motifs. The authors examined MgdE nuclear translocation through ectopic expression in HEK293T cells, which may not reflect physiological conditions. Nuclear-cytoplasmic fractionation experiments under mycobacterial infection should be performed to determine MgdE localization.

      (2) Figure 2F: The authors detected MgdE-EGFP using an anti-GFP antibody, but EGFP as a control was not detected in its lane. The authors should address this technical issue.

      (3) Figure 3C-3H: The data showing that the expression of all detected genes in 24 h is comparable to that in 4 h (but not 0 h) during WT BCG infection is beyond comprehension. The issue is also present in Figure 7C, Figure 7D, and Figure S7. Moreover, since Il6, Il1β (pro-inflammatory), and Il10 (anti-inflammatory) were all upregulated upon MgdE deletion, how do the authors explain the phenomenon that MgdE deletion simultaneously enhanced these gene expressions?

      (4) Figure 5: The authors confirmed the interactions between MgdE and WDR5/ASH2L. How does the interaction between MgdE and WDR5 inhibit COMPASS-dependent methyltransferase activity? Additionally, the precise MgdE-ASH2L binding interface and its functional impact on COMPASS assembly or activity require clarification.

      (5) Figure 6: The authors proposed that the MgdE-regulated COMPASS complex-H3K4me3 axis suppresses pro-inflammatory responses, but the presented data do not sufficiently support this claim. H3K4me3 inhibitor should be employed to verify cytokine production during infection.

      (6) There appears to be a discrepancy between the results shown in Figure S7 and its accompanying legend. The data related to inflammatory responses seem to be missing, and the data on bacterial colonization are confusing (bacterial DNA expression or CFU assay?).

      (7) Line 112-116: Please provide the original experimental data demonstrating nuclear localization of the 56 proteins harboring putative NLS motifs.

    5. Author response:

      The following is the authors’ response to the original reviews.

      Reviewer #1 (Public review): 

      Summary: 

      This fundamental study identifies a new mechanism that involves a mycobacterial nucleomodulin manipulation of the host histone methyltransferase COMPASS complex to promote infection. Although other intracellular pathogens are known to manipulate histone methylation, this is the first report demonstrating the specific targeting of the COMPASS complex by a pathogen. The rigorous experimental design using state-of-the art bioinformatic analysis, protein modeling, molecular and cellular interaction, and functional approaches, culminating with in vivo infection modeling, provides convincing, unequivocal evidence that supports the authors' claims. This work will be of particular interest to cellular microbiologists working on microbial virulence mechanisms and effectors, specifically nucleomodulins, and cell/cancer biologists that examine COMPASS dysfunction in cancer biology. 

      Strengths: 

      (1) The strengths of this study include the rigorous and comprehensive experimental design that involved numerous state-of-the-art approaches to identify potential nucleomodulins, define molecular nucleomodulin-host interactions, cellular nucleomodulin localization, intracellular survival, and inflammatory gene transcriptional responses, and confirmation of the inflammatory and infection phenotype in a small animal model. 

      (2) The use of bioinformatic, cellular, and in vivo modeling that are consistent and support the overall conclusions is a strength of the study. In addition, the rigorous experimental design and data analysis, including the supplemental data provided, further strengthen the evidence supporting the conclusions. 

      Weaknesses: 

      (1) This work could be stronger if the MgdE-COMPASS subunit interactions that negatively impact COMPASS complex function were better defined. Since the COMPASS complex consists of many enzymes, examining the functional impact on each of the components would be interesting. 

      We thank the reviewer for this insightful comment. A biochemistry assays could be helpful to interpret the functional impact on each of the components by MgdE interaction. However, the purification of the COMPASS complex could be a hard task itself due to the complexity of the full COMPASS complex along with its dynamic structural properties and limited solubility. 

      (2) Examining the impact of WDR5 inhibitors on histone methylation, gene transcription, and mycobacterial infection could provide additional rigor and provide useful information related to the mechanisms and specific role of WDR5 inhibition on mycobacterial infection. 

      We thank the reviewer for the comment. A previous study showed that WIN-site inhibitors, such as compound C6, can displace WDR5 from chromatin, leading to a reduction in global H3K4me3 levels and suppression of immune-related gene expression (Hung et al., Nucleic Acids Res, 2018; Bryan et al., Nucleic Acids Res, 2020). These results closely mirror the functional effects we observed for MgdE, suggesting that MgdE may act as a functional mimic of WDR5 inhibition. This supports our proposed model in which MgdE disrupts COMPASS activity by targeting WDR5, thereby dampening host pro-inflammatory responses.

      (3) The interaction between MgdE and COMPASS complex subunit ASH2L is relatively undefined, and studies to understand the relationship between WDR5 and ASH2L in COMPASS complex function during infection could provide interesting molecular details that are undefined in this study. 

      We thank the reviewer for the comment. In this study, we constructed single and multiple point mutants of MgdE at residues S<sup>80</sup>, D<sup>244</sup>, and H<sup>247</sup> to identify key amino acids involved in its interaction with ASH2L (Figure 5A and B; Figure S5). However these mutations did not interrupt the interaction with MgdE, suggesting that more residues are involved in the interaction.

      ASH2L and WDR5 function cooperatively within the WRAD module to stabilize the SET domain and promote H3K4 methyltransferase activity with physiological conditions (Couture and Skiniotis, Epigenetics, 2013; Qu et al., Cell, 2018; Rahman et al., Proc Natl Acad Sci U S A, 2022). ASH2L interacts with RbBP5 via its SPRY domain, whereas WDR5 bridges MLL1 and RbBP5 through the WIN and WBM motifs (Chen at al., Cell Res, 2012; Park et al., Nat Commun, 2019). The interaction status between ASH2L and WDR5 during mycobacterial infection could not be determined in our current study. 

      (4) The AlphaFold prediction results for all the nuclear proteins examined could be useful. Since the interaction predictions with COMPASS subunits range from 0.77 for WDR5 and 0.47 for ASH2L, it is not clear how the focus on COMPASS complex over other nuclear proteins was determined.  

      We thank the reviewer for the comment. We employed AlphaFold to predict the interactions between MgdE and the major nuclear proteins. This screen identified several subunits of the SET1/COMPASS complex as high-confidence candidates for interaction with MgdE (Supplementary Figure 4A). This result is consistent with a proteomic study by Penn et al. which reported potential interactions between MgdE and components of the human SET1/COMPASS complex based on affinity purification-mass spectrometry analysis (Penn et al., Mol Cell, 2018).

      Reviewer #2 (Public review): 

      Summary: 

      The manuscript by Chen et al addresses an important aspect of pathogenesis for mycobacterial pathogens, seeking to understand how bacterial effector proteins disrupt the host immune response. To address this question, the authors sought to identify bacterial effectors from M. tuberculosis (Mtb) that localize to the host nucleus and disrupt host gene expression as a means of impairing host immune function. 

      Strengths: 

      The researchers conducted a rigorous bioinformatic analysis to identify secreted effectors containing mammalian nuclear localization signal (NLS) sequences, which formed the basis of quantitative microscopy analysis to identify bacterial proteins that had nuclear targeting within human cells. The study used two complementary methods to detect protein-protein interaction: yeast two-hybrid assays and reciprocal immunoprecipitation (IP). The combined use of these techniques provides strong evidence of interactions between MgdE and SET1 components and suggests that the interactions are, in fact, direct. The authors also carried out a rigorous analysis of changes in gene expression in macrophages infected with the mgdE mutant BCG. They found strong and consistent effects on key cytokines such as IL6 and CSF1/2, suggesting that nuclear-localized MgdE does, in fact, alter gene expression during infection of macrophages. 

      Weaknesses: 

      There are some drawbacks in this study that limit the application of the findings to M. tuberculosis (Mtb) pathogenesis. The first concern is that much of the study relies on ectopic overexpression of proteins either in transfected non-immune cells (HEK293T) or in yeast, using 2-hybrid approaches. Some of their data in 293T cells is hard to interpret, and it is unclear if the protein-protein interactions they identify occur during natural infection with mycobacteria. The second major concern is that pathogenesis is studied using the BCG vaccine strain rather than virulent Mtb. However, overall, the key findings of the paper - that MgdE interacts with SET1 and alters gene expression are well-supported. 

      We thank the reviewer for the comment. We agree that the ectopic overexpression could not completely reflect a natural status, although these approaches were adopted in many similar experiments (Drerup et al., Molecular plant, 2013; Chen et al., Cell host & microbe, 2018; Ge et al., Autophagy, 2021). Further, the MgdE localization experiment using Mtb infected macrophages will be performed to increase the evidence in the natural infection.

      We agree with the reviewer that BCG strain could not fully recapitulate the pathogenicity or immunological complexity of M. tuberculosis infection.  We employed BCG as a biosafe surrogate model since it was acceptable in many related studies (Wang et al., Nat Immunol, 2025; Wang et al., Nat Commun, 2017; Péan et al., Nat Commun, 2017; Li et al., J Biol Chem, 2020). 

      Reviewer #3 (Public review): 

      In this study, Chen L et al. systematically analyzed the mycobacterial nucleomodulins and identified MgdE as a key nucleomodulin in pathogenesis. They found that MgdE enters into host cell nucleus through two nuclear localization signals, KRIR<sup>108-111</sup> and RLRRPR<sup>300-305</sup>, and then interacts with COMPASS complex subunits ASH2L and WDR5 to suppress H3K4 methylation-mediated transcription of pro-inflammatory cytokines, thereby promoting mycobacterial survival. This study is potentially interesting, but there are several critical issues that need to be addressed to support the conclusions of the manuscript.

      (1) Figure 2: The study identified MgdE as a nucleomodulin in mycobacteria and demonstrated its nuclear translocation via dual NLS motifs. The authors examined MgdE nuclear translocation through ectopic expression in HEK293T cells, which may not reflect physiological conditions. Nuclear-cytoplasmic fractionation experiments under mycobacterial infection should be performed to determine MgdE localization. 

      We thank the reviewer for the comment. The MgdE localization experiment using Mtb infected macrophages will be performed.

      (2) Figure 2F: The authors detected MgdE-EGFP using an anti-GFP antibody, but EGFP as a control was

      We thank the reviewer for pointing this out. The new uncropped blots containing the EGFP band will be provided in Supplementary Information.

      (3) Figure 3C-3H: The data showing that the expression of all detected genes in 24 h is comparable to that in 4 h (but not 0 h) during WT BCG infection is beyond comprehension. The issue is also present in Figure 7C, Figure 7D, and Figure S7. Moreover, since Il6, Il1β (proinflammatory), and Il10 (anti-inflammatory) were all upregulated upon MgdE deletion, how do the authors explain the phenomenon that MgdE deletion simultaneously enhanced these gene expressions? 

      We thank the reviewer for the comment. A relative quantification method was used in our qPCR experiments to normalize the WT expression levels in Figure 3C–3H, Figure 7C, 7D, and Figure S7. 

      The concurrent induction of both types of cytokines likely represents a dynamic host strategy to fine-tune immune responses during infection. This interpretation is supported by previous studies (Podleśny-Drabiniok et al., Cell Rep, 2025; Cicchese et al., Immunological Reviews, 2018).

      (4) Figure 5: The authors confirmed the interactions between MgdE and WDR5/ASH2L. How does the interaction between MgdE and WDR5 inhibit COMPASS-dependent methyltransferase activity? Additionally, the precise MgdE-ASH2L binding interface and its functional impact on COMPASS assembly or activity require clarification. 

      We thank the reviewer for this insightful comment. We cautiously speculate that the MgdE interaction inhibits COMPASS-dependent methyltransferase activity by interfering with the integrity and stability of the COMPASS complex. Accordingly, we have incorporated the following discussion into the revised manuscript (Lines 298-310):

      “The COMPASS complex facilitates H3K4 methylation through a conserved assembly mechanism involving multiple core subunits. WDR5, a central scaffolding component, interacts with RbBP5 and ASH2L to promote complex assembly and enzymatic activity (Qu et al., 2018; Wysocka et al., 2005). It also recognizes the WIN motif of methyltransferases such as MLL1, thereby anchoring them to the complex and stabilizing the ASH2L-RbBP5 dimer (Hsu et al., Cell, 2018). ASH2L further contributes to COMPASS activation by interacting with both RbBP5 and DPY30 and by stabilizing the SET domain, which is essential for efficient substrate recognition and catalysis (Qu et al., Cell, 2018; Park et al., Nat Commun, 2019). Our work shows that MgdE binds both WDR5 and ASH2L and inhibits the methyltransferase activity of the COMPASS complex. Site-directed mutagenesis revealed that residues D<sup>224</sup> and H<sup>247</sup> of MgdE are critical for WDR5 binding, as the double mutant MgdE-D<sup>224</sup>A/H<sup>247</sup> A fails to interact with WDR5 and shows diminished suppression of H3K4me3 levels (Figure 5D).”

      Regarding the precise MgdE-ASH2L binding interface, we attempted to identify the key interaction site by introducing point mutations into ASH2L. However, these mutations did not disrupt the interaction (Figure 5A and B; Figure S5), suggesting that more residues are involved in the interaction.

      (5) Figure 6: The authors proposed that the MgdE-regulated COMPASS complex-H3K4me3 axis suppresses pro-inflammatory responses, but the presented data do not sufficiently support this claim. H3K4me3 inhibitor should be employed to verify cytokine production during infection. 

      We thank the reviewer for the comment. We have now revised the description in lines 824825 “MgdE may suppresses COMPASS complex-mediated inflammatory responses by inhibiting H3K4 methylation” and in lines 219-220 "MgdE suppresses host inflammatory responses probably by inhibition of COMPASS complex-mediated H3K4 methylation." 

      (6) There appears to be a discrepancy between the results shown in Figure S7 and its accompanying legend. The data related to inflammatory responses seem to be missing, and the data on bacterial colonization are confusing (bacterial DNA expression or CFU assay?). 

      We thank the reviewer for the comment. Figure S7 specifically addresses the effect of MgdE on bacterial colonization in the spleens of infected mice, which was assessed by quantitative PCR rather than by CFU assay. 

      We have now revised the legend of Figure S7 as below (Lines 934-938):

      “MgdE facilitates bacterial colonization in the spleens of infected mice. Bacterial colonization was assessed in splenic homogenates from infected mice (as described in Figure 7A) by quantifying bacterial DNA using quantitative PCR at 2, 14, 21, 28, and 56 days post-infection.”

      (7) Line 112-116: Please provide the original experimental data demonstrating nuclear localization of the 56 proteins harboring putative NLS motifs. 

      We thank the reviewer for the comment. We will provide this data in the new Supplementary Table 2.

    1. eLife Assessment

      This study addresses an important question in sensory neuroscience: how the olfactory system distinguishes decreases in stimulus intensity from decreases in neural responses due to adaptation. Based on a combination of electrophysiological and behavioral analyses, solid evidence establishes that neural coding changes differently between intensity reductions and adaptation, with intensity changes altering which neurons are activated while adaptation preserves the active ensemble but reduces response magnitude. Intriguingly, behavioral responses tend to increase as the neural responses decrease, suggesting that core features of the odor response persist through adaptation. While the experimental results are convincing overall, the conclusions will be strengthened by future work recording behavior and neural dynamics in the same animals.

    2. Reviewer #1 (Public review):

      The authors use electrophysiological and behavioral measurements to examine how animals could reliably determine odor intensity/concentration across repeated experience. Because stimulus repetition leads to short-term adaptation evidenced by reduced overall firing rates in the antennal lobe and firing rates are otherwise concentration-dependent, there could be an ambiguity in sensory coding between reduced concentration or more recent experience. This would have a negative impact on the animal's ability to generate adaptive behavioral responses that depend odor intensities. The authors conclude that changes in concentration alter the constituent neurons contributing to the neural population response, whereas adaptation maintains the 'activated ensemble' but with scaled firing rates. This provides a neural coding account of the ability to distinguish odor concentrations even after extended experience. Additional analyses attempt to distinguish hypothesized circuit mechanisms for adaptation. A larger point that runs through the manuscript is that overall spiking activity has an inconsistent relationship with behavior and that the structure of population activity may be the more appropriate feature to consider.

      To my knowledge, the dissociation of effects of odor concentration and adaptation on olfactory system population codes was not previously demonstrated. This is a significant contribution that improves on any simple model based on overall spiking activity. The primary result is most strikingly supported by visualization of a principal components analysis in Figure 4. Additional experiments and analysis complement and provide context for this finding regarding the relationship between neural population changes and behavior. There are some natural limitations on the interpretation of these data imposed by the methodology.

      (1) Because individual recordings do not acquire a sufficient cell population to carry our population analyses, the cells must be combined into pseudopopulations for many analyses. This is common practice but it limits the ability to test the repeatability of findings across animals or populations. One potential additional solution would be to subsample the pseudopopulation, which would reveal the importance of individual sampled cells in the overall result. The utility of this additional testing is suggested by, for example, the benzaldehyde responses in supplementary figure 5, where two cells differentiate high and low concentration responses and would be expected to strongly impact correlation and classifier analyses.

      (2) I do not think the analysis in Figure 2e can be strongly interpreted in terms of the vesicle depletion model. The hard diagonal bound on the lower part of each scatter plot indicates that features of the data/analysis necessarily exclude data in the lower left quadrant. I think this could be possibly explained by a floor effect wherein lower-response neurons cannot possibly express a large deltaResponse. To strengthen this case, one would need to devise a control analysis for the case where neural responses are simply all going as far down as they can go.

      (3) Very minor, but it is confusing and not well-described how the error is computed in Figure 1f. One can imagine that the mean p(POR) is arrived at by averaging the binary values across locusts. Is this the case? If so, the same estimation of variance could be applied to Figures 1d and e

    3. Reviewer #3 (Public review):

      Summary:

      How does the brain distinguish stimulus intensity reduction from response reductions due to adaptation? Ling et al study whether and how the locust olfactory system encodes stimulus intensity and repetition differently. They show that these stimulus manipulations have distinguishable effects on population dynamics.

      Strengths:

      (1) Provides a potential strategy with which the brain can distinguish intensity decrease from adaptation. -- while both conditions reduce overall spike counts, intensity decrease can also changes which neurons are activated and adaptation only changes the response magnitude without changing the active ensemble.

      (2) By interleaving a non-repeated odor, they show that these changes are odor-specific and not a non-specific effect.

      (3) Describes how proboscis orientation response (POR) changes with stimulus repetition., Unlike the spike counts, POR increases in probability with stimulus. The data portray the variability across subjects in a clear way.

      Weaknesses:

      While POR and physiology can show a nice correlation when measured in different animals, additional insight would be gained from acquiring behavior and physiology simultaneously.

    1. eLife Assessment

      The manuscript is an important study which aims to demonstrate the conserved and crucial role of IgM in both systemic and mucosal antiviral immunity in teleost, challenging the established differential roles of IgT and IgM. The strength of the evidence is solid and supported by a combination of in vivo studies, viral infection models, and complementary in vitro assays. In the current version, authors validate the MoAb against IgM

    2. Reviewer #2 (Public review):

      Summary:

      In this manuscript, Weiguang Kong et al. investigate the role of immunoglobulin M (IgM) in antiviral defense in the teleost largemouth bass (Micropterus salmoides). The authors employ an in vivo IgM depletion system and viral infection models, complemented by in vitro assays, histology, and gene expression analysis. Assuming the specificity of the MoAb, their findings demonstrate that largemouth bass IgM functions in both systemic and mucosal immunity and exhibits viral neutralization capabilities by acting on viral particles.

      Strengths:

      The authors utilize multiple complementary methods, including an innovative teleost immunoglobulin depletion approach, to provide strong evidence for the important and conserved role of IgM in anti-viral resistance. The study also highlights the dual role of teleost IgM at both systemic and mucosal levels, challenging the established idea that IgT primarily mediates mucosal protection. Despite variability in IgM depletion levels, the authors demonstrate that fish with depleted IgM+ B cells exhibit significantly higher viral loads, more severe pathological changes, and increased mortality compared to control fish. These results have evolutionary and practical implications, suggesting that IgM's role as an antiviral effector has been conserved across jawed vertebrates for over 500 million years. Insights into IgM's role could inform vaccine strategies targeting mucosal immunity in fish, addressing a key challenge in aquaculture.

      Weaknesses:

      While the authors validate the specificity of MoAb against IgM and address most of the aspects suggested by the reviewer. Some aspects are missing, mainly concerning the overstatement of the findings' novelty.

    1. eLife Assessment

      This study presents important findings on the insecticidal mechanism of betulin, a plant-derived metabolite, in controlling the aphid Myzus persicae and it provides a demonstration that betulin targets the GABA receptor in aphids, with strong supporting evidence from transcriptomic, biochemical, electrophysiological, and genetic approaches. In particular, the identification of a specific conserved residue (THR228) critical for betulin binding advances our understanding of insect neuropharmacology and offers translational potential for pest management strategies. The evidence supporting the primary claims is solid, with well-integrated methodologies and appropriate controls; however, some interpretative and methodological limitations remain, including the option to further explore off-target effects, as well as the broader evolutionary and ecological context. Addressing these points would strengthen the broader implications of the study.

    2. Reviewer #1 (Public review):

      Wang, Junxiu et al. investigated the underlying molecular mechanisms of the insecticidal activity of betulin against the peach aphid, Myzus persicae. There are two important findings described in this manuscript: (a) betulin inhibits the gene expression of GABA receptor in the aphid, and (b) betulin binds to the GABA receptor protein, acting as an inhibitor. The first finding is supported by RNA-Seq and RNAi, and the second one is convinced with MST and electrophysiological assays. Further investigations on the betulin binding site on the receptor protein provided a fundamental discovery that T228 is the key amino acid residue for its affinity, thereby acting as an inhibitor, backed up by site-directed mutagenesis of the heterologously-expressed receptor in E. coli and by CRISPR-genome editing in Drosophila.

      Although the manuscript does have strengths in principle, the weaknesses do exist: the manuscript would benefit from more comprehensive analyses to fully support its key claims in the manuscript. In particular:

      (1) The Western blotting results in Figure 5A & B appear to support the claim that betulin inhibits GABR gene expression (L26), as a decrease in target protein levels is often indicative of suppressed gene expression. The result description for Figure 5A & B is found in L312-L316, within Section 3.6 ("Responses of MpGABR to betulin"), where MST and voltage-clamp assays are also presented. It seems the observed decrease in MpGABR protein content is due to gene downregulation, rather than a direct receptor protein-betulin interaction. However, this interpretation lacks discussion or analysis in either the corresponding results section or the Discussion. In contrast, Figures 5C-F are specifically designed to illustrate protein-betulin interactions. Presenting Figure 5A & B alongside these panels might lead to confusion, as they support distinct claims (gene expression vs. protein binding/inhibition). Therefore, I recommend moving Figure 5A & B either to the end of Figure 3 or to a separate figure altogether to improve clarity and logical flow. A minor point in the Western blotting experiment is that although GAPDH was used as a reference protein, there is no explanation in the corresponding M&M section.

      (2) The description of the electrophysiological recording experiment is unclear regarding the use of GABA. I didn't realize that GABA, the true ligand of the GABA receptor, was used in this inhibition experiment until I reached the Results section (L321), which states, "In the presence of only GABA, a fast inward current was generated." Crucially, no details are provided on the experiment itself, including how GABA was applied (e.g., concentration, duration, whether GABA was treated, followed by betulin, or vice versa). This information is essential for reproducibility. Please ensure these details are thoroughly described in the corresponding M&M section.

      (3) The phylogenetic analysis, particularly concerning Figures 4 and 6B, needs significant attention for clarity and representativeness. First, your claim that MpGABR is only closely related to CAI6365831.1 (L305-L310) is inconsistent with the provided phylogenetic tree, which shows MpGABR as equally close to Metopolophium dirhodum (XP_060864885.1) and Acyrthosiphon pisum (XP_008183008.2). Therefore, singling out only Macrosiphum euphorbiae (CAI6365831.1) is not supported by the data. Second, the representation of various insect orders is insufficient. All 11 sequences in the Hemiptera category (in both Figure 4 and Figure 6B) are exclusively from the Aphididae family. This small subset cannot represent the highly diverse Order Hemiptera. Consequently, statements like "only THR228 was conserved in Hemiptera" (L338), "The results of the sequence alignment revealed that only THR228 was conserved in Hemiptera" (L430), or "THR228... is highly conserved in Hemiptera" (L486) are not adequately supported. Third, similar concerns apply to the Diptera order, which includes 10 Drosophila and 2 mosquito samples (not diverse or representative enough), and likely to other orders as well. Thereby, the Figure 6B alignment should be revised accordingly to reflect a more accurate representation or to clarify the scope of the analysis. Fourth, there's a discrepancy in the phylogenetic method used: the M&M section (L156) states that MEGA7, ClustalW, and the neighbor-joining method were used, while the Figure 4 caption mentions that MEGA X, MUSCLE, and the Maximum likelihood method were employed. This inconsistency needs to be clarified and made consistent throughout the manuscript. Fifth, I have significant concerns about the phylogenetic tree itself (Figure 4). A small glitch was observed at the Danaus plexippus node, which raises suspicion regarding potential manipulation after tree construction. More critically, the tree, especially within Coleoptera, does not appear to be clearly resolved. I am highly concerned about whether all included sequences are true GABR orthologs or if the dataset includes partial or related sequences that could distort the phylogeny. Finally, for Figure 6B, both protein (XP_) and nucleotide (XM_) sequences were mix used. I recommend using the protein sequences instead of nucleotide sequences in this figure panel, as protein sequences are more directly informative.

      (4) The Discussion section requires significant revision to provide a more insightful and interpretative analysis of the results. Currently, much of the section primarily restates findings rather than offering deeper discussion. For instance, L409-L419 restate the results, followed by the short sentence "Collectively, these results suggest that betulin may have insecticidal effects on aphids by inhibiting MpGABR expression". It could be further expanded to make it beneficial to elaborate on proposed mechanisms by which gene expression might be suppressed, including any potential transcription factors involved. In contrast, while L422-L442 also initially summarize results, the subsequent paragraph (L445-L472) effectively discusses the potential mechanisms of inhibitory action and how mortality is triggered, which is a good model for other parts of the section. However, all the discussion ends up with a short statement, "implying that betulin acts as a CA of MpGABR" (L472), which appears to be a leap. The inference that betulin acts as a competitive antagonist (CA) is solely based on the location of its extracellular binding site, which does not exactly overlap with the GABA binding site. It needs stronger justification or actually requires further experimental validation. The authors should consider rephrasing this statement to acknowledge the need for additional studies to definitively confirm this mechanism of action.

    3. Reviewer #2 (Public review):

      Summary:

      This important study shows that betulin from wild peach trees disrupts neural signaling in aphids by targeting a conserved site in the insect GABA receptor. The authors present a nicely integrated set of molecular, physiological, and genetic experiments to establish the compound's species-specific mode of action. While the mechanistic evidence is solid, the manuscript would benefit from a broader discussion of evolutionary conservation and potential off-target ecological effects.

      Strengths:

      The main strengths of the study lie in its mechanistic clarity and experimental rigor. The identification of a betulin-binding single threonine residue was supported by (1) site-directed mutagenesis and (2) functional assays. These experiments strongly support the specificity of action. Furthermore, the use of comparative analyses between aphids and fruit flies demonstrates an important effort to explore species specificity, and the integration of quantitative data further enhances the robustness of the conclusions.

      Weaknesses:

      There are several important limitations that need to be addressed. The manuscript does not explore whether the observed sensitivity to betulin reflects a broadly conserved feature of GABA receptors across animal lineages or a more lineage-specific adaptation. This evolutionary context is crucial for understanding the broader significance of the findings.

      In addition, while the compound's aphicidal effect is well established, the potential for off-target effects in non-target organisms - especially vertebrates - remains unaddressed, despite prior evidence that betulin interacts with mammalian GABAa receptors. There is little discussion on the ecological or environmental safety of exogenous betulin application, such as persistence, degradation, or exposure risks.

    1. eLife Assessment

      This valuable study provides evidence supporting a critical role of the axonemal protein ANKRD5 in male infertility. The data generally supports the conclusions and is considered solid, although there are concerns about the cryo-ET analysis. This work will be of interest to biomedical researchers studying ciliogenesis and fertility.

    2. Reviewer #1 (Public review):

      Summary:

      Asthenospermia, characterized by reduced sperm motility, is one of the major causes of male infertility. The "9 + 2" arranged MTs and over 200 associated proteins constitute the axoneme, the molecular machine for flagellar and ciliary motility. Understanding the physiological functions of axonemal proteins, particularly their links to male infertility, could help uncover the genetic causes of asthenospermia and improve its clinical diagnosis and management. In this study, the authors generated Ankrd5 null mice and found that ANKRD5-/- males exhibited reduced sperm motility and infertility. Using FLAG-tagged ANKRD5 mice, mass spectrometry, and immunoprecipitation (IP) analyses, they confirmed that ANKRD5 is localized within the N-DRC, a critical protein complex for normal flagellar motility. However, transmission electron microscopy (TEM) and cryo-electron tomography (cryo-ET) of sperm from Ankrd5 null mice did not reveal significant structural abnormalities.

      Strengths:

      The phenotypes observed in ANKRD5-/- mice, including reduced sperm motility and male infertility, are conversing. The authors demonstrated that ANKRD5 is an N-DRC protein that interacts with TCTE1 and DRC4. Most of the experiments are well designed and executed.

      Weaknesses:

      The last section of cryo-ET analysis is not convincing. "ANKRD5 depletion may impair buffering effect between adjacent DMTs in the axoneme".

      "In WT sperm, DMTs typically appeared circular, whereas ANKRD5-KO DMTs seemed to be extruded as polygonal. (Fig. S9B,D). ANKRD5-KO DMTs seemed partially open at the junction between the A- and B-tubes (Fig. S9B,D)." In the TEM images of 4E, ANKRD5-KO DMTs look the same as WT. The distortion could result from suboptimal sample preparation, imaging or data processing. Thus, the subsequent analyses and conclusions are not reliable.

      This paper still requires significant improvements in writing and language refinement. Here is an example: "While N-DRC is critical for sperm motility, but the existence of additional regulators that coordinate its function remains unclear" - ill-formed sentences.

    3. Reviewer #2 (Public review):

      Summary:

      The manuscript investigates the role of ANKRD5 (ANKEF1) as a component of the N-DRC complex in sperm motility and male fertility. Using Ankrd5 knockout mice, the study demonstrates that ANKRD5 is essential for sperm motility and identifies its interaction with N-DRC components through IP-mass spectrometry and cryo-ET. The results provide insights into ANKRD5's function, highlighting its potential involvement in axoneme stability and sperm energy metabolism.

      Strengths:

      The authors employ a wide range of techniques, including gene knockout models, proteomics, cryo-ET, and immunoprecipitation, to explore ANKRD5's role in sperm biology.

      Weaknesses:

      Limited Citations in Introduction: Key references on the role of N-DRC components (e.g.,DRC2, DRC4) in male infertility are missing, which weakens the contextual background.

    4. Author response:

      The following is the authors’ response to the original reviews.

      Reviewer #1 (Public review):

      Summary:

      Asthenospermia, characterized by reduced sperm motility, is one of the major causes of male infertility. The "9 + 2" arranged MTs and over 200 associated proteins constitute the axoneme, the molecular machine for flagellar and ciliary motility. Understanding the physiological functions of axonemal proteins, particularly their links to male infertility, could help uncover the genetic causes of asthenospermia and improve its clinical diagnosis and management. In this study, the authors generated Ankrd5 null mice and found that ANKRD5-/- males exhibited reduced sperm motility and infertility. Using FLAG-tagged ANKRD5 mice, mass spectrometry, and immunoprecipitation (IP) analyses, they confirmed that ANKRD5 is localized within the N-DRC, a critical protein complex for normal flagellar motility. However, transmission electron microscopy (TEM) and cryo-electron tomography (cryo-ET) of sperm from Ankrd5 null mice did not reveal any structural abnormalities.

      Strengths:

      The phenotypes observed in ANKRD5-/- mice, including reduced sperm motility and male infertility, are conversing. The authors demonstrated that ANKRD5 is an N-DRC protein that interacts with TCTE1 and DRC4. Most of the experiments are thoughtfully designed and well executed.

      Weaknesses:

      The cryo-FIB and cryo-ET analyses require further investigation, as detailed below. The molecular mechanism by which the loss of ANKRD5 affects sperm flagellar motility remains unclear. The current conclusion that Ankrd5 knockout reduces axoneme stability is not well-supported. Specifically, are other axonemal proteins diminished in Ankrd5 knockout sperm? Conducting immunofluorescence analyses and revisiting the quantitative proteomics data may help address these questions.

      Reviewer #2 (Public review):

      Summary:

      The manuscript investigates the role of ANKRD5 (ANKEF1) as a component of the N-DRC complex in sperm motility and male fertility. Using Ankrd5 knockout mice, the study demonstrates that ANKRD5 is essential for sperm motility and identifies its interaction with N-DRC components through IP-mass spectrometry and cryo-ET. The results provide insights into ANKRD5's function, highlighting its potential involvement in axoneme stability and sperm energy metabolism.

      Strengths:

      The authors employ a wide range of techniques, including gene knockout models, proteomics, cryo-ET, and immunoprecipitation, to explore ANKRD5's role in sperm biology.

      Weaknesses:

      (1) Limited Citations in Introduction: Key references on the role of N-DRC components (e.g., DRC1, DRC2, DRC3, DRC5) in male infertility are missing, which weakens the contextual background.

      (2) Lack of Functional Insights: While interacting proteins outside the N-DRC complex were identified, their potential roles and interactions with ANKRD5 are not adequately explored or discussed.

      (3) Mitochondrial Function Uncertainty: Immunofluorescence suggests possible mitochondrial localization for ANKRD5, but experiments on its role in energy metabolism (e.g., ATP production, ROS) are insufficient, especially given the observed sperm motility defects.

      (4) Glycolysis Pathway Impact: Proteomic analysis indicates glycolysis pathway disruptions in Ankrd5-deficient sperm, but the link between these changes and impaired motility is not well explained.

      (5) Cryo-ET Data Limitations: The structural analysis of the DMT lacks clarity on how ANKRD5 influences N-DRC or RS3. The low quality of RS3 data hinders the interpretation of ANKRD5's impact on axoneme structure.

      (6) Discussion of Findings: The manuscript could benefit from a deeper discussion on the broader implications of ANKRD5's interactions and its role in sperm energy metabolism and motility mechanisms.

      Reviewer #1 (Recommendations for the authors):

      EMD-35210/35211 are 16-nm maps while the Ankrd5 null map is 8-nm repeat. To generate a difference map, the authors should use maps of the same periodicity.

      Thank you for your suggestion. We have replaced the old 16-nm maps with an 8nm map and updated the images (Fig. 7). The 8nm repeats DMT density map we used was obtained by summing two 16nm repeats DMTs that were staggered 8nm apart from each other (EMD-35229). The replacement of the 16nm repeats DMT density map with the 8nm repeats DMT density map has no effect on our scientific findings and experimental conclusions.

      "We were able to detect the N-DRC structure in WT sperm, but we failed to find the density of N-DRC adjacent to RS3 in Ankrd5 null sperm". Do the authors imply that the N-DRC is lost in Ankrd5 null sperm? To draw a conclusion, they need to compare the 96-nm map of WT sperm axoneme with that of Ankrd5 null sperm axoneme. Quantitative proteomics shows that the levels of most N-DRC components in Ankrd5 null sperm are comparable with those of WT sperm. Why are the quantitative proteomics results not consistent with the structural observation?

      We are very sorry for this improper description. Our original description was not rigorous, which led to misunderstanding. Our original intention is to say that the quality of the density map causes the N-DRC to be difficult to recognize, rather than that the N-DRC has disappeared. In addition, attempts to classify 96nm repeats DMT structure during our data processing failed. In the process of classification, we found that the density of RS was not good. So we changed the picture and the description.

      We have changed the description in the text: "During the STA process, many particles were misaligned or deformed in the classification results, revealing various degrees of deformation—particularly affecting the B-tube (Figure 9,Fig. S9E). We could retain only ~10% of the DMT particles to obtain the final density map for ANKRD5-KO sperm (Fig. S9E), whereas ~70% were usable in WT dataset as reported previously [59]. The mutant DMT density map also displayed roughness at its periphery, indicating substantial structural heterogeneity (Fig. S9E). Even after discarding a large fraction of deformed particles, the final density map still showed evident artifacts, implying that although the mutant DMT preserves the fundamental features of both tubes, its shape is highly heterogeneous (Fig. S9E). Furthermore, attempts to classify the 96-nm repeats did not yield a clear density for radial spokes (RSs) (Fig. S9F), indicating that ANKRD5 deficiency may affect the stability of other accessory structures, such as RSs [24-26]. In the raw tomograms, RSs in ANKRD5-KO sperm appeared less regularly arranged than those in WT(Fig. S9A and C)."

      Figure S9. The states of DMT particles in sperm of Ankrd5-KO mouse. (A) and (C) Tomogram slices of WT and Ankrd5-KO in Dynamo (The data for WT mouse sperm was EMPIARC-200007). DMT and RS are marked with white dashed lines and white arrows, respectively. (B) and (D) Comparison of DMT particle states between WT and Ankrd5-KO in Dynamo. The visual angles of the DMT particles shown in (B) and (D) show that the DMT fibers within the white box in (A) and (B) are divided equally into 10 slices along the direction of the white arrow, respectively. The DMT particle shapes of WT and Ankrd5-KO are marked by white dashed lines on the right of (B) and (D). The white arrow in (D) identifies the junction of A-tube and B-tube that is suspected to be disconnected. (E) Deformed particles discarded in 3D classification and final aligned DMT artifacts. (F) 3D classification of attempted RS locations.

      In the process of obtaining DMT with a period of 8nm, we discarded about 90% of the particles (some were mis-aligned particles and some were deformed particles). Although the final DMT density showed complete A-tube and B-tube, both the particles in our calculation process and the projection of the final structure showed strong particle heterogeneity.

      Our results show that in ANKRD5-KO mice, the structure of sperm DMT itself has no apparent effect in tube A and tube B, and we found that DMT in the original tomography were not smooth. We speculate that loss of ANKRD5 may reduce the interaction between N-DRC and neighboring DMTs, resulting in nonuniform force on the axoneme during sperm swimming, which may limit our ability to obtain an average structure of the more dynamic components (RS, N-DRC, ODA, IDA). Therefore, when trying to classify 96nm repeat DMTS, we can only see the density of suspected RS3 and RS2, but it is difficult to obtain the confident 96nm repeat DMT density. It is difficult to further discuss the effects of ANKRD5 on RS3 and N-DRC. To test this conjecture, we further classified the density of suspected RS3, and the results obtained exhibited a variety of mixed states (Fig. S9). To avoid confusion, we have already removed the discussion of RS3 and the related images from the original text.

      It's not clear whether N-DRC proteins and ODA, IDA, RS proteins are affected in DMT of Ankrd5 null sperm. Immunofluorescence staining would help to resolve this problem.

      Thank you for your suggestion. The levels of N-DRC proteins and ODA, IDA, RS were detected by immunofluorescence, and no difference was found between ANKRD5-null sperm and control. We added figure S6 as a new figure and added the following description in red font on page 7 of the article:

      Figure S6. Immunofluorescence results of ANKRD5-null sperm and control. DRC11 serves as a marker protein for N-DRC (nexin-dynein regulatory complex), NME5 as a marker for RS (radial spoke), DNALI1 as a marker for IDA (inner dynein arm), and DNAI1 as a marker for ODA (outer dynein arm).

      In addition, ODA and RS were also marked in the figure when we further analyzed the Cryo-ET data (Figure 7 and Figure S9).

      Does Ankrd5 express in other cilia cells except for sperm?

      We stained mouse respiratory cilia using immunofluorescence and found that the protein was also expressed in mouse respiratory cilia. To support this finding, we added Figure S3 as a new figure and included a description in red font on page 6 of the article.

      Page 7, "However, in the process of manual selection of DMT fibers, we found that they were not as smooth as WT particles." This description is too subjective. Please show the data.

      Thank you for your suggestion. We have added a supplementary figure showing the difference between mutant samples and WT samples during particle picking (Fig. S9).

      Abstract, "These findings establish that ANKRD5 is critical for maintaining axoneme stability, "Page 7, "This suggests that the knockout of Ankrd5 may affect the structural stability of the axoneme," I do not see direct evidence that Ankrd5 KO reduces the axoneme stability.

      Our phrasing was not sufficiently precise. These findings suggest that ANKRD5 plays a crucial role in limiting the relative sliding between adjacent microtubule doublets during axoneme bending, rather than directly contributing to the stability of the axoneme. This sentence has already been modified in the abstract and marked in red. We have added the description in the text: "These findings suggest that ANKRD5 may weaken the N-DRC’s "car bumper" role, reducing the buffering effect between adjacent DMTs and thereby destabilizing axoneme structures during intense axoneme motility." and "To further investigate the RS, IDA, and ODA structures of the axonemes, we conducted immunofluorescence assays in both Ankrd5<sup>-/-</sup> mice and the control group. No significant differences were detected between the two groups (Fig. S6)."

      Page 8, "but our study offers new perspectives for male contraceptive research". Could the authors expand this a bit - how this study may offer new perspectives for male contraceptive research?

      We sincerely appreciate the reviewer's insightful feedback regarding the translational potential of our findings. This is indeed a critical aspect that we sought to highlight. In response, we have added a paragraph on page 9 (marked in red) to further emphasize this point. We have added the description in the text: "The potential for male contraceptive development arises from ANKRD5's critical structural role mediated through its ANK domain, which facilitates interaction with the N-DRC complex in sperm flagella. Recent structural evidence suggests the protein's positively charged surface may engage with glutamylated tubulin in adjacent microtubules[41], presenting a druggable interface. Targeted disruption of this interaction through small-molecule inhibitors could transiently impair sperm motility. Sperm function relies more on ANKRD5 than respiratory cilia, so inhibiting ANKRD5 has less impact on the latter. This makes ANKRD5 a promising drug target. This tissue-specific phenotypic uncoupling is not uncommon among axonemal-associated proteins, such as DNAH17 and IQUB[65,66]."

      Abstract, "reveals its interaction with TCTE1 and DRC4/GAS8", please provide the alias symbol DRC5 for TCTE1 for clarity.

      Thank you for your suggestion, I have revised the abstract by replacing "TCTE1" with "DRC5/TCTE1" to clarify the alias. The changes have been highlighted in red in the manuscript for easy reference.

      Introduction, "Fertilization relies on successful spermatogenesis and normal sperm motility (4), which occurs in the testes." Does spermatogenesis or normal sperm motility occur in the testes?

      Thank you for pointing out the ambiguity in the sentence. We have revised the sentence in the Introduction and highlighted it in red as follows: Fertilization relies on successful spermatogenesis and normal sperm motility..

      Introduction, "The axoneme exhibits a 9+2 microtubule doublet structure". The description is not accurate. The "2" are singlet microtubules.

      Thank you for your suggestion. We have revised the sentence to accurately describe the axoneme structure and highlight in red as follows: The axoneme features a 9+2 architecture, comprising nine doublet microtubules encircling a central pair of singlet microtubules, with the N-DRC forming cross-bridges between adjacent doublets.

      Page 4, "control sperm successfully fertilized both cumulus-intact eggs". "control" should be a capital "C".

      We thank the reviewer for noting this oversight. The correction has been implemented on page 5 with the term highlighted in red (now reading: "Control sperm successfully fertilized both cumulus-intact eggs"), and we have verified capitalization consistency throughout the manuscript.

      Page 6, "applied RELION, M, and other software". "other software" is not an appropriate description, please be precise.

      We have revised the description as suggested. Specifically, on page 7, the phrase "and other software" has been replaced with "Dynamo and Warp/M," and this change is highlighted in red for clarity.

      Reviewer #2 (Recommendations for the authors):

      Several components of the N-DRC complex (e.g., DRC1, DRC2, DRC3, DRC5) have been reported to be associated with male infertility in both humans and mice. However, the introduction lacks proper citations for these studies. Adding these references would provide a more comprehensive background for readers.

      Thank you for your suggestion to strengthen the comprehensiveness of the research background by incorporating additional literatures. More literatures related to DRC1, DRC2, DRC3, and DRC5 were cited in the background of this paper. We have rewritten and reorganized the language of the last paragraph of the introduction, and the entire paragraph is highlighted in red. The content of the paragraph is as follows:

      "It was previously believed that N-DRC comprised 11 protein components[13,18]. However, a new component CCDC153 (DRC12) was found to interact with DRC1[19]. In situ cryoelectron tomography (cryo-ET) has significantly advanced understanding of the N-DRC architecture in Chlamydomonas, demonstrating that DRC1, DRC2/CCDC65, and DRC4/GAS8 constitute its core framework[16], while proteins DRC3/5/6/7/8/11 associate with this framework and engage with other axonemal complexes[20]. Biochemical experiments corroborate these findings and validate this structural model[12,21,22]. The N-DRC functions between the DMTs to convert sliding into axonemal bending motion by restricting the relative sliding of outer microtubule doublets[23,24,25]. Mutations of N-DRC subunits demonstrate that the structural integrity of the N-DRC is crucial for flagellar movements. Mutations in DRC1, DRC2/CCDC65, and DRC4/GAS8 are linked to ciliary motility disorders, causing primary ciliary dyskinesia (PCD)[12,26]. Biallelic truncating mutations in DRC1 induce multiple morphological abnormalities of sperm flagella (MMAF), including outer DMT disassembly, mitochondrial sheath disorganization, and incomplete axonemal structures in human sperm[22,27,28]. Similarly, CCDC65 loss disrupts N-DRC stability, leading to disorganized axonemes, global microtubule dissociation, and complete asthenozoospermia[12,29].  Homozygous frameshift mutations in DRC3 impair N-DRC assembly and intraflagellar transport (IFT), resulting in severe motility defects despite normal sperm morphology[30,31]. TCTE1 knockout mice maintain normal sperm axoneme structure but show impaired glycolysis, leading to reduced ATP levels, lower sperm motility, and male infertility[32]. Both Drc7 and Iqcg (Drc9) knockout mice exhibit disrupted '9+2' axonemal architecture, sperm immotility, and male infertility[21,33]. Drc7 knockout sperm also display head deformities and shortened tails[21]. While N-DRC is critical for sperm motility, but the existence of additional regulators that coordinate its function remains unclear. Our findings indicate that ANKRD5 (Ankyrin repeat domain 5; also known as ANK5 or ANKEF1) interacts with N-DRC structure, serving as an auxiliary element to facilitate collaboration among DRC members. The absence of ANKRD5 results in diminished sperm motility and consequent male infertility."

      While many N-DRC components were identified as interacting with ANKRD5, other proteins outside the N-DRC complex were also detected. Notably, GAS8 (DRC4) ranked 165th among the identified proteins. What are the functions of the higher-ranking proteins, and why do they interact with ANKRD5? Discussing their potential roles would enhance the mechanistic understanding of ANKRD5's function.

      We thank the reviewer for highlighting the importance of non-N-DRC proteins interacting with ANKRD5 (ANKEF1). Below, we provide a detailed analysis of the roles and interaction mechanisms of the top-ranked non-N-DRC proteins (Krt77, Rab2a, Gm7429) to elucidate their functional relevance to ANKRD5. We have added the following text to page 6 to clarify and highlight this in red:

      As for other proteins in the LC-MS results, KRT77 is a classic protein that maintains cytoskeletal stability. It may enhance the physical connection between the N-DRC and adjacent DMTs through interaction with ANKRD5. Recent studies indicate that ANKRD5, a newly identified component in the distal lobe of the N-DRC, has a positively charged surface, which may facilitate binding to glutamylated tubulin on adjacent DMTs[41]. Thus, KRT77 may also regulate its interaction with ANKRD5 via post-translational modifications (PTMs, e.g., phosphorylation), thereby strengthening sperm resistance to shear forces during flagellar movement. Rab family proteins participate in intraflagellar transport and membrane dynamics. RAB2A may promote targeted transport of ANKRD5 or other N-DRC components to axonemal assembly sites by recruiting vesicles, and its GTPase activity might link cellular signals to ANKRD5-mediated axoneme remodeling. However, the observed signals could be false positives due to nonspecific factors such as electrostatic adsorption, high-abundance protein interference, detergent-induced membrane disruption, or protein aggregation tendencies.

      The immunofluorescence localization of ANKRD5-Flag appears more aligned with the mitochondrial sheath rather than the axoneme. There is a finer red fluorescent signal extending from the mitochondrial sheath that might correspond to the axoneme. Could this suggest that ANKRD5 has a functional role in the mitochondria? While the authors measured ROS levels, this might not fully clarify whether ANKRD5 is involved in sperm energy metabolism. Considering the motility defects in Ankrd5 knockout mice, further experiments to explore ANKRD5's potential involvement in energy metabolism are necessary.

      The increased detection of ANKRD5 in the midpiece region of the sperm axoneme does not necessarily indicate its localization in mitochondria. Immunofluorescence signals of multiple axonemal Nexin-Dynein Regulatory Complex (N-DRC) components (e.g., TCTE1, DRC1, CCDC65, DRC3, GAS8, and DRC7) are also non-uniformly distributed along the entire flagellum[1]. Similar localization patterns are observed in other structural components, such as radial spoke protein NME5[2] and outer dynein arm protein DNAH5[3]. Furthermore, mitochondria are membrane-bound organelles, and ANKRD5 predominantly resides in the SDS-soluble fraction under varying lysis conditions, confirming its association with the axoneme rather than mitochondria. Thus, the spatial distribution of ANKRD5 does not support a functional role in mitochondria. Importantly, we validated intact mitochondrial function through measurements of reactive oxygen species (ROS) levels (Figure S5C, D), ATP content (Figure 6E), and mitochondrial membrane potential (Figure S5A, B).

      Proteomic analysis of Ankrd5-deficient sperm revealed disruptions in the glycolysis pathway. While these changes do not appear to affect ATP production, the mechanism by which these disruptions impact sperm motility remains unclear. Further investigation into how glycolysis pathway alterations contribute to impaired motility is warranted.

      We appreciate the reviewer's careful consideration of our proteomic data. However, our Gene Set Enrichment Analysis (GSEA) of glycolysis/gluconeogenesis pathways showed no significant enrichment (p-value=0.089, NES=0.708; Fig.6D), which does not meet the statistical thresholds for biological significance (|NES|>1, pvalue<0.05). This observation is further corroborated by our direct ATP measurements showing no difference between genotypes (Fig.6E). We agree that further studies on metabolic regulation could be valuable, but current evidence does not support glycolysis disruption as a primary mechanism for the motility defects observed in Ankrd5-null sperm. This misinterpretation likely arose from the reviewer's overinterpretation of non-significant proteomic trends. We request that this specific claim be excluded from the assessment to avoid misleading readers.

      Weaknesses:

      Cryo-ET Data Limitations: The structural analysis of the DMT lacks clarity on how ANKRD5 influences NDRC or RS3. The low quality of RS3 data hinders the interpretation of ANKRD5's impact on axoneme structure.

      We tried to further calculate the DMT at 96nm period using the present data to analyze the effect of ANKRD5 deletion on RS and N-DRC, however, due to the heterogeneity of the data, we were only able to obtain DMT at 8nm period (we have added a figure in the supplementary material for presentation). And in the process of obtaining DMT with a period of 8nm, we throw away about 90% of the particles (some are misaligned particles, some are deformed particles). Although we were not able to obtain the structure of 96nm repeats DMT, we noticed the enhanced heterogeneity of DMT caused by ANKRD5 knockout, as shown by the 3D classification and other results of the new supplementary images (Fig. S9), and the graphic description was added in the original article.

      We have changed the description in the text: "During particle picking of DMT fibers, we observed that transverse sections of axonemal DMT particles from ANKRD5-KO sperm differ markedly from those in WT sperm. Although both A- and B-tubes were visible in both samples, the DMTs in ANKRD5-KO sperm showed a more irregular profile. In WT sperm, DMTs typically appeared circular, whereas ANKRD5-KO DMTs seemed to be extruded as polygonal. (Fig. S9B,D). Notably, ANKRD5-KO DMTs seemed partially open at the junction between the A- and B-tubes (Fig. S9B,D).

      During the STA process, many particles were misaligned or deformed in the classification results, revealing various degrees of deformation—particularly affecting the B-tube (Fig. S9E). We could retain only ~10% of the DMT particles to obtain the final density map for ANKRD5-KO sperm (Fig. S9E), whereas ~70% were usable in WT dataset as reported previously [59]. The mutant DMT density map also displayed roughness at its periphery, indicating substantial structural heterogeneity (Fig. S9E). Even after discarding a large fraction of deformed particles, the final density map still showed evident artifacts, implying that although the mutant DMT preserves the fundamental features of both tubes, its shape is highly heterogeneous (Fig. S9E). Furthermore, attempts to classify the 96-nm repeats did not yield a clear density for radial spokes (RSs) (Fig. S9F), indicating that ANKRD5 deficiency may affect the stability of other accessory structures, such as RSs [23,24,25]. In the raw tomograms, RSs in ANKRD5-KO sperm appeared less regularly arranged than those in WT (Fig. S9A and C).

      Most recently, following the submission of this work, ANKRD5 was reported to localize at the head of the N-DRC, simultaneously binding DRC11, DRC7, DRC4, and DRC5 [46]. This structural insight agrees with our in vitro findings that ANKRD5 interacts with DRC4 and DRC5 (Fig. 8C-F). However, that study used isolated and purified DMT samples, leaving the precise positioning of ANKRD5 between adjacent axonemal DMTs unconfirmed. We therefore fitted the published structure (PDB entry: 9FQR) into the in situ DMT structure of mouse sperm 96-nm repeats (EMD-27444), revealing that ANKRD5 lies a mere ~3 nm from the adjacent DMT (Fig. 8G). Notably, the N-DRC is often likened to a "car bumper", buffering two neighboring DMTs during vigorous axonemal motion. Given the extensive DMT deformation observed in our cryo-ET data (Fig. S9E), we propose that ANKRD5 contributes to this buffering function at the N-DRC. The loss of ANKRD5 may weaken the "bumper" effect and consequently increase structural damage to adjacent DMTs under intense conditions, while also compromising the stability of associated DMT accessory structures [19,46,60]."

      Figure S9. The states of DMT particles in sperm of Ankrd5-KO mouse. (A) and (C) Tomogram slices of WT and Ankrd5-KO in Dynamo (The data for WT mouse sperm was EMPIARC-200007). DMT and RS are marked with white dashed lines and white arrows, respectively. (B) and (D) Comparison of DMT particle states between WT and Ankrd5-KO in Dynamo. The visual angles of the DMT particles shown in (B) and (D) show that the DMT fibers within the white box in (A) and (B) are divided equally into 10 slices along the direction of the white arrow, respectively. The DMT particle shapes of WT and Ankrd5-KO are marked by white dashed lines on the right of (B) and (D). The white arrow in (D) identifies the junction of A-tube and B-tube that is suspected to be disconnected. (E) Deformed particles discarded in 3D classification and final aligned DMT artifacts. (F) 3D classification of attempted RS locations.

      Although the loss of ANKRD5 did not affect the density of DMT itself in A Tube and B Tube, we found that DMT particles were not smooth in the original tomogram. We speculate that the loss of ANKRD5, a component of the N-DRC that is close to the neighboring DMT, may reduce the interaction between N-DRC and the neighboring DMT, resulting in uneven force on the axoneme during sperm swimming, which may limit our ability to obtain the average structure of the more dynamic components (RS, N-DRC, ODA, IDA). Therefore, when trying to classify 96nm repeat DMT, we could only see the density of suspected RS3 and RS2, but it was difficult to obtain the complete 96nm repeat DMT density, so that we could not further analyze the effect of ANKRD5 deletion on RS and N-DRC. To test this conjecture, we further classified the density of suspected RS3, and the results obtained exhibited a variety of mixed states (which have been added to the supplementary material). To avoid confusion, we have already removed the discussion of RS3 and the related images from the original text.

      The cryo-ET data on the internal structure of the DMT seems to have limited relevance to the N-DRC complex. Additionally, the quality of the RS3 data appears suboptimal, making it difficult to understand how the absence of ANKRD5 influences RS3. Further refinement of the data or alternative approaches may be needed to address this question.

      Thank you very much for your suggestions. For the 96 nm periodic DMT, we have conducted multiple rounds of classification, including applying different masks at the positions of ODA, RS, and DMT. We have also tried classifying with both a single reference and multiple references. However, we were unable to obtain a suitable 96 nm periodic DMT. Regarding the heterogeneity of the particles, we have added a discussion in the manuscript. Following your advice, we have reanalyzed the data, but unfortunately, we still could not further optimize the experimental results.

      In the process of obtaining the 8 nm periodic DMT, we discarded approximately 90 percent of the particles through multiple rounds of classification and alignment, in order to obtain high-quality 8 nm periodic DMT. We classified the remaining particles and found that the densities of RS3 and RS2 were not in their normal states. RS3 might be a mixture of different states of RS3, which makes it difficult for us to further discuss the effects of ANKRD5 on RS3.

      To avoid confusion, we have already removed the discussion of RS3 and the related images from the original text.

      Regarding the effects of ANKRD5 deficiency, we speculate that as the head of the N-DRC, its absence might affect the interaction between the N-DRC and the adjacent DMT, thereby influencing the forces experienced by the DMT during sperm movement. The uneven and irregular forces on the nine pairs of DMTs do not affect the structure of the A and B tubes of the DMT itself, but result in some heterogeneity in the peripheral microtubule parts of the DMT particles. We have added a discussion on these hypotheses in the manuscript. In addition, our 3D classification results demonstrate the structural heterogeneity of DMT caused by ANKRD5 knockdown. We have changed the description in the text:"During particle picking of DMT fibers, we observed that transverse sections of axonemal DMT particles from ANKRD5-KO sperm differ markedly from those in WT sperm. Although both A- and B-tubes were visible in both samples, the DMTs in ANKRD5-KO sperm showed a more irregular profile. In WT sperm, DMTs typically appeared circular, whereas ANKRD5-KO DMTs seemed to be extruded as polygonal. (Fig. S9B,D). Notably, ANKRD5-KO DMTs seemed partially open at the junction between the A- and B-tubes (Fig. S9B,D).

      During the STA process, many particles were misaligned or deformed in the classification results, revealing various degrees of deformation—particularly affecting the B-tube (Figure 9, Fig. S9E). We could retain only ~10% of the DMT particles to obtain the final density map for ANKRD5-KO sperm (Fig. S9E), whereas ~70% were usable in WT dataset as reported previously [59]. The mutant DMT density map also displayed roughness at its periphery, indicating substantial structural heterogeneity (Fig. S9E). Even after discarding a large fraction of deformed particles, the final density map still showed evident artifacts, implying that although the mutant DMT preserves the fundamental features of both tubes, its shape is highly heterogeneous (Fig. S9E). Furthermore, attempts to classify the 96-nm repeats did not yield a clear density for radial spokes (RSs) (Fig. S9F), indicating that ANKRD5 deficiency may affect the stability of other accessory structures, such as RSs [23,24,25]. In the raw tomograms, RSs in ANKRD5-KO sperm appeared less regularly arranged than those in WT (Fig. S9A and C).

      Most recently, following the submission of this work, ANKRD5 was reported to localize at the head of the N-DRC, simultaneously binding DRC11, DRC7, DRC4, and DRC5 [46]. This structural insight agrees with our in vitro findings that ANKRD5 interacts with DRC4 and DRC5 (Fig. 8C-F). However, that study used isolated and purified DMT samples, leaving the precise positioning of ANKRD5 between adjacent axonemal DMTs unconfirmed. We therefore fitted the published structure (PDB entry: 9FQR) into the in situ DMT structure of mouse sperm 96-nm repeats (EMD-27444), revealing that ANKRD5 lies a mere ~3 nm from the adjacent DMT (Fig. 8G). Notably, the N-DRC is often likened to a "car bumper", buffering two neighboring DMTs during vigorous axonemal motion. Given the extensive DMT deformation observed in our cryo-ET data (Fig. S9E), we propose that ANKRD5 contributes to this buffering function at the N-DRC. The loss of ANKRD5 may weaken the "bumper" effect and consequently increase structural damage to adjacent DMTs under intense conditions, while also compromising the stability of associated DMT accessory structures [19,46,60]."

      To further enhance the readability of our manuscript, we created a Graphic Abstract to visually illustrate the biological functions of ANKRD5. The figure is placed immediately after the Abstract section and has been designated as Figure 9.

    1. eLife Assessment

      The formation of the Z-ring at the time of bacterial cell division interests researchers working towards understanding cell division across all domains of life. The manuscript by Jasnin et al reports the cryoET structure of toroid assembly formation of FtsZ filaments driven by ZapD as the cross linker. The findings are important and have the potential to open a new dimension in the field, and the evidence to support these exciting claims is solid.

    2. Reviewer #1 (Public review):

      Summary:

      The major result in the manuscript is the observation of the higher order structures in a cryoET reconstruction that could be used for understanding the assembly of toroid structures. The cross-linking ability of ZapD dimers result in bending of FtsZ filaments to a constant curvature. Many such short filaments are stitched together to form a toroid like structure. The geometry of assembly of filaments - whether they form straight bundles or toroid like structures - depends on the relative concentrations of FtsZ and ZapD.

      Strengths:

      In addition to a clear picture of the FtsZ assembly into ring-like structures, the authors have carried out basic biochemistry and biophysical techniques to assay the GTPase activity, the kinetics of assembly, and the ZapD to FtsZ ratio.

      Weaknesses:

      Future scope of work includes the molecular basis of curvature generation and how molecular features of FtsZ and ZapD affect the membrane binding of the higher order assembly.

    3. Reviewer #3 (Public review):

      Summary:

      Previous studies have analyzed the binding of ZapD to FtsZ and provided images of negatively stained toroids and straight bundles, where FtsZ filaments are presumably crosslinked by ZapD dimers. Toroids without ZapD have also been previously formed by treating FtsZ with crowding agents. The present study is the first to apply cryoEM tomography, which can resolve the structure of the toroids in 3D. This shows a complex mixture of filaments and sheets irregularly stacked in the Z direction and spaced radially. The most important interpretation would be to distinguish FtsZ filaments from ZapD crosslinks, This is less convincing. The authors seem aware of the ambiguity: "However, we were unable to obtain detailed structural information about the ZapD connectors due to the heterogeneity and density of the toroidal structures, which showed significant variability in the conformations of the connections between the filaments in all directions." Therefore, the reader may assume that the crosslinks identified and colored red are only suggestions, and look for their own structural interpretations.

      Strengths:

      This is the first cryoEM tomography to image toroids and straight bundles of FtsZ filaments bound to ZapD. A strength is the resolution, which. at least for the straight bundles. is sufficient to resolve the ~4.5 nm spacing of ZapD dimers attached to and projecting subunits of an FtsZ filament. Another strength is the pelleting assay to determine the stoichiometry of ZapD:FtsZ (although this also leads to weaknesses of interpretation).

    4. Author response:

      The following is the authors’ response to the previous reviews

      Reviewer #1 (Public review):

      Summary:

      The major result in the manuscript is the observation of the higher order structures in a cryoET reconstruction that could be used for understanding the assembly of toroid structures. The cross-linking ability of ZapD dimers result in bending of FtsZ filaments to a constant curvature. Many such short filaments are stitched together to form a toroid like structure. The geometry of assembly of filaments - whether they form straight bundles or toroid like structures - depends on the relative concentrations of FtsZ and ZapD.

      Strengths:

      In addition to a clear picture of the FtsZ assembly into ring-like structures, the authors have carried out basic biochemistry and biophysical techniques to assay the GTPase activity, the kinetics of assembly, and the ZapD to FtsZ ratio.

      Weaknesses:

      The discussion does not provide an overall perspective that correlates the cryoET structural organisation of filaments with the biophysical data. The current version has improved in terms of addressing this weakness and clearly states the lacuna in the model proposed based on the technical limitations.

      Future scope of work includes the molecular basis of curvature generation and how molecular features of FtsZ and ZapD affect the membrane binding of the higher order assembly.

      Reviewer #3 (Public review):

      Summary:

      Previous studies have analyzed the binding of ZapD to FtsZ and provided images of negatively stained toroids and straight bundles, where FtsZ filaments are presumably crosslinked by ZapD dimers. Toroids without ZapD have also been previously formed by treating FtsZ with crowding agents. The present study is the first to apply cryoEM tomography, which can resolve the structure of the toroids in 3D. This shows a complex mixture of filaments and sheets irregularly stacked in the Z direction and spaced radially. The most important interpretation would be to distinguish FtsZ filaments from ZapD crosslinks, This is less convincing. The authors seem aware of the ambiguity: "However, we were unable to obtain detailed structural information about the ZapD connectors due to the heterogeneity and density of the toroidal structures, which showed significant variability in the conformations of the connections between the filaments in all directions." Therefore, the reader may assume that the crosslinks identified and colored red are only suggestions, and look for their own structural interpretations. But readers should also note some inconsistencies in stoichiometry and crosslinking arrangements that are detailed under "weaknesses."

      Strengths.

      This is the first cryoEM tomography to image toroids and straight bundles of FtsZ filaments bound to ZapD. A strength is the resolution, which. at least for the straight bundles. is sufficient to resolve the ~4.5 nm spacing of ZapD dimers attached to and projecting subunits of an FtsZ filament. Another strength is the pelleting assay to determine the stoichiometry of ZapD:FtsZ (although this also leads to weaknesses of interpretation).

      Weaknesses

      The stoichiometry presents some problems. Fig. S5 uses pelleting to convincingly establish the stoichiometry of ZapD:FtsZ. Although ZapD is a dimer, the concentration of ZapD is always expressed as that of its subunit monomers. Fig. S5 shows the stoichiometry of ZapD:FtsZ to be 1:1 or 2:1 at equimolar or high concentrations of ZapD. Thus at equimolar ZapD, each ZapD dimer should bridge two FtsZ's, likely forming crosslinks between filaments. At high ZapD, each FtsZ should have it's own ZapD dimer. However, this seems contradicted by later statements in Discussion and Results. (1) "At lower concentrations of ZapD, .. toroids are the most prominent structures, containing one ZapD dimer for every four to six FtsZ molecules." Shouldn't it be one ZapD dimer for every two FtsZ? (2) "at the high ZapD concentration...a ZapD dimer binds two FtsZ molecules connecting two filaments." Doesn't Fig. S5 show that each FtsZ subunit has its own ZapD dimer? And wouldn't this saturate the CTD sites with dimers and thus minimize crosslinking?

      We thank the reviewer for these insightful comments. The affinity of ZapD for FtsZ is relatively low and a higher concentration of ZapD is required in solution to effectively saturate the binding sites of all FtsZ molecules forming macrostructures. It is important to clarify that the concentrations mentioned in the text refer to the amounts and ratios of protein added to the total volume of the sample, rather than the proteins actively interacting and forming bundles or macrostructures.

      To differentiate, two aspects can be considered: the ratio of added protein (as mentioned in the text) and the fraction of proteins that contribute to the formation of the macrostructures. Under polymerization conditions, FtsZ-GTP recruits additional monomers to form polymers. Therefore, more FtsZ than ZapD would be involved in forming filaments and bundles. Our results support this hypothesis and show that a higher amount of ZapD is required in the sample to pellet with FtsZ bundles.

      We propose that starting with the same initial concentration of FtsZ and ZapD in solution, only a small fraction of ZapD will bind to the structures, favoring the formation of toroidal structures despite the initial 1:1 ratio of proteins added to the sample. When considering a higher FtsZ:ZapD ratio (1:6), the increased amount of ZapD in solution would facilitate the saturation of all FtsZ binding sites, consistent with the observation of straight bundles. Analytical sedimentation velocity data further supported this finding, indicating a binding ratio of approximately 0.3-0.4, suggesting that one ZapD dimer binds for every 4-6 FtsZ monomers. The binding ratio indicates that two FtsZ monomers will bind to a single dimer of ZapD, but this only occurs when there is a significant excess of ZapD over FtsZ in the solution mixture. 

      These findings align qualitatively with the relative intensities of the electrophoretic bands observed for FtsZ and ZapD in the pelleting assay with different FtsZ-ZapD mixtures, as shown in Suppl. Fig. 5 as % of FtsZ in the fractions. Without prior staining calibration of the gels, there is no simple quantitative relationship between gel band intensities after Coomassie staining and the amount of protein in a band (Darawshe et al. 1993 Anal Biochem - DOI: 10.1006/abio.1993.1581). This last point precludes a quantitative comparison between pelleting/SDS-PAGE data and analytical sedimentation measurements. For this reason, we have decided to present pelleting results as % of FtsZ in supernatant and pellet to avoid overestimations. 

      A major weakness is the interpretation of the cryoEM tomograms, specifically distinguishing ZapD from FtsZ. The distinction of crosslinks seems based primarily on structure: long continuous filaments (which often appear as sheets) are FtsZ, and small masses between filaments are ZapD. The density of crosslinks seems to vary substantially over different parts of the figures. More important, the density of ZapD's identified and colored red seem much lower than the stoichiometry detailed above. Since the mass of the ZapD monomer is half that of FtsZ, the 1:1 stoichiometry in toroids means that 1/3 of the mass should be ZapD and 2/3 FtsZ. However, the connections identified as ZapD seem much fewer than the expected 1/3 of the mass. The authors conclude that connections run horizontally, diagonally and vertically, which implies no regularity. This seems likely, but as I would suggest that readers need to consider for themselves what they would identify as a crosslink.

      The amount of ZapD in the toroids will be significantly less than one third. Although the theoretical addition of protein to the samples is at a 1:1 ratio, the actual amount of protein in the macrostructures containing ZapD is much lower, as shown by sedimentation velocity pelleting assays.

      In contrast to the toroids formed at equimolar FtsZ and ZapD, thin bundles of straight filaments are assembled in excess ZapD. Here the stoichiometry is 2:1, which would mean that every FtsZ should have a bound ZapD DIMER. The segmentation of a single filament in Fig. 5e seems to agree with this, showing an FtsZ filament with spikes emanating like a picket fence, with a 4.5 nm periodicity. This is consistent with each spike being a ZapD dimer, and every FtsZ subunit along the filament having a bound ZapD dimer. But if each FtsZ has its own dimer, this would seem to eliminate crosslinking. The interpretative diagram in Fig. 6, far right, which shows almost all ZapD dimers bridging two FtsZs on opposite filaments, would be inconsistent with this 2:1 stoichiometry.

      Assessing the precise stoichiometry of FtsZ and ZapD within the macrostructures is challenging. We interpret the spikes as ZapD dimers bridging two FtsZ filaments, implying a theoretical 1:1 stoichiometry in the straight bundle. However, ZapD may be enriched in certain areas, indicating that a single FtsZ monomer is binding to one side of the dimer. In contrast, the other side remains available for additional connections, resulting in a potential 2:1 stoichiometry. A combination of both scenarios is likely, although our resolution does not allow further characterization. Considering these complexities, we assume these connections represent a dimer of ZapD binding to two FtsZ monomers.

      Figure 6 shows a simplified scheme illustrating how the bundles could be assembled based on the Cryo-ET data. We acknowledge the limitations of this diagram; its purpose is to depict the mesh formed by the stabilization of ZapD. We have not included interactions that do not lead to filament crosslinking, such as dimers binding to only one FtsZ filament. This focus enhances the interpretation of the scheme and the FtsZ-ZapD interaction. A sentence has been added to the caption to highlight the possibility of other interactions not considered in the scheme.

      In the original review I suggested a control that might help identify the structures of ZapD in the toroids. Popp et al (Biopolymers 2009) generated FtsZ toroids that were identical in size and shape to those here, but lacking ZapD. These toroids of pure FtsZ were generated by adding 8% polyvinyl chloride, a crowding agent. The filamentous substructure of these toroids in negative stain seemed very similar to that of the ZapD toroids here. CryoET of these toroids lacking ZapD might have been helpful in confirming the identification of ZapD crosslinks in the present toroids. However, the authors declined to explore this control.

      The mechanisms by which methylcellulose (MC) promotes the assembly of FtsZ macrostructures reported by Popp et al. involve more than simple excluded volume effects, as the low concentration of MC (less than 1 mg/ml) falls below the typical crowding regime. The latter suggests the existence of poorly characterized additional interactions between MC and FtsZ. These complexities preclude the use of FtsZ polymers formed in the presence of MC as a true control for the FtsZ toroidal structures reported here.

      Finally, it should be noted that the CTD binding sites for ZapD should be on the outside of curved filaments, the side facing the membrane in the cell. All bound ZapD should project radially outward, and if it contacted the back side of the next filament, it should not bind (because the CTD is on the front side). The diagram second to right in Fig. 6 seems to incorporate this abortive contact.

      The role of the flexible linker and its biological implications are still under debate in the field. The flexible linker allows ZapD-driven connections to be made in different directions. While these implications are not the primary focus of our manuscript, the flexible linker could allow connections between filaments in different orientations.

      Reviewer #1 (Recommendations for the authors):

      Most of the concerns which I had raised in the earlier version have been taken care of, as detailed in the response.

      A few minor points, mostly related to re-phrasing are listed below:

      Page 2: line 21: The use of the term 'C-terminal domain' for the C-terminal unstructured region of FtsZ is confusing. The term C-terminal domain or CTD for FtsZ is commonly used to describe part of the globular domain, while C-terminal tail or CCTP will be a more apt usage for all the instances in this manuscript.

      We refer to the C-terminal domain as the carboxy-terminal region of the protein. This domain includes the C-terminal linker (CTL), which varies in length between species, followed by a conserved 11-residue sequence (CTC) and shorter, variable C-terminal sequences (CTV). We used the term "C-terminal domain" primarily to improve the readability of the manuscript, but we appreciate the reviewer's feedback. We have now adopted the term "CCTP" instead of "C-terminal domain" to improve the clarity of our manuscript.

      On a related note, the schematic in Fig 1 shows the interaction with CCTP rather than the C-terminal domain of the globular FtsZ. Please provide an explanation.

      We refer to the unstructured C-terminal domain of FtsZ as the C-terminal tail. To avoid confusion, we have introduced the term CCTP in this manuscript.

      Supple Fig 2: "The FCS analysis demonstrated an increasing diffusion time of ZapD along with the FtsZ concentration as result of higher proportion of ZapD bound to FtsZ.

      The increased diffusion time need not be interpreted as increased ZapD bound, it could also mean that FtsZ could polymerise in the presence of increasing ZapD, was this possibility ruled out? Including a comment on this aspect will be useful.

      In these experiments, we monitored fluorescently labeled ZapD. Due to their interaction, we found that its diffusion time increased at high FtsZ concentrations. The data presented in Supplementary Figure 2 shows ZapD in the presence of FtsZ-GDP (i.e. under non-polymerization conditions).

      Was it possible to get a molecular weight estimate based on the diffusion time?

      It is possible to estimate hydrodynamic volumes using the Stokes-Einstein equation if the diffusion coefficient of the diffusing particles is known, assuming that the particles are small and spherical. A molecular weight can then be estimated using a standard density of 1.35 g/cm3 (Fisher et all. Protein science 2009 DOI: 10.1110/ps.04688204). This estimate is heavily dependent on the shape of the diffusing particle, as we assume that our protein of interest here is far from a spherical shape due to the interaction through the flexible linker, the hydrodynamic volumes are overestimated. This overestimation then leads to a further overestimation of the molecular weight. In addition, for a more accurate estimation of the sizes and thus molecular weights for proteins, a modified model of the Stokes-Einstein equation is required (Tyn and Gusek Biotechnology and Bioengineering DOI: 10/1002/bit.260350402), where additional information about the shape of the diffusing particle is estimated by measuring the radius of gyration of the particle. These calculations are complex and beyond the scope of our manuscript.

      Supple Fig 4:

      Does FtsZ GTPase activity (without ZapD) also vary with KCl concentrations? It will be useful to comment on this in Supplementary Figure 4.

      Yes, it has been previously reported that moderate concentration of KCl is optimal for FtsZ GTPase activity. We added a comment to the caption.

      Page 6, line 42: short filament segments arranged nearly 'parallel' to each other Since FtsZ filaments are polar, it is better to rephrase as 'parallel or antiparallel'.

      Corrected.

      Page 7, line 41: cross linking of short 'FtsZ' filaments and not ZapD?

      It was a typo. Corrected

      Page 8: delete 'from above' in the title?

      Corrected

      The use of the phrases such as 'cross linking from the top'; 'binds to FtsZ from above' is vague. (Figure 5b legend; discussion page 10, line 18; page 8, line 26; page 12, line 27). Similarly labelling on a schematic figure on the use of vertical, diagonal/lateral will be useful for the readers.

      We thank the reviewer for the suggestions to improve the understanding of our data. We have simplified them by renaming these interactions as vertical.

      Page 13, lines 6 -10

      Rather than an orientation of top or from the side, just the presence of multiple crosslinks along coaxial filaments suffices for a straight bundle. The average spacing will be more uniform in such a straight bundle compared to a toroid where there might be regions without ZapD. I do not find the data on an upward orientation convincing. ZapD binding need not be above to have the C-terminal ends of FtsZ pointing towards the membrane. On the other hand, having ZapD bind above is likely to occlude membrane binding of FtsZ?

      The flexibility of the FtsZ linker suggests that ZapD can bind filaments oriented in different directions. In a cellular environment, FtsZ molecules interact with other division proteins that compete with ZapD for binding sites. This competition could prevent the membrane from occluding and instead create binding sites between the filaments, stabilizing them.

      Page 11, lines 32 - 34: Please rephrase the sentence, with focus on the main point to be conveyed. Do the authors want to say that the 'Same molecule contributes to variability in spacing based on the number of connections formed.'

      Thank you for your comment. We have rephrased the sentence for clarity.

      Page 11: paragraphs 1,2, and 3 appears to convey similar, related ideas and are redundant. Could these be shortened further into one paragraph highlighting how the ratio leads to differences in higher order FtsZ organisation?

      These paragraphs discuss different ideas, and it is better to keep them separate.

      In the response to reviewers, page 19, point 5 (iii), it is given that 5000 FtsZ molecules correspond to 2/3rd of the total, while in the manuscript text, it is given as one-third. Please correct the response text/manuscript text accordingly. The numbers in the cited reference appears to suggest 1/3rd.

      Yes, it was 1/3rd. Thanks for pointing that out. 

      Fig 1b. Y-axis: Absorbance spelling has a typo.

      Page 14, line 11: Healthcare ('h' missing)

      Page 14, line 15: HCl, KCl (L should be in small letter)

      Page15, line 18: 43 - 48K rpm (not Krpm)

      Supple Fig 1 legend: line 5: 's' missing for species

      Corrected.

    1. eLife Assessment

      This important study provides evidence for dynamic coupling between translation initiation and elongation that can help maintain low ribosome density and translational homeostasis. The authors combine single-molecule imaging with a new approach to analyze mRNA translation kinetics using Bayesian modeling. This work is overall solid, but certain key aspects and model assumptions could be strengthened.

    2. Reviewer #1 (Public review):

      Summary:

      In this study, Lamberti et al. investigate how translation initiation and elongation are coordinated at the single-mRNA level in mammalian cells. The authors aim to uncover whether and how cells dynamically adjust initiation rates in response to elongation dynamics, with the overarching goal of understanding how translational homeostasis is maintained. To this end, the study combines single-molecule live-cell imaging using the SunTag system with a kinetic modeling framework grounded in the Totally Asymmetric Simple Exclusion Process (TASEP). By applying this approach to custom reporter constructs with different coding sequences, and under perturbations of the initiation/elongation factor eIF5A, the authors infer initiation and elongation rates from individual mRNAs and examine how these rates covary.

      The central finding is that initiation and elongation rates are strongly correlated across a range of coding sequences, resulting in consistently low ribosome density ({less than or equal to}12% of the coding sequence occupied). This coupling is preserved under partial pharmacological inhibition of eIF5A, which slows elongation but is matched by a proportional decrease in initiation, thereby maintaining ribosome density. However, a complete genetic knockout of eIF5A disrupts this coordination, leading to reduced ribosome density, potentially due to changes in ribosome stalling resolution or degradation.

      Strengths:

      A key strength of this work is its methodological innovation. The authors develop and validate a TASEP-based Hidden Markov Model (HMM) to infer translation kinetics at single-mRNA resolution. This approach provides a substantial advance over previous population-level or averaged models and enables dynamic reconstruction of ribosome behavior from experimental traces. The model is carefully benchmarked against simulated data and appropriately applied. The experimental design is also strong. The authors construct matched SunTag reporters differing only in codon composition in a defined region of the coding sequence, allowing them to isolate the effects of elongation-related features while controlling for other regulatory elements. The use of both pharmacological and genetic perturbations of eIF5A adds robustness and depth to the biological conclusions. The results are compelling: across all constructs and conditions, ribosome density remains low, and initiation and elongation appear tightly coordinated, suggesting an intrinsic feedback mechanism in translational regulation. These findings challenge the classical view of translation initiation as the sole rate-limiting step and provide new insights into how cells may dynamically maintain translation efficiency and avoid ribosome collisions.

      Weaknesses:

      A limitation of the study is its reliance on exogenous reporter mRNAs in HeLa cells, which may not fully capture the complexity of endogenous translation regulation. While the authors acknowledge this, it remains unclear how generalizable the observed coupling is to native mRNAs or in different cellular contexts.

      Additionally, the model assumes homogeneous elongation rates and does not explicitly account for ribosome pausing or collisions, which could affect inference accuracy, particularly in constructs designed to induce stalling. While the model is validated under low-density assumptions, more work may be needed to understand how deviations from these assumptions affect parameter estimates in real data.

      Furthermore, although the study observes translation "bursting" behavior, this is not explicitly modeled. Given the growing recognition of translational bursting as a regulatory feature, incorporating or quantifying this behavior more rigorously could strengthen the work's impact.

      Assessment of Goals and Conclusions:

      The authors successfully achieve their stated aims: they quantify translation initiation and elongation at the single-mRNA level and show that these processes are dynamically coupled to maintain low ribosome density. The modeling framework is well suited to this task, and the conclusions are supported by multiple lines of evidence, including inferred kinetic parameters, independent ribosome counts, and consistent behavior under perturbation.

      Impact and Utility:

      This work makes a significant conceptual and technical contribution to the field of translation biology. The modeling framework developed here opens the door to more detailed and quantitative studies of ribosome dynamics on single mRNAs and could be adapted to other imaging systems or perturbations. The discovery of initiation-elongation coupling as a general feature of translation in mammalian cells will likely influence how researchers think about translational regulation under homeostatic and stress conditions.

      The data, models, and tools developed in this study will be of broad utility to the community, particularly for researchers studying translation dynamics, ribosome behavior, or the effects of codon usage and mRNA structure on protein synthesis.

      Context and Interpretation:

      This study contributes to a growing body of evidence that translation is not merely controlled at initiation but involves feedback between elongation and initiation. It supports the emerging view that ribosome collisions, stalling, and quality control pathways play active roles in regulating initiation rates in cis. The findings are consistent with recent studies in yeast and metazoans showing translation initiation repression following stalling events. However, the mechanistic details of this feedback remain incompletely understood and merit further investigation, particularly in physiological or stress contexts.

      In summary, this is a thoughtfully executed and timely study that provides valuable insights into the dynamic regulation of translation and introduces a modeling framework with broad applicability. It will be of interest to a wide audience in molecular biology, systems biology, and quantitative imaging.

    3. Reviewer #2 (Public review):

      Summary:

      This manuscript uses single-molecule run-off experiments and TASEP/HMM models to estimate biophysical parameters, i.e., ribosomal initiation and elongation rates. Combining inferred initiation and elongation rates, the authors quantify ribosomal density. TASEP modeling was used to simulate the mechanistic dynamics of ribosomal translation, and the HMM is used to link ribosomal dynamics to microscope intensity measurements. The authors' main conclusions and findings are:

      (1) Ribosomal elongation rates and initiation rates are strongly coordinated.

      (2) Elongation rates were estimated between 1-4.5 aa/sec. Initiation rates were estimated between 0.5-2.5 events/min. These values agree with previously reported values.

      (3) Ribosomal density was determined below 12% for all constructs and conditions.

      (4) eIF5A-perturbations (KO and GC7 inhibition) resulted in non-significant changes in translational bursting and ribosome density.

      (5) eIF5A perturbations resulted in increases in elongation and decreases in initiation rates.

      Strengths:

      This manuscript presents an interesting scientific hypothesis to study ribosome initiation and elongation concurrently. This topic is highly relevant for the field. The manuscript presents a novel quantitative methodology to estimate ribosomal initiation rates from Harringtonine run-off assays. This is relevant because run-off assays have been used to estimate, exclusively, elongation rates.

      Weaknesses:

      The conclusion of the strong coordination between initiation and elongation rates is interesting, but some results are unexpected, and further experimental validation is needed to ensure this coordination is valid.

      (1) eIF5a perturbations resulted in a non-significant effect on the fraction of translating mRNA, translation duration, and bursting periods. Given the central role of eIF5a, I would have expected a different outcome. I would recommend that the authors expand the discussion and review more literature to justify these findings.

      (2) The AAG construct leading to slow elongation is very surprising. It is the opposite of the field consensus, where codon-optimized gene sequences are expected to elongate faster. More information about each construct should be provided. I would recommend more bioinformatic analysis on this, for example, calculating CAI for all constructs, or predicting the structures of the proteins.

      (3) The authors should consider using their methodology to study the effects of modifying the 5'UTR, resulting in changes in initiation rate and bursting, such as previously shown in reference Livingston et al., 2023. This may be outside of the scope of this project, but the authors could add this as a future direction and discuss if this may corroborate their conclusions.

      (4) The mathematical model and parameter inference routines are central to the conclusions of this manuscript. In order to support reproducibility, the computational code should be made available and well-documented, with a requirements file indicating the dependencies and their versions.

    4. Reviewer #3 (Public review):

      Disclaimer:

      My expertise is in live single-molecule imaging of RNA and transcription, as well as associated data analysis and modeling. While this aligns well with the technical aspects of the manuscript, my background in translation is more limited, and I am not best positioned to assess the novelty of the biological conclusions.

      Summary:

      This study combines live-cell imaging of nascent proteins on single mRNAs with time-series analysis to investigate the kinetics of mRNA translation.

      The authors (i) used a calibration method for estimating absolute ribosome counts, and (ii) developed a new Bayesian approach to infer ribosome counts over time from run-off experiments, enabling estimation of elongation rates and ribosome density across conditions.

      They report (i) translational bursting at the single-mRNA level, (ii) low ribosome density (~10% occupancy {plus minus} a few percents), (iii) that ribosome density is minimally affected by perturbations of elongation (using a drug and/or different coding sequences in the reporter), suggesting a homeostatic mechanism potentially involving a feedback of elongation onto initiation, although (iv) this coupling breaks down upon knockout of elongation factor eIF5A.

      Strengths:

      (1) The manuscript is well written, and the conclusions are, in general, appropriately cautious (besides the few improvements I suggest below).

      (2) The time-series inference method is interesting and promising for broader applications.

      (3) Simulations provide convincing support for the modeling (though some improvements are possible).

      (4) The reported homeostatic effect on ribosome density is surprising and carefully validated with multiple perturbations.

      (5) Imaging quality and corrections (e.g., flat-fielding, laser power measurements) are robust.

      (6) Mathematical modeling is clearly described and precise; a few clarifications could improve it further.

      Weaknesses:

      (1) The absolute quantification of ribosome numbers (via the measurement of $i_{MP}$​) should be improved. This only affects the finding that ribosome density is low, not that it appears to be under homeostatic control. However, if $i_{MP}$​ turns out to be substantially overestimated (hence ribosome density underestimated), then "ribosomes queuing up to the initiation site and physically blocking initiation" could become a relevant hypothesis. In my detailed recommendations to the authors, I list points that need clarification in their quantifications and suggest an independent validation experiment (measuring the intensity of an object with a known number of GFP molecules, e.g., MS2-GFP MS2-GFP-labeled RNAs, or individual GEMs).

      (2) The proposed initiation-elongation coupling is plausible, but alternative explanations, such as changes in abortive elongation frequency, should be considered more carefully. The authors mention this possibility, but should test or rule it out quantitatively.

      (3) The observation of translational bursting is presented as novel, but similar findings were reported by Livingston et al. (2023) using a similar SunTag-MS2 system. This prior work should be acknowledged, and the added value of the current approach clarified.

      (4) It is unclear what the single-mRNA nature of the inference method is bringing since it is only used here to report _average_ ribosome elongation rate and density (averaged across mRNAs and across time during the run-off experiments - although the method, in principle, has the power to resolve these two aspects).

      (5) I did not find any statement about data availability. The data should be made available. Their absence limits the ability to fully assess and reproduce the findings.

    1. eLife Assessment

      This important work elucidates the biological processes and detailed mechanisms by which testosterone influences seminal plasma metabolites in mice. The evidence supporting the upregulation of metabolic enzymes and the role of ACLY is solid, highlighting the potential contributions of fatty acids to sperm motility.

    2. Reviewer #1 (Public review):

      Summary:

      In this revised report, Yamanaka and colleagues investigate a proposed mechanism by which testosterone modulates seminal plasma metabolites in mice. The authors have made improvements from the previous version by softening the claim that oleic acid derived from seminal vesicle epithelium strongly affects linear progressive motility in isolated cauda epididymal sperm in vitro. They have also addressed the ambiguous references to the strength of the relationship between fatty acids and sperm motility, making the manuscript more balanced and nuanced.

      Strengths:

      This study addresses an important gap in our understanding of how testosterone influences seminal plasma metabolites and, in turn, sperm motility. The findings provide valuable insights into the sensitivity of seminal vesicle epithelial cells to testosterone, which could improve in vitro conditions for studying sperm motility. The authors have added methodological details and re-performed experiments with more appropriate control groups, enhancing the robustness of the study. These revisions, along with more carefully modified language reflecting measurement nuances, add significant value to the field. The study's detailed exploration of the physiological role of reproductive tract glandular secretions in modulating sperm behaviors is likely to be of broad interest, providing a strong foundation for future research on the relationship between fatty acid beta-oxidation and sperm motility patterns.

      Weaknesses:

      While the connection between media fatty acids and sperm motility patterns is still not fully conclusive, the authors have taken substantial steps to clarify and tone down their conclusions. The revised manuscript presents a more balanced view, acknowledging the complexity of the relationship and providing a more solid basis for follow-on studies.

    3. Reviewer #2 (Public review):

      Using a combination of in vivo studies with testosterone-inhibited and aged mice with lower testosterone levels, as well as isolated mouse and human seminal vesicle epithelial cells, the authors demonstrate that testosterone induces an increase in glucose uptake. The study reveals that testosterone triggers differential gene expression, particularly focusing on metabolic enzymes. They specifically identify increased expression of enzymes regulating cholesterol and fatty acid synthesis, leading to heightened production of 18:1 oleic acid. The revised version of the manuscript significantly strengthens the role of ACLY as a central regulator of seminal vesicle epithelial cell metabolic programming. The authors suggest that fatty acids secreted by seminal vesicle epithelial cells are taken up by sperm, resulting in a positive impact on sperm function. While the lipid mixture mimicking the lipids secreted by seminal vesicle epithelial cells shows marginal positive effect on sperm motility, the authors have made considerable progress in refining their conclusions. The revised manuscript acknowledges the complexity of pinpointing the specific seminal vesicle fluid component that potentially positively affects sperm function, providing a more measured and credible interpretation of their findings.

  2. Jul 2025
    1. eLife Assessment

      This important study provides new insights into the lesser-known effects of the sodium-potassium pump on how nerve cells process signals, particularly in highly active cells like those of weakly electric fish. The computational methods used to establish the claims in this work are compelling and can be used as a starting point for further studies.

    2. Reviewer #1 (Public review):

      Summary:

      The authors aim to explore the effects of the electrogenic sodium-potassium pump (Na+/K+-ATPase) on the computational properties of highly active spiking neurons, using the weakly-electric fish electrocyte as a model system. Their work highlights how the pump's electrogenicity, while essential for maintaining ionic gradients, introduces challenges in neuronal firing stability and signal processing, especially in cells that fire at high rates. The study identifies compensatory mechanisms that cells might use to counteract these effects, and speculates on the role of voltage dependence in the pump's behavior, suggesting that Na<sup>+</sup>/K<sup>+</sup>-ATPase could be a factor in neuronal dysfunctions and diseases

      Strengths:

      (1) The study explores a less-examined aspect of neural dynamics-the effects of Na<sup>+</sup>/K<sup>+</sup>-ATPase electrogenicity. It offers a new perspective by highlighting the pump's role not only in ion homeostasis but also in its potential influence on neural computation.

      (2) The mathematical modeling used is a significant strength, providing a clear and controlled framework to explore the effects of the Na<sup>+</sup>/K<sup>+</sup>+-ATPase on spiking cells. This approach allows for the systematic testing of different conditions and behaviors that might be difficult to observe directly in biological experiments.

      (3) The study proposes several interesting compensatory mechanisms, such as sodium leak channels and extracellular potassium buffering, which provide useful theoretical frameworks for understanding how neurons maintain firing rate control despite the pump's effects.

      Weaknesses:

      (1) While the modeling approach provides valuable insights, the lack of experimental data to validate the model's predictions weakens the overall conclusions.

      (2) The proposed compensatory mechanisms are discussed primarily in theoretical terms without providing quantitative estimates of their impact on the neuron's metabolic cost or other physiological parameters.

      Comments on revisions:

      The revised manuscript is notably improved.

    3. Reviewer #2 (Public review):

      Summary:

      The paper by Weerdmeester, Schleimer, and Schreiber uses computational models to present the biological constraints under which electrocytes - specialized, highly active cells that facilitate electro-sensing in weakly electric fish-may operate. The authors suggest potential solutions that these cells could employ to circumvent these constraints.

      Electrocytes are highly active or spiking (greater than 300Hz) for sustained periods (for minutes to hours), and such activity is possible due to an influx of sodium and efflux of potassium ions into these cells after each spike. The resulting ion imbalance must be restored, which in electrocytes, as with many other biological cells, is facilitated by the Na-K pumps at the expense of biological energy, i.e., ATP molecules. For each ATP molecule the pump uses, three positively charged sodium ions from the intracellular space are exchanged for two positively charged potassium ions from the extracellular space. This creates a net efflux of positive ions into the extracellular space, resulting in hyperpolarized potentials for the cell over time. For most cells, this does not pose an issue, as their firing rate is much slower, and other compensatory mechanisms and pumps can effectively restore the ion imbalances. However, in the electrocytes of weakly electric fish, which spike at exceptionally high rates, the net efflux of positive ions presents a challenge. Additionally, these cells are involved in critical communication and survival behaviors, underscoring their essential role in reliable functioning.

      In a computational model, the authors test four increasingly complex solutions to the problem of counteracting the hyperpolarized states that occur due to continuous NaK pump action to sustain baseline activity. First, they propose a solution for a well-matched Na leak channel that operates in conjunction with the NaK pump, counteracting the hyperpolarizing states naturally. Their model shows that when such an orchestrated Na leak current is not included, quick changes in the firing rates could have unexpected side effects. Secondly, they study the implications of this cell in the context of chirps-a means of communication between individual fish. Here, an upstream pacemaking neuron entrains the electrocyte to spike, which ceases to produce a so-called chirp - a brief pause in the sustained activity of the electrocytes. In their model, the authors demonstrate that including the extracellular potassium buffer is necessary to obtain a reliable chirp signal. Thirdly, they tested another means of communication in which there was a sudden increase in the firing rate of the electrocyte, followed by a decay to the baseline. For this to occur reliably, the authors emphasize that a strong synaptic connection between the pacemaker neuron and the electrocyte is necessary. Finally, since these cells are energy-intensive, they hypothesize that electrocytes may have energy-efficient action potentials, for which their NaK pumps may be sensitive to the membrane voltages and perform course correction rapidly.

      Strengths:

      The authors extend an existing electrocyte model (Joos et al., 2018) based on the classical Hodgkin and Huxley conductance-based models of sodium and potassium currents to include the dynamics of the sodium-potassium (NaK) pump. The authors estimate the pump's properties based on reasonable assumptions related to the leak potential. Their proposed solutions are valid and may be employed by weakly electric fish. The authors explore theoretical solutions to electrosensing behavior that compound and suggest that all these solutions must be simultaneously active for the survival and behavior of the fish. This work provides a good starting point for conducting in vivo experiments to determine which of these proposed solutions the fish employ and their relative importance. The authors include testable hypotheses for their computational models.

      Weaknesses:

      The model for action potential generation simplifies ion dynamics by considering only sodium and potassium currents, excluding other ions like calcium. The ion channels considered are assumed to be static, without any dynamic regulation such as post-translational modifications. For instance, a sodium-dependent potassium pump could modulate potassium leak and spike amplitude (Markham et al., 2013).

      This work considers only the sodium-potassium (NaK) pumps to restore ion gradients. However, in many cells, several other ion pumps, exchangers, and symporters are simultaneously present and actively participate in restoring ion gradients. When sodium currents dominate action potentials, and thus when NaK pumps play a critical role, such as the case in Eigenmannia virescens, the present study is valid. However, since other biological processes may find different solutions to address the pump's non-electroneutral nature, the generalizability of the results in this work to other fast-spiking cell types is limited. For example, each spike could include a small calcium ion influx that could be buffered or extracted via a sodium-calcium exchanger.

    4. Author response:

      The following is the authors’ response to the original reviews.

      Reviewer #1 (Public review):

      Summary:

      The authors aim to explore the effects of the electrogenic sodium-potassium pump (Na<sup>+</sup>/K<sup>+</sup>-ATPase) on the computational properties of highly active spiking neurons, using the weakly-electric fish electrocyte as a model system. Their work highlights how the pump's electrogenicity, while essential for maintaining ionic gradients, introduces challenges in neuronal firing stability and signal processing, especially in cells that fire at high rates. The study identifies compensatory mechanisms that cells might use to counteract these effects, and speculates on the role of voltage dependence in the pump's behavior, suggesting that Na<sup>+</sup>/K<sup>+</sup>-ATPase could be a factor in neuronal dysfunctions and diseases

      Strengths:

      (1) The study explores a less-examined aspect of neural dynamics-the effects of (Na<sup>+</sup>/K<sup>+</sup>-ATPase) electrogenicity. It offers a new perspective by highlighting the pump's role not only in ion homeostasis but also in its potential influence on neural computation.

      (2) The mathematical modeling used is a significant strength, providing a clear and controlled framework to explore the effects of the Na+/K+-ATPase on spiking cells. This approach allows for the systematic testing of different conditions and behaviors that might be difficult to observe directly in biological experiments.

      (3) The study proposes several interesting compensatory mechanisms, such as sodium leak channels and extracellular potassium buffering, which provide useful theoretical frameworks for understanding how neurons maintain firing rate control despite the pump's effects.

      Weaknesses:

      (1) While the modeling approach provides valuable insights, the lack of experimental data to validate the model's predictions weakens the overall conclusions.

      (2) The proposed compensatory mechanisms are discussed primarily in theoretical terms without providing quantitative estimates of their impact on the neuron's metabolic cost or other physiological parameters.

      We thank the reviewer for their concise and accurate summary and appreciate the constructive feedback on the article’s strengths and weaknesses. Experimental work is beyond the scope of our modeling-based study. However, we would like our work to serve as a framework for future experimental studies into the role of the electrogenic pump current (and its possible compensatory currents) in disease, and its role in evolution of highly specialized excitable cells (such as electrocytes).

      Quantitative estimates of metabolic costs in this study are limited to the ATP that is required to fuel the pump. By integrating the net pump current over time and dividing by one elemental charge, one can find the rate of ATP that is consumed by the Na<sup>+</sup>/K<sup>+</sup>pump for either compensatory mechanism. The difference in net pump current is thus proportional to ATP consumption, which allows for a direct comparison of the cost efficiency of the Na<sup>+</sup>/K<sup>+</sup> pump for each proposed compensatory mechanism. The Na<sup>+</sup>/K<sup>+</sup> pump is, however, not the only ATP-consuming element in the electrocyte, and some of the compensatory mechanisms induce other costs related to cell

      ‘housekeeping’ or presynaptic processes. We now added a section in the appendix titled

      ‘Considerations on metabolic costs of compensatory mechanisms’ (section 11.4), where we provide ballpark estimates for the influence of the compensatory mechanisms on the total metabolic costs of the cell and membrane space occupation. Although we argue that according these estimates, the impact of discussed compensatory mechanisms could be significant, due to the absence of more detailed experimental quantification, a plausible quantitative cost approximation on the whole cell level remains beyond the scope of this article.

      Reviewer #1 (Recommendations for the authors):

      (1)  For the f-I curves in Figures 1 and 6, the firing rate increases as the input current increases. I am curious to know: (a) whether the amplitudes of the action potentials (APs) vary with increased input current; (b) whether the waveform of APs (such as in Fig. 1I) transitions into smaller amplitude oscillations at higher input currents; and (c) if the waveform does change at higher input currents, how do the "current contributions," "current," and "ion exchanges per action potential" in Figures 1HJ and 6AB respond?

      To fully answer these questions, we added a supplemental figure with accompanied text in section 11.1 (Fig. A1). We also added a reference to this figure in the main text (section 4.1). Here, it is shown that, as previously illustrated in [1], AP amplitude decreases when the input current increases (Fig. A1 A, left). This effect remains upon addition of either a pump with constant pump rate and co-expressed sodium leak channels (Fig. A1 A, center), or a voltage-dependent pump (Fig. A1 A, right). Interestingly, even though the shape of the current contributions (Fig. A1 B) and the APs (Fig. A1 C) look very different for low (Fig. A1 C, top) and high inputs (Fig. A1 C, bottom), the total sodium and potassium displacement per AP, and thus the pump rate, is roughly the same (Fig. A1 D). Under the assumption that voltage-gated sodium channel (NaV) expression is adjusted to facilitate fixed-AP amplitudes, however, (as in [1]) more NaV channels would be expressed in fish with higher synaptic drives. This would then result in an additional sodium influx per AP and result in higher energetic requirements per AP for electrocytes with higher firing rates (also shown in [1]).

      (2) Could the authors clarify what the vertical dashed line represents in Figures 1B and 1F? Does it correspond to an input current of 0.63uA?

      (Reviewer comment refers to Fig. 1C and 1F in new version): Yes, it corresponds to the input current that is also used in figures 1D and 1G. We clarified this by adding an additional tick label on the x-axis in 1F. The current input of 0.63uA was chosen as a representative input for this cell as follows: we first modeled an electrocyte with a periodic synaptic drive as in [1]. The frequency of this drive was set to 400 Hz, which is an intermediate value in the range of reported EODfs (and thus presumably pacemaker firing rates) of 200-600Hz [2]. Then, acetylcholine receptor currents I<sub>AChRNa</sub> and I<sub>AChRNa</sub> were summed and averaged to obtain the average input current of 0.63uA. This is now also explained in new Methods section 6.2.1.

      (3) What input current was used for Figures 1H, 1I, and 1J?

      Response: In a physiological setting, where the electrocyte is electrochemically coupled to the pacemaker nucleus, stimulation of the electrocyte occurs through neurotransmitter release in the synaptic cleft, which then leads to the opening of acetylcholine receptor channels. As figures 1H-J concern different ion fluxes, we aimed to also include currents stemming from acetylcholine receptor channels. We therefore did not stimulate the electrocyte with a constant input current as in Fig. 1C and F, but simulated elevated constant neurotransmitter levels in the synaptic cleft, which then leads to elevated acetylcholine receptor currents. In the model, this neurotransmitter level, or ‘synaptic drive’ is represented by parameter syn<sub>clamp</sub>. A physiologically relevant value for syn<sub>clamp</sub> was deduced by averaging the synaptic drive during a 400 Hz pacemaker stimulus. This is now also explained in new Methods section 6.2.1.

      (4) In Figure 4A, there is a slight delay between the PN spikes (driver) and the EO (receiver), and no EO spikes occur without PN spikes. However, the firing rate of EO (receiver) appears to decrease before the chirp initiations in Fig 4B; and this delay seems to disappear in Fig 4C. Could the authors explain these observations?

      As shown in the bottom right of figure 4A, when plotting the instantaneous firing rate as one over the inter-spike-interval (1/ISI), the firing rate of a cell is only plotted at the end of every ISI. Therefore, even though the PN drives the electrocyte and thus spikes earlier in time than the electrocyte, when it initiates chirps, these will only be plotted as an instantaneous firing rate at the end of the chirp. If the electrocyte fires spontaneously within this chirp, its instantaneous firing rate will appear earlier in time than the initiation of the chirp of the PN. The PN did, however, initiate the chirp before that and causality between the PN and electrocyte is not disturbed.

      (5) Regarding Figure 6, could the authors specify the input current used in Figures 6A and 6B?

      Figure 6A and 6B have the same synaptic drive as Fig. 1 H, I and J (syn<sub>clamp</sub>=0.13).

      (6) In Section 6, I would recommend that the authors provide a table of parameters and their corresponding values for clarity.

      Thank you for your suggestion. We now reorganized the method section and added two tables with parameters for clarity. Table 1 (see Methods 6.1) includes all parameters that differ from the parameters reported in [1], and parameters that arise from the additionally modeled equations to simulate ion concentration dynamics and pump. We also added the parameters used to simulate the different stimulus protocols (and corresponding tuned parameters) that are presented in the article in Table 2 (see Methods 6.2).

      Reviewer #2 (Public review):

      Summary:

      The paper 'The electrogenicity of the Na<sup>+</sup>/K<sup>+</sup>-ATPase poses challenges for computation in highly active spiking cells' by Weerdmeester, Schleimer, and Schreiber uses computational models to present the biological constraints under which electrocytes-specialized highly active cells that facilitate electro-sensing in weakly electric fish-may operate. The authors suggest potential solutions these cells could employ to circumvent these constraints.

      Electrocytes are highly active or spiking (greater than 300Hz) for sustained periods (for minutes to hours), and such activity is possible due to an influx of sodium and efflux of potassium ions into these cells for each spike. This ion imbalance must be restored after each spike, which in electrocytes, as with many other biological cells, is facilitated by the Na-K pumps at the expense of biological energy, i.e., ATP molecules. For each ATP molecule the pump uses, three positively charged sodium ions from the intracellular space are exchanged for two positively charged potassium ions from the extracellular volume. This creates a net efflux of positive ions into the extracellular space, resulting in hyperpolarized potentials for the cell over time. This does not pose an issue in most cells since the firing rate is much slower, and other compensatory mechanisms and other pumps can effectively restore the ion imbalances. In electrocytes of weakly electric fish, however, that operate under very different circumstances, the firing rate is exceptionally high. On top of this, these cells are also involved in critical communication and survival behaviors, emphasizing their reliable functioning.

      In a computation model, the authors test four increasingly complex solutions to the problem of counteracting the hyperpolarized states that occur due to continuous NaK pump action to sustain baseline activity. First, they propose a solution for a well-matched Na leak channel that operates in conjunction with the NaK pump, counteracting the hyperpolarizing states naturally. Additionally, their model shows that when such an orchestrated Na leak current is not included, quick changes in the firing rates could have unexpected side effects. Secondly, they study the implication of this cell in the context of chirps - a means of communication between individual fishes. Here, an upstream pacemaking neuron entrains the electrocyte to spike, which ceases to produce a so-called chirp - a brief pause in the sustained activity of the electrocytes. In their model, the authors show that it is necessary to include the extracellular potassium buffer to have a reliable chirp signal. Thirdly, they tested another means of communication in which there was a sudden increase in the firing rate of the electrocyte followed by a decay to the baseline. For reliable occurrence of this, they emphasize that a strong synaptic connection between the pacemaker neuron and the electrocyte is warranted. Finally, since these cells are energy-intensive, they hypothesize that electrocytes may have energyefficient action potentials, for which their NaK pumps may be sensitive to the membrane voltages and perform course correction rapidly.

      Strengths:

      The authors extend an existing electrocyte model (Joos et al., 2018) based on the classical Hodgkin and Huxley conductance-based models of Na and K currents to include the dynamics of the NaK pump. The authors estimate the pump's properties based on reasonable assumptions related to the leak potential. Their proposed solutions are valid and may be employed by weakly electric fish. The authors explore theoretical solutions that compound and suggest that all these solutions must be simultaneously active for the survival and behavior of the fish. This work provides a good starting point for exploring and testing in in vivo experiments which of these proposed solutions the fish use and their relative importance.

      Weaknesses:

      The modeling work makes assumptions and simplifications that should be listed explicitly. For example, it assumes only potassium ions constitute the leak current, which may not be true as other ions (chloride and calcium) may also cross the cell membrane. This implies that the leak channels' reversal potential may differ from that of potassium. Additionally, the spikes are composed of sodium and potassium currents only and no other ion type (no calcium). Further, these ion channels are static and do not undergo any post-translational modifications. For instance, a sodium-dependent potassium pump could fine-tune the potassium leak currents and modulate the spike amplitude (Markham et al., 2013).

      This model considers only NaK pumps. In many cell types, several other ion pumps/exchangers/symporters are simultaneously present and actively participate in restoring the ion gradients. It may be true that only NaK pumps are expressed in the weakly electric fish Eigenmannia virescens. This limits the generalizability of the results to other cell types. While this does not invalidate the results of the present study, biological processes may find many other solutions to address the non-electroneutral nature of the NaK pump. For example, each spike could include a small calcium ion influx that could be buffered or extracted via a sodium-calcium exchanger.

      Finally, including testable hypotheses for these computational models would strengthen this work.

      We thank the reviewer for the detailed summary and the identified weaknesses according to which we improved our article. Our model assumptions and simplifications are now mentioned in more detail in the introduction of the article (section 3), and justified in the Methods (section 6.1).

      Furthermore, we added a discussion section (section 5.1) where we outline the conditions under which the present study can be extended to other cell types. We now also state more clearly that the pump current will be present for any excitable cell with significant sodium flux (assuming that the NaK pump carries out the majority of its active transport), but that compensatory mechanisms (if employed at all in a particular cell) could also be implemented via other ionic currents and transporters. We furthermore now highlight the testable hypotheses that we put forward with our computational study on the weakly electric fish electrocyte more explicitly in the first paragraph of the discussion.

      Reviewer #2 (Recommendations for the authors):

      Main text

      Please explicitly state this model's assumptions in the introduction and elaborate on them in the discussion if necessary. For example, some assumptions that I find relevant to mention are: - The Na and K channels are classic HH conductance-based channels, with no post-translational modifications or beta subunit modifications as seen in other high-frequency firing cells (10.1523/JNEUROSCI.23-12-04899.2003).

      Neither calcium nor chloride ions are considered in the spike generation. Nor are Na-dependent K channels (10.1152/jn.00875.2012).

      Only the Na-K pump (and not the Na-Ca exchanger, Ca-pump, or Cl pumps) is modeled,

      Calmodulin, which can buffer calcium, is highly expressed in electric eels, but it is not considered. If some of these assumptions have valid justifications in weakly electric fish electrocytes, please state so with the citations. I recognize that including these in your models is beyond the scope of the current paper.

      We thank the reviewer for pointing out this issue. We now specified in the introduction that the model only contains sodium and potassium ions and only classic HH conductance-based channels. We there also explicitly specify the details on the Na<sup>+</sup>/K<sup>+</sup>-ATPase: it is the only active transporter in this model, thus solely responsible for maintaining ionic homeostasis; its activity is only modulated by intracellular sodium and extracellular potassium concentrations. In the discussion (6.1), we now elaborate on how ion-channel-related aspects (i.e., the addition of resurgent Na<sup>+</sup> or Na<sup>+</sup> -dependent K<sup>+</sup> channels), additional ion fluxes (including some not relevant for the electrocyte but for other excitable cells), and additional active transporters and pumps would influence the results presented in the article.

      In addition, there might be other factors that the authors and the reviewers have yet to consider. The model is a specific case study about the weakly electric fish electrocyte with high-frequency firing. It is almost guaranteed that biology will find other compensatory ways in different cell types, systems, and species (auditory nerve, for example). Given this, it would be prudent to use phrases such as 'this model suggests,' 'perhaps,' 'could,' 'may,' and 'eludes to,' etc., to accommodate other possible solutions to ion homeostasis in rapidly spiking neurons. The solutions the authors are proposing are some of many.

      We rephrased some of the statements to highlight more the hypothetical nature of the compensatory mechanisms in specific cells and to draw attention to the fact that there can be many more such factors. This fact is now also explicitly mentioned in discussion section 5.2.

      Figures

      Some of my comments on the figures are stylistic, others are to improve clarity, and some are critical for accuracy.

      The research problem concerns weakly electric fish E. virescens. I suggest introducing a picture of an electric fish in the beginning (such as that in Figure 3, but not exactly; see specific comments on this fish figure) along with a schema of the research question. 

      We agree, and added an overview schema in Fig. 1A.

      Font sizes change between the panels in all the figures. Please maintain consistency. The figure panel titles and axis labels should start with a capital letter.

      Thank you for pointing this out, both issues have been resolved in the new version of the article.

      Figure 1:

      Please rearrange the figure - BCFG belong together and should appear in the same order. The x-axis labels could be better placed.

      Consider using fewer pump current f-I curves (B, D, E, F). Five is sufficient to make the point. Having 10 curves adds to the clutter. The placement of the color bar could be better. Similarly, the placement of the panel titles 'without co-expression' and 'with co-expression' and the panel labeling (BCFG) makes it confusing. The panel labels should be above the panel title.

      Response (C, D, F, G in new version): We improved the layout of figure 1. Panels B, C, F, G are now C, D, F, G. We opted to include panel E before panels F and G, because it shows the coexpression mechanism before its effect on the tuning curve. We did move the colorbar, added x-axis labels to B and C, and adjusted the location of the panel labels for clarity. We also plotted fewer pump currents.

      B, F: What does the dashed line indicate?

      Response (C, F in new version): The dashed line indicates the input current that was used in figures 1D and 1G. We now clarified this by adding this value on the x-axis.

      C: Any reason not to show the lower firing rates?

      Response (B in new version): In the previous version of the article, pump currents were estimated for electrocytes that were stimulated with the mean synaptic drive that stems from periodic stimulation in the 200-600 Hz regime. We now extended the range of synaptic inputs to obtain lower (and higher) firing rates. The linear relationship between firing rate and pump current also holds for these additional firing rates.

      D: There is no difference between the curves at the top and the bottom. One fills the area between the curve and the zero line; the other shows the curve itself. Please use only one of the two representations.

      Response (panel I in new version): In the previous version, the difference between the plots was that one showed the absolute values of the currents (the curves), and the other plot showed the contributions of the currents to the total (area between the curves). We now only depict the current contributions.

      The I and H orders can be swapped.

      Thank you, they are now swapped.

      The colors used for Na and K are very dull (light blue and pink).

      We now use darker colors in the new version of the article.

      Figure 2:

      Please verify that without the synaptic input perturbations (i.e., baseline in A, D), the firing rate (B, E) and pump current (C, F) converge to the baseline. There is a noticeable drift (downward for firing rate and upward for pump currents) at the 10-second time point.

      Thanks to you noticing, we identified a version mismatch in the code that estimates the pump current required for ionic homeostasis (see Methods 6.1.2). We have now corrected the code and made sure to start the simulation in the steady state so that there is no drift at baseline firing. We also used this corrected code to present tuned parameters for different stimulus protocols in Table 2 (Methods 6.2).

      Figure 3:

      A. The dipole orientation with respect to the fish in panel B needs to be corrected. Consider removing this as this work is not about the dipole.

      This panel has been removed.

      B. This figure has already been overused in multiple papers; please redraw it. Localized expressions of different pumps and ion channels are present within each electrocyte, which generates the dipole. Either show this correctly or don't at all (the subfigure pointed out by the red arrow).

      This panel has been moved to Fig. 1A. We opted to remove the localized expressions.

      C and D belong together; please place them next to each other. Consider introducing panel D first since it follows a similar protocol to the last figure.

      Response (A in new version): Panel placement has been adjusted. We opted to maintain the order to maintain the flow of the text, but we do now combine them in one panel.

      E and F are very similar in that they are swapped on the x and y axes. Either that or I have severely misunderstood something, in which case it needs to be shown better.

      Response (B and C in new version): We adjusted the placement of these panels. They are not the same, panel B shows the mean of physiological periodic inputs, and figure C shows that when this mean is fed to the electrocyte, it also induces tonic firing. The range of mean currents that result from periodic synaptic stimulation in the physiological regime (panel B, y-axis) is now indicated in panel C by a grey box along the x-axis.

      G. Why show the lines with double arrow ends? The curves are diverging - that's enough.

      Good point, we updated this panel accordingly (now panel D).

      Figure 4

      Please verify the time units in these plots. Something seems amiss. B and D lower plots-perhaps this is seconds? B could use an inset box/ background gray color (t1, t2) indicating the plots of the C panel (left, right). Likewise, for D (t1, t2), connect to E (left, right).

      You are right, the x-axes were supposed to be in seconds, we updated this. We indicated the relations between D-C and D-E by gray backgrounds and by adding the corresponding panel label on the x-axis.

      A: Indicate the perturbation in the schematic, i.e., extracellular K buffer.

      The perturbation is now indicated.

      D: Even with the extracellular K buffer, there is a decay (slower than in B) of the pump current over time. Please verify (you do not have to show in your paper) that this decay saturates.

      After the ten chirps are initiated, pacemaker firing goes back to baseline. In both cases (panel B and panel D), the pump current goes back to baseline after some time. With extracellular potassium buffering, this happens more slowly due to a decreased reaction speed of the pump to changes in firing rate (in comparison to the case without extracellular potassium buffer).

      The decrease in reaction speed however merely delays the effects of changes in firing rates on the pump current in time. Therefore, even with an extracellular potassium buffer, when more chirps are initiated in a short period of time, the pump current can still decrease to an extent that impairs entrainment. Using the same protocol as in panel B and D, we increased the number of chirps and found that with an extracellular potassium buffer, a maximum of 13 chirps could be encoded without entrainment failure (as opposed to 2 chirps without the buffer as shown in panel B).

      Figure 5

      Please verify the time units in these plots, as for Figure 4. B and E lower plots-perhaps this is seconds? B could use an inset box/ background gray color (t1, t2) indicating the plots of the panels C and D. Likewise, for E (t1, t2), connect to F and G.

      The time axis in this figure was indeed also in seconds, which we corrected here. The relations between plots B-C/D and E-F/G are now indicated through gray backgrounds and corresponding panel references on the x-axis.

      A: Indicate the perturbation in the schematic, i.e., the synapse's strength. There is no need to include the arrow or to mention freq. rise. The placement of the time scale can be misinterpreted as a current clamp. Instead, plot it as a zoomed inset.

      The arrow is removed and we now also show a zoomed inset. Also, the perturbation is now indicated.

      E: Verify that the pump current in the strong synapse case already starts at 1.25

      We verified this and noticed that the pump current in the strong synapse case is indeed lower than that in the weak synapse case. This is because to ensure a fair comparison for this stimulation protocol, voltage-gated sodium channel conductance was tuned to maintain a spike amplitude of 13 mV in both cases (see Methods 6.2). In this case, a weak synapse leads to a lower influx of sodium via AChR channels, but a higher influx via voltage-gated sodium channels. The total sodium influx in this case is larger than that for a stronger synapse with relatively less voltage-gated sodium currents, and thus a larger pump current. In the previous version of the article, this was wrongly commented on in the figure captions, and we removed the erroneous statement.

      This is not critical, but because the R-value here can be obtained as a continuous value, it would be appropriate to show it for the whole duration of the weak and strong synapses in B and E. Maybe consider including a schema that shows how R is calculated in panel A.The caption has a typo, 'during frequency rises before (D) and after (E)'. It should be before C) and after (D) instead.

      The caption typo has been corrected. The R-value for the whole duration of the weak and strong synapses in B and E is 1.000. This is because the R-value is the variance of all phase relations between the PN and the electrocyte, and for the entire duration of the stimulus protocol, there are only a few outliers in phase relations at the maxima of the frequency rises. We decided to include this R-value to show that in general, synchronization between the PN and the electrocyte is very stable. The schema that explains how R is calculated has not been included in favor of not overcrowding the figure. We did add a reference in the figure caption to the methods section in which the calculation of R is explained.

      Figure 6:

      A: The top and bottom plots are redundant. Use one of the two. They show the same thing. It may be better to plot Na, K, pump, and net currents on the top panels and the Na leak, which is of smaller magnitude, in a different panel.

      We now only show current contributions.

      B: Please change the color schema. It is barely visible on my prints.

      D: Pump current, instantaneous case, is barely visible

      Color schemes were adjusted.

      Figure A1: It's all good.

      Methods:

      Please provide some internal citations for where specific equations were used in the results/figures. You do this for sections 6.2.3, referencing Figure 5 (c,d,e,g), and 6.2.4, referencing Fig 5 C-E.

      There are now internal references in each methods section to where in the figures they were used. We also included a table with stimulus parameters for each figure with a stimulus protocol (Table 2).

      Also, the methods could be ordered in the same order as the results are presented. Please consider if some details in the methods could be moved to the appendix.

      The ordering of the methods has now been changed to separately explain the model expansions (6.1) and the stimulus protocols (6.2). Both sections are in corresponding order of the figures presented in the article. We opted to maintain all details in the methods.

      6.1.1 Please cite 26 after the first line. Where was this used? In Figure 3C, 4, 5?

      We added the citation. The effects of co-expressed leak channels are shown in Fig. 1 EG, and were used to compensate for pump currents at baseline firing in figures 1 D, H-J (left, with pump), 2, 4, 5, and 6 A-B (left), C (top). This is now also added to the text for clarity.

      Traditionally (Hodgkin, A. L. and Huxley, A. F. (1952). J. Physiol. (Lond.), 117:500-544. Table 3; & Hodgkin, A. L. and Huxley, A. F. (1952). J. Physiol. (Lond.), 116:473-496 Table 5 and the paragraph around it), leak potential is set such that it accounts for all leak from all ions. While in your work, this potential is equal to the reversal of potassium - it need not be so in the animal. There may be leaks from other ions as well, particularly sodium and chloride. Please verify that assuming the leak reversal is the same as that of potassium (Ek, in Equation 3) does not lead to having to model Na leak currents separately.

      In the original model [1], it was assumed that the reversal potential of the leak was the same as that of potassium, which contains the implicit assumption that only potassium ions contribute to the leak. In our article, we also assume that sodium ions contribute to the leak. This can be modeled by adjusting the leak reversal potential accordingly, or by adding an additional leak current that solely models the sodium leak. We opted for the latter in order to track all sodium and potassium ions separately so that ion concentration dynamics could also be modeled properly. Chloride ions were neglected in this study; in our model they do not contribute to the leak. If one were to also model chloride currents and chloride concentration dynamics, it would be beneficial to model these as an additional separate leak current.

      The notation of I_pump_0 needs to be more convenient. Please consider another notation instead of the _0 (pump at baseline). Similarly for [Na<sup>+</sup>]_in_0 [Na<sup>+</sup>]_out_0 and [K<sup>+</sup>]_in_0 and [K+]_out_0

      We changed the notation for baseline similarly to [3], with ‘0’ as a superscript instead of a subscript.

      Equation 11: Please mention why AChRs do not let calcium ions through. Please cite a justification for this. If this is an assumption of the model, please state this explicitly.

      The AChR channels that were found in the E. virescence electrocytes are muscle-type acetylcholine nicotinic receptors [4], which are non-selective cation channels that could indeed support calcium flux [5]. No calcium currents were, however, modeled in the original electrocyte model [1], presumably due to the lack of significant contributions of calcium currents or extracellular calcium concentrations to electrocyte action potentials of a similar weakly electric electrogenic wave-type fish Sternopygus macrurus [6].

      Due to the lack of calcium currents in the original electrocyte model, and due to the limitation of this study to sodium and potassium ions, we chose not to include calcium currents stemming from AChR channels. This assumption is now explicitly stated in Methods 6.1.

      Equation 12, V_in, where the intracellular volume. If possible, avoid the notation of 'V' - you already use a small v for membrane potential.

      We changed the notation for volume to ‘ω’ similarly to [3]. As we previously used ω as a notation for the firing rate, we changed the notation for firing rate to ‘r’.

      Equation 17: Does this have any assumptions? Would the I_AchRNa, and thus Sum(mean(I_Na))) not change depending on the synaptic drive?

      The assumptions of this equations are the following (now also mentioned in Methods 6.1.2):

      The sum of all sodium currents also includes sodium currents through acetylcholine channels (I_AChRNa).

      All active sodium transport (from intra- to extracellular space) is carried out by the Na<sup>+</sup>/K<sup>+</sup>-ATPase, and active sodium transport through additional transporters and pumps is negligible.

      The time-average of sodium currents is either taken in a tonic firing regime where the timeinterval that is averaged over is a multiple of the spiking period, nT, or if it is taken for a more variable firing regime, the size of the averaging window should be sufficiently large to properly sample all firing statistics.

      Under these assumptions, Eq. 17 can be used to compute suitable pump currents for different synaptic drives (as Sum(mean(I_Na))) and thus I_pump0 indeed change with the synaptic drive, see Table 2 in Methods 6.2). 

      6.2: Please rewrite the first sentence of this paragraph.

      The first sentence of this paragraph, which has been moved to section 6.2.2 for improved structuring of the text, has been rewritten.

      6.2.1: The text section could use a rewrite.

      Please elaborate on what t_p is. If it is not time, please do not use 't.' What is p here? What are the units of the equation (22), t_p < 0.05 (?)

      This section has now also been moved to 6.2.2. It has been rewritten to improve clarity and t_p has been renamed to t_pn (as it does reflect time, which is now better explained). The units have now also been added to the equation (which is now Eq. 26).

      6.2.4: Please rewrite this.

      This section has been rewritten (and has been moved to section 6.1.4).

      Bibliography

      Some references are omitted (left anonymous) or inconsistent on multiple occasions.

      Thank you for pointing this out! It is now rectified.

      References used for author response

      (1) Joos B, Markham MR, Lewis JE, Morris CE. A model for studying the energetics of sustained high frequency firing. PLOS ONE. 2018 Apr;13:e0196508.

      (2) Hopkins CD. Electric communication: Functions in the social behavior of eigenmannia virescens. Behaviour. 1974;50(3-4):270–304.

      (3) Hübel N, Dahlem MA. Dynamics from seconds to hours in hodgkin-huxley model with time-dependent ion concentrations and buer reservoirs. PLoS computational biology.ff2014;10(12):e1003941.

      (4) BanY, Smith BE, Markham MR. A highly polarized excitable cell separates sodium channels from sodium-activated potassium channels by more than a millimeter. Journal of neurophysiology. 2015; 114(1):520–30.

      (5) Vernino S, Rogers M, Radcliffe KA, Dani JA. Quantitative measurement of calcium flux through muscle and neuronal nicotinic acetylcholine receptors. Journal of Neuroscience. 1994;14(9):5514-5524.

      (6) Ferrari M, Zakon H. Conductances contributing to the action potential of sternopygus electro-cytes. Journal of Comparative Physiology A. 1993;173:281–92.

    1. eLife Assessment

      This study offers a valuable contribution to the understanding of how inorganic nutrient transporters, particularly SUL1, influence yeast lifespan through signaling pathways rather than transport functions. The findings suggest a novel link between SUL1 deletion and extended replicative lifespan, supported by transcriptomic and stress-response data. However, the strength of the evidence remains incomplete, with key experiments-such as sulfate supplementation tests, functional autophagy validation, and transport assays-either missing or insufficiently described. As a result, while the manuscript presents promising insights, additional work is needed to robustly support its conclusions.

    2. Reviewer #1 (Public review):

      The manuscript by Long et al. focused on SUL1, a gene encoding a sulfate transporter with signaling roles in yeast. The authors claim that the deletion of SUL1, rather than SUL2 (encoding a similar transporter), extended yeast replicative lifespan independent of sulfate transport. They also show that SUL1 loss-of-function mutants display decreased PKA activity, indicated by stress-protective carbohydrate accumulation, relevant transcription factor relocalization (measured during aging in single cells), and changes in gene expression. Finally, they show that loss of SUL1 increases autophagy, which is consistent with the longer lifespan of these cells. Overall, this is an interesting paper, but additional work should strengthen several conclusions, especially for the role of sulfate transport. Specific points include the following:

      What prompted the authors to measure the RLS of sul1 mutants? Prior systematic surveys of RLS in the same strain background (which included the same sul1 deletion strain they used) did not report lifespan extension in sul1 cells (PMID: 26456335).

      Cells carrying a mutant Sul1 (E427Q), which was reported to be disrupted in sulfate transport, did not have a longer lifespan (Figure 1), leading them to conclude that "lifespan extension by SUL1 deletion is not caused by decreased sulfate uptake". They would need to measure sulfate uptake in the mutants they test to draw that conclusion firmly.

      Related to my previous point, another simple experiment would be to repeat the assays in Figure 1 with exogenous sulfur added to see if the lifespan extension is suppressed.

      There needs to be more information in the text or the methods about how they did the enrichment analysis in Figure 2B. P-values are typically insufficient, and adjusted FDR values are reported from standard gene ontology platforms (e.g., PANTHER).

      It is somewhat puzzling that relocalization of Msn2 was not seen in very old cells (past the 17th generation), but it was evident in younger cells. The authors could consider another possibility, that it was early and midlife experiences that made those cells live longer. Past that window, loss of Sul1 may have no impact on longevity. A conditional shutoff system to regulate SUL1 expression would be needed to test the above, albeit this is probably beyond the scope of this report.

      The connections between glucose restriction, autophagy, and sul1 (Figure 4) could be further tested by measuring the RLS of sul1 cells in glucose-restricted cells. If RLS is further extended by glucose restriction, then whatever effects they see should be independent of glucose restriction.

      They made and tested the double (sul1, msn2) mutants, but they should also test the sul1, msn4 combination since Msn4 functions similarly to Msn2.

      Comments on revisions:

      Overall, this is a somewhat improved manuscript, but some prior concerns about the validity of the conclusions remain unresolved.

    3. Reviewer #2 (Public review):

      Summary:

      In this study, the authors find that deletion of a sulfate transporter in yeast, Sul1, leads to extension of replicative lifespan. They investigate mechanisms underlying this extension, and claim that the effects on longevity can be separated from sulfate transport, and are instead linked to a previously proposed transceptor function of the Sul1 transporter. Through RNA sequencing analysis, the authors find that Sul1 loss triggers activation of several stress response pathways, and conclude that deletion of two pathways, autophagy or Msn2/4, partially prevents lifespan extension in cells lacking Sul1. Overall, while it is well-appreciated that activation of Msn2/4 or autophagy is beneficial for lifespan extension in yeast, the results of this study would add an important new mechanism by which this could achieved, through perceived sulfate starvation. However, as described below, several of the experiments utilized to support the authors conclusion are not experimentally sound, and significant additional experimentation is required to support the authors claims throughout the manuscript.

      Strengths:

      The major strength of the study is the robust RNA-seq data that identified differentially expressed genes in cells lacking Sul1. This facilitated the authors focus on two of these pathways, autophagy and the Msn2/4 stress response pathway.

      Weaknesses:

      Several critical experimental flaws need to be addressed by the authors to more rigorously test their hypothesis.

      (1) The lifespan assays throughout the manuscript contain inconsistencies in the mean lifespan of the wild type strain, BY4741. For example, in Figure 1A, the lifespan of BY4741 is 24.3, and the extended lifespan of the sul1 mutant is 31. However, although all mutants tested in Figure 1B also have lifespans close to 30 cell divisions, the wild type control is also at 30 divisions in those experiments as well. This is problematic, as it makes it impossible to conclude anything about the lifespan extension of various mutants with the inconsistencies in the wild type lifespan. Additionally, the mutants analyzed in 1B are what the authors use to claim that loss of the transporter does not extend lifespan through sulfate limitation, but instead through a signaling function. Thus, it remains unclear whether loss of sul1 extends lifespan at all, and if it does, whether this is separable from cellular sulfate levels.

      (2) While the authors use mutants in Figure 1 that should have differential effects on sulfate levels in cells, the authors need to include experiments to measure sulfate levels in their various mutant cells to draw any conclusions about their data.

      (3) Similar to point 2, the authors focused their RNA sequencing analysis on deletion of sul1 and did not include important RNA seq analysis of the specific Sul1 mutation or other mutants in Figure 1B that do not exhibit lifespan extension. The prediction is that they should not see activation of stress response pathways in these mutants as they do not see lifespan extension, but this needs to be tested.

      (4) While the RNA-seq data is robust in Figure 2 as well as the follow up quantitative PCR and trehalose/glycogen assays in 2A-B, the follow-up imaging assays for Msn2/4 localization in Figure 2 are not robust and are difficult to interpret. The authors need to include more high-resolution imaging or at least a close up of the cells in Figure 3C.

      (5) The autophagy assays utilized in Figure 4 appear to all be done with a C-terminal GFP-tagged Atg8 protein. As C-terminal GFP is removed from Atg8 prior to conjugation to phosphatidylethanolamine, microscopy assays of this reporter cannot be utilized to report on autophagy activity or flux. Instead, the authors need to utilize N-terminally tagged Atg8, which they can monitor for vacuole uptake as an appropriate readout of autophagy levels. As it stands, the authors cannot draw any conclusions about autophagy activity in their studies.

      Comments on revisions:

      Their autophagy conclusions are weak at best. As was highlighted in the previous review, they need to use an N-terminal Atg8 fusion for these experiments.

    4. Reviewer #3 (Public review):

      Summary:

      In the revised manuscript, Long et al., showed that sul1∆ mutants have extended replicative lifespan in budding yeast. In comparison, other mutants that have sulfate transport deficiency did not show extended lifespan, suggesting SUL1 deletion extends lifespan independently of sulfate intake. The authors then explored the transcriptome of sul1∆ mutants by RNA-seq, which suggests that SUL1 deletion impacts common longevity pathways. Furthermore, the authors characterized how the PKA pathway is affected in sul1∆ mutants: SUL1 deletion promotes the nuclear localization of Msn2, as well as autophagy, indicating down-regulation of the PKA pathway.

      Strengths:

      This study raised an interesting point that inorganic transporters may impact cellular stress response pathways and affect lifespan. Some of the characterizations on the sul1∆ mutants, including the RNA-seq and MSN2 localization could provide valuable sources for people in related fields. Compared with the previous version, the writing is significantly improved, making the manuscript clearer.

      Weaknesses:

      Several critical flaws have not been revised. The claims are still not well supported by the data.

      (1) The revised manuscript still uses Atg8-EGFP, in which GFP is likely tagging at the C-terminus of Atg8. No strain information was provided for this strain, so it is unclear whether it is N- or C- terminal tagged. As pointed by reviewers of the previous version, C-terminal tagged Atg8 is not functional. As a result, the conclusions on autophagy (Figure 4) is questionable.

      (2) The nuclear localization of Msn2 is much more convincing after the authors updated Figure 3C. However, the rest of the microscopy images (e.g. Figure 3E, 4B, 4E) are still of low resolution. Again, I suggest to separate the DIC and GFP channels. It is really hard to tell where is the GFP signal from these figures.

      (3) In the Kankipati et al. 2015 paper, which is cited by the authors, SUL1E427Q is incorporated on a pRS316 (URA3) plasmic and expressed in sul1∆sul2∆ mutants. In this manuscript, the authors used SUL1E427Q mutants but did not give detailed information on how this construct is expressed. Is it endogenously mutated, incorporated into somewhere in the genome, or expressed from an extrachromosomal plasmid?<br /> In Figure 1B, they simply used BY4741 as a control for the SUL1E427Q mutant. This makes me thinking they are using a SUL1E427Q endogenous point mutation mutant. If so, the authors may want to include the information about this strain in their Supplementary table. Or if it is expressed from an extra copy on chromosomes or extrachromosomal plasmids, the authors would need to express this construct in sul1∆ mutant. In this case, the authors may want to use sul1∆ and sul1∆+empty vector as controls, instead of BY4741. As the authors mentioned in their rebuttal letter, lifespan experiments vary between each individual trials and are not comparable between different trials. Thus proper controls are essential to make the results convincing.

      (4) As suggested by reviewers of the previous version, the authors tested the sulfate uptake in different mutants within 10 minute of Na2SO4 addition (Figure 1B). The authors concluded from the data that wild type takes up sulfate faster than the mutants but they reach similar concentrations at the end point (as fast as 10 minutes). Are all these cells sulfate-starved before the experiment? If not, the experiment might be affected by the basal level of sulfate in each mutants.

    1. eLife Assessment

      This study presents useful findings that explore the prognostic and immunotherapeutic relevance of specific immune-related genes (CALR, IL1R1, IFNB1, and IFNG) in the bladder cancer tumor microenvironment. While the analysis highlights potentially meaningful associations with survival and treatment response, the strength of evidence is incomplete, as some claims lack sufficient experimental or mechanistic validation. Further refinement and validation of the predictive models would enhance the impact and generalizability of the conclusions.

    2. Reviewer #1 (Public review):

      The authors aimed to explore the prognostic and therapeutic relevance of immunogenic cell death (ICD)-related genes in bladder cancer, focusing on a risk-scoring model involving CALR, IL1R1, IFNB1, and IFNG. The research indicates that higher expression of certain ICD-related genes is associated with enhanced immune infiltration, prolonged survival, and improved responsiveness to PD1-targeted therapy in bladder cancer patients.

      Major strengths:

      • The establishment of an ICD-related gene risk model based on publicly available datasets (TCGA and GEO) and further validated through tissue arrays and preliminary single-cell RNA sequencing data provides potential but weak clinical guidance.

      • The integration of multi-dimensional data (gene expression, mutation burden, immune infiltration, and treatment responses) strengthens the clinical applicability of the model.

      Key limitations and concerns:

      (1) Gene Selection and Novelty:

      The selection of genes predominantly reflects known regulators of immune responses, somewhat limiting the novelty. Exploring less-characterized ICD markers or extending validation beyond bladder cancer could improve the model's innovative aspect and wider clinical relevance.

      (2) Reliance on RNA-Seq for Immune Infiltration:

      Immune infiltration analyses based primarily on bulk RNA-Seq data have inherent methodological limitations, such as inability to distinguish cell subsets accurately. Incorporation of robust single-cell sequencing would significantly enhance the reliability of these findings. Although the authors recognize this limitation, future studies should directly address it.

      (3) Drug Sensitivity and Immunotherapy Response Data:

      While the authors clarify that the drug sensitivity analysis was performed using established databases (TCGA via pRRophetic), the unexpected correlations between ICD-related genes and various targeted therapies need further mechanistic validation. The observed relationships may reflect indirect associations rather than direct biological relevance, which warrants cautious interpretation.

      (4) Presentation and Clarity Issues:

      Initially noted formatting inconsistencies across figures compromised professional presentation; these have been corrected by the authors. Additionally, the authors have now provided essential methodological details, including clear sample sizes and database versions, enhancing reproducibility.

      (5) Immunotherapy Response Evidence:

      Conclusions regarding differences in immunotherapy response rates between patient subgroups, although intriguing, remain based on retrospective database analyses with relatively limited demographic and clinical detail. Future prospective studies or more detailed patient characterization would be required to robustly confirm these associations.

      (6) Interpretation of ICD Gene Signatures:

      The ICD-related gene set includes many genes broadly associated with immune activation rather than specifically ICD. Although this was addressed by the authors, clearly distinguishing ICD-specific versus general immune-response genes in future studies would help clarify biological implications.

      Summary and Recommendations for Readers:

      Overall, this study presents an interesting and clinically relevant risk-scoring approach to stratify bladder cancer patients based on ICD-related gene expression profiles. It provides useful information about prognosis, immune infiltration, and potential immunotherapy responsiveness. However, readers should interpret the results within the context of its limitations, notably the need for broader validation and careful consideration of the biological significance underlying the observed associations. This work lays a valuable foundation for further investigation into the integration of ICD and immune response signatures in personalized cancer therapy.

    3. Author response:

      The following is the authors’ response to the original reviews.

      Reviewer #1 (Recommendations for the authors):

      Thank you for your thorough review of our manuscript and your valuable suggestions. Here are our responses to each point you raised:

      (1) Novelty: Exploring the feasibility of extending the risk-scoring model to diverse cancer types could emphasize the broader impact of the research.

      Thank you so much for your thoughtful and insightful feedback. Your suggestion to explore extending the risk-scoring model to diverse cancer types is truly valuable and demonstrates your broad vision in this field. We deeply appreciate your interest in our research and the effort you put into providing such constructive input.

      After careful consideration, we have decided to focus our current study on the specific cancer type(s) we initially set out to explore. This decision was made to ensure that we can thoroughly address the research questions at hand, given our current resources, time constraints, and the complexity of the topic. By maintaining this focused approach, we aim to achieve more in-depth and reliable results that can contribute meaningfully to the understanding of this particular area.

      However, we fully recognize the potential significance of your proposed direction and firmly believe that it could be an excellent avenue for future research. We will definitely keep your suggestion in mind and may explore it in subsequent studies as our research progresses and evolves.

      (2) Improvement in Figure Presentation: The inconsistency in font formatting across figures, particularly in Figure 2 (A-D, E, F-H, I), Figure 3 (A-C, D-J, H, K), and the distinct style change in Figure 5, raises concerns about the professionalism of the visual presentation. It is recommended to standardize font sizes and styles for a more cohesive and visually appealing layout. This ensures that readers can easily follow and comprehend the graphical data presented in the article.

      The text in the picture has been revised as requested.

      (3) Enhancing Reliability of Immune Cell Infiltration Data: Address the potential limitations associated with relying solely on RNASeq data for immune cell infiltration analysis between ICD and ICD high groups in Figure 2. It is advisable to discuss the inherent challenges and potential biases in this methodology. To strengthen the evidence, consider incorporating bladder cancer single-cell sequencing data, which could provide a more comprehensive and reliable understanding of immune cell dynamics within the tumor microenvironment.

      Thank you very much for your meticulous review and the highly constructive suggestions. Your insight regarding the limitations of relying on RNASeq data for immune cell infiltration analysis and the proposal to incorporate bladder cancer single-cell sequencing data truly reflect your profound understanding of the field. We deeply appreciate your efforts in guiding our research and the valuable perspectives you've offered.

      After careful deliberation, given our current research scope, timeline, and available resources, we've decided to focus on further discussing and addressing the challenges and biases inherent in RNASeq-based immune cell infiltration analysis. By delving deeper into the methodological limitations and conducting more in-depth statistical validations, we aim to provide a comprehensive and reliable interpretation of the data within our study framework. This focused approach allows us to maintain the integrity of our original research design and deliver robust findings on the relationship between immune cell infiltration and ICD in the current context.

      However, we fully acknowledge the significant value of your proposed single-cell sequencing approach. It is indeed a powerful method that could offer more detailed insights into immune cell dynamics, and we believe it holds great promise for future research in this area. We will keep your suggestion in mind as an important direction for potential future studies, especially when we plan to expand and deepen our exploration of the tumor microenvironment.

      (4) Clarity in Data Sources and Interpretation of Figure 5: In the results section, provide a detailed and transparent explanation of the sources of data used in Figure 5. This includes specifying the databases or platforms from which the chemotherapy, targeted therapy, and immunotherapy data were obtained. Additionally, elucidate the rationale behind the chosen data sources and how they contribute to the overall interpretation of the study's findings. And, strangely, these immune-related genes are associated with cancer sensitivities to different targeted therapies.

      Thank you very much for your detailed and valuable feedback on Figure 5. We sincerely appreciate your careful review and insightful suggestions, which have provided us with important directions for improvement.

      Regarding the data sources in Figure 5, we used the pRRophetic algorithm to conduct a drug sensitivity analysis on the TCGA database. The reason for choosing these data sources is multi - faceted. Firstly, these databases and platforms are well - established and widely recognized in the field. They have strict data collection and verification processes, ensuring the accuracy and reliability of the data. For example, TCGA has a large - scale, long - term - accumulated chemotherapy case database, which can comprehensively reflect the clinical application and treatment effects of various chemotherapeutic drugs.

      Secondly, these data sources cover a wide range of cancer types and patient information, which can meet the requirements of our study's diverse sample size and variety. This comprehensiveness enables us to conduct a more in - depth and representative analysis of the relationships between different therapies and immune - related genes.

      In terms of the overall interpretation of the study's findings, the use of these data sources provides a solid foundation. The accurate chemotherapy, targeted therapy, and immunotherapy data help us clearly demonstrate the associations between immune - related genes and cancer sensitivities to different treatments. This allows us to draw more reliable conclusions and provides a scientific basis for understanding the complex mechanisms of cancer treatment from the perspective of immune - gene - therapy interactions.

      As for the unexpected association between immune - related genes and cancer sensitivities to different targeted therapies, this is indeed a fascinating discovery. In our analysis, we hypothesized that immune - related genes may affect the tumor microenvironment, thereby influencing the response of cancer cells to targeted therapies. Although this finding is currently beyond our initial expectations, it has opened up a new research direction for us. We will further explore and verify the underlying mechanisms in future research.

      Once again, thank you for your guidance. We will make corresponding revisions and improvements according to your suggestions to make our research more rigorous and complete.

      (5) Legends and Methods: Address the brevity and lack of crucial details in the figure legends and methods section. Expand the figure legends to include essential information, such as the number of samples represented in each figure. In the methods section, provide comprehensive details, including the release dates of databases used, versions of coding packages, and any other pertinent information that is crucial for the reproducibility and reliability of the study.

      We would like to express our sincere gratitude for your valuable feedback on the figure legends and methods section of our study. We highly appreciate your sharp observation of the issues regarding the brevity and lack of key details, which are crucial for further improving our research.

      We have supplemented the methods section with data including the number of samples, the release dates of the databases used, and the versions of the coding packages, etc. For TCGA samples: 421 tumor samples and 19 normal samples.Database release date: March 29, 2022, v36 versions.Coding package version: R version 4.1.1.We will immediately proceed to supplement these key details, making the research process and methods transparent. This will allow other researchers to reproduce our study more accurately and enhance the persuasiveness of our research conclusions.

      (6) Evidence Supporting Immunotherapy Response Rates: The importance of providing a robust foundation for the conclusion regarding lower immunotherapy response rates. Strengthen this section by offering a more detailed description of sample parameters, specifying patient demographics, and presenting any statistical measures that validate the observed trends in Figure 5Q-T. More survival data are required to conclude. Avoid overinterpretation of the results and emphasize the need for further investigation to solidify this aspect of the study.

      Thank you very much for your professional and meticulous feedback on the content related to immunotherapy response rates in our study! Your suggestions, such as providing a solid foundation for the conclusions and supplementing key information, are of great value in enhancing the quality of our research, and we sincerely appreciate them.

      The data in Figures 5Q to T are from the TCGA database, which has already been provided. The statistical measure used for Figures 5Q to T is the P-value, which has been marked in the figures. The survival data have been provided in Figure 3D.

      Reviewer #2 (Recommendations for the authors):

      Thank you for your thorough review of our manuscript and your valuable suggestions. Here are our responses to each point you raised:

      (1) There is no information on the samples studied. Are all TCGA bladder cancer samples studied? Are these samples all treatment naïve? Were any excluded? Even simply, how many samples were studied?

      Thank you so much for pointing out the lack of sample - related information. Your attention to these details has been extremely helpful in identifying areas for improvement in our study.

      All the samples in our study were sourced from the TCGA (The Cancer Genome Atlas) and TCIA (The Cancer Immunome Atlas) databases. It should be noted that the patient data in the TCIA database are originally from the TCGA database. Regarding whether the patients received prior treatment, this information was not specifically mentioned in our current report. Instead, we mainly relied on the scores of the prediction model for evaluation. Since all samples were obtained from publicly available databases, we understand the importance of clarifying their origin and characteristics.

      We sincerely apologize for the omission of the sample size and other relevant details. We will promptly supplement this crucial information in the revised version, including a detailed description of the sample sources and any relevant characteristics. This will ensure greater transparency and help readers better understand the basis of our research.

      For TCGA samples: 421 tumor samples and 19 normal samples.Database release date: March 29, 2022, v36 versions.Coding package version: R version 4.1.1.

      (2) What clustering method was used to divide patients into ICD high/low? The authors selected two clusters from their "unsupervised" clustering of samples with respect to the 34 gene signatures. A Delta area curve showing the relative change in area under the cumulative distribution function (CDF) for k clusters is omitted, but looking at the heatmap one could argue there are more than k=2 groups in that data. Why was k=2 chosen? While "ICD-mid" may not fit the authors' narrative, how would k=3 affect their Figure1C KM curve and subsequent results?

      Thank you very much for raising these insightful and constructive questions, which have provided us with a clear direction for further improving our research.

      When dividing patients into ICD high and low groups, we used the unsupervised clustering method. This method was chosen because it has good adaptability and reliability in handling the gene signature data we have, and it can effectively classify the samples.

      Regarding the choice of k = 2, it is mainly based on the following considerations. Firstly, in the preliminary exploratory analysis, we found that when k = 2, the two groups showed significant and meaningful differences in key clinical characteristics and gene expression patterns. These differences are closely related to the core issues of our study and help to clearly illustrate the distinctions between the ICD high and low groups. At the same time, considering the simplicity and interpretability of the study, the division of k = 2 makes the results easier to understand and present. Although there may seem to be trends of more groups from the heatmap, after in-depth analysis, the biological significance and clinical associations of other possible groupings are not as clear and consistent as when k = 2.

      As for the impact of k = 3 on the KM curve in Figure 1C and subsequent results, we have conducted some preliminary simulation analyses. The results show that if the "ICD-mid" group is introduced, the KM curve in Figure 1C may become more complex, and the survival differences among the three groups may present different patterns. This may lead to a more detailed understanding of the response to immunotherapy and patient prognosis, but it will also increase the difficulty of interpreting the results. Since the biological characteristics and clinical significance of the "ICD-mid" group are relatively ambiguous, it may interfere with the presentation of our main conclusions to a certain extent. Therefore, in this study, we believe that the division of k = 2 is more conducive to highlighting the key research results and conclusions.

      Thank you again for your valuable comments. We will further improve the explanation and description of the relevant content in the paper to ensure the rigor and readability of the research.

      (3) The 'ICD' gene set contains a lot of immune response genes that code for pleiotropic proteins, as well as genes certainly involved in ICD. It is not convincing that the gene expression differences thus DEGs between the two groups, are not simply "immune-response high" vs "immune-response low". For the DEGS analysis, how many of the 34 ICD gene sets are DEGS between the two groups? Of those, which markers of ICD are DEGs vs. those that are related to immune activation?

      a. The pathway analysis then shows that the DEGs found are associated with the immune response.

      b. Are HMGB1, HSP, NLRP3, and other "ICD genes" and not just the immune activation ones, actually DEGs here?

      c. Figures D, I-J are not legible in the manus.

      We sincerely appreciate your profound insights and valuable questions regarding our research. These have provided us with an excellent opportunity to think more deeply and refine our study.

      We fully acknowledge and are grateful for your incisive observations on the "ICD" gene set and your valid concerns about the differential expression gene (DEG) analysis. During the research design phase, we were indeed aware of the complexity of gene functions within the "ICD" gene set and the potential confounding factors between immune responses and ICD. To distinguish the impacts of these two aspects as effectively as possible, we employed a variety of bioinformatics methods and validation strategies in our analysis.

      Regarding the DEG analysis, among the 34 ICD gene sets, 30 genes showed significant differential expression between the groups, excluding HMGB1, HSP90AA1, ATG5, and PIK3CA. We further conducted detailed classification and functional annotation analyses on these DEGs. The ICD gene set is from a previous article and is related to the process of ICD. Relevant literature is in the materials section. HMGB1: A damage-associated molecular pattern (DAMP) that activates immune cells (e.g., via TLR4) upon release, but its core function is to mediate the release of "danger signals" in ICD, with immune activation being a downstream effect.HSP90AA1: A heat shock protein involved in antigen presentation and immune cell function regulation, though its primary role is to assist in protein folding, with immune-related effects being auxiliary.NLRP3: A member of the NOD-like receptor family that forms an inflammasome, activating CASP1 and promoting the maturation and release of IL-1β and IL-18.Among the 34 DEGs, the majority are associated with immune activation, such as IL1B, IL6, IL17A/IL17RA, IFNG/IFNGR1, etc.

      (4) I may be missing something, but I cannot work out what was done in the paragraph reporting Figure 2I. Where is the ICB data from? How has this been analysed? What is the cohort? Where are the methods?

      The samples used in the analysis corresponding to Figure 2I were sourced from the TCGA (The Cancer Genome Atlas) and TCIA (The Cancer Immunome Atlas) databases. These databases are widely recognized in the field for their comprehensive and rigorously curated cancer - related data, ensuring the reliability and representativeness of our sample cohort.

      Regarding the data analysis, the specific methods employed are fully described in the "Methods" section of our manuscript.

      (5) How were the four genes for your risk model selected? It is not clear whether a multivariate model and perhaps LASSO regularisation was used to select these genes, or if they were selected arbitrarily.

      As you inquired about how the four genes for our risk model were selected, we'd like to elaborate based on the previous analysis steps. In the Cox univariate analysis, we systematically examined a series of ICD-related genes in relation to the overall survival (OS) of patients. Through this analysis, we successfully identified four ICD-related genes, namely CALR (with a p-value of 0.003), IFNB1 (p = 0.037), IFNG (p = 0.022), and IF1R1 (p = 0.047), that showed a significant association with OS, as illustrated in Figure 3A.

      Subsequently, to further refine and optimize the model for better prediction performance, we subjected these four genes to a LASSO regression analysis. In the LASSO regression analysis (as depicted in Figure 3B and C), we aimed to address potential multicollinearity issues among the genes and select the most relevant ones that could contribute effectively to the construction of a reliable predictive model. This process allowed us to confirm the significance of these four genes in predicting patient outcomes and incorporate them into our final predictive model.

      (6) How related are the high-risk and ICD-high groups? It is not clear. In the 'ICD-high' group in the 1A heatmap, patients typically have a z-score>0 for CALR, IL1R, IFNg, and some patients do also for IFNB1. However, in 3H, the 'high risk' group has a different expression pattern of these four genes.

      Patients were divided into ICD high-expression and low-expression groups based on gene expression levels. However, the relationship between these genes and patient prognosis is complex. As shown in Figure 3A, some genes such as IFNB1 and IFNG have an HR < 1, while CALR and IL1R1 have an HR > 1. Therefore, an algorithm was used to derive high-risk and low-risk groups based on their prognostic associations.

      (7) In the four-gene model, CALR is related to ICD, as outlined by the authors briefly in the discussion. IFNg, IL1R1, IFNB1 have a wide range of functions related to immune activity. The data is not convincing that this signature is related to ICD-adjuvancy. This is not discussed as a limitation, nor is it sufficiently argued, speculated, or referenced from the literature, why this is an ICD-signature, and why CALR-high status is related to poor prognosis.

      We acknowledge that the functions of these genes are indeed complex and extensive. In the current manuscript, we have included a preliminary discussion of their roles in the "Discussion" section. As demonstrated by the data presented earlier, these genes do exhibit associations with ICD, and we firmly believe in the validity of these findings.

      However, we are fully aware that our current discussion is not sufficient to fully elucidate the intricate relationships among these genes, ICD, and other biological processes. In response to your valuable feedback, we will conduct an in - depth review of the latest literature, aiming to gain a more comprehensive understanding of the underlying mechanisms.

      (8) Score is spelt incorrectly in Figures 3F-J.

      Figures 3F-J have been revised as requested.

      (9) The authors 'comprehensive analysis' in lines 165-173, is less convincing than the preceding survival curves associating their risk model with survival. Their 'correlations' have no statistics.

      We understand your concern regarding the persuasiveness of the content in this part, especially about the lack of statistical support for the correlations we presented. While we currently have our reasons for presenting the information in this way and are unable to make changes to the core data and descriptions at the moment, we deeply respect your perspective that it could be more convincing with proper statistical analysis.

      (10) The authors performed immunofluorescence imaging to "validate the reliability of the aforementioned results". There is no information on the imaging used, the panel (apart from four antibodies), the patient cohort, the number of images, where the 'normal' tissue is from, how the data were analysed etc. This data is not interpretable without this information.

      a. Is CD39 in the panel? CD8, LAG3? It's not clear what this analysis is.

      The color of each antibody has been marked in Fig 2B. The cohort information and its source have been supplemented. The staining experiment was carried out using a tissue microarray, and the analysis method can be found in the "Methods" section.Formalin-fixed, paraffin-embedded human tissue microarrays (HBlaU079Su01) were purchased from Shanghai Outdo Biotech Co., Ltd. (China), comprising a total of 63 cancer tissues and 16 adjacent normal tissues from bladder cancer patients. Detailed clinical information was downloaded from the company's website.The Remmele and Stegner’s semiquantitative immunoreactive score (IRS) scale was employed to assess the expression levels of each marker,as detailed inMethods2.5.CD39, CD8, and LAG3 were also stained, but the results were not presented.

      (11) The single-cell RNA sequencing analysis from their previous dataset is tagged at the end. CALR expression in most identified cells is interesting. Not clear what this adds to the work beyond 'we did scRNA-seq'. How were these data analysed? scRNA-seq analysis is complex and small nuances in pre-processing parameters can lead to divergent results. The details of such analysis are required!

      We understand your concern about the contribution of the single-cell RNA sequencing results. The main purpose of this analysis is to observe the expression changes of the four genes at the single-cell level. As you mentioned, single-cell RNA sequencing analysis is indeed complex, and we fully recognize the importance of detailed information. We performed the analysis using common analytical methods for single-cell sequencing.It has been supplemented in the Methods section.

    1. eLife Assessment

      This study describes a genetic screen to identify deubiquitinases (DUBs) that counteract the activity of small-molecule degraders (PROTACs). The presented data are valuable, identifying OTUD6A and UCHL5 as DUBs that impact the efficacy and potency of PROTACs. While the conclusions are broadly supported and the methods employed are solid, the mechanistic depth and validation are incomplete. Overall, these findings merit further evaluation by the targeted protein degradation community when developing and optimizing PROTACs.

    2. Reviewer #1 (Public review):

      Summary:

      In this study, the authors investigate the role of deubiquitinases (DUBs) in modulating the efficacy of PROTAC-mediated degradation of the cell-cycle kinase AURKA. Using a focused siRNA screen of 97 human DUBs, they identify UCHL5 and OTUD6A as negative regulators of AURKA degradation by PROTACs. They further offer a mechanistic explanation of enhanced AURKA degradation in the nucleus via OTUD6A expression being restricted to the cytosol, thereby protecting the cytoplasmic pool of AURKA. These findings provide important insight into how subcellular localization and DUB activity influence the efficiency of targeted protein degradation strategies, which could have implications for therapy.

      Strengths:

      (1) The manuscript is well-structured, with clearly defined objectives and well-supported conclusions.

      (2) The study employs a broad range of well-validated techniques - including live-cell imaging, proximity ligation assays, HiBiT reporter systems, and ubiquitin pulldowns - to dissect the regulation of PROTAC activity.

      (3) The authors use informative experimental controls, including assessment of cell-cycle progression effects, rescue experiments with siRNA-resistant constructs to confirm specificity, and the application of both AURKA-targeting PROTACs with different warheads and orthogonal degrader systems (e.g., dTAG-13 and dTAGv-1) to differentiate between target- and ligase-specific effects.

      (4) The identification of OTUD6A as a cytosol-restricted DUB that protects cytoplasmic but not nuclear AURKA is novel and may have therapeutic relevance for selectively targeting oncogenic nuclear AURKA pools.

      Weaknesses:

      (1) Although UCHL5 and OTUD6A are shown to limit AURKA degradation, direct physical interaction was not assessed.

      (2) Although the authors identify a correlation between DUB knockdown-induced cell cycle progression and enhanced PROTAC activity, only one DUB (USP36) is excluded on this basis. In addition, one DUB is shown in the correlation plot (Figure 3B) whose knockdown enhances PROTAC sensitivity without significantly altering cell cycle progression, but it is not identified/discussed.

      (3) While the authors suggest that combining PROTACs with DUB inhibition could enhance degradation, this was not experimentally tested.

      (4) The study identifies UCHL5 as a general antagonist of CRBN-recruiting PROTACs, yet the ubiquitin pulldown experiments (Figure 5G, H) show no change in AURKA ubiquitination upon UCHL5 knockdown. This raises questions about the precise step or mechanism by which UCHL5 exerts its protective effect.

    3. Reviewer #2 (Public review):

      Summary:

      In this study, the authors present a screening approach to identify deubiquitylases that may impact PROTAC efficacy/potency, specifically in this case using a previously reported AURKA PROTAC as an initial model. The authors claim that UCHL5 is able to control the level of degradation of both AURKA and dTAG when using CRBN-mediated PROTACs; however, VHL is not impacted by UCHL5 activity. They additionally claim that OTUD6A is able to control the extent of AURKA degradation in a target protein-specific manner and that this effect is specific to cytoplasm-located AURKA.

      Overall, whilst the endeavour is of interest and importance, we found that the claims made were overly generalised, the effects observed when knocking down the respective DUBs were very small, the systems used are highly artificial, and the data is not presented in a way that makes understanding absolute changes transparent.

      Strengths:

      The topic is of high interest and relevance and explores an underappreciated and understudied area of the PROTAC mechanism of action. If findings could be better supported, they would certainly bring value to the field.

      Weaknesses:

      The overall effects observed are sometimes limited in real terms. Even if statistically significant, the data presented does not fully support that changes in degradation due to UCHL5 activity represent changes of functional relevance. The data provided often omits the absolute changes in protein abundance observed. Data on endogenous/less engineered systems and/or with higher resolution read-outs would greatly strengthen some conclusions.

    4. Reviewer #3 (Public review):

      Summary:

      Cardno et al. "test the hypothesis that DUBs could oppose PROTAC-mediated degradation of cellular targets, using AURKA as a model target". A screen with a panel of siRNA that depleted 97 DUBs in the presence and absence of AURKA targeted PROTAC-D identified DUBs that regulated AURKA and those that affected the sensitivity of PROTAC-D. Validation studies with DUBs, UCHL5, and OTU6A yielded mixed results. UCHL5 not only affected PROTAC-mediated AURKA degradation but also affected CRBN-associated substrates, OTUD6A, more specifically, affected PROTAC-mediated AURKA degradation, and the effects of OTUD6A were associated with the localisation of AURKA. The findings are interesting; the impact of the findings would be strengthened if the key results are validated in one or more cancer cell lines that have not been modified.

    5. Author response:

      We therefore plan to make only a minor change to the manuscript to clarify a point raised by Reviewer 1: the DUB shown in the correlation plot in Fig 3B - whose knockdown enhances PROTAC sensitivity without significantly altering cell cycle progression - is BAP1. Since BAP1 subsequently showed no significant effect on endogenous AURKA levels (Fig 3E) it was excluded from further analysis.

      In considering how the mechanistic aspects of our study could be strengthened, we point out that an interaction of AURKA with OTUD6A has been demonstrated elsewhere (Kim et al. 2021). We also argue that an interaction of AURKA with UCHL5 would not be expected since UCHL5 is a proteasomal DUB shown to act on substrates recruited to the proteasome via capture of ubiquitin chains by the ubiquitin receptors of the proteasome lid. We agree that mechanistically we have not provided complete evidence for a direct deubiquitinating activity of UCHL5 on AURKA. We cannot explain why there is no change in AURKA ubiquitination upon UCHL5 knockdown in our ubiquitin pulldown experiment, but indeed there is considerable uncertainty in the scientific literature on the precise role of UCHL5 at the proteasome.

      In response to feedback on the size of effects we report, and whether they represent changes of functional relevance: We agree the differences are small. Nonetheless such changes may be functionally important and therefore relevant to design of future TPD strategies. Our previous characterization of PROTAC-D (Wang et al. 2021) provides evidence that differential degradation of subcellular pools can have functional relevance. We showed in our study that the lack of degradation of the centrosomal pool (even if this represents only a small fraction of the total pool) led to unexpected phenotypic consequences that were distinct from those observed upon treatment with ATP-competitive inhibitor or siRNA. Therefore we believe our specific finding of spatially restricted action of AURKA-selective OTUD6A to be of clear functional relevance to AURKA TPD strategies and of conceptual importance in establishing the paradigm of TPD modulation by DUBs.

      As Reviewer 1 notes, we do not directly test our hypothesis that combining PROTACs with DUB inhibition could enhance degradation. We would have done so had there been suitable small molecule inhibitors available for OTUD6A or UCHL5 at the time of our study. We plan a broader study of OTUD6A mechanisms and its role in PROTAC sensitivity in cancer cell lines, and appreciate Reviewer 3’s suggestion that the impact of our findings would be strengthened if key results were validated in one or more cancer cell lines. The scope of this new study means we plan to report it in a separate, future publication.

    1. eLife Assessment

      In this important contribution, Yan and colleagues describe a powerful and compelling strategy to generate concatamers of the BK channel and their fusion constructs with the auxiliary gamma subunits, which allows exploring contributions of individual subunits of the tetrameric channel to its gating and the study of heteromeric channel complexes of defined composition. Distinct examples are presented, which illustrate great diversity in the stoichiometric control of BK channel gating, depending on the site and nature of molecular perturbations. The molecular approaches could be extended to other membrane proteins whose N and C termini face opposite sides of the membrane.

    2. Reviewer #1 (Public review):

      Summary:

      BK channels are widely distributed and involved in many physiological functions. They have also proven a highly useful tool for studying general allosteric mechanisms for gating and modulation by auxiliary subunits. Tetrameric BK channels are assembled from four separate alpha subunits, which would be identical for homozygous alleles and potentially of five different combinations for heterozygous alleles (Geng et al., 2023, https://doi.org/10.1085/jgp.202213302). Construction of BK channels with concatenated subunits in order to strictly control heteromeric subunit composition had not yet been used because the N-terminus in BK channels is extracellular, whereas the C-terminus is intracellular. In this new work, Chen, Li, and Yan devise clever methods to construct and assemble BK channels of known subunit composition, as well as to fix the number of γ1 axillary subunits per channel. With their novel molecular approaches, Chen, Li and Yan report that a single γ1 axillary subunit is sufficient to fully modulate a BK channel, that the deep conducting pore mutation L312A exhibited a graded effect on gating with each addition mutated subunit replacing a WT subunit in the channel adding an additional incremental left shift in activation, and that the V288A mutation at the selectivity filter must be present on all four alpha subunits in order to induce channel inactivation. Chen, Li, and Yan have been successful in introducing new molecular tools to generate BK channels of known stoichiometry and subunit composition. They validate their methods and provide three examples of their use with useful observations.

      Strengths:

      Powerful new molecular tools for the study of channel gating have been developed and validated in the study.

      Weaknesses:

      One example each of auxiliary, deep pore, and selectivity filter allosteric actions is presented, but this is sufficient for the purposes of the paper to establish their methods and present specific examples of applicability.

    3. Reviewer #2 (Public review):

      Summary:

      This manuscript describes novel BK channel concatemers as a tool to study the stoichiometry of the gamma subunit and mutations in the modulation of the channel. Taking advantage of the modular design of the BK channel alpha subunit, the authors connected S1-S6/1st RCK as two- and four-subunit concatemers and coexpressed with S0-RCK2 to form normal function channels. These concatemers avoided the difficulty that the extracellular N-terminus of S0 was unable to connect with the cytosolic C-terminus of the gamma subunit, allowing a single gamma subunit to be connected to the concatemers. The concatemers also helped reveal the required stoichiometry of mutant BK subunits in modulating channel function. These include L312A in the deep pore region that altered channel function additively with each additional subunit harboring the mutation, and V288A at the selectivity filter that altered channel function cooperatively only when all four subunits were mutated. These results demonstrate that the concatemers are robust and effective in studying BK channel function and molecular mechanisms related to stoichiometry. The different requirement of the gamma subunit and the mutations stoichiometry for altering channel function is interesting, which may relate to the fundamental mechanism of how different motifs of the channel protein control function.

      Strengths:

      The manuscript presents well-designed experiments with high-quality data, which convincingly demonstrate the BK channel concatemers and their utility. The results are clearly presented.

      Weaknesses:

      This reviewer did not identify any major concerns with the manuscript.

    1. eLife Assessment

      This manuscript reports a high-quality genome assembly of the European cuttlefish, Sepia officinalis, a representative species of the Cephalopod lineage. The data are based on current best practices for sequencing and genome assembly, including PacBio HiFi long reads and Hi-C chromatin conformation capture; the analysis is currently in parts incomplete, as further analyses are required to confirm the correct chromosome number. This genome will be a useful resource for the community of researchers interested in cuttlefish biology and comparative genomics in general.

    2. Reviewer #1 (Public review):

      Summary:

      This manuscript presents a high-quality, chromosome-level genome assembly of the European cuttlefish (Sepia officinalis), a representative species of the cephalopod lineage. Using state-of-the-art sequencing and scaffolding technologies -including PacBio HiFi long reads and Hi-C chromatin conformation capture - the authors deliver a genome assembly with exceptional contiguity and completeness, as evidenced by high BUSCO scores. This genome resource fills a significant gap in cephalopod genomics and offers a valuable foundation for studies in neurobiology, behavior, and evolutionary biology. However, there are several major aspects that need to be strengthened.

      Major Revisions Recommended:

      (1) Single-individual genome limitation

      The genome assembly is based on a single individual, which appears to be male. While this approach is common in genome projects, it does not capture the full genetic diversity of the species. As S. officinalis exhibits a wide geographical range and possible population structure, future efforts (or discussion in this manuscript) should consider re-sequencing multiple individuals - of both sexes and from diverse geographic origins - to characterize population-level variation, sex-linked features, and structural polymorphisms.

      (2) Limited experimental validation of chromosomal inferences

      The study reports chromosome-scale scaffolding using Hi-C data and proposes a revised karyotype for S. officinalis. However, these inferences would be significantly strengthened by orthogonal validation methods. In particular, fluorescence in situ hybridization (FISH) or karyotyping from cytogenetic preparations would provide direct confirmation of chromosome number and structural arrangements. The reliance solely on Hi-C contact maps for inferring chromosomal organization should be acknowledged as a limitation or supplemented with such validations.

      (3) Shallow discussion of chromosomal evolution

      The manuscript briefly mentions chromosomal number differences among cephalopods but does not explore their evolutionary or functional implications. A more thorough comparative analysis - linking chromosomal rearrangements (e.g., fusions, fissions) with ecological adaptation, life history, or neural complexity - would greatly enhance the impact of the findings. Referencing chromosomal dynamics in related taxa and possible links to behavioral innovations would contextualize these results more effectively.

      (4) Underdeveloped gene family and pathway analysis

      While the authors identify expansions in gene families such as protocadherins and C2H2 zinc finger transcription factors, the functional significance of these expansions remains speculative. The manuscript would benefit from:

      a) Functional enrichment analyses (e.g., GO, KEGG) targeting these gene families.

      b) Expression profiling across tissues or developmental stages to infer regulatory roles.

      c) Comparison with expression or expansion patterns in other cephalopods with known behavioral complexity (e.g., Octopus bimaculoides, Euprymna scolopes).

      d) Potential integration of transcriptomic or epigenomic data to support regulatory hypotheses.

    3. Reviewer #2 (Public review):

      Summary:

      This paper concerns an interesting organism, Sepia officinalis. However, in the opinion of this reviewer, the paper reads somewhat like a genome report. The authors have used 23x PacBio HiFi in conjunction with relatively low coverage (11x) Hi-C to scaffold the genome into a karyotype of 47 chromosomes. They have used a combination of short and long read RNA seq to annotate the genome in what looks like a very good annotation. The paper offers basic analyses of the Busco evaluation, some descriptive analyses of gene family and repeat content, and a bit more focused analysis on synteny among sequenced squids. Generally, the data will be useful.

      Strengths:

      This is a high-quality annotation, and the data ultimately will be useful to other researchers. I appreciate trying to understand what's happening between assemblies of S. officinalis.

      Weaknesses:

      I don't believe the data at hand makes a strong case for the argument of 47 chromosomes. This is my biggest sticking point with the paper, and it is for a few reasons:

      (1) The authors point to assembly differences between the DToL assembly and the one presented in the manuscript and seem to claim that DToL is incorrect. However, the DToL assembly (xcSepOffi3.1) is based on much deeper HiFi and HiC coverage than the one at hand (51x and 80+x respectively). There are many things to try here, including:

      a) Downloading the DToL data and reassembling using a common pipeline.

      b) Downsampling the DToL data to similar coverage as what the authors have achieved.

      c) Combining your data and that of DToL for even deeper coverage (heterozygosity is low enough that I don't imagine this impeding things too badly).

      (2) Looking at Figure 1, there appears to be a misjoin at chromosome 42. Looking carefully at Figure S1, that misjoin does not appear on any of the panels - this is confusing. Given the size of that chromosome and the authors' chromosome numbering, I'm guessing this is a manual merge (as it's larger than most of the chromosomes numerically close (40, 41, 43, etc). Further, staring closely at Figure 1, there appear to be cross-scaffold contacts between 42 and 43 and 42 and 44. Secondarily there are contacts between 43 and 44. This bit of the assembly seems potentially problematic.

    4. Reviewer #3 (Public review):

      Summary:

      In this study, authors Simone Rencken and co-authors present and investigate the genome of the common cuttlefish Sepia officinalis.

      Strengths:

      The authors explain in a detailed yet concise manner the main steps for a genome assembly, with very robust methods for validation, and according to current best practices. In addition to the chromosomal assembly, the authors confirmed the presence of 47 chromosomes using Hi-C data and multiple species synteny. They also generated a comprehensive gene annotation, with assessments of gene completeness, providing a useful resource for the community of researchers interested in cuttlefish biology and comparative genomics.

      Weaknesses:

      While the study touches upon the subjects of gene content, TE activity, or species-level comparisons, the study does not provide in-depth investigations of these.

    1. eLife Assessment

      This important study systematically investigates the effects of calnexin, an endoplasmic reticulum chaperone, on the drug response of approximately 230 disease-causing variants of the cystic fibrosis transmembrane conductance regulator (CFTR) protein. Through deep mutational scanning, interactome profiling, and functional assays, the findings provide convincing evidence that calnexin significantly influences both CFTR expression and the efficacy of corrector drugs in a variant-specific manner. These insights advance our understanding of how cellular quality control machinery shapes the pharmacological responsiveness of CFTR variants, which are broadly relevant for researchers in protein folding and genetic disease therapeutics.

    2. Reviewer #1 (Public review):

      Summary:

      This research investigates how the cellular protein quality control machinery influences the effectiveness of cystic fibrosis (CF) treatments across different genetic variants. CF is caused by mutations in the CFTR gene, with over 1,700 known disease-causing variants that primarily work through protein misfolding mechanisms. While corrector drugs like those in Trikafta therapy can stabilize some misfolded CFTR proteins, the reasons why certain variants respond to treatment while others don't remain unclear. The authors hypothesized that the cellular proteostasis network-the machinery that manages protein folding and quality control-plays a crucial role in determining drug responsiveness across different CFTR variants. The researchers focused on calnexin (CANX), a key chaperone protein that recognizes misfolded glycosylated proteins. Using CRISPR-Cas9 gene editing combined with deep mutational scanning, they systematically analyzed how CANX affects the expression and corrector drug response of 234 clinically relevant CF variants in HEK293 cells.

      In terms of findings, this study revealed that CANX is generally required for robust plasma membrane expression of CFTR proteins, and CANX disproportionately affects variants with mutations in the C-terminal domains of CFTR and modulates later stages of protein assembly. Without CANX, many variants that would normally respond to corrector drugs lose their therapeutic responsiveness. Furthermore, loss of CANX caused broad changes in how CF variants interact with other cellular proteins, though these effects were largely separate from changes in CFTR channel activity.

      This study has some limitations: the research was conducted in HEK293 cells rather than lung epithelial cells, which may not fully reflect the physiological context of CF. Additionally, the study only examined known disease-causing variants and used methodological approaches that could potentially introduce bias in the data analysis.

      How cellular quality control mechanisms influence the therapeutic landscape of genetic diseases is an emerging field. Overall, this work provides important cellular context for understanding CF mutation severity and suggests that the proteostasis network significantly shapes how different CFTR variants respond to corrector therapies. The findings could pave the way for more personalized CF treatments tailored to patients' specific genetic variants and cellular contexts.

      Strengths:

      (1) This work makes an important contribution to the field of variant effect prediction by advancing our understanding of how genetic variants impact protein function.

      (2) The study provides valuable cellular context for CFTR mutation severity, which may pave the way for improved CFTR therapies that are customized to patient-specific cellular contexts.

      (3) The research provides further insight into the biological mechanisms underlying approved CFTR therapies, enhancing our understanding of how these treatments work.

      (4) The authors conducted a comprehensive and quantitative analysis, and they made their raw and processed data as well as analysis scripts publicly available, enabling closer examination and validation by the broader scientific community.

      Weaknesses:

      (1) The study only considers known disease-causing variants, which limits the scope of findings and may miss important insights from variants of uncertain significance.

      (2) The cellular context of HEK293 cells is quite removed from lung epithelia, the primary tissue affected in cystic fibrosis, potentially limiting the clinical relevance of the findings.

      (3) Methodological choices, such as the expansion of sorted cell populations before genetic analysis, may introduce possible skew or bias in the data that could affect interpretation.

      (4) While the impact on surface trafficking is convincingly demonstrated, how cellular proteostasis affects CFTR function requires further study, likely within a lung-specific cellular context to be more clinically relevant.

    3. Reviewer #2 (Public review):

      In this work, the authors use deep mutational scanning (DMS) to examine the effect of the endogenous chaperone calnexin (CANX) on the plasma membrane expression (PME) and potential pharmacological stabilization cystic fibrosis disease variants. This is important because there are over 1,700 loss-of-function mutations that can lead to the disease Cystic Fibrosis (CF), and some of these variants can be pharmacologically rescued by small-molecule "correctors," which stabilize the CFTR protein and prevent its degradation. This study expands on previous work to specifically identify which mutations affect sensitivity to CFTR modulators, and further develops the work by examining the effect of a known CFTR interactor-CANX-on PME and corrector response.

      Overall, this approach provides a useful atlas of CF variants and their downstream effects, both at a basal level as well as in the context of a perturbed proteostasis. Knockout of CANX leads to an overall reduced plasma membrane expression of CFTR with CF variants located at the C-terminal domains of CFTR, which seem to be more affected than the others. This study then repeats their DMS approach, using PME as a readout, to probe the effect of either VX-445 or VX-455 + VX-661-which are two clinically relevant CFTR pharmacological modulators. I found this section particularly interesting for the community because the exact molecular features that confer drug resistance/sensitivity are not clear. When CANX is knocked out, cells that normally respond to VX-445 are no longer able to be rescued, and the DMS data show that these non-responders are CF variants that lie in the VX-445 binding site. Based on computational data, the authors speculate that NBD2 assembly is compromised, but that remains to be experimentally examined. Cells lacking CANX were also resistant to combinatorial treatment of VX-445 + VX-661, showing that these two correctors were unable to compensate for the lack of this critical chaperone.

      One major strength of this manuscript is the mass spectrometry data, in which 4 CF variants were profiled in parental and CANX KO cells. This analysis provides some explanatory power to the observation that the delF508 variant is resistant to correctors in CANX KO cells, which is because correctors were found not to affect protein degradation interactions in this context. Findings such as this provide potential insights into intriguing new hypothesis, such as whether addition of an additional proteostasis regulators, such as a proteosome inhibitor, would facilitate a successful rescue. Taken together, the data provided can be generative to researchers in the field and may be useful in rationalizing some of the observed phenotypes conferred by the various CF variants, as well as the impact of CANX on those effects.

      To complete their analysis of CF variants in CANX KO cells, the research also attempted to relate their data, primarily based on PME, to functional relevance. They observed that, although CANX KO results in a large reduction in PME (~30% reduction), changes in the actual activation of CFTR (and resultant quenching of their hYFP sensor) were "quite modest." This is an important experiment and caveat to the PME data presented above since changes in CFTR activity does not strictly require changes in PME. In addition, small molecule correctors also do not drastically alter CFTR function in the context of CANX KO. The authors reason that this difference is due to a sort of compensatory mechanism in which the functionally active CFTR molecules that are successfully assembled in an unbalanced proteostasis system (CANX KO) are more active than those that are assembled with the assistance of CANX. While I generally agree with this statement, it is not directly tested and would be challenging to actually test.

      The selected model for all the above experiments was HEK293T cells. The authors then demonstrate some of their major findings in Fischer rat thyroid cell monolayers. Specifically, cells lacking CANX are less sensitive to rescue by CFTR modulators than the WT. This highlights the importance of CANX in supporting the maturation of CFTR and the dependence of chemical correctors on the chaperone. Although this is demonstrated specifically for CANX in this manuscript, I imagine a more general claim can be made that chemical correctors depend on a functional/balanced proteostasis system, which is supported by the manuscript data. I am surprised by the discordance between HEK293T PME levels compared to the CTFR activity. The authors offer a reasonable explanation about the increase in specific activity of the mature CFTR protein following CANX loss.

      For the conclusions and claims relevant to CANX and CF variant surveying of PME/function, I find the manuscript to provide solid evidence to achieve this aim. The manuscript generates a rich portrait of the influence of CF mutations both in WT and CANX KO cells. While the focus of this study is a specific chaperone, CANX, this manuscript has the potential to impact many researchers in the broad field of proteostasis.

    1. eLife Assessment

      This valuable study presents computational analyses of over 5,000 predicted extant and ancestral nitrogenase structures. The data analyses are convincing, it offers unique insights into the relationship between structural evolution and environmental and biological phenotypes. The data generated in this study provide a vast resource that can serve as a starting point for studies of reconstructed and extant nitrogenases.

    2. Reviewer #1 (Public review):

      This was a clearly written manuscript that did an excellent job summarizing complex data. In this manuscript, Cuevas-Zuviría et al. use protein modeling to generate over 5,000 predicted structures of nitrogenase components, encompassing both extant and ancestral forms across different clades. The study highlights that key insertions define the various Nif groups. The authors also examined the structures of three ancestral nitrogenase variants that had been previously identified and experimentally tested. These ancestral forms were shown in earlier studies to exhibit reduced activity in Azotobacter vinelandii, a model diazotroph.

      This work provides a useful resource for studying nitrogenase evolution. However, its impact is somewhat limited due to a lack of evidence linking the observed structural differences to functional changes. For example, in the ancestral nitrogenase structures, only a small set of residues (lines 421-431) were identified as potentially affecting interactions between nitrogenase components. Why didn't the authors test whether reverting these residues to their extant counterparts could improve nitrogenase activity of the ancestral variants?

      Additionally, the paper feels somewhat disconnected. The predicted nitrogenase structures discussed in the first half of the manuscript were not well integrated with the findings from the ancestral structures. For instance, do the ancestral nitrogenase structures align with the predicted models? This comparison was never explicitly made and could have strengthened the study's conclusions.

      Comments on revisions:

      I appreciate the authors responding to my comments. I think Fig. S10 helps put the structural data into more context. It would be helpful to make clearer in the legend what proteins are being compared, especially in 10C.

      Although I can see why the authors focus on the NifK extension and its potential connection to oxygen protection, I would point out that Vnf and Anf do not have this extension in their K subunit, and you find both Vnf and Anf in aerobic and facultative anaerobic diazotrophs. This is a minor point, but I think it is important to mention in the discussion.

    3. Reviewer #2 (Public review):

      Summary:

      This work aims to study the evolution of nitrogenanses, understanding how their structure and function adapted to changes in environment, including oxygen levels and changes in metal availability.

      The study predicts > 3000 structures of nitrogenases, corresponding to extant, ancestral and alternative ancestral sequences. It is observed that structural variations in the nitrogenases correlate with phylogenetic relationships. The amount of data generated in this study represents a massive and admirable undertaking. The study also provides strong insight into how structural evolution correlates with environmental and biological phenotypes

    4. Author response:

      The following is the authors’ response to the original reviews.

      Reviewer #1 (Recommendations for the authors):

      Line 122: There were a number of qualitative descriptors in the paper. For instance, if the authors want to say massive campaign, how massive? How rapid? These are relative terms in this context.

      We have revised the text to minimize qualitative descriptors and to provide concrete numbers where possible. The revised sentence (line 121) now reads “We began our structural investigation of nitrogenase evolutionary history by conducting on a large-scale structure prediction analysis of 5378 protein structures, a more than threefold increase compared to available nitrogenase structures in the PDB. We then analyzed our phylogenetic dataset to identify notable structural changes.”

      Line 179: "massively scale up" How massive?

      We agree with the reviewer’s observation, in response, we have removed the phrase “massively scale up” and revised the text.

      Line 182: "no compromise on alignment depth and negligible cost to prediction accuracy". How do you know this? Is this shown somewhere? Was there a comparison between known structures and the predicted structure for those nitrogenases that have structures?

      In response to this comment, we have made several clarifications and revisions in the manuscript:

      We modified Figure S1, which now shows the pLDDT (per-residue confidence metric from Alphafold) values of all our predictions. These scores are consistently high (over 90 for the D and K subunits, and approximetly 90 for the H subunits) regardless of whether the recycling protocol or the bona-fide protocol was used.

      The reviewer’s comment demonstrated to us that the Figure S1 needed to more clearly representing these values, we therefore updated it accordingly.

      To prevent any misinterpretation of our claims about the accuracy and cost of the method , we have revised the text at line 179, as follows:

      “In total, 2,689 unique extant and ancestral nitrogenase variants were targeted. All structures were generated in approximately 805 hours, including GPU computations and MMseqs2 alignments performed using two different protocols: one for extant or most likely ancestral sequences, and another for ancestral variants.”

      To support our analyses further, Figure S10A compares our model predictions with available PDB structures for nitrogenases.

      Additionally, Figure S10B compare our predicted structures with the experimental structures reported in this article. In all cases, we observe low RMSD values.

      Line 220: "fall within 2 angstroms" instead of "fall 2A"?

      We have updated it in the text.

      Line 315: It is not clear how the binding affinities and other measurements in Figure 4 and S6C were measured, and it is not discussed in the material and methods.

      We thank the reviewer for pointing out this lack of clarity. The binding affinity estimations were performed using Prodigy. We have updated the main text (see line 322) to explicitly state that binding affinities were estimated using Prodigy. In addition, we have expanded the Materials and Methods section to include additional information about the structure characterization methods (lines 745-749). Previously, these details were only noted in Supplementary Table S6.

      Line 510-511: "Subtle, modular structural adjustments away from the active site were key to the evolution and persistence of nitrogenases over geologic time". This seems like a bit of an overstatement. While the authors see structural differences in the ancestral nitrogenase and speculate these differences could be involved in oxygen protection, there is no evidence that the ancestral nitrogenase is more sensitive to oxygen than the extant nitrogenase.

      We appreciate the reviewer’s comment. Our intention was to emphasize that subtle, modular structural adjustments might have contributed to oxygen protection rather than to assert that ancestral nitrogenases are more oxygen-sensitive than their extant counterparts. We have revised the text to clarify.

      Reviewer #2 (Recommendations for the authors):

      What is the reference for the measured RMSDs in Fig 2A? What is the value on the y-axis? The range of 'Count' is unclear, given that there are 5000 structures predicted in the study.

      Figure 2A presents a histogram of RMSD values from all pairwise alignments among 769 structures (385 extant and 384 ancestral DDKK), totaling 591,361 comparisons. We excluded ancestral DDKK variants due to computational limitations.  

      Similarly, what is the sequence identity in Figure 2B calculated relative to?

      In Figure 2B, sequence identities are derived from pairwise comparisons across all structures in our dataset. Each value represents the identity between two specific structures, rather than being measured against a single reference.

      The claim that 'structural analysis could reproduce sequence-based phylogenetic variation' should probably be tempered or qualified, given that the RMSD differences calculated are so low.

      We hope to have addressed the concerns about the low RMSD values in the previous comments. We have revised the text (line 204), which now reads: “it still strongly correlates with sequence identity (Figure 2B), indicating that even minor structural variations can recapitulate sequence-based phylogenetic distinctions.”

      How are binding affinities (Figure 4) calculated?

      We have now clarified the binding affinity calculations in the main text. The model used is now detailed at line 322, with additional information provided in the Methods section.

      Presumably, crystallized proteins (Anc1A, Anc1B, Anc2) were also among those whose structures were predicted with AF. A comparison should be provided of the predicted and crystallized structures, as this is an excellent opportunity to further comment on the reliability of AlphaFold.

      In the revised manuscript, Figure S10 now present structural comparisons between the crystallized proteins and their AlphaFold-predicted counterparts.

      The labels in Figure 5B are not clear. Are the 3rd and 4th panels also comparative RMSD values? But only one complex name is provided.

      We appreciate this feedback and now revised the Figure 5B for clarity.

      Page 9 line 220, missing word: 'varaints fall within/under 2angstroms'

      We thank the reviewer for the correction, we have updated the text.

    1. eLife Assessment

      The macromolecular organization of photosynthetic complexes within the thylakoids of higher plant chloroplasts has been a topic of significant debate. Using in situ cryo-electron tomography, this study reveals the native thylakoid architecture of spinach thylakoid membranes with single-molecule precision. The experimental methods are unique and compelling, providing important information for understanding the structural features that impact photosynthetic regulation in vascular plants and addressing several long-standing questions about the organization and regulation of photosynthesis.

    2. Reviewer #1 (Public review):

      Summary:

      In this study, the authors utilized in situ cryo-electron tomography (cryo-ET) to uncover the native thylakoid architecture of spinach chloroplasts and mapped the molecular organization of these thylakoids with single-molecule resolution. The obtained images show the detailed ultrastructural features of grana membranes and highlight interactions between thylakoids and plastoglobules. Interestingly, despite the distinct three-dimensional architecture of vascular plant thylakoids, their molecular organization closely resembles that of green algae. The pronounced lateral segregation of PSII and PSI was observed at the interface between appressed and non-appressed thylakoid regions, without evidence of a specialized grana margin zone where these complexes might intermix. Furthermore, unlike isolated thylakoid membranes, photosystem II (PSII) did not form a semi-crystalline array and was distributed uniformly within the membrane plane and across stacked grana membranes in intact chloroplasts. Based on the above observations, the authors propose a simplified two-domain model for the molecular organization of thylakoid membranes, which can be applied to both green algae and vascular plants. This study suggests that the general understanding of the functional separation of thylakoid membranes in vascular plants requires reconsideration.

      Strengths:

      By employing and refining AI-driven computational tools for the automated segmentation of membranes and identification of membrane proteins, this study successfully quantifies the spatial organization of photosynthetic complexes both within individual thylakoid membranes and across neighboring stacked membranes.

      Weaknesses:

      This study's weakness is that it requires the use of chloroplasts isolated from leaves and the need to freeze them on a grid for observation. However, the authors have correctly identified the limitations of this approach and have made some innovations, such as rapid sample preparation. The reliability of the interpretation of the results in light of previous results can be evaluated as high.

      Comments on revised version:

      The author has responded appropriately to the peer review comments and revised the paper.

    3. Reviewer #2 (Public review):

      Summary:

      For decades, the macromolecular organization of photosynthetic complexes within the thylakoids of higher plant chloroplasts has been a topic of significant debate. Using focused ion beam milling, cryo-electron tomography, and advanced AI-based image analysis, the authors compellingly demonstrate that the macromolecular organization in spinach thylakoids closely mirrors the patterns observed in their earlier research on Chlamydomonas reinhardtii. Their findings provide strong evidence challenging long-standing assumptions about the existence of a 'grana margin'-a region at the interface between grana and stroma lamellae domains that was thought to contain intermixed particles from both areas. Instead, the study establishes that this mixed zone is absent and reveals a distinct, well-defined boundary between the grana and stroma lamellae.

      Strengths:

      By situating high-resolution structural data within the broader cellular context, this work contributes valuable insights into the molecular mechanisms governing the spatial organization of photosynthetic complexes within thylakoid membranes.

      Comments on revised version:

      All reviewer comments have been fully addressed, and I have no further comments.

    1. eLife Assessment

      This manuscript provides valuable evidence comparing the performance of mathematical models and opinions from experts engaged in outbreak response in forecasting the spatial spread of an Ebola epidemic. The evidence supporting the conclusions is convincing. It will be of interest to disease modellers, infectious disease epidemiologists, policy-makers, and those who need to inform policy-makers during an outbreak.

    2. Reviewer #1 (Public review):

      Munday, Rosello, and colleagues compared predictions from a group of experts in epidemiology with predictions from two mathematical models on the question of how many Ebola cases would be reported in different geographical zones over the next month. Their study ran from November 2019 to March 2020 during the Ebola virus outbreak in Democratic Republic of the Congo. Their key result concerned predicted numbers of cases in a defined set of zones. They found that neither the ensemble of models nor the group of experts produced consistently better predictions. Similarly, neither model performed consistently better than the other, and no expert's predictions were consistently better than the others'. Experts were also able to specify other zones in which they expected to see cases in the next month. For this part of the analysis, experts consistently outperformed the models. In March, the final month of the analysis, the models' accuracy was lower than in other months, and consistently poorer than the experts' predictions.

      A strength of the analysis is use of consistent methodology to elicit predictions from experts during an outbreak that can be compared to observations, and that are comparable to predictions from the models. Results were elicited for a specified group of zones, and experts were also able to suggest other zones that were expected to have diagnosed cases. This likely replicates the type of advice being sought by policymakers during an outbreak.

      A potential weakness is that the authors included only two models in their ensemble. Ensembles of greater numbers of models might tend to produce better predictions. The authors do not address whether a greater number of models could outperform the experts.

      The elicitation was performed in four months near the end of the outbreak. The authors address some of the implications of this. A potential challenge for the transferability of this result is that the experts' understanding of local idiosyncrasies in transmission may have improved over the course of the outbreak. The model did not have this improvement over time. The comparison of models to experts may therefore not be applicable to early stages of an outbreak when expert opinions may be less well-tuned.

      This research has important implications for both researchers and policy-makers. Mathematical models produce clearly-described predictions that will later be compared to observed outcomes. When model predictions differ greatly from observations, this harms trust in the models, but alternative forms of prediction are seldom so clearly articulated or accurately assessed. If models are discredited without proper assessment of alternatives then we risk losing a valuable source of information that can help guide public health responses. From an academic perspective, this research can help to guide methods for combining expert opinion with model outputs, such as considering how experts can inform models' prior distributions and how model outputs can inform experts' opinions.

      Comments on revisions:

      I am grateful to the authors for their responses to my previous comments. I think their updates have made the paper much clearer. I do not think the updates change the opinions already given in the public review so I have not modified it.

    3. Reviewer #2 (Public review):

      The manuscript by Munday et al. presents real-time predictions of geographic spread during an Ebola epidemic in north-eastern DRC. Predictions were elicited from individual experts engaged in outbreak response and from two mathematical models. The authors found comparable performance between experts and models overall, although the models outperformed experts in a few dimensions.

      Both individual experts and mathematical models are commonly used to support outbreak response, but the relative strengths of each information source are rarely quantified. The manuscript presents an in-depth analysis of the accuracy and decision-relevance of the information provided by each source individually and in combination for a real-time outbreak response effort.

      While this paper presents an important and unique comparison, forecast performance is known to be inconsistent and unpredictable across many dimensions such as pathogen, location, forecasting target, and phase of the outbreak. Thus, as the authors note, continuing to replicate such studies will be important for verifying the robustness of their conclusions in other contexts.

      Comments on revisions:

      I have no further comments. I commend the authors for an interesting and important contribution.

    4. Author response:

      The following is the authors’ response to the original reviews.

      Reviewer #1 (Public review):

      Munday, Rosello, and colleagues compared predictions from a group of experts in epidemiology with predictions from two mathematical models on the question of how many Ebola cases would be reported in different geographical zones over the next month. Their study ran from November 2019 to March 2020 during the Ebola virus outbreak in the Democratic Republic of the Congo. Their key result concerned predicted numbers of cases in a defined set of zones. They found that neither the ensemble of models nor the group of experts produced consistently better predictions. Similarly, neither model performed consistently better than the other, and no expert's predictions were consistently better than the others. Experts were also able to specify other zones in which they expected to see cases in the next month. For this part of the analysis, experts consistently outperformed the models. In March, the final month of the analysis, the models' accuracy was lower than in other months and consistently poorer than the experts' predictions. 

      A strength of the analysis is the use of consistent methodology to elicit predictions from experts during an outbreak that can be compared to observations, and that are comparable to predictions from the models. Results were elicited for a specified group of zones, and experts were also able to suggest other zones that were expected to have diagnosed cases. This likely replicates the type of advice being sought by policymakers during an outbreak. 

      A potential weakness is that the authors included only two models in their ensemble. Ensembles of greater numbers of models might tend to produce better predictions. The authors do not address whether a greater number of models could outperform the experts. 

      The elicitation was performed in four months near the end of the outbreak. The authors address some of the implications of this. A potential challenge to the transferability of this result is that the experts' understanding of local idiosyncrasies in transmission may have improved over the course of the outbreak. The model did not have this improvement over time. The comparison of models to experts may therefore not be applicable to the early stages of an outbreak when expert opinions may be less welltuned. 

      This research has important implications for both researchers and policy-makers. Mathematical models produce clearly-described predictions that will later be compared to observed outcomes. When model predictions differ greatly from observations, this harms trust in the models, but alternative forms of prediction are seldom so clearly articulated or accurately assessed. If models are discredited without proper assessment of alternatives then we risk losing a valuable source of information that can help guide public health responses. From an academic perspective, this research can help to guide methods for combining expert opinion with model outputs, such as considering how experts can inform models' prior distributions and how model outputs can inform experts' opinions. 

      Reviewer #2 (Public review):

      Summary: 

      The manuscript by Munday et al. presents real-time predictions of geographic spread during an Ebola epidemic in north-eastern DRC. Predictions were elicited from individual experts engaged in outbreak response and from two mathematical models. The authors found comparable performance between experts and models overall, although the models outperformed experts in a few dimensions. 

      Strengths: 

      Both individual experts and mathematical models are commonly used to support outbreak response but rarely used together. The manuscript presents an in-depth analysis of the accuracy and decision-relevance of the information provided by each source individually and in combination. 

      Weaknesses: 

      A few minor methodological details are currently missing.

      We thank the reviewers for taking the time to consider our paper and for their positive reflections and suggestions for our study. We recognise and endorse their characterisation of the study in the public reviews and are greatful for their interest and support for this work. 

      Reviewer #1 (Recommendations For The Authors): 

      I initially found Table 1 difficult to interpret. In the final two columns, the rows relate to each other but in the other columns, rows within months don't relate to each other. Could this be made clearer? 

      Thank you for your helpful suggestion. We agree that this is a little confusing and have now added vertical dividers to the table to indicate which parts of the table relate to each other.

      In Figure 1A, the colours are the same as in the colour-bar for Figure 1B but don't have the same meaning. Could different colours be used or could Figure 1A have its own colour-bar to aid clarity? 

      Thank you for your query. The colours are not the same pallette, but we appreciate that they look very similar. To help the reader we have changed the colour palette of panel A and added a legend to the left.  

      In Figure 3, can labels for each expert be aligned horizontally, rather than moving above and below the timeline each month? 

      Thank you for your perspective on this. We made the concious dicision to desplay the experts in this way as it allows the timeline to be presented in a shorter horizontal space. We appreciate that others may prefer a different design, but we are happy with this one. 

      On lines 292 and 293, the authors state that experts were less confident that case numbers would cross higher thresholds. It seems that this would be inevitable given the number of cases is cumulative. Could this be clarified, please? 

      Thank you for raising this point. We agree that this wording is confusing. We have now reworked the entire section in response to another reviewer. The equivalent section now reads: 

      Experts correctly identified Mabalako as the highest-risk HZ in December. They attributed an average 82% probability of exceeding 2 cases; Mabalako reported 38 cases that month, exceeding all thresholds, although the probability assigned to exceeding the higher thresholds was similar to that of Beni (3 cases)

      Reviewer #2 (Recommendations For The Authors): 

      (1) Some methodological details seem to be missing. Most importantly, the results present multiple ensembles (experts, models, and both), but I can't seem to find anywhere in the Methods that details how these ensembles are calculated. Also, I think it would be useful to define the variables in each equation. It would have been easier to connect the equations to the description if the variables were cited explicitly in the text. 

      Thank you for pointing out these omissions. We have included the following paragraph to detail how ensemble forecasts were calculated. 

      “Enslemble forecasts

      Ensemble forecasts were calculated as an average of the probabilities attributed by the members of the ensemble. For the expert ensemble the arithmetic mean was calculated across all experts with equal weighting. Similarly the model ensemble used the unweighted mean of the model forecasts. For the mixed (model and expert) ensemble, the mean was weighted such that the combined weight of the experts forecasts and the combined weight of the models forecasts were equal.”

      (2) Overall, I think the results provide a strong analysis of model vs. expert performance. However, some sections were highly detailed (e.g., the text usually discusses results for every month and all health zones), which clouded my ability to see the salient points. For example, I found it difficult to follow all the details about expert/model predictions vs. observations in the "Expert panel and health zones..." subsection; instead, the graphical illustration of predictions vs. observations in Figure 4 was much easier to interpret. Perhaps some of these details could be trimmed or moved to the supplementary material. 

      Thank you for your honest feedback on this point. We have shortened this section to highlight the key points that we feel are the most important. We have also simplified the text where we discuss the health zones nominated by experts. 

      (3) Figure 5C is a nice visualization of the fallibility of relying on a single individual expert (or model). I wonder if it would be useful to summarize these results into the probability that a randomly selected expert outperforms a single model. Is it the case that a single expert is more unreliable than a single model? The discussion emphasizes the importance of ensembles and compares a single model to an ensemble of experts, but eliciting predictions from multiple experts may not always be possible. 

      Thank you for raising this. We agree that this is an important point that eliciting expert opinions is not a trivial task and should not be taken for granted. We agree with the principle of your suggestion that it would be useful to understand how the models compare to indevidual experts. We don’t however believe that an additional analysis would add sufficiently more information than already shown in Figure 5, which already displays the full distribution of indevidual experts for each month and threshold. If you would like to try this analysis yourself, the relevant data (the indevidual score for each combination of expert, threshold, heal zone and month) is included in the github repo (https://github.com/epiforecasts/Ebola-Expert-Elicitation/blob/main/outputs/indevidual_results_with_scores.csv).

      Minor comments: 

      (1) Figure 2: the color scales in each panel are meant to represent different places, correct? The figure might be easier to interpret if the colors used were different.  

      Thank you for bringing this to our attention. We have now changed the palette of panel A to differ from panel B.  

      (2) Equation 7: is o(c>c_thresh) meant to be the indicator function (i.e. 1 if c>c_thresh) and 0 otherwise)? 

      Thanks for raising this. The function o is the same as in the previous equation – an observation count function. We appreciate that this is not immediately clear so have added a sentence to explain the notation after the equation.

      (3) Table 1: a brief description of the column headers would be useful.  

      Thank you for the suggestion. We have now extended the table caption to include more description of the columns. 

      “Table 1: Experts and health zones included in each round of the survey. The left part of the table details the experts interviewed (highlighted in green) the health zones included in the main survey in each month. In addition, the right part of the table details the health zones nominated by experts and the number of experts that nominated each one.”

    1. eLife Assessment

      This important work substantially advances our understanding of the interaction among gut microbiota, lipid metabolism, and the host in type 2 diabetes. The evidence supporting the claims of the authors is convincing. The work will be of interest to medical biologists working on microbiota and diabetes.

    2. Reviewer #1 (Public review):

      Summary:

      The authors sought to identify the relationships between gut microbiota, lipid metabolites and the host in type 2 diabetes (T2DM) by using spontaneously developed T2DM in macaques, considered among the best human models.

      Strengths:

      The authors compared comprehensively the gut microbiota, plasma fatty acids between spontaneous T2DM and the control macaques, verifying the results with macaques in a high-fat diet-fed mice model.

      Comments on revisions:

      The authors responded to the comments raised, and the manuscript has been improved.

    1. eLife Assessment

      This is a valuable study that explores the role of the conserved transcription factor POU4-2 in the maintenance, regeneration, and function of planarian mechanosensory neurons. The authors provide solid evidence provided by gene expression and functional studies to demonstrate that POU4-2 is required for the maintenance and regeneration of functional mechanosensory neurons in planarians. Furthermore, the authors identify conserved genes associated with human auditory and rheosensory neurons as potential targets of this transcription factor.

    2. Reviewer #1 (Public review):

      Summary:

      In this manuscript, the authors explore the role of the conserved transcription factor POU4-2 in planarian maintenance and regeneration of mechanosensory neurons. The authors explore the role of this transcription factor and identify potential targets of this transcription factor. Importantly, many genes discovered in this work are deeply conserved, with roles in mechanosensation and hearing, indicating that planarians may be a useful model with which to study the roles of these key molecules. This work is important within the field of regenerative neurobiology, but also impactful for those studying the evolution of the machinery that is important for human hearing.

      Strengths:

      The paper is rigorous and thorough, with convincing support for the conclusions of the work.

      Weaknesses:

      Weaknesses are relatively minor and could be addressed with additional experiments or changes in writing.

    3. Reviewer #2 (Public review):

      Summary:

      In this manuscript, the authors investigate the role of the transcription factor Smed-pou4-2 in the maintenance, regeneration, and function of mechanosensory neurons in the freshwater planarian Schmidtea mediterranea. First, they characterize the expression of pou4-2 in mechanosensory neurons during both homeostasis and regeneration, and examine how its expression is affected by the knockdown of soxB1, 2, a previously identified transcription factor essential for the maintenance and regeneration of these neurons. Second, the authors assess whether pou4-2 is functionally required for the maintenance and regeneration of mechanosensory neurons.

      Strengths:

      The study provides some new insights into the regulatory role of pou4-2 in the differentiation, maintenance, and regeneration of ciliated mechanosensory neurons in planarians.

      Weaknesses:

      The overall scope is relatively limited. The manuscript lacks clear organization, and many of the conclusions would benefit from additional experiments and more rigorous quantification to enhance their strength and impact.

    4. Author response:

      (1) We will clarify statements comparing regeneration and developmental processes. Additionally, we will include a new supplemental figure with published data showing that the pou4-2 clone dd_Smed_v6_30562_0_1 (cross-referenced as SMED30002016) is expressed during stages corresponding to organ development in Schmidtea mediterranea (https://planosphere.stowers.org/feature/Schmidtea/mediterranea-sexual/transcript/SMED30002016).

      (2) We will reorganize the figures by combining Figures 3 and 4 for improved clarity.

      (3) We will address experimental and interpretive concerns regarding the role of atonal in the pou4-2 gene regulatory network.

    1. eLife Assessment

      This study offers useful findings demonstrating the cartilage-protective effects of osteoactivin in inflammatory experimental models. The study provides compelling evidence that osteoactivin may serve as a promising therapeutic target for inflammatory joint diseases.

    2. Reviewer #1 (Public review):

      Summary:

      While previous studies by this group and others have demonstrated the anti-inflammatory properties of osteoactivin, its specific role in cartilage homeostasis and disease pathogenesis remains unknown. Building on current knowledge, Asaad and colleagues investigated the functional role of this protein using both in vitro systems and an in vivo post-traumatic osteoarthritis model. In line with existing literature, the authors report that osteoactivin exerts inhibitory effects in these experimental settings. This study thus offers novel evidence supporting the cartilage-protective effects of osteoactivin in various experimental models.

      Strengths:

      Strengths of the study include its clinical relevance, given the lack of curative treatments for osteoarthritis, as well as the clarity of the narrative and the quality of most results.

      Weaknesses:

      A limitation of the study is the reliance on standard techniques; however, this is a minor concern that does not diminish the overall impact or significance of the work.

    3. Reviewer #2 (Public review):

      Summary:

      This manuscript presents compelling evidence for a novel anti-inflammatory function of glycoprotein non-metastatic melanoma protein B (GPNMB) in chondrocyte biology and osteoarthritis (OA) pathology. Through a combination of in vitro, ex vivo, and in vivo models, including the destabilization of the medial meniscus (DMM) surgery in mice, the authors demonstrate that GPNMB expression is upregulated in OA-affected cartilage and that recombinant GPNMB treatment reduces the expression of key catabolic markers (MMPs, Adamts-4, and IL-6) without impairing anabolic gene expression. Notably, DBA/2J mice lacking functional GPNMB exhibit exacerbated cartilage degradation post-injury. Mechanistically, GPNMB appears to mitigate inflammation via the MAPK/ERK pathway. Overall, the work is thorough, methodologically sound, and significantly advances our understanding of GPNMB as a protective modulator in osteoarthritic joint disease. The findings could open pathways for therapeutic development.

      Strengths:

      (1) Clear hypothesis addressing a well-defined knowledge gap.

      (2) Robust and multi-modal experimental design: includes human, mouse, cell-line, explant, and surgical OA models.

      (3) Elegant use of DBA/2J GPNMB-deficient mice to mimic endogenous loss-of-function.

      (4) Mechanistic insight provided through MAPK signaling analysis.

      (5) Statistical analysis appears rigorous, and figures are informative.

      Weaknesses:

      (1) Clarify the strain background of the DBA/2J GPNMB+ mice: While DBA/2J GPNMB+ is described as a control, it would help to explicitly state whether these are transgenically rescued mice or another background strain. Are they littermates, congenic, or a separate colony?

      (2) Provide exact sample sizes and variance in all figure legends: Some figures (e.g., Figure 2 panels) do not consistently mention how many replicates were used (biological vs. technical) for each experimental group. Standardizing this across all panels would improve reproducibility.

      (3) Expand on potential sex differences: The DMM model is applied only in male mice, which is noted in the methods. It would be helpful if the authors added 1-2 lines in the discussion acknowledging potential sex-based differences in OA progression and GPNMB function.

      (4) Visual clarity in schematic (Figure 7): The proposed mechanism is helpful, but the text within the schematic is somewhat dense and could be made more readable with spacing or enlarged font. Also, label the MAPK/ERK pathway explicitly in panel B.

    1. eLife Assessment

      This valuable study investigates the role of HIF1a signaling in epicardial activation and neonatal heart regeneration in mice. Through a combination of genetic and pharmacological approaches, the authors show that stabilization of HIF1a enhances epicardial activation and extends the regenerative capacity of the heart beyond the typical neonatal window following myocardial infarction (MI). However, several aspects of the study remain incomplete and would benefit from further clarification and additional experimental support to solidify the conclusions.

    2. Reviewer #1 (Public review):

      Summary:

      The manuscript by Gamen et al. analyzed the functional role of HIF signaling in the epicardium, providing evidence that stabilization of the hypoxia signaling pathway might contribute to neonatal heart regeneration. By generating different conditionally mouse mutants and performing pharmacological interventions, the authors demonstrate that stabilizing HIF signaling enhances cardiac regeneration after MI in P7 neonatal hearts.

      Strengths:

      The study presents convincing genetic and pharmacological approaches to the role of hypoxia signaling in enhancing the regenerative potential of the epicardium.

      Weaknesses:

      The major weakness is the lack of convincing evidence demonstrating the role of hypoxia signaling in EMT modulation in epicardial cells. Additionally, novel experimental approaches should be performed to allow for the translation of these findings to the clinical arena.

    3. Reviewer #2 (Public review):

      Summary:

      In this study, Gamen et al. investigated the roles of hypoxia and HIF1a signaling in regulating epicardial function during cardiac development and neonatal heart regeneration. They found that WT1⁺ epicardial cells become hypoxic and begin expressing HIF1a from mid-gestation onward. During development, epicardial HIF1a signaling regulates WT1 expression and promotes coronary vasculature formation. In the postnatal heart, genetic and pharmacological upregulation of HIF1a sustained epicardial activation and improved regenerative outcomes.

      Strengths:

      HIF1a signaling was manipulated in an epicardium-specific manner using appropriate genetic tools.

      Weaknesses:

      There appears to be a discrepancy between some of the conclusions and the provided histological data. Additionally, the study does not offer mechanistic insight into the functional recovery observed.

    4. Reviewer #3 (Public review):

      Summary:

      The authors' research here was to understand the role of hypoxia and hypoxia-induced transcription factor Hif-1a in the epicardium. The authors noted that hypoxia was prevalent in the embryonic heart, and this persisted into neonatal stages until postnatal day 7 (P7). Hypoxic regions in the heart were noted in the outer layer of the heart, and expression of Hif-1a coincided with the epicardial gene WT1. It has been documented that at P7, the mouse heart cannot regenerate after myocardial infarction, and the authors speculated that the change in epicardial hypoxic conditions could play a role in regeneration. The authors then used genetic and pharmacological tools to increase the activity of Hif genes in the heart and noted that there was a significant improvement in cardiac function when Hif-1a was active in the epicardium. The authors speculated that the presence of Hif-1a improved cell survival.

      Strengths:

      A focus on hypoxia and its effects on the epicardium in development and after myocardial infarction. This study outlines the potential to extend the regenerative time window in neonatal mammalian hearts.

      Weaknesses:

      While the observations of improved cardiac function are clear, the exact mechanism of how increased Hif-1a activity causes these effects is not completely revealed. The authors mention improved myocardium survival, but do not include studies to demonstrate this.

      There is an indication that fibrosis is decreased in hearts where Hif activity is prolonged, but there are no studies to link hypoxia and fibrosis.

    1. eLife Assessment

      This study introduces a useful method to estimate the probability that a malaria case is imported and to identify the geographic origin of parasites by using a Bayesian approach that integrates epidemiological, travel, and genetic data. The authors provide convincing evidence that the approach can reliably identify the main sources of malaria imports. This work will be of great interest to the area of genomic epidemiology and public health strategies aiming to eliminate malaria.

    2. Reviewer #1 (Public review):

      Summary:

      This study presents a new Bayesian approach to estimate importation probabilities of malaria, combining epidemiological data, travel history, and genetic data through pairwise IBD estimates. Importation is an important factor challenging malaria elimination, especially in low-transmission settings. This paper focuses on Magude and Matutuine, two districts in southern Mozambique with very low malaria transmission. The results show isolation-by-distance in Mozambique, with genetic relatedness decreasing with distances larger than 100 km, and no spatial correlation for distances between 10 and 100 km. But again, strong spatial correlation in distances smaller than 10 km. They report high genetic relatedness between Matutuine and Inhambane, higher than between Matutuine and Magude. Inhambane is the main source of importation in Matutuine, accounting for 63.5% of imported cases. Magude, on the other hand, shows smaller importation and travel rates than Matutuine, as it is a rural area with less mobility. Additionally, they report higher levels of importation and travel in the dry season, when transmission is lower. Also, no association with importation was found for occupation, sex, and other factors. These data have practical implications for public health strategies aiming for malaria elimination, for example, testing and treating travelers from Matutuine in the dry season.

      Strengths:

      The strength of this study lies in the combination of different sources of data - epidemiological, travel, and genetic data - to estimate importation probabilities, and the statistical analyses.

      Weaknesses:

      The authors recognize the limitations related to sample size and the biases of travel reports.

    3. Reviewer #2 (Public review):

      Summary:

      Based on a detailed dataset, the authors present a novel Bayesian approach to classify malaria cases as either imported or locally acquired.

      Strengths:

      The proposed Bayesian approach for case classification is simple, well justified, and allows the integration of parasite genomics, travel history, and epidemiological data. The work is well-written, very organized, and brings important contributions both to malaria control efforts in Mozambique and to the scientific community. Understanding the origin of cases is essential for designing more effective control measures and elimination strategies.

      Weakness:

      While the authors aim to classify cases as imported or locally acquired, the work lacks a quantification of the contribution of each case type to overall transmission.

      The Bayesian rationale is sound and well justified; however, the formulation appears to present an inconsistency that is replicated in both the main text and the Supplementary Material.

    4. Reviewer #3 (Public review):

      The authors present an important approach to identify imported P. falciparum malaria cases, combining genetic and epidemiological/travel data. This tool has the potential to be expanded to other contexts. The data was analyzed using convincing methods, including a novel statistical model; although some recognized limitations can be improved. This study will be of interest to researchers in public health and infectious diseases.

      Strengths:

      The study has several strengths, mainly the development of a novel Bayesian model that integrates genomic, epidemiological, and travel data to estimate importation probabilities. The results showed insights into malaria transmission dynamics, particularly identifying importation sources and differences in importation rates in Mozambique. Finally, the relevance of the findings is to suggest interventions focusing on the traveler population to help efforts for malaria elimination.

      Weaknesses:

      The study also has some limitations. The sample collection was not representative of some provinces, and not all samples had sufficient metadata for risk factor analysis, which can also be affected by travel recall bias. Additionally, the authors used a proxy for transmission intensity and assumed some conditions for the genetic variable when calculating the importation probability for specific scenarios. The weaknesses were assessed by the authors.

    1. eLife Assessment

      This study presents an important finding that ant nest structure and digging behavior depend on ant age demographics for a ground-dwelling ant species (Camponotus fellah). By asking whether ants employ age-polyethism in excavation, the authors address a long-standing question about how individuals in collectives determine the overall state of the task they must perform, and their results may prove to be a key consideration for interpreting results from other studies in the field of social insect behavior. The experimental evidence that the age of the ants and the group composition affect the digging of tunnels is solid, although some aspects of the modeling and certain analyses may benefit from further clarification regarding their added value to the core findings.

    2. Reviewer #1 (Public review):

      This study investigates how ant group demographics influence nest structures and group behaviors of Camponotus fellah ants, a ground-dwelling carpenter ant species (found locally in Israel) that build subterranean nest structures. Using a quasi-2D cell filled with artificial sand, the authors perform two complementary sets of experiments to try to link group behavior and nest structure: first, the authors place a mated queen and several pupae into their cell and observe the structures that emerge both before and after the pupae eclose (i.e., "colony maturation" experiments); second, the authors create small groups (of 5,10, or 15 ants, each including a queen) within a narrow age range (i.e., "fixed demographic" experiments) to explore the dependence of age on construction. Some of the fixed demographic instantiations included a manually induced catastrophic collapse event; the authors then compared emergency repair behavior to natural nest creation. Finally, the authors introduce a modified logistic growth model to describe the time-dependent nest area. The modification introduced parameters that allow for age-dependent behavior, and the authors use their fixed demographic experiments to set these parameters, and then apply the model to interpret the behavior of the colony maturation experiments. The main results of this paper are that for natural nest construction, nest areas, and morphologies depend on the age demographics of ants in the experiments: younger ants create larger nests and angled tunnels, while older ants tend to dig less and build predominantly vertical tunnels; in contrast, emergency response seems to elicit digging in ants of all ages to repair the nest.

      The experimental results are solid, providing new information and important insights into nest and colony growth in a social insect species. As presented, I still have some reservations about the model's contribution to a deeper understanding of the system. Additional context and explanation of the model, implications, and limitations would be helpful for readers.

    3. Reviewer #2 (Public review):

      I enjoyed this paper and its examination of the relationship between overall density and age polyethism to reduce the computational complexity required to match nest size with population. I had some questions about the requirement that growth is infinite in such a solution, but these have been addressed by the authors in the responses and the updated manuscript. I also enjoyed the discussion of whether collective behaviour is an appropriate framework in systems in which agents (or individuals) differ in the behavioural rules they employ, according to age, location, or information state. This is especially important in a system like social insects, typically held as a classic example of individual-as-subservient to whole, and therefore most likely to employ universal rules of behaviour. The current paper demonstrates a potentially continuous age-related change in target behaviour (excavation), and suggests an elegant and minimal solution to the requirement for building according to need in ants, avoiding the invocation of potentially complex cognitive mechanisms, or information states that all individuals must have access to in order to have an adaptive excavation output.

      The authors have addressed questions I had in the review process and the manuscript is now clear in its communication and conclusions.

      The modelling approach is compelling, also allowing extrapolation to other group sizes and even other species. This to me is the main strength of the paper, as the answer to the question of whether it is younger or older ants that primarily excavate nests could have been answered by an individual tracking approach (albeit there are practical limitations to this, especially in the observation nest setup, as the authors point out). The analysis of the tunnel structure is also an important piece of the puzzle, and I really like the overall study.

    4. Author response:

      The following is the authors’ response to the original reviews.

      Reviewer #1 (Public review):

      This study investigates how ant group demographics influence nest structures and group behaviors of Camponotus fellah ants, a ground-dwelling carpenter ant species (found locally in Israel) that build subterranean nest structures. Using a quasi-2D cell filled with artificial sand, the authors perform two complementary sets of experiments to try to link group behavior and nest structure: first, the authors place a mated queen and several pupae into their cell and observe the structures that emerge both before and after the pupae eclose (i.e., "colony maturation" experiments); second, the authors create small groups (of 5,10, or 15 ants, each including a queen) within a narrow age range (i.e., "fixed demographic" experiments) to explore the dependence of age on construction. Some of the fixed demographic instantiations included a manually induced catastrophic collapse event; the authors then compared emergency repair behavior to natural nest creation. Finally, the authors introduce a modified logistic growth model to describe the time-dependent nest area. The modification introduces parameters that allow for age-dependent behavior, and the authors use their fixed demographic experiments to set these parameters, and then apply the model to interpret the behavior of the colony maturation experiments. The main results of this paper are that for natural nest construction, nest areas, and morphologies depend on the age demographics of ants in the experiments: younger ants create larger nests and angled tunnels, while older ants tend to dig less and build predominantly vertical tunnels; in contrast, emergency response seems to elicit digging in ants of all ages to repair the nest.

      We sincerely thank Reviewer #1 for the time and effort dedicated to our manuscript's detailed review and assessment. The revision suggestions were constructive, and we have provided a point-by-point response to address them.

      Reviewer #2 (Public review):

      I enjoyed this paper and the approach to examining an accepted wisdom of ants determining overall density by employing age polyethism that would reduce the computational complexity required to match nest size with population (although I have some questions about the requirement that growth is infinite in such a solution). Moreover, the realization that models of collective behaviour may be inappropriate in many systems in which agents (or individuals) differ in the behavioural rules they employ, according to age, location, or information state. This is especially important in a system like social insects, typically held as a classic example of individual-as-subservient to whole, and therefore most likely to employ universal rules of behaviour. The current paper demonstrates a potentially continuous age-related change in target behaviour (excavation), and suggests an elegant and minimal solution to the requirement for building according to need in ants, avoiding the invocation of potentially complex cognitive mechanisms, or information states that all individuals must have access to in order to have an adaptive excavation output.

      We sincerely thank reviewer #2 for the time and effort dedicated to our manuscript's detailed review and assessment. We have provided a point-by-point response to the reviewer's comments, which we have incorporated into the revised version of the manuscript.

      The only real reservation I have is in the question of how this relationship could hold in properly mature colonies in which there is (presumably) a balance between the birth and death of older workers. Would the prediction be that the young ants still dig, or would there be a cessation of digging by young ants because the area is already sufficient? Another way of asking this is to ask whether the innate amount of digging that young ants do is in any way affected by the overall spatial size of the colony. If it is, then we are back to a problem of perfect information - how do the young ants know how big the overall colony is? Perhaps using density as a proxy? Alternatively, if the young ants do not modify their digging, wouldn't the colony become continuously larger? As a non-expert in social insects, I may be misunderstanding and it may be already addressed in the citations used.

      We thank the reviewer for this interesting question. We find that the nest excavation is predominantly performed by the younger ants in the nest, and the nest area increase is followed by an increase in the population. However, if the young ants dig unrestricted, this could result in unnecessary nest growth as suggested by reviewer #2. Therefore, we believe that the innate digging behavior of ants could potentially be regulated by various cues such as;

      (a) Density-based: If the colony becomes less dense as its area expands, this could serve as a feedback signal for young ants to reduce or stop digging, as described in references (25, 29, 30).

      (b) Pheromone depositions: If the colony reaches a certain population density, pheromone signals could inhibit further digging by young ants, references (25, 29), or space usage as a proxy for the nest area. 

      Thus, rather than perfect information, decentralized control, and digging-based local cues probably regulate the level of age-dependent digging, without the ants needing to estimate the overall colony size or nest area.

      In any case, this is an excellent paper. The modelling approach is excellent and compelling, also allowing extrapolation to other group sizes and even other species. This to me is the main strength of the paper, as the answer to the question of whether it is younger or older ants that primarily excavate nests could have been answered by an individual tracking approach (albeit there are practical limitations to this, especially in the observation nest setup, as the authors point out). The analysis of the tunnel structure is also an important piece of the puzzle, and I really like the overall study.

      We thank the reviewer for the comments. We completely agree that individual tracking of ants within our experimental setup would have been the ideal approach, but we were limited by technical and practical limitations of the setup, as pointed out by the reviewer, such as; 

      (a) Continuous tracking of ants in our nests would have required a camera to be positioned at all times in front of the nest, which necessitates a light background. Since Camponotus fellah ants are subterranean, we aimed to allow them to perform nest excavation in conditions as close to their natural dark environment as possible. Additionally, implementing such a system in front of each nest would have reduced the sample sizes for our treatments.

      (b) The experimental duration of our colony maturation and fixed demographics experiments extended for up to six months (unprecedented durations in these kinds of measurements). These naturally limited our ability to conduct individual tracking while maintaining the identity of each ant based on the current design.

      These details are described in detail within the revised version of the manuscript.

      Reviewer #3 (Public review):

      Summary:

      In this study, Harikrishnan Rajendran, Roi Weinberger, Ehud Fonio, and Ofer Feinerman measured the digging behaviours of queens and workers for the first 6 months of colony development, as well as groups of young or old ants. They also provide a quantitative model describing the digging behaviours and allowing predictions. They found that young ants dig more slanted tunnels, while older ants dig more vertically (straight down). This finding is important, as it describes a new form of age polyethism (a division of labour based on age). Age polyethism is described as a "yes or no" mechanism, where individuals perform or not a task according to their age (usually young individuals perform in-nest tasks, and older ones foraging). Here, the way of performing the task is modified, not only the propensity to carry it or not. This data therefore adds in an interesting way to the field of collective behaviours and division of labour.

      The conclusions of the paper are well supported by the data. Measurements of the same individuals over time would have strengthened the claims.

      We sincerely thank reviewer #3 for the time and effort dedicated to our manuscript's detailed review and assessment. We completely agree with the reviewer’s comments on the measurements of the same individuals over time, however, we were limited by the technical and experimental limitations as described above and pointed out by reviewer #2.

      Strengths:

      I find that the measure of behaviour through development is of great value, as those studies are usually done at a specific time point with mature colonies. The description of a behaviour that is modified with age is a notable finding in the world of social insects. The sample sizes are adequate and all the information clearly provided either in the methods or supplementary.

      We thank reviewer #3  for this assessment.

      Weaknesses:

      I think the paper is failing to take into consideration or at least discuss the role of inter-individual variabilities. Tasks have been known to be undertaken by only a few hyper-active individuals for example. Comments on the choice to use averages and the potential roles of variations between individuals are in my opinion lacking. Throughout the paper wording should be modified to refer to the group and not the individuals, as it was the collective digging that was measured. Another issue I had was the use of "mature colony" for colonies with very few individuals and only 6 months of age. Comments on the low number of workers used compared to natural mature colonies would be welcome.

      Regarding the main comment 1

      We completely agree with the reviewer’s comment on considering inter-individual variability based on activity levels. We have discussed how individual morphological variability could influence digging behavior (references: 28, 31), and we will elaborate further on this aspect in future revisions.

      Regarding the main comment 2:

      The term ‘colony maturation’ in our study refers to the progressive development of colonies from a single queen, distinguishing it from experiments that begin with pre-established, demographically stable colonies. We provide a detailed explanation for this terminology in the revised version of the manuscript. We were practically limited by the continuation of the experiments for more than 6 months of age, predominantly due to the stability of nests, as they were made with a sand-soil mix. We also acknowledge that the colony sizes attained in our maturation experiments may be smaller than those of naturally matured colonies. This trend was observed generally in lab-reared colonies and could be attributed to differences in microclimatic conditions, foraging opportunities, space availability, and other factors. We have explicitly described these details in the revised version of the manuscript.

      Reviewer #1 (Recommendations for the authors):

      The experimental design is fantastic. The large quasi-2D should allow for the direct visualization of the movements of individuals and the creation of the nest, and the inclusion of non-workers (specifically, a mated queen and pupae) is new and important. However, I have some questions and concerns about the results, as outlined below. Also, I found the paper difficult to read, and the connections between the various experiments and the model were not always clear. 

      We thank the reviewer for the time and effort dedicated to reviewing our manuscript. We have modified the manuscript substantially to address the comments and readability. 

      The assumption that the digging rate is constant across ants may be a strong one. Previous work (see, for instance, Aguilar, et al, Science 2018) has demonstrated a very heterogeneous workload distribution among ants. I am not sure what implications that may have for the results here, but the authors should comment on this choice. Related to the point above, given a constant digging rate, the variation in digging is attributed to an age-dependent "desired target area". Can the authors comment on the implications of this, specifically in contrast to a variable digging rate? The distinction between digging rate differences and target area differences seems to be important for the authors. However, the way this is presented, it is difficult to fully understand or appreciate this importance and its implications. What is the consequence of this difference, and why is this important?

      We apologize to the reviewer for the confusion.

      Our model does not assume that the digging rate (da/dt, Equation 1) remains constant throughout the experiment. Instead, we only treat the basal digging rate (r) as a constant.

      The variable digging rate (da/dt, Equation 1) is derived by multiplying the basal rate constant (r) by the term (1 - a/a<sub>age</sub>), which accounts for deviations from the age-dependent target area that the ants aim to achieve. This makes the actual digging rate dynamic, as it responds to changes in excavated area (e.g., expansion or rapid collapse)

      For example, according to our model (Equation 1), two ants with the same basal digging rate (r) may exhibit markedly different actual digging rates at a given time if they differ in age. This occurs because the variable digging rate (da/dt) depends not only on ‘r’ but also on the age-dependent term (1 - a/a<sub>age</sub>). Also, we emphasize that the use of a basal digging rate constant aligns with prior studies (refs. 24, 29, 30).

      In our work, we demonstrate that after a collapse event, ants of all ages dig at rates comparable to those observed in the initial (pre-collapse) phase of the experiment. This occurs because the ants are far from their age-dependent target area, effectively resetting their digging behavior. By comparing maximum digging rates pre- and post-collapse, we provide strong empirical evidence that this rate is age-independent (SI Fig. 6A, 6B), supporting the conclusion that the basal digging rate constant (r) is a fundamental property of the ants' behavior, unaffected by age.

      We agree with the reviewer that individual tracking of ants within our experimental setup would have been the ideal approach. Then, we could have taken the inter-individual variability of the digging activity into account. However, we were limited to doing so by the technical and practical limitations of the setup, such as; 

      (a) Continuous tracking of ants in our nests would have required a camera to be positioned at all times in front of the nest, which necessitates a light background. Since Camponotus fellah ants are subterranean, we aimed to allow them to perform nest excavation in conditions as close to their natural dark environment as possible. Additionally, implementing such a system in front of each nest would have reduced the sample sizes for our treatments.

      (b) The experimental duration of our colony maturation experiments extended for up to six months (unprecedented durations in these kinds of measurements). These naturally limited our ability to conduct individual tracking while maintaining the identity of each ant based on the current design.

      In light of these points, the following lines are added to the discussion (line numbers: 283-295), signifying the above points:

      “Our age-dependent model demonstrates that the digging behavior in Camponotus fellah is governed by a basal digging rate constant (r) modulated by the age-dependent feedback (1 − a/aage). Crucially, we show that after a collapse, the maximum digging rates return to their pre-collapse levels, suggesting that this basal rate ’r’ represents an age-independent ceiling on how fast ants can dig, regardless of age or context (SI Fig. 6 A, B). Previous studies have demonstrated both homogeneous and heterogeneous workload distribution, with varying digging rates among ants (24, 29, 30, 35). Studies showing heterogeneous workload distribution relied on continuous individual tracking of ants to quantify digging rates (35). However, this approach was not feasible in our current design due to the experimental durations of both our colony maturation and fixed demographics experiments. Additionally, sample size requirements naturally limited our ability to conduct continuous individual tracking during nest construction in our study. Thus, based on empirical measurements from our fixed-demographics experiments and supported by the age-independent post-collapse digging rates, we adopted a constant basal digging rate for simulating our age-dependent model—an assumption aligned with both prior literature and the collective dynamics observed in our system (24,29,30)”.

      Model: as presented, the model seems to lack independent validation. The model seems to have built-in that there is an age-dependent target area, and this is what is recovered from the model. I am failing to see what is learned from the model that the experiments do not already show. Also, the model has no ant interactions, though ants are eusocial and group size is known to have a large effect on behavior (this is acknowledged by the authors at the beginning of the discussion). Can the authors comment on this?My recommendation would be to remove the model from this paper or improve the text to address the above comments.

      We did not draw the conclusion of the age-dependent target area from our model. We used the fixed demographics experiments to quantify the age-dependent area target as a function of the age of individuals. We then used this age-dependent area target in our model to quantify the excavation dynamics of the colony maturation experiments, where ants span a variety of ages, as the nest population changes over time, resulting in natural variation in the ages of individuals within the nest.  These results could not have been obtained by performing any of the individual experiments, whether colony maturation or the fixed demographics, young or old, on their own. The need for different age demographics was crucial to quantify the age-dependent effects in nest excavation, which were lacking in previous studies. 

      First, the age-dependent model provides a very good estimate for the natural growth of the nest.  More importantly, after fixing an age threshold of 56 days (mean + standard deviation of the young ant age), the model provides an estimate of which ants are doing the majority of the digging during natural nest expansion. This teaches us that during natural expansion, the older ants are far from their density target and therefore do not engage in any substantial digging, which is shown in Figure 4. C. 

      On the other hand, the younger ants are close to their area targets and induced to dig. Indeed, the target area fitted for the age-independent model closely approximates the empirically measured age-dependent target when extrapolated to very young ants. This provides further support for the idea that, in the colony maturation experiments, the youngest ants are responsible for most of the digging.

      Our model is a simple analytical model, inspired by earlier models that used a fixed area target (such as density models) for nest construction. However, because we knew the precise age of workers in our experiments, we were able to obtain age-dependent area targets, thereby challenging the use of a constant area target (as employed in prior studies) in light of our findings from the fixed demographics of young and old colonies.

      Empirically Quantifiable Parameters: We wanted our model to have empirically quantifiable parameters. Since we did not continuously record the experiment, we could not quantify agent-agent interactions, pheromonal depositions, or similar factors.

      Minimal Model Design: We aimed to keep the model as minimal as possible, which is why we did not include complex interactions such as those found in continuous tracking experiments.

      However, the model does set up some interesting hypotheses that could easily be tested with the experimental setup (e.g., marking the ants / tracking individual activity levels). For instance, it is hypothesized that older ants dig less often, but when they do dig, they do so at the same rate. Given the 2D setup, the authors could track individual ants and test this hypothesis. Also, if the desired target area does decrease with age, the authors could verify this hypothesis by placing older ants into arenas with different-sized pre-formed nests to observe how structure is changed to achieve the desired area/ant.

      We thank the reviewer for this comment.

      We believe that the confusion with the usage of a constant basal digging rate is resolved now. To briefly reiterate, ants dig at variable rates that can be decomposed to a (constant on short time scales but age-dependent) basal rate times the (variable) distance from the density target. The suggested experiments are beyond the scope of our current study, and further studies could utilize the suggested experimental design with better time-resolved imaging for individual ant tracking that could verify the predictions from our model. 

      Specific comments:

      Title:

      The title suggests a broad result, yet the study focuses on one ant species. Please modify the title to more accurately reflect the scope of the work.

      We thank the reviewer for the comment.

      The title is modified as “Colony demographics shape nest construction in Camponotus fellah ants.”

      Introduction:

      Important information and context are missing about this ant species. For instance, please add the following about this species in the introduction:

      What is their natural habitat and substrate? How does the artificial soil compare?

      What is their (rough) colony size? [later, discuss experiment group size choice and potential insights/limitations of results when applied to the natural system].

      The details have been added to the introduction (line numbers : 49-55) and the materials and methods section (Study species).

      “Camponotus fellah ants are native to the Near East and North Africa, particularly found in countries like Israel, Egypt, and surrounding arid and semi-arid regions, where they prefer to nest in moist, decaying wood, including tree trunks, branches, or stumps (49,50). The species lives in monogynous colonies with tens to thousands of individuals. Nests are commonly found in a sand-loamy mix, which is a combination of sand, soil, clay, or gravel, providing structural stability and moisture retention (51). They are typically found under rocks, in the crevices of dried vegetation, or dry, sandy soils, sometimes in areas with loose gravel, with a colony size ranging from tens to thousands of workers”.

      What is the natural life expectancy of a worker? A queen? [later, discuss fixed demographic age choices in this context and/or why were age ranges chosen for experiments?].

      The lifespan of ants, including both queens and workers, varies significantly based on caste, species, and environmental conditions.

      (1) Queen Longevity: From the literature, Camponotus fellah queens can live up to 20 years, with one documented case reaching 26 years (50). 

      (2) Worker Longevity: In contrast to queens, the lifespan of workers is much shorter. Lab studies on Camponotus fellah (82) and other Camponotus species (83) suggest that workers can live for several months depending on environmental conditions, colony health, and caste-specific roles (e.g., minor vs. major workers)

      (3) Laboratory vs. Natural Conditions: Worker longevity is highly variable between laboratory and natural conditions

      Therefore, in the context of the old worker lifespan in our experiments, ~200 days (roughly 6–7 months), we strongly believe that the worker lifespan used in our experiments represents a substantial portion of a worker's expected life. While exact figures for C. fellah workers are unavailable, inferences from related species suggest that workers nearing 200 days are approaching the latter stages of their lifespan, making them meaningfully "old". 

      The details are added to the main text (line numbers: 124-127) and discussion (line numbers: 278-282).

      Why was this species chosen? Convenience, or is there something special about this species that the readers should know? Specifically, is there something that might make the results more general or of broader interest?

      Camponotus fellah was chosen for this study because it is native to Israel, making it convenient to collect and maintain in the lab. Additionally, its nuptial flights occur close to the study location, ensuring a steady supply of colonies. We were able to provide them with a nesting substrate similar to what they naturally use, as their nests are typically found in a sand-loamy mix, similar to the sand-soil mix in our artificial nests. This was possible because we had the opportunity to observe their habitat and nesting behavior in the wild, allowing us to gather preliminary information on their natural nesting conditions.

      Results:

      Line 60: "several brood items" - how many exactly? Was this consistent across experiments? Do mated queens ever produce more pupae during the experiments?

      Yes, the number of brood items (5) was added consistently across the experiments. Additionally, the mated queen did produce pupae during the course of the experiments, which was evident from the noticeable increase in the number of workers in the nest. This was significantly higher than the number of brood items present at the start of the study.

      The above points are added to the section (line numbers : 68-69).

      Figure 1: Panel A - The food ports are never mentioned in the text. Are the ants fed during the experiments? If so, what? With what frequency? Is the water column replenished/maintained? If so, how and how often? panel C - how long did this experiment last?

      We thank the reviewer for pointing this out. We have now updated the nest maintenance section in the Materials and Methods (line numbers : 349-354) part to include all the necessary details and clarifications.

      “We provided food to the ants ad libitum through three separate tubes containing water, 20 % sucrose water, and protein food. The protein mixture included egg powder, tuna, prawns, honey, agar, and vitamins. Each of the three tubes was filled with 5 ml of their respective contents and sealed with a cotton stopper to prevent overflow. The tubes were positioned at a slight angle and connected using a custom-made plexiglass adapter to facilitate the flow of liquids. These tubes were replenished once depleted, and regularly replaced once the nest maintenance was carried out bi-weekly.”

      Line 76: "...excavation was commenced by the founding queen". How were the queen and pupae introduced into the system?

      We initiated colony maturation experiments by introducing a single mated queen and several brood items (pupae) at random positions on the soil layer of the nest (line numbers : 68-69)

      Line 87: Please provide bounds for 11cm2/ant value. Is there any biological or physical justification for this number?

      We thank the reviewer for the suggestion. We have now provided the bounds as requested (line numbers : 97-101). 

      We were unable to pinpoint a specific biological justification based solely on this treatment. However, on extrapolating the age-dependent area fit we derived from the fixed demographics experiment, we found that at the age of 1 day, an ant has a target area of approximately 11.17 cm², which is the largest age-dependent area target possible within our experimental setup.

      From the colony maturation experiment, we obtained the value of  11.6 (±1.15) cm² as the area per ant. The consistency between the area per ant obtained from two completely different treatments across different colonies yielded similar results. We propose that under standardized conditions, a 1-day-old ant has a theoretical maximum target area of 11.17 cm²—the highest value observed in our experimental framework.

      Lines 98-99: "one straightforward possibility would be that newborn ants are the ones that dig". This statement contradicts the results presented in Figures 1 and S1 - the population increase seems to occur at least a few days before increased excavation in nearly all cases.

      We apologize for any confusion caused by our initial phrasing. To clarify, we proposed that a lag likely exists between population growth and nest area expansion. This lag could arise from two sequential processes: (1) newborn ants require time to mature and become active (first delay), and (2) digging to expand the nest takes additional time (second delay; estimated at ~10 days from the cross-correlation analysis). Thus, our results suggest that it is not the population that lags behind the area, but rather the area that lags behind the population, as demonstrated in Figures 2D and SI. Figure. S1.

      The sentence “one straightforward possibility would be that newborn ants are the ones that dig” is modified as below (line numbers : 112-119) to prevent further confusion.

      “One possible explanation is that, although all ants are capable of digging, it is primarily the newly emerged ants who perform this task. In this case, nest expansion would lag behind colony growth due to two delays: first, the time needed for young ants to mature enough to begin digging, and second, the physical time required to excavate additional space (e.g., around 10 days). This mechanism could eliminate the need for ants to assess overall colony density, as each new group of active workers simply enlarges the nest as they become ready. An alternative possibility is that all ants, regardless of age, respond to increased density by initiating excavation. In that scenario, nest expansion would follow more immediately after the emergence of new individuals, making delays less prominent (24, 29, 30)”.

      Line 105: How do group sizes compare to natural colony size? Line 106: How do "young" and "old" classifications compare to natural life expectancy?

      We have already addressed this question in an earlier comment. The details are added to the main text (line numbers: 124-127) and discussion (line numbers: 278-282).

      Line 118-119: How are nests artificially collapsed?

      We have added a new section in the Materials and Methods section that describes the nest collapsing procedure (Nest artificial collapse - line numbers : 386-399).

      Figure 2 Panel A: The white dotted line is nearly impossible to see. Please use a more visible color.

      We thank the reviewer for the comment.

      We changed the solid circles to violet and the dotted line color to continuous white.

      Figure 3: The use of circle markers as post-collapse recovery in young and old as well as old pre-collapse is confusing. Use different symbols for old pre-collapse vs young and old post-collapse.

      We thank the reviewer for pointing out the confusion. We have revised the figure markers as suggested and modified the main text accordingly.

      • Young; pre-collapse : star

      • Young; post-collapse : diamond

      • Old; pre-collapse : circle

      • Old; post-collapse: triangle.

      Figure 3 Panel C: Indicate that fixed demographic values here are pre-collapse. Also, as presented, it appears that there is a large group-size dependence that is not commented on. Previous results (Line 87 and Figure 2C) suggest a constant excavation area per ant of 11cm2/ant. Figure 3, panel C appears to suggest a group-size dependence. If these values are divided by group size, is excavated area per ant nearly constant across groups? How does the numerical value compare to the slope from Figure 2C?

      We thank the reviewer for their insightful comments.

      First, we would like to clarify that the area target of 11.1 (±1) cm²/ant, as described in Line 87, was obtained from the colony maturation experiments. In these experiments, we were unable to track the age of each individual ant, so the area target was calculated by normalizing the total excavated area by the number of ants.

      We normalized the excavated area by the group size for both young and old colonies as suggested, and found that the area per ant was not significantly different across the group sizes (see new SI Fig. 5A). This indicates that the excavated area per ant remains relatively constant within each demographic group. Moreover, this shows that the total excavated area is proportional to group size, in agreement with previous works (24, 29, and 30). 

      We have explicitly described the above information in the line numbers: 142-146

      Regarding the slope comparisons, the slope of Figure 2C (10.71), from the colony maturation experiments, is the largest, followed by the area per ant from the short-term young (8.79 ± 0.98) cm²/ant, and short-term old experiments (5.16 ± 0.44) cm²/ant.

      Lines 128-129: "...younger ants aim to approach a higher target area". Seems hard to know what they "aim" to do... rephrase to report what they are observed to do.

      We thank the reviewer for the comment. The sentence is rephrased as suggested (line numbers : 158-161).

      “In the previous sections, we showed that in fixed-demographics experiments, younger ants excavated a significantly larger nest area compared to older ants (Fig. 3. C).  This difference emerged despite similar temporal patterns in digging rates across age groups, with excavation activity peaking within the first 7 days before asymptotically decaying as nest expansion approached saturation (SI Fig. 8).”

      Lines 133-141: The model description is not clear. Specifically, what parameters are ant-dependent? How does A relate to a?

      We appreciate the reviewer's request for clarification. In our model:

      (1) Equation 1 describes the change in the excavated area due to the digging activity of a single ant. Here, the variable 'a' represents the area excavated by one ant. This formulation allows us to capture the individual digging behavior and its impact on the excavation process.

      (2) Equation 2 extends this concept to the total area excavated in the nest, denoted by 'A'. Specifically, 'A' is the sum of the areas excavated by all ants present in the nest. In other words, it aggregates the individual contributions of each ant, linking the microscopic digging behavior to the macroscopic excavation dynamics.

      Therefore, the relationship between 'a' and 'A' is as follows:

      ●     'a' = Area excavated by a single ant.

      ●     'A' = ∑ 'a' (Summed over all ants in the nest).

      We have explicitly mentioned this in the line numbers “ 161-179”, and describe the model assumptions and parameters in detail.

      Figure 4:

      Figure 4, Panel A: The equation quoted in the caption does not match the data in the figure. The equation has a positive slope and negative intercept, while the figure has a negative slope and a positive intercept. Please provide the correct equation and bounds on fit parameters.

      We thank the reviewer for spotting this typing mistake.

      The equation was already updated in the reviewed preprint published online. The correct equation and the fit bound are provided in the figure caption.

      “Target areas decrease linearly with the ant age (y = −0.032x + 11.22 , 95 % CI (Intercept : (-0.035,-0.027), Slope : (10.53,11.91)), R2 = 0.96 ).”

      Figure 4, Panel A: There seem to be three "fixed target area per ant values" in the paper: around 11cm2/ant (line 87), 11.6 cm2/ant (SI Figure 2), and linearly dependent value from fit to Figure 4A. The distinctions between these values and their significance are hard to keep track of. Can the authors add a discussion somewhere that helps the reader better understand? Is there a way to connect/rationalize/explain these different values in terms of demographics?

      We thank the reviewer for the suggestion.We have added a paragraph in the discussion (line numbers : 270-277) describing the area targets.

      “In our colony maturation experiments, we found that area per ant was highest when the workers were youngest, with values around 11.1–11.6 (±1–1.15). This aligns with observations from naturally growing nests, where newly eclosed ants dominate the population and nest volumes are relatively large. Supporting this, fixed-demographics experiments showed that the area excavated per ant declines linearly with worker age, indicating that the youngest ants contribute most to excavation. Notably, the target area we fit for the age-independent model (11.6 ± 1.15) closely matches the extrapolated value for very young workers (Fig. 4. A), reinforcing the idea that young ants are the primary excavators during early colony growth. In contrast, during events like collapses or displacement, when space is urgently needed, ants of all ages participate in excavation.”

      Figure 4, Panel A: What are various symbols and colors for data with error bars? If consistent with Figure 3, then this panel and subsequent model confound two factors: (1) the age dependence and (2) the behavioral differences pre- and post-collapse (structures are different pre-and post-collapse, according to SI Figure 6; line 120: "...colonies ceased digging when they recovered 93{plus minus}3% of the area lost by the manual collapse..."; lines 201-202: "We find significant quantitative and qualitative differences between nests constructed within this natural context and nests constructed in the context of an emergency") and behavior is different (according to SI Figure 7 and line 119: "...all ants dig after collapse...")). Therefore, without further supporting evidence, it does not seem that these data should be used to fit a single line that defines a model parameter a_age for each ant in equation 2.

      The symbols are the area per ant quantified from the fixed demographics of young, and old experiments. The symbols show the following;

      A.  Star - Young, pre-collapse

      B.  Diamond - Young, post-collapse 

      C.  Circle - Old, pre-collapse

      D.  Triangle - Old, post-collapse.

      The details are clearly described in the figure caption. 

      We apologize to the reviewer for the confusion. We argue that the data can be fit by a single line to quantify the parameter ‘a_age’ as follows. 

      A. All data presented in Figure 4A were obtained from the same fixed-demographics experiments (containing only young and old ants) under experimental collapse conditions, pre- and post-collapse. These results, therefore, exclusively reflect emergency nest-building behaviors during emergency scenarios and do not include any observations from natural colony maturation processes.

      B. Age-dependent excavation differences: As correctly noted by the reviewer, the observed difference in excavated area before versus after collapse reflects the natural aging of ants in our experimental colonies. While colonies recovered >90% of lost area post-collapse, the residual variation was not negligible—instead, it systematically correlated with colony age structure. By tracking colonies across this demographic transition, we obtained additional data points spanning a broader developmental spectrum. This extended range strengthened our ability to detect and quantify the linear relationship between worker age and excavation output.

      C.The quoted sentence (lines 201-202, submitted version) refers to comparisons across all three experimental cases: (1) fixed-demographics young ants, (2) fixed-demographics old ants, and (3) the natural scenario (mixed-age colonies). Importantly, these comparisons are based on pre-collapse steady-state excavation areas, ensuring a consistent baseline across treatments. We highlight quantitative and qualitative differences between these distinct experimental groups, not between pre- and post-collapse phases within the same treatment. The pre- and post-collapse data within fixed-demographics groups were analyzed separately to avoid conflating aging effects with emergency responses.

      To avoid confusion, the whole paragraph in the discussion (line numbers : 253-260) is rephrased.

      In lines 201-202; “We find significant quantitative and qualitative differences between nests constructed within this natural context and nests constructed in the context of an emergency”. 

      Here, by natural context, we mean the nests excavated in the colony maturation experiments. We believe that it could have been confusing, and the sentence is modified as answered for the previous question. 

      Figure 4, Panel B: This uses the model with a_age determined by from Figure 4A and the life table (as shown in the supplemental), whereas the supplemental Figure SI 8 uses the fixed blue line a_age value for the model, which comes from the colony maturation experiments. The age-independent model in the supplemental fits the data better, yet the authors claim the supplemental model cannot be applied to the data because of their experimentally determined age-dependent target area. Given the age-independent target area model fits better, additional evidence/justification is needed to support the choice of the model.

      We agree with the reviewer that the age-independent model fits the data well. However, we believe that the fixed area target cannot be used to explain the excavation dynamics for the following reasons.

      We make an important assumption in our model: that the ants rely on local cues and that individual ants can not distinguish between the fixed demographics and colony maturation experiments (line numbers : 161-166). Given this assumption, the ants cannot change their behavior between experiments, meaning the same model should fit all of our results. However, the fixed demographics experiments revealed a significant difference in the areas excavated by young vs. old cohorts, despite having the same group size. If the ants regulated the excavated area based on an age-independent constant density target model, then the excavated area in the fixed demographics of young and old colonies would have been similar. This discrepancy indicates that the target area per ant is not constant, as assumed in the age-independent density model (SI. Fig. 8). We emphasize that while the age-independent model provides a better fit for the excavated area in colony maturation experiments, the age-dependence of excavation is empirically supported by fixed-demographics experiments. Therefore, we implemented this age-dependence through a variable target area within the age-dependent model framework to explain excavation dynamics in the colony maturation experiments.

      These details are explicitly mentioned in the main text (line numbers : 187 - 198)

      Figure 4, Panel C: Is this plot entirely from the model, or are the data points measured from experiments? Please label this more clearly.

      We apologize to the reviewer for the confusion.

      The Figure 4C is based on the age-dependent digging model. We applied the model to population data from the long-term experiments (n = 22). By setting an age threshold of 56 days (since ants used in the short-term young experiment had an average age of 40 ± 16 days), we categorized the ants into young and old groups. We then quantified the area dug by the young ants, the queen, and the old ants in terms of the percentage of the total area excavated. We hypothesized that, because young ants have a lower digging threshold, they would perform the majority of the digging. We indeed confirm this in Figure 4C.

      This information is added to the main text and described in detail (line numbers: 200 - 208).

      Lines 162-165: "...Furthermore, we quantified the area dug by each ant in the normal colony growth experiment as estimated from the age-dependent model and found that all ants excavated more or less the same amount...". Figure 4D shows a distribution with significant values ranges from 1-16 cm2... how is this interpreted as "more or less the same amount" and what is the significance of this?

      We apologise to the reviewer for the confusion.

      We quantified the percentage contribution to the excavated area of each histogram bin (provided in the new SI table: 4), and found that the area excavated between 5 cm² and 13 cm² accounts for 73.76% of the total excavated area. This indicates that most ants dug within this range rather than exhibiting extreme variations. Additionally, the mean excavation amount is 7.84 cm², with a standard deviation of 3.44 cm², meaning that most values fall between 4.4 cm² and 11.28 cm², which aligns well with the 5–13 cm² range. Since the majority of the excavation is concentrated within this narrow interval, and the mean is well centered within it, this suggests that ants excavated more or less the same amount, rather than forming distinct groups with highly different excavation behaviors.

      We have modified the main text (line numbers: 209-216) to include these points.

      The biological significance of this finding is that since all ants in the colony maturation experiments are born inside the nest, we hypothesize that they should excavate similar amounts. To test this, we quantified the area contribution of each ant over the entire duration of the experiment using the age-dependent digging model as described above and found that they indeed excavated more or less the same amount. From our analysis of fixed demographics experiments, we showed that the youngest ants excavate the largest area. Since the majority of the youngest ants participated in the colony maturation experiments, this further supports our hypothesis.

      Figure 5.

      Figure 5, Panels A-C: Please provide a scale bar. 

      The scale bar is provided in the figure as suggested. The algorithm for the cutoffs for tunnel vs wide tunnels is described in detail in the section “Nest skeletonization, segmentation, and orientation.”

      Figure 5, Panel E: Why does the chamber error bar for 5 ants go to zero?

      In Figure 5, E, we plot the standard error, as described in the figure caption. In the experiments, the chamber area contributions were (0,0,39.94,0) respectively. The mean of the 4 numbers is 9.985, the standard deviation is 19.97, and the standard error is 9.985. So, the mean and the standard error are the same, so the lower error bar goes to zero, and the upper error bar goes to 19.97. This implies that in these experiments, the chamber area is often zero.

      Figure 5, Panel I: Why are there no chambers for young colonies in I when they are in the histogram in E?

      We apologize to the reviewer for the confusion. We initially missed adding the chamber orientation data of the young colonies to Panel I, but it has now been included.

      Line 212: "...densities of ants never become too high...". What is too high? Is there some connection to biological or physical constraints?

      Under normal growth conditions, nest volume is kept proportional to the number of ants, ensuring that the density remains within a specific range. This prevents overcrowding, which could otherwise lead to excessively high densities.

      Yes, we believe there is likely a connection to both biological and physical constraints. The proportional relationship between nest volume and the number of ants is likely driven by factors such as:

      (1) Biological Constraints:

      Ant Colony Size: Ants typically adjust their behavior and social structure to maintain an optimal population size relative to available resources and space.Overcrowding could lead to potentially a breakdown in colony function.

      Colony Health: High densities can lead to faster epidemic spread, leading to negative effects on reproduction, foraging efficiency, and overall colony health. By maintaining density within a specific range, the colony can thrive without these adverse effects.

      (2) Physical Constraints:

      Spatial Limitations: The physical space within the nest limits how many ants can occupy it before space becomes constrained. The nest’s structure and size must physically accommodate the ants, and the volume must be large enough to prevent overcrowding, and efficient resource distribution.

      Lines 272 and 302: How often were photos taken? These two statements seem to suggest different data collection rates.

      As stated in line 272, photos were taken every 1 to 3 days. During each photo session, four photos were taken, with each photo separated by 2 seconds, as mentioned in line 302. To avoid confusion, we rephrased the sentence (line numbers: 359-361).

      “We photographed the nest development every 1-3 days. During each photography session, four pictures of the nest were taken, with a 2-second interval between each.”

      Reviewer #2 (Recommendations for the authors):

      Some more minor points/questions/clarifications:

      This might be pedantic, but I don't think the nest serves as the skeleton of the superorganism, while it does change and grow, the analogy becomes weak beyond that point. The skeleton serves to protect the internal organs of the organism, facilitates movement and muscle attachment, and creates new blood cells. I would be more comfortable with a statement that the nest can grow or shrink according to need.

      We sincerely thank the reviewer for their time and effort in providing a detailed review and assessment of our manuscript. A point-by-point response to the comments is provided below.

      The analogy of treating a nest structure to the skeleton of a superorganism was based on the following points;

      (a) Protection: A nest protects the colony on a collective scale. This is analogous to protecting "organs" by a skeletal framework.

      (b) Organization and Division of Space: The skeletal structure organizes the body's internal layout, just as nest structures are organized into various spatial compartments for various colony functions, with specific regions designated for brood chambers, food storage, and waste disposal.

      Thus, we believe that the analogy can still be valid in a metaphorical way.

      Does this statement need justification with a citation, or is that information contained in the subsequent clause? "However, for more complex structures where ants congregate in specific chambers, workers are less likely to assess the overall nest density." The idea that workers do (or do not) assess overall density touches on many issues, including that of perfect information and adaptive responses, that it seems it needs to be well founded in previous work to be stated in such unequivocal terms.

      We thank the reviewer for this comment. The references for this argument are provided in the next sentence. We have now moved these references to the relevant sentence (reference number: 24, 29,30; line number : 30-31 ) 

      Can you give some more information on this statement? "Experiments were terminated either when the queen died or when she became irreversibly trapped after a structural collapse." Why was this collapse irreversible and therefore unlike treatment 2? Did the queen die in these instances? Was this event more likely than in natural colonies? And if so, was there something inherently different about your experiments that limit interpretation under natural conditions (e.g. the narrow nature of the observation setup? The consistency of the sand?)

      Our nest excavation experiments were terminated under two primary scenarios: (1) the queen died of natural causes, reflecting the baseline mortality expected when queens are brought into laboratory conditions, or (2) the nest experienced a structural collapse that left the queen irreversibly trapped. The second scenario is further elaborated below:

      Irreversible Collapses: These collapses were classified as irreversible because the queen could not be rescued alive. This occurred when the structural stability of the nest failed, burying the queen in a manner that prevented recovery. In some cases, the collapse resulted in the queen's immediate death, while in others, she was trapped beyond reach, and any rescue attempt risked further structural damage.

      Collapse and Experimental Context: These collapses were not uniquely associated with natural colonies or fixed-demographic experiments; rather, they occurred across various experimental setups.

      The sentence is modified as below to improve clarity (line numbers : 70-72 ).

      “In all instances where a collapse resulted in the queen's death or her being irreversibly trapped in the nest, the experiment was excluded from analysis starting from the point of the collapse, as such events did not reflect normal colony dynamics.”

      I want to make sure I understand the following statement: "Moreover, the area excavated by the young cohorts was similar to that excavated by naturally maturing colonies at the point in which they reached the same population size (Tukey's HSD; group size: 5; p = 0.61, group size: 10; p = 0.46, group size: 15; p = 0.20)." Do I have it right that this means a group of (e.g. 10) young ants excavates an area similar to that of a group of 10 naturally maturing ants at the same age as the young ants?

      Yes, the interpretation provided is correct. We apologize to the reviewer for the confusion. We have rephrased the sentence for better readability (line numbers : 146-148).

      “Furthermore, the area excavated by the young cohorts was comparable to that excavated by naturally maturing colonies when they reached the same population size (Tukey's HSD; group size: 5, p = 0.61; group size: 10, p = 0.46; group size: 15, p = 0.20)”

      How old do ants get? Is the 'old' demographic (~200 days) meaningfully old in the context of the overall worker lifespan? While the results certainly demonstrate there is an age effect, I would like to understand how rapid this is in terms of overall lifespan.

      The lifespan of ants, including both queens and workers, varies significantly based on caste, species, and environmental conditions.

      (1) Queen Longevity: From the literature, Camponotus fellah queens can live up to 20 years, with one documented case reaching 26 years. This remarkable longevity underscores the queen's central role in maintaining the colony.

      (2) Worker Longevity: In contrast to queens, the lifespan of workers is much shorter.

      However, specific data on worker longevity in Camponotus fellah colonies are lacking. Studies on other Camponotus species (50, 82) suggest that workers can live for several months depending on environmental conditions, colony health, and caste-specific roles (e.g., minor vs. major workers).

      (3) Laboratory vs. Natural Conditions: Worker longevity is highly variable between laboratory and natural conditions

      Therefore, in the context of the old worker lifespan in our experiments of, ~200 days (roughly 6–7 months) we strongly believe that the worker lifespan used in our experiments represents a substantial portion of a worker's expected life. While exact figures for C. fellah workers are unavailable, inferences from related species suggest that workers nearing 200 days are approaching the latter stages of their lifespan, making them meaningfully "old."

      These details are added to the main text (line numbers : 124 - 127) and to the discussion (line numbers : 278-282)

      Reviewer #3 (Recommendations for the authors):

      We sincerely thank the reviewer for their time and effort in providing a detailed review and assessment of our manuscript. A point-by-point response to the comments is provided below.

      L10: "fixed demographics": I find this term unclear, what does it mean, it should specify if the groups are with or without a queen.

      We thank the reviewer for the comment. The sentence is modified in the abstract, and definitions are later added in detail in the introduction (line numbers : 8-10) and the Materials and Methods section (Fixed demographics colonies). 

      “We experimentally compared nest excavation in colonies seeded from a single mated queen and allowed to grow for six months to excavation triggered by a catastrophic event in colonies with fixed demographics, where the age of each individual worker, including the queen, is known”.

      The details of the “fixed demographics” treatments were explained in the later portion of the text (line numbers: 58-61).

      L36: I think it is documented that younger individuals are the ones who involved in nest construction in many species.

      Previous studies on nest construction were predominantly performed on mature colonies of specific age demographics or rather mixed demographics, where age was not considered as a factor influencing nest construction. Some studies have speculated that young ants could be the most probable ones to dig, but this has not been experimentally verified to the best of our knowledge.

      L50: I do not think the colony should be called mature after only 6 months, given that colonies reach thousands of workers.

      The sentence is changed as suggested (line numbers : 56-57).

      “The "Colony-Maturation" experiment observed the development of colonies up to six months, starting from a single fertile queen and progressing to colonies with established worker populations.” 

      L60: Where was the queen introduced? It is specified in the Methods but a word here would be helpful.

      The detail is added as suggested (line numbers : 68-69).

      “We initiated colony maturation experiments by introducing a single mated queen and several brood items (n = 5, across all experiments) at random positions on the soil layer of the nest.”

      L106: Young vs Old workers 40 vs 171 days. Maybe cite a reference or provide a reason for the selection of those ages?

      Previous studies have shown that the Camponotus fellah queens can live up to 20 years, with one documented case reaching 26 years (50). To the best of our knowledge, specific data on worker longevity in Camponotus fellah colonies in natural conditions are lacking. Lab studies on Camponotus fellah (82) and other Camponotus species (50) suggest that workers can live for several months depending on environmental conditions, colony health, and caste-specific roles (e.g., minor vs. major workers). 

      We intentionally selected workers from two distinct age groups: younger ants (40 ± 16 days old) and older ants (171.56 ± 20 days old). These ages represent functionally different life stages - the younger group had completed about 25% of their expected lifespan at the start of the experiment, while the older group had lived through most of theirs (50, 82). This 4-fold age difference allowed us to compare excavation behaviors across fundamentally different phases of adult life.

      Our experiments lasted for 60-90 days, during which all participating workers continued to age. To ensure all ants remained alive throughout the experiments, and given the constraints of the experimental timeline, we selected young and old workers within the specified age range. 

      These details are added to the main text (line numbers :  124 -127), and the discussion (line numbers  : 278-282)

      L122-123: But usually ants can vary highly in their behaviours. Can the authors comment on their choice to consider an average, implying that all ants of the same age had the same digging rates?

      We thank the reviewer for the comment.

      In our experiments, we could not track each worker's activity over time. As described in the methods, we took snapshots of the nest structure over days and recorded the population size of the nest. Thus, we could not capture the activity of single ants in the nest as described in the response to major comments in the reviewed preprint.

      We agree that individual tracking of ants within our experimental setup would have been the ideal approach. Then, we could have taken the inter-individual variability of the digging activity into account. However, we were limited to doing so by the technical and practical limitations of the setup, such as; 

      (a) Continuous tracking of ants in our nests would have required a camera to be positioned at all times in front of the nest, which necessitates a light background. Since Camponotus fellah ants are subterranean, we aimed to allow them to perform nest excavation in conditions as close to their natural dark environment as possible. Additionally, implementing such a system in front of each nest would have reduced the sample sizes for our treatments.

      (b)The experimental duration of our colony maturation and fixed demographics experiments extended for up to six months (unprecedented durations in these kinds of measurements). These naturally limited our ability to conduct individual tracking while maintaining the identity of each ant based on the current design.

      To clarify this, we have added the following to the discussion (line numbers: 286-292).

      “Previous studies have demonstrated both homogeneous and heterogeneous workload distribution, with varying digging rates among ants (24,29,30,35). Studies showing heterogeneous workload distribution relied on continuous individual tracking of ants to quantify digging rates (35). However, this approach was not feasible in our current design due to the experimental durations of both our colony maturation and fixed demographics experiments. Additionally, sample size requirements naturally limited our ability to conduct continuous individual tracking during nest construction in our study.”

      L171: A line on how the nest structure was acquired and data extracted would be welcome here.

      The algorithm for the nest structure segmentation, data extraction, and analysis is added in detail to the SI section: Nest skeletonization, segmentation, and orientation. The line is modified (line numbers : 221-224) in the main text as suggested.

      “We compared nest architectures by segmenting raw nest images into chambers and tunnels (see SI Section: Nest Skeletonization, Segmentation, and Orientation). Chambers were identified as flat, horizontal structures, while tunnels were narrower and more vertical in orientation (see SI Fig. 9, SI Section: Nest Skeletonization, Segmentation, and Orientation)”.  

      Figure 3: Where does the data of the mean in panel C come from: is it the mean of the first 30 days, before the collapse? How is it comparable with the rest?

      We apologize to the reviewer for the confusion.

      In panel C, the mean values (solid stars and circles) for fixed-demography colonies (young/old groups) represent pre-collapse excavation areas. For colony maturation experiments (where no collapses were induced), we instead plot the mean saturated excavation area for each group size. This allows direct comparison of mean excavated areas across experimental conditions at equivalent colony sizes.

      To improve readability, the following sentences are added to the main text (line numbers : 139 - 146 ) 

      “We compared the saturated excavation areas (pre-collapse) from fixed-demographics experiments (young and old groups) with those from colony maturation experiments of the same colony sizes (Fig. 3C). We find that, for a given age cohort (young or old), the saturation areas increase linearly with the colony size (GLMM, F(35,37); p < 0.0001) (Fig. 3 C, SI. Fig 7 A). The observed proportional scaling between excavated area and group size aligns with previous studies, even though those studies did not explicitly account for age demographics (24, 29, 30). After normalizing the pre-collapse excavated area by group size for both young and old colonies, we found no significant difference in area per ant across group sizes (SI Fig. 5. A). This indicates that the excavated area per ant remains relatively constant within each demographic group”.

      L209-210: I would be more parsimonious in saying that the results presented prove that the target area decreases with age, as the individual behaviour of the ants was not monitored. Suggestion: rephrase to "the target of the group decreases with age".

      The sentence is rephrased as suggested (line numbers : 265-266).

      “Our results reveal that this target area of the group decreases linearly with age, such that young ants are more sensitive to shortages in space.”

      L246: Are C.fellah colonies really found with such few workers?

      Previous studies have speculated that mature Camponotus fellah colonies are a monogynous species typically founded by a single queen following nuptial flights (50,51,82), and can range from tens to thousands of workers. However, during the founding stage (as in our experiments), colonies naturally pass through smaller developmental sizes comparable to the matured colonies.

    1. eLife Assessment

      The medicinal leech preparation is an amenable system in which to understand the neural basis of locomotion. Here a previously identified non-spiking neuron was studied in leech and found to alter the mean firing frequency of a crawl-related motoneuron, which fires during the contraction phase of crawling. The findings are valuable and the experiments were diligently done and generally solid; The results lay a foundation for additional studies in this system.

    2. Reviewer #1 (Public review):

      The medicinal leech preparation is an amenable system in which to understand how the underlying cellular networks for locomotion function. A previously identified non-spiking neuron (NS) was studied and found to alter the mean firing frequency of a crawl-related motoneuron (DE-3), which fires during the contraction phase of crawling. The data are mostly solid. Identifying upstream neurons responsible for crawl motor patterning is essential for understanding how rhythmic behavior is controlled.

      Review of Revision:

      Reviewer: On a positive note, the rationale for the study is clearer to me now after reading the authors' responses to both reviewers, but that information, as described in the authors' responses, is minimally incorporated into the current revised paper. Incorporating a discussion of previous work on the NS cell has, indeed, improved the paper.

      I suggested earlier that the paper be edited for clarity but not much text has been changed since the first draft. I will provide an example of the types of sentences that are confusing. The title of the paper is: "Phase-specific premotor inhibition modulates leech rhythmic motor output". Are the authors referring to the inhibition created by premotor neurons (e.g., on to the motoneurons) or the inhibition that the premotor neurons receive?

      I also find the paper still confusing with regard to the suggested "functional homology" with the vertebrate Renshaw cells. When the authors set up this expectation of homology (should be analogy) in the introduction and other sections of the paper, one would assume that the NS cell would be directly receiving excitation from a motoneuron (like DE-3) and, in turn, the motoneuron would then receive some sort of inhibitory input to regulate its firing frequency. Essentially, I have always viewed the Renshaw cells as nature's clever way to monitor the ongoing activity of a motoneuron while also providing recurrent feedback or "recurrent inhibition" to modify that cell's excitatory state. The authors present their initial idea below on line 62. Authors write: "These neurons are present as bilateral pairs in each segmental ganglion and are functional homologs of the mammalian Renshaw cells (Szczupak, 2014). These spinal cord cells receive excitatory inputs from motoneurons and, in turn, transmit inhibitory signals to the motoneurons (Alvarez and Fyffe, 2007)."

      [Reviewer (minor note): I suggest re-writing this last sentence as "these" is confusing. Change to: 'In the spinal cord, Renshaw interneurons receive excitatory inputs from motoneurons and, in turn, transmit inhibitory signals to them (Alvarez and Fyffe, 2007).']

      Reviewer: Furthermore, the authors note that (line 69 on): "In the context of this circuit the activity of excitatory motoneurons evokes chemically mediated inhibitory synaptic potentials in NS. Additionally, the NS neurons are electrically coupled......In physiological conditions this coupling favors the transmission of inhibitory signals from NS to motoneurons." Based on what is being conveyed here, I see a disconnect with the "functional homology" being presented earlier. I may be missing something, but the Renshaw analogy seems to be quite different compared to what looks like reciprocal inhibition in the leech. If the authors want to make the analogy to Renshaw cells clearer, then they should make a simple ball and stick diagram of the leech system and visually compare it to the Renshaw/motoneuron circuit with regard to functionality. This simple addition would help many readers.

      Reviewer: The Abstract, Authors write (line 19), "Specifically, we analyzed how electrophysiological manipulation of a premotor nonspiking (NS) neuron, that forms a recurrent inhibitory circuit (homologous to vertebrate Renshaw cells)...."<br /> First, a circuit would not be homologous to a cell, and the term homology implies a strict developmental/evolutionary commonality. At best, I would use the term functionally analogous but even then I am still not sure that they are functionally that similar (see comments above). Line 22: "The study included a quantitative analysis of motor units active throughout the fictive crawling cycle that shows that the rhythmic motor output in isolated ganglia mirrors the phase relationships observed in vivo." This sentence must be revised to indicate that not all of the extracellular units were demonstrated to be motor units. Revise to: "The study included a quantitative analysis of identified and putative motor units active throughout the fictive crawling cycle that shows.....'

      Line 187 regarding identifying units as motoneurons: Authors write, "While multiple extracellular recordings have been performed previously (Eisenhart et al., 2000), these results (Figure 4) present the first quantitative analysis of motor units activated throughout the crawling cycle in this type of recordings." The authors cannot assume that the units in the recorded nerves belong only to motoneurons. Based on their first rebuttal, the authors seem to be reluctant to accept the idea that the extracellularly recorded units might represent a different class of neurons. They admit that some sensory neurons (with somata located centrally) do, indeed, travel out the same nerves recorded, but go on to explain why they would not be active.

      The leech has a variety of sensory organs that are located in the periphery, and some of these sensory neurons do show rhythmic activity correlated with locomotor activity (see Blackshaw's early work). The numerous stretch receptors, in fact, have very large axons that pass through all the nerves recorded in the current paper. In Fig. 4, it is interesting that the waveforms of all the units recorded in the PP nerve exhibit a reversal in waveform as compared to those in the DP nerve, which might indicate (based on bipolar differential recording) that the units in the PP nerve are being propagated in the opposite direction (i.e., are perhaps afferent). Rhythmic presynaptic inhibition and excitation is commonly seen for stretch receptors within the CNS (see the work of Burrows) and many such cells are under modulatory control.

      Most likely, the majority of the units are from motoneurons, but we do not really know at this point. The authors should reframe their statements throughout the paper as: 'While multiple extracellular recordings have been performed previously (Eisenhart et al., 2000), these results (Figure 4) present the first quantitative analysis of multiple extracellular units, using spike sorting methods, which are activated throughout the crawling cycle.' In cases where the identity of the unit is known, then it is fine to state that, but when the identity of the unit is not known, then there should be some qualification and stated as 'putative motor units'

      Reviewer, the Methods section: needs to include the full parameters that were used to assess whether bursting activity was qualified in ways to be considered crawling activity or not. Typically, crawl-like burst periods of no more than 25 seconds have been the limit for their qualification as crawling activity. In Fig 2F, for example, the inter-burst period is over 35 seconds; that coupled with an average 5 second burst duration would bring the burst period to 40 seconds, which is substantially out of range for there to be bursting relevant to crawl activity. Simply put, long DE-3 burst periods are often observed but may not be indicative of a crawl state as the CV motoneurons are no longer out of phase with DE-3. A number of papers have adopted this criterion.

    3. Author response:

      The following is the authors’ response to the original reviews.

      Reviewer #1 (Public review): 

      Summary:  

      The Szczupak lab published a very interesting paper in 2012 (Rodriquez et al. J Neurophysiol 107:1917-1924) on the effects of the segmentally-distributed non-spiking (NS) cell on crawl-related motoneurons. As far as I can tell, the working model presented in 2012, for how the non-spiking (NS) cell impacts the crawling motor pattern, is the same functional model presented in this new paper. Unfortunately, the Discussion does not address any of the findings in the previous paper or cite them in the context of NS alterations of fictive crawling. Aside from different-looking figures and some new analyses, the results and conclusions are the same. 

      Reviewers #1 and #2 called our attention to our failure to cite the Rodriguez et al. 2012 article in the context of the main goal of the present work. We do now explain how the present study is framed by the published work. See lines 74-79.

      In Rodriguez et al. 2012, we hypothesized that the inhibitory signals onto NS were originated in the motoneuron firing. We now cite this reference in line 104. In the current manuscript we further investigated the connection between the inhibitory signals onto NS and the motoneuron activity (Figure 2) and proved that the hypothesis was wrong. Thus, the model presented here differs from the one proposed in Rodriguez et al. 2012.
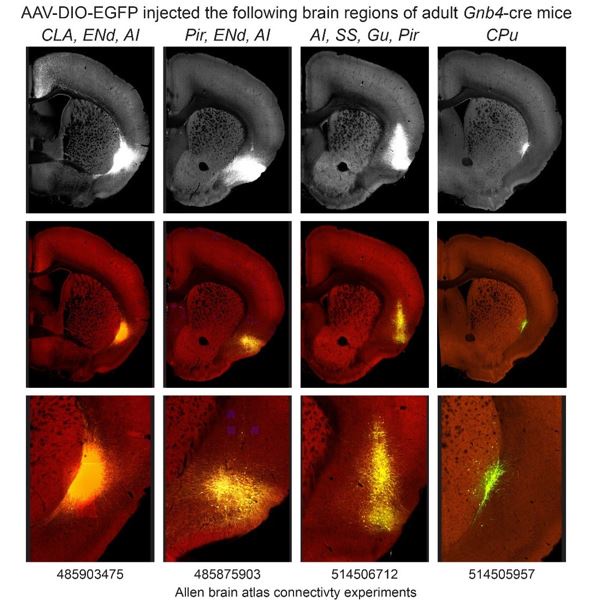
      In Rodriguez et al. 2012, we speculated that the inhibitory signals received by NS were transmitted to the motoneurons, but an important control was missing in that study. In the current study depolarization of NS during crawling is tested against a control series that allows to properly examine the hypothesis (lines 138-147). But, most important, because NS is so widely connected with the layer of motoneurons it was necessary to test the effect on other motoneurons during the fictive crawling cycle. We now explain this rationale in lines 249-257.

      Strengths: 

      The figures are well illustrated. 

      Weaknesses:  

      The paper is a mix of what appears to be two different studies and abruptly switches gears to examine how closely the crawl patterning is in the intact animal as compared to the fictive crawl patterning in the intact animal. Unfortunately, previous studies in other labs are not cited even though identical results have been obtained and similar conclusions were made. Thus, the novelty of the results is missing for those who are familiar with the leech preparation. The lack of appropriate citations and discussion of previous studies also deprives the scientific community of fully comprehending the impact of the data presented and the science it was built upon.  

      The main aim of the manuscript is to learn the role of premotor NS neurons in the crawling motor pattern studied using spike sorting in extracellular nerve recordings. This readout allows to  simultaneously monitor a larger number of units  than in any previous study. This approach aims to determine whether and how a recurrent inhibitory peripheral circuit is involved in coordinating or modulating the rhythmic motor pattern.

      Our rationale was that the known effect of NS on one particular motoneuron (DE-3) may have overlooked a more general effect on crawling (lines 253-257). Moreover, we wanted to investigate whether this effect was due to the recurrent inhibitory circuit or if other elements were involved, and to study whether the modulation was mediated by the recurrent synapse between NS and the motoneurons.

      In the context of this aim we studied the rhythmic activity of cell DE-3, together with motoneurons that fire in-phase and anti-phase, in isolated ganglia (Figure 4). To reveal the effect of NS manipulation we applied a quantitative analysis that showed the phase-specific effect of NS (Figure 6). 

      Given that this is the first study using a spike sorting algorithm to detect and describe the activity of motoneurons in nerve recordings we found it reasonable to compare these results with an in vivo study; thus, providing information to the general reader, that supports the correspondence between the ex vivo and the in vivo patterns.

      (1) Results, Lines 167-170: "While multiple extracellular recordings have been performed previously (Eisenhart et al., 2000), these results present the first quantitative analysis of motor units activated throughout the crawling cycle. The In-Phase units are expected to control the contraction stage by exciting or inhibiting the longitudinal or circular muscles, respectively, and the Anti-Phase units to control the elongation stage by exciting or inhibiting the circular or longitudinal muscles, respectively."  

      Reviewer: The first line above is misleading. The study by Puhl and Mesce (2008, J. Neurosci, 28:4192- 420) contains a comprehensive analysis of the motoneurons active during fictive crawling with the aim of characterizing their roles and phase relationships and solidifying the idea that the oscillator for crawling resides in a single ganglion. Intracellular recordings from a number of key crawl-related motoneurons were made in combination with extracellular recordings of motoneuron DE-3, a key monitor of crawling. In their paper, it was shown that motoneurons AE, VE-4, DI-1, VI-2, and CV were all correlated with crawl activity, and fired repeatedly either in phase or out-of-phase with DE-3. They were shown to be either excitatory or inhibitory. At a minimum, the above paper should be cited. 

      The sentence in the submitted manuscript explicitly refers to the quantitative analysis of extracellular recordings, but we recognize that it may lead to confusion. We have now added a clarification (lines 197-199). 

      The article by Puhl and Mesce 2008 shows very nice intracellular recordings of the AE, CV, VE-4, DE-3, DI-1, and Vi-2, accompanied by extracellular recordings of DE-3 in the DP nerve. In all cases, there is only one intracellular recording paired with the DP nerve recording.

      While it is possible to perform up to 3-4 simultaneous intracellular recordings, these are technically challenging, and more so when the recordings have to last 10-20 minutes. Due to this difficulty, and because our objective was to record multiple units simultaneously in order to comprehensively describe the different crawling stages, we implemented the spike sorting analysis on multiple extracellular recordings. This approach enabled us to reliably obtain multiple units per experiment and thus execute a quantitative analysis of the activity of each identified unit.

      The article by Puhl and Mesce 2008 mentions several quantitative aspects of the neurons that fire in-phase or out-of-phase with DE-3, but, as far as we understand, there is no figure that summarizes activity levels and span in the way Figures 4 and 6 do in the current manuscript. To the best of our knowledge, no previous work renders this information.

      It is very important for us to emphasize that the work by Puhl and Mesce was seminal for our research. We cited it four times in the original manuscript and 10 times in the present version. But, like any important discovery, it sets the ground for further work that can refine certain measurements that in the original discovery were not central.

      This is why we believe that the cited sentence in our manuscript is not misleading.  However, to comply with the requirement of Reviewer #1, we added a sentence preceding the mentioned paragraph (lines 185-187) that acknowledges the description made using intracellular recordings, and explains the need for implementing the approach we chose.

      The submitted paper would be strengthened if some of these previously identified motoneurons were again recorded with intracellular electrodes and concomitant NS cell stimulation. The power of the leech preparation is that cells can be identified as individuals with dual somatic (intracellular) and axonal recordings (extracellular). 

      Most of the motoneurons mentioned by Reviewer #1 are located on the opposite side (dorsal) of the ganglion to NS (ventral), and therefore, simultaneous intracellular recordings in the context of fictive crawling are challenging.

      In the publication of Rodriguez et al. 2009, Mariano Rodriguez did manage to record NS from the dorsal side together with DE-3 and MN-L (!) and this led to the discovery that these motoneurons are electrically coupled, but the recurrent inhibitory circuit masks this interaction. Repeating this type of experiments during crawling, which requires stable recordings for around 15 minutes, is not a reasonable experimental setting.

      Rodriguez et al. 2012 shows intracellular recordings of motoneurons AE and CV during crawling in conjunction with NS, and their activity presented the expected correlation. 

      The shortfall of this aspect of the study (Figure 5) is that the extracellular units have not been identified here. 

      The Reviewer is right in that the extracellular units have not been identified in terms of cell identity. As we explained earlier, most motoneurons are on the opposite side (ventral/dorsal) of the ganglion relative to NS. 

      However, we do characterize the units in terms of the nerve through which they project to the periphery and their activity phase. In lines 345-349 we use this information and, based on published work, we propose possible cellular identities of the different units.

      In xfact, these units might not even be motoneurons. 

      We are surprised by this comment. The classical work of Ort and collaborators (1974) showed that spikes detected in extracellular nerve recordings were emitted by specific motoneurons, and several previous publications have validated extracellular nerve recordings as a means to study fictive motor patterns (Wittenberg & Kristan 1992, Shaw & Kristan 1997, Eisenhart et al. 2000).

      For further reassurance, we only took in consideration units whose activity was locked to DE3; any non-rhythmical activity was filtered out (see lines 433-435). 

      They could represent activity from the centrally located sensory neurons, dopamine-modulated afferent neurons or peripherally projecting modulatory neurons. 

      Peripheral nerves also contain axons from sensory neurons. However, in a previous article, we studied the activity of mechanosensory neurons (Alonso et al. 2020) and showed that they remain silent during crawling. Moreover, the low-threshold T sensory neurons are inhibited in phase with DE-3 bursts and NS IPSPs (Kearney et al. 2022). Alonso et al. 2000 showed that spiking activity of T cells affects the crawling motor pattern, revealing the relevance of keeping them silent.

      What does the Reviewer mean by “dopamine-modulated afferents”? We are not aware of this category of leech neurons.

      The neuromodulatory Rz neurons project peripherally through the recorded nerves, but intracellular recordings of these neurons from our lab show no rhythmic activity in those cells during dopamine-induced crawling.

      Essentially, they may not have much to do with the crawl motor pattern at all.

      Does the Reviewer consider that neurons engaged in a coherent rhythmic firing could be unrelated to the pattern? As indicated above, the units reported in our manuscript were selected because dopamine evoked their rhythmic activity, locked to DE-3. 

      Does the Reviewer consider that dopamine could evoke spurious neuronal activity?

      (2) Results Lines 206-210: "with the elongation and contraction stages of in vivo behavior. However the isometric stages displayed in vivo have no obvious counterpart in the electrophysiological recordings. It is important to consider that the rhythmic movement of successive segments along the antero-posterior axis of the animal requires a delay signal that allows the appropriate propagation of the metachronal wave, and this signal is probably absent in the isolated ganglion." 

      Reviewer: The so-called isometric stages, indeed, have an electrophysiological counterpart due in part to the overlapping activities across segments. This submitted paper would be considerably strengthened if it referred to the body of work that has examined how the individual crawl oscillators operate in a fully intact nerve cord, excised from the body but with all the ganglia (and cephalic ganglion) attached. Puhl and Mesce 2010 (J. Neurosci 30: 2373-2383) and Puhl et al. 2012 (J. Neurosci, 32:17646 -17657) have shown that "appropriate propagation of the metachronal wave" requires the brain, especially cell R3b-1. They also show that the long-distance projecting cell R3b-1 synapses with the CV motoneuron, providing rhythmic excitatory input to it.  

      We would like to draw the Reviewer’s attention to the fact that Puhl and Mesce 2008, 2010 and Puhl et al. 2012 characterized crawling in intact (or nearly intact) animals considering the whole body. In our in vivo analysis, we studied the changes in length of the whole animal and of sections demarcated by the drawn points, as described in the Materials and Methods/Behavioral

      Experiments. Because of this different analysis, we defined “isometric” stages as those in which a given section of the animal does not change its length. We now clarify this (line 230).

      In the paragraph cited by the Reviewer, we intended to state that, in the context of our study, the intersegmental lag caused by the coordinating mechanisms has no counterpart “in the electrophysiological recordings of motoneurons in the isolated ganglia”. We have now completed this idea with the expression underlined in the previous sentence (line 231).

      As the Reviewer indicates, in the intact nerve cord the behavioral isometric stages correspond to the “waiting time” between segments. We did refer to the metachronal order but did not cite the articles by Puhl and Mesce 2010 and Puhl et al. 2012; we now do so (lines 234).

      For this and other reasons, the paper would be much more informative and exciting if the impacts of the NS cell were studied in a fully intact nerve cord. Those studies have never been done, and it would be exciting to see how and if the effects of NS cell manipulation deviated from those in the single ganglion.  

      The Reviewer may consider that a systematic analysis of multiple nerves in several ganglia along the whole nerve cord would have been a different enterprise than the one we carried out. The Reviewer is right in recognizing the interest of such study, but in our opinion, the value of the present work lies in presenting a thorough quantitative analysis of multiple nerves to demonstrate its usefulness for the study of the network underlying leech crawling. In this manuscript, we used it to analyze the role of the premotor NS neuron. Without the recording of units firing in-phase and out-ofphase with DE-3, we would have been unable to assess the span of NS effects.

      (3) Discussion Lines 322-324. "The absence of descending brain signals and/or peripheral signals are assumed as important factors in determining the cycle period and the sequence at which the different behavioral stages take place." 

      Reviewer: The authors could strengthen their paper by including a more complete picture of what is known about the control of crawling. For example, Puhl et al. 2012 (J Neurosci, 32:17646-17657) demonstrated that the descending brain neuron R3b-1 plays a major role in establishing the crawlcycle frequency. With increased R3b-1 cell stimulation, DE-3 periods substantially shortened throughout the entire nerve cord. Thus, the importance of descending brain inputs should not be merely assumed; empirical evidence exists.  

      We now strengthen the concept using “known descending brain signals” (line 358) and cite Puhl et al. 2012. We believe that extending the discussion to cell R3b-1 does not contribute meaningfully to the focus of this manuscript.
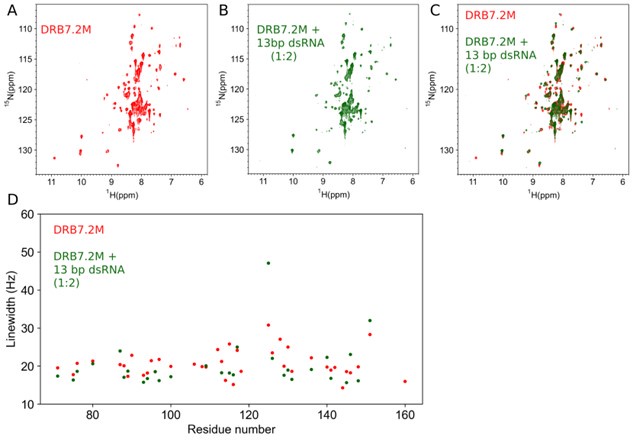
      (4) Discussion Lines 325-327: "the sequence of events, and the proportion of the active cycle dedicated to elongation and contraction were remarkably similar in both experimental settings. This suggests that the network activated in the isolated ganglion is the one underlying the motor behavior." 

      Reviewer: The results and conclusions drawn in the current manuscript mirror those previously reported by Puhl and Mesce (2008, J. Neurosci, 28:4192- 420) who first demonstrated that the essential pattern-generating elements for leech crawling were contained in each of the segmental ganglia comprising the nerve cord. Furthermore, the authors showed that the duty cycle of DE-3, in a single ganglion treated with dopamine, was statistically indistinguishable from the DE-3 duty cycle measured in an intact nerve cord showing spontaneous fictive crawling, in an intact nerve cord induced to crawl via dopamine, and in the intact behaving animal. What was statistically significant, however, was that the DE-3 burst period was greatly reduced in the intact animal (i.e., a higher crawl frequency), which was replicated in the submitted paper.  

      There is no doubt that the article by Puhl and Mesce 2008 is seminal to the work we present here. The Reviewer seems to suggest that we do not recognize the value of this work. The contrary is true, all our related papers cite this important breakthrough. We cite the paper very early in the article in the Introduction (see lines 51 and 52-53). Likely, we would like the Reviewer to recognize the novelty of the current report. To clarify what has been shown and what is new in our manuscript, considerer the following:

      i. Figures 1-6 in Puhl and Mesce 2008 provide representative intracellular recordings that describe neurons that fire in phase and out of phase relative to DE-3. Some general measurements are given in the text, but none of these figures quantify the relative activity of neurons that fire in different stages; only DE-3 activity was quantified. A quantitative description of multiple units active in phase and out of phase with DE-3 is presented here for the first time, are we wrong? This quantification is particularly relevant when assessing how a treatment affects the function of the circuit.

      ii. Regarding the cycle period, we referred to the work from the Kristan lab, which reported this value long before the requested reference. We now cite Puhl and Mesce 2008 in lines 222 regarding in vivo measurements, and in line 221 regarding isolated ganglia.

      iii. Regarding the duty cycle: 

      Puhl and Mesce 2008 measured the duty cycle of DE-3 in three configurations: a. spontaneous whole cord, b. DA-mediated whole cord and c. DA mediated single ganglion crawling. However, it does not report the duty cycle of neurons out-of-phase with DE-3. Our current manuscript carried out this analysis. One could argue that the silence between DE-3 bursts captures that value, but this is a speculation that needed a proper measure.

      Puhl and Mesce 2008 does not indicate the duty cycle of the contraction and elongation stages in vivo. Our current manuscript does. 

      Therefore, the sentence cited by the Reviewer refers to data presented in this manuscript, and not in any prior manuscript. It is true that Puhl and Mesce 2008 inspire the intuition that the sentence is true, but does not present the data that the current manuscript does.

      Finally, our study focused only on the body sections corresponding to the same segmental range used in the ex vivo experiments, rather than the whole animal. The comparison was made only to validate that the duty cycles of neurons firing in phase and out of phase with DE-3 matched the dynamic stages in the studied sections of the leech (line 364).

      In my opinion, the novelty of the results reported in the submitted manuscript is diminished in the light of previously published studies. At a minimum, the previous studies should be cited, and the authors should provide additional rationale for conducting their studies. They need to explain in the discussion how their approach provided additional insights into what has already been reported.  

      Throughout our reply, we have provided a detailed explanation of the rationale and necessity behind each experiment. Following the Reviewer’s suggestion, we have rephrased the research objectives, included what is known from our previously published work, and highlighted the substantial new data contributed by the present study. See lines 80-85. 

      Additionally, we further cite our published article in lines 93, 104, 138, 146 and 250. 

      Reviewer #2 (Public review):  

      The paper is well-written overall. The findings are clearly presented, and the data seems solid overall. I do have, however, a few major and some minor comments representing some concerns.

      My major comments are below. 

      (1) This may seem somewhat semantic, yet, it has implications on the way the data is presented and moreover on the conclusions drawn - a single ganglion cannot show fictive crawling. It can demonstrate rhythmic patterns of activity that may serve in the (fictive) crawling motor pattern. The latter is a result of the intrinsic within single-ganglion connectivity AND the inter-ganglia connections and interactions (coupling) among the sequential ganglia. It may be affected by both short-range and long-range connections (e.g., descending inputs) along the ganglia chain. 

      Semantics is not a trivial issue in science communication. It entails metaphors that enter the bibliography as commonly used “shortcuts” to a complex concept that are adopted by a community of researchers. And yes, indeed, they can be misleading.

      However, if recording the activity in an isolated ganglion shows that a wide group of motoneurons, that control known muscle movements, presents a rhythmic output that maintains the appropriate cycle period and phase relationships, the “shortcut” is incomplete but could be valid (Puhl and Mesce 2008). If we were to include the phase lag component, a single ganglion cannot generate the fictive motor output.

      Because any new study builds knowledge on the basis of the cited bibliography, the way we name concepts is a sensitive point. Adopting the terminology used by previous publications (Puhl and Mesce 2008) seems important to allow readers to follow the development of knowledge. However, attending the observation made by Reviewer #2, we included a sentence clarifying that the concept “fictive crawling” does not include intersegmental connectivity (lines 54-57)

      (2) The point above is even more critical where the authors set to compare the motor pattern in single ganglia with the intact animals. It would have made much more sense to add a description of the motor pattern of a chain of interconnected ganglia. The latter would be expected to better resemble the intact animal. Furthermore, this project would have benefitted from a three-way comparison (isolated ganglion-interconnected ganglia-intact animal.  

      As we answered to Reviewer #1, the present manuscript does not intend to present a thorough study on how the activity in the isolated nervous system compares with the animal behavior. To do so we would have needed to perform a completely different set of experiments. To better define the relevance of our comparison with the in vivo experiments we rephrased the objective of the behavioral analysis (lines 197-199).

      The main aim of the manuscript is to learn the role of premotor NS neurons in the crawling motor pattern studied using a readout (spike sorting in extracellular nerve recordings) that allows simultaneous screening of a larger number of units than in any previous study, in order to determine whether and how a recurrent inhibitory peripheral circuit is involved in coordinating or modulating the rhythmic motor pattern.

      Our rationale was that the known effect of NS on one particular motoneuron (DE-3) may have overlooked a more general effect on crawling (lines 253-257). Moreover, we wanted to investigate whether this effect was due to the recurrent inhibitory circuit or if other elements were involved, and to study whether the modulation was mediated by the recurrent synapse between NS and the motoneurons.

      In the context of this aim we studied the rhythmic activity of cell DE-3, together with motoneurons that fire in-phase and anti-phase, in isolated ganglia (Figure 4). To reveal the effect of NS manipulation we applied a quantitative analysis that showed the phase-specific effect of NS (Figure 6). 

      Given that this is the first study using a spike sorting algorithm to detect and describe the activity of motoneurons in nerve recordings we found it reasonable to compare these results with an in vivo study; thus, providing information to the general reader, that supports the correspondence between the ex vivo and the in vivo patterns.

      (3) Two previous studies by the same group are repeatedly mentioned (Rela and Szczupak, 2003; Rodriguez et al., 2009) and serve as a basis for the current work. The aim of one of these previous studies was to assess the role of the NS neurons in regulating the function of motor networks. The other (Rodriguez et al., 2009) reported on a neuron (the NS) that can regulate the crawling motor pattern. LL 71-74 of the current report presents the aim of this study as evaluating the role of the known connectivity of the premotor NS neuron in shaping the crawling motor pattern. The authors should make it very clear what indeed served as background knowledge, what exactly was known about the circuitry beforehand, and what is different and new in the current study. 

      Rela and Szczupak 2003 and Rodriguez et al. 2009 analyze the interactions of motoneurons with NS. We believe that Reviewer #2 refers here to Rodriguez et al. 2012. A similar observation was made by Reviewer #1. Below, we copy the answer previously stated:
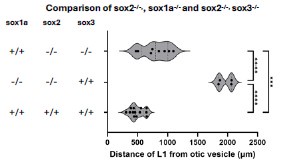
      Following the Reviewer’s suggestion, we have rephrased the research objectives, included what is known from our previously published work, and highlighted the substantial new data contributed by the present study. See lines 80-85. 

      Additionally, we further cite our published article in lines 93, 104, 138, 146 and 250. 

      Reviewer #1 (Recommendations for the authors):  

      Please edit for correct word usage. 

      Reviewer #2 (Recommendations for the authors):  

      Minor Concerns 

      (1) LL33-36: These lines are somewhat vague and non-informative. Why is the functional organization of motor systems an open question? What are the mechanisms at the level of the nerve cord that are an open question? Maybe be more explicit? 

      We did as suggested (lines 30-32).

      (2) L62: The homology between the NS neurons and the vertebrate Renshaw cells is mentioned already in the Abstract and here again. While a reference is provided (citing the lead author of this current work), the reader would benefit from some further short words of explanation regarding the alleged homology. 

      We included a description of Renshaw cell connectivity (lines 64-65).

      (3) LL90-92: The NS recording in Figure 1 (similar to Figure 3 in Rodriguez et al.) demonstrates clear distinct IPSPs. Could these be correlated with DE-3 spikes? 

      We investigated this correlation in detail and the answer is that there is no strictly a 1:1 DE-3 spike to IPSP correlation. NS receives inputs from other dorsal and ventral excitors of longitudinal muscles, and the NS trace is too “noisy” to reflect any short-term correlation. Originally we proposed that the NS IPSPs were due to the polysynaptic interaction between the MN and NS (Rodríguez et al. 2012). However, the present work demonstrates that the IPSPs in NS are caused by a source upstream from the MNs. 

      (4) LL145-145: Do you mean - inhibitory signals FROM NS premotor neurons? Not clear. 

      We see the confusion, and we rewrote the sentence (lines 164). We hope it is clearer now: “…inhibitory signals onto NS premotor neurons were transmitted to DE-3 motoneurons via rectifying electrical synapses and counteracted their excitatory drive during crawling, limiting their firing frequency.”

      (5) LL153-154: Why isn't AA included in Figure 4A? 

      Reading our original text, the Reviewer #1 is right in expecting to see the AA recording. We changed the sentence: “we performed extracellular recordings of DP along with AA and/or PP root nerves” (lines 171-172).

      We dissected the three nerves but, unfortunately, we did not always obtain good recordings from the three of them.

      (6) LL237-238: The statistical significance (B- antiphase) is not clear. Furthermore, with N of 7-8, I'm not sure the parametric tests utilized are appropriate. 

      Regarding the Reviewer's concern about the tests, please note that all the assumptions made for each model were tested (see now Materials and Methods lines 466-467).The information on each model is provided in Supplementary Table 2 under the column 'Model, random effect,' which specifies whether a Linear Mixed Model (LMM) or a Generalized Linear Mixed Model (GLMM) was implemented. For GLMMs, the corresponding distribution and link function are also specified. For the analysis of Max bFF of Anti-Phase motor units, we found a significant interaction between epoch and treatment, indicating a difference between treatments. This is indicated on the left of the y-axis (##). In control experiments, all three comparisons (pre-test, pre-post, test-post) show significant differences in Max bFF: this variable decreased (slightly but significantly) along the subsequent epochs, suggesting a change over time. We now corrected the text to indicate that these changes were small (line 268). In contrast, Max bFF in depo experiments remained stable between pre-test and pre-post, but significantly decreased between the depo and post epochs. Thus, in our view the comparison between control and the test supports the conclusion that NS depolarization was limited to counteracting this decrease (lines 270-273). Supplementary Table 2 provides the significance and modeled estimated ratio for each comparison in the column for pairwise simple contrasts.

      Thanks to this question, we realized that the nomenclature used in the table for the epochs (pre - depo - post) needed to be changed to pre - test - post, and we have now corrected it.

      (7) LL240-241: I fail to see a difference from Control. 

      For the Relative HW of In-Phase units, we also found a significant interaction between epoch and treatment, indicating a difference between treatments, as denoted to the left of the y-axis (#). Then, the significance of the comparisons across epochs within each treatment are shown in the figure (*). What is important to notice is that obtaining the same significance for each treatment does not imply identical results, but we failed to describe this in our original text and we do now in lines 275-279.

      (8) LL244-245: I must admit that Table 2 is beyond me. Maybe add some detail or point out to the reader what is important (if at all). 

      We have now clarified what each column of the tables indicates in the corresponding legends. 

      Here, we also share an insight into how the experiments were designed and analyzed:

      To account for possible temporal drifts of the variables during the recordings that could mask or confuse the results, we compared two experimental series: one in which NS was subjected to depolarizing current pulses (depo), and another series (ctrl) in which the neurons were not depolarized.

      The statistical analysis was made using Linear Mixed Models (LMMs) or Generalized Linear Mixed Models (GLMMs). In these analyses treatments and epochs are used as explanatory variables to evaluate the interaction between these factors. These models allow us to determine whether changes in each variable across epochs differ depending on the treatment. For example, whether the variation in firing frequency from pre to test to post differs between control experiments and those in which NS was depolarized.

      A significant interaction between treatment and epoch indicates that NS depolarization affected the variable. In such cases, we performed pairwise comparisons between epochs (pre-test, test-post, pre-post) within each treatment. In contrast, the absence of a significant interaction can result from two possibilities: either the variable did not change across epoch in either treatment, or a similar temporal drift occurred in both cases.

      (9) LL245-256: Move this paragraph to the discussion. 

      Because we introduced a rationale for the experiments described in Figure 6 (lines 282-284) the paragraph was mostly removed, but the part that supports the methodological approach was left.

      (10)  LL259-260: see my second minor point above. This is explained in LL270-272 for the first time. 

      We amended according to comment (2).

      (11) Figures: The quantitative analysis shown in Figure 3B is very useful. Why isn't this type of analysis utilized for the comparisons shown in Figures 4 and 6? 

      We chose different ways of plotting the data based on their nature. In Figure 3B, we present data from an identified neuron (DE-3) recorded in different experiments. In contrast, in Figure 6 we analyze data from neurons classified into the same group based on their activity during the fictive crawling cycle, but their individual identity was not ascertained. Therefore, we consider it important to plot the results for each unit individually, to assess the effect of temporal drift and NS depolarization.

      (12) Figures: Figure 7 is meant to be compared to Figure 1C; the point being the addition of an inhibitory connection onto the NS neuron. Why are other details of the figure also different (different colored M)? 

      While Figure 1C illustrates the known connection between NS and both DE-3 and CV motoneurons, Figure 7 shows the connections between NS and the different groups of motor units described in this study. The units are represented in the circuit using the same colors that identify them in Figures 4 and 6. Since the CV motoneuron was not recorded in this study, the circuit represents the AntiPhase neurons but does not identify them with CV. Figure 7 legend now clarifies what the colors represent, and Figure 1C has been updated to match the same color scheme.

    1. eLife Assessment

      The paper presents a new behavioral assay for Drosophila aggression and demonstrates that social experience influences fighting strategies, with group-housed males favoring high-intensity but low-frequency tussling over aggressive lunging observed in isolated males. This paper is important for researchers studying the impact of social isolation on aggression, while the description of tussling behavior and the interpretation of the link between tussling and mating success are incomplete.

    2. Reviewer #1 (Public review):
      This work addresses an important question in the field of Drosophila aggression and mating. Prior social isolation is known to increase aggression in males, manifesting as increased lunging, which is suppressed by group housing (GH). However, it is also known that single housed (SH) males, despite their higher attempts to court females, are less successful. Here, Gao et al., develop a modified aggression assay to address this issue by recording aggression in Drosophila males for 2 hours, with a virgin female immobilized by burying its head in the food. They found that while SH males frequently lunge in this assay, GH males switch to higher intensity but very low frequency tussling. Constitutive neuronal silencing and activation experiments implicate cVA sensing Or67d neurons in promoting high frequency lunging, similar to earlier studies, whereas Or47b neurons promote low frequency but higher intensity tussling. Optogenetic activation revealed that three pairs of pC1SS2 neurons increase tussling. Cell-type-specific DsxM manipulations combined with morphological analysis of pC1SS2 neurons and side-by-side tussling quantification link the developmental role of DsxM to the functional output of these aggression-promoting cells. In contrast, although optogenetic activation of P1a neurons in the dark did not increase tussling, thermogenetic activation under visible light drove aggressive tussling. Using a further modified aggression assay, GH males exhibit increased tussling and maintain territorial control, which could contribute to a mating advantage over SH males, although direct measures of reproductive success are still needed
      Strengths:

      Through a series of clever neurogenetic and behavioral approaches, the authors implicate specific subsets of ORNs and pC1 neurons in promoting distinct forms of aggressive behavior, particularly tussling. They have devised a refined territorial control paradigm, which appears more robust than earlier assays using a food cup (Chen et al., 2002). This new setup is relatively clutter-free and could be amenable to future automation using computer vision approaches. The updated Figure 5, which combines cell-type-specific developmental manipulation of pC1SS2 neurons with behavioral output, provides a link between developmental mechanisms and functional aggression circuits. The manuscript is generally well written, and the claims are largely supported by the data.

      Weakness:

      Although most concerns have been addressed, the manuscript still lacks a rigorous, objective method for quantifying lunging and tussling. Because scoring appears to have been done manually and a single lunge in a 30 fps video spans only 2-3 frames, the 0.2 s cutoff seems arbitrary, and there are no objective criteria distinguishing reciprocal lunging from tussling. Despite this, the study offers valuable insights into the neural and behavioral mechanisms of Drosophila aggression.

    3. Reviewer #2 (Public review):

      Summary:

      Gao et al. investigated the change of aggression strategies by the social experience and its biological significance by using Drosophila. Two modes of inter-male aggression in Drosophila are known: lunging, high-frequency but weak mode, and tussling, low-frequency but more vigorous mode. Previous studies have mainly focused on the lunging. In this paper, the authors developed a new behavioral experiment system for observing tussling behavior and found that tussling is enhanced by group rearing, while lunging is suppressed. They then searched for neurons involved in the generation of tussling. Although olfactory receptors named Or67d and Or65a have previously been reported to function in the control of lunging, the authors found that these neurons do not function in the execution of tussling and another olfactory receptor, Or47b, is required for tussling, as shown by the inhibition of neuronal activity and the gene knockdown experiments. Further optogenetic experiments identified a small number of central neurons pC1[SS2] that induce the tussling specifically. These neurons express doublesex (dsx), a sex-determination factor, and knockdown of dsx strongly suppresses the induction of tussling. In order to further explore the ecological significance of the aggression mode change in group-rearing, a new behavioral experiment was performed to examine the territorial control and the mating competition. And finally, the authors found that differences in the social experience (group vs. solitary rearing) and the associated change in aggression strategy are important in these biologically significant competitions. These results add a new perspective to the study of aggression behavior in Drosophila. Furthermore, this study proposes an interesting general model in which the social experience modified behavioral changes play a role in reproductive success.

      Strengths:

      A behavioral experiment system that allows stable observation of tussling, which could not be easily analyzed due to its low-frequency, would be very useful. The experimental setup itself is relatively simple, just the addition of a female to the platform, so it should be applicable to future research. The finding about the relationship between the social experience and the aggression mode change is quite novel. Although the intensity of aggression changes with the social experience was already reported in several papers (Liu et al., 2011 etc), the fact that the behavioral mode itself changes significantly has rarely been addressed, and is extremely interesting. The identification of sensory and central neurons required for the tussling makes appropriate use of the genetic tools and the results are clear. A major strength of this study in neurobiology is the finding that another group of neurons (Or47b-expressing olfactory neurons and pC1[SS2] neurons), distinct from the group of neurons previously thought to be involved in low-intensity aggression (i.e. lunging), function in the tussling behavior. Furthermore, the results showing that the regulation of aggression by pC1[SS2] neurons is based on the function of the dsx gene will bring a new perspective to the field. Further investigation of the detailed circuit analysis is expected to elucidate the neural substrate of the conflict between the two aggression modes. The experimental systems examining the territory control and the reproductive competition in Fig. 6 are novel and have advantages in exploring their biological significance. It is important to note that in addition to showing the effects of age and social experience on territorial and mating behaviors, the authors experimentally demonstrated that altered fighting strategy has effects with respect to these behaviors.

    4. Reviewer #3 (Public review):

      In this revised manuscript, Gao et al. presented a series of well-controlled behavioral data showing that tussling, a form of high-intensity fighting among male fruit flies (Drosophila melanogaster) is enhanced specifically among socially experienced and relatively old males. Moreover, results of behavioral assays led authors to suggest that increased tussling among socially experienced males may increase mating success. They also concluded that tussling is controlled by a class of olfactory sensory neurons and sexually dimorphic central neurons that are distinct from pathways known to control lunges, a common male-type attack behavior.

      A major strength of this work is that it is the first attempt to characterize behavioral function and neural circuit associated with Drosophila tussling. Many animal species use both low-intensity and high-intensity tactics to resolve conflicts. High-intensity tactics are mostly reserved for escalated fights, which are relatively rare. Because of this, tussling in the flies, like high-intensity fights in other animal species, have not been systematically investigated. Previous studies on fly aggressive behavior have often used socially isolated, relatively young flies within a short observation duration. Their discovery that 1) older (14-days old) flies tend to tussle more often than younger (2 to 7-days-old) flies, 2) group-reared flies tend to tussle more often than socially isolated flies, and 3) flies tend to tussle at later stage (mostly ~15 minutes after the onset of fighting), are the result of their creativity to look outside of conventional experimental settings. These new findings are key for quantitatively characterizing this interesting yet under-studied behavior.

      Newly presented data have made several conclusions convincing. Detailed descriptions of methods to quantify behaviors help understand the basis of their claims by improving transparency. However, I remain concerned about authors' persistent attempt to link the high intensity aggression to reproductive success. The authors' effort to "tone down" the link between the two phenomena remains insufficient. There are purely correlational. I reiterate this issue because the overall value of the manuscript would not change with or without this claim.

    5. Author response:

      The following is the authors’ response to the original reviews.

      Reviewer #1 (Public review):

      This work addresses an important question in the field of Drosophila aggression and mating- prior social isolation is known to increase aggression in males by increased lunging, which is suppressed by group housing (GH). However, it is also known that single-housed (SH) males, despite their higher attempts to court females, are less successful. Here, Gao et al., developed a modified aggression assay, to address this issue by recording aggression in Drosophila males for 2 hours, over a virgin female which is immobilized by burying its head in the food. They found that while SH males frequently lunge in this assay, GH males switch to higher intensity but very low-frequency tussling. Constitutive neuronal silencing and activation experiments implicate cVA sensing Or67d neurons promoting high-frequency lunging, similar to earlier studies, whereas Or47b neurons promote low-frequency but higher intensity tussling. Using optogenetic activation they found that three pairs of pC1 neurons- pC1SS2 increase tussling. While P1a neurons, previously implicated in promoting aggression and courtship, did not increase tussling in optogenetic activation (in the dark), they could promote aggressive tussling in thermogenetic activation carried out in the presence of visible light. It was further suggested, using a further modified aggression assay that GH males use increased tussling and are able to maintain territorial control, providing them mating advantage over SI males and this may partially overcome the effect of aging in GH males.

      Strengths

      Using a series of clever neurogenetic and behavioral approaches, subsets of ORNs and pC1 neurons were implicated in promoting tussling behaviors. The authors devised a new paradigm to assay for territory control which appears better than earlier paradigms that used a food cup (Chen et al, 2002), as this new assay is relatively clutter-free, and can be eventually automated using computer vision approaches. The manuscript is generally well-written, and the claims made are largely supported by the data.

      Thank you for your precise summary of our study, and being very positive on the novelty and significance of the study.

      Weaknesses

      I have a few concerns regarding some of the evidence presented and claims made as well as a description of the methodology, which needs to be clarified and extended further.

      (1) Typical paradigms for assaying aggression in Drosophila males last for 20-30 minutes in the presence of nutritious food/yeast paste/females or all of these (Chen et al. 2002, Nilsen et al., 2004, Dierick et al. 2007, Dankert et al., 2009, Certel & Kravitz 2012). The paradigm described in Figure 1 A, while important and more amenable for video recording and computational analysis, seems a modification of the assay from Kravitz lab (Chen et al., 2002), which involved using a female over which males fight on a food cup. The modifications include a flat surface with a central food patch and a female with its head buried in the food, (fixed female) and much longer adaptation and recording times respectively (30 minutes, 2 hours), so in that sense, this is not a 'new' paradigm but a modification of an existing paradigm and its description as new should be appropriately toned down. It would also be important to cite these earlier studies appropriately while describing the assay.

      We now toned down the description of the paradigm and cited more related references.

      (2) Lunging is described as a 'low intensity' aggression (line 111 and associated text), however, it is considered a mid to high-intensity aggressive behavior, as compared to other lower-intensity behaviors such as wing flicks, chase, and fencing. Lunging therefore is lower in intensity 'relative' to higher intensity tussling but not in absolute terms and it should be mentioned clearly.

      We have modified the description as suggested.

      (3) It is often difficult to distinguish faithfully between boxing and tussling and therefore, these behaviors are often clubbed together as box, tussle by Nielsen et al., 2004 in their Markov chain analysis as well as a more detailed recent study of male aggression (Simon & Heberlein, 2020). Therefore, authors can either reconsider the description of behavior as 'box, tussle' or consider providing a video representation/computational classifier to distinguish between box and tussle behaviors.

      Indeed, we could not faithfully distinguish boxing and tussling. To address this concern, we now made textual changes in the result section we occasionally observed the high-intensity boxing and tussling behavior in male flies, which are difficult to distinguish and hereafter simply referred to as tussling.

      We also added this information in the Materials and Methods section Tussling is often mixed with boxing, in which both flies rear up and strike the opponent with forelegs. Since boxing is often transient and difficult to distinguish from tussling, we referred to the mixed boxing and tussling behavior simply as tussling.

      (4) Simon & Heberlein, 2020 showed that increased boxing & tussling precede the formation of a dominance hierarchy in males, and lunges are used subsequently to maintain this dominant status. This study should be cited and discussed appropriately while introducing the paradigm.

      We now cited this important study in both the Introduction and Discussion sections.

      (5) It would be helpful to provide more methodological details about the assay, for instance, a video can be helpful showing how the males are introduced in the assay chamber, are they simply dropped to the floor when the film is removed after 30 minutes (Figures 1-2)?

      We now provided more detailed description about behavioral assays and how we analyze them. For example All testers were loaded by cold anesthesia. After a 30-minute adaptation, the film was gently removed to allow the two males to fell into the behavioral chamber, and the aggressive behavior was recorded for 2 hours.

      (6) The strain of Canton-S (CS) flies used should be mentioned as different strains of CS can have varying levels of aggression, for instance, CS from Martin Heisenberg lab shows very high levels of aggressive lunges. Are the CS lines used in this study isogenized? Are various genetic lines outcrossed into this CS background? In the methods, it is not clear how the white gene levels were controlled for various aggression experiments as it is known to affect aggression (Hoyer et al. 2008).

      We used the wtcs flies from Baker lab in Janelia Research Campus, and are not sure where they are originated. We appreciate your concern on the use of wild-type strains as they may show different fighting levels, but this study mainly used wild-type strains to compare behavioral differences between SH and GH males. All flies tested in this study are in w+ background, based on w+ balancers flies but are not backcrossed. We have listed detailed genotypes of all tested flies in Table S1 in the revised manuscript.

      (7) How important it is to use a fixed female for the assay to induce tussling? Do these females remain active throughout the assay period of 2.5 hours? Is it possible to use decapitated virgin females for the assay? How will that affect male behaviors?

      We used a fixed female to restrict it in the center of food. These females remain active throughout the assay as their legs and abdomens can still move. Such design intends to combine the attractive effects from both female and food. One can also use decapitated females, but in this case, males can push the decapitated female into anywhere in the behavioral chamber. The logic to use fixed females has now been added in the Materials and Methods section of the revised manuscript.

      (8) Raster plots in Figure 2 suggest a complete lack of tussling in SH males in the first 60 minutes of the encounter, which is surprising given the longer duration of the assay as compared to earlier studies (Nielsen et al. 2004, Simon & Heberlein, 2020 and others), which are able to pick up tussling in a shorter duration of recording time. Also, the duration for tussling is much longer in this study as compared to shorter tussles shown by earlier studies. Is this due to differences in the paradigm used, strain of flies, or some other factor? While the bar plots in Figure 2D show some tussling in SH males, maybe an analysis of raster plots of various videos can be provided in the main text and included as a supplementary figure to address this.

      Indeed, tussling is very low in SH males in our paradigm, which may be due to different genetic backgrounds and behavioral assays. Since tussling behavior is a rare fighting form, it is not surprising to see variation between studies from different labs. Nevertheless, this study compared tussling behaviors in SH and GH males, and our finding that GH males show much more tussling behaviors is convincing. The longer duration of tussling in our paradigm may also be due to the modified behavioral paradigm, which also supports that tussling is a high-level fighting form.

      (9) Neuronal activation experiments suggesting the involvement of pC1SS2 neurons are quite interesting. Further, the role of P1a neurons was demonstrated to be involved in increasing tussling in thermogenetic activation in the presence of light (Figure 4, Supplement 1), which is quite important as the role of vision in optogenetic activation experiments, which required to be carried out in dark, is often not mentioned. However, in the discussion (lines 309-310) it is mentioned that PC1SS2 neurons are 'necessary and sufficient' for inducing tussling. Given that P1a neurons were shown to be involved in promoting tussling, this statement should be toned down.

      Thank you for this important comment. We now toned down the statement on pC1SS2 function.

      (10) Are Or47b neurons connected to pC1SS2 or P1a neurons?

      We conducted pathway analysis in the FlyWire electron microscopy database to investigate the connection between Or47b neurons and pC1 neurons. The results indicate that at least three levels of interneurons are required to establish a connection from Or47b neurons to pC1 neurons. Although the FlyWire database currently only contains neuronal data from female brains, they provide a reference for circuit connect in males.

      (11) The paradigm for territory control is quite interesting and subsequent mating advantage experiments are an important addition to the eventual outcome of the aggressive strategy deployed by the males as per their prior housing conditions. It would be important to comment on the 'fitness outcome' of these encounters. For instance, is there any fitness advantage of using tussling by GH males as compared to lunging by SH males? The authors may consider analyzing the number of eggs laid and eclosed progenies from these encounters to address this.

      Thank you for this suggestion. We agree with you and other reviewers that increased tussling behaviors correlate with better mating competition, but it is difficult for us to make a direct link between them. Thus, in the revised manuscript, we prefer to tone down this statement but not expanding on this part.

      Reviewer #2 (Public review):

      Summary

      Gao et al. investigated the change of aggression strategies by the social experience and its biological significance by using Drosophila. Two modes of inter-male aggression in Drosophila are known lunging, high-frequency but weak mode, and tussling, low-frequency but more vigorous mode. Previous studies have mainly focused on the lunging. In this paper, the authors developed a new behavioral experiment system for observing tussling behavior and found that tussling is enhanced by group rearing while lunging is suppressed. They then searched for neurons involved in the generation of tussling. Although olfactory receptors named Or67d and Or65a have previously been reported to function in the control of lunging, the authors found that these neurons do not function in the execution of tussling, and another olfactory receptor, Or47b, is required for tussling, as shown by the inhibition of neuronal activity and the gene knockdown experiments. Further optogenetic experiments identified a small number of central neurons pC1[SS2] that induce the tussling specifically. In order to further explore the ecological significance of the aggression mode change in group rearing, a new behavioral experiment was performed to examine territorial control and mating competition. Finally, the authors found that differences in the social experience (group vs. solitary rearing) are important in these biologically significant competitions. These results add a new perspective to the study of aggressive behavior in Drosophila. Furthermore, this study proposes an interesting general model in which the social experience-modified behavioral changes play a role in reproductive success.

      Strengths

      A behavioral experiment system that allows stable observation of tussling, which could not be easily analyzed due to its low frequency, would be very useful. The experimental setup itself is relatively simple, just the addition of a female to the platform, so it should be applicable to future research. The finding about the relationship between the social experience and the aggression mode change is quite novel. Although the intensity of aggression changes with the social experience was already reported in several papers (Liu et al., 2011, etc), the fact that the behavioral mode itself changes significantly has rarely been addressed and is extremely interesting. The identification of sensory and central neurons required for the tussling makes appropriate use of the genetic tools and the results are clear. A major strength of the neurobiology in this study is the finding that another group of neurons (Or47b-expressing olfactory neurons and pC1[SS2] neurons), distinct from the group of neurons previously thought to be involved in low-intensity aggression (i.e. lunging), function in the tussling behavior. Further investigation of the detailed circuit analysis is expected to elucidate the neural substrate of the conflict between the two aggression modes.

      Thank you for the acknowledgment of the novelty and significance of the study, and your suggestions for improving the manuscript.

      Weaknesses

      The experimental systems examining the territory control and the reproductive competition in Figure 5 are novel and have advantages in exploring their biological significance. However, at this stage, the authors' claim is weak since they only show the effects of age and social experience on territorial and mating behaviors, but do not experimentally demonstrate the influence of aggression mode change itself. In the Abstract, the authors state that these findings reveal how social experience shapes fighting strategies to optimize reproductive success. This is the most important perspective of the present study, and it would be necessary to show directly that the change of aggression mode by social experience contributes to reproductive success.

      We agree that our data did not directly show that it is the change of aggression mode that results in territory and reproductive advantages in GH males. To address the concern, we have toned down the statement throughout the manuscript. For example, we made textual changes in the abstract as following

      Moreover, shifting from lunging to tussling in socially enriched males is accompanied with better territory control and mating success, mitigating the disadvantages associated with aging. Our findings identify distinct sensory and central neurons for two fighting forms and suggest how social experience shapes fighting strategies to optimize reproductive success.

      In addition, a detailed description of the tussling is lacking. For example, the authors state that the tussling is less frequent but more vigorous than lunging, but while experimental data are presented on the frequency, the intensity seems to be subjective. The intensity is certainly clear from the supplementary video, but it would be necessary to evaluate the intensity itself using some index. Another problem is that there is no clear explanation of how to determine the tussling. A detailed method is required for the reproducibility of the experiment.

      Thank you for this important suggestion. We now analyzed duration of tussling and lunging, and found that a lunging event is often very short (less than 0.2s), while a tussling event may last from seconds to minutes. This new data is added as Figure 2G. In addition, we also provided more detailed methods regarding to tussling behavior

      .<br /> Reviewer #3 (Public review):

      In this manuscript, Gao et al. presented a series of intriguing data that collectively suggest that tussling, a form of high-intensity fighting among male fruit flies (Drosophila melanogaster) has a unique function and is controlled by a dedicated neural circuit. Based on the results of behavioral assays, they argue that increased tussling among socially experienced males promotes access to resources. They also concluded that tussling is controlled by a class of olfactory sensory neurons and sexually dimorphic central neurons that are distinct from pathways known to control lunges, a common male-type attack behavior.

      A major strength of this work is that it is the first attempt to characterize the behavioral function and neural circuit associated with Drosophila tussling. Many animal species use both low-intensity and high-intensity tactics to resolve conflicts. High-intensity tactics are mostly reserved for escalated fights, which are relatively rare. Because of this, tussling in the flies, like high-intensity fights in other animal species, has not been systematically investigated. Previous studies on fly aggressive behavior have often used socially isolated, relatively young flies within a short observation duration. Their discovery that 1) older (14-days-old) flies tend to tussle more often than younger (2-days-old) flies, 2) group-reared flies tend to tussle more often than socially isolated flies, and 3) flies tend to tussle at a later stage (mostly ~15 minutes after the onset of fighting), are the result of their creativity to look outside of conventional experimental settings. These new findings are keys for quantitatively characterizing this interesting yet under-studied behavior.

      Precisely because their initial approach was creative, it is regrettable that the authors missed the opportunity to effectively integrate preceding studies in their rationale or conclusions, which sometimes led to premature claims. Also, while each experiment contains an intriguing finding, these are poorly related to each other. This obscures the central conclusion of this work. The perceived weaknesses are discussed in detail below.

      Thank you for the precise summary of the key findings and novelty of the study, and your insightful suggestions.

      Most importantly, the authors' definition of "tussling" is unclear because they did not explain how they quantified lunges and tussling, even though the central focus of the manuscript is behavior. Supplemental movies S1 and S2 appear to include "tussling" bouts in which 2 flies lunge at each other in rapid succession, and supplemental movie S3 appears to include bouts of "holding", in which one fly holds the opponent's wings and shakes vigorously. These cases raise a concern that their behavior classification is arbitrary. Specifically, lunges and tussling should be objectively distinguished because one of their conclusions is that these two actions are controlled by separate neural circuits. It is impossible to evaluate the credibility of their behavioral data without clearly describing a criterion of each behavior.

      Thank you for this very important suggestion. We now provided more detailed description of the two fighting forms in the Materials and Methods section. See below

      Lunging is characterized by a male raising its forelegs and quickly striking the opponent, and each lunge typically lasts less than 0.2 seconds through detailed analysis. Tussling is characterized by both males using their forelegs and bodies to tumble over each other, and this behavior may last from seconds to minutes. Tussling is often mixed with boxing, in which both flies rear up and strike the opponent with forelegs. Since boxing is often transient and difficult to distinguish from tussling, we referred to the mixed boxing and tussling behavior simply as tussling. As we manually analyze tussling for 2 hours for each pair of males, it is possible that we may miss some tussling events, especially those quick ones.

      It is also confusing that the authors completely skipped the characterization of the tussling-controlling neurons they claimed to have identified. These neurons (a subset of so-called pC1 neurons labeled by previously described split-GAL4 line pC1SS2) are central to this manuscript, but the only information the authors have provided is its gross morphology in a low-resolution image (Figure 4D, E) and a statement that "only 3 pairs of pC1SS2 neurons whose function is both necessary and sufficient for inducing tussling in males" (lines 310-311). The evidence that supports this claim isn't provided. The expression pattern of pC1SS2 neurons in males has been only briefly described in reference 46. It is possible that these neurons overlap with previously characterized dsx+ and/or fru+ neurons that are important for male aggressions (measured by lunges), such as in Koganezawa et al., Curr. Biol. 2016 and Chiu et al., Cell 2020. This adds to the concern that lunge and tussling are not as clearly separated as the authors claim.

      Thank you very much for this important question. Indeed, there are many experiments that could do to better understand the function of pC1SS2 neurons, and we only provide the initial characterization of them due to the limited scope of this study. My lab has been focused on studying P1/pC1 function in both male and female flies and will continue to do so.

      To partially address your concern, we made the following revisions

      (1) We provided higher-resolution images of P1a and pC1SS2 (Figure 4C-4E). While their cell bodies are very close, they project to distinct brain regions, in addition to some shared ones.

      (2) By staining these neurons with GFP and co-staining with anti-FruM or anti-DsxM antibodies, we showed that P1a neurons are partially FruM-positive and partially DsxM-positive, while pC1SS2 neurons are DsxM-positive and FruM-negative (Figure 5A-5D).

      (3) As pC1SS2 neurons are DsxM-positive and FruM-negative, we also examined how DsxM regulates the development of these neurons. We found that knocking down DsxM expression in pC1SS2 neurons using RNAi significantly affected pC1 development regarding to both cell numbers (Figure 5G) and their projections (Figure 5H).

      (4) We further found that DsxM in pC1SS2 neurons is crucial for executing their tussling-promoting function, as optogenetic activation of these neurons with DsxM knockdown failed to induce tussling behavior in the initial activation period, and a much lower level of tussling in the second activation period compared to control males (Figure 5I-5K).

      (5) While it is very difficult to identify the upstream and downstream neurons of P1a and pC1SS2 neurons, we made an initial step by utilizing trans-tango and retro-Tango to visualize potential downstream and upstream neurons of P1a and pC1SS2 (Figure 4-figure supplement 2), which certainly needs future investigation.  

      While their characterizations of tussling behaviors in wild-type males (Figures 1 and 2) are intriguing, the remaining data have little link with each other, making it difficult to understand what their main conclusion is. Figure 3 suggests that one class of olfactory sensory neurons (OSN) that express Or47b is necessary for tussling behavior. While the authors acknowledged that Or47b-expressing OSNs promote male courtship toward females presumably by detecting cuticular compounds, they provided little discussion on how a class of OSN can promote two different types of innate behavior. No evidence of a functional or circuitry relationship between the Or47b pathway and the pC1SS2 neurons was provided. It is unclear how these two components are relevant to each other.

      It has been previously found that Or47b-expressing ORNs respond to fly pheromones common to both sexes, and group-housing enhances their sensitivity. Regarding to how Or47b ORNs promotes two different types of innate behaviors, a simple explanation is that they act on multiple second-order and further downstream neurons to regulate both courtship and aggression, not mentioning that neural circuitries for courtship and aggression are partially shared. We did not include this in the discussion as we would like to focus on aggression modes, and how different ORNs (Or47b and Or67d) mediate distinct aggression modes.

      Regarding to the relationship between Or47b ORNs and pC1<sub>SS2</sub> neurons, or in general ORNs to P1/pC1, it is interesting and important to explore, but probably in a separate study. We tried to conduct pathway connection analyses from Or47b to pC1 using the FlyWire database, and found that Or47b neurons can act on pC1 neurons via three layers of interneurons. Although the FlyWire database currently only contains neuronal data from female brains, they can provide a certain degree of reference. We hope the editor and reviewers would agree with us that identifying these intermediate neurons involved in their connection is beyond this study.

      Lastly, the rationale of the experiment in Figure 5 and the interpretation of the results is confusing. The authors attributed a higher mating success rate of older, socially experienced males over younger, socially isolated males to their tendency to tussle, but tussling cannot happen when one of the two flies is not engaged. If, for instance, a socially isolated 14-day-old male does not engage in tussling as indicated in Figure 2, how can they tussle with a group-housed 14-day-old male? Because aggressive interactions in Figure 5 were not quantified, it is impossible to conclude that tussling plays a role in copulation advantage among pairs as authors argue (lines 282-288).

      Indeed, we do not have direct evidence to show it is tussling that makes socially experienced males to dominate over socially isolated males. To address your concern, we have made following revisions

      (1) We toned down the statements about the relationship between fighting strategies and reproductive success throughout the manuscript. For example, in the abstract Moreover, shifting from lunging to tussling in socially enriched males is accompanied with better territory control and mating success.

      (2)  Regarding to whether a SH male can engage in tussling with a GH male, we found that while two SH males rarely perform tussling, paired SH and GH males displayed similar levels of tussling like two GH males, although tussling duration from paired SH and GH males is significantly lower compared to that in two GH males (Figure 6-figure supplement 2).

      (3) To support the potential role of tussling in territory control and mating competition, we performed additional experiments to silence Or47b or pC1SS2 neurons that almost abolished tussling, and paired these males with control males. We found that males with Or47b or pC1SS2 neurons silenced cannot compete over control males, further suggesting the involvement of tussling in territory control and mating competition.  

      Despite these weaknesses, it is important to acknowledge the authors' courage to initiate an investigation into a less characterized, high-intensity fighting behavior. Tussling requires the simultaneous engagement of two flies. Even if there is confusion over the distinction between lunges and tussling, the authors' conclusion that socially experienced flies and socially isolated flies employ distinct fighting strategies is convincing. Questions that require more rigorous studies are 1) whether such differences are encoded by separate circuits, and 2) whether the different fighting strategies are causally responsible for gaining ethologically relevant resources among socially experienced flies. Enhanced transparency of behavioral data will help readers understand the impact of this study. Lastly, the manuscript often mentions previous works and results without citing relevant references. For readers to grasp the context of this work, it is important to provide information about methods, reagents, and other key resources.

      Thank you very much for this comment and we almost totally agree.

      (1) Our results suggest the involvement of distinct sensory neurons and central neurons for lunging and tussling, but do not exclude the possibility that they may also utilize shared neurons. For example, activation of P1a neurons promotes both lunging and tussling in the presence of light.

      (2) We have now toned down the statements about the relationship between fighting strategies and reproductive success throughout the manuscript.

      (3) We provided more detailed methods, genotypes of flies to improve transparency of the manuscript.

      Reviewer #1 (Recommendations for the authors):

      (1) Figure 1 Supplement 1 shows that increased aging has a linear and inverse relationship with the number of lunges, this is in contrast to a previous study from Dierick lab (Chowdhury, 2021), where using Divider assays they showed that aggressive lunges increased up to day 10 and subsequently decreased in 30-day old flies. Given that this study did not use 14-day-old flies, it might be useful to comment on this.

      Thank you for this comment. Indeed, Chowdhury et al., suggested a decline of lunging after 10 days, which is not contradictory to our findings that lunging in 14d-old males is lower than that in 7d-old males. It is ideally to perform a time-series experiments to reveal the detailed relationship between ages and aggression (lunging or tussling) levels, but given our initial findings that 14d-old males showed stable tussling behavior, we prefer to use this time point for the rest of this study.

      (2) For Figure 3, do various manipulations also affect the duration of tussling and boxing besides frequency and latency?

      Thank you for this comment. We only analyzed latency and frequency, but not duration, as data analysis was performed manually rather than automatically on every fly pair for about 2 hours, which is very labor-consuming. We hope you could agree with us that the two parameters (frequency and latency) for tussling are representative for assaying this behavior.

      (3) For Figure 3 A-F, the housing status of the males is not clearly mentioned either in the main text or the figure. What is the status of the tussling and lunging status when this housing condition is reversed when Or47b neurons are silenced, or the gene is knocked down? Do these manipulations overcome the effect of housing conditions similar to what is seen in NaChBac-mediated activation experiments?

      Figure 3A-F used group-housed males and we have now added such information in the figure legends as well as Table S1.

      We appreciate your suggestion on using different housing conditions. As silencing Or47b neurons or knocking down Or47b reduced tussling, it is reasonable to use GH males (as we did in Figure 3A-F) that performed stable tussling behavior, but not SH males that rarely tussle.

      (4) The connections between Or47b neurons and pC1SS2 or P1a neurons can be addressed by available connectomic datasets or TransTango/GRASP approaches.

      Thank you for this important suggestion. We used the FlyWire electron microscope database to analyze the pathway connections between these two types of neurons. The results indicated that there are at least three levels of interneurons for connecting Or47b and pC1 neurons. Although the FlyWire database currently only contains neuronal data from female brains, they can provide a certain degree of reference for males.

      The lack of direct synaptic connection also suggests that it is challenging to resolve the connection between these two neuronal types using methods like trans-Tango/GRASP. To partially address this question, we utilized trans-Tango and retro-Tango techniques to visualize potential downstream and upstream neurons of P1a and pC1SS2 (Figure 4-figure supplement 2). Future investigations are certainly needed for clarifying functional connections between Or47b/Or67d and P1a/pC1SS2 neurons.

      (5) Figure 5, 'Winning index' and 'Copulation advance index' while described in Material and Methods, should be referred to in the main text.

      We now described these two indices briefly in the main manuscript, and in the Discussion section with more details.

      (6) Figure 6 shows comparisons for territorial control and mating outcomes where four different housing and aging conditions are organized in a hierarchical sequence. It is not clear from the data in Figure 5, how this conclusion was arrived at. A supplementary table with various outcomes with statistical analysis would help with this.

      We now added a supplementary table (Table S2) with various outcomes with statistical analysis.

      Minor Comments

      (1) Line 26 says that the courtship levels in SH and GH males are not different, however, unilateral wing extension is higher in SH males as compared to GH males (Pan & Baker, 2014; Inagaki et al., 2014), also it was shown that courtship attempts are higher in D. paulsitorium (Kim & Ehrman, 1998). It would be better to clarify this statement.

      Indeed, it is found in some cases that SH males court more vigorously than GH males. We have added more references on this matter in the introduction.

      (2) Figure 4, correct 'Tussing' to 'Tussling' or 'Box, Tussling' as appropriate.

      Corrected.

      (3) Duistermars, 2018 should be cited while discussing the role of vision in aggression (Figure 4). [A Brain Module for Scalable Control of Complex, Multi-motor Threat Displays]

      We now cited this reference and added more discussion in the revised manuscript.

      (4) Reviews on Drosophila aggression and social isolation can be cited in the introduction/discussion to incorporate recent literature e.g., Palavicino-Maggio, 2022 [The Neuromodulatory Basis of Aggression Lessons From the Humble Fruit Fly]; Yadav et al., 2024[Lessons from lonely flies Molecular and neuronal mechanisms underlying social isolation], etc.

      We now cited these references in both the introduction and discussion sections.

      (5) The concentration of apple juice agar should be mentioned in the methods.

      We added this and other necessary information for materials in the Materials and Methods section of the study.

      (6) Source of the LifeSongX software and, if available, a Github link would be helpful to include in the materials and methods section.

      We now provided the source of the LifesongY software (website https//sourceforge.net/projects/lifesongy/), which is a Windows version of LifesongX (Bernstein, Adam S.et al., 1992).

      Reviewer #2 (Recommendations for the authors):

      (1) Major comment 1

      As pointed out in the public review, the weakness of this study is that the relationship between the aggression strategy and reproductive success is an inference that is not based on experimental facts; I understand that the frequency of tussling is not so high, but at least tussling-like behavior can be observed in the territory control experiment shown in Video 3. Wouldn't it be possible to re-analyse data and examine the correlation between aggressive behavior and territory control? Even if the analysis of tussling itself in this setup is difficult, for example, additional experiments using Or47b knock-out fly or pC1[SS2]-inactivated fly could provide stronger support.

      Indeed, we can only make a correlation between the type of aggressive behavior and territory control. We now toned down this statement throughout the manuscript. For example, in the abstract, we changed our conclusions as following

      Moreover, shifting from lunging to tussling in socially enriched males is accompanied with better territory control and mating success. Our findings identify distinct sensory and central neurons for two fighting forms and suggest how social experience shapes fighting strategies to optimize reproductive success.

      To further address the concern, we now performed additional experiments to silence Or47b or pC1SS2 neurons that almost abolished tussling, and paired these males with control males. We found that males with Or47b or pC1SS2 neurons silenced cannot compete over control males (Figure 6-figure supplement 3), further suggesting the involvement of tussling in territory control and mating competition.

      In relation to the above, some of the text in the Abstract should be changed.Line 28 These findings "reveal" how social experience shapes fighting strategies to optimise reproductive success.

      "suggest" is more accurate at this stage.

      Changed as suggested.

      (2) Major comment 2

      The tussling is the central subject of this paper. However, neither the main text nor Materials and Methods section provides a clear explanation of how this aggression mode was detected. Did the authors determine this behavior manually? Or was it automatically detected by some kind of image analysis? In either case, the criteria and method for detecting the tussling should be clearly described.

      The behavioral data analysis in this study was performed manually. We now provided more detailed description of the two fighting forms in the Materials and Methods section. See below

      Lunging is characterized by a male raising its forelegs and quickly striking the opponent, and each lunge typically lasts less than 0.2 seconds through detailed analysis. Tussling is characterized by both males using their forelegs and bodies to tumble over each other, and this behavior may last from seconds to minutes. Tussling is often mixed with boxing, in which both flies rear up and strike the opponent with forelegs. Since boxing is often transient and difficult to distinguish from tussling, we referred to the mixed boxing and tussling behavior simply as tussling. As we manually analyze tussling for 2 hours for each pair of males, it is possible that we may miss some tussling events, especially those quick ones.

      For the experimental groups where tussling cannot be observed, the latency is regarded as 120 min, but this is a value depending on the observation time. While it is reasonable to use the latency to evaluate the behavior such as the lunging that is observed at relatively early times, care should be taken when using it to evaluate the tussling. Since similar trends to those obtained for the latency are observed for Number of tussles and % of males performing tussling, it may be better to focus on these two indices.

      We initially intended to provide all three statistical metrics. However, we found that using the "% of males performing tussling" would require a significantly larger sample size for subsequent statistical analysis (using chi-square tests), greatly increasing the workload. At the same time, we believe that the trend observed with "% of males performing tussling" is consistent with the other two indices, and the percentage information can also be derived from the individual sample scatter data of the other two metrics. Therefore, we opted to use "latency" and "numbers" as the statistical metrics, despite the caveat as you mentioned.

      The authors repeatedly mention that tussling is less frequent but more vigorous. The low frequency can be understood from the data in Fig. 1 and Fig. 2, but there are no measured data on the intensity. As the authors mention in line 125, each tussling event appears to be sustained for a relatively long period, as can be seen from the ethogram in Fig. 2. For example, it would be possible to evaluate the intensity by measuring the duration of the tussling event.

      Thank you for your valuable suggestion. We now analyzed duration of tussling and lunging, and found that a lunging event is often very short (less than 0.2s), while a tussling event may last from seconds to minutes, further supporting their relative intensities. This new data is added as Figure 2G.

      (3) Minor comments

      a) Line 117 How many flies were placed in one vial for group-rearing (GH)? Were males and females grouped together? Please specify in the Materials and Methods section.

      We have added this information in the Materials and Methods section. In brief, 30-40 virgin males were collected after eclosion and group-housed in each food vial.

      b) Line 174 The trans-Tango is basically a postsynaptic cell labeling technique. It is unlikely that the labeling intensity changes depending on neuronal activity. Do the authors want to say in this text the high activity of Or47b-expressing neurons under GH conditions? Or are they trying to show that the expression level of the Or47b gene, which is supposedly monitored by the expression of GAL4, is increased by GH conditions? The authors should clarify which is the case.

      Although the primary function of the trans-Tango technique is to label downstream neurons, the original literature indicates that the signal strength in downstream neurons depends on the use of upstream neurons evidenced by age-dependent trans-Tango signals. Therefore, the trans-Tango technique can indirectly reflect the usage of upstream neurons. Our findings that GH males showed broader Or47b trans-Tango signals than SH males can indirectly suggest that group-housing experience acts on Or47b neurons. We made textually changes to clarify this.

      c) Line 178 Which fly line labels the mushroom body; R19B03-GAL4?

      Yes, we now provided the detailed genotypes for all tested flies in the Table S1.

      d) Line 184 It was reported in Koganezawa et al., 2016 that some dsx-expressing pC1 neurons are involved in aggressive behavior. The authors should also refer to this paper as they include tussling in the observed aggressive behavior.

      Thank you for this comment, and we now cited this reference in the revised manuscript.

      e) Line 339 I think you misspelled fruM RNAi.

      Thank you for pointing this out. fruMi refers to microRNAi targeting fruM, and we have now clearly stated this information in the main text.

      f) Line 681 Is tussling time (%) the total duration of tussling occurrences during the observation time? Or is it the percentage of individuals observed tussling during the observation time? This needs to be clarified.

      It is the former one. We now clearly stated this definition in the Materials and Methods section

      Reviewer #3 (Recommendations for the authors):

      For authors to support their conclusion that enhanced tussling among socially experienced flies allows them to better retain resources, it is necessary to quantify aggressive behaviors (mainly tussling and lunging) in Figure 5.

      We agree that we can only make a correlation between enhanced tussling behavior and mating competition. We now toned down this statement throughout the manuscript. For example, in the abstract, we changed our conclusions as following Moreover, shifting from lunging to tussling in socially enriched males is accompanied with better territory control and mating success. Our findings identify distinct sensory and central neurons for two fighting forms and suggest how social experience shapes fighting strategies to optimize reproductive success.

      To further address the concern, we now performed additional experiments to silence Or47b or pC1SS2 neurons that almost abolished tussling, and paired these males with control males. We found that males with Or47b or pC1SS2 neurons silenced cannot compete over control males (Figure 6-figure supplement 3), further suggesting the involvement of tussling in territory control and mating competition.

      In contrast to the authors' data in Figure 4, movies in ref 36 clearly show instances of 2 flies exchanging lunges after the optogenetic activation of P1a neurons, like the examples shown in supplementary movies S1-S3. It is a clear discrepancy that requires discussion (and raises a concern about the lack of transparency about behavioral quantification).

      In our study, optogenetic activation of P1<sup>a</sup> neurons failed to induce obvious tussling behavior, and temperature-dependent activation of P1<sup>a</sup> neurons can only induce tussling in the presence of light. These data are different from Hoopfer et al., (2015), but are generally consistent with a new study (Sten et al., Cell, 2025), in which pC1SS2 neurons but not P1a neurons promote aggression. Such discrepancy has now been discussed in the revised manuscript.

      The authors often fail to cite relevant references while discussing previous results, which compromises the scholarship of the manuscript. Examples include (but are not limited to)

      (1) Line 85-86 Simon and Heberlein, J. Exp. Biol. 223 jeb232439 (2020) suggested that tussling is an important factor for flies to establish a dominance hierarchy.

      Reference added.

      (2) Line 142-143 Cuticular compounds such as palmitoleic acid are characterized to be the ligands of Or47b by ref #18.

      Reference added.

      (3) Line 185-187 pC1SS1 and pC1SS2 are first characterized by ref #46. Expression data of this paper also implies that pC1SS1 and pC1SS2 label different neurons in the male brain.

      We have now added this reference at the appropriate place in the revised manuscript. In addition, we have clarified that these two drivers exhibit sexually dimorphic expression patterns in the brain.

      (4) Line 196-199 Cite ref #36, which describes the behavior induced by the optogenetic activation of P1a neurons.

      Reference added.

      (5) Line 233-235 The authors' observation that control males do not form a clear dominance directly contradicts previous observations by others (Nilsen et al., PNAS 10112342 (2002); Yurkovic et al., PNAS 10317519 (2006); also see Trannoy et al., PNAS 1134818 (2016) and Simon and Heberlein above). The authors must at least discuss why their results are different.

      There is a misunderstanding here. We clearly state that there is a ‘winner takes all’ phenomenon. However, for wild-type males of the same age and housing condition, we calculated the winning index as (num. of wins by unmarked males – num. of wins by marked males)/10 encounters * 100%, which is roughly zero due to the randomness of marking.

      (6) Line 251-254 The authors' observation that aged males are less competitive than younger males contradicts the conclusion in ref #18. Discussion is required.

      We have now added a discussion on this matter. In brief, Lin et al., showed that 7d-old males are more competitive than 2d-old males, which is probably due to different levels of sexual maturity of males, but not a matter of age like our study that used up to 21d-old males.

      (7) Line 274-275 It is unclear which "previous studies" "have found that social isolation generally enhances aggression but decreases mating competition in animal models". Cite relevant references.

      Reference added.

      (8) Line 309-310 The evidence supporting the statement that "there are only three pairs of pC1SS2 neurons". If there is a reference, cite it. If it is based on the authors' observation, data is required.

      We have now provided additional data on the number of pC1SS2 neurons in Figure 5G of the revised manuscript.

    1. eLife Assessment

      This important study examines the role of endothelin signaling in nerve regeneration, providing convincing evidence that it functions as a default brake on axon regrowth. Inhibiting endothelin signaling with Bosentan promotes regeneration and counteracts the decline in regenerative potential caused by aging. Since Bosentan is an FDA-approved drug, these findings could have therapeutic value in clinical settings where peripheral nerve regeneration is not adequate or seriously impaired, as is often the case in older individuals.

    2. Reviewer #1 (Public review):

      The manuscript by Feng et al. reported that Endothelin B receptor (ETBR) expressed by the satellite glial cells (SGCs) in the dorsal root ganglions (DRG) acted to inhibit sensory axon regeneration in both adult and aged mice. Thus, pharmacological inhibition of ETBR with specific inhibitors resulted in enhanced sensory axon regeneration in vitro and in vivo. In addition, sensory axon regeneration significantly reduces in aged mice and inhibition of ETBR could restore such defect in aged mice. Moreover, the study provided some evidence that the reduced level of gap junction protein connexin 43 might act downstream of ETBR to suppress axon regeneration in aged mice. Overall, the study revealed an interesting SGC-derived signal in the DRG microenvironment to regulate sensory axon regeneration. It provided additional evidence that non-neuronal cell types in the microenvironment function to regulate axon regeneration via cell-cell interaction.

      However, the molecular mechanisms by which ETBR regulates axon regeneration are unclear, and the structure of the manuscript is relatively not well organized, especially the last section. Some discussion and explanation about the data interpretation are needed to improve the manuscript.

      (1) The result showed that the level of ETBR was not changed after the peripheral nerve injury. Does it mean that its endogenous function is to limit the spontaneous sensory axon regeneration? In other words, the results suggest that SGCs expressing ETBR or vascular endothelial cells expressing its ligand ET-1 act to suppress sensory axon regeneration. Some explanation or discussion about this are necessary. Moreover, does the protein level of ETBR or its ligand change during aging?

      (2) In ex vivo experiments, NGF was added in the culture medium. Previous studies have shown that adult sensory neurons could initiate fast axon growth in response to NGF within 24 hours. In addition, dissociated sensory neurons could also initiate spontaneous regenerative axon growth without NGF after 48 hours. Some discussion or rationale is needed to explain the difference between NGF-induced or spontaneous axon growth of culture adult sensory neurons and the roles of ETBR and SGCs.

      (3) In cultured dissociated sensory neurons, inhibiting ETBR also enhanced axon growth, which meant the presence of SGCs surrounding the sensory neurons. Some direct evidence is needed to show the cellular relationship between them in culture.

      (4) In Figure 3, the in vivo regeneration experiments first showed enhanced axon regeneration either at 1 day or 3 days after the nerve injury. The study then showed that inhibiting ETBR could enhance sensory axon growth in vitro from uninjured naïve neurons or conditioning lesioned neurons. To my knowledge, in vivo sensory axon regeneration is relatively slow during the first 2 days after the nerve injury and then enter the fast regeneration mode in the 3rd day, representing the conditioning lesion effect in vivo. Some discussion is needed to compare the in vitro and the in vivo model of axon regeneration.

      (5) In Figure 5, the study showed that the level of connexin 43 increased after ETBR inhibition in either adult or aged mice, proposing an important role of connexin 43 in mediating the enhancing effect of ETBR inhibition on axon regeneration. However, in the study there was no direct evidence supporting that ETBR directly regulate connexin 43 expression in SGCs. Moreover, there was no functional evidence that connexin 43 acted downstream of ETBR to regulate axon regeneration.

      In the revised manuscript, most comments have been addressed with some new experiments or text revisions in the results or discussion. For representative images showing in vitro cultured DRG neurons, it would be much more convincing if several neurons in the same imaging field are shown, rather than a single neuron (Figure 2A, 3J).

    3. Reviewer #2 (Public review):

      Summary:

      Feng and colleagues set out to investigate the effect of manipulating endothelin signaling on nerve regeneration, focusing on the crosstalk between endothelial cells (ECs) in dorsal root ganglia (DRG), which secrete ET-1, and satellite glial cells (SGCs), which express the ETBR receptor. ETBR signaling limits axon growth. Using in vitro explant assays coupled with pharmacological inhibition in mouse models of nerve injury, the authors demonstrate that the ETAR/ETBR antagonist Bosentan promotes axon regeneration, and that this effect is maintained in aged mice. Although Bosentan inhibits both endothelin receptors A and B, comparison with an ETAR-specific antagonist suggests primary involvement of the ET-1/ETBR pathway. In the DRG, ETBR is mostly expressed by SGCs, a cell type implicated in nerve regeneration. SGCs ensheath and couple with DRG neurons through gap junctions formed by Cx43. The pro-regenerative effects of ETBR inhibition are attributed in part to an increase in Cx43 levels, which are expected to enhance neuron-SGC coupling. snRNA sequencing and TEM analysis reveal a decline in SGC numbers, morphological changes, and transcriptional reprogramming that may impair their pro-regenerative capacity.

      Strengths:

      The study is well-executed, and the main conclusion (that ETBR signaling inhibits axon regeneration after nerve injury and contributes to the age-related decline in regenerative capacity) is well supported by the data. In addition, the study highlights the importance of vascular signals in nerve regeneration, a topic that has gained traction in recent years. Importantly, these results further emphasize the contribution of long-neglected SGCs to nerve tissue homeostasis and repair. Although the study does not provide a complete mechanistic understanding, the findings are robust and are likely to attract the interest of a broad readership.

      Weaknesses:

      While certain aspects could have been further addressed experimentally, these points were either technically challenging or considered beyond the scope of the current study, and are appropriately addressed in the Discussion.

      (1) It remains to be determined whether the accelerated axon regrowth observed after nerve injury depends on cellular crosstalk mediated by ET-1 at the lesion site. Are ECs along the nerve secreting ET-1? What cells are present in the nerve stroma that could respond and participate in the repair process? Would these interactions be sensitive to Bosentan? Dissecting these contributions would require cell-specific manipulations. The potential roles of ECs, fibroblast and SCs in the nerve are discussed.

      (2) It is suggested that the permeability of DRG vessels may facilitate the release of vascular-derived signals. The possibility that the ET-1/ETBR pathway modulates vascular permeability, and that this in turn contributes to the observed effects on regeneration, is discussed.

      (3) It cannot be excluded that ET-3 in fibroblasts is relevant for controlling SGC responses. The possibility that both ET-1 and ET-3 participate in ETBR- dependent effect on axon regeneration is discussed.

      (4) The discovery that ET-1/ETBR signaling in SGC curtails the growth capacity of axons at baseline raises questions about the physiological role of this pathway. This remains to be elucidated with cell type-specific knockout approaches.

      (5) The modulation of Cx43 expression by ET-1/ETBR is examined by immunostaining, but a complementary analysis by quantitative RT-PCR on sorted SGCs would have been a valuable addition. However, quantifying Cx43 on purified SGCs was not attainable due to technical complications.

      (6) The conclusion "that ETBR inhibition in SGCs contributes to axonal regeneration by increasing Cx43 levels, gap junction coupling or hemichannels and facilitating SGC-neuron communication" are consistent with previous studies (Procacci et al., 2008) but in apparent discrepancy with increased gap junctions and dye coupling in SGCs of aged mice (Huang et al., 2006). More experiments are required to clarify what distinguishes a beneficial increase in coupling after ETBR inhibition, from what is observed in aging.

      (7) The effect of Bosentan likely extends beyond the modulation of Cx43 levels. Cell type-specific knockout of Cx43 and ETBR, studies of SGCs-neuron coupling, and biochemical analysis of Cx43 functions would clarify the link between ETBR, Cx43 regulation, and axon regeneration. A discussion of alternative mechanisms is provided.

    4. Author response:

      The following is the authors’ response to the original reviews.

      Reviewer #1 (Public Review): 

      The manuscript by Feng et al. reported that the Endothelin B receptor (ETBR) expressed by the satellite glial cells (SGCs) in the dorsal root ganglions (DRG) acted to inhibit sensory axon regeneration in both adult and aged mice. Thus, pharmacological inhibition of ETBR with specific inhibitors resulted in enhanced sensory axon regeneration in vitro and in vivo. In addition, sensory axon regeneration significantly reduces in aged mice and inhibition of ETBR could restore such defect in aged mice. Moreover, the study provided some evidence that the reduced level of gap junction protein connexin 43 might act downstream of ETBR to suppress axon regeneration in aged mice. Overall, the study revealed an interesting SGC-derived signal in the DRG microenvironment to regulate sensory axon regeneration. It provided additional evidence that non-neuronal cell types in the microenvironment function to regulate axon regeneration via cell-cell interaction. 

      However, the molecular mechanisms by which ETBR regulates axon regeneration are unclear, and the manuscript's structure is not well organized, especially in the last section. Some discussion and explanation about the data interpretation are needed to improve the manuscript. 

      We thank the reviewer for the positive comments. We agree that the mechanisms by which ETBR signaling functions as a brake on axon growth and regeneration remain to be elucidated. We believe that unraveling the detailed molecular pathways downstream of ETBR signaling in SGCs that promote axon regeneration is beyond the scope of this manuscript. Answering these questions would first require cell specific KO of ETBR and Cx43 to confirm that this pathway is operating in SGCs to control axon regeneration. We would also need to identify how SGCs communicate with neurons to regulate axon regeneration, which is a large area of ongoing research that remains poorly understood. Our data showing that pharmacological inhibition of ETBR with specific FDA-approved inhibitors enhances sensory axon regeneration provide not only new evidence for non-neuronal mechanisms in nerve repair, but also a new potential clinical avenue for therapeutic intervention.

      As suggested by the reviewer, we have extensively revised the organization of the manuscript, especially the last section of results. We have performed additional snRNAseq experiments to establish the impact of aging in DRG. We have also performed additional experiments to determine if blocking ETBR improves target tissue reinnervation. Following the reviewer’s suggestion, we have also expanded the Discussion section to discuss alternative mechanisms and o]er additional interpretation of our data. Below we describe how we address each point in detail.

      (1) The result showed that the level of ETBR did not change after the peripheral nerve injury. Does this mean that its endogenous function is to limit spontaneous sensory axon regeneration? In other words, the results suggest that SGCs expressing ETBR or vascular endothelial cells expressing its ligand ET-1 act to suppress sensory axon regeneration. Some explanation or discussion about this is necessary. Moreover, does the protein level of ETBR or its ligand change during aging?  

      We thank the reviewer for this point. Our results indeed indicate that one endogenous function of ETBR is to limit the extent of sensory axon regeneration. This may be a part of a mechanism to limit spontaneous sensory axon growth or plasticity and maladaptive neural rewiring after nerve injury. While the increased growth capacity of damaged peripheral axons can lead to reconnection with their targets and functional recovery, the increased growth capacity can also lead to axonal sprouting of the central axon terminals of injured neurons in the spinal cord, and to pain (see for example Costigan et al 2010, PMID: 19400724).  In the context of aging that we describe here, this protective mechanism may hinder beneficial recovery. Other mechanisms that slow axon regeneration have been reported, and include, for example, axonally synthesized proteins, which typically support nerve regeneration through retrograde signaling and local growth mechanisms. RNA binding proteins (RBP) are needed for this process. One such RBP, the RNA binding protein KHSRP is locally translated following nerve injury. Rather than promoting axon regeneration, KHSRP promotes decay of other axonal mRNAs and slows axon regeneration.  Another example includes the Rho signaling pathway, which was shown to function as an inhibitory mechanism that slows the growth of spiral ganglion neurites in culture. We have now included these examples in the Discussion section.

      To address the reviewer’s second question, we have checked protein levels of ETBR and ET-1 in adult and aged DRG tissue. We observed a robust increase in ET-1 in aged DRG, while the levels of ETBR did not appear to change significantly. These results are now presented in Figure 4- Figure Supplement 1, and further support the notion that in aging, activation of the ETBR signaling hinders axon regeneration.

      (2) In ex vivo experiments, NGF was added to the culture medium. Previous studies have shown that adult sensory neurons could initiate fast axon growth in response to NGF within 24 hours. In addition, dissociated sensory neurons could also initiate spontaneous regenerative axon growth without NGF after 48 hours. Some discussion or rationale is needed to explain the di]erence between NGF-induced or spontaneous axon growth of culture adult sensory neurons and the roles of ETBR and SGCs. 

      We appreciate the reviewer’s suggestion. In adult DRG explant or dissociated cultures, NGF is not typically required for survival or axon outgrowth. However, in dissociated culture, the addition of NGF to the medium stimulates growth from more neurons compared to controls (Smith and Skene 1997). In the DRG explant, NGF does not promote significant e]ects on axon growth, but stimulates glial cell migration (Klimovich et al 2020). We opted to included NGF in our explant assay to increase the potential of stimulating axon regeneration with pharmacological manipulations of ETBR. We have now clarified these considerations in the Method section.

      (3) In cultured dissociated sensory neurons, inhibiting ETBR also enhanced axon growth, which meant the presence of SGCs surrounding the sensory neurons. Some direct evidence is needed to show the cellular relationship between them in culture.  

      We thank the reviewer for raising this point and have added new data, now presented in Figure 2B, to show that in mixed DRG cultures, SGCs labeled with Fabp7 are present in the culture in proximity to neurons labeled with TUJ1, but they do not fully wrap the neuronal soma. These results are consistent with prior findings reporting that as time in culture progresses, SGCs lose their adhesive contacts with neuronal soma and adhere to the coverslip (PMID: 22032231, PMID: 27606776).  While in some cases SGCs can maintain their association with neuronal soma in the first day in culture after plating, in our hands, most SGCs have left the soma at the 24h time point we examined. 

      (4) In Figure 3, the in vivo regeneration experiments first showed enhanced axon regeneration either 1 day or 3 days after the nerve injury. The study then showed that inhibiting ETBR could enhance sensory axon growth in vitro from uninjured naïve neurons or conditioning lesioned neurons. To my knowledge, in vivo sensory axon regeneration is relatively slow during the first 2 days after the nerve injury and then enters the fast regeneration mode on the 3rd day, representing the conditioning lesion e]ect in vivo. Some discussion is needed to compare the in vitro and the in vivo model of axon regeneration. 

      We agree that axon growth is relatively slow the first 2 days and enters a fast growth mode on day 3. This has been elegantly demonstrated in Shin et al Neuron 2012 (PMID: 22726832), where an in vivo conditioning injury 3 days prior increases axon growth one day after injury. In vitro, similar e]ects have been described: a prior in vivo injury accelerates growth capacity within the first day in culture, but a similar growth mode occurs in naive adult neurons after 2-3 days in vitro (Smith and Skene 1996). We also know that the neurite growth in culture is stimulated by higher cell density, likely because non-neuronal cells can secrete trophic factors (Smith and Skene 1996). Our in vitro results thus suggest that blocking ETBR in SGCs in these mixed cultures may alter the media towards a more growth promoting state. In vivo, our data show that Bosentan treatment for 3 days partially mimics the conditioning injury and potentiate the e]ect of the conditioning injury. One possible interpretation is that inhibition of ETBR alters the release of trophic factors from SGCs. Future studies will be required to unravel how ETBR signaling influence the SGCs secretome and its influence on axon growth. We have now included these discussions points in the Results and Discussion Section.

      (5) In Figure 5, the study showed that the level of connexin 43 increased after ETBR inhibition in either adult or aged mice, proposing an important role of connexin 43 in mediating the enhancing e]ect of ETBR inhibition on axon regeneration. However, in the study, there was no direct evidence supporting that ETBR directly regulates connexin 43 expression in SGCs. Moreover, there was no functional evidence that connexin 43 acted downstream of ETBR to regulate axon regeneration.  

      We thank the reviewer for this point and agree that we do not provide direct evidence that connexin 43 acts downstream of ETBR to regulate axon regeneration. To obtain such functional evidence would require selective KO of ETBR and Cx43 in SGCs, which we believe is beyond the scope of the current study. We have revised the Results and Discussion sections to emphasize that while we observe that ETBR inhibition increases Cx43 levels and Cx43 levels correlates with axon regeneration, whether Cx43 directly mediates the e]ect on axon regeneration remains to be established.  We also discuss potential alternative mechanisms downstream of ETBR in SGCs that could contribute to the observed e]ects on axon regeneration. Specifically, we discuss the possibility that  ETBR signaling may limit axon regeneration via regulating SGCs glutamate reuptake functions, because of the following reasons: 1) Similarly to astrocytes, glutamate uptake by SGCs is important to regulate neuronal function, 2) exposure of cultured cortical astrocytes to endothelin results in a decrease in glutamate uptake that correlates with a major loss of basal glutamate transporter expression (GLT-1 and1), 3) Both glutamate transporters are expressed in SGCs in sensory ganglia 4) GLAST and glutamate reuptake function is important for lesion-induced plasticity in the developing somatosensory cortex. 

      Reviewer #2 (Public Review): 

      Summary: 

      In this interesting and original study, Feng and colleagues set out to address the e]ect of manipulating endothelin signaling on nerve regeneration, focusing on the crosstalk between endothelial cells (ECs) in dorsal root ganglia (DRG), which secrete ET-1 and satellite glial cells (SGCs) expressing ETBR receptor. The main finding is that ETBR signaling is a default brake on axon growth, and inhibiting this pathway promotes axon regeneration after nerve injury and counters the decline in regenerative capacity that occurs during aging. ET-1 and ETBR are mapped in ECs and SGCs, respectively, using scRNA-seq of DRGs from adult or aged mice. Although their expression does not change upon injury, it is modulated during aging, with a reported increase in plasma levels of ET-1 (a potent vasoconstrictive signal). Using in vitro explant assays coupled with pharmacological inhibition in mouse models of nerve injury, the authors demonstrate that ET-1/ETBR curbs axonal growth, and the ETAR/ETBR antagonist Bosentan boosts regrowth during the early phase of repair. In addition, Bosentan restores the ability of aged DRG neurons to regrow after nerve lesions. Despite Bosentan inhibiting both endothelin receptors A and B, comparison with an ETAR-specific antagonist indicates that the e]ects can be attributed to the ET-1/ETBR pathway. In the DRGs, ETBR is mostly expressed by SGCs (and a subset of Schwann cells) a cell type that previous studies, including work from this group, have implicated in nerve regeneration. SGCs ensheath and couple with DRG neurons through gap junctions formed by Cx43. Based on their own findings and evidence from the literature, the pro-regenerative e]ects of ETBR inhibition are in part attributed to an increase in Cx43 levels, which are expected to enhance neuron-SGC coupling. Finally, gene expression analysis in adult vs aged DRGs predicts a decrease in fatty acid and cholesterol metabolism, for which previous work by the authors has shown a requirement in SGCs to promote axon regeneration. 

      Strengths: 

      The study is well-executed and the main conclusion that "ETBR signaling inhibits axon regeneration after nerve injury and plays a role in age-related decline in regenerative capacity" (line 77) is supported by the data. Given that Bosentan is an FDA-approved drug, the findings may have therapeutic value in clinical settings where peripheral nerve regeneration is suboptimal or largely impaired, as it often happens in aged individuals. In addition, the study highlights the importance of vascular signals in nerve regeneration, a topic that has gained traction in recent years. Importantly, these results further emphasize the contribution of longneglected SGCs to nerve tissue homeostasis and repair. Although the study does not reach a complete mechanistic understanding, the results are robust and are expected to attract the interest of a broader readership. 

      We thank the reviewer for the positive comments, especially in regard to the rigor and originality of our study.

      Weaknesses: 

      Despite these positive comments provided above, the following points should be considered: 

      (1) This study examines the contribution of the ET-1 pathway in the ganglia, and in vitro assays are consistent with the idea that important signaling events take place there. Nevertheless, it remains to be determined whether the accelerated axon regrowth observed in vivo depends also on cellular crosstalk mediated by ET-1 at the lesion site. Are ECs along the nerve secreting ET-1? What cells are present in the nerve stroma that could respond and participate in the repair process? Would these interactions be sensitive to Bosentan? It may be di]icult to dissect this contribution, but it should at least be discussed.  

      We thank the reviewer for this important point and agree that the in vivo e]ects observed cannot rule out the contribution of ECs or SCs at the lesion site in the nerve. Dissecting the contribution of ETBR expressing cells in the nerve would require cell-specific manipulations that go beyond the scope of this manuscript. We have revised the Discussion section to highlight the potential contribution of ECs, fibroblast and SCs in the nerve.  

      (2) It is suggested that the permeability of DRG vessels may facilitate the release of "vascularderived signals" (lines 82-84). Is it possible that the ET-1/ETBR pathway modulates vascular permeability, and that this, in turn, contributes to the observed e]ects on regeneration?  

      We thank the reviewer for raising this interesting point. ET-1 can have an impact on vascular permeability. It was indeed shown that in high glucose conditions, increased trans-endothelial permeability is associated with increased Edn1, Ednra and Ednrb expression and augmented ET1 immunoreactivity (PMID: 10950122). It is thus possible that part of the e]ects observed results from altered vascular permeability. We have included this point in the Discussion section. Future experiments will be required to test how injury and age a]ects vascular permeability in the DRG.

      (3) Is the a]inity of ET-3 for ETBR similar to that of ET-1? Can it be excluded that ET-3 expressed by fibroblasts is relevant for controlling SGC responses upon injury/aging?  

      We thank the reviewer for raising this point. ET-1 binds to ETAR and ETBR with the same a]inity, but ET3 shows a higher a]inity to ETBR than to ETAR (Davenport et al. Pharmacol. Rev 2016 PMID: 26956245). We attempted to examine ET-3 level in adult and aged DRG by western blot, but in our hands the antibody did not work well enough, and we could not obtain clear results. We thus cannot exclude the possibility that ET-3 released by fibroblasts contribute to the e]ects we observe on axon regeneration. Indeed, in cultured cortical astrocytes, application of either ET-1 or ET-3 leads to inhibition of Cx43 expression. We have revised the text in the Discussion section to highlight the possibility that both ET-1 and ET-3 could participate on the ETBRdependent e]ect on axon regeneration.

      (4) ETBR inhibition in dissociated (mixed) cultures uncovers the restraining activity of endothelin signaling on axon growth (Figure 2C). Since neurons do not express ET-1 receptors, based on scRNA-seq analysis, these results are interpreted as an indication that basal ETBR signaling in SGC curbs the axon growth potential of sensory neurons. For this to occur in dissociated cultures, however, one should assume that SGC-neuron association is present, similar to in vivo, or to whole DRG cultures (Figure 2C). Has this been tested?

      We thank the reviewer for this point. In dissociated DRG culture, neurons, SGCs and other nonneuronal cells are present, but SGCs do not retain the surrounding morphology as they do in vivo. Within 24 hours in culture, SGCs lose their adhesive contacts with neuronal soma and adhere to the coverslip (PMID: 22032231, PMID: 27606776).  We have included new data in Figure 2B to show that in our culture conditions, SGCs are present, but do not wrap neurons soma as they do in vivo. We also know from prior studies that the density of the culture a]ects axon growth, an e]ect that was attributed to trophic factors released from non-neuronal cells (Smith and Skene 1997). Therefore, although SGCs do not surround neurons, the signaling pathway downstream of ETBR may be present in culture and contribute to the release of trophic factors that influence axon growth. We have revised the Results section to better explain our in vitro results and their interpretation.

      In both in vitro experimental settings (dissociated and whole DRG cultures) how is ETBR stimulated over up to 7 days of culture? In other words, where does endothelin come from in these cultures (which are unlikely to support EC/blood vessel growth)? Is it possible that the relevant ligand here derives from fibroblasts (see point #6)? Or does it suggest that ETBR can be constitutively active (i.e., endothelin-independent signaling)? Is there any chance that endothelin is present in the culture media or Matrigel? 

      We thank the reviewer for raising this point.  Our single-cell data indicate that ET-1 is expressed by endothelial cells and ET-3 by fibroblasts. In dissociated DRG culture at 24h time point, all DRGs cells are present, including endothelial cells and fibroblasts, and could represent the source of ET-1 or ET-3. In the explant setting, it is also possible that both ET-1 and ET-3 are released by endothelial cells and fibroblasts during the 7 days in culture. According to information for the suppliers, endothelin is not present neither in the culture media nor in the Matrigel. While mutations can facilitate the constitutive activity of the ETBR receptor, we are not aware of data showing that endogenous ETBR can be constitutively active.  Because the molecular mechanisms governing ETBR -mediated signaling remain incompletely understood (see for example PMID: 39043181, PMID: 39414992) future studies will be required to elucidate the detailed mechanisms activating ETBR in SGCs and its downstream signaling mechanisms.  We have now expanded the Results and discussion sections to clarify these points. 

      (5) The discovery that ET-1/ETBR signaling in SGC curtails the growth capacity of axons at baseline raises questions about the physiological role of this pathway. What happens when ETBR signaling is prevented over a longer period of time? This could be addressed with pharmacological inhibitors, or better, with cell-specific knock-out mice. The experiments would certainly be of general interest, although not within the scope of this story. Nevertheless, it could be worth discussing the possibilities. 

      We agree that this is an interesting point. As mentioned above in response to point #1 of reviewer 1, the physiological role of this pathway could be to limit plasticity and prevent maladaptive neural rewiring that can happen after injury (Costigan et al 2009, PMID: 19400724), but can also hinder beneficial recovery after injury. Other mechanisms that limit axon regeneration capacity have been described and involve local mRNA translation and Rho signaling. We have revised the Discussion section to include these points. We agree that understanding the consequence of blocking ETBR over longer time periods is beyond the scope of the current study, but we now discuss the possibility that blocking ETBR with a cell specific KO approach could unravel its physiological function on target innervation and behavior. 

      (6) Assessing Cx43 levels by measuring the immunofluorescence signal (Figure 5E-F) is acceptable, particularly when the aim is to restrict the analysis to SGCs. The modulation of Cx43 expression by ET-1/ETBR plays an important part in the proposed model. Therefore, a complementary analysis of Cx43 expression by quantitative RT-PCR on sorted SGCs would be a valuable addition to the immunofluorescence data. Is this attainable? 

      We agree and have attempted to perform these types of experiments but encountered technical di]iculties. We attempted to sorting SGCs from transgenic mice in which SGCs are fluorescently labeled. However, the cells did not survive the sorting process and died in culture.  We think that increasing the viability of cells after sorting would require capillary- free fluorescent sorting approaches. However, we do not currently have access to such technology. We attempted this experiment with cultured SGCs, following a previously published protocol (Tonello et al. 2023 PMID: 38156033). In these experiments, SGCs are cultured for 8 days to obtain purity. We did not observe any di]erence in Cx43 protein or mRNA level upon treatment with ET-1 with or without BQ788. However, in these SGCs cultures, Cx43 displayed a di]use localization, rather than puncta as observed in vivo. Therefore, despite our multiple attempts, quantifying Cx43 on sorted or purified SGCs was not attainable.

      (7) The conclusions "We thus hypothesize that ETBR inhibition in SGCs contributes to axonal regeneration by increasing Cx43 levels, gap junction coupling or hemichannels and facilitating SGC-neuron communication" (lines 303-305) are consistent with the findings but seem in contrast with the e]ect of aging on gap junction coupling reported by others and cited in line 210: "the number of gap junctions and the dye coupling between these cells increases (Huang et al., 2006)". I am confused by what distinguishes a potential, and supposedly beneficial, increase in coupling after ETBR inhibition, from what is observed in aging. 

      We agree that the aging impact of Cx43 level and gap junction number appears contradictory. Procacci et al 2008 reported that Cx43 expression in SGCs decreases in the aged mice. Huang et al 2006 report that both the number of gap junctions and the dye coupling between these cells were found to increase with aging. Procacci et al suggested as a possible explanation for this apparent discrepancy that additional connexin types other than Cx43 may contribute to the gap junctions between SGCs in aged mice. Our snRNAseq data did not allow us to verify this hypothesis, because there were less SGCs in aged mice compared to adult, and connexin genes were detected in only 20% or less of SGCs.  Furthermore, our quantification did not look specifically at gap junctions, but just at Cx43 puncta. Cx43 can also form hemichannels in addition to gap junctions, and can also perform non-channel functions, such as protein interaction, cell adhesion, and intracellular signaling. Thus, more research examining the role of Cx43 in SGCs is necessary to address this discrepancy in the literature. We have expanded the Discussion section to include these points. 

      (8) I find it di]icult to reconcile the results in Figure 5F with the proposed model since (1) injury increases Cx43 levels in both adult and aged mice, (2) the injured aged/vehicle group has a similar level to the uninjured adult group, (3) upon injury, aged+Bosentan is much lower than adult+Bosentan (significance not tested). It seems hard to explain the e]ect of Bosentan only through the modulation of Cx43 levels. Whether the increase in Cx43 levels following ETBR inhibition actually results in higher SGC-neuron coupling has not been assessed experimentally. 

      We thank the reviewer for this point and agree that the e]ect of Bosentan is likely not exclusively through the modulation of Cx43 levels in SGCs, and that Cx43 levels may simply correlate with axon regenerative capacity. We have revised the manuscript to clarify this point.  We have also added the missing significance test in Figure 5F.

      Cell specific KO of Cx43 and ETBR would allow to test this hypothesis directly but is beyond the scope of the current study. We have not tested SGCs-neuron coupling, as these experiments are currently beyond our area of expertise. Cx43 has also other functions beyond gap junction coupling, such as protein interaction, cell adhesion, and intracellular signaling. Investigating the precise function of Cx43 would require in depth biochemical and cell specific experiments that are beyond the scope of this study. Furthermore, as we now mentioned in response to reviewer #2 point 5, ETBR signaling may also have other downstream e]ects in SGCs, such as glutamate transporters expression, or a]ect other cells in the nerve during the regeneration process. We have revised the Discussion section to include these alternative mechanisms.

      Reviewer #3(Public Review): 

      Summary: 

      This manuscript suggests that inhibiting ETBR via the FDA-approved compound Bosentan can disrupt ET-1-ETBR signalling that they found detrimental to nerve regeneration, thus promoting repair after nerve injury in adult and aged mice. 

      Strengths: 

      (1) The clinical need to identify molecular and cellular mechanisms that can be targeted to improve repair after nerve injury. 

      (2) The proposed mechanism is interesting. 

      (3) The methodology is sound. 

      We thank the reviewer for highlighting the strengths of our study

      Weaknesses: 

      (1) The data appear preliminary and the story appears incomplete. 

      We appreciate the reviewer’s point. We would like to emphasize that our results provide compelling evidence that ETBR signaling is a default brake on axon growth, and inhibiting this pathway promotes axon regeneration after nerve injury and counters the decline in regenerative capacity that occurs during aging. We also provide evidence that ETBR signaling regulates the levels of Cx43 in SGCs. Furthermore, our results document the use of an FDA approved compound to increase axon regeneration may be of interest to the broader readership, as there is currently no therapies to improve or accelerate nerve repair after injury. We agree that the detailed mechanisms operating downstream of ETBR will need to be elucidated. Answering these questions would first require cell specific KO of ETBR and Cx43 to confirm that this pathway is operating in SGCs to control axon regeneration. We would also need to identify how SGCs communicate with neurons to regulate axon regeneration, which is a large area of ongoing research that remains poorly understood. This extensive and highly complex set of experiments is beyond the scope of the current study. As we discussed in our response to reviewer #1 and #2 we attempted to perform numerous additional experiments to better define the role of ETBR signaling in SGCs in aging and have included additional results in Fig. 2B, Fig 3G-H,  Fig 5A-E, and Figure 4- Figure Supplement 1and Figure 5- Figure Supplement 1. We have expanded the

      Discussion to acknowledge the limitation of our study and to discuss possible mechanisms.  

      (2) Lack of causality and clear cellular and molecular mechanism. There are also some loose ends such as the role of connexin 43 in SGCs: how is it related to ET-1- ETBR signalling?  

      We thank the reviewer for this point and agree that the molecular mechanisms downstream of ETBR remain to be elucidated. However, we believe that our manuscript reports an interesting potential of an FDA-approved compound in promoting nerve repair. We focused on Cx43 downstream of ETBR signaling because decreased Cx43 expression in SGCs in ageing was previously established, but the mechanisms were not elucidated. Furthermore, it was reported that ET1 signaling in cultured astrocytes, which share functional similarities with SGCs, leads to the closure of gap junctions and reduction in Cx43 expression. Our study thus provides a mechanism by which ETBR signaling in SGCs regulates Cx43 expression. Whether Cx43 directly impact axon regeneration remains to be tested. Cell specific KO of Cx43 and ETBR would be required to answer this question. We have revised the Introduction and Discussion section extensively to provide a link between ETBR and Cx43 and to acknowledge the lack of causality in Cx43 in SGCs, as well as to provide additional potential mechanisms by which ETBR inhibition may promote nerve repair.

      Reviewer #2 (Recommendations For The Authors): 

      In addition to the points listed in the Public Review section, please consider the following comments: 

      (1) ETAR, which is high in mural cells, does not seem to be implicated in the reported proregenerative e]ects. Even so, can vasoconstriction be ruled out as an underlying cause of the age-dependent decline in axon regrowth potential and, more generally, in the e]ects of ET-1 inhibition on regeneration? This could be discussed. 

      We agree that we can’t exclude a role in vasoconstriction or e]ect on vascular permeability in the age-dependent decline in axon regrowth potential. However, our in vitro and ex vivo experiments, in which vascular related mechanisms are unlikely, suggest that vasoconstriction may not be a major contributor to the e]ects we observed.

      (2) The manuscript (e.g. line 287-288) would benefit from a discussion of the role that blood vessels play in the peripheral nervous system, and possibly CNS, repair. Vessels were shown to accompany regenerating fibers and instruct the reorganization of the nerve tissue to favor repair potentially through the release of pro-regenerative signals acting on stromal cells, glia, and other cellular components. Highlighting these processes will help put the current findings into perspective. 

      We agree and have revised the Discussion section to better explain the role of blood vessels in orientating Schwann cells migration and guiding axon regeneration.

      (3) The vast majority of the cells that are sequenced and shown in the UMAP in Figure 1C are from adult (3-month-old) mice [16,923 out of 18,098]. It would be useful to include the UMAP split (or color-coded) by timepoint to appreciate changes in cell clustering that may occur with aging.  

      We apologize for this misunderstanding, Figure 1C had all cells from all ages. However, the number of cells we obtained from the age group was insu]icient to perform in depth analysis of each cell type. We have thus revised this section and Figure 1, now only presenting the data from adult mice.  

      It is not discussed why fewer cells were sequenced at later stages. Additionally, I do not know how to interpret the double asterisks next to the labeling "18,098 samples" in Figure 1C. 

      Since our original sequencing of adult and aged mice using 10x yielded so few cells from the aged DRG, we tested and optimized a new technology for single cell preparation of DRG using Illumina Single Cell 3’ RNA Prep. This preparation creates templated emulsions using a vortex mixer to capture and barcode single-cell mRNA instead of a microfluidics system. This method yielded much better results for nuclei recovery from aged DRG, with more nuclei and better quality of nuclei. Thus, we now present in Figure 5 and Figure 5- Figure Supplement 1 the results from snRNA-sequencing of aged and adult DRG using the Illumina single cell kit. The results of the snRNA-sequencing show a decreased abundance of SGCs in aged mice, consistent with the results from our morphology analysis with EM. We were also able to perform SGCs-specific pathway analysis because of the increased number of nuclei captured in the aged SGCs, which we included in the manuscript.

      (4) The in vivo studies are designed to examine the e]ects of ETBR inhibition during the first phase of axon regrowth after nerve injury (1-3 days post-injury, dpi). Is there a reason why later stages have not been studied? It would be interesting to understand whether ETBR inhibition improves long-term recovery or is only e]ective at boosting the initial growth of axons through the lesion. It is possible that early inhibition will be enough for long-term recovery. If so, these experiments would define a sensitivity window with therapeutic value. 

      We agree that assessing functional recovery requires proper behavioral tests or morphological evaluations of reinnervation. To determine if Bosentan treatment has long-term e]ects on recovery, we administered Bosentan or vehicle for 3 weeks (daily for 1 week, and then once a week for the subsequent 2 weeks) after sciatic nerve crush. At 24 days after SNC, we assessed intraepidermal nerve fiber density (IENFD) in the injured paw and saw a trend towards increased fibers/mm in the treated animals (new Figure 3G,H). Future studies will examine how long-term Bosentan treatment a]ects functional recovery and innervation at later time points. Additionally, behavior assays will be needed to determine if these morphological changes relate to behavioral improvements using IENFD and behavior assays.

      (5) I am unsure if the gene expression analysis shown in Figure 6 fits well into this story. It is interesting per se and in line with previous work from this group showing the relevance of fatty acid metabolism in SGCs for axon regeneration. Nevertheless, without a mechanistic link to endothelin signaling and Cx43/gap junction modulation, the observations derived from DEG analysis are not well integrated with the rest and may be more distracting than helpful. One limitation is that there is no cell-type information for the DEGs due to the small number of cells recovered from aged mice. For instance, if ETBR inhibition rescued gene downregulation associated with fatty acid/cholesterol metabolism, then the DGE results would become more relevant for understanding the cellular basis of the pro-regenerative e]ect, which at this point remains quite speculative (lines 264-265; lines 318-319).  

      We agree and have added new snRNA sequencing data to replace these findings (see above response to point #4, new Figure 5 and Figure 5- Figure Supplement 1. The new data shows a decreased abundance of SGCs in aged mice, consistent with our TEM results. Pathway analysis revealed that aging triggers extensive transcriptional reprogramming in SGCs, reflecting heightened demands for structural integrity, cell junction remodeling, and glia–neuron interactions within the aged DRG microenvironment.  

      (6) It would be interesting to determine whether Bosentan increases SGC coverage of neuronal cell bodies in aged mice (Figures 6A-C). 

      We agree that this would be very interesting, but will require extensive EM analysis at di]erent time points and is beyond the scope of the current manuscript.

      (7) Finally, adding a summary model would help the readers. 

      We agree and have made a summary model, now presented in Figure 6F.

      Reviewer #3 (Recommendations For The Authors): 

      Longer time points post-injury and assessment of functional recovery after Bosentan would be of great value here. 

      We agree that assessing functional recovery requires proper behavioral tests or morphological evaluations of reinnervation. To determine if Bosentan treatment has long-term e]ects on recovery, we administered Bosentan or vehicle for 3 weeks (daily for 1 week, and then once a week for the subsequent 2 weeks) after sciatic nerve crush. At 24 days after SNC, we assessed intraepidermal nerve fiber density in the injured paw and saw a trend towards increased fibers/mm in the treated animals (Fig 3). While the results do not reach significance, we decided to include this new data as it provides evidence that Bosentan treatment may also improves long term recovery. Future studies will be required examine how long-term Bosentan treatment a]ects functional recovery and innervation at later time points. Additionally, behavior assays will be needed to determine if these morphological changes relate to behavioral improvements.

      It would be important to know how ET-1- ETBR signalling axis promotes the regeneration of axons:this remains unaddressed. What are the cells that are specifically involved? Endothelial cellsSGC- neurons- SC? There are no experiments addressing the role of any of these? 

      We agree that the molecular and cellular mechanisms by which ETBR signaling in SGCs promote axon regeneration remains to be elucidated.  Answering these questions would first require cell specific KO of ETBR and Cx43 to confirm that this pathway is operating in SGCs to control axon regeneration. We would also need to identify how SGCs communicate with neurons to regulate axon regeneration, which is a large area of ongoing research that remains poorly understood. While these are important experiments, because of numerous technical and temporal constrains, we believe they are beyond the scope of the current manuscript. 

      How does connexin 43 in SGCs related to ET-1- ETBR signalling? 

      The relation between connexin 43 and ETBR signaling stems from observations made in astrocytes. ET1 signaling in cultured astrocytes, which share functional similarities with SGCs, was shown to lead to the closure of gap junctions and the reduction in Cx43 expression. Because Cx43 expression, a major connexin expressed in SGCs as in astrocytes, was previously shown to be reduced at the protein level in SGCs from aged mice, we decided to explore it this ETBR-Cx43 mechanism also operates in SGCs. We have revised the Introduction and Discussion section extensively to acknowledge the lack of causality in Cx43 expression SGCs and to provide additional potential mechanisms by which ETBR inhibition may promote nerve repair.

    1. eLife Assessment

      This study presents a valuable finding about how receptor-ligand binding pathways with multi-site phosphorylation can show non-monotonic responses to increasing ligand affinity and to kinase activity. The authors provide convincing evidence through a simple ordinary differential equation model of such signaling networks with the key new ingredient of ligand-induced receptor degradation. The work will be of interest to physicists and biologists working on signal transduction and biological information processing.

    2. Reviewer #1 (Public review):

      Summary:

      The authors study the steady-state solutions of ODE models for molecular signaling involving ligand binding coupled to multi-site phosphorylation at saturating ligand concentrations. Although the results are in principle general, the work highlights the receptor tyrosine kinases (RTK) as model systems. After presenting previous ODE model solutions, the authors present their own "kinetic sorting" model, which is distinguished by ligand-induced phosphorylation-dependent receptor degradation and the property that every phosphorylation state is signaling competent. The authors show that this model recovers the two types of non-monotonicity experimentally reported for RTKs: maximum activity for intermediate ligand affinity and maximum activity for intermediate kinase activity.

      The main contribution of the work is in demonstrating that their model can capture both types of non-monotonicity, whereas previous models could at most capture non-monotonicity of ligand binding.

      Strengths:

      The question of how energy-dissipating, and thus non-equilibrium, molecular systems can achieve steady-state solutions not accessible to equilibrium systems is of fundamental importance in biomolecular information processing and self-organization. Although the authors do not address the energy requirements of their non-equilibrium model, their comparative analysis of different alternative non-equilibrium models provides insight into the design choices necessary to achieve non-monotonic control, a property that is inaccessible at equilibrium.

      The paper is succinctly written and easy to follow, and the authors achieve their aims by providing convincing numerical solutions demonstrating non-monotonicity over the range of parameter values encompassing the biologically relevant regime.

      Weaknesses:

      (1) A key motivating framework for this work is the argument that the ability to tune to recognize intermediate ligand affinities provides a control knob for signal selection that is available to non-equilibrium systems. As such, this seems like a compelling type of ligand selectivity, which is a question of broad interest. However, as the authors note in the results, the previously published "limited signaling model" already achieves such non-monotonicity in ligand binding affinity. The introduction and abstract do not clearly delineate the new contributions of the model.

      The novel benefit of the model introduced by the authors is that it also achieves a non-monotonic response to kinase activity. Because such non-monotonicity is observed for RTK, this would make the authors' model a better fit for capturing RTK behavior. However, the broad significance of achieving non-monotonicity to kinase activity is not motivated or supported by empirical evidence in the paper. As such, the conceptual significance of the modified model presented by the authors is not clear.

      (2) Whereas previous models used in the literature are schematized in Figure 1, the model proposed by the authors is missing (see line 97 of page 3). Without the schematic, the text description of the model is incomplete.

      (3) The authors use the activity of the first phosphorylation site as the default measure of activity. This choice needs to be justified. Why not use the sum of the activities at all sites?

    3. Reviewer #2 (Public review):

      Summary:

      In classical models of signaling networks, the signaling activity increases monotonically with the ligand affinity. However, certain receptors prefer ligands of intermediate affinity. In the paper, the authors present a new minimal model to derive generic conditions for ligand specificity. In brief, this requires multi-site phosphorylation and that high-affinity complexes be more prone to degrade. This particular type of kinetic discrimination allows for overcoming equilibrium constraints.

      Strengths:

      The model is simple, and it adds only a few parameters to classical generic models. Moreover, the authors vary these additional parameters in ranges based on experimental observations. They explain how the introduction of these new parameters is essential to ligand specificity. Their model quantitatively reproduces the ligand specificity of a certain receptor. Finally, they provide a testable prediction.

      Weaknesses:

      The naming of certain variables may be confusing to readers.

    1. eLife Assessment

      This important work provides mechanistic insights into the development of cardiac arrhythmia and establishes a new experimental use case for optogenetics in studying cardiac electrophysiology. The agreement between computational models and experimental observations provides a convincing level of evidence that wave train-induced pacemaker activity can originate in continuously depolarized tissue, with the limitation that there may be differences between depolarization arising from constant optogenetic stimulation, as opposed to pathophysiological tissue depolarization. Future experiments in vivo and in other tissue preparations would extend the generality of these findings.

    2. Reviewer #1 (Public review):

      Summary:

      The study by Teplenin and coworkers assesses the combined effects of localized depolarization and excitatory electrical stimulation in myocardial monolayers. They study the electrophysiological behaviour of cultured neonatal rat ventricular cardiomyocytes expressing the light-gated cation channel Cheriff, allowing them to induce local depolarization of varying area and amplitude, the latter titrated by the applied light intensity. In addition, they used computational modeling to screen for critical parameters determining state transitions and to dissect the underlying mechanisms. Two stable states, thus bistability, could be induced upon local depolarization and electrical stimulation, one state characterized by a constant membrane voltage and a second, spontaneously firing, thus oscillatory state. The resulting 'state' of the monolayer was dependent on the duration and frequency of electrical stimuli, as well as the size of the illuminated area and the applied light intensity, determining the degree of depolarization as well as the steepness of the local voltage gradient. In addition to the induction of oscillatory behaviour, they also tested frequency-dependent termination of induced oscillations.

      Strengths:

      The data from optogenetic experiments and computational modelling provide quantitative insights into the parameter space determining the induction of spontaneous excitation in the monolayer. The most important findings can also be reproduced using a strongly reduced computational model, suggesting that the observed phenomena might be more generally applicable.

      Weaknesses:

      While the study is thoroughly performed and provides interesting mechanistic insights into scenarios of ventricular arrhythmogenesis in the presence of localized depolarized tissue areas, the translational perspective of the study remains relatively vague. In addition, the chosen theoretical approach and the way the data are presented might make it difficult for the wider community of cardiac researchers to understand the significance of the study.

    3. Reviewer #2 (Public review):

      In the presented manuscript, Teplenin and colleagues use both electrical pacing and optogenetic stimulation to create a reproducible, controllable source of ectopy in cardiomyocyte monolayers. To accomplish this, they use a careful calibration of electrical pacing characteristics (i.e., frequency, number of pulses) and illumination characteristics (i.e., light intensity, surface area) to show that there exists a "sweet spot" where oscillatory excitations can emerge proximal to the optogenetically depolarized region following electrical pacing cessation, akin to pacemaker cells. Furthermore, the authors demonstrate that a high-frequency electrical wave-train can be used to terminate these oscillatory excitations. The authors observed this oscillatory phenomenon both in vitro (using neonatal rat ventricular cardiomyocyte monolayers) and in silico (using a computational action potential model of the same cell type). These are surprising findings and provide a novel approach for studying triggered activity in cardiac tissue.

      The study is extremely thorough and one of the more memorable and grounded applications of cardiac optogenetics in the past decade. One of the benefits of the authors' "two-prong" approach of experimental preps and computational models is that they could probe the number of potential variable combinations much deeper than through in vitro experiments alone. The strong similarities between the real-life and computational findings suggest that these oscillatory excitations are consistent, reproducible, and controllable.

      Triggered activity, which can lead to ventricular arrhythmias and cardiac sudden death, has been largely attributed to sub-cellular phenomena, such as early or delayed afterdepolarizations, and thus to date has largely been studied in isolated single cardiomyocytes. However, these findings have been difficult to translate to tissue and organ-scale experiments, as well-coupled cardiac tissue has notably different electrical properties. This underscores the significance of the study's methodological advances: the use of a constant depolarizing current in a subset of (illuminated) cells to reliably result in triggered activity could facilitate the more consistent evaluation of triggered activity at various scales. An experimental prep that is both repeatable and controllable (i.e., both initiated and terminated through the same means).

      The authors also substantially explored phase space and single-cell analyses to document how this "hidden" bi-stable phenomenon can be uncovered during emergent collective tissue behavior. Calibration and testing of different aspects (e.g., light intensity, illuminated surface area, electrical pulse frequency, electrical pulse count) and other deeper analyses, as illustrated in Appendix 2, Figures 3-8, are significant and commendable.

      Given that the study is computational, it is surprising that the authors did not replicate their findings using well-validated adult ventricular cardiomyocyte action potential models, such as ten Tusscher 2006 or O'Hara 2011. This may have felt out of scope, given the nice alignment of rat cardiomyocyte data between in vitro and in silico experiments. However, it would have been helpful peace-of-mind validation, given the significant ionic current differences between neonatal rat and adult ventricular tissue. It is not fully clear whether the pulse trains could have resulted in the same bi-stable oscillatory behavior, given the longer APD of humans relative to rats. The observed phenomenon certainly would be frequency-dependent and would have required tedious calibration for a new cell type, albeit partially mitigated by the relative ease of in silico experiments.

      For all its strengths, there are likely significant mechanistic differences between this optogenetically tied oscillatory behavior and triggered activity observed in other studies. This is because the constant light-elicited depolarizing current is disrupting the typical resting cardiomyocyte state, thereby altering the balance between depolarizing ionic currents (such as Na+ and Ca2+) and repolarizing ionic currents (such as K+ and Ca2+). The oscillatory excitations appear to later emerge at the border of the illuminated region and non-stimulated surrounding tissue, which is likely an area of high source-sink mismatch. The authors appear to acknowledge differences in this oscillatory behavior and previous sub-cellular triggered activity research in their discussion of ectopic pacemaker activity, which is canonically expected more so from genetic or pathological conditions. Regardless, it is exciting to see new ground being broken in this difficult-to-characterize experimental space, even if the method illustrated here may not necessarily be broadly applicable.

    1. eLife Assessment

      This manuscript presents a valuable methodological approach for investigating context-dependent activity of cis-regulatory elements within defined genomic loci. The authors combine a locus-specific massively parallel reporter assay, enabling unbiased and high-coverage profiling of enhancer activity across large genomic regions, with a degenerate reporter assay to identify nucleotides critical for enhancer function. The data supporting the conclusions are solid, highlighted by the successful identification and characterization of both previously known and new regulatory elements across multiple developmental stages, cell types, and species; however, concerns regarding assay sensitivity, statistical rigor in distinguishing active regions, and limitations inherent to the design of the reporter assays remain to be addressed. With strengthened quantitative analysis, statistical validation, and additional functional experiments to directly establish regulatory element-gene relationships, this study will be of broad interest to researchers investigating gene regulation mechanisms in development and disease.

    2. Reviewer #1 (Public review):

      MPRAs are a high-throughput and powerful tool for assaying the regulatory potential of genomic sequences. However, linking MPRA-nominated regulatory sequences to their endogenous target genes and identifying the more specific functional regions within these sequences can be challenging. MPRAs that tile a genomic region, and saturation mutagenesis-based MPRAs, can help to address these challenges. In this work, Tulloch et al. describe a streamlined MPRA system for the identification and investigation of the regulatory elements surrounding a gene of interest with high resolution. The use of BACs covering a locus of interest to generate MPRA libraries allows for an unbiased and high-coverage assessment of a particular region. Follow-up degenerate MPRAs, where each nucleotide in the nominated sequences is systematically mutated, can then point to key motifs driving their regulatory activity. The authors present this MPRA platform as straightforward, easily customizable, and less time- and resource-intensive than traditional MPRA designs. They demonstrate the utility of their design in the context of the developing mouse retina, where they first use the LS-MPRA to identify active regulatory elements for select retinal genes, followed by d-MPRA, which allowed them to dissect the functional regions within those elements and nominate important regulatory motifs. These assays were able to recapitulate some previously known cis-regulatory modules (CRMs), as well as identify some new potential regulatory regions. Follow-up experiments assessing co-localization of the gene of interest with the CRM-linked GFP reporter in the target cells, and CUT&RUN assays to confirm transcription factor binding to nominated motifs, provided support linking these CRMs to the genes of interest. Overall, this method appears flexible and could be an easy-to-implement tool for other investigators aiming to study their locus of interest with high resolution.

      Strengths:

      (1) The method of fragmenting BACs allows for high, overlapping coverage of the region of interest.

      (2) The d-MPRA method was an efficient way to identify key functional transcription factor motifs and nominate specific transcription factor-driven regulatory pathways that could be studied further.

      (3) Additional assays like co-expression analyses using the endogenous gene promoter, and use of the Notch inhibitor in the case of Olig2, helped correlate the activity of the CRMs to the expression of the gene of interest, and distinguish false positives from the initial MPRA.

      (4) The use of these assays across different time points, tissues, and even species demonstrated that they can be used across many contexts to identify both common and divergent regulatory mechanisms for the same gene.

      Weaknesses:

      The LS-MPRA assay most strongly identified promoters, which are not usually novel regulatory elements you would try to discover, and the signal-to-noise ratio for more TSS-distal, non-promoter regulatory elements was usually high, making it difficult to discriminate lower activity CRMs, like enhancers, from the background. For example, NR2 and NR3 in Figure 3 have very minimal activity peaks (NR3 seems non-existent). The ex vivo data in Figure 2 are similarly noisy. Is there a particular metric or calculation that was or could be used to quantitatively or statistically call a peak above the background? The authors mention in the discussion some adjustments that could reduce the noise, such as increased sequencing depth, which I think is needed to make these initial LS-MPRA results and the benchmarking of this assay more convincing and impactful.

    3. Reviewer #2 (Public review):

      Summary:

      In this study, Tulloch et al. developed two modified massively parallel reporter assays (MPRAs) and applied them to identify cis-regulatory modules (CRMs) - genomic regions that activate gene expression, controlling retinal gene expression. These CRMs usually function at specific developmental stages and in distinct cell types to orchestrate retinal development. Studying them provides insights into how retinal progenitor cells give rise to various retinal cell types.

      The first assay, named locus-specific MPRA (LS-MPRA), tests all genomic regions within 150-300 kb of the gene of interest, rather than relying on previously predicted candidate regulatory elements. This approach reduces potential bias introduced during candidate selection, lowers the cost of synthesizing a library of candidate sequences, and simplifies library preparation. The LS-MPRA libraries were electroporated into mouse retinas in vivo or ex vivo. To benchmark the method, the authors first applied LS-MPRA near stably expressed retinal genes (e.g., Rho, Cabp5, Grm6, and Vsx2), and successfully identified both known and novel CRMs. They then used LS-MPRA to identify CRMs in embryonic mouse retinas, near Olig2 and Ngn2, genes expressed in subsets of retinal progenitor cells. Similar experiments were conducted in chick retinas and postnatal mouse retinas, revealing some CRMs with conserved activity across species and developmental stages.

      Although the study identified CRMs with robust reporter activity in Olig2+ or Ngn2+ cells, the data do not provide sufficient evidence to support the claims that these CRMs regulate Olig2 or Ngn2, rather than other nearby genes, in a cell-type-specific manner. For example, the authors propose that three regions (NR1/2/3) regulate Olig2 specifically in retinal progenitor cells based on: (1) the three regions are close to Olig2, (2) increased Olig2 expression and NR1/2/3 activity upon Notch inhibition, and (3) reporter activity observed in Olig2+ cells (though also present in many Olig2- cells). While these are promising findings, they do not directly support the claims.

      The second assay, called degenerate MPRA (d-MPRA), introduces random point mutations into CRMs via error-prone PCR to assess the impact of sequence variations on regulatory activity. This approach was used on NR1/2/3 to identify mutations that alter CRM activity, potentially by influencing transcription factor binding. The authors inferred candidate transcription factors, such as Mybl1 and Otx2, through motif analysis, co-expression with Olig2 (based on single-cell RNA-seq), and CUR&RUN profiling. While some transcription factors identified in this way overlapped with the d-MPRA results, others did not. This raises questions about how well d-MPRA complements other methods for identifying transcriptional regulators.

      Strengths:

      (1) The study introduces two technically robust MPRA protocols that offer advantages over standard methods, such as avoiding reliance on predefined candidate regions, reducing cost and labor, and minimizing selection bias.

      (2) The identified regulatory elements and transcription factors contribute to our understanding of gene regulation in retinal development and may have translational potential for cell-type-specific gene delivery into developing retinas.

      Weaknesses:

      (1) The claims for gene-specific and cell type-specific CRMs would benefit from further validation using complementary approaches, such as CRISPR interference or Prime editing.

    4. Reviewer #3 (Public review):

      Summary:

      Use of reporter assays to understand the regulatory mechanisms controlling gene expression moves beyond simple correlations of cis-regulatory sequence accessibility, evolutionary sequence conservation, and epigenetic status with gene expression, instead quantifying regulatory sequence activity for individual elements. Tulloch et al., provide a systematic characterization of two new reporter assay techniques (LS-MPRA and d-MPRA) to comprehensively identify cis-regulatory sequences contained within genomic loci of interest during retinal development. The authors then apply LS-MPRA and d-MPRA to identify putative cis-regulatory sequences controlling Olig2 and Ngn2 expression, including potential regulatory motifs that known retinal transcription factors may bind. Transcription factor binding to regulatory sequences is then assessed via CUT&RUN. The broader utility of the techniques is then highlighted by performing the assays across development, across species, and across tissues.

      Strengths:

      (1) The authors validate the reporter assays on retinal loci for which the regulatory sequences are known (Rho, Vsx2, Grm6, Cabp5) mostly confirming known regulatory sequence activity but highlighting either limitations of the current technology or discrepancies of previous reporter assays and known biology. The techniques are then applied to loci of interest (Olig2 and Ngn2) to better understand the regulatory sequences driving expression of these transcription factors across retinal development within subsets of retinal progenitor cells, identifying novel regulatory sequences through comprehensive profiling of the region.

      (2) LS-MPRA provides broad coverage of loci of interest.

      (3) d-MPRA identifies sequence features that are important for cis-regulatory sequence activity.

      (4) The authors take into account transcript and protein stability when determining the correlation of putative enhancer sequence activity with target gene expression.

      Weaknesses:

      (1) In its current form, the many important controls that are standard for other MPRA experiments are not shown or not performed, limiting the interpretations of the utility of the techniques. This includes limited controls for basal-promoter activity, limited information about sequence saturation and reproducibility of individual fragments across different barcode sequences, limitations in cloning and assay delivery, and sequencing requirements. Additional quantitative metrics, including locus coverage and number of barcodes/fragments, would be beneficial throughout the manuscript.

      (2) There are no statistical metrics for calling a region/sequence 'active'. This is especially important given that NR3 for Olig2 seems to have a small 'peak' and has non-significant activity in Figure 4.

      (3) The authors present correlational data for identified cis-regulatory sequences with target gene expression. Additionally, the significance of transcription factor binding to the putative regulatory sequences is not currently tested, only correlated based on previous single-cell RNA-sequencing data. While putative regulatory sequences with potential mechanisms of regulation are identified/proposed, the lack of validation (and discrepancies with previous literature) makes it hard to decipher the utility of the techniques.

      (4) While the interpretations that Olig2 mRNA/protein expression is dynamically regulated improved the proportions of cells that co-expressed CRM-regulated GFP and Olig2, alternate explanations (some noted) are just as likely. First, the electroporation isn't specific to Olig2+ progenitors. Also, the tested, short CRM fragments may have activating signals outside of Olig2 neurogenic cells because chromatin conformation, histone modifications, and DNA methylation are not present on plasmids to precisely control plasmid activity. Alternatively, repressive elements that control Olig2 expression are not contained in the reporter vectors.

      (5) It is unclear as to why the d-MPRA uses a different barcoding strategy, placing a second copy of the cis-regulatory sequence in the 3' UTR. As acknowledged by the author, this will change the transcript stability by changing the 3' UTR sequence. Because of this, comparisons of sequence activity between the LS-MPRA and d-MPRA should not be performed as the experiments are not equivalent.

      (6) Furthermore, details of the mutational burden in d-MPRA experiments are not provided, limiting the interpretations of these results.

      (7) Many figures are IGV screenshots that suffer from low resolution. Many figures could be consolidated.

    5. Author response:

      We thanks the Reviewers for their thorough reviews and helpful suggestions. We will provide additional quantification as requested for several aspects of the study.

      The methods that we developed were meant to provide candidates for regulatory elements for a gene of interest. These candidates could be used to further understand the regulation of a gene, a complex and difficult task, especially for dynamically regulated genes in the context of development. These candidates could also, or instead, be used to drive gene expression specifically in a target cell of interest for applications such as gene therapy or perturbations that need this type of specificity. In the first case, to use the candidates to understand the regulation of a gene, one would need to validate the candidates using the types of methods typically employed for this purpose, most rigorously in the in vivo genomic context. We did not pursue this level of validation as it would encompass a great deal of work outside the scope of the current study. However, by initially testing loci and CRMs which have been studied by several groups (Rho, Grm6, Vsx2, and Cabp5), and at least in the cases of Rho and Vsx2, shown to be relevant in the genomic context in vivo, we provide evidence that the LS-MPRA can identify relevant CRMs. These data show that the method is worth using for loci of interest, particularly when only one or a few loci are of interest, i.e. one does not need to use genome-wide approaches. It is also apparent that our methods are not perfect and that the LS-MPRA does not pick up all CRMs. We do not know of a method that has been shown to do so.

      Some of the statistical and quantitative data asked for by the Reviewers will be provided. However, it is important to note that the types of statistics using peak callers asked for regarding candidate choice will be of limited value. If one is testing a library in a single cell type in vitro, and/or running genome-wide assays, these statistics could aid in the choice of candidates. However, here we are electroporating a complex and dynamic set of cells, present at very different frequencies. In addition, at least for Olig2 and Ngn2, their expression is very transient, and each is expressed in only a small subset of cells. An additional confound is that the level of expression of each gene that one might test is variable. All of these variables render a statistical prediction of strong candidates to be less valuable than one might hope, and might lead one to miss those CRMs of interest. Instead, we suggest that one use one’s own level of interest and knowledge in choosing CRM candidates. We provide several examples of experimental, rather than purely statistical, approaches that might help in one’s choice of candidates. We used a functional read-out of CRM activity (Notch perturbation), carried out in the context of the entire LS-MPRA library, as one method. Co-expression in single cells of candidate regulators identified by the d-MPRA is another. One can of course use chromatin structure and sequence conservation, as used in many studies of regulatory regions, as other ways to narrow down candidates. The d-MPRA predictions also can be viewed in light of previous genetic studies, i.e. mutations in TFs that effect the cell type of interest or the regulation of the gene of interest, as we were able to do here for CRMs predicted to be regulated by Otx2.

      If one wishes to use a candidate CRM to drive gene expression in a targeted cell type, one needs to establish specificity. In particular, specificity needs to be established in the context of the vector that is being used. Non-integrated vs integrated vectors, different types of viral vectors with their own confounding regulatory sequences, and copy number can all effect specificity. We provided a double in situ hybridization method for the examination of specificity for some of the novel candidate CRMs. It was quite difficult in the case of Olig2 and Ngn2 as their RNAs and proteins are unstable. We would need to provide further evidence should we wish to use these candidate CRMs for directing expression specifically in Olig2- or Ngn2-expressing cells. We suggest that an investigator can choose the vector and method for establishing specificity depending upon the goals of the application.

    1. eLife Assessment

      This important study offers substantial technical advancements for neural circuit tracing in larval zebrafish, a model for systems and developmental neurobiology. The enhanced rabies virus-based retrograde transneuronal tracing improves efficiency and provides a method for combined structural and functional brain mapping. The supporting evidence is solid, and there is strong confidence in the technique's utility for neurobiologists working with zebrafish.

    2. Reviewer #1 (Public review):

      (1) Presentation of Figures in the Response Letter

      I would like to note that the figures included in the response letter would benefit from improved organization. For example, Author response image 1 lacks clarity for experimental conditions. From the response letter, my understanding is that a "Labeling rate index", Rg−Rn, was calculated to represent the difference in the rate of increase in labeling between neurons and glial across two time intervals based on experiments shown in Figure 2-figure supplement 1C and G. It seems that a mean convergence index was calculated for each experimental condition at each time point for glial and neurons, and then the differences in mean convergence index increase between time intervals were calculated for glial and neurons. The legend needs more detail to enhance clarity.

      Furthermore, the manuscript should clearly distinguish between figures generated from re-analysis of existing data and those based on newly conducted experiments. This distinction should be explicitly stated in the figure legends and/or main text.<br /> I recommend that all response figures containing data integral to the authors' rebuttal be properly integrated into the manuscript's existing supplementary figure set, rather than remaining isolated in the response document. This would enhance clarity and ensure that key supporting data are fully accessible to readers. For instance, Author response image 1 can be integrated with Figure 2-figure supplement.

      (2) Glial Cell Labeling and Specificity of Trans-Synaptic Spread

      The authors provided a comprehensive and well-reasoned response to the concern regarding the labeling of radial glial cells. The inclusion of a dedicated section in the revised Discussion and response figures (possibly to be integrated with supplementary figures), strengthens the manuscript.

      The authors have made an interesting observation in Author response image 2 that glial labeling was frequently observed near the soma and dendrites of starter cells, suggesting that transneuronal labeled glial cells may be synaptically associated with the starter neurons. Also astroglia starter cells lead to infection of nearby TVA-negative astroglia, suggesting astroglia-to- astroglia transmission.

      I find the response scientifically satisfactory and appreciate the authors' transparency in addressing the limitations of their approach.

      (3) Temperature Effects and Larval Viability

      The authors' justification for raising larvae at 36C to improve labeling efficiency is reasonable. The supporting data indicating minimal impact on larval viability within the experimental timeframe are convincing. Referencing prior behavioral studies and including survival data under controlled conditions adds credibility to their claims. I find this issue satisfactorily addressed.

      (4) Viral Toxicity and Dosage Considerations, Secondary Starter Cells

      The authors present a well-reasoned explanation that viral cytotoxicity is primarily driven by replication and not by viral titer or injection volume. However, the inclusion of experimental data directly testing the effects of higher titer or volume on starter cell viability would have strengthened this point, particularly since such tests are relatively straightforward to perform.

      Regarding the potential contribution of secondary starter cells, the authors provide a convincing rationale for why such effects are unlikely under their sparse labeling conditions. However, in cases where TVA and G are broadly expressed-such as under the vglut2a promoter, as shown in Author response image 2-it would be valuable to directly evaluate this possibility experimentally. While the authors' interpretation is reasonable, empirical validation would further strengthen their conclusions.

    3. Reviewer #2 (Public review):

      The study by Chen, Deng et al. aims to develop an efficient viral transneuronal tracing method that allows efficient retrograde tracing in the larval zebrafish. The authors utilize pseudotyped-rabies virus that can be targeted to specific cell types using the EnvA-TvA systems. Pseudotyped rabies virus has been used extensively in rodent models and, in recent years, has begun to be developed for use in adult zebrafish. However, compared to rodents, the efficiency of spread in adult zebrafish is very low (~one upstream neuron labeled per starter cell). Additionally, there is limited evidence of retrograde tracing with pseudotyped rabies in the larval stage, which is the stage when most functional neural imaging studies are done in the field. In this study, the authors systematically optimized several parameters of rabies tracing, including different rabies virus strains, glycoprotein types, temperatures, expression construct designs, and elimination of glial labeling. The optimal configurations developed by the authors are up to 5-10 fold higher than more typically used configurations.

      The results are convincing and support the conclusions. There are some additional changes that are recommended:

      (1) The new data included in the response to reviewer's letter are important to support the main conclusions and should be included in the manuscript.

      (2) Line 357-362: This section should include all of the Author response image and associated details. Additionally, the Author response image 3 is at odds with Fig 2-supplement 1G. In Author response image 3, ~75% of glial cells labeled at 4 dpi loses their fluorescence by 10 dpi. However, Figure 2-supplement 1G shows that glial overall labeling increases ~2 fold from 4 dpi to 10 dpi. This would suggest that the de novo labeling rate for glia is much higher than the net labeling rate calculated from the convergence index. The authors should clarify these findings.

    1. eLife Assessment

      This manuscript presents solid experimental data using Fmr1 knockout mice to explore the fundamental role of Fmr1 in sleep regulation. The study supports the hypothesis that scheduled feeding can improve circadian rhythm and behavior in a mouse model of Fragile X syndrome. These findings may offer new insights into neurodevelopmental disorders and their potential treatment strategies.

    2. Reviewer #1 (Public review):

      The authors conducted a comprehensive investigation into sleep and circadian rhythm disturbances in Fmr1 knockout (KO) mice, a model for Fragile X Syndrome (FXS). They began by monitoring daily home cage behaviors to identify disruptions in sleep and circadian patterns, then assessed the mice's adaptability to altered light conditions through photic suppression and skeleton photoperiod experiments. To uncover potential mechanisms, they examined the connectivity between the retina and the suprachiasmatic nucleus. The study also included an analysis of social behavior deficits in the mutant mice and tested whether scheduled feeding could alleviate these issues. Notably, scheduled feeding not only improved sleep, circadian, and social behaviors but also normalized plasma cytokine levels. The manuscript is strengthened by its focus on a significant and underexplored area-sleep deficits in an FXS model-and by its robust experimental design, which integrates a variety of methodological approaches to provide a thorough understanding of the observed phenomena and potential therapeutic avenues.

    3. Reviewer #2 (Public review):

      Summary:

      In the present study, the authors, using a mouse model of Fragile X syndrome, explore the intriguing hypothesis that restricting food access over the daily schedule will improve sleep patterns and subsequently enhanced behavioral capacities. By restricting food access from 12h to 6h over the nocturnal period (the active period for mice), they show, in these KO mice, an improvement in the sleep pattern accompanied by reduced systemic levels of inflammatory markers and improved behavior. These data, using a classical mouse model of neurodevelopmental disorder (NDD), suggest that modifying eating patterns might improve sleep quality, leading to reduced inflammation and enhanced cognitive/behavioral capacities in children with NDD.

      Overall, the paper is well-written and easy to follow. The rationale of the study is generally well introduced. Data are globally sound. The interpretation is overall supported by the provided data.

    4. Author response:

      The following is the authors’ response to the original reviews.

      Reviewer #1 (Public review): 

      Summary: 

      The authors investigated sleep and circadian rhythm disturbances in Fmr1 KO mice. Initially, they monitored daily home cage behaviors to assess sleep and circadian disruptions. Next, they examined the adaptability of circadian rhythms in response to photic suppression and skeleton photic periods. To explore the underlying mechanisms, they traced retino-suprachiasmatic connectivity. The authors further analyzed the social behaviors of Fmr1 KO mice and tested whether a scheduled feeding strategy could mitigate sleep, circadian, and social behavior deficits. Finally, they demonstrated that scheduled feeding corrected cytokine levels in the plasma of mutant mice. 

      Strengths: 

      (1) The manuscript addresses an important topic-investigating sleep deficits in an FXS mouse model and proposing a potential therapeutic strategy. 

      (2) The study includes a comprehensive experimental design with multiple methodologies, which adds depth to the investigation. 

      We thank the reviewer for the positive comments.

      Weaknesses: 

      (1) The first serious issue in the manuscript is the lack of a clear description of how they performed the experiments and the missing definitions of various parameters in the results.  

      We thank the reviewer for pointing out lapses in the editing of the manuscript. We were trying to keep the descriptions of previously published methods brief but must have gone too far, the manuscript has been carefully checked for grammar and readability. Description of the experimental design has been refined and a graphical presentation has been added as Suppl Fig 3. The sleep and circadian parameters have been thoroughly explained in the methods and briefly in the figure legnds.

      (2) Although the manuscript has a relatively long Methods section, some essential information is missing. For instance, the definition of sleep bout, as described above, is unclear. Additional missing information includes

      Figure 2: "Rhythmic strength (%)" and "Cycle-to-cycle variability (min)." 

      Figure 3: "Activity suppression." 

      Figure 4: "Rhythmic power (V%)" (is this different from rhythmic strength (%)?) and "Subjective day activity (%)." 

      We have provided definitions for the general audience of the terms used in the field of circadian rhythms, such as sleep bout, rhythm power, cycle-to-cycle, masking, and % of activity during the day in the methods and Fig legends. Most of the techniques used in this study, for example, the behavioral measurement of sleep or locomotor activity, are well established and have been used in multiple published works, including our own. We have made sure to include citations for interested readers.

      Figure 5: Clear labeling of the SCN's anatomical features and an explanation for quantifying only the ventral part instead of the entire SCN. 

      We have added more landmarks (position of the third ventricle and optic chiasm) to Fig 5, and have outlined the shell and core of the SCN in two additional images of the ventral hypothalamus in Suppl fig 4.

      We had actually quantified the fluorescence in the whole SCN as well as in the ventral part.This was/is described in the methods as well as reported in the results section and Table 4 “Likewise, a subtle decrease in the intensity of the labelled fibers was found in the whole SCN (Table 4) of the Fmr1 KO mice as compared to WT.“ 

      Methods: ” Two methods of analyses were carried out on the images of 5 consecutive sections per animal containing the middle SCN. First, the relative intensity of the Cholera Toxin fluorescent processes was quantified in the whole SCN, both left and right separately, by scanning densitometry using the Fiji image processing package of the NIH ImageJ software (https://imagej.net). A single ROI of fixed size (575.99 μm x 399.9 μm, width x height) was used to measure the relative integrated density (mean gray values x area of the ROI) in all the images. The values from the left and right SCN were averaged per section and 5 sections per animal were averaged to obtain one value per animal………..”

      Since the retinal innervation of the SCN is strongest in the ventral aspect, where the retino-hypothalamic fibers reach the SCN and our goal was to identify differences in the input to the SCN, e.g. defects in the retino-SCN connectivity as suggested by some deficits in circadian behaviour; we also looked at intensity of Cholera Toxin in the fibers arriving to the ventral SCN from the retina.

      We have added a sentence in the methods about the rationale for measuring the intensity of the cholera toxin labelled fiber in the whole SCN and also just in the ventral part: “Second, the retinal innervation of the SCN is strongest in the ventral aspect, where the retino-hypothalamic fibers reach the SCN, hence, the distribution….”

      Figure 6: Inconsistencies in terms like "Sleep frag. (bout #)" and "Sleep bouts (#)." Consistent terminology throughout the manuscript is essential.

      We have now clearly explained that sleep bouts are a measure of sleep fragmentation throughout the manuscript and in the fig legends; in addition, we have corrected the figures, reconciled the terminology, which is now consistent throughout the results and methods.

      Methods: “Sleep fragmentation was determined by the number of sleep bouts, which were operationally defined as episodes of continuous immobility with a sleep count greater than 3 per minute, persisting for at least 60 secs.”

      (3) Figure 1A shows higher mouse activity during ZT13-16. It is unclear why the authors scheduled feeding during ZT15- 21, as this seems to disturb the rhythm. Consistent with this, the body weights of WT and Fmr1 KO mice decreased after scheduled feeding. The authors should explain the rationale for this design clearly.

      We have added to the rationale for the feeding schedule. This protocol was initially used by the Panda group to counter metabolic dysfunction (Hatori et al., 2012). We have used it for many years now (see citations below) in various mouse models presenting with circadian disruption to reset the clock and improve sleep. This study represents our first application/intervention in a mouse model of a neurodevelopmental disease.

      Hatori M, Vollmers C, Zarrinpar A, DiTacchio L, Bushong EA, Gill S, Leblanc M, Chaix A, Joens M, Fitzpatrick JA, Ellisman MH, Panda S. Time-restricted feeding without reducing caloric intake prevents metabolic diseases in mice fed a high-fat diet. Cell Metab. 2012 Jun 6;15(6):848-60. doi: 10.1016/j.cmet.2012.04.019. Epub 2012 May 17. PMID: 22608008; PMCID: PMC3491655.

      Chiem E, Zhao K, Dell'Angelica D, Ghiani CA, Paul KN, Colwell CS. Scheduled feeding improves sleep in a mouse model of Huntington's disease. Front Neurosci. 2024 18:1427125. doi: 10.3389/fnins.2024.1427125. PMID: 39161652.

      Whittaker DS, Akhmetova L, Carlin D, Romero H, Welsh DK, Colwell CS, Desplats P. Circadian modulation by time-restricted feeding rescues brain pathology and improves memory in mouse models of Alzheimer's disease. Cell Metab. 2023 35(10):1704- 1721.e6. doi: 10.1016/j.cmet.2023.07.014. PMID: 37607543

      Brown MR, Sen SK, Mazzone A, Her TK, Xiong Y, Lee JH, Javeed N, Colwell CS, Rakshit K, LeBrasseur NK, Gaspar-Maia A, Ordog T, Matveyenko AV. Time-restricted feeding prevents deleterious metabolic effects of circadian disruption through epigenetic control of β cell function. Sci Adv. 2021 7(51):eabg6856. doi: 10.1126/sciadv.abg6856. PMID: 34910509

      Whittaker DS, Loh DH, Wang HB, Tahara Y, Kuljis D, Cutler T, Ghiani CA, Shibata S, Block GD, Colwell CS. Circadian-based Treatment Strategy Effective in the BACHD Mouse Model of Huntington's Disease. J Biol Rhythms. 2018 33(5):535-554. doi: 10.1177/0748730418790401. PMID: 30084274.

      Wang HB, Loh DH, Whittaker DS, Cutler T, Howland D, Colwell CS. Time-Restricted Feeding Improves Circadian Dysfunction as well as Motor Symptoms in the Q175 Mouse Model of Huntington's Disease. eNeuro. 2018 Jan 3;5(1):ENEURO.0431-17.2017. doi: 10.1523/ENEURO.0431-17.2017.

      Loh DH, Jami SA, Flores RE, Truong D, Ghiani CA, O'Dell TJ, Colwell CS. Misaligned feeding impairs memories. Elife. 2015 4:e09460. doi: 10.7554/eLife.09460.

      (4) The interpretation of social behavior results in Figure 6 is questionable. The authors claim that Fmr1 KO mice cannot remember the first stranger in a three-chamber test, writing, "The reduced time in exploring and staying in the novelmouse chamber suggested that the Fmr1 KO mutants were not able to distinguish the second novel mouse from the first now-familiar mouse." However, an alternative explanation is that Fmr1 KO mice do remember the first stranger but prefer to interact with it due to autistic-like tendencies. Data in Table 5 show that Fmr1 KO mice spent more time interacting with the first stranger in the 3-chamber social recognition test, which support this possibility. Similarly, in the five-trial social test, Fmr1 KO mice's preference for familiar mice might explain the reduced interaction with the second stranger.

      Thank you for this interesting interpretation of the social behavior experiments. We used the common interpretations for both the three-chamber test and the 5-trial social interaction test, but have now modified the text leaving space for alternative interpretations, have soften the language, and mentioned decreased sociability in the Fmr1 KO mice. “The reduced time spent exploring the novel-mouse chamber suggest that the mutants were, perhaps, unable to distinguish the second novel mouse from the first, now familiar, mouse, along with decreased sociability.”

      In Figure 6C (five-trial social test results), only the fifth trial results are shown. Data for trials 1-4 should be provided and compared with the fifth trial. The behavioral features of mice in the 5-trial test can then be shown completely. In addition, the total interaction times for trials 1-4 (154 {plus minus} 15.3 for WT and 150 {plus minus} 20.9 for Fmr1 KO) suggest normal sociability in Fmr1 KO mice (it is different from the results of 3-chamber). Thus, individual data for trials 1-4 are required to draw reliable conclusions.  

      We have added a suppl figure showing the individual trial results for both WT and Fmr1 KO mice as requested (Suppl. Fig. 2).  

      In Table 6 and Figure 6G-6J, the authors claim that "Sleep duration (Figures 6G, H) and fragmentation (Figures 6I, J) exhibited a moderate-strong correlation with both social recognition and grooming." However, Figure 6I shows a p-value of 0.077, which is not significant. Moreover, Table 6 shows no significant correlation between SNPI of the three-chamber social test and any sleep parameters. These data do not support the authors' conclusions. 

      Thanks for pointing out the error with statement about Fig. 6I.

      “…. Sleep duration (Fig. 6G, H; Table 6) exhibited a moderate to strong correlation with both social recognition and grooming time, while sleep fragmentation (measured by sleep bouts number) only correlated with the latter (Fig. 6J); the length of sleep bouts (Table 6) showed moderate correlation with both social recognition and repetitive behavior. In addition, a moderate correlation was seen between grooming time and the circadian parameters, rhythmic power and activity onset variability (Table 6). In short, our work suggests that even when tested during their circadian active phase, the Fmr1 KO mice exhibit robust repetitive and social behavioral deficits. Moreover, the shorter and more fragmented the daytime sleep, the more severe the behavioral impairment in the mutants.”

      (5) Figure 7 demonstrates the effect of scheduled feeding on circadian activity and sleep behaviors, representing another critical set of results in the manuscript. Notably, the WT+ALF and Fmr1 KO+ALF groups in Figure 7 underwent the same handling as the WT and Fmr1 KO groups in Figures 1 and 2, as no special treatments were applied to these mice. However, the daily patterns observed in Figures 7A, 7B, 7F, and 7G differ substantially from those shown in Figures 2B and 1A, respectively. Additionally, it is unclear why the WT+ALF and Fmr1 KO+ALF groups did not exhibit differences in Figures 7I and 7J, especially considering that Fmr1 KO mice displayed more sleep bouts but shorter bout lengths in Figures 1C and 1D. 

      We appreciate the reviewer’s attention to the subtle details of the behavioral measurement of sleep and believe the reviewer to be referring to differences in the behavioral measurements of sleep with data shown in Table 1 and Table 7. The first set of experiments described in this study was carried out between 2016 and 2017 and involves the comparison between WT and Fmr1 KO mice. The WT and mutants were obtained from JAX. In this initial set of experiments (Table 1), the total amount of sleep in 24 hrs was reduced in the KO, albeit not significantly, and these also exhibited sleep bouts of significantly reduced duration. The pandemic forced us to greatly slow down the research and reduce our mouse colonies. Post-pandemic, we used new cohorts of Fmr1 KO ordered again from JAX for the TRF experiment presented in this study. In these cohorts, the KO mice exhibited a significant reduction in total sleep (Table 7) and the sleep bouts were still shorter but not significantly. We have added to our text to explain that the description of the mutants and TRF interventions were carried out at different times (2017 vs 2022). We would like to emphasize that we always run contemporaneously controls and experimental groups to be used for the statistical analyses. We believe that the data are remarkably consistent over these years, even with different students doing the measurements. 

      Furthermore, it is not specified whether the results in Figure 7 were collected after two weeks of scheduled feeding (for how many days?) or if they represent the average data from the two-week treatment period.

      This is another good point raised by the reviewer. The activity measurements are collected during the 2 weeks (14 days) then the TRF was extended for a 3 more days to allow the behavioral sleep measurements.

      We have added a supplementary figure (Supp Fig 3) depicting the different experimental designs.

      The rationale behind analyzing "ZT 0-3 activity" in Figure 7D instead of the parameters shown in Figures 2C and 2D is also unclear. 

      We have added to our explanation. In prior work, we found that the TRF protocol has a big impact on the beginning of the sleep time, hence, we specifically targeted this 3-hours interval in the analysis.

      In Figure 7F, some data points appear to be incorrectly plotted. For instance, the dark blue circle at ZT13 connects to the light blue circle at ZT14 and the dark blue circle at ZT17. This is inconsistent, as the dark blue circle at ZT13 should link to the dark blue circle at ZT14. Similarly, it is perplexing that the dark blue circle at ZT16 connects to both the light blue and dark blue circles at ZT17. Such errors undermine confidence in the data. The authors need to provide a clear explanation of how these data were processed. 

      Thank you for bringing this to our attention. The data were plotted correctly, however, those data points completely overlapped with those behind, masking them. We have now offset a bit them for clarity.

      Lastly, in the Figure 7 legend, Table 6 is cited; however, this appears to be incorrect. It seems the authors intended to refer to Table 7. 

      We have corrected this error, thank you.  

      (6) Similar to the issue in Figure 7F, the data for day 12 in Supplemental Figure 2 includes two yellow triangles but lacks a green triangle. It is unclear how the authors constructed this chart, and clarification is needed. 

      We have corrected this error. As the reviewer pointed out, we filled the triangle on day 12 with yellow instead of green.  

      (7) In Figure 8, a 5-trial test was used to assess the effect of scheduled feeding on social behaviors. It is essential to present the results for all trials (1 to 4). Additionally, it is unclear whether the results for familial mice in Figure 8A correspond to trials 1, 2, 3, or 4. 

      The legend for Figure 8 also appears to be incorrect: "The left panels show the time spent in social interactions when the second novel stranger mouse was introduced to the testing mouse in the 5-trial social interaction test. The significant differences were analyzed by two-way ANOVA followed by Holm-Sidak's multiple comparisons test with feeding treatment and genotype as factors." This description does not align with the content of the left panels. Moreover, two-way ANOVA is not the appropriate statistical analysis for Figure 8A. The authors need to provide accurate details about the analysis and revise the figure legend accordingly. 

      We apologies for the confusing Figure legend which has been revised: 

      “Fig. 8: TRF improved social memory and stereotypic grooming behavior in the Fmr1 KO mice. (A) Social memory was evaluated with the 5-trial social interaction test as described above. The social memory recognition was significantly augmented in the Fmr1 KO by the intervention, suggesting that the treated mutants were able to distinguish the novel mouse from the familiar mouse. The time spent in social interactions with the novel mouse in the 5<sup>th</sup>-trial was increased to WT-like levels in the mutants on TRF. Paired t-tests were used to evaluate significant differences in the time spent interacting with the test mouse in the 4<sup>th</sup> (familiar mouse) and 5<sup>th</sup> (novel mouse) trials.  *P < 0.05 indicates the significant time spent with the novel mouse compared to the familiar mouse. (B) Grooming was assessed in a novel arena in mice of each genotype (WT, Fmr1 KO) under each feeding condition and the resulting data analyzed by two-way ANOVA followed by the Holm-Sidak’s multiple comparisons test with feeding regimen and genotype as factors. *P < 0.05 indicates the significant difference within genotype - between diet regimens , and #P < 0.05 those between genotypes - same feeding regimen. (C) TRF did not alter the overall locomotion in the treated mice. See Table 8.”

      To assess social recognition memory, mice underwent a five-trial social interaction paradigm in a neutral open-field arena. Each trial lasted 5 minutes and was separated by a 1-minute inter-trial interval. During trials 1–4, the test mouse was exposed to the same conspecific (Stimulus A) enclosed within a wire cup to permit olfactory and limited tactile interaction. In trial 5, a novel conspecific (Stimulus B) was introduced. Time spent investigating the stimulus B mouse (defined as sniffing or directing the nose toward the enclosure within close proximity) was scored using AnyMaze software. A progressive decrease in investigation time across trials 1–4 reflects habituation, while a significant increase in trial 5 indicates dishabituation and intact social recognition memory. In our data, there was not a lot of habituation in both genotypes, but clear differences can be appreciated between trial 4 with the now familiar mouse and trial 5 with novel mouse. Fig. 8A plots the results from individual animals in Trial 4 with a familiar mouse and in Trial 5 with a novel mouse, we have well specified this in the legends. As such, these data were analyzed with a pair t-test. 

      We used Tow-Way ANOVA to analyse the data reported in Panel 8B and as well as the results in Table 8.  This has been clarified in the legend.

      (8) The circadian activity and sleep behaviors of Fmr1 KO mice have been reported previously, with some findings consistent with the current manuscript, while others contradict it. Although the authors acknowledge this discrepancy, it seems insufficiently thorough to simply state that the reasons for the conflicts are unknown. Did the studies use the same equipment for behavior recording? Were the same parameters used to define locomotor activity and sleep behaviors? The authors are encouraged to investigate these details further, as doing so may uncover something interesting or significant. 

      We agree with the reviewers, and believe that the main differences were likely in the experimental design and possibly interpretation.

      (9) Some subtitles in the Results section and the figure legends do not align well with the presented data. For example, in the section titled "Reduced rhythmic strength and nocturnality in the Fmr1 KOs," it is unclear how the authors justify the claim of altered nocturnality in Fmr1 KO mice. How do the authors define changes in nocturnality? Additionally, the tense used in the subtitles and figure legends is incorrect. The authors are encouraged to carefully review all subtitles and figure legends to correct these errors and enhance readability. 

      Nocturnality is defined as the % of total activity within a 24-h cycle that occurred in the night, since this can be confusing and we agree that it was not well explained we have removed it from the subtitle/figure legends. 

      We have adjusted the subtitles as recommended; however, the tense of the verbs might be a matter of writing style.

      Reviewer #2 (Public review): 

      Summary: 

      In the present study, the authors, using a mouse model of Fragile X syndrome, explore the very interesting hypothesis that restricting food access over a daily schedule will improve sleep patterns and, subsequently, behavioral capacities. By restricting food access from 12h to 6h over the nocturnal period (active period for mice), they show, in these KO mice, an improvement of the sleep pattern accompanied by reduced systemic levels of inflammatory markers and improved behavior. Using a classical mouse model of neurodevelopmental disorder (NDD), these data suggest that eating patterns might improve sleep quality, reduce inflammation and improve cognitive/behavioral capacities in children with NDD. 

      Strengths: 

      Overall, the paper is very well-written and easy to follow. The rationale of the study is generally well-introduced. The data are globally sound. The provided data support the interpretation overall. 

      Thank you for the positive comments.  

      Weaknesses:  

      (1) The introduction part is quite long in the Abstract, leaving limited space for the data provided by the present study.

      We have revised the Abstract to better focus on the most impactful findings as suggested. 

      (2) A couple of points are not totally clear for a non-expert reader:  - The Fmr1/Fxr2 double KO mice are not well described. What is the rationale for performing both LD and DD measures? 

      We did not use the Fmr1/Fxr2 double KO mice in this study.  

      While measurement of day/night differences in activity rhythms are standardly done in a light/dark (LD) cycle, the organisms must be under constant conditions (DD) to measure their endogenous circadian rhythms (free running activity); this is often needed to uncover a compromised clock as entrainment to the LD cycle can mask deficits in the endogenous circadian rhythms.

      (3) The data on cytokines and chemokines are interesting. However, the rationale for the selection of these molecules is not given. In addition, these measures have been performed in the systemic blood. Measures in the brain could be very informative. 

      The panel that we used had 16 cytokines/chemokines which are reported in Table 9. The experiment included WT and mutants held under 2 different feeding conditions with an n=8 per group. If we are able to obtain more resources, we would like to also carry out a comprehensive investigation of immunomediator levels as well as RNA-seq or Nanostring in selected brain regions associated with ASD aberrant behavioural phenotypes, for instance the prefrontal cortex.

      (4) An important question is the potential impact of fasting vs the impact of the food availability restriction. Indeed, fasting has several effects on brain functioning including cognitive functions. 

      We did not address this issue in the present study. Briefly, the distinction between caloric restriction (CR) and TRF, in which no calories are restricted, has important mechanistic implications in mouse models. While both interventions can impact metabolism, circadian rhythms, and aging, they operate via overlapping but distinct molecular pathways. These have been the topic of recent reviews and investigations. Importantly, the fast-feed cycle can also act as a circadian entrainer (Zeitgeber)

      Ribas-Latre A, Fernández-Veledo S, Vendrell J. Time-restricted eating, the clock ticking behind the scenes. Front Pharmacol. 2024 Aug 8;15:1428601. doi: 10.3389/fphar.2024.1428601. PMID: 39175542; PMCID: PMC11338815.

      Wang R, Liao Y, Deng Y, Shuang R. Unraveling the Health Benefits and Mechanisms of Time-Restricted Feeding: Beyond Caloric Restriction. Nutr Rev. 2025 Mar 1;83(3):e1209-e1224. doi: 10.1093/nutrit/nuae074.

      (5) How do the authors envision the potential translation of the present study to human patients? How to translate the 12 to 6 hours of food access in mice to children with Fragile X syndrome? 

      Time-restricted feeding (TRF) is a type of intermittent fasting that limits food intake to a specific window of time each day (usually 8–12 hours in humans), is being actively studied in adults for benefits on metabolic health, sleep, and circadian rhythms. However, applying TRF to children is not currently recommended as a general intervention, and there are important developmental, medical, and ethical considerations to take into account.  

      On the other hand, we believe that the Fmr1 KO mouse is a good preclinical model for FXS because it closely recapitulates key molecular, cellular, and behavioral phenotypes observed in humans with the disorder. A number of the behavioral phenotypes seen in the mouse mirror those seen in patients including increased anxiety-like behavior, sensory hypersensitivity, social interaction deficits and repetitive behaviors so there is strong face validity.  

      As we show in this study, Fmr1 KO mice present with disrupted sleep/wake cycles and reduced amplitude of circadian rhythms, consistent with findings in individuals with FXS. This makes the Fmr1 KO an excellent model to test out circadian based interventions such as scheduled feeding.

      We believe that pre-clinical research in Fmr1 KO mice bridges the gap between basic discovery and human clinical application. It provides a controlled, cost-effective, and biologically relevant platform for understanding disease mechanisms and testing interventions. These types of experiments need to be done before jumping to humans to ensure that the human trials are scientifically justified and ethically sound.

      Reviewer #1 (Recommendations for the authors): 

      The authors should: 

      (1) Revise the Methods section for clarity and completeness.  

      We have re-worked the methods for clarity and completeness. 

      (2) Provide consistent and precise definitions for all parameters and terms.  

      We believe that we have provided definitions for all terms.  

      (3) Clarify the rationale for experimental designs, such as the feeding schedule.  

      We have added to the rationale for the feeding schedule.  This feeding schedule has been used in a number of prior studies including our own.  All this work is cited in the manuscript.   

      (4) Reanalyze and transparently present data, including individual trial results.  

      We have added to the figure showing the individual trail results for the 5-trial tests as requested (Supplementary Fig. 2).  

      (5) Conduct appropriate statistical tests and correct figure legends.  

      We believe that we have carried out appropriate statistical tests and have carefully rechecked the figure legends.  

      (6) Investigate discrepancies with prior studies to enhance the discussion. 

      We have added to our discussion of prior work. 

      (7) Improve language quality and ensure consistency in terminology and grammar.  

      We have edited the manuscript to improve language quality.  

      Reviewer #2 (Recommendations for the authors): 

      (1) The Abstract should be rewritten to provide more room for the obtained data.  

      We have re-written the Abstract to focus on the most impactful findings. 

      (2) An additional sentence describing the double KO mice should be added.  

      We did not use double KO mice in this study.  

      (3) The rationale for studying LD and DD should be provided. 

      Measurement of day/night differences are standardly done in a light/dark cycle.  To measure the endogenous circadian rhythms, the organisms must be under constant conditions (Dark/Dark).

      (4) The data on cytokines/chemokines should be strengthened by performing a larger panel of measures both in blood and the brain.  

      The panel that we used had 16 cytokines/chemokines which we report in Table 9.  This was a large experiment with 2 genotypes being held under 2 feeding conditions with n=8 mice per group. If we are able to obtain more resources, we would like to also carry out RNA-seq in different brain regions.  

      (5) The authors should discuss in more detail the potential role of fastening vs restriction of food access.  

      We did not address this issue in the present study.  Briefly, the distinction between caloric restriction (CR) and TRF when no calories are restricted has important mechanistic implications in mouse models. While both interventions can impact metabolism, circadian rhythms, and aging, they operate via overlapping but distinct molecular pathways. 

      (6) The authors should also provide some insight into their view on the potential translation of their experimental studies.  

      We believe that the Fmr1 KO mouse is considered a good preclinical model for FXS because it closely recapitulates key molecular, cellular, and behavioral phenotypes observed in humans with the disorder. A number of the behavioral phenotypes seen in the mouse mirror those seen in patients including increased anxiety-like behavior, sensory hypersensitivity, social interaction deficits and repetitive behaviors so there is strong face validity.   As we  demonstrate in this study, Fmr1 KO mice exibit disrupted sleep/wake cycles and reduced amplitude of circadian rhythms, consistent with findings in individuals with FXS.  This makes the Fmr1 KO an excellent model to test out circadian based interventions such as scheduled feeding.  

      Still we are mindful that the translation of therapeutic findings from mouse to human has proven challenging e.g., mGluR5 antagonists failed in clinical trials despite strong preclinical data (Berry-Kravis et al., 2016).  Therefore, we are cautious in overreaching in our translational interpretations. 

      Berry-Kravis, E., Des Portes, V., Hagerman, R., Jacquemont, S., Charles, P., Visootsak, J., Brinkman, M., Rerat, K., Koumaras, B., Zhu, L., Barth, G. M., Jaecklin, T., Apostol, G., & von Raison, F. (2016). Mavoglurant in fragile X syndrome: Results of two randomized, double-blind, placebo-controlled trials. Science translational medicine, 8(321), 321ra5. https://doi.org/10.1126/scitranslmed.aab4109).

    1. eLife Assessment

      This important work advances our understanding of DNA methylation and its consequences for susceptibility to DNA damage. This work presents evidence that DNA methylation can accentuate the genomic damage propagated by DNA damaging agents as well as potentially being an independent source of such damage. The experimental results reported are sound but the evidence presented to support the conclusions drawn is incomplete and other interpretations are possible. The work will be of broad interest to biochemists, cell and genome biologists.

    2. Reviewer #1 (Public review):

      Summary:

      The manuscript titled "Introduction of cytosine-5 DNA methylation sensitizes cells to oxidative damage" proposes that 5mC modifications to DNA, despite being ancient and wide-spread throughout life, represent a vulnerability, making cells more susceptible to both chemical alkylation and, of more general importance, reactive oxygen species. Sarkies et al take the innovative approach of introducing enzymatic genome-wide cytosine methylation system (DNA methyltransferases, DNMTs) into E. coli, which normally lacks such a system. They provide compelling evidence that the introduction of DNMTs increases the sensitivity of E. coli to chemical alkylation damage. Surprisingly they also show DNMTs increase the sensitivity to reactive oxygen species and propose that the DNMT generated 5mC presents a target for the reactive oxygen species that is especially damaging to cells. Evidence is presented that DNMT activity directly or indirectly produces reactive oxygen species in vivo, which is an important discovery if correct, though the mechanism for this remains obscure.

      I am satisfied that the points #2, #3 and #4 relating to non-addativity, transcriptional changes and ROS generation have been appropriately addressed in this revised manuscript. The most important point (previously #1) has not been addressed beyond the acknowledgement in the results section that: "Alternatively, 3mC induction by DNMT may lead to increased levels of ssDNA, particularly in alkB mutants, which could increase the risk of further DNA damage by MMS exposure and heighten sensitivity." This slightly miss-represents the original point that 5mC the main enzymatic product of DNMTs rather or in addition to 3mC is likely to lead to transient damage susceptible ssDNA, especially in an alkB deficient background. And more centrally to the main claims of this manuscript, the authors have not resolved whether methylated cytosine introduced into bacteria is deleterious in the context of genotoxic stress because of the oxidative modification to 5mC and 3mC, or because of oxidative/chemical attack to ssDNA that is transiently exposed in the repair processing of 5mC and 3mC, especially in an alkB deficient background. This is a crucial distinction because chemical vulnerability of 5mC would likely be a universal property of cytosine methylation across life, but the wide-spread exposure of ssDNA is expected to be peculiarity of introducing cytosine methylation into a system not evolved with that modification as a standard component of its genome.

      These two models make different predictions about the predominant mutation types generated, in the authors system using M.SssI that targets C in a CG context - if oxidative damage to 5mC dominates then mutations are expected to be predominantly in a CG context, if ssDNA exposure effects dominate then the mutations are expected to be more widely distributed - sequencing post exposure clones could resolve this.

      Strengths:

      This work is based on an interesting initial premise, it is well motivated in the introduction and the manuscript is clearly written. The results themselves are compelling.

      Weaknesses:

      I am not currently convinced by the principal interpretations and think that other explanations based on known phenomena could account for key results. Specifically the authors have not resolved whether oxidative modification to 5mC and 3mC, or chemical attack to ssDNA that is transiently exposed in the repair processing of 5mC and 3mC is the principal source of the observed genotoxicity.

      (1) Original query which still stands: As noted in the manuscript, AlkB repairs alkylation damage by direct reversal (DNA strands are not cut). In the absence of AlkB, repair of alklylation damage/modification is likely through BER or other processes involving strand excision and resulting in single stranded DNA. It has previously been shown that 3mC modification from MMS exposure is highly specific to single stranded DNA (PMID:20663718) occurring at ~20,000 times the rate as double stranded DNA. Consequently the introduction of DNMTs is expected to introduce many methylation adducts genome-wide that will generate single stranded DNA tracts when repaired in an AlkB deficient background (but not in an AlkB WT background), which are then hyper-susceptible to attack by MMS. Such ssDNA tracts are also vulnerable to generating double strand breaks, especially when they contain DNA polymerase stalling adducts such as 3mC. The generation of ssDNA during repair is similarly expected follow the H2O2 or TET based conversion of 5mC to 5hmC or 5fC neither of which can be directly repaired and depend on single strand excision for their removal. The potential importance of ssDNA generation in the experiments has not been [adequately] considered.

    3. Reviewer #2 (Public review):

      5-methylcytosine (5mC) is a key epigenetic mark in DNA and plays a crucial role in regulating gene expression in many eukaryotes including humans. The DNA methyltransferases (DNMTs) that establish and maintain 5mC, are conserved in many species across eukaryotes, including animals, plants, and fungi, mainly in a CpG context. Interestingly, 5mC levels and distributions are quite variable across phylogenies with some species even appearing to have no such DNA methylation.

      This interesting and well-written paper discusses continuation of some of the authors' work published several years ago. In that previous paper, the laboratory demonstrated that DNA methylation pathways coevolved with DNA repair mechanisms, specifically with the alkylation repair system. Specifically, they discovered that DNMTs can introduce alkylation damage into DNA, specifically in the form of 3-methylcytosine (3mC). (This appears to be an error in the DNMT enzymatic mechanism where the generation 3mC as opposed to its preferred product 5-methylcytosine (5mC), is caused by the flipped target cytosine binding to the active site pocket of the DNMT in an inverted orientation.) The presence of 3mC is potentially toxic and can cause replication stress, which this paper suggests may explain the loss of DNA methylation in different species. They further showed that the ALKB2 enzyme plays a crucial role in repairing this alkylation damage, further emphasizing the link between DNA methylation and DNA repair.

      The co-evolution of DNMTs with DNA repair mechanisms suggest there can be distinct advantages and disadvantages of DNA methylation to different species which might depend on their environmental niche. In environments that expose species to high levels of DNA damage, high levels of 5mC in their genome may be disadvantageous. This present paper sets out to examine the sensitivity of an organism to genotoxic stresses such as alkylation and oxidation agents as the consequence of DNMT activity. Since such a study in eukaryotes would be complicated by DNA methylation controlling gene regulation, these authors cleverly utilize Escherichia coli (E.coli) and incorporate into it the DNMTs from other bacteria that methylate the cytosines of DNA in a CpG context like that observed in eukaryotes; the active sites of these enzymes are very similar to eukaryotic DNMTs and basically utilize the same catalytic mechanism (also this strain of E.coli does not specifically degrade this methylated DNA) .

      The experiments in this paper more than adequately show that E. coli expression of these DNMTs (comparing to the same strain without the DNMTS) do indeed show increased sensitivity to alkylating agents and this sensitivity was even greater than expected when a DNA repair mechanism was inactivated. Moreover, they show that this E. coli expressing this DNMT is more sensitive to oxidizing agents such as H2O2 and has exacerbated sensitivity when a DNA repair glycosylase is inactivated. Both propensities suggest that DNMT activity itself may generate additional genotoxic stress. Intrigued that DNMT expression itself might induce sensitivity to oxidative stress, the experimenters used a fluorescent sensor to show that H2O2 induced reactive oxygen species (ROS) are markedly enhanced with DNMT expression. Importantly, they show that DNMT expression alone gave rise to increased ROS amounts and both H2O2 addition and DNMT expression has greater effect that the linear combination of the two separately. They also carefully checked that the increased sensitivity to H2O2 was not potentially caused by some effect on gene expression of detoxification genes by DNMT expression and activity. Finally, by using mass spectroscopy, they show that DNMT expression led to production of the 5mC oxidation derivatives 5-hydroxymethylcytosine (5hmC) and 5-formylcytosine (5fC) in DNA. 5fC is a substrate for base excision repair while 5hmC is not; more 5fC was observed. Introduction of non-bacterial enzymes that produce 5hmC and 5fC into the DNMT expressing bacteria again showed a greater sensitivity than expected. Remarkedly, in their assay with addition of H2O2, bacteria showed no growth with this dual expression of DNMT and these enzymes.

      Overall, the authors conduct well thought-out and simple experiments to show that a disadvantageous consequence of DNMT expression leading to 5mC in DNA is increased sensitivity to oxidative stress as well as alkylating agents.

      Again, the paper is well-written and organized. The hypotheses are well-examined by simple experiments. The results are interesting and can impact many scientific areas such as our understanding of evolutionary pressures on an organism by environment to impacting our understanding about how environment of a malignant cell in the human body may lead to cancer.

      In a new revised version of the paper, the authors have adequately addressed issues put forth by other reviewers. The result is even a better manuscript. Additions to the Results and Discussion sections and a new Supplemental Figure 2 give further credence to their conclusions.

    4. Reviewer #3 (Public review):

      Summary:

      Krwawicz et al., present evidence that expression of DNMTs in E. coli results in (1) introduction of alkylation damage that is repaired by AlkB; (2) confers hypersensitivity to alkylating agents such as MMS (and exacerbated by loss of AlkB); (3) confers hypersensitivity to oxidative stress (H2O2 exposure); (4) results in a modest increase in ROS in the absence of exogenous H2O2 exposure; and (5) results in the production of oxidation products of 5mC, namely 5hmC and 5fC, leading to cellular toxicity. The findings reported here have interesting implications for the concept that such genotoxic and potentially mutagenic consequences of DNMT expression (resulting in 5mC) could be selectively disadvantageous for certain organisms. The other aspect of this work which is important for understanding the biological endpoints of genotoxic stress is the notion that DNA damage per se somehow induces elevated levels of ROS.

      Strengths:

      The manuscript is well-written, and the experiments have been carefully executed providing data that support the authors' proposed model presented in Fig. 7 (Discussion, sources of DNA damage due to DNMT expression).

      Weaknesses:

      (1) The authors have established an informative system relying on expression of DNMTs to gauge the effects of such expression and subsequent induction of 3mC and 5mC on cell survival and sensitivity to an alkylating agent (MMS) and exogenous oxidative stress (H2O2 exposure). The authors state (p4) that Fig. 2 shows that "Cells expressing either M.SssI or M.MpeI showed increased sensitivity to MMS treatment compared to WT C2523, supporting the conclusion that the expression of DNMTs increased the levels of alkylation damage." This is a confusing statement and requires revision as Fig. 2 does ALL cells shown in Fig. 2 are expressing DNMTs and have been treated with MMS. It is the absence of AlkB and the expression of DNMTs that that causes the MMS sensitivity.

      (2) It would be important to know whether the increased sensitivity (toxicity) to DNMT expression and MMS is also accompanied by substantial increases in mutagenicity. The authors should explain in the text why mutation frequencies were not also measured in these experiments.

      (3) Materials and Methods. ROS production monitoring. The "Total Reactive Oxygen Species (ROS) Assay Kit" has not been adequately described. Who is the Vendor? What is the nature of the ROS probes employed in this assay? Which specific ROS correspond to "total ROS"?

      (4) The demonstration (Fig. 4) that DNMT expression results in elevated ROS and its further synergistic increase when cells are also exposed to H2O2 is the basis for the authors' discussion of DNA damage-induced increases in cellular ROS. S. cerevisiae does not possess DNMTs/5mC, yet exposure to MMS also results in substantial increases in intracellular ROS (Rowe et al, (2008) Free Rad. Biol. Med. 45:1167-1177. PMC2643028). The authors should be aware of previous studies that have linked DNA damage to intracellular increases in ROS in other organisms and should comment on this in the text.