10,000 Matching Annotations
  1. May 2025
    1. Reviewer #2 (Public review):

      Summary:

      The cerebellum is known to be vulnerable to aging, yet specific cell type vulnerability remains understudied. This important study convincingly demonstrates that the normal aged mouse cerebellum exhibits Purkinje cell loss, and that the vulnerable PCs to age are arranged on the basis of the known zebrin stripe pattern that represents a particular subtype of the PCs. Although the patterns of PC loss were analyzed qualitatively, the phenotype is robust enough to clearly appreciate that PC loss occurs predominantly in zebrin-negative regions when combined with zebrin immunohistochemistry. Interestingly, the authors demonstrate that this phenotype appears stochastically even within the inbred C57BL/6J mouse strain examined, though the mechanisms behind this individual variability remain unexplored. In contrast to the expectation that the PC loss could account for age-related motor decline, the authors did not find any correlation between them. While the authors attempt to draw parallels with normal human aging, the human phenotypes have not been conclusively shown to match those in mice beyond the occurrence of potentially age-related PC loss. Future studies should investigate why this PC loss phenotype occurs stochastically across the population and whether these findings parallel human cerebellar aging.

      Strength:

      (1) Banding pattern of PC loss is very clearly demonstrated by combining immunostaining for zebrin.

      (2) A critical methodological concern that a standard PC marker, calbindin, could be compromised in aging has been addressed by performing control experiments with appropriate counterstaining.

      (3) Parallels with neurodegenerative phenotype would be helpful to understand the mechanisms of PC loss in the future.

      Weakness:

      (1) Limited strain diversity: The study exclusively uses C57BL/6J mice despite known genetic and motor differences even the closely related strains like C57BL/6N.

      (2) No correlation quantified between the degree of PC loss, aging, and motor performance.

      (3) It has not been demonstrated whether the neurodegenerative changes are indeed observed in zebrin-negative PCs.

      (4) The mechanisms of why only a subset of mice show PC loss remain unexplored and not discussed.

      (5) Linkages with normal human aging and cerebellar function are not well supported. While motor behavioral assays captured phenotypes that mimic aged people, correlation with PC loss is demonstrated to be absent in mice. It remains unclear whether this PC loss phenomenon is universal or specific to a particular individual; and whether specific to a human PC subtype.

      (6) Analyses in the paraflocculus are currently not easy to understand. This lobule has heterogeneous PC subtypes, developmentally or molecularly. Zebrin-weak and Zebrin-intense PCs are known to be arranged in stripes, which resembles the pattern of developmentally defined PC subsets (Fujita et al., 2014, Plos one; Fujita et al., 2012, J Neurosci). In the data presented, it is hard to appreciate whether the viewing angle is consistent relative to the angle of the paraflocculus. This may be a limitation of the analysis of the paraflocculus in general, that the orientation of this lobule is so susceptible to fixation and dissection. Discrepancy between PC loss stripe and zebrin pattern may be an overstatement, because appropriate analyses on the paraflocculus would require a rigorously standardized analytic method.

    2. Reviewer #3 (Public review):

      Summary:

      Donofrio et al. report a new observation that in normal aging mice, anti-calbindin wholemount staining and coronal immunohistochemistry in the cerebellum often show a sagittally patterned loss of Purkinje cells with age. The authors address a central concern that calbindin antibody staining alone is not sufficient to definitively assess Purkinje cell loss, and corroborate their antibody staining data with transgenic Pcp2-CRE x flox-GFP reporter mice and Neutral Red staining. The authors then investigate whether this patterned Purkinje loss correlates with the known parasagittal expression of zebrin-II, finding a strong but imperfect correlation with zebrin-II antibody staining. They next draw a connection between this age-related Purkinje loss to the age-related decline in motor function in mice, with a trending but non-significant statistical association between the severity/patterning of Purkinje loss and motor phenotypes within cohorts of aged mice. Finally, the authors look at post-mortem human cerebellar tissues from deceased healthy donors between 21 and 74 years of age, finding a positive correlation between Purkinje degeneration and age, but with unknown spatial patterning.

      Strengths:

      The conclusions drawn from this study are well supported by the data provided. The authors highlight several examples of parasagittal patterning of Purkinje cell degeneration in disease, and show that proper methodologies must be used to account for these patterns to avoid highly variable data in the sagittal plane. The authors aptly point out that additional work is needed to investigate the spatial patterns of Purkinje cell loss in the human cerebellum.

      Weaknesses:

      (1) In Figure 3, the authors use Pcp2-CRE mice to drive GFP expression in Purkinje cells in order to avoid the confounding variable of loss of calbindin expression in aging Purkinje cells. The authors go on to say, "we argue that calbindin expression alone is not a reliable, sufficient indicator of Purkinje cell loss". However, in Figure 4, the authors return to calbindin staining alone to assess the correlation of Purkinje cell loss with zebrin-II expression. Could the authors comment on why zebrin-II co-staining experiments were not performed in GFP reporter mice to avoid potential confounds of calbindin expression? Without this experiment, should readers accept the data presented in Figure 4 as a "reliable, sufficient indicator of Purkinje cell loss", given the author's prior claim?

      (2) Throughout the manuscript, there is a considerable reliance on the authors' interpretation of imaging data with no accompanying quantification (categorization of "striped" or "non-striped" PC loss, correlation of GFP/calbindin/zebrin-II staining, etc.). While this may be difficult to obtain, the results would be much stronger with a quantitative approach to support the stated categorizations/observations.

    3. Author response:

      We thank all three reviewers for providing excellent suggestions that we feel will enhance the clarity and impact of our manuscript. When we submit the revised manuscript, we plan to respond to each comment and provide additional data and discussion points as requested. Below, we include an outline of the main points that we intend to address.

      (1) Reviewers 1 and 2 both suggested investigating degenerative changes in Purkinje cells that are more resistant to age-related loss. We will look for hallmarks of neurodegeneration, such as shrunken dendrites and axonal swellings, in two areas: surviving Purkinje cells adjacent to stripes of cell loss, and the Purkinje cells in aged mice without Purkinje cell loss.

      (2) We agree with Reviewer 2’s point that our manuscript would benefit from discussion of the differences in vulnerability between individual mice.  Therefore, we will elaborate upon possible reasons why some aged mice are more resistant to age-related Purkinje cell loss than others.

      (3) We will take Reviewer 3’s suggestion to perform zebrin II co-staining in our GFP reporter mice, given our findings that calbindin staining can be unreliable in this context. 4) We appreciate Reviewer 3’s comment that quantification would support the observations made in our study. To provide quantitative evidence for our categorization of mice with striped and non-striped Purkinje cell loss, we will measure the gaps (or lack thereof) between Purkinje cell bodies in the anterior zone.

      (4) We will also incorporate several minor but important changes suggested by all three reviewers.

      Thank you to the reviewers and editors for taking the time and effort to review our manuscript.

    1. eLife Assessment

      This study presents a valuable finding on how the locus coeruleus modulates the involvement of medial prefrontal cortex in set shifting using calcium imaging. The evidence supporting the claims was viewed as incomplete, although a more rigorous statistical comparison of intradimensional vs. extradimensional stages of the task, either in behavior or in the calcium imaging data, would help to address this concern. The work is of broad interest to those studying flexible cognition.

    2. Reviewer #1 (Public review):

      Summary:

      The authors note that there is a large corpus of research establishing the importance of LC-NE projections to the medial prefrontal cortex (mPFC) of rats and mice in attentional set or 'rule' shifting behaviours. However, this is complex behavior, and the authors were attempting to gain an understanding of how locus coeruleus modulation of the mPFC contributes to set shifting.

      The authors replicated the ED-shift impairment following NE denervation of mPFC by chemogenetic inhibition of the LC. They further showed that LC inhibition changed the way neurons in mPFC responded to the cues, with a greater proportion of individual neurons responsive to 'switching', but the individual neurons also had broader tuning, responding to other aspects of the task (i.e., response choice and response history). The population dynamics were also changed by LC inhibition, with reduced separation of population vectors between early-post-switch trials, when responding was at chance, and later trials when responding was correct. This was what they set out to demonstrate, and so one can conclude they achieved their aims.

      The authors concluded that LC inhibition disrupted mPFC "encoding capacity for switching" and suggest that this "underlie the behavioral deficits."

      Strengths:

      The principal strength is the combination of inactivation of LC with calcium imaging in the mPFC. This enabled detailed consideration of the change in behavior (i.e., defining epochs of learning, with an 'early phase' when responding is at chance being compared to a 'later phase' when the behavioral switch has occurred) and how these are reflected in neuronal activity in the mPFC, with and without LC-NE input.

      Weaknesses:

      Methodologically, some improvement could be made in terms of the statistical descriptions. Supplementary Figure 2: For the peripheral CNO, the 'control group' (saline) was n=4 and the test group (CNO), n=5. For the central CNO, the test group was n = 8 and the control was n = 7. The authors explain that the group sizes were not statistically determined and mice were assigned to groups 'arbitrarily', but why did they not at least make the group sizes equal?

      In Figure 1 (e), given the small sample size, it would be helpful if all the data points were included on the bar charts. As a t-test was performed on only the ED stage of the test, seeing all the data points would reassure that there would not have been a statistically significant 'improvement' in the ID stage in the group given mPFC CNO. It would also be helpful to give effect sizes for all statistical tests.

    3. Reviewer #2 (Public review):

      Summary:

      The authors were building on prior research linking cortical norepinephrine in a test of attentional set shifting. They extended prior research by assessing the effects of excitatory or inhibitory DREADDs prior to the test of attentional set shifting.

      Strengths:

      The use of DREADDs in the previously validated test of attentional set shifting improves temporal control of corticopetal, noradrenergic pathways during behavior. While mice typically require multiple intradimensional shifts to form an attentional set, the subjects in the current study perform a variant of the task similar to that used in humans, improving the translational validity of the work.

      Weaknesses:

      A critical piece of evidence needed to support the behavioral claim that mice form an attentional set is a statistically significant difference between the number of trials to reach criterion at the intradimensional vs. the extradimensional stage of the task. Based on prior literature, this could be done as a planned comparison, which would improve the power to detect differences beyond that found using an HSD test. An additional methodological ambiguity is the amount of time between the administration of CNO and the performance of the ED. As reported, it seems likely that the DREADDS were impacting performance at multiple stages of the test.

      Overall, the authors seem to have achieved their aims, but have failed to provide critical statistical support for claims made.

      The work is likely to be of interest to the burgeoning number of scientists investigating the role of cortical norepinephrine in cognitive flexibility.

    4. Reviewer #3 (Public review):

      Summary:

      Nigro et al examine how the locus coeruleus (LC) influences the medial prefrontal cortex (mPFC) during attentional shifts required for behavioral flexibility. Specifically, they propose that LC-mPFC inputs enable mice to shift attention effectively from texture to odor cues to optimize behavior. The LC and its noradrenergic projections to the mPFC have previously been implicated in this behavior. The authors further establish this by using chemogenetics to inhibit LC terminals in mPFC and show a selective deficit in extradimensional set-shifting behavior. However, the study's primary innovation is the simultaneous inhibition of LC while recording multineuron patterns of activity in mPFC. Analysis at the single neuron and population levels revealed broadened tuning properties, less distinct population dynamics, and disrupted predictive encoding when LC is inhibited. These findings add to our understanding of how neuromodulatory inputs shape attentional encoding in mPFC. However, several issues somewhat limit the overall impact and interpretation of the results.

      Strengths:

      The more naturalistic set-shifting task used in the study is a major strength, and its implementation in freely-moving animals is very useful. The inclusion of localized suppression of LC-mPFC terminals is also a strength that builds confidence in the specificity of their behavioral effect. Moreover, the combination of chemogenetic inhibition of LC while simultaneously recording neural activity in mPFC with miniscopes is state-of-the-art. The authors apply analyses to population dynamics, in particular, that can advance our understanding of how the LC modifies patterns of mPFC neural activity. The authors show that neural encoding at both the single-cell level and the population level is disrupted when LC is inhibited. They also show that activity is less able to predict key aspects of the behavior when the influence of LC is disrupted. This is quite interesting and adds to a growing understanding of how neuromodulatory systems sharpen the tuning of mPFC activity.

      Weaknesses:

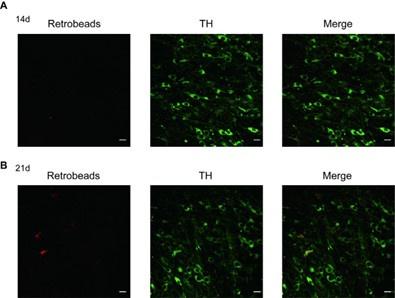
      There are some concerns about tying the results to noradrenergic circuit activity. The authors use a DBH-Cre mouse line, but the histology images provided are low resolution, and surprisingly, there appears to be little overlap between HM4Di expression and TH immunostaining. It is unclear what explains this, but without further confirmation, it is hard to be sure whether the manipulation selectively impacts a specific LC population. While the authors are generally conservative in relating their findings to norepinephrine (NE) signaling, it is still implied that this is likely. But even if HM4Di is expressed specifically in DBH+ LC neurons, there is no confirmation that NE release is suppressed, and these neurons may release other neurotransmitters, including glutamate and dopamine. In the absence of careful controls, it is important to recognize that effects may or may not be due to LC-mPFC NE.

      Another weakness is that the behavior of miniscope mice is not shown. These experiments make up the bulk of the study, including the most significant results (Figures 2-4). Interpreting the chemogenetics + imaging results without this data is more challenging and relies on the assumption that they were affected similarly to an animal from Figure 1. More fundamentally, the imaging analyses are entirely from the extradimensional shift session. Showing similar analyses from the intradimensional shift (IDS) session would confirm that test group mice do not exhibit broadened tuning prior to injecting CNO and would help to establish whether the observed changes are to some feature of activity that is specific to extradimensional shifts. The ideal experiment would also include a separate group of animals with LC suppression during the IDS, which would show whether the observed effects are specific to an extradimensional shift and might explain behavioral effects.

      There are also some weaknesses in how the single neuron encoding data is analyzed and presented. First, the corresponding methods section is insufficient to fully understand how selectively tuned neurons were classified. The authors perform ROC analysis for the period 0 - 5s before choice to reveal choice-tuned neurons. It would be useful to know what proportion of the total neurons this represents, and whether this includes neurons with activity that is significantly increased, decreased, or both. Further, insufficient detail is provided to be able to understand how neurons are further classified into 'choice', 'history', and 'switch' categories, or what percentage of ROC-identified neurons fall into each category (only % of total neurons is provided).

      Finally, there are some concerns about lumping all the identified neurons together (as in Figure 2F). The miniscope experiments include very few mice (n=4 controls, n=5 test), and effects may be driven by only 1 or 2 subjects. Also, plotting the data on a per-animal basis would help to better understand the effects in greater detail. Overall, the results are interesting, but these weaknesses limit the strength and specificity of the claims that can be made.

    1. eLife Assessment

      This valuable study found Gamma Knife SBRT combined with tislelizumab offers a safe and powerful later-line option for pMMR/MSS/MSI-L metastatic CRC patients who were unresponsive to the first and second-line chemotherapy. The authors implemented a well-structured experimental protocol and provide convincing evidence to substantiate the conclusions. This work would be of broad interest to oncologists working on colorectal cancer.

    2. Reviewer #1 (Public review):

      Summary:

      This study presents compelling evidence for a novel treatment approach in a challenging patient population with MSS/pMMR mCRC, where traditional immunotherapy has often fallen short. The combination of SBRT and tislelizumab not only yielded a high disease control rate but also indicated significant improvements in the tumor's immune landscape. The safety profile appears favorable, which is crucial for patients who have already undergone multiple lines of therapy.

      Strengths:

      The results underscore the potential of leveraging radiation therapy to enhance the effectiveness of immunotherapy, especially in tumor environments previously deemed hostile to immune interventions. Future research should focus on larger cohorts to validate these findings and explore the underlying mechanisms of immune modulation post-treatment.

      Comments on revisions:

      The author provided satisfactory responses to my queries, offering clarifications and additional explanations to address potential points of confusion. The supplementary experimental data further corroborate the author's conclusions. Although a more in-depth and detailed analysis did not yield significant results, this does not undermine the overall integrity of the article's structure or the reliability of its conclusions. Based on the content and the supporting evidence presented, I believe this article meets the necessary criteria for publication.

    3. Reviewer #2 (Public review):

      Summary:

      This Phase II clinical trial investigates the combination of Gamma Knife Stereotactic Body Radiation Therapy (SBRT) with Tislelizumab for the treatment of metastatic colorectal cancer (mCRC) in patients with proficient mismatch repair (pMMR). The study addresses a critical clinical challenge in the management of pMMR CRC, focusing on the selection of appropriate candidates. The results suggest that the combination of Gamma Knife SBRT and Tislelizumab provides a safe and potent treatment option for patients with pMMR/MSS/MSI-L mCRC who have become refractory to first- and second-line chemotherapy. The study design is rigorous, and the outcomes are promising.

      Advantage:

      The trial design was meticulously structured, and appropriate statistical methods were employed to rigorously analyze the results. Bioinformatics approaches were utilized to further elucidate alterations in the patient's tumor microenvironment and to explore the underlying factors contributing to the observed differences in treatment efficacy. The conclusions drawn from this trial offer valuable insights for managing advanced colorectal cancer in patients who have not responded to first- and second-line therapies.

      Weakness:

      (1) Clarity and Structure of the Abstract<br /> - Results Section: The results section should contain important data, I suggest some important sequencing data should be shown to enhance understanding.<br /> (2) As the author using the NanoString assay for transcriptome analysis, more detail should be shown such as the version of R, and the bioinformatics analysis methods.<br /> (3) It is interesting for included patients that PD-L1 increase expression after Gamma Knife Stereotactic Body Radiation Therapy (SBRT) treatment, How to explain it?<br /> (4) It would be helpful to include a brief discussion of the limitations of the study, such as sample size constraints and their impact on the generalizability of the results. This will give readers a more comprehensive understanding of the findings.<br /> (5) Language Accuracy: There are a few instances where wording could be more professional or precise.

      Revision comment:

      The author had responded to all questions and improved the manuscript. The author's answers and revisions are very satisfactory to me. I believe it is an important study for the immunotherapy of colorectal cancer.

    4. Author response:

      The following is the authors’ response to the original reviews

      Public Reviews:

      Reviewer #1 (Public review):

      Summary:

      This study presents compelling evidence for a novel treatment approach in a challenging patient population with MSS/pMMR mCRC, where traditional immunotherapy has often fallen short. The combination of SBRT and tislelizumab not only yielded a high disease control rate but also indicated significant improvements in the tumor's immune landscape. The safety profile appears favorable, which is crucial for patients who have already undergone multiple lines of therapy.

      Strengths:

      The results underscore the potential of leveraging radiation therapy to enhance the effectiveness of immunotherapy, especially in tumor environments previously deemed hostile to immune interventions. Future research should focus on larger cohorts to validate these findings and explore the underlying mechanisms of immune modulation post-treatment.

      Weaknesses:

      I believe the author's work is commendable and should be considered with some minor modifications:

      (1) While the author categorized patients based on the type of RAS mutation and the location of colorectal cancer metastasis, the article does not adequately address how these classifications influence treatment outcomes. Such as whether KRAS or NRAS mutations, as well as the type of metastatic lesions, affect the sensitivity to gamma-ray treatment and lead to varying responses.

      Thank you very much for your question. Therefore, in the revised manuscript, we added an analysis of the impact of RAS mutation types and different metastatic sites on patient prognosis, but unfortunately, due to the limited number of samples, we were unable to obtain satisfactory results. We also placed the relevant results in the supplementary figure.

      (2) In Figure 2, clarification is needed on how the author differentiated between on-target and off-target lesions. I observed that some images depicted both lesion types at the same level, which could lead to confusion.

      We sincerely apologize for any oversight in our previous submission. To clarify, during the process of radiotherapy planning, we pre-select target lesions at the CT image level, and subsequently define the planning treatment volume (PTV) by marking these pre-selected areas with the 50% isodose lines. In our efficacy evaluation, we distinguish between the target lesions inside the PTV and any lesions outside the target area. In response to your valuable feedback, we have now added the isodose lines for the target lesions to the supplementary figure for greater clarity.

      (3) The author performed only a basic difference analysis. A more comprehensive analysis, including calculations of markers related to treatment efficacy, could offer additional insights for clinical practice.

      To identify potential markers associated with treatment efficacy, we attempted to establish a Cox proportional hazards model and conducted both univariate and multivariate Cox regression analyses. Unfortunately, due to the constraints of sample size and sequencing depth, the analyses did not yield statistically significant results, and we were unable to identify markers that could clearly predict treatment outcomes.

      (4) The transcriptome sequencing analysis provides insights into how stereotactic radiotherapy sensitizes immunotherapy; however, it currently relies on a simple pre- and post-treatment group comparison. It would be beneficial to include additional subgroups to explore more nuanced findings.

      We acknowledge the limitations in the depth of our analysis. In addition to performing differential analysis between the responder group (PR) and the non-responder group (Non-PR), we also conducted differential gene expression analysis on samples before and after treatment. The results revealed a consistent increase in the expression of NOS2 in both groups following Gamma Knife combined with immunotherapy, suggesting that this gene may serve as a potential prognostic factor influencing treatment outcomes. However, given the limited number of studies exploring the role of NOS2 in this context, we recognize that further research is necessary to better understand its involvement and to substantiate its potential as a predictive marker.

      (5) The author briefly discusses the effects of changes in tumor fibrosis and angiogenesis on treatment outcomes. Further experiments may be necessary to validate these findings and investigate the underlying mechanisms of immune regulation following treatment.

      We sincerely appreciate your thoughtful feedback on our results. In response, we conducted additional experiments, including immunohistochemical analysis of patient samples before and after combined treatment. The results demonstrated a reduction in the expression of CD31, a marker of tumor angiogenesis, following the combined treatment. This finding further supports our hypothesis that Gamma Knife treatment, in combination with immunotherapy, may effectively inhibit tumor angiogenesis, contributing to an improved therapeutic outcome.

      Reviewer #2 (Public review):

      Summary:

      This Phase II clinical trial investigates the combination of Gamma Knife Stereotactic Body Radiation Therapy (SBRT) with Tislelizumab for the treatment of metastatic colorectal cancer (mCRC) in patients with proficient mismatch repair (pMMR). The study addresses a critical clinical challenge in the management of pMMR CRC, focusing on the selection of appropriate candidates. The results suggest that the combination of Gamma Knife SBRT and Tislelizumab provides a safe and potent treatment option for patients with pMMR/MSS/MSI-L mCRC who have become refractory to first- and second-line chemotherapy. The study design is rigorous, and the outcomes are promising.

      Advantage:

      The trial design was meticulously structured, and appropriate statistical methods were employed to rigorously analyze the results. Bioinformatics approaches were utilized to further elucidate alterations in the patient's tumor microenvironment and to explore the underlying factors contributing to the observed differences in treatment efficacy. The conclusions drawn from this trial offer valuable insights for managing advanced colorectal cancer in patients who have not responded to first- and second-line therapies.

      Weakness:

      (1) Clarity and Structure of the Abstract<br /> - Results Section: The results section should contain important data, I suggest some important sequencing data should be shown to enhance understanding.

      Thank you for your insightful question. In response, we have revised the content of the article and restructured the abstract to enhance its scientific clarity and make it more accessible to readers.

      (2) As the author using the NanoString assay for transcriptome analysis, more detail should be shown such as the version of R, and the bioinformatics analysis methods.

      We have also addressed the missing details in our research methodology. The revised manuscript now includes a complete description of the research methods, along with the specific software and versions used.

      (3) It is interesting for included patients that PD-L1 increase expression after Gamma Knife Stereotactic Body Radiation Therapy (SBRT) treatment, How to explain it?

      Thank you for your thought-provoking question. PD-L1 plays a crucial role in tumor cell immune evasion, and anti-PD-1/PD-L1 inhibitors have emerged as effective immune checkpoint inhibitors, widely used in cancer therapy. In our clinical trials, we observed an increase in PD-L1 expression in some patients following combined treatment. Existing literature suggests that activation of various carcinogenic and stress response pathways, along with post-transcriptional modifications of PD-L1 (such as phosphorylation, glycosylation, acetylation, ubiquitination, and palmitoylation), can influence its expression[1]. We hypothesize that the increase in PD-L1 expression may be attributed to the activation of specific signaling pathways induced by the radiation from Gamma Knife treatment, as well as the enhanced tumor stress in response to the treatment. However, the precise mechanisms underlying this observation require further experimental investigation. A deeper understanding of these processes could potentially optimize our clinical treatment strategies.

      (4) It would be helpful to include a brief discussion of the limitations of the study, such as sample size constraints and their impact on the generalizability of the results. This will give readers a more comprehensive understanding of the findings.

      Thank you for highlighting the limitations of the article. In response, we have added a detailed discussion of the constraints arising from the limited number of experimental samples and insufficient sequencing depth. This addition aims to provide readers with a clearer understanding of the study's limitations and the context of our research findings.

      (5) Language Accuracy: There are a few instances where wording could be more professional or precise.

      Regarding the language deficiency, we are very sorry that the wording of the professional content in the article is not careful and accurate enough due to the difference in the native language environment. We have checked our article again and revised the wording and grammar in the hope that you and other readers can grasp our research content more accurately.

      Recommendations for the authors:

      Reviewer #1 (Recommendations for the authors):

      The research presented in this article is commendable; however, I would like to propose several revisions for consideration:

      Consideration of Concomitant Medications: It is imperative to ascertain whether enrolled patients utilized additional pharmacological agents alongside the trial regimen. Such concurrent drug use could potentially influence the final outcomes. A concise discussion of this aspect is warranted within the manuscript.

      Clinical Characterization of Response Groups: An examination of the clinical characteristics distinguishing the effective and non-responsive cohorts within the trial is essential. This inquiry merits further exploration, as it may elucidate factors influencing treatment efficacy.

      Tumor Microenvironment Analysis: The authors highlight the implications of tumor fibrosis and angiogenesis on therapeutic response. Identification of specific biomarkers associated with these phenotypes is crucial. I recommend undertaking straightforward testing and validation to substantiate these observations.

      Thank you very much for your valuable suggestions, many of which have been incorporated into the revised manuscript. Regarding the consideration of concurrent medication, we would like to clarify that all patients included in the study were advanced CRC patients who had progressed during first- or second-line treatments. As such, targeted therapy or chemotherapy was used concurrently in the trial. Previous studies have not indicated that different targeted therapies influence the efficacy of Gamma Knife treatment, though some chemotherapy agents may vary in their side effects. However, we believe these differences do not significantly impact the final outcomes. Given that existing chemotherapy regimens do not substantially affect patient prognosis, we considered the combined drug treatment regimen to be an irrelevant variable in our analysis.

      Additionally, we have carefully examined the clinical characteristics of patients across different groups. We have also included an analysis of the impact of various mutation types and metastatic sites in the revised manuscript. Furthermore, we plan to perform CD31 staining on lesions from both the responder and non-responder groups before and after Gamma Knife treatment to assess the role of angiogenesis in treatment response.

      Reviewer #2 (Recommendations for the authors):

      The abstract should be revised for greater clarity and include key results that substantiate the conclusions. The discussion section needs to more thoroughly address the limitations of the clinical trial, providing readers with a deeper understanding of the trial's findings and implications. Additionally, the methods section should be more rigorous and detailed, offering sufficient information to enhance the transparency and robustness of the experimental design.

      Thank you for your constructive suggestions regarding the shortcomings in our manuscript. In response, we have thoroughly reviewed the article and addressed the missing content, including revisions to the abstract, results, discussion, and methods sections. Additionally, we have refined the grammar and wording throughout the manuscript to enhance its professionalism and ensure it aligns with the standards expected for publication.

      (1)  YAMAGUCHI H, HSU J M, YANG W H, et al. Mechanisms regulating PD-L1 expression in cancers and associated opportunities for novel small-molecule therapeutics [J]. Nature reviews Clinical oncology, 2022, 19(5): 287-305.

    1. eLife Assessment

      This study provides important information on the ultrastructural organization of layer 1 of the human neocortex. The quantitative assessment of various synaptic parameters, astrocytic coverage and mitochondrial morphology is based on convincing experimental approaches. These data provide new information on the detailed morphology of human neocortical tissue that will be of interest to neuroscientists working on different network functions.

    2. Reviewer #1 (Public review):

      Summary:

      The Authors investigated the anatomical features of the excitatory synaptic boutons in layer 1 of the human temporal neocortex. They examined the size of the synapse, the macular or the perforated appearance and the size of the synaptic active zone, the number and volume of the mitochondria, the number of the synaptic and the dense core vesicles, also differentiating between the readily releasable, the recycling and the resting pool of synaptic vesicles. The coverage of the synapse by astrocytic processes was also assessed, and all the above parameters were compared to other layers of the human temporal neocortex. The Authors conclude that the subcellular morphology of the layer 1 synapses is suitable for the functions of the neocortical layer, i.e. the synaptic integration within the cortical column. The low glial coverage of the synapses might allow the glutamate spillover from the synapses enhancing synpatic crosstalk within this cortical layer.

      Strengths:

      The strengths of this paper are the abundant and very precious data about the fine structure of the human neocortical layer 1. Quantitative electron microscopy data (especially that derived from the human brain) are very valuable, since this is a highly time- and energy consuming work. The techniques used to obtain the data, as well as the analyses and the statistics performed by the Authors are all solid, strengthen this manuscript, and support the conclusions drawn in the discussion.

      Comments on latest version:

      The third version of this paper has been substantially improved. The English is significantly better, there are only few paragraphs and sentences which are hard to understand (see my comments and suggestions below). Almost all of my suggestions were incorporated.

      Remaining minor concerns:<br /> About epileptic and non-epileptic (non-affected) tissue. I am aware that temporal lobe neocortical tissue derived from epileptic patients is regarded as non-affected by many groups, and they are quite similar to the cortex of non-epileptic (tumour) patients in their electrophysiological properties and synaptic physiology. But please, note, that one paper you cited did not use samples from epileptic patients, but only tissue from non-epileptic tumor patients (Molnár et al. PLOS 2008).<br /> When you look deeper, and make thorough comparison of tissues derived from epileptic and non-epileptic patients, there are differences in the fine structure, as well as in several electrophysiological features. See for example Tóth et al., J Physiol, 2018, where higher density of excitatory synapses were found in L2 of neocortical samples derived from epileptic patients compared to non-epileptic (tumor) patients. Furthermore, the appearance of population bursts is similar, but their occurrence is more frequent and their amplitude is higher in tissue from epileptic compared to non-epileptic patients. So, I still cannot agree, that temporal neocortex of epileptic patients with the seizure focus in the hippocampus would be non-affected. Therefore I suggested to use the term biopsy tissue.

      It is still not emphasized in the first paragraph of the Discussion, that only excitatory axon terminals were investigated.

      The text in the Results and the Discussion are somewhat inconsistent.<br /> The last two paragraphs of the Results section ends with several sentences which should be part of the discussion, such as line 328: This finding strongly supports multivesicular release... or line 344: --- pointing towards a layer-specific regulation of the putative RRP. Moreover, the results suggest that... and line 370: ... it is most likely... Please, correct this.<br /> The first paragraph of the Discussion summarizes the work of the quantitative EM work and gives one conclusion about the astrocytic coverage. This last sentence is inconsistent with the other parts of the paragraph. I would either write that "astrocytic coverage was also investigated" (or something similar), or move this sentence to the paragraph which discusses the astrocytic coverage.<br /> Results line 180-183. "Special connections" between astrocytic processes and synaptic boutons are mentioned, but not shown. Either show these (but then prove with staining!), or leave out this paragraph.

    3. Reviewer #2 (Public review):

      Summary:

      The study of Rollenhagen et al examines the ultrastructural features of Layer 1 of human temporal cortex. The tissue was derived from drug-resistant epileptic patients undergoing surgery, and was selected as further from the epilepsy focus, and as such considered to be non-epileptic. The analyses has included 4 patients with different age, sex, medication and onset of epilepsy. The manuscript is a follow-on study with 3 previous publications from the same authors on different layers of the temporal cortex:

      Layer 4 - Yakoubi et al 2019 eLife<br /> Layer 5 - Yakoubi et al 2019 Cerebral Cortex,<br /> Layer 6 - Schmuhl-Giesen et al 2022 Cerebral Cortex

      They find, the L1 synaptic boutons mainly have single active zone a very large pool of synaptic vesicles and are mostly devoid of astrocytic coverage.

      Strengths:

      The MS is well written easy to read. Result section gives a detailed set of figures showing many morphological parameters of synaptic boutons and surrounding glial elements. The authors provide comparative data of all the layers examined by them so far in the Discussion. Given that anatomical data in human brain are still very limited, the current MS has substantial relevance.<br /> The work appears to be generally well done, the EM and EM tomography images are of very good quality. The analyses is clear and precise.

      Weaknesses:

      The authors made all the corrections required and answered all of my concerns, included additional data sets, and clarified statements where needed.

    4. Author response:

      The following is the authors’ response to the previous reviews

      Public Reviews:

      Reviewer #1 (Public review):

      Summary:

      The Authors investigated the anatomical features of the excitatory synaptic boutons in layer 1 of the human temporal neocortex. They examined the size of the synapse, the macular or the perforated appearance and the size of the synaptic active zone, the number and volume of the mitochondria, the number of the synaptic and the dense core vesicles, also differentiating between the readily releasable, the recycling and the resting pool of synaptic vesicles. The coverage of the synapse by astrocytic processes was also assessed, and all the above parameters were compared to other layers of the human temporal neocortex. The Authors conclude that the subcellular morphology of the layer 1 synapses is suitable for the functions of the neocortical layer, i.e. the synaptic integration within the cortical column. The low glial coverage of the synapses might allow the glutamate spillover from the synapses enhancing synaptic crosstalk within this cortical layer.

      Strengths:

      The strengths of this paper are the abundant and very precious data about the fine structure of the human neocortical layer 1. Quantitative electron microscopy data (especially that derived from the human brain) are very valuable, since this is a highly time- and energy consuming work. The techniques used to obtain the data, as well as the analyses and the statistics performed by the Authors are all solid, strengthen this manuscript, and mainly support the conclusions drawn in the discussion.

      Comments on latest version:

      The corrected version of the article titled “Ultrastructural sublaminar specific diversity of excitatory synaptic boutons in layer 1 of the adult human temporal lobe neocortex" has been improved thanks to the comments and suggestions of the reviewers. The Authors implemented several of my comments and suggestions. However, many of them were not completed. It is understandable that the Authors did not start a whole new series of experiments investigating inhibitory synapses (as it was a misunderstanding affecting 2 reviewers from the three). But the English text is still very hard to understand and has many mistakes, although I suggested to extensively review the use of English. Furthermore, my suggestion about avoiding many abbreviations in the abstract, analyse and discuss more the perforated synapses, the figure presentation (Figure 3) and including data about the astrocytic coverage in the Results section were not implemented. My questions about the number of docked vesicles and p10 vesicles, as well as about the different categories of the vesicle pools have not been answered neither. Many other minor comments and suggestions were answered, corrected and implemented, but I think it could have been improved more if the Authors take into account all of the reviewers' suggestions, not only some of them. I still have several main and minor concerns, with a few new ones as well I did not realize earlier, but still think it is important.

      We would like to thank the reviewer for the comments.

      - We worked on the English again and tried to improve the language.

      - We avoided to use too many abbreviations in the Abstract and reduced them to a minimum.

      - We included a small paragraph about non-perforated vs. perforated active zones in both the Results and Discussion sections. However, since the majority of active zones in all cortical layers of the human TLN were of the macular type, we concluded that it is not relevant to describe their function in more detail.

      - In Figure 3 A-C we added contour lines to the boutons to make their outlines more visible.

      - We completed the data about the astrocytic coverage in the Results section (see also below).

      - Concerning the vesicle pools please see below.

      Main concerns:

      (1) Epileptic patients:

      As all patients were epileptic, it is not correct to state in the abstract that non-epileptic tissue was investigated. Even if the seizure onset zone was not in the region investigated, seizures usually invade the temporal lobe in TLE. If you can prove that no spiking activity occurred in the sample you investigated and the seizures did not invade that region, then you can write that it is presumably non-epileptic. I would suggest to write “L1 of the human temporal lobe neocortical biopsy tissue". See also Methods lines 608-612. Write only “non-epileptic" or “non-affected" if you verified it with EcoG. If this was the case, please write a few sentences about it in the Methods.

      We rephrased Material and Methods concerning this point and added that patients were monitored with EEG, MRI and multielectrode recordings. In addition, we stated that the epileptic focus was always far away from the neocortical tissue samples. Furthermore, we added a small paragraph that functional studies using the same methodology have shown that neocortical access tissue samples taken from epilepsy surgery do not differ in electrophysiological properties and synaptic physiology when compared with acute slice preparations in experimental animals and we quoted the relevant papers.

      We hope that the reviewer is now convinced that our tissue samples can be regarded as non-affected.

      (2) About the inhibitory/excitatory synapses.

      Since our focus was on excitatory synaptic boutons as already stated in the title we have not analyzed inhibitory SBs. Now, I do understand that only excitatory synapses were investigated. Although it was written in the title, I did not realized, since all over the manuscript the Authors were writing synapses, and were distinguishing between inhibitory and excitatory synapses in the text and showing numerous excitatory and inhibitory synapses on Figure 2 and discussing inhibitory interneurons in the Discussion as well. Maybe this was the reason why two reviewers out of the three (including myself) thought you investigated both types of synapses but did not differentiated between them. So, please, emphasize in the Abstract (line 40), Introduction (for ex. line 92-97) and the Discussion (line 369) that only excitatory synaptic boutons were investigated.

      As this paper investigated only excitatory synaptic boutons, I think it is irrelevant to write such a long section in the Discussion about inhibitory interneurons and their functions in the L1 of the human temporal lobe neocortex. Same applies to the schematic drawing of the possible wiring of L1 (Figure 7). As no inhibitory interneurons were examined, neither the connection of the different excitatory cells, only the morphology of single synaptic boutons without any reference on their origin, I think this figure does not illustrate the work done in this paper. This could be a figure of a review paper about the human L1, but is inappropriate in this study.

      We followed the reviewer’s suggestion and pointed out explicitly that we only investigated excitatory synaptic boutons. We also changed the Discussion and focused more on circuitry in L1 and the role of CR-cells.

      (3) Perforated synapses

      The findings of the Geinismann group suggesting that perforated synapses are more efficient than non-perforated ones is nowadays very controversially discussed” I did not ask the Authors to say that perforated synapses are more efficient. However, based on the literature (for ex. Harris et al, 1992; Carlin and Siekievitz, 1982; Nieto-Sampedro et al., 1982) the presence of perforated synapses is indeed a good sign of synapse division/formation - which in turn might be coupled to synaptic plasticity (Geinisman et al, 1993), increased synaptic activity (Vrensen and Cardozo, 1981), LTP (Geinisman et al, 1991, Harris et al, 2003), pathological axonal sprouting (Frotscher et al, 2006), etc. I think it is worth mentioning this at least in the Discussion.

      We agree with the reviewer and added a small paragraph in the Results section about the two types of AZs in L1 of the human TLN. We pointed out that there are both types, macular non-perforated and perforated AZs, but the majority in all layers were of the non-perforated type. In the Discussion we added some paper pointing out the role of perforated synapses.

      (4) Question about the vesicle pools

      Results, Line 271: Still not understandable, why the RRP was defined as {less than or equal to}10 nm and {less than or equal to}20nm. Why did you use two categories? One would be sufficient (for example {less than or equal to}20nm). Or the vesicles between 10 and 20nm were considered to be part of RRP? In this case there is a typo, it should be {greater than or equal to}10 nm and {less than or equal to}20nm.

      The answer of the Authors was to my question raised: We decided that also those very close within 10 and 20 nm away from the PreAZ, which is less than a SV diameter may also contribute to the RRP since it was shown that SVs are quite mobile.

      This does not clarify why did you use two categories. Furthermore, I did not receive answer (such as Referee #2) for my question on how could you have 3x as many docked vesicles than vesicles {less than or equal to}10nm. The category {less than or equal to}10nm should also contain the docked vesicles. Or if this is not the case, please, clarify better what were your categories.

      We thank the reviewer for pointing out that mentioning two distance criteria (p10 and p20) to define one physiological entity (RRP) is somewhat confusing and we acknowledge that the initial response to the reviewers falls short of explaining this choice. This is indeed only understandable in the context of the original paper by Sätzler et al. 2002, where these criteria were first introduced. We therefore referenced this publication more prominently in the paragraph in question.

      So to explain this, we first would like to clarify the definition of the two RRP classification criteria used (p10 and p20), which has caused some confusion amongst the reviewers as to which vesicles where included or not:

      - p10 criterion: p£10 nm (SVs have a minimum distance less than or equal to 10 nm from the PreAZ), including ‘docked’ vesicles which have a distance of zero or less (p0)

      - p20 criterion: p£20 nm (SVs have a minimum distance less than or equal to 20 nm from the PreAZ), including vesicles of the p10 criterion.

      As mentioned, these criteria were introduced first in Sätzler et al. 2002 looking at the Calyx of Held synapse. In that paper, we tried to establish a morphological correlate to existing physiological measurements, which included the RRP. As there is no known marker that would allow to discriminate between vesicles that contribute to the RRP anatomically, we looked at existing physiological experiments such as Schneggenburger et al. 1999; Wu and Borst 1999; Sun and Wu 2001 and compared their total numbers to our measurements. As the number of docked vesicles (p0, see above) was on the lower side of these physiological estimates, we also looked at vesicles close to the AZ, which we think could be recruited within a short time (£ 10 msec). Comparing with existing literature, we found that at p20 we get pool sizes comparable to midrange estimates of reported RRP sizes. In order to account for the variability of the observed physiological pool sizes, we reported all three measurements (p0, p10, p20) not only in the original Calyx of Held, but in all subsequent studies of different CNS synapses of our group since then.

      As it remains uncertain if such correlate indeed exists, we therefore followed the suggestion to rephrase RRP and RP to putative RRP and putative RP (see also Rollenhagen et al. 2007). We thank both reviewers for pointing out this omission.

      Concerning the difference between ‘docked’ vesicles and vesicles within the p10 perimeter criterion. First of all, the reviewer is right in saying that the category p10 ({less than or equal to}10nm) should also contain the docked vesicles (see above). The fact to have 3x as many ‘docked’ vesicles in our TEM tomography than in the p10 distance analysis could be partly explained, on the one hand, by a very high variability between patients (as expressed by the high SD, table 1) and, on the other hand, by a high intraindividual synaptic bouton variability. In both sublayers, there is a huge difference in the number of vesicles within the p10 criterion of individual synaptic boutons ranging from 0 to ~40 with a mean value of ~1 to ~4 (calculated per patient), the upper level being close to the values calculated with TEM tomography for the ‘docked’ vesicles.

      (5) Astrocytic coverage

      On Fig. 6 data are presented on the astrocytic coverage derived from L1 and L4. In my previous review I asked to include this in the text of the Results as well, but I still do not see it. It is also lacking from the Results how many samples from which layer were investigated in this analysis. Only percentages are given, and only for L1 (but how many patients, L1a and/or L1b and/or L4 is not provided). In contrast, Figure 6 and Supplementary Table 2 (patient table) contains the information that this analysis has been made in L4 as well. Please, include this information in the text as well (around lines 348-360).

      In our previous revised version, we had included the values shown in Fig. 6 for both L1 and L4 in the Results section (L4: lines 352 – 355: ‘The findings in L1…’). However, we agree with the reviewer and have now also added the number of patients and synapses investigated (now lines 359 – 365).

      About how to determine glial elements. I cannot agree with the Authors that glial elements can be determined with high certainty based only on the anatomical features of the profiles seen in the EM. “With 25 years of experience in (serial) EM work" I would say, that glial elements can be very similar to spine necks and axonal profiles.

      All in all, if similar methods were used to determine the glial coverage in the different layers of the human neocortex, than it can be compared (I guess this is the case). However, I would say in the text that proper determination would need immunostaining and a new analysis. This only gives an estimation with the possibility of a certain degree of error.

      We do not entirely agree with the reviewer on this point. As stated in the text, there are structural criteria to identify astrocytic elements (see citations quoted). These golden standard criteria are commonly used also by other well-known groups (DeFelipe and co-workers, Francisco Clasca and co-workers; Michael Frotscher the late and co-workers etc.). However, in a past paper about astrocytic coverage of synaptic complexes in L5 of the human TLN, immunohistochemistry against glutamine synthetase, a key enzyme in astrocytes, was carried out to describe the coverage. This experiment supports our findings in the other cortical layers of the human TLN. As the reviewer might know, immunohistochemistry always led to a reduction in ultrastructural preservation, so we decided not to use immunohistochemistry for the further publications of the other cortical layers. We added a short notice on this in the Material and Methods section.

      (6) Large interindividual differences in the synapse density should be discussed in the Discussion.

      As suggested by the reviewer we have included a sentence in the Discussion that interindividual differences can be either related to differences in age, gender and the use of different methodology as suggested by DeFelipe and co-workers (1999)

      Reviewer #2 (Public review):

      Summary:

      The study of Rollenhagen et al examines the ultrastructural features of Layer 1 of human temporal cortex. The tissue was derived from drug-resistant epileptic patients undergoing surgery, and was selected as further from the epilepsy focus, and as such considered to be non-epileptic. The analyses has included 4 patients with different age, sex, medication and onset of epilepsy. The MS is a follow-on study with 3 previous publications from the same authors on different layers of the temporal cortex:

      Layer 4 - Yakoubi et al 2019 eLife

      Layer 5 - Yakoubi et al 2019 Cerebral Cortex,

      Layer 6 - Schmuhl-Giesen et al 2022 Cerebral Cortex

      They find, the L1 synaptic boutons mainly have single active zone a very large pool of synaptic vesicles and are mostly devoid of astrocytic coverage.

      Strengths:

      The MS is well written easy to read. Result section gives a detailed set of figures showing many morphological parameters of synaptic boutons and surrounding glial elements. The authors provide comparative data of all the layers examined by them so far in the Discussion. Given that anatomical data in human brain are still very limited, the current MS has substantial relevance.

      The work appears to be generally well done, the EM and EM tomography images are of very good quality. The analyses is clear and precise.

      Weaknesses:

      The authors made all the corrections required, answered most of my concerns, included additional data sets, and clarified statements where needed.

      My remaining points are:

      Synaptic vesicle diameter (that has been established to be ~40nm independent of species) can properly be measured with EM tomography only, as it provides the possibility to find the largest diameter of every given vesicle. Measuring it in 50 nm thick sections result in underestimation (just like here the values are ~25 nm) as the measured diameter will be smaller than the true diameter if the vesicle is not cut in the middle, (which is the least probable scenario). The authors have the EM tomography data set for measuring the vesicle diameter properly.

      We thank the reviewer for the helpful comments. We followed the recommendation to measure the vesicle diameter using our TEM tomography tilt series, but came to similar results concerning this synaptic parameter. As stated in our Material and Methods section, we only counted (measured) clear ring-link structures according to a paper by Abercrombie (1963). Since our results are similar for both methods, we do believe that our measurements are correct. Even random single measurements on the original 3D tilt-series yielded comparable results (Lübke and co-workers, personal observation). Furthermore, our results are within ranges, although with high variability, also described by other groups (see discussion lines 436 - 449). We therefore hope that the reviewer will now accept our measurements.

      It is a bit misleading to call vesicle populations at certain arbitrary distances from the presynaptic active zone as readily releasable pool, recycling pool and resting pool, as these are functional categories, and cannot directly be translated to vesicles at certain distances. Even it is debated whether the morphologically docked vesicles are the ones, that are readily releasable, as further molecular steps, such as proper priming is also a prerequisite for release.

      It would help to call these pools as "putative" correlates of the morphological categories.

      We followed the suggestion by the reviewer and renamed our vesicle pools as putative RRP, putative RP and putative resting pools.

      Reviewer #3 (Public review):

      Summary:

      Rollenhagen at al. offer a detailed description of layer 1 of the human neocortex. They use electron microscopy to assess the morphological parameters of presynaptic terminals, active zones, vesicle density/distribution, mitochondrial morphology and astrocytic coverage. The data is collected from tissue from four patients undergoing epilepsy surgery. As the epileptic focus was localized in all patients to the hippocampus, the tissue examined in this manuscript is considered non-epileptic (access) tissue.

      Strengths:

      The quality of the electron microscopic images is very high, and the data is analyzed carefully. Data from human tissue is always precious and the authors here provide a detailed analysis using adequate approaches, and the data is clearly presented.

      Weaknesses:

      The text connects functional and morphological characteristics in a very direct way. For example, connecting plasticity to any measurement the authors present would be rather difficult without any additional functional experiments. References to various vesicle pools based on the location of the vesicles is also more complex than it is suggested in the manuscript. The text should better reflect the limitations of the conclusions that can be drawn from the authors' data.

      Recommendations for the authors:

      Reviewer #1 (Recommendations for the authors):

      Astrocytic coverage

      On Fig. 6 data are presented on the astrocytic coverage derived from L1 and L4. In my previous review I asked to include this in the text of the Results as well, but I still do not see it. It is also lacking from the Results how many samples from which layer were investigated in this analysis. Only percentages are given, and only for L1 (but how many patients, L1a and/or L1b and/or L4 is not provided). In contrast, Figure 6 and Supplementary Table 2 (patient table) contains the information that this analysis has been made in L4 as well. Please, include this information in the text as well (around lines 348-360).

      See above.

      About how to determine glial elements. I cannot agree with the Authors that glial elements can be determined with high certainty based only on the anatomical features of the profiles seen in the EM. “With 25 years of experience in (serial) EM work" I would say, that glial elements can be very similar to spine necks and axonal profiles. Please, see the photos below, out of the 16 circled profiles (2nd picture, very similar to each other) only 3 belong to an astroglial cell (last picture, purple profiles-purple cell), 10 are spines/spine necks/small caliber dendrites of pyramidal cells, 3 are axonal profiles (last but one picture, blue profiles, marked with arrows on the right side). If you follow in your serial sections those elements which you think are glial processes and indeed they are attached to a confidently identifiable glial cell, I agree, it is a glial process. But identifying small, almost empty profiles without any specific staining, from one single EM section, as glial process is very uncertain. Please, check the database of the Allen Institute made from the V1 visual cortex of a mouse. It is a large series of EM sections where they reconstructed thousands of neurons, astroglial and microglial cells. It is possible to double click on the EM picture on a profile and it will show the cell to which that profile belongs. https://portal.brain-map.org/connectivity/ultrastructural-connectomics Pictures included here: https://elife-rp.msubmit.net/eliferp_files/2024/11/25/00132644/02/132644_2_attach_21_29456_convrt.pdf

      All in all, if similar methods were used to determine the glial coverage in the different layers of the human neocortex, than it can be compared (I guess this is the case). However, I would say in the text that proper determination would need immunostaining and a new analysis. This only gives an estimation with the possibility of a certain degree of error.

      As stated above, we carried out glutamine synthetase immunohistochemistry in L5 of the human TLN and came to the same results. However, we added a sentence on this in the chapter on astrocytic coverage in the Material and Methods section. Additionally, we modified this chapter according to the reviewer’s suggestion.

      Minor comments

      Introduction: Last sentence is not understandable (lines 101-103), please rephrase. (contribute to understand or contribute in understanding or contribute to the understanding of..., but definitely not contribute to understanding). The authors should check and review extensively for improvements to the use of English, or use a program such as Grammarly.

      Results: Grammar (line 107): L1 in the adult mammalian neocortex represents a relatively...

      Line 173: “Some SBs in both sublaminae were seen to establish either two or three SBs on the same spine, spines 173 of other origin or dendritic shafts." - Some SBs established two or three SBs? I would write Some SBs established two or three synapses on...

      Line 243: “The synaptic cleft size were slightly, but non-significantly different"

      Line 260: “DCVs play an important role in endo- and exocytosis, the build-up of PreAZs by releasing Piccolo and Bassoon (Schoch and Gundelfinger 2006; Murkherjee et al. 2010)," - please, correct this.

      We have done corrections as suggested by the reviewer.

      Line 374: No point at the end of the last phrase.

      Discussion:

      Lines 400-404: “The majority of SBs in L1 of the human TLN had a single at most three AZs that could be of the non perforated macular or perforated type comparable with results for other layers in the human TLN but by ~1.5-fold larger than in rodent and non-human primates." - What is comparable with the other layers, but different from animals? Please rephrase this sentence, it is not understandable. I already mentioned this sentence in my previous review, but nothing happened.

      Lines 435-437: “Remarkably, the total pool sizes in the human TLN were significantly larger by more than 6-fold (~550 SVs/AZ), and ~4.7-fold (~750 SVs/AZ;) than those in L4 and L5 (Yakoubi et al. 2019a, b; see also Rollenhagen et al. 2018) in rats." Please rethink what you wished to say and compare to the sentence meaning. I think you wanted to compare human TLN L1 pool size to L4 and L5 in the human TLN (Yakoubi 2019a and b) and to rat (Rollenhagen 2018). Instead, you compared all layers of the human TLN to L4 and L5 in rats (with partly wrong references). Please rephrase this. Lines 483-484: “Astrocytes serve as both a physical barrier to glutamate diffusion and as mediate neurotransmitter uptake via transporters".

      This sentence is grammatically incorrect, please rephrase.

      We corrected the sentences as suggested by the reviewer.

      Methods:

      In the text, there are only 4 patients (lines 603-604), but in the supplementary table there are 9 patients (5 new included for L4 astrocytic coverage). Please, correct it in the text.

      Lines 608-609: “neocortical access tissue samples were resected to control the seizures for histological inspection by neuropathologists." - What is the meaning of this? Please, rephrase.

      We thank the reviewer for the comment and included the 5 patients used for L4 to the Material and Methods section, as well as in the Results section.

      The reviewer is right, and we rephrased and corrected the sentence concerning the inspection by neuropathologists.

      Figures

      Figures 5B: The legend says “SB (sb) synapsing on a stubby spine (sp) with a prominent spine apparatus (framed area) and a thick dendritic segment (de) in L1b" - In my opinion this is not one synaptic bouton, but two. Clearly visible membranes separate them, close to the spine.

      Supplemental Table 2 (patient table). If there is no information about Hu_04 patient's epilepsy, please write N/A (=non available) instead of - (which means it does not exist).

      The reviewer is right, and we corrected the figure and the legend, as well as the table accordingly.

      Reviewer #2 (Recommendations for the authors):

      The authors addressed almost all of my concern, only this one remained:

      If there is, however, relevant literature on "methods based on EM tomography" and "stereological methods to estimate both types of error" (over- and underestimates) that we are missing out on, we would appreciate the reviewer providing us with the corresponding references so that we can include such calculations in our paper.

      There is a very detailed new study on calculating correction for TEM 2D 3D, Rothman et al 2023 PLOS One. That addresses most of these issues.

      We thank the reviewer for drawing our attention to the publication by Rothman et al. 2023, which is a very detailed and comprehensive study looking at accurately estimating distributions of 3D size and densities of particles from 2D measurements using – amongst others – ET and TEM images as well as synaptic vesicles for validating their method. However, we do not see how this would be relevant to the reported mean diameters and their corresponding variances. And even if we would have reported on vesicle size/diameter distributions (referred to as G(d) in Rothmann et al. 2023), the authors themselves state that “… the results from our ET and TEM image analysis highlight the difficulty in computing a complete G(d) of MFT vesicles due to their small size…

    1. eLife Assessment

      In this valuable study, the authors report on an innovative chemostat propagation system to reduce eukaryotic viruses while retaining phages in mixtures used for FVTs (fecal virome transplant). The authors hypothesized that chemostat-propagated viromes could modulate the gut microbiota and reduce necrotizing enterocolitis (NEC) lesions while avoiding potential side effects, such as earlier onset of diarrhea. The study is solid in that it integrates in vitro fermentation, high-resolution metagenomics, immunogenicity assays, and in vivo validation, demonstrating the potential of FVT using eukaryotic-free virome-based therapeutics. However, the study overall has some conceptual and technical limitations.

    2. Reviewer #1 (Public review):

      Summary:

      Fecal virome transfer (FVT) has the potential to take advantage of microbiome-associated phages to treat diseases such as NEC. However, FVT is also associated with toxicity due to the presence of eukaryotic viruses in the mixture, which are difficult to filter out. The authors use a chemostat propagation system to reduce the presence of eukaryotic viruses (these become lost over time during culture). They show in pig models of NEC that chemostat propagation reduces the incidence of diarrhea induced by FVTs.

      Strengths:

      The authors report an innovative yet simple approach that has the potential to be useful for future applications. Most of the experiments are easy to follow and are performed well.

      Weaknesses:

      The biggest weakness is that the authors show that their technique addresses safety, but they are unable to demonstrate that they retain efficacy in their NEC model. This could be due to technical issues or perhaps the efficacy of FVT reported in the literature is not robust. If they cannot demonstrate the efficacy of the chemostat-propagated virome mixture, the value of the study is compromised.

      The above issue is especially concerning because the chemostat propagation selected for bacteria that may not necessarily be the ones that harbor the beneficial phages. Without an understanding of exactly how FVT works, is it possible to make any conclusion about the usefulness of the chemostat approach?

      Finally, can the authors rule out that their observations in THP-1 cells are driven by LPS or some other bacterial product in the media?

    3. Reviewer #2 (Public review):

      The authors hypothesized that chemostat propagated viromes could modulate the GM and reduce NEC lesions while avoiding potential side effects, such as the earlier onset of diarrhea. This is interesting.

      Major Comments:

      (1) As the authors state that the aim of the research is 'We hypothesized that chemostat propagated viromes could modulate the GM and reduce NEC lesions while avoiding potential side effects, such as earlier onset of diarrhea'.<br /> a) For the efficacy, in Figure 5, there is no significance in stomach pathology and enterocolitis between groups, even between the control group and experimental groups, is it because of the low incidence of NEC? This may affect the statistical power of the conclusions. Therefore, it is unclear how one can draw the conclusion that chemostat can reduce NEC lesions?<br /> b) Convincing pathology images would be helpful.<br /> c) For the safety, such as body weight development, FVT had no statistical significance difference from control, CVT, and CVT-MO. So how can the authors draw the conclusion that chemostat can avoid potential side effects?<br /> d) There is a lack of evidence to convince the reader that there is a decrease in eukaryotic viruses. More quantitative data here would be useful.

      (2) Questions regarding Figure 3F:<br /> a) How can the medium have 'the baseline viral content'?<br /> b) What is the statistical significance of the relative abundance of specific eukaryotic viruses?<br /> c) The hosts for some of the listed eukaryotic viruses are neither pigs or humans, as such, the significance of a decrease in these viruses to humans is unclear.

      (3) In this study, pH 6.5 was selected as the pH value for chemostat cultivation, but considering the different adaptability of different bacteria to pH, it is recommended to further explore the effect of pH on bacteria and virus groups. In particular, it was optimized to maintain the growth of beneficial bacteria such as Lactobacillaceae and Bacteroides in order to improve the effect of chemostat cultivation.

      (4) Please improve the quality of the images, charts, error bars, and statistical significance markers throughout and mark the n's. used in each experiment.

    4. Reviewer #3 (Public review):

      This study investigated the in vitro amplification of donor fecal virus using chemostat culturing technology, aiming to reduce eukaryotic virus load while preserving bacteriophage community diversity, thereby optimizing the safety and efficacy of FVT. The research employed a preterm pig model to evaluate the effects of chemostat-propagated viromes (CVT) in preventing necrotizing enterocolitis (NEC) and mitigating adverse effects such as diarrhea.

      Strengths:

      (1) Enhanced Safety Profile:<br /> Chemostat cultivation effectively reduced eukaryotic virus load, thereby minimizing the potential infection risks associated with virome transplantation and offering a safer virome preparation method for clinical applications.

      (2) Process Reproducibility:<br /> The chemostat system achieved stable amplification of bacteriophage communities (Bray-Curtis similarity >70%), mitigating the impact of donor fecal variability on therapeutic efficacy.

      Weaknesses:

      (1) Loss of Phage Functionality:<br /> The chemostat cultivation resulted in a reduction in phage diversity (e.g., the loss of Lactobacillaceae phages), which may compromise their protective effects against NEC (potentially linked to the immunomodulatory functions of Lactobacilli). The authors should explicitly address this limitation in the discussion section, particularly if additional experiments cannot be conducted to resolve it within the current study.

      (2) Limitations in Experimental Design:<br /> The low incidence of NEC lesions in the control group reduced the statistical power of the study. This limitation undermines the ability to conclusively evaluate the efficacy and safety of the chemostat-propagated virome as a novel intervention for NEC. Future studies should optimize experimental conditions (e.g., using a more NEC-susceptible model or diet) to ensure adequate disease incidence for robust statistical comparisons.

    1. eLife Assessment

      Mackie and colleagues present a valuable comparison of lateralized gustation in two well-studied nematodes. Their results present convincing evidence that ASEL/R lateralization exists and is achieved by different means in P. pacificus compared to C. elegans. This work will be of interest to neurobiologists interested in how small nervous systems make sense of the environment, and how evolution can take multiple paths to asymmetry within a neuron class.

    2. Reviewer #1 (Public review):

      Summary:

      Mackie and colleagues compare chemosensory preferences between C. elegans and P. pacificus, and the cellular and molecular mechanisms underlying them. The nematodes have overlapping and distinct preferences for different salts. Although P. pacificus lacks the lsy-6 miRNA important for establishing asymmetry of the left/right ASE salt sensing neurons in C. elegans, the authors find that P. pacificus ASE homologs achieve molecular (receptor expression) and functional (calcium response) asymmetry by alternative means. This work contributes an important comparison of how these two nematodes sense salts and highlights that evolution can find different ways to establish asymmetry in small nervous systems to optimize the processing of chemosensory cues in the environment.

      Strengths:

      The authors use clear and established methods to record the response of neurons to chemosensory cues. They were able to show clearly that ASEL/R are functionally asymmetric in P. pacificus, and combined with genetic perturbation establish a role for che-1-dependent gcy-22.3 in the asymmetric response to NH4Cl.

      Weaknesses:

      The mechanism of lsy-6-independent establishment of ASEL/R asymmetry in P. pacificus remains uncharacterized.

      Comments on revisions: Looks good - all the best

    3. Author response:

      The following is the authors’ response to the original reviews

      Public Reviews:

      Reviewer #1 (Public review):

      Summary:

      Mackie and colleagues compare chemosensory preferences between C. elegans and P. pacificus, and the cellular and molecular mechanisms underlying them. The nematodes have overlapping and distinct preferences for different salts. Although P. pacificus lacks the lsy-6 miRNA important for establishing asymmetry of the left/right ASE salt-sensing neurons in C. elegans, the authors find that P. pacificus ASE homologs achieve molecular (receptor expression) and functional (calcium response) asymmetry by alternative means. This work contributes an important comparison of how these two nematodes sense salts and highlights that evolution can find different ways to establish asymmetry in small nervous systems to optimize the processing of chemosensory cues in the environment.

      Strengths:

      The authors use clear and established methods to record the response of neurons to chemosensory cues. They were able to show clearly that ASEL/R are functionally asymmetric in P. pacificus, and combined with genetic perturbation establish a role for che-1-dependent gcy-22.3 in in the asymmetric response to NH<sub>4</sub>Cl.

      Weaknesses:

      The mechanism of lsy-6-independent establishment of ASEL/R asymmetry in P. pacificus remains uncharacterized.

      We thank the reviewer for recognizing the novel contributions of our work in revealing the existence of alternative pathways for establishing neuronal lateral asymmetry without the lsy-6 miRNA in a divergent nematode species. We are certainly encouraged now to search for genetic factors that alter the exclusive asymmetric expression of gcy-22.3.

      Reviewer #2 (Public review):

      Summary:

      In this manuscript, Mackie et al. investigate gustatory behavior and the neural basis of gustation in the predatory nematode Pristionchus pacificus. First, they show that the behavioral preferences of P. pacificus for gustatory cues differ from those reported for C. elegans. Next, they investigate the molecular mechanisms of salt sensing in P. pacificus. They show that although the C. elegans transcription factor gene che-1 is expressed specifically in the ASE neurons, the P. pacificus che-1 gene is expressed in the Ppa-ASE and Ppa-AFD neurons. Moreover, che-1 plays a less critical role in salt chemotaxis in P. pacificus than C. elegans. Chemogenetic silencing of Ppa-ASE and Ppa-AFD neurons results in more severe chemotaxis defects. The authors then use calcium imaging to show that both Ppa-ASE and Ppa-AFD neurons respond to salt stimuli. Calcium imaging experiments also reveal that the left and right Ppa-ASE neurons respond differently to salts, despite the fact that P. pacificus lacks lsy-6, a microRNA that is important for ASE left/right asymmetry in C. elegans. Finally, the authors show that the receptor guanylate cyclase gene Ppa-gcy-23.3 is expressed in the right Ppa-ASE neuron (Ppa-ASER) but not the left Ppa-ASE neuron (Ppa-ASEL) and is required for some of the gustatory responses of Ppa-ASER, further confirming that the Ppa-ASE neurons are asymmetric and suggesting that Ppa-GCY-23.3 is a gustatory receptor. Overall, this work provides insight into the evolution of gustation across nematode species. It illustrates how sensory neuron response properties and molecular mechanisms of cell fate determination can evolve to mediate species-specific behaviors. However, the paper would be greatly strengthened by a direct comparison of calcium responses to gustatory cues in C. elegans and P. pacificus, since the comparison currently relies entirely on published data for C. elegans, where the imaging parameters likely differ. In addition, the conclusions regarding Ppa-AFD neuron function would benefit from additional confirmation of AFD neuron identity. Finally, how prior salt exposure influences gustatory behavior and neural activity in P. pacificus is not discussed.

      Strengths:

      (1) This study provides exciting new insights into how gustatory behaviors and mechanisms differ in nematode species with different lifestyles and ecological niches. The results from salt chemotaxis experiments suggest that P. pacificus shows distinct gustatory preferences from C. elegans. Calcium imaging from Ppa-ASE neurons suggests that the response properties of the ASE neurons differ between the two species. In addition, an analysis of the expression and function of the transcription factor Ppa-che-1 reveals that mechanisms of ASE cell fate determination differ in C. elegans and P. pacificus, although the ASE neurons play a critical role in salt sensing in both species. Thus, the authors identify several differences in gustatory system development and function across nematode species.

      (2) This is the first calcium imaging study of P. pacificus, and it offers some of the first insights into the evolution of gustatory neuron function across nematode species.

      (3) This study addresses the mechanisms that lead to left/right asymmetry in nematodes. It reveals that the ASER and ASEL neurons differ in their response properties, but this asymmetry is achieved by molecular mechanisms that are at least partly distinct from those that operate in C. elegans. Notably, ASEL/R asymmetry in P. pacificus is achieved despite the lack of a P. pacificus lsy-6 homolog.

      Weaknesses:

      (1) The authors observe only weak attraction of C. elegans to NaCl. These results raise the question of whether the weak attraction observed is the result of the prior salt environment experienced by the worms. More generally, this study does not address how prior exposure to gustatory cues shapes gustatory responses in P. pacificus. Is salt sensing in P. pacificus subject to the same type of experience-dependent modulation as salt sensing in C. elegans?

      We tested if starving animals in the presence of a certain salt will result in those animals avoiding it. However, under our experimental conditions we were unable to detect experiencedependent modulation either in P. pacificus or in C. elegans.

      Author response image 1.

      (2) A key finding of this paper is that the Ppa-CHE-1 transcription factor is expressed in the PpaAFD neurons as well as the Ppa-ASE neurons, despite the fact that Ce-CHE-1 is expressed specifically in Ce-ASE. However, additional verification of Ppa-AFD neuron identity is required. Based on the image shown in the manuscript, it is difficult to unequivocally identify the second pair of CHE-1-positive head neurons as the Ppa-AFD neurons. Ppa-AFD neuron identity could be verified by confocal imaging of the CHE-1-positive neurons, co-expression of Ppa-che1p::GFP with a likely AFD reporter, thermotaxis assays with Ppa-che-1 mutants, and/or calcium imaging from the putative Ppa-AFD neurons.

      In the revised manuscript, we provide additional and, we believe, conclusive evidence for our correct identification of Ppa-AFD neuron being another CHE-1 expressing neuron. Specifically, we have constructed and characterized 2 independent reporter strains of Ppa-ttx-1, a putative homolog of the AFD terminal selector in C. elegans. There are two pairs of ttx-1p::rfp expressing amphid neurons. The anterior neuronal pair have finger-like endings that are unique for AFD neurons compared to the dendritic endings of the 11 other amphid neuron pairs (no neuron type has a wing morphology in P. pacificus). Their cell bodies are detected in the newly tagged TTX-1::ALFA strain that co-localize with the anterior pair of che-1::gfp-expressing amphid neurons (n=15, J2-Adult).

      We note that the identity of the posterior pair of amphid neurons differs between the ttx-1p::rfp promoter fusion reporter and TTX-1::ALFA strains– the ttx-1p::rfp posterior amphid pair overlaps with the gcy-22.3p::gfp reporter (ASER) but the TTX-1::ALFA posterior amphid pair do not overlap with the posterior pair of che-1::gfp-expressing amphid neurons (n=15). Given that there are 4 splice forms detected by RNAseq (Transcriptome Assembly Trinity, 2016; www.pristionchus.org), this discrepancy between the Ppa-ttx-1 promoter fusion reporter and the endogenous expression of the Ppa-TTX-1 C-terminally tagged to the only splice form containing Exon 18 (ppa_stranded_DN30925_c0_g1_i5, the most 3’ exon) may be due to differential expression of different splice variants in AFD, ASE, and another unidentified amphid neuron types.  

      Although we also made reporter strains of two putative AFD markers, Ppa-gcy-8.1 (PPA24212)p::gfp; csuEx101 and Ppa-gcy-8.2 (PPA41407)p::gfp; csuEx100, neither reporter showed neuronal expression.

      (3) Loss of Ppa-che-1 causes a less severe phenotype than loss of Ce-che-1. However, the loss of Ppa-che-1::RFP expression in ASE but not AFD raises the question of whether there might be additional start sites in the Ppa-che-1 gene downstream of the mutation sites. It would be helpful to know whether there are multiple isoforms of Ppa-che-1, and if so, whether the exon with the introduced frameshift is present in all isoforms and results in complete loss of Ppa-CHE-1 protein.

      According to www.pristionchus.org (Transcriptome Assembly Trinity), there is only a single detectable splice form by RNAseq. Once we have a Ppa-AFD-specific marker, we would be able to determine how much of the AFD terminal effector identify (e.g. expression of gcy-8 paralogs) is effected by the loss of Ppa-che-1 function.

      (4) The authors show that silencing Ppa-ASE has a dramatic effect on salt chemotaxis behavior. However, these data lack control with histamine-treated wild-type animals, with the result that the phenotype of Ppa-ASE-silenced animals could result from exposure to histamine dihydrochloride. This is an especially important control in the context of salt sensing, where histamine dihydrochloride could alter behavioral responses to other salts.

      We have inadvertently left out this important control. Because the HisCl1 transgene is on a randomly segregating transgene array, we have scored worms with and without the transgene expressing the co-injection marker (Ppa-egl-20p::rfp, a marker in the tail) to show that the presence of the transgene is necessary for the histamine-dependent knockdown of NH<sub>4</sub>Br attraction. This control is added as Figure S2.

      (5) The calcium imaging data in the paper suggest that the Ppa-ASE and Ce-ASE neurons respond differently to salt solutions. However, to make this point, a direct comparison of calcium responses in C. elegans and P. pacificus using the same calcium indicator is required. By relying on previously published C. elegans data, it is difficult to know how differences in growth conditions or imaging conditions affect ASE responses. In addition, the paper would be strengthened by additional quantitative analysis of the calcium imaging data. For example, the paper states that 25 mM NH<sub>4</sub>Cl evokes a greater response in ASEL than 250 mM NH<sub>4</sub>Cl, but a quantitative comparison of the maximum responses to the two stimuli is not shown.

      We understand that side-by-side comparisons with C. elegans using the same calcium indicator would lend more credence to the differences we observed in P. pacificus versus published findings in C. elegans from the past decades, but are not currently in a position to conduct these experiments in parallel.

      (6) It would be helpful to examine, or at least discuss, the other P. pacificus paralogs of Ce-gcy22. Are they expressed in Ppa-ASER? How similar are the different paralogs? Additional discussion of the Ppa-gcy-22 gene expansion in P. pacificus would be especially helpful with respect to understanding the relatively minor phenotype of the Ppa-gcy-22.3 mutants.

      In P. pacificus, there are 5 gcy-22-like paralogs and 3 gcy-7-like paralogs, which together form a subclade that is clearly distinct from the 1-1 Cel-gcy-22, Cel-gcy-5, and Cel-gcy-7 orthologs in a phylogenetic tree containing all rGCs in P. pacificus, C. elegans, and C. briggssae (Hong et al, eLife, 2019). In Ortiz et al (2006 and 2009), Cel-gcy-22 stands out from other ASER-type gcy genes (gcy-1, gcy-4, gcy-5) in being located on a separate chromosome (Chr. V) as well as in having a wider range of defects in chemoattraction towards salt ions. Given that the 5 P. pacificus gcy-22-like paralogs are located on 3 separate chromosomes without clear synteny to their C. elegans counterparts, it is likely that the gcy-22 paralogs emerged from independent and repeated gene duplication events after the separation of these Caenorhabditis and Pristionchus lineages. Our reporter strains for two other P. pacificus gcy-22-like paralogs either did not exhibit expression in amphid neurons (Ppa-gcy-22.1p::GFP, ) or exhibited expression in multiple neuron types in addition to a putative ASE neuron (Ppa-gcy-22.4p::GFP). We have expanded the discussion on the other P. pacificus gcy-22 paralogs.

      (7) The calcium imaging data from Ppa-ASE is quite variable. It would be helpful to discuss this variability. It would also be helpful to clarify how the ASEL and ASER neurons are being conclusively identified during calcium imaging.

      For each animal, the orientation of the nose and vulva were recorded and used as a guide to determine the ventral and dorsal sides of the worm, and subsequently, the left and right sides of the worm. Accounting for the plane of focus of the neuron pairs as viewed through the microscope, it was then determined whether the imaged neuron was the worm’s left or right neuron of each pair. We added this explanation to the Methods.

      (8) More information about how the animals were treated prior to calcium imaging would be helpful. In particular, were they exposed to salt solutions prior to imaging? In addition, the animals are in an M9 buffer during imaging - does this affect calcium responses in Ppa-ASE and Ppa-AFD? More information about salt exposure, and how this affects neuron responses, would be very helpful.

      Prior to calcium imaging, animals were picked from their cultivation plates (using an eyelash pick to minimize bacteria transfer) and placed in loading solution (M9 buffer with 0.1% Tween20 and 1.5 mM tetramisole hydrochloride, as indicated in the Method) to immobilize the animals until they were visibly completely immobilized.

      (9) In Figure 6, the authors say that Ppa-gcy-22.3::GFP expression is absent in the Ppa-che1(ot5012) mutant. However, based on the figure, it looks like there is some expression remaining. Is there a residual expression of Ppa-gcy-22.3::GFP in ASE or possibly ectopic expression in AFD? Does Ppa-che-1 regulate rGC expression in AFD? It would be helpful to address the role of Ppa-che-1 in AFD neuron differentiation.

      In Figure 6C, the green signal is autofluorescence in the gut, and there is no GFP expression detected in any of the 55 che-1(-) animals we examined. We are currently developing AFDspecific rGC markers (gcy-8 homologs) to be able to examine the role of Ppa-CHE-1 in regulating AFD identity.

      Recommendations for the authors:

      Reviewer #1 (Recommendations for the authors):

      (1) Abstract: 'how does sensory diversity prevail within this neuronal constraint?' - could be clearer as 'numerical constraint' or 'neuron number constraint'.

      We have clarified this passage as ‘…constraint in neuron number’.

      (2) 'Sensory neurons in the Pristionchus pacificus' - should get rid of the 'the'.

      We have removed the ‘the’.

      (3) Figure 2: We have had some good results with the ALFA tag using a similar approach (tagging endogenous loci using CRISPR). I'm not sure if it is a Pristionchus thing, or if it is a result of our different protocols, but our staining appears stronger with less background. We use an adaptation of the Finney-Ruvkin protocol, which includes MeOH in the primary fixation with PFA, and overcomes the cuticle barrier with some LN2 cracking, DTT, then H2O2. No collagenase. If you haven't tested it already it might be worth comparing the next time you have a need for immunostaining.

      We appreciate this suggestion. Our staining protocol uses paraformaldehyde fixation. We observed consistent and clear staining in only 4 neurons in CHE-1::ALFA animals but more background signals from TTX-1::ALFA in Figure 2I-J in that could benefit from improved immunostaining protocol.

      (4) Page 6: 'By crossing the che-1 reporter transgene into a che-1 mutant background (see below), we also found that che-1 autoregulates its own expression (Figure 2F), as it does in C. elegans' - it took me some effort to understand this. It might make it easier for future readers if this is explained more clearly.

      We understand this confusion and have changed the wording along with a supporting table with a more detailed account of che-1p::RFP expression in both ASE and AFD neurons in wildtype and che-1(-) backgrounds in the Results.

      (5) Line numbers would make it easier for reviewers to reference the text.

      We have added line numbers.

      (6) Page 7: is 250mM NH<sub>4</sub>Cl an ecologically relevant concentration? When does off-target/nonspecific activation of odorant receptors become an issue? Some discussion of this could help readers assess the relevance of the salt concentrations used.

      This is a great question but one that is difficult to reconcile between experimental conditions that often use 2.5M salt as point-source to establish salt gradients versus ecologically relevant concentrations that are very heterogenous in salinity. Efforts to show C. elegans can tolerate similar levels of salinity between 0.20-0.30 M without adverse effects have been recorded previously (Hu et al., Analytica Chimica Acta 2015; Mah et al. Expedition 2017).

      (7) It would be nice for readers to have a short orientation to the ecological relevance of the different salts - e.g. why Pristionchus has a particular taste for ammonium salts.

      Pristionchus species are entomophilic and most frequently found to be associated with beetles in a necromenic manner. Insect cadavers could thus represent sources of ammonium in the soil. Additionally, ammonium salts could represent a biological signature of other nematodes that the predatory morphs of P. pacificus could interpret as prey. We have added the possible ecological relevance of ammonium salts into the Discussion.

      (8) Page 11: 'multiple P. pacificus che-1p::GCaMP strains did not exhibit sufficient basal fluorescence to allow for image tracking and direct comparison'. 500ms exposure to get enough signal from RCaMP is slow, but based on the figures it still seems enough to capture things. If image tracking was the issue, then using GCaMP6s with SL2-RFP or similar in conjunction with a beam splitter enables tracking when the GCaMP signal is low. Might be an option for the future.

      These are very helpful suggestions and we hope to eventually develop an improved che1p::GCaMP strain for future studies.

      (9) Sometimes C. elegans genes are referred to as 'C. elegans [gene name]' and sometimes 'Cel [gene name]'. Should be consistent. Same with Pristionchus.

      We have now combed through and corrected the inconsistencies in nomenclature.

      (10) Pg 12 - '...supports the likelihood that AFD receives inputs, possibly neuropeptidergic, from other amphid neurons' - the neuropeptidergic part could do with some justification.

      Because the AFD neurons are not exposed directly to the environment through the amphid channel like the ASE and other amphid neurons, the calcium responses to salts detected in the AFD likely originate from sensory neurons connected to the AFD. However, because there is no synaptic connection from other amphid neurons to the AFD neurons in P. pacificus (unlike in C. elegans; Hong et al, eLife, 2019), it is likely that neuropeptides connect other sensory neurons to the AFDs. To avoid unnecessary confusion, we have removed “possibly neuropeptidergic.”

      (11) Pg16: the link to the Hallam lab codon adaptor has a space in the middle. Also, the paper should be cited along with the web address (Bryant and Hallam, 2021).

      We have now added the proper link, plus in-text citation. https://hallemlab.shinyapps.io/Wild_Worm_Codon_Adapter/ (Bryant and Hallem, 2021)

      Full citation:

      Astra S Bryant, Elissa A Hallem, The Wild Worm Codon Adapter: a web tool for automated codon adaptation of transgenes for expression in non-Caenorhabditis nematodes, G3 Genes|Genomes|Genetics, Volume 11, Issue 7, July 2021, jkab146, https://doi.org/10.1093/g3journal/jkab146

      Reviewer #2 (Recommendations for the authors):

      (1) In Figure 1, the legend states that the population tested was "J4/L4 larvae and young adult hermaphrodites," whereas in the main text, the population was described as "adult hermaphrodites." Please clarify which ages were tested.

      We have tested J4-Adult stage hermaphrodites and have made the appropriate corrections in the text.

      (2) The authors state that "in contrast to C. elegans, we find that P. pacificus is only moderately and weakly attracted to NaCl and LiCl, respectively." However, this statement does not reflect the data shown in Figure 1, where there is no significant difference between C. elegans and P. pacificus - both species show at most weak attraction to NaCl.

      Although there is no statistically significant difference in NaCl attraction between P. pacificus and C. elegans, NaCl attraction in P. pacificus is significantly lower than its attraction to all 3 ammonium salts when compared to C. elegans. We have rephrased this statement as relative differences in the Results and updated the Figure legend.

      (3) In Figure 1, the comparisons between C. elegans and P. pacificus should be made using a two-way ANOVA rather than multiple t-tests. Also, the sample sizes should be stated (so the reader does not need to count the circles) and the error bars should be defined.

      We performed the 2-way ANOVA to detect differences between C. elegans and P. pacificus for the same salt and between salts within each species. We also indicated the sample size on the figure and defined the error bars.

      Significance:

      For comparisons of different salt responses within the same species:

      - For C. elegans, NH<sub>4</sub>Br vs NH<sub>4</sub>Cl (**p<0.01), NH<sub>4</sub>Cl vs NH<sub>4</sub>I (* p<0.05), and NH<sub>4</sub>Cl vs NaCl (* p<0.05). All other comparisons are not significant.

      - For P. pacificus, all salts showed (****p<0.0001) when compared to NaAc and to NH<sub>4</sub>Ac, except for NH<sub>4</sub>Ac and NaAc compared to each other (ns). Also, NH<sub>4</sub>Cl showed (*p<0.05) and NH<sub>4</sub>I showed (***p<0.001) when compared with LiCl and NaCl. All other comparisons are not significant.

      For comparisons of salt responses between different species (N2 vs PS312):

      - NH<sub>4</sub>I and LiCl (*p<0.05); NaAc and NH<sub>4</sub>Ac (****p<0.0001)

      (4) It might be worth doing a power analysis on the data in Figure 3B. If the data are underpowered, this might explain why there is a difference in NH<sub>4</sub>Br response with one of the null mutants but not the other.

      For responses to NH<sub>4</sub>Cl, since both che-1 mutants (rather than just one) showed significant difference compared to wildtype, we conducted a power analysis based on the effect size of that difference (~1.2; large). Given this effect size, the sample size for future experiments should be 12 (ANOVA).

      For responses to NH<sub>4</sub>Br and given the effect size of the difference seen between wildtype (PS312) and ot5012 (~0.8; large), the sample size for future experiments should be 18 (ANOVA) for a power value of 0.8. Therefore, it is possible that the sample size of 12 for the current experiment was too small to detect a possible difference between the ot5013 alleles and wildtype.

      (5) It would be helpful to discuss why silencing Ppa-ASE might result in a switch from attractive to repulsive responses to some of the tested gustatory cues.

      For similar assays using Ppa-odr-3p::HisCl1, increasing histamine concentration led to decreasing C.I. for a given odorant (myristate, a P. pacificus-specific attractant). It is likely that the amount of histamine treatment for knockdown to zero (i.e. without a valence change) will differ depending on the attractant.

      (6) The statistical tests used in Figure 3 are not stated.

      Figure 3 used Two-way ANOVA with Dunnett’s post hoc test. We have now added the test in the figure legend.

      (7) It would be helpful to examine the responses of ASER to the full salt panel in the Ppa-gcy-22.3 vs. wild-type backgrounds.

      We understand that future experiments examining neuron responses to the full salt panel for wildtype and gcy-22.3 mutants would provide further information about the salts and specific ions associated with the GCY-22.3 receptor. However, we have tested a broader range of salts (although not yet the full panel) for behavioral assays in wildtype vs gcy-22.3 mutants, which we have included as part of an added Figure 8.

      (8) The controls shown in Figure S1 may not be adequate. Ideally, the same sample size would be used for the control, allowing differences between control worms and experimental worms to be quantified.

      Although we had not conducted an equal number of negative controls using green light without salt stimuli due to resource constraints (6 control vs ~10-19 test), we provided individual recordings with stimuli to show that conditions we interpreted as having responses rarely showed responses resembling the negative controls. Similarly, those we interpreted as having no responses to stimuli mostly resembled the no-stimuli controls (e.g. WT to 25 mM NH<sub>4</sub>Cl, gcy22.3 mutant to 250 mM NH<sub>4</sub>Cl).

      (9) An osmolarity control would be helpful for the calcium imaging experiments.

      We acknowledge that future calcium imaging experiments featuring different salt concentrations could benefit from osmolarity controls.

      (10) In Figure S7, more information about the microfluidic chip design is needed.

      The chip design features a U-shaped worm trap to facilitate loading the worm head-first, with a tapered opening to ensure the worm fits snugly and will not slide too far forward during recording. The outer two chip channels hold buffer solution and can be switched open (ON) or closed (OFF) by the Valvebank. The inner two chip channels hold experimental solutions. The inner channel closer to the worm trap holds the control solution, and the inner channel farther from the worm trap holds the stimulant solution.

      We have added an image of the chip in Figure S7 and further description in the legend.

      (11) Throughout the manuscript, the discussion of the salt stimuli focuses on the salts more than the ions. More discussion of which ions are eliciting responses (both behavioral and neuronal responses) would be helpful.

      In Figure 7, the gcy-22.3 defect resulted in a statistically significant reduction in response only towards NH<sub>4</sub>Cl but not towards NaCl, which suggests ASER is the primary neuron detecting NH<sub>4</sub><sup>+</sup> ions. To extend the description of the gcy-22.3 mutant defects to other ions, we have added a Figure 8: chemotaxis on various salt backgrounds. We found only a mild increase in attraction towards NH<sub>4</sub><sup>+</sup> by both gcy-22.3 mutant alleles, but wild-type in their responses toward Cl<sup>-</sup>, Na<sup>+</sup>, or I<sup>-</sup>. The switch in the direction of change between the behavioral (enhanced) and calcium imaging result (reduced) suggests the behavioral response to ammonium ions likely involves additional receptors and neurons.

      Minor comments:

      (1) The full species name of "C. elegans" should be written out upon first use.

      We have added ‘Caenorhabditis elegans’ to its first mention.

      (2) In the legend of Figure 1, "N2" should not be in italics.

      We have made the correction.

      (3) The "che-1" gene should be in lowercase, even when it is at the start of the sentence.

      We have made the correction.

      (4) Throughout the manuscript, "HisCl" should be "HisCl1."

      We have made these corrections to ‘HisCl1’.

      (5) Figure 3A would benefit from more context, such as the format seen in Figure 7A. It would also help to have more information in the legend (e.g., blue boxes are exons, etc.).

      (6) "Since NH<sub>4</sub>I sensation is affected by silencing of che-1(+) neurons but is unaffected in che-1 mutants, ASE differentiation may be more greatly impacted by the silencing of ASE than by the loss of che-1": I don't think this is exactly what the authors mean. I would say, "ASE function may be more greatly impacted...".

      We have changed ‘differentiation’ to ‘function’ in this passage.

      (7) In Figure 7F-G, the AFD neurons are referred to as AFD in the figure title but AM12 in the graph. This is confusing.

      Thank you for noticing this oversight. We have corrected “AM12” to “AFD”.

      (8) In Figure 7, the legend suggests that comparisons within the same genotype were analyzed. I do not see these comparisons in the figure. In which cases were comparisons within the same genotype made?

      Correct, we performed additional tests between ON and OFF states within the same genotypes (WT and mutant) but did not find significant differences. To avoid unnecessary confusion, we have removed this sentence.

      (9) The nomenclature used for the transgenic animals is unconventional. For example, normally the calcium imaging line would be listed as csuEx93[Ppa-che-1p::optRCaMP] instead of Ppache-1p::optRCaMP(csuEx93).

      We have made these corrections to the nomenclature.

      (10) Figure S6 appears to come out of order. Also, it would be nice to have more of a legend for this figure. The format of the figure could also be improved for clarity.

      We have corrected Figure S6 (now S8) and added more information to the legend.

      (11) Methods section, Chemotaxis assays: "Most assays lasted ~3.5 hours at room temperature in line with the speed of P. pacificus without food..." It's not clear what this means. Does it take the worms 3.5 hours to crawl across the surface of the plate?

      Correct, P. pacificus requires 3-4 hours to crawl across the surface of the plate, which is the standard time for chemotaxis assays for some odors and all salts. We have added this clarification to the Methods.

    1. eLife Assessment

      This study provides an important and timely analysis of invasive and non-invasive Streptococcus pyogenes emm89 isolates, which have become a dominant serotype in the past decade. Using genome sequencing of 311 strains from Japan and comparing them with 666 global strains, the authors present compelling evidence in support of the identification of genetic factors linked to the invasive phenotype of emm89. The findings are both theoretically and practically significant in medical microbiology.

    2. Reviewer #1 (Public review):

      Summary:

      In this study, the authors sequenced emm89 serotype genomes of clinical isolates from patients in Japan, where the number of invasive Group A Streptococcus (GAS), especially those of the emm89 serotype, has drastically increased over the past 10-15 years. The sequences from this cohort were compared against a large collection of publicly available global isolates, yielding a total of almost 1000 genomes in the analysis. Because the researchers focused on the emm89 serotype, they could construct a common core genome, with subsequent ability to analyze genomic differences in accessory genes and intergenic regions that contributed to the invasive phenotype using multiple types of GWAS analysis (SNP, k-mer). Their analysis demonstrates some mutations responsible for invasiveness are specific to the Japanese strains, and that multiple independent virulence factors can contribute to invasiveness. None of the invasive phenotypes were correlated with new gene acquisition. Together, the data support that synergy between bacterial survival and upregulation of virulence factors contribute to the development of severe infection.

      Strengths:

      • The authors verify their analysis by confirming that covS is one of the more frequently mutated genes in invasive strains of GAS, as has been shown in other publications.

      • A mutation in one of the SNPs attributed to invasiveness (SNP fhuB) was introduced into an invasive strain. The authors demonstrate that this mutant strain survives less well in human blood. Therefore, the authors have experimental data to support their claims that their analysis uncovered a new mutation/SNP that contributed to invasiveness.

      Weaknesses:

      • It would be helpful for the authors to highlight why their technique (large scale analysis of one emm type) can yield more information than a typical GWAS analysis of invasive vs. non-invasive strains. Are SNPs easier to identify using a large-scale core genome? Is it more likely evolutionarily to find mutations in non-coding regions as opposed to the core genome and accessory genes, and this is what this technique allows? Did the analysis yield unexpected genes or new genes that had not been previously identified in other GWAS analyses? These points may need to be made more apparent in the results and deserves some thought in the discussion section.

      • The Alpha-fold data does not demonstrate why the mutations the authors identified could contribute to the invasive phenotype. It would be helpful to show an overlay of the predicted structures containing the different SNPs to demonstrate the potential structural differences that can occur due to the SNP. This would make the data more convincing that the SNP has a potential impact on the function of the protein. Similarly, the authors discuss modification of the hydrophobicity of the side chain in the ferrichrome transporter (lines 317-318) due to a SNP, but this is not immediately obvious in the figure (Fig. 5).

      Comments on revisions:

      The authors have addressed the concerns from reviewers. The implemented revisions have improved the manuscript's clarity.

    3. Author response:

      The following is the authors’ response to the original reviews

      Reviewer #1 (Public review):

      Weaknesses:

      It would be helpful for the authors to highlight why their technique (large scale analysis of one emm type) can yield more information than a typical GWAS analysis of invasive vs. non-invasive strains. Are SNPs easier to identify using a large-scale core genome? Is it more likely evolutionarily to find mutations in non-coding regions as opposed to the core genome and accessory genes, and this is what this technique allows? Did the analysis yield unexpected genes or new genes that had not been previously identified in other GWAS analyses? These points may need to be made more apparent in the results and deserve some thought in the discussion section.

      We thank the reviewer for pointing out the importance of this study. By focusing on bacteria within a single emm type, false positives caused by confounding lineage effects can be minimized, which contributes to greater accuracy of the pan-GWAS. We have added relevant text describing the strong points of our pan-GWAS approach to the Results and Discussion sections, as shown following:

      “The present pan-GWAS of bacteria within a single emm type minimized lineage effects, thus reducing false positives.” (lines 204–205)

      The present study focused on emm89 S. pyogenes, known to cause increasing rates of invasive infections worldwide, and also assessed differences between emm89 strains causing invasive and non-invasive infections. By focusing on bacteria within closed phylogenies, false positives caused by confounding lineage effects were minimized, thus contributing to a higher level of accuracy of the pan-GWAS.” (lines 420–424)

      In addition, we would like to comment more regarding the reviewer’s question, "Is it more likely evolutionarily to find mutations in non-coding regions as opposed to the core genome and accessory genes, and this is what this technique allows?". Mutations are generally considered to be more frequent in non-coding than coding regions. However, the actual mutation frequencies in both types of regions were not assessed in this study. Nevertheless, exploring non-coding regions using the k-mer method is of considerable importance, as variations significantly associated with infectious phenotypes may contribute to alterations in gene expression and other regulatory mechanisms.

      The Alpha-fold data does not demonstrate why the mutations the authors identified could contribute to the invasive phenotype. It would be helpful to show an overlay of the predicted structures containing the different SNPs to demonstrate the potential structural differences that can occur due to the SNP. This would make the data more convincing that the SNP has a potential impact on the function of the protein. Similarly, the authors discuss modification of the hydrophobicity of the side chain in the ferrichrome transporter (lines 317-318) due to a SNP, but this is not immediately obvious in the figure (Fig. 5).

      As the reviewer suggested, we have substituted Figure 5E in the previous version with a figure illustrating the molecular surface within proximity of the mutation. We speculated that the mutation may induce a small indentation on the surface, and thus attenuate the stability of the hydrophobic bound between FhuB and FhuD by invasion of solvent into the indentation. Additionally, images showing the wild-type and mutated models have been separated for better visibility instead of as an overlay of the predicted models suggested by the reviewer. Relevant text in the Results section and legend of Figure 5E have been accordingly revised, as shown following:

      “The mutation was predicted to induce formation of a small indentation on the molecular surface, thus increasing the surface area accessible to the solvent, and is considered to potentially affect the stability of the hydrophobic bond between FhuB and FhuD, and thus ferrichrome transport (Figure 5E).” (lines 360–363)

      “The 73rd valine in FhuB, shown in magenta, was substituted with alanine. The molecular surface is illustrated with a wireframe and that of the predicted indentation is shown with an arrowhead.” (lines 1162–1164)

      Reviewer #1 (Recommendations for the author):

      The figure legend for Fig. 3C needs to be explained so that it is similarly laid out as in Fig. 2C. Fig. 2C should indicate that the magenta color represents the invasive phenotype.

      Based on this helpful suggestion, more detailed information about the magenta color representing the invasive phenotype has been added to the legends of Fig. 2C and 3C, with relevant text also included in the revised legends, as shown following:

      “Colored bars above indicate countries and phenotypes, and magenta bars represent invasive phenotypes. Using the Roary program, gene names starting with “Group_” were automatically assigned. Position indicates the location of each SNP/indel on the core gene alignment. The full results are shown in Table S6.” (lines 1116–1120)

      “Colored bars above indicate countries and phenotypes, and magenta bars represent invasive phenotypes. Using the Roary program, gene names starting with “Group_” were automatically assigned. The full results are shown in Table S8. (lines 1130–1133)

      The wording and organization of results in the k-mer section started to get confusing around lines 270-271. It begins to be a list of results and would be better served by some interpretation or explanation of the significance (why it is important to find such mutations). For example, for mutations you find in non-coding regions, do you expect them to have a detrimental effects on gene expression/regulation?

      As the reviewer kindly suggested, we have added interpretation or explanation of the significance of Comp_6 and Comp_24 to the Results section. We analyzed the function of the non-coding region of Comp_6 by employing web-based in silico tools, including MLDSPP and BacPP, though no promoter sequences could be identified. Next, using BLAST, a search for known promoter sequences of S. pyogenes M1 strain SF370 of the CDBProm database was attempted, because the web-based in silico promoter prediction tools are not suitable for S. pyogenes. However, neither identical nor homologous sequences were detected. Thus, the significance of this region remains unknown. In Comp_24, group_141 was also identified in the COGs-based pan-GWAS as a non-invasiveness related gene. Furthermore, group_141 showed high levels of correlation with group_139 and group_467, encoding transposase and uncharacterized protein, respectively, which suggests that the presence of an MGE is associated with a non-invasive phenotype.

      Relevant text has been added to the Materials and Methods (lines 653–657) and Results (lines 308–311 and 314–319) sections, as shown following:

      “Promoter sequences in intergenic regions were predicted using web-based tools, MLDSPP and BacPP[29,30]. Additionally, BLAST was employed to search the promoter sequences of S. pyogenes strain SF370 registered in the CDBProm database (https://aw.iimas.unam.mx/cdbprom/)[69]” (lines 653–657)

      “We speculated that this region is related to regulation of gene expression. However, no promoter sequences were identified by utilizing MLDSPP, BacPP, and BLAST, thus the significance of this region remains to be clarified[29,30].” (lines 308–311)

      “Furthermore, group_141 was also identified in the COGs-based pan-GWAS as a non-invasiveness-related gene along with group_139 and group_467, which encode transposase and uncharacterized protein, respectively (Table S8 and Figure S4). Taken together, the absence of an MGE containing group_141, and the presence of another MGE harboring group_142 and group_143 may result in an invasive phenotype.” (lines 314–319)

      Additionally, new references (#29, 30, and 69) concerning bacterial promoter prediction have been included in the revised version of the manuscript.

      Because there is no difference in intracellular free ferric ions in the fhuB mutant compared with the wild-type, the authors speculate that the upregulation of the fhuBCD operon can compensate for the loss of function of the fhuB gene, but there is insufficient data to support this claim.

      As the reviewer indicate, the data presented in the previous version were insufficient to support our speculation. Therefore, the following sentence has been deleted from the manuscript (previous version line 367):

      “Therefore, the upregulation of fhuBCD may compensate for the impaired function mediated by SNP T218C.”

      The authors mention that there was no direct association between invasiveness and acquisition of genes (lines 451-455), including antibiotic resistance genes from prophages and MGEs (lines 467-469). These data should be moved to the results section to focus the results on the correlation between invasiveness and mutation of existing DNA vs acquisition of new DNA.

      Accordingly, we have added relevant text to the Results section, as shown following:

      “On the other hand, the present pan-GWAS found no genes encoding known virulence factors significantly associated with invasiveness, thus further analysis of the relationships of detected distribution patterns with prophages and MGEs was performed.” (lines 264–267)

      Minor spelling error at line 210 ("waws" instead of "was").

      As the reviewer kindly pointed out, the spelling has been corrected. (line 233)

      Reviewer #2 (Recommendations for the authors):

      Minor comments:

      Line 55: Does this rate apply to all types of infections?

      The authors appreciate this question from the reviewer. We checked what types of infections the mortality rate is applied to and confirmed that it only represents STSS. Therefore, relevant text has been revised, as shown following:

      However, even with proper treatment, the mortality rate of patients with STSS remains high, ranging from 23–81%[6]”. (lines 72–73)

      Line 58: Could you explain the protein encoded by the emm gene and the role of the hypervariable region in pathogenesis?

      As requested, relevant text regarding the pathogenic role of the hypervariable region of M protein has been added, as shown following:

      S. pyogenes has been classified into at least 240 emm types based on a hypervariable region sequence of the emm gene, which encodes the M protein. This hypervariable region of the M protein is responsible for type-specific antigenicity and binds with high affinity to C4b-binding protein, a major fluid phase inhibitor of the classical and lectin pathways of the complement system that confers resistance to opsonophagocytosis[8].” (lines 76–81)

      Line 161: Figure 1C does not show the strain with the different pattern.

      The authors apologize for the lack of clarity. In Fig. 1C, the strain is shown by a pale pink color bar used to indicate the related clade. For clarity, an arrowhead pointing to the strain from outside of the tree has been added along with the following text in the legend:

      “Arrowhead indicates strain belonging to the novel clade.” (lines 1102–1103)

      Line 239: It could be interesting to examine the genes in the region between the mobile elements found in the global cohort, as the result profile was very different from the Japanese group, which revealed more specific genes. Consider adding this to the results section.

      Based on the reviewer’s insightful suggestion, we attempted to find regions between the mobile genetic element-related genes. However, contigs generated from short reads were not adequate to identify such a genome structure. Therefore, calculations to analyze the pairwise correlation of the presence of significant COGs in the 666 strains to predict genes on prophages and MGEs were performed, and the results added to Figure S4. Eight clusters were detected as coexisting COG groups, seven of which comprised phage- or MGE-related genes. Furthermore, a cluster with antimicrobial-resistant genes was shown to be correlated with non-invasive infections. It is thus speculated that gain or loss of gene sets via phages and MGEs rather than acquisition of virulence genes may lead to changes in fitness to the environment and bacterial phenotypes. Relevant text has been added to the revised versions of the Results, Discussion, and Materials and Methods sections, as shown following:

      “On the other hand, the present pan-GWAS found no genes encoding known virulence factors significantly associated with invasiveness, thus further analysis of the relationships of detected distribution patterns with prophages and MGEs was performed. For calculating the pairwise correlation of the presence of significant COGs in the 666 strains, the COGs were clustered into eight coexisting groups, seven of which contained phage- and/or MGEs-related genes (Figure S4). The largest group comprised 65 genes including phage proteins, while the second largest with 42 genes was found to be associated with non-invasive infections, and included group_2689, group_1833, and ermA1, encoding TetR/AcrR family transcriptional regulator, multidrug efflux system permease protein, and rRNA adenine N-6-methyltransferase, respectively.” (lines 264–273)

      “On the other hand, a cluster comprising 49 non-invasiveness-associated genes including antibiotic-resistance genes was identified. Furthermore, among the genes showing a significant correlation with the infectious phenotype, approximately 90% (152 of 169) were associated with non-invasiveness. One possible explanation is that significantly related genes reflect the process of not only gain of factors but also loss of those affecting fitness cost.” (lines 517–522)

      “The correlation of the presence of significant COGs was calculated and visualized using the R program.” (lines 643–644)

      Line 548: What cutoff values were used in Fastp?

      The default cutoff value for Fastp (Q>15) was used, and relevant text has been added to the Materials and Methods section in the revised version, as shown following:

      “All collected sequences were subjected to quality checks using Fastp v.0.20.1, with a default cutoff value of Q>15[53].” (lines 600–601)

      Line 635: Were the transcriptome experiments performed in triplicate?

      We apologize for the confusion. The transcriptome experiment was performed only once with three samples for each condition. The notation “(n=3 for each condition)” has been added to the relevant text portion in the Materials and Methods section (line 696).

      Discussion section: I believe the authors should place more emphasis on the fact that FhuB is associated with non-invasiveness, to provide clearer context in the discussion.

      Based on this helpful suggestion, we have revised relevant text in the Discussion section, as shown following:

      “Transcriptomic analysis findings suggested that the Japan-specific fhuB mutation associated with non-severe invasive infections contributes to the growth rate of S. pyogenes in human blood by adapting to the environment.” (lines 457–459)

      Also, “V73A” has been removed from the relevant text in the Discussion section to provide a more clear and precise context, with the revised sentence shown following:

      “Two possible roles of the FhuB mutation in the pathogenesis of severe invasive infections are thus proposed.” (lines 470–471)

    1. eLife Assessment

      This valuable study presents a deep learning framework for predicting synergistic drug combinations for cancer treatment in the AstraZeneca-Sanger (AZS) DREAM Challenge dataset. The level of evidence seems solid, although performance on some datasets seems unconvincing and further validation would be required to demonstrate the generalizability of the model and, in turn, its clinical relevance. The reported tool, DIPx, could be of use for personalized drug synergy prediction and exploring the activated pathways related to the effects of drug combinations.

    2. Reviewer #1 (Public review):

      The authors introduces DIPx, a deep learning framework for predicting synergistic drug combinations for cancer treatment using the AstraZeneca-Sanger (AZS) DREAM Challenge dataset. While the approach is innovative, I have following concerns and comments, and hopefully will improve the study's rigor and applicability, making it a more powerful tool in real clinical world.

      (1) The model struggles with predicting synergies for drug combinations not included in its training data (showing only Spearman correlation 0.26 in Test Set 2). This limits its potential for discovering new therapeutic strategies. Utilizing techniques such as transfer learning or expanding the training dataset to encompass a wider range of drug pairs could help to address this issue.

      (2) The use of pan-cancer datasets, while offering broad applicability, may not be optimal for specific cancer subtypes with distinct biological mechanisms. Developing subtype-specific models or adjusting the current model to account for these differences could improve prediction accuracy for individual cancer types.

      (3) Line 127, "Since DIPx uses only molecular data, to make a fair comparison, we trained TAJI using only molecular features and referred to it as TAJI-M.". TAJI was designed to use both monotherapy drug-response and molecular data, and likely won't be able to reach maximum potential if removing monotherapy drug-response from the training model. It would be critical to use the same training datasets and then compare the performances. From Figure 6 of TAJI's paper (Li et al., 2018, PMID: 30054332) , i.e., the mean Pearson correlation for breast cancer and lung cancer are around 0.5 - 0.6.

      The following 2 concerns have been included in the Discussion section which are great:

      (1) Training and validating the model using cell lines may not fully capture the heterogeneity and complexity of in vivo tumors. To increase clinical relevance, it would be beneficial to validate the model using primary tumor samples or patient-derived xenografts.

      (2) The Pathway Activation Score (PAS) is derived exclusively from primary target genes, potentially overlooking critical interactions involving non-primary targets. Including these secondary effects could enhance the model's predictive accuracy and comprehensiveness.

    3. Reviewer #2 (Public review):

      Trac, Huang, et al used the AZ Drug Combination Prediction DREAM challenge data to make a new random forest-based model for drug synergy. They make comparisons to the winning method and also show that their model has some predictive capacity for a completely different dataset. They highlight the ability of the model to be interpretable in terms of pathway and target interactions for synergistic effects.

      In their revised manuscript and response, the authors have tried to address all points. I do not fully agree with them about the definition of overfitting still. If the objective it to identify synergies given any 2 drugs, not just those in a dataset at different doses, then the results certainly appear overfit to the training set given the performance degradation. However, at this time, I cannot add any useful suggestions to improve performance.

    4. Reviewer #3 (Public review):

      Summary:

      Predicting how two different drugs act together by looking at their specific gene targets and pathways is crucial for understanding the biological significance of drug combinations. This study incorporates drug-specific pathway activation scores (PASs) to estimate synergy scores as one of the key advancements for synergy prediction. The new algorithm, Drug synergy Interaction Prediction (DIPx), developed in this study, uses gene expression, mutation profiles, and drug synergy data to train the model and predict synergy between two drugs. Comprehensive comparisons with another best-performing algorithm, TAIJI-M, highlight the potential of its capabilities.

      Strengths:

      DIPx uses target and driver genes to elucidate pathway activation scores (PASs) to predict drug synergy. Its performance was tested using the AstraZeneca-Sanger (AZS) DREAM Challenge dataset, especially in Test Set 1, where the Spearman correlation coefficient between predicted and observed drug synergy was 0.50 (95% CI: 0.47-0.53). DIPx's ability to handle novel combinations, as evidenced by its performance in test set 2, indicates the potential for predicting new and untested drug combinations, even though it's lower than that of the test set 1.

      Weaknesses:

      While the DIPx algorithm shows promise in predicting drug synergy based on pathway activation scores, it's essential to consider its limitations. One limitation is that the availability of training data for specific drug combinations may influence its predictive capability. Further testing and experimental validation of the predictions in future studies would be necessary to assess the algorithm's generalizability and robustness.

    5. Author response:

      The following is the authors’ response to the previous reviews

      We would like to respond to just one remaining concern from Reviewer 1 and Reviewer 2 regarding a potential overfitting in Test Set 1, which involves combinations already present in the training set. DIPx’s (and TAIJI’s) performance in Test Set 1 is better than in Test Set 2, which involves combinations not present in the training set. Let’s consider two general points to highlight why the improved performance is not the result of overfitting. 

      (1) Suppose we are testing the e ect of one drug D; the training may involve, for example, selecting an optimal dose. A validated e ect of D in an independent test set is not an overfit, even though we are using the same drug in the training and the test set. Testing one drug is an extreme case, but the same idea holds for any number of drugs. What matters is the independence of the test set. 

      (2) A prediction model P1 will legitimately perform better than model P2, if P1 uses better or more informative features than P2. The features could be those used directly in the model, but they could also be other observable characteristics not directly used in the model, such as optimal subregions of the feature space. DPIx or TAIJI results indicate that the identity of previously trained combinations is one such informative feature. The set of previously trained combinations corresponds to a subregion of the feature space. DIPx’s prediction performance for known combinations would be expected to follow the results from Test Set 1; we cannot expect that if there is an overfitting issue. Finally, we note that Test Set 1 was established and used in the AstraZeneca Dream Challenge for rigorously testing the prediction of known combinations.

    1. eLife Assessment

      This is valuable work with theoretical implications for possible mediation by MMP12 in the link between atherosclerosis and intracranial aneurysms, using Mendelian Randomization for causal inference. Additional analysis would be required to verify the claims, which currently have incomplete support in terms of the strength of evidence. Given that most of the identified causal associations do not hold after correcting for multiple tests, the conclusions should be carefully reviewed in order to be fully supported by the results.

    2. Reviewer #1 (Public review):

      Summary:

      The authors performed bidirectional two-sample Mendelian randomization using publicly available GWAS summary data to assess the directional causal association between atherosclerosis and intracranial aneurysms. They have used a similar strategy to identify the role of matrix metalloproteinases (MMP), especially MMP12, in mediating the above causal association. They finally substantiated these results by measuring and comparing the MMP12 levels in the plasma samples collected from carotid atherosclerosis and intracranial aneurysm patients with those of healthy controls. Local tissue levels of MMP12 were also measured in experimental mouse models.

      Strengths:

      The authors have chosen to address an important problem that could be of interest to many researchers and clinicians in the subfield.

      Weaknesses:

      Mendelian Randomization (MR) is a powerful approach to explore the directional causal relationship between comorbid conditions using genetic variants as instrumental variables. The validity of causal inference derived from MR strongly depends on genetic instruments satisfying the three core assumptions- relevance, independence, and exclusion restriction. The violation of these assumptions is hard to verify in many real-world situations and may result in spurious results. Rigorous sensitivity analysis is essential to ensure the robustness of the results. The sensitivity analysis presented in the current manuscript is incomplete. The key points are as follows:

      (1) The GWAS summary datasets used by the authors for assessing the causal relationship between atherosclerosis and intracranial aneurysms were all from the FinnGen study and thus may have overlapping samples which is known to introduce bias into the causal estimates and inflate type 1 error rates.

      (2) Both atherosclerosis and aneurysms share common risk factors (mentioned by the authors as well) such as hypertension, cholesterol, diabetes, smoking, etc., which could lead to correlated pleiotropy while performing Mendelian randomization. MR-PRESSO may not effectively account for the same.

      (3) The authors explored the role of matrix metalloproteinases as intermediate biomarkers mediating the risk of atherosclerosis in the intracranial aneurysms. Separating the exposure to biomarker MR from biomarker to outcome MR limits the interpretation of the results. The effect size of the indirect effect cannot be assessed.

      (4) The scatter plots presented in Supplementary Figures 1-3 are neither cited nor discussed in the manuscript. Some of the plots show variability in the direction and magnitude of the causal estimates from MR-Egger and MR-IVW methods, indicating either masking of the causal estimates or directional pleiotropy. Discussing these results is crucial to inform the readers of the limitations of the derived causal estimates.

      (5) When there is substantial evidence available for the frequent coexistence of atherosclerosis and aneurysms, the additional value of the cross-sectional data showing the increased prevalence of atherosclerosis in patients with intracranial aneurysms without adjusting for confounding risk factors is not clear.

      (6) It is also not clear from the manuscript whether the authors are projecting the MMP12 as a shared biomarker or as a mediator between atherosclerosis and intracranial aneurysms. As also noted by the authors, assessment of plasma MMP12 levels in a cross-sectional sample is not sufficient to substantiate the role of MMP12 as an intermediate biomarker connecting atherosclerosis to the increased risk of intracranial aneurysms.

      Impact:

      The findings from this study can form the basis for a more systematic analysis towards identifying molecular intermediates mediating the risk of atherosclerosis in patients with intracranial aneurysms or vice versa, which in turn helps develop novel strategies to manage these comorbid conditions.

    3. Reviewer #2 (Public review):

      The manuscript by Liu and colleagues applied Mendelian Randomization (MR) techniques to study the causal relationship of atherosclerosis (categorized into four subtypes) and intracranial aneurysms (classified as unruptured or ruptured), as well as the potential mediation by 12 plasma matrix metalloproteinase (MMP) levels. The authors have followed rigorous MR analysis guidelines by using multiple analytical approaches, implementing strict selection criteria, and employing comprehensive sensitivity analyses. One of the strengths is the lack of overlapping samples in their two-sample MR analysis. This approach helps mitigate potential biases and increases the reliability of their causal inference. The analysis is fundamentally sound, but there are still several nuanced areas where the methodology could be strengthened. Given that most of the identified causal associations do not hold after correcting for multiple tests, the conclusions should be carefully reviewed to be fully supported by the results.

      The recommendations below are meant to enhance the already robust approach.

      (1) The selection of 12 MMPs lacks a clear, explicit rationale in the provided excerpt. A more detailed explanation of why these specific MMPs were chosen would strengthen the methodological rigor.

      (2) Adjusting p-value for multiple testing using Bonferroni correction needs to be elucidated better.

      (3) The authors should provide a more robust explanation of why they shifted from 5×10⁻⁹ to 5×10⁻⁶ to select genomic instruments.

      (4) Egger's intercept may be a more robust approach for this study to test horizontal pleiotropy rather than MR-PRESSO.

    4. Author response:

      We appreciate the constructive and thoughtful reviews provided by the reviewers and editorial team. We thank you for the opportunity to submit a provisional response and are grateful for the detailed and critical feedback that will strengthen our work. Below, we provide a summary of our planned revisions in response to the public reviews from Reviewer #1 and Reviewer #2.

      Reviewer #1 – Public Review Response Plan

      (1) Sample Overlap (MR Bias):

      We plan to replace several non-overlapping GWAS data sources to validate the association between aneurysms and atherosclerosis, thereby eliminating bias and Type I errors caused by sample overlap.

      (2) Multivariable MR (MVMR):<br /> We will attempt to incorporate known confounding factors (e.g., hypertension, smoking, diabetes) within the multivariable MR framework to verify the robustness of our results.

      (3) Clarifications and Presentation:

      - We will correct eTable citations.

      - Distinguish correctly between "incidence" and "prevalence".

      - Reorganize results to consistently present primary analyses first (IVW), followed by sensitivity results.

      - Expand the methods section to fully reflect all analyses.

      Reviewer #2 – Public Review Response Plan

      (1) Justification of MMP Selection:<br /> We will provide a detailed rationale for the inclusion of the 12 MMPs, based on prior literature and biological relevance.

      (2) Multiple Testing Clarification:<br /> We will clarify the Bonferroni correction strategy, explicitly accounting for all tests (e.g., 72 comparisons × multiple MR methods).

      (3) Instrument Selection Threshold:

      - We agree with the reviewer and will revise the SNP selection strategy, starting from p < 5×10⁻⁸ and only relaxing thresholds when fewer than 3 instruments are found.

      - Clarify the reasons why we do not use LD proxies.

      (4) Pleiotropy and Heterogeneity Tests:

      - We will add Egger's intercept results alongside MR-PRESSO.

      - Specify the R packages used (e.g., TwoSampleMR).

      - To prevent cluttered data presentation, we have included both heterogeneity and pleiotropy p-values in the supplementary tables.

      - Supplement forest plots showing outlier exclusion effects.

      (5) Clarifications in Figures and Tables:

      - Fix the duplicated “simple mode” entry in Figure 2.

      - Correct inconsistencies in p-values between figures and text.

      - Improve figure legends (e.g., color bar labels, panel identifiers).

      - Revise Table 4 title for clarity.

      - Remove the term "causal" where associations are nominal (e.g., p ~ 0.05).

    1. eLife Assessment

      The reported cryo-EM imaging of a pentameric ligand-gated ion channel in liposomes as opposed to nanodiscs has both broad implications and contributes valuable methodological advances to the structural investigation of membrane receptors. The comparison of structures assigned to distinct functional states in liposomes versus nanodiscs is convincing, and will aid membrane protein structural biologists in selection of functionally relevant membrane reconstitution environments. This work could be strengthened by a more quantitative presentation of the pore dimension profile leading to the proposed 9' desensitization gate with discussion of the additional apparent constriction at 2' in the desensitized structure, and by a more thorough description of the biochemistry methods for which core parts are not described and/or discussed in sufficient detail.

    2. Reviewer #1 (Public review):

      Summary:

      The authors, Dalal, et. al., determined cryo-EM structures of open, closed, and desensitized states of the pentameric ligand-gated ion channel ELIC reconstituted in liposomes, and compared them to structures determined in varying nanodisc diameters. They argue that the liposomal reconstitution method is more representative of functional ELIC channels, as they were able to test and recapitulate channel kinetics through stopped-flow thallium flux liposomal assay. The authors and others have described channel interactions with membrane scaffold proteins (MSP), initially thought to be in a size-dependent manner. However, the authors reported that their cryo-EM ELIC structure interacts with the large nanodisc spNW25, contrary to their original hypotheses. This suggests that the channel's interactions with MSPs might alter its structure, possibly not accurately representing/reflecting functional states of the channel.

      Strengths:

      Cryo-EM structural determination from proteoliposomes is a promising methodology within the ion channel field due to their large surface area and lack of MSP or other membrane mimetics that could alter channel structure. Comparing liposomal ELIC to structures in various-sized nanodiscs gives rise to important discussions for other membrane protein structural studies when deciding the best method for individual circumstances.

      Weaknesses:

      The overarching goal of the study was to determine structural differences of ELIC in detergent nanodiscs and liposomes. Including comparisons of the results to the native bacterial lipid environment would provide a more encompassing discussion of how the determined liposome structures might or might not relate to the native receptor in its native environment. The authors stated they determined open, closed, and desensitized states of ELIC reconstituted in liposomes and suggest the desensitization gate is at the 9' region of the pore. However, no functional studies were performed to validate this statement.

    3. Reviewer #2 (Public review):

      Summary

      The report by Dalas and colleagues introduces a significant novelty in the field of pentameric ligand-gated ion channels (pLGICs). Within this family of receptors, numerous structures are available, but a widely recognised problem remains in assigning structures to functional states observed in biological membranes. Here, the authors obtain both structural and functional information of a pLGIC in a liposome environment. The model receptor ELIC is captured in the resting, desensitized, and open states. Structures in large nanodiscs, possibly biased by receptor-scaffold protein interactions, are also reported. Altogether, these results set the stage for the adoption of liposomes as a proxy for the biological membranes, for cryoEM studies of pLGICs and membrane proteins in general.

      Strengths

      The structural data is comprehensive, with structures in liposomes in the 3 main states (and for each, both inward-facing and outward-facing), and an agonist-bound structure in the large spNW25 nanodisc (and a retreatment of previous data obtained in a smaller disc). It adds up to a series of work from the same team that constitutes a much-needed exploration of various types of environment for the transmembrane domain of pLGICs. The structural analysis is thorough.

      The tone of the report is particularly pleasant, in the sense that the authors' claims are not inflated. For instance, a sentence such as "By performing structural and functional characterization under the same reconstitution conditions, we increase our confidence in the functional annotation of these structures." is exemplary.

      Weaknesses

      Core parts of the method are not described and/or discussed in enough detail. While I do believe that liposomes will be, in most cases, better than, say, nanodiscs, the process that leads from the protein in its membrane down to the liposome will play a big role in preserving the native structure, and should be an integral part of the report. Therefore, I strongly felt that biochemistry should be better described and discussed. The results section starts with "Optimal reconstitution of ELIC in liposomes [...] was achieved by dialysis". There is no information on why dialysis is optimal, what it was compared to, the distribution of liposome sizes using different preparation techniques, etc... Reading the title, I would have expected a couple of paragraphs and figure panels on liposome reconstitution. Similarly, potential biochemical challenges are not discussed. The methods section mentions that the sample was "dialyzed [...] over 5-7 days". In such a time window, most of the members of this protein family would aggregate, and it is therefore a protocol that can not be directly generalised. This has to be mentioned explicitly, and a discussion on why this can't be done in two days, what else the authors tested (biobeads? ... ?) would strengthen the manuscript.

      To a lesser extent, the relative lack of both technical details and of a broad discussion also pertains to the cryoEM and thallium flux results. Regarding the cryoEM part, the authors focus their analysis on reconstructions from outward-facing particles on the basis of their better resolutions, yet there was little discussion about it. Is it common for liposome-based structures? Are inward-facing reconstructions worse because of the increased background due to electrons going through two membranes? Are there often impurities inside the liposomes (we see some in the figures)? The influence of the membrane mimetics on conformation could be discussed by referring to other families of proteins where it has been explored (for instance, ABC transporters, but I'm sure there are many other examples). If there are studies in other families of channels in liposomes that were inspirational, those could be mentioned. Regarding thallium flux assays, one argument is that they give access to kinetics and set the stage for time-resolved cryoEM, but if I did not miss it, no comparison of kinetics with other techniques, such as electrophysiology, nor references to eventual pioneer time-resolved studies are provided.

      Altogether, in my view, an updated version would benefit from insisting on every aspect of the methodological development. I may well be wrong, but I see this paper more like a milestone on sample prep for cryoEM imaging than being about the details of the ELIC conformations.

    1. eLife Assessment

      This valuable study highlights the potential of combining immunotherapy for pMMR CRC by selecting suitable cases and demonstrating that Gamma Knife SBRT with tislelizumab provides a safe and effective later-line treatment option for patients with pMMR/MSS/MSI-L mCRC unresponsive to standard chemotherapy. The authors employed a robust experimental design and rigorous statistical analyses to ensure the reliability of their findings. Their results offer convincing evidence to support the clinical value of this combined therapeutic approach.

    2. Reviewer #1 (Public review):

      Summary:

      This study presents compelling evidence for a novel treatment approach in a challenging patient population with MSS/pMMR mCRC, where traditional immunotherapy has often fallen short. The combination of SBRT and tislelizumab not only yielded a high disease control rate but also indicated significant improvements in the tumor's immune landscape. The safety profile appears favorable, which is crucial for patients who have already undergone multiple lines of therapy.

      Strengths:

      The results underscore the potential of leveraging radiation therapy to enhance the effectiveness of immunotherapy, especially in tumor environments previously deemed hostile to immune interventions. Future research should focus on larger cohorts to validate these findings and explore the underlying mechanisms of immune modulation post-treatment.

      Weaknesses:

      I believe the author's work is commendable and should be considered with some minor modifications:

      (1) While the author categorized patients based on the type of RAS mutation and the location of colorectal cancer metastasis, the article does not adequately address how these classifications influence treatment outcomes. Such as whether KRAS or NRAS mutations, as well as the type of metastatic lesions, affect the sensitivity to gamma-ray treatment and lead to varying responses.

      (2) In Figure 2, clarification is needed on how the author differentiated between on-target and off-target lesions. I observed that some images depicted both lesion types at the same level, which could lead to confusion.

      (3) The author performed only a basic difference analysis. A more comprehensive analysis, including calculations of markers related to treatment efficacy, could offer additional insights for clinical practice.

      (4) The transcriptome sequencing analysis provides insights into how stereotactic radiotherapy sensitizes immunotherapy; however, it currently relies on a simple pre- and post-treatment group comparison. It would be beneficial to include additional subgroups to explore more nuanced findings.

      (5) The author briefly discusses the effects of changes in tumor fibrosis and angiogenesis on treatment outcomes. Further experiments may be necessary to validate these findings and investigate the underlying mechanisms of immune regulation following treatment.

    3. Reviewer #2 (Public review):

      Summary:

      This Phase II clinical trial investigates the combination of Gamma Knife Stereotactic Body Radiation Therapy (SBRT) with Tislelizumab for the treatment of metastatic colorectal cancer (mCRC) in patients with proficient mismatch repair (pMMR). The study addresses a critical clinical challenge in the management of pMMR CRC, focusing on the selection of appropriate candidates. The results suggest that the combination of Gamma Knife SBRT and Tislelizumab provides a safe and potent treatment option for patients with pMMR/MSS/MSI-L mCRC who have become refractory to first- and second-line chemotherapy. The study design is rigorous, and the outcomes are promising.

      Advantage:

      The trial design was meticulously structured, and appropriate statistical methods were employed to rigorously analyze the results. Bioinformatics approaches were utilized to further elucidate alterations in the patient's tumor microenvironment and to explore the underlying factors contributing to the observed differences in treatment efficacy. The conclusions drawn from this trial offer valuable insights for managing advanced colorectal cancer in patients who have not responded to first- and second-line therapies.

      Weakness:

      (1) Clarity and Structure of the Abstract<br /> - Results Section: The results section should contain important data, I suggest some important sequencing data should be shown to enhance understanding.<br /> (2) As the author using the NanoString assay for transcriptome analysis, more detail should be shown such as the version of R, and the bioinformatics analysis methods.<br /> (3) It is interesting for included patients that PD-L1 increase expression after Gamma Knife Stereotactic Body Radiation Therapy (SBRT) treatment, How to explain it?<br /> (4) It would be helpful to include a brief discussion of the limitations of the study, such as sample size constraints and their impact on the generalizability of the results. This will give readers a more comprehensive understanding of the findings.<br /> (5) Language Accuracy: There are a few instances where wording could be more professional or precise.

    4. Author response:

      We would like to express our sincere gratitude to the editor and reviewers for their thoughtful comments and suggestions on our manuscript. Below is our interim response to the reviewers’ public review:

      Reviewer 1:

      (1) We appreciate the reviewer’s insightful comment on the consideration of RAS mutation type and lesion metastasis site in our study. We will undertake a more comprehensive review of the literature and conduct a detailed analysis to assess how these factors influence treatment efficacy in our cohort.

      (2) Regarding the radiotherapy planning process, we will provide further clarification in the revised manuscript. Specifically, we select the target lesion using CT imaging and delineate it by marking the 50% isodose line to define the planning target volume (PTV). In assessing treatment efficacy, we differentiate between target lesions (within the PTV) and off-target lesions (outside the PTV). We will update the figures to include the isodose line display for better clarity.

      (3 & 4) We acknowledge the limitations of our study, particularly with respect to the sample size, which may hinder the statistical power required for a comprehensive analysis of treatment effect markers and subgroup variations. Nonetheless, we will continue to refine our analyses in the revised manuscript to provide additional insights and strengthen the conclusions where possible.

      (5) During the early stages of our research, our team conducted a series of investigations into the impact of tumor fibrosis and angiogenesis on treatment outcomes. We have accumulated a substantial body of data, and we will summarize these findings in the revised manuscript to provide further context and support for our current study.

      Reviewer 2:

      (1, 4 & 5) We greatly appreciate the reviewer’s careful reading of the manuscript. We will revise the abstract, methods, and results sections to improve clarity and precision. Additionally, we will refine the overall wording of the manuscript to enhance its scientific rigor and professionalism.

      (2) We also appreciate the reviewer’s suggestions regarding the methods and results. These will be incorporated into the revised manuscript, with additional detail in the methods section to clarify our experimental approach and strengthen the discussion of our findings.

      (3) This is an intriguing point raised by the reviewer. We agree that the upregulation of PD-L1 expression following SBRT treatment could potentially enhance the efficacy of subsequent immunotherapy. To explore this further, we will conduct a detailed literature review and provide a more in-depth analysis of our data to elucidate the underlying mechanisms.

      We trust that the clarifications provided above partially address the reviewers' concerns. We are committed to fully resolving the raised issues through more comprehensive revisions in the subsequent manuscript update.

    1. eLife Assessment

      This important work supports the role of breast carcinoma amplified sequence 2 (Bcas2) in positively regulating primitive wave hematopoiesis through amplification of beta-catenin-dependent (canonical) Wnt signaling. The study is convincing: it uses appropriate and validated methodology in line with the current state-of-the-art, and there is a first-rate analysis of a strong phenotype with highly supportive mechanistic data. The findings shed light on the controversial question of whether, when, and how canonical Wnt signaling may be involved in hematopoietic development. The work will be of interest to hematologists and developmental biologists.

    2. Reviewer #1 (Public review):

      Summary:

      In this manuscript, Ning et al. reported that Bcas2 played an indispensable role in zebrafish primitive hematopoiesis via sequestering β-catenin in the nucleus. The authors showed that loss of Bcas2 caused primitive hematopoietic defects in zebrafish. They unraveled that Bcas2 deficiency promoted β-catenin nuclear export via a CRM1-dependent manner in vivo and in vitro. They further validated that BCAS2 directly interacted with β-catenin in the nucleus and enhanced β-catenin accumulation through its CC domains. They unveil a novel insight into Bcas2, which is critical for zebrafish primitive hematopoiesis via regulating nuclear β-catenin stabilization rather than its canonical pre-mRNA splicing functions. Overall, the study is impressive and well-performed, although there are also some issues to address.

      Strengths:

      The study unveils a novel function of Bcas2, which is critical for zebrafish primitive hematopoiesis by sequestering β-catenin. The authors validated the results in vivo and in vitro. Most of the figures are clear and convincing. This study nicely complements the function of Bcas2 in primitive hematopoiesis.

      Comments on revisions:

      The authors have nicely answered all my questions, I have no problem.

    3. Reviewer #2 (Public review):

      Summary:

      Ning and colleagues present studies supporting a role for breast carcinoma amplified sequence 2 (Bcas2) in positively regulating primitive wave hematopoiesis through amplification of beta-catenin-dependent (canonical) Wnt signaling. The authors present compelling evidence that zebrafish bcas2 is expressed at the right time and place to be involved in primitive hematopoiesis, that there are primitive hematopoietic defects in hetero- and homozygous mutant and knockdown embryos, that Bcas2 mechanistically positively regulates canonical Wnt signaling, and that Bcas2 is required for nuclear retention of B-cat through physical interaction involving armadillo repeats 9-12 of B-cat and the coiled-coil domains of Bcas2. Overall, the data and writing are clean, clear, and compelling. This study is a first rate analysis of a strong phenotype with highly supportive mechanistic data. The findings shed light on the controversial question of whether, when, and how canonical Wnt signaling may be involved in hematopoietic development.

      In the revised version of their previous work, they have included responses to some of our suggestions for minor experiments and edits. We previously suggested they examine the structural compatibility of a Bcas2/beta-catenin dimer with binding to the DNA-binding protein Tcf7l1 (previously Tcf3), which would be expected for a beta-catenin nuclear-retention factor that potentiates canonical Wnt signaling responses. Although the authors did not test compatibility of Bcas2 with Tcf3 binding to beta-catenin, they show that a three-way complex with the family member Tcf4 is possible (Fig. S12), which suggests that Lef/Tcf family binding in general is plausible.

      The authors' acceptance of our suggestion to evaluate cdx and hox gene expression is welcome, as these genes have previously been defined as canonical Wnt targets (Lengerke et al., 2009) that regionalize the lateral plate mesoderm (LPM) and confer pre-hematopoietic identity there (Davidson et al., 2003; Davidson and Zon, 2004). The authors' finding that cdx4 and hoxa9a are diminished in the bcas2 mutants (Fig. S7) validates this suggestion and seem to imply that the primary defect here is specification of the early hematopoietic field in the LPM, however the results are a little confusing or surprising given that scl - which is unaffected in the bcas2 mutant (Fig. 2A) - is a downstream target of Cdx4 (Davidson et al., 2003, Fig. 1b, 3d). The results in the current submission imply that early maintenance of pre-hematopoietic competence in the LPM is a canonical-Wnt-directed phenomenon separable from the earliest specification of the hematopoietic field. We believe it would be of value to further evaluate regulation of cdx1, which has been shown to cooperate with cdx4 in regulation of the LPM hematopoietic field, as well as analyze some of the putative downstream hox family targets.

      We previously reviewed the article as suitable for publication and we continue to support our prior assessment. The authors have presented strong data supporting a role for Bcas2 in hematopoietic development across phyla and a mechanistic involvement in promoting canonical Wnt signaling.

      Strengths:

      (1) The study features clear and compelling phenotypes and results.<br /> (2) The manuscript narrative exposition and writing are clear and compelling.<br /> (3) The authors have attended to important technical nuances sometimes overlooked, for example, focusing on different pools of cytosolic or nuclear b-catenin.<br /> (4) The study sheds light on a controversial subject: regulation of hematopoietic development by canonical Wnt signaling and presents clear evidence of a role.<br /> (5) The authors present evidence of phylogenetic conservation of the pathway.

    4. Reviewer #3 (Public review):

      Summary:

      This manuscript utilized zebrafish bcas2 mutants to study the role of bcas2 in primitive hematopoiesis, and further confirms that it has a similar function in mice. Moreover, they showed that bcas2 regulates the transition of hematopoietic differentiation from angioblasts via activating Wnt signaling. By performing a series of biochemical experiments, they also showed that bcas2 accomplishes this by sequestering b-catenin within the nucleus, rather than through its known function in pre-mRNA splicing.

      Strengths:

      The work is well-performed, and the manuscript is well-written.

      Comments on revisions:

      The revised manuscript is substantially improved, and all my previous questions are now well addressed.

    5. Author response:

      The following is the authors’ response to the original reviews

      Reviewer #1 (Public Review):

      Summary:

      In this manuscript, Ning et al. reported that Bcas2 played an indispensable role in zebrafish primitive hematopoiesis via sequestering β-catenin in the nucleus. The authors showed that loss of Bcas2 caused primitive hematopoietic defects in zebrafish. They unraveled that Bcas2 deficiency promoted β-catenin nuclear export via a CRM1-dependent manner in vivo and in vitro. They further validated that BCAS2 directly interacted with β-catenin in the nucleus and enhanced β-catenin accumulation through its CC domains. They unveil a novel insight into Bcas2, which is critical for zebrafish primitive hematopoiesis via regulating nuclear β-catenin stabilization rather than its canonical pre-mRNA splicing functions. Overall, the study is impressive and well-performed, although there are also some issues to address.

      Strengths:

      The study unveils a novel function of Bcas2, which is critical for zebrafish primitive hematopoiesis by sequestering β-catenin. The authors validated the results in vivo and in vitro. Most of the figures are clear and convincing. This study nicely complements the function of Bcas2 in primitive hematopoiesis.

      Weaknesses:

      A portion of the figures were over-exposed.

      Thank you for the time reviewing our manuscript. We agree with your suggestion and the exposure of Figure 5C and Figure 7E has been reduced. We hope that the revisions will meet your expectation.

      Reviewer #2 (Public Review):

      Summary:

      Ning and colleagues present studies supporting a role for breast carcinoma amplified sequence 2 (Bcas2) in positively regulating primitive wave hematopoiesis through amplification of beta-catenin-dependent (canonical) Wnt signaling. The authors present compelling evidence that zebrafish bcas2 is expressed at the right time and place to be involved in primitive hematopoiesis, that there are primitive hematopoietic defects in hetero- and homozygous mutant and knockdown embryos, that Bcas2 mechanistically positively regulates canonical Wnt signaling, and that Bcas2 is required for nuclear retention of B-cat through physical interaction involving armadillo repeats 9-12 of B-cat and the coiled-coil domains of Bcas2. Overall, the data and writing are clean, clear, and compelling. This study is a first-rate analysis of a strong phenotype with highly supportive mechanistic data. The findings shed light on the controversial question of whether, when, and how canonical Wnt signaling may be involved in hematopoietic development. We detail some minor concerns and questions below, which if answered, we believe would strengthen the overall story and resolve some puzzling features of the phenotype. Notwithstanding these minor concerns, we believe this is an exceptionally well-executed and interesting manuscript that is likely suitable for publication with minor additional experimental detail and commentary.

      Strengths:

      (1) The study features clear and compelling phenotypes and results.

      (2) The manuscript narrative exposition and writing are clear and compelling.

      (3) The authors have attended to important technical nuances sometimes overlooked, for example, focusing on different pools of cytosolic or nuclear b-catenin.

      (4) The study sheds light on a controversial subject: regulation of hematopoietic development by canonical Wnt signaling and presents clear evidence of a role.

      (5) The authors present evidence of phylogenetic conservation of the pathway.

      Weaknesses:

      (1) The authors present compelling data that Bcas2 regulates nuclear retention of B-cat through physical association involving binding between the Bcas2 CC domains and B-cat arm repeats 9-12. Transcriptional activation of Wnt target genes by B-cat requires physical association between B-cat and Tcf/Lef family DNA binding factors involving key interactions in Arm repeats 2-9 (Graham et al., Cell 2000). Mutually exclusive binding by B-cat regulatory factors, such as ICAT that prevent Tcf-binding is a documented mechanism (e.g. Graham et al., Mol Cell 2002). It would appear - based on the arm repeat usage by Bcas2 (repeats 9-12)-that Bcas2 and Tcf binding might not be mutually exclusive, which would support their model that Bcas2 physical association with B-cat to retain it in the nucleus would be compatible with co-activation of genes by allowing association with Tcf. It might be nice to attempt a three-way co-IP of these factors showing that B-cat can still bind Tcf in the presence of Bcas2, or at least speculate on the plausibility of the three-way interaction.

      We appreciate your assessment and generous comments for the manuscript. As you mentioned, the binding sites for TCF on β-catenin almost do not overlap with those for BCAS2. It is likely that BCAS2-mediated nuclear sequestration of β-catenin would be compatible with the initiation of gene transcription by allowing TCF to associate with β-catenin. To test this possibility, we have taken your suggestion and performed co-IP assays. The results showed that β-catenin still bound with TCF4 in the presence of BCAS2 (Supplemental Figure 12), confirming that the binding of BCAS2 to β-catenin would not interfere with the formation of β-catenin/TCF complex.

      (2) A major way that canonical Wnt signaling regulates hematopoietic development is through regulation of the LPM hematopoietic competence territories by activating expression of cdx1a, cdx4, and their downstream targets hoxb5a and hoxa9a (Davidson et al., Nature 2003; Davidson et al., Dev Biol 2006; Pilon et al., Dev Biol 2006; Wang et al., PNAS 2008). Could the authors assess (in situ) the expression of cdx1a, cdx4, hoxb5a, and hoxa9a in the bcas2 mutants?

      We agree with your suggestion and have examined the expression of cdx4 and hoxa9a by performing WISH. Diminished expression of cdx4 and hoxa9a was detected in the lateral plate mesoderm of bcas2<sup>+/-</sup> embryos at the 6-somite stage (Supplemental Figure 7).

      (3) The authors show compellingly that even heterozygous loss of bcas2 has strong Wnt-inhibitory effects. If Bcas2 is required for canonical Wnt signaling and bcas2 is expressed ubiquitously from the 1-cell stage through at least the beginning of gastrulation, why do bcas2 KO embryos not have morphological axis specification defects consistent with loss of early Wnt signaling, like loss of head (early), or brain anteriorization (later)? Could the authors provide some comments on this puzzle? Or if they do see any canonical Wnt signaling patterning defects in het- or homozygous embryos, could they describe and/or present them?

      You have raised an interesting question. In fact, we did not observe ventralization or axis determination defects in the early embryos of bcas2<sup>+/-</sup> mutants. Even in the very small number of homozygous mutant embryos, we did not find such morphological defects. Given that the homozygous and heterozygous mutant embryos were derived from crossing bcas2<sup>+/-</sup> males with bcas2<sup>+/-</sup> females, maternal Bcas2 might still remain and function in these embryos during gastrulation when axis determination and neural patterning took place. Accordingly, we have expanded our discussion to incorporate these insights (Line 565-572).

      Reviewer #3 (Public Review):

      Summary:

      This manuscript utilized zebrafish bcas2 mutants to study the role of bcas2 in primitive hematopoiesis and further confirms that it has a similar function in mice. Moreover, they showed that bcas2 regulates the transition of hematopoietic differentiation from angioblasts via activating Wnt signaling. By performing a series of biochemical experiments, they also showed that bcas2 accomplishes this by sequestering b-catenin within the nucleus, rather than through its known function in pre-mRNA splicing.

      Strengths:

      The work is well-performed, and the manuscript is well-written.

      Weaknesses:

      Several issues need to be clarified.

      (1) Is wnt signaling also required during hematopoietic differentiation from angioblasts? Can the authors test angioblast and endothelial markers in embryos with wnt inhibition? Also, can the authors add export inhibitor LMB to the mouse mutants to test if sequestering of b-catenin by bcas2 is conserved during primitive hematopoiesis in mice?

      Thank you very much for your appreciation and detailed assessment. To test whether Wnt signaling is also required during hematopoietic differentiation from angioblasts, wild-type embryos were exposed to 10 µM CCT036477, a small molecule β-catenin antagonist, from 9 hpf and then collected for WISH experiments. As shown in Supplemental Figure 8, the expression of hemangioblast markers npas4l, scl, and gata2 and endothelial marker fli1a remained unchanged, but the expression of erythroid progenitor marker gata1 was significantly reduced. These results suggest that canonical Wnt pathway may not be required for the generation of hemangioblasts or their endothelial differentiation, but is pivotal for their hematopoietic differentiation.

      It is quite difficult to validate the conserve role of BCAS2 during primitive hematopoiesis in mice, because the toxicity of LMB may cause severe adverse effects in mice.[1,2]

      (2) Bcas2 is required for primitive myelopoiesis in ALM. Does bcas2 play a similar function in primitive myelopoiesis, or is bcas2/b-catenin interaction more important for hematopoietic differentiation in PLM?

      You have raised an important question. In our study, we have demonstrated that the expression of myeloid progenitor marker pu.1 was significantly decreased in bcas2 mutants, hinting that Bcas2 is pivotal for primitive myelopoiesis. To further clarify the function of Bcas2 in primitive myelopoiesis, we injected 8 ng of bcas2 morpholino into Tg(coro1a:GFP) embryos at the 1-cell stage and examined β-catenin distribution at 17 hpf via immunostaining. We observed a significant decline of nuclear β-catenin in primitive myeloid cells (Supplemental Figure 9), indicating that Bcas2 is highly likely to play a similar role in sequestering β-catenin within the nucleus during primitive myelopoiesis.

      (3) Is it possible that CC1-2 fragment sequester b-catenin? The different phenotypes between this manuscript and the previous article (Yu, 2019) may be due to different mutations in bcas2. Is it possible that the bcas2 mutation in Yu's article produces a complete CC1-2 fragment, which might sequester b-catenin?

      This is an interesting perspective. To test the possibility that CC1-2 sequesters β-catenin, mRNA expressing the CC domains of BCAS2 has been co-injected with bcas2 morpholino into Tg(gata1:GFP) embryo at the one-cell stage. Increased nuclear β-catenin levels were detected in the GFP-positive hematopoietic progenitor cells at 16 hpf (Supplemental Figure 11). Our findings support that CC1-2 fragment of BCAS2 can sequester β-catenin within the nucleus.

      In the previous article (Yu, 2019), a deletion 5 bases mutation in the third exon of BCAS2 was produced by TALEN, therefore the CC domains of this mutant should be affected. It is difficult to conclude that the mutant BCAS2 protein in Yu’s study still remains association with β-catenin.

      (4) Can the author clarify what embryos the arrows point to in SI Figure 2D? In SI Figure 6B and B', can the author clarify how the nucleus and cytoplasm are bleached? In B, the nucleus also appears to be bleached.

      Thank you for your query and suggestion. In our revisions, the corresponding clarifications have been supplemented (Line 239-242; Line 978-979).

      We acknowledge that the nuclei in both the BCAS2 overexpression group and control group were slightly bleached. Given that we have performed real-time analysis for fluorescent recovery after photobleaching, and we have observed a much slower recovery of cytoplasmic fluorescence in BCAS2 overexpressed cells, the conclusion that BCAS2 inhibits the nuclear export of β-catenin but not its nuclear import, remains changed.

      Reviewer #1 (Recommendations For The Authors):

      Major concerns:

      (1) In this study, the authors detected β-catenin distribution in erythrocytes (gata1-GFP+ cells). Estimating the β-catenin distribution in the myeloid cells is recommended.

      Thank you for your assessment and we have taken your suggestion. Tg(coro1a:GFP) embryos, which is commonly used to track both macrophages and neutrophils,[3] were injected with 8 ng of bcas2 morpholino into at the 1-cell stage and collected for immunostaining to examine the β-catenin distribution at 17 hpf. We observed a significant decline of nuclear β-catenin in primitive myeloid cells (Supplemental Figure 9). This result indicates that Bcas2 is highly likely to play a similar role in sequestering β-catenin within the nucleus during primitive myelopoiesis.

      (2) The reduced nuclear localization of β-catenin in Figure 3H required further evidence. It would be helpful if the authors quantified the fluorescence intensity in the cell nucleus and cytoplasm. Meanwhile, the figures (Figure 5C, Figure 7E) were over-exposed. Please validate these figures.

      Thank you for your suggestions. We agree with you that the fluorescence intensity of β-catenin in the nucleus and cytoplasm should be quantified. However, as the nucleus comprises a large part of the cell, we believe it would be more appropriate to quantify the relative fluorescence intensity by dividing the fluorescence intensity of nuclear β-catenin by the fluorescence intensity of DAPI.

      Such quantifications have been added for Figure 3G, 5C, 7E, S9A, and S13A. In addition, we have reduced the exposure of Figure 5C and Figure 7E. We hope that you will be satisfied with the revisions.

      (3) The authors used cKO mice to validate that the erythrocytes were eliminated. It would be interesting to detect β-catenin distribution by immunofluorescent staining in primitive hematopoietic cells in cKO mice. Addressing this issue can provide further evidence to support the conservation of Bcas2.

      We appreciate your suggestion. However, we found that red blood cells were almost eliminated in the yolk sac of Bcas2<sup>F/F</sup>;Flk1-Cre mice at E12.5. It is difficult to further detect β-catenin distribution in primitive erythroid cells in these mice.

      (4) The authors discovered that Bcas2 mediated β-catenin nuclear export in a CRM1-dependent manner. CRM1 is a key regulator involved in the majority of factors of nuclear export via recognizing specific nuclear export signals (NES). Validating the NES of Bcas2 is recommended. Furthermore, I wonder about the relationship between Bcas2 and CRM1 in regulating β-catenin nuclear export. One possibility is that Bcas2 covers the NES to inhibit the interaction between CRM1 and β-catenin, thus leading to β-catenin accumulation in the cell nucleus. The authors should discuss this possibility accordingly.

      Thank you for providing an interesting perspective. CRM1-mediated nuclear export of β-catenin usually requires CRM1 recognition and binding with the NES sequences in chaperon proteins, such as APC, Axin and Chibby.[4-6] Moreover, CRM1 can bind directly to and function as an efficient nuclear exporter for β-catenin.[7] Since BCAS2 has not been reported to contain any recognizable NES sequences, it will be interesting to investigate whether BCAS2 competitively inhibits β-catenin from associating with CRM1, or with the chaperone proteins. We have rewritten the discussion on CRM1-dependent nuclear export of β-catenin in line with your comments (Line 572-578).

      (5) It would be interesting if the authors could answer the specificity in Bcas2-mediated protein nuclear export pathway. The authors should detect other classical factors (CRM1 mediated) distribution when loss of Bcas2.

      Thank you for bringing up this point. To test whether BCAS2 specifically regulates CRM1-mediated nuclear export of β-catenin, we have investigated the nucleocytoplasmic distribution of other known CRM1 cargoes, such as ATG3 and CDC37L.[8] BCAS2 overexpression in HeLa cells slightly enhanced the nuclear localization of CDC37L, and had no significant impact on that of ATG3 (Supplemental Figure 11), indicating the specificity of BCAS2 in the regulation of CRM1-dependent nuclear export of β-catenin.

      Minor concerns:

      (1) The name "bcas2Δ7+/- and bcas2Δ14+/-" should be changed into "bcas2+/Δ7 and bcas2+/Δ14"(+/Δ7 or +/Δ14 should be superior on the right).

      Thank you for your suggestion. We have changed the names of the mutants throughout the manuscript.

      (2) The scale bar position in the figures should be unified.

      We agree with your suggestion and have unified the scale bar position in all figures.

      (3) In Figure 4E, "Nuclear" should be changed into "Nucleus".

      We apologize for the mistake and Figure 4E has been revised.

      (4) There are some unaesthetic issues in the figures. The figures need to be further edited. Figure 3H "β-catenin and Merge", Figure 4D "Merge". All these words should be centered in the figures.

      Thank you. We have edited all the figures to ensure that the text is centered.

      Reviewer #2 (Recommendations For The Authors):

      (1) It would be nice to have whole blot images for the Westerns in Supplementary Info.

      Thank you for your suggestion. Whole images for immunoblotting have been supplemented as Source data.

      (2) Line 292 change 5 hpf to 5 dpf.

      (3) Line 301 change "primary" to "primitive"?

      We apologize for the mistakes. We have incorporated these suggestions in the revised manuscript and reexamined spelling throughout the paper.

      (4) Figure S2C: is "Maker" a typographical error? Change to "ladder"?

      We apologize for this typographical error and we have revised it in Figure S2C.

      Reference

      (1) Ishizawa J, Kojima K, Hail N, Tabe Y, Andreeff M. Expression, function, and targeting of the nuclear exporter chromosome region maintenance 1 (CRM1) protein. Pharmacology & Therapeutics. 2015;153:25-35.

      (2) Li X, Feng Y, Yan MF, et al. Inhibition of Autism-Related Crm1 Disrupts Mitosis and Induces Apoptosis of the Cortical Neural Progenitors. Cerebral Cortex. 2020;30(7):3960-3976.

      (3) Li L, Yan B, Shi YQ, Zhang WQ, Wen ZL. Live Imaging Reveals Differing Roles of Macrophages and Neutrophils during Zebrafish Tail Fin Regeneration. Journal of Biological Chemistry. 2012;287(30):25353-25360.

      (4) Neufeld KL, Nix DA, Bogerd H, et al. Adenomatous polyposis coli protein contains two nuclear export signals and shuttles between the nucleus and cytoplasm. Proceedings of the National Academy of Sciences of the United States of America. 2000;97(22):12085-12090.

      (5) Li FQ, Mofunanya A, Harris K, Takemaru KI. Chibby cooperates with 14-3-3 to regulate β-catenin subcellular distribution and signaling activity. Journal of Cell Biology. 2008;181(7):1141-1154.

      (6) Cong F, Varmus H. Nuclear-cytoplasmic shuttling of Axin regulates subcellular localization of β-catenin. Proceedings of the National Academy of Sciences of the United States of America. 2004;101(9):2882-2887.

      (7) Ki H, Oh M, Chung SW, Kim K. β-Catenin can bind directly to CRM1 independently of adenomatous polyposis coli, which affects its nuclear localization and LEF-1/β-catenin-dependent gene expression. Cell Biology International. 2008;32(4):394-400.

      (8) Kirli K, Karaca S, Dehne HJ, et al. A deep proteomics perspective on CRM1-mediated nuclear export and nucleocytoplasmic partitioning. Elife. 2015;4.

    1. Author response:

      The following is the authors’ response to the original reviews.

      Public Reviews:

      Reviewer #1 (Public Review):

      Summary:

      Using a cross-modal sensory selection task in head-fixed mice, the authors attempted to characterize how different rules reconfigured representations of sensory stimuli and behavioral reports in sensory (S1, S2) and premotor cortical areas (medial motor cortex or MM, and ALM). They used silicon probe recordings during behavior, a combination of single-cell and population-level analyses of neural data, and optogenetic inhibition during the task.

      Strengths:

      A major strength of the manuscript was the clarity of the writing and motivation for experiments and analyses. The behavioral paradigm is somewhat simple but well-designed and wellcontrolled. The neural analyses were sophisticated, clearly presented, and generally supported the authors' interpretations. The statistics are clearly reported and easy to interpret. In general, my view is that the authors achieved their aims. They found that different rules affected preparatory activity in premotor areas, but not sensory areas, consistent with dynamical systems perspectives in the field that hold that initial conditions are important for determining trial-based dynamics.

      Weaknesses:

      The manuscript was generally strong. The main weakness in my view was in interpreting the optogenetic results. While the simplicity of the task was helpful for analyzing the neural data, I think it limited the informativeness of the perturbation experiments. The behavioral read-out was low dimensional -a change in hit rate or false alarm rate- but it was unclear what perceptual or cognitive process was disrupted that led to changes in these read-outs. This is a challenge for the field, and not just this paper, but was the main weakness in my view. I have some minor technical comments in the recommendations for authors that might address other minor weaknesses.

      I think this is a well-performed, well-written, and interesting study that shows differences in rule representations in sensory and premotor areas and finds that rules reconfigure preparatory activity in the motor cortex to support flexible behavior.

      Reviewer #2 (Public Review):

      Summary:

      Chang et al. investigate neuronal activity firing patterns across various cortical regions in an interesting context-dependent tactile vs visual detection task, developed previously by the authors (Chevee et al., 2021; doi: 10.1016/j.neuron.2021.11.013). The authors report the important involvement of a medial frontal cortical region (MM, probably a similar location to wM2 as described in Esmaeili et al., 2021 & 2022; doi: 10.1016/j.neuron.2021.05.005; doi: 10.1371/journal.pbio.3001667) in mice for determining task rules.

      Strengths:

      The experiments appear to have been well carried out and the data well analysed. The manuscript clearly describes the motivation for the analyses and reaches clear and well-justified conclusions. I find the manuscript interesting and exciting!

      Weaknesses:

      I did not find any major weaknesses.

      Reviewer #3 (Public Review):

      This study examines context-dependent stimulus selection by recording neural activity from several sensory and motor cortical areas along a sensorimotor pathway, including S1, S2, MM, and ALM. Mice are trained to either withhold licking or perform directional licking in response to visual or tactile stimulus. Depending on the task rule, the mice have to respond to one stimulus modality while ignoring the other. Neural activity to the same tactile stimulus is modulated by task in all the areas recorded, with significant activity changes in a subset of neurons and population activity occupying distinct activity subspaces. Recordings further reveal a contextual signal in the pre-stimulus baseline activity that differentiates task context. This signal is correlated with subsequent task modulation of stimulus activity. Comparison across brain areas shows that this contextual signal is stronger in frontal cortical regions than in sensory regions. Analyses link this signal to behavior by showing that it tracks the behavioral performance switch during task rule transitions. Silencing activity in frontal cortical regions during the baseline period impairs behavioral performance.

      Overall, this is a superb study with solid results and thorough controls. The results are relevant for context-specific neural computation and provide a neural substrate that will surely inspire follow-up mechanistic investigations. We only have a couple of suggestions to help the authors further improve the paper.

      (1) We have a comment regarding the calculation of the choice CD in Fig S3. The text on page 7 concludes that "Choice coding dimensions change with task rule". However, the motor choice response is different across blocks, i.e. lick right vs. no lick for one task and lick left vs. no lick for the other task. Therefore, the differences in the choice CD may be simply due to the motor response being different across the tasks and not due to the task rule per se. The authors may consider adding this caveat in their interpretation. This should not affect their main conclusion.

      We thank the Reviewer for the suggestion. We have discussed this caveat and performed a new analysis to calculate the choice coding dimensions using right-lick and left-lick trials (Fig. S3h) on page 8. 

      “Choice coding dimensions were obtained from left-lick and no-lick trials in respond-to-touch blocks and right-lick and no-lick trials in respond-to-light blocks. Because the required lick directions differed between the block types, the difference in choice CDs across task rules (Fig. S4f) could have been affected by the different motor responses. To rule out this possibility, we did a new version of this analysis using right-lick and left-lick trials to calculate the choice coding dimensions for both task rules. We found that the orientation of the choice coding dimension in a respond-to-touch block was still not aligned well with that in a respond-to-light block (Fig. S4h;  magnitude of dot product between the respond-to-touch choice CD and the respond-to-light choice CD, mean ± 95% CI for true vs shuffled data: S1: 0.39 ± [0.23, 0.55] vs 0.2 ± [0.1, 0.31], 10 sessions; S2: 0.32 ± [0.18, 0.46] vs 0.2 ± [0.11, 0.3], 8 sessions; MM: 0.35 ± [0.21, 0.48] vs 0.18 ± [0.11, 0.26], 9 sessions; ALM: 0.28 ± [0.17, 0.39] vs 0.21 ± [0.12, 0.31], 13 sessions).”

      We also have included the caveats for using right-lick and left-lick trials to calculate choice coding dimensions on page 13.

      “However, we also calculated choice coding dimensions using only right- and left-lick trials. In S1, S2, MM and ALM, the choice CDs calculated this way were also not aligned well across task rules (Fig. S4h), consistent with the results calculated from lick and no-lick trials (Fig. S4f). Data were limited for this analysis, however, because mice rarely licked to the unrewarded water port (# of licksunrewarded port  / # of lickstotal , respond-to-touch: 0.13, respond-to-light: 0.11). These trials usually came from rule transitions (Fig. 5a) and, in some cases, were potentially caused by exploratory behaviors. These factors could affect choice CDs.”

      (2) We have a couple of questions about the effect size on single neurons vs. population dynamics. From Fig 1, about 20% of neurons in frontal cortical regions show task rule modulation in their stimulus activity. This seems like a small effect in terms of population dynamics. There is somewhat of a disconnect from Figs 4 and S3 (for stimulus CD), which show remarkably low subspace overlap in population activity across tasks. Can the authors help bridge this disconnect? Is this because the neurons showing a difference in Fig 1 are disproportionally stimulus selective neurons?

      We thank the Reviewer for the insightful comment and agree that it is important to link the single-unit and population results. We have addressed these questions by (1) improving our analysis of task modulation of single neurons  (tHit-tCR selectivity) and (2) examining the relationship between tHit-tCR selective neurons and tHit-tCR subspace overlaps.  

      Previously, we averaged the AUC values of time bins within the stimulus window (0-150 ms, 10 ms bins). If the 95% CI on this averaged AUC value did not include 0.5, this unit was considered to show significant selectivity. This approach was highly conservative and may underestimate the percentage of units showing significant selectivity, particularly any units showing transient selectivity. In the revised manuscript, we now define a unit as showing significant tHit-tCR selectivity when three consecutive time bins (>30 ms, 10ms bins) of AUC values were significant. Using this new criterion, the percentage of tHittCR selective neurons increased compared with the previous analysis. We have updated Figure 1h and the results on page 4:

      “We found that 18-33% of neurons in these cortical areas had area under the receiver-operating curve (AUC) values significantly different from 0.5, and therefore discriminated between tHit and tCR trials (Fig. 1h; S1: 28.8%, 177 neurons; S2: 17.9%, 162 neurons; MM: 32.9%, 140 neurons; ALM: 23.4%, 256 neurons; criterion to be considered significant: Bonferroni corrected 95% CI on AUC did not include 0.5 for at least 3 consecutive 10-ms time bins).”

      Next, we have checked how tHit-tCR selective neurons were distributed across sessions. We found that the percentage of tHit-tCR selective neurons in each session varied (S1: 9-46%, S2: 0-36%, MM:25-55%, ALM:0-50%). We examined the relationship between the numbers of tHit-tCR selective neurons and tHit-tCR subspace overlaps. Sessions with more neurons showing task rule modulation tended to show lower subspace overlap, but this correlation was modest and only marginally significant (r= -0.32, p= 0.08, Pearson correlation, n= 31 sessions). While we report the percentage of neurons showing significant selectivity as a simple way to summarize single-neuron effects, this does neglect the magnitude of task rule modulation of individual neurons, which may also be relevant. 

      In summary, the apparent disconnect between the effect sizes of task modulation of single neurons and of population dynamics could be explained by (1) the percentages of tHit-tCR selective neurons were underestimated in our old analysis, (2) tHit-tCR selective neurons were not uniformly distributed among sessions, and (3) the percentages of tHit-tCR selective neurons were weakly correlated with tHit-tCR subspace overlaps. 

      Recommendations for the authors:

      Reviewer #1 (Recommendations For The Authors):

      For the analysis of choice coding dimensions, it seems that the authors are somewhat data limited in that they cannot compare lick-right/lick-left within a block. So instead, they compare lick/no lick trials. But given that the mice are unable to initiate trials, the interpretation of the no lick trials is a bit complicated. It is not clear that the no lick trials reflect a perceptual judgment about the stimulus (i.e., a choice), or that the mice are just zoning out and not paying attention. If it's the latter case, what the authors are calling choice coding is more of an attentional or task engagement signal, which may still be interesting, but has a somewhat different interpretation than a choice coding dimension. It might be worth clarifying this point somewhere, or if I'm totally off-base, then being more clear about why lick/no lick is more consistent with choice than task engagement.

      We thank the Reviewer for raising this point. We have added a new paragraph on page 13 to clarify why we used lick/no-lick trials to calculate choice coding dimensions, and we now discuss the caveat regarding task engagement.  

      “No-lick trials included misses, which could be caused by mice not being engaged in the task. While the majority of no-lick trials were correct rejections (respond-to-touch: 75%; respond-to-light: 76%), we treated no-licks as one of the available choices in our task and included them to calculate choice coding dimensions (Fig. S4c,d,f). To ensure stable and balanced task engagement across task rules, we removed the last 20 trials of each session and used stimulus parameters that achieved similar behavioral performance for both task rules (Fig. 1d; ~75% correct for both rules).”

      In addition, to address a point made by Reviewer 3 as well as this point, we performed a new analysis to calculate choice coding dimensions using right-lick vs left-lick trials. We report this new analysis on page 8:

      “Choice coding dimensions were obtained from left-lick and no-lick trials in respond-to-touch blocks and right-lick and no-lick trials in respond-to-light blocks. Because the required lick directions differed between the block types, the difference in choice CDs across task rules (Fig. S4f) could have been affected by the different motor responses. To rule out this possibility, we did a new version of this analysis using right-lick and left-lick trials to calculate the choice coding dimensions for both task rules. We found that the orientation of the choice coding dimension in a respond-to-touch block was still not aligned well with that in a respond-to-light block (Fig. S4h;  magnitude of dot product between the respond-to-touch choice CD and the respond-to-light choice CD, mean ± 95% CI for true vs shuffled data: S1: 0.39 ± [0.23, 0.55] vs 0.2 ± [0.1, 0.31], 10 sessions; S2: 0.32 ± [0.18, 0.46] vs 0.2 ± [0.11, 0.3], 8 sessions; MM: 0.35 ± [0.21, 0.48] vs 0.18 ± [0.11, 0.26], 9 sessions; ALM: 0.28 ± [0.17, 0.39] vs 0.21 ± [0.12, 0.31], 13 sessions).” 

      We added discussion of the limitations of this new analysis on page 13:

      “However, we also calculated choice coding dimensions using only right- and left-lick trials. In S1, S2, MM and ALM, the choice CDs calculated this way were also not aligned well across task rules (Fig. S4h), consistent with the results calculated from lick and no-lick trials (Fig. S4f). Data were limited for this analysis, however, because mice rarely licked to the unrewarded water port (# of licksunrewarded port  / # of lickstotal , respond-to-touch: 0.13, respond-to-light: 0.11). These trials usually came from rule transitions (Fig. 5a) and, in some cases, were potentially caused by exploratory behaviors. These factors could affect choice CDs.”

      The authors find that the stimulus coding direction in most areas (S1, S2, and MM) was significantly aligned between the block types. How do the authors interpret that finding? That there is no major change in stimulus coding dimension, despite the change in subspace? I think I'm missing the big picture interpretation of this result.

      That there is no significant change in stimulus coding dimensions but a change in subspace suggests that the subspace change largely reflects a change in the choice coding dimensions.

      As I mentioned in the public review, I thought there was a weakness with interpretation of the optogenetic experiments, which the authors generally interpret as reflecting rule sensitivity. However, given that they are inhibiting premotor areas including ALM, one might imagine that there might also be an effect on lick production or kinematics. To rule this out, the authors compare the change in lick rate relative to licks during the ITI. What is the ITI lick rate? I assume pretty low, once the animal is welltrained, in which case there may be a floor effect that could obscure meaningful effects on lick production. In addition, based on the reported CI on delta p(lick), it looks like MM and AM did suppress lick rate. I think in the future, a task with richer behavioral read-outs (or including other measurements of behavior like video), or perhaps something like a psychological process model with parameters that reflect different perceptual or cognitive processes could help resolve the effects of perturbations more precisely.

      Eighteen and ten percent of trials had at least one lick in the ITI in respond-to-touch and  respond-tolight blocks, respectively. These relatively low rates of ITI licking could indeed make an effect of optogenetics on lick production harder to observe. We agree that future work would benefit from more complex tasks and measurements, and have added the following to make this point (page 14):

      “To more precisely dissect the effects of perturbations on different cognitive processes in rule-dependent sensory detection, more complex behavioral tasks and richer behavioral measurements are needed in the future.”

      Reviewer #2 (Recommendations For The Authors):

      I have the following minor suggestions that the authors might consider in revising this already excellent manuscript :

      (1) In addition to showing normalised z-score firing rates (e.g. Fig 1g), I think it is important to show the grand-average mean firing rates in Hz.

      We thank the Reviewer for the suggestion and have added the grand-average mean firing rates as a new supplementary figure (Fig. S2a). To provide more details about the firing rates of individual neurons, we have also added to this new figure the distribution of peak responses during the tactile stimulus period (Fig. S2b).

      (2) I think the authors could report more quantitative data in the main text. As a very basic example, I could not easily find how many neurons, sessions, and mice were used in various analyses.

      We have added relevant numbers at various points throughout the Results, including within the following examples:

      Page 3: “To examine how the task rules influenced the sensorimotor transformation occurring in the tactile processing stream, we performed single-unit recordings from sensory and motor cortical areas including S1, S2, MM and ALM (Fig. 1e-g, Fig. S1a-h, and Fig. S2a; S1: 6 mice, 10 sessions, 177 neurons, S2: 5 mice, 8 sessions, 162 neurons, MM: 7 mice, 9 sessions, 140 neurons, ALM: 8 mice, 13 sessions, 256 neurons).”

      Page 5: “As expected, single-unit activity before stimulus onset did not discriminate between tactile and visual trials (Fig. 2d; S1: 0%, 177 neurons; S2: 0%, 162 neurons; MM: 0%, 140 neurons; ALM: 0.8%, 256 neurons). After stimulus onset, more than 35% of neurons in the sensory cortical areas and approximately 15% of neurons in the motor cortical areas showed significant stimulus discriminability (Fig. 2e; S1: 37.3%, 177 neurons; S2: 35.2%, 162 neurons; MM: 15%, 140 neurons; ALM: 14.1%, 256 neurons).”

      Page 6: “Support vector machine (SVM) and Random Forest classifiers showed similar decoding abilities

      (Fig. S3a,b; medians of classification accuracy [true vs shuffled]; SVM: S1 [0.6 vs 0.53], 10 sessions, S2

      [0.61 vs 0.51], 8 sessions, MM [0.71 vs 0.51], 9 sessions, ALM [0.65 vs 0.52], 13 sessions; Random

      Forests: S1 [0.59 vs 0.52], 10 sessions, S2 [0.6 vs 0.52], 8 sessions, MM [0.65 vs 0.49], 9 sessions, ALM [0.7 vs 0.5], 13 sessions).”

      Page 6: “To assess this for the four cortical areas, we quantified how the tHit and tCR trajectories diverged from each other by calculating the Euclidean distance between matching time points for all possible pairs of tHit and tCR trajectories for a given session and then averaging these for the session (Fig. 4a,b; S1: 10 sessions, S2: 8 sessions, MM: 9 sessions, ALM: 13 sessions, individual sessions in gray and averages across sessions in black; window of analysis: -100 to 150 ms relative to stimulus onset; 10 ms bins; using the top 3 PCs; Methods).” 

      Page 8: “In contrast, we found that S1, S2 and MM had stimulus CDs that were significantly aligned between the two block types (Fig. S4e; magnitude of dot product between the respond-to-touch stimulus CDs and the respond-to-light stimulus CDs, mean ± 95% CI for true vs shuffled data: S1: 0.5 ± [0.34, 0.66] vs 0.21 ± [0.12, 0.34], 10 sessions; S2: 0.62 ± [0.43, 0.78] vs 0.22 ± [0.13, 0.31], 8 sessions; MM: 0.48 ± [0.38, 0.59] vs 0.24 ± [0.16, 0.33], 9 sessions; ALM: 0.33 ± [0.2, 0.47] vs 0.21 ± [0.13, 0.31], 13 sessions).”  Page 9: “For respond-to-touch to respond-to-light block transitions, the fractions of trials classified as respond-to-touch for MM and ALM decreased progressively over the course of the transition (Fig. 5d; rank correlation of the fractions calculated for each of the separate periods spanning the transition, Kendall’s tau, mean ± 95% CI: MM: -0.39 ± [-0.67, -0.11], 9 sessions, ALM: -0.29 ± [-0.54, -0.04], 13 sessions; criterion to be considered significant: 95% CI on Kendall’s tau did not include 0).

      Page 11: “Lick probability was unaffected during S1, S2, MM and ALM experiments for both tasks, indicating that the behavioral effects were not due to an inability to lick (Fig. 6i, j; 95% CI on Δ lick probability for cross-modal selection task: S1/S2 [-0.18, 0.24], 4 mice, 10 sessions; MM [-0.31, 0.03], 4 mice, 11 sessions; ALM [-0.24, 0.16], 4 mice, 10 sessions; Δ lick probability for simple tactile detection task: S1/S2 [-0.13, 0.31], 3 mice, 3 sessions; MM [-0.06, 0.45], 3 mice, 5 sessions; ALM [-0.18, 0.34], 3 mice, 4 sessions).”

      (3) Please include a clearer description of trial timing. Perhaps a schematic timeline of when stimuli are delivered and when licking would be rewarded. I may have missed it, but I did not find explicit mention of the timing of the reward window or if there was any delay period.

      We have added the following (page 3): 

      “For each trial, the stimulus duration was 0.15 s and an answer period extended from 0.1 to 2 s from stimulus onset.”

      (4) Please include a clear description of statistical tests in each figure legend as needed (for example please check Fig 4e legend).

      We have added details about statistical tests in the figure legends:

      Fig. 2f: “Relationship between block-type discriminability before stimulus onset and tHit-tCR discriminability after stimulus onset for units showing significant block-type discriminability prior to the stimulus. Pearson correlation: S1: r = 0.69, p = 0.056, 8 neurons; S2: r = 0.91, p = 0.093, 4 neurons; MM: r = 0.93, p < 0.001, 30 neurons; ALM: r = 0.83, p < 0.001, 26 neurons.” 

      Fig. 4e: “Subspace overlap for control tHit (gray) and tCR (purple) trials in the somatosensory and motor cortical areas. Each circle is a subspace overlap of a session. Paired t-test, tCR – control tHit: S1: -0.23, 8 sessions, p = 0.0016; S2: -0.23, 7 sessions, p = 0.0086; MM: -0.36, 5 sessions, p = <0.001; ALM: -0.35, 11 sessions, p < 0.001; significance: ** for p<0.01, *** for p<0.001.”  

      Fig. 5d,e: “Fraction of trials classified as coming from a respond-to-touch block based on the pre-stimulus population state, for trials occurring in different periods (see c) relative to respond-to-touch → respondto-light transitions. For MM (top row) and ALM (bottom row), progressively fewer trials were classified as coming from the respond-to-touch block as analysis windows shifted later relative to the rule transition. Kendall’s tau (rank correlation): MM: -0.39, 9 sessions; ALM: -0.29, 13 sessions. Left panels: individual sessions, right panels: mean ± 95% CI. Dash lines are chance levels (0.5). e, Same as d but for respond-to-light → respond-to-touch transitions. Kendall’s tau: MM: 0.37, 9 sessions; ALM: 0.27, 13 sessions.”

      Fig. 6: “Error bars show bootstrap 95% CI. Criterion to be considered significant: 95% CI did not include 0.”

      (5) P. 3 - "To examine how the task rules influenced the sensorimotor transformation occurring in the tactile processing stream, we performed single-unit recordings from sensory and motor cortical areas including S1, S2, MM, and ALM using 64-channel silicon probes (Fig. 1e-g and Fig. S1a-h)." Please specify if these areas were recorded simultaneously or not.

      We have added “We recorded from one of these cortical areas per session, using 64-channel silicon probes.”  on page 3.  

      (6) Figure 4b - Please describe what gray and black lines show.

      The gray traces are the distance between tHit and tCR trajectories in individual sessions and the black traces are the averages across sessions in different cortical areas. We have added this information on page 6 and in the Figure 4b legend. 

      Page 6: “To assess this for the four cortical areas, we quantified how the tHit and tCR trajectories diverged from each other by calculating the Euclidean distance between matching time points for all possible pairs of tHit and tCR trajectories for a given session and then averaging these for the session (Fig. 4a,b; S1: 10 sessions, S2: 8 sessions, MM: 9 sessions, ALM: 13 sessions, individual sessions in gray and averages across sessions in black; window of analysis: -100 to 150 ms relative to stimulus onset; 10 ms bins; using the top 3 PCs; Methods).

      Fig. 4b: “Distance between tHit and tCR trajectories in S1, S2, MM and ALM. Gray traces show the time varying tHit-tCR distance in individual sessions and black traces are session-averaged tHit-tCR distance (S1:10 sessions; S2: 8 sessions; MM: 9 sessions; ALM: 13 sessions).”

      (7) In addition to the analyses shown in Figure 5a, when investigating the timing of the rule switch, I think the authors should plot the left and right lick probabilities aligned to the timing of the rule switch time on a trial-by-trial basis averaged across mice.

      We thank the Reviewer for suggesting this addition. We have added a new figure panel to show the probabilities of right- and left-licks during rule transitions (Fig. 5a).

      Page 8: “The probabilities of right-licks and left-licks showed that the mice switched their motor responses during block transitions depending on task rules (Fig. 5a, mean ± 95% CI across 12 mice).” 

      (8) P. 12 - "Moreover, in a separate study using the same task (Finkel et al., unpublished), high-speed video analysis demonstrated no significant differences in whisker motion between respond-to-touch and respond-to-light blocks in most (12 of 14) behavioral sessions.". Such behavioral data is important and ideally would be included in the current analysis. Was high-speed videography carried out during electrophysiology in the current study?

      Finkel et al. has been accepted in principle for publication and will be available online shortly. Unfortunately we have not yet carried out simultaneous high-speed whisker video and electrophysiology in our cross-modal sensory selection task.

      Reviewer #3 (Recommendations For The Authors):

      (1) Minor point. For subspace overlap calculation of pre-stimulus activity in Fig 4e (light purple datapoints), please clarify whether the PCs for that condition were constructed in matched time windows. If the PCs are calculated from the stimulus period 0-150ms, the poor alignment could be due to mismatched time windows.

      We thank the Reviewer for the comment and clarify our analysis here. We previously used timematched windows to calculate subspace overlaps. However, the pre-stimulus activity was much weaker than the activity during the stimulus period, so the subspaces of reference tHit were subject to noise and we were not able to obtain reliable PCs. This caused the subspace overlap values between the reference tHit and control tHit to be low and variable (mean ± SD, S1:  0.46± 0.26, n = 8 sessions, S2: 0.46± 0.18, n = 7 sessions, MM: 0.44± 0.16, n = 5 sessions, ALM: 0.38± 0.22, n = 11 sessions).  Therefore, we used the tHit activity during the stimulus window to obtain PCs and projected pre-stimulus and stimulus activity in tCR trials onto these PCs. We have now added a more detailed description of this analysis in the Methods (page 32). 

      “To calculate the separation of subspaces prior to stimulus delivery, pre-stimulus activity in tCR trials (100 to 0 ms from stimulus onset) was projected to the PC space of the tHit reference group and the subspace overlap was calculated. In this analysis, we used tHit activity during stimulus delivery (0 to 150 ms from stimulus onset) to obtain reliable PCs.”   

      We acknowledge this time alignment issue and have now removed the reported subspace overlap between tHit and tCR during the pre-stimulus period from Figure 4e (light purple). However, we think the correlation between pre- and post- stimulus-onset subspace overlaps should remain similar regardless of the time windows that we used for calculating the PCs. For the PCs calculated from the pre-stimulus period (-100 to 0 ms), the correlation coefficient was 0.55 (Pearson correlation, p <0.01, n = 31 sessions). For the PCs calculated from the stimulus period (0-150 ms), the correlation coefficient was 0.68 (Figure 4f, Pearson correlation, p <0.001, n = 31 sessions). Therefore, we keep Figure 4f.  

      (2) Minor point. To help the readers follow the logic of the experiments, please explain why PPC and AMM were added in the later optogenetic experiment since these are not part of the electrophysiology experiment.

      We have added the following rationale on page 9.

      “We recorded from AMM in our cross-modal sensory selection task and observed visually-evoked activity (Fig. S1i-k), suggesting that AMM may play an important role in rule-dependent visual processing. PPC contributes to multisensory processing51–53 and sensory-motor integration50,54–58.  Therefore, we wanted to test the roles of these areas in our cross-modal sensory selection task.”

      (3) Minor point. We are somewhat confused about the timing of some of the example neurons shown in figure S1. For example, many neurons show visually evoked signals only after stimulus offset, unlike tactile evoked signals (e.g. Fig S1b and f). In addition, the reaction time for visual stimulus is systematically slower than tactile stimuli for many example neurons (e.g. Fig S1b) but somehow not other neurons (e.g. Fig S1g). Are these observations correct?

      These observations are all correct. We have a manuscript from a separate study using this same behavioral task (Finkel et al., accepted in principle) that examines and compares (1) the onsets of tactile- and visually-evoked activity and (2) the reaction times to tactile and visual stimuli. The reaction times to tactile stimuli were slightly but significantly shorter than the reaction times to visual stimuli (tactile vs visual, 397 ± 145 vs 521 ± 163 ms, median ± interquartile range [IQR], Tukey HSD test, p = 0.001, n =155 sessions). We examined how well activity of individual neurons in S1 could be used to discriminate the presence of the stimulus or the response of the mouse. For discriminability for the presence of the stimulus, S1 neurons could signal the presence of the tactile stimulus but not the visual stimulus. For discriminability for the response of the mouse, the onsets for significant discriminability occurred earlier for tactile compared with visual trials (two-sided Kolmogorov-Smirnov test, p = 1x10-16, n = 865 neurons with DP onset in tactile trials, n = 719 neurons with DP onset in visual trials).

    1. Author Response

      The following is the authors’ response to the original reviews.

      Public Comments

      Reviewer 1

      (1) Despite the well-established role of Netrin-1 and UNC5C axon guidance during embryonic commissural axons, it remains unclear which cell type(s) express Netrin-1 or UNC5C in the dopaminergic axons and their targets. For instance, the data in Figure 1F-G and Figure 2 are quite confusing. Does Netrin-1 or UNC5C express in all cell types or only dopamine-positive neurons in these two mouse models? It will also be important to provide quantitative assessments of UNC5C expression in dopaminergic axons at different ages.

      Netrin-1 is a secreted protein and in this manuscript we did not examine what cell types express Netrin-1. This question is not the focus of the study and we consider it irrelevant to the main issue we are addressing, which is where in the forebrain regions we examined Netrin-1+ cells are present. As per the reviewer’s request we include below images showing Netrin-1 protein and Netrin-1 mRNA expression in the forebrain. In Figure 1 below, we show a high magnification immunofluorescent image of a coronal forebrain section showing Netrin-1 protein expression.

      Author response image 1.

      This confocal microscope image shows immunofluorescent staining for Netrin-1 (green) localized around cell nuclei (stained by DAPI in blue). This image was taken from a coronal section of the lateral septum of an adult male mouse. Scale bar = 20µm

      In Figures 2 and 3 below we show low and high magnification images from an RNAscope experiment confirming that cells in the forebrain regions examined express Netrin-1 mRNA.

      Author response image 2.

      This confocal microscope image of a coronal brain section of the medial prefrontal cortex of an adult male mouse shows Netrin-1 mRNA expression (green) and cell nuclei (DAPI, blue). Brain regions are as follows: Cg1: Anterior cingulate cortex 1, DP: dorsopeduncular cortex, fmi: forceps minor of the corpus callosum, IL: Infralimbic Cortex, PrL: Prelimbic Cortex

      Author response image 3.

      A higher resolution image from the same sample as in Figure 2 shows Netrin-1 mRNA (green) and cell nuclei (DAPI; blue). DP = dorsopeduncular cortex

      Regarding UNC5c, this receptor homologue is expressed by dopamine neurons in the rodent ventral tegmental area (Daubaras et al., 2014; Manitt et al., 2010; Phillips et al., 2022). This does not preclude UNC5c expression in other cell types. UNC5c receptors are ubiquitously expressed in the brain throughout development, performing many different developmental functions (Kim and Ackerman, 2011; Murcia-Belmonte et al., 2019; Srivatsa et al., 2014). In this study we are interested in UNC5c expression by dopamine neurons, and particularly by their axons projecting to the nucleus accumbens. We therefore used immunofluorescent staining in the nucleus accumbens, showing UNC5 expression in TH+ axons. This work adds to the study by Manitt et al., 2010, which examined UNC5 expression in the VTA. Manitt et al. used Western blotting to demonstrate that UNC5 expression in VTA dopamine neurons increases during adolescence, as can be seen in the following figure:

      References:

      Daubaras M, Bo GD, Flores C. 2014. Target-dependent expression of the netrin-1 receptor, UNC5C, in projection neurons of the ventral tegmental area. Neuroscience 260:36–46. doi:10.1016/j.neuroscience.2013.12.007

      Kim D, Ackerman SL. 2011. The UNC5C Netrin Receptor Regulates Dorsal Guidance of Mouse Hindbrain Axons. J Neurosci 31:2167–2179. doi:10.1523/jneurosci.5254-10.20110.2011

      Manitt C, Labelle-Dumais C, Eng C, Grant A, Mimee A, Stroh T, Flores C. 2010. Peri-Pubertal Emergence of UNC-5 Homologue Expression by Dopamine Neurons in Rodents. PLoS ONE 5:e11463-14. doi:10.1371/journal.pone.0011463

      Murcia-Belmonte V, Coca Y, Vegar C, Negueruela S, Romero C de J, Valiño AJ, Sala S, DaSilva R, Kania A, Borrell V, Martinez LM, Erskine L, Herrera E. 2019. A Retino-retinal Projection Guided by Unc5c Emerged in Species with Retinal Waves. Current Biology 29:1149-1160.e4. doi:10.1016/j.cub.2019.02.052

      Phillips RA, Tuscher JJ, Black SL, Andraka E, Fitzgerald ND, Ianov L, Day JJ. 2022. An atlas of transcriptionally defined cell populations in the rat ventral tegmental area. Cell Reports 39:110616. doi:10.1016/j.celrep.2022.110616

      Srivatsa S, Parthasarathy S, Britanova O, Bormuth I, Donahoo A-L, Ackerman SL, Richards LJ, Tarabykin V. 2014. Unc5C and DCC act downstream of Ctip2 and Satb2 and contribute to corpus callosum formation. Nat Commun 5:3708. doi:10.1038/ncomms4708

      (2) Figure 1 used shRNA to knockdown Netrin-1 in the Septum and these mice were subjected to behavioral testing. These results, again, are not supported by any valid data that the knockdown approach actually worked in dopaminergic axons. It is also unclear whether knocking down Netrin-1 in the septum will re-route dopaminergic axons or lead to cell death in the dopaminergic neurons in the substantia nigra pars compacta?

      First we want to clarify and emphasize, that our knockdown approach was not designed to knock down Netrin-1 in dopamine neurons or their axons. Our goal was to knock down Netrin-1 expression in cells expressing this guidance cue gene in the dorsal peduncular cortex.

      We have previously established the efficacy of the shRNA Netrin-1 knockdown virus used in this experiment for reducing the expression of Netrin-1 (Cuesta et al., 2020). The shRNA reduces Netrin-1 levels in vitro and in vivo.

      We agree that our experiments do not address the fate of the dopamine axons that are misrouted away from the medial prefrontal cortex. This research is ongoing, and we have now added a note regarding this to our manuscript.

      Our current hypothesis, based on experiments being conducted as part of another line of research in the lab, is that these axons are rerouted to a different brain region which they then ectopically innervate. In these experiments we are finding that male mice exposed to tetrahydrocannabinol in adolescence show reduced dopamine innervation in the medial prefrontal cortex in adulthood but increased dopamine input in the orbitofrontal cortex. In addition, these mice show increased action impulsivity in the Go/No-Go task in adulthood (Capolicchio et al., Society for Neuroscience 2023 Abstracts)

      References:

      Capolicchio T., Hernandez, G., Dube, E., Estrada, K., Giroux, M., Flores, C. (2023) Divergent outcomes of delta 9 - tetrahydrocannabinol in adolescence on dopamine and cognitive development in male and female mice. Society for Neuroscience, Washington, DC, United States [abstract].

      Cuesta S, Nouel D, Reynolds LM, Morgunova A, Torres-Berrío A, White A, Hernandez G, Cooper HM, Flores C. 2020. Dopamine Axon Targeting in the Nucleus Accumbens in Adolescence Requires Netrin-1. Frontiers Cell Dev Biology 8:487. doi:10.3389/fcell.2020.00487

      (3) Another issue with Figure1J. It is unclear whether the viruses were injected into a WT mouse model or into a Cre-mouse model driven by a promoter specifically expresses in dorsal peduncular cortex? The authors should provide evidence that Netrin-1 mRNA and proteins are indeed significantly reduced. The authors should address the anatomic results of the area of virus diffusion to confirm the virus specifically infected the cells in dorsal peduncular cortex.

      All the virus knockdown experiments were conducted in wild type mice, we added this information to Figure 1k.

      The efficacy of the shRNA in knocking down Netrin-1 was demonstrated by Cuesta et al. (2020) both in vitro and in vivo, as we show in our response to the reviewer’s previous comment above.

      We also now provide anatomical images demonstrating the localization of the injection and area of virus diffusion in the mouse forebrain. In Author response image 4 below the area of virus diffusion is visible as green fluorescent signal.

      Author response image 4.

      Fluorescent microscopy image of a mouse forebrain demonstrating the localization of the injection of a virus to knock down Netrin-1. The location of the virus is in green, while cell nuclei are in blue (DAPI). Abbreviations: DP: dorsopeduncular cortex IL: infralimbic cortex

      References:

      Cuesta S, Nouel D, Reynolds LM, Morgunova A, Torres-Berrío A, White A, Hernandez G, Cooper HM, Flores C. 2020. Dopamine Axon Targeting in the Nucleus Accumbens in Adolescence Requires Netrin-1. Frontiers Cell Dev Biology 8:487. doi:10.3389/fcell.2020.00487

      (4) The authors need to provide information regarding the efficiency and duration of knocking down. For instance, in Figure 1K, the mice were tested after 53 days post injection, can the virus activity in the brain last for such a long time?

      In our study we are interested in the role of Netrin-1 expression in the guidance of dopamine axons from the nucleus accumbens to the medial prefrontal cortex. The critical window for these axons leaving the nucleus accumbens and growing to the cortex is early adolescence (Reynolds et al., 2018b). This is why we injected the virus at the onset of adolescence, at postnatal day 21. As dopamine axons grow from the nucleus accumbens to the prefrontal cortex, they pass through the dorsal peduncular cortex. We disrupted Netrin-1 expression at this point along their route to determine whether it is the Netrin-1 present along their route that guides these axons to the prefrontal cortex. We hypothesized that the shRNA Netrin-1 virus would disrupt the growth of the dopamine axons, reducing the number of axons that reach the prefrontal cortex and therefore the number of axons that innervate this region in adulthood.

      We conducted our behavioural tests during adulthood, after the critical window during which dopamine axon growth occurs, so as to observe the enduring behavioral consequences of this misrouting. This experimental approach is designed for the shRNa Netrin-1 virus to be expressed in cells in the dorsopeduncular cortex when the dopamine axons are growing, during adolescence.

      References:

      Capolicchio T., Hernandez, G., Dube, E., Estrada, K., Giroux, M., Flores, C. (2023) Divergent outcomes of delta 9 - tetrahydrocannabinol in adolescence on dopamine and cognitive development in male and female mice. Society for Neuroscience, Washington, DC, United States [abstract].

      Reynolds LM, Yetnikoff L, Pokinko M, Wodzinski M, Epelbaum JG, Lambert LC, Cossette M-P, Arvanitogiannis A, Flores C. 2018b. Early Adolescence is a Critical Period for the Maturation of Inhibitory Behavior. Cerebral cortex 29:3676–3686. doi:10.1093/cercor/bhy247

      (5) In Figure 1N-Q, silencing Netrin-1 results in less DA axons targeting to infralimbic cortex, but why the Netrin-1 knocking down mice revealed the improved behavior?

      This is indeed an intriguing finding, and we have now added a mention of it to our manuscript. We have demonstrated that misrouting dopamine axons away from the medial prefrontal cortex during adolescence alters behaviour, but why this improves their action impulsivity ability is something currently unknown to us. One potential answer is that the dopamine axons are misrouted to a different brain region that is also involved in controlling impulsive behaviour, perhaps the dorsal striatum (Kim and Im, 2019) or the orbital prefrontal cortex (Jonker et al., 2015).

      We would also like to note that we are finding that other manipulations that appear to reroute dopamine axons to unintended targets can lead to reduced action impulsivity as measured using the Go No Go task. As we mentioned above, current experiments in the lab, which are part of a different line of research, are showing that male mice exposed to tetrahydrocannabinol in adolescence show reduced dopamine innervation in the medial prefrontal cortex in adulthood, but increased dopamine input in the orbitofrontal cortex. In addition, these mice show increased action impulsivity in the Go/No-Go task in adulthood (Capolicchio et al., Society for Neuroscience 2023 Abstracts)

      References

      Capolicchio T., Hernandez, G., Dube, E., Estrada, K., Giroux, M., Flores, C. (2023) Divergent outcomes of delta 9 - tetrahydrocannabinol in adolescence on dopamine and cognitive development in male and female mice. Society for Neuroscience, Washington, DC, United States [abstract].

      Jonker FA, Jonker C, Scheltens P, Scherder EJA. 2015. The role of the orbitofrontal cortex in cognition and behavior. Rev Neurosci 26:1–11. doi:10.1515/revneuro2014-0043 Kim B, Im H. 2019. The role of the dorsal striatum in choice impulsivity. Ann N York Acad Sci 1451:92–111. doi:10.1111/nyas.13961

      (6) What is the effect of knocking down UNC5C on dopamine axons guidance to the cortex?

      We have found that mice that are heterozygous for a nonsense Unc5c mutation, and as a result have reduced levels of UNC5c protein, show reduced amphetamine-induced locomotion and stereotypy (Auger et al., 2013). In the same manuscript we show that this effect only emerges during adolescence, in concert with the growth of dopamine axons to the prefrontal cortex. This is indirect but strong evidence that UNC5c receptors are necessary for correct adolescent dopamine axon development.

      References

      Auger ML, Schmidt ERE, Manitt C, Dal-Bo G, Pasterkamp RJ, Flores C. 2013. unc5c haploinsufficient phenotype: striking similarities with the dcc haploinsufficiency model. European Journal of Neuroscience 38:2853–2863. doi:10.1111/ejn.12270

      (7) In Figures 2-4, the authors only showed the amount of DA axons and UNC5C in NAcc. However, it remains unclear whether these experiments also impact the projections of dopaminergic axons to other brain regions, critical for the behavioral phenotypes. What about other brain regions such as prefrontal cortex? Do the projection of DA axons and UNC5c level in cortex have similar pattern to those in NAcc?

      UNC5c receptors are expressed throughout development and are involved in many developmental processes (Kim and Ackerman, 2011; Murcia-Belmonte et al., 2019; Srivatsa et al., 2014). We cannot say whether the pattern we observe here is unique to the nucleus accumbens, but it is certainly not universal throughout the brain.

      The brain region we focus on in our manuscript, in addition to the nucleus accumbens, is the medial prefrontal cortex. Close and thorough examination of the prefrontal cortices of adult mice revealed practically no UNC5c expression by dopamine axons. However, we did observe very rare cases of dopamine axons expressing UNC5c. It is not clear whether these rare cases are present before or during adolescence.

      Below is a representative set of images of this observation, which is now also included as Supplementary Figure 4:

      Author response image 5.

      Expression of UNC5c protein in the medial prefrontal cortex of an adult male mouse. Low (A) and high (B) magnification images demonstrate that there is little UNC5c expression in dopamine axons in the medial prefrontal cortex. Here we identify dopamine axons by immunofluorescent staining for tyrosine hydroxylase (TH, see our response to comment #9 regarding the specificity of the TH antibody for dopamine axons in the prefrontal cortex). This figure is also included as Supplementary Figure 4 in the manuscript. Abbreviations: fmi: forceps minor of the corpus callosum, mPFC: medial prefrontal cortex.

      References:

      Kim D, Ackerman SL. 2011. The UNC5C Netrin Receptor Regulates Dorsal Guidance of Mouse Hindbrain Axons. J Neurosci 31:2167–2179. doi:10.1523/jneurosci.5254- 10.20110.2011

      Murcia-Belmonte V, Coca Y, Vegar C, Negueruela S, Romero C de J, Valiño AJ, Sala S, DaSilva R, Kania A, Borrell V, Martinez LM, Erskine L, Herrera E. 2019. A Retino-retinal Projection Guided by Unc5c Emerged in Species with Retinal Waves. Current Biology 29:1149-1160.e4. doi:10.1016/j.cub.2019.02.052

      Srivatsa S, Parthasarathy S, Britanova O, Bormuth I, Donahoo A-L, Ackerman SL, Richards LJ, Tarabykin V. 2014. Unc5C and DCC act downstream of Ctip2 and Satb2 and contribute to corpus callosum formation. Nat Commun 5:3708. doi:10.1038/ncomms4708

      (8) Can overexpression of UNC5c or Netrin-1 in male winter hamsters mimic the observations in summer hamsters? Or overexpression of UNC5c in female summer hamsters to mimic the winter hamster? This would be helpful to confirm the causal role of UNC5C in guiding DA axons during adolescence.

      This is an excellent question. We are very interested in both increasing and decreasing UNC5c expression in hamster dopamine axons to see if we can directly manipulate summer hamsters into winter hamsters and vice versa. We are currently exploring virus-based approaches to design these experiments and are excited for results in this area.

      (9) The entire study relied on using tyrosine hydroxylase (TH) as a marker for dopaminergic axons. However, the expression of TH (either by IHC or IF) can be influenced by other environmental factors, that could alter the expression of TH at the cellular level.

      This is an excellent point that we now carefully address in our methods by adding the following:

      In this study we pay great attention to the morphology and localization of the fibres from which we quantify varicosities to avoid counting any fibres stained with TH antibodies that are not dopamine fibres. The fibres that we examine and that are labelled by the TH antibody show features indistinguishable from the classic features of cortical dopamine axons in rodents (Berger et al., 1974; 1983; Van Eden et al., 1987; Manitt et al., 2011), namely they are thin fibres with irregularly-spaced varicosities, are densely packed in the nucleus accumbens, sparsely present only in the deep layers of the prefrontal cortex, and are not regularly oriented in relation to the pial surface. This is in contrast to rodent norepinephrine fibres, which are smooth or beaded in appearance, relatively thick with regularly spaced varicosities, increase in density towards the shallow cortical layers, and are in large part oriented either parallel or perpendicular to the pial surface (Berger et al., 1974; Levitt and Moore, 1979; Berger et al., 1983; Miner et al., 2003). Furthermore, previous studies in rodents have noted that only norepinephrine cell bodies are detectable using immunofluorescence for TH, not norepinephrine processes (Pickel et al., 1975; Verney et al., 1982; Miner et al., 2003), and we did not observe any norepinephrine-like fibres.

      Furthermore, we are not aware of any other processes in the forebrain that are known to be immunopositive for TH under any environmental conditions.

      To reduce confusion, we have replaced the abbreviation for dopamine – DA – with TH in the relevant panels in Figures 1, 2, 3, and 4 to clarify exactly what is represented in these images. As can be seen in these images, fluorescent green labelling is present only in axons, which is to be expected of dopamine labelling in these forebrain regions.

      References:

      Berger B, Tassin JP, Blanc G, Moyne MA, Thierry AM (1974) Histochemical confirmation for dopaminergic innervation of the rat cerebral cortex after destruction of the noradrenergic ascending pathways. Brain Res 81:332–337.

      Berger B, Verney C, Gay M, Vigny A (1983) Immunocytochemical Characterization of the Dopaminergic and Noradrenergic Innervation of the Rat Neocortex During Early Ontogeny. In: Proceedings of the 9th Meeting of the International Neurobiology Society, pp 263–267 Progress in Brain Research. Elsevier.

      Levitt P, Moore RY (1979) Development of the noradrenergic innervation of neocortex. Brain Res 162:243–259.

      Manitt C, Mimee A, Eng C, Pokinko M, Stroh T, Cooper HM, Kolb B, Flores C (2011) The Netrin Receptor DCC Is Required in the Pubertal Organization of Mesocortical Dopamine Circuitry. J Neurosci 31:8381–8394.

      Miner LH, Schroeter S, Blakely RD, Sesack SR (2003) Ultrastructural localization of the norepinephrine transporter in superficial and deep layers of the rat prelimbic prefrontal cortex and its spatial relationship to probable dopamine terminals. J Comp Neurol 466:478–494.

      Pickel VM, Joh TH, Field PM, Becker CG, Reis DJ (1975) Cellular localization of tyrosine hydroxylase by immunohistochemistry. J Histochem Cytochem 23:1–12.

      Van Eden CG, Hoorneman EM, Buijs RM, Matthijssen MA, Geffard M, Uylings HBM (1987) Immunocytochemical localization of dopamine in the prefrontal cortex of the rat at the light and electron microscopical level. Neurosci 22:849–862.

      Verney C, Berger B, Adrien J, Vigny A, Gay M (1982) Development of the dopaminergic innervation of the rat cerebral cortex. A light microscopic immunocytochemical study using anti-tyrosine hydroxylase antibodies. Dev Brain Res 5:41–52.

      (10) Are Netrin-1/UNC5C the only signal guiding dopamine axon during adolescence? Are there other neuronal circuits involved in this process?

      Our intention for this study was to examine the role of Netrin-1 and its receptor UNC5C specifically, but we do not suggest that they are the only molecules to play a role. The process of guiding growing dopamine axons during adolescence is likely complex and we expect other guidance mechanisms to also be involved. From our previous work we know that the Netrin-1 receptor DCC is critical in this process (Hoops and Flores, 2017; Reynolds et al., 2023). Several other molecules have been identified in Netrin-1/DCC signaling processes that control corpus callosum development and there is every possibility that the same or similar molecules may be important in guiding dopamine axons (Schlienger et al., 2023).

      References:

      Hoops D, Flores C. 2017. Making Dopamine Connections in Adolescence. Trends in Neurosciences 1–11. doi:10.1016/j.tins.2017.09.004

      Reynolds LM, Hernandez G, MacGowan D, Popescu C, Nouel D, Cuesta S, Burke S, Savell KE, Zhao J, Restrepo-Lozano JM, Giroux M, Israel S, Orsini T, He S, Wodzinski M, Avramescu RG, Pokinko M, Epelbaum JG, Niu Z, Pantoja-Urbán AH, Trudeau L-É, Kolb B, Day JJ, Flores C. 2023. Amphetamine disrupts dopamine axon growth in adolescence by a sex-specific mechanism in mice. Nat Commun 14:4035. doi:10.1038/s41467-023-39665-1

      Schlienger S, Yam PT, Balekoglu N, Ducuing H, Michaud J-F, Makihara S, Kramer DK, Chen B, Fasano A, Berardelli A, Hamdan FF, Rouleau GA, Srour M, Charron F. 2023. Genetics of mirror movements identifies a multifunctional complex required for Netrin-1 guidance and lateralization of motor control. Sci Adv 9:eadd5501. doi:10.1126/sciadv.add5501

      (11) Finally, despite the authors' claim that the dopaminergic axon project is sensitive to the duration of daylight in the hamster, they never provided definitive evidence to support this hypothesis.

      By “definitive evidence” we think that the reviewer is requesting a single statistical model including measures from both the summer and winter groups. Such a model would provide a probability estimate of whether dopamine axon growth is sensitive to daylight duration. Therefore, we ran these models, one for male hamsters and one for female hamsters.

      In both sexes we find a significant effect of daylength on dopamine innervation, interacting with age. Male age by daylength interaction: F = 6.383, p = 0.00242. Female age by daylength interaction: F = 21.872, p = 1.97 x 10⁻⁹. The full statistical analysis is available as a supplement to this letter (Response_Letter_Stats_Details.docx).

      Reviewer 3

      (1) Fig 1 A and B don't appear to be the same section level.

      The reviewer is correct that Fig 1B is anterior to Fig 1A. We have changed Figure 1A to match the section level of Figure 1B.

      (2) Fig 1C. It is not clear that these axons are crossing from the shell of the NAC.

      We have added a dashed line to Figure 1C to highlight the boundary of the nucleus accumbens, which hopefully emphasizes that there are fibres crossing the boundary. We also include here an enlarged image of this panel:

      Author response image 6.

      An enlarged image of Figure1c in the manuscript. The nucleus accumbens (left of the dotted line) is densely packed with TH+ axons (in green). Some of these TH+ axons can be observed extending from the nucleus accumbens medially towards a region containing dorsally oriented TH+ fibres (white arrows).

      (3) Fig 1. Measuring width of the bundle is an odd way to measure DA axon numbers. First the width could be changing during adult for various reasons including change in brain size. Second, I wouldn't consider these axons in a traditional bundle. Third, could DA axon counts be provided, rather than these proxy measures.

      With regards to potential changes in brain size, we agree that this could have potentially explained the increased width of the dopamine axon pathway. That is why it was important for us to use stereology to measure the density of dopamine axons within the pathway. If the width increased but no new axons grew along the pathway, we would have seen a decrease in axon density from adolescence to adulthood. Instead, our results show that the density of axons remained constant.

      We agree with the reviewer that the dopamine axons do not form a traditional “bundle”. Therefore, throughout the manuscript we now avoid using the term bundle.

      Although we cannot count every single axon, an accurate estimate of this number can be obtained using stereology, an unbiassed method for efficiently quantifying large, irregularly distributed objects. We used stereology to count TH+ axons in an unbiased subset of the total area occupied by these axons. Unbiased stereology is the gold-standard technique for estimating populations of anatomical objects, such as axons, that are so numerous that it would be impractical or impossible to measure every single one. Here and elsewhere we generally provide results as densities and areas of occupancy (Reynolds et al., 2022). To avoid confusion, we now clarify that we are counting the width of the area that dopamine axons occupy (rather than the dopamine axon “bundle”).

      References:

      Reynolds LM, Pantoja-Urbán AH, MacGowan D, Manitt C, Nouel D, Flores C. 2022. Dopaminergic System Function and Dysfunction: Experimental Approaches. Neuromethods 31–63. doi:10.1007/978-1-0716-2799-0_2

      (4) TH in the cortex could also be of noradrenergic origin. This needs to be ruled out to score DA axons

      This is the same comment as Reviewer 1 #9. Please see our response below, which we have also added to our methods:

      In this study we pay great attention to the morphology and localization of the fibres from which we quantify varicosities to avoid counting any fibres stained with TH antibodies that are not dopamine fibres. The fibres that we examine and that are labelled by the TH antibody show features indistinguishable from the classic features of cortical dopamine axons in rodents (Berger et al., 1974; 1983; Van Eden et al., 1987; Manitt et al., 2011), namely they are thin fibres with irregularly-spaced varicosities, are densely packed in the nucleus accumbens, sparsely present only in the deep layers of the prefrontal cortex, and are not regularly oriented in relation to the pial surface. This is in contrast to rodent norepinephrine fibres, which are smooth or beaded in appearance, relatively thick with regularly spaced varicosities, increase in density towards the shallow cortical layers, and are in large part oriented either parallel or perpendicular to the pial surface (Berger et al., 1974; Levitt and Moore, 1979; Berger et al., 1983; Miner et al., 2003). Furthermore, previous studies in rodents have noted that only norepinephrine cell bodies are detectable using immunofluorescence for TH, not norepinephrine processes (Pickel et al., 1975; Verney et al., 1982; Miner et al., 2003), and we did not observe any norepinephrine-like fibres.

      References:

      Berger B, Tassin JP, Blanc G, Moyne MA, Thierry AM (1974) Histochemical confirmation for dopaminergic innervation of the rat cerebral cortex after destruction of the noradrenergic ascending pathways. Brain Res 81:332–337.

      Berger B, Verney C, Gay M, Vigny A (1983) Immunocytochemical Characterization of the Dopaminergic and Noradrenergic Innervation of the Rat Neocortex During Early Ontogeny. In: Proceedings of the 9th Meeting of the International Neurobiology Society, pp 263–267 Progress in Brain Research. Elsevier.

      Levitt P, Moore RY (1979) Development of the noradrenergic innervation of neocortex. Brain Res 162:243–259.

      Manitt C, Mimee A, Eng C, Pokinko M, Stroh T, Cooper HM, Kolb B, Flores C (2011) The Netrin Receptor DCC Is Required in the Pubertal Organization of Mesocortical Dopamine Circuitry. J Neurosci 31:8381–8394.

      Miner LH, Schroeter S, Blakely RD, Sesack SR (2003) Ultrastructural localization of the norepinephrine transporter in superficial and deep layers of the rat prelimbic prefrontal cortex and its spatial relationship to probable dopamine terminals. J Comp Neurol 466:478–494.

      Pickel VM, Joh TH, Field PM, Becker CG, Reis DJ (1975) Cellular localization of tyrosine hydroxylase by immunohistochemistry. J Histochem Cytochem 23:1–12.

      Van Eden CG, Hoorneman EM, Buijs RM, Matthijssen MA, Geffard M, Uylings HBM (1987) Immunocytochemical localization of dopamine in the prefrontal cortex of the rat at the light and electron microscopical level. Neurosci 22:849–862.

      Verney C, Berger B, Adrien J, Vigny A, Gay M (1982) Development of the dopaminergic innervation of the rat cerebral cortex. A light microscopic immunocytochemical study using anti-tyrosine hydroxylase antibodies. Dev Brain Res 5:41–52.

      (5) Netrin staining should be provided with NeuN + DAPI; its not clear these are all cell bodies. An in situ of Netrin would help as well.

      A similar comment was raised by Reviewer 1 in point #1. Please see below the immunofluorescent and RNA scope images showing expression of Netrin-1 protein and mRNA in the forebrain.

      Author response image 7.

      This confocal microscope image shows immunofluorescent staining for Netrin-1 (green) localized around cell nuclei (stained by DAPI in blue). This image was taken from a coronal section of the lateral septum of an adult male mouse. Scale bar = 20µm

      Author response image 8.

      This confocal microscope image of a coronal brain section of the medial prefrontal cortex of an adult male mouse shows Netrin-1 mRNA expression (green) and cell nuclei (DAPI, blue). RNAscope was used to generate this image. Brain regions are as follows: Cg1: Anterior cingulate cortex 1, DP: dorsopeduncular cortex, IL: Infralimbic Cortex, PrL: Prelimbic Cortex, fmi: forceps minor of the corpus callosum

      Author response image 9.

      A higher resolution image from the same sample as in Figure 2 shows Netrin-1 mRNA (green) and cell nuclei (DAPI; blue). DP = dorsopeduncular cortex

      (6) The Netrin knockdown needs validation. How strong was the knockdown etc?

      This comment was also raised by Reviewer 1 #1.

      We have previously established the efficacy of the shRNA Netrin-1 knockdown virus used in this experiment for reducing the expression of Netrin-1 (Cuesta et al., 2020). The shRNA reduces Netrin-1 levels in vitro and in vivo.

      References:

      Cuesta S, Nouel D, Reynolds LM, Morgunova A, Torres-Berrío A, White A, Hernandez G, Cooper HM, Flores C. 2020. Dopamine Axon Targeting in the Nucleus Accumbens in Adolescence Requires Netrin-1. Frontiers Cell Dev Biology 8:487. doi:10.3389/fcell.2020.00487

      (7) If the conclusion that knocking down Netrin in cortex decreases DA innervation of the IL, how can that be reconciled with Netrin-Unc repulsion.

      This is an intriguing question and one that we are in the planning stages of addressing with new experiments.

      Although we do not have a mechanistic answered for how a repulsive receptor helps guide these axons, we would like to note that previous indirect evidence from a study by our group also suggests that reducing UNC5c signaling in dopamine axons in adolescence increases dopamine innervation to the prefrontal cortex (Auger et al, 2013).

      References

      Auger ML, Schmidt ERE, Manitt C, Dal-Bo G, Pasterkamp RJ, Flores C. 2013. unc5c haploinsufficient phenotype: striking similarities with the dcc haploinsufficiency model. European Journal of Neuroscience 38:2853–2863. doi:10.1111/ejn.12270

      (8) The behavioral phenotype in Fig 1 is interesting, but its not clear if its related to DA axons/signaling. IN general, no evidence in this paper is provided for the role of DA in the adolescent behaviors described.

      We agree with the reviewer that the behaviours we describe in adult mice are complex and are likely to involve several neurotransmitter systems. However, there is ample evidence for the role of dopamine signaling in cognitive control behaviours (Bari and Robbins, 2013; Eagle et al., 2008; Ott et al., 2023) and our published work has shown that alterations in the growth of dopamine axons to the prefrontal cortex leads to changes in impulse control as measured via the Go/No-Go task in adulthood (Reynolds et al., 2023, 2018a; Vassilev et al., 2021).

      The other adolescent behaviour we examined was risk-like taking behaviour in male and female hamsters (Figures 4 and 5), as a means of characterizing maturation in this behavior over time. We decided not to use the Go/No-Go task because as far as we know, this has never been employed in Siberian Hamsters and it will be difficult to implement. Instead, we chose the light/dark box paradigm, which requires no training and is ideal for charting behavioural changes over short time periods. Indeed, risk-like taking behavior in rodents and in humans changes from adolescence to adulthood paralleling changes in prefrontal cortex development, including the gradual input of dopamine axons to this region.

      References:

      Bari A, Robbins TW. 2013. Inhibition and impulsivity: Behavioral and neural basis of response control. Progress in neurobiology 108:44–79. doi:10.1016/j.pneurobio.2013.06.005

      Eagle DM, Bari A, Robbins TW. 2008. The neuropsychopharmacology of action inhibition: cross-species translation of the stop-signal and go/no-go tasks. Psychopharmacology 199:439–456. doi:10.1007/s00213-008-1127-6

      Ott T, Stein AM, Nieder A. 2023. Dopamine receptor activation regulates reward expectancy signals during cognitive control in primate prefrontal neurons. Nat Commun 14:7537. doi:10.1038/s41467-023-43271-6

      Reynolds LM, Hernandez G, MacGowan D, Popescu C, Nouel D, Cuesta S, Burke S, Savell KE, Zhao J, Restrepo-Lozano JM, Giroux M, Israel S, Orsini T, He S, Wodzinski M, Avramescu RG, Pokinko M, Epelbaum JG, Niu Z, Pantoja-Urbán AH, Trudeau L-É, Kolb B, Day JJ, Flores C. 2023. Amphetamine disrupts dopamine axon growth in adolescence by a sex-specific mechanism in mice. Nat Commun 14:4035. doi:10.1038/s41467-023-39665-1

      Reynolds LM, Pokinko M, Torres-Berrío A, Cuesta S, Lambert LC, Pellitero EDC, Wodzinski M, Manitt C, Krimpenfort P, Kolb B, Flores C. 2018a. DCC Receptors Drive Prefrontal Cortex Maturation by Determining Dopamine Axon Targeting in Adolescence. Biological psychiatry 83:181–192. doi:10.1016/j.biopsych.2017.06.009

      Vassilev P, Pantoja-Urban AH, Giroux M, Nouel D, Hernandez G, Orsini T, Flores C. 2021. Unique effects of social defeat stress in adolescent male mice on the Netrin-1/DCC pathway, prefrontal cortex dopamine and cognition (Social stress in adolescent vs. adult male mice). Eneuro ENEURO.0045-21.2021. doi:10.1523/eneuro.0045-21.2021

      (9) Fig2 - boxes should be drawn on the NAc diagram to indicate sampled regions. Some quantification of Unc5c would be useful. Also, some validation of the Unc5c antibody would be nice.

      The images presented were taken medial to the anterior commissure and we have edited Figure 2 to show this. However, we did not notice any intra-accumbens variation, including between the core and the shell. Therefore, the images are representative of what was observed throughout the entire nucleus accumbens.

      To quantify UNC5c in the accumbens we conducted a Western blot experiment in male mice at different ages. A one-way ANOVA analyzing band intensity (relative to the 15-day-old average band intensity) as the response variable and age as the predictor variable showed a significant effect of age (F=5.615, p=0.01). Posthoc analysis revealed that 15-day-old mice have less UNC5c in the nucleus accumbens compared to 21- and 35-day-old mice.

      Author response image 10.

      The graph depicts the results of a Western blot experiment of UNC5c protein levels in the nucleus accumbens of male mice at postnatal days 15, 21 or 35 and reveals a significant increase in protein levels at the onset adolescence.

      Our methods for this Western blot were as follows: Samples were prepared as previously (Torres-Berrío et al., 2017). Briefly, mice were sacrificed by live decapitation and brains were flash frozen in heptane on dry ice for 10 seconds. Frozen brains were mounted in a cryomicrotome and two 500um sections were collected for the nucleus accumbens, corresponding to plates 14 and 18 of the Paxinos mouse brain atlas. Two tissue core samples were collected per section, one for each side of the brain, using a 15-gauge tissue corer (Fine surgical tools Cat no. NC9128328) and ejected in a microtube on dry ice. The tissue samples were homogenized in 100ul of standard radioimmunoprecipitation assay buffer using a handheld electric tissue homogenizer. The samples were clarified by centrifugation at 4C at a speed of 15000g for 30 minutes. Protein concentration was quantified using a bicinchoninic acid assay kit (Pierce BCA protein assay kit, Cat no.PI23225) and denatured with standard Laemmli buffer for 5 minutes at 70C. 10ug of protein per sample was loaded and run by SDS-PAGE gel electrophoresis in a Mini-PROTEAN system (Bio-Rad) on an 8% acrylamide gel by stacking for 30 minutes at 60V and resolving for 1.5 hours at 130V. The proteins were transferred to a nitrocellulose membrane for 1 hour at 100V in standard transfer buffer on ice. The membranes were blocked using 5% bovine serum albumin dissolved in tris-buffered saline with Tween 20 and probed with primary (UNC5c, Abcam Cat. no ab302924) and HRP-conjugated secondary antibodies for 1 hour. a-tubulin was probed and used as loading control. The probed membranes were resolved using SuperSignal West Pico PLUS chemiluminescent substrate (ThermoFisher Cat no.34579) in a ChemiDoc MP Imaging system (Bio-Rad). Band intensity was quantified using the ChemiDoc software and all ages were normalized to the P15 age group average.

      Validation of the UNC5c antibody was performed in the lab of Dr. Liu, from whom it was kindly provided. Briefly, in the validation study the authors showed that the anti-UNC5C antibody can detect endogenous UNC5C expression and the level of UNC5C is dramatically reduced after UNC5C knockdown. The antibody can also detect the tagged-UNC5C protein in several cell lines, which was confirmed by a tag antibody (Purohit et al., 2012; Shao et al., 2017).

      References:

      Purohit AA, Li W, Qu C, Dwyer T, Shao Q, Guan K-L, Liu G. 2012. Down Syndrome Cell Adhesion Molecule (DSCAM) Associates with Uncoordinated-5C (UNC5C) in Netrin-1mediated Growth Cone Collapse. The Journal of biological chemistry 287:27126–27138. doi:10.1074/jbc.m112.340174

      Shao Q, Yang T, Huang H, Alarmanazi F, Liu G. 2017. Uncoupling of UNC5C with Polymerized TUBB3 in Microtubules Mediates Netrin-1 Repulsion. J Neurosci 37:5620–5633. doi:10.1523/jneurosci.2617-16.2017

      (10) "In adolescence, dopamine neurons begin to express the repulsive Netrin-1 receptor UNC5C, and reduction in UNC5C expression appears to cause growth of mesolimbic dopamine axons to the prefrontal cortex".....This is confusing. Figure 2 shows a developmental increase in UNc5c not a decrease. So when is the "reduction in Unc5c expression" occurring?

      We apologize for the mistake in this sentence. We have corrected the relevant passage in our manuscript as follows:

      In adolescence, dopamine neurons begin to express the repulsive Netrin-1 receptor UNC5C, particularly when mesolimbic and mesocortical dopamine projections segregate in the nucleus accumbens (Manitt et al., 2010; Reynolds et al., 2018a). In contrast, dopamine axons in the prefrontal cortex do not express UNC5c except in very rare cases (Supplementary Figure 4). In adult male mice with Unc5c haploinsufficiency, there appears to be ectopic growth of mesolimbic dopamine axons to the prefrontal cortex (Auger et al., 2013). This miswiring is associated with alterations in prefrontal cortex-dependent behaviours (Auger et al., 2013).

      References:

      Auger ML, Schmidt ERE, Manitt C, Dal-Bo G, Pasterkamp RJ, Flores C. 2013. unc5c haploinsufficient phenotype: striking similarities with the dcc haploinsufficiency model. European Journal of Neuroscience 38:2853–2863. doi:10.1111/ejn.12270

      Manitt C, Labelle-Dumais C, Eng C, Grant A, Mimee A, Stroh T, Flores C. 2010. Peri-Pubertal Emergence of UNC-5 Homologue Expression by Dopamine Neurons in Rodents. PLoS ONE 5:e11463-14. doi:10.1371/journal.pone.0011463

      Reynolds LM, Pokinko M, Torres-Berrío A, Cuesta S, Lambert LC, Pellitero EDC, Wodzinski M, Manitt C, Krimpenfort P, Kolb B, Flores C. 2018a. DCC Receptors Drive Prefrontal Cortex Maturation by Determining Dopamine Axon Targeting in Adolescence. Biological psychiatry 83:181–192. doi:10.1016/j.biopsych.2017.06.009

      (11) In Fig 3, a statistical comparison should be made between summer male and winter male, to justify the conclusions that the winter males have delayed DA innervation.

      This analysis was also suggested by Reviewer 1, #11. Here is our response:

      We analyzed the summer and winter data together in ANOVAs separately for males and females. In both sexes we find a significant effect of daylength on dopamine innervation, interacting with age. Male age by daylength interaction: F = 6.383, p = 0.00242. Female age by daylength interaction: F = 21.872, p = 1.97 x 10⁻⁹. The full statistical analysis is available as a supplement to this letter (Response_Letter_Stats_Details.docx).

      (12) Should axon length also be measured here (Fig 3)? It is not clear why the authors have switched to varicosity density. Also, a box should be drawn in the NAC cartoon to indicate the region that was sampled.

      It is untenable to quantify axon length in the prefrontal cortex as we cannot distinguish independent axons. Rather, they are “tangled”; they twist and turn in a multitude of directions as they make contact with various dendrites. Furthermore, they branch extensively. It would therefore be impossible to accurately quantify the number of axons. Using unbiased stereology to quantify varicosities is a valid, well-characterized and straightforward alternative (Reynolds et al., 2022).

      References:

      Reynolds LM, Pantoja-Urbán AH, MacGowan D, Manitt C, Nouel D, Flores C. 2022. Dopaminergic System Function and Dysfunction: Experimental Approaches. Neuromethods 31–63. doi:10.1007/978-1-0716-2799-0_2

      (13) In Fig 3, Unc5c should be quantified to bolster the interesting finding that Unc5c expression dynamics are different between summer and winter hamsters. Unc5c mRNA experiments would also be important to see if similar changes are observed at the transcript level.

      We agree that it would be very interesting to see how UNC5c mRNA and protein levels change over time in summer and winter hamsters, both in males, as the reviewer suggests here, and in females. We are working on conducting these experiments in hamsters as part of a broader expansion of our research in this area. These experiments will require a lengthy amount of time and at this point we feel that they are beyond the scope of this manuscript.

      (14) Fig 4. The peak in exploratory behavior in winter females is counterintuitive and needs to be better discussed. IN general, the light dark behavior seems quite variable.

      This is indeed a very interesting finding, which we have expanded upon in our manuscript as follows:

      When raised under a winter-mimicking daylength, hamsters of either sex show a protracted peak in risk taking. In males, it is delayed beyond 80 days old, but the delay is substantially less in females. This is a counterintuitive finding considering that dopamine development in winter females appears to be accelerated. Our interpretation of this finding is that the timing of the risk-taking peak in females may reflect a balance between different adolescent developmental processes. The fact that dopamine axon growth is accelerated does not imply that all adolescent maturational processes are accelerated. Some may be delayed, for example those that induce axon pruning in the cortex. The timing of the risk-taking peak in winter female hamsters may therefore reflect the amalgamation of developmental processes that are advanced with those that are delayed – producing a behavioural effect that is timed somewhere in the middle. Disentangling the effects of different developmental processes on behaviour will require further experiments in hamsters, including the direct manipulation of dopamine activity in the nucleus accumbens and prefrontal cortex.

      Full Reference List

      Auger ML, Schmidt ERE, Manitt C, Dal-Bo G, Pasterkamp RJ, Flores C. 2013. unc5c haploinsufficient phenotype: striking similarities with the dcc haploinsufficiency model. European Journal of Neuroscience 38:2853–2863. doi:10.1111/ejn.12270

      Bari A, Robbins TW. 2013. Inhibition and impulsivity: Behavioral and neural basis of response control. Progress in neurobiology 108:44–79. doi:10.1016/j.pneurobio.2013.06.005

      Cuesta S, Nouel D, Reynolds LM, Morgunova A, Torres-Berrío A, White A, Hernandez G, Cooper HM, Flores C. 2020. Dopamine Axon Targeting in the Nucleus Accumbens in Adolescence Requires Netrin-1. Frontiers Cell Dev Biology 8:487. doi:10.3389/fcell.2020.00487

      Daubaras M, Bo GD, Flores C. 2014. Target-dependent expression of the netrin-1 receptor, UNC5C, in projection neurons of the ventral tegmental area. Neuroscience 260:36–46. doi:10.1016/j.neuroscience.2013.12.007

      Eagle DM, Bari A, Robbins TW. 2008. The neuropsychopharmacology of action inhibition: crossspecies translation of the stop-signal and go/no-go tasks. Psychopharmacology 199:439– 456. doi:10.1007/s00213-008-1127-6

      Hoops D, Flores C. 2017. Making Dopamine Connections in Adolescence. Trends in Neurosciences 1–11. doi:10.1016/j.tins.2017.09.004

      Jonker FA, Jonker C, Scheltens P, Scherder EJA. 2015. The role of the orbitofrontal cortex in cognition and behavior. Rev Neurosci 26:1–11. doi:10.1515/revneuro-2014-0043

      Kim B, Im H. 2019. The role of the dorsal striatum in choice impulsivity. Ann N York Acad Sci 1451:92–111. doi:10.1111/nyas.13961

      Kim D, Ackerman SL. 2011. The UNC5C Netrin Receptor Regulates Dorsal Guidance of Mouse Hindbrain Axons. J Neurosci 31:2167–2179. doi:10.1523/jneurosci.5254-10.2011

      Manitt C, Labelle-Dumais C, Eng C, Grant A, Mimee A, Stroh T, Flores C. 2010. Peri-Pubertal Emergence of UNC-5 Homologue Expression by Dopamine Neurons in Rodents. PLoS ONE 5:e11463-14. doi:10.1371/journal.pone.0011463

      Murcia-Belmonte V, Coca Y, Vegar C, Negueruela S, Romero C de J, Valiño AJ, Sala S, DaSilva R, Kania A, Borrell V, Martinez LM, Erskine L, Herrera E. 2019. A Retino-retinal Projection Guided by Unc5c Emerged in Species with Retinal Waves. Current Biology 29:1149-1160.e4. doi:10.1016/j.cub.2019.02.052

      Ott T, Stein AM, Nieder A. 2023. Dopamine receptor activation regulates reward expectancy signals during cognitive control in primate prefrontal neurons. Nat Commun 14:7537. doi:10.1038/s41467-023-43271-6

      Phillips RA, Tuscher JJ, Black SL, Andraka E, Fitzgerald ND, Ianov L, Day JJ. 2022. An atlas of transcriptionally defined cell populations in the rat ventral tegmental area. Cell Reports 39:110616. doi:10.1016/j.celrep.2022.110616

      Purohit AA, Li W, Qu C, Dwyer T, Shao Q, Guan K-L, Liu G. 2012. Down Syndrome Cell Adhesion Molecule (DSCAM) Associates with Uncoordinated-5C (UNC5C) in Netrin-1-mediated Growth Cone Collapse. The Journal of biological chemistry 287:27126–27138. doi:10.1074/jbc.m112.340174

      Reynolds LM, Hernandez G, MacGowan D, Popescu C, Nouel D, Cuesta S, Burke S, Savell KE, Zhao J, Restrepo-Lozano JM, Giroux M, Israel S, Orsini T, He S, Wodzinski M, Avramescu RG, Pokinko M, Epelbaum JG, Niu Z, Pantoja-Urbán AH, Trudeau L-É, Kolb B, Day JJ, Flores C. 2023. Amphetamine disrupts dopamine axon growth in adolescence by a sex-specific mechanism in mice. Nat Commun 14:4035. doi:10.1038/s41467-023-39665-1

      Reynolds LM, Pantoja-Urbán AH, MacGowan D, Manitt C, Nouel D, Flores C. 2022. Dopaminergic System Function and Dysfunction: Experimental Approaches. Neuromethods 31–63. doi:10.1007/978-1-0716-2799-0_2

      Reynolds LM, Pokinko M, Torres-Berrío A, Cuesta S, Lambert LC, Pellitero EDC, Wodzinski M, Manitt C, Krimpenfort P, Kolb B, Flores C. 2018a. DCC Receptors Drive Prefrontal Cortex Maturation by Determining Dopamine Axon Targeting in Adolescence. Biological psychiatry 83:181–192. doi:10.1016/j.biopsych.2017.06.009

      Reynolds LM, Yetnikoff L, Pokinko M, Wodzinski M, Epelbaum JG, Lambert LC, Cossette M-P, Arvanitogiannis A, Flores C. 2018b. Early Adolescence is a Critical Period for the Maturation of Inhibitory Behavior. Cerebral cortex 29:3676–3686. doi:10.1093/cercor/bhy247

      Schlienger S, Yam PT, Balekoglu N, Ducuing H, Michaud J-F, Makihara S, Kramer DK, Chen B, Fasano A, Berardelli A, Hamdan FF, Rouleau GA, Srour M, Charron F. 2023. Genetics of mirror movements identifies a multifunctional complex required for Netrin-1 guidance and lateralization of motor control. Sci Adv 9:eadd5501. doi:10.1126/sciadv.add5501

      Shao Q, Yang T, Huang H, Alarmanazi F, Liu G. 2017. Uncoupling of UNC5C with Polymerized TUBB3 in Microtubules Mediates Netrin-1 Repulsion. J Neurosci 37:5620–5633. doi:10.1523/jneurosci.2617-16.2017

      Srivatsa S, Parthasarathy S, Britanova O, Bormuth I, Donahoo A-L, Ackerman SL, Richards LJ, Tarabykin V. 2014. Unc5C and DCC act downstream of Ctip2 and Satb2 and contribute to corpus callosum formation. Nat Commun 5:3708. doi:10.1038/ncomms4708

      Torres-Berrío A, Lopez JP, Bagot RC, Nouel D, Dal-Bo G, Cuesta S, Zhu L, Manitt C, Eng C, Cooper HM, Storch K-F, Turecki G, Nestler EJ, Flores C. 2017. DCC Confers Susceptibility to Depression-like Behaviors in Humans and Mice and Is Regulated by miR-218. Biological psychiatry 81:306–315. doi:10.1016/j.biopsych.2016.08.017

      Vassilev P, Pantoja-Urban AH, Giroux M, Nouel D, Hernandez G, Orsini T, Flores C. 2021. Unique effects of social defeat stress in adolescent male mice on the Netrin-1/DCC pathway, prefrontal cortex dopamine and cognition (Social stress in adolescent vs. adult male mice). Eneuro ENEURO.0045-21.2021. doi:10.1523/eneuro.0045-21.2021

      Private Comments

      Reviewer #1

      (12) The language should be improved. Some expression is confusing (line178-179). Also some spelling errors (eg. Figure 1M).

      We have removed the word “Already” to make the sentence in lines 178-179 clearer, however we cannot find a spelling error in Figure 1M or its caption. We have further edited the manuscript for clarity and flow.

      Reviewer #2

      (1) The authors claim to have revealed how the 'timing of adolescence is programmed in the brain'. While their findings certainly shed light on molecular, circuit and behavioral processes that are unique to adolescence, their claim may be an overstatement. I suggest they refine this statement to discuss more specifically the processes they observed in the brain and animal behavior, rather than adolescence itself.

      We agree with the reviewer and have revised the manuscript to specify that we are referring to the timing of specific developmental processes that occur in the adolescent brain, not adolescence overall.

      (2) Along the same lines, the authors should also include a more substantiative discussion of how they selected their ages for investigation (for both mice and hamsters), For mice, their definition of adolescence (P21) is earlier than some (e.g. Spear L.P., Neurosci. and Beh. Reviews, 2000).

      There are certainly differences of opinion between researchers as to the precise definition of adolescence and the period it encompasses. Spear, 2000, provides one excellent discussion of the challenges related to identifying adolescence across species. This work gives specific ages only for rats, not mice (as we use here), and characterizes post-natal days 28-42 as being the conservative age range of “peak” adolescence (page 419, paragraph 1). Immediately thereafter the review states that the full adolescent period is longer than this, and it could encompass post-natal days 20-55 (page 419, paragraph 2).

      We have added the following statement to our methods:

      There is no universally accepted way to define the precise onset of adolescence. Therefore, there is no clear-cut boundary to define adolescent onset in rodents (Spear, 2000). Puberty can be more sharply defined, and puberty and adolescence overlap in time, but the terms are not interchangeable. Puberty is the onset of sexual maturation, while adolescence is a more diffuse period marked by the gradual transition from a juvenile state to independence. We, and others, suggest that adolescence in rodents spans from weaning (postnatal day 21) until adulthood, which we take to start on postnatal day 60 (Reynolds and Flores, 2021). We refer to “early adolescence” as the first two weeks postweaning (postnatal days 21-34). These ranges encompass discrete DA developmental periods (Kalsbeek et al., 1988; Manitt et al., 2011; Reynolds et al., 2018a), vulnerability to drug effects on DA circuitry (Hammerslag and Gulley, 2014; Reynolds et al., 2018a), and distinct behavioral characteristics (Adriani and Laviola, 2004; Makinodan et al., 2012; Schneider, 2013; Wheeler et al., 2013).

      References:

      Adriani W, Laviola G. 2004. Windows of vulnerability to psychopathology and therapeutic strategy in the adolescent rodent model. Behav Pharmacol 15:341–352. doi:10.1097/00008877-200409000-00005

      Hammerslag LR, Gulley JM. 2014. Age and sex differences in reward behavior in adolescent and adult rats. Dev Psychobiol 56:611–621. doi:10.1002/dev.21127

      Hoops D, Flores C. 2017. Making Dopamine Connections in Adolescence. Trends in Neurosciences 1–11. doi:10.1016/j.tins.2017.09.004

      Kalsbeek A, Voorn P, Buijs RM, Pool CW, Uylings HBM. 1988. Development of the Dopaminergic Innervation in the Prefrontal Cortex of the Rat. The Journal of Comparative Neurology 269:58–72. doi:10.1002/cne.902690105

      Makinodan M, Rosen KM, Ito S, Corfas G. 2012. A critical period for social experiencedependent oligodendrocyte maturation and myelination. Science 337:1357–1360. doi:10.1126/science.1220845

      Manitt C, Mimee A, Eng C, Pokinko M, Stroh T, Cooper HM, Kolb B, Flores C. 2011. The Netrin Receptor DCC Is Required in the Pubertal Organization of Mesocortical Dopamine Circuitry. J Neurosci 31:8381–8394. doi:10.1523/jneurosci.0606-11.2011

      Reynolds LM, Flores C. 2021. Mesocorticolimbic Dopamine Pathways Across Adolescence: Diversity in Development. Front Neural Circuit 15:735625. doi:10.3389/fncir.2021.735625

      Reynolds LM, Yetnikoff L, Pokinko M, Wodzinski M, Epelbaum JG, Lambert LC, Cossette MP, Arvanitogiannis A, Flores C. 2018. Early Adolescence is a Critical Period for the Maturation of Inhibitory Behavior. Cerebral cortex 29:3676–3686. doi:10.1093/cercor/bhy247

      Schneider M. 2013. Adolescence as a vulnerable period to alter rodent behavior. Cell and tissue research 354:99–106. Doi:10.1007/s00441-013-1581-2

      Spear LP. 2000. Neurobehavioral Changes in Adolescence. Current directions in psychological science 9:111–114. doi:10.1111/1467-8721.00072

      Wheeler AL, Lerch JP, Chakravarty MM, Friedel M, Sled JG, Fletcher PJ, Josselyn SA, Frankland PW. 2013. Adolescent Cocaine Exposure Causes Enduring Macroscale Changes in Mouse Brain Structure. J Neurosci 33:1797–1803. doi:10.1523/jneurosci.3830-12.2013

      (3) Figure 1 - the conclusions hinge on the Netrin-1 staining, as shown in panel G, but the cells are difficult to see. It would be helpful to provide clearer, more zoomed images so readers can better assess the staining. Since Netrin-1 expression reduces dramatically after P4 and they had to use antigen retrieval to see signal, it would be helpful to show some images from additional brain regions and ages to see if expression levels follow predicted patterns. For instance, based on the allen brain atlas, it seems that around P21, there should be high levels of Netrin-1 in the cerebellum, but low levels in the cortex. These would be nice controls to demonstrate the specificity and sensitivity of the antibody in older tissue.

      We do not study the cerebellum and have never stained this region; doing so now would require generating additional tissue and we’re not sure it would add enough to the information provided to be worthwhile. Note that we have stained the forebrain for Netrin-1 previously, providing broad staining of many brain regions (Manitt et al., 2011)

      References:

      Manitt C, Mimee A, Eng C, Pokinko M, Stroh T, Cooper HM, Kolb B, Flores C. 2011. The Netrin Receptor DCC Is Required in the Pubertal Organization of Mesocortical Dopamine Circuitry. J Neurosci 31:8381–8394. doi:10.1523/jneurosci.0606-11.2011

      (4) Figure 3 - Because mice tend to avoid brightly-lit spaces, the light/dark box is more commonly used as a measure of anxiety-like behavior than purely exploratory behavior (including in the paper they cited). It is important to address this possibility in their discussion of their findings. To bolster their conclusions about the coincidence of circuit and behavioral changes in adolescent hamsters, it would be useful to add an additional measure of exploratory behaviors (e.g. hole board).

      Regarding the light/dark box test, this is an excellent point. We prefer the term “risk taking” to “anxiety-like” and now use the former term in our manuscript. Furthermore, our interest in the behaviour is purely to chart the development of adolescent behaviour across our treatment groups, not to study a particular emotional state. Regardless of the specific emotion or emotions governing the light/dark box behaviour, it is an ideal test for charting adolescent shifts in behaviour as it is well-characterized in this respect, as we discuss in our manuscript.

      (5) Supplementary Figure 4,5 The authors defined puberty onset using uterine and testes weights in hamsters. While the weights appear to be different for summer and winter hamsters, there were no statistical comparison. Please add statistical analyses to bolster claims about puberty start times. Also, as many studies use vaginal opening to define puberty onset, it would be helpful to discuss how these measurements typically align and cite relevant literature that described use of uterine weights. Also, Supplementary Figures 4 and 5 were mis-cited as Supp. Fig. 2 in the text (e.g. line 317 and others).

      These are great suggestions. We have added statistical analyses to Supplementary Figures 5 and 6 and provided Vaginal Opening data as Supplementary Figure 7. The statistical analyses confirm that all three characters are delayed in winter hamsters compared to summer hamsters.

      We have also added the following references to the manuscript:

      Darrow JM, Davis FC, Elliott JA, Stetson MH, Turek FW, Menaker M. 1980. Influence of Photoperiod on Reproductive Development in the Golden Hamster. Biol Reprod 22:443–450. doi:10.1095/biolreprod22.3.443

      Ebling FJP. 1994. Photoperiodic Differences during Development in the Dwarf Hamsters Phodopus sungorus and Phodopus campbelli. Gen Comp Endocrinol 95:475–482. doi:10.1006/gcen.1994.1147

      Timonin ME, Place NJ, Wanderi E, Wynne-Edwards KE. 2006. Phodopus campbelli detect reduced photoperiod during development but, unlike Phodopus sungorus, retain functional reproductive physiology. Reproduction 132:661–670. doi:10.1530/rep.1.00019

      (6) The font in many figure panels is small and hard to read (e.g. 1A,D,E,H,I,L...). Please increase the size for legibility.

      We have increased the font size of our figure text throughout the manuscript.

      Reviewer #3

      (15) Fig 1 C,D. Clarify the units of the y axis

      We have now fixed this.

      Full Reference List

      Adriani W, Laviola G. 2004. Windows of vulnerability to psychopathology and therapeutic strategy in the adolescent rodent model. Behav Pharmacol 15:341–352. doi:10.1097/00008877-200409000-00005

      Hammerslag LR, Gulley JM. 2014. Age and sex differences in reward behavior in adolescent and adult rats. Dev Psychobiol 56:611–621. doi:10.1002/dev.21127

      Hoops D, Flores C. 2017. Making Dopamine Connections in Adolescence. Trends in Neurosciences 1–11. doi:10.1016/j.tins.2017.09.004

      Kalsbeek A, Voorn P, Buijs RM, Pool CW, Uylings HBM. 1988. Development of the Dopaminergic Innervation in the Prefrontal Cortex of the Rat. The Journal of Comparative Neurology 269:58–72. doi:10.1002/cne.902690105

      Makinodan M, Rosen KM, Ito S, Corfas G. 2012. A critical period for social experiencedependent oligodendrocyte maturation and myelination. Science 337:1357–1360. doi:10.1126/science.1220845

      Manitt C, Mimee A, Eng C, Pokinko M, Stroh T, Cooper HM, Kolb B, Flores C. 2011. The Netrin Receptor DCC Is Required in the Pubertal Organization of Mesocortical Dopamine Circuitry. J Neurosci 31:8381–8394. doi:10.1523/jneurosci.0606-11.2011

      Reynolds LM, Flores C. 2021. Mesocorticolimbic Dopamine Pathways Across Adolescence: Diversity in Development. Front Neural Circuit 15:735625. doi:10.3389/fncir.2021.735625 Reynolds LM, Yetnikoff L, Pokinko M, Wodzinski M, Epelbaum JG, Lambert LC, Cossette M-P, Arvanitogiannis A, Flores C. 2018. Early Adolescence is a Critical Period for the Maturation of Inhibitory Behavior. Cerebral cortex 29:3676–3686. doi:10.1093/cercor/bhy247

      Schneider M. 2013. Adolescence as a vulnerable period to alter rodent behavior. Cell and tissue research 354:99–106. doi:10.1007/s00441-013-1581-2

      Spear LP. 2000. Neurobehavioral Changes in Adolescence. Current directions in psychological science 9:111–114. doi:10.1111/1467-8721.00072

      Wheeler AL, Lerch JP, Chakravarty MM, Friedel M, Sled JG, Fletcher PJ, Josselyn SA, Frankland PW. 2013. Adolescent Cocaine Exposure Causes Enduring Macroscale Changes in Mouse Brain Structure. J Neurosci 33:1797–1803. doi:10.1523/jneurosci.3830-12.2013

    1. Author Response

      The following is the authors’ response to the original reviews.

      eLife assessment

      This important study combines a range of advanced ultrastructural imaging approaches to define the unusual endosomal system of African trypanosomes. Compelling images show that instead of a distinct set of compartments, the endosome of these protists comprises a continuous system of membranes with functionally distinct subdomains as defined by canonical markers of early, late and recycling endosomes. The findings suggest that the endocytic system of bloodstream stages has evolved to facilitate the extraordinarily high rates of membrane turnover needed to remove immune complexes and survive in the blood, which is of interest to anyone studying infectious diseases.

      Public Reviews:

      Reviewer #1 (Public Review):

      Summary:

      Bloodstream stages of the parasitic protist, Trypanosoma brucei, exhibit very high rates of constitutive endocytosis, which is needed to recycle the surface coat of Variant Surface Glycoproteins (VSGs) and remove surface immune complexes. While many studies have shown that the endo-lysosomal systems of T. brucei BF stages contain canonical domains, as defined by classical Rab markers, it has remained unclear whether these protists have evolved additional adaptations/mechanisms for sustaining these very high rates of membrane transport and protein sorting. The authors have addressed this question by reconstructing the 3D ultrastructure and functional domains of the T. brucei BF endosome membrane system using advanced electron tomography and super-resolution microscopy approaches. Their studies reveal that, unusually, the BF endosome network comprises a continuous system of cisternae and tubules that contain overlapping functional subdomains. It is proposed that a continuous membrane system allows higher rates of protein cargo segregation, sorting and recycling than can otherwise occur when transport between compartments is mediated by membrane vesicles or other fusion events.

      Strengths:

      The study is a technical tour-de-force using a combination of electron tomography, super-resolution/expansion microscopy, immune-EM of cryo-sections to define the 3D structures and connectivity of different endocytic compartments. The images are very clear and generally support the central conclusion that functionally distinct endocytic domains occur within a dynamic and continuous endosome network in BF stages.

      Weaknesses:

      The authors suggest that this dynamic endocytic network may also fulfil many of the functions of the Golgi TGN and that the latter may be absent in these stages. Although plausible, this comment needs further experimental support. For example, have the authors attempted to localize canonical makers of the TGN (e.g. GRIP proteins) in T. brucei BF and/or shown that exocytic carriers bud directly from the endosomes?

      We agree with the criticism and have shortened the discussion accordingly and clearly marked it as speculation. However, we do not want to completely abandon our hypothesis.

      The paragraph now reads:

      Lines 740 – 751:

      “Interestingly, we did not find any structural evidence of vesicular retrograde transport to the Golgi. Instead, the endosomal ‘highways’ extended throughout the posterior volume of the trypanosomes approaching the trans-Golgi interface. It is highly plausible that this region represents the convergence point where endocytic and biosynthetic membrane trafficking pathways merge. A comparable merging of endocytic and biosynthetic functions has been described for the TGN in plants. Different marker proteins for early and recycling endosomes were shown to be associated and/ or partially colocalized with the TGN suggesting its function in both secretory and endocytic pathways (reviewed in Minamino and Ueda, 2019). As we could not find structural evidence for the existence of a TGN we tentatively propose that trypanosomes may have shifted the central orchestrating function of the TGN as a sorting hub at the crossroads of biosynthetic and recycling pathways to the endosome. Although this is a speculative scenario, it is experimentally testable.”

      Furthermore, we removed the lines 51 - 52, which included the suggestion of the TGN as a master regulator, from the abstract.

      Reviewer #2 (Public Review):

      The authors suggest that the African trypanosome endomembrane system has unusual organisation, in that the entire system is a single reticulated structure. It is not clear if this is thought to extend to the lysosome or MVB. There is also a suggestion that this unusual morphology serves as a trans-(post)Golgi network rather than the more canonical arrangement.

      The work is based around very high-quality light and electron microscopy, as well as utilising several marker proteins, Rab5A, 11 and 7. These are deemed as markers for early endosomes, recycling endosomes and late or pre-lysosomes. The images are mostly of high quality but some inconsistencies in the interpretation, appearance of structures and some rather sweeping assumptions make this less easy to accept. Two perhaps major issues are claims to label the entire endosomal apparatus with a single marker protein, which is hard to accept as certainly this reviewer does not really even know where the limits to the endosomal network reside and where these interface with other structures. There are several additional compartments that have been defined by Rob proteins as well, and which are not even mentioned. Overall I am unconvinced that the authors have demonstrated the main things they claim.<br /> The endomembrane system in bloodstream form T. brucei is clearly delimited. Compared to mammalian cells it is tidy and confined to the posterior part of the spindleshaped cell. The endoplasmic reticulum is linked to one side of the longitudinal cell axis, marked by the attached flagellum, while the mitochondrion locates to the opposite side. Glycosomes are easily identifiable as spheres, as are acidocalcisomes, which are smaller than glycosomes and – in electron micrographs – are characterized by high electron density. All these organelles extend beyond the nucleus, which is not the case for the endosomal compartment, the lysosome and the Golgi. The vesicles found in the posterior half of the trypanosome cell are quantitatively identifiable as COP1, CCVI or CCVII vesicles, or exocytic carriers. The lysosome has a higher degree of morphological plasticity, but this is not topic of the present work. Thus, the endomembrane system in T. brucei is comparatively well structured and delimited, which is why we have chosen trypanosomes as cell biological model.

      We have published EP1::GFP as marker for the endosome system and flagellar pocket back in 2004. We have defined the fluid phase volume of the trypanosome endosome in papers published between 2002 and 2007. This work was not intended to represent the entirety of RAB proteins. We were only interested in 3 canonical markers for endosome subtypes. We do not claim anything that is not experimentally tested, we have clearly labelled our hypotheses as such, and we do not make sweeping assumptions.

      The approaches taken are state-of-the-art but not novel, and because of the difficulty in fully addressing the central tenet, I am not sure how much of an impact this will have beyond the trypanosome field. For certain this is limited to workers in the direct area and is not a generalisable finding.

      To the best of our knowledge, there is no published research that has employed 3D Tokuyasu or expansion microscopy (ExM) to label endosomes. The key takeaway from our study, which is the concept that "endosomes are continuous in trypanosomes" certainly is novel. We are not aware of any other report that has demonstrated this aspect.

      The doubts formulated by the reviewer regarding the impact of our work beyond the field of trypanosomes are not timely. Indeed, our results, and those of others, show that the conclusions drawn from work with just a few model organisms is not generalisable. We are finally on the verge of a new cell biology that considers the plethora of evolutionary solutions beyond ophistokonts. We believe that this message should be widely acknowledged and considered. And we are certainly not the only ones who are convinced that the term "general relevance" is unscientific and should no longer be used in biology.

      Reviewer #3 (Public Review):

      Summary:

      As clearly highlighted by the authors, a key plank in the ability of trypanosomes to evade the mammalian host’s immune system is its high rate of endocytosis. This rapid turnover of its surface enables the trypanosome to ‘clean’ its surface removing antibodies and other immune effectors that are subsequently degraded. The high rate of endocytosis is likely reflected in the organisati’n and layout of the endosomal system in these parasites. Here, Link et al., sought to address this question using a range of light and three-dimensional electron microscopy approaches to define the endosomal organisation in this parasite.

      Before this study, the vast majority of our information about the make-up of the trypanosome endosomal system was from thin-section electron microscopy and immunofluorescence studies, which did not provide the necessary resolution and 3D information to address this issue. Therefore, it was not known how the different structures observed by EM were related. Link et al., have taken advantage of the advances in technology and used an impressive combination of approaches at the LM and EM level to study the endosomal system in these parasites. This innovative combination has now shown the interconnected-ness of this network and demonstrated that there are no ‘classical’ compartments within the endosomal system, with instead different regions of the network enriched in different protein markers (Rab5a, Rab7, Rab11).

      Strengths:

      This is a generally well-written and clear manuscript, with the data well-presented supporting the majority of the conclusions of the authors. The authors use an impressive range of approaches to address the organisation of the endosomal system and the development of these methods for use in trypanosomes will be of use to the wider parasitology community.

      I appreciate their inclusion of how they used a range of different light microscopy approaches even though for instance the dSTORM approach did not turn out to be as effective as hoped. The authors have clearly demonstrated that trypanosomes have a large interconnected endosomal network, without defined compartments and instead show enrichment for specific Rabs within this network.

      Weaknesses:

      My concerns are:

      i) There is no evidence for functional compartmentalisation. The classical markers of different endosomal compartments do not fully overlap but there is no evidence to show a region enriched in one or other of these proteins has that specific function. The authors should temper their conclusions about this point.

      The reviewer is right in stating that Rab-presence does not necessarily mean Rabfunction. However, this assumption is as old as the Rab literature. That is why we have focused on the 3 most prominent endosomal marker proteins. We report that for endosome function you do not necessarily need separate membrane compartments. This is backed by our experiments.

      ii) The quality of the electron microscopy work is very high but there is a general lack of numbers. For example, how many tomograms were examined? How often were fenestrated sheets seen? Can the authors provide more information about how frequent these observations were?

      The fenestrated sheets can be seen in the majority of the 37 tomograms recorded of the posterior volume of the parasites. Furthermore, we have randomly generated several hundred tiled (= very large) electron micrographs of bloodstream form trypanosomes for unbiased analyses of endomembranes. In these 2D-datasets the “footprint” of the fenestrated flat and circular cisternae is frequently detectable in the posterior cell area.

      We now have included the corresponding numbers in all EM figure legends.

      iii) The EM work always focussed on cells which had been processed before fixing. Now, I understand this was important to enable tracers to be used. However, given the dynamic nature of the system these processing steps and feeding experiments may have affected the endosomal organisation. Given their knowledge of the system now, the authors should fix some cells directly in culture to observe whether the organisation of the endosome aligns with their conclusions here.

      This is a valid criticism; however, it is the cell culture that provides an artificial environment. As for a possible effect of cell harvesting by centrifugation on the integrity and functionality of the endosome system, we consider this very unlikely for one simple reason. The mechanical forces acting in and on the parasites as they circulate in the extremely crowded and confined environment of the mammalian bloodstream are obviously much higher than the centrifugal forces involved in cell preparation. This becomes particularly clear when one considers that the mass of the particle to be centrifuged determines the actual force exerted by the g-forces. Nevertheless, the proposed experiment is a good control, although much more complex than proposed, since tomography is a challenging technique. We have performed the suggested experiment and acquired tomograms of unprocessed cells. The corresponding data is now included as supplementary movie 2, 3 and 4. We refer to it in lines 202 – 206: To investigate potential impacts of processing steps (cargo uptake, centrifugation, washing) on endosomal organization, we directly fixed cells in the cell culture flask, embedded them in Epon, and conducted tomography. The resulting tomograms revealed endosomal organization consistent with that observed in cells fixed after processing (see Supplementary movie 2, 3, and 4).

      We furthermore thank the reviewer for the experiment suggestion in the acknowledgments.

      iv) The discussion needs to be revamped. At the moment it is just another run through of the results and does not take an overview of the results presenting an integrated view. Moreover, it contains reference to data that was not presented in the results.

      We have improved the discussion accordingly.

      Recommendations for the authors:

      The reviewers concurred about the high calibre of the work and the importance of the findings.

      They raised some issues and made some suggestions to improve the paper without additional experiments - key issues include

      (1) Better referencing of the trypanosome endocytosis/ lysosomal trafficking literature.

      The literature, especially the experimental and quantitative work, is very limited. We now provide a more complete set of references. However, we would like to mention that we had cited a recent review that critically references the trypanosome literature with emphasis on the extensive work done with mammalian cells and yeast.

      (2) Moving the dSTORM data that detracts from otherwise strong data in a supplementary figure.

      We have done this.

      (3) Removal of the conclusion that the continuous endosome fulfils the functions of TGN, without further evidence.

      As stated above, this was not a conclusion in our paper, but rather a speculation, which we have now more clearly marked as such. Lines 740 to 751 now read:

      “Interestingly, we did not find any structural evidence of vesicular retrograde transport to the Golgi. Instead, the endosomal ‘highways’ extended throughout the posterior volume of the trypanosomes approaching the trans-Golgi interface. It is highly plausible that this region represents the convergence point where endocytic and biosynthetic membrane trafficking pathways merge. A comparable merging of endocytic and biosynthetic functions was already described for the TGN in plants. Different marker proteins for early and recycling endosomes were shown to be associated and/ or partially colocalized with the TGN suggesting its function in both secretory and endocytic pathways (reviewed in Minamino and Ueda, 2019). As we could not find structural evidence for the existence of a TGN we tentatively propose that trypanosomes may have shifted the central orchestrating function of the TGN as a sorting hub at the crossroads of biosynthetic and recycling pathways to the endosome. Although this is a speculative scenario, it is experimentally testable.”

      (4) Broader discussion linking their findings to other examples of organelle maturation in eukaryotes (e.g cisternal maturation of the Golgi)

      We have improved the discussion accordingly.

      Reviewer #1 (Recommendations For The Authors):

      What are the multi-vesicular vesicles that surround the marked endosomal compartments in Fig 1. Do they become labelled with fluid phase markers with longer incubations (e.g late endosome/ lysosomal)?

      The function of MVBs in trypanosomes is still far from being clear. They are filled with fluid phase cargo, especially ferritin, but are devoid of VSG. Hence it is likely that MVBs are part of the lysosomal compartment. In fact, this part of the endomembrane system is highly dynamic. MVBs can be physically connected to the lysosome or can form elongated structures. The surprising dynamics of the trypanosome lysosome will be published elsewhere.

      Figure 2. The compartments labelled with EP1::Halo are very poorly defined due to the low levels of expression of the reporter protein and/or sensitivity of detection of the Halo tag. Based on these images, it would be hard to conclude whether the endosome network is continuous or not. In this respect, it is unclear why the authors didn't use EP1-GFP for these analyses? Given the other data that provides more compelling evidence for a single continuous compartment, I would suggest removing Fig 2A.

      We have used EP1::GFP to label the entire endosome system (Engstler and Boshart, 2004). Unfortunately, GFP is not suited for dSTORM imaging. By creating the EP1::Halo cell line, we were able to utilize the most prominent dSTORM fluorescent dye, Alexa 647. This was not primarily done to generate super resolution images, but rather to measure the dynamics of the GPI-anchored, luminal protein EP with single molecule precision. The results from this study will be published separately. But we agree with the reviewer and have relocated the dSTORM data to the supplementary material.

      The observation that Rab5a/7 can be detected in the lumen of lysosome is interesting. Mechanistically, this presumably occurs by invagination of the limiting membrane of the lysosome. Is there any evidence that similar invagination of cytoplasmic markers occurs throughout or in subdomains of the endocytic network (possibly indicative of a 'late endosome' domain)?

      So far, we have not observed this. The structure of the lysosome and the membrane influx from the endosome are currently being investigated.

      The authors note that continuity of functionally distinct membrane compartments in the secretory/endocytic pathways has been reported in other protists (e.g T. cruzi). A particular example that could be noted is the endo-lysosomal system of Dictyostelium discoideum which mediates the continuous degradation and eventual expulsion of undigested material.

      We tried to include this in the discussion but ultimately decided against it because the Dictyostelium system cannot be easily compared to the trypanosome endosome.

      Reviewer #2 (Recommendations For The Authors):

      Abstract

      Not sure that 'common' is the correct term here. Frequent, near-universal..... it would be true that endocytosis is common across most eukaryotes.

      We have changed the sentence to “common process observed in most eukaryotes” (line 33).

      Immune evasion - the parasite does not escape the immune system, but does successfully avoid its impact, at least at the population level.

      We have replaced the word “escape” with “evasion” (line 35).

      The third sentence needs to follow on correctly from the second. Also, more than Igs are internalised and potentially part of immune evasion, such as C3, Factor H, ApoL1 etcetera.

      We believe that there may be a misunderstanding here. The process of endocytic uptake and lysosomal degradation has so far only been demonstrated in the context of VSGbound antibodies, which is why we only refer to this. Of course, the immune system comprises a wide range of proteins and effector molecules, all of which could be involved in immune evasion.

      I do not follow the logic that the high flux through the endocytic system in trypanosomes precludes distinct compartmentalisation - one could imagine a system where a lot of steps become optimised for example. This idea needs expanding on if it is correct.

      Membrane transport by vesicle transfer between several separate membrane compartments would be slower than the measured rate of membrane flux.

      Again I am not sure 'efficient' on line 40. It is fast, but how do you measure efficiency? Speed and efficiency are not the same thing.

      We have replaced the word “efficient” with “fast” (line 42).

      The basis for suggesting endosomes as a TGN is unclear. Given that there are AP complexes, retromer, exocyst and other factors that are part of the TGN or at least post-G differentiation of pathways in canonical systems, this seems a step too far. There really is no evidence in the rest of the MS that seems to support this.

      Yes, we agree and have clarified the discussion accordingly. We have not completely removed the discussion on the TGN but have labelled it more clearly as speculation.

      I am aware I am being pedantic here, but overall the abstract seems to provide an impression of greater novelty than may be the case and makes several very bold claims that I cannot see as fully valid.

      We are not aware of any claim in the summary that we have not substantiated with experiments, or any hypothesis that we have not explained.

      Moreover, the concept of fused or multifunctional endosomes (or even other endomembrane compartments) is old, and has been demonstrated in metazoan cells and yeast. The concept of rigid (in terms of composition) compartments really has been rejected by most folks with maturation, recycling and domain structures already well-established models and concepts.

      We agree that the (transient) presence of multiple Rab proteins decorating endosomes has been demonstrated in various cell types. This finding formed the basis for the endosomal maturation model in mammals and yeast, which has replaced the previous rigid compartment model.

      However, we do not appreciate attempts to question the originality of our study by claiming that similar observations have been made in metazoans or yeast. This is simply wrong. There are no reports of a functionally structured, continuous, single and large endosome in any other system. The only membrane system that might be similar was described in the American parasite Trypanosoma cruzi, however, without the use of endosome markers or any functional analysis. We refer to this study in the discussion.

      In summary, the maturation model falls short in explaining the intricacies of the membrane system we have uncovered in trypanosomes. Therefore, one plausible interpretation of our data is that the overall architecture of the trypanosome endosomes represents an adaptation that enables the remarkable speed of plasma membrane recycling observed in these parasites. In our view, both our findings and their interpretation are novel and worth reporting. Again, modern cell biology should recognize that evolution has developed many solutions for similar processes in cells, about whose diversity we have learned almost nothing because of our reductionist view. A remarkable example of this are the Picozoa, tiny bipartite eukaryotes that pack the entire nutritional apparatus into one pouch and the main organelles with the locomotor system into the other. Another one is the “extreme” cell biology of many protozoan parasites such as Giardia, Toxpoplasma or Trypanosoma.

      Higher plants have been well characterised, especially at the level of Rab/Arf proteins and adaptins.

      We now mention plant endosomes in our brief discussion of the trypanosome TGN. Lines 744 – 747:

      “A comparable merging of endocytic and biosynthetic functions was already described for the TGN in plants. Different marker proteins for early and recycling endosomes were shown to be associated and/ or partially colocalized with the TGN suggesting its function in both secretory and endocytic pathways (reviewed in Minamino and Ueda, 2019).”

      The level of self-citing in the introduction is irritating and unscholarly. I have no qualms with crediting the authors with their own excellent contributions, but work from Dacks, Bangs, Field and others seems to be selectively ignored, with an awkward use of the authors' own publications. Diversity between organisms for example has been a mainstay of the Dacks lab output, Rab proteins and others from Field and work on exocytosis and late endosomal systems from Bangs. These efforts and contributions surely deserve some recognition?

      This is an original article and not a review. For a comprehensive overview the reviewer might read our recent overview article on exo- and endocytic pathways in trypanosomes, in which we have extensively cited the work of Mark Field, Jay Bangs and Joel Dacks. In the present manuscript, we have cited all papers that touch on our results or are otherwise important for a thorough understanding of our hypotheses. We do not believe that this approach is unscientific, but rather improves the readability of the manuscript. Nevertheless, we have now cited additional work.

      For the uninitiated, the posterior/anterior axis of the trypanosome cell as well as any other specific features should be defined.

      In lines 102 - 110 we wrote:

      “This process of antibody clearance is driven by hydrodynamic drag forces resulting from the continuous directional movement of trypanosomes (Engstler et al., 2007). The VSG-antibody complexes on the cell surface are dragged against the swimming direction of the parasite and accumulate at the posterior pole of the cell. This region harbours an invagination in the plasma membrane known as the flagellar pocket (FP) (Gull, 2003; Overath et al., 1997). The FP, which marks the origin of the single attached flagellum, is the exclusive site for endo- and exocytosis in trypanosomes (Gull, 2003; Overath et al., 1997). Consequently, the accumulation of VSG-antibody complexes occurs precisely in the area of bulk membrane uptake.”

      We think this sufficiently introduces the cell body axes.

      I don't understand the comment concerning microtubule association. In mammalian cells, such association is well established, but compartments still do not display precise positioning. This likely then has nothing to do with the microtubule association differences.

      We have clarified this in the text (lines 192 – 199). There is no report of cytoplasmic microtubules in trypanosomes. All microtubules appear to be either subpellicular or within the flagellum. To maintain the structure and position of the endosomal apparatus, they should be associated either with subpellicular microtubules, as is the case with the endoplasmic reticulum, or with the more enigmatic actomyosin system of the parasites. We have been working on the latter possibility and intend to publish a follow-up paper to the present manuscript.

      The inability to move past the nucleus is a poor explanation. These compartments are dynamic. Even the nucleus does interesting things in trypanosomes and squeezes past structures during development in the tsetse fly.

      The distance between the nucleus and the microtubule cytoskeleton remains relatively constant even in parasites that squeeze through microfluidic channels. This is not unexpected as the nucleus can be highly deformed. A structure the size of the endosome will not be able to physically pass behind the nucleus without losing its integrity. In fact, the recycling apparatus is never found in the anterior part of the trypanosome, most probably because the flagellar pocket is located at the posterior cell pole.

      L253 What is the evidence that EP1 labels the entire FP and endosomes? This may be extensive, but this claim requires rather more evidence. This is again suggested at l263. Again, please forgive me for being pedantic, but this is an overstatement unless supported by evidence that would be incredibly difficult to obtain. This is even sort of acknowledged on l271 in the context of non-uniform labelling. This comes again in l336.

      The evidence that EP1 labels the entire FP and endosomes is presented here: Engstler and Boshart, 2004; 10.1101/gad.323404).

      Perhaps I should refrain from comments on the dangers of expansion microscopy, or asking what has actually been gained here. Oddly, the conclusion on l290 is a fair statement that I am happy with.

      An in-depth discussion regarding the advantages and disadvantages of expansion microscopy is beyond the manuscript's intended scope. Our approach involved utilizing various imaging techniques to confirm the validity of our findings. We appreciate that our concluding sentence is pleasing.

      F2 - The data in panel A seem quite poor to me. I also do not really understand why the DAPI stain in the first and second columns fails to coincide or why the kinetoplast is so diffuse in the second row. The labelling for EP1 presents as very small puncta, and hence is not evidence for a continuum. What is the arrow in A IV top? The data in panel B are certainly more in line with prior art, albeit that there is considerable heterogeneity in the labelling and of the FP for example. Again, I cannot really see this as evidence for continuity. There are gaps.... Albeit I accept that labelling of such structures is unlikely to ever be homogenous.

      We agree that the dSTORM data represents the least robust aspect of the findings we have presented, and we concur with relocating it to the supplementary material.

      F3 - Rather apparent, and specifically for Rab7, that there is differential representation - for example, Cell 4 presents a single Rab7 structure while the remaining examples demonstrate more extensive labelling. Again, I am content that these are highly dynamic strictures but this needs to be addressed at some level and commented upon. If the claim is for continuity, the dynamics observed here suggest the usual; some level of obvious overlap of organellar markers, but the representation in F3 is clever but not sure what I am looking at. Moreover, the title of the figure is nothing new. What is also a bit odd is that the extent of the Rab7 signal, and to some extent the other two Rabs used, is rather variable, which makes this unclear to me as to what is being detected. Given that the Rab proteins may be defining microdomains or regions, I would also expect a region of unique straining as well as the common areas. This needs to at least be discussed.

      The differences in the representation result from the dynamics of the labelled structures. Therefore, we have selected different cells to provide examples of what the labelling can look like. We now mention this in the results section.

      The overlap of the different Rab signals was perhaps to be expected, but we now have demonstrated it experimentally. Importantly, we performed a rigorous quantification by calculating the volume overlaps and the Pearson correlation coefficients.

      In previous studies the data were presented as maximal intensity projections, which inherently lack the complete 3D information.

      We found that Rab proteins define microdomains and that there are regions of unique staining as well as common areas, as shown in Figure 3. The volumes do not completely overlap. This is now more clearly stated in lines 315 – 319:

      “These objects showed areas of unique staining as well as partially overlapping regions. The pairwise colocalization of different endosomal markers is shown in Figure 3 A, XI - XIII and 3 B. The different cells in Figure 3 B were selected to represent the dynamic nature of the labelled structures. Consequently, the selected cells provide a variety of examples of how the labelling can appear.”

      This had already been stated in lines 331 – 336:

      “In summary, the quantitative colocalization analyses revealed that on the one hand, the endosomal system features a high degree of connectivity, with considerable overlap of endosomal marker regions, and on the other hand, TbRab5A, TbRab7, and TbRab11 also demarcate separated regions in that system. These results can be interpreted as evidence of a continuous endosomal membrane system harbouring functional subdomains, with a limited amount of potentially separated early, late or recycling endosomes.”

      F4-6 - Fabulous images. But a couple of issues here; first, as the authors point out, there is distance between the gold and the antigen. So, this of course also works in the z-plane as well as the x/y-planes and some of the gold may well be associated with membraneous figures that are out of the plane, which would indicate an absence of colinearity on one specific membrane. Secondly, in several instances, we have Rab7 essentially mixed with Rab11 or Rab5 positive membrane. While data are data and should be accepted, this is difficult to reconcile when, at least to some level, Rab7 is a marker for a late-endosomal structure and where the presence of degradative activity could reside. As division of function is, I assume, the major reason for intracellular compartmentalisation, such a level of admixture is hard to rationalise. A continuum is one thing but the data here seem to be suggesting something else, i.e. almost complete admixture.

      We are grateful for the positive feedback regarding the image quality. It is true that the "linkage error," representing the distance between the gold and the antigen, also functions to some extent in the z-axis. However, it's important to note that the zdimension of the section in these Figures is 55 nm. Nevertheless, it's interesting to observe that membranes, which may not be visible within the section itself but likely the corresponding Rab antigen, is discernible in Figure 4C (indicated by arrows).

      We have clarified this in lines 397 – 400:

      “Consequently, gold particles located further away may represent cytoplasmic TbRab proteins or, as the “linkage error” can also occur in the z-plane, correspond to membranes that are not visible within the 55 nm thickness of the cryosection (Figure 4, panel C, arrows). “

      The coexistence of different Rabs is most likely concentrated in regions where transitions between different functions are likely. Our focus was primarily on imaging membranes labelled with two markers. We wanted to show that the prevailing model of separate compartments in the trypanosome literature is not correct.

      F7 - Not sure what this adds beyond what was published by Grunfelder.

      First, this figure is an important control that links our results to published work (Grünfelder et al. (2003)). Second, we include double staining of cargo with Rab5, Rab7, and Rab11, whereas Grünfelder focused only on Rab11. Therefore, our data is original and of such high quality that it warrants a main figure.

      F8 - and l583. This is odd as the claim is 'proof' which in science is a hard thing to claim (and this is definitely not at a six sigma level of certainty, as used by the physics community). However, I am seeing structures in the tomograms which are not contiguous - there are gaps here between the individual features (Green in the figure).

      We have replaced the term "proof". It is important to note that the structures in individual tomograms cannot all be completely continuous because the sections are limited to a thickness of 250 nm. Therefore, it is likely that they have more connectivity above and below the imaged section. Nevertheless, we believe that the quality of the tomograms is satisfactory, considering that 3D Tokuyasu is a very demanding technique and the production of serial Tokuyasu tomograms is not feasible in practice.

      Discussion - Too long and the self-citing of four papers from the corresponding author to the exclusion of much prior work is again noted, with concerns about this as described above. Moreover, at least four additional Rab proteins are known associated with the trypanosome endosomal system, 4, 5B, 21 and 28. These have been completely ignored.

      We have outlined our position on referencing in original articles above. We also explained why we focused on the key marker proteins associated with early (Rab5), late (Rab7) and recycling endosomes (Rab11). We did not ignore the other Rabs, we just did not include them in the present study.

      Overall this is disappointing. I had expected a more robust analysis, with a clearer discussion and placement in context. I am not fully convinced that what we have here is as extreme as claimed, or that we have a substantial advance. There is nothing here that is mechanistic or the identification of a new set of gene products, process or function.

      We do not think that this is constructive feedback.

      This MS suggests that the endosomal system of African trypanosomes is a continuum of membrane structures rather than representing a set of distinct compartments. A combination of light and electron microscopy methods are used in support. The basic contention is very challenging to prove, and I'm not convinced that this has been. Furthermore, I am also unclear as to the significance of such an organisation; this seems not really addressed.

      We acknowledge and respect varying viewpoints, but we hold a differing perspective in this matter. We are convinced that the data decisively supports our interpretation. May future work support or refute our hypothesis.

      Reviewer #3 (Recommendations For The Authors):

      Line 81 - delete 's

      Done.

      Generally, the introduction was very well written and clearly summarised our current understanding but the paragraph beginning line 134 felt out of place and repeated some of the work mentioned earlier.

      We have removed this paragraph.

      For the EM analysis throughout quantification would be useful as highlighted in the public review. How many tomograms were examined, and how often were types of structures seen? I understand the sample size is often small but this would help the reader appreciate the diversity of structures seen.

      We have included the numbers.

      Following on from this how were the cells chosen for tomogram analysis? For example, the dividing cell in 1D has palisades associating with the new pocket - is this commonly seen? Does this reflect something happening in dividing cells. This point about endosomal division was picked up in the discussion but there was little about in the main results.

      This issue is undoubtedly inherent to the method itself, and we have made efforts to mitigate it by generating a series of tomograms recorded randomly. We have refrained from delving deeper into the intricacies of the cell cycle in this manuscript, as we believe that it warrants a separate paper.

      As the authors prosecute, the co-localisation analysis highlights the variable nature of the endosome and the overlap of different markers. When looking at the LM analysis, I was struck by the variability in the size and number of labelled structures in the different cells. For example, in 3A Rab7 is 2 blobs but in 3B Cell 1 it is 4/5 blobs. Is this just a reflection of the increase in the endosome during the cell cycle?

      The variability in representation is a direct consequence of the dynamic nature of the labelled structures. For this reason, we deliberately selected different cells to represent examples of how the labelling can look like. We have decided not to mention the dynamics of the endosome during the cell cycle. This will be the subject of a further report.

      Moreover, Rab 11 looks to be the marker covering the greatest volume of the endosomal system - is this true? I think there's more analysis of this data that could be done to try and get more information about the relative volumes etc of the different markers that haven't been drawn out. The focus here is on the co-localisation.

      Precisely because we recognize the importance of this point, we intend to turn our attention to the cell cycle in a separate publication.

      I appreciate that it is an awful lot of work to perform the immuno-EM and the data is of good quality but in the text, there could be a greater effort to tie this to the LM data. For example, from the Rab11 staining in LM you would expect this marker to be the most extensive across the networks - is this reflected in the EM?

      For the immuno-EM there were no numbers, the authors had measured the position of the gold but what was the proportion of gold that was in/near membranes for each marker? This would help the reader understand both the number of particles seen and the enrichment of the different regions.

      Our original intent was to perform a thorough quantification (using stereology) of the immuno-EM data. However, we later realized that the necessary random imaging approach is not suitable for Tokuyasu sections of trypanosomes. In short, the cells are too far apart, and the cell sections are only occasionally cut so that the endosomal membranes are sufficiently visible. Nevertheless, we continue to strive to generate more quantitative data using conventional immuno-EM.

      The innovative combination of Tokuyasu tomograms with immuno-EM was great. I noted though that there was a lack of fenestration in these models. Does this reflect the angle of the model or the processing of these samples?

      We are grateful to the referee, as we have asked ourselves the same question. However, we do not attribute the apparent lack of fenestration to the viewing angle, since we did not find fenestration in any of the Tokuyasu tomograms. Our suspicion is more directed towards a methodological problem. In the Tokuyasu workflow, all structures are mainly fixed with aldehydes. As a result, lipids are only effectively fixed through their association with membrane proteins. We suggest that the fenestration may not be visible because the corresponding lipids may have been lost due to incomplete fixation.

      We now clearly state this in the lines 563 – 568.

      “Interestingly, these tomograms did not exhibit the fenestration pattern identified in conventional electron tomography. We suspect that this is due to methodological reasons. The Tokuyasu procedure uses only aldehydes to fix all structures. Consequently, effective fixation of lipids occurs only through their association with membrane proteins. Thus, the lack of visible fenestration is likely due to possible loss of lipids during incomplete fixation.”

      The discussion needs to be reworked. Throughout it contains references to results not in the main results section such as supplementary movie 2 (line 735). The explicit references to the data and figures felt odd and more suited to the results rather than the discussion. Currently, each result is discussed individually in turn and more effort needs to be made to integrate the results from this analysis here but also with previous work and the data from other organisms, which at the moment sits in a standalone section at the end of the discussion.

      We have improved the discussion and removed the previous supplementary movies 2 and 3. Supplementary movie 1 is now mentioned in the results section.

      Line 693 - There was an interesting point about dividing cells describing the maintenance of endosomes next to the old pocket. Does that mean there was no endosome by the new pocket and if so where is this data in the manuscript? This point relates back to my question about how cells were chosen for analysis - how many dividing cells were examined by tomography?

      The fate of endosomes during the cell cycle is not the subject of this paper. In this manuscript we only show only one dividing cell using tomography. An in-depth analysis focusing on what happens during the cell cycle will be published separately.

      Line 729 - I'm unclear how this represents a polarization of function in the flagellar pocket. The pocket I presume is included within the endosomal system for this analysis but there was no specific mention of it in the results and no marker of each position to help define any specialisation. From the results, I thought the focus was on endosomal co-localisation of the different markers. If the authors are thinking about specialisation of the pocket this paper from Mark Field shows there is evidence for the exocyst to be distributed over the entire surface of the pocket, which is relevant to the discussion here. Boehm, C.M. et al. (2017) The trypanosome exocyst: a conserved structure revealing a new role in endocytosis. PLoS Pathog. 13, e1006063

      We have formulated our statement more cautiously. However, we are convinced that membrane exchange cannot physically work without functional polarization of the pocket. We know that Rab11, for example, is not evenly distributed on the pocket. By the way, in Boehm et al. (2017) the exocyst is not shown to cover the entire pocket (as shown in Supplementary Video 1).

      We now refer to Boehm et al. (Lines 700 – 703):

      “Boehm et al (2017) report that in the flagellar pocket endocytic and exocytic sites are in close proximity but do not overlap. We further suggest that the fusion of EXCs with the flagellar pocket membrane and clathrin-mediated endocytosis take place on different sites of the pocket. This disparity explains the lower colocalization between TbRab11 and TbRab5A.”

      Line 735 - link to data not previously mentioned I think. When I looked at this data I couldn't find a key to explain what all the different colours related to.

      We have removed the previous supplementary movies 2 and 3. We now reference supplementary movie 1 in the results section.

    1. eLife Assessment

      How misfolded proteins are segregated and cleared is a significant question in cell biology, since clearance of these aggregates can protect against pathologies that may otherwise arise. The authors discover a cell cycle stage-dependent clearing mechanism that involves the ER chaperone BiP, the proteosome, and CDK inactivation, but is curiously independent of the anaphase promoting complex (APC). These are valuable and interesting new observations, and the evidence supporting these claims is solid.

    2. Reviewer #1 (Public review):

      Du et al. address the cell cycle-dependent clearance of misfolded protein aggregates mediated by the endoplasmic reticulum (ER) associated Hsp70 chaperone family and ER reorganisation. The observations are interesting and impactful to the field.

      Strength:

      The manuscript addresses the connection between the clearance of misfolded protein aggregates and the cell cycle using a proteostasis reporter targeted to ER in multiple cell lines. Through imaging and some biochemical assays, they establish the role of BiP, an Hsp70 family chaperone, and Cdk1 inactivation in aggregate clearance upon mitotic exit. Furthermore, the authors present an initial analysis of the role of ER reorganisation in this clearance. These are important correlations and could have implications for ageing-associated pathologies. Overall, the results are convincing and impactful to the field.

      Weakness:

      The manuscript still lacks a mechanistic understanding of aggregate clearance. Even though the authors have provided the role of different cellular components, such as BiP, Cdk1 and ATL2/3 through specific inhibitors, at least an outline establishing the sequence of events leading to clearance is missing. Moreover, the authors show that the levels of ER-FlucDM-eGFP do not change significantly throughout the cell cycle, indicating that protein degradation is not in play. Therefore, addressing/elaborating on the mechanism of disassembly can add value to the work. Also, the physiological relevance of aggregate clearance upon mitotic exit has not been tested, nor have the cellular targets of this mode of clearance been identified or discussed.

    3. Reviewer #2 (Public review):

      This paper describes an interesting observation that ER-targeted misfolded proteins are trapped within vesicles inside nucleus to facilitate quality control during cell division. This work supports the concept that transient sequestration of misfolded proteins is a fundamental mechanism of protein quality control. The authors satisfactorily addressed several points asked in the review of first submission. The manuscript is improved but still unable to fully address the mechanisms.

      Strengths:

      The observations in this manuscript are very interesting and open up many questions on proteostasis biology.

      Weaknesses:

      Despite inclusions of several protein-level experiments, the manuscript remained a microscopy-driven work and missed the opportunity to work out the mechanisms behind the observations.

    4. Reviewer #3 (Public review):

      This paper describes a new mechanism for the clearance of protein aggregates associated to endoplasmic reticulum re-organization that occurs during mitosis.

      Experimental data showing clearance of protein aggregates during mitosis is solid, statistically significant, and very interesting. The authors made several new experiments included in the revised version to address the concerns raised by reviewers. A new proteomic analysis, co-localization of the aggregates with the ER membrane Sec61beta protein, expression of the aggregate-prone protein in the nucleus does not result in accumulation of aggregates, detection of protein aggregates in the insoluble faction after cell disruption and mostly importantly knockdown of ATL proteins involved in the organization of ER shape and structure impaired the clearance mechanism. This last observation addresses one of the weakest points of the original version which was the lack of experimental correlation between ER structure capability to re-shape and the clearance mechanism.

      In conclusion, this new mechanism of protein aggregate clearance from the ER was not completely understood in this work but the manuscript presented, particularly in the revised version, an ensemble of solid observations and mechanistic information to scaffold future studies that clarify more details of this mechanism. As stated by the authors: "How protein aggregates are targeted and assembled into the intranuclear membranous structure waits for future investigation". This new mechanism of aggregate clearance from the ER is not expected to be fully understood in a single work but this paper may constitute one step to better comprehend the cell capability to resolve protein aggregates in different cell compartments.

      [Editors' note: The authors have appropriately addressed the previous reviewers' concerns.]

    5. Author response:

      The following is the authors’ response to the previous reviews

      Public Reviews:

      Reviewer #1 (Public review):

      Du et al. address the cell cycle-dependent clearance of misfolded protein aggregates mediated by the endoplasmic reticulum (ER) associated Hsp70 chaperone family and ER reorganisation. The observations are interesting and impactful to the field.

      Strength:

      The manuscript addresses the connection between the clearance of misfolded protein aggregates and the cell cycle using a proteostasis reporter targeted to ER in multiple cell lines. Through imaging and some biochemical assays, they establish the role of BiP, an

      Hsp70 family chaperone, and Cdk1 inactivation in aggregate clearance upon mitotic exit.

      Furthermore, the authors present an initial analysis of the role of ER reorganisation in this clearance. These are important correlations and could have implications for ageingassociated pathologies. Overall, the results are convincing and impactful to the field.

      Weakness:

      The manuscript still lacks a mechanistic understanding of aggregate clearance. Even though the authors have provided the role of different cellular components, such as BiP, Cdk1 and ATL2/3 through specific inhibitors, at least an outline establishing the sequence of events leading to clearance is missing. Moreover, the authors show that the levels of ERFlucDM-eGFP do not change significantly throughout the cell cycle, indicating that protein degradation is not in play. Therefore, addressing/elaborating on the mechanism of disassembly can add value to the work. Also, the physiological relevance of aggregate clearance upon mitotic exit has not been tested, nor have the cellular targets of this mode of clearance been identified or discussed.

      Thank you for your suggestions. 

      We have added descriptions about the sequence of events leading to clearance in the abstract (line 33) and discussion (line 316). 

      We have commented on the future work that could address the molecular mechanisms behind the aggregate clearance in the discussion (line 388). 

      It has been difficult to address the physiological relevance of aggregate clearance during cell division, as the inhibition of BiP or depletion of ATL2/3 that prevent aggregate clearance cause cellular consequences not specific to aggregate clearance. Future work that lead to understanding of aggregate clearance at the molecular level may allow us to address this more specifically. Furthermore, we have commented about the potential defects that could arise in cells expressing ER-FlucDM-eGFP that have a perturbed cellular health based on the proteomic analysis (line 359). 

      To identify pathological targets that undergo clearance as the ER-FlucDM-eGFP, we tested three pathological mutants (CFTR-∆F508, AAT S and Z variants) that are known to mis-fold and accumulate in the ER. Unfortunately, expression of these mutants did not result in the confinement of aggregates in the nucleus. The data related to this have been added as Figure S1E and S1F (line 102) in this revised manuscript. We have also commented in the discussion that pathological targets are yet to be identified and could be a part of future work (line 392).

      Reviewer #2 (Public review):

      This paper describes an interesting observation that ER-targeted misfolded proteins are trapped within vesicles inside nucleus to facilitate quality control during cell division. This work supports the concept that transient sequestration of misfolded proteins is a fundamental mechanism of protein quality control. The authors satisfactorily addressed several points asked in the review of first submission. The manuscript is improved but still unable to fully address the mechanisms.

      Strengths:

      The observations in this manuscript are very interesting and open up many questions on proteostasis biology.

      Weaknesses:

      Despite inclusions of several protein-level experiments, the manuscript remained a microscopy-driven work and missed the opportunity to work out the mechanisms behind the observations.

      Thank you for your suggestions. We believe that our study has provided a genetic basis for the involvement of ER reorganization and BiP during cell division in aggregate clearance, which is a new observation. We have also commented in this revised manuscript about the future work that could address the molecular mechanisms behind the aggregate clearance in the discussion (line 388).  

      Reviewer #3 (Public review):

      This paper describes a new mechanism for the clearance of protein aggregates associated to endoplasmic reticulum re-organization that occurs during mitosis.

      Experimental data showing clearance of protein aggregates during mitosis is solid, statistically significant, and very interesting. The authors made several new experiments included in the revised version to address the concerns raised by reviewers. A new proteomic analysis, co-localization of the aggregates with the ER membrane Sec61beta protein, expression of the aggregate-prone protein in the nucleus does not result in accumulation of aggregates, detection of protein aggregates in the insoluble faction after cell disruption and mostly importantly knockdown of ATL proteins involved in the organization of ER shape and structure impaired the clearance mechanism. This last observation addresses one of the weakest points of the original version which was the lack of experimental correlation between ER structure capability to re-shape and the clearance mechanism.

      In conclusion, this new mechanism of protein aggregate clearance from the ER was not completely understood in this work but the manuscript presented, particularly in the revised version, an ensemble of solid observations and mechanistic information to scaffold future studies that clarify more details of this mechanism. As stated by the authors: "How protein aggregates are targeted and assembled into the intranuclear membranous structure waits for future investigation". This new mechanism of aggregate clearance from the ER is not expected to be fully understood in a single work but this paper may constitute one step to better comprehend the cell capability to resolve protein aggregates in different cell compartments.

      We thank the reviewer for the comments.

      Recommendations for the authors:

      Reviewer #1 (Recommendations for the authors):

      The manuscript presents a very interesting set of observations that could have significant implications on age-related protein misfolding and aggregate clearance. There are a few places in the manuscript that still need more clarity. Some are listed below, which I think can improve the manuscript.

      - The new data associated with proteomic analysis is appreciated, but the information gained has not been explored or elaborated sufficiently in the manuscript. Based on the differential expression of cell cycle proteins, how the authors interpret cellular health is unclear. Also, the physiological role of this mode of aggregate clearance remains unclear.

      We have added our interpretation of perturbed cellular health in cells expressing ERFlucDM-eGFP in the discussion (line 359). 

      It has been difficult to address the physiological relevance of aggregate clearance during cell division, as the inhibition of BiP or depletion of ATL2/3 that prevent aggregate clearance cause cellular consequences not specific to aggregate clearance. Future work that lead to understanding of aggregate clearance at the molecular level may allow us to address this more specifically.

      - In Figure 3A, have the authors measured the total GFP intensity from interphase through early G1? Even though the number and area of the aggregates decrease significantly, the cytoplasmic GFP signal does not seem to increase. Considering new CHX chase experiments and total Fluorescence intensity calculations (Figure S7D), which indicate no difference, one would expect an increase in cytoplasmic signal upon the disassembly of aggregates. Therefore, the data from Figures 3A and 7D seem contradictory. Can the authors please explain?

      We apologized for the confusion. The images in Figure 3A were derived from fixed cells. So, different cells were shown in every cell cycle phases and were not suitable for quantification. Fluorescence intensity changes could be better appreciated in Figure 3C or 4D as these were time-lapse microscopy images of live cells progressing through mitosis and cytokinesis. Data used in the quantification of fluorescence intensity in Figure S7D were derived from live cells taken from specific time points to avoid unwanted fluorescence bleaching during time-lapse microscopy. 

      - Do the authors expect a similar clearance of pathological aggregates such as mutant FUS or TDP43 condensates? Showing aggregate disassembly of disease-relevant aggregates would be an excellent addition to the manuscript, but it might be beyond the scope of the current version. However, the authors can comment/speculate how their study might extend to pathological condensates.

      We tested three pathological mutants (CFTR-∆F508, AAT S and Z variants) that are known to mis-fold and accumulate in the ER. Unfortunately, expression of these mutants did not result in the confinement of aggregates in the nucleus. The data related to this have been added as Figure S1E and S1F (line 102) in this revised manuscript. We have commented that pathological targets are yet to be identified and could be a part of future work (line 392).

      - The presence of ER membrane around these aggregates is an interesting observation. This membrane is retained even after nuclear membrane breakdown. What could be the relevance of membrane-bound aggregates, especially since the membrane can limit the access of chaperones involved in disassembly? This observation becomes more important since the depletion of ER membrane fusion proteins also leads to the accumulation of aggregates. Are the membranes a beacon for disassembly? The authors may comment/ speculate. This could also be an important aspect of the mechanism of clearance.

      We think that the ER membranes around the aggregates are disassembled when the ER networks reorganize during mitotic exit and this may allow accessibility of BiP to disaggregate the aggregates. We have added this in the discussion (line 316).

    1. Author response:

      Reviewer #1 (Public Review):

      Summary:

      For many years, there has been extensive electrophysiological research investigating the relationship between local field potential patterns and individual cell spike patterns in the hippocampus. In this study, using state-of-the-art imaging techniques, they examined spike synchrony of hippocampal cells during locomotion and immobility states. In contrast to conventional understanding of the hippocampus, the authors demonstrated that hippocampal place cells exhibit prominent synchronous spikes locked to theta oscillations.

      Strengths:

      The voltage imaging used in this study is a highly novel method that allows recording not only suprathreshold-level spikes but also subthreshold-level activity. With its high frame rate, it offers time resolution comparable to electrophysiological recordings. Moreover, it enables the visualization of actual cell locations, allowing for the examination of spatial properties (e.g., Figure 4G).

      We thank the reviewer for pointing out the technical novelty of this work.

      Weaknesses:

      There is a notable deviation from several observations obtained through conventional electrophysiological recordings. Particularly, as mentioned below in detail, the considerable differences in baseline firing rates and no observations of ripple-triggered firing patterns raise some concerns about potential artifacts from imaging and analysis, such as cell toxicity, abnormal excitability, and false detection of spikes. While these findings are intriguing if the validity of these methods is properly proven, accepting the current results as new insights is challenging.

      We appreciate the reviewer’s insightful comments regarding the intriguing aspect of our findings. Indeed, the emergence of a novel form of CA1 population synchrony presents exciting implications for hippocampal memory research and beyond.

      While we acknowledge the deviations from conventional electrophysiological recordings, we respectfully contend that these differences do not necessarily imply methodological flaws. All experiments and analyses were conducted with meticulous adherence to established standards in the field.

      Regarding the observed variations in averaging firing rates, it is important to note the well-documented heterogeneity in CA1 pyramidal neuron firing rates, spanning from 0.01 to 10 Hz, with a skewed distribution toward lower frequencies (Mizuseki et al., 2013). Our exclusion criteria for neurons with low estimated firing rates may have inadvertently biased the selection towards more active neurons. Moreover, prior research has indicated that averaging firing rates tend to increase during exposure to novel environments (Karlsson et al., 2008), and among deep-layer CA1 pyramidal neurons (Mizuseki et al., 2011). Given our recording setup in a highly novel environment and the predominance of deep CA1 pyramidal neurons in our sample, the observed higher averaging firing rates could be influenced by these factors. Considering these points, our mean firing rates (3.2 Hz) are reasonable estimations compared to previously reported values obtained from electrophysiological recordings (2.1 Hz in McHugh et al., 1996 and 2.4-2.6 Hz in Buzsaki et al., 2003).

      Regarding concerns about potential cell toxicity, previous studies have shown that Voltron expression and illumination do not significantly alter membrane resistance, membrane capacitance, resting membrane potentials, spike amplitudes, and spike width (see Abdelfattah 2019, Science, Supplementary Figure 11 and 12). In our recordings, imaged neurons exhibit preserved membrane and dendritic morphology during and after experiments (Author response image 1), supporting the absence of significant toxicity.

      Author response image 1.

      Voltron-expressing neurons exhibit preserved membrane and dendritic morphology. (A) Images of two-photon z-stack maximum intensity projection showing Voltron-expressing neurons taken after voltage image experiments in vivo. (B) Post-hoc histological images of neurons being voltage-imaged.

      Regarding spike detection, we use validated algorithms (Abdelfattah et al., 2019 and 2023) to ensure robust and reliable detection of spikes. Spiking activity was first separated from slower subthreshold potentials using high-pass filtering. This way, a slow fluorescence increase will not be detected as a spike, even if its amplitude is large. We benchmarked the detection algorithm in computer simulation. The sensitivity and specificity of the algorithm exceed 98% at the level of signal-to-noise ratio of our recordings. While we acknowledge that a small number of spikes, particularly those occurring later in a burst, might be missed due to their smaller amplitudes (as illustrated in Figure 1 and 2 of the manuscript), we anticipate that any missed spikes would lead to a decrease rather than an increase in synchrony between neurons. Overall, we are confident that spike detection is performed in a rigorous and robust manner.

      To further strengthen these points, we will include the following in the revision:

      (1) Histological images of recorded neurons during and after experiments.

      (2) Further details regarding the validation of spike detection algorithms.

      (3) Analysis of publicly available electrophysiological datasets.

      (4) Discussion regarding the reasons behind the novelty of some of our findings compared to previous observations.

      In conclusion, we assert that our experimental and analysis approach upholds rigorous standards. We remain committed to reconciling our findings with previous observations and welcome further scrutiny and engagement from the scientific community to explore the intriguing implications of our findings.

      Reviewer #2 (Public Review):

      Summary:

      This study employed voltage imaging in the CA1 region of the mouse hippocampus during the exploration of a novel environment. The authors report synchronous activity, involving almost half of the imaged neurons, occurred during periods of immobility. These events did not correlate with SWRs, but instead, occurred during theta oscillations and were phased-locked to the trough of theta. Moreover, pairs of neurons with high synchronization tended to display non-overlapping place fields, leading the authors to suggest these events may play a role in binding a distributed representation of the context.

      We thank the reviewer for a thorough and thoughtful review of our paper.

      Strengths:

      Technically this is an impressive study, using an emerging approach that allows single-cell resolution voltage imaging in animals, that while head-fixed, can move through a real environment. The paper is written clearly and suggests novel observations about population-level activity in CA1.

      We thank the reviewer for pointing out the technical strength and the novelty of our observations.

      Weaknesses:

      The evidence provided is weak, with the authors making surprising population-level claims based on a very sparse data set (5 data sets, each with less than 20 neurons simultaneously recorded) acquired with exciting, but less tested technology. Further, while the authors link these observations to the novelty of the context, both in the title and text, they do not include data from subsequent visits to support this. Detailed comments are below:

      We understand the reviewer’s concerns regarding the size of the dataset. Despite this limitation, it is important to note that synchronous ensembles beyond what could be expected from chance (jittering) were detected in all examined data. In the revision, we plan to add more data, including data from subsequent visits, to further strengthen our findings.

      (1) My first question for the authors, which is not addressed in the discussion, is why these events have not been observed in the countless extracellular recording experiments conducted in rodent CA1 during the exploration of novel environments. Those data sets often have 10x the neurons simultaneously recording compared to these present data, thus the highly synchronous firing should be very hard to miss. Ideally, the authors could confirm their claims via the analysis of publicly available electrophysiology data sets. Further, the claim of high extra-SWR synchrony is complicated by the observation that their recorded neurons fail to spike during the limited number of SWRs recorded during behavior- again, not agreeing with much of the previous electrophysiological recordings.

      We understand the reviewer’s concern. We will examine publicly available electrophysiology datasets to gain further insights into any similarities and differences to our findings. Based on these results, we will discuss why these events have not been previously observed/reported.

      (2) The authors posit that these events are linked to the novelty of the context, both in the text, as well as in the title and abstract. However, they do not include any imaging data from subsequent days to demonstrate the failure to see this synchrony in a familiar environment. If these data are available it would strengthen the proposed link to novelty if they were included.

      We thank the reviewer’s constructive suggestion. We will acquire more datasets from subsequent visits to gain further insights into these synchronous events.

      3) In the discussion the authors begin by speculating the theta present during these synchronous events may be slower type II or attentional theta. This can be supported by demonstrating a frequency shift in the theta recording during these events/immobility versus the theta recording during movement.

      We thank the reviewer’s constructive suggestion. We did demonstrate a frequency shift to a lower frequency in the synchrony-associated theta during immobility than during locomotion (see Fig. 4B, the red vs. blue curves). We will enlarge this panel and specifically refer to it in the corresponding discussion paragraph.

      (4) The authors mention in the discussion that they image deep-layer PCs in CA1, however, this is not mentioned in the text or methods. They should include data, such as imaging of a slice of a brain post-recording with immunohistochemistry for a layer-specific gene to support this.

      We thank the reviewer’s constructive suggestion. We do have images of brain slices post-recordings (Author response image 2). Imaged neurons are clearly located in the deep CA1 pyramidal layer. We will add these images and quantification in the revised manuscript.

      Author response image 2.

      Imaged neurons are located in the deep pyramidal layer of the dorsal hippocampal CA1 region.

      Reviewer #3 (Public Review):

      Summary:

      In the present manuscript, the authors use a few minutes of voltage imaging of CA1 pyramidal cells in head-fixed mice running on a track while local field potentials (LFPs) are recorded. The authors suggest that synchronous ensembles of neurons are differentially associated with different types of LFP patterns, theta and ripples. The experiments are flawed in that the LFP is not "local" but rather collected in the other side of the brain, and the investigation is flawed due to multiple problems with the point process analyses. The synchrony terminology refers to dozens of milliseconds as opposed to the millisecond timescale referred to in prior work, and the interpretations do not take into account theta phase locking as a simple alternative explanation.

      We genuinely appreciate the reviewer’s feedback and acknowledge the concerns raised. However, we believe these concerns can be effectively addressed without undermining the validity of our conclusions. With this in mind, we respectfully disagree with the assessment that our experiments and investigation are flawed. Please allow us to address these concerns and offer additional context to support the validity of our study.

      Weaknesses:

      The two main messages of the manuscript indicated in the title are not supported by the data. The title gives two messages that relate to CA1 pyramidal neurons in behaving head-fixed mice: (1) synchronous ensembles are associated with theta (2) synchronous ensembles are not associated with ripples.

      There are two main methodological problems with the work:

      (1) Experimentally, the theta and ripple signals were recorded using electrophysiology from the opposite hemisphere to the one in which the spiking was monitored. However, both signals exhibit profound differences as a function of location: theta phase changes with the precise location along the proximo-distal and dorso-ventral axes, and importantly, even reverses with depth. And ripples are often a local phenomenon - independent ripples occur within a fraction of a millimeter within the same hemisphere, let alone different hemispheres. Ripples are very sensitive to the precise depth - 100 micrometers up or down, and only a positive deflection/sharp wave is evident.

      We appreciate the reviewer’s consideration regarding the collection of LFP from the contralateral hemisphere. While we acknowledge the limitation of this design, we believe that our findings still offer valuable insights into the dynamics of synchronous ensembles. Despite potential variations in theta phases with recording locations and depth, we find that the occurrence and amplitudes of theta oscillations are generally coordinated across hemispheres (Buzsaki et al., Neurosci., 2003). Therefore, the presence of prominent contralateral LFP theta around the times of synchronous ensembles in our study (see Figure 4A of the manuscript) strongly supports our conclusion regarding their association with theta oscillations, despite the collection of LFP from the opposite hemisphere.

      In addition, in our manuscript, we specifically mentioned that the “preferred phases” varied from session to session, likely due to the variability of recording locations (see Line 254-256). Therefore, we think that the reviewer’s concern regarding theta phase variability has already been addressed in the present manuscript.

      Regarding ripple oscillations, while we recognize that they can sometimes occur locally, the majority of ripples occur synchronously in both hemispheres (up to 70%, see Szabo et al., Neuron, 2022; Buzsaki et al., Neurosci., 2003). Therefore, using contralateral LFP to infer ripple occurrence on the ipsilateral side has been a common practice in the field, employed by many studies published in respectable journals (Szabo et al., Neuron, 2022; Terada et al., Nature, 2021; Dudok et al., Neuron, 2021; Geiller et al., Neuron, 2020). Furthermore, our observation that 446 synchronous ensembles during immobility do not co-occur with contralateral ripples, and the remaining 313 ensembles during locomotion are not associated with ripples, as ripples rarely occur during locomotion. Therefore, our conclusion that synchronous ensembles are not associated with ripple oscillations is supported by data.

      (2) The analysis of the point process data (spike trains) is entirely flawed. There are many technical issues: complex spikes ("bursts") are not accounted for; differences in spike counts between the various conditions ("locomotion" and "immobility") are not accounted for; the pooling of multiple CCGs assumes independence, whereas even conditional independence cannot be assumed; etc.

      We acknowledge the reviewer’s concern regarding spike train analysis. Indeed, complex bursts or different behavioral conditions can lead to differences in spike counts that could potentially affect the detection of synchronous ensembles. However, our jittering procedure (see Line 121-132) is designed to control for the variation of spike counts. Importantly, while the jittered spike trains also contain the same spike count variations, we found 7.8-fold more synchronous events in our data compared to jitter controls (see Figure 1G of the manuscript), indicating that these factors cannot account for the observed synchrony.

      To explicitly demonstrate that complex bursts cannot account for the observed synchrony, we have performed additional analysis to remove all latter spikes in bursts and only count the single and the first spikes of bursts. Importantly, we found that this procedure did not change the rate and size of synchronous ensembles, nor did it significantly alter the grand-average CCG (see Author response image 3). The results of this analysis explicitly rule out a significant effect of complex spikes on the analysis of synchronous ensembles.

      Author response image 3.

      Population synchrony remains after the removal of spikes in bursts. (A) The grand-average cross correlogram (CCG) was calculated using spike trains without latter spikes in bursts. The gray line represents the mean grand average CCG between reference cells and randomly selected cells from different sessions. (B) Pairwise comparison of the event rates of population synchrony between spike trains containing all spikes and spike trains without latter spikes in bursts. Bar heights indicate group means (n=10 segments, p=0.036, Wilcoxon signed-rank test). (C) Histogram of the ensemble sizes as percentages of cells participating in the synchronous ensembles.

      Beyond those methodological issues, there are two main interpretational problems: (1) the "synchronous ensembles" may be completely consistent with phase locking to the intracellular theta (as even shown by the authors themselves in some of the supplementary figures).

      We agree with the reviewer that the synchronous ensembles are indeed consistent with theta phase locking. However, it is important to note that theta phase locking alone does not necessarily imply population synchrony. In fact, theta phase locking has been shown to “reduce” population synchrony in a previous study (Mizuseki et al., 2014, Phil. Trans. R. Soc. B.). Thus, the presence of theta phase locking cannot be taken as a simple alternative explanation of the synchronous ensembles.

      To directly assess the contribution of theta phase locking to synchronous ensembles, we have performed a new analysis to randomize the specific theta cycles in which neurons spike, while keeping the spike phases constant. This manipulation disrupts spike co-occurrence while preserving theta phase locking, allowing us to test whether theta phase locking alone can explain the population synchrony, or whether spike co-occurrence in specific cycles is required. The grand-average CCG shows a much smaller peak compared to the original peak (Author response image 4A). Moreover, synchronous event rates show a 4.5-fold decrease in the randomized data compared to the original event rates (Author response image 4B). Thus, the new analysis reveals theta phase locking alone cannot account for the population synchrony.

      Author response image 4.

      Drastic reduction of population synchrony by randomizing spikes to other theta cycles while preserving the phases. (A) The grand-average cross correlogram (CCG) was calculated using original spike trains (black) and randomized spike trains where theta phases of the spikes are kept the same but spike timings were randomly moved to other theta cycles (red). (B) Pairwise comparison of the event rates of population synchrony between the original spike trains and randomized spike trains (n=10 segments, p=0.002, Wilcoxon signed-rank test). Bar heights indicate group means. ** p<0.01

      (2) The definition of "synchrony" in the present work is very loose and refers to timescales of 20-30 ms. In previous literature that relates to synchrony of point processes, the timescales discussed are 1-2 ms, and longer timescales are referred to as the "baseline" which is actually removed (using smoothing, jittering, etc.).

      Regarding the timescale of synchronous ensembles, we acknowledge that it varies considerably across studies and cell types. However, it is important to note that a timescale of dozens, or even hundreds of milliseconds is common for synchrony terminology in CA1 pyramidal neurons (see Csicsvari et al., Neuron, 2000; Harris et al., Science, 2003; Malvache et al., Science, 2016; Yagi et al., Cell Reports, 2023). In fact, a timescale of 20-30 ms is considered particularly important for information transmission and storage in CA1, as it matches the membrane time constant of pyramidal neurons, the period of hippocampal gamma oscillations, and the time window for synaptic plasticity. Therefore, we believe that this timescale is relevant and in line with established practices in the field.

    1. eLife Assessment

      This useful study uses brain stimulation and electroencephalography to study speech-gesture integration. It investigates the role of frontotemporal regions in integrating linguistic and extra-linguistic information during communication, focusing on the inferior frontal gyrus and posterior middle temporal gyrus. Reliance on activation patterns of tightly-coupled brain regions over short timescales leads to incomplete support for the study's conclusions due to conceptual and methodological limitations.

    2. Reviewer #1 (Public review):

      Summary:

      The authors quantified information in gesture and speech, and investigated the neural processing of speech and gestures in pMTG and LIFG, depending on their informational content, in 8 different time-windows, and using three different methods (EEG, HD-tDCS and TMS). They found that there is a time-sensitive and staged progression of neural engagement that is correlated with the informational content of the signal (speech/gesture).

      Strengths:

      A strength of the paper is that the authors attempted to combine three different methods to investigate speech-gesture processing.

      Comments on revisions:

      I thank the authors for their careful responses to my comments. However, I remain not convinced by their argumentation regarding the specificity of their spatial targeting and the time-windows that they used.

      The authors write that since they included a sham TMS condition, that the TMS selectively disrupted the IFG-pMTG interaction during specific time windows of the task related to gesture-speech semantic congruency. This to me does not show anything about the specificity of the time-windows itself, nor the selectivity of targeting in the TMS condition.

      It could still equally well be the case that other regions or networks relevant for gesture-speech integration are targeted, and it can still be the case that these timewindows are not specific, and effects bleed into other time periods. There seems to be no experimental evidence here that this is not the case.

      To be more specific, the authors write that double-pulse TMS has been widely used in previous studies (as found in their table). However, the studies cited in the table do not necessarily demonstrate the level of spatial and temporal specificity required to disentangle the contributions of tightly-coupled brain regions like the IFG and pMTG during the speech-gesture integration process. pMTG and IFG are located in very close proximity, and are known to be functionally and structurally interconnected, something that is not necessarily the case for the relatively large and/or anatomically distinct areas that the authors mention in their table.

      But also more in general: The mere fact that these methods have been used in other contexts does not necessarily mean they are appropriate or sufficient for investigating the current research question. Likewise, the cognitive processes involved in these studies are quite different from the complex, multimodal integration of gesture and speech. The authors have not provided a strong theoretical justification for why the temporal dynamics observed in these previous studies should generalize to the specific mechanisms of gesture-speech integration.

      Moreover, the studies cited in the table provided by the authors have used a wide range of interpulse intervals, from 20 ms to 100 ms, suggesting that the temporal precision required to capture the dynamics of gesture-speech integration (which is believed to occur within 200-300 ms; Obermeier & Gunter, 2015) may not even be achievable with their 40 ms time windows.

      I do appreciate the extra analyses that the authors mention. However, my 5th comment is still unanswered: why not use entropy scores as a continous measure?

      In light of these concerns, I do not believe the authors have adequately demonstrated the spatial and temporal specificity required to disentangle the contributions of the IFG and pMTG during the gesture-speech integration process. While the authors have made a sincere effort to address the concerns raised by the reviewers, and have done so with a lot of new analyses, I remain doubtful that the current methodological approach is sufficient to draw conclusions about the causal roles of the IFG and pMTG in gesture-speech integration.

      Reference:<br /> Obermeier, C., & Gunter, T. C. (2015). Multisensory Integration: The Case of a Time Window of Gesture-Speech Integration. Journal of Cognitive Neuroscience, 27(2), 292-307. https://doi.org/10.1162/jocn_a_00688

    3. Reviewer #2 (Public review):

      Summary

      The study is an innovative and fundamental study that clarified important aspects of brain processes for integration of information from speech and iconic gesture (i.e., gesture that depicts action, movement, and shape), based on tDCS, TMS and EEG experiments. They evaluated their speech and gesture stimuli in information-theoretic ways and calculated how informative speech is (i.e., entropy), how informative gesture is, and how much shared information speech and gesture encode. The tDCS and TMS studies found that the left IFG and pMTG, the two areas that were activated in fMRI studies on speech-gesture integration in the previous literature, are causally implicated in speech-gesture integration. The size of tDC and TMS effects are correlated with entropy of the stimuli or mutual information, which indicates that the effects stems from the modulation of information decoding/integration processes. The EEG study showed that various ERP (event-related potential, e.g., N1-P2, N400, LPC) effects that have been observed in speech-gesture integration experiments in the previous literature are modulated by the entropy of speech/gesture and mutual information. This makes it clear that these effects are related to information decoding processes. The authors propose a model of how speech-gesture integration process unfolds in time, and how IFG and pMTG interact with each other in that process.

      Strengths

      The key strength of this study is that the authors used information-theoretic measures of their stimuli (i.e., entropy and mutual information between speech and gesture) in all of their analyses. This made it clear that the neuro-modulation (tDCS, TMS) affected information decoding/integration and ERP effects reflect information decoding/integration. This study used tDCS and TMS methods to demonstrate that left IFG and pMTG are causally involved in speech-gesture integration. The size of tDCS and TMS effects are correlated with information-theoretic measures of the stimuli, which indicate that the effects indeed stem from disruption/facilitation of information decoding/integration process (rather than generic excitation/inhibition). The authors' results also showed correlation between information-theoretic measures of stimuli with various ERP effects. This indicates that these ERP effects reflect the information decoding/integration process.

      Weakness

      The "mutual information" cannot capture all types of interplay of the meaning of speech and gesture. The mutual information is calculated based on what information can be decoded from speech alone and what information can be decoded from gesture alone. However, when speech and gesture are combined, a novel meaning can emerge, which cannot be decoded from a single modality alone. When example, a person produce a gesture of writing something with a pen, while saying "He paid". The speech-gesture combination can be interpreted as "paying by signing a cheque". It is highly unlikely that this meaning is decoded when people hear speech only or see gestures only. The current study cannot address how such speech-gesture integration occur in the brain, and what ERP effects may reflect such a process. The future studies can classify different types of speech-gesture integration and investigate neural processes that underlie each type. Another important topic for future studies is to investigate how the neural processes of speech-gesture integration change when the relative timing between the speech stimulus and the gesture stimulus changes.

      Comments on revisions: The authors addressed my concerns well.

    4. Author response:

      The following is the authors’ response to the previous reviews

      Responses to Editors:

      We appreciate the editors’ concern regarding the difficulty of disentangling the contributions of tightly-coupled brain regions to the speech-gesture integration process—particularly due to the close temporal and spatial proximity of the stimulation windows and the potential for prolonged disruption. While we agree with that stimulation techniques, such as transcranial magnetic stimulation (TMS), can evoke or modulate neuronal activity both locally within the target region and in remote connected areas of the network. This complex interaction makes drawing clear conclusions about the causal relationship between stimulation and cognitive function more challenging. However, we believe that cause-and-effect relationships in cognitive neuroscience studies using non-invasive brain stimulation (NIBS) can still be robustly established if key assumptions are explicitly tested and confounding factors are rigorously controlled (Bergmann & Hartwigsen et al., 2021, J Cogn Neurosci).

      In our experiment, we addressed these concerns by including a sham TMS condition, an irrelevant control task, and multiple control time points. The results showed that TMS selectively disrupted the IFG-pMTG interaction during specific time windows of the task related to gesture-speech semantic congruency, but not in the sham TMS condition or the control task (gender congruency effect) (Zhao et al., 2021, JN). This selective disruption provides strong evidence for a causal link between IFG-pMTG connectivity and gesture-speech integration in the targeted time window.

      Regarding the potential for transient artifacts from TMS, we acknowledge that previous research has demonstrated that single-pulse TMS induces brief artifacts (0–10 ms) due to direct depolarization of cortical neurons, which momentarily disrupts electrical activity in the stimulated area (Romero et al., 2019, NC). However, in the case of paired-pulse TMS (ppTMS), the interaction between the first and second pulses is more complex. The first pulse increases membrane conductance in the target neurons via shunting inhibition mediated by GABAergic interneurons. This effectively lowers neuronal membrane resistance, “leaking” excitatory current and diminishing the depolarization induced by the second pulse, leading to a reduction in excitability during the paired-pulse interval. This mechanism suppresses the excitatory response to the second pulse, which is reflected in a reduced motor evoked potential (MEP) (Paulus & Rothwell, 2016, J Physiol).

      Furthermore, ppTMS has been widely used in previous studies to infer causal temporal relationships and explore the neural contributions of both structurally and functionally connected brain regions, across timescales as brief as 3–60 ms. We have reviewed several studies that employed paired-pulse TMS to investigate neural dynamics in regions such as the tongue and lip areas of the primary motor cortex (M1), as well as high-level semantic regions like the pMTG, PFC, and ATL (Table 1). These studies consistently demonstrate the methodological rigor and precision of double-pulse TMS in elucidating the temporal dynamics between different brain regions within short temporal windows.

      Given these precedents and the evidence provided, we respectfully assert the validity of the methods employed in our study. We therefore kindly request the editors to reconsider the assessment that “the methods are insufficient for studying tightly-coupled brain regions over short timescales.” We hope that the editors’ concerns about the complexities of TMS-induced effects have been adequately addressed, and that our study’s design and results provide a clear and convincing causal argument for the role of IFG-pMTG in gesture-speech integration.

      Author response table 1.

      Double-pulse TMS studies on brain regions over 3-60 ms time interval

      Reference

      Teige, C., Mollo, G., Millman, R., Savill, N., Smallwood, J., Cornelissen, P. L., & Jefferies, E. (2018). Dynamic semantic cognition: Characterising coherent and controlled conceptual retrieval through time using magnetoencephalography and chronometric transcranial magnetic stimulation. Cortex, 103, 329-349.

      Amemiya, T., Beck, B., Walsh, V., Gomi, H., & Haggard, P. (2017). Visual area V5/hMT+ contributes to perception of tactile motion direction: a TMS study. Scientific reports, 7(1), 40937.

      Muessgens, D., Thirugnanasambandam, N., Shitara, H., Popa, T., & Hallett, M. (2016). Dissociable roles of preSMA in motor sequence chunking and hand switching—a TMS study. Journal of Neurophysiology, 116(6), 2637-2646.

      Vernet, M., Brem, A. K., Farzan, F., & Pascual-Leone, A. (2015). Synchronous and opposite roles of the parietal and prefrontal cortices in bistable perception: a double-coil TMS–EEG study. Cortex, 64, 78-88.

      Pitcher, D. (2014). Facial expression recognition takes longer in the posterior superior temporal sulcus than in the occipital face area. Journal of Neuroscience, 34(27), 9173-9177.

      Bardi, L., Kanai, R., Mapelli, D., & Walsh, V. (2012). TMS of the FEF interferes with spatial conflict. Journal of cognitive neuroscience, 24(6), 1305-1313.

      D’Ausilio, A., Bufalari, I., Salmas, P., & Fadiga, L. (2012). The role of the motor system in discriminating normal and degraded speech sounds. Cortex, 48(7), 882-887.

      Pitcher, D., Duchaine, B., Walsh, V., & Kanwisher, N. (2010). TMS evidence for feedforward and feedback mechanisms of face and body perception. Journal of Vision, 10(7), 671-671.

      Gagnon, G., Blanchet, S., Grondin, S., & Schneider, C. (2010). Paired-pulse transcranial magnetic stimulation over the dorsolateral prefrontal cortex interferes with episodic encoding and retrieval for both verbal and non-verbal materials. Brain Research, 1344, 148-158.

      Kalla, R., Muggleton, N. G., Juan, C. H., Cowey, A., & Walsh, V. (2008). The timing of the involvement of the frontal eye fields and posterior parietal cortex in visual search. Neuroreport, 19(10), 1067-1071.

      Pitcher, D., Garrido, L., Walsh, V., & Duchaine, B. C. (2008). Transcranial magnetic stimulation disrupts the perception and embodiment of facial expressions. Journal of Neuroscience, 28(36), 8929-8933.

      Til Ole Bergmann, Gesa Hartwigsen; Inferring Causality from Noninvasive Brain Stimulation in Cognitive Neuroscience. J Cogn Neurosci 2021; 33 (2): 195–225. https://doi.org/10.1162/jocn_a_01591

      Romero, M.C., Davare, M., Armendariz, M. et al. Neural effects of transcranial magnetic stimulation at the single-cell level. Nat Commun 10, 2642 (2019). https://doi.org/10.1038/s41467-019-10638-7

      Paulus W, Rothwell JC. Membrane resistance and shunting inhibition: where biophysics meets state-dependent human neurophysiology. J Physiol. 2016 May 15;594(10):2719-28. doi: 10.1113/JP271452. PMID: 26940751; PMCID: PMC4865581.

      Staat, C., Gattinger, N., & Gleich, B. (2022). PLUSPULS: A transcranial magnetic stimulator with extended pulse protocols. HardwareX, 13. https://doi.org/10.1016/j.ohx.2022.e00380

      Zhao, W., Li, Y., and Du, Y. (2021). TMS reveals dynamic interaction between inferior frontal gyrus and posterior middle temporal gyrus in gesture-speech semantic integration. The Journal of Neuroscience, 10356-10364. https://doi.org/10.1523/jneurosci.1355-21.2021.

      Reviewer #1 (Public review):

      Summary:

      The authors quantified information in gesture and speech, and investigated the neural processing of speech and gestures in pMTG and LIFG, depending on their informational content, in 8 different time-windows, and using three different methods (EEG, HD-tDCS and TMS). They found that there is a time-sensitive and staged progression of neural engagement that is correlated with the informational content of the signal (speech/gesture).

      Strengths:

      A strength of the paper is that the authors attempted to combine three different methods to investigate speech-gesture processing.

      We sincerely thank the reviewer for recognizing our efforts in conducting three experiments to explore the neural activity linked to the amount of information processed during multisensory gesture-speech integration. In Experiment 1, we observed that the extent of inhibition in the pMTG and LIFG was closely linked to the overlapping gesture-speech responses, as quantified by mutual information. Building on the established roles of the pMTG and LIFG in our previous study (Zhao et al., 2021, JN), we then expanded our investigation to determine whether the dynamic neural engagement between the pMTG and LIFG during gesture-speech processing was also associated with the quality of the information. This hypothesis was further validated through high-temporal resolution EEG, where we examined ERP components related to varying information contents. Notably, we observed a close time alignment between the ERP components and the time windows of the TMS effects, which were associated with the same informational matrices in gesture-speech processing.

      Weaknesses:

      (1) One major issue is that there is a tight anatomical coupling between pMTG and LIFG. Stimulating one area could therefore also result in stimulation of the other area (see Silvanto and Pascual-Leone, 2008). I therefore think it is very difficult to tease apart the contribution of these areas to the speech-gesture integration process, especially considering that the authors stimulate these regions in time windows that are very close to each other in both time and space (and the disruption might last longer over time).

      Response 1: We greatly appreciate the reviewer’s careful consideration. We trust that the explanation provided above has clarified this issue (see Response to Editors for detail).

      (2) Related to this point, it is unclear to me why the HD-TDCS/TMS is delivered in set time windows for each region. How did the authors determine this, and how do the results for TMS compare to their previous work from 2018 and 2023 (which describes a similar dataset+design)? How can they ensure they are only targeting their intended region since they are so anatomically close to each other?

      Response 2: The current study builds on a series of investigations that systematically examined the temporal and spatial dynamics of gesture-speech integration. In our earlier work (Zhao et al., 2018, J. Neurosci), we demonstrated that interrupting neural activity in the IFG or pMTG using TMS selectively disrupted the semantic congruency effect (reaction time costs due to semantic incongruence), without affecting the gender congruency effect (reaction time costs due to gender incongruence). These findings identified the IFG and pMTG as critical hubs for gesture-speech integration. This informed the brain regions selected for subsequent studies.

      In Zhao et al. (2021, J. Neurosci), we employed a double-pulse TMS protocol, delivering stimulation within one of eight 40-ms time windows, to further examine the temporal involvement of the IFG and pMTG. The results revealed time-window-selective disruptions of the semantic congruency effect, confirming the dynamic and temporally staged roles of these regions during gesture-speech integration.

      In Zhao et al. (2023, Frontiers in Psychology), we investigated the semantic predictive role of gestures relative to speech by comparing two experimental conditions: (1) gestures preceding speech by a fixed interval of 200 ms, and (2) gestures preceding speech at its semantic identification point. We observed time-window-selective disruptions of the semantic congruency effect in the IFG and pMTG only in the second condition, leading to the conclusion that gestures exert a semantic priming effect on co-occurring speech. These findings underscored the semantic advantage of gesture in facilitating speech integration, further refining our understanding of the temporal and functional interplay between these modalities.

      The design of the current study—including the choice of brain regions and time windows—was directly informed by these prior findings. Experiment 1 (HD-tDCS) targeted the entire gesture-speech integration process in the IFG and pMTG to assess whether neural activity in these regions, previously identified as integration hubs, is modulated by changes in informativeness from both modalities (i.e., entropy) and their interactions (mutual information, MI). The results revealed a gradual inhibition of neural activity in both areas as MI increased, evidenced by a negative correlation between MI and the tDCS inhibition effect in both regions. Building on this, Experiments 2 and 3 employed double-pulse TMS and ERPs to further assess whether the engaged neural activity was both time-sensitive and staged. These experiments also evaluated the contributions of various sources of information, revealing correlations between information-theoretic metrics and time-locked brain activity, providing insights into the ‘gradual’ nature of gesture-speech integration.

      We acknowledge that the rationale for the design of the current study was not fully articulated in the original manuscript. In the revised version, we provided a more comprehensive and coherent explanation of the logic behind the three experiments, as well as the alignment with our previous findings in Lines 75-102:

      ‘To investigate the neural mechanisms underlying gesture-speech integration, we conducted three experiments to assess how neural activity correlates with distributed multisensory integration, quantified using information-theoretic measures of MI. Additionally, we examined the contributions of unisensory signals in this process, quantified through unisensory entropy. Experiment 1 employed high-definition transcranial direct current stimulation (HD-tDCS) to administer Anodal, Cathodal and Sham stimulation to either the IFG or the pMTG. HD-tDCS induces membrane depolarization with anodal stimulation and membrane hyperpolarization with cathodal stimulation[26], thereby increasing or decreasing cortical excitability in the targeted brain area, respectively. This experiment aimed to determine whether the overall facilitation (Anodal-tDCS minus Sham-tDCS) and/or inhibitory (Cathodal-tDCS minus Sham-tDCS) of these integration hubs is modulated by the degree of gesture-speech integration, as measure by MI.

      Given the differential involvement of the IFG and pMTG in gesture-speech integration, shaped by top-down gesture predictions and bottom-up speech processing [23], Experiment 2 was designed to further assess whether the activity of these regions was associated with relevant informational matrices. Specifically, we applied inhibitory chronometric double-pulse transcranial magnetic stimulation (TMS) to specific temporal windows associated with integration processes in these regions[23], assessing whether the inhibitory effects of TMS were correlated with unisensory entropy or the multisensory convergence index (MI).

      Experiment 3 complemented these investigations by focusing on the temporal dynamics of neural responses during semantic processing, leveraging high-temporal event-related potentials (ERPs). This experiment investigated how distinct information contributors modulated specific ERP components associated with semantic processing. These components included the early sensory effects as P1 and N1–P2[27,28], the N400 semantic conflict effect[14,28,29], and the late positive component (LPC) reconstruction effect[30,31]. By integrating these ERP findings with results from Experiments 1 and 2, Experiment 3 aimed to provide a more comprehensive understanding of how gesture-speech integration is modulated by neural dynamics.’

      Although the IFG and pMTG are anatomically close, the consistent differentiation of their respective roles, as evidenced by our experiment across various time windows (TWs) and supported by previous research (see Response to editors for details), reinforces the validity of the stimulation effect observed in our study.

      References

      Zhao, W.Y., Riggs, K., Schindler, I., and Holle, H. (2018). Transcranial magnetic stimulation over left inferior frontal and posterior temporal cortex disrupts gesture-speech integration. Journal of Neuroscience 38, 1891-1900. 10.1523/Jneurosci.1748-17.2017.

      Zhao, W., Li, Y., and Du, Y. (2021). TMS reveals dynamic interaction between inferior frontal gyrus and posterior middle temporal gyrus in gesture-speech semantic integration. The Journal of Neuroscience, 10356-10364. https://doi.org/10.1523/jneurosci.1355-21.2021.

      Zhao, W. (2023). TMS reveals a two-stage priming circuit of gesture-speech integration. Front Psychol 14, 1156087. 10.3389/fpsyg.2023.1156087.

      Bikson, M., Inoue, M., Akiyama, H., Deans, J.K., Fox, J.E., Miyakawa, H., and Jefferys, J.G.R. (2004). Effects of uniform extracellular DC electric fields on excitability in rat hippocampal slices. J Physiol-London 557, 175-190. 10.1113/jphysiol.2003.055772.

      Federmeier, K.D., Mai, H., and Kutas, M. (2005). Both sides get the point: hemispheric sensitivities to sentential constraint. Memory & Cognition 33, 871-886. 10.3758/bf03193082.

      Kelly, S.D., Kravitz, C., and Hopkins, M. (2004). Neural correlates of bimodal speech and gesture comprehension. Brain and Language 89, 253-260. 10.1016/s0093-934x(03)00335-3.

      Wu, Y.C., and Coulson, S. (2005). Meaningful gestures: Electrophysiological indices of iconic gesture comprehension. Psychophysiology 42, 654-667. 10.1111/j.1469-8986.2005.00356.x.

      Fritz, I., Kita, S., Littlemore, J., and Krott, A. (2021). Multimodal language processing: How preceding discourse constrains gesture interpretation and affects gesture integration when gestures do not synchronise with semantic affiliates. J Mem Lang 117, 104191. 10.1016/j.jml.2020.104191.

      Gunter, T.C., and Weinbrenner, J.E.D. (2017). When to take a gesture seriously: On how we use and prioritize communicative cues. J Cognitive Neurosci 29, 1355-1367. 10.1162/jocn_a_01125.

      Ozyurek, A., Willems, R.M., Kita, S., and Hagoort, P. (2007). On-line integration of semantic information from speech and gesture: Insights from event-related brain potentials. J Cognitive Neurosci 19, 605-616. 10.1162/jocn.2007.19.4.605.

      (3) As the EEG signal is often not normally distributed, I was wondering whether the authors checked the assumptions for their Pearson correlations. The authors could perhaps better choose to model the different variables to see whether MI/entropy could predict the neural responses. How did they correct the many correlational analyses that they have performed?

      Response 3: We greatly appreciate the reviewer’s thoughtful comments.

      (1) Regarding the questioning of normal distribution of EEG signals and the use of Pearson correlation, in Figure 5 of the manuscript, we have already included normal distribution curves to illustrate the relationships between average ERP amplitudes across each ROI or elicited cluster and the three information models.

      Additionally, we performed the Shapiro-Wilk test, a widely accepted method for assessing bivariate normality, on both the MI/entropy and averaged ERP data. The p-values for all three combinations were greater than 0.05, indicating that the sample data from all bivariate combinations were normally distributed (Author response table 2).

      Author response table 2.

      Shapiro-Wilk results of bivariable normality test

      To further consolidate the relationship between entropy/MI and various ERP components, we also conducted a Spearman rank correlation analysis (Author response table 3-5). While the correlation between speech entropy and ERP amplitude in the P1 component yielded a p-value of 0.061, all other results were consistent with those obtained from the Pearson correlation analysis across the three experiments. Therefore, our conclusion that progressive neural responses reflected the degree of information remains robust. Although the Spearman rank and Pearson correlation analyses yielded similar results, we opted to report the Pearson correlation coefficients throughout the manuscript to maintain consistency.

      Author response table 3.

      Comparison of Pearson and Spearman results in Experiment 1

      Author response table 4.

      Comparison of Pearson and Spearman results in Experiment 2

      Author response table 5.

      Comparison of Pearson and Spearman results in Experiment 3

      (2) Regarding the reviewer’s comment ‘choose to model the different variables to see whether MI/entropy could predict the neural responses’, we employed Representational Similarity Analysis (RSA) (Popal et.al, 2019) with MI and entropy as continuous variables. This analysis aimed to build a model to predict neural responses based on these feature metrics.

      To capture dynamic temporal features indicative of different stages of multisensory integration, we segmented the EEG data into overlapping time windows (40 ms in duration with a 10 ms step size). The 40 ms window was chosen based on the TMS protocol used in Experiment 2, which also employed a 40 ms time window. The 10 ms step size (equivalent to 5 time points) was used to detect subtle shifts in neural responses that might not be captured by larger time windows, allowing for a more granular analysis of the temporal dynamics of neural activity.

      Following segmentation, the EEG data were reshaped into a four-dimensional matrix (42 channels × 20 time points × 97 time windows × 20 features). To construct a neural similarity matrix, we averaged the EEG data across time points within each channel and each time window. The resulting matrix was then processed using the pdist function to compute pairwise distances between adjacent data points. This allowed us to calculate correlations between the neural matrix and three feature similarity matrices, which were constructed in a similar manner. These three matrices corresponded to (1) gesture entropy, (2) speech entropy, and (3) mutual information (MI). This approach enabled us to quantify how well the neural responses corresponded to the semantic dimensions of gesture and speech stimuli at each time window.

      To determine the significance of the correlations between neural activity and feature matrices, we conducted 1000 permutation tests. In this procedure, we randomized the data or feature matrices and recalculated the correlations repeatedly, generating a null distribution against which the observed correlation values were compared. Statistical significance was determined if the observed correlation exceeded the null distribution threshold (p < 0.05). This permutation approach helps mitigate the risk of spurious correlations, ensuring that the relationships between the neural data and feature matrices are both robust and meaningful.

      Finally, significant correlations were subjected to clustering analysis, which grouped similar neural response patterns across time windows and channels. This clustering allowed us to identify temporal and spatial patterns in the neural data that consistently aligned with the semantic features of gesture and speech stimuli, thus revealing the dynamic integration of these multisensory modalities across time. Results are as follows:

      (1) Two significant clusters were identified for gesture entropy (Author response image 1 left). The first cluster was observed between 60-110 ms (channels F1 and F3), with correlation coefficients (r) ranging from 0.207 to 0.236 (p < 0.001). The second cluster was found between 210-280 ms (channel O1), with r-values ranging from 0.244 to 0.313 (p < 0.001).

      (2) For speech entropy (Author response image 1 middle), significant clusters were detected in both early and late time windows. In the early time windows, the largest significant cluster was found between 10-170 ms (channels F2, F4, F6, FC2, FC4, FC6, C4, C6, CP4, and CP6), with r-values ranging from 0.151 to 0.340 (p = 0.013), corresponding to the P1 component (0-100 ms). In the late time windows, the largest significant cluster was observed between 560-920 ms (across the whole brain, all channels), with r-values ranging from 0.152 to 0.619 (p = 0.013).

      (3) For mutual information (MI) (Author response image 1 right), a significant cluster was found between 270-380 ms (channels FC1, FC2, FC3, FC5, C1, C2, C3, C5, CP1, CP2, CP3, CP5, FCz, Cz, and CPz), with r-values ranging from 0.198 to 0.372 (p = 0.001).

      Author response image 1.

      Results of RSA analysis.

      These additional findings suggest that even using a different modeling approach, neural responses, as indexed by feature metrics of entropy and mutual information, are temporally aligned with distinct ERP components and ERP clusters, as reported in the current manuscript. This alignment serves to further consolidate the results, reinforcing the conclusion we draw. Considering the length of the manuscript, we did not include these results in the current manuscript.

      (3) In terms of the correction of multiple comparisons, in Experiment 1, two separate participant groups were recruited for HD-tDCS applied over either the IFG or pMTG. FDR correction was performed separately for each group, resulting in six comparisons for each brain region (three information matrices × two tDCS effects: anodal-sham or cathodal-sham). In Experiment 2, six comparisons (three information matrices × two sites: IFG or pMTG) were submitted for FDR correction. In Experiment 3, FDR correction was applied to the seven regions of interest (ROIs) within each component, resulting in five comparisons.

      Reference:

      Wilk, M.B. (2015). The Shapiro Wilk And Related Tests For Normality.

      Popal, H., Wang, Y., & Olson, I. R. (2019). A guide to representational similarity analysis for social neuroscience. Social cognitive and affective neuroscience, 14(11), 1243-1253.

      (4) The authors use ROIs for their different analyses, but it is unclear why and on the basis of what these regions are defined. Why not consider all channels without making them part of an ROI, by using a method like the one described in my previous comment?

      Response 4: For the EEG data, we conducted both a traditional ROI analysis and a cluster-based permutation approach. The ROIs were defined based on a well-established work (Habets et al., 2011), allowing for hypothesis-driven testing of specific regions. In addition, we employed a cluster-based permutation methods, which is data-driven and helps enhance robustness while addressing multiple comparisons. This method serves as a complement to the hypothesis-driven ROI analysis, offering an exploratory, unbiased perspective. Notably, the results from both approaches were consistent, reinforcing the reliability of our findings.

      To make the methods more accessible to a broader audience, we clarified the relationship between these approaches in the revised manuscript in Lines 267-270: ‘To consolidate the data, we conducted both a traditional region-of-interest (ROI) analysis, with ROIs defined based on a well-established work40, and a cluster-based permutation approach, which utilizes data-driven permutations to enhance robustness and address multiple comparisons’

      Additionally, we conducted an RSA analysis without defining specific ROIs, considering all channels in the analysis. This approach yielded consistent results, further validating the robustness of our findings across different analysis methods. See Response 3 for detail.

      Reference:

      Habets, B., Kita, S., Shao, Z.S., Ozyurek, A., and Hagoort, P. (2011). The Role of Synchrony and Ambiguity in Speech-Gesture Integration during Comprehension. J Cognitive Neurosci 23, 1845-1854. 10.1162/jocn.2010.21462

      (5) The authors describe that they have divided their EEG data into a "lower half" and a "higher half" (lines 234-236), based on entropy scores. It is unclear why this is necessary, and I would suggest just using the entropy scores as a continuous measure.

      Response 5: To identify ERP components or spatiotemporal clusters that demonstrated significant semantic differences, we split each model into higher and lower halves based on entropy scores. This division allowed us to capture distinct levels of information processing and explore how different levels of entropy or mutual information (MI) related to neural activity. Specifically, the goal was to highlight the gradual activation process of these components and clusters as they correlate with changes in information content. Remarkably, consistent results were observed between the ERP components and clusters, providing robust evidence that semantic information conveyed through gestures and speech significantly influenced the amplitude of these components or clusters. Moreover, the semantic information was shown to be highly sensitive, varying in tandem with these amplitude changes.

      Reviewer #2 (Public review):

      Comment:

      Summary:

      The study is an innovative and fundamental study that clarified important aspects of brain processes for integration of information from speech and iconic gesture (i.e., gesture that depicts action, movement, and shape), based on tDCS, TMS, and EEG experiments. They evaluated their speech and gesture stimuli in information-theoretic ways and calculated how informative speech is (i.e., entropy), how informative gesture is, and how much shared information speech and gesture encode. The tDCS and TMS studies found that the left IFG and pMTG, the two areas that were activated in fMRI studies on speech-gesture integration in the previous literature, are causally implicated in speech-gesture integration. The size of tDC and TMS effects are correlated with the entropy of the stimuli or mutual information, which indicates that the effects stem from the modulation of information decoding/integration processes. The EEG study showed that various ERP (event-related potential, e.g., N1-P2, N400, LPC) effects that have been observed in speech-gesture integration experiments in the previous literature, are modulated by the entropy of speech/gesture and mutual information. This makes it clear that these effects are related to information decoding processes. The authors propose a model of how the speech-gesture integration process unfolds in time, and how IFG and pMTG interact with each other in that process.

      Strengths:

      The key strength of this study is that the authors used information theoretic measures of their stimuli (i.e., entropy and mutual information between speech and gesture) in all of their analyses. This made it clear that the neuro-modulation (tDCS, TMS) affected information decoding/integration and ERP effects reflect information decoding/integration. This study used tDCS and TMS methods to demonstrate that left IFG and pMTG are causally involved in speech-gesture integration. The size of tDCS and TMS effects are correlated with information-theoretic measures of the stimuli, which indicate that the effects indeed stem from disruption/facilitation of the information decoding/integration process (rather than generic excitation/inhibition). The authors' results also showed a correlation between information-theoretic measures of stimuli with various ERP effects. This indicates that these ERP effects reflect the information decoding/integration process.

      We sincerely thank the reviewer for recognizing our efforts and the innovation of employing information-theoretic measures to elucidate the brain processes underlying the multisensory integration of gesture and speech.

      Weaknesses:

      The "mutual information" cannot fully capture the interplay of the meaning of speech and gesture. The mutual information is calculated based on what information can be decoded from speech alone and what information can be decoded from gesture alone. However, when speech and gesture are combined, a novel meaning can emerge, which cannot be decoded from a single modality alone. When example, a person produces a gesture of writing something with a pen, while saying "He paid". The speech-gesture combination can be interpreted as "paying by signing a cheque". It is highly unlikely that this meaning is decoded when people hear speech only or see gestures only. The current study cannot address how such speech-gesture integration occurs in the brain, and what ERP effects may reflect such a process. Future studies can classify different types of speech-gesture integration and investigate neural processes that underlie each type. Another important topic for future studies is to investigate how the neural processes of speech-gesture integration change when the relative timing between the speech stimulus and the gesture stimulus changes.

      We greatly appreciate Reviewer2 ’s thoughtful concern regarding whether "mutual information" adequately captures the interplay between the meanings of speech and gesture. We would like to clarify that the materials used in the present study involved gestures that were performed without actual objects, paired with verbs that precisely describe the corresponding actions. For example, a hammering gesture was paired with the verb “hammer”, and a cutting gesture was paired with the verb “cut”. In this design, all gestures conveyed redundant information relative to the co-occurring speech, creating significant overlap between the information derived from speech alone and that from gesture alone.

      We understand the reviewer’s concern about cases where gestures and speech might provide complementary, rather than redundant, information. To address this, we have developed an alternative metric for quantifying information gains contributed by supplementary multisensory cues, which will be explored in a subsequent study. However, for the present study, we believe that the observed overlap in information serves as a key indicator of multisensory convergence, a central focus of our investigation.

      Regarding the reviewer’s concern about how neural processes of speech-gesture integration may change with varying relative timing between speech and gesture stimuli, we would like to highlight findings from our previous study (Zhao, 2023, Frontiers in Psychology). In that study, we explored the semantic predictive role of gestures relative to speech under two timing conditions: (1) gestures preceding speech by a fixed interval of 200 ms, and (2) gestures preceding speech at its semantic identification point. Interestingly, only in the second condition did we observe time-window-selective disruptions of the semantic congruency effect in the IFG and pMTG. This led us to conclude that gestures play a semantic priming role for co-occurring speech. Building on this, we designed the present study with gestures deliberately preceding speech at its semantic identification point to reflect this semantic priming relationship. Additionally, ongoing research in our lab is exploring gesture and speech interactions in natural conversational settings to investigate whether the neural processes identified here remain consistent across varying contexts.

      To address potential concerns and ensure clarity regarding the limitations of the MI measurement, we have included a discussion of tthis in the revised manuscript in Lines 543-547: ‘Furthermore, MI quantifies overlap in gesture-speech integration, primarily when gestures convey redundant meaning. Consequently, the conclusions drawn in this study are constrained to contexts in which gestures serve to reinforce the meaning of the speech. Future research should aim to explore the neural responses in cases where gestures convey supplementary, rather than redundant, semantic information.’ This is followed by a clarification of the timing relationship between gesture and speech: ‘Note that the sequential cortical involvement and ERP components discussed above are derived from a deliberate alignment of speech onset with gesture DP, creating an artificial priming effect with gesture semantically preceding speech. Caution is advised when generalizing these findings to the spontaneous gesture-speech relationships, although gestures naturally precede speech[34].’ (Lines 539-543).

      Reviewer #3 (Public review):

      In this useful study, Zhao et al. try to extend the evidence for their previously described two-step model of speech-gesture integration in the posterior Middle Temporal Gyrus (pMTG) and Inferior Frontal Gyrus (IFG). They repeat some of their previous experimental paradigms, but this time quantifying Information-Theoretical (IT) metrics of the stimuli in a stroop-like paradigm purported to engage speech-gesture integration. They then correlate these metrics with the disruption of what they claim to be an integration effect observable in reaction times during the tasks following brain stimulation, as well as documenting the ERP components in response to the variability in these metrics.

      The integration of multiple methods, like tDCS, TMS, and ERPs to provide converging evidence renders the results solid. However, their interpretation of the results should be taken with care, as some critical confounds, like difficulty, were not accounted for, and the conceptual link between the IT metrics and what the authors claim they index is tenuous and in need of more evidence. In some cases, the difficulty making this link seems to arise from conceptual equivocation (e.g., their claims regarding 'graded' evidence), whilst in some others it might arise from the usage of unclear wording in the writing of the manuscript (e.g. the sentence 'quantitatively functional mental states defined by a specific parser unified by statistical regularities'). Having said that, the authors' aim is valuable, and addressing these issues would render the work a very useful approach to improve our understanding of integration during semantic processing, being of interest to scientists working in cognitive neuroscience and neuroimaging.

      The main hurdle to achieving the aims set by the authors is the presence of the confound of difficulty in their IT metrics. Their measure of entropy, for example, being derived from the distribution of responses of the participants to the stimuli, will tend to be high for words or gestures with multiple competing candidate representations (this is what would presumptively give rise to the diversity of responses in high-entropy items). There is ample evidence implicating IFG and pMTG as key regions of the semantic control network, which is critical during difficult semantic processing when, for example, semantic processing must resolve competition between multiple candidate representations, or when there are increased selection pressures (Jackson et al., 2021). Thus, the authors' interpretation of Mutual Information (MI) as an index of integration is inextricably contaminated with difficulty arising from multiple candidate representations. This casts doubt on the claims of the role of pMTG and IFG as regions carrying out gesture-speech integration as the observed pattern of results could also be interpreted in terms of brain stimulation interrupting the semantic control network's ability to select the best candidate for a given context or respond to more demanding semantic processing.

      Response 1: We sincerely thank the reviewer for pointing out the confound of difficulty. The primary aim of this study is to investigate whether the degree of activity in the established integration hubs, IFG and pMTG, is influenced by the information provided by gesture-speech modalities and/or their interactions. While we provided evidence for the differential involvement of the IFG and pMTG by delineating their dynamic engagement across distinct time windows of gesture-speech integration and associating these patterns with unisensory information and their interaction, we acknowledge that the mechanisms underlying these dynamics remain open to interpretation. Specifically, whether the observed effects stem from difficulties in semantic control processes, as suggested by the reviewer, or from resolving information uncertainty, as quantified by entropy, falls outside the scope of the current study. Importantly, we view these two interpretations as complementary rather than mutually exclusive, as both may be contributing factors. Nonetheless, we agree that addressing this question is a compelling avenue for future research.

      In the revised manuscript, we have included an additional analysis to assess whether the confounding effects of lexical or semantic control difficulty—specifically, the number of available responses—affect the neural outcomes. To address this, we performed partial correlation analyses, controlling for the number of responses.

      We would like to clarify an important distinction between the measure of entropy derived from the distribution of responses and the concept of response diversity. Entropy, in our analysis, is computed based on the probability distribution of each response, as captured by the information entropy formula. In contrast, response diversity refers to the simple count of different responses provided. Mutual Information (MI), by its nature, is also an entropy measure, quantifying the overlap in responses. For reference, although we observed a high correlation between the three information matrices and the number of responses (gesture entropy & gesture response number: r = 0.976, p < 0.001; speech entropy & speech response number: r = 0.961, p < 0.001; MI & total response number: r = 0.818, p < 0.001), it is crucial to emphasize that these metrics capture different aspects of the semantic information represented. In the revised manuscript, we have provided a table detailing both entropy and response numbers for each stimulus, to allow for greater transparency and clarity.

      Furthermore, we have added a comprehensive description of the partial correlation analysis conducted across all three experiments in the methodology section: for Experiment 1, please refer to Lines 213–222: ‘To account for potential confounds related to multiple candidate representations, we conducted partial correlation analyses between the tDCS effects and gesture entropy, speech entropy, and MI, controlling for the number of responses provided for each gesture and speech, as well as the total number of combined responses. Given that HD-tDCS induces overall disruption at the targeted brain regions, we hypothesized that the neural activity within the left IFG and pMTG would be progressively affected by varying levels of multisensory convergence, as indexed by MI. Moreover, we hypothesized that the modulation of neural activity by MI would differ between the left IFG and pMTG, as reflected in the differential modulation of response numbers in the partial correlations, highlighting their distinct roles in semantic processing[37].’

      Experiment 2: ‘To control for potential confounds, partial correlations were also performed between the TMS effects and gesture entropy, speech entropy, and MI, controlling for the number of responses for each gesture and speech, as well as the total number of combined responses. By doing this, we can determine how the time-sensitive contribution of the left IFG and pMTG to gesture–speech integration was affected by gesture and speech information distribution.’ (Lines 242–246).

      Experiment 3: ‘Additionally, partial correlations were conducted, accounting for the number of responses for each respective metric’ (Lines 292–293).

      As anticipated by the reviewer, we observed a consistent modulation of response numbers across both regions as well as across the four ERP components and associated clusters. The detailed results are presented below:

      Experiment 1: ‘However, partial correlation analysis, controlling for the total response number, revealed that the initially significant correlation between the Cathodal-tDCS effect and MI was no longer significant (r = -0.303, p = 0.222, 95% CI = [-0.770, 0.164]). This suggests that the observed relationship between Cathodal-tDCS and MI may be confounded by semantic control difficulty, as reflected by the total number of responses. Specifically, the reduced activity in the IFG under Cathodal-tDCS may be driven by variations in the difficulty of semantic control rather than a direct modulation of MI.’ (Lines 310-316) and ‘’Importantly, the reduced activity in the pMTG under Cathodal-tDCS was not influenced by the total response number, as indicated by the non-significant correlation (r = -0.253, p = 0.295, 95% CI = [-0.735, 0.229]). This finding was further corroborated by the unchanged significance in the partial correlation between Cathodal-tDCS and MI, when controlling for the total response number (r = -0.472, p = 0.048, 95% CI = [-0.903, -0.041]). (Lines 324-328).

      Experiment 2:’ Notably, inhibition of pMTG activity in TW2 was not influenced by the number of speech responses (r = -0.539, p = 0.087, 95% CI = [-1.145, 0.067]). However, the number of speech responses did affect the modulation of speech entropy on the pMTG inhibition effect in TW2. This was evidenced by the non-significant partial correlation between pMTG inhibition and speech entropy when controlling for speech response number (r = -0.218, p = 0.545, 95% CI = [-0.563, 0.127]).

      In contrast, the interrupted IFG activity in TW6 appeared to be consistently influenced by the confound of semantic control difficulty. This was reflected in the significant correlation with both gesture response number (r = -0.480, p = 0.032, 95% CI = [-904, -0.056]), speech response number (r = -0.729, p = 0.011, 95% CI = [-1.221, -0.237]), and total response number (r = -0.591, p = 0.008, 95% CI = [-0.993, -0.189]). Additionally, partial correlation analyses revealed non-significant relationship between interrupted IFG activity in TW6 and gesture entropy (r = -0.369, p = 0.120, 95% CI = [-0.810, -0.072]), speech entropy (r = -0.455, p = 0.187, 95% CI = [-1.072, 0.162]), and MI (r = -0.410, p = 0.091, 95% CI = [-0.856, -0.036]) when controlling for response numbers.’ (Lines 349-363)

      Experiment 3: ‘To clarify potential confounds of semantic control difficulty, partial correlation analyses were conducted to examine the relationship between the elicited ERP components and the relevant information matrices, controlling for response numbers. Results consistently indicated modulation by response numbers in the relationship of ERP components with the information matrix, as evidenced by the non-significant partial correlations between the P1 amplitude (P1 component over ML: r = -0.574, p = 0.082, 95% CI = [-1.141, -0.007]) and the P1 cluster (r = -0.503, p = 0.138, 95% CI = [-1.102, 0.096]) with speech entropy; the N1-P2 amplitude (N1-P2 component over LA: r = -0.080, p = 0.746, 95% CI = [-0.554, 0.394]) and N1-P2 cluster (r \= -0.179, p = 0.464, 95% CI = [-0.647, 0.289]) with gesture entropy; the N400 amplitude (N400 component over LA: r = 0.264, p = 0.247, 95% CI = [-0.195,0.723]) and N400 cluster (r = 0.394, p = 0.095, 95% CI = [-0.043, 0.831]) with gesture entropy; the N400 amplitude (N400 component over LA: r = -0.134, p = 0.595, 95% CI = [-0.620, 0.352]) and N400 cluster (r = -0.034, p = 0.894, 95% CI = [-0.524,0.456]) with MI; and the LPC amplitude (LPC component over LA: r \= -0.428, p = 0.217, 95% CI = [-1.054, 0.198]) and LPC cluster (r \= -0.202, p = 0.575, 95% CI = [-0.881, 0.477]) with speech entropy.’ (Lines 424-438)

      Based on the above results, we conclude that there is a dynamic interplay between the difficulty of semantic representation and the control pressures that shape the resulting neural responses. Furthermore, while the role of the IFG in control processes remains consistent, the present study reveals a more segmented role for the pMTG. Specifically, although the pMTG is well-established in the processing of distributed speech information, the integration of multisensory convergence, as indexed by MI, did not elicit the same control-related modulation in pMTG activity. A comprehensive discussion of the control process in shaping neural responses, as well as the specific roles of the IFG and pMTG in this process, is provided in the Discussion section in Lines (493-511): ‘Given that control processes are intrinsically integrated with semantic processing50, a distributed semantic representation enables dynamic modulation of access to and manipulation of meaningful information, thereby facilitating flexible control over the diverse possibilities inherent in a concept. Accordingly, an increased number of candidate responses amplifies the control demands necessary to resolve competing semantic representations. This effect was observed in the present study, where the association of the information matrix with the tDCS effect in IFG, the inhibition of pMTG activity in TW2, disruption of IFG activity in TW6, and modulation of four distinct ERP components collectively demonstrated that response quantity modulated neural activity. These results underscore the intricate interplay between the difficulty of semantic representation and the control pressures that shape the resulting neural responses. 

      The IFG and pMTG, central components of the semantic control network, have been extensively implicated in previous research 50-52. While the role of the IFG in managing both unisensory information and multisensory convergence remains consistent, as evidenced by the confounding difficulty results across Experiments 1 and 2, the current study highlights a more context-dependent function for the pMTG. Specifically, although the pMTG is well-established in the processing of distributed speech information, the multisensory convergence, indexed by MI, did not evoke the same control-related modulation in pMTG activity. These findings suggest that, while the pMTG is critical to semantic processing, its engagement in control processes is likely modulated by the specific nature of the sensory inputs involved’

      Reference:

      Tesink, C.M.J.Y., Petersson, K.M., van Berkum, J.J.A., van den Brink, D., Buitelaar, J.K., and Hagoort, P. (2009). Unification of speaker and meaning in language comprehension: An fMRI study. J Cognitive Neurosci 21, 2085-2099. 10.1162/jocn.2008.21161

      Jackson, R.L. (2021). The neural correlates of semantic control revisited. Neuroimage 224, 117444. 10.1016/j.neuroimage.2020.117444.

      Jefferies, E. (2013). The neural basis of semantic cognition: converging evidence from neuropsychology, neuroimaging and TMS. Cortex 49, 611-625. 10.1016/j.cortex.2012.10.008.

      Noonan, K.A., Jefferies, E., Visser, M., and Lambon Ralph, M.A. (2013). Going beyond inferior prefrontal involvement in semantic control: evidence for the additional contribution of dorsal angular gyrus and posterior middle temporal cortex. J Cogn Neurosci 25, 1824-1850. 10.1162/jocn_a_00442.

      In terms of conceptual equivocation, the use of the term 'graded' by the authors seems to be different from the usage commonly employed in the semantic cognition literature (e.g., the 'graded hub hypothesis', Rice et al., 2015). The idea of a graded hub in the controlled semantic cognition framework (i.e., the anterior temporal lobe) refers to a progressive degree of abstraction or heteromodal information as you progress through the anatomy of the region (i.e., along the dorsal-to-ventral axis). The authors, on the other hand, seem to refer to 'graded manner' in the context of a correlation of entropy or MI and the change in the difference between Reaction Times (RTs) of semantically congruent vs incongruent gesture-speech. The issue is that the discourse through parts of the introduction and discussion seems to conflate both interpretations, and the ideas in the main text do not correspond to the references they cite. This is not overall very convincing. What is it exactly the authors are arguing about the correlation between RTs and MI indexes? As stated above, their measure of entropy captures the spread of responses, which could also be a measure of item difficulty (more diverse responses imply fewer correct responses, a classic index of difficulty). Capturing the diversity of responses means that items with high entropy scores are also likely to have multiple candidate representations, leading to increased selection pressures. Regions like pMTG and IFG have been widely implicated in difficult semantic processing and increased selection pressures (Jackson et al., 2021). How is this MI correlation evidence of integration that proceeds in a 'graded manner'? The conceptual links between these concepts must be made clearer for the interpretation to be convincing.

      Response 2: Regarding the concern of conceptual equivocation, we would like to emphasize that this study represents the first attempt to focus on the relationship between information quantity and neural engagement, a question addressed in three experiments. Experiment 1 (HD-tDCS) targeted the entire gesture-speech integration process in the IFG and pMTG to assess whether neural activity in these regions, previously identified as integration hubs, is modulated by changes in informativeness from both modalities (i.e., entropy) and their interactions (MI). The results revealed a gradual inhibition of neural activity in both areas as MI increased, evidenced by a negative correlation between MI and the tDCS inhibition effect in both regions. Building on this, Experiments 2 and 3 employed double-pulse TMS and ERPs to further assess whether the engaged neural activity was both time-sensitive and staged. These experiments also evaluated the contributions of various sources of information, revealing correlations between information-theoretic metrics and time-locked brain activity, providing insights into the ‘gradual’ nature of gesture-speech integration.

      Therefore, the incremental engagement of the integration hub of IFG and pMTG along with the informativeness of gesture and speech during multisensory integration is different from the "graded hub," which refers to anatomical distribution. We sincerely apologize for this oversight. In the revised manuscript, we have changed the relevant conceptual equivocation in Lines 44-60: ‘Consensus acknowledges the presence of 'convergence zones' within the temporal and inferior parietal areas [1], or the 'semantic hub' located in the anterior temporal lobe[2], pivotal for integrating, converging, or distilling multimodal inputs. Contemporary theories frame the semantic processing as a dynamic sequence of neural states[3], shaped by systems that are finely tuned to the statistical regularities inherent in sensory inputs[4]. These regularities enable the brain to evaluate, weight, and integrate multisensory information, optimizing the reliability of individual sensory signals[5]. However, sensory inputs available to the brain are often incomplete and uncertain, necessitating adaptive neural adjustments to resolve these ambiguities [6]. In this context, neuronal activity is thought to be linked to the probability density of sensory information, with higher levels of uncertainty resulting in the engagement of a broader population of neurons, thereby reflecting the brain’s adaptive capacity to handle diverse possible interpretations[7,8]. Although the role of 'convergence zones' and 'semantic hubs' in integrating multimodal inputs is well established, the precise functional patterns of neural activity in response to the distribution of unified multisensory information—along with the influence of unisensory signals—remain poorly understood.

      To this end, we developed an analytic approach to directly probe the cortical engagement during multisensory gesture-speech semantic integration.’  

      Furthermore, in the Discussion section, we have replaced the term 'graded' with 'incremental' (Line 456,). Additionally, we have included a discussion on the progressive nature of neural engagement, as evidenced by the correlation between RTs and MI indices in Lines 483-492: ‘The varying contributions of unisensory gesture-speech information and the convergence of multisensory inputs, as reflected in the correlation between distinct ERP components and TMS time windows (TMS TWs), are consistent with recent models suggesting that multisensory processing involves parallel detection of modality-specific information and hierarchical integration across multiple neural levels[4,48]. These processes are further characterized by coordination across multiple temporal scales[49]. Building on this, the present study offers additional evidence that the multi-level nature of gesture-speech processing is statistically structured, as measured by information matrix of unisensory entropy and multisensory convergence index of MI, the input of either source would activate a distributed representation, resulting in progressively functioning neural responses.’

      Reference:

      Damasio, H., Grabowski, T.J., Tranel, D., Hichwa, R.D., and Damasio, A.R. (1996). A neural basis for lexical retrieval. Nature 380, 499-505. DOI 10.1038/380499a0.

      Patterson, K., Nestor, P.J., and Rogers, T.T. (2007). Where do you know what you know? The representation of semantic knowledge in the human brain. Nature Reviews Neuroscience 8, 976-987. 10.1038/nrn2277.

      Brennan, J.R., Stabler, E.P., Van Wagenen, S.E., Luh, W.M., and Hale, J.T. (2016). Abstract linguistic structure correlates with temporal activity during naturalistic comprehension. Brain and Language 157, 81-94. 10.1016/j.bandl.2016.04.008.

      Benetti, S., Ferrari, A., and Pavani, F. (2023). Multimodal processing in face-to-face interactions: A bridging link between psycholinguistics and sensory neuroscience. Front Hum Neurosci 17, 1108354. 10.3389/fnhum.2023.1108354.

      Noppeney, U. (2021). Perceptual Inference, Learning, and Attention in a Multisensory World. Annual Review of Neuroscience, Vol 44, 2021 44, 449-473. 10.1146/annurev-neuro-100120-085519.

      Ma, W.J., and Jazayeri, M. (2014). Neural coding of uncertainty and probability. Annu Rev Neurosci 37, 205-220. 10.1146/annurev-neuro-071013-014017.

      Fischer, B.J., and Pena, J.L. (2011). Owl's behavior and neural representation predicted by Bayesian inference. Nat Neurosci 14, 1061-1066. 10.1038/nn.2872.

      Ganguli, D., and Simoncelli, E.P. (2014). Efficient sensory encoding and Bayesian inference with heterogeneous neural populations. Neural Comput 26, 2103-2134. 10.1162/NECO_a_00638.

      Meijer, G.T., Mertens, P.E.C., Pennartz, C.M.A., Olcese, U., and Lansink, C.S. (2019). The circuit architecture of cortical multisensory processing: Distinct functions jointly operating within a common anatomical network. Prog Neurobiol 174, 1-15. 10.1016/j.pneurobio.2019.01.004.

      Senkowski, D., and Engel, A.K. (2024). Multi-timescale neural dynamics for multisensory integration. Nat Rev Neurosci 25, 625-642. 10.1038/s41583-024-00845-7.

      Reviewer #2 (Recommendations for the authors):

      I have a number of small suggestions to make the paper more easy to understand.

      We sincerely thank the reviewer for their careful reading and thoughtful consideration. All suggestions have been thoroughly addressed and incorporated into the revised manuscript.

      (1) Lines 86-87, please clarify whether "chronometric double-pulse TMS" should lead to either excitation or inhibition of neural activities

      Double-pulse TMS elicits inhibition of neural activities (see responses to editors), which has been clarified in the revised manuscript in Lines 90-93: ‘we applied inhibitory chronometric double-pulse transcranial magnetic stimulation (TMS) to specific temporal windows associated with integration processes in these regions[23], assessing whether the inhibitory effects of TMS were correlated with unisensory entropy or the multisensory convergence index (MI)’

      (2) Line 106 "validated by replicating the semantic congruencey effect". Please specify what the task was in the validation study.

      The description of the validation task has been added in Lines 116-119: ‘To validate the stimuli, 30 participants were recruited to replicate the multisensory index of semantic congruency effect, hypothesizing that reaction times for semantically incongruent gesture-speech pairs would be significantly longer than those for congruent pairs.’

      (3) Line 112. "30 subjects". Are they Chinese speakers?

      Yes, all participants in the present study, including those in the pre-tests, are native Chinese speakers.

      (4) Line 122, "responses for each item" Please specify whether you mean here "the comprehensive answer" as you defined in 118-119.

      Yes, and this information has been added in Lines 136-137: ‘comprehensive responses for each item were converted into Shannon's entropy (H)’

      (5) Line 163 "one of three stimulus types (Anodal, Cathodal or Sham)". Please specify whether the order of the three conditions was counterbalanced across participants. Or, whether the order was fixed for all participants.

      The order of the three conditions was counterbalanced across participants, a clearer description has been added in the revised manuscript in Lines 184-189: ‘Participants were divided into two groups, with each group undergoing HD-tDCS stimulation at different target sites (IFG or pMTG). Each participant completed three experimental sessions, spaced one week apart, during which 480 gesture-speech pairs were presented across various conditions. In each session, participants received one of three types of HD-tDCS stimulation: Anodal, Cathodal, or Sham. The order of stimulation site and type was counterbalanced using a Latin square design to control for potential order effects.’

      (6) Line 191-192, "difference in reaction time between semantic incongruence and semantic congruent pairs)" Here, please specify which reaction time was subtracted from which one. This information is very crucial; without it, you cannot interpret your graphs.

      (17) Figure 3. Figure caption for (A). "The semantic congruence effect was calculated as the reaction time difference between...". You need to specify which condition was subtracted from what condition; otherwise, you cannot interpret this figure. "difference" is too ambiguous.

      Corrections have been made in the revised manuscript in Lines 208-211: ‘Neural responses were quantified based on the effects of HD-tDCS (active tDCS minus sham tDCS) on the semantic congruency effect, defined as the difference in reaction times between semantic incongruent and congruent conditions (Rt(incongruent) - Rt(congruent))’ and Line 796-798: ‘The semantic congruency effect was calculated as the reaction time (RT) difference between semantically incongruent and semantically congruent pairs (Rt(incongruent) - Rt(congruent))’.

      (7) Line 363 "progressive inhibition of IFG and pMTG by HD-tDCS as the degree of gesture-speech interaction, indexed by MI, advanced." This sentence is very hard to follow. I don't understand what part of the data in Figure 3 speaks to "inhibition of IFG". And what is "HD-tDCS"? I think it is easier to read if you talk about correlation (not "progressive" and "advanced").

      High-Definition transcranial direct current stimulation (HD-tDCS) was applied to modulate the activity of pMTG and IFG, with cathodal stimulation inducing inhibitory effects and anodal stimulation facilitating neural activity. In Figure 3, we examined the relationship between the tDCS effects on pMTG and IFG and the three information matrices (entropy and MI). Our results revealed significant correlations between MI and the cathodal-tDCS effects in both regions. We acknowledge that the original phrasing may have been unclear, and in the revised manuscript, we have provided a more explicit explanation to enhance clarity in Lines 443-445: ‘Our results, for the first time, revealed that the inhibition effect of cathodal-tDCS on the pMTG and IFG correlated with the degree of gesture-speech multisensory convergence, as indexed by MI’.

      (8) Lines 367-368 I don't understand why gesture is top down and speech is bottom up. Is that because gesture precedes speech (gesture is interpretable at the point of speech onset)?

      Yes, since we employed a semantic priming paradigm by aligning speech onset with the gesture comprehension point, we interpret the gesture-speech integration process as an interaction between the top-down prediction from gestures and the bottom-up processing of speech. In the revised manuscript, we have provided a clearer and more coherent description that aligns with the results. Lines 445-449: ‘Moreover, the gradual neural engagement was found to be time-sensitive and staged, as evidenced by the selectively interrupted time windows (Experiment 2) and the distinct correlated ERP components (Experiment 3), which were modulated by different information contributors, including unisensory entropy or multisensory MI’

      (9) Line 380 - 381. Can you spell out "TW" and "IP"?

      (16) Line 448, NIBS, Please spell out "NIBS".

      "TW" have been spelled out in Lines 459: ‘time windows (TW)’,"IP" in Line 460: ‘identification point (IP)’. The term "NIBS" was replaced with "HD-tDCS and TMS" to provide clearer specification of the techniques employed: ‘Consistent with this, the present study provides robust evidence, through the application of HD-tDCS and TMS, that the integration hubs for gesture and speech—the pMTG and IFG—operate in an incremental manner.’ (Lines 454-457). 

      (10) Line 419, The higher certainty of gesture => The higher the certainty of gesture is

      (13) Line 428, "a larger MI" => "a larger MI is"

      (12) Line 427-428, "the larger overlapped neural populations" => "the larger, the overlapped neural populations"

      Changes have been made in Line 522 ‘The higher the certainty of gesture is’ , Line 531: ‘a larger MI is’ and Line 530 ‘the larger, overlapped neural populations’

      (11) Line 423 "Greater TMS effect over the IFG" Can you describe the TMS effect?

      TMS effect has been described as ‘Greater TMS inhibitory effect’ (Line 526)

      (14) Line 423 "reweighting effect" What is this? Please describe (and say which experiment it is about).

      Clearer description has been provided in Lines 535-538: ‘As speech entropy increases, indicating greater uncertainty in the information provided by speech, more cognitive effort is directed towards selecting the targeted semantic representation. This leads to enhanced involvement of the IFG and a corresponding reduction in LPC amplitude’.

      (15) Line 437 "the graded functionality of every disturbed period is not guaranteed" (I don't understand this sentence).

      Clearer description has been provided in Lines 552-557: ‘Additionally, not all influenced TWs exhibited significant associations with entropy and MI. While HD-tDCS and TMS may impact functionally and anatomically connected brain regions[55,56], whether the absence of influence in certain TWs can be attributed to compensation by other connected brain areas, such as angular gyrus[57] or anterior temporal lobe[58], warrants further investigation. Therefore, caution is needed when interpreting the causal relationship between inhibition effects of brain stimulation and information-theoretic metrics (entropy and MI).

      References:

      Humphreys, G. F., Lambon Ralph, M. A., & Simons, J. S. (2021). A Unifying Account of Angular Gyrus Contributions to Episodic and Semantic Cognition. Trends in neurosciences, 44(6), 452–463. https://doi.org/10.1016/j.tins.2021.01.006

      Bonner, M. F., & Price, A. R. (2013). Where is the anterior temporal lobe and what does it do?. The Journal of neuroscience : the official journal of the Society for Neuroscience, 33(10), 4213–4215. https://doi.org/10.1523/JNEUROSCI.0041-13.2013

      (18) Figure 4. "TW1", "TW2", etc. are not informative. Either replace them with the actual manuscript or add manuscript information (either in the graph itself or in the figure title).

      Information was added into the figure title ‘Figure 4. TMS impacts on semantic congruency effect across various time windows (TW).’ (Line 804), included a detailed description of each time window in Lines 805-807: ‘(A) Five time windows (TWs) showing selective disruption of gesture-speech integration were chosen: TW1 (-120 to -80 ms relative to speech identification point), TW2 (-80 to -40 ms), TW3 (-40 to 0 ms), TW6 (80 to 120 ms), and TW7 (120 to 160 ms).’

      (19) Table 2C.

      The last column is titled "p(xi, yi)". I don't understand why the authors use this label for this column.

      In the formula, at the very end, there is "p(xi|yi). I wonder why it is p(xi|yi), as opposed to p(yi|xi).

      Mutual Information (MI) was calculated by subtracting the entropy of the combined gesture-speech dataset (Entropy(gesture + speech)) from the sum of the individual entropies of gesture and speech (Entropy(gesture) + Entropy(speech)). Thus, the p(xi,yi) aimed to describe the entropy of the combined dataset. We acknowledge the potential ambiguity in the original description, and in the revised manuscript, we have changed the formula of p(xi,yi) into ‘p(xi+yi)’ (Line 848) in Table 2C, and the relevant equation of MI ‘’. Also we provided a clear MI calculation process in Lines 143-146: ‘MI was used to measure the overlap between gesture and speech information, calculated by subtracting the entropy of the combined gesture-speech dataset (Entropy(gesture + speech)) from the sum of their individual entropies (Entropy(gesture) + Entropy(speech)) (see Appendix Table 2C)’.

      Reviewer #3 (Recommendations for the authors):

      (1) The authors should try and produce data showing that the confound of difficulty due to the number of lexical or semantic representations is not underlying high-entropy items if they wish to improve the credibility of their claim that the disruption of the congruency effect is due to speech-gesture integration. Additionally, they should provide more evidence either in the form of experiments or references to better justify why mutual information is an index for integration in the first place.

      Response 1: An additional analysis has been conducted to assess whether the number of lexical or semantic representations affect the neural outcomes, please see details in the Responses to Reviewer 3 (public review) response 1.

      Mutual information (MI), a concept rooted in information theory, quantifies the reduction in uncertainty about one signal when the other is known, thereby capturing the statistical dependence between them. MI is calculated as the difference between the individual entropies of each signal and their joint entropy, which reflects the total uncertainty when both signals are considered together. This metric aligns with the core principle of multisensory integration: different modalities reduce uncertainty about each other by providing complementary, predictive information. Higher MI values signify that the integration of sensory signals results in a more coherent and unified representation, while lower MI values indicate less integration or greater divergence between the modalities. As such, MI serves as a robust and natural index for assessing the degree of multisensory integration.

      To date, the use of MI as an index of integration has been limited, with one notable study by Tremblay et al. (2016), cited in the manuscript, using pointwise MI to quantify the extent to which two syllables mutually constrain each other. While MI has been extensively applied in natural language processing to measure the co-occurrence strength between words (e.g., Lin et al., 2012), its application as an index of multisensory convergence—particularly in the context of gesture-speech integration as employed in this study—is novel. In the revised manuscript, we have clarified the relationship between MI and multisensory convergence: ‘MI assesses share information between modalities[25],indicating multisensory convergence and acting as an index of gesture-speech integration’ (Lines 73-74).

      Also, in our study, we calculated MI as per its original definition, by subtracting the entropy of summed dataset of gesture-speech from the combined entropies of gesture and speech. The detailed calculation method is provided in Lines 136-152: ‘To quantify information content, comprehensive responses for each item were converted into Shannon's entropy (H) as a measure of information richness (Figure 1A bottom). With no significant gender differences observed in both gesture (t(20) = 0.21, p = 0.84) and speech (t(20) = 0.52, p = 0.61), responses were aggregated across genders, resulting in 60 answers per item (Appendix Table 2). Here, p(xi) and p(yi) represent the distribution of 60 answers for a given gesture (Appendix Table 2B) and speech (Appendix Table 2A), respectively. High entropy indicates diverse answers, reflecting broad representation, while low entropy suggests focused lexical recognition for a specific item (Figure 2B). MI was used to measure the overlap between gesture and speech information, calculated by subtracting the entropy of the combined gesture-speech dataset (Entropy(gesture + speech)) from the sum of their individual entropies (Entropy(gesture) + Entropy(speech)) (see Appendix Table 2C). For specific gesture-speech combinations, equivalence between the combined entropy and the sum of individual entropies (gesture or speech) indicates absence of overlap in response sets. Conversely, significant overlap, denoted by a considerable number of shared responses between gesture and speech datasets, leads to a noticeable discrepancy between combined entropy and the sum of gesture and speech entropies. Elevated MI values thus signify substantial overlap, indicative of a robust mutual interaction between gesture and speech.’

      Additional examples outlined in Appendix Table 2 in Lines 841-848:

      This novel application of MI as a multisensory convergence index offers new insights into how different sensory modalities interact and integrate to shape semantic processing.

      Reference:

      Tremblay, P., Deschamps, I., Baroni, M., and Hasson, U. (2016). Neural sensitivity to syllable frequency and mutual information in speech perception and production. Neuroimage 136, 106-121. 10.1016/j.neuroimage.2016.05.018

      Lin, W., Wu, Y., & Yu, L. (2012). Online Computation of Mutual Information and Word Context Entropy. International Journal of Future Computer and Communication, 167-169.

      (2) Finally, if the authors wish to address the graded hub hypothesis as posited by the controlled semantic cognition framework (e.g., Rice et al., 2015), they would have to stimulate a series of ROIs progressing gradually through the anatomy of their candidate regions showing the effects grow along this spline, more than simply correlate MI with RT differences.

      Response 2: We appreciate the reviewer’s thoughtful consideration. The incremental engagement of the integration hub of IFG and pMTG along with the informativeness of gesture and speech during multisensory integration is different from the concept of "graded hub," which refers to anatomical distribution. See Responses to reviewer 3 (public review) response 2 for details.

      (3) The authors report significant effects with p values as close to the threshold as p=0.49 for the pMTG correlation in Experiment 1, for example. How confident are the authors these results are reliable and not merely their 'statistical luck'? Especially in view of sample sizes that hover around 22-24 participants, which have been called into question in the field of non-invasive brain stimulation (e.g., Mitra et al, 2021)?

      Response 3: In Experiment 1, a total of 52 participants were assigned to two groups, each undergoing HD-tDCS stimulation over either the inferior frontal gyrus (IFG) or posterior middle temporal gyrus (pMTG), yielding 26 participants per group for correlation analysis. Power analysis, conducted using G*Power, indicated that a sample size of 26 participants per group would provide sufficient power (0.8) to detect a large effect size (0.5) at an alpha level of 0.05, justifying the chosen sample size. To control for potential statistical artifacts, we compared the results to those from the unaffected control condition.

      In the Experiment 1, participants were tasked with a gender categorization task, where they responded as accurately and quickly as possible to the gender of the voice they saw, while gender congruency (e.g., a male gesture paired with a male voice or a female gesture with a male voice) was manipulated. This manipulation served as direct control, enabling the investigation of automatic and implicit semantic interactions between gesture and speech. This relevant information was provided in the manuscript in Lines 167-172:‘An irrelevant factor of gender congruency (e.g., a man making a gesture combined with a female voice) was created[22,23,35]. This involved aligning the gender of the voice with the corresponding gender of the gesture in either a congruent (e.g., male voice paired with a male gesture) or incongruent (e.g., male voice paired with a female gesture) manner. This approach served as a direct control mechanism, facilitating the investigation of the automatic and implicit semantic interplay between gesture and speech[35]’. Correlation analyses were conducted to examine the TMS disruption effects on gender congruency, comparing reaction times for gender-incongruent versus congruent trials. No significant correlations were found between TMS disruption effects on either the IFG (Cathodal-tDCS effect with MI: r = 0.102, p = 0.677; Anodal-tDCS effect with MI: r = 0.178, p = 0.466) or pMTG (Cathodal-tDCS effect with MI: r \= -0.201, p = 0.410; Anodal-tDCS effect with MI: r = -0.232, p = 0.338).

      Moreover, correlations between the TMS disruption effect on semantic congruency and both gesture entropy, speech entropy, and mutual information (MI) were examined. P-values of 0.290, 0.725, and 0.049 were observed, respectively.  

      The absence of a TMS effect on gender congruency, coupled with the lack of significance when correlated with the other information matrices, highlights the robustness of the significant finding at p = 0.049.

      (4) The distributions of entropy for gestures and speech are very unequal. Whilst entropy for gestures has high variability, (.12-4.3), that of speech is very low (ceiling effect?) with low variance. Can the authors comment on whether they think this might have affected their analyses or results in any way? For example, do they think this could be a problem when calculating MI, which integrates both measures? L130-131.'

      Response 4: We sincerely thank the reviewer for raising this insightful question. The core premise of the current study is that brain activity is modulated by the degree of information provided. Accordingly, the 20 entropy values for gesture and speech represent a subset of the overall entropy distribution, with the degree of entropy correlating with a distributed pattern of neural activity, regardless of the scale of variation. This hypothesis aligns with previous studies suggesting that neuronal activity is linked to the probability density of sensory information, with higher levels of uncertainty resulting in the engagement of a broader population of neurons, thereby reflecting the brain’s adaptive capacity to handle diverse possible interpretations (Fischer & Pena, 2011; Ganguli & Simoncelli, 2014).

      Importantly, we conducted another EEG experiment with 30 subjects. Given the inherent differences between gesture and speech, it is important to note that speech, being more structurally distinct, tends to exhibit lower variability than gesture. To prevent an imbalance in the distribution of gesture and speech, we manipulated the information content of each modality. Specifically, we created three conditions for both gesture and speech (i.e., 0.75, 1, and 1.25 times the identification threshold), thereby ensuring comparable variance between the two modalities: gesture (mean entropy = 2.91 ± 1.01) and speech (mean entropy = 1.82 ± 0.71) (Author response table 6).

      Full-factorial RSA analysis revealed an early P1 effect (0-100 ms) for gesture and a late LPC effect (734-780 ms) for speech (Author response image 2b). Crucially, the identified clusters showed significant correlations with both gesture (Author response image 2c1) and speech entropy (Author response image 2c3), respectively. These findings replicate the results of the present study, demonstrating that, irrespective of the variance in gesture and speech entropy, both modalities elicited ERP amplitude responses in a progressive manner that aligned with their respective information distributions.

      Regarding the influence on MI values, since MI was calculated based on the overlapping responses between gesture and speech, a reduction in uncertainty during speech comprehension would naturally result in a smaller contribution to the MI value. However, as hypothesized above, the MI values were also assumed to represent a subset of the overall distribution, where the contributions of both gesture and speech are expected to follow a normal distribution. This hypothesis was further supported by our replication experiment. When the contributions of gesture and speech were balanced, a correlation between MI values and N400 amplitude was observed (Author response image 2c2), consistent with the results reported in the present manuscript. These findings not only support the idea that the correlation between MI and ERP components is unaffected by the subset of MI values but also confirm the replicability of our results.

      Author response table 6.

      Quantitative entropy for each gesture stimulus (BD: before discrimination point; DP: discrimination point; AD: after discrimination point) and speech stimulus (BI: before identification point; IP: identification point; AI: after identification point).

      Author response image 2.

      Results of group-level analysis and full-factorial RSA. a: The full-factorial representational similarity analysis (RSA) framework is illustrated schematically. Within the general linear model (GLM), the light green matrix denotes the representational dissimilarity matrix (RDM) for gesture semantic states, while light blue matrix represents speech semantic states, and the light red matrix illustrates the semantic congruency effect. The symbol ‘e’ indicates the random error term. All matrices, including the neural dissimilarity matrix, are structured as 18 * 18 matrices, corresponding to 18 conditions (comprising 3 gesture semantic states, 3 speech semantic states, and 2 congruency conditions). b: Coding strength for gesture states, speech states and congruency effect. Shaded clusters represent regions where each factor exhibited significant effects. Clusters with lower opacity correspond to areas where the grand-mean ERP amplitudes across conditions showed the highest correlation with unimodal entropy or MI. c1-c6: Topographical correlation maps illustrate the four significant RSA clusters (top), accompanied by the highest correlations between ERP amplitudes within the significant RSA clusters and the information matrices (bottom). Black dots represent electrodes exhibiting significant correlations, while black stars highlight the electrode with the highest correlation coefficient.

      (5) L383: Why are the authors calling TW2 pre-lexical and TW6 post-lexical? I believe they must provide evidence or references justifying calling these periods pre- and post-lexical. This seems critical given the argument they're trying to make in this paragraph.

      Response 5: The time windows (TWs) selected for the current study were based on our previous work (Zhao et al., 2021, J. Neurosci). In that study, we employed a double-pulse TMS protocol, delivering stimulation across eight 40-ms time windows: three windows preceding the speech identification point (TWs 1-3) and five windows following it (TWs 4-8). The pre-lexical time windows (TWs 1-3) occur before speech identification, while the post-lexical time windows (TWs 4-8) occur after this point. in the revised manuscript, we have made that clear in Lines 462-466:

      “In TW2 of gesture-speech integration, which precedes the speech identification point23 and represents a pre-lexical stage, the suppression effect observed in the pMTG was correlated with speech entropy. Conversely, during TW6, which follows the speech identification point23 and represents a post-lexical stage, the IFG interruption effect was influenced by both gesture entropy, speech entropy, and their MI”

      Reference:

      Zhao, W., Li, Y., and Du, Y. (2021). TMS reveals dynamic interaction between inferior frontal gyrus and posterior middle temporal gyrus in gesture-speech semantic integration. The Journal of Neuroscience, 10356-10364. 10.1523/jneurosci.1355-21.2021.

      (6) Below, I recommend the authors improve their description of the criteria employed to select ROIs. This is important for several reasons. For example, the lack of a control ROI presumably not implicated in integration makes the interpretation of the specificity of the results difficult. Additionally, other regions have been proposed more consistently by recent evidence as multimodal integrators, like for example, the angular gyrus (Humphreys, 2021), or the anterior temporal lobe. The inclusion of IFG as a key region for integration and the oversight of angular gyrus seems to me unjustified in the light of recent evidence.

      Response 6: We appreciate the reviewer’s thoughtful consideration. The selection of IFG and pMTG as ROIs was based on a meta-analysis of multiple fMRI studies on gesture-speech integration, in which these two locations were consistently identified as activated. See Table 2 for details of the studies and coordinates of brain locations reported.

      Author response table 7.

      Meta-analysis of previous studies on gesture-speech integration.

      Based on the meta-analysis of previous studies, we selected the IFG and pMTG as ROIs for gesture-speech integration. The rationale for selecting these brain regions is outlined in the introduction in Lines 65-68: ‘Empirical studies have investigated the semantic integration between gesture and speech by manipulating their semantic relationship[15-18] and revealed a mutual interaction between them[19-21] as reflected by the N400 latency and amplitude[14] as well as common neural underpinnings in the left inferior frontal gyrus (IFG) and posterior middle temporal gyrus (pMTG)[15,22,23]’.

      And further described in Lines 79-80: ‘_Experiment 1 employed high-definition transcranial direct current stimulation (HD-tDCS) to administer Anodal, Cathodal and Sham stimulation to either the IFG or the pMTG ’._ And Lines 87-90: ‘Given the differential involvement of the IFG and pMTG in gesture-speech integration, shaped by top-down gesture predictions and bottom-up speech processing [23], Experiment 2 was designed to assess whether the activity of these regions was associated with relevant informational matrices’.

      In the Methods section, we clarified the selection of coordinates in Lines 193-199: ‘Building on a meta-analysis of prior fMRI studies examining gesture-speech integration[22], we targeted Montreal Neurological Institute (MNI) coordinates for the left IFG at (-62, 16, 22) and the pMTG at (-50, -56, 10). In the stimulation protocol for HD-tDCS, the IFG was targeted using electrode F7 as the optimal cortical projection site[36], with four return electrodes placed at AF7, FC5, F9, and FT9. For the pMTG, TP7 was selected as the cortical projection site36, with return electrodes positioned at C5, P5, T9, and P9.’

      The selection of IFG or pMTG as integration hubs for gesture and speech has also been validated in our previous studies. Specifically, Zhao et al. (2018, J. Neurosci) applied TMS to both areas. Results demonstrated that disrupting neural activity in the IFG or pMTG via TMS selectively impaired the semantic congruency effect (reaction time costs due to semantic incongruence), while leaving the gender congruency effect unaffected. These findings identified the IFG and pMTG as crucial hubs for gesture-speech integration, guiding the selection of brain regions for our subsequent studies.

      In addition, Zhao et al. (2021, J. Neurosci) employed a double-pulse TMS protocol across eight 40-ms time windows to explore the temporal dynamics of the IFG and pMTG. The results revealed time-window-selective disruptions of the semantic congruency effect, further supporting the dynamic and temporally staged involvement of these regions in gesture-speech integration.

      While we have solid rationale for selecting the IFG and pMTG as key regions, we acknowledge the reviewer's point that the involvement of additional functionally and anatomically brain areas, cannot be excluded. We have included in the discussion as limitations in Lines 552-557: ‘Additionally, not all influenced TWs exhibited significant associations with entropy and MI. While HD-tDCS and TMS may impact functionally and anatomically connected brain regions[55,56], whether the absence of influence in certain TWs can be attributed to compensation by other connected brain areas, such as angular gyrus[57] or anterior temporal lobe[58], warrants further investigation. Therefore, caution is needed when interpreting the causal relationship between inhibition effects of brain stimulation and information-theoretic metrics (entropy and MI).

      References:

      Willems, R.M., Ozyurek, A., and Hagoort, P. (2009). Differential roles for left inferior frontal and superior temporal cortex in multimodal integration of action and language. Neuroimage 47, 1992-2004. 10.1016/j.neuroimage.2009.05.066.

      Drijvers, L., Jensen, O., and Spaak, E. (2021). Rapid invisible frequency tagging reveals nonlinear integration of auditory and visual information. Human Brain Mapping 42, 1138-1152. 10.1002/hbm.25282.

      Drijvers, L., and Ozyurek, A. (2018). Native language status of the listener modulates the neural integration of speech and iconic gestures in clear and adverse listening conditions. Brain and Language 177, 7-17. 10.1016/j.bandl.2018.01.003.

      Drijvers, L., van der Plas, M., Ozyurek, A., and Jensen, O. (2019). Native and non-native listeners show similar yet distinct oscillatory dynamics when using gestures to access speech in noise. Neuroimage 194, 55-67. 10.1016/j.neuroimage.2019.03.032.

      Holle, H., and Gunter, T.C. (2007). The role of iconic gestures in speech disambiguation: ERP evidence. J Cognitive Neurosci 19, 1175-1192. 10.1162/jocn.2007.19.7.1175.

      Kita, S., and Ozyurek, A. (2003). What does cross-linguistic variation in semantic coordination of speech and gesture reveal?: Evidence for an interface representation of spatial thinking and speaking. J Mem Lang 48, 16-32. 10.1016/S0749-596x(02)00505-3.

      Bernardis, P., and Gentilucci, M. (2006). Speech and gesture share the same communication system. Neuropsychologia 44, 178-190. 10.1016/j.neuropsychologia.2005.05.007.

      Zhao, W.Y., Riggs, K., Schindler, I., and Holle, H. (2018). Transcranial magnetic stimulation over left inferior frontal and posterior temporal cortex disrupts gesture-speech integration. Journal of Neuroscience 38, 1891-1900. 10.1523/Jneurosci.1748-17.2017.

      Zhao, W., Li, Y., and Du, Y. (2021). TMS reveals dynamic interaction between inferior frontal gyrus and posterior middle temporal gyrus in gesture-speech semantic integration. The Journal of Neuroscience, 10356-10364. 10.1523/jneurosci.1355-21.2021.

      Hartwigsen, G., Bzdok, D., Klein, M., Wawrzyniak, M., Stockert, A., Wrede, K., Classen, J., and Saur, D. (2017). Rapid short-term reorganization in the language network. Elife 6. 10.7554/eLife.25964.

      Jackson, R.L., Hoffman, P., Pobric, G., and Ralph, M.A.L. (2016). The semantic network at work and rest: Differential connectivity of anterior temporal lobe subregions. Journal of Neuroscience 36, 1490-1501. 10.1523/JNEUROSCI.2999-15.2016.

      Humphreys, G. F., Lambon Ralph, M. A., & Simons, J. S. (2021). A Unifying Account of Angular Gyrus Contributions to Episodic and Semantic Cognition. Trends in neurosciences, 44(6), 452–463. https://doi.org/10.1016/j.tins.2021.01.006

      Bonner, M. F., & Price, A. R. (2013). Where is the anterior temporal lobe and what does it do?. The Journal of neuroscience : the official journal of the Society for Neuroscience, 33(10), 4213–4215. https://doi.org/10.1523/JNEUROSCI.0041-13.2013

      (7) Some writing is obscure or unclear, in part due to superfluous words like 'intricate neural processes' on L74. Or the sentence in L47 - 48 about 'quantitatively functional mental states defined by a specific parser unified by statistical regularities' which, even read in context, fails to provide clarity about what a quantitatively functional mental state is, or how it is defined by specific parsers (or what these are), and what is the link to statistical regularities. In some cases, this lack of clarity leads to difficulties assessing the appropriateness of the methods, or the exact nature of the claims. For example, do they mean degree of comprehension instead of comprehensive value? I provide some more examples below:

      Response 7: We appreciate the reviewer’s thoughtful consideration. The revised manuscript now includes a clear description and a detailed explanation of the association with the statistical logic, addressing the concerns raised in Lines 47-55: ‘Contemporary theories frame the semantic processing as a dynamic sequence of neural states[3], shaped by systems that are finely tuned to the statistical regularities inherent in sensory inputs[4]. These regularities enable the brain to evaluate, weight, and integrate multisensory information, optimizing the reliability of individual sensory signals [5]. However, sensory inputs available to the brain are often incomplete and uncertain, necessitating adaptive neural adjustments to resolve these ambiguities[6]. In this context, neuronal activity is thought to be linked to the probability density of sensory information, with higher levels of uncertainty resulting in the engagement of a broader population of neurons, thereby reflecting the brain’s adaptive capacity to handle diverse possible interpretations[7,8].’

      References:

      Brennan, J.R., Stabler, E.P., Van Wagenen, S.E., Luh, W.M., and Hale, J.T. (2016). Abstract linguistic structure correlates with temporal activity during naturalistic comprehension. Brain and Language 157, 81-94. 10.1016/j.bandl.2016.04.008.

      Benetti, S., Ferrari, A., and Pavani, F. (2023). Multimodal processing in face-to-face interactions: A bridging link between psycholinguistics and sensory neuroscience. Front Hum Neurosci 17, 1108354. 10.3389/fnhum.2023.1108354.

      Noppeney, U. (2021). Perceptual Inference, Learning, and Attention in a Multisensory World. Annual Review of Neuroscience, Vol 44, 2021 44, 449-473. 10.1146/annurev-neuro-100120-085519.

      Ma, W.J., and Jazayeri, M. (2014). Neural coding of uncertainty and probability. Annu Rev Neurosci 37, 205-220. 10.1146/annurev-neuro-071013-014017.

      Fischer, B.J., and Pena, J.L. (2011). Owl's behavior and neural representation predicted by Bayesian inference. Nat Neurosci 14, 1061-1066. 10.1038/nn.2872.

      Ganguli, D., and Simoncelli, E.P. (2014). Efficient sensory encoding and Bayesian inference with heterogeneous neural populations. Neural Comput 26, 2103-2134. 10.1162/NECO_a_00638.

      Comment 7.1: a) I am not too sure what they mean by 'response consistently provided by participants for four to six consecutive instances' [L117-118]. They should be clearer with the description of these 'pre-test' study methods.

      Response 7.1: Thank you for this insightful question. An example of a participant's response to the gesture 'an' is provided below (Table 3). Initially, within 240 ms, the participant provided the answer "an," which could potentially be a guess. To ensure that the participant truly comprehends the gesture, we repeatedly present it until the participant’s response stabilizes, meaning the same answer is given consistently over several trials. While one might consider fixing the number of repetitions (e.g., six trials), this could lead to participants predicting the rule and providing the same answer out of habit. To mitigate this potential bias, we allow the number of repetitions to vary flexibly between four and six trials. 

      We understand that the initial phrase might be ambiguous, in the revised manuscript, we have changed the phrase into: ‘For each gesture or speech, the action verb consistently provided by participants across four to six consecutive repetitions—with the number of repetitions varied to mitigate learning effects—was considered the comprehensive response for the gesture or speech.’ (Lines 130-133)

      Author response table 8.

      Example of participant's response to the gesture 'an'

      Comment 7.2: b) I do not understand the paragraph in L143 - 146. This is important to rephrase for clarification. What are 'stepped' neural changes? What is the purpose of 'aggregating' neural responses with identical entropy / MI values?

      Response 7.2: It is important to note that the 20 stimuli exhibit 20 increments of gesture entropy values, 11 increments of speech entropy values, and 19 increments of mutual information values (Appendix Table 3). This discrepancy arises from the calculation of entropy and mutual information, where the distributions were derived from the comprehensive set of responses contributed by all 30 participants. As a result, these values were impacted not only by the distinct nameabilities of the stimuli but also by the entirety of responses provided. Consequently, in the context of speech entropy, 9 items demonstrate the nameability of 1, signifying unanimous comprehension among all 30 participants, resulting in an entropy of 0. Moreover, stimuli 'ning' and 'jiao' share an identical distribution, leading to an entropy of 0.63. Regarding MI, a value of 0.66 is computed for the combinations of stimuli 'sao' (gesture entropy: 4.01, speech entropy: 1.12, Author response image 32) and 'tui' (gesture entropy: 1.62, speech entropy: 0, Author response image 4). This indicates that these two sets of stimuli manifest an equivalent degree of integration.

      Author response image 3.

      Example of gesture answers (gesture sao), speech answers (speech sao), and mutual information (MI) for the ‘sao’ item

      Author response image 4.

      Example of gesture answers (gesture tui), speech answers (speech tui), and mutual information (MI) for the ‘tui’ item

      To precisely assess whether lower entropy/MI corresponds to a smaller or larger neural response, neural responses (ERP amplitude or TMS inhibition effect) with identical entropy or MI values were averaged before undergoing correlational analysis. We understand that the phrasing might be ambiguous. Clear description has been changed in the revised manuscript in Lines 157-160: ‘To determine whether entropy or MI values corresponds to distinct neural changes, the current study first aggregated neural responses (including inhibition effects of tDCS and TMS or ERP amplitudes) that shared identical entropy or MI values, prior to conducting correlational analyses.’

      Comment 7.3: c) The paragraph in L160-171 is confusing. Is it an attempt to give an overview of all three experiments? If so, consider moving to the end or summarising what each experiment is at the beginning of the paragraph giving it a name (i.e., TMS). Without that, it is unclear what each experiment is counterbalancing or what 'stimulation site' refers to, for example, leading to a significant lack of clarity.

      Response 7.3: We are sorry for the ambiguity, in the revised manuscript, we have moved the relevant phrasing to the beginning of each experiment.

      ‘Experiment 1: HD-tDCS protocol and data analysis

      Participants were divided into two groups, with each group undergoing HD-tDCS stimulation at different target sites (IFG or pMTG). Each participant completed three experimental sessions, spaced one week apart, during which 480 gesture-speech pairs were presented across various conditions. In each session, participants received one of three types of HD-tDCS stimulation: Anodal, Cathodal, or Sham. The order of stimulation site and type was counterbalanced using a Latin square design to control for potential order effects’ (Lines 183-189)

      ‘Experiment 2: TMS protocol and data analysis

      Experiment 2 involved 800 gesture-speech pairs, presented across 15 blocks over three days, with one week between sessions. Stimulation was administered at three different sites (IFG, pMTG, or Vertex). Within the time windows (TWs) spanning the gesture-speech integration period, five TWs that exhibited selective disruption of integration were selected: TW1 (-120 to -80 ms relative to the speech identification point), TW2 (-80 to -40 ms), TW3 (-40 to 0 ms), TW6 (80 to 120 ms), and TW7 (120 to 160 ms)23 (Figure 1C). The order of stimulation site and TW was counterbalanced using a Latin square design.’ (Lines 223-230)

      ‘Experiment 3: Electroencephalogram (EEG) recording and data analysis

      Experiment 3, comprising a total of 1760 gesture-speech pairs, was completed in a single-day session.’ (Lines 249-250)

      Comment 7.4: d) L402-406: This sentence is not clear. What do the authors mean by 'the state of [the neural landscape] constructs gradually as measured by entropy and MI'? How does this construct a neural landscape? The authors must rephrase this paragraph using clearer language since in its current state it is very difficult to assess whether it is supported by the evidence they present.

      Response 7.4: We are sorry for the ambiguity, in the revised manuscript we have provided clear description in Lines 483-492: ‘The varying contributions of unisensory gesture-speech information and the convergence of multisensory inputs, as reflected in the correlation between distinct ERP components and TMS time windows (TMS TWs), are consistent with recent models suggesting that multisensory processing involves parallel detection of modality-specific information and hierarchical integration across multiple neural levels[4,48]. These processes are further characterized by coordination across multiple temporal scales[49]. Building on this, the present study offers additional evidence that the multi-level nature of gesture-speech processing is statistically structured, as measured by information matrix of unisensory entropy and multisensory convergence index of MI, the input of either source would activate a distributed representation, resulting in progressively functioning neural responses’

      References:

      Benetti, S., Ferrari, A., and Pavani, F. (2023). Multimodal processing in face-to-face interactions: A bridging link between psycholinguistics and sensory neuroscience. Front Hum Neurosci 17, 1108354. 10.3389/fnhum.2023.1108354.

      Meijer, G.T., Mertens, P.E.C., Pennartz, C.M.A., Olcese, U., and Lansink, C.S. (2019). The circuit architecture of cortical multisensory processing: Distinct functions jointly operating within a common anatomical network. Prog Neurobiol 174, 1-15. 10.1016/j.pneurobio.2019.01.004.

      Senkowski, D., and Engel, A.K. (2024). Multi-timescale neural dynamics for multisensory integration. Nat Rev Neurosci 25, 625-642. 10.1038/s41583-024-00845-7.

      (8) Some writing suffers from conceptual equivocation. For example, the link between 'multimodal representation' and gesture as a type of multimodal extralinguistic information is not straightforward. What 'multimodal representations' usually refer to in semantic cognition is not the co-occurrence of gesture and speech, but the different sources or modalities that inform the structure of a semantic representation or concept (not the fact we use another modality vision to perceive gestures that enrich the linguistic auditory communication of said concepts). See also my comment in the public review regarding the conceptual conflation of the graded hub hypothesis.

      Response 8: We aimed to clarify that the integration of gesture and speech, along with the unified representation it entails, is not merely a process whereby perceived gestures enhance speech comprehension. Rather, there exists a bidirectional influence between these two modalities, affecting both their external forms (Bernaidis et al., 2006) and their semantic content (Kita et al., 2003; Kelly et al., 2010). Given that multisensory processing is recognized as an interplay of both top-down and bottom-up mechanisms, we hypothesize that this bidirectional semantic influence between gesture and speech operates similarly. Consequently, we recorded neural responses—specifically the inhibitory effects observed through TMS/tDCS or ERP components—beginning at the onset of speech, which marks the moment when both modalities are accessible.

      We prioritize gesture for two primary reasons. Firstly, from a naturalistic perspective, speech and gesture are temporally aligned; gestures typically precede their corresponding speech segments by less than one second (Morrelsamuls et al., 1992). This temporal alignment has prompted extensive research aimed at identifying the time windows during which integration occurs (Obermeier et al., 2011, 2015). Results indicate that local integration of gesture and speech occurs within a time frame extending from -200 ms to +120 ms relative to gesture-speech alignment, where -200 ms indicates that gestures occur 200 ms before speech onset, and +120 ms signifies gestures occurring after the identification point of speech.

      Secondly, in our previous study (Zhao, 2023), we investigated this phenomenon by manipulating gesture-speech alignment across two conditions: (1) gestures preceding speech by a fixed interval of 200 ms, and (2) gestures preceding speech at its semantic identification point. Notably, only in the second condition did we observe time-window-selective disruptions of the semantic congruency effect in the IFG and pMTG. This led us to conclude that gestures serve a semantic priming function for co-occurring speech.

      We recognize that our previous use of the term "co-occurring speech" may have led to ambiguity. Therefore, in the revised manuscript, we have replaced those sentences with a detailed description of the properties of each modality in Lines 60-62: ‘Even though gestures convey information in a global-synthetic way, while speech conveys information in a linear segmented way, there exists a bidirectional semantic influence between the two modalities[9,10]’

      Conceptual conflation of the graded hub hypothesis has been clarified in the Response to Reviewer 3 (public review) response 2.

      References:

      Bernardis, P., & Gentilucci, M. (2006). Speech and gesture share the same communication system. Neuropsychologia, 44(2), 178-190

      Kelly, S. D., Ozyurek, A., & Maris, E. (2010b). Two sides of the same coin: speech and gesture mutually interact to enhance comprehension. Psychological Science, 21(2), 260-267. doi:10.1177/0956797609357327

      Kita, S., & Ozyurek, A. (2003). What does cross-linguistic variation in semantic coordination of speech and gesture reveal?: Evidence for an interface representation of spatial thinking and speaking. Journal of Memory and Language, 48(1), 16-32. doi:10.1016/s0749-596x(02)00505-3

      Obermeier, C., & Gunter, T. C. (2015). Multisensory Integration: The Case of a Time Window of Gesture-Speech Integration. Journal of Cognitive Neuroscience, 27(2), 292-307. doi:10.1162/jocn_a_00688

      Obermeier, C., Holle, H., & Gunter, T. C. (2011). What Iconic Gesture Fragments Reveal about Gesture-Speech Integration: When Synchrony Is Lost, Memory Can Help. Journal of Cognitive Neuroscience, 23(7), 1648-1663. doi:10.1162/jocn.2010.21498

      Morrelsamuels, P., & Krauss, R. M. (1992). WORD FAMILIARITY PREDICTS TEMPORAL ASYNCHRONY OF HAND GESTURES AND SPEECH. Journal of Experimental Psychology-Learning Memory and Cognition, 18(3), 615-622. doi:10.1037/0278-7393.18.3.615

      Hostetter, A., and Mainela-Arnold, E. (2015). Gestures occur with spatial and Motoric knowledge: It's more than just coincidence. Perspectives on Language Learning and Education 22, 42-49. doi:10.1044/lle22.2.42.

      McNeill, D. (2005). Gesture and though (University of Chicago Press). 10.7208/chicago/9780226514642.001.0001.

      Zhao, W. (2023). TMS reveals a two-stage priming circuit of gesture-speech integration. Front Psychol 14, 1156087. 10.3389/fpsyg.2023.1156087.

      (9) The last paragraph of the introduction lacks a conductive thread. The authors describe three experiments without guiding the reader through a connecting thread underlying the experiments. Feels more like three disconnected studies than a targeted multi-experiment approach to solve a problem. What is each experiment contributing to? What is the 'grand question' or thread unifying these?

      Response 9: The present study introduced three experiments to explore the neural activity linked to the amount of information processed during multisensory gesture-speech integration. In Experiment 1, we observed that the extent of inhibition in the pMTG and LIFG was closely linked to the overlapping gesture-speech responses, as quantified by mutual information. Building on the established roles of the pMTG and LIFG in our previous study (Zhao et al., 2021, JN), we then expanded our investigation to determine whether the dynamic neural engagement between the pMTG and LIFG during gesture-speech processing was also associated with the quality of the information. This hypothesis was further validated through high-temporal resolution EEG, where we examined ERP components related to varying information qualities. Notably, we observed a close time alignment between the ERP components and the time windows of the TMS effects, which were associated with the same informational matrices in gesture-speech processing.

      Linkage of the three experiments has been clarified in the introduction in Lines 75-102: ‘

      To investigate the neural mechanisms underlying gesture-speech integration, we conducted three experiments to assess how neural activity correlates with distributed multisensory integration, quantified using information-theoretic measures of MI. Additionally, we examined the contributions of unisensory signals in this process, quantified through unisensory entropy. Experiment 1 employed high-definition transcranial direct current stimulation (HD-tDCS) to administer Anodal, Cathodal and Sham stimulation to either the IFG or the pMTG. HD-tDCS induces membrane depolarization with anodal stimulation and membrane hyperpolarization with cathodal stimulation[26], thereby increasing or decreasing cortical excitability in the targeted brain area, respectively. This experiment aimed to determine whether the overall facilitation (Anodal-tDCS minus Sham-tDCS) and/or inhibitory (Cathodal-tDCS minus Sham-tDCS) of these integration hubs is modulated by the degree of gesture-speech integration, as measure by MI.

      Given the differential involvement of the IFG and pMTG in gesture-speech integration, shaped by top-down gesture predictions and bottom-up speech processing [23], Experiment 2 was designed to further assess whether the activity of these regions was associated with relevant informational matrices. Specifically, we applied inhibitory chronometric double-pulse transcranial magnetic stimulation (TMS) to specific temporal windows associated with integration processes in these regions[23], assessing whether the inhibitory effects of TMS were correlated with unisensory entropy or the multisensory convergence index (MI).

      Experiment 3 complemented these investigations by focusing on the temporal dynamics of neural responses during semantic processing, leveraging high-temporal event-related potentials (ERPs). This experiment investigated how distinct information contributors modulated specific ERP components associated with semantic processing. These components included the early sensory effects as P1 and N1–P2[27,28], the N400 semantic conflict effect[14,28,29], and the late positive component (LPC) reconstruction effect[30,31]. By integrating these ERP findings with results from Experiments 1 and 2, Experiment 3 aimed to provide a more comprehensive understanding of how gesture-speech integration is modulated by neural dynamics’

      References:

      Bikson, M., Inoue, M., Akiyama, H., Deans, J.K., Fox, J.E., Miyakawa, H., and Jefferys, J.G.R. (2004). Effects of uniform extracellular DC electric fields on excitability in rat hippocampal slices. J Physiol-London 557, 175-190. 10.1113/jphysiol.2003.055772.

      Federmeier, K.D., Mai, H., and Kutas, M. (2005). Both sides get the point: hemispheric sensitivities to sentential constraint. Memory & Cognition 33, 871-886. 10.3758/bf03193082.

      Kelly, S.D., Kravitz, C., and Hopkins, M. (2004). Neural correlates of bimodal speech and gesture comprehension. Brain and Language 89, 253-260. 10.1016/s0093-934x(03)00335-3.

      Wu, Y.C., and Coulson, S. (2005). Meaningful gestures: Electrophysiological indices of iconic gesture comprehension. Psychophysiology 42, 654-667. 10.1111/j.1469-8986.2005.00356.x.

      Fritz, I., Kita, S., Littlemore, J., and Krott, A. (2021). Multimodal language processing: How preceding discourse constrains gesture interpretation and affects gesture integration when gestures do not synchronise with semantic affiliates. J Mem Lang 117, 104191. 10.1016/j.jml.2020.104191.

      Gunter, T.C., and Weinbrenner, J.E.D. (2017). When to take a gesture seriously: On how we use and prioritize communicative cues. J Cognitive Neurosci 29, 1355-1367. 10.1162/jocn_a_01125.

      Ozyurek, A., Willems, R.M., Kita, S., and Hagoort, P. (2007). On-line integration of semantic information from speech and gesture: Insights from event-related brain potentials. J Cognitive Neurosci 19, 605-616. 10.1162/jocn.2007.19.4.605.

      Zhao, W., Li, Y., and Du, Y. (2021). TMS reveals dynamic interaction between inferior frontal gyrus and posterior middle temporal gyrus in gesture-speech semantic integration. The Journal of Neuroscience, 10356-10364. 10.1523/jneurosci.1355-21.2021.

      (10) The authors should provide a clearer figure to appreciate their paradigm, illustrating clearly the stimulus presentation (gesture and speech).

      Response 10: To reduce ambiguity, unnecessary arrows were deleted from Figure 1.

      Comment 11.1: (11) Required methodological clarifications to better assess the strength of the evidence presented:

      a) Were the exclusion criteria only handedness and vision? Did the authors exclude based on neurological and psychiatric disorders? Psychoactive drugs? If not, do they think the lack of these exclusion criteria might have influenced their results?

      Response 11.1: Upon registration, each participant is required to complete a questionnaire alongside the consent form and handedness questionnaire. This procedure is designed to exclude individuals with potential neurological or psychiatric disorders, as well as other factors that may affect their mental state or reaction times. Consequently, all participants reported in the manuscript do not have any of the aforementioned neurological or psychiatric disorders. The questionnaire is attached below:

      Author response image 4.

      Comment 11.2: b) Are the subjects from the pre-tests (L112-113) and the replication study (L107) a separate sample or did they take part in Experiments 1-3?

      Response 11.2: The participants in each pre-test and experiment were independent, resulting in a total of 188 subjects. Since the stimuli utilized in this study were previously validated and reported (Zhao et al., 2021), the 90 subjects who participated in the three pre-tests are not included in the final count for the current study, leaving a total of 98 participants reported in the manuscript in Lines 103-104: ‘Ninety-eight young Chinese participants signed written informed consent forms and took part in the present study’.

      Comment 11.3: c) L176. The authors should explain how they selected ROIs. This is very important for the reasons outlined above.

      Response 11.3: Please see Response to Comment 6 for details.

      Comment 11.4: d) The rationale for Experiment 1 and its analysis approach should be explicitly described. Why perform Pearson correlations? What is the conceptual explanation of the semantic congruency effect and why should it be expected to correlate with the three information-theoretic metrics? What effects could the authors expect to find and what would they mean? There is a brief description in L187-195 but it is unclear.

      Response 11.4: We thank the reviewer for their rigorous consideration. The semantic congruency effect is widely used as an index of multisensory integration. Therefore, the effects of HD-tDCS on the IFG and pMTG, as measured by changes in the semantic congruency effect, serve as an indicator of altered neural responses to multisensory integration. In correlating these changes with behavioral indices of information degree, we aimed to assess whether the integration hubs (IFG and pMTG) function progressively during multisensory gesture-speech integration. The rationale for using Pearson correlations is based on the hypothesis that the 20 sets of stimuli used in this study represent a sample from a normally distributed population. Thus, even with changes in the sample (e.g., using another 20 values), the gradual relationship between neural responses and the degree of information would remain unchanged. This hypothesis is supported by the findings from another experiment (see details in Response to Comment 4).

      In the revised manuscript, we have provided a clear description of the rationale for Experiment 1 in Lines 206-219: ‘To examine the relationship between the degree of information and neural responses, we conducted Pearson correlation analyses using a sample of 20 sets. Neural responses were quantified based on the effects of HD-tDCS (active tDCS minus sham tDCS) on the semantic congruency effect, defined as the difference in reaction times between semantic incongruent and congruent conditions (Rt(incongruent) - Rt(congruent)). This effect served as an index of multisensory integration[35] within the left IFG and pMTG. The variation in information was assessed using three information-theoretic metrics. To account for potential confounds related to multiple candidate representations, we conducted partial correlation analyses between the tDCS effects and gesture entropy, speech entropy, and MI, controlling for the number of responses provided for each gesture and speech, as well as the total number of combined responses. Given that HD-tDCS induces overall disruption at the targeted brain regions, we hypothesized that the neural activity within the left IFG and pMTG would be progressively affected by varying levels of multisensory convergence, as indexed by MI.’

      Additionally, in the introduction, we have rephrased the relevant rationale in Lines 75-86: _‘_To investigate the neural mechanisms underlying gesture-speech integration, we conducted three experiments to assess how neural activity correlates with distributed multisensory integration, quantified using information-theoretic measures of MI. Additionally, we examined the contributions of unisensory signals in this process, quantified through unisensory entropy. Experiment 1 employed high-definition transcranial direct current stimulation (HD-tDCS) to administer Anodal, Cathodal and Sham stimulation to either the IFG or the pMTG. HD-tDCS induces membrane depolarization with anodal stimulation and membrane hyperpolarization with cathodal stimulation[26], thereby increasing or decreasing cortical excitability in the targeted brain area, respectively. This experiment aimed to determine whether the overall facilitation (Anodal-tDCS minus Sham-tDCS) and/or inhibitory (Cathodal-tDCS minus Sham-tDCS) of these integration hubs is modulated by the degree of gesture-speech integration, as measure by MI

      Reference:

      Kelly, S.D., Creigh, P., and Bartolotti, J. (2010). Integrating speech and iconic gestures in a Stroop-like task: Evidence for automatic processing. Journal of Cognitive Neuroscience 22, 683-694. 10.1162/jocn.2009.21254.

      Comment 11.5: e) The authors do not mention in the methods if FDR correction was applied to the Pearson correlations in Experiment 1. There is a mention in the Results Figure, but it is unclear if it was applied consistently. Can the authors confirm, and explicitly state the way they carried out FDR correction for this family of tests in Experiment 1? This is especially important in the light of some of their results having a p-value of p=.049.

      Response 11.5: FDR correction was applied to Experiment 1, and all reported p-values were corrected using this method. In the revised manuscript, we have included a reference to FDR correction in Lines 221-222: ‘False discovery rate (FDR) correction was applied for multiple comparisons.’

      In Experiment 1, since two separate participant groups (each N = 26) were recruited for the HD-tDCS over either the IFG or pMTG, FDR correction was performed separately for each group. Therefore, for each brain region, six comparisons (three information matrices × two tDCS effects: anodal-sham or cathodal-sham) were submitted for FDR correction.

      In Experiment 2, six comparisons (three information matrices × two sites: IFG or pMTG) were submitted for FDR correction. In Experiment 3, FDR correction was applied to the seven regions of interest (ROIs) within each component, resulting in five comparisons

      The confidence of a p-value of 0.049 was clarified in Response to Comment 3.

      Comment 11.6: f) L200. What does the abbreviation 'TW' stands for in this paragraph? When was it introduced in the main text? The description is in the Figure, but it should be moved to the main text.]

      Comment 11.7: g) How were the TWs chosen? Is it the criterion in L201-203? If so, it should be moved to the start of the paragraph. What does the word 'selected' refer to in that description? Selected for what? The explanation seems to be in the Figure, but it should be in the main text. It is still not a complete explanation. What were the criteria for assigning TWs to the IFG or pMTG?

      Response 11.6& 11.7: Since the two comments are related, we will provide a synthesized response. 'TW' refers to time window, the selection of which was based on our previous study (Zhao et al., 2021, J. Neurosci). In Zhao et al. (2021), we employed the same experimental protocol—using inhibitory double-pulse transcranial magnetic stimulation (TMS) over the IFG and pMTG in one of eight 40-ms time windows relative to the speech identification point (IP; the minimal length of lexical speech), with three time windows before the speech IP and five after. Based on this previous work, we believe that these time windows encompass the potential gesture-speech integration process. Results demonstrated a time-window-selective disruption of the semantic congruency effect (i.e., reaction time costs driven by semantic conflict), with no significant modulation of the gender congruency effect (i.e., reaction time costs due to gender conflict), when stimulating the left pMTG in TW1, TW2, and TW7, and when stimulating the left IFG in TW3 and TW6. Based on these findings, the present study selected the five time windows that showed a selective disruption effect during gesture-speech integration.

      Note that in the present study, we applied stimulation to both the IFG and pMTG across all five time windows, and further correlated the TMS disruption effects with the three information matrices.

      We recognize that the rationale for the choice of time windows was not sufficiently explained in the original manuscript. In the revised manuscript, we have added the relevant description in Lines 223-228: ‘Stimulation was administered at three different sites (IFG, pMTG, or Vertex). Within the time windows (TWs) spanning the gesture-speech integration period, five TWs that exhibited selective disruption of integration were selected: TW1 (-120 to -80 ms relative to the speech identification point), TW2 (-80 to -40 ms), TW3 (-40 to 0 ms), TW6 (80 to 120 ms), and TW7 (120 to 160 ms)[23] (Figure 1C). The order of stimulation site and TW was counterbalanced using a Latin square design.’

      Comment 11.8: h) Again, the rationale for the Pearson correlations of semantic congruency with information-theoretic metrics should be explicitly outlined. What is this conceptually?

      Response 11.8: Given that the rationale behind Experiment 1 and Experiment 2 is similar—both investigating the correlation between interrupted neural effects and the degree of information—we believe that the introduction of the Pearson correlation between semantic congruency and information-theoretic metrics, as presented in Experiment 1 (see Response to Comment 11.4 for details), is sufficient for both experiments.

      Comment 11.9: i)What does 'gesture stoke' mean in the Figure referring to Experiment 3? Figure 1D is not clear. What are the arrows referring to?

      Response 11.9: According to McNeill (1992), gesture phases differ based on whether the gesture depicts imagery. Iconic and metaphoric gestures are imagistic and typically consist of three phases: a preparation phase, a stroke phase, and a retraction phrase. Figure 4 provides an example of these three phases using the gesture ‘break’. In the preparation phase, the hand and arm move away from their resting position to a location in gesture space where the stroke begins. As illustrated in the first row of Figure 4, during the preparation phase of the ‘break’ gesture, the hands, initially in a fist and positioned downward, rise to a center-front position. In the stroke phase, the meaning of the gesture is conveyed. This phase occurs in the central gesture space and is synchronized with the linguistic segments it co-expresses. For example, in the stroke phase of the ‘break’ gesture (second row of Figure 4), the two fists move 90 degrees outward before returning to a face-down position. The retraction phase involves the return of the hand from the stroke position to the rest position. In the case of the ‘break’ gesture, this involves moving the fists from the center front back into the resting position (see third row of Figure 4).

      Therefore, in studies examining gesture-speech integration, gestures are typically analyzed starting from the stroke phase (Habets et al., 2011; Kelly et al., 2010), a convention also adopted in our previous studies (Zhao et al., 2018, 2021, 2023). We acknowledge that this should be explained explicitly, and in the revised manuscript, we have added the following clarification in Lines 162-166: ‘Given that gestures induce a semantic priming effect on concurrent speech[33], this study utilized a semantic priming paradigm in which speech onset was aligned with the DP of each gesture[23,33], the point at which the gesture transitions into a lexical form[34]. The gesture itself began at the stroke phase, a critical moment when the gesture conveys its primary semantic content[34].’

      Additionally, Figure 1 has been revised in the manuscript to eliminate ambiguous arrows. (see Response 10 for detail).

      Author response image 5.

      An illustration of the gesture phases of the 'break' gesture.

      References:

      Habets, B., Kita, S., Shao, Z. S., Ozyurek, A., & Hagoort, P. (2011). The Role of Synchrony and Ambiguity in Speech-Gesture Integration during Comprehension. Journal of Cognitive Neuroscience, 23(8), 1845-1854. doi:10.1162/jocn.2010.21462

      Kelly, S. D., Creigh, P., & Bartolotti, J. (2010). Integrating Speech and Iconic Gestures in a Stroop-like Task: Evidence for Automatic Processing. Journal of Cognitive Neuroscience, 22(4), 683-694. doi:DOI 10.1162/jocn.2009.21254

      Comment 11.10: j) L236-237: "Consequently, four ERP components were predetermined" is very confusing. Were these components predetermined? Or were they determined as a consequence of the comparison between the higher and lower halves for the IT metrics described above in the same paragraph? The description of the methods is not clear.

      Response 11.10: The components selected were based on a comparison between the higher and lower halves of the information metrics. By stating that these components were predetermined, we aimed to emphasize that the components used in our study are consistent with those identified in previous research on semantic processing. We acknowledge that the phrasing may have been unclear, and in the revised manuscript, we have provided a more explicit description in Lines 267-276: ‘To consolidate the data, we conducted both a traditional region-of-interest (ROI) analysis, with ROIs defined based on a well-established work[40], and a cluster-based permutation approach, which utilizes data-driven permutations to enhance robustness and address multiple comparisons.

      For the traditional ROI analysis, grand-average ERPs at electrode Cz were compared between the higher (≥50%) and lower (<50%) halves for gesture entropy (Figure 5A1), speech entropy (Figure 5B1), and MI (Figure 5C1). Consequently, four ERP components were determined: the P1 effect observed within the time window of 0-100 ms[27,28], the N1-P2 effect observed between 150-250ms[27,28], the N400 within the interval of 250-450ms[14,28,29], and the LPC spanning from 550-1000ms[30,31].’

      Reference: Habets, B., Kita, S., Shao, Z.S., Ozyurek, A., and Hagoort, P. (2011). The Role of Synchrony and Ambiguity in Speech-Gesture Integration during Comprehension. J Cognitive Neurosci 23, 1845-1854. 10.1162/jocn.2010.21462.

      (12) In the Results section for Experiment 2 (L292-295), it is not clear what the authors mean when they mention that a more negative TMS effect represents a stronger interruption of the integration effect. If I understand correctly, the correlation reported for pMTG was for speech entropy, which does not represent integration (that would be MI).

      Response 12: Since the TMS effect was defined as active TMS minus Vertex TMS, the inhibitory TMS effect is inherently negative. A greater inhibitory TMS effect corresponds to a larger negative value, such that a more negative TMS effect indicates a stronger disruption of the integration process. We acknowledge that the previous phrasing was somewhat ambiguous. In the revised manuscript, we have rephrased the sentence as follows: ‘a larger negative TMS effect signifies a greater disruption of the integration process’ (Lines 342-343)

      Multisensory integration transcends simple data amalgamation, encompassing complex interactions at various hierarchical neural levels and the parallel detection and discrimination of raw data from each modality (Benetti et al., 2023; Meijer et al., 2019). Therefore, we regard the process of gesture-speech integration as involving both unisensory processing and multisensory convergence. The correlation of gesture and speech entropy reflects contributions from unisensory processing, while the mutual information (MI) index indicates the contribution of multisensory convergence during gesture-speech integration. The distinction between these various source contributions will be the focus of Experiment 2 and Experiment 3, as described in the revised manuscript Lines 87-102: ‘Given the differential involvement of the IFG and pMTG in gesture-speech integration, shaped by top-down gesture predictions and bottom-up speech processing [23], Experiment 2 was designed to further assess whether the activity of these regions was associated with relevant informational matrices. Specifically, we applied inhibitory chronometric double-pulse transcranial magnetic stimulation (TMS) to specific temporal windows associated with integration processes in these regions[23], assessing whether the inhibitory effects of TMS were correlated with unisensory entropy or the multisensory convergence index (MI).

      Experiment 3 complemented these investigations by focusing on the temporal dynamics of neural responses during semantic processing, leveraging high-temporal event-related potentials (ERPs). This experiment investigated how distinct information contributors modulated specific ERP components associated with semantic processing. These components included the early sensory effects as P1 and N1–P2[27,28], the N400 semantic conflict effect[14,28,29], and the late positive component (LPC) reconstruction effect[30,31]. By integrating these ERP findings with results from Experiments 1 and 2, Experiment 3 aimed to provide a more comprehensive understanding of how gesture-speech integration is modulated by neural dynamics’.  

      References:

      Benetti, S., Ferrari, A., and Pavani, F. (2023). Multimodal processing in face-to-face interactions: A bridging link between psycholinguistics and sensory neuroscience. Front Hum Neurosci 17, 1108354. 10.3389/fnhum.2023.1108354.

      Meijer, G.T., Mertens, P.E.C., Pennartz, C.M.A., Olcese, U., and Lansink, C.S. (2019). The circuit architecture of cortical multisensory processing: Distinct functions jointly operating within a common anatomical network. Prog Neurobiol 174, 1-15. 10.1016/j.pneurobio.2019.01.004.

      (13) I find the description of the results for Experiment 3 very hard to follow. Perhaps if the authors have decided to organise the main text by describing the components from earliest to latest, the Figure organisation should follow suit (i.e., organise the Figure from the earliest to the latest component, instead of gesture entropy/speech entropy / mutual information). This might make the description of the results easier to follow.

      Response 13: As suggested, we have reorganized the results of experiment 3 based on components from earliest to latest, together with an updated Figure 5.

      The results are detailed in Lines 367-423: ‘Topographical maps illustrating amplitude differences between the lower and higher halves of speech entropy demonstrate a central-posterior P1 amplitude (0-100 ms, Figure 5B). Aligning with prior findings[27], the paired t-tests demonstrated a significantly larger P1 amplitude within the ML ROI (t(22) = 2.510, p = 0.020, 95% confidence interval (CI) = [1.66, 3.36]) when contrasting stimuli with higher 50% speech entropy against those with lower 50% speech entropy (Figure 5D1 left). Subsequent correlation analyses unveiled a significant increase in the P1 amplitude with the rise in speech entropy within the ML ROI (r = 0.609, p = 0.047, 95% CI = [0.039, 1.179], Figure 5D1 right). Furthermore, a cluster of neighboring time-electrode samples exhibited a significant contrast between the lower 50% and higher 50% of speech entropy, revealing a P1 effect spanning 16 to 78 ms at specific electrodes (FC2, FCz, C1, C2, Cz, and CPz, Figure 5D2 middle) (t(22) = 2.754, p = 0.004, 95% confidence interval (CI) = [1.65, 3.86], Figure 5D2 left), with a significant correlation with speech entropy (r = 0.636, p = 0.035, 95% CI = [0.081, 1.191], Figure 5D2 right).

      Additionally, topographical maps comparing the lower 50% and higher 50% gesture entropy revealed a frontal N1-P2 amplitude (150-250 ms, Figure 5A). In accordance with previous findings on bilateral frontal N1-P2 amplitude[27], paired t-tests displayed a significantly larger amplitude for stimuli with lower 50% gesture entropy than with higher 50% entropy in both ROIs of LA (t(22) = 2.820, p = 0.011, 95% CI = [2.21, 3.43]) and RA (t(22) = 2.223, p = 0.038, 95% CI = [1.56, 2.89]) (Figure 5E1 left).  Moreover, a negative correlation was found between N1-P2 amplitude and gesture entropy in both ROIs of LA (r = -0.465, p = 0.039, 95% CI = [-0.87, -0.06]) and RA (r = -0.465, p = 0.039, 95% CI = [-0.88, -0.05]) (Figure 5E1 right). Additionally, through a cluster-permutation test, the N1-P2 effect was identified between 184 to 202 ms at electrodes FC4, FC6, C2, C4, C6, and CP4 (Figure 5E2 middle) (t(22) = 2.638, p = 0.015, 95% CI = [1.79, 3.48], (Figure 5E2 left)), exhibiting a significant correlation with gesture entropy (r = -0.485, p = 0.030, 95% CI = [-0.91, -0.06], Figure 5E2 right).

      Furthermore, in line with prior research[42], a left-frontal N400 amplitude (250-450 ms) was discerned from topographical maps of gesture entropy (Figure 5A). Specifically, stimuli with lower 50% values of gesture entropy elicited a larger N400 amplitude in the LA ROI compared to those with higher 50% values  (t(22) = 2.455, p = 0.023, 95% CI = [1.95, 2.96], Figure 5F1 left). Concurrently, a negative correlation was noted between the N400 amplitude and gesture entropy (r = -0.480, p = 0.032, 95% CI = [-0.94, -0.03], Figure 5F1 right) within the LA ROI. The identified clusters showing the N400 effect for gesture entropy (282 – 318 ms at electrodes FC1, FCz, C1, and Cz, Figure 5F2 middle) (t(22) = 2.828, p = 0.010, 95% CI = [2.02, 3.64], Figure 5F2 left) also exhibited significant correlation between the N400 amplitude and gesture entropy (r = -0.445, p = 0.049, 95% CI = [-0.88, -0.01], Figure 5F2 right).

      Similarly, a left-frontal N400 amplitude (250-450 ms) [42] was discerned from topographical maps for MI (Figure 5C). A larger N400 amplitude in the LA ROI was observed for stimuli with lower 50% values of MI compared to those with higher 50% values (t(22) = 3.00, p = 0.007, 95% CI = [2.54, 3.46], Figure 5G1 left). This was accompanied by a significant negative correlation between N400 amplitude and MI (r = -0.504, p = 0.028, 95% CI = [-0.97, -0.04], Figure 5G1 right) within the LA ROI. The N400 effect for MI, observed in the 294–306 ms window at electrodes F1, F3, Fz, FC1, FC3, FCz, and C1 (Figure 5G2 middle) (t(22) = 2.461, p = 0.023, 95% CI = [1.62, 3.30], Figure 5G2 left), also showed a significant negative correlation with MI (r = -0.569, p = 0.011, 95% CI = [-0.98, -0.16], Figure 5G2 right).

      Finally, consistent with previous findings[30], an anterior LPC effect (550-1000 ms) was observed in topographical maps comparing stimuli with lower and higher 50% speech entropy (Figure 5B). The reduced LPC amplitude was evident in the paired t-tests conducted in ROIs of LA (t(22) = 2.614, p = 0.016, 95% CI = [1.88, 3.35]); LC (t(22) = 2.592, p = 0.017, 95% CI = [1.83, 3.35]); RA (t(22) = 2.520, p = 0.020, 95% CI = [1.84, 3.24]); and ML (t(22) = 2.267, p = 0.034, 95% CI = [1.44, 3.10]) (Figure 5H1 left). Simultaneously, a marked negative correlation with speech entropy was evidenced in ROIs of LA (r = -0.836, p =   0.001, 95% CI = [-1.26, -0.42]); LC (r = -0.762, p = 0.006, 95% CI = [-1.23, -0.30]); RA (r = -0.774, p = 0.005, 95% CI = [-1.23, -0.32]) and ML (r = -0.730, p = 0.011, 95% CI = [-1.22, -0.24]) (Figure 5H1 right). Additionally, a cluster with the LPC effect (644 - 688 ms at electrodes Cz, CPz, P1, and Pz, Figure 5H2 middle) (t(22) = 2.754, p = 0.012, 95% CI = [1.50, 4.01], Figure 5H2 left) displayed a significant correlation with speech entropy (r = -0.699, p = 0.017, 95% CI = [-1.24, -0.16], Figure 5H2 right).’

      (14) In the Discussion (L394 - 395) the authors mention for the first time their task being a semantic priming paradigm. This idea of the task as a semantic priming paradigm allowing top-down prediction of gesture over speech should be presented earlier in the paper, perhaps during the final paragraph of the introduction (as part of the rationale) or during the explanation of the task. The authors mention top-down influences earlier and this is impossible to understand before this information about the paradigm is presented. It would also make the reading of the paper significantly clearer. Critically, an appropriate description of the paradigm is missing in the Methods (what are the subjects asked to do? It states that it replicates an effect in Ref 28, but this manuscript does not contain a clear description of the task). To further complicate things, the 'Experimental Procedure' section of the methods states this is a semantic priming paradigm of gestures onto speech (L148) and proceeds to provide two seemingly irrelevant references (for example, the Pitcher reference is to a study that employed faces and houses as stimuli). How is this a semantic priming paradigm? The study where I found the first mention of this paradigm seems to clearly classify it as a Stroop-like task (Kelly et al, 2010).

      We appreciate the reviewer’s thorough consideration. The experimental paradigm employed in the current study differs from the Stroop-like task utilized by Kelly et al. (2010). In their study, the video presentation started with the stroke phase of the gesture, while speech occurred 200 ms after the gesture onset.

      As detailed in our previous study (Zhao et al., 2023, Frontiers in Psychology), we confirmed the semantic predictive role of gestures in relation to speech by contrasting two experimental conditions: (1) gestures preceding speech by a fixed 200 ms interval, and (2) gestures preceding speech at the semantic identification point of the gesture. Our findings revealed time-window-selective disruptions in the semantic congruency effect in the IFG and pMTG, but only in the second condition, suggesting that gestures exert a semantic priming effect on concurrent speech.

      This work highlighted the semantic priming role of gestures in the integration of speech found in Zhao et al. (2021, Journal of Neuroscience). In the study, a comparable approach was adopted by segmenting speech into eight 40-ms time windows based on the speech discrimination point, while manipulating the speech onset to align with the gesture identification point. The results revealed time-window-selective disruptions in the semantic congruency effect, providing support for the dynamic and temporally staged roles of the IFG and pMTG in gesture-speech integration.

      Given that the present study follows the same experimental procedure as our prior work (Zhao et al., 2021, Journal of Neuroscience; Zhao et al., 2023, Frontiers in Psychology), we refer to this design as a "semantic priming" of gesture upon speech. We agree with the reviewer that a detailed description should be clarified earlier in the manuscript. To address this, we have added a more explicit description of the semantic priming paradigm in the methods section of the revised manuscript in Lines 162-166: ‘Given that gestures induce a semantic priming effect on concurrent speech[33], this study utilized a semantic priming paradigm in which speech onset was aligned with the DP of each gesture[23,33], the point at which the gesture transitions into a lexical form[34]. The gesture itself began at the stroke phase, a critical moment when the gesture conveys its primary semantic content [34].’

      The task participants completed was outlined immediately following the explanation of the experimental paradigm: ‘Gesture–speech pairs were presented randomly using Presentation software (www.neurobs.com). Participants were asked to look at the screen but respond with both hands as quickly and accurately as possible merely to the gender of the voice they heard’ (Lines:177-180).

      Wrongly cited references have been corrected.

      (15) L413-417: How do the authors explain that they observe this earlier ERP component and TMS effect over speech and a later one over gesture in pMTG when in their task they first presented gesture and then speech? Why mention STG/S when they didn't assess this?

      (19) L436-440: This paragraph yields the timing of the findings represented in Figure 6 even more confusing. If gesture precedes speech in the paradigm, why are the first TMS and ERP results observed in speech?

      Response 15 &19: Since these two aspects are closely related, we offer a comprehensive explanation. Although gestures were presented before speech, the integration process occurs once both modalities are available. Consequently, ERP and TMS measurements were taken after speech onset to capture the integration of the two modalities. Neural responses were used as the dependent variable to reflect the degree of integration—specifically, gesture-speech semantic congruency in the TMS study and high-low semantic variance in the ERP study. Therefore, the observed early effect can be interpreted as an interaction between the top-down influence of gesture and the bottom-up processing of speech.

      To isolate the pure effect of gesture, neural activity would need to be recorded from gesture onset. However, if one aims to associate the strength of neural activity with the degree of gesture information, recording from the visual processing areas would be more appropriate.

      To avoid unnecessary ambiguity, the phrase "involved STG/S" has been removed from the manuscript.

      (16) L427-428: I find it hard to believe that MI, a behavioural metric, indexes the size of overlapped neural populations activated by gesture and speech. The authors should be careful with this claim or provide evidence in favour.

      Response 16: Mutual information (MI) is a behavioral metric that indexes the distribution of overlapping responses between gesture and speech (for further details, please see the Response to Comment 1). In the present study, MI was correlated with neural responses evoked by gesture and speech, with the goal of demonstrating that neural activity progressively reflects the degree of information conveyed, as indexed by MI.

      (17) Why would you have easier integration (reduced N400) with larger gesture entropy in IFG (Figure 6(3))? Wouldn't you expect more difficult processing if entropy is larger?

      (18) L431-432: The claim that IFG stores semantic information is controversial. The authors provide two references from the early 2000s that do not offer support for this claim (the IFG's purported involvement according to these is in semantic unification, not storage).

      Response 17 &18: As outlined in the Responses to Comment 1 of the public review, we have provided a re-explanation of the IFG as a semantic control region. Additionally, we have clarified the role of the IFG in relation to the various stages of gesture-speech integration in Lines 533-538: ‘Last, the activated speech representation would disambiguate and reanalyze the semantic information and further unify into a coherent comprehension in the pMTG[12,37]. As speech entropy increases, indicating greater uncertainty in the information provided by speech, more cognitive effort is directed towards selecting the targeted semantic representation. This leads to enhanced involvement of the IFG and a corresponding reduction in LPC amplitude’

      (20) Overall, the grammar makes some parts of the discussion hard to follow (e.g. the limitation in L446-447: 'While HD tDCS and TMS may impact functionally and anatomically connected brain regions, the graded functionality of every disturbed period is not guaranteed')

      Response 20: Clear description has been provided in the revised manuscript in Lines 552-557: ‘Additionally, not all influenced TWs exhibited significant associations with entropy and MI. While HD-tDCS and TMS may impact functionally and anatomically connected brain regions[55,56],  whether the absence of influence in certain TWs can be attributed to compensation by other connected brain areas, such as angular gyrus[57] or anterior temporal lobe[58], warrants further investigation. Therefore, caution is needed when interpreting the causal relationship between inhibition effects of brain stimulation and information-theoretic metrics (entropy and MI).’

      References:

      Hartwigsen, G., Bzdok, D., Klein, M., Wawrzyniak, M., Stockert, A., Wrede, K., Classen, J., and Saur, D. (2017). Rapid short-term reorganization in the language network. Elife 6. 10.7554/eLife.25964.

      Jackson, R.L., Hoffman, P., Pobric, G., and Ralph, M.A.L. (2016). The semantic network at work and rest: Differential connectivity of anterior temporal lobe subregions. Journal of Neuroscience 36, 1490-1501. 10.1523/JNEUROSCI.2999-15.2016

      Humphreys, G. F., Lambon Ralph, M. A., & Simons, J. S. (2021). A Unifying Account of Angular Gyrus Contributions to Episodic and Semantic Cognition. Trends in neurosciences, 44(6), 452–463. https://doi.org/10.1016/j.tins.2021.01.006

      Bonner, M. F., & Price, A. R. (2013). Where is the anterior temporal lobe and what does it do?. The Journal of neuroscience : the official journal of the Society for Neuroscience, 33(10), 4213–4215. https://doi.org/10.1523/JNEUROSCI.0041-13.2013

      (21) Inconsistencies between terminology employed in Figures and main text (e.g., pre-test study in text, gating study in Figure?)

      Response 21: Consistence has been made by changing the ‘gating study’ into ‘pre-tests’ in Figure 1 (Lines 758).

    1. eLife Assessment

      This important manuscript uses circuit mapping, chemogenetics, and optogenetics to demonstrate a novel hippocampal lateral septal circuit that regulates social novelty behaviours and shows that downstream of the hippocampal septal circuit, septal projections to the ventral tegmental area are necessary for general novelty discrimination. The strength of the evidence supporting the claims is convincing but would be strengthened by the inclusion of additional functional assays. The work will be of interest to systems and behavioural neuroscientists who are interested in the brain mechanisms of social behaviours.

      We thank the reviewers for their thoughtful and constructive feedback. We are excited that both reviewers thought that the manuscript was of “interest to specialists in the field and to the broad readership of the journal”, that the paper was “well-written and logically organized” and that the “study opens an avenue to study these circuits further to uncover the plasticity and synaptic mechanisms regulating social novelty preference.” Additionally, the reviewers wrote that the experiments were “well-designed” “with clever controls and conditions to provide compelling evidence for their conclusion.” The reviewers additionally provided constructive feedback, which we address in our responses below.

      Public Reviews:

      Reviewer #1 (Public Review):

      Summary:

      The study investigated the neural circuits underlying social novelty preference in mice. Using viral circuit tracing, chemogenetics, and optogenetics in the vHPC, LS, and VTA, the authors found that vHPC to LS projections may contribute to the salience of social novelty investigations. In addition, the authors identify LS projections to the VTA involved in social novelty and familiar food responses. Finally, via viral tracing, they demonstrate that vHPC-LS neurons may establish direct monosynaptic connections with VTA dopaminergic neurons. The experiments are well-designed, and the conclusions are mostly very clear. The manuscript is well-written and logically organized, and the content will be of interest to specialists in the field and to the broad readership of the journal.

      Strengths:

      (1) The vHPC has been involved in social memory for novel and familiar conspecifics. Yet, how the vHPC conveys this information to drive motivation for novel social investigations remains unclear. The authors identified a pathway from the vHPC to the LS and eventually the VTA, that may be involved in this process.

      (2) Mice became familiar with a novel conspecific by co-housing for 72h. This represents a familiarization session with a longer duration as compared to previous literature. Using this new protocol, the authors found robust social novelty preference when animals were given a choice between a novel and familiar conspecific.

      (3) The effects of vHPC-LS inhibition are specific to novel social stimuli. The authors included novel food and novel object control experiments and those were not affected by neuronal manipulations.

      (4) For optogenetic studies, the authors applied closed-loop photoinhibition only when the animals investigated either the novel conspecific or the familiar. This optogenetic approach allowed for the investigation of functional manipulations to selective novel or familiar stimuli approaches.

      Weaknesses:

      (1) The abstract and the overall manuscript pose that the authors identified a novel vHPC-LS-VTA pathway that is necessary for mice to preferentially investigate novel conspecifics. However, the authors assessed the functional manipulations of vHPC-LS and LS-VTA circuits independently and the sentence could be misleading. Therefore, a viral strategy specifically designed to target the vHPC-LS-VTA circuit combined with optogenetic/chemogenetic tools and behavior may be necessary for the statement of this conclusion.

      The reviewer raises an important point. Although Figure 3 shows that vHPC (vCA1 and vCA3) is the source of the greatest number of monosynaptic inputs onto LS-VTA neurons, we did not perform any experiments that specifically manipulated vHPC neurons that project to LS-VTA neurons. While these experiments would be extremely interesting, they are technically challenging and beyond the scope of this study.

      (2) The authors combined males and females in their analysis, as neural circuit manipulation affected novelty discrimination ratios in both sexes. However, supplementary Figure 1 demonstrates the chemogentic inhibition of vHPC-LS circuit may cause stronger effects in male mice as compared to females.

      The reviewer makes an interesting point. We can confirm that we found no significant differences in the effectiveness of our vHPC-LS inhibition between the males and females (2-factor ANOVA with sex (male/female) and drug condition (saline/CNO) as factors on the discrimination scores of hM4Di expressing animals: interaction p=0.2241, sex: p=0.1233, drug condition: p=0.0166). These data suggest that there are no significant sex differences in the effectiveness of inhibition of the vHPC-LS neurons.

      (3) In most experiments, the same animals were used for social novelty preference, for food or object novelty responses but washout periods between experiments are not mentioned in the methods section. In this line, the authors did not mention the time frame between the closed-loop optogenetic experiments that silenced the vHPC-LS only during familiar and then only novel social investigations. When using the same animals tested for social experiments in the same context there may be an effect of context-dependent social behaviors that could affect future outcomes.

      We thank the reviewer for this important clarification. We apologize for not including these crucial details in our Methods section. For both the chemogenetic and optogenetic inhibition experiments, all conditions were separated by a minimum of 24 hours. In the chemogenetic inhibition experiments, saline and CNO conditions were counterbalanced between animals. Similarly, we counterbalanced the order of light ON vs light OFF conditions across animals during our optogenetic inhibition experiments.

      (4) All the experiments were performed in a non-cell-type-specific manner. The viral strategies used targeted multiple neuronal subpopulations that could have divergent effects on social novelty preference. This constraint could be added in the discussion section.

      The reviewer raises an important point. In our study, while we specifically manipulate projection populations (either vHPC-LS or LS-VTA), it is possible that these projection populations themselves are composed of heterogeneous cell types. It would be an interesting direction of study to pursue in the future.

      (5) The authors' assumptions were all based on experiments of necessity. The authors could use an experiment of sufficiency by targeting for instance the LS-VTA circuit and assess if animals reduce novel social investigations with LS-VTA photostimulation.

      We agree with the reviewers that it would be interesting to determine if LS-VTA neurons are sufficient, in addition to being necessary, to drive social novelty. These will be interesting experiments to pursue in the future.

      Reviewer #2 (Public Review):

      Summary:

      Rashid and colleagues demonstrate a novel hippocampal lateral septal circuit that is important for social recognition and drives the exploration of novel conspecifics. Their study spans from neural tracing to close-loop optogenetic experiments with clever controls and conditions to provide compelling evidence for their conclusion. They demonstrate that downstream of the hippocampal septal circuit, septal projections to the ventral tegmental area are necessary for general novelty discrimination. The study opens an avenue to study these circuits further to uncover the plasticity and synaptic mechanisms regulating social novelty preference.

      Strengths:

      Chemogenetic and optogenetic experiments have excellent behavioral controls. The synaptic tracing provides important information that informs the narrative of experiments presented and invites future studies to investigate the effects of septal input on dopaminergic activity.

      Weaknesses:

      There are unclear methodological important details for circuit manipulation experiments and analyses where multiple measures are needed but missing. Based on the legends, the chemogenetic experiment is done in a within-animal design. That is the same mouse receives SAL and CNO. However, the data is not presented in a within-animal manner such that we can distinguish if the behavior of the same animal changes with drug treatment. Similarly, the methods specify that the optogenetic manipulations were done in three different conditions, but the analyses do not report within-animal changes across conditions nor account for multiple measures within subjects.

      Thank you for raising this important point. We agree that a repeated measures ANOVA would be ideal, but there is sufficient behavioral variability that such analyses will be difficult without very large sample sizes.

      Finally, it is unclear if the order of drug treatment and conditions were counterbalanced across subjects.

      As mentioned in the above response to Reviewer 1, for both the chemogenetic and optogenetic inhibition experiments, all conditions were separated by a minimum of 24 hours and we counterbalanced the order of chemogenetic (saline/CNO) and optogenetic (light ON/light OFF) experimental manipulations across animals.

    1. eLife Assessment

      The study presents a fundamental advance in antiviral RNA research by adapting SHAPE-Map to chart the secondary structure of the Porcine Epidemic Diarrhoea Virus (PEDV) genome in infected cells and pinpointing structurally conserved, accessible RNA elements as therapeutic targets. A broad, well-documented integration of biochemical probing, computational analysis, and functional validation provides convincing evidence that these regions are both biologically relevant and druggable. Beyond PEDV, the work offers a generalizable framework for RNA-guided antiviral discovery that will interest researchers in RNA therapeutics and viral genome biology.

    2. Reviewer #1 (Public review):

      Summary:

      This is a significant study because it adapts current methods to develop an approach for identifying promising targets for therapeutics in viral genomic RNA. The authors provide a wide array of data from different methods to help support their findings.

      Strengths:

      There are a number of strengths to highlight in this manuscript.

      (1) The study uses a sophisticated technique (SHAPE-MaP) to analyze the PEDV RNA genome in situ, providing valuable insights into its structural features.

      (2) The authors provide a strong rationale for targeting specific RNA structures for antiviral development.

      (3) The study includes a range of experiments, including structural analysis, compound screening, siRNA design, and viral proliferation assays, to support their conclusions.

      (4) Finally, the findings have potential implications for the development of new antiviral therapies against PEDV and other RNA viruses.

      Overall, this interesting study highlights the importance of considering RNA structure when designing antiviral therapies and provides a compelling strategy for identifying promising RNA targets in viral genomes.

    3. Reviewer #2 (Public review):

      Summary:

      Luo et. al. use SHAPE-MaP to find suitable RNA targets in Porcine Epidemic Diarrhoea Virus. Results show that dynamic and transient structures are good targets for small molecules, and that exposed strand regions are adequate targets for siRNA. This work is important to segment the RNA targeting.

      Strengths:

      This work is well done and the data supports its findings and conclusions. When possible, more than one technique was used to confirm some of the findings.

      Weaknesses:

      The study uses a cell line that is not porcine (not the natural target of the virus). That being said, authors used a widely used cell line that has been used in similar studies.

    4. Reviewer #3 (Public review):

      Summary:

      This manuscript by Luo et al. applied SHAPE-Map to analyze the secondary structure of the Porcine Epidemic Diarrhoea Virus (PEDV) RNA genome in infected cells. By combining SHAPE reactivity and Shannon entropy, the study indicated that the folding of the PEDV genomic RNA was nonuniform, with the 5' and 3' untranslated regions being more compactly structured, which revealed potentially antiviral targetable RNA regions. Interestingly, the study also suggested that compounds bound to well-folded RNA structures in vitro did not necessarily exhibit antiviral activity in cells, because the binding of these compounds did not necessarily alter the functions of the well-folded RNA regions. Later in the manuscript, the authors focus on guanine-rich regions, which may form G-quadruplexes and be potential targets for small interfering RNA (siRNA). The manuscript shows the binding effect of Braco-19 (a G-quadruplex-binding ligand) to a predicted G4 region in vitro, along with the inhibition of PEDV proliferation in cells. This suggests that targeting high SHAPE-high Shannon G4 regions could be a promising approach against RNA viruses. Lastly, the manuscript identifies 73 single-stranded regions with high SHAPE and low Shannon entropy, which demonstrated high success in antiviral siRNA targeting.

      Strengths:

      The paper presents valuable data for the community. Additionally, the experimental design and data analysis are well documented.

      Weaknesses:

      I have no further comments after the authors validated their concept by adding the ThT fluorescence assay in the revised version.

    5. Author response:

      The following is the authors’ response to the previous reviews

      Public Reviews:

      Reviewer #1 (Public review):

      Summary:

      This study investigates the potential of targeting specific regions within the RNA genome of the Porcine Epidemic Diarrhea Virus (PEDV) for antiviral drug development. The authors used SHAPE-MaP to analyze the structure of the PEDV RNA genome in infected cells. They categorized different regions of the genome based on their structural characteristics, focusing on those that might be good targets for drugs or small interfering RNAs (siRNAs).

      They found that dynamic single-stranded regions can be stabilized by compounds (e.g., to form G-quadruplexes), which inhibit viral proliferation. They demonstrated this by targeting a specific G4-forming sequence with a compound called Braco-19. The authors also describe stable (structured) single-stranded regions that they used to design siRNAs showing that they effectively inhibited viral replication.

      Strengths:

      There are a number of strengths to highlight in this manuscript.

      (1) The study uses a sophisticated technique (SHAPE-MaP) to analyze the PEDV RNA genome in situ, providing valuable insights into its structural features.

      (2) The authors provide a strong rationale for targeting specific RNA structures for antiviral development.

      (3) The study includes a range of experiments, including structural analysis, compound screening, siRNA design, and viral proliferation assays, to support their conclusions.

      (4) Finally, the findings have potential implications for the development of new antiviral therapies against PEDV and other RNA viruses.

      Overall, this interesting study highlights the importance of considering RNA structure when designing antiviral therapies and provides a compelling strategy for identifying promising RNA targets in viral genomes.

      Weaknesses:

      I have some concerns about the utility of the 3D analyses, the effects of their synonymous mutants on expression/proliferation, a potentially missed control for studies of mutants, and the therapeutic utility of the compound they tested vs. Gquadruplexes.

      We thank the reviewer for their positive assessment and insightful comments. Below, we address each point of concern:

      (1) The utility of the 3D analyses:

      In the revised manuscript, we have toned down this discussion and moved Figure 3A to the supplementary materials to reduce any sense of fragmentation in the overall story. While SHAPE-MaP technology is mature and convenient to use and can indeed capture some RNA structural elements with special functions in certain case; we acknowledge that its application for 3D analyses requires further validation. We believe this approach will become more prevalent in future research.

      (2) The effects of synonymous mutants on expression/proliferation:

      In the PEDV genome, the PQS1 mutation site encodes lysine (AAG). Given that lysine has only two codons (AAG and AAA), the G3109A synonymous mutation represented our sole viable option. Published studies (Ding et al., 2024) confirm that neither AAG nor AAA are classified as rare or dominant codons in mammalian cells. Therefore, the observed changes in viral proliferation levels are likely to stem from alterations in RNA secondary structure rather than codon usage effects.

      REFERENCES:

      Ding W, Yu W, Chen Y, et al. Rare codon recoding for efficient noncanonical amino acid incorporation in mammalian cells. Science. 2024;384(6700):1134-1142. 

      (3) Potentially missed control for studies of mutants:

      In the revised manuscript, we have incorporated additional control experiments evaluating Braco-19's therapeutic effects on the PQS3 mutant strain (Figure 4 – figure supplement 3):

      (4) The therapeutic utility of Braco-19 vs. G-quadruplexes:

      While Braco-19 is indeed a broad-spectrum G4 ligand, our data clearly show that not all PQSs in the viral genome can form G4 structures. Our findings primarily provide proof-of-concept that sequences with high G4-forming potential in viral genomes represent viable targets for antiviral therapy. Future studies could leverage SHAPEguided structural insights to design ligands with enhanced specificity for viral G4s, potentially improving therapeutic utility while minimizing off-target effects.

      Reviewer #2 (Public review):

      Summary:

      Luo et. al. use SHAPE-MaP to find suitable RNA targets in Porcine Epidemic Diarrhoea Virus. Results show that dynamic and transient structures are good targets for small molecules, and that exposed strand regions are adequate targets for siRNA. This work is important to segment the RNA targeting.

      Strengths:

      This work is well done and the data supports its findings and conclusions. When possible, more than one technique was used to confirm some of the findings.

      Weaknesses:

      The study uses a cell line that is not porcine (not the natural target of the virus).

      We thank the reviewer for their insightful comments and recognition of our study's value. The most commonly employed cell models for in vitro PEDV studies are monkey-derived Vero E6 cells and porcine PK1 cells. However, PEDV (particularly our strain) exhibits significantly lower replication efficiency in PK1 cells compared to Vero cells, and no cytopathic effects were observed in PK1 cells. In our preliminary attempts to perform SHAPE-MaP experiments using infected PK1 cells, the sequencing data showed less than 0.03% alignment to the PEDV genome, rendering subsequent analysis and downstream experiments unfeasible.

      Reviewer #3 (Public review):

      Summary:

      This manuscript by Luo et al. applied SHAPE-Map to analyze the secondary structure of the Porcine Epidemic Diarrhoea Virus (PEDV) RNA genome in infected cells. By combining SHAPE reactivity and Shannon entropy, the study indicated that the folding of the PEDV genomic RNA was nonuniform, with the 5' and 3' untranslated regions being more compactly structured, which revealed potentially antiviral targetable RNA regions. Interestingly, the study also suggested that compounds bound to well-folded RNA structures in vitro did not necessarily exhibit antiviral activity in cells, because the binding of these compounds did not necessarily alter the functions of the well-folded RNA regions. Later in the manuscript, the authors focus on guanine-rich regions, which may form G-quadruplexes and be potential targets for small interfering RNA (siRNA). The manuscript shows the binding effect of Braco-19 (a G-quadruplex-binding ligand) to a predicted G4 region in vitro, along with the inhibition of PEDV proliferation in cells. This suggests that targeting high SHAPE-high Shannon G4 regions could be a promising approach against RNA viruses. Lastly, the manuscript identifies 73 singlestranded regions with high SHAPE and low Shannon entropy, which demonstrated high success in antiviral siRNA targeting.

      Strengths:

      The paper presents valuable data for the community. Additionally, the experimental design and data analysis are well documented.

      Weakness:

      The manuscript presents the effect of Braco-19 on PQS1, a single G4 region with high SHAPE and high Shannon entropy, to suggest that "the compound can selectively target the PQS1 of the high SHAPE-high Shannon region in cells" (lines 625-626). While the effect of Braco-19 on PQS1 is supported by strong evidence in the manuscript, the conclusion regarding the G4 region with high SHAPE and high Shannon entropy is based on a single target, PQS1.

      We thank the reviewer for their positive assessment of our methodology and dataset. We propose that dynamic RNA structures in high SHAPE-high Shannon regions, when stabilized by small molecules, can serve as viable targets for antiviral therapy. Gquadruplexes represent a characteristic type of such dynamic structures that compete with local stem-loop formations in the genome. While we identified seven highly conserved PQSs in the PEDV genome, only PQS1 was located within a high SHAPEhigh Shannon region. To further validate this concept, we have supplemented the revised manuscript with Thioflavin T (ThT) fluorescence turn-on assays (Figures 3D, 3E, and Figure 3 – figure supplement 6), which provide additional evidence for the differential G4-forming capabilities of PQSs across regions with distinct structural features.

      Recommendations for the authors:

      Reviewer #1 (Recommendations for the authors):

      Major Comments:

      (1) It could be valuable for the authors to spend some more effort comparing their approach to siRNA target discovery and design to current methods for siRNA design. It would be good to highlight which components are novel, and which might offer superior performance with respect to other existing methods.

      We thank the reviewer for highlighting this important point. In response, we have rewritten the relevant section in the discussion:

      “Our approach uniquely integrates in situ RNA structural data (SHAPE reactivity and Shannon entropy) to prioritize siRNA targets within stable single-stranded regions (high SHAPE reactivity, low Shannon entropy), which are experimentally validated as accessible in infected cells. This represents a significant departure from traditional siRNA design methods that rely primarily on sequence conservation, thermodynamic rules (e.g., Tuschl rules), or in vitro structural predictions (Ali Zaidi et al., 2023; Qureshi et al., 2018; Tang and Khvorova, 2024),which may not accurately reflect intracellular RNA accessibility. Bowden-Reid et al. designed 39 antiviral siRNAs against various SARS-CoV-2 variants based on sequence conservation, ultimately identifying 8 highly effective sequences (Bowden-Reid et al., 2023). Notably, five of these effective sequences targeted regions that were located in high SHAPE-high Shannon regions according to SARS-CoV-2 SHAPE datasets (Supplementary Table 8) (Manfredonia et al., 2020). This independent finding aligns perfectly with our conclusions and demonstrates that SHAPE-based siRNA design outperforms sequence/structureagnostic approaches, at least in terms of significantly improving antiviral siRNA screening efficiency. Given the growing availability of SHAPE datasets for numerous viruses, we are confident that our methodology will facilitate more precise design of antiviral siRNAs.”

      (2) The section targeting their discovered G4 structure with Braco-19 is interesting, particularly showing effects on viral proliferation; however, it's not clear to me how this compound could be used therapeutically against PEDV, as it is a non-selective binder of G4 structures. Their results are good support for the presence and functionality of a G4 structure in PEDV, but I don't see any strategy outlined in the manuscript on how this could be specifically targeted with Braco-19.

      While Braco-19 is indeed a broad-spectrum G4 ligand, our data demonstrate that not all PQSs in the viral genome can form G4 structures under physiological conditions. Our results specifically show that Braco-19 exerts its anti-PEDV activity by targeting PQS1, which is located in a high SHAPE-high Shannon entropy region. This target specificity was further confirmed by the complete resistance of the PQS1mut strain (lacking G4-forming ability) to Braco-19 treatment in our in vitro assays. 

      Additionally, previous studies have reported that during rapid viral replication, viral RNA accumulates to levels that significantly exceed host RNA concentrations. This "concentration advantage" suggests that G4 ligands like Braco-19 would preferentially bind viral G4 structures over host targets, thereby enhancing their antiviral specificity in vivo. In summary, our data provide proof-of-concept that viral genomic regions with high G4-forming potential - particularly those in high SHAPE-high Shannon entropy regions - represent promising targets for antiviral therapy.

      (3) The section where they proposed 3D RNA structures based on sequence similarity feels "tacked on" and I don't see how it adds to the overall story. The authors identify a short RNA hairpin in the PEDV genome with some sequence similarity to the CPEB3 nuclease P4 hairpin. However, they don't provide any evidence that this motif functions in a similar way or that it's important for the virus's life cycle. They also don't explain how this similarity could be exploited for antiviral drug development. It's not clear whether targeting this motif would have any effect on the virus. It's interesting that these two sequences share nucleotides, but it's unlikely that they share any homology...perhaps they convergently evolved (or were captured), but the similarity could also be coincidental.

      We appreciate the reviewer's insightful observation regarding this section. While our intention was to demonstrate that flexible conformations in high SHAPE-high Shannon regions could potentially be targeted, we acknowledge that extensive discussion of these motifs' functions would exceed the scope of this study, resulting in some disconnection from the main narrative. In response to this valuable feedback, we have consequentially removed it from the manuscript.

      (4) The authors should consider the optimality of the synonymous mutation (G3109A) that they introduced, as G3109A could swap a rare codon for a more optimal one. Even though the protein sequence is unaffected, the translation rate (and ability to proliferate) could be very different due to altered codon optimality. Additionally, to show the inactivity of the PQS3 mutant, the Braco-19 treatment studies performed on the PQS1 mutants could be repeated with PQS3 - using this as a control for these experiments.

      We appreciate the reviewer's insightful comment regarding codon optimization. In the PEDV genome, the PQS1 mutation site encodes lysine (AAG). Since lysine has only two codons (AAG and AAA), the G3109A synonymous mutation was our only viable option. Published literature (Ding et al. 2024) confirms that neither AAG nor AAA are classified as either preferred or rare codons in mammalian cells. Therefore, this substitution should have minimal direct impact on translation efficiency. Compared to nonsynonymous mutations that would alter amino acid sequences, we believe this synonymous mutation represents the optimal approach for maintaining native protein function while introducing the desired structural modification.

      REFERENCES:

      Ding W, Yu W, Chen Y, et al. Rare codon recoding for efficient noncanonical amino acid incorporation in mammalian cells. Science. 2024;384(6700):1134-1142.

      In the revised version, we have added control experiments showing the inhibitory activity of Braco-19 against the PQS3 mutant strain (Figure 4—figure supplement 3C) and discussed it in the results section.

      “Furthermore, as a control, we observed nearly identical inhibitory activity of Braco19 against both the PQS3 mutant strain (AJ1102-PQS3mut) and wild-type virus (Figure 4—figure supplement 3C), demonstrating the specificity of Braco-19's action on PQS1.”

      Minor Comments:

      (5) The authors' description of the Shannon Entropy could be improved. The current description makes it seem like the Shannon Entropy only provides information on base pairing, however, the Shannon entropy quantifies the uncertainty of structural states at each position and is calculated based on the probabilities of the different states (paired or unpaired) that a nucleotide can adopt.

      We have revised the description of Shannon entropy in the manuscript:

      "The pairing probability of each nucleotide derived from SHAPE reactivities was subsequently used to calculate Shannon entropy. Regions with high Shannon entropy may adopt alternative conformations, while those with low Shannon entropy correspond to either well-defined RNA structures or persistently single-stranded regions (MATHEWS, 2004; Siegfried et al., 2014)."

      (6) The overall writing of the manuscript is very good, but there are some minor grammatical issues throughout, e.g., here are some of the ones that I caught:

      a) Lines 71-3: "various types of RNA structures such as hairpin structure, RNA singlestrand, RNA pseudoknot and RNA G-quadruplex (G4)" - the examples should be plural and, rather than "hairpins" (or in addition), perhaps add "helixes" to be more generically correct(?).

      We have revised the relevant description: 

      "various types of RNA structures such as stem-loop structures (with double-helical stems), RNA single-strand, RNA pseudoknot and RNA G-quadruplex (G4)"

      b) Lines 74-5: "Of these, RNA G4 has shown considerable promise because of the high stability and modulation by small molecules" should be "Of these, RNA G4 has shown considerable promise because of its high stability and ability for modulation by small molecules."

      We have revised the sentence:

      “Of these, RNA G4 has shown considerable promise because of its high stability and ability for modulation by small molecules.”

      c) Line 76: "have" should be "has".

      We have revised the sentence.

      d) Lines 104-5 (and elsewhere): "frameshift stimulation element (FSE)" should be "frameshift stimulatory element (FSE)".

      We have revised the sentence.

      e) Lines 428-9: following the Manfredonia's methods" should be "following Manfredonia's method" or "following the Manfredonia method".

      We have made the appropriate edit.

      These edits ensure grammatical accuracy and consistency with standard scientific terminology. We appreciate the reviewer's attention to detail, which has significantly improved the clarity of our manuscript.

      Reviewer #2 (Recommendations for the authors):

      (1) There are some important references missing, on shape-seq from Julius Lucks.

      We have added citations to the foundational work by Lucks et al. (2011, PNAS) that pioneered in vitro RNA structure probing using SHAPE-seq.

      (2) Describe the acronym "SHAPE",

      We have now included the full name of SHAPE:“Selective 2’-Hydroxyl Acylation and Primer Extension”.

      (3) Line 81: 2"-hydroxyl-selective - the prime is incorrect.

      We thank the reviewer for catching this technical error. We have corrected "2"hydroxyl" to "2'-hydroxyl".

      (4) Explaining a bit better how shape reagent works would be beneficial (one sentence should suffice).

      We have revised the Introduction section:

      “SHAPE reagents like NAI selectively modify flexible, unpaired 2′-OH groups in RNA, and these modifications are detected as mutations during reverse transcription, enabling precise mapping of RNA secondary structures through sequencing.”

      (5) Line 128: cite the paper that introduced NAI.

      We have now properly cited the original publication introducing NAI(Spitale et al., 2012).

      (6) Line 243: Can you describe what the compound is?

      The compound is Braco-19. This has now been included in the methods section. 

      (7) Line 272: describe what 3Dpol is and the source of it.

      We have supplemented the relevant information as follows:

      "3Dpol (recombinant RNA-dependent RNA polymerase; Abcam, ab277617, 0.02 mg/reaction)"

      (8) Figure 1 legend: For both C and D, the explanation of the G4 structure and the RISC complex should be added, otherwise, it becomes unclear why they are there.

      We have revised the captions for Figure 1 as follows:

      "(A) Well-folded regions (low SHAPE reactivity and low Shannon entropy; 26.40% of genome). These regions represent stably folded RNA structures with minimal conformational flexibility, likely serving as structural scaffolds or functional elements in viral replication. (B) Dynamic structured regions (low SHAPE reactivity and high Shannon entropy; 11.70% of genome). These conformationally plastic domains likely mediate regulatory switches between alternative secondary structures during infection. (C) Dynamic unpaired regions (high SHAPE reactivity and high Shannon entropy; 26.90% of genome). These regions are prone to form non-canonical nucleic acid structures (e.g., G-quadruplexes), which can be stabilized by small-molecule ligands to inhibit viral replication. (D) Persistent unpaired regions (high SHAPE reactivity and low Shannon entropy; 9.67% of genome). These regions are more accessible for siRNA binding, facilitating recruitment of Argonaute proteins and Dicer to form the RNAinduced silencing complex (RISC) for targeted cleavage."

      (9) Figure S2 panel A should be in Figure 1. This is a nice picture showing the backbone of the research.

      In the revised manuscript, we have reorganized Figure 1 and Figure S2 by incorporating the SHAPE-MaP workflow diagram (previously Figure S2A) into Figure 1 as panel (A): 

      (10) Please add the citation to Braco-19.

      We have now added the appropriate citation for Braco-19 (Gowan et al., 2002) in the revised manuscript.

      (11) Figure 5 legend: could you add in parenthesis the what ds means (and call Figure S28).

      We appreciate the reviewer's attention to detail. In the revised manuscript, we have clarified the abbreviations in the Figure 5 legend: ss (single-stranded targeting siRNAs); ds (dual-stranded targeting siRNAs). 

      (12) Line 107: I would argue that the "stabilization of a G4" inhibited viral proliferation. And that supports the point of the paper, that a small molecule that stabilizes the G4 can be used to reduce viral replication. I suggest emphasizing this thorough the paper.

      We fully concur with the reviewer's insightful perspective. In the revised manuscript, we have comprehensively strengthened the point of 'G4 stabilization' as an antiviral mechanism through the following enhancements:

      (1) In the Results section: We present Thioflavin T (ThT) fluorescence assays demonstrating the G4-forming capability of PQSs in the full-length PEDV genomic RNA context:

      “These findings indicate that although most PQSs can form G4 structures in vitro, PQS1—located in the high SHAPE-high Shannon entropy region—demonstrates the most robust G4-forming capability when competing with local secondary structures in the genomic context.”

      (2) In the Results section: The inclusion of Braco-19 inhibition assays using PQS3 mutant virus as control provides robust evidence that Braco-19 exerts its antiviral effects specifically through PQS1 stabilization:

      “Furthermore, as a control, we observed nearly identical inhibitory activity of Braco-19 against both the PQS3 mutant strain (AJ1102-PQS3mut) and wild-type virus, demonstrating the specificity of Braco-19's action on PQS1.”

      (3) In the Discussion section: We have rewritten the mechanistic interpretation to emphasize: 

      "Crucially, Braco-19 showed no inhibitory activity against the PQS1-mutant strain while maintaining potent activity against the PQS3-mutant strain (Figure 4E, Figure 4—figure supplement 3C). This suggests that the compound can selectively target the PQS1 of the high SHAPE-high Shannon region in cells." 

      (13) For PQS1, it's suggested that it is indeed a competing and transient conformation that forms the G4. I wonder if using an extended PQS1 (perhaps what is shown in Figure 3E) and using fluorescence, and/or K+ vs Li+, and/or in-vitro SHAPE could tell us more about this dynamic structure. Thioflavin T or any other fluorescent molecule that binds to G4s could be easily used to show how the formation of G4 may happen or not. In addition, how Braco-19 could really lock the dynamic structure in-vitro as well. I think the field would benefit from a deeper investigation of it.

      To address the dynamic competition between G4 and alternative RNA conformations, we performed Thioflavin T (ThT) fluorescence turn-on assay (now in Figure 3D-E and Figure 3—figure supplement 6) under physiological K<sup>+</sup> conditions (100 mM), with PRRSV-G4 RNA as a positive control. This reads as:

      “To validate whether SHAPE analysis could reflect the competitive conformational folding of PQSs in the PEDV genome, we performed in vitro transcription to obtain local intact structures containing PQSs within dynamic single-stranded regions and stable double-stranded regions (Table S6). Thioflavin T (ThT) fluorescence turn-on assays were conducted under physiological K<sup>+</sup> conditions (100 mM), with the G4 sequence of porcine reproductive and respiratory syndrome virus (PRRSV) serving as a positive control (Control-G4)(Fang et al., 2023). The results demonstrated that for short PQSs sequences containing only G4-forming motifs (Table S7), PQS1, PQS3, PQS4, and PQS6 all induced significant ThT fluorescence enhancement (Figure 3D-E, Figure 3—figure supplement 6), confirming their ability to form G4 structures. However, in long RNA fragments encompassing PQSs and their flanking sequences, only PQS1 and PQS4 exhibited pronounced ThT fluorescence responses (Figure 3DE), whereas PQS2, PQS3, and PQS6 showed negligible signals (Figure 3E, Figure 3— figure supplement 6). Notably, the PQS1-long chain displayed the strongest fluorescence signal, while its mutant counterpart (PQS1mut-long chain) exhibited the lowest background fluorescence (Figure 3D). These findings indicate that although most PQSs can form G4 structures in vitro, PQS1—located in the high SHAPE-high Shannon entropy region—demonstrates the most robust G4-forming capability when competing with local secondary structures in the genomic context. Therefore, PQS1 was selected for further structural and functional validation.”

      (14) Figure S29 is nice and informative. Consider moving it to the main text.

      We appreciate the reviewer's positive assessment of Figure S29. Now we have renamed this figure as "Figure 5—Supplement 2".

    1. eLife Assessment

      This paper presents valuable findings on the processing of sound mixtures in the auditory cortex of ferrets, a species widely used for studies of auditory processing. Using the convenient and relatively high-resolution method of functional ultrasound imaging, the authors provide solid evidence that background noise invariance emerges across the auditory cortical processing hierarchy. However, differences between this and other methods limit the comparisons that can be made across different species, and additional controls are needed to fully substantiate the paper's claims. This work will nonetheless be of interest to researchers studying the auditory cortex and the neural mechanisms underlying auditory scene analysis and hearing in noise.

    2. Reviewer #1 (Public review):

      This is a very interesting paper addressing the hierarchical nature of the mammalian auditory system. The authors use an unconventional technique to assess brain responses -- functional ultrasound imaging (fUSI). This measures blood volume in the cortex at a relatively high spatial resolution. They present dynamic and stationary sounds in isolation and together, and show that the effect of the stationary sounds (relative to the dynamic sounds) on blood volume measurements decreases as one ascends the auditory hierarchy. Since the dynamic/stationary nature of sounds is related to their perception as foreground/background sounds (see below for more details), this suggests that neurons in higher levels of the cortex may be increasingly invariant to background sounds.

      The study is interesting, well conducted, and well written. I am broadly convinced by the results. However, I do have some concerns about the validity of the results, given the unconventional technique. fUSI is convenient because it is much less invasive than electrophysiology, and can image a large region of the cortex in one go. However, the relationship between blood volume and neuronal activity is unclear, and blood volume measurements are heavily temporally averaged relative to the underlying neuronal responses. I am particularly concerned about the implications of this for a study on dynamic/stationary stimuli in auditory cortical hierarchy, because the time scale of the dynamic sounds is such that much of the dynamic structure may be affected by this temporal averaging. Also, there is a well-known decrease in temporal following rate that is exhibited by neurons at higher levels of the auditory system. This means that results in different areas will be differently affected by the temporal averaging. I would like to see additional control models to investigate the impact of this.

      I also think that the authors should address several caveats: the fact that their measurements heavily spatially average neuronal responses, and therefore may not accurately reflect the underlying neuronal coding; that the perceptual background/foreground distinction is not identical to the dynamic/stationary distinction used here; and that ferret background/foreground perception may be very different from that in humans.

      Major points

      (1) Changes in blood volume due to brain activity are indirectly related to neuronal responses. The exact relationship is not clear, however, we do know two things for certain: (a) each measurable unit of blood volume change depends on the response of hundreds or thousands of neurons, and (b) the time course of the volume changes are are slow compared to the potential time course of the underlying neuronal responses. Both of these mean that important variability in neuronal responses will be averaged out when measuring blood changes. For example, if two neighbouring neurons have opposite responses to a given stimulus, this will produce opposite changes in blood volume, which will cancel each other out in the blood volume measurement due to (a). This is important in the present study because blood volume changes are implicitly being used as a measure of coding in the underlying neuronal population. The authors need to acknowledge that this is a coarse measure of neuronal responses and that important aspects of neuronal responses may be missing from the blood volume measure.

      (2) More importantly for the present study, however, the effect of (b) is that any rapid changes in the response of a single neuron will be cancelled out by temporal averaging. Imagine a neuron whose response is transient, consisting of rapid excitation followed by rapid inhibition. Temporal averaging of these two responses will tend to cancel out both of them. As a result, blood volume measurements will tend to smooth out any fast, dynamic responses in the underlying neuronal population. In the present study, this temporal averaging is likely to be particularly important because the authors are comparing responses to dynamic (nonstationary) stimuli with responses to more constant stimuli. To a first approximation, neuronal responses to dynamic stimuli are themselves dynamic, and responses to constant stimuli are themselves constant. Therefore, the averaging will mean that the responses to dynamic stimuli are suppressed relative to the real responses in the underlying neurons, whereas the responses to constant stimuli are more veridical. On top of this, temporal following rates tend to decrease as one ascends the auditory hierarchy, meaning that the comparison between dynamic and stationary responses will be differently affected in different brain areas. As a result, the dynamic/stationary balance is expected to change as you ascend the hierarchy, and I would expect this to directly affect the results observed in this study.

      It is not trivial to extrapolate from what we know about temporal following in the cortex to know exactly what the expected effect would be on the authors' results. As a first-pass control, I would strongly suggest incorporating into the authors' filterbank model a range of realistic temporal following rates (decreasing at higher levels), and spatially and temporally average these responses to get modelled cerebral blood flow measurements. I would want to know whether this model showed similar effects as in Figure 2. From my guess about what this model would show, I think it would not predict the effects shown by the authors in Figure 2. Nevertheless, this is an important issue to address and to provide control for.

      (3) I do not agree with the equivalence that the authors draw between the statistical stationarity of sounds and their classification as foreground or background sounds. It is true that, in a common foreground/background situation - speech against a background of white noise - the foreground is non-stationary and the background is stationary. However, it is easy to come up with examples where this relationship is reversed. For example, a continuous pure tone is perfectly stationary, but will be perceived as a foreground sound if played loudly. Background music may be very non-stationary but still easily ignored as a background sound when listening to overlaid speech. Ultimately, the foreground/background distinction is a perceptual one that is not exclusively determined by physical characteristics of the sounds, and certainly not by a simple measure of stationarity. I understand that the use of foreground/background in the present study increases the likely reach of the paper, but I don't think it is appropriate to use this subjective/imprecise terminology in the results section of the paper.

      (4) Related to the above, I think further caveats need to be acknowledged in the study. We do not know what sounds are perceived as foreground or background sounds by ferrets, or indeed whether they make this distinction reliably to the degree that humans do. Furthermore, the individual sounds used here have not been tested for their foreground/background-ness. Thus, the analysis relies on two logical jumps - first, that the stationarity of these sounds predicts their foreground/background perception in humans, and second, that this perceptual distinction is similar in ferrets and humans. I don't think it is known to what degree these jumps are justified. These issues do not directly affect the results, but I think it is essential to address these issues in the Discussion, because they are potentially major caveats to our understanding of the work.

    3. Reviewer #2 (Public review):

      Summary:

      Noise invariance is an essential computation in sensory systems for stable perception across a wide range of contexts. In this paper, Landemard et al. perform functional ultrasound imaging across primary, secondary, and tertiary auditory cortex in ferrets to uncover the mesoscale organization of background invariance in auditory cortex. Consistent with previous work, they find that background invariance increases throughout the cortical hierarchy. Importantly, they find that background invariance is largely explained by progressive changes in spectrotemporal tuning across cortical stations, which are biased towards foreground sound features. To test if these results are broadly relevant, they then re-analyze human fMRI data and find that spectro-temporal tuning fails to explain background invariance in human auditory cortex.

      Strengths:

      (1) Novelty of approach: Though the authors have published on this technique previously, functional ultrasound imaging offers unprecedented temporal and spatial resolution in a species where large-scale calcium imaging is not possible and electrophysiological mapping would take weeks or months. Combining mesoscale imaging with a clever stimulus paradigm, they address a fundamental question in sensory coding.

      (2) Quantification and execution: The results are generally clear and well supported by statistical quantification.

      (3) Elegance of modeling: The spectrotemporal model presented here is explained clearly and, most importantly, provides a compelling framework for understanding differences in background invariance across cortical areas.

      Weaknesses:

      (1) Interpretation of the cerebral blood volume signal: While the results are compelling, more caution should be exercised by the authors in framing their results, given that they are measuring an indirect measure of neural activity, this is the difference between stating "CBV in area MEG was less background invariant than in higher areas" vs. saying "MEG was less background invariant than other areas". Beyond framing, the basic properties of the CBV signal should be better explored:

      a) Cortical vasculature is highly structured (e.g. Kirst et al.( 2020) Cell). One potential explanation for the results is simply differences in vasculature and blood flow between primary and secondary areas of auditory cortex, even if fUS is sensitive to changes in blood flow, changes in capillary beds, etc (Mace et al., 2011) Nat. Methods.. This concern could be addressed by either analyzing spontaneous fluctuations in the CBV signal during silent periods or computing a signal-to-noise ratio of voxels across areas across all sound types. This is especially important given the complex 3D geometry of gyri and sulci in the ferret brain.

      b) Figure 1 leaves the reader uncertain what exactly is being encoded by the CBV signal, as temporal responses to different stimuli look very similar in the examples shown. One possibility is that the CBV is an acoustic change signal. In that case, sounds that are farther apart in acoustic space from previous sounds would elicit larger responses, which is straightforward to test. Another possibility is that the fUS signal reflects time-varying features in the acoustic signal (e.g. the low-frequency envelope). This could be addressed by cross-correlating the stimulus envelope with fUS waveform. The third possibility, which the authors argue, is that the magnitude of the fUS signal encodes the stimulus ID. A better understanding of the justification for only looking at the fUS magnitude in a short time window (2-4.8 s re: stimulus onset) would increase my confidence in the results.

      (2) Interpretation of the human data: The authors acknowledge in the discussion that there are several differences between fMRI and fUS. The results would be more compelling if they performed a control analysis where they downsampled the Ferret fUS data spatially and temporally to match the resolution of fMRI and demonstrated that their ferret results hold with lower spatiotemporal resolution.

    4. Reviewer #3 (Public review):

      This paper investigates invariance to natural background noise in the auditory cortex of ferrets and humans. The authors first replicate, in ferrets, a finding from human neuroimaging showing that invariance to background noise increases along the cortical hierarchy (i.e., from primary to non-primary auditory cortex). Next, the authors ask whether this pattern of invariance could be explained by differences in tuning to low-level acoustic features across primary and non-primary regions. The authors conclude that this tuning can explain the spatial organization of background invariance in ferrets, but not in humans. The conclusions of the paper are generally well supported by the data, but additional control analyses are needed to fully substantiate the paper's claims. Finally, additional discussion and potentially analysis, are needed to reconcile these findings with similar work in the literature (particularly that of Hamersky et al. 2025 J. Neurosci.).

      The paper is very straightforwardly written, with a generally clear presentation including well-designed and visually appealing figures. Not only does this paper provide an important replication in a non-human animal model commonly used in auditory neuroscience, but it also extends the original findings in three ways. First, the authors reveal a more fine-grained gradient of background invariance by showing that background invariance increases across primary, secondary, and tertiary cortical regions. Second, the authors address a potential mechanism that might underlie this pattern of invariance by considering whether differences in tuning to frequency and spectrotemporal modulations across regions could account for the observed pattern of invariance. The spectrotemporal modulation encoding model used here is a well-established approach in auditory neuroscience and seems appropriate for exploring potential mechanisms underlying invariance in auditory cortex, particularly in ferrets. However, as discussed below, the analyses based on this simple encoding model are only informative to the extent that the model accurately captures neural responses. Thus, its limitations in modeling non-primary human auditory cortex should be considered when interpreting cross-species comparisons. Third, the authors provide a more complete picture of invariance by additionally analyzing foreground invariance, a complementary measure not explored in the original study. While this analysis feels like a natural extension and its inclusion is appreciated, the interpretation of these foreground invariance findings remains somewhat unclear, as the authors offer limited discussion of their significance or relation to existing literature.

      As mentioned above, interpretation of the invariance analyses using predictions from the spectrotemporal modulation encoding model hinges on the model's ability to accurately predict neural responses. Although Figure S5 suggests the encoding model was generally able to predict voxel responses accurately, the authors note in the introduction that, in human auditory cortex, this kind of tuning can explain responses in primary areas but not in non-primary areas (Norman-Haignere & McDermott, PLOS Biol. 2018). Indeed, the prediction accuracy histograms in Figure S5C suggest a slight difference in the model's ability to predict responses in primary versus non-primary voxels. Additional analyses should be done to a) determine whether the prediction accuracies are meaningfully different across regions and b) examine whether controlling for prediction accuracy across regions (i.e., sub-selecting voxels across regions with matched prediction accuracy) affects the outcomes of the invariance analyses.

      A related concern is the procedure used to train the encoding model. From the methods, it appears that the model may have been fit using responses to both isolated and mixture sounds. If so, this raises questions about the interpretability of the invariance analyses. In particular, fitting the model to all stimuli, including mixtures, may inflate the apparent ability of the model to "explain" invariance, since it is effectively trained on the phenomenon it is later evaluated on. Put another way, if a voxel exhibits invariance, and the model is trained to predict the voxel's responses to all types of stimuli (both isolated sounds and mixtures), then the model must also show invariance to the extent it can accurately predict voxel responses, making the result somewhat circular. A more informative approach would be to train the encoding model only on responses to isolated sounds (or even better, a completely independent set of sounds), as this would help clarify whether any observed invariance is emergent from the model (i.e., truly a result of low-level tuning to spectrotemporal features) or simply reflects what it was trained to reproduce.

      Finally, the interpretation of the foreground invariance results remains somewhat unclear. In ferrets (Figure 2I), the authors report relatively little foreground invariance, whereas in humans (Figure 5G), most participants appear to show relatively high levels of foreground invariance in primary auditory cortex (around 0.6 or greater). However, the paper does not explicitly address these apparent cross-species differences. Moreover, the findings in ferrets seem at odds with other recent work in ferrets (Hamersky et al. 2025 J. Neurosci.), which shows that background sounds tend to dominate responses to mixtures, suggesting a prevalence of foreground invariance at the neuronal level. Although this comparison comes with the caveat that the methods differ substantially from those used in the current study, given the contrast with the findings of this paper, further discussion would nonetheless be valuable to help contextualize the current findings and clarify how they relate to prior work.

    5. Author response:

      Reviewer #1:

      (1) Changes in blood volume due to brain activity are indirectly related to neuronal responses. The exact relationship is not clear, however, we do know two things for certain: (a) each measurable unit of blood volume change depends on the response of hundreds or thousands of neurons, and (b) the time course of the volume changes are slow compared to the potential time course of the underlying neuronal responses. Both of these mean that important variability in neuronal responses will be averaged out when measuring blood changes. For example, if two neighbouring neurons have opposite responses to a given stimulus, this will produce opposite changes in blood volume, which will cancel each other out in the blood volume measurement due to (a). This is important in the present study because blood volume changes are implicitly being used as a measure of coding in the underlying neuronal population. The authors need to acknowledge that this is a coarse measure of neuronal responses and that important aspects of neuronal responses may be missing from the blood volume measure.

      The reviewer is correct: we do not measure neuronal firing, but use blood volume as a proxy for bulk local neuronal activity, which does not capture the richness of single neuron responses. We will highlight this point in the manuscript. This is why the paper focuses on large-scale spatial representations as well as cross-species comparison. For this latter purpose, fMRI responses are on par with our fUSI data, with both neuroimaging techniques showing the same weakness.

      (2) More importantly for the present study, however, the effect of (b) is that any rapid changes in the response of a single neuron will be cancelled out by temporal averaging. Imagine a neuron whose response is transient, consisting of rapid excitation followed by rapid inhibition. Temporal averaging of these two responses will tend to cancel out both of them. As a result, blood volume measurements will tend to smooth out any fast, dynamic responses in the underlying neuronal population. In the present study, this temporal averaging is likely to be particularly important because the authors are comparing responses to dynamic (nonstationary) stimuli with responses to more constant stimuli. To a first approximation, neuronal responses to dynamic stimuli are themselves dynamic, and responses to constant stimuli are themselves constant. Therefore, the averaging will mean that the responses to dynamic stimuli are suppressed relative to the real responses in the underlying neurons, whereas the responses to constant stimuli are more veridical. On top of this, temporal following rates tend to decrease as one ascends the auditory hierarchy, meaning that the comparison between dynamic and stationary responses will be differently affected in different brain areas. As a result, the dynamic/stationary balance is expected to change as you ascend the hierarchy, and I would expect this to directly affect the results observed in this study.

      It is not trivial to extrapolate from what we know about temporal following in the cortex to know exactly what the expected effect would be on the authors' results. As a first-pass control, I would strongly suggest incorporating into the authors' filterbank model a range of realistic temporal following rates (decreasing at higher levels), and spatially and temporally average these responses to get modelled cerebral blood flow measurements. I would want to know whether this model showed similar effects as in Figure 2. From my guess about what this model would show, I think it would not predict the effects shown by the authors in Figure 2. Nevertheless, this is an important issue to address and to provide control for.

      We understand the reviewer’s concern about potential differences in response dynamics in stationary vs non-stationary sounds. In particular, it seems that the reviewer is concerned that responses to foregrounds may be suppressed in non-primary fields because foregrounds are not stationary, and non-primary regions could struggle to track and respond to these sounds. Nevertheless, we  observed the contrary, with non-primary regions over-representing non-stationary (dynamic) sounds, over stationary ones. For this reason, we are inclined to think that this explanation cannot falsify our findings.

      Furthermore, background sounds are not completely constant: they are still dynamic sounds, but their temporal modulation rates are usually faster (see Figure 3B). Similarly, neural responses to these two types of sounds are dynamic (see for example Hamersky et al., 2025, Figure 1).  Thus, we are not sure that blood volume would transform the responses to these types of sounds non-linearly.

      We understand the comment that temporal following rates might differ across regions in the auditory hierarchy and agree. In fact, we show that tuning to temporal rates differ across regions and partly explains the differences in background invariance we observe. We think the reviewer’s suggestion is already implemented by our spectrotemporal model, which incorporates the full range of realistic temporal following rates (up to 128 Hz). The temporal averaging is done as we take the output of the model (which varies continuously through time) and average it in the same window as we used for our fUSI data. When we fit this model to the ferret data, we find that voxels in non-primary regions, especially VP (tertiary auditory cortex), tend to be more tuned to low temporal rates (Figure 2F, G), and that background invariance is stronger in voxels tuned to low rates. This is, however, not true in humans, suggesting that background invariance in humans rely on different computational mechanisms.

      (3) I do not agree with the equivalence that the authors draw between the statistical stationarity of sounds and their classification as foreground or background sounds. It is true that, in a common foreground/background situation - speech against a background of white noise - the foreground is non-stationary and the background is stationary. However, it is easy to come up with examples where this relationship is reversed. For example, a continuous pure tone is perfectly stationary, but will be perceived as a foreground sound if played loudly. Background music may be very non-stationary but still easily ignored as a background sound when listening to overlaid speech. Ultimately, the foreground/background distinction is a perceptual one that is not exclusively determined by physical characteristics of the sounds, and certainly not by a simple measure of stationarity. I understand that the use of foreground/background in the present study increases the likely reach of the paper, but I don't think it is appropriate to use this subjective/imprecise terminology in the results section of the paper.

      We appreciate the reviewer’s comment that the classification of our sounds into foregrounds and backgrounds is not verified by any perceptual experiments. We use those terms to be consistent with the literature, including the paper we derived this definition from (Kell et al., 2019). These terms are widely used in studies where no perceptual or behavioral experiments are included, and even when animals are anesthetized. However, we will emphasize the limits of this definition when introducing it, as well as in the discussion.

      (4) Related to the above, I think further caveats need to be acknowledged in the study. We do not know what sounds are perceived as foreground or background sounds by ferrets, or indeed whether they make this distinction reliably to the degree that humans do. Furthermore, the individual sounds used here have not been tested for their foreground/background-ness. Thus, the analysis relies on two logical jumps - first, that the stationarity of these sounds predicts their foreground/background perception in humans, and second, that this perceptual distinction is similar in ferrets and humans. I don't think it is known to what degree these jumps are justified. These issues do not directly affect the results, but I think it is essential to address these issues in the Discussion, because they are potentially major caveats to our understanding of the work.

      We agree with the reviewer that the foreground-background distinction might be different in ferrets. In anticipation of that issue, we had enriched the sound set with more ecologically relevant sounds, such as ferret and other animal vocalizations. Nevertheless, the point remains valid and is already raised in the discussion. We will emphasize this limitation in addition to the limitation of our definition of foregrounds and backgrounds.

      Reviewer #2:

      (1) Interpretation of the cerebral blood volume signal: While the results are compelling, more caution should be exercised by the authors in framing their results, given that they are measuring an indirect measure of neural activity, this is the difference between stating "CBV in area MEG was less background invariant than in higher areas" vs. saying "MEG was less background invariant than other areas". Beyond framing, the basic properties of the CBV signal should be better explored:

      a) Cortical vasculature is highly structured (e.g. Kirst et al.( 2020) Cell). One potential explanation for the results is simply differences in vasculature and blood flow between primary and secondary areas of auditory cortex, even if fUS is sensitive to changes in blood flow, changes in capillary beds, etc (Mace et al., 2011) Nat. Methods.. This concern could be addressed by either analyzing spontaneous fluctuations in the CBV signal during silent periods or computing a signal-to-noise ratio of voxels across areas across all sound types. This is especially important given the complex 3D geometry of gyri and sulci in the ferret brain.

      We agree with the reviewers that there could be differences in vasculature across subregions of the auditory cortex. We will run analyses providing comparisons of basic signal properties across our different regions of interest. We note that this point would also be valid for the human fMRI data, for which we cannot run these controls. Nevertheless, this should not affect our analyses and results, which should be independent of local vascular density. First, we normalize the signal in each voxel before any analysis, so that the absolute strength of the signal, or blood volume in a given voxel, does not matter. Second, we do see sound-evoked responses in all regions (Figure S2) and only focus on reliable voxels in each region. Third, our analysis mostly relies on voxel-based correlation across sounds, which is independent of the mean and variance of the voxel responses. Thus, we believe that differences in vascular architecture across regions are unlikely to affect our results.

      b) Figure 1 leaves the reader uncertain what exactly is being encoded by the CBV signal, as temporal responses to different stimuli look very similar in the examples shown. One possibility is that the CBV is an acoustic change signal. In that case, sounds that are farther apart in acoustic space from previous sounds would elicit larger responses, which is straightforward to test. Another possibility is that the fUS signal reflects time-varying features in the acoustic signal (e.g. the low-frequency envelope). This could be addressed by cross-correlating the stimulus envelope with fUS waveform. The third possibility, which the authors argue, is that the magnitude of the fUS signal encodes the stimulus ID. A better understanding of the justification for only looking at the fUS magnitude in a short time window (2-4.8 s re: stimulus onset) would increase my confidence in the results.

      We thank the reviewer for raising that point as it highlights that the layout of Figure 1 is misleading. While Figure 1B shows an example snippet of our sound streams, Figure 1D shows the average timecourse of CBV time-locked to a change in sound (foreground or background, isolated or in a mixture). This is the average across all voxels and sounds, and the point is just to illustrate the dynamics for the three broad categories. In Figure 1E however, we show the cross-validated cross-correlation of CBV  across sounds (and different time lags). To obtain this, we compute for each voxel the response to each sound at each time lag, thus obtaining two vector of size number of sounds per lag, one per repeat. Then, we correlate all these vectors across the two repeats, obtaining one cross-correlation matrix per neuron. We finally average these matrices across all neurons. The fact that you see red squares demonstrates that the signal encodes sound identity, since CBV is more similar across two repeats of the same sound (for e.g., in the foreground only matrix, 0-5 s vs 0-5 s), than two different sounds (0-5 s vs. 7-12 s). We will modify the figure layout as well as the legend to improve clarity.

      (2) Interpretation of the human data: The authors acknowledge in the discussion that there are several differences between fMRI and fUS. The results would be more compelling if they performed a control analysis where they downsampled the Ferret fUS data spatially and temporally to match the resolution of fMRI and demonstrated that their ferret results hold with lower spatiotemporal resolution.

      We agree with the reviewer that the use of different techniques might come in the way of cross-species comparison. We will add additional discussion on this point. We already control for the temporal aspect by using the average of stimulus-evoked activity across time (note that due to scanner noise, sounds are presented cut into small pieces in the fMRI experiments). Regarding the spatial aspect, there are several things to consider. First, both species have brains of very different sizes, a factor that is conveniently compensated for by the higher spatial resolution of fUSI compared to fMRI (0.1 vs 2 mm). Downsampling to fMRI resolution would lead to having one voxel per region per slice, which is not feasible. We also summarize results with one value per region, which is a form of downsampling that is fairer across species. Furthermore, we believe that we already established in a previous study (Landemard et al, 2021 eLife) that fUSI and fMRI data are comparable signals. We indeed could predict human fMRI responses to most sounds from ferret fUSI responses to the same identical sounds.

      Reviewer #3:

      As mentioned above, interpretation of the invariance analyses using predictions from the spectrotemporal modulation encoding model hinges on the model's ability to accurately predict neural responses. Although Figure S5 suggests the encoding model was generally able to predict voxel responses accurately, the authors note in the introduction that, in human auditory cortex, this kind of tuning can explain responses in primary areas but not in non-primary areas (Norman-Haignere & McDermott, PLOS Biol. 2018). Indeed, the prediction accuracy histograms in Figure S5C suggest a slight difference in the model's ability to predict responses in primary versus non-primary voxels. Additional analyses should be done to a) determine whether the prediction accuracies are meaningfully different across regions and b) examine whether controlling for prediction accuracy across regions (i.e., sub-selecting voxels across regions with matched prediction accuracy) affects the outcomes of the invariance analyses.

      The reviewer is correct: the spectrotemporal model tends to perform less well in human non-primary cortex. We believe this does not contradict our results but goes in the same direction: while there is a gradient in invariance in both ferrets and humans, this gradient is predicted by the spectrotemporal model in ferrets, but not in humans (possibly indeed because predictions are less good in human non-primary auditory cortex). Regardless of the mechanism, this result points to a difference across species. We will clarify these points by quantifying potential differences in prediction accuracy in both species and comment on those in the manuscript.

      A related concern is the procedure used to train the encoding model. From the methods, it appears that the model may have been fit using responses to both isolated and mixture sounds. If so, this raises questions about the interpretability of the invariance analyses. In particular, fitting the model to all stimuli, including mixtures, may inflate the apparent ability of the model to "explain" invariance, since it is effectively trained on the phenomenon it is later evaluated on. Put another way, if a voxel exhibits invariance, and the model is trained to predict the voxel's responses to all types of stimuli (both isolated sounds and mixtures), then the model must also show invariance to the extent it can accurately predict voxel responses, making the result somewhat circular. A more informative approach would be to train the encoding model only on responses to isolated sounds (or even better, a completely independent set of sounds), as this would help clarify whether any observed invariance is emergent from the model (i.e., truly a result of low-level tuning to spectrotemporal features) or simply reflects what it was trained to reproduce.

      We thank the reviewer for this suggestion and will run an additional prediction using only the sounds presented in isolation. This will be included in the next version of the manuscript.

      Finally, the interpretation of the foreground invariance results remains somewhat unclear. In ferrets (Figure 2I), the authors report relatively little foreground invariance, whereas in humans (Figure 5G), most participants appear to show relatively high levels of foreground invariance in primary auditory cortex (around 0.6 or greater). However, the paper does not explicitly address these apparent cross-species differences. Moreover, the findings in ferrets seem at odds with other recent work in ferrets (Hamersky et al. 2025 J. Neurosci.), which shows that background sounds tend to dominate responses to mixtures, suggesting a prevalence of foreground invariance at the neuronal level. Although this comparison comes with the caveat that the methods differ substantially from those used in the current study, given the contrast with the findings of this paper, further discussion would nonetheless be valuable to help contextualize the current findings and clarify how they relate to prior work.

      We thank the reviewer for this point. We will indeed add further discussion of the  difference between ferrets and humans in foreground invariance in primary auditory cortex. In addition, while we found a trend for higher background invariance than foreground invariance in ferret primary auditory cortex, this difference was not significant and many voxels exhibit similar levels of background and foreground invariance (for example in Figure 2D, G). Thus, we do not think our results are inconsistent with Hamersky et al., 2025, though we agree the bias towards background sounds is not as strong in our data. This might indeed reflect differences in methodology, both in the signal that is measured (blood volume vs spikes), and the sound presentation paradigm. We will add this point to our discussion.

    1. eLife Assessment

      This work presents an important genetic toolkit for Drosophila neurobiologists to access and manipulate neuronal lineages during development and adulthood. The evidence supporting the fidelity of this toolkit after revision is compelling. This work will interest Drosophila neurobiologists in general, and some of the genetic tools may be used outside the nervous system. The conceptual approaches used in this paper are likely transferable to other fields as comparable data and genomic methods are obtained.

    2. Reviewer #1 (Public review):

      The ventral nerve cord (VNC) of organisms like Drosophila is an invaluable model for studying neural development and organisation in more complex organisms. Its well-defined structure allows researchers to investigate how neurons develop, differentiate, and organise into functional circuits. As a critical central nervous system component, the VNC plays a key role in controlling motor functions, reflexes, and sensory integration.

      Particularly relevant to this work, the VNC provides a unique opportunity to explore neuronal hemilineages-groups of neurons that share molecular, genetic, and functional identities. Understanding these hemilineages is crucial for elucidating how neurons cooperate to form specialized circuits, essential for comprehending normal brain function and dysfunction.

      A significant challenge in the field has been the lack of developmentally stable, hemilineage-specific driver lines that enable precise tracking and measurement of individual VNC hemilineages. The authors address this need by generating and validating a comprehensive, lineage-specific split-GAL4 driver library.

      Strengths and weaknesses:

      The authors select new marker genes for hemilineages from previously published single-cell data of the VNC. They generate and validate specific and temporally stable lines for almost all the hemilineages in the VNC. They successfully achieved their aims, and their results support their conclusions. This will be a valuable resource for investigating neural circuit formation and function.

      Comments on revisions:

      The manuscript has been amended, and the points raised by the reviewers have been addressed.

    3. Reviewer #2 (Public review):

      It is my pleasure to review this manuscript from Stoffers, Lacin, and colleagues, in which they identify pairs of transcription factors unique to (almost) every ventral nerve cord hemilineage in Drosophila and use these pairs to create reagents to label and manipulate these cells. The advance is sold as largely technical-as a pipeline for identifying durably expressed transcription factor codes in postmitotic neurons from single cell RNAseq data, generating knock-in alleles in the relevant genes, using these to match transcriptional cell types to anatomic cell types, and then using the alleles as a genetic handle on the cells for downstream explication of their function. Yet I think the work is gorgeous in linking expression of genes that are causal for neuron-type-specific characteristics to the anatomic instantiations of those neurons. It is astounding that the authors are able to use their deep collective knowledge of hemilineage anatomy and gene expression to match 33 of 34 to transcriptional profiles. Together with other recent studies, this work drives a major course correction in developmental biology, away from empirically identified cell type "markers" (in Drosophila neuroscience, often genomic DNA fragments that contain enhancers found to be expressed in specific neurons at specific times), and towards methods in which the genes that generate neuronal type identity are actually used to study those neurons. Because the relationship between fate and form/function are built into the tools, I believe that this approach will be a trojan horse to integrate the fields of neural development and systems neuroscience.

      Comments on revisions:

      The authors have addressed my (minor) suggestions.

    4. Reviewer #3 (Public review):

      Summary:

      Soffers et al. developed a comprehensive genetic toolkit that enables researchers to access neuronal hemilineages during developmental and adult time points using scRNA-seq analysis to guide gene cassette exchange-based or CRISPR-based tool building. Currently, research groups studying neural circuit development are challenged with tying together findings in the development and mature circuit function of hemilineage related neurons. Here, authors leverage publicly available scRNA-seq datasets to inform the development of a split-Gal4 library that targets 32 of 34 hemilineages in development and adult stages. The authors demonstrated that the split-Gal4 library, or genetic toolkit, can be used to assess the functional roles, neurotransmitter identity, and morphological changes in targeted cells. The tools presented in this study should prove to be incredibly useful to Drosophila neurobiologists seeking to link neural developmental changes to circuit assembly and mature circuit function. Additionally, some hemilineages have more than one split-Gal4 combination that will be advantageous for studies seeking to disrupt associated upstream genes.

      Strengths:

      Informing genetic tool development with publicly available scRNA-seq datasets is a powerful approach to creating specific driver lines. Additionally, this approach can be easily replicated by other researchers looking to generate similar driver lines for more specific subpopulations of cells, as mentioned in the Discussion.

      The unification of optogenetic stimulation data of 8B neurons and connectomic analysis of the Giant-Fiber-induced take-off circuit was an excellent example of the utility of this study. The link between hemilineage-specific functional assays and circuit assembly has been limited by insufficient genetic tools. The tools and data present in this study will help better understand how collections of hemilineages develop in a genetically constrained manner to form circuits amongst each other selectively.

    5. Author response:

      The following is the authors’ response to the original reviews

      Reviewer #1 (Public review):

      The ventral nerve cord (VNC) of organisms like Drosophila is an invaluable model for studying neural development and organisation in more complex organisms. Its well-defined structure allows researchers to investigate how neurons develop, differentiate, and organise into functional circuits. As a critical central nervous system component, the VNC plays a key role in controlling motor functions, reflexes, and sensory integration.

      Particularly relevant to this work, the VNC provides a unique opportunity to explore neuronal hemilineages - groups of neurons that share molecular, genetic, and functional identities. Understanding these hemilineages is crucial for elucidating how neurons cooperate to form specialized circuits, essential for comprehending normal brain function and dysfunction.<br /> A significant challenge in the field has been the lack of developmentally stable, hemilineage-specific driver lines that enable precise tracking and measurement of individual VNC hemilineages. The authors address this need by generating and validating a comprehensive, lineage-specific split-GAL4 driver library.

      Strengths and weaknesses

      The authors select new marker genes for hemilineages from previously published single-cell data of the VNC. They generate and validate specific and temporally stable lines for almost all the hemilineages in the VNC. They successfully achieved their aims, and their results support their conclusions. This will be a valuable resource for investigating neural circuit formation and function.

      We thank the reviewer for her/his positive comments and time reviewing our manuscript. We are pleased that the reviewer recognized the value of our work in generating a comprehensive, lineage-specific split-GAL4 driver library for VNC hemilineages. We agree that this will be a critical resource for investigating neural circuit formation and function, and we are encouraged by the positive comments regarding the novelty and potential impact of our approach.

      Reviewer #1 (Recommendations for the authors):

      I have no suggestions for further experiments, data, or analyses. There are some grammatical errors and referencing issues throughout, but the editors will hopefully catch them.

      We appreciate the reviewer’s comments regarding the grammatical errors and referencing issues and have carefully checked the revised manuscript.

      Reviewer #2 (Public review):

      It is my pleasure to review this manuscript from Soffers, Lacin, and colleagues, in which they identify pairs of transcription factors unique to (almost) every ventral nerve cord hemilineage in Drosophila and use these pairs to create reagents to label and manipulate these cells. The advance is sold as largely technical-as a pipeline for identifying durably expressed transcription factor codes in postmitotic neurons from single cell RNAseq data, generating knock-in alleles in the relevant genes, using these to match transcriptional cell types to anatomic cell types, and then using the alleles as a genetic handle on the cells for downstream explication of their function. Yet I think the work is gorgeous in linking the expression of genes that are causal for neuron-type-specific characteristics to the anatomic instantiations of those neurons. It is astounding that the authors are able to use their deep collective knowledge of hemilineage anatomy and gene expression to match 33 of 34 transcriptional profiles. Together with other recent studies, this work drives a major course correction in developmental biology, away from empirically identified cell type "markers" (in Drosophila neuroscience, often genomic DNA fragments that contain enhancers found to be expressed in specific neurons at specific times), and towards methods in which the genes that generate neuronal type identity are actually used to study those neurons. Because the relationship between fate and form/function is built into the tools, I believe that this approach will be a trojan horse to integrate the fields of neural development and systems neuroscience.

      We thank the reviewer for their time reviewing our manuscript, generous compliments, and appreciation of the potential of our study to drive a major shift in developmental biology, moving away from traditional marker-based methods toward utilizing the genes that mark neuronal type identity in “omics” datasets. Much like the Trojan Horse, which, though initially a concealed and subtle tool, we hope that the strategy outlined here will have continued impact, as we and others plan to leverage future high-resolution and developmental series of scRNAseq datasets to generate driver lines to target neuronal cell types with uttermost precision.

      Reviewer #2 (Recommendations for the authors):

      Line 126-127: I'm not sure if it is true to say "most TFs in the CNS are expressed in a hemilineage-specific manner." As the authors haven't formally interrogated how different neuronal features relate to expression patterns of all ~600 Drosophila TFs, how about replacing "most" with "many?"

      The reviewer makes an excellent point. Work by Lacin and colleagues has demonstrated via genetic studies that lineage-specific transcription factors that regulate the specification and differentiation of postembryonic neurons are stably expressed during development. This was documented for 15 transcription factors in Lacin et al., 2014, and our lab has identified additional examples since. When we refer to the stable expression of transcription factors, we refer to such transcription factors, not the complete set of ~600 transcription factors described to date. We have added this citation to clarify this statement and replaced p6 line 135 ”Most”  by “Many”. We have also address this now in the introduction (p5 line 109-116). Of note, as we conducted this study, we found that is closer to be a rule than an exception that if a transcription factor acted cluster as marker, it was also stably expressed during development. Thus, a growing number of transcription factors is now documented to be stably expressed in a hemilineage-specific manner

      Line 265: Typo? 334 should be 34?

      We thank the reviewer for noting this type error. We have corrected this typographical error.

      Line 522: Refs 56, 57 here related to chinmo, mamo, br-c don't show br-c or mamo mark temporal cohorts of postmitotic neurons. Consider adding PMID: 19883497, 18510932, and 31545163.

      We thank the reviewer for pointing this out and have added these references that demonstrate that broad, Mamo and Chinmo mark temporal cohorts in the developing adult CNS (p17 line 535).

      Reviewer #3 (Public review):

      Soffers et al. developed a comprehensive genetic toolkit that enables researchers to access neuronal hemilineages during developmental and adult time points using scRNA-seq analysis to guide gene cassette exchange-based or CRISPR-based tool building. Currently, research groups studying neural circuit development are challenged with tying together findings in the development and mature circuit function of hemilineage-related neurons. Here, authors leverage publicly available scRNA-seq datasets to inform the development of a split-Gal4 library that targets 32 of 34 hemilineages in development and adult stages. The authors demonstrated that the split-Gal4 library, or genetic toolkit, can be used to assess the functional roles, neurotransmitter identity, and morphological changes in targeted cells. The tools presented in this study should prove to be incredibly useful to Drosophila neurobiologists seeking to link neural developmental changes to circuit assembly and mature circuit function. Additionally, some hemilineages have more than one split-Gal4 combination that will be advantageous for studies seeking to disrupt associated upstream genes.

      Strengths:

      Informing genetic tool development with publicly available scRNA-seq datasets is a powerful approach to creating specific driver lines. Additionally, this approach can be easily replicated by other researchers looking to generate similar driver lines for more specific subpopulations of cells, as mentioned in the Discussion.

      The unification of optogenetic stimulation data of 8B neurons and connectomic analysis of the Giant-Fiber-induced take-off circuit was an excellent example of the utility of this study. The link between hemilineage-specific functional assays and circuit assembly has been limited by insufficient genetic tools. The tools and data present in this study will help better understand how collections of hemilineages develop in a genetically constrained manner to form circuits amongst each other selectively.

      Weaknesses:

      Although cell position, morphology (to some extent), and gene expression are good markers to track cell identity across developmental time, there are genetic tools available that could have been used to permanently label cells that expressed genes of interest from birth, ensuring that the same cells are being tracked in fixed tissue images.

      Although gene activation is a good proxy for assaying neurochemical features, relying on whether neurochemical pathway genes are activated in a cell to determine its phenotype can be misleading given that the Trojan-Gal4 system commandeers the endogenous transcriptional regulation of a gene but not its post-transcriptional regulation. Therefore, neurochemical identity is best identified via protein detection. (strong language used in this section of the paper).

      The authors mainly rely on the intersectional expression of transcription factors to generate split-Gal4 lines and target hemilineages specifically. However, the Introduction (Lines 97-99) makes a notable point about how driver lines in the past, which have also predominantly relied on the regulatory sequences of transcription factors, lack the temporal stability to investigate hemilineages across time. This point seems to directly conflict with the argument made in the Results (Lines 126-127) that states that most transcription factors are stably expressed in hemilineage neurons that express them. It is generally known that transcription factors can be expressed stably or transiently depending on the context. It is unclear how using the genes of transcription factors in this study circumvents the issue of creating temporally stable driver lines.<br />

      We thank the reviewer for their time to thoroughly and carefully review our manuscript. We appreciate the reviewer’s comments on its strengths, and we to hope that this body of work will prove to be incredibly useful to Drosophila neurobiologists seeking to link neural developmental changes to circuit assembly and mature circuit function. Likewise, we also appreciate the reviews careful consideration of its weaknesses, as the reviewer raises valid points. We have addressed these in our revised manuscript and believe this has significantly improved our manuscript.

      Weakness 1: Although cell position, morphology (to some extent), and gene expression are good markers to track cell identity across developmental time, there are genetic tools available that could have been used to permanently label cells that expressed genes of interest from birth, ensuring that the same cells are being tracked in fixed tissue images.

      The reviewer is fully correct, and we are aware of techniques developed by the laboratories of U. Banerjee, T. Lee, and J. Truman that can make transient GAL4 expression permanent, such as G-TRACE and lineage filtering. A common feature of these techniques is that effector activity is permanent (FLP-mediated removal of the FRT-flanked stop codon preceding GFP in G-TRACE or LexA in lineage filtering) but not the GAL4 activity, which is needed to take advantage of the vast UAS based effector lines such as RNAi libraries. For example, the study of Harris et al., 2015 from the Truman lab beautifully showed the strength of this kind of approaches for labeling the hemilineages but their approach cannot be used for functional studies for the reasons mentioned above. Fly lines using these approaches already have several transgenes and require the addition of several more to be used for functional studies. Our approach requires only two transgenes and is compatible with all UAS lines. One additional advantage of the splitGAL4 combinations that we identify here is that they are inserted in genes that are stably expressed throughout larval and pupal development in postmitotic cells, such that they can be used for functional manipulations during development. We emphasized this point in the discussion on page 16 under the heading “Mapping and manipulating morphological outgrowth patterns of hemilineages during development”. 

      Weakness 2: Although gene activation is a good proxy for assaying neurochemical features, relying on whether neurochemical pathway genes are activated in a cell to determine its phenotype can be misleading given that the Trojan-Gal4 system commandeers the endogenous transcriptional regulation of a gene but not its post-transcriptional regulation. Therefore, neurochemical identity is best identified via protein detection. (strong language used in this section of the paper).

      We thank the reviewer for bringing up this important point. We agree that the Trojan-GAL4 approach will not faithfully recapitulate expression of genes that undergo posttranscriptional regulation. Our previous eLife paper (Lacin et al., 2019) showed that this is the case for Trojan driver lines for the ChAT gene. This study demonstrated that ChAT drivers unexpectedly but strongly labeled many GABAergic and Glutamatergic neurons in both the brain and VNC. With RNA in situ hybridization and immunostainings approaches, we showed that these neurons indeed express ChAT mRNA but not the protein. After our publication, another group showed a class of miRNA binds to the 3’UTR of the ChAT gene and regulates its expression post-transcriptionally (Griffith 2023). We believe that one major reason the Trojan driver lines do not faithfully recapitulate this expression pattern is due to the presence of the Hsp70 transcriptional terminator located at the 5’ end of the trojan exon which prematurely ends the transcript and affects the host gene’s 3’ UTR regulation. For this reason, we have recently generated new Trojan plasmids which allow the retention of the 3’UTR of the host gene in the transcript. We have revised the result section “Neurotransmitter use on pages 11-12 to address this point and have modified the language.

      Weakness 3: The authors mainly rely on the intersectional expression of transcription factors to generate split-Gal4 lines and target hemilineages specifically. However, the Introduction (Lines 97-99) makes a notable point about how driver lines in the past, which have also predominantly relied on the regulatory sequences of transcription factors, lack the temporal stability to investigate hemilineages across time. This point seems to directly conflict with the argument made in the Results (Lines 126-127) that states that most transcription factors are stably expressed in hemilineage neurons that express them. It is generally known that transcription factors can be expressed stably or transiently depending on the context. It is unclear how using the genes of transcription factors in this study circumvents the issue of creating temporally stable driver lines.

      We thank the reviewer for pointing out this apparent paradox, which we have clarified in the manuscript (p4. lines 94-102). Driver lines in the past have relied on the intersection of genes to label a defined set of neurons, which helped marking more narrow cell populations compared to enhancer traps in the adult CNS. Elegant and elaborate screening methods have been devised to identify hemidriver combinations that mark specific subset of neurons in the adult (Meissner et al, 2025 (eLife 98405.2) and citations therein). However, these hemidrivers do not leverage the expression pattern of hemilineage marker genes. Instead, their expression is controlled by random 2-3 kb genomic fragments. We and others observed that these drivers are not stably expressed during development. Hence, hemidrivers combinations that work beautifully to target adult neuronal cel populations can oftentimes not be directly used for developmental studies. Work by Lacin et al. 2014 has demonstrated that transcription factors that mark hemilineages are oftentimes stably expressed in the embryo larvae and even adult. When we made driver lines for these TF, using artificial exons, its complete endogenous enhancers elements remain intact. Consequently, we find that Trojan driver lines recapitulate the expression pattern of the transcription factor gene in which it was inserted, and the hemidrivers are stably expressed during development. Hence, leveraging scRNAseq cluster markers for hemilineages and converting them to Trojan driver lines, the approach we took in this paper, has proven a powerful method to generate stable driver lines for developmental studies.

      Reviewer #3 (Recommendations for the authors):

      (1) Line 14: Affiliations typo should be correct to "St. Louis".

      We thank the reviewer for catching this and have corrected the typo.

      (2) Line 26: "model systems have focused on only on a few".

      We have replaced the words “a few regions” by “select regions” to better contrast that studies to date have been performed, but not at CNS level, due to the lack of genetic driver lines.

      (3) Line 52: The use of "medium" here is ambiguous without a comparison.

      We agree that the term “medium” in line 52 could be ambiguous without context, and we appreciate your suggestion to clarify this. The revised sentence now reads: “Drosophila has served as a powerful model system to investigate how neuronal circuits function due to its medium complexity compared to vertebrate models”

      (4) Line 91-92: Consider shortening to "of behavioral circuit assembly".

      Thank you for this suggestion, we have revised p4 lines 90-91 to: “Thus, taking a hemilineage-based approach is essential for a systematic and comprehensive understanding of behavioral circuit assembly during development in complex nervous systems.”

      (5) Line 216-217: Consider establishing what the expected morphology and neurochemical phenotype for 2A neurons is before presenting findings.

      This suggestion is well-taken, and agree that this paragraph did not fully get the point across we were trying to make. This purpose of this paragraph is to explain our workflow of how we assigned 16 hemilineages to orphan clusters, which is why we present the data in this order and present the morphology of hemilineage 2A last. To accommodate the reviewer’s suggestion, we have now clarified our approach before diving into the results to improve the flow of this paragraph (p8 lines 218-223). Briefly, the starting point to annotate the 16 orphan scRNAseq clusters was each time taking one orphan scRNAseq cluster, picking its top cluster marker genes that had not been established yet as marker genes for any hemilineage, and visualizing the morphology of the neurons that expressed such cluster marker using a reporter line for the cluster marker or an antibody stain for its protein. We then compared this to documented hemilineage morphologies, and to narrow down our search, we compared the observed trajectories to those of unannotated hemilineages that used the same neurotransmitter as the orphan scRNAseq. The evaluation of the documented morphologies of the hemilineages came at the last part of our method to annotate the hemilineages to orphan scRNAseq clusters, which is why we chose to present the expected morphology of a hemilineage at the end.

      (6) If "neurochemical" phenotype and "neurotransmitter" identity are sometimes used interchangeably but seem to mean the same thing. Consider choosing one term throughout.

      We thank the reviewer for this suggestion and have changed the terminology to “neurotransmitter use” (p11-12 lines 326-359).

      (7) Line 235: MARCM technique citation needed.

      We thank the reviewer for pointing this out, the citation (no. 37, p9 line 249) was present in the method section, but we had inadvertently omitted it in the main text and we have now corrected this.

      (8) Line 281: typo, should be "patterns".

      We thank the reviewer for noting this and have corrected this.

      (9) Line 469: End of sentence needs a ".".

      We have added the punctuation mark.

      (10) Line 516: "driver line combinations to express...".

      We have inserted the word “to” to correct it.

      (11) Please make sure that the correct genotypes are matched in the figure legends and Table 1. For instance, knot-GAL4-DBD is listed as the hemi driver for 10B neurons in Figure 3 but only knot-p65.AD is listed in Table 1.

      We thank the reviewer for catching this, we made a mistake and the correct hemidriver combination used in Figure 3L i: knot-GAL4-AD with hb9-GAL4-DBD. We have updated the legend and carefully checked the legends and tables.

      (12) Consider making different color choices for readability when possible and be consistent with labeling CadN. For instance, in Figure 1 the magenta color has three separate meanings: CadN, Acj6, and unc-4. Either of the three genes can be mistaken for the other for a reader mainly paying attention to the magenta color. I find that one color can mean two things in a figure if organized properly but any more begs for confusion. Also, CadN can be easily labeled if used in a new figure (e.g. Figure 1-Supplment 1).

      We thank the reviewer for this insightful observation and have adjusted figure 1 so that cadN is displayed in blue and reporter genes expressing Acj6, Unc-4 or their intersection in green. The legend is modified to reflect these changes.

      (13) If Seurat object changes or additional quality control steps were taken from the original studies, please provide these changes. Similarly, provide any scRNA-seq code used or cite code used for readers to access. Also, provide a section in the methods briefly describing how genes were chosen (criteria) for tool development.

      We thank the reviewer for nothing we had not described our scRNA analysis pipeline and criteria to select transcription factors in the methods section of the manuscript. We have added this section at p19 lines 548-558. Briefly, we used the Seurat object generated by Allen et al., 2015, and did not change quality control steps, normalizations or scaling. Candidate genes to make split-GAL4 drivers from were chosen based on their ability to mark the clusters defined by Allen et al. We did not use computer-based algorithms and made a list of the top cluster markers. Then, we made binary combinations amongst these cluster markers and with hemilineages markers we had identified before (Lacin et al, 2014; Lacin et al 2019), and used the code generated by Allen et al., 2015 (deposited on Github) with Seurat v5 to test if these combinations marked unique clusters. We then prioritized testing these combinations based on the availability of antibodies, BAC lines and CRiMIC/MiMIC constructs to validate their expression pattern prior to creating split-GAL4 lines for these candidates.

      (14) In regard to the seemingly contradictory argument that most transcription factors are stably expressed when most drivers of the past used regulatory elements of transcription factors: the paper could be strengthened by either a) describing how older driver lines differ from the lines presented in the paper or b) remarking on the endogenous temporal stability of the transcription factors used in this study.

      We thank the reviewer for pointing this out, and we agree that it is necessary to clarify this apparent paradox since it is essential for understanding the impact of the present work. We have revised our manuscript described in our response to weakness 1.

    1. eLife Assessment

      Oor and colleagues report the potentially independent effects of the spatial and feature-based selection history on visuomotor choices. They outline compelling evidence, tracking the dynamic history effects based on their extremely clever experimental design (urgent version of the search task). Their finding is of fundamental significance, broadening the framework to identify variables contributing to choice behavior and their neural correlates in future studies.

    2. Reviewer #1 (Public review):

      Summary:

      Oor et al. report the potentially independent effects of the spatial and feature-based selection history on visuomotor choices. They outline compelling evidence, tracking the dynamic history effects based on their clever experimental design (urgent version of the search task). Their finding broadens the framework to identify variables contributing to choice behavior and their neural correlates in future studies.

      Strengths:

      In their urgent search task, the variable processing time of the visual cue leads to a dichotomy in choice performance-uninformed guesses vs. informed choices. Oor et al. did rigorous analyses to find a stronger influence of the location-based selection history on the uninformed guesses and a stronger influence of the feature-based selection history on the informed choices. It is a fundamental finding that contributes to understanding the drivers of behavioral variance. The results are clear, and the authors convincingly addressed all previously raised concerns, strengthening their conclusions.

    3. Reviewer #2 (Public review):

      Summary:

      This is a clear and systematic study on trial history influences on the performance of monkeys in a target selection paradigm. The primary contribution of the paper is to add a twist in which the target information is revealed after, rather than before, the cue to make a foveating eye movement. This twist results in a kind of countermanding of an earlier "uninformed" saccade plan by a new one occurring right after the visual information is provided. As with countermanding tasks in general, time now plays a key factor in success in this task, and it is time that allows the authors to quantitatively assess the parametric influences of things like previous target location, previous target identity, and previous correctness rate on choice performance. The results are logical and consistent with the prior literature, but the authors also highlight novelties in the interpretation of prior-trial effects that they argue are enabled by the use of their paradigm.

      Strengths:

      Careful analysis of a multitude of variables influencing behavior

      Weaknesses:

      Results appear largely confirmatory

      Comments on revisions:

      The authors have addressed the previous comments.

    4. Author response:

      The following is the authors’ response to the original reviews

      Public Reviews:

      Reviewer #1 (Public review):

      Summary:

      Oor et al. report the potentially independent effects of the spatial and feature-based selection history on visuomotor choices. They outline compelling evidence, tracking the dynamic history effects based on their clever experimental design (urgent version of the search task). Their finding broadens the framework to identify variables contributing to choice behavior and their neural correlates in future studies.

      Strengths:

      In their urgent search task, the variable processing time of the visual cue leads to a dichotomy in choice performance - uninformed guesses vs. informed choices. Oor et al. did rigorous analyses to find a stronger influence of the location-based selection history on the uninformed guesses and a stronger influence of the feature-based selection history on the informed choices. It is a fundamental finding that contributes to understanding the drivers of behavioral variance. The results are clear.

      Weaknesses:

      (1) In this urgent search task, as the authors stated in line 724, the variability in performance was mainly driven by the amount of time available for processing the visual cue. The authors used processing time (PT) as the proxy for this "time available for processing the visual cue." But PT itself is already a measure of behavioral variance since it is also determined by the subject's reaction time (i.e., PT = Reaction time (RT) - Gap). In that sense, it seems circular to explain the variability in performance using the variability in PT. I understand the Gap time and PT are correlated (hinted by the RT vs. Gap in Figure 1C), but Gap time seems to be more adequate to use as a proxy for the (imposed) time available for processing the visual cue, which drives the behavioral variance. Can the Gap time better explain some of the results? It would be important to describe how the results are different (or the same) if Gap time was used instead of PT and also discuss why the authors would prefer PT over Gap time (if that's the case).

      Thanks to Rev 1 for requesting clarification of this important point. As Rev 1 notes, PT is a derived variable, computed for each trial by subtracting the Gap interval from RT (PT=RT‒Gap). While it is true that Gap and PT are correlated (inversely), it is precisely because of the variance in RT that Gap alone is not an adequate (or certainly not the best) predictor of choice outcome. First, note that, if the Gap were fixed, there would still be variance in RT and in outcome, and any dependence of outcome on time would be explained necessarily by the PT. This is true at any Gap. So, clearly, the PT predicts outcome in a way that the Gap cannot. It is easy to see why: the Gap is the part of the RT interval during which no cue information is present, whereas the PT is the part of the same interval during which it is. Therefore, if one accepts the logical premise that the likelihood of a correct choice depends on the amount of time available to view the Cue before making that choice (i.e., the definition of PT), it follows that the relationship between PT and performance should be tighter than that between performance and Gap. And, indeed, this is the case. Mean accuracy declines systematically as a function of Gap, as expected, but its correlation with performance is much weaker than for PT.

      Rev 1’s request for a comparison of how accuracy varies as function of PT versus how it varies with Gap has appeared in earlier publications (Stanford et al., 2010; Shankar et al., 2011; Salinas et al., 2014) and we now include it here for the current dataset by adding plots of accuracy versus Gap as a new panel in Fig. 1 (Fig. 1c). That PT (not Gap) better predicts the likelihood of success on a given trial is evident in comparing the tachometric (Fig. 1b) and psychometric curves (Fig. 1c). The tachometric curves vary from chance to asymptotic performance and do so over a short range of PT (~75 ms) with well-defined inflection points identifying key transitions in performance (e.g., from guesses to increasingly informed choices). In contrast, the psychometric function plotting average accuracy versus Gap (Fig. 1c) varies much more gradually, a reduction in temporal definition attributable to the failure to account for the RT’s contribution to determining PT for each trial at a given Gap.

      (2) The authors provide a compelling account of how the urgent search task affords

      (i) more pronounced selection history effects on choice and

      (ii) dissociating the spatial and feature-based history effects by comparing their different effects on the tachometric curves. However, the authors didn't discuss the limits of their task design enough. It is a contrived task (one of the "laboratory tasks"), but the behavioral variability in this simple task is certainly remarkable. Yet, is there any conclusion we should avoid from this study? For instance, can we generalize the finding in more natural settings and say, the spatial selection history influences the choice under time pressure? I wonder whether the task is simple yet general enough to make such a conclusion.

      As Rev. 1 notes, the CO task is a laboratory task that produces large history effects. But importantly, we don't think urgency is causal or essential to the existence of such effects (this is now more explicitly stated in the first section of the Results); it is simply a powerful tool for revealing and characterizing them. As noted in the Discussion, our results are consistent with studies that, based on simpler, non-urgent tasks, demonstrated either reward-driven spatial biases or color priming effects. The CO task uses urgency to generate a psychometric function that time resolves perceptually informed from perceptually uninformed choices, and thereby provides the logical key to disambiguating the simultaneous contributions of perceptual and non-perceptual biases to performance. Such was essential to our demonstration that distinct biases act independently on the same saccade choices.

      In a natural setting, we would certainly expect the respective magnitudes of such non-volitional history-based biases to be highly context dependent, but it would be difficult, if not impossible, to discern their relative impact on natural behavior. That said, we think that the biases revealed by the CO task are exemplary of those that would manifest in natural behaviors depending on the real-world context to which such behaviors correspond. Here, it is important to emphasize that the spatial- and feature-based biases we observed were not strategic, on average neither helping nor hindering overall performance. Thus, in the real-world we might expect the expression of similar biases to be an important source of behavioral variance. These observations are now summarized in the penultimate paragraph of the Discussion.

      (3) Although the authors aimed to look at both inter- and intra-trial temporal dynamics, I'm not sure if the results reflect the true within-trial dynamics. I expected to learn more about how the spatial selection history bias develops as the Gap period progresses (as the authors mentioned in line 386, the spatial history bias must develop during the Gap interval). Does Figure 3 provide some hints in this within-trial temporal dynamics?

      Because it is based on the location of the saccadic choice(s) on previous trial(s), we might expect a signal of spatial bias to be present before and during the Gap period and perhaps even before a trial begins (i.e., intertrial interval). However, because behavioral bias is a probabilistic measure of saccade tendency, we have no way of knowing if such a signal is present during periods devoid of saccadic choices. Note that, for both monkey subjects, average RT exceeded the duration of the longest Gap employed (Fig. 1), and this means that relatively few saccades occurred prior to Cue onset. That said, it's clear in both Figs. 2, 3, and 6 that location bias is evident for saccades initiated at the transition between Gap and Cue intervals (PT=0). Anecdotally, we can report that that spatial bias is evident when we extend our analysis back further into the range of negative PTs (i.e., Gap interval), but the statistics are weak given the paucity of trials at that point. Nevertheless, this is consistent with a bias that exists from the beginning of the trial, as would be expected based on neurophysiological studies from Hikosaka's lab in a simpler but comparable spatial bias task.

      Although our data do not unequivocally identify the temporal origin of the spatial bias, they clearly show that the bias is present early (at short PTs) and diminishes rapidly as the perceptual information accrues (at long PTs). Thus, the PT-dependent temporal dynamics that are revealed clearly suggest that spatial and perceptual biases operate over different intra-trial time frames, one decreasing and the other increasing. As mentioned by Rev. 1, Fig. 3 emphasizes this dichotomy.

      (4) The monkeys show significant lapse rates (enough error trials for further analyses). Do the choices in the error trials reflect the history bias? For example, if errors are divided in terms of PTs, do the errors with short PT reflect more pronounced spatial history bias (choosing the previously selected location) compared to the errors with long PT?

      The short answer is “yes”. Errors generally show a PT-dependent influence of history bias. However, correct and error trials are the result of the same biased dynamics, and analyzing them separately post-hoc does not provide much additional insight about the history effects beyond that provided by the tachometric curves themselves.

      To see this, first consider the figure below (Author response image 1). Two tachometric curves conditioned on color history are shown (left). These are the two extreme curves plotted in Fig. 2a, which correspond to the 4S (i.e., 4 repeats of the current target color) and 4D (4 color repeats and then a switch) conditions. Each of these curves already shows the probability of making an error at each PT but, indeed, we can compare the proportions of correct and error trials at short PTs (guesses) and long PTs (informed choices). These are indicated by the bar graphs on the right. Now, the effect of a bias would be to create a difference in success rate between repetitions (4S, blue) and switches (4D, red) relative to the overall, unbiased expectation (indicated by dotted lines). For color-based history, there is no bias at short PT: the proportions of correct choices are almost exactly at the expected chance level (filled bars coincide with dotted line). In contrast, at long PTs, there is a differential effect, but it is due both to a proportion of correct trials that is higher than expected in the 4S case (filled blue bar above dotted line) and to a proportion of correct trials that is lower than expected in the 4D case (filled orange bar below dotted line). This is exactly as one would expect if the current choice was biased by target color history.

      Author response image 1.

      A similar analysis can be done for location history (Author response image 2, which shows the two extreme curves from Fig. 2e). In this case the bias is much stronger at short PTs, and the difference between repeats (4S, blue) and switches (4D, red) is largely explained by a proportion of correct choices that is much higher than expected by chance in the 4S condition (filled blue bar well above dotted line). This makes sense, because a rewarded location is likely to become the next guess, so if the target happens to appear again at that same location, the subsequent guess is more likely than chance to be correct. At longer PTs, the differential effect is smaller, as would be expected for more informed choices, but it is again driven by the 4S condition. Importantly, in the case of location the total number of S trials is much smaller than the total number of D trials (because a target-location repetition has a probability of 0.25 only), so it only makes sense to compare the proportions of correct (or error) trials, not the absolute numbers, between those conditions.

      Author response image 2.

      In summary, although it is possible to examine the separate dependencies of correct and error trials on history and PT, the distinction is not very useful. Only the frequency of errors relative to that of correct choices makes complete sense, not so much, say, the frequency of short PT errors relative to that of long PT errors.  

      Reviewer #2 (Public review):

      Summary:

      This is a clear and systematic study of trial history influences on the performance of monkeys in a target selection paradigm. The primary contribution of the paper is to add a twist in which the target information is revealed after, rather than before, the cue to make a foveating eye movement. This twist results in a kind of countermanding of an earlier "uninformed" saccade plan by a new one occurring right after the visual information is provided. As with countermanding tasks in general, time now plays a key factor in the success of this task, and it is time that allows the authors to quantitatively assess the parametric influences of things like previous target location, previous target identity, and previous correctness rate on choice performance. The results are logical and consistent with the prior literature, but the authors also highlight novelties in the interpretation of prior-trial effects that they argue are enabled by the use of their paradigm.

      Strengths:

      Careful analysis of a multitude of variables influencing behavior

      Weaknesses:

      Results appear largely confirmatory.

      Recommendations for the authors:

      Reviewer #1 (Recommendations for the authors):

      (1) The authors provide comprehensive accounts of the urgent search task in multiple places in the manuscript. But the description can be simpler and more consistent throughout. I found it confusing when the authors compared their task with previous search tasks used by Bichot and Schall, McPeek et al. I believe the authors wanted to explain that it is not just the urgency but the fact that the target color being randomly interleaved also contributes to the pronounced history bias in their task. I appreciate their thorough comparison with previous studies but it can be distracting or lose focus. It might read better if this statement can be expanded in the Discussion, not in the Results (lines 366-376).

      We thank the reviewer for pointing this out. We agree that the paragraph in question was ambiguous and appeared to elaborate a Discussion point, which was not our intent. Indeed, as the reviewer noted, the main point was that the randomization of the target colors (and not urgency) is the critical aspect of the task that makes it surprisingly difficult for the monkeys. We have revised the paragraph to emphasize this conclusion and the two empirical results from our own data that support it. The agreement with prior studies, which is somewhat tangential, is now briefly mentioned at the end of the paragraph. It should now be clear that the text mainly describes current data that are relevant to the interpretation of the main results.

      (2) It's important to state that feature-based selection history bias is not merely due to the monkey's intrinsic bias to one color over the other (red vs green). The authors did a nice job controlling that, as mentioned in Methods (lines 194-196) and supplementary figure (Figure 1 - Figure Supplement 2). It would be helpful for readers to read in Results as well.

      Thank you for the suggestion. We now mention this in the second section of the Results.

      (3) D trial examples for the location history in Results can be confusing to readers (lines 407-409; left-left-right, up-up-left). The examples in Methods (lines 224-229; left-up-right, up-down-left) are better to convey the preceding (different) trials can be of any kind.

      Indeed. Both types of example are now mentioned in the Results.

      Reviewer #2 (Recommendations for the authors):

      I have only minor comments:

      (1) In the abstract, I'm not sure what "when combined" means in the last sentence. What is combined? Selection history and stimulus salience? If so, this is not very clear. Also, it might be nice to end the abstract on how the study addresses the three components of attention that the abstract started with in the first place (salience, task, and history). Otherwise, I spent multiple abstract reads (before even reading the rest of the paper) trying to see whether indeed the paper addresses the three components of attention that were so prominently described at the beginning of the abstract or not. And, I still could not convince myself of whether all three were addressed by the study or not (I then resorted to proceeding with a reading of the rest of the paper).

      Thanks for pointing this out. We have reworded the abstract to clarify that we are focusing on selection history, not salience or top-down attention.

      (2) Line 72: isn't stimulus location still a feature????

      Our nomenclature here is intended to be consistent with the commonly applied distinction between “spatial” and “feature” -based attention that underscores the distinct mechanistic underpinnings of “where” and “what”.

      (3) Lines 76-79: I'm very confused here. The part about "guesses can be strongly biased toward an arbitrary location early on". However, I expected the later part of the sentence to still stick to location and mention what the temporal dynamic is. Instead, it discusses perceptual bias, which I presume is the color thing. So, the net result is that I'm a bit confused about how *both* location and color behave in *both* early and late times.

      We have rewritten the end of this paragraph to clarify when and how location and feature biases manifest in behavior. It may be useful to note the following. The tachometric curve describes different types of choices distinguished by their timing, guesses at short PTs vs informed decisions at long PTs. However, this also corresponds to the degree to which perceptual information becomes available over time within a single trial. Namely, perceptual information is initially absent but arrives later on. The revised text now reflects this distinction, making the logic for the expected results clearer.

      (4) Last paragraph of the introduction (lines 80-82): it would be helpful to justify here why the psychophysics were done in monkeys in this study, instead of humans.

      We now allude to the reason these studies were done in monkeys but feel that more elaboration of this point is better left to Discussion. The Discussion now more explicitly states that the current data are closely related to neurophysiological studies of spatial attention and color priming in monkeys (beginning of 4th paragraph).

      - Line 389: this kind of formulation is much clearer to me than lines 76-79 mentioned above.

      As noted, the above-mentioned section has been revised.

      - I'm a bit confused by Figure 4 in the sense that some of the effect sizes are not too different from Figure 2, even when there are some intermediate inconsistent trials. I guess the problem is aggravated by the different axis ranges in Figures 2, and 4.

      All the 1S and 1D data points are the same in both figures, as they should, but the problem is that, otherwise, the two figures are just not comparable. Apples and oranges. To see this, note that the trends for the difference between S and D conditions should go in opposite directions as trials go further into the past, and indeed they do. In Figures 2c, f, the differences between 1S and 1D results are small, and those between 4S and 4D results are the largest because both S and D effects grow away from the average with more repetitions. In contrast, in Figure 4b-d, the differences between S and D shrink as the effect of a single trial becomes more distant (differences are largest between 1S and 1D results, smallest between 1S9x and 1D9x results). The only slightly ambiguous trend is that of Figure 2g, because the S data are more noisy. We have expanded the text surrounding Figure 4 to highlight the different expected trends for this analysis in contrast to that presented in Figure 2. This should clarify the qualitative difference between the two.

      - On a related note, it is odd that the summary figures (e.g. Figures. 2, 4, etc) are vertically aligned such that the dependent measure is on the x-axis rather than the y-axis. For example, looking at Figure 2, it would make much more sense if panels b-d and f-h were rotated by 90 deg, such that the vertical axis is indeed the low asymptote or high asymptote or RT. This would directly correlate with the same data in panels a and e in the same figure and would be much easier to follow. Then, later in the paper, Fig. 8 suddenly does the dependent measure on the y-axis, as I said. I think it can help to use similarly consistent plotting approaches across all (or most) analyses.

      We tried other formats but settled on the current one because we felt it made it (slightly) easier to compare the patterns across history conditions between any two of the 6 bar graphs in each figure (in Figs 2, 5, 6), in part because it prevents any confusion with the PT axes. As this does not make a substantial difference either way, we prefer to maintain the present arrangement. Additional labels are now included, which should make the figures a bit more friendly.

      - At the beginning of the paper, I was under the impression that this will really be a free viewing search task (e.g. Wolfe search arrays or old Nakayama search arrays), but then it became clear later that it was still an instructed task, with the only difference being that the target onset is now 4 targets. I think this distinction should be clarified very early on, in order to avoid confusion by the readers. The reason I say this is that with enforced fixation, there are other factors in this task that come into play, like the monkey's individual microsaccade rates etc, which can modulate performance since they also have a form of countermanding that is like the one imposed by the compelled saccade task. So, better alert the readers to the context of the task early on.

      Thanks. We have provided additional detail when introducing the task for the first time in the Introduction, along with a citation to an earlier publication in which the specific task is described. There should be no ambiguity now.

      Reviewing Editor Comments:

      Short Assessment:

      This important study makes compelling use of the monkey animal model to capture the long-time course over which trial history affects decision-making under time pressure, showing decisions are affected by the stimulus sequence extending back as many as four trials previously.

      Summary:

      Decision-making is variable, but how much of this variability can be accounted for by the immediate previous history is not well known. Using an "urgent" saccade, Oor et al manipulated how much time monkeys had to process evidence, and evaluated what they did when there was too little time to make an evidence-based decision. They report that the history affected performance as far back as 4 previous trials and that different aspects of the stimulus history (color and location) affected performance differently.

      Strengths:

      The key strengths of this paper are that the monkey paradigm permitted a study under highly controlled conditions with stable performance across sessions and enough trials to conduct the history analysis farther back in time than is possible with smaller data sets. While the fact that prior history affects decisions was previously known, this study provides a careful quantification of the effect -- which proves to be quite large - as well as an assessment of both location and feature histories in combination with each other. The manuscript is well-written and easy to follow.

      Weaknesses and recommendations for the authors:

      (1) The figures are lovely but could use some more text/design elements to clarify, and there is space to do so. e.g., in Figure 2, there could be titles to indicate that the top row involves the color history and the bottom row involves location history. The information is there, in the y labels of panels B and F, but it takes a while to see that.

      Done. Titles have been added to Figure 2 and several others.

      (2) Furthermore, the abbreviations 1D, 4S, etc are explained in the legend but it seems there is room to spell them out or include a graphic to indicate what they mean.

      The labels 1D, 4S, etc are difficult to spell out because each one represents multiple conditions; for instance, 2S may correspond to green-green or red-red target colors, and so on. Figure legends have been edited to more clearly indicate that S and D labels correspond to repeat and switch trials, respectively, and that the associated number indicates how far back the history goes.

      (3) The terms "low asymptote" and "high asymptote" could be indicated in a graphic of a tachymetric function, smoothing the transition to the rightmost panels. (Consider also alternative terms - perhaps "floor" and "ceiling" might be more readily understandable than asymptote to the student reader??).

      Thanks for the suggested terms, “floor” and “ceiling”, which we’ve adopted. They are indeed more natural. Figure 2a now indicates that floor and ceiling accuracies correspond to opposite ends of the PT axis.

      (4) The units for the asymptotes are not indicated - I assume these are "% correct" but that would be helpful to clarify.

      Yes. Units for floor and ceiling (and RT) are now indicated in all figures.

      (5) Figure 3 - "PT", and "1S-1D" could be spelled out, and the meaning of the two colored traces could be in the figure itself rather than only in the legend. Similar suggestions apply about labeling, abbreviations apply in subsequent figures.

      PT is now spelled out in all figures other than Figure 1, and labels for the two traces were added to Figure 3. Thanks for all the detailed suggestions.

    1. Author response:

      The following is the authors’ response to the original reviews

      Public Reviews:

      Reviewer #1 (Public review):

      Summary:

      This is a very well-written paper presenting interesting findings related to the recovery following the end-Permian event in continental settings, from N China. The finding is timely as the topic is actively discussed in the scientific community. The data provides additional insights into the faunal, and partly, floral global recovery following the EPE, adding to the global picture.

      Strengths:

      The conclusions are supported by an impressive amount of sedimentological and paleontological data (mainly trace fossils) and illustrations.

      We thank Reviewer #1 for the positive assessments.

      Weaknesses:

      The occurrence of MISS (Microbially Induced Sedimentary Structures) could be discussed more in detail as these provide interesting information directly linked to the delayed recovery of the biota.

      We appreciate the reviewer for highlighting this important point. In the Phanerozoic, increase of microbial abundances generally occurred with rapid warming when documented and those hyperthermal events had causal links to mass extinction in continental realms, including the Permian–Triassic mass extinction (Mays et al., 2021). Accumulations of cyanobacteria and other microbes was favored by low dissolved oxygen concentrations (Pacton et al., 2011) and the produced secondary metabolites may also be toxic to animals (Paerl and Otten, 2013). Therefore, repeated algal and bacterial blooms in the post-extinction interval could disrupt ecological stability and inhibit the restoration of ecosystems.

      So, the sentence from Lines 127–130 “The depauperate ichnofauna of the late Smithian were monospecific, representing initial recolonization of empty niches by opportunists, but the coeval thrived microbial mats indicated harsh environments, which might have inhibited the recovery of freshwater ecosystems (Tu et al., 2016; Chu et al., 2017; Mays et al., 2021).” is rephased by:

      “The depauperate ichnofauna of the late Smithian were monospecific, representing initial recolonization of empty niches by opportunists. However, recurrent occurrences of microbial induced sedimentary structures (MISS) in the Liujiagou Formation imply that depressed ecosystems persisted until the Smithian (Tu et al., 2016; Chu et al., 2017). Studies revealed that the increase in microbial abundances were generally associated with hyperthermals, which would be the principal causes for mass extinction on land (Mays et al., 2021). Accumulations of microbes were favored by low dissolved oxygen concentration condition and their secondary metabolites could also be toxic to animals (Pacton et al., 2011; Paerl and Otten, 2013). Therefore, repeated thriving of MISS during the Dienerian–Smithian disrupted ecological stability in freshwater ecosystem and delayed biotic recovery in North China.”

      References:

      Mays, C., et al. 2021. Lethal microbial blooms delayed freshwater ecosystem recovery following the end-Permian extinction. Nat. Commun. 12, 5511. https://doi.org/10.1038/s41467-021-25711-3

      Pacton, M., et al. 2011. Amorphous organic matter—Experimental data on formation and the role of microbes. Rev. Palaeobot. Palynol. 166, 253–267. https://doi.org/10.1016/j.revpalbo.2011.05.011

      Paerl, H. W. & Otten, T. G. 2013. Harmful cyanobacterial blooms: causes, consequences, and controls. Microb. Ecol. 65, 995–1010. https://doi.org/10.1007/s00248-012-0159-y

      Reviewer #2 (Public review):

      Summary:

      A rapid recovery of the ecosystems during the late Early Triassic, in the aftermath of the end-Permian mass extinction, is discussed based on different types of fossils.

      Strengths:

      The combined study of invertebrate trace fossils, tetrapod bones, and plant remains together with their stratigraphic distribution in different sections provides a convincing case to support a rapid recovery as the authors hypothesize.

      We thank Reviewer #2 for the positive comments on our work.

      Weaknesses:

      The study is based on three regions with Triassic successions from the North China block. While a first-hand study of other localities of similar age would be ideal, this is of course a difficult task. Instead, the authors provide comparisons with other worldwide regions to build their case and support the initial hypothesis.

      Globally, ichnoassemblages reported from the Lower Triassic are relatively impoverished (Guo et al., 2019). We have compiled ichnoassemblages from several continental basins before, including South Africa, Antarctica, North America, European Basin and North China (Fig. 14 in Guo et al., 2019). However, most of the Early Triassic strata lack bioturbation (e.g., Guo et al., 2019, Buatois et al., 2021). On the contrary, the coeval deposits in North China contain diverse trace fossils, making it an ideal place for ichnological investigations. Hence, this study mainly focuses on the ichnological records in North China, but we hope more work will be done in other basins. 

      References:

      Guo, W.W, et al. 2019. Secular variations of ichnofossils from the terrestrial Late Permian–Middle Triassic succession at the Shichuanhe section in Shaanxi Province, North China. Glob. Planet. Change 181, 102978. https://doi.org/10.1016/j.gloplacha.2019.102978

      Buatois, L.A., et al. 2021. Impact of Permian mass extinctions on continental invertebrate infauna. Terra Nova 33, 455–464. https://doi.org/10.1111/ter.12530

      Reviewer #3 (Public review):

      Summary:

      This manuscript by Guo and colleagues features the documentation and interpretation of three successions of continental to marginal marine deposits spanning the P/T transition and their respective ichnofaunas. Based on these new data inferences concerning end-Permian mass extinction and Triassic recovery in the tropical realm are discussed.

      Strengths:

      The manuscript is well-written and organized and includes a large amount of new lithological and ichnological data that illuminate ecosystem evolution in a time of large-scale transition. The lithological documentations, facies interpretations, and ichnotaxonomic assignments look okay (with a few exceptions).

      We thank Reviewer #3 for the positive assessments.

      Weaknesses:

      Some interpretations in Table 1 could be questioned: For facies association FA2 the interpretation as „terrestrial facies with periodical flooding" should be put into the right column and, given the fossil content, other interpretations, such as "marine facies" or "lagoonal environment" with some plant debris and (terrestrial) animal remains washed in, could also be possible. For FA3 the statement "bioturbation is absent" is in conflict with the next statement "strata are moderately reworked". For FA5 the observation of a "monospecific ichnoassemblage" contradicts the listing of several ichnotaxa.

      We thank the reviewer for this feedback. The “FA2: terrestrial facies with periodical flooding” has been moved to the right column. As for the interpretation of depositional environment of FA2, this interval was basically terrestrial accordingly to the well-developed paleosols (Yu et al., 2022). Meanwhile, regional geological surveys have shown a faunal transition in this interval among a series of successions, from typical marine fauna containing Lingula, Eumorphotis, etc. in the southwest to a marine bivalve-terrestrial conchostracan mixed fauna in the northeast (Yin and Lin, 1979; Chu et al., 2019). Therefore, occurrence of episodic transgressions is suggested.

      The FA3: Costal mudplain facies distributed to both the upper Sunjiagou Formation and Lower Heshang Formation (Fig S1), where the former lack bioturbation and the latter were moderately disturbed. We have stated this clearly in the table S1.

      Ichnofauna in FA5 are dominated by Skolithos, Lockeia and Gordia, with only one poorly preserved specimen of Palaeophycus, which are distributed at the Shichuanhe and Liulin sections. However, there ichnotaxa were distributed separately, characterized by low diversity (single ichnogenus) and high density. We have deleted the “monospecific ichnoassemblage” for clarity.

      References:

      Chu, D., et al. 2019, Mixed continental-marine biotas following the Permian-Triassic mass extinction in South and North China: Palaeogeography, Palaeoclimatology, Palaeoecology, v. 519, p. 95–107, doi:10.1016/j.palaeo.2017.10.028.

      Yu, Y., et al. 2021, Latest Permian–Early Triassic paleoclimatic reconstruction by sedimentary and isotopic analyses of paleosols from the Shichuanhe section in central North China Basin: Palaeogeography, Palaeoclimatology, Palaeoecology, v. 585, p. 110726, doi:10.1016/j.palaeo.2021.110726.

      Yin, H.F., Lin, H.M., 1979. Marine Triassic faunas and the geologic time from Shihchienfeng Group in the northern Weihe River Basin, Shaanxi Province. Acta Stratigr. Sin. 3, 233–241 (in Chinese).

      Concerning the structure of the manuscript, certain hypotheses related to the end-Permian mass extinction and the process of the P/T extinction and recovery, namely the existence of a long-persisting "tropic dead zone" are introduced as a foregone conclusion to which the new data seemingly shall be fit as corroborating evidence. Some of the data - e.g. the presence of a supposedly Smithian-age ichnofauna are interpreted as a fast recovery shortening the duration of the "tropic dead zone" episode - but these interpretations could also be interpreted as contradicting the idea of a "dead zone" sensu stricto in favour of a "normal" post-extinction environment with low diversity and occurrence of typical disaster taxa. Due to their large error bars the early Triassic radiometric ages did not put much of a constraint on the age determination of the earliest post-extinction ichnofaunas discussed here.

      In the first ~5 Myr of the Triassic, there is evidence for a broad equatorial belt (30°N-40°S) where marine and terrestrial animals were nearly absent (namely “equatorial tetrapod gap”; Sun et al., 2012). However, the nature, duration and range of the “equatorial tetrapod gap” remain debated. Allen et al. (2020) show poleward migrations of terrestrial tetrapods during the Late Permian to Middle Triassic, with marine reptile diversity peak still restricted to northern low latitudes. Romano et al. (2020) argued that the Early Triassic equatorial terrestrial tetrapod gap would be narrower and restricted the “death belt” between 15° N and about 31° S, while Liu et al. (2022) consider that the exact boundaries of this gap likely varied with climate change (hot phases). Moreover, duration of the gap is also questioned, it’s long-lasting (Late Permian to Middle Triassic), during Induan (Bernardi et al., 2018), or from Induan to the early Spathian (Liu et al., 2022). Regardless of these discrepancies, all the related studies show the existence of the “low latitudinal tetrapod gap”, which is mentioned as background information. On this basis, this study aims to reveal when and how terrestrial ecosystems recovered from the “tropic dead zone” from the ecological point of view, rather than tetrapods only.

      The fast recovered terrestrial ecosystems are represented by diverse traces, and concurrent tetrapods and plants found in the Heshanggou Formation. We acknowledge that the chronostratigraphy of the Lower Triassic in North China (and most of continental basins globally) are not controlled by precise ages, this formation, however, could be constrained to Spathian (or even straddle to earliest Middle Triassic), based on integrated magnetostratigraphic correlation, fossil records and geochemical data (Liu, 2018; Guo et al., 2022). The Smithian-age ichnofaunas here are not interpreted as a rapidly recovering biota, but early occurring opportunist-dominated communities that explore the empty ecospace under inhospitable environments. Our study also constrains roughly the “tropical dead zone” from Induan to late Smithian in North China (Fig. 4).

      References:

      Allen, B.J., et al. 2020. The latitudinal diversity gradient of tetrapods across the Permo-Triassic mass extinction and recovery interval. Proc Biol Sci 287, 20201125. https://doi.org/10.1098/rspb.2020.1125

      Bernardi, M., et al. 2018. Tetrapod distribution and temperature rise during the Permian-Triassic mass extinction. Proc Biol Sci 285, 20172331. https://doi.org/10.1098/rspb.2017.2331

      Guo, W., et al. 2022. Late Permian–Middle Triassic magnetostratigraphy in North China and its implications for terrestrial-marine correlations. Earth Planet. Sci. Lett. 585, 117519. https://doi.org/10.1016/j.epsl.2022.117519

      Liu, J. 2018. New progress on the correlation of Chinese terrestrial Permo-Triassic strata. Vertebrata Palasiatica, 56, 327-342. 10.19615/j.cnki.1000-3118.180709

      Liu, J., et al. 2021. Permo-Triassic tetrapods and their climate implications. Glob. Planet. Change 103618. https://doi.org/10.1016/j.gloplacha.2021.103618

      Romano, M., et al. 2020. Early Triassic terrestrial tetrapod fauna: a review. Earth-Sci. Rev. 210, 103331. https://doi.org/10.1016/j.earscirev.2020.103331

      Sun, Y., er al. 2012. Lethally hot temperatures during the early triassic greenhouse. Science 338, 366–70. https://doi.org/10.1126/science.1224126

      Considering the somewhat equivocal evidence and controversial ideas about the P/T transition, the introduction could be improved by describing how the idea of a "tropic dead zone" arose against the background of earlier ideas, alternative views, and conflicting data. In the discussion section, alternative interpretations of the extensive data presented here - e.g. proximal-distal shifts in lithofacies with respect to the sediment source, sea level changes, preservation bias, the local occurrence of hostile environments instead of a regional scale, etc. should be discussed, also to avoid the impression that the author's conclusion was driven by confirmation bias.

      As mentioned above, it’s still controversial about the nature, duration and range of the “equatorial tetrapod gap”, which primarily derived from the database (body fossils only vs. both skeletal and footprint data) and analytical methods. However, detailed discussions about these differences are beyond the scope of our study. This paper provides new evidence for the "tropical dead zone" from the ecological perspective (invertebrate ichnology, paleobotany and newly found tetrapods). Our results show that the "tropical dead zone" in North China terminated in the Smithian, followed by the reappearance of many animals in the Spathian, shedding light on the more rapidly recovering terrestrial ecosystems than previously thought.

      We have improved the Introduction section by providing a summary of the “equatorial tetrapod gap”. Lines 33-35: “A tropical “tetrapod gap”, spanning between 15°N and ~31°S, prevailed through the Early Triassic, or at least during particular intervals of intense global warming (Bernardi et al., 2018; Allen et al., 2020; Romano et al., 2020; Liu et al., 2022).” is revised to:

      “A tropical “tetrapod gap”, spanning between 15°N and ~31°S, prevailed in the Early Triassic, or at particular interval of intense global warming, even though the nature, duration and range remain debated (Bernardi et al., 2018; Allen et al., 2020; Romano et al., 2020; Liu et al., 2022).”

      In the Discussion section, Lines 180-181: “Although the specimens are not yet fully prepared for taxonomic description, they clearly show the existence of tetrapod at this level” is revised to:

      “Although the specimens are not yet fully prepared for taxonomic description, they clearly show the existence of tetrapods at this level, narrowing the “tetrapod gap” to the Spathian.”

      we also add a new paragraph from Line 208:

      “Our results also shed light on the timing of the tropical dead zone. The late Smithian-age ichnofauna, although impoverished, represents early opportunist-dominated communities that explored empty ecospace under inhospitable environments, which constrains the equatorial death belt to the late Smithian in North China.”

      Contrary to the authors' claim, Figures S7 and S8 suggest that burrow size does not vary much within the studied sections. Size decreases and increases in the Shichuanhe and Liulin sections do not contemporaneously, are usually within the error-bar range, and might be driven by ichnotaxa composition, i.e. the presence or absence of larger ichnotaxa, rather than by size changes in the same ichnotaxon (and producer group). Here the measurement data would be needed as well to check the basis of the authors' interpretations.

      We thank the reviewer for highlighting this important point. We have checked the accuracy of our raw data. Both the average size of all ichnogenera and single ichnogenera do not change obviously, but increase slightly upwards in the Spathian (Figures S7c and S8). This tendency is congruent with other coeval studies in North China (e.g., Shu et al., 2018; Xing et al., 2020). The presence of larger ichnotaxa will indeed improve the average sizes of fossil-bearing horizons, however, burrows of single ichnogenera in the Spathian generally show wider size distributions than in the Smithian, which might be associated with enriched producer groups or different growth stages of the same biota.

      The asynchronous burrow size changes in the Shichuanhe and Liulin sections could be attributed to sedimentary facies. Late Permian deposits at Shichuanhe are finer than those at Linlin, which is located at the basin margin. As a result, tiny traces, like Helminthoidichnites, which were widely distributed at Shichuanhe, are absent at Linlin section. Those traces significantly reduce the average sizes in this interval, leading to inconsistent size variation patterns.

      References:

      Shu, W., et al. 2018. Limuloid trackways from Permian-Triassic continental successions of North China. Palaeogeogr. Palaeoclimatol. Palaeoecol. 508, 71–90. https://doi.org/10.1016/j.palaeo.2018.07.022

      Xing, Z.F., et al. 2020. Trace fossils from the Lower Triassic of North China—a potential signature of the gradual recovery of a terrestrial ecosystem. Palaeoworld 30, 95–105. https://doi.org/10.1016/j.palwor.2020.06.002

      Some arthropod tracks assigned here to Kouphichnium might not represent limulid traces but other (non-marine) arthropod taxa in accordance with their occurrence in terrestrial facies/non-marine units of the succession. More generally, the ichnotaxonomy of arthropod trackways is not yet well reserved - beyond Kouphichnium and Diplichnites various similar-looking types may occur that can have a variety of distinct insect, crustacean, millipede, etc. producers (including larval stages).

      Well, individual trace-makers can produce different traces, and different organisms can make morphologically similar traces. In consideration of this, it’s hard to give a one-on-one relationship between trace fossils and their producers in most cases, especially for the invertebrates. So, Kouphichnium could be made by arthropods other than limuloidss.

      However, horseshoe crabs, originating in the early Ordovician, invaded freshwater environments twice in the Paleozoic and once in the Mesozoic (Lamsdell, 2016), and their body fossils have been found from the Early Triassic of Germany (e.g., Hauschke and Wilde, 2008) and North China (which occur with their traces; unpublished data). Accordingly, we tentatively speculate Kouphichnium found in this interval could be primarily produced by limuloids.

      References:

      Hauschke, N., Wilde, V. 2008. Limuliden aus dem Oberen Buntsandstein von Süddeutschland. Hallesches Jahrb. Für Geowiss. 30, 21–26.

      Lamsdell, J.C. 2016. Horseshoe crab phylogeny and independent colonizations of fresh water: ecological invasion as a driver for morphological innovation. Palaeontology 59, 181–194. https://doi.org/10.1111/pala.12220

      Recommendations for the authors:

      Reviewer #1 (Recommendations for The Authors):

      (1)  Line 112 - was identified during..; please change to ...was identified in successions of late Changsian-early Smithian age.

      Revised as suggested.

      (2)  Line 116 - change prolong to prolonged.

      Revised as suggested.

      (3) Line 121 - change ichnofaunal to ichnofauna (check the entire sentence).

      We checked the manuscript thoroughly and revised as suggested.

      (4) Figure 1 caption - check sentence starting with - Base map...(delete 'of is')

      Revised as suggested.

      (5) Line 471 - tiny instead of tinny.

      Revised as suggested.

      (6) Figure S9 - would it be possible to include this reconstruction in the main manuscript?

      We have moved the artistic illustration to the main text as Figure 5.

      (7) Add the illustrators name / or indicate if it is produced by AI.

      We have added the sentence “The artistic illustration is credited to J. Sun” at the end.

      Reviewer #2 (Recommendations for The Authors):

      (1) Line 15 – change 252 million years ago to ca. 252 million years ago.

      Revised as suggested.

      (2) Line 18 – change low-latitude North China to low-latitude present-day North China.

      Actually, the paleolatitude of North China during the Early Triassic is about 17-18°N according to paleomagnetic results (Huang et al., 2018; Guo et al., 2022,).

      References:

      Guo, W., et al. 2022. Late Permian–Middle Triassic magnetostratigraphy in North China and its implications for terrestrial-marine correlations. Earth Planet. Sci. Lett. 585, 117519. https://doi.org/10.1016/j.epsl.2022.117519

      Huang, B., et al. 2018. Paleomagnetic constraints on the paleogeography of the east asian blocks during Late Paleozoic and Early Mesozoic times. Earth-Sci. Rev. 186, 8–36. https://doi.org/10.1016/j.earscirev.2018.02.004

      (3) Line 25 - "possible" doesn't seem the appropriate term here for the structure of the sentence. Could it be "to make possible" that it meant? Or otherwise you could write "possibly". Please revise this.

      Revised “possible” to “possibly”.

      (4) Line 33 – change “are” to “were”.

      Revised as suggested.

      (5) Line 43 – There are other, more appropriate articles that should (also) be cited here, especially because Mujal et al. (2017) doesn't deal with the Central European Basin (so you could even remove this reference). For sure this one should be cited:

      Scholze, F., Wang, Z., Kirscher, U., Kraft, J., Schneider, J.W., Götz, A.E., Joachimski, M.M., Bachtadse, V., 2017. A multistratigraphic approach to pinpoint the Permian-Triassic boundary in continental deposits: the Zechstein–Lower Buntsandstein transition in Germany. Glob. Planet. Chang. 152, 129–151. http://dx.doi.org/10.1016/j.gloplacha.2017.03.004.

      We have replaced Mujal’s paper with Scholze et al., (2017) in the main text.

      (6) Line 46 – change “Roopnarinev et al., 2019” to “Roopnarine et al., 2019”.

      Revised as suggested.

      (7) Line 53 – Here Mujal et al. (2017) would be more appropriate, since it deals with a basin from the western peri-Tethys, also, this other article by Mujal et al. (2017) discussed the recovery in the western peri-Tethys based on tetrapod footprints:

      Mujal, E., Fortuny, J., Bolet, A., Oms, O., López, J.Á., 2017. An archosauromorph dominated ichnoassemblage in fluvial settings from the late Early Triassic of the Catalan Pyrenees (NE Iberian Peninsula). PLoS One 12 (4), e0174693. http://dx.doi.org/10.1371/journal.pone.0174693.

      Revised as suggested.

      (8) Line 58 – change “relatively diversified trace fossils have been found during the late Early Triassic” to “because relatively diversified trace fossils have been found in upper Lower Triassic deposits”.

      Revised as suggested.

      (9) Line 58 – change “recovered” to “ecosystems recovered”.

      Revised as suggested.

      (10) Line 81 – These two paragraphs could be under a section named Geological setting or similar.

      Yes, these two paragraphs are brief introductions of the geological background of North China, so we change the section name to “Geological Settings and Methods”.

      (11) Line 99 – change “behavioural” to “behavioral”.

      Revised as suggested and check spelling throughout.

      (12) Line 103 – add “is” before adopted.

      The sentence “Tiering, referring to the life position of an animal vertically in the sediment, is divided into surficial, semi-infaunal (0–0.5 cm), shallow (0.5–6 cm), intermediate (6–12 cm) and deep infaunal tiers (> 12 cm), adopted from Minter et al. (2017).” is changed to “…, based on Minter et al. (2017).”

      (13) Line 113 –change “mainly” to “were mainly”.

      Revised as suggested

      (14) Line 116 - change prolong to prolonged.

      Revised as suggested.

      (15) Line 121 – add “preserved” before in.

      Revised as suggested.

      (16) Line 123 - change “were” to “are”.

      Revised as suggested.

      (17) Line 127 – “Kouphichnium” instead of “Kouphichnim”.

      Revised as suggested.

      (18) Line 135 – change to “Occupied by”.

      Revised as suggested.

      (19) Line 140 – change “bioturbations” to “bioturbated deposits”.

      Revised as suggested.

      (20) Line 145 – “Spathian” rather than “Spthian”.

      Revised as suggested.

      (21) Line 140 – change “displayed” to “displays”.

      Revised as suggested.

      (22) Line 160 – change “continental” to “terrestrial”.

      Revised as suggested.

      (23) Line 165 – “Marchetti” rather than “Marchettti”.

      Revised as suggested.

      (24) Line 168 – change “relationships” to “relation”.

      Revised as suggested.

      (25) Line 177 – “including” instead of “includes”.

      Revised as suggested.

      (26) Line 181 and Line 214– change “tetrapod” to “tetrapods”.

      Revised as suggested.

      (27) Line 195 and Line 218 – change “cooccurred” to “co-occurring”.

      Revised as suggested.

      (28) Line 540 – delete “herein”.

      Revised as suggested.

      (28) Line 559 – “Helminthoidichnites tenuis”, it should be in italics.

      Revised as suggested.

    2. Reviewer #3 (Public review):

      Summary:

      The manuscript by Guo and colleagues features the documentation and interpretation of three successions of continental to marginal marine deposits spanning the P/T transition and their respective ichnofaunas. Based on these new data inferences concerning end-Permian mass extinction and Triassic recovery in the tropical realm are discussed.

      Strengths:

      The manuscript is well written and organized and includes a large amount of new lithological and ichnological data that illuminate ecosystem evolution in a time of large scale transition. The lithological documentations, facies interpretations and ichnotaxonomic assignments look alright (with few exceptions).

      Weaknesses: [all eliminated in revision]

    3. Reviewer #2 (Public review):

      Summary:

      The authors made a thorough revision of the manuscript, strengthening the message. They also considered all the comments made by the reviewers and provided appropriate and convincing arguments.

      Strengths:

      The revised manuscript clarifies all the major points raised by the reviewers, and the way the information is presented (in the text, figures and tables) is clear.

      Weaknesses:

      The authors provided an appropriate and convincing rebuttal regarding the potential weakness I pointed out in the first review of the manuscript. Therefore, I do not see any major issue in their work.

    4. Reviewer #1 (Public review):

      Summary:

      This is a very well-written paper presenting interesting findings related to the recovery following the end-Permian event in continental settings, from N China. The finding is timely as the topic is actively discussed in the scientific community. The data provides additional insights into the faunal, and partly, floral global recovery following the EPE, adding to the global picture.

      Strengths: The conclusions are supported by an impressive amount of sedimentological and paleontological data (mainly trace fossils) and illustrations.

      Weaknesses: [eliminated in revision]

    5. eLife Assessment

      This is a well-written important paper on the recovery of fauna and flora following the end-Permian extinction event in several continental sites in northern China. The convincing conclusion, a rapid recovery in tropical riparian ecosystems following a short phase of hostile environments and depauperate biota, is supported by an impressive amount of data from sedimentology, body fossils of animals and plants, and especially trace fossils.

    1. eLife Assessment

      This important study presents compelling observational data supporting a role for transcription and polysome accumulation in the separation of newly replicated bacterial chromosomes. Through a comprehensive and rigorous comparative analysis of the spatiotemporal dynamics of ribosomal accumulation, nucleoid segregation, and cell division, the authors develop a model that nucleoid segregation rates are determined at least in part by the accumulation of ribosomes in the center of the cell, exerting a steric force to drive nucleoid segregation prior to cell division. This model circumvents the need to invoke as yet unidentified active mechanisms (e.g. an equivalent to a eukaryotic spindle) as drivers of bacterial chromosome segregation and intrinsically couples this vital step in the cell cycle to cell growth.

    2. Reviewer #1 (Public review):

      Summary:

      The paper by Papagiannakis et al is an elegant, mostly observational work detailing observations that polysome accumulation appears to drive nucleoid splitting and segregation. Overall I think this is an insightful work with solid observations.

      Strengths:

      The strengths of this paper are the careful and rigorous observational work that leads to their hypothesis. They find the accumulation of polysomes correlates with nucleoid splitting, and that the nucleoid segregation occurring right after splitting correlates with polysome segregation. These correlations are also backed up by other observations:

      (1) Faster polysome accumulation and DNA segregation at faster growth rates.<br /> (2) Polysome distribution negatively correlating with DNA positioning near asymmetric nucleoids.<br /> (3) Polysomes form in regions inaccessible to similarly sized particles.

      These above points are observational, I have no comments on these observations leading to their hypothesis.

      Comments on revisions:

      The authors have satisfied all of my concerns.

    3. Reviewer #2 (Public review):

      Summary:

      The authors perform a remarkably comprehensive, rigorous, and extensive investigation into the spatiotemporal dynamics between ribosomal accumulation, nucleoid segregation, and cell division. Using detailed experimental characterization and rigorous physical models, they offer a compelling argument that nucleoid segregation rates are determined at least in part by the accumulation of ribosomes in the center of the cell, exerting a steric force to drive nucleoid segregation prior to cell division. This evolutionarily ingenious mechanism means cells can rely on ribosomal biogenesis as the sole determinant for the growth rate and cell division rate, avoiding the need for two separate 'sensors,' which would require careful coupling.

      Strengths:

      In terms of strengths; the paper is very well written, the data are of extremely high quality, and the work is of fundamental importance to the field of cell growth and division. This is an important and innovative discovery enabled through the combination of rigorous experimental work and innovative conceptual, statistical, and physical modeling.

      Weaknesses:

      The authors have reasonably addressed by minor weaknesses raised in the first round of reviews, and I see no other weaknesses at this point worth raising.

    4. Reviewer #3 (Public review):

      Summary:

      Papagiannakis et al. present a detailed study exploring the relationship between DNA/polysome phase separation and nucleoid segregation in Escherichia coli. Using a combination of experiments and modelling, the authors aim to link physical principles with biological processes to better understand nucleoid organisation and segregation during cell growth.

      Strengths:

      The authors have a conducted a large number of experiments under different growth conditions and physiological perturbations (using antibiotics) to analyse the biophysical factors underlying the spatial organisation of nucleoids within growing E. coli cells. A simple model of ribosome-nucleoid segregation has been developed to explain the observations and tested with cleverly designed perturbation experiments.

      The model and explanation presented in the original version have been strengthened with additional results and consideration of new factors. In particular, the radial attachment of the nucleoid, supported by previous studies and the A22 treatment data in this study, provides a plausible mechanism that prevents ribosomes from diffusing between and around the nucleoid lobes through the radial shells surrounding the nucleoid. The revised version of the paper incorporates this effect, resulting in model predictions that align well with the drug treatment outcomes and the observed mid-cell accumulation and confinement of ribosomes.

      Furthermore, experiments involving plasmid-based gene expression, designed to redirect transcription away from chromosomal loci, offer compelling validation of the model's predictions. Overall, this is a robust and insightful study that will be of significant value to the quantitative microbiology community.

    5. Author response:

      The following is the authors’ response to the original reviews

      Public Reviews:

      Reviewer #1 (Public review):

      Summary:

      This paper is an elegant, mostly observational work, detailing observations that polysome accumulation appears to drive nucleoid splitting and segregation. Overall I think this is an insightful work with solid observations.

      Thank you for your appreciation and positive comments. In our view, an appealing aspect of this proposed biophysical mechanism for nucleoid segregation is its self-organizing nature and its ability to intrinsically couple nucleoid segregation to biomass growth, regardless of nutrient conditions.

      Strengths:

      The strengths of this paper are the careful and rigorous observational work that leads to their hypothesis. They find the accumulation of polysomes correlates with nucleoid splitting, and that the nucleoid segregation occurring right after splitting correlates with polysome segregation. These correlations are also backed up by other observations:

      (1) Faster polysome accumulation and DNA segregation at faster growth rates.

      (2) Polysome distribution negatively correlating with DNA positioning near asymmetric nucleoids.

      (3) Polysomes form in regions inaccessible to similarly sized particles.

      These above points are observational, I have no comments on these observations leading to their hypothesis.

      Thank you!

      Weaknesses:

      It is hard to state weaknesses in any of the observational findings, and furthermore, their two tests of causality, while not being completely definitive, are likely the best one could do to examine this interesting phenomenon.

      It is indeed difficult to prove causality in a definitive manner when the proposed coupling mechanism between nucleoid segregation and gene expression is self-organizing, i.e., does not involve a dedicated regulatory molecule (e.g., a protein, RNA, metabolite) that we could have eliminated through genetic engineering to establish causality. We are grateful to the reviewer for recognizing that our two causality tests are the best that can be done in this context.

      Points to consider / address:

      Notably, demonstrating causality here is very difficult (given the coupling between transcription, growth, and many other processes) but an important part of the paper. They do two experiments toward demonstrating causality that help bolster - but not prove - their hypothesis. These experiments have minor caveats, my first two points.

      (1) First, "Blocking transcription (with rifampicin) should instantly reduce the rate of polysome production to zero, causing an immediate arrest of nucleoid segregation". Here they show that adding rifampicin does indeed lead to polysome loss and an immediate halting of segregation - data that does fit their model. This is not definitive proof of causation, as rifampicin also (a) stops cell growth, and (b) stops the translation of secreted proteins. Neither of these two possibilities is ruled out fully.

      That’s correct; cell growth also stops when gene expression is inhibited, which is consistent with our model in which gene expression within the nucleoid promotes nucleoid segregation and biomass growth (i.e., cell growth), inherently coupling these two processes. This said, we understand the reviewer’s point: the rifampicin experiment doesn’t exclude the possibility that protein secretion and cell growth drive nucleoid segregation. We are assuming that the reviewer is envisioning an alternative model in which sister nucleoids would move apart because they would be attached to the membrane through coupled transcription-translation-protein secretion (transertion) and the membrane would expand between the separating nucleoids, similar to the model proposed by Jacob et al in 1963 (doi:10.1101/SQB.1963.028.01.048). There are several observations arguing against cell elongation/transertion acting a predominant mechanism of nucleoid segregation.

      (1) For this alternative mechanism to work, membrane growth must be localized at the middle of the splitting nucleoids (i.e., midcell position for slow growth and ¼ and ¾ cell positions for fast growth) to create a directional motion. To our knowledge, there is no evidence of such localized membrane incorporation. Furthermore, even if membrane growth was localized at the right places, the fluidity of the cytoplasmic membrane (PMID: 6996724, 20159151, 24735432, 27705775) would be problematic. To circumvent the membrane fluidity issue, one could potentially evoke an additional connection to the rigid peptidoglycan, but then again, peptidoglycan growth would have to be localized at the middle of the splitting nucleoid. However, peptidoglycan growth is dispersed early in the cell division cycle when the nucleoid splitting happens in fast growing cells and only appears to be zonal after the onset of cell constriction (PMID: 35705811, 36097171, 2656655).

      (2) Even if we ignore the aforementioned caveats, Paul Wiggins’s group ruled out the cell elongation/transertion model by showing that the rate of cell elongation is slower than the rate of chromosome segregation (PMID: 23775792). In our revised manuscript, we clarify this point and provide confirmatory data showing that the cell elongation rate is indeed slower than the nucleoid segregation rate (Figure 1H and Figure 1 - figure supplement 5A), indicating that it cannot be the main driver.

      (3) The asymmetries in nucleoid compaction that we described in our paper are predicted by our model. We do not see how they could be explained by cell growth or protein secretion.

      (4) We also show that polysome accumulation at ectopic sites (outside the nucleoid) results in correlated nucleoid dynamics, consistent with our proposed mechanism. It is not clear to us how such nucleoid dynamics could be explained by cell growth or protein secretion (transertion).

      (1a) As rifampicin also stops all translation, it also stops translational insertion of membrane proteins, which in many old models has been put forward as a possible driver of nucleoid segregation, and perhaps independent of growth. This should at last be mentioned in the discussion, or if there are past experiments that rule this out it would be great to note them.

      It is not clear to us how the attachment of the DNA to the cytoplasmic membrane could alone create a directional force to move the sister nucleoids. We agree that old models have proposed a role for cell elongation (providing the force) and transertion (providing the membrane tether). Please see our response above for the evidence (from the literature and our work) against it. This was mentioned in the Introduction and Results section, but we agree that this was not well explained. We have now put emphasis on the related experimental data (Figure 1H, Figure 1 – figure supplement 5A, ) and revised the text (lines 199 - 210) to clarify these points.

      (1b) They address at great length in the discussion the possibility that growth may play a role in nucleoid segregation. However, this is testable - by stopping surface growth with antibiotics. Cells should still accumulate polysomes for some time, it would be easy to see if nucleoids are still segregated, and to what extent, thereby possibly decoupling growth and polysome production. If successful, this or similar experiments would further validate their model.

      We reviewed the literature and could not find a drug that stops cell growth without stopping gene expression. Any drug that affects the integrity or potential of the membrane depletes cells of ATP; without ATP, gene expression is inhibited. However, our experiment in which we drive polysome accumulation at ectopic sites decouples polysome accumulation from cell growth. In this experiment, by redirecting most of chromosome gene expression to a single plasmid-encoded gene, we reduce the rate of cell growth but still create a large accumulation of polysomes at an ectopic location. This ectopic polysome accumulation is sufficient to affect nucleoid dynamics in a correlated fashion. In the revised manuscript, we have clarified this point and added model simulations (Figure 7 – figure supplement 2) to show that our experimental observations are predicted by our model.

      (2) In the second experiment, they express excess TagBFP2 to delocalize polysomes from midcell. Here they again see the anticorrelation of the nucleoid and the polysomes, and in some cells, it appears similar to normal (polysomes separating the nucleoid) whereas in others the nucleoid has not separated. The one concern about this data - and the differences between the "separated" and "non-separated" nuclei - is that the over-expression of TagBFP2 has a huge impact on growth, which may also have an indirect effect on DNA replication and termination in some of these cells. Could the authors demonstrate these cells contain 2 fully replicated DNA molecules that are able to segregate?

      We have included new flow cytometry data of fluorescently labeled DNA to show that DNA replication is not impacted.

      (3) What is not clearly stated and is needed in this paper is to explain how polysomes do (or could) "exert force" in this system to segregate the nucleoid: what a "compaction force" is by definition, and what mechanisms causes this to arise (what causes the "force") as the "compaction force" arises from new polysomes being added into the gaps between them caused by thermal motions.

      They state, "polysomes exert an effective force", and they note their model requires "steric effects (repulsion) between DNA and polysomes" for the polysomes to segregate, which makes sense. But this makes it unclear to the reader what is giving the force. As written, it is unclear if (a) these repulsions alone are making the force, or (b) is it the accumulation of new polysomes in the center by adding more "repulsive" material, the force causes the nucleoids to move. If polysomes are concentrated more between nucleoids, and the polysome concentration does not increase, the DNA will not be driven apart (as in the first case) However, in the second case (which seems to be their model), the addition of new material (new polysomes) into a sterically crowded space is not exerting force - it is filling in the gaps between the molecules in that region, space that needs to arise somehow (like via Brownian motion). In other words, if the polysome region is crowded with polysomes, space must be made between these polysomes for new polysomes to be inserted, and this space must be made by thermal (or ATP-driven) fluctuations of the molecules. Thus, if polysome accumulation drives the DNA segregation, it is not "exerting force", but rather the addition of new polysomes is iteratively rectifying gaps being made by Brownian motion.

      We apologize for the understandable confusion. In our picture, the polysomes and DNA (conceptually considered as small plectonemic segments) basically behave as dissolved particles. If these particles were noninteracting, they would simply mix. However, both polysomes and DNA segments are large enough to interact sterically. So as density increases, steric avoidance implies a reduced conformational entropy and thus a higher free energy per particle. We argue (based on Miangolarra et al. 2021 PMID: 34675077 and Xiang et al. 2021 PMID: 34186018) that the demixing of polysomes and DNA segments occurs because DNA segments pack better with each other than they do with polysomes. This raises the free energy cost associated with DNA-polysome interactions compared to DNA-DNA interactions. We model this effect by introducing a term in the free energy χ_np, which refers to as a repulsion between DNA and polysomes, though as explained above it arises from entropic effects. At realistic cellular densities of DNA and polysomes, this repulsive interaction is strong enough to cause the DNA and polysomes to phase separate.

      This same density-dependent free energy that causes phase separation can also give rise to forces, just in the way that a higher pressure on one side of a wall can give rise to a net force on the wall. Indeed, the “compaction force” we refer to is fundamentally an osmotic pressure difference. At some stages during nucleoid segregation, the region of the cell between nucleoids has a higher polysome concentration, and therefore a higher osmotic pressure, than the regions near the poles. This results in a net poleward force on the sister nucleoids that drives their migration toward the poles. This migration continues until the osmotic pressure equilibrates. Therefore, both phase separation (due to the steric repulsion described above) and nonequilibrium polysome production and degradation (which creates the initial accumulation of polysomes around midcell) are essential ingredients for nucleoid segregation.

      This has been clarified in the revised text, with the support of additional simulation results showing how the asymmetry in polysome distribution causes a compaction force (Figure 4A).

      The authors use polysome accumulation and phase separation to describe what is driving nucleoid segregation. Both terms are accurate, but it might help the less physically inclined reader to have one term, or have what each of these means explicitly defined at the start. I say this most especially in terms of "phase separation", as the currently huge momentum toward liquid-liquid interactions in biology causes the phrase "phase separation" to often evoke a number of wider (and less defined) phenomena and ideas that may not apply here. Thus, a simple clear definition at the start might help some readers.

      In our case, phase separation means that the DNA-polysome steric repulsion is strong enough to drive their demixing, which creates a compact nucleoid. As mentioned in a previous point, this effect is captured in the free energy by the χ_np term, which is an effective repulsion between DNA and polysomes, though it arises from entropic effects.

      In the revised manuscript, we now illustrate this with our theoretical model by initializing a cell with a diffuse nucleoid and low polysome concentration. For the sake of simplicity, we assume that the cell does not elongate. We observe that the DNA-polysome steric repulsion is sufficient to compact the nucleoid and place it at mid-cell (new Figure 4A).

      (4) Line 478. "Altogether, these results support the notion that ectopic polysome accumulation drives nucleoid dynamics". Is this right? Should it not read "results support the notion that ectopic polysome accumulation inhibits/redirects nucleoid dynamics"?

      We think that the ectopic polysome accumulation drives nucleoid dynamics. In our theoretical model, we can introduce polysome production at fixed sources to mimic the experiments where ectopic polysome production is achieved by high plasmid expression. The model is able to recapitulate the two main phenotypes observed in experiments (Figure 7). These new simulation results have been added to the revised manuscript (Figure 7 – figure supplement 2).

      (5) It would be helpful to clarify what happens as the RplA-GFP signal decreases at midcell in Figure 1- is the signal then increasing in the less "dense" parts of the cell? That is, (a) are the polysomes at midcell redistributing throughout the cell? (b) is the total concentration of polysomes in the entire cell increasing over time?

      It is a redistribution—the RplA-GFP signal remains constant in concentration from cell birth to division (Figure 1 – Figure Supplement 1E). This is now clarified in the revised text.

      (6) Line 154. "Cell constriction contributed to the apparent depletion of ribosomal signal from the mid-cell region at the end of the cell division cycle (Figure 1B-C and Movie S1)" - It would be helpful if when cell constriction began and ended was indicated in Figures 1B and C.

      Good idea. We have added markers in Figure 1C to indicate the average start of cell constriction. This relative time from birth to division was estimated as described in the new Figure 1 – figure supplement 2. We have also indicated that cell birth and division correspond to the first and last images/timepoint in Figure 1B and C, respectively. The two-imensional average cell projections presented in Figure 3D also indicate the average timing of cell constriction, consistent with our analysis in Figure 1 – figure supplement 2.

      (7) In Figure 7 they demonstrate that radial confinement is needed for longitudinal nucleoid segregation. It should be noted (and cited) that past experiments of Bacillus l-forms in microfluidic channels showed a clear requirement role for rod shape (and a given width) in the positing and the spacing of the nucleoids.

      Wu et al, Nature Communications, 2020. "Geometric principles underlying the proliferation of a model cell system" https://dx.doi.org/10.1038/s41467-020-17988-7

      Good point! We have revised the text to mention this work. Thank you.

      (8) "The correlated variability in polysome and nucleoid patterning across cells suggests that the size of the polysome-depleted spaces helps determine where the chromosomal DNA is most concentrated along the cell length. This patterning is likely reinforced through the displacement of the polysomes away from the DNA dense region"

      It should be noted this likely functions not just in one direction (polysomes dictating DNA location), but also in the reverse - as the footprint of compacted DNA should also exclude (and thus affect) the location of polysomes

      We agree that the effects could go both ways at this early stage of the story. We have revised the text accordingly.

      (9) Line 159. Rifampicin is a transcription inhibitor that causes polysome depletion over time. This indicates that all ribosomal enrichments consist of polysomes and therefore will be referred to as polysome accumulations hereafter". Here and throughout this paper they use the term polysome, but cells also have monosomes (and 2 somes, etc). Rifampicin stops the assembly of all of these, and thus the loss of localization could occur from both. Thus, is it accurate to state that all transcription events occur in polysomes? Or are they grouping all of the n-somes into one group?

      In the original discussion, we noted that our term “polysomes” also includes monosomes for simplicity, but we agree that the term should have been defined much earlier. The manuscript has been revised accordingly. Furthermore, in the revised manuscript, we have included additional simulation results with three different diffusion coefficients that reflect different polysome sizes to show that different polysome species with less or more ribosomes give similar results (Figure 4 – figure supplement 4). This shows that the average polysome description in our model is sufficient.

      Thank you for the valuable comments and suggestions!

      Reviewer #2 (Public review):

      Summary:

      The authors perform a remarkably comprehensive, rigorous, and extensive investigation into the spatiotemporal dynamics between ribosomal accumulation, nucleoid segregation, and cell division. Using detailed experimental characterization and rigorous physical models, they offer a compelling argument that nucleoid segregation rates are determined at least in part by the accumulation of ribosomes in the center of the cell, exerting a steric force to drive nucleoid segregation prior to cell division. This evolutionarily ingenious mechanism means cells can rely on ribosomal biogenesis as the sole determinant for the growth rate and cell division rate, avoiding the need for two separate 'sensors,' which would require careful coupling.

      Terrific summary! Thank you for your positive assessment.

      Strengths:

      In terms of strengths; the paper is very well written, the data are of extremely high quality, and the work is of fundamental importance to the field of cell growth and division. This is an important and innovative discovery enabled through a combination of rigorous experimental work and innovative conceptual, statistical, and physical modeling.

      Thank you!

      Weaknesses:

      In terms of weaknesses, I have three specific thoughts.

      Firstly, my biggest question (and this may or may not be a bona fide weakness) is how unambiguously the authors can be sure their ribosomal labeling is reporting on polysomes, specifically. My reading of the work is that the loss of spatial density upon rifampicin treatment is used to infer that spatial density corresponds to polysomes, yet this feels like a relatively indirect way to get at this question, given rifampicin targets RNA polymerase and not translation. It would be good if a more direct way to confirm polysome dependence were possible.

      The heterogeneity of ribosome distribution inside E. coli cells has been attributed to polysomes by many labs (PMID: 25056965, 38678067, 22624875, 31150626, 34186018, 10675340). The attribution is also consistent with single-molecule tracking experiments showing that slow-moving ribosomes (polysomes) are excluded by the nucleoid whereas fast-diffusing ribosomes (free ribosomal subunits) are distributed throughout the cytoplasm (PMID: 25056965, 22624875). These points are now mentioned in the revised manuscript.

      Second, the authors invoke a phase separation model to explain the data, yet it is unclear whether there is any particular evidence supporting such a model, whether they can exclude simpler models of entanglement/local diffusion (and/or perhaps this is what is meant by phase separation?) and it's not clear if claiming phase separation offers any additional insight/predictive power/utility. I am OK with this being proposed as a hypothesis/idea/working model, and I agree the model is consistent with the data, BUT I also feel other models are consistent with the data. I also very much do not think that this specific aspect of the paper has any bearing on the paper's impact and importance.

      We appreciate the reviewer’s comment, but the output of our reaction-diffusion model is a bona fide phase separation (spinodal decomposition). So, we feel that we need to use the term when reporting the modeling results. Inside the cell, the situation is more complicated. As the reviewer points out, there are likely entanglements (not considered in our model) and other important factors (please see our discussion on the model limitations). This said, we have revised our text to clarify our terms and proposed mechanism.

      Finally, the writing and the figures are of extremely high quality, but the sheer volume of data here is potentially overwhelming. I wonder if there is any way for the authors to consider stripping down the text/figures to streamline things a bit? I also think it would be useful to include visually consistent schematics of the question/hypothesis/idea each of the figures is addressing to help keep readers on the same page as to what is going on in each figure. Again, there was no figure or section I felt was particularly unclear, but the sheer volume of text/data made reading this quite the mental endurance sport! I am completely guilty of this myself, so I don't think I have any super strong suggestions for how to fix this, but just something to consider.

      We agree that there is a lot to digest. We could not come up with great ideas for visuals others than the schematics we already provide. However, we have revised the text to clarify our points and added a simulation result (Figure 4A) to help explain biophysical concepts.

      Reviewer #3 (Public review):

      Summary:

      Papagiannakis et al. present a detailed study exploring the relationship between DNA/polysome phase separation and nucleoid segregation in Escherichia coli. Using a combination of experiments and modelling, the authors aim to link physical principles with biological processes to better understand nucleoid organisation and segregation during cell growth.

      Strengths:

      The authors have conducted a large number of experiments under different growth conditions and physiological perturbations (using antibiotics) to analyse the biophysical factors underlying the spatial organisation of nucleoids within growing E. coli cells. A simple model of ribosome-nucleoid segregation has been developed to explain the observations.

      Weaknesses:

      While the study addresses an important topic, several aspects of the modelling, assumptions, and claims warrant further consideration.

      Thank you for your feedback. Please see below for a response to each concern.

      Major Concerns:

      Oversimplification of Modelling Assumptions:

      The model simplifies nucleoid organisation by focusing on the axial (long-axis) dimension of the cell while neglecting the radial dimension (cell width). While this approach simplifies the model, it fails to explain key experimental observations, such as:

      (1) Inconsistencies with Experimental Evidence:

      The simplified model presented in this study predicts that translation-inhibiting drugs like chloramphenicol would maintain separated nucleoids due to increased polysome fractions. However, experimental evidence shows the opposite-separated nucleoids condense into a single lobe post-treatment (Bakshi et al 2014), indicating limitations in the model's assumptions/predictions. For the nucleoids to coalesce into a single lobe, polysomes must cross the nucleoid zones via the radial shells around the nucleoid lobes.

      We do not think that the results from chloramphenicol-treated cells are inconsistent with our model. Our proposed mechanism predicts that nucleoids will condense in the presence of chloramphenicol, consistent with experiments. It also predicts that nucleoids that were still relatively close at the time of chloramphenicol treatment could fuse if they eventually touched through diffusion (thermal fluctuation) to reduce their interaction with the polysomes and minimize their conformational energy. Fusion is, however, not expected for well-separated nucleoids since their diffusion is slow in the crowded cytoplasm. This is consistent with our experimental observations: In the presence of a growth-inhibitory concentration of chloramphenicol (70 μg/mL), nucleoids in relatively close proximity can fuse, but well-separated nucleoids condense and do not fuse. Since the growth rate inhibition is not immediate upon chloramphenicol treatment, many cells with well-separated condensed nucleoids divide during the first hour. As a result, the non-fusion phenotype is more obvious in non-dividing cells, achieved by pre-treating cells with the cell division inhibitor cephalexin (50μg/mL). In these polyploid elongated cells, well-separated nucleoids condensed but did not fuse, not even after an hour in the presence of chloramphenicol. We have revised the manuscript to add these data (illustrative images + a quantitative analysis) in Figure 4 – figure supplement 1.

      (2) The peripheral localisation of nucleoids observed after A22 treatment in this study and others (e.g., Japaridze et al., 2020; Wu et al., 2019), which conflicts with the model's assumptions and predictions. The assumption of radial confinement would predict nucleoids to fill up the volume or ribosomes to go near the cell wall, not the nucleoid, as seen in the data.

      The reviewer makes a good point that DNA attachment to the membrane through transertion could contribute to the nucleoid being peripherally localized in A22 cells. We have revised the text to add this point. However, we do not think that this contradicts the proposed nucleoid segregation mechanism described in our model. On the contrary, by attaching the nucleoid to the cytoplasmic membrane along the cell width, transertion might help reduce the diffusion and thus exchange of polysomes across nucleoids. We have revised the text to discuss transertion over radial confinement.

      (3) The radial compaction of the nucleoid upon rifampicin or chloramphenicol treatment, as reported by Bakshi et al. (2014) and Spahn et al. (2023), also contradicts the model's predictions. This is not expected if the nucleoid is already radially confined.

      We originally evoked radial confinement to explain the observation that polysome accumulations do not equilibrate between DNA-free regions. We agree that transertion is an alternative explanation. Thank you for bringing it to our attention. However, please note that this does not contradict the model. In our view, it actually supports the 1D model by providing a reasonable explanation for the slow exchange of polysomes across DNA-free regions. The attachment of the nucleoid to the membrane along the cell width may act as diffusion barrier. We have revised the text and the title of the manuscript accordingly.

      (4) Radial Distribution of Nucleoid and Ribosomal Shell:

      The study does not account for well-documented features such as the membrane attachment of chromosomes and the ribosomal shell surrounding the nucleoid, observed in super-resolution studies (Bakshi et al., 2012; Sanamrad et al., 2014). These features are critical for understanding nucleoid dynamics, particularly under conditions of transcription-translation coupling or drug-induced detachment. Work by Yongren et al. (2014) has also shown that the radial organisation of the nucleoid is highly sensitive to growth and the multifork nature of DNA replication in bacteria.

      We have revised the manuscript to discuss the membrane attachment. Please see the previous response.

      The omission of organisation in the radial dimension and the entropic effects it entails, such as ribosome localisation near the membrane and nucleoid centralisation in expanded cells, undermines the model's explanatory power and predictive ability. Some observations have been previously explained by the membrane attachment of nucleoids (a hypothesis proposed by Rabinovitch et al., 2003, and supported by experiments from Bakshi et al., 2014, and recent super-resolution measurements by Spahn et al.).

      We agree—we have revised the text to discuss membrane attachment in the radial dimension. See previous responses.

      Ignoring the radial dimension and membrane attachment of nucleoid (which might coordinate cell growth with nucleoid expansion and segregation) presents a simplistic but potentially misleading picture of the underlying factors.

      Please see above.

      This reviewer suggests that the authors consider an alternative mechanism, supported by strong experimental evidence, as a potential explanation for the observed phenomena:

      Nucleoids may transiently attach to the cell membrane, possibly through transertion, allowing for coordinated increases in nucleoid volume and length alongside cell growth and DNA replication. Polysomes likely occupy cellular spaces devoid of the nucleoid, contributing to nucleoid compaction due to mutual exclusion effects. After the nucleoids separate following ter separation, axial expansion of the cell membrane could lead to their spatial separation.

      This “membrane attachment/cell elongation” model is reminiscent to the hypothesis proposed by Jacob et al in 1963 (doi:10.1101/SQB.1963.028.01.048). There are several lines of evidence arguing against it as the major driver of nucleoid segregation:

      (Below is a slightly modified version of our response to a comment from Reviewer 1—see page 3)

      (1) For this alternative model to work, axial membrane expansion (i.e., cell elongation) would have to be localized at the middle of the splitting nucleoids (i.e., midcell position for slow growth and ¼ and ¾ cell positions for fast growth) to create a directional motion. To our knowledge, there is no evidence of such localized membrane incorporation. Furthermore, even if membrane growth was localized at the right places, the fluidity of the cytoplasmic membrane (PMID: 6996724, 20159151, 24735432, 27705775) would be problematic. To go around this fluidity issue, one could potentially evoke a potential connection to the rigid peptidoglycan, but then again, peptidoglycan growth would have to be localized at the middle of the splitting nucleoid to “push” the sister nucleoid apart from each other. However, peptidoglycan growth is dispersed prior to cell constriction (PMID: 35705811, 36097171, 2656655).

      (2) Even if we ignore the aforementioned caveats, Paul Wiggins’s group ruled out the cell elongation/transertion model by showing that the rate of cell elongation is slower than the rate of chromosome segregation (PMID: 23775792). In the revised manuscript, we confirm that the cell elongation rate is indeed overall slower than the nucleoid segregation rate (see Figure 1 - figure supplement 5A where the subtraction of the cell elongation rate to the nucleoid segregation rate at the single-cell level leads to positive values).

      (3) Furthermore, our correlation analysis comparing the rate of nucleoid segregation to the rate of either cell elongation or polysome accumulation argues that polysome accumulation plays a larger role than cell elongation in nucleoid segregation. These data were already shown in the original manuscript (Figure 1I and Figure 1 – figure supplement 5B) but were not highlighted in this context. We have revised the text to clarify this point.

      (4) The membrane attachment/cell elongation model does not explain the nucleoid asymmetries described in our paper (Figure 3), whereas they can be recapitulated by our model.

      (5) The cell elongation/transertion model cannot predict the aberrant nucleoid dynamics observed when chromosomal expression is largely redirected to plasmid expression (Figure 7). In the revised manuscript, we have added simulation results showing that these nucleoid dynamics are predicted by our model (Figure 7 – figure supplement 2).

      Based on these arguments, we do not believe that a mechanism based on membrane attachment and cell elongation is the major driver of nucleoid segregations. However, we do believe that it may play a complementary role (see “Nucleoid segregation likely involves multiple factors” in the Discussion). We have revised the text to clarify our thoughts and mention the potential role of transertion.

      Incorporating this perspective into the discussion or future iterations of the model may provide a more comprehensive framework that aligns with the experimental observations in this study and previous work.

      As noted above, we have revised the text to mention transertion.

      Simplification of Ribosome States:

      Combining monomeric and translating ribosomes into a single 'polysome' category may overlook spatial variations in these states, particularly during ribosome accumulation at the mid-cell. Without validating uniform mRNA distribution or conducting experimental controls such as FRAP or single-molecule measurements to estimate the proportions of ribosome states based on diffusion, this assumption remains speculative.

      Indeed, for simplicity, we adopt an average description of all polysomes with an average diffusion coefficient and interaction parameters, which is sufficient for capturing the fundamental mechanism underlying nucleoid segregation. To illustrate that considering multiple polysome species does not change the physical picture, we have considered an extension of our model, which contains three polysome species, each with a different diffusion coefficient (D<sub>P</sub> = 0.018, 0.023, or 0.028 μm<sup>2</sup>/s), reflecting that polysomes with more ribosomes will have a lower diffusion coefficient. Simulation of this model reveals that the different polysome species have essentially the same concentration distribution, suggesting that the average description in our minimal model is sufficient for our purposes. We present these new simulation results in Figure 4 – figure supplement 4 of the revised manuscript.

      Recommendations for the authors:

      Reviewer #1 (Recommendations for the authors):

      (1) Does the polysome density correlate with the origins? If the majority of ribosomal genes are expressed near the origins,

      This is indeed an interesting point that we mention in the discussion. The fact that the chromosomal origin is surrounded by highly expressed genes (PMID: 30904377) and is located near the middle of the nucleoid prior to DNA replication (PMID: 15960977, 27332118, 34385314, 37980336) can only help the model that we propose by increasing the polysome density at the mid-nucleoid position.

      (2) Red lines in 3C are hard to resolve - can the authors make them darker?

      Absolutely. Sorry about that.

      Reviewer #2 (Recommendations for the authors):

      The authors use rifampicin treatment as a mechanism to trigger polysome disassembly and show this leads to homogenous RplA distribution. This is a really important experiment as it is used to link RplA localization to polysomes, and tp argue that RplA density is reporting on polysomes. Given rifampicin inhibits RNA polymerase, and given the only reference of the three linking rifampicin to polysome disassembly is the 1971 Blundell and Wild ref), it would perhaps be useful to more conclusively show that polysome depletion (as opposed to inhibition of mRNA synthesis, which is upstream of polysome assembly) by using an alternative compound more commonly linked to polysome disassembly (e.g., puromycin) and show timelapse loss of density as a function of treatment time. This is not a required experiment, but given the idea that RplA density reports on polysomes is central to the authors' interpretation, it feels like this would be a thing worth being certain of. An alternative model is that ribosomes undergo self-assembly into local storage depots when not being used, but those depots are not translationally active/lack polysomes. I don't know if I think this is likely, but I'm not convinced the rifampicin treatment + waiting for a relatively long period of time unambiguously excludes other possible mechanisms given the large scale remodeling of the intracellular environment upon mRNA inhibition. I 100% buy the relationship between ribosomal distribution and nucleoid segregation (and the ectopic expression experiments are amazing in this regard), so my own pause for thought here is "do we know those ribosomes are in polysomes in the ribosome-dense regions". I'm not sure the answer to this question has any bearing on the impact and importance of this work (in my mind, it doesn't, but perhaps there's a reason it does?). The way to unambiguously show this would really be to do CryoET and show polysomes in the dense ribosomal regions, but I would never suggest the authors do that here (that's an entire other paper!).

      We agree that mRNAs play a role, as mRNAs are major components of polysomes and most mRNAs are expected to be in the form of polysomes (i.e., in complex with ribosomes). In addition, as mentioned above, the enrichments of ribosome distribution are known to be associated with polysomes (PMID: 25056965, 38678067, 22624875, 31150626, 34186018, 10675340). The attribution is consistent with single-molecule tracking experiments showing that slow-moving ribosomes (polysomes) are excluded by the nucleoid whereas fast-diffusing ribosomes (free ribosomal subunits) are distributed throughout the cytoplasm (PMID: 25056965, 22624875). This is also consistent with cryo-ET results that we actually published (see Figure S5, PMID: 34186018). We have added this information to the revised manuscript. Thank you for alerting us of this oversight.

      On line 320 the authors state "Our single-cell studies provided experimental support that phase separation between polysomes and DNA contributes to nucleoid segregation." - this comes pretty out of left field? I didn't see any discussion of this hypothesis leading up to this sentence, nor is there evidence I can see that necessitates phase separation as a mechanistic explanation unless we are simply using phase separation to mean cellular regions with distinct cellular properties (which I would advise against). If the authors really want to pursue this model I think much more support needs to be provided here, including (1) defining what the different phases are, (2) providing explicit description of what the attractive/repulsive determinants of these different phases could be/are, and (3) ruling out a model where the behavior observed is driven by a combination of DNA / polysome entanglement + steric exclusion; if this is actually the model, then being much more explicit about this being a locally arrested percolation phenomenon would be essential. Overall, however, I would probably dissuade the authors from pursuing the specific underlying physics of what drives the effects they're seeing in a Results section, solely because I think ruling in/out a model unambiguously is very difficult. Instead, this would be a useful topic for a Discussion, especially couched under a "our data are consistent with..." if they cannot exclude other models (which I think is unreasonably difficult to do).

      Thank you for your advice. We have revised the text to more carefully choose our words and define our terms.

      Minor comments:

      The results in "Cell elongation may also contribute to sister nucleoid migration near the end of the division cycle" are really interesting, but this section is one big paragraph, and I might encourage the authors to divide this paragraph up to help the reader parse this complex (and fascinating) set of results!

      We have revised this section to hopefully make it more accessible.

      Reviewer #3 (Recommendations for the authors):

      Technical Controls:

      The authors should conduct a photobleaching control to confirm that the perceived 'higher' brightness of new ribosomes at the mid-cell position is not an artefact caused by older ribosomes being photobleached during the imaging process. Comparing results at various imaging frequencies and intensities is necessary to address this issue.

      The ribosome localization data across 30 nutrient conditions (Figure 2, Figure 1 – figure supplement 6, Figure 2 – Figure supplement 1, Figure 2 – Figure supplement 3 and Figure 5) are from snapshot images, which do not have any photobleaching issue. They confirm the mid-cell accumulation seen by time-lapse microscopy. We have revised the text to clarify this point.

      Novelty of Experimental Measurements:

      While the scale of the study is unprecedented, claims of novelty (e.g., line 142) regarding ribosome-nucleoid segregation tracking are overstated. Similar observations have been made previously (e.g., Bakshi et al., 2012; Bakshi et al., 2014; Chai et al., 2014).

      Our apologies. The text in line 142 oversimplified our rationale. This has been corrected in the revised manuscript.

    1. Public Reviews:

      Reviewer #1 (Public Review):

      Summary:

      This manuscript reports experiments designed to dissect the function of N-cadherin during mammalian folliculogenesis, using the mouse as a model system. Prior studies have shown that this is the principal cadherin expressed by the follicular granulosa cells. Two main strategies are used - small-molecule inhibitors that target N-cadherin and a conditional knockout where the gene encoding N-cad is deleted in granulosa cells. The authors also take advantage of the ability to reproduce key events of folliculogenesis, such as oocyte meiotic maturation, in vitro. Four main conclusions are drawn from the studies: (i) cadherin-based cell contact is required to maintain cadherin (N-cad in the granulosa cells; E-cad in the oocyte) at the plasma membrane; (ii) N-cad is required for cumulus layer expansion; (iii) N-cad is required for meiotic maturation of the oocyte; (iv) N-cad is required for ovulation.

      Strengths:

      The experiments are logically conceived, clearly described and presented, and carefully interpreted. A key strength of the paper is that multiple approaches have been used (drugs, knockouts, immunofluorescence, PLA, in vitro and in vivo studies). Taken together, they clearly establish essential roles for N-cadherin during folliculogenesis.

      It is intriguing that, when cadherin activity is impaired, the cadherins are lost from the plasma membrane. This suggests that, in a multicellular context, interactions with other cadherins, either in cis within the same cell or in trans with a neighboring cell, are required to maintain cadherins at the membrane. Hence, beyond their significance for understanding female reproductive biology, these experiments have broader implications for cell biology.

      Weaknesses:

      A few points could be considered or clarified by the authors:

      The YAP experiments were confusing to the reviewer. CRS-066 increased YAP activity, as indicated by increased expression of target genes. Since CRS-066 prevents expansion, this result suggests that YAP antagonizes expansion. Therefore, blocking YAP should favor expansion. Yet, the YAP inhibitor impaired expansion. In the reviewer's eyes, these results seem to be contradictory.

      The mechanism through which N-cadherin inhibitors block cumulus expansion isn’t fully elucidated but isn’t deemed to be through YAP alone. The transcriptional changes indicate crosstalk between N-cadherin, β-catenin and Hippo/YAP pathways, as well as impacting on the signalling between cumulus cells and the oocyte.

      It is intriguing that the inhibitors were able to efficiently block oocyte maturation. Oocytes from which the cumulus granulosa cells have been removed (denuded) will mature in vitro in the absence of LH or EGF. Since the effect of the inhibitors is to break the contact between the cumulus cells and oocyte, one might have predicted that this would not impair the ability of the oocytes to mature. Perhaps the authors could comment on this.

      Indeed, removal of cumulus cells permits oocyte meiotic maturation by reducing oocyte cAMP, leading to activation of meiosis promoting factor (MPF). A hypothesis would be that cyclic nucleotides and MPF arrest in the oocyte are maintained when N-cadherin contacts are blocked but this was not determined.

      Regarding the experiments where the inhibitors were administered intra-peritoneally, the authors might comment on the rationale for choosing the doses that were used. An additional point to consider is that, since N-cadherin is expressed in a variety of tissues, an effect of interfering with N-cadherin at these non-ovarian sites could indirectly influence ovarian function.

      Doses were chosen based on previous reported use of these inhibitors in vivo (Mrozik et al. 2020). Possible effects of the N-cadherin antagonists in other tissues was a carefully considered in this and the previous Mrozik et al study. While we saw no evidence of effects in gross morphological observations, or closer examination of vasculature or blood in these studies, this potential is not excluded.

      Reviewer #2 (Public Review):

      Summary:

      The manuscript entitled "N-cadherin mechanosensing in ovarian follicles controls oocyte maturation and ovulation" aimed to investigate the role of N-cadherin in different ovarian physiological processes, including cumulus oocyte expansion, oocyte maturation, and ovulation. The authors performed several in vitro and in vivo mice experiments, using diverse techniques to reinforce their results.

      First, they identified two compounds (N-cadherin antagonists) that block the adhesion of periovulatory COCs to fibronectin through screening a small molecule library, using the xCELLigenceTM system, performing proper and complementary controls. Second, the authors showed the presence of N-cadherin adherens junctions between granulosa cells and cumulus cells and at the interface of cumulus cell transzonal projections and the oocyte throughout folliculogenesis. And that these adherens complexes between cumulus cells and oocytes were disrupted when inhibited N-cadherin, as observed by nice representative confocal images. Then, the authors assessed COC expansion and oocyte meiotic maturation to determine whether the loss of oocyte membrane β-catenin and E-cadherin upon N-cadherin inhibitor treatment disrupts the bi-directional communication between cumulus cells and the oocyte. Indeed, N-cadherin antagonists disrupted both processes (cumulus expansion and oocyte meiotic). However, the expression of known mediators of COC expansion (E.g., Areg and Ptgs2) were either increased or unaffected. Nevertheless, RNA-Seq showed consistent effects on cell signaling mRNA genes by the antagonist CRS-066.

      In vivo studies using mice were also achieved using stimulated protocols (together with one of the antagonists or vehicle) or granulosa-specific Cdh2 Knockouts to further analyze the role of N-cadherin. N-cadherin antagonist CRS-066 (but not LCRF-0006) significantly reduced mouse ovulation compared to controls. RNA-sequencing data analysis identified distinct gene expression profiles in CRS-066 treated compared to control ovaries. Ovulation in CdhFl/FL; Amhr2Cre mice after stimulation were also significantly reduced; multiple large unruptured follicles were observed in these granulosa-specific Cdh2 mutant ovaries, and the mRNA expression of Areg and Ptgs2 were reduced.

      The authors conclude that their study identified N-cadherin as a mechanosensory regulator important in ovarian granulosa cell differentiation able to respond to hormone stimuli both in vivo and in vitro, demonstrating a critical role for N-cadherin in ovarian follicular development and ovulation. They highlighted the potential to inhibit ovulation by targeting this signaling mechanism.

      Strengths:

      This remarkable manuscript is very well designed, performed, and discussed. The authors analyzed different aspects, and their data supports their conclusions.

      Weaknesses:

      This study was performed using the mouse as a research model; further studies in larger animals and humans would be interesting and warranted.

      Indeed, this would be interesting. Ongoing research into therapeutic applications of N-cadherin targeting is reviewed in Blaschuk OW. Front Cell Dev Biol. 2022 Mar 3;10:866200

      Minor comments:

      Some results are intriguing. While the AREG y PTGS2 mRNA increased within the COC in vitro by the N-cadherin antagonists, in vivo, the treatment induced a significant increase in both genes when analyzing the whole ovary. What are the authors' ideas that could explain these discrepancies in outcomes?

      Comparing the responses in IVM COCs to in vivo whole ovaries carries multiple caveats, though as noted, the observations are consistent with altered mechanotransduction in each case. It is important to note the change in pre-ovulatory follicle gene expression in vivo, which likely affects the response of follicles to ovulatory stimulus.

      The authors stated that the ovaries from mice treated in the same manner and collected either before hCG treatment (eCG 44 h) or 11 h after hCG showed equivalent numbers of follicles at each stage of development from primary to antral. However, in Panel l from Figure 5, there is a significant increase in the number of antral follicles in the CRS-066 group (hCG 11 h) compared to the vehicle. Could the author discuss it in the manuscript?

      A small change in these follicle types was significant in hCG 11h treated mice and is consistent with the altered response to the ovulatory stimulus and reduced ovulation resulting in persistent antral follicles.

      Recommendations For The Authors:

      Reviewer #1 (Recommendations For The Authors):

      Is the mechanism by which the small molecules block N-cad's adhesive activity known? And is the stable residence of cadherins in the plasma membrane known to depend on their engagement with other cadherins either in cis or in trans?

      Adhesion interactions between N-cadherin in Cis or Trans results in their clustering and enrichment at the membrane. Molecular docking models of the small molecule N-cadherin inhibitors are not available. However, these inhibitors were designed as peptidomimetics of the N-cadherin amino-terminus that is shown to interacts in Trans with N-cadherin on neighbouring cells (Blaschuk OW. Front Cell Dev Biol. 2022 Mar 3;10:866200).

      Since the inhibitors are blocking cadherin activity, one might have expected the cumulus cell mass to disaggregate into individual cells. Yet, Figures 3a and 3c show that this does not happen. Could the authors speculate how the cells are being held together?

    1. Author Response

      We appreciate the insightful feedback provided by the editors and reviewers who have recognized the novelty of our study. We have mapped the spatial distribution of six endogenous somatic histone H1 variants within the nuclei of several human cell lines using specific antibodies, which strongly suggest functional differences between variants. We will submit a reviewed version of the manuscript to accommodate the reviewers comments.

      To answer the reviewers comments at this stage:

      1. We do have investigated co-localization of H1 variants with HP1 proteins and we are eager to add some of this data in a revised version of this manuscript.

      2. Respect to the functional significance of the results presented here, we want to stress that as a consequence of the differential distribution and abundance of H1 variants among cell types, depletion of different variants has different consequences. For example, H1.2 depletion but not others has a great impact on chromatin compaction. Besides, cell lines lacking H1.3/H1.5 expression present a basal up-regulation of some Interferon stimulated genes (ISGs) and particular repetive elements, as it was previously described upon induced depletion of H1.2/H1.4 in a breast cancer cell line or in pancreatic adenocarcinomas with lower levels of replication-dependent H1 variants (Izquierdo et al. 2017 NAR 45:11622). So, our results reinforce the existing link between H1 content and immune signature. We are eager to add this data in a revised version of this manuscript. Moreover, we also analyzed the chromatin structural changes upon combined depletion of H1.2 and H1.4. Combined H1.2/H1.4 depletion triggers a global chromatin decompaction, which supports previous observations from ATAC-Seq and Hi-C experiments in these cells (Izquierdo et al. 2017 NAR 45:11622; Serna-Pujol et al. 2022 NAR 50:3892). Although H1 content is more compromised in these cells (30% total H1 reduction) compared to single H1 KDs, the phenotype observed could not be recapitulated when other H1 KD combinations, in which total H1 content was reduced similarly, were investigated (Izquierdo et al. 2017 NAR 45:11622), supporting that the deleterious defects were due to the non-redundant role of H1.2 and H1.4 proteins. Indeed, this manuscript supports this notion, as H1.2 and H1.4 show a different genome-wide and nuclear distribution.

      3. We totally agree with the reviewers that the use of commercially available antibodies does not guarantee their quality and specificity. As this issue was crucial for our studies, we extensively assayed performance and specificity of the antibodies, using different approaches. The validations were shown in our previous publications where these antibodies where successfully used for ChIP-seq (Serna et al. 2022 NAR 50:3892; Salinas-Pena et al, under revision). In summary, performance of H1.0 (05-629l, Millipore), H1.2 (ab4086, abcam), H1.4 (702876; Invitrogen), H1.5 (711912, Invitrogen) and H1X (ab31972; abcam) antibodies was tested by Western-Blot, ChIP and proteomic analyses (all the results are included in Supplementary Figure 1 in Serna et al. 2022 NAR 50:3892). Concretely, we tested specificity using inducible KDs for the depletion of each of the somatic H1 variants in T47D. We also checked that the antibodies did not recognize additional H1 variants using recombinant proteins or cell lines naturally lacking some of the variants. All the experiments confirmed that antibodies were variant-specific. In addition, when the corresponding epitope was absent, the antibodies did not gain new cross-reactivity with other variants. More recently, validation of the specificicity of the H1.3 antibody (ab203948) was performed following the same experimental approaches described for the rest of antibodies (Salinas-Pena et al, under revision).

      4. Our immunofluorescence data, together with ChIP-seq data, do not discard binding of H1 variants to a great variety of chromatin, but show enrichment or preferential binding to certain regions or chromatin types. Our data on the interphase nuclei does not suggest at all any type of quenching or saturation. Obviously, detection with antibodies depends on epitope accessibility, just like all immunofluorescence data ever published, and we have acknowledged that post-translational modifications of H1 may occlude antibody accessibility as some phospho-H1 antibodies give distribution patterns different than total/unmodified H1 antibodies. Thus, we cannot exclude that specific modified-H1s exhibit particular distribution patterns that are not being recapitulated in our data. This represents another layer of complexity in H1 diversity and we agree that exploration of the repertoire of H1 PTMs and their functional roles are an interesting matter of study that needs to be addressed. Still, our data is highly relevant as it demonstrates for the first time the unique distribution patterns of H1 variants among multiple cell lines and it does not use overexpression of tagged H1 variants that in our experience produces mislocalization of H1s.

      5. We will further explain how the relative quantification of H1 variants in different cell lines was performed if not clear enough. We agree that more sophisticated mass spectrometry-based quantification is desirable and we are collaborating to do this using internal H1 peptide controls, but this is out of the scope of this manuscript as the observed patterns of distribution of H1 variants do not depend on mild differences in variants abundance. Only the absence of H1.3 and H1.5 in some cell lines alters the distribution of other variants.

      6. We have also studied the spatial distribution of H1 variants in non-tumorogenic cell lines and we are eager to add this in a revised version of the manuscript.

    1. Author Response

      The following is the authors’ response to the original reviews.

      Reviewer 1:

      Public review:

      In this study, Porter et al report on outcomes from a small, open-label, pilot randomized clinical trial comparing dornase-alfa to the best available care in patients hospitalized with COVID-19 pneumonia. As the number of randomized participants is small, investigators describe also a contemporary cohort of controls and the study concludes about a decrease of inflammation (reflected by CRP levels) aJer 7 days of treatment but no other statistically significant clinical benefit.

      Suggestions to the authors:

      • The RCT does not follow CONSORT statement and reporting guidelines

      We thank you for this suggestion and have now amended the order and content of the manuscript to follow the CONSORT statement as closely as possible.

      • The authors have chosen a primary outcome that cannot be at least considered as clinically relevant or interesting. AJer 3 years of the pandemic with so much research, why investigate if a drug reduces CRP levels as we already have marketed drugs that provide beneficial clinical outcomes such as dexamethasone, anakinra, tocilizumab and baricitinib.

      We thank the reviewer for bringing up this central topic. The answer to this question has both a historical and practical component. This trial was initiated in June of 2020 and was completed in June of 2021. At that time there were no known treatments for the severe immune pathology of COVID19 pneumonia. In June 2020, dexamethasone data came out and we incorporated dexamethasone into the study design. It took much longer for all other anti-inflammatories to be tested. Hence, our decision to trial an approved endonuclease was based purely on basic science work on the pathogenic role of cell-free chromatin and NETs in murine sepsis and flu models and the ability of DNase I to clear them and reduce pathology in these animal models. In addition, evidence for the presence of cell-free chromatin components in COVID-19 patient plasma had already been communicated in a pre-print. Finally, several studies had reported the anti-inflammatory effects of dornase treatment in CF patients. Hence there was a strong case for a cheap, safe, pulmonary noninvasive treatment that could be self-administered outside the clinical se]ng.

      The Identification of novel/repurposed treatments effective for COVID-19 were hampered by patient recruitment to competing studies during a pandemic. This resulted in small studies with inconclusive or contrary findings. In general, effective treatments were only picked up in very large RCTs. For example, demonstrating dexamethasone as effective in COVID-19 required recruitment of 6,425 patients into the RECOVERY study. Multiple trials with anti-IL-6 gave conflicting evidence until RECOVERY recruited 4116 adults with COVID-19 (n=2022, tocilizumab and 2094, control) similar for Baracitinib (4,148 randomised to treatment and 4,008 to standard care). Anakinra is approved for patients with elevated suPAR, based on data from one randomized clinical trial of 594 patients, of whom 405 had active treatment (PMID: 34625750). However, a systematic review analysing over 1,627 patients (anakinra 888, control 739) with COVID-19 showed no benefit (PMID: 36841793). Regarding the choice of the primary endpoint, there is a wealth of clinical evidence to support the relevance of CRP as a prognostic marker for COVID-19 pneumonia patients and it is a standard diagnostic and prognostic clinical parameter in infectious disease wards. This choice in March 2020 was supported by evidence of the prognostic value of IL-6; CRP is a surrogate of IL-6. We also provide our own data from a large study of severe COVID-19 pneumonia in figure 1, showing how well CRP correlates with survival.

      In summary, our data suggest that Dornase yields an anti-inflammatory effect that is comparable or potentially superior to cytokine-blocking monotherapies at a fraction of the cost and potentially without the additional adverse effects such as the increase for co-infections.

      We now provide additional justification on these points in the introduction on pg.4 as follows:

      “The trial was ini.ated in June 2020 and was completed in September of 2021. At the start of the trial only dexamethasone had been proven to benefit hospitalized COVID-19 pneumonia pa.ents and was thus included in both arms of the trial. To increase the chance of reaching significance under challenging constraints in pa.ent access, we opted to increase our sample size by using a combina.on of randomized individuals and available CRP data from matched contemporary controls (CC) hospitalized at UCL but not recruited to a trial. These approaches demonstrated that when combined with dexamethasone, nebulized DNase treatment was an effec.ve an.-inflammatory treatment in randomized individuals with or without the implementa.on of CC data.”

      We also added the following explanation in the discussion on pg. 16:

      “Our study design offered a solution to the early screening of compounds for inclusion in larger platform trials. The study took advantage of frequent repeated measures of quantifiable CRP in each patient, to allow a smaller sample size to determine efficacy/futility than if powered on clinical outcomes. We applied a CRP-based approach that was similar to the CATALYST and ATTRACT studies. CATALYST showed in much smaller groups (usual care, 54, namilumab, 57 and infliximab, 35) that namilumab that is an antibody that blocks the cytokine GM-CSF reduced CRP even in participants treated with dexamethasone whereas infliximab that targets TNF-α had no significant effect on CRP. This led to a suggestion that namilumab should be considered as an agent to be prioritised for further investigation in the RECOVERY trial. A direct comparison of our results with CATALYST is difficult due to the different nature of the modelling employed in the two studies. However, in general Dornase alfa exhibited comparable significance in the reduction in CRP compared to standard of care as described for namilumab at a fraction of the cost. Furthermore, endonuclease therapies may prove superior to cytokine blocking monotherapies, as they are unlikely to increase the risk for microbial co-infections that have been reported for antibody therapies that neutralize cytokines that are critical for immune defence such as IL-1β, IL-6 or GM-CSF. “

      • Please provide in Methods the timeframe for the investigation of the primary endpoint

      This information is provided in the analysis on pg. 8:

      “The primary outcome was the least square (LS) mean CRP up to 7 days or at hospital discharge whichever was sooner.”

      • Why day 35 was chosen for the read-out of the endpointt?

      We now state on pg. 8 that “Day 35 was chosen as being likely to include most early mortality due to COVID-19 being 4 weeks after completion of a week of treatment. ( i.e. d7 of treatment +28 (4 x 7 days))”

      • The authors performed an RCT but in parallel chose to compare also controls. They should explain their rationale as this is not usual. I am not very enthusiastic to see mixed results like Figures 2c and 2d.

      We initially aimed at a fully randomized trial. However, the swiJ implementation of trial prioritization strategies towards large and pre-established trial plamorms in the UK made the recruitment COVID19 patients to small studies extremely challenging. Thus, we struggled to gain access to patients. Our power calculations suggested that a mixed trial with randomized and contemporary controls was the best way forward under these restrictions in patient access that could provide sufficient power.

      That being said, we also provide the primary endpoint (CRP) results in Fig. 3B as well as the results for the length of hospitalization (Fig. S3D) for the randomized subjects only.

      • Analysis is performed in mITT; this is a major limitation. The authors should provide at least ITT results. And they should describe in the main manuscript why they chose mITT analysis.

      We apologize if this point was confusing. We performed the analysis on the ITT as defined in our SAP: “The primary analysis population will be all evaluable patients randomised to BAC + dornase alfa or BAC only who have at least one post-baseline CRP measurement, as well as matched historical comparators.”

      We understand that the reason this might be mistaken as an mITT is because the N in the ITT (39) doesn’t match the number randomised and because we had stated on pg. 8 that “ Efficacy assessments of primary and secondary outcomes in the modified inten.on-to-treat popula.on were performed.”

      However, we did randomise 41 participants, but:

      One participant in the DA arm never received treatment. The individual withdrew consent and was replaced. We also have no CRP data for this participant in the database, so they were unevaluable, and we couldn’t include them in the baseline table even if we wanted to. In addition, 1 participant in BAC only had a baseline CRP measurement available. Hence not evaluable as we only have a baseline CRP measurement for this participant.

      We have corrected the confusing statement on pg. 8 and added an additional explanation.

      “Efficacy assessments of primary and secondary outcomes in the inten.on-to-treat (ITT) popula.on were performed on all randomised par.cipants who had received at least one dose of dornase alfa if randomized to treatment. For full details see Sta.s.cal Analysis Plan. The ITT was adjusted to mi.gate the following protocol viola.ons where one par.cipant in the BAC arm and one in the DA arm withdrew before they received treatment and provided only a baseline CRP measurement available. The par.cipant in the DA arm was replaced with an addi.onal recruited pa.ent. Exploratory endpoints were only available in randomised par.cipants and not in the CC. In this case, a post hoc within group analysis was conducted to compare baseline and post-baseline measurements.”

      • It is also not usual to exclude patients from analysis because investigators just do not have serial measurements. This is lost to follow up and investigators should have pre-decided what to do with lost-to-follow-up.

      Our protocol pre-specified that the primary analysis population should have at least one postbaseline CRP measurement (pg. 13 of protocol). The patient that was excluded was one that initially joined the trial but withdrew consent after the first treatment but before the first post-treatment blood sample could be drawn. Hence, the pre-treatment CRP of this patient alone provided no useful information.

      • In Table 1 I would like to see all randomized patients (n=39), which is missing. There are also baseline characteristics that are missing, like which other treatments as BAT received by those patients except for dexamethasone.

      Table 1 includes all 39 patients plus 60 CCs.<br /> Table 2 shows additional treatments given for COVID-19 as part of BAC.

      • In the first paragraph of clinical outcomes, the authors refer to a cohort that is not previously introduced in the manuscript. This is confusing. And I do not understand why this analysis is performed in the context of this RCT although I understand its pilot nature.

      One of the main criticisms we have encountered in this study has been the choice of the primary endpoint. The best way respond to these questions was to provide data to support the prognostic relevance of CRP in COVID-19 pneumonia from a separate independent study where no other treatments such as dexamethasone, anakinra or anti-IL6 therapies were administered. We think this is very useful analysis and provides essential context for the trial and the choice of the primary endpoint, indicating that CRP has good enough resolution to predict clinical outcomes.

      • Propensity-score selected contemporary controls may introduce bias in favor of the primary study analysis, since controls are already adjusted for age, sex and comorbidities.

      The contemporary controls were selected to best match the characteristics of the randomized patients including that the first CRP measurement upon admission surpassed the trial threshold, so we do not see how this selection process introduces biases, as it was blinded with regards to the course of the CRP measurements. Given that this was a small trial, matching for baseline characteristics is necessary to minimize confounding effects.

      • The authors do not clearly present numerically survivors and non-survivors at day 34, even though this is one of the main secondary outcomes.

      We now provide the mortality numbers in the following paragraph on pg. 13.

      “Over 35 days follow up, 1 person in the BAC + dornase-alfa group died, compared to 8 in the BAC group. The hazard ra.o observed in the Cox propor.onal hazards model (95% CI) was 0.47 (0.06, 3.86), which es.mates that throughout 35 days follow-up, there was a 53% reduced chance of death at any given .mepoint in the BAC + dornase-alfa group compared to the BAC group, though the confidence intervals are wide due to a small number of events. The p-value from a log-rank test was 0.460, which does not reach sta.s.cal significance at an alpha of 0.05.”

      • It is unclear why another cohort (Berlin) was used to associate CRP with mortality. CRP association with mortality should (also) be performed within the current study.

      As we explained above, the Berlin cohort CRP data serve to substantiate the relevance of CRP as a primary endpoint in a cohort that experienced sufficient mortality as this cohort did not receive any approved anti-inflammatory therapy. Mortality in our COVASE trial was minimal, since all patients were on dexamethasone and did not reach the highest severity grade, since we opted to treat patients before they deteriorated further. The overall mortality was 8% across all arms of our study, which does not provide enough events for mortality measurements. In contrast the Berlin cohort did not receive dexamethasone and all patients had reached a WHO severity grade 7 category with mortality at 30%.

      My other concerns are:

      • This report is about an RCT and the authors should follow the CONSORT reporting guidelines. Please amend the manuscript and Figure 1b accordingly and provide a CONSORT checklist.

      We now provide a CONSORT checklist and have amended the CONSORT diagram accordingly.

      • Please provide in brief the exclusion criteria in the main manuscript

      We have now included the exclusion criteria in the manuscript on pg. 6.

      “1.1.1 Exclusion criteria

      1. Females who are pregnant, planning pregnancy or breasmeeding

      2. Concurrent and/or recent involvement in other research or use of another experimental inves.ga.onal medicinal product that is likely to interfere with the study medica.on within (specify .me period e.g. last 3 months) of study enrolment 3. Serious condi.on mee.ng one of the following:

      a. Respiratory distress with respiratory rate >=40 breaths/min

      b. oxygen satura.on<=93% on high-flow oxygen

      1. Require mechanical invasive or non-invasive ven.la.on at screening

      2. Concurrent severe respiratory disease such as asthma, COPD and/or ILD

      3. Any major disorder that in the opinion of the Inves.gator would interfere with the evalua.on of the results or cons.tute a health risk for the trial par.cipant

      4. Terminal disease and life expectancy <12 months without COVID-19

      5. Known allergies to dornase alfa and excipients

      6. Par.cipants who are unable to inhale or exhale orally throughout the en.re nebulisa.on period So briefly Patients were excluded if they were:

      7. pregnant, planning pregnancy or breasmeeding

      8. Serious condition meeting one of the following:

      a. Respiratory distress with respiratory rate >=40 breaths/min

      b. oxygen satura.on<=93% on high-flow oxygen

      1. Require ven.la.on at screening

      2. Concurrent severe respiratory disease such as asthma, COPD and/or ILD

      3. Terminal disease and life expectancy <12 months without COVID-19

      4. Known allergies to dornase alfa and excipients

      5. Participants who are unable to inhale or exhale orally throughout the en.re nebulisa.on period”

      • "The final trial visit occurred at day 35." "Analysis included mortality at day 35". I am not sure I understand why. In clinicaltrials.gov all endpoints are meant to be studies at day 7 except for mortality rate day 28. Why day 35 was chosen? Please be consistent.

      Thank you for identifying this inconsistency. We have amended the record on clinicaltrials.gov to read ‘’the time to event data was censored at 28 days post last dose (up to d35) for the randomised participants and at the date of the last electronic record for the CC.”

      • Please provide in Methods the timeframe for the investigation of the primary endpoint

      • The authors performed an RCT but in parallel chose to compare also controls. They should explain their rationale as this is not usual. I am not very enthusiastic to see mixed results like Figures 2c and 2d.

      • Analysis is performed in mITT; this is a major limitation. The authors should provide at least ITT results. And they should describe in the main manuscript why they chose mITT analysis.

      • It is also not usual to exclude patients from analysis because investigators just do not have serial measurements. This is lost to follow up and investigators should have pre-decided what to do with lost-to-follow-up.

      • Figure 1b as in CONSORT statement, please provide reasons why screened patients were not enrolled.

      • In Table 1 I would like to see all randomized patients (n=39), which is missing. There are also baseline characteristics that are missing, like which other treatment as BAT received those patients except for dexamethasone.

      • In the first paragraph of clinical outcomes, the authors refer to a cohort that is not previously introduced in the manuscript. This is confusing. And I do not understand why this analysis is performed in the context of this RCT although I understand its pilot nature.

      • In Figure 2 the authors draw results about ITT although in methods describe that they performed an mITT analysis. Please be consistent.

      Please see answers provided to these queries above.

      Reviewer #2 (Recommendations For The Authors):

      1) Suppl Figure 2B would be more informative if presented as a Table with N of patients with per day sampling

      We now provide the primary end point daily sampling table in Table 3.

      2) The numbers at risk should figure under the KM curves

      The numbers at risk for figures 1E, 2C, 2D have been added as graphs either in the main figures or in the supplement.

      3) HD in Supplementary figure 3 should be explained

      We apologize for this omission. We now provide a description for the healthy donor samples that we used in the cell-free DNA measurements in figure S3B on pg. 14:

      “Compared to the plasma of anonymized healthy donors volunteers at the Francis Crick ins.tute (HD), plasma cf-DNA levels were elevated in both BAC and DA-treated COVASE par.cipants.

      4) Presentation is inappropriate for Table S4

      We thank the reviewer for pointing this issue. We have now formaxed Table S4 to be consistent with all other tables.

    1. eLife Assessment

      In their important manuscript, Chen et al. investigate the phospho-regulation of the C. elegans kinesin-2 motor protein OSM-3, revealing that the kinase, NEKL-3, phosphorylates a serine/threonine patch at the hinge region of the motor to mediate autoinhibition until it reaches the ciliary middle segment. The findings are supported by robust genetic data, in vivo imaging, and motility assays with wild-type and mutant motors. Overall, the study provides a compelling contribution to understanding the regulation of OSM-3 kinesin activity both on the molecular and cellular levels.

    2. Reviewer #1 (Public review):

      Summary:

      This manuscript is a focused investigation of the phosphor-regulation of a C. elegans kinesin-2 motor protein, OSM-3. In C-elegans sensory ciliary, kinesin-2 motor proteins Kinesin-II complex and OSM-3 homodimer transport IFT trains anterogradely to the ciliary tip. Kinesin-II carries OSM-3 as an inactive passenger from the ciliary base to the middle segment, where kinesin-II dissociates from IFT trains and OSM-3 gets activated and transports IFT trains to the distal segment. Therefore, activation/inactivation of OSM-3 plays an essential role in its ciliary function.

      Strengths:

      In this study, using mass spectrometry, the authors have shown that the NEKL-3 kinase phosphorylates a serine/threonine patch at the hinge region between coiled coils 1 and 2 of an OSM-3 dimer, referred to as the elbow region in ubiquitous kinesin-1. Phosphomimic mutants of these sites inhibit OSM-3 motility both in vitro and in vivo, suggesting that this phosphorylation is critical for the autoinhibition of the motor. Conversely, phospho-dead mutants of these sites hyperactivate OSM-3 motility in vitro and affect the localization of OSM3 in C. elegans. The authors also showed that Alanine to Tyrosine mutation of one of the phosphorylation rescues OS-3 function in live worms.

      Weaknesses:

      Collectively, this study presents evidence for the physiological role of OSM-3 elbow phosphorylation in its autoregulation, which affects ciliary localization and function of this motor. Overall, the work is well performed, and the results mostly support the conclusions of this manuscript. During revision, the authors further supported conclusions and ruled out alternative explanations by filling some logical gaps with new experimental evidence and in-text clarifications.

      Comments on revisions: I have no additional comments or concerns.

    3. Reviewer #2 (Public review):

      Summary:

      The regulation of kinesin is fundamental to cellular morphogenesis. Previously, it has been shown that OSM-3, a kinesin required for intraflagellar transport (IFT), is regulated by autoinhibition. However, it remains totally elusive how the autoinhibition of OSM-3 is released. In this study, the authors have shown that NEKL-3 phosphorylates OSM-3 and release its autoinhibition.

      The authors found NEKL-3 directly phosphorylates OSM-3 (Figure 1). The phophorylated residue is the "elbow" of OSM-3. The authors introduced phospho-dead (PD) and phospho-mimic (PM) mutations by genome editing and found that the OSM-3(PD) protein does not form cilia, and instead, accumulates to the axonal tips. The phenotype is similar to another constitutive active mutant of OSM-3, OSM-3(G444A) (Imanishi et al., 2006; Xie et al., 2024). osm-3(PM) has shorter cilia, which resembles with loss of function mutants of osm-3 (Figure 2). The authors did structural prediction and shows that G444E and PD mutations change the conformation of OSM-3 protein (Figure 3). In the single molecule assays G444E and PD mutations exhibited increased landing rate (Figure 4). By unbiased genetic screening, the authors identified a suppressor mutant of osm-3(PD), in which A489T occurs. The result confirms the importance of this residue. Based on these results, the authors suggest that NEKL-3 induces phosphorylation of the elbow domain and inactivates OSM-3 motor when the motor is synthesized in the cell body. This regulation is essential for the proper cilia formation.

      Strengths:

      The finding is interesting and gives new insight into how IFT motor is regulated.

      Comments on revisions: In the revised manuscript, the authors describe why they focused on NEKL-3 and detailed experimental procedures are presented.

      My only minor concern is the title, which appears to be too general. Researchers in the motor protein field may firstly assume this paper focuses on kinesin-1, because the "elbow" domain was originally suggested in kinesin-1. This paper newly determines the elbow region of OSM-3 and shows its crucial role in autoinhibition. Therefore, a more specific title, "Kinesin-2 Autoinhibition Requires Elbow Phosphorylation" or "OSM-3 Autoinhibition Requires Elbow phosphorylation" may be better.

    4. Author response:

      The following is the authors’ response to the original reviews

      Public Reviews:

      Reviewer #1 (Public review):

      Summary:

      This manuscript is a focused investigation of the phosphor-regulation of a C. elegans kinesin-2 motor protein, OSM-3. In C-elegans sensory ciliary, kinesin-2 motor proteins Kinesin-II complex and OSM-3 homodimer transport IFT trains anterogradely to the ciliary tip. Kinesin-II carries OSM-3 as an inactive passenger from the ciliary base to the middle segment, where kinesin-II dissociates from IFT trains and OSM-3 gets activated and transports IFT trains to the distal segment. Therefore, activation/inactivation of OSM-3 plays an essential role in its ciliary function.

      Strengths:

      In this study, using mass spectrometry, the authors have shown that the NEKL-3 kinase phosphorylates a serine/threonine patch at the hinge region between coiled coils 1 and 2 of an OSM-3 dimer, referred to as the elbow region in ubiquitous kinesin-1. Phosphomimic mutants of these sites inhibit OSM-3 motility both in vitro and in vivo, suggesting that this phosphorylation is critical for the autoinhibition of the motor. Conversely, phospho-dead mutants of these sites hyperactivate OSM-3 motility in vitro and affect the localization of OSM3 in C. elegans. The authors also showed that Alanine to Tyrosine mutation of one of the phosphorylation rescues OS-3 function in live worms.

      Weaknesses:

      Collectively, this study presents evidence for the physiological role of OSM-3 elbow phosphorylation in its autoregulation, which affects ciliary localization and function of this motor. Overall, the work is well performed, and the results mostly support the conclusions of this manuscript. However, the work will benefit from additional experiments to further support conclusions and rule out alternative explanations, filling some logical gaps with new experimental evidence and in-text clarifications, and improving writing before I can recommend publication.

      We appreciate Reviewer #1’s comments and suggestions. We have now provided additional evidences and discussions to further support our conclusions and fill the logical gaps. We have also provided alternative explanations to our data and improved writing.

      Reviewer #2 (Public review):

      Summary:

      The regulation of kinesin is fundamental to cellular morphogenesis. Previously, it has been shown that OSM-3, a kinesin required for intraflagellar transport (IFT), is regulated by autoinhibition. However, it remains totally elusive how the autoinhibition of OSM-3 is released. In this study, the authors have shown that NEKL-3 phosphorylates OSM-3 and releases its autoinhibition.

      The authors found NEKL-3 directly phosphorylates OSM-3 (although the method is not described clearly) (Figure 1). The phophorylated residue is the "elbow" of OSM-3. The authors introduced phospho-dead (PD) and phospho-mimic (PM) mutations by genome editing and found that the OSM-3(PD) protein does not form cilia, and instead, accumulates to the axonal tips. The phenotype is similar to another constitutive active mutant of OSM-3, OSM-3(G444A) (Imanishi et al., 2006; Xie et al., 2024). osm-3(PM) has shorter cilia, which resembles with loss of function mutants of osm-3 (Figure 3). The authors did structural prediction and showed that G444E and PD mutations change the conformation of OSM-3 protein (Figure 3). In the single-molecule assays G444E and PD mutations exhibited increased landing rate (Figure 4). By unbiased genetic screening, the authors identified a suppressor mutant of osm-3(PD), in which A489T occurs. The result confirms the importance of this residue. Based on these results, the authors suggest that NEKL-3 induces phosphorylation of the elbow domain and inactivates OSM-3 motor when the motor is synthesized in the cell body. This regulation is essential for proper cilia formation.

      Strengths:

      The finding is interesting and gives new insight into how the IFT motor is regulated.

      Weaknesses:

      The methods section has not presented sufficient information to reproduce this study.

      We appreciate that Reviewer #2 is also positive to our study. We have now provided sufficient information in the revised Methods section.

      Recommendations for the authors:

      Reviewer #1 (Recommendations for the authors):

      Major Concerns

      (1) Why do the authors think that NEKL-3 phosphorylates OSM-3 in the first place? This seems to come out of nowhere and prior evidence indicating that NEKL-3 may be phosphorylating OSM-3 is not even mentioned in the Introduction.

      We thank the Reviewer for raising this important point. Our hypothesis that NEKL-3 phosphorylates OSM-3 stems from prior findings in our lab. In a previous study (Yi et al., Traffic, 2018, PMID: 29655266), we identified NEKL-4, a member of the NIMA kinase family, as a suppressor of the OSM-3(G444E) hyperactive mutation. This discovery prompted us to explore the broader role of NIMA kinases in regulating OSM3. Subsequent genetic screens (Xie et al., EMBO J, 2024, PMID: 38806659) revealed that both NEKL-3 and NEKL-4 suppress multiple OSM-3 mutations, further supporting their functional interaction. Given the established role of NIMA kinases in phosphorylation-dependent processes (Fry et al., JCS, 2012, PMID: 23132929; Chivukula et al., Nat. Med., 2020, PMID: 31959991; Thiel, C. et al. Am. J. Hum. Genet. 2011, PMID: 21211617; Smith, L. A. et al., J. Am. Soc. Nephrol., 2006, PMID: 16928806), we hypothesized that NEKL-3/4 may directly phosphorylate OSM-3 to modulate its activity.

      To test this hypothesis, we expressed recombinant C. elegans NEKL-3 and OSM-3 proteins and conducted in vitro phosphorylation assays. While we were unable to obtain active recombinant NEKL-4 (limitations noted in the revised text), our experiments with NEKL-3 revealed phosphorylation at residues 487-490 (YSTT motif) in OSM-3’s tail region, as confirmed by mass spectrometry. These findings are now explicitly contextualized in the Introduction and Results sections of the revised manuscript.

      Page #4, Line #11:

      “...In our previous study (Yi et al., Traffic, 2018, PMID: 29655266), a genetic screen targeting the OSM-3(G444E) hyperactive mutation identified NEKL-4, a member of the NIMA kinase family, as a suppressor of this phenotype. This finding, combined with reports that NIMA kinases regulate ciliary processes independently of their canonical mitotic roles (Fry et al., JCS, 2012, PMID: 23132929; Chivukula et al., Nat. Med., 2020, PMID: 31959991; Thiel, C. et al. Am. J. Hum. Genet. 2011, PMID: 21211617; Smith, L. A. et al., J. Am. Soc. Nephrol., 2006, PMID: 16928806), prompted us to investigate whether NIMA kinases modulate OSM-3-driven intraflagellar transport. We hypothesized that NEKL-3/4, as paralogs within this family, might directly phosphorylate OSM-3 to regulate its motility...”

      Page #4, line #26:  

      “... To determine whether NIMA kinase family members could directly phosphorylate

      OSM-3, we purified prokaryotic recombinant C. elegans NEKL-3/NEKL-4 and OSM3 protein in order to perform in vitro phosphorylation assays. We were able to obtain active recombinant NEKL-3 but not NEKL-4. The in vitro phosphorylation assays showed that NEKL-3, directly phosphorylates OSM-3 (Fig. 1A-B, Appendix Table S1). Subsequent mass spectrometric analysis revealed phosphorylation at residues 487-490, which localize to the conserved "YSTT" motif within OSM-3’s C-terminal tail region ...”

      (2) The authors need to characterize the proteins they expressed and purified for in vitro ATPase and motility assays. Are these proteins monomers or dimers?

      For our in vitro ATPase and motility assays, OSM-3 was expressed in E. coli BL21(DE3) and purified using established protocols (Xie et al., EMBO J, 2024, PMID: 38806659; Imanishi et al., JCB, 2006, PMID: 17000874). To confirm its oligomeric state, we analyzed recombinant OSM-3 by size-exclusion chromatography coupled with multiangle light scattering (SEC-MALS). As reported in Xie et al. (2024), OSM-3 (~80 kDa monomer) elutes with a molecular weight of 173–193 kDa under physiological buffer conditions, consistent with a homodimeric assembly. These findings confirm that the functional unit used in our assays is the biologically relevant dimer. This characterization has been added to the revised manuscript on Page #35, Line #7.

      “…OSM-3 was expressed in E. coli BL21(DE3) and purified for in vitro assays using established protocols (REFs). Size-exclusion chromatography coupled with multiangle light scattering (SEC-MALS) (Xie et al., EMBO J., 2024) confirmed that recombinant OSM-3 forms a homodimer (173–193 kDa) under physiological conditions, ensuring its dimeric state remained intact....” 

      (3) The authors primarily used PD and PM mutations, which affect all four amino acids in the region. This may or may not be physiologically relevant. Figure 5 indicates that T489 is a critical regulatory site. However, this conclusion is undermined by reliance on PD mutations, which affect all four amino acids. Creating PM (T489E) and PD (T489A) mutations based on WT OSM-3 would better reflect physiological relevance. In vitro assays with a single phosphomimic or phosphor-dead mutation at residue 489 are missing at the end of this story. This would better link Figure 5 with the rest of the manuscript.

      We thank the reviewer for this constructive critique. Below, we address the concerns and integrate new data to strengthen the link between T489 and autoinhibition:

      To probe the regulatory role of T489 phosphorylation, we generated osm-3(T489E) (phosphomimetic, PM) and osm-3(T489A) (phospho-dead, PD) mutant animals. Strikingly, both mutants formed axonal puncta (Figure S7), recapitulating the hyperactive phenotype of the OSM-3G444E mutant. While the similar puncta formation in PM and PD mutants initially appeared paradoxical, this observation underscores the necessity of dynamic phosphorylation cycling at T489 for proper autoinhibition. Specifically, the PD mutant (T489A) likely disrupts phosphorylationdependent autoinhibition stabilization, leading to constitutive activation, where as the PM mutant (T489E) may mimic a "locked" phosphorylated state, preventing dephosphorylation-dependent release of autoinhibition in cilia and trapping OSM-3 in an aggregation-prone conformation. These results highlight T489 as a structural linchpin whose post-translational modification dynamically regulates motor activity. While the precise molecular mechanism—such as how phosphorylation modulates tailmotor domain interactions—remains to be elucidated, our data conclusively demonstrate that perturbing T489 (even in isolation) destabilizes autoinhibition, driving puncta formation and the constitutive activity.

      We have integrated the above paragraph in the revised manuscript on page #8, line #27.

      (4) There seems to be a disconnect between the MT gliding assays in Figure 4C and single molecule motility assays in Figure 4E. The gliding assays show that all constructs can glide microtubules at near WT speeds. Yet, the motility assays show that WT and PM cannot land or walk on MTs. The authors need to explain why this is the case. Is this because surface immobilization of kinesin from its tail disrupts autoinhibition? Alternatively, the protein preparation may include monomers that cannot be autoinhibited and cannot land and processively walk on surface-immobilized microtubules (because they only have one motor domain) but can glide microtubules when immobilized on the surface from their tail.

      The surface immobilization of OSM-3 via its tail domain disrupts autoinhibition, a phenomenon previously observed in other kinesins such as kinesin-1 (Nitzsche et al, Methods Cell Biol., 2010, PMID: 20466139). In our assays, OSM-3 was nonspecifically immobilized on glass surfaces, enabling microtubule gliding by motors whose autoinhibition was relieved through tail anchoring. Critically, the PD and PM mutations reside in the tail region and do not alter the intrinsic properties of the motor head domain. Consequently, once autoinhibition is released via immobilization, the gliding velocities reflect the conserved motor head activity, which is expected to remain comparable across all constructs. While we cannot entirely rule out the presence of monomeric OSM-3 in solution, several lines of evidence argue against this possibility. First, the mutations are located in the elbow region, which is dispensable for motor dimerization. Second, SEC-MALS analysis from prior studies confirms that purified OSM-3 exists predominantly as dimers in solution. 

      We have discussed these issues in the revised text on page #10, line #18: 

      “…In our gliding assays, OSM-3PM has an increased gliding speed of 0.69 ± 0.07 μm/s (Fig. 4 C-D), similar to PD mutant. PD and PM mutations are confined to the elbow region, leaving the motor head’s mechanochemical properties intact. Upon tail immobilization—which releases autoinhibition—the gliding speeds reflect motor head activity. Single-molecule assays, however, directly resolve their native regulatory states: PD mutants are constitutively active, whereas PM mutants persist in an autoinhibited state (Fig. 4E-G). Although monomeric OSM-3 could theoretically mediate singlemotor gliding, the previous SEC-MALS data demonstrate that OSM-3 purifies as stable dimers (Xie et al., EMBO J, 2024, PMID: 38806659). Thus, dimeric OSM-3 is perhaps the predominant functional species in our assays…”

      (5) An alternative explanation for the data is that both PD and PM mutations result in loss-of-function effects, disrupting OSM-3 activity. For instance:

      a) In Figure 2C, both mutations cause shorter cilia than the wild type (WT).

      b) In Figure 4A, both mutations result in higher ATPase activity than WT.

      c) In Figure 4D, both mutations show increased gliding velocity compared to WT. These results suggest the observed effects could stem from loss of function rather than phosphorylation-specific regulation.

      Although PD and PM mutations exhibit superficially similar "loss-of-function" phenotypes in certain assays, they mechanistically disrupt motor regulation in distinct ways:

      a) Ciliary Length (Figure 2C) PD Mutants: Hyperactivation causes OSM-3-PD to prematurely aggregate into axonal puncta, preventing ciliary entry. Consequently, cilia are built solely by the weaker Kinesin-II motor, which only constructs shorter middle segments.

      PM Mutants: OSM-3-PM retains autoinhibition during transport (enabling ciliary entry) but cannot be dephosphorylated in cilia. This blocks activation, leaving OSM-3-PM partially functional and resulting in cilia intermediate in length between WT and PD.

      We have discussed this issue in the revised text on page #5, line #30:

      “…These findings indicate that OSM-3-PM is in an autoinhibited state capable of ciliary delivery, yet fails to achieve full activation due to defective dephosphorylation. This incomplete activation results in suboptimal motor function and intermediate ciliary length phenotypes (Fig.2 B-C). In contrast, OSM-3-PD exhibits constitutive activation leading to aggregation into axonal puncta, which completely abolishes its ciliary entry capacity (Fig.2 A-B)...”

      b) ATPase Activity (Figure 4A)

      PD Mutants: Fully autoinhibition-released (98.15% of KHC ATPase activity), consistent with constitutive activation.

      PM Mutants: Show partial ATPase activity (34.28% of KHC), reflecting imperfect phosphomimicry. While the DDEE substitution introduces negative charges, it fails to fully replicate the steric/kinetic effects of phosphorylated tyrosine (Y486; phenyl ring absent), resulting in incomplete autoinhibition stabilization. Despite this, the residual inhibition is sufficient to phenocopy shorter cilia in vivo.

      We have discussed this issue in the revised text on page #7, line#19:

      “…The PM mutant’s partial ATPase activity (34.28% of KHC) might arise from imperfect phosphomimicry—while the DDEE substitution introduces negative charges, it lacks the steric bulk of phosphorylated tyrosine (pY487). And this incomplete mimicry allows residual autoinhibition, sufficient to limit ciliary construction in vivo...”

      c) Microtubule Gliding Velocity (Figure 4D)

      Gliding Assay Limitation: Tail immobilization artificially releases autoinhibition, masking regulatory differences. Thus, all constructs (PD, PM) exhibit similar velocities (~0.7 µm/s), reflecting conserved motor head activity.

      Single-Molecule Assay (Figure 4E): Directly resolves native autoinhibition states:

      PD mutants show robust motility (autoinhibition released).

      PM mutants remain largely inactive (autoinhibition retained).

      We have discussed this issue in the revised text on page #10, line#18:

      “…In our gliding assays, OSM-3PM has an increased gliding speed of 0.69 ± 0.07 μm/s (Fig. 4 C-D), similar to PD mutant. PD and PM mutations are confined to the elbow region, leaving the motor head’s mechanochemical properties intact. Upon tail immobilization—which releases autoinhibition—the gliding speeds reflect motor head activity. Single-molecule assays, however, directly resolve their native regulatory states: PD mutants are constitutively active, whereas PM mutants persist in an autoinhibited state (Fig. 4E-G)...”

      Minor Suggestions and Concerns

      (1) Lines 60-66: References that support these observations are missing from this section.

      We have added the relevant references.

      (2) Lines 66-67: I would revise this sentence as "It remains unclear how OSM-3 becomes enriched...".

      We have made the changes.

      (3) Line 85: The authors should describe how they perform these assays (i.e. recombinantly expressed NEKL-3 and OSM-3, are these C. elegans proteins, and which expression system was used...).

      We have described them in the main text and methods

      Page #4 line #26

      “...To determine whether NIMA kinase family members could directly phosphorylate OSM-3, we purified prokaryotic recombinant C. elegans NEKL-3/NEKL-4 and OSM-3 protein in order to perform in vitro phosphorylation assays...”

      Page #35 line#12

      “...Basically, point mutations was introduced in to pET.M.3C OSM-3-eGFP-His6 plasmid for prokaryotic expression. Plasmid transformed E. coli (BL21) was cultured at 37°C and induced overnight at 23°C with 0.2 mM IPTG. Cells were lysed in lysis buffer (50 mM NaPO4 pH8.0, 250 mM NaCl, 20 mM imidazole, 10 mM bME, 0.5 mM ATP, 1 mM MgCl¬2, Complete Protease Inhibitor Cocktail (Roche)) and Ni-NTA beads were applied for affinity purification. After incubation, beads were washed with wash buffer (50 mM NaPO4 pH6.0, 250 mM NaCl, 10 mM bME, 0.1 mM ATP, 1 mM MgCl¬2) and eluted with elute buffer (50 mM NaPO4 pH7.2, 250 mM NaCl, 500 mM imidazole, 10 mM bME, 0.1 mM ATP, 1 mM MgCl¬2). Protein concentration was determined by standard Bradford assay. C elegans nekl-3 cDNA was cloned in to pGEX-6P GST vector and expressed in E. coli BL21 (DE3) and purified for in vitro phosphorylation assays. Plasmid transformed E. coli (BL21) was cultured at 37°C and induced overnight at 18°C with 0.5 mM IPTG. Cells were lysed in lysis buffer (50 mM NaPO4 pH8.0, 250 mM NaCl, 1 mM DTT, Complete Protease Inhibitor Cocktail (Roche)) and GST beads were applied for affinity purification. After incubation, beads were washed with wash buffer (50 mM NaPO4 pH6.0, 250 mM NaCl, 1 mM DTT) and eluted with elute buffer (50 mM NaPO4 pH7.2, 150 mM NaCl, 10 mM GSH, 1 mM DTT). Purified proteins were dialyzed against storge buffer (50 mM Tris-HCl, pH 8.0, 150 mM NaCl). Protein concentration was determined by standard Bradford assay...”
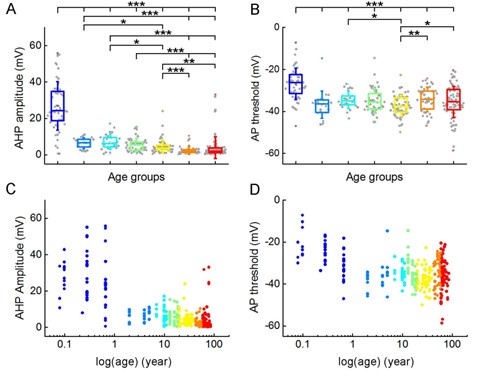
      (4) Line 141: The first sentence of this paragraph lacks motivation. I would start this sentence with "To directly observe the effects of phosphor mutants in the elbow region in microtubule binding and motility of OSM-3, we...".

      We have made the change.

      (5) Figure 1B: The mass spectrometry data in Figure 1B lacks adequate explanation. The Methods section should detail the experimental protocol, data interpretation, and any databases used. Additionally, the manuscript should list all identified phosphorylation sites on OSM-3 to provide context, including whether Y487_T490 is the major site.

      We have provided the detailed experimental protocol, data interpretation, and databases used in methods. We have provided all identified sites as Appendix table S1.

      (6) Figure 1C: Is it possible to model the effect of PM and PD mutations using AlphaFold? The authors should also show PAE or pLDDT scores of their model.

      AlphaFold cannot well model the effect of mutants, but we conducted the Rosetta relax to capture their possible conformational changes, as shown in the revised Figure 3. We have provided PAE and pLDDT as a new figure, Figure S2.

      (7) Figure 2D: The unit for speed should use a lowercase "s" for seconds.

      We have fixed it.

      (8) Figure 3: I am not sure whether this figure stands for a main text figure on its own, as it is only a Rosetta prediction and is not supported by any experimental data. In addition, it remains unclear what the labels on the x-axis mean.

      We have updated the figure and explain the labels on the x-axis in Figure S4 to make it more reader-friendly.

      (9) Figure 4: NEKL-3-treated OSM-1 should be included as a positive control in the in vitro experiments.

      We suspect that the Reviewer asked for NEKL-3-treated OSM-3. 

      In our other study which has just been accepted by the Journal of Cell Biology, NEKL3-treated OSM-3 significantly reduced the affinity between OSM-3 motor and microtubules and showed very low ATPase activity. We have cited and discussed this in the revised text on page #10, line #28: 

      “…As demonstrated in our recent study (Huang et al., JCB, 2025, In press, attached), phosphorylation of OSM-3 by NEKL-3 at two distinct regions—Ser96 and the conserved "elbow" motif—differentially regulates its activity and localization. Phosphorylation at Ser96 reduces OSM-3’s ATPase activity and alters its ciliary distribution from the distal segment to a uniform localization, while elbow phosphorylation induces autoinhibition, retaining OSM-3 in the cell body. Strikingly, in vitro phosphorylation of OSM-3 by NEKL-3 significantly reduces its microtubulebinding affinity, likely arising from combined modifications at both sites. We propose a model wherein elbow phosphorylation ensures anterograde ciliary transport, while Ser96 phosphorylation fine-tunes distal segment targeting. This multistep regulation may involve distinct phosphatases to reverse phosphorylation at specific sites, a hypothesis warranting further investigation….”

      (10) Figure 4C, D, and F: The unit of velocity is wrong. The authors should use the same units they used in the table shown in Figure 4B.

      We have fixed these errors

      (11) Figure 4F: The velocity of PD is a lot lower than G444E. Therefore, it would be more appropriate to refer to PD as partially active, rather than hyperactive.

      We have made the change. 

      (12) Figure 5: There is too much genetics jargon on this figure (EMF, F2, 100%Dyf,...). How are the alleles numbered? Is it OK to refer to them as Alleles 1 and 2 for simplicity?

      According to the established C. elegans allele nomenclature, each worm allele has a unique number named after the lab code for identification. We have simplified the labels and updated the figure to make it more reader-friendly.

      (13) Figure 5E: A plot would be more reader-friendly than a table. Additionally, the legend for Fig. 5E mistakenly refers to it as "D."

      We have changed the table to a plot and fixed the mistakes. We thank the Reviewer for pointing them out.

      Reviewer #2 (Recommendations for the authors):

      (1) The model appears as if NEKL-3 induces dephosphorylation of OSM-3 (Figure 6). This is not consistent with the conclusions described in the Discussion and is confusing.

      We have updated the model figure and fixed the error.

      (2) It should be described why the authors hypothesized NEKL-3 phosphorylates OSM3. Was there genetic evidence? Did the authors screened cilia-related kinases? or Did the authors identify it incidentally? Providing this information would help readers to understand the context of the research.

      We appreciate both Reviewers for pointing out this issue. 

      Our hypothesis that NEKL-3 phosphorylates OSM-3 stems from prior findings in our lab. In a previous study (Yi et al., Traffic, 2018, PMID: 29655266), we identified NEKL-4, a member of the NIMA kinase family, as a suppressor of the OSM-3(G444E) hyperactive mutation. This discovery prompted us to explore the broader role of NIMA kinases in regulating OSM-3. Subsequent genetic screens (Xie et al., EMBO J, 2024, PMID: 38806659) revealed that both NEKL-3 and NEKL-4 suppress multiple OSM-3 mutations, further supporting their functional interaction. Given the established role of NIMA kinases in phosphorylation-dependent processes (Fry et al., JCS, 2012, PMID: 23132929; Chivukula et al., Nat. Med., 2020, PMID: 31959991; Thiel, C. et al. Am. J. Hum. Genet. 2011, PMID: 21211617; Smith, L. A. et al., J. Am. Soc. Nephrol., 2006, PMID: 16928806), we hypothesized that NEKL-3/4 may directly phosphorylate OSM3 to modulate its activity.

      To test this hypothesis, we expressed recombinant C. elegans NEKL-3 and OSM-3 proteins and conducted in vitro phosphorylation assays. While we were unable to obtain active recombinant NEKL-4 (limitations noted in the revised text), our experiments with NEKL-3 revealed phosphorylation at residues 487-490 (YSTT motif) in OSM-3’s tail region, as confirmed by mass spectrometry. These findings are now explicitly contextualized in the Introduction and Results sections of the revised manuscript.

      Page #4, Line #11:

      “... In our previous study (Yi et al., Traffic, 2018, PMID: 29655266), a genetic screen targeting the OSM-3(G444E) hyperactive mutation identified NEKL-4, a member of the NIMA kinase family, as a suppressor of this phenotype. This finding, combined with reports that NIMA kinases regulate ciliary processes independently of their canonical mitotic roles (Fry et al., JCS, 2012, PMID: 23132929; Chivukula et al., Nat. Med., 2020, PMID: 31959991; Thiel, C. et al. Am. J. Hum. Genet. 2011, PMID: 21211617; Smith, L. A. et al., J. Am. Soc. Nephrol., 2006, PMID: 16928806), prompted us to investigate whether NIMA kinases modulate OSM-3-driven intraflagellar transport. We hypothesized that NEKL-3/4, as paralogs within this family, might directly phosphorylate OSM-3 to regulate its motility...”

      Page #4, line #26: 

      “... To determine whether NIMA kinase family members could directly phosphorylate OSM-3, we purified prokaryotic recombinant C. elegans NEKL-3/NEKL-4 and OSM3 protein in order to perform in vitro phosphorylation assays. We were able to obtain active recombinant NEKL-3 but not NEKL-4. The in vitro phosphorylation assays showed that NEKL-3, directly phosphorylates OSM-3 (Fig. 1A-B, Appendix Table S1). Subsequent mass spectrometric analysis revealed phosphorylation at residues 487-490, which localize to the conserved "YSTT" motif within OSM-3’s C-terminal tail region...”

      (3) It is curious the authors have not addressed the cilia phenotype and the localization of OSM-3 in nekl-3 mutant. Regardless of whether these observations agrees with the proposed mechanisms, it is essential for the authors to show and discuss the cilia phenotype and OSM-3 localization in nekl-3 mutants.

      We thank the Reviewer for highlighting this critical point. Indeed, nekl-3 null mutants are inviable due to essential mitotic roles (Barstead et al., 2012, PMID: 23173093), precluding direct analysis of ciliary phenotypes. To bypass this limitation, we recently generated nekl-3 conditional knockouts (cKOs) in ciliated neurons (Huang et al., JCB, 2025 in press, attached). In these mutants, OSM-3—which is normally enriched in the ciliary distal segment—becomes uniformly distributed along the cilium. This redistribution correlates with premature activation of OSM-3-driven anterograde motility in the ciliary middle region, consistent with our proposed model where NEKL3 phosphorylation suppresses OSM-3 activity. We have now integrated this result and discussion into the revised manuscript, reinforcing the physiological relevance of NEKL-3-mediated regulation in ciliary transport. 

      Page #6 line #10

      “… While nekl-3 null mutants are inviable due to essential mitotic roles (Barstead et al., 2012, PMID: 23173093), conditional knockout (cKO) of nekl-3 in ciliated neurons (Huang et al., JCB, 2025 in press, attached) revealed its critical role in regulating OSM3 dynamics. In nekl-3 cKO animals, OSM-3—normally enriched in the ciliary distal segment—redistributed uniformly along the cilium, concomitant with premature activation of anterograde motility in the middle ciliary region. This phenotype aligns with our model wherein NEKL-3 phosphorylation suppresses OSM-3 activity, ensuring spatiotemporal regulation of IFT.…”

      (4) The methods section lacks some information, which is critical to reproducing this study.

      We have now provided detailed information in the methods section in the revised manuscript.

      (a) It is not described how the authors determined phosphorylation of OSM-3 by NEKL-3. In methods, nothing is described about the assay.

      We performed in vitro phosphorylation assays using recombinant OSM-3 and NEKL3 purified from bacteria. We then used LC-MS/MS for identification of phosphorylation sites. We have now updated the methods section to include all the information.

      Page #4 line #26

      “... To determine whether NIMA kinase family members could directly phosphorylate OSM-3, we purified prokaryotic recombinant C. elegans NEKL-3/NEKL-4 and OSM3 protein in order to perform in vitro phosphorylation assays. We were able to obtain active recombinant NEKL-3 but not NEKL-4. The in vitro phosphorylation assays showed that NEKL-3, directly phosphorylates OSM-3 (Fig. 1A-B, Appendix Table S1). Subsequent mass spectrometric analysis revealed phosphorylation at residues 487-490, which localize to the conserved "YSTT" motif within OSM-3’s C-terminal tail region...”

      Page #36, line #19

      “In vitro phosphorylation assay 20 μM purified OSM-3 was incubated with 1 μM GST-NEKL-3 at 30 °C in 100 μL reaction buffer (50 mM Tris-HCl pH 8.0, 10 mM MgCl2, 150 mM NaCl, and 2 mM ATP) for 30 min. The reaction was terminated by boiling for 5 min with an SDS-sample buffer.
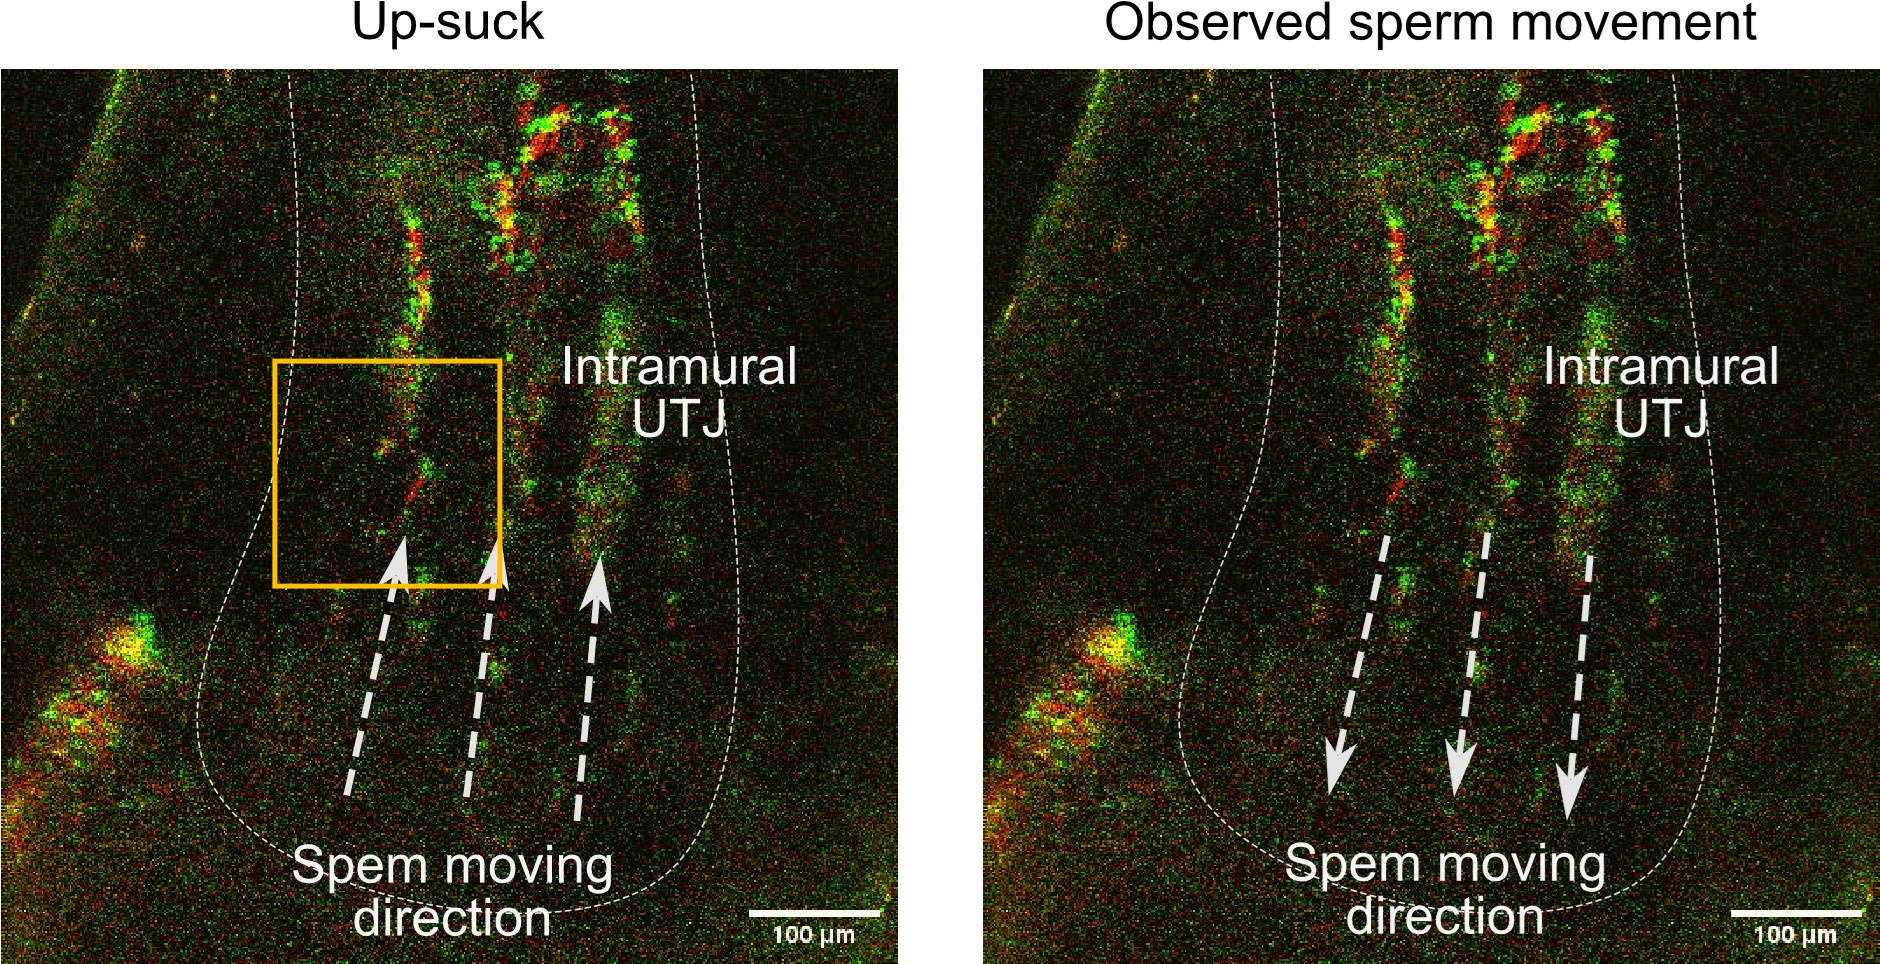
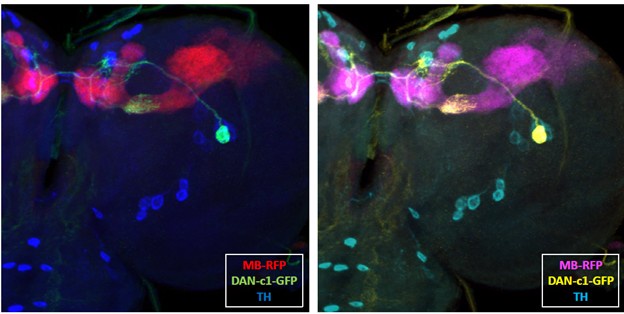
      Mass spectrometry

      Following NEKL-3 treatment, OSM-3 proteins were resolved by SDS-PAGE and visualized with Coomassie Brilliant Blue staining. Protein bands corresponding to OSM-3 were excised and subjected to digestion using the following protocol: reduction with 5 mM TCEP at 56°C for 30 min; alkylation with 10 mM iodoacetamide in darkness for 45 min at room temperature, and tryptic digestion at 37°C overnight with a 1:20 enzyme-to-protein ratio. The resulting peptides were subjected to mass spectrometry analysis. Briefly, the peptides were analyzed using an UltiMate 3000 RSLCnano system coupled to an Orbitrap Fusion Lumos mass spectrometer (Thermo Fisher Scientific). We applied an in-house proteome discovery searching algorithm to search the MS/MS data against the C. elegans database. Phosphorylation sites were determined using PhosphoRS algorithm with manual validation of MS/MS spectra.”
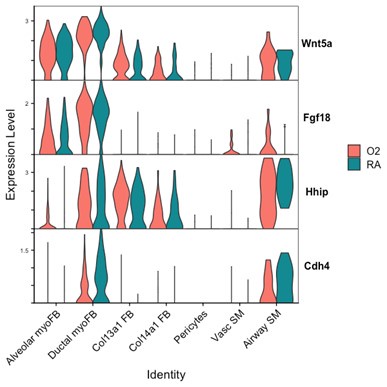
      (b) The method of structural prediction by Alfafold2 and LocalColabFold needs clarification. In general, the prediction gives several candidates. How did the authors choose one of these candidates?

      We generated five candidate models and all of them showed similar conformation. We thus chose the model with the highest confidence. We have provided PAE and pLDDT as additional data in Figure S2 and discussed them in the revised text on, Page #4, line #32: 

      “...To gain structural insights from this motif, we employed LocalColabFold based on AlphaFold2 to predict the dimeric structure of OSM-3 (Evans et al., 2022; Jumper et al., 2021; Mirdita et al., 2022). The highest-confidence model was selected for further analysis (Fig. 1C, Fig. S2)...”

      (c) The methods to predict conformational changes by introducing various point mutations are interesting (Figure 3). However, the methods require more detailed descriptions. In the current form, the manuscript only lists the tools used. The pipelines and parameters need to be described. This information is important because AlphaFoldbased predictions often give folded conformations because the training data are mainly composed of folded proteins. It is surprising that the methods applied here give open conformations induced by point mutations.

      We have described the pipelines in the revised Methods section on page#34, line#25: 

      “…OSM-3 model was predicted using LocalColabFold (Evans et al., 2022; Jumper et al., 2021; Mirdita et al., 2022). Mutated proteins were designed by Pymol 2.6, choosing the rotamer of the mutated residues in G444E, PM and PD models with the least clash as the initial conformation. To predict mutation-induced conformational changes, the initial models were subjected to Pyrosetta (Chaudhury et al., 2010). The energies of pre-relaxed models were evaluated with Rosetta Energy Function 2015 (Alford et al., 2017), and then the relax procedure were applied to the models with default parameters to obtain the relaxed models visualized by Pymol to minimize the energy of these models. In detail, to obtain the relaxed models visualized by Pymol and minimize the energy of these models, the classic relax mover was used in the procedure mentioned above with default settings. The relax script has been uploaded to Github: https://github.com/young55775/RosettaRelax_for_OSM3...”

      (5) The authors have purified proteins. Do they show different properties in gel filtration that are consistent with the structural prediction? It is anticipated that open-form mutants are eluted from earlier than closed forms.

      We thank the reviewer for this insightful suggestion. Indeed, our recent study supported that the open-from of the active OSM-3 G444E mutation were eluted earlier than the wild-type closed form (Xie et al., EMBO J., 2024). While the current study did not perform gel filtration chromatography (SEC) to directly compare the hydrodynamic properties of the OSM-3 mutants, our functional assays provide robust evidence for conformational changes predicted by structural modeling. For example: ATPase activity assays revealed that the open-state mutants (e.g., G444E and PD muatnts) exhibited significantly enhanced enzymatic activity (Figure 4A), consistent with structural predictions of an active, destabilized autoinhibitory interface (Figure 3A). These functional readouts collectively validate the predicted structural states. While SEC could further corroborate these findings by distinguishing compact (closed) versus extended (open) conformations, we prioritized assays that directly link structural predictions to in vitro enzymatic activity and in vivo ciliary transport dynamics. Future studies incorporating SEC or cryo-EM will provide additional biophysical validation of these states.

      We have revised the text in the manuscript (Page #7, Lines #22): 

      “…Notably, the open-state OSM-3 mutants (e.g., G444E) displayed elevated ATPase activity, consistent with structural predictions of autoinhibition release (Fig. 3A, Fig. 4A) (Xie et al., 2024). While hydrodynamic profiling (e.g., SEC) could further resolve conformational states, our functional assays directly connect predicted structural changes to altered biochemical and cellular activity...”

      Minor point

      (1) Line 85 "MIMA kinase family" should be "NIMA kinase family".

      We have corrected the typo and appreciate that the Reviewer for pointing it out. 

      (2) M.S. and D.S. need to be defined in Figure 2D.

      We have updated the figures.

    1. Author Response

      The following is the authors’ response to the current reviews.

      1) The main issue relates to Set2, and how STIM1 expression rescues Set2-dependent functions in Set2 KO flies. If Set2 is downstream of STIM1, how would STIM1 over-expression rescue a Set2-dependent effect?

      STIM rescue is of Set2 knockdown (RNAi) and NOT Set2 Knockout flies. Over expression of STIM raises SOCE in primary cultures of Drosophila neurons (as demonstrated in previous publications from our group: Agrawal et al., 2010; Chakraborty et al, 2016; Deb et al., 2016). The higher SOCE drives greater expression of Set2 from the endogenous locus thus reducing the efficacy of Set2 RNAi. Hence the rescue by STIM of Set2 KD flies in Figure S2E. We have explained this in lines 227-234.

      2) There is still no characterization of SOCE in fpDANs from flies expressing native Orai or the dominant negative OraiE180A mutant.

      Measurement of SOCE is not technically feasible in ex-vivo preps due to the presence of extracellular calcium in the brain milieu. In the past we have measured SOCE from primary cultures of central dopaminergic neurons expressing either native Orai OR OraiE180A mutant (Pathak et al., 2015) where we found that all dopaminergic neurons expressing OraiE180A exhibit very low SOCE. This is the reason we have not measured SOCE in the fewer cells of the fpDAN subset marked by THD' GAL4. This point has been specifically mentioned and explained in the section on “limitations of the study” at the end of the manuscript.

      3) The revised version does not include an analysis of the STIM:Orai stoichiometry, which has been demonstrated to be essential for SOCE.

      To measure such stoichiometry we would need to perform direct measurements of STIM and Orai levels by protein extraction from the fpDANs of all appropriate genotypes. This is not feasible due to the small number of cells available from each brain.

      I confirm that there are no changes to the text OR figures from the previous version of the manuscript.


      The following is the authors’ response to the original reviews.

      […]

      The manuscript by Mitra and coworkers analyses the functional role of Orai in the excitability of central dopaminergic neurons in Drosophila. The authors show that a dominant-negative mutant of Orai (OraiE180A) significantly alters the gene expression profile of flight-promoting dopaminergic neurons (fpDANs). Among them, OraiE180A attenuates the expression of Set2 and enhances that of E(z) shifting the level of epigenetic signatures that modulate gene expression. The present results also demonstrate that Set2 expression via Orai involves the transcription factor Trl. The Orai-Trl-Set1 pathway modulates the expression of VGCC, which, in turn, are involved in dopamine release. The topic investigated is interesting and timely and the study is carefully performed and technically sound; however, there are several major concerns that need to be addressed:

      1) In Figure S2E, STIM is overexpressed in the absence of Set2 and this leads to rescue. It is presumed that STIM overexpression causes excess SOCE, yet this is rarely the case. Perhaps the bigger concern, however, is how excess SOCE might overcome the loss of SET2 if SET2 mediates SOCE-induced development of flight. These data are more consistent with something other than SET2 mediating this function.

      Our statement that STIM overexpression overcomes deficits in SOCE is based on the following published work, which has been highlighted in the revised version of the manuscript (see Lines 226-233):

      1. Studies of SOCE in wildtype cultured larval Drosophila neurons demonstrated that overexpression of STIM raised SOCE to the same extent as co-expression of STIM and Orai in the WT background (Chakraborty et al, 2016; Figure 1D).

      2. Both Carbachol-induced IP3-mediated Ca2+ release and SOCE (measured by Ca2+ add back after Thapsigargin-induced store depletion) were rescued in primary cultures of IP3R hypomorphic mutant (itprku) Drosophila neurons by overexpression of STIM (Agrawal et al., 2010; Figure 8A-G).

      3. Deb et al., 2016 (Supplementary Figure 2h,i) reaffirmed that overexpression of STIM significantly improves SOCE after Thapsigargin-induced passive store-depletion in Drosophila neurons expressing IP3RRNAi.

      4. Consistent with the cellular rescue of SOCE, defects in flight initiation and physiology observed in the heteroallelic IP3R hypomorphic background (itprku) could be rescued by overexpression of STIM (Agrawal et al., 2010; Figure 3A-E) as well as Orai (Venkiteswaran and Hasan, 2009; Figure 3).

      5. In Figure S2E, we show that flight deficits arising from THD’> Set2RNAi are rescued upon overexpression of STIM (i.e. THD’>Set2RNAi; STIMOE). Here and in another recent publication (Mitra et al., 2021) we show that neurons expressing Set2RNAi exhibit reduced expression of the IP3R and reduced ER-Ca2+ release presumably leading to reduced SOCE. As mentioned above we have consistently found that STIM overexpression raises both IP3-mediated Ca2+ release and SOCE in Drosophila neurons.

      In this study, we propose that Ca2+ release through the IP3R followed by SOCE are part of a positive feedback loop (described in the revised manuscript- see Lines 302-307) driving expression of Set2 which in turn upregulates expression of mAChR and IP3R (Figure 3F) to regulate dopaminergic neuron function. Our observation that loss of Set2 (THD’>Set2RNAi) can be rescued by STIM overexpression is consistent with this model because:

      1. Loss of Set2 (THD’>Set2RNAi) results in downregulation of several genes including mAChR and IP3R leading to decreased SOCE.

      2. As evident from our previous studies increased STIM expression in the Set2RNAi background (THD’>Set2RNAi; STIMOE) is expected to enhance SOCE which we predict would rescue Set2 expression leading to rescue of other Set2 dependent downstream functions like flight (Figure 2D).

      2) In Figure 3, data is provided linking SET2 expression and Cch-induced Ca2+ responses. The presentation of these data is confusing. In addition, the results may be a simple side effect of SET2-dependent expression of IP3R. Given that this article is about SOCE, why isn't SOCE shown here? More generally, there are no measurements of SOCE in this entire article. Measuring SOCE (not what is measured in response to Cch) could help eliminate some of this confusion.

      This section has been re-written in the revised version for better clarity and we have explained how Set2-dependent IP3R expression is an important component of Orai-mediated Ca2+ entry in fpDANs (see Lines 302-307). Here, we propose that IP3-mediated Ca2+ release and SOCE, through Orai, are together part of a positive feedback loop (see Lines 286-307) driving transcription of Set2 which in turn upregulates mAChR and IP3R expression (Figure 3F). We hypothesized that the observed loss of CCh-induced Ca2+ response in the Set2RNAi background (Figure 3B-D; THD’>Set2RNAi) results from decreased itpr and mAChR expression and verified this in Figure 3E. This is further validated by the rescue of CCh-induced Ca2+ response and itpr/mAChR expression in the OraiE180A background upon Set2 overexpression (Figure 3B-E; THD’>OraiE180A; Set2OE). We were constrained to measure CCh-induced Ca2+ responses in OraiE180A expressing neurons for the following reasons (highlighted in the revised version of the manuscript- (See Lines 307-313; ‘Limitations of the study’-Lines 719-735):

      1. SOCE measurements through Tg mediated store Ca2+ release followed by Ca2+ add back require a 0 Ca2+ environment that can only be achieved in culture. The Drosophila brain is bathed in hemolymph which contains Ca2+ and there do not exist any methods to readily deplete Ca2+ from the tissue to create a 0 Ca2+ environment without also effecting the health of the neurons.
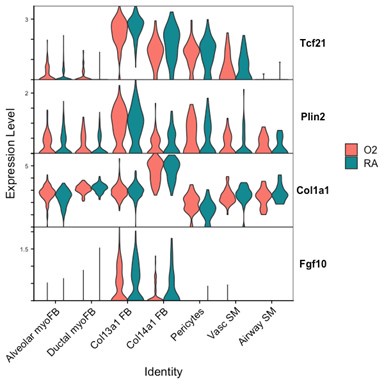
      2. Cultures of the subset of dopaminergic neurons (THD’) we have focused on in this study were not feasible due to the small number of neurons being studied from the total number of dopaminergic neurons in the brain (~35/400). In previous studies we have shown that SOCE post-Tg induced store depletion is abrogated in cultured dopaminergic neurons from Drosophila upon expression of OraiE180A (Pathak et al., 2015). Furthermore, Carbachol-induced IP3-mediated Ca2+ release is tightly coupled to SOCE in Drosophila neurons (Venkiteswaran and Hasan, 2009) and Ca2+ release from the IP3R is physiologically relevant for flight behavior in THD’ neurons (Sharma and Hasan, 2020).

      3) A significant gap in the study relates to the conclusion that trl is a SOCE-regulated transcription factor. This conclusion is entirely based on genetic analysis of STIMKO heterozygous flies in which a copy of the trl13C hypomorph allele is introduced. While these results suggest a genetic interaction between the expression of the two genes, the evidence that expression translates into a functional interaction that places trl immediately downstream of SOCE is not rigorous or convincing. All that can be said is that the double mutant shows a defect in flight which could arise from an interruption of the circuit. Further, it is not clear whether the trl13C hypomorph is only introduced during the critical 72-96 hour time window when the Orai1E180E phenotype shows up. The same applies to the over-expression of Set2 and the other genes. If the expression is not temporally controlled, then the phenotype could be due to the blockade of an entirely different aspect of flight neuron function.

      The idea that Trl functions downstream of Orai-mediated Ca2+ entry in THD’ neurons is based on the following genetic evidence (highlighted in the revised version; see Lines 339-341; 351-367; 647-65; ‘Limitations of the study’: 736-739)

      1. In Figure 4D, we show evidence of genetic interaction between trl-STIM and trl-Set2. The rescue of trl13c/STIMKO with STIM overexpression in THD’ neurons indicates that excess SOCE (driven by STIMOE) may activate the residual Trl (there exists a WT Trl copy in this genetic background) to rescue THD’ flight function. This is further supported by the rescue of trl/STIMKO with Set2 overexpression in THD’ neurons, which is consistent with the feedback loop model proposed in Figure 5C (see Lines 390-396) where we propose that reduced SOCE leads to reduced ‘activated’ Trl and thus reduced Set2 expression, and the latter is rescued by SET2OE . The manner in which SOCE ‘activates’ Trl is the subject of ongoing investigations.

      2. The trl hypomorphic alleles (including trl13C) exist as genetic mutants and they affect Trl function in all tissues throughout development. While we concede that these mutant alleles would affect multiple functions at other stages of development, which may impinge on the phenotypes noted in Figure S4B, we have used a targeted RNAi approach to validate Trl function specifically in the THD’ neurons (see Figure 4C; Lines 339-341).

      3. Overexpression mediated rescues (including Set2) were not induced only during the critical 72-96 hrs APF developmental window. Having established that Orai function drives critical gene expression during this window (Figure 1), it is reasonable to assume that Set2 rescue of loss of flight in OraiE180A occurs in the same time window where flight is disrupted (see Lines 221-224).

      4) In Figure 4, data is shown that SOCE compensates for the loss of Trl, the presumed mediator of SOCE-dependent flight. The fact that flight deficits are rescued by raising SOCE in the absence of Trl is very inconsistent with this conclusion.

      We apologise for this confusion and have clarified in the revision (see Lines 346-367). trl13c is a recessive allele of Trl and has been written as such throughout the text and in the figures (i.e trl13c and NOT Trl13c). In all cases of Trl mutant rescue by STIMOE and Set2OE there exists residual Trl that can be activated by excess SOCE thus leading to the rescue. This is true for trl13C/ STIMKO where each mutant is present as a heterozygote (the complete genotype of this strain is STIMKO/+; trl13c/+; this has been corrected in the revision). Similarly, for TrlRNAi we expect reduced levels (but not complete loss) of Trl. Thus the SOCE rescue of loss of Trl occurs in conditions where Trl levels are reduced but NOT absent. Homozygous trl null mutants are lethal.

      5) In Figure 5 (A-C), data is provided that Trl transcripts are unaffected by loss of SOCE and that overexpression cannot rescue flightlessness. From this, the authors conclude that this gene "must" be calcium responsive. While that is one possibility, it is also possible that these genes are not functionally linked.

      The idea that Trl is functionally linked to SOCE is based on the following evidence (included in the revised version- see Lines 339-341; 346-367; 391-396)

      1. In Figure 4C we show that flight defects caused by partial loss of Trl (THD’>TrlRNAi) were rescued by STIM overexpression (THD’>TrlRNAi; STIMOE). As mentioned above we have found that STIM overexpression raises SOCE.

      2. Heteroalleles of the trl13C hypomorph exhibit a strong genetic interaction with a single copy of the null allele of STIMKO as shown by the flight deficit of trl13c/+; STIMKO/+ (trl13C/STIMKO ) flies (Figure 4D). The genotypes will be corrected in the revision.

      3. Flight defects in trl13C/STIMKO flies could be rescued by STIM overexpression in the THD’ neurons (trl13C/STIMKO; THD’>STIMOE)

      4. In Figure 4E, we show that partial loss of Trl in THD’ neurons (THD’>TrlRNAi) leads to decreased expression of the Ca2+ responsive genes mAChR, itpr, and Set2 genes indicating that Trl is a constituent of the SOCE-driven transcriptional feedback loop (see Figure 5C).

      Since we could not detect a well-defined Ca2+ binding domain in Trl, we hypothesize that it could be activated by a Ca2+ dependent post-translational modification. Phosphoproteome analysis of Trl demonstrated that it does indeed undergo phosphorylation at a Threonine residue (T237; Zhai et al., 2008), which lies within a potential site for CaMKII. Independently, CaMKII has been identified as a binding partner of Trl from a Trl interactome study (Lomaev et al., 2018). Past work from our group (Ravi et al., 2018) identified a role for CaMKII in THD’ neurons in the context of flight. We are currently testing if CaMKII functions downstream of SOCE in THD’ neurons to mediate flight and will update this information in the next version of the manuscript.

      Now included in the revised version of the manuscript as Figure S5; Lines 397-424)

      6) There is no characterization of SOCE in fpDANs from flies expressing native Orai or the dominant negative OraiE180A mutant. While the authors refer to previous studies, as the manuscript is essentially based on Orai function thapsigargin-induced SOCE should be tested using the Ca2+ add-back protocol in order to assess the release of Ca2+ from the ER in response to thapsigargin as well as the subsequent SOCE.

      The fpDANs consist of 16-19 neurons in each hemisphere (PPL1 are 10-12 and PPM3 are 6-7 cells; Pathak et al., 2015). Measuring SOCE from these neurons in vivo is not possible due to the presence of abundant extracellular Ca2+ in the brain. Given their sparse number, it proved technically challenging to isolate the fpDANs in culture to perform SOCE measurements using the Ca2+ add back protocol. Due to these reasons, we have relied upon using Carbachol to elicit IP3-mediated Ca2+ release and SOCE as a proxy for in vivo SOCE. In previous studies we have shown that Carbachol treatment of cultured Drosophila neurons elicits IP3-mediated Ca2+ release and SOCE (Agrawal et al., 2010; Figure 8). Moreover, expression of OraiE180A completely blocks SOCE as measured in primary cultures of dopaminergic neurons (Pathak et al., 2015; Figure 1E). Hence we have not repeated SOCE measurements from all dopaminergic neurons in this work. In the revised version we have explicitly stated this weakness of our study and the reasons for it (See Lines 307-313; ‘Limitations of the study’-Lines 719-735).

      7) In the experiments performed to rescue flight duration in Set2RNAi individuals the authors overexpress STIM and attribute the effect to "Excess STIM presumably drives higher SOCE sufficient to rescue flight bout durations caused by deficient Set2 levels.". This should be experimentally tested as the STIM:Orai stoichiometry has been demonstrated as essential for SOCE.

      The assumption that STIM overexpression drives higher SOCE is based upon previously published work from Drosophila neurons (Agrawal et al., 2010; Chakraborty et al, 2016; Deb et al., 2016) which demonstrates that excess WT STIM overcomes IP3R deficiencies (RNAi or hypomorphic mutants) to rescue SOCE. We agree that STIM-Orai stoichiometry is essential for SOCE, and propose that the rescue backgrounds possess sufficient WT Orai, which is recruited by the excess STIM to mediate the rescue. We have referenced the earlier work to validate our use of STIMOE for rescue of SOCE (See Lines 226-233).

      Here, we propose that Set2 is part of a positive feedback loop (see Lines 286-307) driving transcription of mAChR and IP3R (Figure 3F). In keeping with this hypothesis, we posit that the phenotypes observed in the Set2RNAi background (Figure 2D) result from decreased itpr and mAChR expression (validated in Figure 3E). This is further validated by the Set2 overexpression mediated rescue of OraiE180A (Figure 2D) and rescue of itpr/mAChR expression in the OraiE180A background (Figure 3B-E; THD’>OraiE180A; Set2OE).

      8) The authors show that overexpression of OraiE108A results in Stim downregulation at a mRNA level. What about the protein level? And more important, how does OraiE108A downregulate Stim expression? Does it promote Stim degradation? Does it inhibit Stim expression?

      We hypothesize that changes in STIM mRNA observed in the THD’ > OraiE180A neurons stems from an overall reduction in IP3-mediated Ca2+ release and SOCE due to loss of Trl-Set2 driven gene expression detailed in our transcriptional feedback loop model (Figure 5C; see Lines 286-307; 581-591). We have attempted to explain this aspect more clearly in the revised version of the manuscript. While we agree that measuring levels of STIM protein would be helpful, estimation of protein levels from a limited number of neurons (~35 cells per brain) is technically challenging. The STIM antibody does not work well in immunohistochemistry. In the absence of any experimental evidence we cannot comment on how expression of OraiE180A might affect STIM protein turnover (see Lines 307-313).

      9) Lines 271-273, the authors state "whereas overexpression of a transgene encoding Set2 in THD' neurons either with loss of SOCE (OraiE180A) or with knockdown of the IP3R (itprRNAi), lead to significant rescue of the Ca2+ response". This is attributed to a positive effect of Set2 expression on IP3R expression and the authors show a positive correlation between these two parameters; however, there is no demonstration that Set2 expression can rescue IP3R expression in cells where the IP3R is knocked down (itprRNAi). This should be further demonstrated.

      The rescue of IP3R expression by Set2 overexpression in itprRNAi was demonstrated in a different set of Drosophila neurons in an earlier study (Mitra et al., 2021) and has not been repeated specifically in THD’ neurons (see Lines 286-307). Similar to the previous study, here we tested CCh stimulated Ca2+ responses of THD’ neurons with itprRNAi and itprRNAi; SetOE (Fig S3), which are indeed rescued by SET2OE see Lines 280-285)

      10) The data presented in Figure 3E should be functionally demonstrated by analyzing the ability of CCh to release Ca2+ from the intracellular stores in the absence of extracellular Ca2+.

      CCh-mediated Ca2+ release from the intracellular stores in the absence of extracellular Ca2+ has been described in primary cultures of Drosophila neurons in previously published work (Venkiteswaran and Hasan, 2009; Agrawal et al., 2010) This work focuses on a set of 16-19 dopaminergic neurons in a hemisphere of the Drosophila central brain. It is technically challenging to generate a 0 Ca2+ environment in vivo, which is essential for measuring store Ca2+ release. Given their meagre numbers, primary cultures of these neurons is not readily feasible. (see Lines 307-313; ‘Limitations of the study’-Lines 719-735)

      11) The conclusion that SOCE regulates the neuronal excitability threshold is based entirely on either partial behavioral rescue of flight, or measurements of KCl-induced Ca2+ rises monitored by GCaMP6m in DAN neurons. The threshold for neuronal excitability is a precise parameter based on rheobase measurements of action potentials in current-clamp. Measurements of slow calcium signals using a slow dye such as GCaMp6m should not be equated with neuronal excitability. What is measured is a loss of the calcium response in high K depolarization experiments, which occurs due to the loss of expression of Cav channels. Hence, the use of this term is not accurate and will confuse readers. The use of terms referring to neuronal excitability needs to be changed throughout the manuscript. As such, the conclusions regarding neuronal excitability should be strongly tempered and the data reinterpreted as there are no true measurements of neuronal excitability in the manuscript. All that can be said is that expression of certain ion channel genes is suppressed. Since both Na+ channels and K+ channel expression is down-regulated, it is hard to say precisely how membrane excitability is altered without action potential analysis.

      The claim that SOCE influences neuronal excitability is based on the following observations:

      1. Interruption of the transcriptional feedback loop involving SOCE, Trl, and Set2 through loss of any of its constituents, results in the downregulation of VGCCs (Figure 5G, 6H), which are essential components of action potentials.

      2. OraiE180A mediated loss of SOCE in THD’ neurons abrogates the KCl-evoked depolarization response (Figure 6B, C) measured using GCaMP6m. We verified that this response requires VGCC function using pharmacological inhibition of L-type VGCCs (Figure 6E, F).

      3. SOCE deficient THD’ neurons, which were presumably compromised in their ability to evoke action potentials could be rescued to undergo KCl-evoked depolarisation by expression of NachBac, which lowers the depolarization threshold (Figure 7C, D) or through optogenetic stimulation using CsChrimson (Figure 7F).

      We agree that ‘neuronal excitability threshold’ is a precise electrophysiological parameter that has not been directly investigated here by measurement of action potentials. Therefore, references to neuronal excitability have been tempered throughout the revised manuscript and be replaced with a more generic reference to ‘neuronal activity’. In this context we have included further evidence supporting reduced activity of THD’ neurons upon loss of SOCE in the revision.

      Since one of the key functional outcomes of activity during critical developmental periods such as the 72-96 hrs APF developmental window identified in this study, is remodelling of neuronal morphology, we decided to investigate the same in our context. Neuronal activity can drive changes in neurite complexity and axonal arborization (Depetris-Chauvin et al., 2011) especially during critical developmental periods (Sachse et al., 2007). To understand if Orai mediated Ca2+ entry and downstream gene expression through Set2 affects this activity-driven parameter, we investigated the morphology of fpDANs, and specifically measured the complexity of presynaptic terminals within the 2’1 lobe MB using super-resolution microscopy. We found striking changes in the neurite volume upon expression of OraiE180A which could be rescued by restoring either Set2 (OraiE180A; Set2OE) or by inducing hyperactivity through NachBac expression (OraiE180A ; NachBacOE). These data have been included in the revised manuscript (Figure 8 B, C, D; see Lines 481-482; 519-534; 584-591; 701-704).

      12) Related, since trl does not contain any molecular domains that could be regulated by Ca2+ signaling, it is unclear whether trl is directly regulated by SOCE or the regulation is highly indirect. Reporter assays evaluating trl activation upon Ca2+ rises would provide much stronger and more direct evidence for the conclusion that trl is a SOCE-regulated TF. As such the evidence is entirely based on RNAi downregulation of trl which indicates that trl is essential but has no bearing on exactly what point of the signaling cascade it is involved.

      We agree that luciferase Trl reporters would provide a direct method to test SOCE-mediated activation. Future investigations will be targeted in this direction. Regarding possible mechanisms of Trl activation - since we could not detect a well-defined Ca2+ binding domain in Trl, we hypothesize that it may be phosphorylation by a Ca2+ sensitive kinase. Phosphoproteome analysis of Trl indicates that it does indeed undergo phosphorylation at a Threonine reside (T237; Zhai et al., 2008), which may be mediated by the Ca2+ sensitive kinase-CaMKII based on binding partners identified in the Trl interactome (Lomaev et al., 2018; Past work (Ravi et al., 2018) has indeed demonstrated a requirement for CaMKII in THD’ neurons for flight. We are currently testing whether CaMKII functions downstream of SOCE in these neurons to mediate flight, and will be updating this information in the next version of the manuscript.

      New data and analysis has been included - see Figure S5; ‘Limitations of the study’- Lines 397-424; 736-739).

      13) Are NFAT levels altered in the Orai1 loss of function mutant? If not, this should be explicitly stated. It would seem based on previous literature that some gene regulation may be related to the downregulation of this established Ca2+-dependent transcription factor. Same for NFkb.

      As mentioned in the revised version of the manuscript (see Lines 315-326), Drosophila NFAT lacks a calcineurin binding site and is therefore not sensitive to Ca2+ (Keyser et al., 2007). In the past we tested if knockdown of NF-kB in dopaminergic neurons gave a flight phenotype and did not observe any measurable deficit. From the RNAseq data we find a slight downregulation of NFAT (0.49 fold, p value=0.048) and NF-kb (0.26 fold, p value =0.258) the significance of which is unclear at this point. We did not find any consensus binding sites for these two factors in the regulatory regions of downregulated genes from THD’ neurons.

      14) Does over-expression of Set2 restore ion channel expression especially those of the VGCCs? This would provide rigorous, direct evidence that SOCE-mediated regulation of VGCCs through Set2 controls voltage-gated calcium channel signaling.

      Set2 overexpression in the OraiE180A background indeed restores the expression of VGCC genes (see Figure 6H; Lines 461-468).

      15) All 6 representative panels from Figure 3B are duplicated in Figure 4G. Likewise, 2 representative panels from Figure 5H are duplicated in Figure 6D. Although these panels all represent the results from control experiments, the relevant experiments were likely not conducted at the same time and under the same conditions. Thus, control images from other experiments should not be used simply because they correspond to controls. This situation should be clarified.

      We regret the confusion caused by the same representative images for the control experiments. These have been replaced by new representative images for Figure 4G and 6D in the updated version of the manuscript.

      16) The figures are unusually busy and difficult to follow. In part this is because they usually have many panels (Fig. 1: A-I; Fig. 2, A-J, etc) but also because the arrangement of the panels is not consistent: sometimes the following panel is found to the right, other times it is below. It would help the reader to make the order of the panels consistent, and, if possible, reduce the number of panels and/or move some of the panels to new figures (eLife does not limit the number of display items).

      The image panels have been rearranged for ease of reading in the updated version of the manuscript.

      17) As a final recommendation, the reviewers suggest that the authors a- Reword the text that refers to membrane excitability since membrane excitability was not directly measured here. b-Explain why STIM1 rescues the partial loss of flight in Set2 RNAi flies (Fig. S2E); and c- Explain how/why trl is calcium regulated and test using luciferase (or other) reporter assays whether Orai activation leads to trl activation.

      a. Textual references to membrane excitability have been appropriately modified and some new data has been included in this regard (see Figure 8 B, C, D; Lines 481-483; 519-534; 584-591; 701-704).

      b. We have provided a detailed explanation for how STIM overexpression might rescue the phenotypes caused by Set2RNAi in Point 1 (see Lines 226-233). In short, these phenotypes depend upon IP3R mediated Ca2+ entry driving a transcriptional feedback loop. We relied upon past reports that STIM overexpression upregulates IP3R-mediated Ca2+ release and SOCE in Drosophila itpr mutant neurons (Agrawal et al., 2010; Chakraborty et al, 2016; Deb et al, 2016). We therefore propose that STIM overexpression in the Set2RNAi background rescues IP3R mediated Ca2+ release followed by SOCE, which drives enhanced Set2 transcription, counteracting the effects of the RNAi. We will explain this more clearly with past references in the next revision.

      c. We have provided a detailed response to this comment in Point 12. Briefly, we agree that building luciferase reporters for Trl could be an ideal strategy to test for its responsiveness to SOCE and needs to be done in future. As an alternate strategy, we have looked at data from existing studies of interacting partners of Trl (Lomaev et al., 2017) and identified CamKII, which is both Ca2+ responsive (Braun and Schulman, 1995; Yasuda et al., 2022), and thus might activate Trl through a phosphorylation-switch like mechanism (see Figure S5; ‘Limitations of the study’-736-739; Lines 397-424). Moreover, a previous publication identified a requirement for CamKII in THD’ neurons for Drosophila flight (Ravi et al., 2018). We have tested the ability of a dominant active version of CamKII to rescue THD’>E180A flight deficits and have included this information in the next version of the manuscript.

      References

      1. Agrawal N, Venkiteswaran G, Sadaf S, Padmanabhan N, Banerjee S, Hasan G. Inositol 1,4,5-Trisphosphate Receptor and dSTIM Function in Drosophila Insulin-Producing Neurons Regulates Systemic Intracellular Calcium Homeostasis and Flight. J Neurosci. 2010;30:1301-1313. doi:10.1523/jneurosci.3668-09.2010

      2. Braun AP, Schulman H. A non-selective cation current activated via the multifunctional Ca(2+)-calmodulin-dependent protein kinase in human epithelial cells. J Physiol. 1995. 488:37-55. doi:10.1113/jphysiol.1995.sp020944

      3. Chakraborty S, Deb BK, Chorna T, Konieczny V, Taylor CW, Hasan G. Mutant IP3 receptors attenuate store-operated Ca2+ entry by destabilizing STIM-Orai interactions in Drosophila neurons. J Cell Sci. 2016. 129:3903-3910. doi:10.1242/jcs.191585

      4. Deb BK, Pathak T, Hasan G. Store-independent modulation of Ca2+ entry through Orai by Septin 7. Nat Commun. 2016. 7:11751. doi:10.1038/ncomms11751

      5. Depetris-Chauvin A, Berni J, Aranovich EJ, Muraro NI, Beckwith EJ, Ceriani MF. Adult-specific electrical silencing of pacemaker neurons uncouples molecular clock from circadian outputs. Curr Biol. 2011. 21:1783-1793. doi: 10.1016/j.cub.2011.09.027.

      6. Keyser P, Borge-Renberg K, Hultmark D. The Drosophila NFAT homolog is involved in salt stress tolerance. Insect Biochem Mol Biol. 2007. 37:356-362. doi:10.1016/j.ibmb.2006.12.009

      7. Kilo L, Stürner T, Tavosanis G, Ziegler AB. Drosophila Dendritic Arborisation Neurons: Fantastic Actin Dynamics and Where to Find Them. Cells. 2021. 10:2777. doi:10.3390/cells10102777

      8. Lomaev D, Mikhailova A, Erokhin M, et al. The GAGA factor regulatory network: Identification of GAGA factor associated proteins. PLoS One. 2017. 12:e0173602. doi:10.1371/journal.pone.0173602

      9. Mitra R, Richhariya S, Jayakumar S, Notani D, Hasan G. IP3/Ca2+ signals regulate larval to pupal transition under nutrient stress through the H3K36 methyltransferase dSET2. Development. 2021. 148:dev199018. doi:10.1101/2020.11.25.399329

      10. Pathak T, Agrawal T, Richhariya S, Sadaf S, Hasan G. Store-Operated Calcium Entry through Orai Is Required for Transcriptional Maturation of the Flight Circuit in Drosophila. J Neurosci. 2015. 35:13784-13799. doi:10.1523/jneurosci.1680-15.2015

      11. Ravi P, Trivedi D, Hasan G. FMRFa receptor stimulated Ca2+ signals alter the activity of flight modulating central dopaminergic neurons in Drosophila melanogaster. Barsh GS, ed. PLOS Genet. 2018. 14:e1007459. doi:10.1371/journal.pgen.1007459

      12. Sachse S, Rueckert E, Keller A, Okada R, Tanaka NK, Ito K, Vosshall LB. Activity-dependent plasticity in an olfactory circuit. Neuron. 2007. 56:838-50. doi: 10.1016/j.neuron.2007.10.035.

      13. Sharma A, Hasan G. Modulation of flight and feeding behaviours requires presynaptic IP3Rs in dopaminergic neurons. Elife. 2020;9. e62297.doi:10.7554/elife.62297

      14. Venkiteswaran G, Hasan G. Intracellular Ca2+ signalling and store operated Ca2+ entry are required in Drosophila neurons for flight. Proc Natl Acad Sci. 2009.106:10326-10331. doi: 10.1073/pnas.0902982106

      15. Yasuda R, Hayashi Y, Hell JW. CaMKII: a central molecular organizer of synaptic plasticity, learning and memory. Nat Rev Neurosci. 2022. 23: 666-682 doi:10.1038/s41583-022-00624-2

      16. Zhai B, Villén J, Beausoleil SA, Mintseris J, Gygi SP. Phosphoproteome Analysis of Drosophila melanogaster Embryos. J Proteome Res. 2008. 7:1675-1682. doi:10.1021/pr700696a

    1. eLife Assessment

      The authors use a multidisciplinary approach to provide a link between Beta-alanine and S. Typhimurium (STM) infection and virulence. This valuable work shows how Beta-alanine synthesis mediates zinc homeostasis regulation, possibly contributing to virulence. The work is convincing as it adds to the existing knowledge of metabolic flexibility displayed by STM during infection.

    2. Reviewer #1 (Public review):

      Summary:

      Ma & Yang et al. report a new investigation aimed at elucidating one of the key nutrients S. Typhimurium (STM) utilizes with the nutrient-poor intracellular niche within macrophage, focusing on the amino acid beta-alanine. From these data, the authors report that beta-alanine plays important roles in mediating STM infection and virulence. The authors employ a multidisciplinary approach that includes some mouse studies, and ultimately propose a mechanism by which panD, involved in B-Ala synthesis, mediates regulation of zinc homeostasis in Salmonella.

      Strengths and weaknesses:

      The results and model are adequately supported by the authors' data. Further work will need to be performed to learn whether the Zn2+ functions as proposed in their mechanism. By performing a small set of confirmatory experiments in S. Typhi, the authors provide some evidence of relevance to human infections.

      Impact:

      This work adds to the body of literature on the metabolic flexibility of Salmonella during infection that enable pathogenesis.

    3. Reviewer #3 (Public review):

      Salmonella is interesting due to its life within a compact compartment, which we call SCV or Salmonella containing vacuole in the field of Salmonella. SCV is a tight-fitting vacuole where the acquisition of nutrients is a key factor by Salmonella. The authors among many nutrients, focused on beta-alanine. It is also known that Salmonella requires beta-alanine from many other studies. The authors have done in vitro RAW macrophage infection assays and In vivo mouse infection assays to see the life of Salmonella in the presence of beta-alanine. They concluded by comprehending that beta-alanine modulates the expression of many genes including zinc transporters which is required for pathogenesis.

      [Editors' note: The authors have appropriately addressed the previous reviewers' concerns.]

    4. Author response:

      The following is the authors’ response to the previous reviews

      Reviewer #1 (Public review):

      Summary:

      Ma & Yang et al. report a new investigation aimed at elucidating one of the key nutrients S. Typhimurium (STM) utilizes with the nutrient-poor intracellular niche within macrophage, focusing on the amino acid beta-alanine. From these data, the authors report that beta-alanine plays important roles in mediating STM infection and virulence. The authors employ a multidisciplinary approach that includes some mouse studies, and ultimately propose a mechanism by which panD, involved in B-Ala synthesis, mediates regulation of zinc homeostatisis in Salmonella.

      Strengths and weaknesses:

      The results and model are adequately supported by the authors' data. Further work will need to be performed to learn whether the Zn2+ functions as proposed in their mechanism. By performing a small set of confirmatory experiments in S. Typhi, the authors provide some evidence of relevance to human infections.

      Impact:

      This work adds to the body of literature on the metabolic flexibility of Salmonella during infection that enable pathogenesis.

      Reviewer #1 (Recommendations for the authors):

      No further suggestions. The authors have adequately addressed my prior concerns through new data and revisions to the text.

      Thank you for considering this work. We appreciate your efforts in aiding us to improve our manuscript.

      Reviewer #3 (Public review):

      Summary:

      Salmonella is interesting due to its life within a compact compartment, which we call SCV or Salmonella containing vacuole in the field of Salmonella. SCV is a tight-fitting vacuole where the acquisition of nutrients is a key factor by Salmonella. The authors among many nutrients, focussed on beta-alanine. It is also known that Salmonella requires beta-alanine from many other studies. The authors have done in vitro RAW macrophage infection assays and In vivo mouse infection assays to see the life of Salmonella in the presence of beta-alanine. They concluded by comprehending that beta-alanine modulates the expression of many genes including zinc transporters which is required for pathogenesis.

      Strengths:

      Made a couple of knockouts in Salmonella and did transcriptomic to understand the global gene expression pattern

      Weaknesses:

      (1) Transport of Beta-alanine to SCV is not yet elucidated. Is it possible to determine whether the Zn transporter is involved in B-alanine transport?

      Thank you for the comment. Following your suggestion, we investigated the growth of Salmonella WT and the ∆znuA mutant cultured in N-minimal and M9 minimal medium, with β-alanine as the sole carbon source. We observed no significant difference in growth kinetics between the ∆znuA mutant and WT strain under either culture condition (please refer to Author response image 1). The results indicate that ZnuA is not involved in β-alanine transport in Salmonella.

      Author response image 1.

      (2) Beta-alanine can also be shuttled to form carnosine along with histidine. If beta-alanine is channelled to make more carnosine, then the virulence phenotypes may be very different.

      Our study reveals that β-alanine availability, whether obtained from the host or synthesized de novo via the panD-dependent pathway, is important for Salmonella pathogenesis. We have shown that β-alanine influences Salmonella intracellular replication and in vivo virulence partly by enhancing the expression of the zinc transporter genes.

      Although β-alanine can also be shuttled to form carnosine along with histidine in animals, the Salmonella genome lacks canonical carnosine synthase (CARNS) orthologs that catalyze the condensation of β-alanine and histidine into carnosine. Therefore, we believe that the carnosine biosynthetic pathway does not influence the virulence phenotypes of Salmonella.

      (3) Some amino acid transporters can be knocked out to see if beta-alanine uptake is perturbed. Like ArgT transport Arginine, and its mutation perturbs the uptake of beta-alanine. What is the beta-alanine concentration in the SCV? SCVS can be purified at different time points, and the Beta-alanine concentration can be measured

      Thank you for the comment. As suggested, we have investigated the role of other amino acid transporters in the uptake of β-alanine. In E. coli, GabP transports γ-aminobutyric acid (GABA), a structural analogue of β-alanine, and may also transport β-alanine (J Bacteriol. 2021, 203(4):e00642-20). Nevertheless, SalmonellagabP mutant displayed no growth defect in minimal medium with β-alanine as the sole carbon source (Figure 1_figure Supplement 7, Figure 1_figure Supplement 8), indicating that GabP is not involved in β-alanine uptake in Salmonella. Strikingly, the Δ_argT_ mutant—defective in arginine uptake—showed markedly decreased growth in the minimal medium with β-alanine as the sole carbon source (Figure 1F),suggesting that ArgT also transports β-alanine in Salmonella. We have added the results in the revised manuscript (lines 167-179).

      It has been reported that ArgT is essential for Salmonella replication within macrophages and full virulence in vivo (PloS one. 2010, 5(12):e15466). Given that ArgT is involved in both arginine and β-alanine uptake (as verified in this study), whether the attenuated virulence of the ∆argT mutant is due to a deficiency in β-alanine or arginine requires further investigation. We have also included a discussion on this issue (lines 409-415).

      In this work, to avoid delays and alterations in metabolite concentrations during the isolation of bacterial contents from macrophages, we directly assessed the combined metabolite concentrations within infected cells and Salmonella. It has been previously verified that these metabolites are primarily of host origin (Nat Commun. 2021, 12(1):879.). We noted a decrease in β-alanine levels in macrophages infected with Salmonella. The process of separating SCV is intricate and encompasses dissociation and sonication (Nat Commun. 2018, 9(1):2091). These steps may potentially result in alterations of metabolite concentrations during the separation procedure. Therefore, we did not measure the β-alanine concentration in the SCV.

      Reviewer #3 (Recommendations for the authors):

      The Authors have done meticulous experiments to address the questions asked by the reviewers. My one question of beta-alanine transport inside the SCV remains undone, though the authors have tried.

      Was Zinc transporter mutant checked? It is possible that the Zn transporter can take up Beta-alanine.

      Thank you for the comment. Following your suggestion, we investigated the growth of Salmonella WT and the ∆znuA mutant cultured in N-minimal and M9 minimal medium, with β-alanine as the sole carbon source. We observed no significant difference in growth kinetics between the ∆znuA mutant and WT strain under either culture condition (please refer to Author response image 1). The results indicate that ZnuA is not involved in β-alanine transport in Salmonella.

      Additionally, we have investigated the role of other amino acid transporters in the uptake of β-alanine and have ultimately identified that ArgT, the arginine transporter, is involved in the uptake of β-alanine in Salmonella (please refer to our previous response).

    1. Author Response:

      Reviewer #1 (Public Review):

      Summary:<br /> The global decline of amphibians is primarily attributed to deadly disease outbreaks caused by the chytrid fungus, Batrachochytrium dendrobatidis (Bd). It is unclear whether and how skin-resident immune cells defend against Bd. Although it is well known that mammalian mast cells are crucial immune sentinels in the skin and play a pivotal role in the immune recognition of pathogens and orchestrating subsequent immune responses, the roles of amphibian mast cells during Bd infections are largely unknown. The current study developed a novel way to enrich X. laevis skin mast cells by injecting the skin with recombinant stem cell factor (SCF), a KIT ligand required for mast cell differentiation and survival. The investigators found an enrichment of skin mast cells provides X. laevis substantial protection against Bd and mitigates the inflammation-related skin damage resulting from Bd infection. Additionally, the augmentation of mast cells leads to increased mucin content within cutaneous mucus glands and shields frogs from the alterations to their skin microbiomes caused by Bd.

      Strengths:<br /> This study underscores the significance of amphibian skin-resident immune cells in defenses against Bd and introduces a novel approach to examining interactions between amphibian hosts and fungal pathogens.

      Weaknesses:<br /> The main weakness of the study is the lack of functional analysis of X. laevis mast cells. Upon activation, mast cells have the characteristic feature of degranulation to release histamine, serotonin, proteases, cytokines, and chemokines, etc. The study should determine whether X. laevis mast cells can be degranulated by two commonly used mast cell activators IgE and compound 48/80 for IgE-dependent and independent pathways. This can be easily done in vitro. It is also important to assess whether in vivo these mast cells are degranulated upon Bd infection using avidin staining to visualize vesicle releases from mast cells. Figure 3 only showed rSCF injection caused an increase in mast cells in naïve skin. They need to present whether Bd infection can induce mast cell increase and rSCF injection under Bd infection causes a mast cell increase in the skin. In addition, it is unclear how the enrichment of mast cells provides protection against Bd infection and alternations to skin microbiomes after infection. It is important to determine whether skin mast cells release any contents mentioned above.

      We would like to thank the reviewer for taking the time to review our work and for providing us with valuable feedback.

      Please note that amphibians do not possess the IgE antibody isotype1.

      To our knowledge there have been no published studies using approaches for studying mammalian mast cell degranulation to examine amphibian mast cells. Notably, several studies suggest that amphibian mast cells lack histamine2, 3, 4, 5 and serotonin2, 6. While there are commercially available kits and reagents for examining mammalian mast cell granule content, most of these reagents may not cross-react with their amphibian counterparts. This is especially true of cytokines and chemokines, which diverged quickly with evolution and thus do not share substantial protein sequence identity across species as divergent as frogs and mammals. Respectfully, while following up on these findings is possible, it would involve considerable additional work to find reagents that would detect amphibian mast cell contents.

      We would also like to respectfully point out that while mast cell degranulation is a feature most associated with mammalian mast cells, this is not the only means by which mammalian mast cells confer their immunological effects. While we agree that defining the biology of amphibian mast cell degranulation is important, we anticipate that since the anti-Bd protection conferred by enriching frog mast cells is seen after 21 days of enrichment, it is quite possible that degranulation may not be the central mechanism by which the mast cells are mediating this protection.

      As noted in our manuscript, frog mast cells upregulate their expression of interleukin-4 (IL4), which is a hallmark cytokine associated with mammalian mast cells7. We are presently exploring the role of the frog IL4 in the observed mast cell anti-Bd protection. Should we generate meaningful findings in this regard, we will add them to the revised version of this manuscript.

      We are also exploring the heparin content of frog mast cells and capacities of these cells to degranulate in vitro in response to compound 48/80. In addition, we are exploring in vivo mast cell degranulation via histology and avidin-staining. Should these studies generate significant findings, we will include them in the revised version of this manuscript.

      Per the reviewer’s suggestion, in our revised manuscript we also plan to include data showing whether Bd infections affect skin mast cell numbers and how rSCF injection impacts skin mast cell numbers in the context of Bd infections.

      In regard to how mast cells impact Bd infections and skin microbiomes, our data indicate that mast cells are augmenting skin integrity during Bd infections and promoting mucus production, as indicated by the findings presented in Figure 4A-C and Figure 5A-C, respectively. There are several mammalian mast cell products that elicit mucus production. In mammals, this mucus production is mediated by goblet cells while the molecular control of amphibian skin mucus gland content remains incompletely understood. Interleukin-13 (IL13) is the major cytokine associated with mammalian mucus production8, while to our knowledge this cytokine is either not encoded by amphibians or else has yet to be identified and annotated in these animals’ genomes. IL4 signaling also results in mucus production9 and we are presently exploring the possible contribution of the X. laevis IL4 to skin mucus gland filling. Any significant findings on this front will be included in the revised manuscript. Histamine release contributes to mast cell-mediated mucus production10, but as we outline above, several studies indicate that amphibian mast cells may lack histamine2, 3, 4, 5. Mammalian mast cell-produced lipid mediators also play a critical role in eliciting mucus secretion11 and our transcriptomic analysis indicates that frog mast cells express several enzymes associated with production of such mediators. We will highlight this observation in our revised manuscript.

      We anticipate that X. laevis mast cells influence skin integrity, microbial composition and Bd susceptibility in a myriad of ways. Considering the substantial differences between amphibian and mammalian evolutionary histories and physiologies, we anticipate that many of the mechanisms by which X. laevis mast cells confer anti-Bd protection will prove to be specific to amphibians and some even unique to X. laevis. We are most interested in deciphering what these mechanisms are but foresee that they will not necessarily reflect what one would expect based on what we know about mammalian mast cells in the context of mammalian physiologies.

      Reviewer #2 (Public Review):

      Summary:<br /> In this study, Hauser et al investigate the role of amphibian (Xenopus laevis) mast cells in cutaneous immune responses to the ecologically important pathogen Batrachochytrium dendrobatidis (Bd) using novel methods of in vitro differentiation of bone marrow-derived mast cells and in vivo expansion of skin mast cell populations. They find that bone marrow-derived myeloid precursors cultured in the presence of recombinant X. laevis Stem Cell Factor (rSCF) differentiate into cells that display hallmark characteristics of mast cells. They inject their novel (r)SCF reagent into the skin of X. laevis and find that this stimulates the expansion of cutaneous mast cell populations in vivo. They then apply this model of cutaneous mast cell expansion in the setting of Bd infection and find that mast cell expansion attenuates the skin burden of Bd zoospores and pathologic features including epithelial thickness and improves protective mucus production and transcriptional markers of barrier function. Utilizing their prior expertise with expanding neutrophil populations in X. laevis, the authors compare mast cell expansion using (r)SCF to neutrophil expansion using recombinant colony-stimulating factor 3 (rCSF3) and find that neutrophil expansion in Bd infection leads to greater burden of zoospores and worse skin pathology.

      Strengths: <br /> The authors report a novel method of expanding amphibian mast cells utilizing their custom-made rSCF reagent. They rigorously characterize expanded mast cells in vitro and in vivo using histologic, morphologic, transcriptional, and functional assays. This establishes solid footing with which to then study the role of rSCF-stimulated mast cell expansion in the Bd infection model. This appears to be the first demonstration of the exogenous use of rSCF in amphibians to expand mast cell populations and may set a foundation for future mechanistic studies of mast cells in the X. laevis model organism. 

      We thank the reviewer for recognizing the breadth and extent of the undertaking that culminated in this manuscript. Indeed, this manuscript would not have been possible without considerable reagent development and adaptation of techniques that had previously not been used for amphibian immunity research. In line with the reviewer’s sentiment, to our knowledge this is the first report of using molecular approaches to augment amphibian mast cells, which we hope will pave the way for new areas of research within the fields of comparative immunology and amphibian disease biology.

      Weaknesses:<br /> The conclusions regarding the role of mast cell expansion in controlling Bd infection would be stronger with a more rigorous evaluation of the model, as there are some key gaps and remaining questions regarding the data. For example:

      1. Granulocyte expansion is carefully quantified in the initial time courses of rSCF and rCSF3 injections, but similar quantification is not provided in the disease models (Figures 3E, 4G, 5D-G). A key implication of the opposing effects of mast cell vs neutrophil expansion is that mast cells may suppress neutrophil recruitment or function. Alternatively, mast cells also express notable levels of csfr3 (Figure 2) and previous work from this group (Hauser et al, Facets 2020) showed rG-CSF-stimulated peritoneal granulocytes express mast cell markers including kit and tpsab1, raising the question of what effect rCSF3 might have on mast cell populations in the skin. Considering these points, it would be helpful if both mast cells and neutrophils were quantified histologically (based on Figure 1, they can be readily distinguished by SE or Giemsa stain) in the Bd infection models.

      We thank the reviewer for this insightful suggestion. We are performing a further examination of skin granulocyte content during Bd infections and plan on including any significant findings in our revised manuscript.

      We predict that rSCF administration results in the accumulation of mast cells that are polarized such that they ablate the inflammatory response elicited by Bd infection. Mammalian mast cells, including peritonea-resident mast cells, express csf3r12, 13. Although the X. laevis animal model does not permit nearly the degree of immune cell resolution afforded by mammalian animal models, we do know that the adult X. laevis peritonea contain heterogenous leukocyte populations. We anticipate that the high kit expression reported by Hauser et al., 2020 in the rCSF3-recruited peritoneal leukocytes reflects the presence of mast cells therein. As such and in acknowledgement of the reviewer’s suggestion, we also think that the cells recruited by rCSF3 into the skin may include not only neutrophils but also mast cells. Possibly, these mast cells have distinct polarization states from those enriched by rSCF. While the lack of antibodies against frog neutrophils or mast cells has limited our capacity to address this question, we will attempt to reexamine by histology the proportions of skin neutrophils and mast cells in the skins of frogs under the conditions described in our manuscript. Any new findings in this regard will be included in the revised version of this work.

      2. Epithelial thickness and inflammation in Bd infection are reported to be reduced by rSCF treatment (Figure 3E, 5A-B) or increased by rCSF3 treatment (Figure 4G) but quantification of these critical readouts is not shown.

      We thank the reviewer for this suggestion. We will score epithelial thickness under the distinct conditions described in our manuscript and present the quantified data in the revised paper.

      3. Critical time points in the Bd model are incompletely characterized. Mast cell expansion decreases zoospore burden at 21 dpi, while there is no difference at 7 dpi (Figure 3E). Conversely, neutrophil expansion increases zoospore burden at 7 dpi, but no corresponding 21 dpi data is shown for comparison (Figure 4G). Microbiota analysis is performed at a third time point,10 dpi (Figure 5D-G), making it difficult to compare with the data from the 7 dpi and 21 dpi time points. Reporting consistent readouts at these three time points is important to draw solid conclusions about the relationship of mast cell expansion to Bd infection and shifts in microbiota.

      Because there were no significant effects of mast cell enrichment at 7 days post Bd infection, we chose to look at the microbiome composition in a subsequent experiment at 10 days and 21 days post Bd infection, with 10 days being a bit more of a midway point between the initial exposure and day 21, when we see the effect on Bd loads. We will clarify this rationale in the revised manuscript.

      The enrichment of neutrophils in frog skins resulted in prompt (12 hours post enrichment) skin thickening (in absence of Bd infection) and increased frog Bd susceptibility by 7 days of infection. Conversely, mast cell enrichment stabilized skin mucosal and symbiotic microbial environment, presumably accounting at least in part for the lack of further Bd growth on mast cell-enriched animals by 21 days of infection. Our question regarding the roles of inflammatory granulocytes/neutrophils during Bd infections was that of ‘how’ rather ‘when’ these cells affect Bd infections. Because the central focus of this work was mast cells and not other granulocyte subsets, when we saw that rCSF3-recruited granulocytes adversely affected Bd infections at 7 days post infection, we did not pursue the kinetics of these responses further. We plan to explore the roles of inflammatory mediators and disparate frog immune cell subsets during the course of Bd infections, but we feel that these future studies are more peripheral to the central thesis of the present manuscript regarding the roles of frog mast cells during Bd infections.

      4. Although the effect of rSCF treatment on Bd zoospores is significant at 21 dpi (Figure 3E), bacterial microbiota changes at 21 dpi are not (Figure S3B-C). This discrepancy, how it relates to the bacterial microbiota changes at 10 dpi, and why 7, 10, and 21 dpi time points were chosen for these different readouts (Figure 5F-G), is not discussed.

      Our results indicate that after 10 days of Bd infection, control Bd-challenged animals exhibited reduced microbial richness, while skin mast cell-enriched Bd-infected frogs were protected from this disruption of their microbiome. The amphibian microbiome serves as a major barrier to these fungal infections14, and we anticipate that Bd-mediated disruption of microbial richness and composition facilitates host skin colonization by this pathogen. Control and mast cell-enriched animals had similar skin Bd loads at 10 days post infection. However, by 21 days of Bd infection the mast cells-enriched animals maintained their Bd loads to levels observed at 10 days post infection, whereas the control animals had significantly greater Bd loads. Thus, we anticipate that frog mast cells are conferring the observed anti-Bd protection in part by preventing microbial disassembly and thus interfering with optimal Bd colonization and growth on frog skins. In other words, maintained microbial composition at 10 days of infection may be preventing additional Bd colonization/growth, as seen when comparing skins of control and mast cell-enriched frogs at 21 days post infection. By 21 days of infection, control animals rebounded from the Bd-mediated reduction in bacterial richness seen at 10 days. Considering that after 21 days of infection control animals also had significantly greater Bd loads than mast-cell enriched animals suggests that there may be a critical earlier window during which microbial composition is able to counteract _Bd_growth. 

      While the current draft of our manuscript has a paragraph to this effect (see below), we appreciate the reviewer conveying to us that our perspective on the relationship between skin mast cells and the kinetics of microbial composition and _Bd_loads could be better emphasized. We plan to revise our manuscript to include the above discussion points. 

      Bd infections caused major reductions in bacterial taxa richness, changes in composition and substantial increases in the relative abundance of Bd-inhibitory bacteria early in the infection. Similar changes to microbiome structure occur during experimental Bd infections of red-backed salamanders and mountain yellow-legged frogs15, 16. In turn, progressing Bd_infections corresponded with a return to baseline levels of _Bd-inhibitory bacteria abundance and rebounding microbial richness, albeit with dissimilar communities to those seen in control animals. These temporal changes indicate that amphibian microbiomes are dynamic, as are the effects of Bd infections on them. Indeed, Bd infections may have long-lasting impacts on amphibian microbiomes15. While Bd infections manifested in these considerable changes to frog skin microbiome structure, mast cell enrichment appeared to counteract these deleterious effects to their microbial composition. Presumably, the greater skin mucosal integrity and mucus production observed after mast cell enrichment served to stabilize the cutaneous environment during Bd infections, thereby ameliorating the Bd-mediated microbiome changes. While this work explored the changes in established antifungal flora, we anticipate the mast cell-mediated inhibition of Bd may be due to additional, yet unidentified bacterial or fungal taxa. Intriguingly, while mammalian skin mast cell functionality depends on microbiome elicited SCF production by keratinocytes17, our results indicate that frog skin mast cells in turn impact skin microbiome structure and likely their function. It will be interesting to further explore the interdependent nature of amphibian skin microbiomes and resident mast cells.

      5. The time course of rSCF or rCSF3 treatments relative to Bd infection in the experiments is not clear. Were the treatments given 12 hours prior to the final analysis point to maximize the effect? For example, in Figure 3E, were rSCF injections given at 6.5 dpi and 20.5 dpi? Or were treatments administered on day 0 of the infection model? If the latter, how do the authors explain the effects at 7 dpi or 21 dpi given mast cell and neutrophil numbers return to baseline within 24 hours after rSCF or rCSF3 treatment, respectively?

      Please find the schematic of the immune manipulation, Bd infection, and sample collection times below. We will include a figure like this in our revised manuscript.

      The title of the manuscript may be mildly overstated. Although Bd infection can indeed be deadly, mortality was not a readout in this study, and it is not clear from the data reported that expanding skin mast cells would ultimately prevent progression to death in Bd infections.

      We acknowledge this point. The revised manuscript will be titled: “Amphibian mast cells: barriers to chytrid fungus infections”.

      Reviewer #3 (Public Review):

      Summary:<br /> Hauser et al. provide an exceptional study describing the role of resident mast cells in amphibian epidermis that produce anti-inflammatory cytokines that prevent Batrachochytrium dendrobatidis (Bd) infection from causing harmful inflammation, and also protect frogs from changes in skin microbiomes and loss of mucin in glands and loss of mucus integrity that otherwise cause changes to their skin microbiomes. Neutrophils, in contrast, were not protective against Bd infection. Beyond the beautiful cytology and transcriptional profiling, the authors utilized elegant cell enrichment experiments to enrich mast cells by recombinant stem cell factor, or to enrich neutrophils by recombinant colony-stimulating factor-3, and examined respective infection outcomes in Xenopus.

      Strengths:<br /> Through the use of recombinant IL4, the authors were able to test and eliminate the hypothesis that mast cell production of IL4 was the mechanism of host protection from Bd infection. Instead, impacts on the mucus glands and interaction with the skin microbiome are implicated as the protective mechanism. These results will press disease ecologists to examine the relative importance of this immune defense among species, the influence of mast cells on the skin microbiome and mucosal function, and open the potential for modulating mucosal defense.

      We thank the reviewer for recognizing the significance and utility of the findings presented in our manuscript.

      Weaknesses:<br /> A reduction of bacterial diversity upon infection, as described at the end of the results section, may not always be an "adverse effect," particularly given that anti-Bd function of the microbiome increased. Some authors (see Letourneau et al. 2022 ISME, or Woodhams et al. 2023 DCI) consider these short-term alterations as encoding ecological memory, such that continued exposure to a pathogen would encounter an enriched microbial defense. Regardless, mast cell-initiated protection of the mucus layer may negate the need for this microbial memory defense.

      We thank the reviewer their insightful comment. We will revise our discussion to include this possible interpretation.

      While the description of the mast cell location in the epidermal skin layer in amphibians is novel, it is not known how representative these results are across species ranging in chytridiomycosis susceptibility. No management applications are provided such as methods to increase this defense without the use of recombinant stem cell factor, and more discussion is needed on how the mast cell component (abundance, distribution in the skin) of the epidermis develops or is regulated.

      We appreciate the reviewer’s comment and would like to point out that the work presented in our manuscript was driven by comparative immunology questions more than by conservation biology.

      We thank the reviewer for suggesting expanding our discussion to include potential management applications and potential mechanisms for regulating frog skin mast cells. While any content to these effects would be highly speculative, we agree that it may spark new interest and pave new avenues for research. To this end, our revised manuscript will include a paragraph to this effect.

      References:

      1. Flajnik, M.F. A cold-blooded view of adaptive immunity. Nat Rev Immunol 18, 438-453 (2018).

      2. Mulero, I., Sepulcre, M.P., Meseguer, J., Garcia-Ayala, A. & Mulero, V. Histamine is stored in mast cells of most evolutionarily advanced fish and regulates the fish inflammatory response. Proc Natl Acad Sci U S A 104, 19434-19439 (2007).

      3. Reite, O.B. A phylogenetical approach to the functional significance of tissue mast cell histamine. Nature 206, 1334-1336 (1965).

      4. Reite, O.B. Comparative physiology of histamine. Physiol Rev 52, 778-819 (1972).

      5. Takaya, K., Fujita, T. & Endo, K. Mast cells free of histamine in Rana catasbiana. Nature 215, 776-777 (1967).

      6. Galli, S.J. New insights into "the riddle of the mast cells": microenvironmental regulation of mast cell development and phenotypic heterogeneity. Lab Invest 62, 5-33 (1990).

      7. Babina, M., Guhl, S., Artuc, M. & Zuberbier, T. IL-4 and human skin mast cells revisited: reinforcement of a pro-allergic phenotype upon prolonged exposure. Archives of dermatological research 308, 665-670 (2016).

      8. Lai, H. & Rogers, D.F. New pharmacotherapy for airway mucus hypersecretion in asthma and COPD: targeting intracellular signaling pathways. J Aerosol Med Pulm Drug Deliv 23, 219-231 (2010).

      9. Rankin, J.A. et al. Phenotypic and physiologic characterization of transgenic mice expressing interleukin 4 in the lung: lymphocytic and eosinophilic inflammation without airway hyperreactivity. Proc Natl Acad Sci U S A 93, 7821-7825 (1996).

      10. Church, M.K. Allergy, Histamine and Antihistamines. Handb Exp Pharmacol 241, 321-331 (2017).

      11. Nakamura, T. The roles of lipid mediators in type I hypersensitivity. J Pharmacol Sci 147, 126-131 (2021).

      12. Aponte-Lopez, A., Enciso, J., Munoz-Cruz, S. & Fuentes-Panana, E.M. An In Vitro Model of Mast Cell Recruitment and Activation by Breast Cancer Cells Supports Anti-Tumoral Responses. Int J Mol Sci 21 (2020).

      13. Jamur, M.C. et al. Mast cell repopulation of the peritoneal cavity: contribution of mast cell progenitors versus bone marrow derived committed mast cell precursors. BMC Immunol 11, 32 (2010).

      14. Walke, J.B. & Belden, L.K. Harnessing the Microbiome to Prevent Fungal Infections: Lessons from Amphibians. PLoS Pathog 12, e1005796 (2016).

      15. Jani, A.J. et al. The amphibian microbiome exhibits poor resilience following pathogen-induced disturbance. ISME J 15, 1628-1640 (2021).

      16. Muletz-Wolz, C.R., Fleischer, R.C. & Lips, K.R. Fungal disease and temperature alter skin microbiome structure in an experimental salamander system. Mol Ecol 28, 2917-2931 (2019).

      17. Wang, Z. et al. Skin microbiome promotes mast cell maturation by triggering stem cell factor production in keratinocytes. J Allergy Clin Immunol 139, 1205-1216 e1206 (2017).

    1. Author Response

      The following is the authors’ response to the original reviews.

      Reviewer #1 (Public Review):

      Summary:

      This study investigated behavioural performance on a competing speech task and neural attentional filtering over the course of two years in a group of middle-aged to older adults. Neural attentional filtering was quantified using EEG by comparing neural envelope tracking to an attended vs. an unattended sentence. This dataset was used to examine the stability of the link between behavior and neural filtering over time. They found that neural filtering and behavior were correlated during each measurement, but EEG measures at the first time point did not predict behavioural performance two years later. Further, while behavioural measures showed relatively high test-retest reliability, the neural filtering reliability was weak with an r-value of 0.21. The authors conclude that neural tracking-based metrics have limited ability to predict longitudinal changes in listening behavior.

      Strengths:

      This study is novel in its tracking of behavioural performance and neural envelope tracking over time, and it includes an impressively large dataset of 105 participants. The manuscript is clearly written.

      Weaknesses:

      The weaknesses are minor, primarily concerning how the reviewers interpret their data. Specifically, the envelope tracking measure is often quite low, close to the noise floor, and this may affect testretest reliability. Furthermore, the trajectories may be affected by accelerated age-related declines that are more apparent in neural tracking than in behaviour.

      We thank the reviewer for their supportive assessment of our work. We describe in detail how we have addressed the two main concerns raised here—neural filtering’s low test-retest reliability and differences in age-related behavioural vs. neural change—in our response to the more detailed recommendations below.

      To briefly summarise here:

      (1) In Figure 5, we now illustrate more transparently how the employed structural equation framework helps to overcome the issue of low test-retest reliability of neural filtering as originally reported.

      (2) We include two additional control analyses, one of which relates neural tracking of attended speech (featuring a moderately high T1–T2 correlation of r = .64 even outside of latent modelling) to behavioural change. Importantly, this analysis provides critical empirical support for the apparent independence of neural and behavioural trajectories.

      (3) We more clearly describe how the latent-variable modelling strategy accounts for differences in age-related change along the neural and behavioural domain. Moreover, the results of the of 18 additional control analysis also suggest that the absence of a change-change relationship is not primarily due to differential effects of age on brain and behaviour.

      Reviewer #1 (Recommendations For The Authors):

      1) Figure 3:

      Does the 70-year range reach a tipping point?

      Is that why neural filtering drops dramatically in this age group, whereas the other groups do not change or increase slightly?

      This can also be seen with behavioral accuracy to a lesser extent. Perhaps test-retest reliability is affected by accelerated age-related declines in older listeners, as was found for envelope tracking measures in Decruy et al. 2019.

      We agree with the reviewer that at first glance the data seem to suggest a critical tipping point in the age range above 70 years. It is important to emphasize, however, that the four age bins were not based on equal number of data points. In fact, the >70 age group included the fewest participants, leading to a less reliable estimate of change. Together with the known observation of increasing interindividual differences with increasing age, the results do not allow for any strong conclusions regarding a potential tipping point. For the same reasons, we used the four age bins for illustrative purposes, only, and did not include them in any statistical modelling.

      We did however include chronological age as a continuous predictor in latent change score modelling. Here, we modelled its influence on participants’ T1 neural and behavioural status, as well as its effect on their respective change, thereby accounting for any differential (linear) effects of age on neural vs. behavioural functioning and its change.

      On p.14 of the revised manuscript, we now state more clearly that the latent change score model did in fact account for the potential influence of age on the change-related relationships:

      "In line with our hypotheses, we modelled the longitudinal impact of T1 neural functioning on the change in speed, and tested for a change-change correlation. Since the analyses conducted up to this point have either directly shown or have suggested that longitudinal change per domain may be affected by age, we included individuals’ age as a time-invariant covariate in the final model. We modelled the influence of age on neural and behavioural functioning at T1 but also on individual change per domain. By accounting for linear effects of age on longitudinal change, we also minimize its potential impact on the estimation of change-change relationship of interest. Note that we refrained from fitting separate models per age group due to both limited and different number of data points per age group."

      2) Would good test-retest reliability be expected when the actual values of envelope tracking for attended vs. unattended speech are so low? The investigators address this by including measurement errors in the models, but I am not certain this kind adequately deals with envelope tracking values that are close to the noise floor.

      We thank the reviewer for this comment. We addressed the concerns regarding the low re-test reliability of our neural-attentional metric (and its potential impact on observing a systematic changechange relationship) in two separate ways.

      The major outcome of these tests is that low re-test reliability of neural tracking is (i) not generally true, and (ii) is not the cause of the main finding, i.e., a low or absent correlations of behavioural vs. neural changes over time.

      In more detail, to show how latent change score modelling improves test-retest reliability by explicitly modelling measurement error, we first extracted and correlated T1 and T2 latent factors scores from the respective univariate models of neural filtering and response speed.

      Indeed, at the latent level, the correlation of T1–T2 neural filtering was moderately high at r = .65 (compared to r = .21 at the manifest level). The correlation of T1–T2 response speed was estimated as r = .75 (compared to r = .71).

      Figure 5A, reproduced below for the reviewer’s convenience, now includes insets quantifying these latent-level correlations over time.

      Author response image 1.

      Modelling of univariate and bivariate change. A Univariate latent change score models for response speed (left) and neural filtering (right). All paths denoted with Latin letters refer to freely estimated but constrained to be equal parameters of the respective measurement models. Greek letters refer to freely estimated parameters of the structural model. Highlighted in black is the estimated mean longitudinal change from T1 to T2. Scatterplots in the top left corner illustrate how capturing T1 and T2 neural and behavioural functioning as latent factors improves their respective test-retest reliability. B Latent change score model (LCSM) relating two-year changes in neural filtering strength to changes in response speed. Black arrows indicate paths or covariances of interest. Solid black arrows reflect freely estimated and statistically significant effects, dashed black arrows reflect non-significant effects. All estimates are standardised. Grey arrows show paths that were freely estimated or fixed as part of the structural model but that did not relate to the main research questions. For visual clarity, manifest indicators of the measurement model and all symbols relating to the estimated mean structure are omitted but are identical to those shown in panel A. p<.001, p<.01, p<.05, p=.08. C Scatterplots of model-predicted factor scores that refer to the highlighted paths in panel B. Top panel shows that baseline-level neural filtering did not predict two-year change in behavioural functioning, bottom panel shows the absence of a significant change-change correlation.

      Second, we ran a control analysis that includes the neural tracking of attended speech in selectiveattention trials rather than the neural filtering index averaged across all trials. The results are shown as part of a new main figure (and two new supplemental figures) reproduced below (see in particular Figure 6, panels C and D).

      This analysis serves two purposes: On the one hand, it allows for a more direct evaluation of the actual strength of neural speech tracking as quantified by the Pearson’s correlation coefficient. Note that these individual averages fall well within the to be expected range given that the neural tracking estimates are based on relatively short sentences (i.e., duration of ~2.5 sec) (O’Sullivan et al., 2014).

      On the other hand, neural tracking of attended speech showed a moderately high, r = .64, T1–T2 correlation even outside of latent modelling. Note that the magnitude of this T1–T2 reliability is close to the short-term test-retest reliability recently reported by Panela et al. (2023). Still, when including neural tracking of attended speech in the bivariate model of change, the change-change correlation with response speed was now estimated as close to 0 (𝜙 = –.03, n.s). This observation suggests that manifest-level high re-test reliability does not necessarily improve chances of observing a significant change-change correlation.

      Lastly, we would like to point out that these bivariate model results also help to shed light on the question of whether non-linear effects of age on neural / behavioural change may affect the chance of observing a systematic change-change relationship. As shown in Fig. 6C, for neural tracking of attended speech, we observed a fairly consistent longitudinal increase across age groups. Yet, as detailed above, the change-change correlation was virtually absent.

      In sum, these new results provide compelling evidence for the absence of a systematic changechange relationship.

      The respective control analysis results section reads as follows, and is accompanied by Figure 6 reproduced below:

      "Control analyses: The weak correlation of behavioural and neural change is robust against different quantifications of neural filtering

      Taken together, our main analyses revealed that inter-individual differences in behavioural change could only be predicted by baseline age and baseline behavioural functioning, and did not correlate with contemporaneous neural changes.

      However, one could ask in how far core methodological decisions taken in the current study, namely our focus on (i) the differential neural tracking of relevant vs. irrelevant speech as proxy of neural filtering, and (ii) on its trait-level characterization that averaged across different spatial-attention conditions may have impacted these results. Specifically, if the neural filtering index (compared to the neural tracking of attended speech alone) is found to be less stable generally, would this also impact the chances of observing a systematic change-change relationship? Relatedly, did the analysis of neural filtering across all trials underestimate the effects of interest?

      To evaluate the impact of these consideration on our main findings, we conducted two additional control analyses: First, we repeated the main analyses using the neural filtering index (and response speed) averaged across selective-attention trials, only. Second, we repeated the main analyses using the neural tracking of attended speech, again averaged across selective-attention trials, only.

      As shown in Figure 6, taken together, the control analyses provide compelling empirical support for the robustness of our main results: Linking response speed and neural filtering under selective attention strengthened their relationship at T1 (𝜙 = .54, SE = .15, Dc2(df = 1) = 2.74, p = .1; see. Fig 6B) but did not yield any significant effects for the influence of T1 neural filtering on behavioural change (β = .13, SE = .21, Dc2(df = 1) = .43, p = .51), or for the relationship of neural and behavioural change (𝜙 = .26, SE = .14, Dc2(df = 1) = 3.1, p = .08; please note the close correspondence to path estimates reported in Fig. 5). The second control analysis revealed a substantially higher manifest-level test-retest reliability of neural tracking of attended speech (r = .65, p<.001; Fig. 6C) compared to that of the neural tracking index. However, when linked to longitudinal changes in response speed, this analysis provided even less evidence for systematic change-related relationships: Baseline-levels of attended-speech tracking did not predict future change in response speed (β = .18, SE = .11, Dc2(df = 1) = 2.73, p = .10), and changes in neural and behavioural functioning occurred independently of one another (𝜙 = –.03, SE = .12, Dc2(df = 1) = .06, p = .81).

      In sum, the two control analyses provide additional empirical support for the results revealed by our main analysis."

      Author response image 2.

      Control analyses corroborate the independence of neural and behavioural trajectories under selective attention. Cross-sectional and longitudinal change in neural filtering (A) and neural tracking of attended speech (C) averaged across selective-attention trials, only. Coloured vectors (colour-coding four age groups for illustrative purposes, only) in the left subpanels show individual T1–T2 change along with the cross-sectional trend plus 95% confidence interval (CI) separately for T1 (dark grey) and T2 (light grey). Top right, correlation of T1 and T2 as measure of test-retest reliability along with the 45° line (grey) and individual data points (black circles). Bottom right, mean longitudinal change per age group and grand mean change (grey). B, D Latent change score model (LCSM) relating two-year changes in neural filtering (B) /neural tracking (D) strength to changes in response speed. Black arrows show the paths or covariances of interest that were freely estimates, grey arrows show paths that were freely estimated or fixed as part of the structural model but did not relate to the main research questions. Solid arrows indicate statistically significant effects, dashed arrows reflect nonsignificant paths. All estimates are standardised. p<.001, p<.01, p<.05.

      3) The authors conclude that the temporal instability of the neural filtering measure precludes its use for diagnostic/therapeutic intervention. I agree that test-retest reliability is needed for a clinical intervention. However, given the relationship with behavior at a specific point in time, would it not be a possible target for intervention to improve performance? Even if there are different trajectories, an individual may benefit from enhanced behavioral performance in the present.

      We thank the reviewer for this comment. We would agree that the observation of robust betweensubject (or even more desirable: within-subject) brain–behaviour relationships is a key desideratum in identifying potential interventional targets. At the same time, we would argue that the most direct way of evaluating a neural signature’s translational potential is by focusing on how it predicts or is linked to individual change. In revising both the Introduction and Discussion section, we hope to now better motivate our reasoning.

      Other minor comments:

      4) Lines 106-107 What is the basis for the prediction regarding neural filtering?

      In our previous analysis of T1 data (Tune et al., 2021), we found inter-individual differences in neural filtering itself, and also in its link to behaviour, to be independent of chronological age and hearing loss. On the basis of these results, we did not expect any systematic decrease or increase in neural filtering over time.<br /> We rephrased the respective sentence as follows:

      Since we previously observed inter-individual differences in neural filtering to be independent of age and hearing status, we did not expect any systematic longitudinal change in neural filtering.

      5) Line 414: Replace "relevant" with "relevance".

      Thank you, this has been corrected.

      6) What was the range of presentation levels? Stimuli presented at 50 dB above individual sensation level could result in uncomfortably loud levels for people with mild to moderate hearing loss.

      Unfortunately, we didn’t have the means to estimate the precise dB SPL level at which our stimuli were presented. Due to the use of in-ear headphones, we did not aim to measure the exact sound pressure level of presentation but instead ensured that even if stimuli were presented at the maximally possible intensity given our hardware, this would not result in subjectively uncomfortably loud stimulus presentation levels. The described procedure estimated per individual how far the maximal sound pressure level needed to be attenuated to arrive at a comfortable and easy-tounderstand presentation level.

      Reviewer #2 (Public Review):

      Summary:

      This study examined the longitudinal brain-behaviour link between attentional neural filtering and listening behaviour among a sample of aging individuals. The results based on the latent change score modeling showed that neither attentional neural filtering at T1 nor its T1-T2 change predicted individual two-year listening performance change. The findings suggest that neural filtering and listening behaviour may follow independent developmental trajectories. This study focuses on an interesting topic and has the potential to contribute a better understanding of the neurobiological mechanisms of successful communication across the lifespan.

      Strengths:

      Although research suggests that speech comprehension is neurally supported by an attentionguided filter mechanism, the evidence of their causal association is limited. This study addresses this gap by testing the longitudinal stability of neural filtering as a neural mechanism upholding listening performance, potentially shedding light on translational efforts aiming at the preservation of speech comprehension abilities among aging individuals.

      The latent change score modeling approach is appropriately used as a tool to examine key developmental questions and distinguish the complex processes underlying lifespan development in brain and behaviour with longitudinal data.

      Weaknesses:

      Although the paper does have strengths in principle, the weaknesses of the paper are that the findings are merely based on a single listening task. Since both neural and behavioral indicators are derived from the same task, the results may be applicable only to this specific task, and it is difficult to extrapolate them to cognitive and listening abilities measured by the other tasks. Therefore, more listening tasks are required to comprehensively measure speech comprehension and neural markers.

      The age span of the sample is relatively large. Although no longitudinal change from T1 to T2 was found at the group-level, from the cross-sectional and longitudinal change results (see Figure 3), individuals of different age groups showed different development patterns. Particularly, individuals over the age of 70 show a clear downward trend in both neural filtering index and accuracy. Therefore, different results may be found based on different age groups, especially older groups. However, due to sample limitations, this study was unable to examine whether age has a moderating effect on this brain-behaviour link.

      In the Dichotic listening task, valid and invalid cues were manipulated. According to the task description, the former could invoke selective attention, whereas the latter could invoke divided attention. It is possible that under the two conditions, the neural filtering index may reflect different underlying cognitive processes, and thus may differ in its predictive effect on behavioral performance. The author could perform a more in-depth data analysis on indicators under different conditions.

      We thank the reviewer for their critical yet positive assessment of our work that also appreciates its potential to further our understanding of key determinants of successful communication in healthy aging. Please also see our more in-depth responses to the detailed recommendations that relate to the three main concern raised above.

      Regarding the first concern of the reviewer about the limited generalizability of our brain–behaviour results, we would argue that there are two sides to this argument.

      On the one hand, the results do not directly speak to the generalizability of the observed complex brain–behaviour relationships to other listening tasks. This may be perceived as a weakness. Unfortunately, as part of our large-scale projects, we did not collect data from another listening task suitable for such a generalization test. Using any additional cognitive tests would shift the focus away from the goal of understanding the determinants of successful communication, and rather speak more generally to the relationship of neural and cognitive change.

      On the other hand, we would argue the opposite, namely that the focus on the same listening task is in fact a major strength of the present study: The key research questions were motivated by our timepoint 1 findings of a brain-behaviour link both at the within-subject (state) and at the between subject (trait) level (Tune et al., 2021). Notably, in the current study, we show that both, the state- and the trait-level results, were replicated at timepoint 2. This observed stability of results provides compelling empirical evidence for the functional relevance of neural filtering to the listening outcome and critically sets the stage for the inquiry into the complex longitudinal change relationships. We now spell this out more clearly in the Introduction and the Discussion.

      Here, we briefly summarise how we have addressed the two remaining main concerns.

      (1) Please refer to our response R1’s comment #1 on the influence of (differential) age effects on brain and behaviour. These effects were in fact already accounted for by our modelling strategy which included the continuously (rather than binned by age group) modelled effect of age. We now communicate this more clearly in the revised manuscript.

      (2) We added two control analyses, one of which replicated the main analysis using selective attention trials, only. Critically, as shown in Figure 6, while the strength of the relationship of neural filtering and behaviour at a given timepoint increased, the key change-related relationships of interest remained not only qualitatively unchanged, but resulted in highly similar quantitative estimates.

      Reviewer #2 (Recommendations For The Authors):

      1) Theoretically, the relationship between brain and behavior may not be just one-way, but probably bi-directional. In this study, the authors only considered the unidirectional predictive effect of neural filtering on changes in listening task performance. However, it is possible that lower listening ability may limit information processing in older adults, which may lead to a decline in neural filtering abilities. The authors may also consider this theoretical hypothesis.

      We thank the reviewer for this comment. While we did not have any specific hypotheses about influence of the behavioural state at timepoint 1 on the change in neural filtering, we ran control analysis that freely estimates the respective path (rather than implicitly assuming it to be 0). However, the results did not provide evidence for such a relationship. We report the results on p. 14 of the revised manuscript:

      "We did not have any a priori hypotheses on the influence of T1 speed on the individual T1–T2 change in neural filtering. Still in a control analysis that freely estimated the respective path, we found that an individual’s latent T1 level of response speed was not predictive of the ensuing latent T1–T2 change in neural filtering (β = –.11, SE = .21, Dc2(df = 1) = .31, p = .58)."

      2) The necessity of exploring the longitudinal relationship between attentional neural filtering and listening behaviour needs to be further clarified. That is, why choose attentional filtering (instead of the others) as an indicator to predict listening performance?

      We are not quite certain we understood which ‘other’ metrics the reviewer was referring to here exactly. But we would like to reiterate our argument from above: we believe that focusing on neural and behavioural metrics that are (i) derived from the same task, and (ii) were previously shown to be linked at both the trait- and state-level provided strong empirical ground for our inquiries into their longitudinal change-related relationships.

      Please note that we agree that the neural filtering index as a measure of attention-guided neural encoding of relevant vs. irrelevant speech signals is only one potential candidate neural measure but one that was clearly motivated by previous results. Nevertheless, in the revised manuscript we now also report on the relationship of neural tracking of attended speech and listening performance (see also our response to the reviewer’s comment #5 below).

      Apart of this, by making the entire T1–T2 dataset openly available, we invite researchers to conduct any potential follow-up analyses focused on metrics not reported here.

      3) Regarding the Dichotic listening task, further clarification is needed.

      (1) The task procedure and key parameters need to be supplemented.

      We have added a new supplemental Figure S6 which details the experimental design and procedure. We have also added further listening task details to the Methods section on p.23:

      At each timepoint, participants performed a previously established dichotic listening task20. We provide full details on trial structure, stimulus construction, recording and presentation in our previously published study on the first (N = 155) wave of data collection (but see also Fig. S6)12.

      In short, in each of 240 trials, participants listened to two competing, dichotically presented five-word sentences spoken by the same female speaker. They were probed on the sentence-final noun in one of the two sentences. Participants were instructed to respond within a given 4 s time window beginning with the onset of a probe screen showing four alternatives. They were not explicitly instructed to respond as quickly as possible. The probe screen showed four alternative words presented either on the left or right side of the screen, indicating the probed ear. Two visual cues preceded auditory presentation (…)

      We also note that the task and key parameters have been published additionally in (Tune et al., 2021) and Alavash et al. (2019). We have made sure these citations are placed prominently at the beginning of the methods section.

      Author response image 3.

      Experimental design and procedure.

      (2) Prior to the task, were the participants instructed to respond quickly and correctly? Was there a speed-accuracy trade-off? Was it possible to consider an integrated ACC-RT indicator?

      We instructed participants to respond within a 4-sec time window following the response screen onset but we did not explicitly instruct them to respond as quickly as possible. We also state this more explicitly in the revised Method section on p. 23 (see also our response to comment #3 by R3 on p. 15 below).

      In a between-subjects analysis we observed, both within T1 and T2, a significant positive correlation (rT1 = .33, p<.01; rT2 = .40, p<.001) of participants’ overall accuracy and response speed, speaking against a speed-accuracy trade-off. For this reason, we did not consider an integrated speed–accuracy measure as behavioural indicator for modelling.

      (3) The correlation between neural filtering at T1 and T2 was weak, which may be due to the low reliability of this indicator. The generally low reliability of the difference score is a notorious measurement problem recognized in the academic community.

      We fully agree with the reviewer on their assessment of notoriously noisy difference scores. It is the very reason that motivated our application of the latent change score model approach. This framework elegantly supersedes the manual calculation of differences scores, and by explicitly

      modelling measurement error also removes the impact of varying degrees of reliability on the estimation of change and how it varies as a function of different influences.

      While we had already detailed this rationale in the original manuscript, we now more prominently describe the advantages of the latent variable approach in the first paragraph of the Results section:

      Third and final, we integrate and extend the first two analysis perspectives in a joint latent change score model (LCSM) to most directly probe the role of neural filtering ability as a predictor of future attentive listening ability. Addressing our key change-related research questions at the latent rather than the manifest level supersedes the manual calculation of notoriously noisy differences scores, and effectively removes the influence of each metric’s reliability on the estimation of change-related relationships.

      We also kindly refer the reviewer to our in-depth response to R1’s comment #2 regarding the concern of neural filtering’s low test-rest reliability and its impact on estimating change-change relationships.

      1. For the latent change score model, it is recommended that the authors:<br /> (1) Supplement the coefficients of each path in Figure 5. For details, please refer to the figures in the papers of Kievit et al. (2017, 2019)

      This information has been added to Figure 5.

      (2) In Figure 5 and Figure S2, why should the two means of the observed 2nd half scores be estimated?

      In longitudinal modelling, special care needs to be applied to the pre-processing/transformation of raw data for the purpose of change score modelling. While it is generally desirable to bring all variables onto the same scale (typically achieved by standardising all variables), one needs to be careful not to remove the mean differences of interest in such a data transformation step. We therefore followed the procedure recommended by Little (2013) and rescaled variables stacked across T1 and T2 using the proportion of maximum scale (‘POMS’) methods. This procedure, however, results in mean values per timepoint ≠ 0, so the mean of the second half needed to be freely estimated to avoid model misfit. Note that the mean of the first half manifest variables was set to 0 (using the ‘marker method’; see Little, 2013) to ensure model identification.

      We have added the following more detailed description to the Method section on p. 26:

      To bring all manifest variables onto the same scale while preserving mean differences over time, we first stacked them across timepoint and then rescaled them using the proportion of maximum scale (‘POMS’) method99,100 (…) Given our choice of POMS-transformation of raw to preserve mean differences over time, the mean of the second manifest variable had to be freely estimated (rather than implicitly assumed to be 0) to avoid severe model misfit.

      (3) The authors need to clarify whether the latent change factor in Figure 5 is Δ(T1-T2) or Δ(T2-T1)?

      Thank you for this comment. Our notation here was indeed confusing. The latent change factor quantifies the change from T1 to T2, so it is Δ(T2–T1). We have accordingly re-named the respective latent variables in all corresponding figures.

      1. For data analysis, the author combined the trials under different conditions (valid and invalid cues) in the dichotic listening task and analyzed them together, which may mask the variations between different attention levels (selective vs. divided attention). It is recommended that the authors analyze the relationship between various indicators under different conditions.

      We thank the reviewer for this comment which prompted us to (i) more clearly motivate our decision to model neural filtering across all trials, and (ii) nevertheless report the results of an additional control analyses that focused on neural filtering (or the neural tracking of attended speech) in selective-attention trials, only.

      Our decision to analyse neural filtering across all spatial-attention conditions was motivated by two key considerations: First, previous T1 results (Tune et al., 2021) suggested that irrespective of the spatial-attention condition, stronger neural filtering boosted behavioural performance. Second, analysing neural filtering (and associated behaviour) across all trials provided the most direct way of probing the trait-like nature of individual neural filtering ability. <br /> We have included the following paragraph to the Results section on p. 6 to motivate this decision more clearly:

      Our main analyses focus on neural filtering and listening performance averaged across all trials and thereby also across two separate spatial-attention conditions. This choice allowed us to most directly probe the trait-like nature and relationships of neural filtering. It was additionally supported by our previous observation of a general boost in behavioural performance with stronger neural filtering, irrespective of spatial attention.

      On the other hand, one could argue that the effects of interest are underestimated by jointly analysing neural and behavioural functioning derived from both selective- and divided-attention conditions. After all, it is reasonable to expect a more pronounced neural filtering response in selective-attention trials.

      For this reason, we now report, in the revised version, two additional control analyses that replicate the key analyses for the neural filtering index and for the tracking of attended speech, both averaged across selective-attention trials, only: In summary, analysing neural filtering under selective attention strengthened the brain-behaviour link within a given time-point but resulted in highly similar quantitative estimated for the key relationships of interest. The analysis of attended speech tracking notably improved the neural metric’s manifest-level re-test reliability (r = .64, p<.001) – but resulted in an estimated change-change correlation close to 0.

      Taken together, these control analyses provide compelling support for our main conclusion that neural and behavioural functioning follow largely independent developmental trajectories.

      We kindly refer the reviewer to our detailed response to R1 for the text of the added control analysis section on p. 4f. above. The additional Figure 6 is reproduced again below for the reviewer’s convenience.

      Author response image 4.

      Control analyses corroborate the independence of neural and behavioural trajectories under selective attention. Cross-sectional and longitudinal change in neural filtering (A) and neural tracking of attended speech (C) averaged across selective-attention trials, only. Coloured vectors (colour-coding four age groups for illustrative purposes, only) in the left subpanels show individual T1–T2 change along with the cross-sectional trend plus 95% confidence interval (CI) separately for T1 (dark grey) and T2 (light grey). Top right, correlation of T1 and T2 as measure of test-retest reliability along with the 45° line (grey) and individual data points (black circles). Bottom right, mean longitudinal change per age group and grand mean change (grey). B, D Latent change score model (LCSM) relating two-year changes in neural filtering (B) /neural tracking (D) strength to changes in response speed. Black arrows show the paths or covariances of interest that were freely estimates, grey arrows show paths that were freely estimated or fixed as part of the structural model but did not relate to the main research questions. Solid arrows indicate statistically significant effects, dashed arrows reflect nonsignificant paths. All estimates are standardised. p<.001, p<.01, p<.05.

      Figure 6 has also been supplemented by two additional figures showing behavioural functioning (Fig. S4) and neural tracking of ignored speech (Fig. S5) under selective-attention trials, only. These figures are reproduced below for the reviewer’s convenience.

      Author response image 5.

      Cross-sectional and longitudinal change in listening behaviour under selective attention.

      Author response image 6.

      Cross-sectional and longitudinal change in neural tracking of ignored speech under selective attention.

      6) As can be seen from the Methods section, there were still other cognitive tasks in this database that can be included in the data analysis to further determine the predictive validity of neural filtering.

      We kindly refer the reviewer to our response to their public review and comment # 2 above where we motivate our decision to focus on manifest indicators of neural and behavioural functioning that are derived from the same task.

      We believe that the analysis of several additional indicators of cognitive functioning would have distracted from our main goal of the current study focused on understanding how individual trajectories of listening performance may be explained and predicted.

      7) "Magnitudes > 1 are taken as moderate, > 2.3 as strong evidence for either of the alternative or null hypotheses, respectively." Which papers are referenced by these criteria? The interpretation of BF values seems inconsistent with existing literature.

      It may deserve emphasis that these are log Bayes Factors (logBF). Our interpretation of logarithmic Bayes Factors (logBF) follows Lee and Wagenmakers’ (2013) classic heuristic scheme for the interpretation of (non-logarithmic, ‘raw’) BF10 values. We have added the respective reference to the manuscript.

      Reviewer #3 (Public Review):

      Summary:

      The study investigates the longitudinal changes in hearing threshold, speech recognition behavior, and speech neural responses in 2 years, and how these changes correlate with each other. A slight change in the hearing threshold is observed in 2 years (1.2 dB on average) but the speech recognition performance remains stable. The main conclusion is that there is no significant correlation between longitudinal changes in neural and behavioral measures.

      Strengths:

      The sample size (N>100) is remarkable, especially for longitudinal studies.

      Weaknesses:

      The participants are only tracked for 2 years and relatively weak longitudinal changes are observed, limiting how the data may shed light on the relationships between basic auditory function, speech recognition behavior, and speech neural responses.

      Suggestions

      First, it's not surprising that a 1.2 dB change in hearing threshold does not affect speech recognition, especially for the dichotic listening task and when speech is always presented 50 dB above the hearing threshold. For the same listener, if the speech level is adjusted for 1.2 dB or much more, the performance will not be influenced during the dichotic listening task. Therefore, it is important to mention in the abstract that "sensory acuity" is measured using the hearing threshold and the change in hearing threshold is only 1.2 dB.

      We thank the reviewer for this comment. We have added the respective information to the abstract and have toned down our interpretation of the observed behavioural stability despite the expected decline in auditory acuity.

      Second, the lack of correlation between age-related changes in "neuronal filtering" and behavior may not suggest that they follow independent development trajectories. The index for "neuronal filtering" does not seem to be stable and the correlation between the two tests is only R = 0.21. This low correlation probably indicates low test-retest reliability, instead of a dramatic change in the brain between the two tests. In other words, if the "neuronal filtering" index only very weakly correlates with itself between the two tests, it is not surprising that it does not correlate with other measures in a different test. If the "neuronal filtering" index is measured on two consecutive days and the index remains highly stable, I'm more convinced that it is a reliable measure that just changes a lot within 2 years, and the change is dissociated with the changes in behavior.

      The authors attempted to solve the problem in the section entitled "Neural filtering reliably supports listening performance independent of age and hearing status", but I didn't follow the logic. As far as I could tell, the section pooled together the measurements from two tests and did not address the test-retest stability issue.

      Please see our detailed response to R1’s comment #2 regarding the concern of how low (manifestlevel) reliability of our neural metric may have impacted the chance of observing a significant changechange correlation.

      In addition, we would like to emphasize that the goal of the second step of our analysis procedure, featuring causal mediation analysis, was not to salvage the perhaps surprisingly low reliability of neural filtering. Instead, this section addressed a different research question, namely, whether the link of neural filtering to behaviour would hold across time, irrespective of the observed stability of the measure itself. The stability of the observed between-subjects brain-behaviour relationships was assessed by testing for an interaction with timepoint.

      We have revised the respective Results section to more clearly state our scientific questions, and how our analysis procedure helped to address them:

      "The temporal instability of neural filtering challenges its status as a potential trait-like neural marker of attentive listening ability. At the same time, irrespective of the degree of reliability of neural filtering itself, across individuals it may still be reliably linked to the behavioural outcome (see Fig. 1). This is being addressed next.

      On the basis of the full T1–T2 dataset, we aimed to replicate our key T1 results and test whether the previously observed between-subjects brain-behaviour relationship would hold across time: We expected an individual’s neural filtering ability to impact their listening outcome (accuracy and response speed) independently of age or hearing status12. (…) To formally test the stability of direct and indirect relationships across time, we used a moderated mediation analysis. In this analysis, the inclusion of interactions by timepoint tested whether the influence of age, sensory acuity, and neural filtering on behaviour varied significantly across time."

      Third, the behavioral measure that is not correlated with "neuronal filtering" is the response speed. I wonder if the participants are asked to respond as soon as possible (not mentioned in the method). If not, the response speed may strongly reflect general cognitive function or a personal style, which is not correlated with the changes in auditory functions. This can also explain why the hearing threshold affects speech recognition accuracy but not the response speed (lines 263-264).

      Participants were asked to response within a given time window limited to 4 s but were not implicitly instructed to respond as quickly as possible. This is now stated more clearly in the Methods section (please also refer to our response to R2 on a similar question). It is important to emphasize—as shown in Figure 4A and Figure 5B —both at the manifest and latent variable level neural filtering (and in fact also the neural tracking of attended speech, see Fig. 6C) was reliably linked to response speed at T1 and T2. These results providing important empirical ground for the question of whether changes in neural filtering are systematically related to changes in response speed, and whether the fidelity of neural filtering at T1 represents a precursor of behavioural changes.

      Moreover, an interpretation of response speed as an indicator of general cognitive function is not at all incompatible with the cognitive demands imposed by the task. As the reviewer rightly stated above, performance in a dichotic listening task does not simply hinge on how auditory acuity may limit perceptual encoding of speech inputs but also on how the goal-directed application of attention modulates the encoding of relevant vs. irrelevant inputs. We here focus on one candidate neural strategy we here termed ‘neural filtering’ in line with an influential metaphor of how auditory attention may be neurally implemented (Cherry, 1953; Erb & Obleser, 2020; Fernandez-Duque & Johnson, 1999).

      Reviewer #3 (Recommendations For The Authors):

      Other issues:

      The authors should consider using terminology that the readers are more familiar with and avoid unsubstantiated claims.

      For example, the Introduction mentions that "The observation of such brain-behaviour relationships critically advances our understanding of the neurobiological foundation of cognitive functioning. Their translational potential as neural markers predictive of behaviour, however, is often only implicitly assumed but seldomly put to the test. Using auditory cognition as a model system, we here overcome this limitation by testing directly the hitherto unknown longitudinal stability of neural filtering as a neural compensatory mechanism upholding communication success."

      For the first sentence, please be clear about which aspects of "our understanding of the neurobiological foundation of cognitive functioning" is critically advanced by such brain-behaviour relationships, and why such brain-behaviour relationships are so critical given that so many studies have analyzed brain-behaviour relationships. The following two sentences seem to suggest that the current study is a translational study, but the later questions do not seem to be quite translational.

      The uncovering of robust between- and within-subject brain behaviour-relationships is a key scientific goal that unites basic and applied neuroscience. From a basic neuroscience standpoint, the observation of such brain–behaviour links provides important mechanistic insight into the neurobiological implementation of higher order cognition – here the application of auditory spatial attention in the service of speech comprehension. At the same time, they provide fruitful ground for translational inquiries of applied neuroscience. We therefore don’t consider it contradictory at all that the current study addressed both more basic and applied/translational neuroscientific research questions.

      We have rephrased the respective section as follows:

      "The observation of such brain–behaviour relationships critically advances our understanding of the neurobiological foundation of cognitive functioning by showing, for example, how neural implementations of auditory selective attention support attentive listening. They also provide fruitful ground for scientific inquiries into the translational potential of neural markers. However, the potency of neural markers to predict future behavioural outcomes is often only implicitly assumed but seldomly put to the test15."

      More importantly, "neuronal filtering" is a key concept in the paper but I'm not sure what it means. The authors have only mentioned that auditory cognition is a model system for "neuronal filtering", but not what "neuronal filtering" is. Even for auditory cognition, I'm not sure what "neuronal filtering" is and why the envelope response is representative of "neuronal filtering".

      As spelled out in the Introduction, we define our ‘neural filtering’ metric of interest as neural manifestation of the attention-guided segregation of behaviourally relevant from irrelevant sounds. By terming this signature neural ‘filtering’, we take up on a highly influential algorithmic metaphor of how auditory attention may be implemented at the neurobiological level (Cherry, 1953; Erb & Obleser, 2020; Fernandez-Duque & Johnson, 1999).

      We now provide more mechanistic detail in our description of the neural filtering signature analysed in the current study:

      "Recent research has focused on the neurobiological mechanisms that promote successful speech comprehension by implementing ‘neural filters’ that segregate behaviourally relevant from irrelevant sounds. Such neural filter mechanisms act by selectively increasing the sensory gain for behaviourally relevant inputs or by inhibiting the processing of irrelevant inputs5-7. A growing body of evidence suggests that speech comprehension is neurally supported by an attention-guided filter mechanism that modulates sensory gain and arises from primary auditory and perisylvian brain regions: By synchronizing its neural activity with the temporal structure of the speech signal of interest, the brain ‘tracks’ and thereby better encodes behaviourally relevant auditory inputs to enable attentive listening 8-11."

      Figure 1C should be better organized and the questions mentioned in the Introduction should be numbered.

      We have revised both the respective section of the Introduction and corresponding Figure 1 in line with the reviewer’s suggestions. The revised text and figure are reproduced below for the reviewer’s convenience:

      "First, by focusing on each domain individually, we ask how sensory, neural, and behavioural functioning evolve cross-sectionally across the middle and older adult life span (Fig. 1B). More importantly, we also ask how they change longitudinally across the studied two-year period (Fig. 1C, Q1), and whether aging individuals differ significantly in their degree of change (Q2). We expect individuals’ hearing acuity and behaviour to decrease from T1 to T2. Since we previously observed inter-individual differences in neural filtering to be independent of age and hearing status, we did not expect any systematic longitudinal change in neural filtering.

      Second, we test the longitudinal stability of the previously observed age- and hearing-loss–independent effect of neural filtering on both accuracy and response speed (Fig. 1A). To this end, we analyse the multivariate direct and indirect relationships of hearing acuity, neural filtering and listening behaviour within and across timepoints.

      Third, leveraging the strengths of latent change score modelling16,17, we fuse cross-sectional and longitudinal perspectives to probe the role of neural filtering as a precursor of behavioural change in two different ways: we ask whether an individual’s T1 neural filtering strength can predict the observed behavioural longitudinal change (Q3), and whether two-year change in neural filtering can explain concurrent change in listening behaviour (Q4). Here, irrespective of the observed magnitude and direction of T1–T2 developments, two scenarios are conceivable: Intra-individual neural and behavioural change may be either be correlated—lending support to a compensatory role of neural filtering—or instead follow independent trajectories18 (see Fig. 1C)."

      Author response image 7.

      Schematic illustration of key assumptions and research questions. A Listening behaviour at a given timepoint is shaped by an individuals’ sensory and neural functioning. Increased age decreases listening behaviour both directly, and indirectly via age-related hearing loss. Listening behaviour is supported by better neural filtering ability, independently of age and hearing acuity. B Conceptual depiction of individual two-year changes along the neural (blue) and behavioural (red) domain. Thin coloured lines show individual trajectories across the adult lifespan, thick lines and black arrows highlight two-year changes in a single individual. C Left, Schematic diagram highlighting the key research questions detailed in the introduction and how they are addressed in the current study using latent change score modelling. Right, across individuals, co-occurring changes in the neural and behavioural domain may be correlated (top) or independent of one another (bottom).

      Figure 3, the R-value should also be labeled on the four main plots.

      This information has been added to Figure 3, reproduced below.

      Author response image 8.

      Characterizing cross-sectional and longitudinal change along the auditory sensory (A), neural (B), and behavioural (C, D) domain. For each domain, coloured vectors (colour-coding four age groups for illustrative purposes, only) in the respective left subpanels show an individual’s change from T1 to T2 along with the cross-sectional trend plus 95% confidence interval (CI) separately for T1 (dark grey) and T2 (light grey). Top right subpanels: correlation of T1 and T2 as measure of test-retest reliability along with the 45° line (grey) and individual data points (black circles). Bottom right panels: Mean longitudinal change per age group (coloured vectors) and grand mean change (grey). Note that accuracy is expressed here as proportion correct for illustrative purposes, but was analysed logit-transformed or by applying generalized linear models.

      T1 and T2 should be briefly defined in the abstract or where they first appear.

      We have changed the abstract accordingly.

      References

      Alavash, M., Tune, S., & Obleser, J. (2019). Modular reconfiguration of an auditory control brain network supports adaptive listening behavior. [Clinical Trial]. Proceedings of the National Academy of Science of the United States of America, 116(2), 660-669. https://doi.org/10.1073/pnas.1815321116

      Cherry, E. C. (1953). Some experiments on the recognition of speech, with one and with two ears. The Journal of the Acoustical Society of America, 25(5), 975-979. https://doi.org/10.1121/1.1907229

      Erb, J., & Obleser, J. (2020). Neural filters for challening listening situations. In M. Gazzaniga, G. R. Mangun, & D. Poeppel (Eds.), The cognitive neurosciences (6th ed.). MIT Press.

      Fernandez-Duque, D., & Johnson, M. L. (1999). Attention metaphors: How metaphors guide the cognitive psychology of attention. Cognitive Science, 23(1), 83-116. https://doi.org/10.1207/s15516709cog2301_4<br /> O’Sullivan, J. A., Power, A. J., Mesgarani, N., Rajaram, S., Foxe, J. J., Shinn-Cunningham, B. G., Slaney, M., Shamma,

      S. A., & Lalor, E. C. (2014). Attentional Selection in a Cocktail Party Environment Can Be Decoded from Single-Trial EEG. Cerebral Cortex, 25(7), 1697-1706. https://doi.org/10.1093/cercor/bht355

      Panela, R. A., Copelli, F., & Herrmann, B. (2023). Reliability and generalizability of neural speech tracking in younger and older adults. Nature Communications, 2023.2007.2026.550679. https://doi.org/10.1101/2023.07.26.550679

      Tune, S., Alavash, M., Fiedler, L., & Obleser, J. (2021). Neural attentional-filter mechanisms of listening success in middle-aged and older individuals. Nature Communications, 1-14. https://doi.org/10.1038/s41467021-24771-9

    1. Author Response

      The following is the authors’ response to the original reviews.

      Reviewer #1:

      Watanuki et al used metabolomic tracing strategies of U-13C6-labeled glucose and 13C-MFA to quantitatively identify the metabolic programs of HSCs during steady-state, cell-cycling, and OXPHOS inhibition. They found that 5-FU administration in mice increased anaerobic glycolytic flux and decreased ATP concentration in HSCs, suggesting that HSC differentiation and cell cycle progression are closely related to intracellular metabolism and can be monitored by measuring ATP concentration. Using the GO-ATeam2 system to analyze ATP levels in single hematopoietic cells, they found that PFKFB3 can accelerate glycolytic ATP production during HSC cell cycling by activating the rate-limiting enzyme PFK of glycolysis. Additionally, by using Pfkfb3 knockout or overexpressing strategies and conducting experiments with cytokine stimulation or transplantation stress, they found that PFKFB3 governs cell cycle progression and promotes the production of differentiated cells from HSCs in proliferative environments by activating glycolysis. Overall, in their study, Watanuki et al combined metabolomic tracing to quantitatively identify metabolic programs of HSCs and found that PFKFB3 confers glycolytic dependence onto HSCs to help coordinate their response to stress. Even so, several important questions need to be addressed as below:

      We sincerely appreciate the constructive feedback from the reviewer. Additional experiments and textual improvements have been made to the manuscript based on your valuable suggestions. In particular, the major revisions are as follows: First, we investigated the extent to which other metabolites, not limited to the glycolytic system, affect metabolism in HSCs after 5-FU treatment. Second, the extent to which PFKFB3 contributes to the expansion of the HSPC pool in the bone marrow was adjusted to make the description more accurate based on the data. Finally, we overexpressed PFKFB3 in HSCs derived from GO-ATeam2 mice and confirmed that PRMT1 inhibition did not reduce the ATP concentration. We believe that the reviewer's valuable comments have further deepened our knowledge of the significance of glycolytic activation by PFKFB3 that we have demonstrated. Our response to the "Recommendations for Authors" is listed first, followed by our responses to all "Public Review" comments as follows:

      (Recommendations For The Authors):

      1. The methods used in key experiments should be described in more detail. For example, in the section on ‘Conversion of GO-ATeam2 fluorescence to ATP concentration’, the knock-in strategy for GO-ATeam2 should be described, as well as U-13C6 -glucose tracer assays.

      As per your recommendation, we have described the key experimental method in more detail in the revised manuscript: the GO-ATeam2 knock-in method was reported by Yamamoto et al. 1. Briefly, they used a CAG promoter-based knock-in strategy targeting the Rosa26 locus to generate GO-ATeam2 knock-in mice. A description of the method has been added to Methods and the reference has been added to the citation.

      For the U-13C6-glucose tracer analysis, the following points were added to describe the details of the analysis: First, a note was added that the number of cells used for the in vitro tracer analysis was the number of cells used for each sample. Second, we added the solution from which the cells were collected by sorting. We added that the incubation was performed under 1% O2 and 5% CO2.

      1. Confusing image label of Supplemental Figure 1H should be corrected in line 253.

      We have corrected the incorrect figure caption on line 217 in the revised manuscript to "Supplemental Figure 1N" as you suggested.

      1. The percentage of the indicated cell population should also be shown in Figure S1B.

      As you indicated, we have included the percentages for each population in Supplemental Figure 1B.

      Author response image 1.

      1. Please pay attention to the small size of the marks in the graph, such as in Figure S1F and so on.

      As you indicated, we have corrected the very small text contained in Figure S1F. Similar corrections have been made to Figures S1B and S5A.

      1. Please pay attention to the label of line in Figure S6A-D.

      Thank you very much for the advice. We have added line labels to the graph in the original Figures S6A–D.

      (Specific comments)

      1. Based on previous reports, the authors expanded the LSK gate to include as many HSCs as possible (Supplemental Figure 1B). However, while they showed the gating strategy on Day 6 after 5-FU treatment, results from other time-points should also be displayed to ensure the strict selection of time-points.

      Thank you for pointing this out. First, we did not enlarge the Sca-1 gating in this study. We apologize for any confusion caused by the incomplete description. The gating of c-Kit is based on that shown by Umemoto et al (Figure EV1A) 2, who used 250 mg/kg 5-FU, so their c-Kit reduction is more pronounced than ours.

      We followed this study and compared c-Kit expression in Lin-Sca-1+CD150+CD48-EPCR+ gates to BMMNCs on day 6 after 5-FU administration (150 mg/kg). The results are shown below.

      Author response image 2.

      Since the MFI of c-Kit was downregulated, we used gating that extended the c-Kit gate to lower-expression regions on day 6 after 5-FU administration (revised Figure S1C). At other time points, LSK gating was the same as in the PBS-treated group, as noted in the Methods.

      1. In Figure 1, the authors examined the metabolite changes on Day 6 after 5-FU treatment. However, it is important to consider whether there are any dynamic adjustments to metabolism during the early and late stages of 5-FU treatment in HSCs compared to PBS treatment, in order to coordinate cell homeostasis despite no significant changes in cell cycle progression at other time-points.

      Thank you for pointing this out. Below are the results of the GO-ATeam2 analysis during the very early phase (day 3) and late phase (day 15) after 5-FU administration (revised Figures S7A–H).

      Author response image 3.

      In the very early phase, such as day 3 after 5-FU administration, cell cycle progression had not started (Figure S1C) and was not preceded by metabolic changes. Meanwhile, in the late phase, such as day 15 after 5-FU administration, the cell cycle and metabolism returned to a steady state. In summary, the timing of the metabolic changes coincided with that of cell cycle progression. This point is essential for discussing the cell cycle-dependent metabolic system of HSCs and has been newly included in the Results (page 11, lines 321-323).

      1. As is well known, ATP can be produced through various pathways, including glycolysis, the TCA cycle, the PPP, NAS, lipid metabolism, amino acid metabolism and so on. Therefore, it is important to investigate whether treatment with 5-FU or oligomycin affects these other metabolic pathways in HSCs.

      As the reviewer pointed out, ATP production by systems other than the glycolytic system of HSCs is also essential. In this revised manuscript, we examined the effects of the FAO inhibitor (Etomoxir, 100 µM) and the glutaminolysis inhibitor 6-diazo-5-oxo-L-norleucine (DON, 2mM) alone or in combination on the ATP concentration of HSCs after PBS or 5-FU treatment. As shown below, there was no apparent decrease in ATP concentration (revised Figures S7J–M).

      Author response image 4.

      Fatty acid β-oxidation activity was also measured in 5-FU-treated HSCs using the fluorescent probe FAOBlue and was unchanged compared to PBS-treated HSCs (revised Figure S7N).

      Author response image 5.

      Notably, the addition of 100 µM etomoxir plus glucose and Pfkfb3 inhibitors resulted in a rapid decrease in ATP concentration in HSCs (revised Figures S7O–P). This indicates that etomoxir partially mimics the effect of oligomycin, suggesting that at a steady state, OXPHOS is driven by FAO, but can be compensated by the acceleration of the glycolytic system by Pfkfb3. Meanwhile, the exposure of HSCs to Pfkfb3 inhibitors in addition to 2 mM DON, which is an extremely high dose considering that the Ki value of DON for glutaminase is 6 µM, did not reduce ATP (revised Figures S7O–P). This suggests that ATP production from glutaminolysis is limited in HSCs at a steady state.

      Author response image 6.

      These points suggest that OXPHOS is driven by fatty acids at a steady state, but unlike the glycolytic system, FAO is not further activated by HSCs after 5-FU treatment. The results of these analyses and related descriptions are included in the revised manuscript (page 11, lines 332-344).

      1. In part 2, they showed that oligomycin treatment of HSCs exhibited activation of the glycolytic system, but what about the changes in ATP concentration under oligomycin treatment? Are other metabolic systems affected by oligomycin treatment?

      Thank you for your thoughtful comments. The relevant results we have obtained so far with the GO-ATeam2 system are as follows: First, OXPHOS inhibition in the absence of glucose significantly decreases the ATP concentration of HSCs (Figure 4C). Meanwhile, OXPHOS inhibition in the presence of glucose maintains the ATP concentration of HSCs (Figure 5B). Since it is difficult to imagine a completely glucose-free environment in vivo, it is thought that ATP concentration is maintained by the acceleration of the glycolytic system even under hypoxic or other conditions that inhibit OXPHOS.

      Meanwhile, glucose tracer analysis shows that OXPHOS inhibition suppresses nucleic acid synthesis (NAS) except for the activation of the glycolytic system (Figures 2C–F). This is because phosphate groups derived from ATP are transferred to nucleotide mono-/di-phosphate in NAS, but OXPHOS, the main source of ATP production, is impaired, along with the enzyme conjugated with OXPHOS in the process of NAS (dihydroorotate dehydrogenase, DHODH). We have added a new paragraph in the Discussion section (page 17, lines 511-515) to provide more insight to the reader by summarizing and discussing these points.

      1. In Figure 5M, it would be helpful to include a control group that was not treated with 2-DG. Additionally, if Figure 5L is used as the control, it is unclear why the level of ATP does not show significant downregulation after 2-DG treatment. Similarly, in Figure 5O, a control group with no glucose addition should be included.

      Thank you for your advice. The experiments corresponding to the control groups in Figures 5M and O were in Figures 5L and N, respectively, but we have combined them into one graph (revised Figures 5L–M). The results more clearly show that PFKFB3 overexpression enhances sensitivity to 2-DG, but also enhances glycolytic activation upon oligomycin administration.

      Author response image 7.

      1. In this study, their findings suggest that PFKFB3 is required for glycolysis of HSCs under stress, including transplantation. In Figure 7B, the results showed that donor-derived chimerism in PB cells decreased relative to that in the WT control group during the early phase (1 month post-transplant) but recovered thereafter. Although the transplantation cell number is equal in two groups of donor cells, it is unclear why the donor-derived cell count decreased in the 2-week post-transplantation period and recovered thereafter in the Pfkgb3 KO group. Therefore, they should provide an explanation for this. Additionally, they only detected the percentage of donor-derived cells in PB but not from BM, which makes it difficult to support the argument for Increasing the HSPC pool.

      As pointed out by the reviewer, it is interesting to note that the decrease in peripheral blood chimerism in the PFKFB3 knockout is limited to immediately after transplantation and then catches up with the control group (Figure 7B). We attribute this to the fact that HSPC proliferation is delayed immediately after transplantation in PFKFB3 deficiency, but after a certain time, PB cells produced by the delayed proliferating HSPCs are supplied. In support of this, the PFKFB3 knockout HSPCs did not exhibit increased cell death after transplantation (Figure 7K), while a delayed cell cycle was observed (Figures 7G–J). A description of this point has been added to the Discussion (page 19, lines 573-579).

      In addition, the knockout efficiency in bone marrow cells could not be verified because the number of cells required for KO efficiency analysis was not available. Therefore, we have added a statement on this point and have toned down our overall claim regarding the extent to which PFKFB3 is involved in the expansion of the HSPC pool (page 15, lines 474-476).

      1. In Figure 7E, they collected the BM reconstructed with Pfkfb3- or Rosa-KO HSPCs two months after transplantation, and then tested their resistance to 5-FU. However, the short duration of the reconstruction period makes it difficult to draw conclusions about the effects on steady-state blood cell production.

      We agree that we cannot conclude from this experiment alone that PFKFB3 is completely unnecessary in steady state because, as you pointed out, the observation period of the experiment in Figure 7E is not long. We have toned down the claim by stating that PFKFB3 is only less necessary in steady-state HSCs compared to proliferative HSCs (page 15, lines 460-461).

      1. PFK is allosterically activated by PFKFB, and other members of the PFKFB family could also participate in the glycolytic program. Therefore, they should investigate their function in contributing to glycolytic plasticity in HSCs during proliferation. Additionally, they should also analyze the protein expression and modification levels of other members. Although PFKFB3 is the most favorable for PFK activation, the role of other members should also be explored in HSC cell cycling to provide sufficient reasoning for choosing PFKFB3.

      To further justify why we chose PFKFB3 among the PFKFB family members, we reviewed our data and the publicly available Gene Expression Commons (GEXC) 3. PFKFB3 is the most highly expressed member of the PFKFB family in HSCs (revised Figure 4F), and its expression increases with proliferation (Author response image 9). In addition to this, we have also cited the literature 4 indicating that AZ PFKFB3 26 is a Pfkfb3-specific inhibitor that we used in this paper, and added a note to this point (that it is specific) (page 11, lines 327-329). Through these revisions, we sought to strengthen the rationale for Pfkfb3 as the primary target of the analysis.

      Author response image 8.

      Author response image 9.

      1. In this study, the authors identified PRMT1 as the upstream regulator of PFKFB3 that is involved in the glycolysis activation of HSCs. However, PRMT1 is also known to participate in various transcriptional activations. Thus, it is important to determine whether PRMT1 affects glycolysis through transcriptional regulation or through its direct regulation of PFKFB3? Additionally, the authors should investigate whether PRMT1i inhibits ATP production in normal HSCs. Moreover, could we combine Figure 6I and 6J for analysis. Finally, the authors could conduct additional rescue experiments to demonstrate that the effect of PRMT1 inhibitors on ATP production can be rescued by overexpression of PFKFB3.

      Although PRMT1 inhibition reduced m-PFKFB3 levels in HSCs, 5-FU treatment also reduced or did not alter Pfkfb3 transcript levels (Figures 6B, G) and the expression of genes such as Hoxa7/9/10, Itga2b, and Nqo1, which are representative transcriptional targets of PRMT1, in proliferating HSCs after 5-FU treatment (revised Figure S9).

      Author response image 10.

      These results suggest that PRMT1 promotes PFKFB3 methylation, which increases independently of transcription in HSCs after 5-FU treatment.

      A summary analysis of the original Figures 6I and 6J is shown below (revised Figure 6I).

      Author response image 11.

      Finally, we tested whether the inhibition of the glycolytic system and the decrease in ATP concentration due to PRMT1 inhibition could be rescued by the retroviral overexpression of PFKFB3. We found that PFKFB3 overexpression did not decrease the ATP concentration in HSCs due to PRMT1 inhibition (revised Figure 6J). Therefore, PFKFB3 overexpression mitigated the decrease in ATP concentration caused by PRMT1 inhibition. These data and related statements have been added to the revised manuscript (page 14, lines 427-428).

      Author response image 12.

      Reviewer #2:

      In the manuscript Watanuki et al. want to define the metabolic profile of HSCs in stress/proliferative (myelosuppression with 5-FU), and mitochondrial inhibition and homeostatic conditions. Their conclusions are that during proliferation HSCs rely more on glycolysis (as other cell types) while HSCs in homeostatic conditions are mostly dependent on mitochondrial metabolism. Mitochondrial inhibition is used to demonstrate that blocking mitochondrial metabolism results in similar features of proliferative conditions.

      The authors used state-of-the-art technologies that allow metabolic readout in a limited number of cells like rare HSCs. These applications could be of help in the field since one of the major issues in studying HSCs metabolism is the limited sensitivity of the“"standard”" assays, which make them not suitable for HSC studies.

      However, the observations do not fully support the claims. There are no direct evidence/experiments tackling cell cycle state and metabolism in HSCs. Often the observations for their claims are indirect, while key points on cell cycle state-metabolism, OCR analysis should be addressed directly.

      We sincerely appreciate the reviewer's constructive comments. Thank you for highlighting the importance of the highly sensitive metabolic assay developed in this study and the findings based on it. Meanwhile, the reviewer's comments have made us aware of areas where we can further improve this manuscript. In particular, in the revised manuscript, we have performed further studies to demonstrate the link between the cell cycle and metabolic state. Specifically, we further subdivided HSCs by the uptake of in vivo-administered 2-NBDG and performed cell cycle analysis. Next, HSCs after PBS or 5-FU treatment were analyzed by a Mito Stress test using the Seahorse flux analyzer, including ECAR and OCR, and a more direct relationship between the cell cycle state and the metabolic system was found. We believe that the reviewer's valuable suggestions have helped us clarify more directly the importance of the metabolic state of HSCs in response to cell cycle and stress that we wanted to show and emphasize the usefulness of the GO-ATeam2 system. Our response to "Recommendations For The Authors" is listed first, followed by our responses to all comments in "Public Review" as follows:

      (Recommendations For The Authors):

      In general, I believe it would be important:

      1. to directly associate cell cycle state with metabolic state. For example, by sorting HSC (+/- 5FU) based on their cell cycle state (exploiting the mouse model presented in the manuscript or by defining G0/G1/G2-S-M via Pyronin/Hoechst staining which allow to sort live cells) and follow the fate of radiolabeled glucose.

      Thank you for raising these crucial points. Unfortunately, it was difficult to perform the glucose tracer analysis by preparing HSCs with different cell cycle states as you suggested due to the amount of work involved. In particular, in the 5-FU group, more than 60 mice per group were originally required for an experiment, and further cell cycle-based purification would require many times that number of mice, which we felt was unrealistic under current technical standards. As an alternative, we administered 2-NBDG to mice and fractionated HSCs at the 2-NBDG fluorescence level for cell cycle analysis. The results are shown below (revised Figure S1M). Notably, even in the PBS-treated group, HSCs with high 2-NBDG uptake were more proliferative than those with low 2-NBDG uptake and are comparable to HSCs after 5-FU treatment, although the overall population of HSCs exiting the G0 phase and entering the G1 phase increased after 5-FU treatment. In both PBS/5-FU-treated groups, these large differences in cell cycle glucose utilization suggest a direct link between HSC proliferation and glycolysis activation. If a more sensitive type of glucose tracer analysis becomes available in the future, it may be possible to directly address the reviewer's comments. We see this as a topic for the future. The descriptions of the above findings and perspectives have been added to the Results and Discussion section (page 7, lines 208-214, page 20, lines 607-610).

      Author response image 13.

      1. Use other radio labeled substrates (fatty acid, glutamate)

      Thank you very much for your suggestion. While this is an essential point for future studies, we believe it is not the primary focus of the paper. We are planning another research project on tracer analysis using labeled fatty acids and glutamates, which we will report on in the near future. We have clearly stated in the Abstract and Introduction of the revised manuscript, that the focus of this study is on changes in glucose metabolism when HSCs are stressed (page 3, line 75 and 87, page 5, lines 135).

      Instead, we added the following analyses of metabolic changes in fatty acids and glutamate using the GO-ATeam2 system. HSCs derived from GO-ATeam2 mice treated with PBS or 5-FU were used to measure changes in ATP concentrations after exposure to the fatty acid beta-oxidation (FAO) inhibitor etomoxir and the glutaminolysis inhibitor 6-diazo-5-oxo-L-norleucine (DON). Etomoxir was used at 100 µM, a concentration that inhibits FAO without inhibiting mitochondrial electron transfer complex I, as previously reported 5. DON was used at 2 mM, a concentration that sufficiently inhibits the enzyme as the Ki for glutaminase is 6 µM. In this experiment, etomoxir alone, DON alone, or etomoxir and DON in combination did not decrease the ATP concentration of HSCs in the PBS and 5-FU groups (revised Figures S7J–M), suggesting that FAO and glutaminolysis were not essential for ATP production in HSCs in the short term. Thus, according to the analysis using the GO-Ateam2 system, HSCs exposed to acute stresses change the efficiency of glucose utilization (accelerated glycolytic ATP production) rather than other energy sources. Since there are reports that FAO and glutaminolysis are required for HSC maintenance in the long term 5,6, compensatory pathways may be able to maintain ATP levels in the short term. A description of these points has been added to the Discussion (page 11, lines 332-344).

      Author response image 14.

      1. Include OCR analyses.

      In addition to the ECAR data of the Mito Stress test (original Figures 2G–H), OCR data were added to the revised manuscript (revised Figures 2H, S3D). Compared to c-Kit+ myeloid progenitors (LKS- cells), HSC showed a similar increase in ECAR, while the decrease in OCR was relatively limited. A possible explanation for this is that glycolytic and mitochondrial metabolism are coupled in c-Kit+ myeloid progenitors, whereas they are decoupled in HSCs. This is also suggested by the glucose plus oligomycin experiment in Figures 5B, C, and S6A–D (orange lines). In summary, in HSCs, glycolytic and mitochondrial ATP production are decoupled and can maintain ATP levels by glycolytic ATP production alone, whereas in progenitors including GMPs, the two ATP production systems are constantly coupled, and glycolysis alone cannot maintain ATP concentration. We have added descriptions of these points in the Results and Discussion section (page 8, lines 240-243, page 18, lines 558-561).

      Author response image 15.

      Next, a Mito Stress test was performed using HSCs derived from PBS- or 5-FU-treated mice in the presence or absence of oligomycin (revised Figures 1G–H, S3A–B). Without oligomycin treatment, ECAR in 5-FU-treated HSCs was higher than in PBS-treated HSCs, and OCR was unchanged. Oligomycin treatment increased ECAR in both PBS- and 5-FU-treated HSCs, whereas OCR was unchanged in PBS-treated HSCs, but significantly decreased in 5-FU-treated HSCs. Changes in ECAR in response to oligomycin differed between HSC proliferation or differentiation: ECAR increased in 5-FU-treated HSCs but not in LKS- progenitors (original Figures 2G–H). This suggests a metabolic feature of HSCs in which the coupling of OXPHOS with glycolysis seen in LKS- cells is not essential in HSCs even after cell cycle entry. The results and discussion of this experiment have been added to page 7, lines 194-201 and page 18, lines 558-561).

      Author response image 16.

      1. Correlate proliferation-mitochondrial inhibition-metabolic state

      We agree that it is important to clarify this point. First, OXPHOS inhibition and proliferation similarly accelerate glycolytic ATP production with PFKFB3 (Figures 4G, I, and 5F–I). Meanwhile, oligomycin treatment rapidly decreases ATP in HSCs with or without 5-FU administration (Figure 4C). These results suggest that OXPHOS is a major source of ATP production both at a steady state and during proliferation, even though the analysis medium is pre-saturated with hypoxia similar to that in vivo. This has been added to the Discussion section (page 17, lines 520-523).

      1. Tune down the claim on HSCs in homeostatic conditions since from the data it seems that HSCs rely more on anaerobic glycolysis.

      Thanks for the advice. The original Figures S2C, D, F, and G show that HSC is dependent on the anaerobic glycolytic system even at a steady state, so we have toned down our claims (page 7, lines 192-194).

      1. For proliferative HSCs mitochondrial are key. When you block mitochondria with oligomycin there's the biggest drop in ATP.

      In the revised manuscript, we have tried to highlight the key findings that you have pointed out. First, we mentioned in the Discussion (page 17, lines 523-525) that previous studies suggested the importance of mitochondria in proliferating HSCs. Meanwhile, the GO-ATeam2 and glucose tracer analyses in this study newly revealed that the glycolytic system activated by PFKFB3 is activated during the proliferative phase, as shown in Figure 4C. We also confirmed that mitochondrial ATP production is vital in proliferating HSCs, and we hope to clarify the balance between ATP-producing pathways and nutrient sources in future studies.

      1. To better clarify this point authors, authors should do experiments in hypoxic conditions and compare it to oligomycin treatment and showing that mito-inhibition acts differently on HSCs (considering that all these drugs are toxic for mitochondria and induce rapidly stress responses ex: mitophagy).

      We apologize for any confusion caused by not clearly describing the experimental conditions. As pointed out by the reviewer, we also recognize the importance of experiments in a hypoxic environment. All GO-ATeam2 analyses were performed in a medium saturated sufficiently under hypoxic conditions and analyzed within minutes, so we believe that the medium did not become oxygenated (page S5-S6, lines 160-163 in the Methods). Despite being conducted under such hypoxic conditions, the substantial decrease in ATP after oligomycin treatment is intriguing (original Figures 4C, 5B, 5C). The p50 value of mitochondria (the partial pressure of oxygen at which respiration is half maximal) is 0.1 kPa, which is less than 0.1% of the oxygen concentration at atmospheric pressure 7. Thus, biochemically, it is consistent that OXPHOS can maintain sufficient activity even in a hypoxic environment like the bone marrow. We are currently embarking on a study to determine ATP concentration in physiological hypoxic conditions using in vivo imaging within the bone marrow, which we hope to report in a separate project. We have discussed these points, technical limitations, and perspectives in the Discussion section (page 20, lines 610-612).

      • In Figure 1 C, D, E and F, the comparison should be done as unpaired t test and the control group should not be 1 as the cells comes from different individuals.

      Thank you very much for pointing this out. We have reanalyzed and revised the figures (revised Figures 1C–F)

      Author response image 17.

      • In Figure S2A, the post-sorting bar of 6PG, R5P and S7P are missing.

      Metabolites below the detection threshold (post-sorting samples of 6PG, R5P, and S7P) are now indicated as N.D. (not detected) (revised Figure S2A).

      Author response image 18.

      • In the 2NBDG experiments, authors should add the appropriate controls, since it has been shown that 2NBDG cellular uptake do not correctly reflect glucose uptake (Sinclair LV, Immunometabolism 2020) (a cell type dependent variations) thus inhibitors of glucose transporters should be added as controls (cytochalasin B; 4,6-O-ethylidene-a-D-glucose) it would be quite challenging to test it in vivo but it would be sufficient to show that in vitro in the different HSPCs analyzed.

      We appreciate the essential technical point raised by the reviewer. In the revised manuscript, we performed a 2-NBDG assay with cytochalasin B and phloretin as negative controls. After PBS treatment, 2-NBDG uptake was higher in 5-FU-treated HSCs compared to untreated HSCs. This increase was inhibited by both cytochalasin B and phloretin. In PBS-treated HSCs, cytochalasin B did not downregulate 2-NBDG uptake, whereas phloretin did. Although cytochalasin B inhibits glucose transporters (GLUTs), it is also an inhibitor of actin polymerization. Therefore, its inhibitory effect on GLUTs may be weaker than that of phloretin. We have revised the figure (revised Figure S1L) and added the corresponding description (page 7, lines 207-208).

      Author response image 19.

      • S5C: authors should show the cell number for each population. If there's a decreased in % in Lin- that will be reflected in all HSPCs. Comparing the proportion of the cells doesn't show the real impact on HSPCs.

      Thank you for your insightful point. In the revision, we compared the numbers, not percentages, of HSPCs and found no difference in the number of cells in the major HSPC fractions in Lin-. The figure has been revised (revised Figure S6C) and the corresponding description has been added (page 10, lines 296-299).

      Author response image 20.

      Minor:

      1. In S1 F-G is not indicated in which day post 5FU injection is done the analysis. I assume on day 6 but it should be indicated in the figure legend and/or text.

      Thank you for pointing this out. As you assumed, the analysis was performed on day 6. The description has been added to the legend of the revised Figure S1G.

      1. S1K is not described in the text. What are proliferative and quiescence-maintaining conditions? The analyses are done by flow using LKS SLAM markers after culture? How long was the culture?

      Thank you for your comments. First, the figure citation on line 250 was incorrect and has been corrected to Figure S1N. Regarding the proliferative and quiescence-maintaining conditions, we have previously reported on these 8. In brief, these are culture conditions that maintain HSC activity at a high level while allowing for the proliferation or maintenance of HSCs in quiescence, achieved by culturing under fatty acid-rich, hypoxic conditions with either high or low cytokine concentrations. Analysis was performed after one week of culture, with the HSC number determined by flow cytometry based on the LSK-SLAM marker. While these are mentioned in the Methods section, we have added a description in the main text to highlight these points for the reader (page 7, lines 214-217).

      1. In Figure 5G, why does the blue line (PFKFB3 inhibitor) go up in the end of the real-time monitoring? Does it mean that other compensatory pathway is turned on?

      As you have pointed out, we cannot rule out the possibility that other unknown compensatory ATP production pathways were activated. We have added a note in the Discussion section to address this (page 18, lines 555-556).

      1. In Figure S6H&J, the reduction is marginal. Does it mean that PKM2 is not important for ATP production in HSCs?

      The activity of the inhibitor is essential in the GO-ATeam2 analysis. The commercially available PKM2 inhibitors have a higher IC50 value (IC50 = 2.95 μM in this case). Nevertheless, the effect of reducing the ATP concentration was observed in progenitor cells, but not in HSCs. The report by Wang et al. 9 on the analysis using a PKM2-deficient model suggests a stronger effect on progenitor cells than on HSCs. Our results are similar to those of the previous report.

      (Specific comments)

      Specifically, there are several major points that rise concerns about the claims:

      1. The gating strategy to select HSCs with enlarged Sca1 gating is not convincing. I understand the rationale to have a sufficient number of cells to analyze, however this gating strategy should be applied also in the control group. From the FACS plot seems that there are more HSCs upon 5FU treatment (Figure S1b). How that is possible? Is it because of the 20% more of cycling cells at day 6? To prove that this gating strategy still represents a pure HSC population, authors should compare the blood reconstitution capability of this population with a "standard" gated population. If the starting population is highly heterogeneous then the metabolic readout could simply reflect cell heterogeneity.

      Thank you for pointing this out. First, we did not enlarge the Sca-1 gating in this study. We apologize for any confusion caused by the incomplete description. The gating of c-Kit is based on that shown by Umemoto et al (Figure EV1A) 2, who used 250 mg/kg 5-FU, so their c-Kit reduction is more pronounced than ours.

      We followed this study and compared c-Kit expression in the Lin-Sca-1+CD150+CD48-EPCR+ gates to BMMNCs on day 6 after 5-FU administration (150 mg/kg). The results are shown below.

      Author response image 21.

      Since the MFI of c-Kit was downregulated, we used gating that extended the c-Kit gate to lower expression regions on day 6 after 5-FU administration (revised Figure S1C).

      At other time points, LSK gating was the same as in the PBS-treated group, as noted in the Methods.

      The reason why the number of HSCs appears to be higher in the 5-FU group is because most of the differentiated blood cells were lost due to 5-FU administration and the same number of cells as in the PBS group were analyzed by FACS, resulting in a relatively higher number of HSCs. The legend of Figure S1 shows that the number of HSCs in both the PBS and 5-FU groups appeared to increase because the same number of BMMNCs was obtained at the time of analysis (page S22, lines 596-598).

      Regarding cellular heterogeneity, from a metabolic point of view, the heterogeneity in HSCs is rather reduced by 5-FU administration. As shown in Figure S3A–C, this is simulated under stress conditions, such as after 5-FU administration or during OXPHOS inhibition, where the flux variability in each enzymatic reaction is significantly reduced. GO-ATeam2 analysis after 5-FU treatment showed no increase in cell population variability. After 2-DG treatment, ATP concentrations in HSCs were widely distributed from 0 mM to 0.8 mM in the PBS group, while more than 80% of those in the 5-FU group were less than 0.4 mM (Figures 4B, D). HSCs may have a certain metabolic diversity at a steady state, but under stress conditions, they may switch to a more specialized metabolism with less cellular heterogeneity in order to adapt.

      1. S2 does not show major differences before and after sorting. However, a key metabolite like Lactate is decreased, which is also one of the most present. Wouldn't that mean that HSCs once they move out from the hypoxic niche, they decrease lactate production? Do they decrease anaerobic glycolysis? How can quiescent HSC mostly rely on OXPHOS being located in hypoxic niche?

      2. Since HSCs in the niche are located in hypoxic regions of the bone marrow, would that not mimic OxPhos inhibition (oligomycin)? Would that not mean that HSCs in the niche are more glycolytic (anaerobic glycolysis)?

      3. In Figure 5B, the orange line (Glucose+OXPHOS inhibition) remains stable, which means HSCs prefer to use glycolysis when OXPHOS is inhibited. Which metabolic pathway would HSCs use under hypoxic conditions? As HSCs resides in hypoxic niche, does it mean that these steady-state HSCs prefer to use glycolysis for ATP production? As mentioned before, mitochondrial inhibition can be comparable at the in vivo condition of the niche, where low pO2 will "inhibit" mitochondria metabolism.

      Thank you for the first half of comment 2 on the technical features of our approach. First, as you have pointed out, there is minimal variation and stable detection of many metabolites before and after sorting (Figure S2A), suggesting that isolation from the hypoxic niche and sorting stress do not significantly alter metabolite detection performance. This is consistent with a previous report by Jun et al. 10. Meanwhile, lactate levels decreased by sorting. Therefore, if the activity of anaerobic glycolysis was suppressed in stressed HSCs, it may be difficult to detect these metabolic changes with our tracer analysis. However, in this study, several glycolytic metabolites, including an increase in lactate, were detected in HSCs from 5-FU-treated mice compared with HSCs from PBS-treated mice that were similarly sorted and prepared, suggesting an increase in glycolytic activity. In other words, we may have been fortunate to detect the stress-induced activation of the glycolytic system beyond the characteristic of our analysis system that lactate levels tend to appear lower than they are. Given that damage to the bone marrow hematopoiesis tends to alleviate the low-oxygen status of the niche 11, we postulate that this upregulated aerobic glycolysis arises intrinsically in HSCs rather than from external conditions.

      The second half of comment 2, and comments 7 and 10, are essential and overlapping comments and will be answered together. Although genetic analyses have shown that HSCs produce ATP by anaerobic glycolysis in low-oxygen environments 9,12, our GO-ATeam2 analysis in this study confirmed that HSCs also generate ATP via mitochondria. This is also supported by Ansó's prior findings where the knockout of the Rieske iron–sulfur protein (RISP), a constituent of the mitochondrial electron transport chain, impairs adult HSC quiescence and bone marrow repopulation 13. Bone marrow is a physiologically hypoxic environment (9.9–32.0 mmHg 11). However, the p50 value of mitochondria (the partial pressure of oxygen at which respiration is half maximal) is below 0.1% oxygen concentration at atmospheric pressure (less than 1 mmHg) 7. This suggests that OXPHOS can retain sufficient activity even under physiologically hypoxic conditions. We are currently initiating efforts to discern ATP concentrations in vivo within the bone marrow under physiological hypoxia. This will be reported in a separate project in the future. Admittedly, when we began this research, we did not anticipate the significant mitochondrial reliance of HSCs. As we previously reported, the metabolic uncoupling of glycolysis and mitochondria 12 may enable HSCs to activate only glycolysis, and not mitochondria, under stress conditions such as post-5-FU administration, suggesting a unique metabolic trait of HSCs. We have included these technical limitations and perspectives in the Discussion section (page 17, lines 520-523).

      1. The authors performed challenging experiments to track radiolabeled glucose, which are quite remarkable. However, the data do not fully support the conclusions. Mitochondrial metabolism in HSCs can be supported by fatty acid and glutamate, thus authors should track the fate of other energy sources to fully discriminate the glycolysis vs mito-metabolism dependency. From the data on S2 and Fig1 1C-F, the authors can conclude that upon 5FU treatment HSCs increase glycolytic rate.

      2. FIG.2B-C: Increase of Glycolysis upon oligomycin treatment is common in many different cell types. As explained before, other radiolabeled substrates should be used to understand the real effect on mitochondria metabolism.

      Thank you for your suggestion. While this is essential for future studies, we believe it is not the primary focus of the paper. We are planning another research project on tracer analysis using labeled fatty acids and glutamates, which we will report on in the near future. We have clearly stated in the Abstract and Introduction of the revised manuscript that the focus of this study is on changes in glucose metabolism when HSCs are stressed (page 3, line 75 and 87, page 5, lines 135).

      Instead, we have added the following analyses of metabolic changes in fatty acids and glutamate using the GO-ATeam2 system: HSCs derived from GO-ATeam2 mice treated with PBS or 5-FU were used to measure changes in ATP concentrations after exposure to the fatty acid beta-oxidation (FAO) inhibitor etomoxir and the glutaminolysis inhibitor 6-diazo-5-oxo-L-norleucine (DON). Etomoxir was used at 100 µM, a concentration that inhibits FAO without inhibiting mitochondrial electron transfer complex I, as previously reported 5. DON was used at 2 mM, a concentration that sufficiently inhibits the enzyme as the Ki for glutaminase is 6 µM. In this experiment, etomoxir alone, DON alone, or etomoxir and DON in combination did not decrease the ATP concentration of HSCs in the PBS and 5-FU groups (revised Figures S7J–M), suggesting that FAO and glutaminolysis were not essential for ATP production in HSCs in the short term. Thus, according to the analysis using the GO-Ateam2 system, HSCs exposed to acute stresses change the efficiency of glucose utilization (accelerated glycolytic ATP production) rather than other energy sources. Since there are reports that FAO and glutaminolysis are required for HSC maintenance in the long term 5,6, compensatory pathways may be able to maintain ATP levels in the short term. A description of these points has been added to the Discussion (page 17, lines 525-527).

      Author response image 22.

      Fatty acid β-oxidation activity was also measured in 5-FU-treated HSCs using the fluorescent probe FAOBlue and was unchanged compared to PBS-treated HSCs (revised Figure S7N).

      Author response image 23.

      Notably, the addition of 100 µM etomoxir plus glucose and Pfkfb3 inhibitors resulted in a rapid decrease in ATP concentration in HSCs (revised Figures S7O–P). This indicates that etomoxir partially mimics the effect of oligomycin, suggesting that at a steady state, OXPHOS is driven by FAO, but can be compensated by the acceleration of the glycolytic system by Pfkfb3. Meanwhile, the exposure of HSCs to Pfkfb3 inhibitors in addition to 2 mM DON did not reduce ATP (revised Figures S7O–P). This suggests that ATP production from glutaminolysis is limited in HSCs at a steady state.

      Author response image 24.

      These points suggest that OXPHOS is driven by fatty acids at a steady state, but unlike the glycolytic system, FAO is not further activated by HSCs after 5-FU treatment. The results of these analyses and related descriptions are included in the revised manuscript (page 11, lines 332-344).

      1. In Figure S1, 5-FU leads to the induction of cycling HSCs and in figure 1, 5-FU results in higher activation of glycolysis. Would it be possible to correlate these two phenotypes together? For example, by sorting NBDG+ cells and checking the cell cycle status of these cells?

      We appreciate the reviewer’s insightful comments. We administered 2-NBDG to mice and fractionated HSCs at the 2-NBDG fluorescence level for cell cycle analysis. The results are shown below (revised Figure S1M). Notably, even in the PBS-treated group, HSCs with high 2-NBDG uptake were more proliferative than HSCs with low 2-NBDG uptake and were comparable to HSCs after 5-FU treatment, although the overall population of HSCs that exited the G0 phase and entered the G1 phase increased after 5-FU treatment. In both PBS/5-FU-treated groups, these profound differences in cell cycle glucose utilization suggest a direct link between HSC proliferation and glycolysis activation. Descriptions of the above findings and perspectives have been added to the Results and Discussion section (page 7, lines 208-214, page 20, lines 607-610).

      Author response image 25.

      1. Why are only ECAR measurements (and not OCR measurements) shown? In Fig.2G, why are HSCs compared with cKit+ myeloid progenitors, and not with MPP1? The ECAR increased observed in HSC upon oligomycin treatment is shared with many other types of cells. However, cKit+ cells have a weird behavior. Upon oligo treatment cKit+ cells decrease ECAR, which is quite unusual. The data of both HSCs and cKit+ cells could be clarified by adding OCR curves. Moreover, it is recommended to run glycolysis stress test profile to assess the dependency to glycolysis (Glucose, Oligomycin, 2DG).

      In addition to the ECAR data of the Mito Stress test (original Figures 2G–H), OCR data were added in the revised manuscript (revised Figures 2H, S3D). Compared to c-Kit+ myeloid progenitors (LKS- cells), HSC exhibited a similar increase in ECAR, while the decrease in OCR was relatively limited. This may be because glycolytic and mitochondrial metabolism are coupled in c-Kit+ myeloid progenitors, whereas they are decoupled in HSCs. This is also suggested by the glucose plus oligomycin experiment in Figures 5B, C, and S6A–D (orange lines). In summary, in HSCs, glycolytic and mitochondrial ATP production are decoupled and can maintain ATP levels by glycolytic ATP production alone, whereas in progenitors including GMPs, the two ATP production systems are constantly coupled, and glycolysis alone cannot maintain the ATP concentration. While we could not conduct a glycolysis stress test, we believe that Pfkfb3-dependent glycolytic activation, which is evident in the oligomycin+glucose+Pfkfb3i experiment, is only apparent in HSCs when subjected to glucose+oligomycin treatment (original Figures 5F–I). We have added descriptions of these points in the Results and Discussion section (page 8, lines 240-243, page 18, lines 558-561).

      Author response image 26.

      FIG.3 A-C. As mentioned previously, the flux analyses should be integrated with data using other energy sources. If cycling HSCs are less dependent to OXPHOS, what happen if you inhibit OXHPHOS in 5-FU condition? Since the authors are linking OXPHOS inhibition and upregulation of Glycolysis to increase proliferation, do HSCs proliferate more when treated with oligomycin?

      First, please see our response to comments 3 and 5 regarding the first part of this comment about the flux analysis of other energy sources. According to the analysis using the GO-Ateam2 system, stressed HSCs change the efficiency of glucose utilization (accelerated glycolytic ATP production) rather than other energy sources. The change in ATP concentration after OXPHOS inhibition for 5-FU-treated HSCs is shown in Figures 4C and E, suggesting that the activity of OXPHOS itself does not increase. HSCs after oligomycin treatment and HSCs after 5-FU treatment are similar in that they activate glycolytic ATP production. However, inhibition of OXPHOS did not induce the proliferation of HSCs (original Figure S1K). This suggests that proliferation activates glycolysis and not that activation of the glycolytic system induces proliferation. This similarity and dissimilarity of glycolytic activation upon proliferation and OXPHOS inhibition is discussed in the Discussion section (page 16-17, lines 505-515).

      1. FIG.4 shows that in vivo administration of radiolabeled glucose especially marks metabolites of TCA cycle and Glycolysis. The authors interpret enhanced anaerobic glycolysis, but I am not sure this is correct; if more glycolysis products go in the TCA cycle, it might mean that HSC start engaging mitochondrial metabolism. What do the authors think about that?

      Thank you for pointing this out. We believe that the data are due to two differences in the experimental features between in vivo (Figure S5) and in vitro (Figures 1 and S2) tracer analysis. The first difference is that in in vivo tracer analysis, unlike in vitro, all cells can metabolize U-13C6-glucose. Another difference is that after glucose labeling in vivo, it takes approximately 120–180 minutes to purify HSCs to extract metabolites, and processing on ice may result in a gradual progression of metabolic reactions within HSCs. As a result, in vivo tracer analysis may detect an increased influx of labeled carbon derived from U-13C6-glucose into the TCA cycle over an extended period. However, it is difficult to interpret whether this influx of labeled carbon is derived from the direct influx of glycolysis or the re-uptake by HSCs of metabolites that have been metabolized to other metabolites in other cells. Meanwhile, as shown in Figure 4C using the GO-ATeam2 system, ATP production from mitochondria is not upregulated by 5-FU treatment. This suggests that even if the direct influx from glycolysis into the TCA cycle is increased, the rate of ATP production does not exceed that of glycolysis. Despite these technical caveats in interpretation, the results of in vivo and in vitro tracer analyses are considered essential. In particular, we consider the increased labeling of metabolites involved in glycolysis and nucleotide synthesis to be crucial. We have added a discussion of these points, including experimental limitations (page 17-18, lines 530-545).

      1. FIG.4: the experimental design is not clear. Are BMNNCs stained and then put in culture? Is it 6-day culture or BMNNCs are purified at day 6 post 5FU? FIG-4B-C The difference between PBS vs 5FU conditions are the most significant; however, the effect of oligomycin in both conditions is the most dramatic one. From this readout, it seems that HSCs are more dependent on mitochondria for energy production both upon 5FU treatment and in PBS conditions.

      We apologize for the incomplete description of the experimental details. The experiment involved dispensing freshly stained BMMNC with surface antigens into the medium and immediately subjecting them to flow cytometry analysis. For post-5-FU treatment HSCs, mice were administered with 5-FU (day 1), and freshly obtained BMMNCs were analyzed on day 6. The analysis of HSCs and progenitors was performed by gating each fraction within the BMMNC (original Figure S5A). We have added these details to ensure that readers can grasp these aspects more clearly (page S5, lines 155-158).

      As pointed out by the reviewer, we understand that HSCs produce more ATP through OXPHOS. However, ATP production by glycolysis, although limited, is observed under steady-state conditions (post-PBS treatment HSC), and its reliance increases during the proliferation phase (post-5-FU treatment HSC) (original Figures 4B, D). Until now, discussions on energy production in HSCs have focused on either glycolysis or mitochondrial functions. However, with the GO-ATeam2 system, it has become possible for the first time to compare their contributions to ATP production and evaluate compensatory pathways. As a result, it became evident that while OXPHOS is the main source of ATP production, the reliance on glycolysis plastically increases in response to stress. This has led to a better understanding of HSC metabolism. These points are included in the Discussion as well (page 16, lines 479-488).

      1. FIG.6H should be extended with cell cycle analyses. There are no differences between 5FU and ctrl groups. If 5FU induces HSCs cycling and increases glycolysis I would expect higher 2-NBDG uptake in the 5FU group. How do the authors explain this?

      Thank you for your comments. In the original Figure 6H, we found that 2-NBDG uptake correlated with mPFKFB3 levels in both the 5-FU and PBS groups. mPfkfb3 levels remained low in the few HSCs with low 2-NBDG uptake in the 5-FU group.

      In the revised manuscript, to directly relate glucose utilization to the cell cycle, we administered 2-NBDG to mice and fractionated HSCs at the 2-NBDG fluorescence level for cell cycle analysis. The results are shown below (revised Figure S1M). Notably, even in the PBS-treated group, HSCs with high 2-NBDG uptake were more proliferative than those with low 2-NBDG uptake and are comparable to HSCs after 5-FU treatment, although the overall population of HSCs that exited the G0 phase and entered the G1 phase increased after 5-FU treatment. The large differences in glucose utilization per cell cycle observed in both PBS/5-FU-treated groups suggest a direct link between HSC proliferation and glycolysis activation. Descriptions of the above findings have been added to the Results and Discussion ((page 7, lines 208-214, page 20, lines 607-610).

      Author response image 27.

      1. In S7 the experimental design is not clear. What are quiescent vs proliferative conditions? What does it mean "cell number of HSC-derived colony"? Is it a CFU assay? Then you should show colony numbers. When HSCs proliferate, they need more energy thus inhibition of metabolism will impact proliferation. What happens if you inhibit mitochondrial metabolism with oligomycin?

      Regarding the proliferative and quiescence-maintaining conditions, we have previously reported on these 8. In brief, these are culture conditions that maintain HSC activity at a high level while allowing for the proliferation or maintenance of HSCs in quiescence, achieved by culturing under fatty acid-rich, hypoxic conditions with either high or low cytokine concentrations. Analysis was performed after one week of culture, with the HSC number determined by flow cytometry based on the LSK-SLAM marker. While these are mentioned in the Methods section, we have added a description in the main text to highlight these points for the reader (page 7, lines 214-217).

      In vitro experiments with the oligomycin treatment of HSCs showed that OXPHOS inhibition activates the glycolytic system, but does not induce HSC proliferation (original Figure S1K). This suggests that proliferation activates glycolysis and not that activation of the glycolytic system induces proliferation. This similarity and dissimilarity of glycolytic activation upon proliferation and OXPHOS inhibition is discussed in the Discussion (page 16-17, lines 505-515).

      1. In FIG 7 since homing of HSCs is influenced by the cell cycle state, should be important to show if in the genetic model for PFKFB3 in HSCs there's a difference in homing efficiency.

      In response to the reviewer's comments, we knocked out PFKFB3 in HSPCs derived from Ubc-GFP mice, transplanted 200,000 HSPCs into recipients (C57BL/6 mice) post-8.5Gy irradiation, and harvested the bone marrow of recipients after 16 h to compare homing efficiency (revised Figure S10H). Even with the knockout of PFKFB3, no significant difference in homing efficiency was detected compared to the control group (Rosa knockout group). These results suggest that the short-term reduction in chimerism due to PFKFB3 knockout is not due to decreased homing efficiency or cell death by apoptosis (Figure 7K) but a transient delay in cell cycle progression. We have added descriptions regarding these findings in the Results and Discussion sections (page 15, lines 470-471, page 19, lines 576-578).

      Author response image 28.

      1. Yamamoto M, Kim M, Imai H, Itakura Y, Ohtsuki G. Microglia-Triggered Plasticity of Intrinsic Excitability Modulates Psychomotor Behaviors in Acute Cerebellar Inflammation. Cell Rep. 2019;28(11):2923-2938 e2928.

      2. Umemoto T, Johansson A, Ahmad SAI, et al. ATP citrate lyase controls hematopoietic stem cell fate and supports bone marrow regeneration. EMBO J. 2022:e109463.

      3. Seita J, Sahoo D, Rossi DJ, et al. Gene Expression Commons: an open platform for absolute gene expression profiling. PLoS One. 2012;7(7):e40321.

      4. Boyd S, Brookfield JL, Critchlow SE, et al. Structure-Based Design of Potent and Selective Inhibitors of the Metabolic Kinase PFKFB3. J Med Chem. 2015;58(8):3611-3625.

      5. Ito K, Carracedo A, Weiss D, et al. A PML–PPAR-δ pathway for fatty acid oxidation regulates hematopoietic stem cell maintenance. Nat Med. 2012;18(9):1350-1358.

      6. Oburoglu L, Tardito S, Fritz V, et al. Glucose and glutamine metabolism regulate human hematopoietic stem cell lineage specification. Cell Stem Cell. 2014;15(2):169-184.

      7. Gnaiger E, Mendez G, Hand SC. High phosphorylation efficiency and depression of uncoupled respiration in mitochondria under hypoxia. Proc Natl Acad Sci U S A. 2000;97(20):11080-11085.

      8. Kobayashi H, Morikawa T, Okinaga A, et al. Environmental Optimization Enables Maintenance of Quiescent Hematopoietic Stem Cells Ex Vivo. Cell Rep. 2019;28(1):145-158 e149.

      9. Wang YH, Israelsen WJ, Lee D, et al. Cell-state-specific metabolic dependency in hematopoiesis and leukemogenesis. Cell. 2014;158(6):1309-1323.

      10. Jun S, Mahesula S, Mathews TP, et al. The requirement for pyruvate dehydrogenase in leukemogenesis depends on cell lineage. Cell Metab. 2021;33(9):1777-1792 e1778.

      11. Spencer JA, Ferraro F, Roussakis E, et al. Direct measurement of local oxygen concentration in the bone marrow of live animals. Nature. 2014;508(7495):269-273.

      12. Takubo K, Nagamatsu G, Kobayashi CI, et al. Regulation of glycolysis by Pdk functions as a metabolic checkpoint for cell cycle quiescence in hematopoietic stem cells. Cell Stem Cell. 2013;12(1):49-61.

      13. Anso E, Weinberg SE, Diebold LP, et al. The mitochondrial respiratory chain is essential for haematopoietic stem cell function. Nat Cell Biol. 2017;19(6):614-625.

    1. eLife Assessment

      African (or Salivarian) trypanosomes are significant pathogens of humans and domestic animals. For many decades is was accepted that only the "stumpy" non-proliferative form was capable of infecting the Tsetse-fly vector, but recent work challenged this, suggesting that the proliferative "slender" form is also infective. The current paper provides important and convincing laboratory evidence that the original concept is probably correct for most infections: the slender form was not infective for adult Tsetse, and was only able to infect young, less immunocompetent flies if N-acetyl glucosamine was added to the feed.

    2. Reviewer #2 (Public review):

      Summary:

      In contrast to the recent findings reported by Schuster S et al., this brief paper presents evidence suggesting that the stumpy form of T. brucei is likely the most pre-adapted form to progress through the life cycle of this parasite in the tsetse vector.

      Strengths:

      One significant experimental point is that all fly infection experiments are conducted in the absence of "boosting" metabolites like GlcNAc or S-glutathione. As a result, flies infected with slender trypanosomes present very low or nonexistent infection rates. This provides important experimental evidence that the findings of Schuster S and colleagues may need to be revisited.

      In the revised submission the authors also compared trypanosome midgut infection levels in tsetse flies when either young (teneral) or mature adult flies received infected bloodmeals, with or without 60 mM GlcNAc. The data clearly show that, unlike in teneral flies, the addition of GlcNAc to the trypanosome-infected bloodmeal does not enhance midgut infection in mature adult flies. This is now convincingly demonstrated in Figure 2 and provides strong experimental support for the suggestion that the effect reported by Schuster S. et al. may have been influenced by both fly age and the inclusion of metabolic "boosters" in the bloodmeal.

    3. Reviewer #3 (Public review):

      The dogma in the Trypanosome field is that transmission by Tsetse flies is ensured by stumpy forms. This has been recently challenged by the Engstler lab (Schuster et al. ), who showed that slender forms can also be transmitted by teneral flies. In this work, the authors aimed to test whether transmission by slender forms is possible and frequent. The authors observed that most stumpy forms infections with teneral and adult flies were successful while only 1 out of 24 slender form infections were successful.

      The comparison of midgut infection in adult vs teneral flies was significant in most of the conditions. However, the critical comparison is still missing: within each type of fly (adult or teneral), was the MG infection significantly different between slender and stumpy forms?

      Figure 2 convincingly demonstrates the effect of the metabolite N-acetylglucosamine on Tsetse infection. This addition helps better integrate the study with previous work. I thank the authors for their effort in performing this experiment.

      It is still remains unknown why this work and Schuster et al. reached different conclusions. As a result it remains unclear in which conditions slender forms could be important for transmission. Several variables could explain differences between the two groups: the strain used, the presence or absence of glutathione, how Tsetse colonies were maintained, thorough molecular and cellular characterisation of slender and stumpy forms (to avoid using intermediate forms as slender forms), comparison to recent field parasite strains.

    4. Author response:

      The following is the authors’ response to the previous reviews

      eLife Assessment

      For decades it has been accepted that only the growth-arrested "stumpy" form of Trypanosoma brucei can infect the arthropod vector, the Tsetse fly, but this was recently challenged by a demonstration that - under artificial conditions that are known to enhance infectivity - the proliferative "slender" form can also establish Tsetse infections. The infectiousness of the two forms is a fundamental question in trypanosome biology and epidemiology, concerning both infection dynamics and parasite differentiation. The authors of the current study provide compelling evidence that without artificial enhancement, the "stumpy" form is indeed much more infective for Tsetse than the slender form; they suggest that this is probably also true in the wild.

      Since the authors of this paper did not themselves test the effect of enhancing conditions, the precise reason for the discrepancy in results between the two laboratories has not been demonstrated conclusively.

      This specific comment was addressed in the revision and illustrated with new data.

      Differences between the strain clones, the cell culture conditions and/or the fly colony maintenance conditions could explain part of the differences in infection rates observed here as compared to the Schuster et al. study (1). However, the use of the lectin-inhibitory sugar N-acetyl-glucosamine to enhance infection rates in the latter study could be a more likely explanation. To assess this hypothesis, an additional experimental challenge was performed to compare infection rates in teneral versus adult flies, with or without N-acetyl-glucosamine supplement in an infective meal containing 10<sup>5</sup> slender parasites / ml (Figure 2). Whereas no infection was detected in adult flies, the N-acetyl-glucosamine supplementation of the infective meal led to an increase of the infection rates from 2,4% to 13,3% in teneral flies (Figure 2).

      Public Reviews:

      Reviewer #1 (Public Review):

      Summary:

      Ngoune et al. present compelling evidence that Slender cells are challenged to infect tsetse flies. They explore the experimental context of a recent important paper in the field, Schuster et al., that presents evidence suggesting the proliferative Slender bloodstream T.brucei can infect juvenile tsetse flies. Schuster et al. was disruptive to the widely accepted paradigm that the Stumpy bloodstream form is solely responsible for tsetse infection and T.brucei transmission potential. Evidence presented here shows that in all cases, Stumpy form parasites are exponentially more capable of infecting tsetse flies. They further show that Slender cells do not infect mature flies.

      However, they raise questions of immature tsetse immunological potential and field transmission potential that their experiments do not address. Specifically, they do not show that teneral tsetse flies are immunocompromised, that tsetse flies must be immunocompromised for Slender infection nor that younger teneral tsetse infection is not pertinent to field transmission.

      All these specific comments were addressed in the revision and illustrated with new data and references.

      - The limited immunocompetence of teneral flies has been extensively studied by the labs of S. Aksoy at Yale and M. Lehane at Liverpool. In the discussion, we provide key references from these two labs 19-22.

      - Differences between the strain clones, the cell culture conditions and/or the fly colony maintenance conditions could explain part of the differences in infection rates observed here as compared to the Schuster et al. study (1). However, the use of the lectin-inhibitory sugar N-acetyl-glucosamine to enhance infection rates in the latter study could be a more likely explanation. To assess this hypothesis, an additional experimental challenge was performed to compare infection rates in teneral versus adult flies, with or without N-acetyl-glucosamine supplement in an infective meal containing 10<sup>5</sup> slender parasites / ml (Figure 2). Whereas no infection was detected in adult flies, the N-acetyl-glucosamine supplementation of the infective meal led to an increase of the infection rates from 2,4% to 13,3% in teneral flies (Figure 2).

      - Our comment on the relevance to field transmission is simply based on field observations of the fly biology. For example, according to the capture-recapture experiments described in HARGROVE JW insect sci applic 1990 (new ref 23), wild female mortality was reported 6.8% shortly after emergence, <1% for ages 20-50 days and rose to 5% by 130 day (a pattern similar to that for laboratory reared tsetse), while wild male daily mortality was 8.3% after emergence, fell to 5.5% by 9 days, then rose continuously to more than 10% by 30 days. This means that adult flies represent the majority of individuals in a wild tsetse population. Hence, knowing that both males and females are strictly hematophagous and that they can live up to nine months, the impact of teneral flies (up to 4 days after emergence) on trypanosome transmission appears limited, if not incidental.

      Strengths:

      Experimental Design is precise and elegant, outcomes are convincing. Discussion is compelling and important to the field. This is a timely piece that adds important data to a critical discussion of host:parasite interactions, of relevance to all parasite transmission.

      Thank you

      Weaknesses:

      As above, the authors dispute the biological relevance of teneral tsetse infection in the wild, without offering evidence to the contrary. Statements need to be softened for claims regarding immunological competence or relevance to field transmission.

      All these specific comments were addressed in the revision and illustrated with new data and references.

      - The limited immunocompetence of teneral flies has been extensively studied by the labs of S. Aksoy at Yale and M. Lehane at Liverpool. In the discussion, we provide key references from these two labs 19-22.

      - Differences between the strain clones, the cell culture conditions and/or the fly colony maintenance conditions could explain part of the differences in infection rates observed here as compared to the Schuster et al. study (1). However, the use of the lectin-inhibitory sugar N-acetyl-glucosamine to enhance infection rates in the latter study could be a more likely explanation. To assess this hypothesis, an additional experimental challenge was performed to compare infection rates in teneral versus adult flies, with or without N-acetyl-glucosamine supplement in an infective meal containing 10<sup>5</sup> slender parasites / ml (Figure 2). Whereas no infection was detected in adult flies, the N-acetyl-glucosamine supplementation of the infective meal led to an increase of the infection rates from 2,4% to 13,3% in teneral flies (Figure 2).

      - Our comment on the relevance to field transmission is simply based on field observations of the fly biology. For example, according to the capture-recapture experiments described in HARGROVE JW insect sci applic 1990 (new ref 23), wild female mortality was reported 6.8% shortly after emergence, <1% for ages 20-50 days and rose to 5% by 130 day (a pattern similar to that for laboratory reared tsetse), while wild male daily mortality was 8.3% after emergence, fell to 5.5% by 9 days, then rose continuously to more than 10% by 30 days. This means that adult flies represent the majority of individuals in a wild tsetse population. Hence, knowing that both males and females are strictly hematophagous and that they can live up to nine months, the impact of teneral flies (up to 4 days after emergence) on trypanosome transmission appears limited, if not incidental.

      Reviewer #2 (Public Review):

      Summary:

      In contrast to the recent findings reported by Schuster S et al., this brief paper presents evidence suggesting that the stumpy form of T. brucei is likely the most pre-adapted form to progress through the life cycle of this parasite in the tsetse vector.

      Strengths:

      One significant experimental point is that all fly infection experiments are conducted in the absence of "boosting" metabolites like GlcNAc or S-glutathione. As a result, flies infected with slender trypanosomes present very low or nonexistent infection rates. This provides important experimental evidence that the findings of Schuster S and colleagues may need to be revisited.

      Thank you

      Weaknesses:

      However, I believe the authors should have included their own set of experiments demonstrating that the presence of these metabolites in the infectious bloodmeal enhances infection rates in flies receiving blood meals containing slender trypanosomes. Considering the well-known physiological variabilities among flies from different facilities, including infection rates, this would have strengthened the experimental evidence presented by the authors.

      This specific comment was addressed in the revision and illustrated with new data.

      Differences between the strain clones, the cell culture conditions and/or the fly colony maintenance conditions could explain part of the differences in infection rates observed here as compared to the Schuster et al. study (1). However, the use of the lectin-inhibitory sugar N-acetyl-glucosamine to enhance infection rates in the latter study could be a more likely explanation. To assess this hypothesis, an additional experimental challenge was performed to compare infection rates in teneral versus adult flies, with or without N-acetyl-glucosamine supplement in an infective meal containing 10<sup>5</sup> slender parasites / ml (Figure 2). Whereas no infection was detected in adult flies, the N-acetyl-glucosamine supplementation of the infective meal led to an increase of the infection rates from 2,4% to 13,3% in teneral flies (Figure 2).

      Reviewer #3 (Public Review):

      The dogma in the Trypanosome field is that transmission by Tsetse flies is ensured by stumpy forms. This has been recently challenged by the Engstler lab (Schuster et al.), who showed that slender forms can also be transmitted by teneral flies. In this work, the authors aimed to test whether transmission by slender forms is possible and frequent. The authors observed that most stumpy forms infections with teneral and adult flies were successful while only 1 out of 24 slender form infections were successful.

      In this revised version of the manuscript, the authors made some text changes and included statistical testing as a new section of the Materials and Methods. It seems the comparison of midgut infection in adult vs teneral flies was significant in most of the conditions. However, the critical comparison is still missing: within each type of fly (adult or teneral), was the MG infection significantly different between slender and stumpy forms?

      An ANOVA statistical analysis was performed and a dedicated section added to the revised version. MG infection rate comparisons were statistically significant between teneral and adult flies infected with ST in each amount (p<0.02 with 10 parasites; p<0.0001 with 100 and 1,000 parasites) and with 1,000 SL (p<0.0001). MG infection rate comparisons were statistically significant (p<0.0001) between parasite stages (SL and ST) in each amount (10, 100 and 1,000) and for each fly group (teneral and adult), excepted in teneral flies infected with 1,000 parasites (p=0.2356).

      Given no additional experiments were performed, it remains unknown why this work and Schuster et al. reached different conclusions. As a result it remains unclear in which conditions slender forms could be important for transmission. Several variables could explain differences between the two groups: the strain used, the presence or absence of N-acetylglucosamine and/or glutathione, how Tsetse colonies were maintained, thorough molecular and cellular characterisation of slender and stumpy forms (to avoid using intermediate forms as slender forms), comparison to recent field parasite strains.

      This specific comment was addressed in the revision and illustrated with new data.

      Differences between the strain clones, the cell culture conditions and/or the fly colony maintenance conditions could explain part of the differences in infection rates observed here as compared to the Schuster et al. study (1). However, the use of the lectin-inhibitory sugar N-acetyl-glucosamine to enhance infection rates in the latter study could be a more likely explanation. To assess this hypothesis, an additional experimental challenge was performed to compare infection rates in teneral versus adult flies, with or without N-acetyl-glucosamine supplement in an infective meal containing 10<sup>5</sup> slender parasites / ml (Figure 2). Whereas no infection was detected in adult flies, the N-acetyl-glucosamine supplementation of the infective meal led to an increase of the infection rates from 2,4% to 13,3% in teneral flies (Figure 2).

      Recommendations for the authors:

      Reviewer #1 (Recommendations For The Authors):

      The manuscript is improved, but the author has not addressed much of the constructive criticism offered that would benefit the manuscript.

      To clarify, evidence from Schuster et al did not demonstrate, rather it suggested. That is a major point of this paper - that the previous evidence presented had caveats. Terms such as demonstrate or prove are inappropriate in most biological contexts, unless evidence is without caveat.

      This specific comment was addressed in the revision and illustrated with new data.

      Differences between the strain clones, the cell culture conditions and/or the fly colony maintenance conditions could explain part of the differences in infection rates observed here as compared to the Schuster et al. study (1). However, the use of the lectin-inhibitory sugar N-acetyl-glucosamine to enhance infection rates in the latter study could be a more likely explanation. To assess this hypothesis, an additional experimental challenge was performed to compare infection rates in teneral versus adult flies, with or without N-acetyl-glucosamine supplement in an infective meal containing 10<sup>5</sup> slender parasites / ml (Figure 2). Whereas no infection was detected in adult flies, the N-acetyl-glucosamine supplementation of the infective meal led to an increase of the infection rates from 2,4% to 13,3% in teneral flies (Figure 2).

      Statements regarding teneral flies in the field are softened. Yet the referenced papers pertain more to commensurate coinfections rather than reduced immunocapacity of immature teneral flies in the field. This should be clarified.

      The limited immunocompetence of teneral flies has been extensively studied by the labs of S. Aksoy at Yale and M. Lehane at Liverpool. In the discussion, we provide key references from these two labs 19-22.

      The text remains convoluted to read with grammatical errors in places. For example, it is incorrect to begin a sentence with However. There are far too many run-on sentences in the manuscript that confuse this straightforward story.

      The revised text was improved as much as possible.

      All text requires grammatical refinement and softer claims unless additional experiments are undertaken.

      Reviewer #2 (Recommendations For The Authors):

      I continue to endorse the publication of this manuscript; however, I am somewhat disappointed by the authors' justifications for not conducting additional experiments or exploring other factors that might influence the infection phenotypes in the fly.

      This specific comment was addressed in the revision and illustrated with new data.

      Differences between the strain clones, the cell culture conditions and/or the fly colony maintenance conditions could explain part of the differences in infection rates observed here as compared to the Schuster et al. study (1). However, the use of the lectin-inhibitory sugar N-acetyl-glucosamine to enhance infection rates in the latter study could be a more likely explanation. To assess this hypothesis, an additional experimental challenge was performed to compare infection rates in teneral versus adult flies, with or without N-acetyl-glucosamine supplement in an infective meal containing 10<sup>5</sup> slender parasites / ml (Figure 2). Whereas no infection was detected in adult flies, the N-acetyl-glucosamine supplementation of the infective meal led to an increase of the infection rates from 2,4% to 13,3% in teneral flies (Figure 2).

    1. eLife Assessment

      This manuscript provides a single-cell transcriptomic atlas for AML (222 samples comprising 748,679 cells) integrating data from multiple studies. They use this dataset to investigate t(8;21) AML, and they reconstruct the Gene Regulatory Network and enhancer Gene Regulatory Network, which allowed identification of interesting targets. This aggregation is useful and can help infer differences in genetic regulatory modules based on the age of disease onset, which may help explain age-related variations in prognosis and disease development. However, result interpretations and the motivation and critical analysis of the applied computational methods are incomplete, and the statistical analyses lack control experiments and should be improved to avoid potential selection bias in the later analyses.

    2. Reviewer #1 (Public review):

      Summary:

      In this manuscript, the authors performed an integration of 48 scRNA-seq public datasets and created a single-cell transcriptomic atlas for AML (222 samples comprising 748,679 cells). This is important since most AML scRNA-seq studies suffer from small sample size coupled with high heterogeneity. They used this atlas to further dissect AML with t(8;21) (AML-ETO/RUNX1-RUNX1T1), which is one of the most frequent AML subtypes in young people. In particular, they were able to predict Gene Regulatory Networks in this AML subtype using pySCENIC, which identified the paediatric regulon defined by a distinct group of hematopoietic transcription factors (TFs) and the adult regulon for t(8;21). They further validated this in bulk RNA-seq with AUCell algorithm and inferred prenatal signature to 5 key TFs (KDM5A, REST, BCLAF1, YY1, and RAD21), and the postnatal signature to 9 TFs (ENO1, TFDP1, MYBL2, KLF1, TAGLN2, KLF2, IRF7, SPI1, and YXB1). They also used SCENIC+ to identify enhancer-driven regulons (eRegulons), forming an eGRN, and found that prenatal origin shows a specific HSC eRegulon profile, while a postnatal origin shows a GMP profile. They also did an in silico perturbation and found AP-1 complex (JUN, ATF4, FOSL2), P300, and BCLAF1 as important TFs to induce differentiation. Overall, I found this study very important in creating a comprehensive resource for AML research.

      Strengths:

      (1) The generation of an AML atlas integrating multiple datasets with almost 750K cells will further support the community working on AML.

      (2) Characterisation of t(8;21) AML proposes new interesting leads.

      Weaknesses:

      Were these t(8;21) TFs/regulons identified from any of the single datasets? For example, if the authors apply pySCENIC to any dataset, would they find the same TFs, or is it the increase in the number of cells that allows identification of these?

    3. Reviewer #2 (Public review):

      Summary:

      The authors assemble 222 publicly available bone marrow single-cell RNA sequencing samples from healthy donors and primary AML, including pediatric, adolescent, and adult patients at diagnosis. Focusing on one specific subtype, t(8;21), which, despite affecting all age classes, is associated with better prognosis and drug response for younger patients, the authors investigate if this difference is reflected also in the transcriptomic signal. Specifically, they hypothesize that the pediatric and part of the young population acquires leukemic mutations in utero, which leads to a different leukemogenic transformation and ultimately to differently regulated leukemic stem cells with respect to the adult counterpart. The analysis in this work heavily relies on regulatory network inference and clustering (via SCENIC tools), which identifies regulatory modules believed to distinguish the pre-, respectively, post-natal leukemic transformation. Bulk RNA-seq and scATAC-seq datasets displaying the same signatures are subsequently used for extending the pool of putative signature-specific TFs and enhancer elements. Through gene set enrichment, ontology, and perturbation simulation, the authors aim to interpret the regulatory signatures and translate them into potential onset-specific therapeutic targets. The putative pre-natal signature is associated with increased chemosensitivity, RNA splicing, histone modification, stem-ness marker SMARCA2, and potentially maintained by EP300 and BCLAF1.

      Strengths:

      The main strength of this work is the compilation of a pediatric AML atlas using the efficient Cellxgene interface. Also, the idea of identifying markers for different disease onsets, interpreting them from a developmental angle, and connecting this to the different therapy and relapse observations, is interesting. The results obtained, the set of putative up-regulated TFs, are biologically coherent with the mechanisms and the conclusions drawn. I also appreciate that the analysis code was made available and is well documented.

      Weaknesses:

      There were fundamental flaws in how methods and samples were applied, a general lack of critical examination of both the results and the appropriateness of the methods for the data at hand, and in how results were presented. In particular:

      (1) Cell type annotation:

      a) The 2-phase cell type annotation process employed for the scRNA-seq sample collection raised concerns. Initially annotated cells are re-labeled after a second round with the same cell types from the initial label pool (Figure 1E). The automatic annotation tools were used without specifying the database and tissue atlases used as a reference, and no information was shown regarding the consensus across these tools.

      b) Expression of the CD34 marker is only reported as a selection method for HSPCs, which is not in line with common practice. The use of only is admitted as a surface marker, while robust annotation of HSPCs should be done on the basis of expression of gene sets.

      c) During several analyses, the cell types used were either not well defined or contradictory, such as in Figure 2D, where it is not clear if pySCENIC and AUC scores were computed on HSPCs alone or merged with CMPs. In other cases, different cell type populations are compared and used interchangeably: comparing the HSPC-derived regulons with bulk (probably not enriched for CD34+ cells) RNA samples could be an issue if there are no valid assumptions on the cell composition of the bulk sample.

      (2) Method selection:

      a) The authors should explain why they use pySCENIC and not any other approach. They should briefly explain how pySCENIC works and what they get out in the main text. In addition they should explain the AUCell algorithm and motivate its usage.

      b) The obtained GRN signatures were not critically challenged on an external dataset. Therefore, the evidence that supports these signatures to be reliable and significant to the investigated setting is weak.

      (3) There are some issues with the analysis & visualization of the data.

      (4) Discussion:

      a) What exactly is the 'regulon signature' that the authors infer? How can it be useful for insights into disease mechanisms?

      b) The authors write 'Together this indicates that EP300 inhibition may be particularly effective in t(8;21) AML, and that BCLAF1 may present a new therapeutic target for t(8;21) AML, particularly in children with inferred pre-natal origin of the driver translocation.' I am missing a critical discussion of what is needed to further test the two targets. Put differently: Would the authors take the risk of a clinical study given the evidence from their analysis?

    4. Author response:

      Reviewer #1 (Public review):

      Summary:

      In this manuscript, the authors performed an integration of 48 scRNA-seq public datasets and created a single-cell transcriptomic atlas for AML (222 samples comprising 748,679 cells). This is important since most AML scRNA-seq studies suffer from small sample size coupled with high heterogeneity. They used this atlas to further dissect AML with t(8;21) (AML-ETO/RUNX1-RUNX1T1), which is one of the most frequent AML subtypes in young people. In particular, they were able to predict Gene Regulatory Networks in this AML subtype using pySCENIC, which identified the paediatric regulon defined by a distinct group of hematopoietic transcription factors (TFs) and the adult regulon for t(8;21). They further validated this in bulk RNA-seq with AUCell algorithm and inferred prenatal signature to 5 key TFs (KDM5A, REST, BCLAF1, YY1, and RAD21), and the postnatal signature to 9 TFs (ENO1, TFDP1, MYBL2, KLF1, TAGLN2, KLF2, IRF7, SPI1, and YXB1). They also used SCENIC+ to identify enhancer-driven regulons (eRegulons), forming an eGRN, and found that prenatal origin shows a specific HSC eRegulon profile, while a postnatal origin shows a GMP profile. They also did an in silico perturbation and found AP-1 complex (JUN, ATF4, FOSL2), P300, and BCLAF1 as important TFs to induce differentiation. Overall, I found this study very important in creating a comprehensive resource for AML research.

      Strengths:

      (1) The generation of an AML atlas integrating multiple datasets with almost 750K cells will further support the community working on AML.

      (2) Characterisation of t(8;21) AML proposes new interesting leads.

      We thank the reviewer for a succinct summary of our work and highlighting its strengths.

      Weaknesses:

      Were these t(8;21) TFs/regulons identified from any of the single datasets? For example, if the authors apply pySCENIC to any dataset, would they find the same TFs, or is it the increase in the number of cells that allows identification of these?

      The purpose of our study was to gain biological insights by integrating multiple datasets, to overcome limitations from small sample size. We expect that the larger dataset would improve network inference, which is what we implemented in the manuscript, hence we have not looked at individual datasets. However, we will investigate this further in the revised manuscript by running pySCENIC on individual datasets and comparing to the results drawn from the whole atlas.

      Reviewer #2 (Public review):

      Summary:

      The authors assemble 222 publicly available bone marrow single-cell RNA sequencing samples from healthy donors and primary AML, including pediatric, adolescent, and adult patients at diagnosis. Focusing on one specific subtype, t(8;21), which, despite affecting all age classes, is associated with better prognosis and drug response for younger patients, the authors investigate if this difference is reflected also in the transcriptomic signal. Specifically, they hypothesize that the pediatric and part of the young population acquires leukemic mutations in utero, which leads to a different leukemogenic transformation and ultimately to differently regulated leukemic stem cells with respect to the adult counterpart. The analysis in this work heavily relies on regulatory network inference and clustering (via SCENIC tools), which identifies regulatory modules believed to distinguish the pre-, respectively, post-natal leukemic transformation. Bulk RNA-seq and scATAC-seq datasets displaying the same signatures are subsequently used for extending the pool of putative signature-specific TFs and enhancer elements. Through gene set enrichment, ontology, and perturbation simulation, the authors aim to interpret the regulatory signatures and translate them into potential onset-specific therapeutic targets. The putative pre-natal signature is associated with increased chemosensitivity, RNA splicing, histone modification, stem-ness marker SMARCA2, and potentially maintained by EP300 and BCLAF1.

      Strengths:

      The main strength of this work is the compilation of a pediatric AML atlas using the efficient Cellxgene interface. Also, the idea of identifying markers for different disease onsets, interpreting them from a developmental angle, and connecting this to the different therapy and relapse observations, is interesting. The results obtained, the set of putative up-regulated TFs, are biologically coherent with the mechanisms and the conclusions drawn. I also appreciate that the analysis code was made available and is well documented.

      We thank the reviewer for reviewing our work, and highlighting its key features, including creation of AML atlas, downstream analysis and interpretation for t(8;21) subtype.

      We also appreciate useful critique of our paper provided below.

      Weaknesses:

      There were fundamental flaws in how methods and samples were applied, a general lack of critical examination of both the results and the appropriateness of the methods for the data at hand, and in how results were presented. In particular:

      (1) Cell type annotation:

      a) The 2-phase cell type annotation process employed for the scRNA-seq sample collection raised concerns. Initially annotated cells are re-labeled after a second round with the same cell types from the initial label pool (Figure 1E). The automatic annotation tools were used without specifying the database and tissue atlases used as a reference, and no information was shown regarding the consensus across these tools.

      We believe that most of the reviewer’s criticisms stem from a misunderstanding, and we apologize for not explaining certain aspects of our work more clearly.

      The two types of cell type annotation applied were different and served distinct purposes:

      • One was using general bone marrow/blood reference datasets to annotate blood subtype lineage clusters.

      • The other was using a CD34 purified AML specific reference dataset which included leukaemia-associated annotations, to identify HSPC subpopulations. We also implemented this on a single-cell level to allow more robust identification of these rare populations in a large dataset.

      This is probably not well explained in the methods and figure presentation. We will clearly indicate in the revised manuscript that different HSPC annotations represent separate analysis and will update the figures to highlight this. We will provide a comprehensive review of the annotation strategies implemented, including the automated tool outputs, which may be useful for the single-cell community.

      b) Expression of the CD34 marker is only reported as a selection method for HSPCs, which is not in line with common practice. The use of only is admitted as a surface marker, while robust annotation of HSPCs should be done on the basis of expression of gene sets.

      We used CD34 expression in conjunction with other cell type annotations and marker sets to identify LSCs, although results are same when we use HSPC annotated cells without condition on CD34 expression.  In the revised manuscript, we will simplify this analysis to use HSPC clusters as suggested by the reviewer.

      c) During several analyses, the cell types used were either not well defined or contradictory, such as in Figure 2D, where it is not clear if pySCENIC and AUC scores were computed on HSPCs alone or merged with CMPs. In other cases, different cell type populations are compared and used interchangeably: comparing the HSPC-derived regulons with bulk (probably not enriched for CD34+ cells) RNA samples could be an issue if there are no valid assumptions on the cell composition of the bulk sample.

      As mentioned in the Methods, we only excluded lymphoid cell types from the pySCENIC analysis to overcome the bias that some samples were enriched using CD34 selection when preparing them for scRNA-seq. We will make this clearer in the text and figures of the revised manuscript. It is difficult to overcome this bias when using bulk RNA samples, which may explain why some of our samples do not fit into our defined signature groups. However, as we do not have access to primary samples ourselves, we cannot provide a better matched experimental cohort for validation.

      (2) Method selection:

      a) The authors should explain why they use pySCENIC and not any other approach. They should briefly explain how pySCENIC works and what they get out in the main text. In addition they should explain the AUCell algorithm and motivate its usage.

      pySCENIC is state-of-the-art method for network inference from scRNA data and is widely used within the single-cell community (over 5000 citations for both versions of the SCENIC pipeline). The pipeline has been benchmarked as one of the top performers for GRN analysis (Nguyen et al, 2021. Briefings in Bioinformatics). AUCELL is a module within the pySCENIC pipeline to summarise the activity of a set of genes (a regulon) into a single number which helps compare and visualise different regulons. We agree with reviewer that this could have been more clearly explained within the manuscript. We will update text in the revised manuscript to add more explanation.

      b) The obtained GRN signatures were not critically challenged on an external dataset. Therefore, the evidence that supports these signatures to be reliable and significant to the investigated setting is weak.

      These signatures were inferred from the best suitable AML single-cell RNA datasets available to date, and we used two independent datasets to validate our findings (the TARGET AML bulk RNA sequencing cohort, and the Lambo et al. scRNA-seq dataset). To our knowledge, there are no other better suited datasets for validation. Experimental validations on patient samples are beyond the scope of this study.

      (3) There are some issues with the analysis & visualization of the data.

      We will provide new statistical tests to improve robustness of the analysis as well as presentation and visualization of the data in the revised manuscript.

      (4) Discussion:

      a) What exactly is the 'regulon signature' that the authors infer? How can it be useful for insights into disease mechanisms?

      The ’regulon signature’ here refers to a gene regulatory program (multiple gene modules, each defined by a transcription factor and its targets) which are specific to different age groups. Further investigation into this can be useful for understanding why patients of different ages confer a different clinical course. We will add more text on the utility of our discovered 'regulon signature' in the discussion section of revised manuscript.

      b) The authors write 'Together this indicates that EP300 inhibition may be particularly effective in t(8;21) AML, and that BCLAF1 may present a new therapeutic target for t(8;21) AML, particularly in children with inferred pre-natal origin of the driver translocation.' I am missing a critical discussion of what is needed to further test the two targets. Put differently: Would the authors take the risk of a clinical study given the evidence from their analysis?

      Of course, many extensive studies would be required before these findings are clinically translatable. We can include some perspectives on what further work is required in terms of further experimental validation and potential subsequent clinical study.

    1. eLife Assessment

      This important work substantially advances our understanding of the molecular mechanisms underlying the timing of the initiation of metamorphosis of the Ciona ascidian tadpole larva. Through the combination of gene knockdown experiments and fluorescent molecular reporters the authors provide compelling evidence about a crosstalk between different G protein mediated signalling pathways and are able to place different signalling molecules within a signalling network. The work will be of interest to molecular, developmental and marine biologists and to scientists working on animal metamorphosis.

    2. Reviewer #1 (Public review):

      Summary:

      In this manuscript, the authors use gene functional analysis, pharmacology and live imaging to develop a proposed model of diverse G protein family signalling that takes place in the papillae during the ascidian Ciona larval adhesion to regulate the timing of initiation of the morphological changes of metamorphosis. Their experiments provide solid evidence that antagonistic G protein signalling regulates cAMP levels in the papillae, which provides a threshold for triggering metamorphosis that is reflective of a larva keeping a strong and sustained level of contact with a substrate for a minimum period of approximately half an hour. The authors discuss their reasoning and address different specific aspects of their proposed timing mechanism to provide a logical flow to the manuscript. The results are nicely linked to the ecology of Ciona larval settlement and will be of interest to developmental biologists, neurobiologists, molecular biologists, marine biologists as well as provide information relevant to antifouling and aquaculture sectors.

      First, the authors knock down the G proteins Gaq and Gas to show that these genes are important for Ciona larval metamorphosis. They then provide evidence that the Gaq protein acts through a Ca2+ pathway mediated by phospholipase C and inositol triphosphate by showing that inositol phosphate and phospholipase C gene knockdown also inhibits metamorphosis, while overexpression of Gaq or phospholipase C allows larvae to undergo metamorphosis even in the absence of their mechanosensory cue, which is deprived by removing the posterior half of the tail and culturing the larvae on agar-coated dishes. The authors used calcium imaging with a genetically encoded fluorescent calcium sensor to show that Gq knockdown larvae lack a Ca2+ spike in their papillae after mechanostimulation, confirming that Gaq acts through a Ca2+ pathway. Similarly the authors show that overexpression of Gas also enables larvae to metamorphose in the absence of mechanostimulation, suggesting a role for both Gaq and Gas in this process.

      To confirm that Gas acts through cAMP signalling, the authors use pharmacological treatment or overexpression of a photoactivating adenylate cyclase to increase cAMP, and show that this also enables larvae to metamorphose in the absence of mechanostimulation, but only when their adhesive papillae are still present. Transcriptome data indicate that both Gs and Gq pathway genes are expressed in the adhesive papillae of the Ciona larva. The authors use a fluorescent cAMP indicator, Pink Flamindo, to show that cAMP increases in the papillae upon adhesion to a substrate, and this increase is lost in Gs and Gq knockdown larvae. Complementary to this, larvae that fail to undergo metamorphosis lack a cAMP increase in papillae.

      The authors then provide evidence that GABA signalling within the papillae is acting downstream of the G proteins to induce metamorphosis. Transcriptome data shows that the genes for the GABA-producing enzyme (GAD), and for GABAb receptors, are both expressed in papillae. Pharmacological experiments show that GABA induces metamorphosis in the absence of mechanosensory cues, but only in larvae that retain their papillae. To show that GABA signalling within the papillae, rather than from the brain of the larva is important, the authors also demonstrate that anterior segments of larvae lacking the brain, can also be stimulated to metamorphose by GABA, and show changes in gene expression caused by GABA.

      The authors then use a combination of pharmacology and knockdown experiments in the presence or absence of mechanosensory cues to show that Gq/Ca2+ signalling acts upstream of Gs/cAMP signalling. As elevation of cAMP by pharmacology or photoactivating adenylate cyclase rescued GABA pathway mutant larvae, the Gq and Gs pathways were concluded to be downstream of GABA signaling. However, as GABA treatment could still induce Gaq- and Gas-knockdown larvae to metamorphose, suggesting an alternative pathway to metamorphosis, which the authors deduce to be through a third G protein, Gai. They identify an unusual Gai protein that based on transcriptome data is strongly expressed in the papillae. Gai knockdown larvae fail to metamorphose but are rescued by GABA treatment, which can be explained by a potential additional Gai protein being still present (this is confirmed experimentally with MO knockdown experiments). The authors then use overexpression and knockdown experiments to show that the Gai protein acts through Gβγi complex to activate phospholipase C. Their experiments also indicate potential for a complementary or compensatory role for Gai and Gaq signalling through Gβγi. By inhibiting the potassium channel GIRK through knockdown, and the MAPK pathway gene MEK1/2 by pharmacology, the authors also establish a role for these in their proposed model of signalling, allowing GABA and cAMP to compensate or interact with each other.

      The strength of this paper is the meticulous and extensive experiments, which are carefully designed to be able to precisely target specific genes in the putative signalling pathway to build step by step a complex model that can demonstrate how metamorphosis of the ascidian larva is timed so as to only occur when strongly attached to a suitable substrate. The unique possibility of inhibiting mechanosensory-induced metamorphosis by removing some of the tail and smoothing the attachment substrate allows the authors to investigate potential effects on both activation and inhibition of metamorphosis, and to confirm that specific signalling pathways are clearly downstream of the initial mechanosensory stimulation. The study is also clear about which aspects of the model still remain unknown, such as which ligands and receptors may be responsible for the binding and activation of Gaq and Gas. Experiments testing metamorphosis of just the anterior region of the larvae nicely demonstrate the need for signalling in the region of the papillae, as do experiments where the papillae are removed, which then block metamorphosis in treatments that would otherwise stimulate it. The final model makes a clear summary of how the extensive experiments all fit together into a cohesive potential signalling network, which can be built upon in the future to potentially integrate the role of sensory cues additional to mechanosensation.

    3. Reviewer #2 (Public review):

      Summary:

      This work aims to characterize the neural signaling cascade underlying the initiation of metamorphosis in Ciona larvae. Combining gene-specific functional analyses, pharmacological experiments, and live imaging approaches, the authors identify the molecular players downstream of GABA to initiate Ciona metamorphosis. The results of this study will serve as a useful framework for future research on animal metamorphosis.

      Strengths:

      Taking advantage of the Ciona model system, the authors meticulously conducted genetic manipulation and pharmacological experiments to test the epistatic relationships among the signaling players controlling the initiation of Ciona metamorphosis. The experiments were well designed, and the results were convincing. Based on the experimental data, the final working model proposed by the authors will server as an important foundation for further investigation on metamorphosis controls in Ciona and other marine invertebrate larvae.

      Weaknesses:

      In this revised manuscript, the authors have greatly improved the descriptions of their experimental results, and have clarified my previous concerns. I do not have further comments on "weaknesses".

    4. Author response:

      The following is the authors’ response to the original reviews

      Thank you for your valuable comments, which helped us improve our manuscript. We will make the following modifications in the revised manuscript:

      (1) In the first paragraph of the Result section, we will provide a summary of trimeric G proteins in Ciona and explain how we focused on Gαs and Gαq in the initial phase of this study.

      We added a summary of trimeric G proteins in Ciona in the initial part of the Results section (page 6, line 23 to page 8, line 5). In this summary, we added the following sentence explaining the reason we focused on Gas and Gaq in the initial phase of this study: "Among them, we prioritized examining the Gα proteins having an excitatory function (Gαq and Gαs) rather than inhibitory roles since previous studies suggested that excitatory events like Ca<sup>2+</sup> transient and neuropeptide secretion occur when Ciona metamorphose."

      (2) As the reviewer 1 suggests, the polymodal roles of papilla neurons are interesting. Although we could not address this through functional analyses in this study, we will add a discussion regarding this aspect. The sentences will be something like the following:

      “The recent study (Hoyer et al., 2024) provided several lines of evidence suggesting that PSNs can serve as the sensors of several chemicals in addition to the mechanical stimuli. This finding and our model could be mutually related because these chemicals could modify Ca<sup>2+</sup> and cAMP production. The use of G protein signaling allows Ciona to reflect various environmental stimuli to initiate metamorphosis in the appropriate situation, both mechanically and chemically.”

      We added a discussion related to the recent publication by Hoyer and colleagues on page 23, lines 13-18: " A recent study[19] provided several lines of evidence suggesting that PNs can serve as the sensors of several chemicals in addition to mechanical stimuli. This finding and our model could be mutually related because these chemicals could modify Ca<sup>2+</sup> and cAMP production. G protein signaling allows Ciona to reflect various environmental stimuli to initiate metamorphosis either mechanically or chemically according to the situation."

      (3) As both reviewers suggested, imaging cAMP on the backgrounds of some G protein knockdowns is essential, and we will conduct the experiments.

      We added the data on cAMP imaging in Gas, Gaq, and dvGai_Chr2 knockdown larvae in Supplementary Figure S4C-D and Figure 6E.

      (4) We carefully modify the text throughout the manuscript so that the descriptions suitably reflect the results.

      We modified the descriptions of experimental results so that the text reflects the results more precisely.

      Reviewer #1:

      Pg1 - need to add an additional '6' to the author list to clarify which two or more authors contributed equally.

      We added a 6 as suggested. Thank you for pointing this out.

      Pg3 - note that larval adhesive organ applies to not all benthic adults, but to benthic sessile adults this makes it sound like the adhesive organ can trigger metamorphosis but has that been shown? In Ciona or others? Need to specify the role of cells secreting adhesive, vs sensory cells that trigger metamorphosis?

      We divided the corresponding sentence into two to clearly state that adhesion and triggering metamorphosis are related but could be different events. Moreover, we modified the sentence to state that physical contact is one example of a cue triggering metamorphosis. We then added another example of a factor triggering metamorphosis—i.e., chemicals from the organisms surrounding the adherence site (page 3, lines 16-20 of the revised version):

      "Many marine invertebrates exhibit a benthic lifestyle at the adult stage[4]. Their planktonic larvae have an adhesive organ that secretes adhesives and adheres to a substratum. The cues associated with the adhesion, such as the physical contact with the substratum and a chemical from organisms surrounding the adherence site, can trigger their metamorphosis."

      Pg 4 - although mechanosensation is the focus here, could there also be chemoreception/chemoreceptors involved in Ciona metamorphosis? For example, Hoyer et al. 2024 (Current Biology 34(6):1168-1182) concluded that some palp sensory neurons were multimodal and could be both chemo- and mechano-sensory.

      We added statements about this recent finding in the Introduction and Discussion sections. In the Introduction (page 4, lines 16-18), however, we also stated that a mechanical stimulus can trigger metamorphosis in the lab without the need to supply these chemicals. This is to emphasize that the mechanical stimulus is the focus of this study. In the Discussion, we added a statement that G-protein signaling could also be used to receive the chemical stimuli (page 23, lines 13-18).

      Pg 6 - Before starting functional characterizations, it would be useful to give an overview (table?) of the G proteins found in papillae, and what receptor they are suspected of binding to, or if this is completely unknown, and which downstream pathways they likely activate. That is, to show some results about which G proteins are found in Ciona, and which are found in papillae. In this way, it will make more sense for readers when the Gai is suddenly introduced later, following the sections of Gaq and Gas.

      Thank you for your idea to improve the readability of this manuscript. In the initial part of the Results section (page 6, line 22 to page 8, line 5), we added descriptions of the repertoire of trimeric G-proteins in Ciona, including phylogenetic analyses, and expression in the papillae based on RNA-seq data, followed by the reason why we initially focused on Gaq and Gas. The data are displayed in Supplementary Figure S1. The phylogenetic analyses were modified from those shown in Supplementary Figure S5 of the previous version. We also added the general downstream activities of Gas, Gai and Gaq in the Introduction section (page 6, lines 10-12). Considering the contents, the general function of Ga12/13 was stated in the Results section (page 8, lines 2-3).

      We did not add the information about their partner receptors in this early section. This is because there are many candidates, and we could not pick some of them. Instead, we described our current suppositions about their possible partners in the Discussion (page 23, line 22 to page 24, line 19). However, we suspect that there are more candidates, and we wish to promote unbiased research in the future.

      Pg 9 - would be good to know the timing of this PF fluorescence increase and the timing of stimulation in the text here, relevant to the 30-min gap before metamorphosis initiation

      We added the start times for the cAMP reduction and re-upregulation in the following sentence (page 11, lines 17-18): "The cAMP reduction and increase respectively started at 35 seconds and 4 min 40 seconds after stimulation on average."

      Pg 28 - Phylogenetic analysis: Given that the results may be of interest to metamorphosis in other marine invertebrates as discussed in the last paragraph of the paper, it would be useful to include G proteins from these other animal phyla where available in the phylogenetic tree. Similarly, in Figure S5A it would be useful to highlight further all the different Ciona G proteins, and the different protein families, through the use of additional colour/labelling (regardless of whether this remains Fig S5A, or becomes part of the main figures)

      We drew a phylogenetic tree of G-proteins including those in some sessile and benthic animals (barnacle, sea anemone, hydra, sponge, sea urchin and shell). However, we decided not to add the tree in the revised version because, unfortunately, the bootstrap values of many branches were not high enough to have confidence in the results. We hope you understand our decision. Ciona divergent G-proteins are likely to be specific to Ciona.

      According to your comment, we highlighted all Ciona G alpha proteins in red in Figure S5A, which is now Figure S1A in the revised version.

      Figure 3E and Figure S3 - is the data shown as an average of all larvae measured (n=5 and n=4) or is it data from one representative larva out of the 4-5 measured? This needs clarification.

      The original graphs in Figure 3E and Figure S3 are typical examples. We added the graphs summarizing data of all larvae in each experimental condition in Supplementary Figure S4 (corresponding to Supplementary Figure S3 of the original version). Figure 3E remains as a typical example of the result of a single larva to explain our data analysis in detail.

      Experimental suggestion - As mentioned above, one missing detail seems to be the need for evidence that cAMP is elevated in the papillae directly as a result of Gs activation- this could be shown with measurement of cAMP via PF in Gs knockdown larvae that are mechanically stimulated compared to wildtype stimulated and non-stimulated?

      Thank you for your suggestion. The experiments are indeed important. We added the data of Pink Flamindo imaging in the Gas, Gaq and dvGai_Chr2 knockdown conditions. The results of Gas and Gaq knockdowns are described in page 11, line 24 to page 12, line 5, and are displayed in Supplementary Figure S4C-D. The result of dvGai_Chr2 knockdown is given on page 16, lines 20-22 and shown in Figure 6E.

      In order to insert the data of cAMP imaging of dvGai_Chr2 knockdown larvae, we transferred some panels of Figure 6 to Supplementary Figure S6. In addition, the knockdown data of dvGαi_Chr4 and double knockdowns of Gai genes are also included in Supplementary Figure S6.

      Reviewer #2:

      Page 6, line 3-4 in the first paragraph of the "Results"; the authors state "Neither morphant showed any signature of metamorphosis even though both were allowed to adhere to the base of culture dishes...". However, judging from Fig. 1E, "the percentage of metamorphosis initiation" (indicated by the initiation of tail regression) in Gαq morphans is not close to 0 (average about 40%), thus I am not convinced this observation can be described as "Neither morphant showed any signature of metamorphosis..." in this sentence.

      Thank you for your suggestion. In writing the original text, we oversimplified some of the descriptions when trying to improve the readability. We agree this resulted in imprecision in places. We have revised all these passages in our revision. In this particular case, we softened the overly emphatic statement to better reflect the results, changing “... any signature of metamorphosis...” to “... reduced rate of metamorphosis initiation...” In addition, we stated that the effect of G_α_q MO was weaker than that of G_α_s MO on page 8, lines 10-12. The weaker effect of Gaq MO was due to the redundant role of the Gi pathway, which is shown on page 17, lines 10-17, and in Figure 6G-H.

      Similarly, in the next paragraph describing the knockdown of PLCβ1/2/3, PLCβ4, and IP3R genes, the authors appear to neglect there is a weaker effect of the PLCβ4 MO, and simply described the results as "The knockdown larvae of these three genes failed to start metamorphosis". Based on Fig. 1H, about 30% of the PLCβ4 MO-injected animals still initiated tail regeneration. This difference may have some biological meanings and thus should be described more precisely.

      We added the following sentence on page 8, lines 18-19 of the revised version: “The effect of PLCβ4 MO was weaker than those of the other MOs, suggesting that this PLC plays an auxiliary role.”

      Page 7, second paragraph, on the description of GCaMP8 fluorescence and also at the end of Fig. 1O legend, the citation to "Figure S1" is confusing; Fig. S1 is the phylogenetic tree of PLCβ proteins. Is there additional data regarding this Gαq MO plus GCaMP8 mRNA injection experiment?

      Figure S1 of the original version corresponds to Figure S2 of the revised version. To avoid confusion, we deleted this citation from the legend of Figure 1O. By this modification, the sentence stating the repertoire of PLCb and IP3R in Ciona (page 8, lines 15-16) is the only sentence citing Figure S2 in the revised version.

      Page 8, first sentence; The purpose of theophylline treatment is not to prevent larvae from adhesion, thus I would suggest modifying this sentence to: "We treated wild-type larvae with theophylline after tail amputation, and we observed that most theophylline-treated larvae completed tail regression without adhesion (Figure 2D-F)".

      We modified the sentence according to your comment. Thank you for your suggestion.

      Page 9, second paragraph; judging from the data presented in Fig. 3C, I think this description: "when papillae were removed from larvae, theophylline failed to induce metamorphosis" is not accurate, because about ~30% of the Papilla cut +Theophylline-treated larvae still initiated their tail regression. This needs to be explained clearly.

      We modified the sentence (page 11, lines 2-3) as follows: “...the average rate of metamorphosis induction by theophylline was reduced from 100% to 30%...”

      Similarly in the next few sentences regarding the results presented in Fig, 3D, the effects of overexpressing those genes are not uniform. While amputation of papillae in larvae overexpressing caPLCβ1/2/3 could inhibit metamorphosis almost completely, papilla cut seems to have a weaker effect on caGαq, caGαs, and bPAC-overexpressing larvae.

      We added a description explaining that caPLCβ1/2/3 was the most sensitive to papilla amputation, and the possibility that PLCβ1/2/3 works specifically in the papillae (page 11, lines 9-11): “Among these experiments, caPLCβ1/2/3 overexpression was the most sensitive to papilla amputation, suggesting that PLCβ1/2/3 acts specifically in the papillae during metamorphosis.”

      Page 9, the paragraph on using the fluorescent cAMP indicator; there is a discrepancy between the described developmental time when the authors conducted this experiment and the metamorphosis competent timing (after 24hpf) described on page 7. On page 26, the authors describe "The Pink Flamindo mRNA-injected larvae were immobilized on Poly L lysine-coated glass bottom dishes at 20-21 hpf...". Did the authors start stimulating the larvae to observe the fluorescent signal soon after immobilization, or wait several hours until the larvae passed 24hpf and then conduct the experiment?

      The latter is the case. The immobilized larvae were kept until they acquired the competence for metamorphosis and then stimulation/recording was carried out. This point is described in the Materials and Methods section of the revised version (page 29, lines 16-18):

      "The Pink Flamindo mRNA-injected larvae were immobilized on Poly L lysine-coated glass-bottom dishes at 20-21 hpf, and stimulated their adhesive papillae around 25 hpf."

      Page 10, the description "...Gαq morphants initiated metamorphosis when caGαs was overexpressed in the nervous system (Figure 4F)". It should be noted that the result is only a partial rescue. To be precise, this description needs to be modified.

      We changed the sentence to reflect the results more precisely (page 14, lines 2-3): “Moreover, caGαs overexpression in the nervous system significantly, although not perfectly, ameliorated the effect of Gαq MO (Figure 4F).”

      Page 12-13, This description and the figure 5E presented is a bit confusing to me. The figure legend for 5E: "GABA is necessary for Ca2+ transient in the adhesive papillae (arrow)" But the arrow in this image points to a place with no fluorescent signal, and on the upper corner it labeled as "29% (n=17)". Does that mean the proportion of "no Ca2+ increase after stimulation" was 29% among the 17 samples examined? Or actually, is the other way around that 81% of the examined larvae did not show Ca2+ signal increase after stimulation?

      The latter is the case. We added a caption explaining this clearly in the Figure legend: “The percentage and number exhibit the rate of animals showing Ca<sup>2+</sup> transient in the papillae.”

      Page 13, second paragraph; I do not agree with the overly simplified description that "GABA significantly ameliorated the metamorphosis-failed phenocopies of Gαq, PLCβ, and Gαs morphants". As shown in Fig. 5F-H, adding GABA exerts different levels of partial rescue effect on each morphant, and thus should be described clearly.

      When the outliers are neglected, the effect of GABA is most evident in Gαs knockdowns. This suggests that the target(s) of GABA signaling is more likely to be Gq pathway components. We added the following sentence to the revised version (page 15, lines 14-16):

      “Among the three morphants, GABA exhibited the most effective rescues in Gαs knockdowns than Gαq and PLCβ.”

      In addition, we think this sentence establishes a more logical connection with the sentence that follows it: “These results could be explained by assuming enhancement of the Gq pathway by GABA through PLCβ and another GABA-mediated metamorphic pathway bypassing Gq components.” Thank you for your suggestion.

      The section "Contribution of Gi to metamorphosis" confirmed the possibility that GABA signaling targets Gq pathway components.

      Page 13, the first paragraph on "Contribution of Gi to metamorphosis"; the description that "The knockdown of this gene (Gαi) exhibited a significantly reduced rate of metamorphosis;..." is misleading. I would suggest modifying the entire sentence as "The knockdown of this gene (Gαi) exhibited a moderate (although statistically significant) reduction of metamorphosis rate, suggesting the presence of another Gαi regulating metamorphosis".

      Thank you for your suggestion. We modified the sentence (page 16, lines 2-4 in the revised version) as recommended. We believe the description is much improved.

      Page 20, the last sentence about Ciona papilla neurons expressing transcription factor Islet; the authors seem to attempt to make some comparison with the vertebrate pancreatic beta cells in this paragraph, but the comparison and the argument are not fully developed in this current format.

      To deepen this discussion, we added the following sentence (page 23, lines 10-12): “The atypical secretion of GABA might depend on the transcription factor like Islet shared between Ciona papilla neurons and vertebrate beta cells.”

      However, we would like to limit the depth of our discussion on this point, as we hope to expand on it further in future studies.

      Other suggestions:

      Page 3, second paragraph: as they become unable to "move" after metamorphosis -> "relocate"

      We corrected the word as suggested.

      Page 4, second paragraph: In the first sentence, the author states the current understanding of chordate phylogeny and cites Delsuc et al. 2006 Nature paper at the end of this sentence. However, in this paper cephalochordates were erroneously grouped with echinoderms, and thus chordates did not form a monophyletic clade. A later paper by Bourlat et al, (Nature 444:85-88, 2006) corrected this problem, and subsequently Dulsuc et al. also published another paper (genesis, 46:592-604, 2008) with broader sampling to overcome this problem. These later publications need to be included for the sake of correctness.

      We added this reference.

      Page 14, regarding the redundant function of the typical Gαi protein in the papillae; the authors may try double KD of Gαi and dvGαi_Chr2 in their experimental system to test this idea.

      We carried out double knockdown of typical Gai and dvGαi_Chr2. However, we could not address their redundant role sufficiently because most of the double knockdown larvae exhibited severe shape malformation.

      dvGαi_Chr4 is also expressed in the papillae. We carried out knockdown of this gene, to find that the knockdown resulted in very minor but statistically significant reduction of the metamorphosis rate, suggesting that this Gai also plays a supportive role in metamorphosis. We also carried out double knockdown of dvGαi_Chr2 and dvGαi_Chr4. The double KD larvae exhibited responsiveness to GABA, probably because of the presence of typical Gai.

      These results are described on page 16, lines 2-18, and the data are shown in Supplementary Figure S6A-D of the revised version.

      Responses to the Reviewing editor's comments:

      "Larvae of the ascidian Ciona initiate metamorphosis tens of minutes after adhesion to a substratum via its adhesive organ." - Larvae is plural so change to 'via their adhesive organ'

      The sentence was corrected as suggested.

      "Metamorphosis is a widespread feature of animal development that allows them" - revise the sentence, e.g. "Metamorphosis is a widespread feature of development that allows animals"

      The sentence was corrected as suggested.

      "GABA synthase (GAD)" GAD is not called GABA synthase but glutamate decarboxylase - clarify, e.g. encoding the enzyme synthesizing GABA called glutamate decarboxylase (GAD)

      This part was corrected exactly as suggested. Thank you.

      "IP3 is received by its receptor on the endoplasmic reticulum (ER) and releases calcium ion (Ca2+ )" revise to "IP3 is received by its receptor on the endoplasmic reticulum (ER) that releases calcium ion (Ca2+ )"

      The sentence was corrected as suggested.

      "Moreover, GPCR is implicated as the mediator of settlement" - GPCRs are implicated

      This sentence was modified as suggested.

    1. eLife Assessment

      The study evaluates the feasibility, safety, and tolerability of neoadjuvant radiotherapy followed by a CDK4/6 inhibitor (dalpiciclib) and hormonal therapy in treatment-naive patients with unilateral early-stage HR+/HER2- breast cancer. The findings are convincing, with a strong scientific rationale supported by integrated correlative studies. The trial is considered to be important as the outcomes could inform the design of larger, future studies. The limitations of the study have been acknowledged and outlined in this manuscript, which include only a small cohort of patients (n=12), which was not adequately powered to definitively assess the efficacy or safety of this combinatorial treatment approach.

    2. Reviewer #1 (Public review):

      Summary:

      This manuscript details the results of a small pilot study of neoadjuvant radiotherapy followed by combination treatment with hormone therapy and dalpiciclib for early stage HR+/HER2-negative breast cancer.

      Strengths:

      The strengths of the manuscript include the scientific rationale behind the approach, and the inclusion of some simple translational studies.

      Weaknesses:

      The main weakness of the manuscript is that a study this small is not powered to fully characterize efficacy or safety of a treatment approach, and can, at best, can demonstrate feasibility. These data need validation in a larger cohort before they can have any implications for clinical practice, and the treatment approach outlined should not yet be considered a true alternative to standard evidence-based approaches.

      I would urge the readers exercise caution when comparing results of this 12-patient pilot study to historical studies, many of which were much larger, and had different treatment protocols and baseline patient characteristics. Cross-trial comparisons like this are prone to mislead, even when comparing well powered studies. With such a small sample size, the risk of statistical error is very high, and comparisons like this have little meaning.

    3. Author response:

      The following is the authors’ response to the original reviews

      Reviewer #1(Public review):

      Summary:

      This manuscript details the results of a small pilot study of neoadjuvant radiotherapy followed by combination treatment with hormone therapy and dalpiciclib for early-stage HR+/HER2-negative breast cancer.

      Strengths:

      The strengths of the manuscript include the scientific rationale behind the approach and the inclusion of some simple translational studies.

      Weaknesses:

      The main weakness of the manuscript is that overly strong conclusions are made by the authors based on a very small study of twelve patients. A study this small is not powered to fully characterize the efficacy or safety of a treatment approach, and can, at best, demonstrate feasibility. These data need validation in a larger cohort before they can have any implications for clinical practice, and the treatment approach outlined should not yet be considered a true alternative to standard evidence-based approaches.

      I would urge the authors and readers to exercise caution when comparing results of this 12-patient pilot study to historical studies, many of which were much larger, and had different treatment protocols and baseline patient characteristics. Cross-trial comparisons like this are prone to mislead, even when comparing well powered studies. With such a small sample size, the risk of statistical error is very high, and comparisons like this have little meaning.

      We greatly appreciate your evaluation of our study and fully agree with the limitations you have pointed out. We have clearly stated the limitations of the small sample size and emphasized the need for a larger population to validate our preliminary findings in the discussion section (Lines 311-316).

      We acknowledge that this small sample size is not powered to characterize this regimen as a promising alternative regimen in the treatment of patients with HR-positive, HER2-negative breast cancer. Therefore, we have revised the description of this regimen to serve as a feasible option for neoadjuvant therapy in HR-positive, HER2-negative breast cancers both in the discussion (Lines 317-320) and the abstract (Lines 71-72).

      We agree with you that cross-trial comparisons should be approached with caution due to differences in study designs and patient populations. In our discussion section, we acknowledge that small sample size limited the comparison of our data with historical data in the literature due to the potential bias (Lines 312-313). We clearly state that such comparisons hold limited significance (Lines 313-314) and suggest a larger population to validate our preliminary findings.

      • Why was dalpiciclib chosen, as opposed to another CDK4/6 inhibitor?

      Thank you for your comments. The rationale for selecting dalpiciclib over other CDK4/6 inhibitors in our study is primarily based on the following considerations:

      (1) Clinical Efficacy: In several clinical trials, including DAWNA-1 and DAWNA-2, the combination of dalpiciclib with endocrine therapies such as fulvestrant, letrozole, or anastrozole has been shown to significantly extend the progression-free survival (PFS) in patients with hormone receptor-positive, HER2-negative advanced breast cancer [1-2].

      (2) Tolerability and Management of Adverse Reactions: The primary adverse reactions associated with dalpiciclib are neutropenia, leukopenia, and anemia. Despite these potential side effects, the majority of patients are able to tolerate them, and with proper monitoring and management, these reactions can be effectively mitigated [1-2].

      (3) Comparable pharmacodynamic with other CDK4/6 inhibitors: The combination of CDK4/6 inhibitors, including palbociclib, ribociclib, and abemaciclib, with aromatase inhibitors has demonstrated an enhanced ability to suppress tumor proliferation and increase the rate of clinical response in neoadjuvant therapy for HR-positive, HER2-negative breast cancer [3-5]. Furthermore, preclinical studies have shown that dalpiciclib has comparable in vivo and in vitro pharmacodynamic activity to palbociclib, suggesting its potential effectiveness in similar treatment regimens [6].

      (4) Accessibility and Regulatory Approval: Dalpiciclib has gained marketing approval in China on December 31, 2021, which facilitates the accessibility of this medication, making it a more convenient option when considering treatment plans.

      References:

      (1) Zhang P, Zhang Q, Tong Z, et al. Dalpiciclib plus letrozole or anastrozole versus placebo plus letrozole or anastrozole as first-line treatment in patients with hormone receptor-positive, HER2-negative advanced breast cancer (DAWNA-2): a multicentre, randomised, double-blind, placebo-controlled, phase 3 trial[J]. The Lancet Oncology, 2023, 24(6): 646-657.

      (2) Xu B, Zhang Q, Zhang P, et al. Dalpiciclib or placebo plus fulvestrant in hormone receptor-positive and HER2-negative advanced breast cancer: a randomized, phase 3 trial[J]. Nature medicine, 2021, 27(11): 1904-1909.

      (3) Hurvitz S A, Martin M, Press M F, et al. Potent cell-cycle inhibition and upregulation of immune response with abemaciclib and anastrozole in neoMONARCH, phase II neoadjuvant study in HR+/HER2− breast cancer[J]. Clinical Cancer Research, 2020, 26(3): 566-580.

      (4) Prat A, Saura C, Pascual T, et al. Ribociclib plus letrozole versus chemotherapy for postmenopausal women with hormone receptor-positive, HER2-negative, luminal B breast cancer (CORALLEEN): an open-label, multicentre, randomised, phase 2 trial[J]. The lancet oncology, 2020, 21(1): 33-43.

      (5) Ma C X, Gao F, Luo J, et al. NeoPalAna: neoadjuvant palbociclib, a cyclin-dependent kinase 4/6 inhibitor, and anastrozole for clinical stage 2 or 3 estrogen receptor–positive breast cancer[J]. Clinical Cancer Research, 2017, 23(15): 4055-4065.

      (6) Long F, He Y, Fu H, et al. Preclinical characterization of SHR6390, a novel CDK 4/6 inhibitor, in vitro and in human tumor xenograft models[J]. Cancer science, 2019, 110(4): 1420-1430.

      • The eligibility criteria are not consistent throughout the manuscript, sometimes saying early breast cancer, other times saying stage II/III by MRI criteria.

      Thank you for pointing out the inconsistencies in the description of the eligibility criteria in our manuscript. We deeply apologize for any confusion caused by these inconsistencies. We have revised the term from “early-stage HR-positive, HER2-negative breast cancer” to “early or locally advanced HR-positive, HER2-negative breast cancer” (Lines 128 and 150). The term “early or locally advanced” encompasses two different stages of breast cancer, whereas “Stage II/III by MRI criteria” refers to specific stages within the TNM staging system.

      • The authors should emphasize the 25% rate of conversion from mastectomy to breast conservation and also report the type and nature of axillary lymph node surgery performed. As the authors note in the discussion section, rates of pathologic complete response/RCB scores are less prognostic for hormone-receptor-positive breast cancer than other subtypes, so one of the main rationales for neoadjuvant medical therapy is for surgical downstaging. This is a clinically relevant outcome.

      We appreciate your constructive comments. Based on your suggestions, we have made the following revisions and additions to the article.

      The breast conservation rate serves as a secondary endpoint in our study (Line 62 and 179). We have highlighted the significant 25% conversion rate from mastectomy to breast conservation in both the results (Lines 229-230) and discussion sections (Lines 290-292).

      In our study, all patients underwent lymph node surgery, including sentinel lymph node biopsy or axillary lymph node dissection. Among them, 58.3% of patients (7/12) underwent sentinel lymph node biopsies.

      We agree with your point that the prognostic value of pathologic complete response/RCB score is lower for hormone receptor-positive breast cancer compared to other subtypes, we have revised the discussion section to clarify that one of the principal objectives for neoadjuvant therapy in this patient population is to facilitate downstaging and enhance the rate of breast conservation (Lines 289-290). And also emphasized that this neoadjuvant therapeutic regiment appeared to improve the likelihood of pathological downstaging and achieve a margin-free resection, particularly for those with locally advanced and high-risk breast cancer (Lines 293-295).

      Reviewer #2 (Public review):

      Firstly, as this is a single-arm preliminary study, we are curious about the order of radiotherapy and the endocrine therapy. Besides, considering the radiotherapy, we also concern about the recovery of the wound after the surgery and whether related data were collected.

      Thanks for the comments. The treatment sequence in this study is to first administer radiotherapy, followed by endocrine therapy. A meta-analysis has indicated that concurrent radiotherapy with endocrine therapy does not significantly impact the incidence of radiation-induced toxicity or survival rates compared to a sequential approach [1]. In light of preclinical research suggesting enhanced therapeutic efficacy when radiotherapy is delivered prior to CDK4/6 inhibitors, we have opted to administer radiotherapy before the combination therapy of CDK4/6 inhibitors and hormone therapy [2].

      In our study, we collected data on surgical wound recovery. All 12 patients had Class I incisions, which healed by primary intention. The wounds exhibited no signs of redness, swelling, exudate, or fat necrosis.

      References:

      (1) Li Y F, Chang L, Li W H, et al. Radiotherapy concurrent versus sequential with endocrine therapy in breast cancer: A meta-analysis[J]. The Breast, 2016, 27: 93-98.

      (2) Petroni G, Buqué A, Yamazaki T, et al. Radiotherapy delivered before CDK4/6 inhibitors mediates superior therapeutic effects in ER+ breast cancer[J]. Clinical Cancer Research, 2021, 27(7): 1855-1863.

      Secondly, in the methodology, please describe the sample size estimation of this study and follow up details.

      Thanks for pointing out this crucial omission. Sample size estimation for this study and follow-up details have been added in the methodology section. The section on sample size estimation has been revised to state in Statistical analysis: “This exploratory study involves 12 patients, with the sample size determined based on clinical considerations, not statistical factors (Lines 210-211).” The section on follow up has been revised to state in Procedures section “A 5-year follow-up is conducted every 3 months during the first 2 years, and every 6 months for the subsequent 3 years. Additionally, safety data are collected within 90 days after surgery for subjects who discontinue study treatment (Lines 169-172).”

      Thirdly, in Table 1, the item HER2 expression, it's better to categorise HER2 into 0, 1+, 2+ and FISH-.

      Thank you very much for pointing out this issue. The item HER2 expression in Table 1 has been revised from “negative, 1+, 2+ and FISH-” to “0, 1+, 2+ and FISH-”.

    1. eLife Assessment

      The ability to estimate the force of infection for Plasmodium falciparum from other more directly measurable epidemiological quantities would contribute to malaria epidemiology. The authors propose a method to accomplish this using genetic data from the var genes of the Pf genome and novel applications of existing methods from queueing theory. After revising the manuscript, this is a useful contribution to the field, and the authors provide solid evidence to support it.

    2. Reviewer #1 (Public review):

      Summary

      In their paper Zhan et al. have used Pf genetic data from simulated data and Ghanaian field samples to elucidate a relationship between multiplicity of infection (MOI) (the number of distinct parasite clones in a single host infection) and force of infection (FOI). Specifically, they use sequencing data from the var genes of Pf along with Bayesian modeling to estimate MOI individual infections and use these values along with methods from queueing theory that rely on various assumptions to estimate FOI. They compare these estimates to known FOIs in a simulated scenario and describe the relationship between these estimated FOI values and another commonly used metric of transmission EIR (entomological inoculation rate).

      This approach does fill an important gap in malaria epidemiology, namely estimating force of infection, which is currently complicated by several factors including superinfection, unknown duration of infection, and highly genetically diverse parasite populations. The authors use a new approach borrowing from other fields of statistics and modeling and make extensive efforts to evaluate their approach under a range of realistic sampling scenarios. However, the write-up would greatly benefit from added clarity both in the description of methods, and in the presentation of the results. Without these clarifications, rigorously evaluating whether the author's proposed method of estimating FOI is sound remains difficult. Additionally, there are several limitations that call into question the stated generalizability of this method that should at minimum be further discussed by authors and in some cases require a more thorough evaluation.

      Major comments:

      (1) Description and evaluation of FOI estimation procedure.

      a. The methods section describing the two-moment approximation and accompanying appendix is lacking several important details. Equations on line 891 and 892 are only a small part of the equations in Choi et al. and do not adequately describe the procedure notably several quantities in those equations are never defined some of them are important to understand the method (e.g. A, S as the main random variables for inter-arrival times and service times, aR and bR which are the known time average quantities, and these also rely on the squared coefficient of variation of the random variable which is also never introduced in the paper). Without going back to the Choi paper to understand these quantities, and to understand the assumptions of this method it was not possible to follow how this works in the paper. At minimum, all variables used in the equations should be clearly defined.

      b. Additionally, the description in the main text of how queueing procedure can be used to describe malaria infections would benefit from a diagram currently as written it's very difficult to follow.

      c. Just observing the box plots of mean and 95% CI on a plot with the FOI estimate (Figures 1, 2 and 10-14) is not sufficient to adequately assess the performance of this estimator. First, it is not clear whether authors are displaying the bootstrapped 95%Cis or whether they are just showing the distribution of the mean FOI taken over multiple simulations, and then it seems that they are also estimating mean FOI per host on an annual basis. Showing a distribution of those per host estimates would also be helpful. Second, a more quantitative assessment of the ability of the estimator to recover the truth across simulations (e.g. proportion of simulations where the truth is captured in the 95% CI or something like this) is important in many cases it seems that the estimator is always underestimating the true FOI and may not even contain the true value in the FOI distribution (e.g. figure 10, figure 1 under the mid IRS panel). But it's not possible to conclude on way or the other based on this visualization. This is a major issue since it calls into question whether there is in fact data to support that these methods give good and consistent FOI estimates.

      d. Furthermore authors state in the methods that the choice of mean and variance (and thus second moment) parameters for inter arrival times are varied widely, however, it's not clear what those ranges are there needs to be a clear table or figure caption showing what combinations of values were tested and which results are produced from them, this is an essential component of the method and it's impossible to fully evaluate its performance without this information. This relates to the issue of selecting the mean and variance values that maximize the likelihood of observing a given distribution of MOI estimates, this is very unclear since no likelihoods have been written down in the methods section of the main text, which likelihood are the authors referring to, is this the probability distribution of the steady state queue length distribution? At other places the authors refer to these quantities as Maximum Likelihood estimators, how do they know they have found the MLE? There are no derivations in the manuscript to support this. The authors should specify and likelihood and include in an appendix why their estimation procedure is in fact maximizing this likelihood preferably with evidence of the shape of the likelihood, and how fine the grid of values they tested are for their mean and variance since this could influence the overall quality of the estimation procedure.

      (2) Limitation of FOI estimation procedure.

      a. The authors discuss the importance of duration of infection to this problem. While I agree that empirically estimating this is not possible, there are other options besides assuming that all 1-5 year olds have the same duration of infection distribution as naïve adults co-infected with syphilis. E.g. it would be useful to test a wide range of assumed infection duration and assess their impact on the estimation procedure. Furthermore, if the authors are going to stick to the described method for duration of infection, the potentially limited generalizability of this method needs to be further highlighted in both the introduction, and the discussion. In particular, for an estimated mean FOI of about 5 per host per year in the pre-IRS season as estimated in Ghana (Figure 3) it seems that this would not translate to 4 year old being immune naïve, and certainly this would not necessarily generalize well to a school-aged child population or an adult population.

      b. The evaluation of the capacity parameter c seems to be quite important, and is set at 30, however, the authors only describe trying values of 25 and 30, and claim that this does not impact FOI inference, however it is not clear that this is the case. What happens if carrying capacity is increased substantially? Alternatively, this would be more convincing if the authors provided a mathematical explanation of why the carrying capacity increasing will not influence the FOI inference, but absent that, this should be mentioned and discussed as a limitation.

      Comments on revisions:

      The authors have adequately responded to all comments.

    3. Reviewer #2 (Public review):

      Summary:

      The authors combine a clever use of historical clinical data on infection duration in immunologically naive individuals and queuing theory to infer the force of infection (FOI) from measured multiplicity of infection (MOI) in a sparsely sampled setting. They conduct extensive simulations using agent based modeling to recapitulate realistic population dynamics and successfully apply their method to recover FOI from measured MOI. They then go on to apply their method to real world data from Ghana before and after an indoor residual spraying campaign.

      Strengths:

      - The use of historical clinical data is very clever in this context<br /> - The simulations are very sophisticated with respect to trying to capture realistic population dynamics<br /> - The mathematical approach is simple and elegant, and thus easy to understand

      Weaknesses:

      - The assumptions of the approach are quite strong, and the authors have made clear that applicability is constrained to individuals with immune profiles that are similar to malaria naive patients with neurosyphilis. While the historical clinical data is a unique resource and likely directionally correct, it remains somewhat dubious to use the exact estimated values as inputs to other models without extensive sensitivity analysis.

    4. Reviewer #3 (Public review):

      Summary:

      It has been proposed that the FOI is a method of using parasite genetics to determine changes in transmission in areas with high asymptomatic infection. The manuscript attempts to use queuing theory to convert multiplicity of infection estimates (MOI) into estimates of the force of infection (FOI), which they define as the number of genetically distinct blood-stage strains. They look to validate the method by applying them to simulated results from a previously published agent based model. They then apply these queuing theory methods to previously published and analysed genetic data from Ghana. They then compare their results to previous estimates of FOI.

      Strengths:

      It would be great to be able to infer FOI from cross sectional surveys which are easier and cheaper than current FOI estimates which require longitudinal studies. This work proposes a method to convert MOI to FOI for cross sectional studies. They attempt to validate this process using a previously published agent based model which helps us understand the complexity of parasite population genetics.

      Weaknesses:

      (1) I fear that the work could be easily over-interpreted as no true validation was done as no field estimates of FOI (I think considered true validation) were measured. You have developed a method of estimating FOI from MOI which makes a number of biological and structural assumptions. I would not call being able to recreate model results that were generated using a model that makes its own (probably similar) defined set of biological and structural assumptions acts as a validation of what is going on in the field. The authors claim this at times (for example, Line 153 ) and I feel it would be appropriate to differentiate this in the discussion.

      (2) Another aspect of the paper is adding greater realism to the previous agent based model, by including assumptions on missing data and under sampling. This takes prominence in the figures and results section, but I would imagine is generally not as interesting to the less specialised reader. The apparent lack of impact of drug treatment on MOI is interesting and counterintuitive, though it is not really mentioned in the results or discussion sufficiently to allay my confusion. I would have been interested in understanding the relationship between MOI and FOI as generated by your queuing theory method and the model. It isn't clear to me why these more standard results are not presented, as I would imagine they are outputs of the model (though happy to stand corrected - it isn't entirely clear to me what the model is doing in this manuscript alone).

      (3) I would suggest that outside of malaria geneticists, the force of infection is considered to be the entomological inoculation rate, not the number of genetically distinct blood-stage strains. I appreciate that FOI has been used to explain the later before by others, though the authors could avoid confusion by stating this clearly throughout the manuscript. For example, the abstract says FOI is "the number of new infections acquired by an individual host over a given time interval" which suggests the former, please consider clarifying.

      (4) Line 319 says "Nevertheless, overall, our paired EIR (directly measured by the entomological team in Ghana (Tiedje et al., 2022)) and FOI values are reasonably consistent with the data points from previous studies, suggesting the robustness of our proposed methods". I would agree that the results are consistent, given that there is huge variation in Figure 4 despite the transformed scales, but I would not say this suggests a robustness of the method.

      (5) The text is a little difficult to follow at times, and sometimes requires multiple reads to understand. Greater precision is needed with the language in a few situations and some of the assumptions made in the modelling process are not referenced, making it unclear whether it is a true representation of the biology.

      Comments on revisions:

      I think the authors gave a robust but thorough response to our reviews and made some important changes to the manuscript which certainly clarify things for me.

    5. Author response:

      The following is the authors’ response to the original reviews

      Public Reviews:

      Reviewer #1 (Public Review):

      Summary:

      In their paper, Zhan et al. have used Pf genetic data from simulated data and Ghanaian field samples to elucidate a relationship between multiplicity of infection (MOI) (the number of distinct parasite clones in a single host infection) and force of infection (FOI). Specifically, they use sequencing data from the var genes of Pf along with Bayesian modeling to estimate MOI individual infections and use these values along with methods from queueing theory that rely on various assumptions to estimate FOI. They compare these estimates to known FOIs in a simulated scenario and describe the relationship between these estimated FOI values and another commonly used metric of transmission EIR (entomological inoculation rate).

      This approach does fill an important gap in malaria epidemiology, namely estimating the force of infection, which is currently complicated by several factors including superinfection, unknown duration of infection, and highly genetically diverse parasite populations. The authors use a new approach borrowing from other fields of statistics and modeling and make extensive efforts to evaluate their approach under a range of realistic sampling scenarios. However, the write-up would greatly benefit from added clarity both in the description of methods and in the presentation of the results. Without these clarifications, rigorously evaluating whether the author's proposed method of estimating FOI is sound remains difficult. Additionally, there are several limitations that call into question the stated generalizability of this method that should at minimum be further discussed by authors and in some cases require a more thorough evaluation.

      Major comments:

      (1) Description and evaluation of FOI estimation procedure.

      a. The methods section describing the two-moment approximation and accompanying appendix is lacking several important details. Equations on lines 891 and 892 are only a small part of the equations in Choi et al. and do not adequately describe the procedure notably several quantities in those equations are never defined some of them are important to understand the method (e.g. A, S as the main random variables for inter-arrival times and service times, aR and bR which are the known time average quantities, and these also rely on the squared coefficient of variation of the random variable which is also never introduced in the paper). Without going back to the Choi paper to understand these quantities, and to understand the assumptions of this method it was not possible to follow how this works in the paper. At a minimum, all variables used in the equations should be clearly defined.

      We thank the reviewer for this useful comment. We have clarified the method and defined all relevant variables in the revised manuscript (Line 537-573). The reviewer correctly pointed out additional sections and equations in Choi et al., including the derivation of an exact expression for the steady-state queue-length distribution and the two-moment approximation. Since our work directly utilized the two-moment approximation, our previous manuscript included only material on that section. However, we agree that providing additional details on the derivation of the exact expression would benefit readers. Therefore, we have summarized this derivation in the revised manuscript (Line 561-564). Additionally, we clarified the method’s assumptions, particularly those involved in transitioning from the exact expression to the two-moment approximation (Line 565-570).

      b. Additionally, the description in the main text of how the queueing procedure can be used to describe malaria infections would benefit from a diagram currently as written it's very difficult to follow.

      We thank the reviewer for this suggestion. In the revised manuscript, we included a diagram illustrating the connection between the queueing procedure and malaria transmission (Appendix 1-Figure 8).

      c. Just observing the box plots of mean and 95% CI on a plot with the FOI estimate (Figures 1, 2, and 10-14) is not sufficient to adequately assess the performance of this estimator. First, it is not clear whether the authors are displaying the bootstrapped 95%CIs or whether they are just showing the distribution of the mean FOI taken over multiple simulations, and then it seems that they are also estimating mean FOI per host on an annual basis. Showing a distribution of those per-host estimates would also be helpful. Second, a more quantitative assessment of the ability of the estimator to recover the truth across simulations (e.g. proportion of simulations where the truth is captured in the 95% CI or something like this) is important in many cases it seems that the estimator is always underestimating the true FOI and may not even contain the true value in the FOI distribution (e.g. Figure 10, Figure 1 under the mid-IRS panel). But it's not possible to conclude one way or the other based on this visualization. This is a major issue since it calls into question whether there is in fact data to support that these methods give good and consistent FOI estimates.

      There seems to be some confusion on what we display in some key figures. Figures 1-2 and 10-14 (labeled as Figure 1-2 and Appendix 1-Figure 11-15 in the revised manuscript) display bootstrapped distributions including the 95% CIs, not the distribution of the mean FOI taken over multiple simulations. To estimate the mean FOI per host on an annual basis, the two proposed methods require either the steady-state queue length distribution (MOI distribution) or the moments of this distribution. Obtaining such a steady-state queue length distribution necessitates either densely tracked time-series observations per host or many realizations at the same sampling time per host. However, under the sparse sampling schemes, we only have two one-time-point observations per host: one at the end of wet/high-transmission and another at the end of dry/low-transmission. This is typically the case for empirical data, although numerical simulations could circumvent this limitation and generate such output. Nonetheless, we have a population-level queue length distribution from both simulation outputs and empirical data by aggregating MOI estimates across all sampled individuals. We use this population-level distribution to represent and approximate the steady-state queue length distribution at the individual level, not explicitly considering any individual heterogeneity due to transmission. The estimated FOI is per host in the sense of representing the FOI experienced by an individual host whose queue length distribution is approximated from the collection of all sampled individuals. The true FOI per host per year in the simulation is the total FOI of all hosts per year divided by the number of hosts. Therefore, our estimator, combined with the demographic information on population size, estimates the total number of Plasmodium falciparum infections acquired by all individual hosts in the population of interest per year. We clarified this point in the revised manuscript in the subsection of the Materials and Methods, entitled ‘Population-level MOI distribution for approximating time-series observation of MOI per host or many realizations at the same sampling time per host’ (Line 623-639).

      We evaluated the impact of individual heterogeneity due to transmission on FOI inference using simulation outputs (Line 157-184, Figure 1-2 and Appendix 1-Figure 11-15). Even with significant heterogeneity among individuals (2/3 of the population receiving approximately 94% of all bites whereas the remaining 1/3 receives the rest of the bites), our methods performed comparably to scenarios with homogeneous transmission. Furthermore, our methods demonstrated similar performance for both non-seasonal and seasonal transmission scenarios.

      Regarding the second point, we quantitatively assessed the ability of the estimator to recover the truth across simulations and included this information in a supplementary table in the revised manuscript (supplementary file 3-FOImethodsPerformance.xlsx). Specifically, we indicated whether the truth lies within the bootstrap distribution and provided a measure of relative deviation, which is defined as the true FOI value minus the median of the bootstrap distribution for the estimate, normalized by the true FOI value .  This assessment is a valuable addition which enhances clarity, but please note that our previous graphical comparisons do illustrate the ability of the methods to estimate “sensible” values, close to the truth despite multiple sources of errors. “Close” here is relative to the scale of variation of FOI in the field and to the kind of precision that would be useful in an empirical context. From a practical perspective based on the potential range of variation of FOI, the graphical results already illustrate that the estimated distributions would be informative.

      We also thank the reviewer for highlighting instances where our proposed methods for FOI inference perform sub-optimally (e.g. Figure 10, Figure 1 under the mid-IRS panel in the previous manuscript). This feedback prompted us to examine these instances more closely and identify the underlying causes related to the stochastic impact introduced during various sampling processes. These include sampling the host population and their infections at a specific sampling depth in the simulated output, matching the depth used for collecting empirical data. In addition, previously, we imputed MOI estimates for treated individuals by sampling only once from non-treated individuals. This time, we conducted 200 samplings and used the final weighted MOI distribution for FOI inference. By doing so, we reduced the impact of extreme single-sampling efforts on MOI distribution and FOI inference. In other words, some of these suboptimal instances correspond to the scenarios where the one-time sampled MOIs from non-treated individuals do not fully capture the MOI distribution of non-treated individuals. We added a section titled ‘Reducing stochastic impact in sampling processes’ to Appendix 1 on this matter (Line 841-849).

      The reviewer correctly noted that our proposed methods tend to underestimate FOI (Figure 1-2, 10-14, ‘Estimated All Errors’ and ‘Estimated Undersampling of Var’ panels in the previous manuscript, corresponding to Figure 1-2 and Appendix 1-Figure 11-15 in the revised manuscript). This underestimation arises from the underestimation of MOI. The Bayesian formulation of the varcoding method does not account for the limited overlap between co-infecting strains, an additional factor that reduces the number of var genes detected per individual. We have elaborated on this matter in the Results and Discussion sections of the revised manuscript (Line 142-149, 252-256).

      d. Furthermore the authors state in the methods that the choice of mean and variance (and thus second moment) parameters for inter-arrival times are varied widely, however, it's not clear what those ranges are there needs to be a clear table or figure caption showing what combinations of values were tested and which results are produced from them, this is an essential component of the method and it's impossible to fully evaluate its performance without this information. This relates to the issue of selecting the mean and variance values that maximize the likelihood of observing a given distribution of MOI estimates, this is very unclear since no likelihoods have been written down in the methods section of the main text, which likelihood are the authors referring to, is this the probability distribution of the steady state queue length distribution? At other places the authors refer to these quantities as Maximum Likelihood estimators, how do they know they have found the MLE? There are no derivations in the manuscript to support this. The authors should specify the likelihood and include in an appendix an explanation of why their estimation procedure is in fact maximizing this likelihood, preferably with evidence of the shape of the likelihood, and how fine the grid of values they tested is for their mean and variance since this could influence the overall quality of the estimation procedure.

      We thank the reviewer for pointing out these aspects of the work that can be further clarified. In response, we maximized the likelihood of observing the population-level MOI distribution in the sampled population (see our responses to your previous comment c), given queue length distributions, derived from the two-moment approximation method for various mean and variance combinations of inter-arrival times. We added a new section to the Materials and Methods in the revised manuscript with an explicit likelihood formulation (Line 574-585).

      Additionally, we specified the ranges for the mean and variance parameters for inter-arrival times and provided the grid of values tested in a supplementary table (supplementary file 4-meanVarianceParams.xlsx). Example figures illustrating the shape of the likelihood have also been included in Appendix 1-Figure 9. We tested the impact of different grid value choices on estimation quality by refining the grid to include more points, ensuring the FOI inference results are consistent. The results of the test are documented in the revised manuscript (Line 587-593, Appendix 1-Figure 10).

      (2) Limitation of FOI estimation procedure.

      a. The authors discuss the importance of the duration of infection to this problem. While I agree that empirically estimating this is not possible, there are other options besides assuming that all 1-5-year-olds have the same duration of infection distribution as naïve adults co-infected with syphilis. E.g. it would be useful to test a wide range of assumed infection duration and assess their impact on the estimation procedure. Furthermore, if the authors are going to stick to the described method for duration of infection, the potentially limited generalizability of this method needs to be further highlighted in both the introduction, and the discussion. In particular, for an estimated mean FOI of about 5 per host per year in the pre-IRS season as estimated in Ghana (Figure 3) it seems that this would not translate to 4-year-old being immune naïve, and certainly this would not necessarily generalize well to a school-aged child population or an adult population.

      We thank the reviewer for this useful comment. The reviewer correctly noted the challenge in empirically measuring the duration of infection for 1-5-year-olds and comparing it to that of naïve adults co-infected with syphilis. We nevertheless continued to use the described method for the duration of infection, while more thoroughly acknowledging and discussing the limitations this aspect of the method introduces. We have highlighted this potential limitation in the Abstract, Introduction, and Discussion sections of the revised manuscript (Line 26-28, 99-103, 270-292). It is important to note that the infection duration from the historical clinical data we have relied on has been used, and is still used, in the malaria modeling community as a credible source for this parameter in untreated natural infections of malaria-naïve individuals in endemic settings of Africa (e.g. in the agent-based model OpenMalaria, see 1).

      To reduce misspecification in infection duration and fully utilize our proposed methods, future data collection and sampling could prioritize subpopulations with minimal prior infections and an immune profile similar to naïve adults, such as infants and toddlers. As these individuals are also the most vulnerable, prioritizing them aligns with the priority of all intervention efforts in the short term, which is to monitor and protect the most vulnerable individuals from severe symptoms and death. We discuss this aspect in detail in the Discussion section of the revised manuscript (Line 287-292).

      In the pre-IRS phase of Ghana surveys, an estimated mean FOI of about 5 per host per year indicates that a 4-year-old child would have experienced around 20 infections, which could suggest they are far from naïve. The extreme diversity of circulating var genes (2) implies, however, that even after 20 infections, a 4-year-old may have only developed immunity to a small fraction of the variant surface antigens (PfEMP1, Plasmodium falciparum erythrocyte membrane protein 1) encoded by this important gene family. Consequently, these children are not as immunologically experienced as it might initially seem. Moreover, studies have shown that long-lived infections in older children and adults can persist for months or even years, including through the dry season. This persistence is driven by high antigenic variation of var genes and associated incomplete immunity. Additionally, parasites can skew PfEMP1 expression to produce less adhesive erythrocytes, enhancing splenic clearance, reducing virulence, and maintaining sub-clinical parasitemia (3, 4, 5). The impact of immunity on infection duration with age for falciparum malaria remains a challenging open question.

      Lastly, the FOI for naïve hosts is a key basic parameter for epidemiological models of complex infectious diseases like falciparum malaria, in both agent-based and equation-based formulations. This is because FOI for non-naïve hosts is typically a function of their immune status, body size, and the FOI of naïve hosts. Thus, knowing the FOI of naïve hosts helps parameterize and validate these models by reducing degrees of freedom.

      b. The evaluation of the capacity parameter c seems to be quite important and is set at 30, however, the authors only describe trying values of 25 and 30, and claim that this does not impact FOI inference, however it is not clear that this is the case. What happens if the carrying capacity is increased substantially? Alternatively, this would be more convincing if the authors provided a mathematical explanation of why the carrying capacity increase will not influence the FOI inference, but absent that, this should be mentioned and discussed as a limitation.

      Thank you for this question. This parameter represents the carrying capacity of the queuing system, or the maximum number of blood-stage strains with which an individual human host can be co-infected. Empirical evidence, estimated using the varcoding method, suggests this value is 20 (2), providing a lower bound for parameter c. However, the varcoding method does not account for the limited overlap between co-infecting strains, which reduces the number of var genes detected in an individual, thereby affecting the basis of MOI estimation. Additional factors, such as the synchronicity of clones in their 48-hour life cycle on alternate days (6) and within-host competition of strains leading to low-parasitemia levels (7, 8), contribute to under-sampling of strains and are not accounted for in MOI estimation (9). To address these potential under-sampling issues, we previously tested values of 25 and 30.

      This time, we systematically investigated a wider range of values, including substantially higher ones: 25, 30, 40, and 60. We found that the FOI inference results are similar across these values. Figure 3 in the main text and supplementary figures (Appendix 1-Figure 16-18) illustrates these findings.

      The parameter c influences the steady-state queue length distribution based on the two-moment approximation with specific mean and variance combinations, primarily affecting the distribution’s tail when customer or infection flows are high. Smaller values of c lower the maximum possible queue length, making the system more prone to “overflow”. In such cases, customers or infections may find no space available upon their arrival, hence not incrementing the queue length.

      Empirical MOI distributions for high-transmission endemic regions center around 4 or 5, mostly remaining below 10, with only a small fraction between 15-20 (2). These distributions do not support parameter combinations resulting in frequent overflow for a system with c equal to 25 or 30. As one increases the value of c further, these parameter combinations would cause the MOI distributions to shift to larger values inconsistent with the empirical MOI distributions. We therefore do not expect substantially higher values for parameter c to noticeably change either the relative shape of the likelihood or the MLE.

      We have included a subsection on parameter c in the Materials and Methods section of the revised manuscript (Line 596-612).

      Reviewer #2 (Public Review):

      Summary:

      The authors combine a clever use of historical clinical data on infection duration in immunologically naive individuals and queuing theory to infer the force of infection (FOI) from measured multiplicity of infection (MOI) in a sparsely sampled setting. They conduct extensive simulations using agent-based modeling to recapitulate realistic population dynamics and successfully apply their method to recover FOI from measured MOI. They then go on to apply their method to real-world data from Ghana before and after an indoor residual spraying campaign.

      Strengths:

      (1) The use of historical clinical data is very clever in this context.

      (2) The simulations are very sophisticated with respect to trying to capture realistic population dynamics.

      (3) The mathematical approach is simple and elegant, and thus easy to understand.

      Weaknesses:

      (1) The assumptions of the approach are quite strong and should be made more clear. While the historical clinical data is a unique resource, it would be useful to see how misspecification of the duration of infection distribution would impact the estimates.

      We thank the reviewer for bringing up the limitation of our proposed methods due to their reliance on a known and fixed duration of infection distribution from historical clinical data. Please see our response to Reviewer 1, Comment 2a, for a detailed discussion on this matter.

      (2) Seeing as how the assumption of the duration of infection distribution is drawn from historical data and not informed by the data on hand, it does not substantially expand beyond MOI. The authors could address this by suggesting avenues for more refined estimates of infection duration.

      We thank the reviewer for pointing out a potential improvement to our work. We acknowledge that FOI is inferred from MOI and thus depends on the information contained in MOI. However, MOI by definition is a number and not a rate parameter. FOI for naïve hosts is a fundamental parameter for epidemiological models of complex infectious diseases like falciparum malaria, in both agent-based and equation-based formulations. FOI of non-naïve hosts is typically a function of their immune status, body size, and the FOI of naïve hosts. Thus, knowing the FOI of naïve hosts helps parameterize and validate these models by reducing degrees of freedom. In this sense, we believe the transformation from MOI to FOI is valuable.

      Measuring infection duration is challenging, making the simultaneous estimation of infection duration and FOI an attractive alternative, as the referee noted. This, however, would require closely monitored cohort studies or densely sampled cross-sectional surveys to reduce issues like identifiability. For instance, a higher arrival rate of infections paired with a shorter infection duration could generate a similar MOI distribution to a lower arrival rate with a longer infection duration. In some cases, incorrect combinations of rate and duration might even produce an MOI distribution that appears closer to the targeted distribution. Such cohort studies and densely sampled cross-sectional surveys have not been and will not be widely available across different geographical locations and times. This work utilizes more readily available data from sparsely sampled single-time-point cross-sectional surveys, which precludes more sophisticated derivation of time-varying average arrival rates of infections and lacks the resolution to simultaneously estimate arrival rates and infection duration. In the revised manuscript, we have elaborated on this matter and added a paragraph in the Discussion section (Line 306-309).

      (3) It is unclear in the example how their bootstrap imputation approach is accounting for measurement error due to antimalarial treatment. They supply two approaches. First, there is no effect on measurement, so the measured MOI is unaffected, which is likely false and I think the authors are in agreement. The second approach instead discards the measurement for malaria-treated individuals and imputes their MOI by drawing from the remaining distribution. This is an extremely strong assumption that the distribution of MOI of the treated is the same as the untreated, which seems unlikely simply out of treatment-seeking behavior. By imputing in this way, the authors will also deflate the variability of their estimates.

      We thank the reviewer for pointing out aspects of the work that can be further clarified. Disentangling the effect of drug treatment on measurements like infection duration is challenging. Since our methods rely on the known and fixed distribution of infection duration from historical data of naïve patients with neurosyphilis infected with malaria as a therapy, drug treatment can potentially violate this assumption. In the previous manuscript, we did not attempt to directly address the impact of drug treatment. Instead, we considered two extreme scenarios that bound reality, well summarized by the reviewer. Reality lies somewhere in between these two extremes, with antimalarial treatment significantly affecting measurements in some individuals but not in others. Nonetheless, the results of FOI inference do not differ significantly across both extremes.

      The impact of the drugs likely depends on their nature, efficiency, and duration. We note that treatment information was collected via a routine questionnaire, with participant self-reporting that they had received an antimalarial treatment in the previous two-weeks before the surveys (i.e., participants that reported they were sick, sought treatment, and were provided with an antimalarial treatment). No confirmation through hospital or clinic records was conducted, as it was beyond the scope of the study. Additionally, many of these sick individuals seek treatment at local chemists, which may limit the relevance of hospital or clinic records, if they are even available. Consequently, information on the nature, efficiency, and duration of administrated drugs was incomplete or lacking. As this is not the focus of this work, we do not elaborate on the impact of drug treatment in the revised manuscript.

      The reviewer correctly noted that this imputation might not add additional information and could reduce MOI variability. Therefore, in the revised manuscript, we reported FOI estimates with drug-treated 1-5-year-olds excluded. Additionally, we discarded the infection status and MOI values of treated individuals and sampled their MOI from non-treated microscopy-positive individuals, imputing a positive MOI for treated and uninfected individuals. We also reported FOI estimates based on these MOI values. This scenario provides an upper bound for FOI estimates. Note that we do not assume that the MOI distribution for treated individuals is the same as that for untreated individuals. Rather, we aim to estimate what their MOI would have been, and consequently, determine what the FOI per individual per year in the combined population would be, had these individuals not received antimalarial treatment. The results of FOI inference do not differ significantly between these two approaches. They can serve as general solutions to antimalarial treatment issues for others applying our FOI inference methods. These details can be found in the revised manuscript (Line 185-210, 462-484).

      - For similar reasons, their imputation of microscopy-negative individuals is also questionable, as it also assumes the same distributions of MOI for microscopy-positive and negative individuals.

      We thank the reviewer for this comment. The reviewer correctly noted that we imputed the MOI values for microscopy-negative but PCR-positive 1-5-year-olds by sampling from the microscopy-positive 1-5-year-olds, under the assumption that both groups have similar MOI distributions. This approach was motivated by the analysis of our Ghana surveys, which shows no clear relationship between MOI (or the number of var genes detected within an individual host, on the basis of which our MOI values were estimated) and the parasitemia levels of those hosts. Parasitemia levels underlie the difference in detection sensitivity between PCR and microscopy.

      In the revised manuscript, we elaborated on this issue and included formal regression tests showing the lack of a relationship between MOI/the number of var genes detected within an individual host and the parasitemia levels of those hosts (Line 445-451, Appendix 1-Figure 7). We also described potential reasons or hypotheses behind this observation (Line 452-461).

      Reviewer #3 (Public Review):

      Summary:

      It has been proposed that the FOI is a method of using parasite genetics to determine changes in transmission in areas with high asymptomatic infection. The manuscript attempts to use queuing theory to convert multiplicity of infection estimates (MOI) into estimates of the force of infection (FOI), which they define as the number of genetically distinct blood-stage strains. They look to validate the method by applying it to simulated results from a previously published agent-based model. They then apply these queuing theory methods to previously published and analysed genetic data from Ghana. They then compare their results to previous estimates of FOI.

      Strengths:

      It would be great to be able to infer FOI from cross-sectional surveys which are easier and cheaper than current FOI estimates which require longitudinal studies. This work proposes a method to convert MOI to FOI for cross-sectional studies. They attempt to validate this process using a previously published agent-based model which helps us understand the complexity of parasite population genetics.

      Weaknesses:

      (1) I fear that the work could be easily over-interpreted as no true validation was done, as no field estimates of FOI (I think considered true validation) were measured. The authors have developed a method of estimating FOI from MOI which makes a number of biological and structural assumptions. I would not call being able to recreate model results that were generated using a model that makes its own (probably similar) defined set of biological and structural assumptions a validation of what is going on in the field. The authors claim this at times (for example, Line 153) and I feel it would be appropriate to differentiate this in the discussion.

      We thank the reviewer for this comment, although we think there is a mis-understanding on what can and cannot be practically validated in the sense of a “true” measure of FOI that would be free from assumptions for a complex disease such as malaria. We would not want the results to be over-interpreted, and we have extended the discussion of what we have done to test the methods in the revised manuscript (Line 314-328). Performance evaluation via simulation output is common and often necessary for statistical methods. These simulations can come from dynamical or descriptive models, each making their own assumptions to simplify reality. Our stochastic agent-based model (ABM) of malaria transmission, used in this study, has successfully replicated several key patterns from high-transmission endemic regions in the field, including aspects of strain diversity not represented and captured by simpler models (10).

      In what sense this ABM makes a set of biological and structural assumptions that are “probably similar” to those of the queuing methods we present is not clear to us. We agree that using models with different structural assumptions from the method being tested is ideal. Our FOI inference methods based on queuing theory require the duration of infection distribution and the MOI distribution among sampled individuals. However, these FOI inference methods are agnostic to the specific biological mechanisms governing these distributions.

      Another important point raised by this comment is what would be the “true” FOI value against which to validate our methods. Empirical MOI-FOI pairs from cohort studies tracking FOI directly are still lacking. Direct FOI measurements are prone to errors because differentiating new infections from the temporary absence of an old infection in the peripheral blood and its subsequent re-emergence remains challenging. Reasons for this challenge include the low resolution of the polymorphic markers used in cohort studies, which cannot fully differentiate hyper-diverse antigenic strains, and the complexity of within-host dynamics and competitive interaction of co-infecting strains (6, 8, 9). Alternative approaches also do not provide a “true” FOI estimation free from assumptions. These approaches involve fitting simplified epidemiological models to densely sampled/repeated cross-sectional surveys for FOI inference. In this case, no FOI is measured directly, and thus, there are no FOI values available for benchmarking against fitted FOI values. The evaluation or validation of these model-fitting approaches is typically based on their ability to capture other epidemiological quantities that are easier to sample or measure, such as prevalence or incidence, with criteria such as the Akaike information criterion (AIC). This type of evaluation is similar to the one done in this work. We selected FOI values that maximize the likelihood of observing the given MOI distribution. Furthermore, we paired our estimated FOI values for Ghana surveys with the independently measured EIR (Entomological Inoculation Rate), a common field measure of transmission intensity. We ensured that our resulting FOI-EIR points align with existing FOI-EIR pairs and the relationship between these quantities from previous studies. We acknowledge that, like model-fitting approaches, our validation for the field data is also indirect and further complicated by high variance in the relationship between EIR and FOI from previous studies.

      Prompted by the reviewer’s comment, we elaborated on these points in the revised manuscript, emphasizing the indirect nature and existing constraints of our validation with field data in the Discussion section (Line 314-328). Additionally, we clarified certain basic assumptions of our agent-based model in Appendix 1-Simulation data.

      (2) Another aspect of the paper is adding greater realism to the previous agent-based model, by including assumptions on missing data and under-sampling. This takes prominence in the figures and results section, but I would imagine is generally not as interesting to the less specialised reader. The apparent lack of impact of drug treatment on MOI is interesting and counterintuitive, though it is not really mentioned in the results or discussion sufficiently to allay my confusion. I would have been interested in understanding the relationship between MOI and FOI as generated by your queuing theory method and the model. It isn't clear to me why these more standard results are not presented, as I would imagine they are outputs of the model (though happy to stand corrected - it isn't entirely clear to me what the model is doing in this manuscript alone).

      We thank the reviewer for this comment. Please refer to our response to Reviewer 2, comment (3), as we made changes in the revised manuscript regarding antimalarial drug treated individuals. We reported two sets of FOI estimates. In the first, we excluded these treated individuals from the analysis as suggested by Reviewer 2. In the second, we discarded their infection status and MOI estimates and sampling from non-treated individuals.

      The reviewer correctly noted the surprising lack of impact of antimalarial treatment on MOI estimates. This pattern is indeed interesting and counterintuitive. The impact of the drugs likely depends on their nature, efficiency, and duration. We note that treatment information was collected via a routine questionnaire, with participant self-reporting that they had received an antimalarial treatment in the previous two-weeks before the surveys (i.e., participants that reported they were sick, sought treatment, and were provided with an antimalarial treatment). No confirmation through hospital or clinic or pharmacy records was conducted, as it was beyond the scope of the study. Additionally, many of these sick individuals seek treatment at local chemists, which may limit the relevance of hospital or clinic records, if they are even available. Consequently, information on the nature, efficiency, and duration of administrated drugs was incomplete or lacking. As this is not the focus of this work, we do not elaborate on the impact of drug treatment in the revised manuscript.

      Regarding the last point of the reviewer, on understanding the relationship between MOI and FOI, we are not fully clear about what was meant. We are also confused about the statement on what the “model is doing in this manuscript alone”. We interpret the overall comment as the reviewer suggesting a better understanding of the relationship between MOI and FOI generated by the two-moment approximation method and the agent-based model. This could involve exploring the relationship between the moments of their distributions, possibly by fitting models such as simple linear regression models. Although this approach is in principle possible, it falls outside the focus of our work. Moreover, it would be challenging to evaluate the performance of this alternative approach given the lack of MOI-FOI pairs from empirical settings with directly measured FOI values (from large cohort studies). Nonetheless, we note that the qualitative relationship between the two quantities is intuitive. Higher FOI values should correspond to higher MOI values. Less variable FOI values should result in more narrow or concentrated MOI distributions, whereas more variable FOI values should lead to more spread-out MOI distributions. We described this qualitative relationship between MOI and FOI in the revised manuscript (Line 499-502).

      As mentioned in the response to the reviewer’s previous point (1), we hope that our clarification of the basic assumptions underlying our agent-based model in Appendix 1-Simulation data helps the reviewer gain a better sense of the model. We appreciate agent-based models involve more assumptions and parameters than typical equation-based models in epidemiology, and their description can be difficult to follow. We have extended this description to rely less on previous publications. As for other ABMs, the population dynamics of the disease is followed over time by tracking individual hosts and strains. This allows us to implement specific immune memory to the large number of strains arising from the var multigene family. There is no equation-based formulation of the transmission dynamics that can incorporate immune memory in the presence of such large variation as well as recombination of the strains. We rely on this model because large strain diversity at high transmission underlies superinfection of individual hosts, and therefore, MOI values larger than one. We relied on the estimation of MOI with a method based on var gene sampling, and therefore, simulated such sampling for individual hosts (which requires an ABM and one that represents such genes and resulting strains explicitly).

      (3) I would suggest that outside of malaria geneticists, the force of infection is considered to be the entomological inoculation rate, not the number of genetically distinct blood-stage strains. I appreciate that FOI has been used to explain the latter before by others, though the authors could avoid confusion by stating this clearly throughout the manuscript. For example, the abstract says FOI is "the number of new infections acquired by an individual host over a given time interval" which suggests the former, please consider clarifying.

      We thank the reviewer for this helpful comment, as it is crucial to avoid any confusion regarding basic definitions. EIR, the entomological inoculation rate, is closely related to the FOI, force of infection, but they are not equivalent. EIR focuses on the rate of arrival of infectious bites and is measured as such by focusing on the mosquito vectors that are infectious and arrive to bite a given host. Not all these bites result in actual infection of the human host. Epidemiological models of malaria transmission clearly make this distinction, as FOI is defined as the rate at which a host acquires infection. This definition comes from more general models of the population dynamics of infectious diseases. For simpler diseases without super-infection, the typical SIR models define FOI as the rate at which a susceptible individual becomes infected. In the context of malaria, FOI refers to the number of new infections acquired by an individual host over a given time interval. This distinction between EIR and FOI is the reason why studies have investigated their relationship, with the nonlinearity of this relationship reflecting the complexity of the underlying biology and how host immunity influences the outcome of an infectious bite.

      We added “blood-stage strains” to the definition of FOI in the previous manuscript, as pointed out by the reviewer, for the following reason. After an individual host acquires an infection/strain from an infectious mosquito bite, the strain undergoes a multi-stage life cycle within the host, including the liver stage and asexual blood stage. Liver-stage infections can fail to advance to the blood stage due to immunity or exceeding the blood-stage carrying capacity. Only active blood-stage infections are detectable in all direct measures of FOI. Quantities used in indirect model-fitting approaches for estimating FOI are also based on or reflect these blood-stage strains/infections. Only these blood-stage strains/infections are transmissible to other individuals, impacting disease dynamics. Ultimately, the FOI we seek to estimate is the one defined as specified above, as well as in both the previous and revised manuscripts, consistent with the epidemiological literature. We expanded on this point in the revised manuscript (Line 641-656).

      (4) Line 319 says "Nevertheless, overall, our paired EIR (directly measured by the entomological team in Ghana (Tiedje et al., 2022)) and FOI values are reasonably consistent with the data points from previous studies, suggesting the robustness of our proposed methods". I would agree that the results are consistent, given that there is huge variation in Figure 4 despite the transformed scales, but I would not say this suggests a robustness of the method.

      We thank the reviewer for this comment and have modified the relevant sentences to use “consistent” instead of “robust” (Line 229-231).

      (5) The text is a little difficult to follow at times and sometimes requires multiple reads to understand. Greater precision is needed with the language in a few situations and some of the assumptions made in the modelling process are not referenced, making it unclear whether it is a true representation of the biology.

      We thank the reviewer for this comment. As mentioned in the response to Reviewer 1 and in response to your previous points, we have shortened, reorganized and rewritten parts of the text in the revised manuscript to improve clarity and readability.

      Reviewer #1 (Recommendations For The Authors):

      Minor comments:

      Bar graphs in Figures 6 and 7 are not an appropriate way to rigorously compare whether your estimated MOI (under different approaches) is comparable to your true MOIs. Particularly in Figure 6 it is very difficult to clearly compare what is going on. If anything in Figure 7 it looks like as MOI gets higher, Bayesian methods and barcoding are overestimating relative to the truth. The large Excel file that shows KS statistics could be better summarized (and include p-values not in a separate table) and further discussion of how these methods perform on metrics other than the mean value would be important given that MOI distributions can be heavily right skewed and these high MOI values contain a large proportion of genetic diversity which can be highly informative for the purposes of this estimation.

      We appreciate the reviewer’s comment. It appears there may have been some misinterpretation of the pattern in Figure 7 in the previous manuscript. We believe the reviewer meant “as MOI gets higher, Bayesian methods and varcoding are UNDERESTIMATING relative to the truth” rather than “OVERESTIMATING”.

      We agree with the reviewer that the comparison of MOI distributions can be improved. To better quantify the difference between the MOI distribution from the original varcoding method and its Bayesian formulation relative to true MOIs, we replaced the KS test conducted in the previous manuscript with two alternative, more powerful tests: the Cramer-von Mises Test and the Anderson-Darling Test. The Cramer-von Mises Test quantifies the sum of the squared differences between the two cumulative distribution functions, while the Anderson-Darling Test, a modification of the Cramer-von Mises Test, gives more weight to the tails of the distribution, as noted by the reviewer. We have summarized the results, including test statistics and their associated p-values, in a supplementary table (Line 135-149, Line 862-883, supplementary file 1-MOImethodsPerformance.xlsx and supplementary file 7-BayesianImprovement.xlsx).

      Throughout the text the authors use "consistent" to describe their estimation of FOI, I know this is meant in the colloquial use of the word but consider changing this word to replicable or something similar. When talking about estimators, usually, consistency implies asymptotic convergence in probability which we do not know whether the proposed estimator does.

      We thank the reviewer for this suggestion. We changed “consistent” to “replicable” in the revised manuscript.

      I think there is an issue with the numbering of the figures, they are just numbered continuously between the main text and appendix between 1 and 15, but in the text, there is a different numbering system between the main text and appendix figures.

      We thank the reviewer for this comment. We have double-checked to ensure that the numbering of the figures is consistent with the text in the revised manuscript. Figures are numbered continuously between the main text and the appendix. When referring to these figures in the text, we provide a prefix (i.e., Appendix 1) indicating whether the figure is in the main text or Appendix 1, followed by the figure number.

      The description of the bootstrap for 95% CI is a bit sparse, did bootstrap distributions look symmetric? If not did authors use a skewness adjustment to ensure good coverage? Also, is the bootstrap unit of resampling at the individual level, the simulation scenario level, population level?

      We checked the bootstrap distributions and calculated their skewness. The majority fall within the range of -0.5 to 0.5, with a few exceptions falling within the range of 0.5-0.75 (supplementary file 6-FOIBootstrapSkewness.xlsx). We considered them as fairly symmetric and thus did not use a skewness adjustment.

      In Figures 8 and 9 the x-axes seem to imply there are both the true and estimated MOI distributions on the plot but only 1 color of grey is clearly visible. If there are 2 distributions the color or size needs to be changed or if not consider re-labeling the x-axis.

      We thank the reviewer for this comment. There was a mistake in the x-axis labels in Figure 8 and 9. Only the estimated MOI distributions were shown because the true ones are not available for the Ghana field surveys. The labels should simply be “Estimated MOIvar”.

      Reviewer #2 (Recommendations For The Authors):

      (1) Throughout the results section there are lots of vague statements such as "differ only slightly", "exhibit a somewhat larger, but still small, difference", etc. Please include the exact values and ranges within the text where appropriate because it can be difficult to discern from the figure.

      We thank the reviewer for this useful comment. In the revised manuscript, we have provided exact values and ranges where appropriate (supplementary file 1- MOImethodsPerformance.xlsx, supplementary file 3- FOImethodsPerformance.xlsx, and supplementary file 7-BayesianImprovement.xlsx).

      (2) Truncate decimals to 2 places.

      We thank the reviewer for this comment. In the revised manuscript, we have truncated decimals to two places where applicable.

      (3) The queueing theory notation in the methods section is unfamiliar, specifically things like "M/M/c/k", please define the variables used.

      We thank the reviewer for this useful comment. In the revised manuscript, we have defined all the variables used. Please refer to our responses to Reviewer 1 Point (1) a.

      Reviewer #3 (Recommendations For The Authors):

      (1) The work takes many of the models and data from a previous paper published in eLife in 2023 (the 4 most senior authors of this previous manuscript are the 4 authors of the current manuscript). This previous paper introduced some new terminology "census population" which was highlighted as being potentially confusing by 2 of the 3 reviewers of the original article. This was somewhat rebuffed by the authors, though their response was ambiguous about whether the terminology would be changed in any potential future revision. The census population terminology does not appear in this manuscript, though the same data is being used. Publication of similar papers with the same data and different terminology could generate confusion, so I would encourage authors to be consistent and make sure the two papers are in line. To this end, it feels like this paper would be better suited to be classified as a "Research Advances" on this original manuscript and linked, which is a nice functionality that eLife offers.

      We thank the reviewer for this comment, but we do not think our work would fall under the criteria of “Research Advances” based on our previous paper pointed out by the reviewer. The reviewer correctly noted that the current work and the previous paper used the same datasets. However, they have different goals and are not related in terms of content.

      The previous paper examined how epidemiological quantities and diversity measurements of the local parasite population change following the initiation of effective control interventions and subsequently as this control wanes. These quantities included MOI and census population size (MOI was estimated using the Bayesian formulation of the varcoding method, and the census population size was derived from summing MOIvar across individuals in the human population). In contrast, our current work focused on a different goal: inferring FOI based on MOI. We proposed two methods from queuing theory and illustrated them with MOI estimates obtained with the Bayesian formulation of the "varcoding" method. Although the method applied to estimate MOI is indeed the same as that of the paper mentioned by the reviewer, the proposed methods should be applicable to MOI estimates obtained in any other way, as stated in the Abstract in the previous manuscript. That is, the methods we present in the current paper are independent from the way the MOI estimation has been carried out. Our results are not about the MOI values themselves but rather on an illustration of the methods for converting those MOI values to FOI. In fact, there are different ways to obtain MOI estimates for Plasmodium falciparum (9). The most common approach for determining MOI involves size-polymorphic antigenic markers, such as msp1, msp2, msp3, glurp, ama1, and csp. Similarly, microsatellites, also termed simple sequence repeat (SSR), are another type of size-polymorphic marker that can be amplified to estimate MOI by determining the number of alleles detected. Combinations of genome-wide single nucleotide polymorphisms (SNPs) have also been used to estimate MOI.

      The result section of the current manuscript begins by evaluating how different kinds of errors/sampling limitations affect the estimation of MOI using the Bayesian formulation of the varcoding method. Only that brief section, which is not the core or primary objective of the manuscript, could be considered an extension and an advancement related to the other paper. We considered the effect of these errors on the resulting estimates of FOI.

      We further note that, as the reviewer pointed out, the census population size is not utilized at all in our current work. We are unclear on why this quantity is mentioned here. Our previous paper has been revised and can be found in eLife as such. We have not changed this terminology and have provided a clear explanation for why we chose it. The reviewer seems to have read the previous response to version 1 posted on December 28, 2023 (Note that version 2 and the associated response was posted on November 20, 2024). Regardless, this is not the place for a discussion on another paper on a quantity that is irrelevant to the current work being reviewed.

      We understand that the reviewer’s impression may have been influenced by the previous emphasis on the Bayesian formulation of the varcoding method in our manuscript. With the reorganization and rewriting of parts of the manuscript, we hope the revised version will clearly convey the central goal of our work.

      (2) Similar statements that could be toned down. 344 ".... two-moment approximation approach and Little's law are shown to provide consistent and good FOI estimates,.....", 374 "Thus, the flexibility and generality of these two proposed methods allow robust estimation of an important metric for malaria transmission"

      We thank the reviewer for this comment. We have modified the descriptive terms for the performance of our methods. Please also refer to our responses to Reviewer 1, Point (1) c and your previous Point (1).

      (3) Various assumptions seem to have been made which are not justified. For example, heterogeneous mixing is defined as 2/3rd of the population receives 90% of the bites. A reference for this would be good.

      In this work, we considered heterogenous transmission arising from 2/3 of the population receiving approximately 94% of all bites, because we believe this distribution introduces a reasonable and sufficient amount of heterogeneity in exposure risk across individuals. We are not aware of field studies justifying this degree of heterogeneity.

      (4) The work assumes children under 5 have no immunity (Line 648 says "It is thus safe to consider negligible the impact of immune memory accumulated from previous infections on the duration of a current infection." ). Is there supporting evidence for this and what would happen if this wasn't the case?

      We thank the reviewer for this helpful comment. Please refer to our responses to Reviewer 1 Point (2) a.

      (5) Similarly, there are a few instances of a need for more copy-editing. The text says "We continue with the result of the heterogeneous exposure risk scenarios in which a high-risk group ( 2/3 of the total population) receives around 94% of all bites whereas a low-risk group ( 1/3 of the total population) receives the remaining bites (Appendix 1-Figure 5C)." whereas the referenced caption says "For example, heterogeneous mixing is defined as 2/3rd of population receives 90% of the bites."

      We believe there was a misinterpretation of the legend caption. In the referenced caption, we stated “2/3rd of population receives MORE THAN 90% of the bites”, which aligns with “around 94% of all bites”. Nonetheless, to maintain consistency in the revised manuscript, we have updated the description to uniformly state “approximately 94% of all bites” throughout.

      (6) The term "measurement error" is used to describe the missing potential under-sampling of var genes. Given this would only go one way isn't the term "bias" more appropriate?

      We understand that, in general English, “bias” might seem more precise for describing a deviation in one direction. However, in malaria epidemiology and in models for malaria and other infectious diseases, “measurement error” is a general term that describes deviations introduced in the process of measurement and sampling, which can confound or add noise to the true values being collected. This term is commonly used, and we have adhered to it in the revised manuscript.

      (7) Line 739 "Though FOI and EIR both reflect transmission intensity, the former refers directly to detectable blood-stage infections whereas the latter concerns human-vector contact rates." In my mind this is not true, the EIR is the number of potentially invading parasites (a contact rate between parasites in mosquitoes and humans if you will). The human-vector contact rate is the human biting rate.

      We thank the reviewer for this comment. We have clarified the definition regarding FOI and EIR in our response to your previous comment (3) and in the revised manuscript. We agree that the term “human-vector contact rates” was not precise enough for EIR. We intended “human-infectious vector contact rates”, and we have updated the text to reflect this change (Line 644-645).

      References and Notes

      (1) Maire, N. et al. A model for natural immunity to asexual blood stages of Plasmodium falciparum malaria in endemic areas. Am J Trop Med Hyg., 75(2 Suppl):19-31 (2006).

      (2) Tiedje, K. E. et al. Measuring changes in Plasmodium falciparum census population size in response to sequential malaria control interventions. eLife, 12 (2023).

      (3) Andrade C. M. et al. Infection length and host environment influence on Plasmodium falciparum dry season reservoir. EMBO Mol Med.,16(10):2349-2375 (2024).

      (4) Zhang X. and Deitsch K. W. The mystery of persistent, asymptomatic Plasmodium falciparum infections, Current Opinion in Microbiology, 70:102231 (2022).

      (5) Tran, T. M. et al. An Intensive Longitudinal Cohort Study of Malian Children and Adults Reveals No Evidence of Acquired Immunity to Plasmodium falciparum Infection, Clinical Infectious Diseases, 57(1):40–47 (2013).

      (6) Farnert, A., Snounou, G., Rooth, I., Bjorkman, A. Daily dynamics of Plasmodium falciparum subpopulations in asymptomatic children in a holoendemic area. Am J Trop Med Hyg., 56(5):538-47 (1997).

      (7) Read, A. F. and Taylor, L. H. The Ecology of Genetically Diverse Infections, Science, 292:1099-1102 (2001).

      (8) Sondo, P. et al. Genetically diverse Plasmodium falciparum infections, within-host competition and symptomatic malaria in humans. Sci Rep 9(127) (2019).

      (9) Labbe, F. et al. Neutral vs. non-neutral genetic footprints of Plasmodium falciparum multiclonal infections. PLoS Comput Biol, 19(1) (2023).

      (10) He, Q. et al. Networks of genetic similarity reveal non-neutral processes shape strain structure in Plasmodium falciparum. Nat Commun 9(1817) (2018).

    1. eLife Assessment

      It is well established that cellulose synthesis in higher plants requires three different but related catalytic subunits known as CESA proteins. Here the authors provide cryo electron microscopy structural information on soybean CESA1, CESA3, and CESA6 and find substantial differences between the structure of these CESA homotrimers and the previously-resolved secondary cell wall CESAs. They present an important model with convincing evidence in which the multi-subunit cellulose synthase complexes are made of multiple homotrimers.

    2. Reviewer #1 (Public review):

      Cellulose is the major component of the plant cell wall and as such is a major component of all plant biomass on the planet. It is made at the cell surface by a large membrane-bound complex known as the cellular synthase complex. It is the structure of the cellulose synthase complex that determines the structure of the cellulose microfibril, the unit of cellulose found in nature. Consequently, while understanding the molecular structure of individual catalytic subunits that synthesise individual beta 1-4 glucose chains is important, to really understand cellulose synthesis it is necessary to understand the structure of the entire complex.

      In higher plants cellulose is synthesised by a large membrane-bound complex composed of three different CESA proteins. During cellulose synthesis in the primary cell wall this is composed of members of groups CESA1, CESA3 and CESA6. While the authors have previously presented structural data on CESA8, required for cellulose synthesis in the secondary cell wall, here they provide structural and enzymatic analysis of CESA1, CESA3 and CESA6 from soybean.

      The authors have utilised their established protocol to purify trimers for all three classes of CESA proteins and obtain structural information using electron microscopy. The structures reveal some subtle, but interesting differences between the structures obtained in this study and that previously obtained for CESA8. In particular, they identify a change in the position of transmembrane helices 7 that in previous structures formed part of the transmembrane channel. In the structure of CESA1 TM7 is shifted laterally to a position more towards the periphery of the protomer where is stabilised by inter protomer interactions. This creates a large lipid exposed channel opening that is likely encountered by the growing cellulose chain. In the discussion the authors speculate this channel might facilitate lateral movement of cellulose chains in the membrane what would allow them to associate to form the microfibril. There is, however, no explanation for why this might be different for CESA proteins involved in primary and secondary cell wall CESA proteins.

      Interactions within the trimer as stabilised by the plant conserved regions (PCR), while in common with previous studies that class-specific regions (CSR) is not resolved, likely of it being highly disordered as has been suggested in previous studies. As the name suggests these regions are likely to be important for determining how different CESA proteins interact, but it remains to be seen how they achieve this. Similarly, the N-terminal domain (NTD) remains rather intriguing. In the CESA3 structure, the NTD forms a stalk that protrudes into the cytoplasm that was previously observed for CESA8, while it remains unresolved in CESA1 and CESA6. The authors suggest the inability to resolve this region is likely the result of the NTD being able to form multiple conformations. Loss of the NTD does not prevent the formation of trimers and CESA1 and CESA3 are still able to interact. Previous bioinformatic studies suggest that the CSR part of the NTD is also highly class-specific (Carrol et al. 2011 Frontiers in Plant Science 2, 5-5) suggesting it is also likely to participate in interactions between different CESA proteins. This analysis provides little new information on the structure of the NTD or how it functions as part of the cellulose synthase complex.

      The other important point regarding cellulose synthesis is how the different CESA trimers function during cellulose synthesis and complex assembly. The authors provide biochemical evidence that mixed complexes of two different CESA proteins are able to synergistically increase the rate of cellulose synthesis. This increase is not dramatic, around 2-fold as it is unclear what brings about this increase and whether it results from the ability to form larger complexes favouring greater rates of cellulose synthesis.

      It is clear however from electron microscopy that mixing of CESA proteins can lead to the formation of large aggregates not seen with single CESA proteins. The aggregates observed do not form rosette type shapes but appear to be much more random aggregates of different CESA trimers. The authors suggest that this is likely a result of the fact that the complexes are not constrained in two dimensions by the membrane, however if these are biologically relevant interactions that form aggregates is somewhat surprising that they do not form hexameric structures, particularly since that are essentially forming as a single layer.

      Overall the study provides some important data and raises a number of important questions.

    3. Reviewer #3 (Public review):

      Cellulose is a major component of the primary cell wall of growing cells and it is made by cellulose synthases (CESAs) organized into multi-subunit complexes in the plasma membrane. Previous results have resolved the structure of secondary cell wall CESAs, which are only active in a subset of cells. Here, the authors evaluate the structure of CESAs from soybean (Glycine max, Gm) via cryo-EM and compare these structures to secondary cell wall CESAs. First, they express a select member of the GmCESA1, GmCESA3, or GmCESA6 families in insect cells, purified these proteins as both monomers and homotrimers, and demonstrated their capacity to incorporate 3H-labelled glucose into cellulase-sensitive product in a pH and divalent cation (e.g., Mg2+) -dependant fashion (Figure 2). Although CESA1, CESA3, and a CESA6-like isoforms are essential for cellulose synthesis in Arabidopsis, in this study, monomers and homotrimers both showed catalytic activity, and there was more variation between individual isoforms than between their oligomerization states (i.e., CESA3 monomers and trimers showed similar activities, which were substantially different from CESA1 monomers or trimers).

      They next use cryo-EM to solve the structure of each homotrimer to ~3.0 to 3.3 A (Figure 3). They compare this with PttCESA8 and find important similarities, such as the unidentified density at a positively-charged region near Arg449, Lys452, and Arg453; and differences, such as the position and relatively low resolution (suggesting higher flexibility) of TM7, which presumably creates a large lateral lipid-exposed channel opening, rather than the transmembrane pore in PttCESA8. Like PttCESA8, an oligosaccharide in the translocation channel was co-resolved with the protein structure. Neither the N-terminal domains nor the CSRs (a plant-specific insert into the cytosolic loop between TM2 and TM3) are resolved well.

      Several previous models have proposed that the cellulose synthase complexes may be composed of multiple heterotrimers, but since the authors were able to isolate beta-glucan-synthesizing homotrimers, their results challenge this model. Using the purified trimers, the authors investigated how the CESA homotrimers might assemble into higher order complexes. They detected interactions between each pair of CESA homotrimers via pull down assays (Figure 4), although these same interactions were also detected among monomers (Supplemental Figure 4). Neither catalytic activity nor these inter-homotrimer interactions required the N-terminal domain (Figure 5). When populations of homotrimers were mixed, they formed larger aggregations in vitro (Figure 6) and displayed increased activity, compared to the predicted additive activity of each enzyme alone (Figure 7). Intriguingly, this synergistic behavior is observed even when one trimer is chemically inactivated before mixing (supplemental figure 7), suggesting that the synergistic effects are due to structural interactions.

      The main strength of this manuscript is its detailed characterization of the structure of multiple CESAs implicated in primary cell wall synthesis, which complements previous studies of secondary cell wall CESAs. They provide a comprehensive comparison of these new structures with previously resolved CESA structures and discuss several intriguing similarities and differences. The synergistic activity observed when different homotrimers are mixed is a particularly interesting result. These results provide fundamental in vitro support for a cellulose synthase complex comprised of a hexamer of CESA homotrimers.

      The main weakness of the manuscript is that the authors' evidence that these proteins make cellulose in vitro is limited to beta-glucanase-sensitive digestion of the product. Previous reports characterizing CESA structures have used multiple independent methods: sensitivity and resistance of the product to various enzymes, linkage analysis, and importantly, TEM of the product to ensure that it makes genuine cellulose microfibrils, rather than amorphous beta-glucan.

    4. Author response:

      The following is the authors’ response to the original reviews.

      Reviewer #1 (Recommendations For The Authors):

      I can find no problems with the experiments performed in this study, but there are several results that are not easily explained. I would like to see more consideration of possible explanations. For example, one of the major differences between the the CESA structure from primary and secondary cell walls is the displacement of TM7 in the primary cell wall CESAs that leads to the formation of lipid exposed channel. Why does this vary between primary and secondary cell wall CESA proteins? Could it explain differences in the properties, such as crystallinity between primary and secondary cell wall cellulose?

      At this time, the different position of TM helix 7 observed in our GmCesA structures is just an observation. We have some emerging evidence that this helix is also flexible in POCesA8 under certain conditions; however, we do not know whether this affects catalytic activity or cellulose coalescence. We have revised the text to avoid the interpretation that TM 7 repositioning is a characteristic feature of primary cell wall CesAs only.

      Similarly, regarding the formation of the larger structures from mixtures of different CESA trimers. Why do they not form roseOes? Par;cularly as these appear to be forming 2-dimensional structures.

      We have included additional data on the interaction between different CesA isoform trimers (Figure 6). To answer the reviewer’s ques;on, the most likely reasons for not observing closely packed roseOe-like structures are (a) steric interferences between the micelles harboring the individual CesA trimers, and (b) the lack of a stabilizing cellulose fiber.  This interpretation is supported by 2D class averages of dimers of CesA1 and CesA3 trimers (now shown in Fig. 6). The class averages show an ‘upside-down and side-by-side’ orientation of the two trimers, consistent with interferences between the solubilizing detergent micelles. The implica;ons of this non-physiological arrangement are discussed in the revised manuscript. In a biological membrane, the CesA trimers are confined to the same plane in the same orientation, which is likely necessary to form ordered arrangements.

      What role does the NTD play in trimer formation given its apparent very high class specificity?

      We have no data suggesting any contribution of the NTD to trimer formation. Recent work on moss CesA5 and similar AlphaFold predic;ons suggest that, for some CesAs, an extreme Nterminal region can interact with the beta sheet of the catalytic domain via beta-strand augmentation. Whether this interaction can contribute to CesA-CesA interactions remains unknown.

      Reviewer #2 (Recommendations For The Authors):

      The authors provide PDB codes but not EMDB codes for the EM maps, also I would encourage the authors to upload the raw micrographs to the EMPIAR database.

      The EMDB codes are shown in Table 1 and data transfer to EMPIAR is ongoing.  

      Page 6 line 144, the statement "All CesA isoforms show greatest catalytic activity at neutral pH" seems to contradict the data in Figure 1e and the subsequent statements. This sentence should be removed.

      The text has been revised to indicate that CesA1 and CesA6 show highest activity under mild alkaline conditions.  

      Page 6, line 150, the authors state "The affinities for substrate binding range from 1.4 mM for CesA1 to 0.6 and 2.4 mM for CesA3 and CesA6, respectively." How were the affinities determined? Is this the affinities or the Michaelis constants? Is it known whether CesAs are rapid equilibrium enzymes? This should be clarified.

      The text now states that we performed Michaelis Menten kine;cs using the ‘UDP-Glo’ glycosyltransferase assay kit. We are uncertain about whether CesAs can be classified as rapid equilibrium enzymes. The rate-limiting step of cellulose biosynthesis has been proposed to be glycosyl transfer, rather than cellulose transloca;on.  To avoid any confusion, we changed the text from '…reveals Michaelis Menten constants for substrate binding of CesA1 and CesA3' to '…reveals Michaelis Menten constants for CesA1 and CesA3 with respect to UDP-Glc'.

      Page 6, line 153, the authors state "CesA1's apparent Ki for UDP is roughly 0.8 mM, whereas this concentration is increased to about 1.2 to 1.5 mM for CesA6 and CesA3, respectively." From the Figure 1g legend, it appears that the authors performed additional experiments at different UDP-Glc concentrations in order to determine Ki that are not shown. This data should be included as a figure supplement as the data presented are insufficient to determine Ki (only IC50).

      The UDP inhibition data show apparent IC50 values, and this has been corrected in the text. For each CesA isoform, the titration was done at one UDP-Glc concentration only.    

      Page 8, line 202, the authors state that TM helix 7 of the primary cell wall CesAs is more flexible "as evidenced by weaker density." The density for the TM helix 7 should be shown. If the density shown in Supplementary Figure 3 corresponds to TM helices the number of the helices should be indicated as it is not immediately obvious from the amino acid residue numbers.

      The densities for TM helix 7 of all CesA isoforms are shown in Supplemental Figure 3. The helices are now labeled to orient the reader.  

      Reviewer #2 (Public Review)

      The authors demonstrate via truncation that the N-terminus of the CesA is not involved in the interactions between the isoforms and propose that the CSR hook-like extensions are the primary mediator of trimer-trimer interactions. This argument would be strengthened by equivalent truncation experiments in which the CSR region is removed.

      We performed the suggested experiment. We replaced the CSR in N-terminally truncated GmCesA1 and GmCesA3 with a 20-residue long linker. The resulting constructs assemble into homotrimeric complexes as observed for the wild type and only N-terminally truncated versions. However, the CSR-truncated constructs of the different isoforms do not interact with each other in vitro. Further, CSR-deleted GmCesA3 also does not interact with full-length CesA1, suggesting that two CSR domains of different isoforms are necessary for homotrimer interaction. This data is now shown as Fig. 5.  

      Reviewer #3 (Recommendations For The Authors):

      Major Points

      (1) The authors state on Line 354 that they were unable to isolate heterotrimers, but they need to provide the data to support this claim; for example, it is important for readers to understand whether co-expression of all three CESAs leads to only homotrimers or only monomers. This information is essential to exclude model C in Figure 6.

      We have revised the corresponding discussion and toned down the statement that heterotrimeric complexes did not form in our recombinant expression system. Co-expression of differently tagged secondary or primary cell wall CesAs in Sf9 cells has consistently resulted in negligible amounts of material that can be purified sequentially over different affinity matrices (corresponding to the tags on the recombinantly expressed CesAs – His, Strep, Flag). While this does not exclude the formation of a small fraction of hetero-oligomeric complexes (which could be trimers as observed in the structures or monomers interacting via their CSR regions), it demonstrates that CesAs favor the same isoform for trimer formation, rather than partnering with other isoforms. An example of such a purification is now shown as Supplemental Figure 8.

      Determining whether heterotrimers are formed upon co-expression of different CesA isoforms requires high resolution structural analysis because co-purification of different isoforms can also be due to interactions between different homo-trimeric complexes, as demonstrated in this study.

      While we cannot exclude that factors exist in planta that may prevent the formation of homotrimers and favor the formation of hetero-trimers, it is important to keep in mind that currently no experimental data supports the formation of hetero-trimeric complexes. Instead, our work demonstrates that existing data on CesA isoform interactions can be explained by the interaction of homotrimers of different isoforms.

      (2) The evidence that the products of GmCEA1, GmCESA3, and GmCESA6 homotrimers are cellulose is that they consume UDP-glucose and produce a beta-glucanase-sensitive product. Other beta-glucans synthesized by similar GT2 family proteins (e.g. CSLDs, Yang et al., 2020 Plant Cell or CSLCs, Kim et al., 2020 PNAS) would be sensitive to this enzyme, and the product cannot truly be called cellulose unless it forms microfibrils. Previous reports of CESA activity in vitro have demonstrated that the products form genuine cellulose microfibrils rather than amorphous beta-glucan (via electron microscopy); extensively documented that the product is sensitive to beta-glucanase, but not other enzymes (e.g., callose or MLG degrading enzymes); provided linkage analysis of the product to conclusively demonstrate that it is a beta1,4-linked glucan; and documented a loss of activity when key catalytic residues were mutated (Purushotham et al., 2016 PNAS; Cho et al., 2017 Plant Phys; Purushotham et al., 2020 Science).

      Other GT2 characterization efforts have documented activity to similar standards (e.g. CSLDs, Yang et al., 2020 Plant Cell or CSLFs, Purushotham et al., 2022 Science Advances). At least one independent method should be provided, and the TEM of the product is necessary for readers to appreciate whether the product forms true cellulose microfibrils.

      There may be some confusion regarding the nomenclature. Therefore, we revised the second sentence of the Introduction to define ‘cellulose’ as a beta-1,4 linked glucose polymer, in accordance with the ‘Essentials of Glycobiology’. This is also consistent with enzyme nomenclature as the primary product of cellulose synthase is a single glucose polymer, and not a fibril. For example, most bacterial cellulose synthases only produce amorphous (single chain) cellulose. 

      We show that the GmCesA products can be degraded with a beta-1,4 specific glucanase (cellulase), which demonstrates the formation of authentic cellulose. This study does not focus on the formation of fibrillar cellulose apart from suggesting a revised model for a microfibrilforming CSC.       

      (3) The position of isoxaben-resistant mutations implies that primary cell wall CESAs form heterotrimers (Shim et al., 2018 Frontiers in Plant Biology). Indeed, in their previous description of the POCESA8 structure (Purushotham et al., 2020 Science), the authors discussed the position of isoxaben-resistant mutations as a way to justify the way that TM7 of one CESA can contribute to forming the cellulose translocation pore in the neighbouring CESA within a heterotrimer. However, in this manuscript, the authors document a different location for TM7 in the GmCEA1, GmCESA3, and GmCESA6 homotrimers, which would change the position of these resistance mutations. Please discuss.

      As stated in the manuscript, we do not know what the functional implication of the TM7 flexibility may be, but we speculate that it could affect the alignment of the synthesized cellulose polymers. Regarding the previously reported POCesA8 structure, the mapping of one of the reported isoxaben resistance mutants to the C-terminus of TM7 was not used to justify the structure; the structure with its position of TM7 stands on its own.  Considering recent observations suggesting that isoxaben may affect cellulose biosynthesis via secondary effects, we prefer not to speculate on the mechanism by which these mutations cause the apparent resistance to isoxaben (PMID: 37823413).

      (4) The authors present no evidence that GmCESA1/3/6 are involved in primary cell wall synthesis. Please include gene expression information (documenting widespread expression consistent with primary CESAs) and rigorous molecular phylogenetic analysis (or references to these published data) to clarify that these are indeed primary cell wall CESAs.

      This has been addressed. We have included additional figures (Fig. 1 and S1B) that show the strong and wide distribution of the selected CesAs in soybean leaves, their co-expression with primary cell wall markers, and their phylogenetic clustering with Arabidopsis primary cell wall CesAs.  

      (5) Several small changes need to be made to the abstract to ensure that it aligns with the data: Line 28: add "in vitro" arer "their assembly into homotrimeric complexes" Line 28: change "stabilized by the PCR" to "presumably stabilized by the PCR".

      We inserted ‘in vitro’ as requested. We did not insert the second modification as requested since CesA trimers are stabilized by the PCR. This is a fact arising from several experimentally determined CesA trimer structures.  

      (6) In all graphs in all figures it is unclear what the sample size is and what the bars represent. These must be stated in the figure legends. It is best practice to plot individual data points so that readers can easily interpret both the sample size and the variation.

      The sample sizes and error bars are now defined in the relevant figure legends.

      (7) The methods need to unambiguously define GmCESA1, GmCESA3, GmCESA6 protein identities using appropriate accession numbers.

      The accession codes are now provided in the Methods.

      Minor Points

      (1) Does CESA1 have higher activity in Figure 1D because of the pH at which the assay was conducted (see Figure 1E)? Could this difference in activity or pH preference have also affected their capacity to resolve TM7 of CESA1?

      We consistently observe higher in vitro catalytic activity of CesA1, compared to CesA3 and CesA6. Activity assays are performed at a pH of 7.5, roughly halfway between the activity maxima of CesA3 and CesA1/6. At this pH, we expect activity differences to arise from factors other than the buffer pH. As detailed above, we do not know whether the conformational flexibility of TM helix 7 affects catalytic activity.

      (2) Line 55: The authors should cite additional papers that also provide insight into CESA structure (e.g. Qiao et al 2021 PNAS).

      A recent publication on moss CesA5 has been included. Qiao et al unfortunately report on a dimeric assembly of a fragment of Arabidopsis thaliana’s CesA3 catalytic domain, which we consider non-physiological. We added a brief statement in the Discussion explaining that our GmCesA3 structure is inconsistent with the dimeric arrangement reported by Qiao et al.

      (3) Line 95: these references are about secondary cell wall CESA isoforms, but there are more appropriate references for the primary CESAs that should be included in place of these papers.

      Fagard et al report on growth defects in roots and dark-grown hypocotyls linked to Arabidopsis CesA 1 and CesA6, which are primary cell wall CesAs. Nevertheless, we have included two additional recent publications from the Meyerowitz and Persson labs.

      (4) Line 121-122: Please cite a specific figure that supports this claim, since the (Purushotham et al., 2020) reference refers to POCESA8 enrichment results, but the claims are about the GmCESA1/3/6 enrichment.

      The POCesA8 reference has been removed. The classification into monomers and trimers arises from the data processing described in this manuscript and is consistent with similar results obtained for POCesA8.

      (5) Line 314: It is more appropriate to use "enzyme activity" rather than "cellulose synthesis".

      We prefer to use cellulose biosynthesis since the enzyme produces cellulose.

      (6) Figure 1: please add colour to the graphs to clarify which trend lines belong to which data series (especially Figure 1G).

      The figure (now Fig. 2) has been revised as suggested.  

      (7) Figure 2D: It's not clear which parts are GmCESA and which are POCESA8; please clarify the figure legend.

      Thank you, the legend has been revised accordingly (now Fig. 3).

      (8) In Figure 5, It's not clear that the one CESA is maintained at a steady concentration throughout the assay since there is only a bar for that CESA at the highest concentration (e.g. in Figure 5A, the blue bar for CESA1 only appears on the right-most assay, but there was CESA1 in all assays, so this should be indicated).

      In the panel the reviewer is referring to, the blue bar corresponds to the activity measured for only CesA1 at a concentration of 20 µM. The red columns (indicated as ‘Mix’) represent the activities measured in the presence of 20 µM of CesA1 plus increasing concentrations of CesA3. The purple columns represent activities obtained for only CesA3 at the indicated concentrations. Numerical addition of the activities of CesA1 alone at 20 µM (blue column) and CesA 3 alone (purple columns) gives rise to the gray columns, now indicated by a capital ‘sigma’ sign. We are unclear on how the figure could be improved, but we have revised the legend to avoid confusion.    

      (9) Figure 5 legend needs to be clarified to indicate whether monomers or homotrimers were used in the assays.

      This is now shown as Fig. 7 and the legend has been revised as requested. The experiments were performed with the trimeric CesA fractions.

      (10) There seem to be some random dots near the top of Figures 6B & 6C

      Removed. Thank you.

    1. eLife Assessment

      This important study aims to understand the role of endothelial cell differentiation into pericytes in the restoration of blood-brain barrier function after ischemic stroke. Identification of pericytes derived from endothelial cells and the involvement of myeloid cell-derived TGFβ1 signaling are compelling new findings, but future studies will be needed to validate the origin and nature of these pericytes. The work will be of interest to blood-brain barrier and basic and translational stroke researchers.

    2. Reviewer #1 (Public review):

      Summary:

      Using lineage tracing and single-cell RNA sequencing, Li et al. reported brain ECs can differentiate into pericytes after stroke. This finding is novel and important to the field.

      Strengths:

      Detailed characterization of each time point and genetic manipulation of genes for study role of ECs and E-pericyte.

      Weaknesses:

      Genetic evidence for lineage tracing of ECs and E-pericytes requires more convincing data that include staining, FACS, and scRNA-seq analysis.

      Comments on revisions:

      Authors have addressed some of my concerns and questions, and also plan to include more convincing data to support the conclusion. Some unpublished data should be included in the online supporting files.

    3. Reviewer #2 (Public review):

      Summary:

      In this manuscript, Li and colleagues study the fate of endothelial cells in a mouse model of ischemic stroke. Using genetic lineage tracing approaches, they find that endothelial cells give rise to non-endothelial cells, which they term "E-pericytes." They further show that depleting these cells exacerbates blood-brain barrier leakage and worsens functional recovery. The authors also provide evidence that endothelial-to-mesenchymal transition, myeloid cell-derived TGFβ1, and endothelial TGFβRII are involved in this process. These are potentially interesting findings, however, the experimental evidence that endothelial cells undergo transdifferentiation to non-endothelial cells is weak, as is the evidence that these cells are pericytes. Addressing this foundational weakness will facilitate interpretation of the other findings.

      In this revised manuscript, the authors corrected labeling errors and included negative controls for flow cytometry and immunohistochemistry data. They did not, however, substantively address the major weaknesses below related to rigorously demonstrating the cellular origin and identity of "E-pericytes."

      Strengths:

      (1) The authors address an important question about blood vessel function and plasticity in the context of stroke.

      (2) The authors use a variety of genetic approaches to understand cell fate in the context of stroke. Particularly commendable is the use of several complementary lineage tracing strategies, including an intersectional strategy requiring both endothelial Cre activity and subsequent mural cell NG2 promoter activity.

      (3) The authors address upstream cellular and molecular mechanisms, including roles for myeloid-derived TGFβ.

      Weaknesses:

      (1) The authors use Cdh5-CreERT2; Ai47 mice to permanently label endothelial cells and their progeny with eGFP. They then isolate eGFP+ cells from control and MCAO RP7D and RP34D brains, and use single cell RNA-seq to identify the resulting cell types. Theoretically, all eGFP+ cells should be endothelial cells or their progeny. This is a very powerful and well-conceived experiment. The authors use the presence of a pericyte cluster as evidence that endothelial to pericyte transdifferentiation occurs. However, pericytes are also present in the scRNA-seq data from sham mice, as are several other cell types such as fibroblasts and microglia. This suggests that pericytes and these other cell types might have been co-purified (e.g., as doublets) with eGFP+ endothelial cells during FACS and may not themselves be eGFP+. Pericyte-endothelial doublets are common in scRNA-seq given that these cell types are closely and tightly associated. Additionally, tight association (e.g., via peg-socket junctions) can cause fragments of endothelial cells to be retained on pericytes (and vice-versa) during dissociation. Finally, it is possible that after stroke or during the dissociation process, endothelial cells lyse and release eGFP that could be taken up by other cell types. All of these scenarios could lead to purification of cells that were not derived (transdifferentiated) from endothelial cells. Authors note that the proportion of pericytes increased in the stroke groups, but it does not appear this experiment was replicated and thus this conclusion is not supported by statistical analysis. The results of pseudotime and trajectory analyses rely on the foundation that the pericytes in this dataset are endothelial-derived, which, as discussed above, has not been rigorously demonstrated.

      (2) I have the same concern regarding inadvertent purification of cells that were not derived from endothelial cells in the context of the bulk RNA-seq experiment (Fig. S4), especially given the sample-to-sample variability in gene expression in the RP34D, eGFP+ non-ECs group (e.g., only 2/5 samples are enriched for mesenchymal transcription factor Tbx18, only 1/5 samples are enriched for mural cell TF Heyl). If the sorted eGFP+ non-ECs were pericytes, I would expect a strong and consistent pericyte-like gene expression profile.

      (3) Authors use immunohistochemistry to understand localization, morphology, and marker expression of eGFP+ cells in situ. The representative "E-pericytes" shown in Fig. 3A-D are not associated with blood vessels, and the authors' quantification also shows that the majority of such cells are not vessel-associated ("avascular"). By definition, pericytes are a component of blood vessels and are embedded within the vascular basement membrane. Thus, concluding that these cells are pericytes ("E-pericytes") may be erroneous.

      (4) CD13 flow cytometry and immunohistochemistry are used extensively to identify pericytes. In the context of several complementary lineage tracing strategies noted in Strength #2, CD13 immunohistochemistry is the only marker used to identify putative pericytes (Fig. S3J-M). In stroke, CD13 is not specific to pericytes; dendritic cells and other monocyte-derived cells express CD13 (Anpep) in mouse brain after stroke (PMID: 38177281, https://anratherlab.shinyapps.io/strokevis/).

      (5) Authors conclude that "EC-specific overexpression of the Tgfbr2 protein by a virus (Tgfbr2) decreases Evans blue leakage, promotes CBF recovery, alleviates neurological deficits and facilitates spontaneous behavioral recovery after stroke by increasing the number of E-pericytes." All data in Fig. 10, however, compare endothelial Tgfbr2 overexpression to a DsRed overexpression control. There is no group in which Tgfbr2 is overexpressed but "E-pericytes" are eliminated with DTA (this is done in Fig. 9B, but this experiment lacks the Tgfbr2 overexpression-only control). Thus, the observed functional outcomes cannot be ascribed to "E-pericytes"; it remains possible that endothelial Tgfbr2 overexpression affects EB leakage, CBF, and behavior through alternative mechanisms.

      In response to this comment, authors wrote: "in Figures 9A-B, we observed no significant difference in Evans blue leakage between the Tgfbr2 overexpression group and the Tgfbr2 overexpression + DTA group (P=0.8153), this suggests that the impact of Tgfbr2 overexpression on the blood-brain barrier (BBB) is primarily attributed from the E-pericytes generated by Tgfbr2 expression."

      I do not see data from a Tgfbr2 overexpression-only group in Fig. 9B. Further, I do not understand authors' logic: If the mechanism by which EC Tgfbr2 overexpression acts to reduce BBB leakage is by increasing the number of "E-pericytes," depleting "E-pericytes" with DTA in this context should increase BBB leakage.

      (6) Single-cell and bulk RNA-seq data are not available in a public repository (such as GEO). Depositing these data would facilitate their independent reevaluation and reuse.

      In response to this comment, authors indicated they submitted data to GEO, but did not provide an accession number.

    4. Reviewer #3 (Public review):

      Summary:

      The data and experiments presented in that study convincingly show that a subpopulation of endothelial cells undergo transformation into pericyte-like cells after stroke in mice. These so-called "E-pericytes" are protective and might present a new target for stroke recovery. The authors used a huge battery of different techniques and modified signaling pathways and cellular interactions using several genetic and pharmacological tools to show that TGFbeta and EndoMT are causes of this transformation.

      Strengths:

      The amount of different genetic and pharmacological approaches in combination with sophisticated techniques such as single-cell RNAseq is impressive and convincing. The results support their conclusions and the authors achieved their aims. The findings will strongly impact the field of cerebrovascular recovery after stroke and might open up new therapeutic targets.

      Weaknesses:

      In addition to improving the written and graphical presentation of the results, there is only one point I would like to see clarified: the inclusion of additional experiments, even if they have already been performed but are not applicable due to methodological difficulties regarding the role of Procr+ cells. Negative results also help the scientific community avoid unnecessary experiments and advance understanding.

    5. Author response:

      The following is the authors’ response to the original reviews

      Public Reviews:

      Reviewer #1 (Public review):

      Summary:

      Using lineage tracing and single-cell RNA sequencing, Li et al. reported brain ECs can differentiate into pericytes after stroke. This finding is novel and important to the field.

      Strengths:

      Detailed characterization of each time point and genetic manipulation of genes for study role of ECs and E-pericyte.

      Weaknesses:

      Genetic evidence for lineage tracing of ECs and E-pericytes requires more convincing data that includes staining, FACS, and scRNA-seq analysis.

      We appreciate the reviewer’s recommendation to explore more convincing data, including staining, FACS, and scRNA-seq analysis. We initially employed traditional lineage tracing methods to demonstrate that endothelial cells can transform into pericytes after stroke. We utilized Cdh5CreERT2;Ai47 mice, Tie2-Dre;Mfsd2aCreER;Ai47 mice, and AAV-BI30 virus-infected Ai47 mice. However, in our validation of the transformed cells as pericytes, there are limitations to our results. While three pericyte markers (CD13, NG2, and PDGFRβ) were used in Cdh5CreERT2;Ai47 mice, only one marker (CD13) was applied in Tie2Dre; Mfsd2aCreER;Ai47 and AAV-BI30 virus-infected Ai47 mice. This is insufficient, and the other two pericyte markers (NG2 and PDGFRβ) need to be verified in these models.

      At scRNA-seq, although we observed an increased proportion of pericyte/EGFP<sup>+</sup> cells after stroke, we did not rule out potential contamination by pericyte cells, nor did we include sufficient replicates. To address these issues, we can explore additional methods for analyzing scRNA-seq data, increasing sample replicates, and eliminating pericyte contamination using advanced algorithms. Furthermore, we can use chimeric-related mutations to compare normal endothelial cells, normal pericytes, endothelial-derived pericytes (E-pericytes), and intermediate fibroblast-like cells at the DNA level. This approach will help identify and trace chimeric-related mutations across different cell types and developmental stages. Finally, we can track the entire process of endothelial cell transformation into pericytes using two-photon imaging in vivo.

      Reviewer #2 (Public review):

      Summary:

      In this manuscript, Li and colleagues study the fate of endothelial cells in a mouse model of ischemic stroke. Using genetic lineage tracing approaches, they found that endothelial cells give rise to non-endothelial cells, which they term "E-pericytes." They further show that depleting these cells exacerbates blood-brain barrier leakage and worsens functional recovery. The authors also provide evidence that endothelial-to-mesenchymal transition, myeloid cell-derived TGFβ1, and endothelial TGFβRII are involved in this process. These are potentially interesting findings, however, the experimental evidence that endothelial cells undergo transdifferentiation to non-endothelial cells is weak, as is the evidence that these cells are pericytes. Addressing this foundational weakness will facilitate the interpretation of the other findings.

      Strengths:

      (1) The authors address an important question about blood vessel function and plasticity in the context of stroke.

      (2) The authors use a variety of genetic approaches to understand cell fate in the context of stroke. Particularly commendable is the use of several complementary lineage tracing strategies, including an intersectional strategy requiring both endothelial Cre activity and subsequent mural cell NG2 promoter activity.

      (3) The authors address upstream cellular and molecular mechanisms, including roles for myeloid-derived TGFβ.

      Weaknesses:

      (1) The authors use Cdh5-CreERT2; Ai47 mice to permanently label endothelial cells and their progeny with eGFP. They then isolate eGFP<sup>+</sup> cells from control and MCAO RP7D and RP34D brains, and use single-cell RNA-seq to identify the resulting cell types. Theoretically, all eGFP<sup>+</sup> cells should be endothelial cells or their progeny. This is a very powerful and well-conceived experiment. The authors use the presence of a pericyte cluster as evidence that endothelial-to-pericyte transdifferentiation occurs. However, pericytes are also present in the scRNA-seq data from sham mice, as are several other cell types such as fibroblasts and microglia. This suggests that pericytes and these other cell types might have been co-purified (e.g., as doublets) with eGFP<sup>+</sup> endothelial cells during FACS and may not themselves be eGFP<sup>+</sup>. Pericyte-endothelial doublets are common in scRNA-seq given that these cell types are closely and tightly associated. Additionally, tight association (e.g., via peg-socket junctions) can cause fragments of endothelial cells to be retained on pericytes (and vice-versa) during dissociation. Finally, it is possible that after stroke or during the dissociation process, endothelial cells lyse and release eGFP that could be taken up by other cell types. All of these scenarios could lead to the purification of cells that were not derived (transdifferentiated) from endothelial cells. The authors note that the proportion of pericytes increased in the stroke groups, but it does not appear this experiment was replicated and thus this conclusion is not supported by statistical analysis. The results of pseudotime and trajectory analyses rely on the foundation that the pericytes in this dataset are endothelial-derived, which, as discussed above, has not been rigorously demonstrated.

      Thank you for your thoughtful comment.

      Indeed, we face the challenge of obtaining pure cells. As the reviewer has pointed out, several factors may contribute to cell contamination. For instance, the meninges of adult mice are difficult to remove completely, which may lead to fibroblast contamination. Although Cdh5CreERT2 can specifically label endothelial cells in the normal brain parenchyma, there may still be very few unspecific cells in certain brain regions, such as the choroid plexus and periventricular areas, resulting in the presence of ependymal cells. To address these issues, we can improve our methodology by carefully removing the meninges, choroid plexus, and periventricular cells during sample preparation. Additionally, we need to increase the N of the transcriptome samples to enhance the reliability of our data.

      (2) I have the same concern regarding the inadvertent purification of cells that were not derived from endothelial cells in the context of the bulk RNA-seq experiment (Figure S4), especially given the sample-to-sample variability in gene expression in the RP34D, eGFP<sup>+</sup> non-ECs-group (e.g., only 2/5 samples are enriched for mesenchymal transcription factor Tbx18, only 1/5 samples are enriched for mural cell TF Heyl). If the sorted eGFP<sup>+</sup> non-ECs were pericytes, I would expect a strong and consistent pericyte-like gene expression profile.

      This is an interesting question.

      Indeed, significant differences were observed in the expression of pericyte-related transcriptional profiles within the eGFP<sup>+</sup> non-ECs group. For instance, transcription factors such as Hic1 and Fosl1 were nearly absent in the eGFP<sup>+</sup> non-ECs group. We propose several potential explanations for these observations:

      (1) The sorted eGFP<sup>+</sup> non-ECs group may contain other cell types, leading to contamination.

      (2) The eGFP<sup>+</sup> non-ECs group may not uniformly express all pericyte-related transcriptional profiles.

      (3) The temporal dynamics of transcription factor expression (i.e., different factors being expressed at different stages) could contribute to the observed variability.

      (4) The heterogeneity in the timing of endothelial-to-pericyte transformation (i.e., some cells have already transformed into pericytes while others are in the process of transformation at the early stage) may result in significant differences in transcriptional profiles.

      (3) The authors use immunohistochemistry to understand localization, morphology, and marker expression of eGFP<sup>+</sup> cells in situ. The representative "E-pericytes" shown in Figure 3A-D are not associated with blood vessels, and the authors' quantification also shows that the majority of such cells are not vessel-associated ("avascular"). By definition, pericytes are a component of blood vessels and are embedded within the vascular basement membrane. Thus, concluding that these cells are pericytes ("E-pericytes") may be erroneous.

      Yes, we found that 72.2% of E-pericytes were free and not associated with blood vessels. Normally, pericytes surround blood vessels and connect to endothelial cells. However, in certain diseases, such as Alzheimer's disease, stroke, and diabetic encephalopathy, pericytes can detach from blood vessels. In our stroke model, we observed that pericytes detach from blood vessels. This phenomenon can be explained by two possible scenarios:

      (1) After endothelial cells transform into E-pericytes, the E-pericytes detach from blood vessels due to the pathological environment following stroke.

      (2) After stroke, blood vessel function is impaired, leading to vascular degeneration. Endothelial cells shed from the blood vessels and subsequently transform into E-pericytes.

      Therefore, preventing pericyte detachment from blood vessels after stroke represents an important scientific challenge.

      (4) CD13 flow cytometry and immunohistochemistry are used extensively to identify pericytes. In the context of several complementary lineage tracing strategies noted in Strength #2, CD13 immunohistochemistry is the only marker used to identify putative pericytes (Figure S3J-M). In stroke, CD13 is not specific to pericytes; dendritic cells and other monocyte-derived cells express CD13 (Anpep) in mouse brain after stroke (PMID: 38177281, https://anratherlab.shinyapps.io/strokevis/).

      We thank the reviewer for their valuable input. In the context of stroke, CD13 is not specific to pericytes. Additionally, pericytes lack a single specific marker; instead, their identity is determined by a combination of multiple markers. To more convincingly validate the identity of pericytes, it is necessary to incorporate additional pericyte markers alongside several complementary lineage tracing strategies.

      (5) The authors conclude that "EC-specific overexpression of the Tgfbr2 protein by a virus (Tgfbr2) decreases Evans blue leakage, promotes CBF recovery, alleviates neurological deficits and facilitates spontaneous behavioral recovery after stroke by increasing the number of E-pericytes." All data in Figure 10, however, compare endothelial Tgfbr2 overexpression to a DsRed overexpression control. There is no group in which Tgfbr2 is overexpressed but "E-pericytes" are eliminated with DTA (this is done in Figure 9B, but this experiment lacks the Tgfbr2 overexpression-only control). Thus, the observed functional outcomes cannot be ascribed to "E-pericytes"; it remains possible that endothelial Tgfbr2 overexpression affects EB leakage, CBF, and behavior through alternative mechanisms.

      We thank the reviewer for their valuable comment. Although in Figures 9A-B, we observed no significant difference in Evans blue leakage between the Tgfbr2 overexpression group and the Tgfbr2 overexpression + DTA group (P=0.8153), this suggests that the impact of Tgfbr2 overexpression on the blood-brain barrier (BBB) is primarily attributed from the E-pericytes generated by Tgfbr2 expression. Furthermore, in Figure 10A, the inclusion of the Tgfbr2 overexpression + DTA group would provide stronger evidence that the effects of Tgfbr2 overexpression on the BBB and neurobehavioral outcomes are mainly due to the E-pericytes derived from Tgfbr2 expression.

      (6) Single-cell and bulk RNA-seq data are not available in a public repository (such as GEO). Depositing these data would facilitate their independent reevaluation and reuse.

      Thank you for the suggestion and we have uploaded Single-cell and bulk RNA-seq data (The assignment of GEO number is pending).

      Reviewer #3 (Public review):

      Summary:

      The data and experiments presented in that study convincingly show that a subpopulation of endothelial cells undergo transformation into pericyte-like cells after stroke in mice. These so-called "E-pericytes" are protective and might present a new target for stroke recovery. The authors used a huge battery of different techniques and modified signaling pathways and cellular interactions using several genetic and pharmacological tools to show that TGFbeta and EndoMT are causes of this transformation.

      Strengths:

      The amount of different genetic and pharmacological approaches in combination with sophisticated techniques such as single-cell RNAseq is impressive and convincing. The results support their conclusions and the authors achieved their aims. The findings will strongly impact the field of cerebrovascular recovery after stroke and might open up new therapeutic targets.

      Weaknesses:

      The written and graphic presentation of the findings needs substantial improvement. Language editing is strongly recommended (there are a lot of spelling and grammatical errors in the text and illustrations, including legends).

      Thank you for raising this important point and we will place greater emphasis on the written and graphic presentation of the findings.

      Recommendations for the authors:

      Reviewer #1 (Recommendations for the authors):

      In this study, Li et al. reported that endothelial cells in the brain can differentiate into pericytes to promote the restoration of blood-brain barrier (BBB) function after stroke. Understanding the mechanisms underlying BBB restoration post-stroke is crucial to the field. Using lineage tracing, RNA sequencing (RNA-seq), and immunostaining, Li et al. detected the transdifferentiation of endothelial cells (ECs) into E-pericytes in the middle cerebral artery occlusion (MCAO) model. The specific knockout of Tgfbr2 in ECs reduced the number of E-pericytes, exacerbated BBB leakage, and worsened neurological deficits. This observation of EC to pericyte differentiation is novel; however, the conclusions at this stage are not fully supported by the evidence provided.

      (1) The authors claimed, based on the EdU assay, that 12.9% of pericytes present at RP34D originated from self-proliferation, while the origin of the remaining 27.6% of new pericytes remains unclear. This raises concerns, as the EdU assay is not 100% efficient in detecting all proliferating cells. If EdU<sup>+</sup> ECs account for fewer than 10% of all ECs, it follows that other EdU-ECs must have alternative origins.

      That is an interesting question. To address this issue, we need to consider the following aspects:

      (1) The EdU assay is not 100% efficient in detecting all proliferating cells, which means that the actual proportion of proliferating pericytes may be higher than 12.9%, while the proportion of pericytes from other sources may be lower than 27.6% (as determined by FACS). This is consistent with the observation in Figure 3H (immunofluorescence analysis), where EGFP<sup>+</sup> pericytes accounted for only 24.5% of all pericytes.

      (2) The dose of EdU administered in our study was relatively high (200 mg/kg, intraperitoneal injection, daily), which may increase the efficiency of EdU labeling.

      (3) When EdU<sup>+</sup> endothelial cells (ECs) constitute less than 10% of all ECs, it does suggest that EdU-ECs could be a source of pericytes. However, at least EdU<sup>+</sup> ECs cannot transform into pericytes, as we did not detect any EdU<sup>+</sup>EGFP<sup>+</sup> pericytes.

      (2) The reference for Cdh5CreERT2 is cited as 25, which is a review article published in ATVB. This review lists many different drivers, and the specific Cdh5CreERT2 line used in this study is not identified. This specificity is critical for accurate lineage tracing of ECs.

      Although the review I mentioned did not address this, the specificity of Cdh5CreERT2 in the brain has been demonstrated in other studies (Boyé K, et al. Nat Commun. 2022 Mar 4;13(1):1169; Patel A, et al. Proc Natl Acad Sci U S A. 2024 Dec 3;121(49):e2322124121). We have further confirmed that Cdh5CreERT2 specifically labels endothelial cells in the brain parenchyma (Figure S1). Additionally, we found nonspecific labeling in the blood (less than 1% CD45+ blood cells, primarily myeloid cells) and meninges outside the brain parenchyma. We ruled out nonspecific transdifferentiation labeling in the blood through bone marrow reconstitution experiments and in the meninges using in vivo two-photon imaging (results not shown).

      (3) The scRNA-seq data should include GFP signals to track the increasing number of pericytes from early to late stages post-injury. This is the only independent method from staining to verify that the pericytes are indeed derived from GFP<sup>+</sup> ECs after brain injury. Sham samples should be utilized as strict side-by-side controls.

      This is a valuable suggestion. We observed that, despite being positive for EGFP protein, only 50% of the sorted cells expressed the EGFP gene at the transcriptome level. This phenomenon has also been reported in other studies (Rodor J,et al a. Cardiovasc Res. 2022 Aug 24;118(11):2519-2534.). For these reasons, we did not rely on GFP signals to track the increase in pericyte numbers from early to late stages post-injury.

      (4) Since Ai47 is employed, there are three different variants of green fluorescent proteins, including ZsGreen, which may result in signals being spotted in the staining. The GFP signal detected could also represent dead cells that have lost CD31 expression.

      The detected GFP signal could also originate from dead cells that have lost CD31 expression, which is a plausible explanation. As shown in Figure 3I, EGFP<sup>+</sup> non-ECs peak at RP14D and then decline, suggesting that some EGFP<sup>+</sup> non-ECs either die or revert to endothelial cells (ECs). Therefore, it cannot be ruled out that we captured some dead EGFP<sup>+</sup> non-ECs; however, as indicated in Figure 3I, this proportion is likely less than 25%. Additionally, pericytes are prone to death in ischemic and hypoxic environments (Figure 1A), which explains why some of the transformed EGFP<sup>+</sup> non-ECs may die. Nevertheless, at RP514D, we can still detect EGFP<sup>+</sup> non-ECs, indicating that a subset of these cells can survive for an extended period (Figure S3F).

      (5) The quality of the staining images is not convincing, as some non-ECs and ECs are in close proximity, leading to potential artifacts in signal interpretation. The reviewer cannot rely solely on single staining techniques to be convinced of EC differentiation into pericytes. Although it has been reported that ECs can differentiate into pericytes during development, this phenomenon in the adult brain is surprising; thus, more rigorous evidence with strong lineage tracing data should be provided through multiple measurements.

      Why some non-ECs and ECs are located nearby:

      (1) Non-ECs exhibit characteristics of pericytes, which are typically adjacent to ECs.

      (2) Could this proximity lead to potential artifacts in signal interpretation? We believe this is unlikely, as we also observed a significant number of non-ECs located far from ECs on blood vessels (Figure 3A-B, Figure S3M).

      (3) Three pericyte markers (CD13, NG2, and PDGFRβ) were also used to verify the transformed cells, while the three pericyte markers were not expressed in normal endothelial cells.

      (6) FACS (Fluorescence-activated cell sorting) should be employed to quantitatively assess the contribution of GFP<sup>+</sup> ECs to pericytes at each stage after injury, compared to sham controls.

      Yes, if the contribution of GFP<sup>+</sup> ECs to pericytes could be assessed at each time point, the role of E-pericytes in the pericyte pool could be better explained, and the proportion of E-pericytes would become more prominent. In Figure 3, we did not use FACS to evaluate the contribution of GFP<sup>+</sup> ECs to pericytes at each stage post-injury. Instead, we only assessed the ratio of EGFP<sup>+</sup> non-ECs to all EGFP<sup>+</sup> cells. However, we did verify the contribution of GFP<sup>+</sup> ECs (E-pericytes) to pericytes at RP34D using FACS (CD13+ DsRed/CD13 = 25.6%, Figure 4C). This ratio is consistent with the immunofluorescence data (Figure 3H).

      (7) In Tie2Dre;Mfsd2aCrexER;Ai47 mice, ECs in the brain are specifically labeled, indicating that ECs could give rise to CD13+ EGFP<sup>+</sup> non-ECs at RP34D (Figure S3L). However, the GFP signal for Ai47 is not homogeneous, displaying many spotted patterns. Using tdTomato as an alternative for detection could enhance clarity.

      We repeated the experiment using tdTomato as the reporter gene in mice and observed results consistent with those obtained using Ai47 as the reporter gene. For consistency, all results presented are based on Ai47. Regarding the spotted patterns observed with Ai47, this phenomenon can be attributed to the relatively low laser intensity (2%). Higher laser intensity would cause overexposure of EGFP<sup>+</sup> ECs. To address the issue of spotted patterns in Ai47 imaging, we can improve the visualization of complete cell morphology (as shown in Figure S3M) by increasing the gain value, which enhances the background signal.

      (8) The data concerning the genetic ablation of pericytes lacks specificity. There is insufficient evidence to support that DTA is specifically expressed in E-pericytes. The authors should utilize DTR (Diphtheria Toxin Receptor) and confirm that DTR expression is restricted to pericytes derived from GFP<sup>+</sup> ECs. Treatment with diphtheria toxin, but not PBS as a control, should specifically ablate these E-pericytes without affecting any other GFP-pericytes in the brain following injury.

      We did not verify that DTA expression was restricted to E-pericytes. To ensure that DTA is only expressed in converted E-pericytes, we employed two strategies:

      (1) Specific Targeting of Endothelial Cells: We used the AAV-BI30 virus to specifically infect endothelial cells. Although not 100% exclusive, 98.5% of the expression occurred in endothelial cells, with minimal infection in neurons and microglia. Additionally, we combined this with Cdh5CreERT2 to control the DIO action in the virus. This means that only endothelial cells expressing both Cdh5CreERT2 and infected with AAV-BI30 could undergo cell fate changes and transform into pericytes, subsequently expressing markers such as NG2 and driving DTA expression in E-pericytes (Figure 4A).

      (2) Validation of DTA Expression: To prevent off-target expression of DTA in other cell types, we plan to verify DTA protein expression using specific antibodies to confirm whether DTA is expressed in unintended cells. Alternatively, as suggested, we could utilize the Diphtheria Toxin Receptor (DTR) system. By ensuring that DTR expression is restricted to pericytes derived from GFP<sup>+</sup> ECs, treatment with diphtheria toxin would specifically ablate these E-pericytes without affecting other GFP- pericytes in the brain post-injury.

      (9) There is currently no convincing genetic data demonstrating that Tgfb signaling overexpression or deletion modulates the transdifferentiation of ECs to pericytes.

      Yes, this is an important consideration. Although we knocked out the TGFβ receptor in endothelial cells (ECs) and observed a reduction in the formation of E-pericytes (Figure 6D and 6G), it would be more informative to specifically knockout the Tgfb gene in myeloid cells or monocyte-macrophage lineages to determine whether these cells are the primary source of TGFβ driving endothelial cell transformation. Additionally, injecting TGFβ protein directly into the brains of mice could help explore whether exogenous TGFβ promotes the formation of E-pericytes.

      Reviewer #2 (Recommendations for the authors):

      (1) Figure 1D, there does not appear to be a clear PDGFRβ-positive population. In this case, it is necessary to include the negative control that served as the basis for drawing the positive gate.

      Author response image 1 below show the negative control for CD31 and PDGFRβ.

      Author response image 1.

      (2) Figures 3A-D, Figures S3J-M, the authors statistically compare % negative to % positive. It appears % negative = 100% - % positive. If this is the case, these groups are not independent and should not be statistically compared.

      This is a very important point, and such a comparison is not appropriate. The statistical comparison mentioned above has now been removed.

      (3) Figure 4B, in addition to the cells indicated with arrows, there is a substantial additional DsRed+ signal of similar intensity in this image. It would be helpful to show a negative control.

      Author response image 2 below show the contralateral and ipsilateral, respectively. In the contralateral, DsRed has few signals, no complete cell morphology, and is separated from the Hoechst+ nucleus. in the ipsilateral, DsRed signals are strong, have intact cell morphology, and are tightly bound to the Hoechst+ nucleus. In the ipsilateral, some DsRed signals may come from dying cells.

      Author response image 2.

      (4) Figure 6G, the y-axis title is "E-pericytes/all EGFP<sup>+</sup> cells (%)" but the y-axis scale goes from 0 to 900. Is this an error?

      Thank you. We want to calculate the number of pericytes per unit area, it should be E-pericyte/mm2.

      (5) Figure 9B, in the representative images, the 6th group is labeled "Tgfb2 + DTA" but in the plot below, the 6th group is labeled Tgfbr2 + DsRed. Which is correct?

      Thank you. The "Tgfb2 + DTA" is right. We have changed it to "Tgfb2 + DTA" in the 6th group, Figure 9B.

      (6) Figure S1I, error bars and/or individual data points should be shown.

      The purpose of this diagram is to demonstrate the number of mice in which EGFP<sup>+</sup> cells are 100% co-labeled with endothelial markers (CD31, ERG, GLUT1, and VE-Cadherin), as EGFP<sup>+</sup> cells are exclusively found in endothelial cells within the brain parenchyma. Additionally, the diagram illustrates the number of mice in which EGFP<sup>+</sup> cells show no co-labeling (0%) with mural cell markers (CD13, PDGFRβ, α-SMA, and NG2), as EGFP<sup>+</sup> cells are not present in mural cells within the brain parenchyma.

      (7) The authors write: "When Tgfbr2 was overexpressed and DTA was expressed specifically in the same ECs, DTA prevented the EC-specific overexpression of the Tgfbr2 gene and increased the proportion of E-pericytes.". The authors' strategy for DTA expression involves the NG2 promoter, which, in principle, is not active in ECs. Thus how can DTA be "expressed specifically in the same ECs" and how can DTA "prevent EC-specific overexpression" of Tgfbr2?

      Our purpose is not clearly expressed. The statement should be revised to: “When Tgfbr2 was overexpressed to increase E-pericytes and DTA was expressed in transformed cells to deplete E-pericytes, we found that there was no significant change in the number of E-pericytes in the Tgfbr2 + DTA group compared with the DTA group.”

      (8) The interpretation of Evans blue leakage as "low molecular weight" leakage should be revised since Evans blue binds serum albumin and thus it is the molecular weight of this complex (~67 kDa) that is relevant.

      We agree with the reviewer. Yes, it should not be stated that Evans blue is low molecular weight, as it binds to serum albumin to form complexes. The text has been revised to: “Interestingly, no obvious leakage of dextran-rhodamine B (~70 kDa) (Figure S8C) or Texas Red (~71 kDa) was detected (Figure S8D). However, the elimination of E-pericytes allowed evans blue and trypan blue to cross the blood-brain barrier (BBB).”

      (9) It is critical that the sequencing data be made available through a public repository (such as GEO).

      Thank you. Now we've uploaded it to GEO.

      (10) It would be extremely helpful if the authors would make their viral plasmids available through a public repository (such as Addgene).

      Thank you. Now we've uploaded it to Addgene (The assignment of Addgene number is pending).

      Reviewer #3 (Recommendations for the authors):

      (1) The distribution and expression of pericytic and fibroblast markers at different time points after stroke is confusing while reading the manuscript, e.g., vimentin is not expressed on day 34 but on day 8, whereas CD13 is expressed on day 34 but not on day 8, if I understood the text correctly. To make it easier to follow, the authors could add a label of the day after stroke to each of the subfigures which show images and co-expression of different markers (e.g. Figures 3 and S3).

      Below are the expressions of different specific markers in each cell.

      “√” stand for positive, “×” stand for positive

      Author response table 1.

      (2) The authors need to check the N numbers again, e.g., Figure S3L: 4 dots per group are shown in the graph but an N of 3 is mentioned in the legend.

      Thank you for raising this important point. N=4 has been corrected in the legend of Figure 3S. We also checked other N numbers.

      (3) Labelling of graphs should be consistent (e.g., S4C: "I-ECs" vs. S4F: "Ipsi-ECs") and correct (e.g., "DsRed" instead of "DeRed" in Figure 4B).

      Yes, we need a uniform name with "Ipsi-ECs" and "DsRed". Thank you.

      (4) Figure 4: In the text, the injection is described to be done on day 34 whereas in Figure 4A the injections are described to take place before MCAO, please clarify. Does day 34 mean 34 days after injection or after MCAO (as in the former experiments)?

      In the text, the sentence, “Then we used AAV2/9-BI30-NG2 promoter-DIO-DTA (DTA) to deplete E-pericytes at RP34D (Figure 4D),” could be misinterpreted as suggesting that the virus was injected at RP34D. To avoid confusion, it has been revised to: “We used the AAV2/9-BI30-NG2 promoter-DIO-DTA (DTA) virus, which was injected before MCAO (Figure 4A), to deplete E-pericytes (Figure 4D).” Yes, day 34 means 34 days after injection or after MCAO and we unify to 34 days.

      (5) Some images are too dark to recognize clear structures and prove the findings (e.g., Figure S6B).

      Thank you for raising this important point.

      (6) There is no Figure S8D (as mentioned in the text).

      Thank you for raising this important point. This problem has been corrected.

      (7) Figure S9: the text only states, that Tgfbr2 overexpression increases CBF recovery and effective perfusion. Also with the legend, it is not clear what was done and measured, especially in Figure S9B - what do the graphs show? Also, the y-axis labeling is missing for the traces.

      In Figure S9A, we assessed changes in blood flow using laser speckle imaging. Laser speckle imaging relies on random interference patterns formed by scattered light when a laser strikes tissue. Moving red blood cells alter the contrast of the speckle pattern: faster blood flow results in quicker speckle changes and lower contrast, while slower blood flow leads to slower speckle changes and higher contrast. By analyzing these changes in speckle contrast, blood flow dynamics can be evaluated in real-time and non-invasively.

      In Figure S9B, we measured blood flow changes using Laser Doppler flowmetry. When a laser interacts with flowing blood, the moving red blood cells scatter the light, causing a frequency shift (Doppler shift). Faster blood flow results in a greater frequency shift, while slower blood flow leads to a smaller frequency shift. By detecting the frequency shift of the scattered light, blood flow velocity and changes can be measured in real time and non-invasively. In Laser Doppler Flowmetry (LDF), the unit of the vertical axis is typically Perfusion Units (PU). PU is a relative unit used to represent changes in blood flow rather than absolute blood flow velocity. These methods have now been further explained in the diagram.

      (8) Which regions of the brain were used to take images (e.g., to count neurons)?

      We captured images and quantified neurons in the cortex and striatum of the brain. Our statistical analysis further demonstrated that, at RP34D, the presence of E-pericytes in the brain does not exhibit region-specificity. Instead, the formation of E-pericytes is driven by TGFβ1, which is regulated by immune cells. Ultimately, the distribution and activity of these immune cells are influenced by the severity of ischemia and hypoxia.

      (9) The sentence "Protein C receptor-expressing (Procr+) ECs could give rise to de novo formation of ECs and pericytes in the mammary gland13." is repeated almost identically in three different places in the text. However, whether Procr+ cells are involved in the described transdifferentiation or whether "E-pericytes" do express the protein C receptor is not shown and needs additional investigation.

      The reason for referencing this literature is to highlight that endothelial cells (ECs) during breast development can give rise to pericytes, which serves as background knowledge supporting our research. To further explore this phenomenon in brain, we used ProcrCreERT2;Ai47 mice subjected to MCAO (middle cerebral artery occlusion) to investigate whether Procr+ ECs could transform into pericytes, similar to what occurs in mammary glands. However, since ProcrCreERT2 labels not only ECs but also pericytes in the brain, the results did not achieve our goal and were therefore not included in the study.

    1. eLife Assessment

      This paper provides a useful systematic quantification of the relationship between electrophysiological response properties of single neurons with their position in the brain. The quality of the classification setup is high and the methodology is solid.

    2. Reviewer #1 (Public review):

      Summary:

      The paper by Tolossa et al. presents classification studies that aim to predict the anatomical location of a neuron from the statistics of its in-vivo firing pattern. They study two types of statistics (ISI distribution, PSTH) and try to predict the location at different resolutions (region, subregion, cortical layer).

      Strengths:

      This paper provides a systematic quantification of the single-neuron firing vs location relationship.

      The quality of the classification setup seems high.

      The paper uncovers that, at the single neuron level, the firing pattern of a neuron carries some information on the neuron's anatomical location, although the predictive accuracy is not high enough to rely on this relationship in most cases.

      Weaknesses:

      As the authors mention in the Discussion, it is not clear whether the observed differences in firing is epiphenomenal. If the anatomical location information is useful to the neuron, to what extent can this be inferred from the vicinity of the synaptic site, based on the neurotransmitter and neuromodulator identities? Why would the neuron need to dynamically update its prediction of the anatomical location of its pre-synaptic partner based on activity when that location is static, and if that information is genetically encoded in synaptic proteins, etc (e.g., the type of the synaptic site)? Note that the neuron does not need to classify all possible locations to guess the location of its pre-synaptic partner because it may only receive input from a subset of locations. Ultimately, the inability to dissect whether the paper's findings point to a mechanism utilized by neurons or merely represent an epiphenomenon is the main weakness of the curious, though somewhat weak, observations described in this paper.

    3. Reviewer #2 (Public review):

      Summary:

      In this manuscript, Tolossa et al. analyze Inter-spike intervals from various freely available datasets from the Allen Institute and from a dataset from Steinmetz et al.. They show that they can modestly decode between gross brain regions (Visual vs. Hippocampus vs. Thalamus), and modestly separate sub areas within brain regions (DG vs. CA1 or various visual brain areas). The core result is that a multi-layer perceptron trained on the ISI distributions can modestly classify different brain areas and perhaps in a reasonably compelling way generalize across animals. The result is interesting but the exact problem formulation still feels a tad murky to me because I am worried the null is a strawman and I'm unsure if anyone has ever argued for this null hypothesis ("the impact of anatomy on a neuron's activity is either nonexistent or unremarkable"). Given the patterns of inputs to different brain areas and the existence of different developmental origin and different cell types within these areas, I am unclear why this would be a good null hypothesis. Nevertheless, the machine learning is reasonable, and the authors demonstrate that a nonlinear population based classifier can pull out reasonable information about the brain area and layer.

      Strengths:

      The paper is reasonably well written, and the definitions are quite well done. For example, the authors clearly explained transductive vs. inductive inference in their decoders. E.g., transductive learning allows the decoder to learn features from each animal, whereas inductive inference focuses on withheld animals and prioritizes the learning of generalizable features. The authors walk the reader through various analyses starting as simply as PCA, then finally showing a MLP trained on ISI distributions and PSTHs performs modestly well in decoding brain area. The key is ISI distributions work well in inductive settings for generalizing from one mouse to the other.

      Weaknesses:

      As articulated in my overall summary, I still found the null hypothesis a tad underwhelming. I am not sure this is really a valid null hypothesis ("the impact of anatomy on a neuron's activity is either nonexistent or unremarkable"), although in the statistical sense it is fine. The authors took on board some of the advice from the first review and clarified the paper but there are portions that are unnecessarily verbose (e.g., "Beyond fundamental scientific insight, our findings may be of benefit in various practical applications, such as the continued development of brain-machine interfaces and neuroprosthetics"). Also, given that ISIs cannot separate between visual areas, why is the statement that these are conserved. I still find it somewhat underwhelming that the thalamus, hippocampus , and visual cortex have different ISI distributions. Multiple researchers have reported similar things in cortex perhaps without the focus on decoding area from these ISI distributions.

      All in all, it is an interesting paper with the notion that ISI distributions can modestly predict brain area and layer. It could have some potential for a tool for neuropixels, although this needs to be developed further for this use case.

    4. Author response:

      The following is the authors’ response to the original reviews

      Reviewer #1 (Recommendations for the authors):

      We appreciate the reviewers' thoughtful comments and suggestions. Below, we provide point-by-point responses to the recommendations and outline the updates made to the manuscript.

      (1) Discussion, "the obvious experiment is to manipulate a neuron's anatomical embedding while leaving stimulus information intact."] The epiphenomenon can arise from the placement and types of a neuron's neurotransmitters and neuromodulators, too.

      The content of vesicles released by a neuron is obviously of great importance in determining postsynaptic impact. However, we’re suggesting that (assuming vesicular content is held constant) the anatomically-relevant patterning of spiking might additionally affect the postsynaptic neuron’s integration of the presynaptic input. To avoid confusion, we updated the text accordingly: “the obvious experiment is to manipulate a neuron's anatomical embedding while minimally impacting external and internal variables, such as stimulus information and levels of neurotransmitters or neuromodulators” (Line 594 - 596).

      (2) “In all conditions, the slope of the input duration versus sensitivity line was still positive at 1,800 seconds (Fig. 3B)". This may suggest that the estimate of the calculated statistics (ISI, PSTH) is more reliable with more data, rather than (or in addition to) specific information being extracted from faraway time points. Another potential confound is the training statistics were calculated from all training data, so the test data is a better match to training data when test statistics are calculated from more data. Overall, the validity of the conclusions following this observation is not clear to me.

      This is a great point. Accordingly, we revised the text to include this possibility: “Because the training data were of similar duration, this could be explained by either of two possibilities. First, the signal is relatively short, but noisy—in this case, extended sampling will increase reliability. Second, the anatomical signal is, itself, distributed over time scales of tens to hundreds of seconds.” (Line 252 - 255).

      (3) "This further suggests that there is a latent neural code for anatomical location embedded within the spike train, a feature that could be practically applied to determining the brain region of a recording electrode without the need for post-hoc histology". The performance of the model at the subregion level, which is a typical level of desired precision in locating cells, does not seem to support such a practical application. Please clarify to avoid confusion.

      The current model should not be considered a replacement for traditional methods, such as histology. Our intention is to convey that, with the inclusion of multimodal data and additional samples, a computational approach to anatomical localization has great promise. We updated the manuscript to clarify this point: “While significantly above chance, the structure-level model still lacks the accuracy for immediate practical application. However, it is highly likely that the incorporation of datasets with diverse multi-modal features and alternative regions from other research groups will increase the accuracy of such a model. In addition, a computational approach can be combined with other methods of anatomical reconstruction.” (Line 355 - 359).

      Additionally, we directly addressed this point in our original manuscript (Discussion section: Line 498 - 505 in the current version). Furthermore, following the release of our preprint, independent efforts have adopted a multimodal strategy with qualitatively similar results (Yu et al., 2024). Other recent work expands on the idea of utilizing single-neuron features for brain region/structure characterization (La Merre et al., 2024).

      Yu, H., Lyu, H., Xu, E. Y., Windolf, C., Lee, E. K., Yang, F., ... & Hurwitz, C. (2024). In vivo cell-type and brain region classification via multimodal contrastive learning. bioRxiv, 2024-11.

      Le Merre, P., Heining, K., Slashcheva, M., Jung, F., Moysiadou, E., Guyon, N., ... & Carlén, M. (2024). A Prefrontal Cortex Map based on Single Neuron Activity. bioRxiv, 2024-11.

      (4) "These results support the notion the meaningful computational division in murine visuocortical regions is at the level of VISp versus secondary areas.". The use of the word "meaningful" is vague and this conclusion is not well justified because it is possible that subregions serve different functional roles without having different spiking statistics.

      Precisely! It is well established that different subregions serve different functional purposes - but they do not necessitate different regional embeddings. It is important to note the difference between stimulus encoding and the embedding that we are describing. As a rough analogy, the regional embedding might be considered a language, while the stimulus is the content of the spoken words. However, to avoid vague words, we revised the sentence to “These results suggest that the computational differentiability of murine visuocortical regions is at the level of VISp versus secondary areas.” (Line 380 - 381)

      (5) Figure 3D left/right halves look similar. A measure of the effect size needs to accompany these p-values.

      We assume the reviewer is referring to Figure 3E. Although some of the violin plots in Figure 3E look similar, they are not identical. In the revision, we include effect sizes in the caption.

      (6) Figure 3A, 3F: Could uncertainty estimates be provided?

      Yes. We added uncertainty estimates to the text (Line 272 - 294) and to the caption of Figure S2, which displays confusion matrices corresponding to Figure 3A. The inclusion of similar estimates for 3F would be so unwieldy as to be a disservice to the reader—there are 240 unique combinations of stimulus parameters and structures. In the context of the larger figure, 3F serves to illustrate a relationship between stimulus, region, and the anatomical embedding.

      (7) Page 21. "semi-orthogonal". Please reword or explain if this usage is technical.

      We replaced “semi-orthogonal” with “dissociable” (Line 549).

      (8) Page 11, "This approach tested whether..."] Unclear sentence. Please reword.

      We changed “This approach tested whether the MLP’s performance depended on viewing the entire ISI distribution or was enriched in a subset of patterns” to “This approach identified regions of the ISI distribution informative for classification” (Line 261).

      Reviewer #2 (Recommendations for the authors):

      We appreciate the reviewer’s comments and summary of the results. We agree that the introductory results (Figs. 1-3) are not particularly compelling when considered in isolation. They provide a baseline of comparison for the subsequent results. Our intention was to approach the problem systematically, progressing from well-established, basic methods to more advanced approaches. This allows us to clearly test a baseline and avoid analytical leaps or untested assumptions. Specifically:

      ● Figure 1 provides an evaluation of the standard dimensionality reduction methods. As expected, these methods yield minimal results, serving as a clear baseline. This is consistent, for example, with an understanding of single units as rate-varying Poisson processes.

      ● Figures 2 and 3 then build upon these results with spiking features frequent in neuroscience literature such as firing rate, coefficient of variation, etc using linear supervised and more detailed spiking features such as ISI distribution using nonlinear supervised machine learning methods.

      By starting from the standpoint of the status quo, we are better able to contextualize the significance of our later findings in Figures 4–6.

      Response to Specific Points in the Summary

      (6) Separability of VISp vs. Secondary Visual Areas

      I found the entire argument about visual areas somewhat messy and unclear. The stimuli used might not drive the secondary visual areas particularly well and might necessitate task engagement.

      We appreciate your feedback that the dissection of visual cortical structures is unclear. To summarize, as shown in the bottom three rows of Figure 6, there is a notable lack of diagonality in visuocortical structures. This means that our model was unable to learn signatures to reliably predict these classes. In contrast, visuocortical layer is returned well above chance, and superstructures (primary and secondary areas) are moderately well identified, albeit still well above chance.

      Consider a thought experiment, if Charlie Gross had not shown faces to monkeys to find IT, or Newsome and others shown motion to find MT and Zeki and others color stimuli to find V4, we would conclude that there are no differences.

      The thought experiment is misleading. The results specifically do not arise from stimulus selectivity—much of Newsome’s own work suggests that the selectivity of neurons in IT etc. is explained by little more than rate varying Poisson processes. In this case, there should be no fundamental anatomical difference in the “language” of the neurons in V4 and IT, only a difference in the inputs driving those neurons. In contrast, our work suggests that the “language” of neurons varies as a function of some anatomical divisions. In other words, in contrast to a Poisson rate code, our results predict that single neuron spike patterns might be remarkably different in MT and IT— and that this is not a function of stimulus selectivity. Notably, the anatomical (and functional) division between V1 and secondary visual areas does not appear to manifest in a different “language”, thus constituting an interesting result in and of itself.

      We regret a failure to communicate this in a tight and compelling fashion on the first submission, but hope that the revision is limpid and accessible.

      Barberini, C. L., Horwitz, G. D., & Newsome, W. T. (2001). A comparison of spiking statistics in motion sensing neurones of flies and monkeys. Motion Vision: Computational, Neural, and Ecological Constraints, 307-320.

      Bair, W., Zohary, E., & Newsome, W. T. (2001). Correlated firing in macaque visual area MT: time scales and relationship to behavior. Journal of Neuroscience, 21(5), 1676-1697.

      Similarly, why would drifting gratings be a good example of a stimulus for the hippocampus, an area thought to be involved in memory/place fields?

      The results suggest that anatomical “language” is not tied to stimuli. It is imperative to recall that neurons are highly active absent experimentally imposed stimuli, such as when an animal is at rest, when an animal is asleep, and when an animal is in the dark (relevant to visual cortices). With this in mind, also recall that, despite the lack of stimuli tailored to the hippocampus, neurons therein were still reliably separable from neurons in seven nuclei in the thalamus, 6 of which are not classically considered visual regions. Should these regions (including hippocampus) have been inert during the presentation of visual stimuli, there would have been very little separability.

      (7) Generalization across laboratories

      “[C]omparison across laboratories was somewhat underwhelming. It does okay but none of the results are particularly compelling in terms of performance.

      Any result above chance is a rejection of the null hypothesis: that a model trained on a set of animals in Laboratory A will be ineffective in identifying brain regions when tested on recordings collected in Laboratory B (in different animals and under different experimental conditions). As an existence proof, the results suggest conserved principles (however modest) that constrain neuronal activity as a function of anatomy. That models fail to achieve high accuracy (in this context) is not surprising (given the limitations of available recordings)---that models achieve anything above chance, however, is.

      Thus, after reading the paper many times, I think part of the problem is that the study is not cohesive, and the authors need to either come up with a tool or demonstrate a scientific finding.

      We demonstrate that neuronal spike trains carry robust anatomical information. We developed an ML architecture for this and that architecture is publicly available.

      They try to split the middle and I am left somewhat perplexed about what exact scientific problem they or other researchers are solving.

      We humbly suggest that the question of a neurons “language” is highly important and central to an understanding of how brains work. From a computational perspective, there is no reason for a vast diversity of cell types, nor a differentiation of the rules that dictate neuronal activity in one region versus another. A Turing Complete system can be trivially constructed from a small number of simple components, such as an excitatory and inhibitory cell type. This is the basis of many machine learning tools.

      Please do not confuse stimulus specificity with the concept of a neuron’s language. Neurons in VISp might fire more in response to light, while those in auditory cortex respond to sound. This does not mean that these neurons are different - only that their inputs are. Given the lack of a literature describing our main effect—that single neuron spiking carries information about anatomical location—it is difficult to conclude that our results are either commonplace or to be expected.

      I am also unsure why the authors think some of these results are particularly important.

      See above.

      For instance, has anyone ever argued that brain areas do not have different spike patterns?

      Yes. In effect, by two avenues. The first is a lack of any argument otherwise (please do not conflate spike patterns with stimulus tuning), and the second is the preponderance of, e.g., rate codes across many functionally distinct regions and circuits.

      Is that not the premise for all systems neuroscience?

      No. The premise for all systems neuroscience (from our perspective) is that the brain is a) a collection of interacting neurons and b) the collective system of neurons gives rise to behavior, cognition, sensation, and perception. As stated above, these axiomatic first principles fundamentally do not require that neurons, as individual entities, obey different rules in different parts of the brain.

      I could see how one could argue no one has said ISIs matter but the premise that the areas are different is a fundamental part of neuroscience.

      Based on logic and the literature, we fundamentally disagree. Consider: while systems neuroscience operates on the principle that brain regions have specialized functions, there is no a priori reason to assume that these functions must be reflected in different underlying computational rules. The simplest explanation is that a single language of spiking exists across regions, with functional differences arising from processing distinct inputs rather than fundamentally different spiking rules. For example, an identical spike train in the amygdala and Layer 5 of M1 would have profoundly different functional impacts, yet the spike timing itself could be identical (even as stimulus response). Until now, evidence for region-specific spiking patterns has been lacking, and our work attempts to begin addressing this gap. There is extensive further work to be conducted in this space, and it is certain that models will improve, rules will be clarified, and mechanisms will be identified.

      Detailed major comments

      (1) Exploratory trends in spiking by region and structure across the population:

      The argument in this section is that unsupervised analyses might reveal subtle trends in the organization of spiking patterns by area. The authors show 4 plots from t-SNE and claim to see subtle organization. I have concerns. For Figure 1C, it is nearly impossible to see if a significant structure exists that differentiates regions and structures. So this leads certain readers to conclude that the authors are looking at the artifactual structure (see Chari et al. 2024) - likely to contribute to large Twitter battles. Contributing to this issue is that the hyperparameter for tSNE was incorrectly chosen. I do think that a different perplexity should be used for the visualization in order to better show the underlying structure; the current visualization just looks like a single "blob". The UMAP visualizations in the supplement make this point more clearly. I also think the authors should include a better plot with appropriate perplexity or not include this at all. The color map of subtle shades of green and yellow is hard to see as well in both Figure S1 and Figure 1.

      In response to the feedback, we replaced t-SNE/UMAP with LDA, while keeping PCA for dimensionality reduction.

      As stated in the original methods, t-SNE/UMAP hyperparameters were chosen based on the combination that led to the greatest classifiable separability of the regions/structures in the space (across a broad range of possible combinations). It just so happens that the maximally separable structure from a regions/structures perspective is the “blob”. This suggests that perhaps the predominant structure the t-SNE finds in the data is not driven by anatomy. If we selected hyperparameters in some other way that was not based specifically on regions/structures (e.g. simple visual inspection of the plots) the conformation would of course be different and not blob-like. However, we removed the t-SNE and UMAP to avoid further confusion.

      The “muddy appearance” is not an issue with the color map. As seen in Figure 1B, the chosen colors are visibly distinct. Figure 1C (previous version) appeared muddy yellow/green because of points that overlap with transparency, resulting in a mix of clearly defined classes (e.g., a yellow point on top of a blue point creating green). This overlap is a meaningful representation of the separability observed in this analysis. We also tried using 2D KDE for visualization, but it did not improve the impression of visual separability.

      We are removing p-values from the figures because they lead to the impression that we over-interpret these results quantitatively. However, we calculated p-values based on label permutation similar to the way R2 suggests (see previous methods). The conflation with the Wasserstein distances is an understandable misunderstanding. These are unrelated to p-values and used for the heatmaps in S1 only (see previous methods).

      Instead of p-values, we now use the adjusted rand index, which measures how accurately neurons within the same region are clustered together (see Line 670 - 671, Figure 1C, and Figure S1) (Hubert & Arabie 1985). This quantifies the extent to which the distribution of points in dimensionally-reduced space is shaped by region/structure.

      Hubert, L., & Arabie, P. (1985). Comparing partitions. Journal of Classification, 2(1), 193–218. https://doi.org/10.1007/BF01908075

      (2) Logistic classifiers:

      The results in this section are somewhat underwhelming. Accuracy is around 40% and yes above chance but I would be very surprised if someone is worried about separating visual structures from the thalamus. Such coarse brain targeting is not difficult. If the authors want to include this data, I recommend they show it as a control in the ISI distribution section. The entire argument here is that perhaps one should not use derived metrics and a nonlinear classifier on more data is better, which is essentially the thrust of the next section.

      As outlined above, our work systematically increases in model complexity. The logistic result is an intermediate model, and it returns intermediate results. This is an important stepping stone between the lack of a result based on unsupervised linear dimensionality reduction and the performance of supervised nonlinear models.

      From a purely utilitarian perspective, the argument could be framed as “one should not use derived metrics, and a nonlinear classifier on more data is better.” However, please see all of our notes above.

      (3) MLP classifiers:

      Even in this section, I was left somewhat underwhelmed that a nonlinear classifier with large amounts of data outperforms a linear classifier with small amounts of data. I found the analysis of the ISIs and which timescales are driving the classifier interesting but I think the classifier with smoothing is more interesting. So with a modest chance level decodability of different brain areas in the visual system, I found it somewhat grandiose to claim a "conserved" code for anatomy in the brain. If there is conservation, it seems to be at the level of the coarse brain organization, which in my opinion is not particularly compelling.

      The sample size used for both the linear and nonlinear classifiers is the same; however, the nonlinear classifier leverages the detailed spiking time information from ISIs. Our goal here was to systematically evaluate how classical spike metrics compare to more detailed temporal features in their ability to decode brain areas. We chose a linear classifier for spike metrics because, with fewer features, nonlinear methods like neural networks often offer very modest advantages over linear methods, less interpretability, and are prone to overfitting.

      Respectfully, we stand by our word choice. The term “conserved” is appropriate given that our results hold appreciably, i.e., statistically above chance, across animals.

      (4) Generalization section:

      The authors suggest that a classifier learned from one set of data could be used for new data. I was unsure if this was a scientific point or the fact that they could use it as a tool.

      It can be both. We are more driven by the scientific implications of a rejection of the null.

      Is the scientific argument that ISIs are similar across areas even in different tasks?

      It appears so - despite heterogeneity in the tuning of single neurons, their presynaptic inputs, and stimuli, there is identifiable information about anatomical location in the spike train.

      Why would one not learn a classifier from every piece of available data: like LFP bands, ISI distributions, and average firing rates, and use that to predict the brain area as a comparison?

      Because this would obfuscate the ability to conclude that spike trains embed information about anatomy.

      Considering all features simultaneously and adding additional data modalities—such as LFP bands and spike waveforms—has potential to improve classification accuracy at the cost of understanding the contribution of each feature. The spike train as a time series is the most fundamental component of neuronal communication. As a result, this is the only feature of neuronal activity of concern for the present investigation.

      Or is the argument that the ISIs are a conserved code for anatomy? Unfortunately, even in this section, the data are underwhelming.

      We appreciate the reviewer’s comments, but arrive at a very different conclusion. We were quite surprised to find any generalizability whatsoever.

      Moreover, for use as a tool, I think the authors need to seriously consider a control that is either waveforms from different brain areas or the local field potentials. Without that, I am struggling to understand how good this tool is. The authors said "because information transmission in the brain arises primarily from the timing of spiking and not waveforms (etc)., our studies involve only the timestamps of individual spikes from well-isolated units ". However, we are not talking about information transmission and actually trying to identify and assess brain areas from electrophysiological data.

      While we are not blind to the “tool” potential that is suggested by our work, this is not the primary motivation or content in any section of the paper. As stated clearly in the abstract, our motivation is to ask “whether individual neurons [...] embed information about their own anatomical location within their spike patterns”. We go on to say “This discovery provides new insights into the relationship between brain structure and function, with broad implications for neurodevelopment, multimodal integration, and the interpretation of large-scale neuronal recordings. Immediately, it has potential as a strategy for in-vivo electrode localization.” Crucially, the last point we make is a nod to application. Indeed, our results suggest that in-vivo electrode localization protocols may benefit from the incorporation of such a model.

      In light of the reviewer’s concerns, we have further dampened the weight of statements about our model as a consumer-ready tool.

      Example 1: The final sentence of the abstract now reads: “Computational approximations of anatomy have potential to support in-vivo electrode localization.”

      Example 2: The results sections now contains the following text: “While significantly above chance, the structure-level model still lacks the accuracy for immediate practical application. However, it is highly likely that the incorporation of datasets with diverse multi-modal features and alternative regions from other research groups will increase the accuracy of such a model. In addition, a computational approach can be combined with other methods of anatomical reconstruction.” (Line 355 - 359).

      Example 3: We replaced the phrase "because information transmission in the brain arises primarily from the timing of spiking and not waveforms (etc) " with the phrase “because information is primarily encoded by the firing rate or the timing of spiking and not waveforms (etc)” (Line 116 - 118).

      (5) Discussion section:

      In the discussion, beginning with "It is reasonable to consider . . ." all the way to the penultimate paragraph, I found the argumentation here extremely hard to follow. Furthermore, the parts of the discussion here I did feel I understood, I heavily disagreed with. They state that "recordings are random in their local sampling" which is almost certainly untrue when it comes to electrophysiology which tends to oversample task-modulated excitatory neurons (https://elifesciences.org/articles/69068). I also disagree that "each neuron's connectivity is unique, and vertebrate brains lack 'identified neurons' characteristic of simple organisms. While brains are only eutelic and "nameable" in only the simplest organisms (C. elegans), cell types are exceedingly stereotyped in their connectivity even in mammals and such connectivity defines their computational properties. Thus I don't find the premise the authors state in the next sentence to be undermined ("it seems unlikely that a single neuron's happenstance imprinting of its unique connectivity should generalize across stimuli and animals"). Overall, I found this subsection to rely on false premises and in my opinion it should be removed.

      At the suggestion of R2, we removed the paragraph in question. However, we would like to address some points of disagreement:

      We agree that electrophysiology, along with spike-sorting, quality metrics, and filtering of low-firing neurons, leads to oversampling of task-modulated neurons. However, when we stated that recordings are random in their local sampling, we were referring to structural (anatomical) randomness, not functional randomness. In other words, the recorded neurons were not specifically targeted (see below).

      Electrode arrays, such as Neuropixels, record from hundreds of neurons within a small volume relative to the total number of neurons and the volume of a given brain region. For instance, the paper R2 referenced includes a statement supporting this: “... assuming a 50-μm ‘listening radius’ for the probes (radius of half-cylinder around the probe where the neurons’ spike amplitude is sufficiently above noise to trigger detection) …, the average yield of 116 regular-spiking units/probe (prior to QC filtering) would imply a density of 42,000 neurons/mm³, much lower than the known density of ~90,000 neurons/mm³ for excitatory cells in mouse visual cortex….”

      If we take the estimated volume of V1 to be approximately 3 mm³, this region could theoretically be subdivided into multiple cylinders with a 100-μm diameter. While stereotaxic implantation of the probe mitigates some variability, the natural anatomical variability across individual animals introduces spatially random sampling. This was the randomness we were referring to, and thus, we disagree with the assertion that our claim is “almost certainly untrue.”

      Additionally, each cortical pyramidal neuron is understood to have ~ 10,000 presynaptic partners. It is highly unlikely that these connections are entirely pre-specified, perfectly replicated within the same animal, and identical across all members of species. Further, there is enormous diversity in the activity properties of even neighboring cells of the same type. Consider pyramidal neurons in V1. Single neuron firing rates are log normally distributed, there are many of combinations of tuning properties (i.e., direction, orientation) that must occupy each point in retinotopic space, and there is powerful experience dependent change in the connectivity of these cells. We suggest that it is inconceivable that any two neurons, even within a small region of V1, have identical connectivity.

      Minor Comments:

      (1) Although the description of confusion matrices is good from a didactic perspective, some of this could be moved to methods to simplify the paper.

      We thank the reviewer for the suggestion. However, given the broad readership of eLife, we gently suggest that confusion matrices are not a trivial and universally appreciated plotting format. For the purpose of accessibility, a brief and didactic 2-sentence description will make the paper far more comprehensible to many readers at little cost to experts.

      (2) Figure 3A: It is concluded in their subsequent figure that the longer the measured amount of time, the better the decoding performance. Thus it makes sense why the average PSTHs do not show significant decoding of areas or structures

      That is a good observation. However, all features were calculated from the same duration of data, except in Figure 3B, where we tested the effect of duration. The averaged PSTH was calculated from the same length of data as the ISI distribution and binned to have the same number of feature lengths as the ISI distribution (refer to Methods section). Therefore, we interpreted this as an indication of information degradation through averaging, rather than an effect of data length (Line 234 - 237).

      (3) Figure 3D: A Gaussian is used to fit the ISI distributions here but ISI distributions do not follow a normal distribution, they follow an inverse gamma distribution.

      We agree with the reviewer and we are familiar with the literature that the ISI distribution is best fitted by a gamma family distribution (as a recent, but not earliest example: Li et al. 2018). However, we did not fit a gaussian (or any distribution) to the data, we just calculated the sample mean and variance. Reporting sample mean and variance (or standard deviation) is not something that is only done for Gaussian distributions. They are broadly used metrics that simply have additional intrinsic meaning for Gaussian distributions. We used the schematic illustration in Fig 3D because mean and variance are much more familiar in Gaussian distribution context, but ultimately that does not affect our analyses in Fig 3 E-F. Alternatively, the alpha and beta intrinsic parameters of a gamma distribution could have been used, but they are known by a much smaller portion of neuroscientists.

      Li, M., Xie, K., Kuang, H., Liu, J., Wang, D., Fox, G. E., ... & Tsien, J. Z. (2018). Spike-timing pattern operates as gamma-distribution across cell types, regions and animal species and is essential for naturally-occurring cognitive states. Biorxiv, 145813(10.1101), 145813.

      (4) Figure 3G: Something is wrong with this figure as each vertical bar is supposed to represent a drifting grating onset but yet, they are all at 5 hz despite the PSTH being purportedly shown at many different frequencies from 1 to 15 hz.

      We appreciate your attention to detail, but we are not representing the onset of individual drifting gratings in this. We just meant to represent the overall start\end of the drifting grating session. We did not intend to signal the temporal frequency of the drifting gratings (or the spatial frequency, orientation, or contrast).

    1. eLife Assessment

      This valuable study provides strong evidence for the development of a penetration ring during Magnaporthe oryzae infection and, supported by knockout and expression studies, shows that Ppe1 is involved in the virulence of the fungus. Although the authors demonstrated the close association of Ppe1 with the host plasma membrane, the work fell short in providing direct evidence for its role at the host-pathogen interface and the precise molecular function of the penetration ring. Therefore, the study presented strong structural and phenotypic characterization but remains incomplete regarding mechanistic insights of Ppe1.

    2. Joint Public Review:

      This study presents novel insights into the formation and characterization of a penetration ring during host infection by Magnaporthe oryzae. Based on the solid genetic evidence and localization data, the authors demonstrate the structural presence of the penetration ring and the contribution of Ppe1 to fungal virulence. Nevertheless, the mechanisms through which the penetration ring influences host-pathogen interaction, including its potential function in effector translocation, remain only partially resolved. Further work using higher-resolution imaging and functional assays will help address this knowledge gap. Overall, the findings are valuable for advancing our understanding of plant-pathogen interactions, though important mechanistic questions remain open.

    3. Author response:

      The following is the authors’ response to the original reviews

      Public Reviews:

      Reviewer #1 (Public review):

      Summary:

      This study focuses on characterizing a previously identified gene, encoding the secreted protein Ppe1, that may play a role in rice infection by the blast fungus Magnaporthe oryzae. Magnaporthe oryzae is a hemibiotrophic fungus that infects living host cells before causing disease. Infection begins with the development of a specialized infection cell, the appressorium, on the host leaf surface. The appressorium generates enormous internal turgor that acts on a thin penetration peg at the appressorial base, forcing it through the leaf cuticle. Once through this barrier, the peg elaborates into bulbous invasive hyphae that colonizes the first infected cell before moving to neighboring cells via plasmodesmata. During this initial biotrophic growth stage, invasive hyphae invaginate the host plasma membrane, which surrounds growing hyphae as the extra-invasive hyphae membrane (EIHM). To avoid detection, the fungus secretes apoplastic effectors into the EIHM matrix via the conventional ER-Golgi secretion pathway. The fungus also forms a plant-derived structure called the biotrophic interfacial complex (BIC) that receives cytoplasmic effectors through an unconventional secretion route before they are delivered into the host cell. Together, these secreted effector proteins act to evade or suppress host innate immune responses. Here the authors contribute to our understanding of M. oryzae infection biology by showing how Ppe1, which localizes to both the appressorial penetration peg and to the appressorial-like transpressoria associated with invasive hyphal movements into adjacent cells, maximizes host cell penetration and disease development and is thus a novel contributor to rice blast disease.

      We sincerely appreciate the reviewer’s thoughtful evaluation of our work. We are grateful for your recognition of Ppe1 as a novel contributor to M. oryzae infection biology and your insightful summary of its spatio-temporal localization and functional importance in host penetration. We also appreciate devoting your time to provide us with constructive feedback, which greatly strengthens our manuscript.

      Strengths:

      A major goal of M. oryzae research is to understand how the fungus causes disease, either by determining the physiological underpinnings of the fungal infection cycle or by identifying effectors and their host targets. Such new knowledge may point the way to novel mitigation strategies. Here, the authors make an interesting discovery that bridges both fungal physiology and effector biology research by showing how a secreted protein Ppe1, initially considered an effector with potential host targets, associates with its own penetration peg (and transpressoria) to facilitate host invasion. In a previous study, the authors had identified a small family of small secreted proteins that may function as effectors. Here they suggest Ppe1 (and, later in the manuscript, Ppe2/3/5) localizes outside the penetration peg when appressoria develops on surfaces that permit penetration, but not on artificial hard surfaces that prevent peg penetration. Deleting the PPE1 gene reduced (although did not abolish) penetration, and a fraction of those that penetrated developed invasive hyphae that were reduced in growth compared to WT. Using fluorescent markers, the authors show that Ppe1 forms a ring underneath appressoria, likely where the peg emerges, which remained after invasive hyphae had developed. The ring structure is smaller than the width of the appressorium and also lies within the septin ring known to form during peg development. This so-called penetration ring also formed at the transpressorial penetration point as invasive hyphae moved to adjacent cells. This structure is novel, and required for optimum penetration during infection. Furthermore, Ppe1, which carries a functional signal peptide, may form on the periphery of the peg, together suggesting it is secreted and associated with the peg to facilitate penetration. Staining with aniline blue also suggests Ppe1 is outside the peg. Together, the strength of the work lies in identifying a novel appressorial penetration ring structure required for full virulence.

      We are deeply grateful to the reviewer for the clear understanding and insightful evaluation of our work. Your recognition of the novel contribution and scientific merit of our study is both encouraging and motivating. We sincerely appreciate the time, expertise and constructive feedback dedicated to reviewing our manuscript, as the comments have been instrumental in enhancing the quality of this work.

      Weaknesses:

      The main weakness of the paper is that, although Ppe1 is associated with the peg and optimizes penetration, the function of Ppe1 is not known. The work starts off considering Ppe1 a secreted effector, then a facilitator of penetration by associating with the peg, but what role it plays here is only often speculated about. For example, the authors consider at various times that it may have a structural role, a signaling role orchestrating invasive hyphae development, or a tethering role between the peg and the invaginated host plasma membrane (called throughout the host cytoplasmic membrane, a novel term that is not explained). However, more effort should be expended to determine which of these alternative roles is the most likely. Otherwise, as it stands, the paper describes an interesting phenomenon (the appressorial ring) but provides no understanding of its function.

      We sincerely appreciate the reviewer’s comments. We have revised "host cytoplasmic membrane" to "host plasma membrane" throughout the manuscript for consistency. To further investigate the role of the Ppe1 in the interaction between M. oryzae and rice, we overexpressed PPE1 in rice ZH11. A pCXUN-SP-GFP-Ppe1 vector containing a signal peptide and an N-terminal GFP tag was constructed (pCXUN-SP-GFP-Ppe1), and 35 GFP-PPE1-OX plants (T0) were subsequently obtained through Agrobacterium-mediated rice transformation. Subsequently, PCR and qRT-PCR validation were performed on the T0 transgenic plants. The PCR results showed that the inserted plasmid could be amplified from the genomic DNA extracted from the leaves of all the resulting T0 plants (Author response image 1A). qRT-PCR results indicated that most T0 transgenic plants could transcriptionally express PPE1 (Author response image 1B). T0 plants with higher expression levels were selected for western blot analysis, which confirmed the presence of GFP-Ppe1 bands of the expected size (Author response image 1C). To further explore the targets of Ppe1 in rice, the leaf sheaths of T0 plants were inoculated with M. oryzae strain Guy11. Total proteins were extracted at 24 hours post-inoculation (hpi) and subjected to immunoprecipitation using GFP magnetic beads. Silver staining revealed more interacting protein bands in T0 plants compared to ZH11 and GFP-OX controls (Author response image 1D). These samples were then analyzed by mass spectrometry in which 331 rice proteins that potentially interact with Ppe1 were identified (Author response image 1E). Subsequently, yeast two-hybrid assays were performed on 13 putative interacting proteins with higher coverage, but no interaction was detected between Ppe1 and these proteins (Author response image 1F-G). Considering that the identification and functional validation of interacting proteins is a labor-intensive and time-consuming endeavor, we will focus our future efforts on in-depth studies of Ppe1's function in rice.

      Author response image 1.

      Screening of Ppe1 candidate targets in rice. (A) The determination of GFP-PPE1 construct in transgenic rice. (B) The expression of PPE1 transgenic rice (T0) was verified by qRT-PCR. (C) Western blot analysis of Ppe1 expression in transgenic rice. (D) Rapid silver staining for detection of the purified proteins captured by the GFP-beads. (E) Venn diagram comparing the number of proteins captured in the different samples. (F) Identity of the potential targets of Ppe1 in rice. (G) Yeast two-hybrid assay showing negative interaction of Ppe1 with rice candidate proteins.

      The inability to nail down the function of Ppe1 likely stems from two underlying assumptions with weak support. Firstly, the authors assume that Ppe1 is secreted and associated with the peg to form a penetration ring between the plant cell wall and cytoplasm membrane. However, the authors do not demonstrate it is secreted (for instance by blocking Ppe1 secretion and its association with the peg using brefeldin A).

      To investigate the secretion pathway of Ppe1 in M. oryzae, we determined the inhibitory effects of Brefeldin A (BFA) on conventional ER-to-Golgi secretion in fungi as suggested by the reviewer. We inoculated rice leaf sheaths with conidia suspensions from the Ppe1-mCherry and PBV591 strains (containing a Pwl2-mCherry-NLS and Bas4-GFP co-expressing constructs) and treated them with BFA. We found that, even after exposure to BFA for 5 to 11 hours, the Ppe1-mCherry still formed its characteristic ring conformation (Author response image 2). Similarly, in the BFA-treated samples, the cytoplasmic effector Pwl2-mCherry accumulated at the BIC, while the apoplastic effector Bas4-GFP was retained in the invasive hyphae (Author response image 2). These results indicate that Ppe1 is not secreted through the conventional ER-Golgi secretion pathway.

      Author response image 2.

      The secretion of Ppe1 is not affected by BFA treatment. (A) and (B) The Ppe1-mCherry fluorescent signal was still observed both in the presence and absence of BFA. (C) Following BFA treatment, the secretion of the apoplastic effector Bas4-GFP was blocked while that of the cytoplasmic effector Pwl2-mCherry was not affected. The rice leaf sheath tissue was inoculated with 50 μg/mL BFA (0.1% DMSO) at 17 hpi. Images were captured at 22 hpi for A and 28 hpi for B and C. Scale bars = 10 µm.

      Also, they do not sufficiently show that Ppe1 localizes on the periphery of the peg. This is because confocal microscopy is not powerful enough to see the peg. The association they are seeing (for example in Figure 4) shows localization to the bottom of the appressorium and around the primary hyphae, but the peg cannot be seen. Here, the authors will need to use SEM, perhaps in conjunction with gold labeling of Ppe1, to show it is associating with the peg and, indeed, is external to the peg (rather than internal, as a structural role in peg rigidity might predict). It would also be interesting to repeat the microscopy in Figure 4C but at much earlier time points, just as the peg is penetrating but before invasive hyphae have developed - Where is Ppe1 then? Finally, the authors speculate, but do not show, that Ppe1 anchors penetration pegs on the plant cytoplasm membrane. Doing so may require FM4-64 staining, as used in Figure 2 of Kankanala et al, 2007 (DOI: 10.1105/tpc.106.046300), to show connections between Ppe1 and host membranes. Note that the authors also do not show that the penetration ring is a platform for effector delivery, as speculated in the Discussion.

      We sincerely appreciate the reviewer's valuable suggestion regarding SEM with immunogold labeling to precisely visualize Ppe1's association with penetration peg. While we fully acknowledge this would be an excellent approach, after consulting several experts in the field, we realized that the specialized equipment and technical expertise required for fungal immunogold-SEM are currently unavailable to us. We sincerely hope that the reviewer will understand this technical limitation.

      To further strengthen our evidence for the role of Ppe1's in anchoring penetration peg to the plant plasma membrane, we provided new co-localization images of Ppe1 and penetration peg (Fig. S7). At 16 hours post-inoculation (hpi), when the penetration peg was just forming and prior to the development of invasive hyphae, the Ppe1-mCherry fluorescence forms a tight ring-like structure closely associated with the base of the appressorium. As at 23 hpi, the circular Ppe1-mCherry signal was still detectable beneath the appressorium, and around the penetration peg which differentiated into the primary invasive hyphae. Furthermore, we obtained 3D images of the strain expressing both Ppe1-mCherry and Lifeact-GFP during primary invasive hyphal development. The results revealed that Ppe1 forms a ring-like structure that remains anchored to the penetration peg during fungal invasion (Fig. S6).

      We also conducted FM4-64 staining experiment as recommended by the reviewer. Although the experiment provided valuable insights, we found that the resolution was insufficient to precisely delineate the spatial relationship between Ppe1 and host membranes at the penetration peg (Author response image 3). To optimize this colocalization, we tested the localization between Ppe1-mCherry ring and rice plasma membrane marker GFP-OsPIP2 (Fig. S8). These new results provide compelling complementary evidence supporting our conclusion that Ppe1 functions extracellularly at the host-pathogen interface. We hope these additional data will help address the reviewer's concerns regarding Ppe1's localization.

      Author response image 3.

      FM4-64-stained rice leaf sheath inoculated with M. oryzae strain expressing Ppe1-GFP. Ppe1-GFP ring was positioned above the primary invasive hyphae. Scale bar = 5 µm.

      Secondly, the authors assume Ppe1 is required for host infection due to its association with the peg. However, its role in infection is minor. The majority of appressoria produced by the mutant strain penetrate host cells and elaborate invasive hyphae, and lesion sizes are only marginally reduced compared to WT (in fact, the lesion density of the 70-15 WT strain itself seems reduced compared to what would be expected from this strain). The authors did not analyze the lesions for spores to confirm that the mutant strains were non-pathogenic (non-pathogenic mutants sometimes form small pinprick-like lesions that do not sporulate). Thus, the pathogenicity phenotype of the knockout mutant is weak, which could contribute to the inability to accurately define the molecular and cellular function of Ppe1.

      We appreciate the reviewer’s comments. To ensure the reliability of our findings, we conducted spray inoculation experiments with multiple independent repeats. Our results consistently demonstrated that deletion of the PPE1 gene significantly attenuates the virulence of M. oryzae. Further analysis of lesion development and sporulation in the Δ_ppe1_ mutant revealed that it retains the ability to produce conidia. To validate these observations, we generated a PPE1 knockout in the wild-type reference strain Guy11. Similarly, we observed a significant decrease in the pathogenicity of the Δ_ppe1_ mutants generated from the wild-type Guy11 strain compared to Guy11 in the spray assay (Fig S2). These results collectively indicate the importance of Ppe1 in the pathogenicity of M. oryzae to rice.

      In summary, it is important that the role of Ppe1 in infection be determined.

      Reviewer #2 (Public review):

      The article focuses on the study of Magnaporthe oryzae, the fungal pathogen responsible for rice blast disease, which poses a significant threat to global food security. The research delves into the infection mechanisms of the pathogen, particularly the role of penetration pegs and the formation of a penetration ring in the invasion process. The study highlights the persistent localization of Ppe1 and its homologs to the penetration ring, suggesting its function as a structural feature that facilitates the transition of penetration pegs into invasive hyphae. The article provides a thorough examination of the infection process of M. oryzae, from the attachment of conidia to the development of appressoria and the formation of invasive hyphae. The discovery of the penetration ring as a structural element that aids in the invasion process is a significant contribution to the understanding of plant-pathogen interactions. The experimental methods are well-documented, allowing for reproducibility and validation of the results.

      We sincerely appreciate the thoughtful and insightful evaluation of our work. Thank you for recognizing the significance of our findings regarding the penetration ring and the functional role of Ppe1 during host invasion.

      Recommendations for the authors:

      Reviewer #1 (Recommendations for the authors):

      Line 48: "after appressorium- or transpressorium-mediated penetration of plant cell wall" - transpressoria do not penetrate the plant cell wall.

      Thank you for your valuable suggestion. For improved clarity, we have rephrased the sentence as follows: In this study, we showed that a penetration ring is formed by penetration pegs after appressorium-mediated penetration of plant cell wall.

      Line 143: "approximately 25% of the 143 appressoria formed by the Δppe1 mutant had no penetration peg" - It is not possible to see the penetration peg by confocal microscopy.

      Thank you for your valuable suggestion. We have revised the sentence as follows: In contrast, approximately 25% of the appressoria formed by the Δ_ppe1_ mutant had no penetration.

      Line 159: "inner cycle" -should be inner circle?

      We gratefully acknowledge the reviewer's careful reading. The typographical error has been corrected throughout the revised manuscript.

      Line 255: "These results indicate that initiation of penetration peg formation is necessary for the formation of the penetration ring." Actually, more precisely, they indicate that penetration is necessary.

      We appreciate this suggestion and have revised the text to be more concise: These results indicate that penetration is necessary for the formation of the penetration ring.

      Line 282: "unlike subcellular localizations of other effectors"- is this an effector if no plant targets are known?

      We appreciate this suggestion and have revised the text as follows: unlike subcellular localizations of Bas4, Slp1, Pwl2, and AvrPiz-t.

      Line 299: "it may function as a novel physical structure for anchoring penetration pegs on the surface of plant cytoplasm membrane after cell wall penetration" - an interaction with the plant plasma membrane was not shown and this is speculative.

      We have provided new evidence to show the spatial positioning of Ppe1-mCherry ring with the rice plasma membrane (see figure S8)

      Line 301: "It is also possible that this penetration ring functions as a collar or landmark that is associated with the differentiation of penetration pegs (on the surface of cytoplasm membrane) into primary invasive hyphae enveloped in the EIHM cytoplasm membrane (Figure 7)." The alternative conclusions for Ppe1 function, either interacting with host membranes or acting as a developmental landmark, need to be resolved here.

      We appreciate this suggestion and have revised the text as follows: It is also possible that this penetration ring functions as a collar that is associated with the differentiation of penetration pegs into primary invasive hyphae enveloped in the EIHM (Figure 7).

      Line 317: "is likely a structural feature or component for signaling the transition of penetration pegs to invasive hyphae",- if the authors think Ppe1 has these roles, why do they refer to Ppe1 as an effector?

      Many thanks for these comments. We have revised this and refer to Ppe1 as a secreted protein throughout the revised manuscript.

      Line 337: "After the penetration of plant cell wall, the penetration ring may not only function as a physical structure but also serve as an initial effector secretion site for the release of specific effectors to overcome plant immunity in early infection stages"- which is it? Also, no evidence is provided to suggest it is a platform for effector secretion.

      We sincerely appreciate your valuable suggestion. We have revised this sentence as follows: After the penetration of plant cell wall, the penetration ring may not only function as a physical structure but also serve as a secretion site for the release of specific proteins to overcome plant immunity during the early infection stages.

      Reviewer #2 (Recommendations for the authors):

      (1) While the study suggests the penetration ring as a structural feature, it remains unclear whether it also serves as a secretion site for effectors. Further exploration of this aspect would strengthen the conclusions.

      We thank the reviewer for this useful suggestion. In this study, we demonstrated that Ppe1 proteins form a distinct penetration ring structure at the site where the penetration peg contacts the plant plasma membrane prior to differentiation into primary invasive hyphae (Figs. 2 and 7). Thus, we reasoned that penetration ring may function as a novel physical structure. Notably, additional Ppe family members (Ppe2, Ppe3, and Ppe5) were also found to localize to this penetration ring (Fig. 6B), suggesting that it also serves as a secretion site for releasing proteins. To test whether Ppe1 and Ppe2 label to the same site, we analyzed the colocalization between Ppe1-GFP and Ppe2-mCherry. The results showed that Ppe1-GFP and Ppe2-mCherry are well colocalized (Author response image 4). This study primarily focuses on the discovery and characterization of the penetration ring. The potential role of this structure in effector translocation will be investigated in future studies.

      Author response image 4.

      Ppe1 co-localizes with Ppe2 at the penetration ring in M. oryzae. Line graphs were generated at the directions pointed by the white arrows. Scale bar = 2μm.

      (2) The article could benefit from a discussion on the broader implications of these findings for developing resistant crop varieties or new fungicidal strategies.

      We have incorporated this discussion as suggested (lines 358-360).

      (3) What is the significance of the formation of the penetration ring in the pathogenicity of the rice blast fungus? Or, how does it assist the fungus in its infection process?

      Our findings have several significant implications. First, we believe that the discovery of the penetration ring as a novel physical structure associated with the differentiation of invasive hyphae represents a breakthrough in plant-pathogen interactions that will be of interest to fungal biologists, pathologists and plant biologists. Secondly, our study presents new role of the peg as a specialized platform for secretory protein deployment, in addition to its commonly known role as a physical penetration tool for the pathogen. Thirdly, we identify Ppe1 as a potential molecular target for controlling the devastating rice blast disease, as Ppe homologs are absent in plants and mammals. We have incorporated this discussion in the revised manuscript (lines 354-362).

    1. eLife Assessment

      This valuable paper explores the idea that transient modulations of neural gain promote switches between distinct perceptual interpretations of ambiguous stimuli. The authors provide solid evidence for this idea by pupillometry (an indirect proxy of neuromodulatory activity), fMRI, neural network modeling, and dynamical systems analyses. The highly integrative nature of this approach is rare in the field.

    2. Reviewer #1 (Public review):

      Summary:

      This paper proposes a neural mechanism underlying the perception of ambiguous images: neuromodulation changes the gain of neural circuits promoting a switch between two possible percepts. Converging evidence for this is provided by indirect measurements of neuromodulatory activity and large-scale brain dynamics which are linked by a neural network model. However, both the data analysis as well as the computational modeling are incomplete and would benefit from a more rigorous approach.

      This is a revised version of the manuscript which, in my view, is a considerable step forward compared to the original submission.

      In particular, the authors now model phasic gain changes in the RNN, based on the network's uncertainty. This is original and much closer to what is suggested by the phasic pupil responses. They also show that switching is actually a network effect because switching times depend on network configuration (Fig 2). This resolves my main comments 1 and 2 about the model.

      The mechanism, as I understand it, is different from what the authors described before in the RNN with tonic gain changes. As uncertainty increases, the network enters a regime in which the two excitatory populations start to oscillate. My intuition is that this oscillation arises from the feedback loop created by the new gain control mechanism. If my intuition is correct, I think it would be worth to explain this mechanism in the paper more explicitly.

      Comments on revisions:

      This is a second revision. I have no further comments. The authors have not answered the question that I had in the previous round (about the origin of oscillations in the RNN). I think this topic deserves to be explored in more detail but perhaps that is beyond the scope of the current paper.

    3. Reviewer #2 (Public review):

      This paper tests the hypothesis that perceptual switches during the presentation of ambiguous stimuli are accompanied by changes in neuromodulation that alter neural gain and trigger abrupt changes in brain activity. To test this hypothesis, the study combines pupillometry, artificial recurrent network (RNN) analysis and fMRI recording. In particular, the study uses methods of energy landscape analysis inspired by physics, which is particularly interesting.

      Strengths<br /> - The authors should be commended for combining different methods (pupillometry, RNNs, fMRI) to test their hypothesis. This combination provides a mechanistic insight into perceptual switches in the brain and artificial neural networks.<br /> - The study combines different viewpoints and fields of scientific literature, including neuroscience, psychology, physics, dynamical systems. In order to make this combination more accessible to the reader, the different aspects are presented in a pedagogical way to be accessible to all fields.<br /> - This combination of methods and viewpoints is rarely done, so it is very useful.<br /> - The authors introduce dynamic gain modulation in their recurrent neural network, which is novel. They devote a section of the paper to studying the dynamics, fixed points and convergence of this type of network.

      Weaknesses<br /> - The study may not be specific to perceptual switches. This is because the study relies on a paradigm in which participants report when they identify a switch in the item category. Therefore, it is unclear whether the effects reported in the paper are related to the perceptual switch itself, to attention, or to the detection of behaviourally relevant events. The authors are cautious and explicitly acknowledge this point in their study.<br /> - The demonstration of the causal role of gain modulation in perceptual switches is partial. This causality is clearly demonstrated in the simulation work with the RNN. However, it is not fully demonstrated in the pupil analysis and the fMRI analysis. One reason is that this work is correlative (which is already very informative).<br /> - Some effects may reflect the expectation of a perceptual switch rather than the perceptual switch itself. To mitigate this risk, the design of the fMRI task included catch trials, in which no switch occurs, to reduce the expectation of a switch. The pupil study, however, did not include such catch trials.<br /> - The paper uses RNN-based modelling to provide mechanistic insight into the role of gain modulation in perceptual switches. However, the RNN solves a task that differs from that performed by human participants, which may limit the explanatory value of the model. The RNN is provided with two inputs characterising the sensory evidence supporting the first and last image category in the sequence (e.g. plane and shark). In contrast, observers in the task don't know in advance the identity of the last image at the beginning of the sequence. The brain first receives sensory evidence about the image category (e.g. plane) with which the sequence begins, which is very easy to recognise, then it sees a sequence of morphed images and has to discover what the final image category will be. To discover the final image category, the brain considers several possibilities for the second images (it is a shark?, a frog?, a bird?, etc.), rather than comparing the likelihood of just two categories. This search process among many alternatives and the perceptual switch in the task is therefore different from the competition between only two inputs in the RNN.<br /> - Another aspect of the motivation for the RNN model remains unclear. The authors introduce dynamic gain modulation in the RNN, but it is not clear what the added value of dynamic gain modulation is. Both static (Fig. S1) and dynamic (Fig. 2F) gain modulation lead to the predicted effect: faster switching when the gain is larger.<br /> - The authors are to be commended for addressing their research questions with multiple tools and approaches. There are links between the different parts of the study. The RNN and the pupil are linked by the notion of gain modulation, the RNN and the fMRI analysis are linked by the study of the energy landscape, the fMRI study and the pupil study are indirectly linked by previous work for this group showing that the peak in LC fMRI activity precedes a flattening of the energy landscape. These links are very interesting but could have been stronger and more complete.

      Comments on revisions:

      I thank the authors for their responses.<br /> My review presents points that the authors themselves present as weaknesses or limitations. It also includes points that cannot be addressed in a revision (e.g. causality).<br /> Regarding the fact that the RNN only considers two categories, whereas subjects consider more categories (because they don't know the final image), I have toned down my remark (removing "markedly" different, removing the fact that the hypothesis space is vast given that participants have some priors). I also removed the qualifier "mechanistically" different, because it can be understood in different ways. The point remains that the proposed model has 2 inputs, the corresponding network in the brain has >2 inputs (because it considers more categories than the RNN), which is different, and which is the point of my remark. I think it may limit the value of the model, but I don't think it is not "sensible".

    4. Author response:

      The following is the authors’ response to the previous reviews

      Reviewer #1 (Public review):

      The mechanism, as I understand it, is different from what the authors described before in the RNN with tonic gain changes. As uncertainty increases, the network enters a regime in which the two excitatory populations start to oscillate. My intuition is that this oscillation arises from the feedback loop created by the new gain control mechanism. If my intuition is correct, I think it would be worth to explain this mechanism in the paper more explicitly.

      While interesting, this intuition is not correct. The oscillations are generated by the interaction between excitatory and inhibitory nodes in the network and occur in the model even with stationary gain. All of the plots in figure 3 exploring the dynamical regime of the network at different input x gain combinations (i.e., where the oscillatory regime is characterised) are simulations run with stationary gain.

      To ensure that this intuition is more clearly presented in the manuscript, we have edited the description in the text.

      P. 12: “Because of the large size of the network, we could not solve for the fixed points or study their stability analytically. Instead, we opted for a numerical approach and characterised the dynamical regime (i.e. the location and existence of approximate fixed-point attractors) across all combinations of (static) gain and  visited by the network.”

      Reviewer #2 (Public review):

      - The demonstration of the causal role of gain modulation in perceptual switches is partial. This causality is clearly demonstrated in the simulation work with the RNN. However, it is not fully demonstrated in the pupil analysis and the fMRI analysis. One reason is that this work is correlative (which is already very informative). An analysis of the timing of the effect might have overcome this limitation. For example, in a previous study, the same group showed that fMRI activity in the LC region precedes changes in the energy landscape of fMRI dynamics, which is a step towards investigating causal links between gain modulation, changes in the energy landscape and perceptual switches.

      Thank you for the suggestion, which we considered in detail. Unfortunately, the  temporal and spatial resolution of the fMRI data collected for this study precluded the same analyses we’ve run in previous work, however this is an important question for future work.

      - Some effects may reflect the expectation of a perceptual switch rather than the perceptual switch itself. To mitigate this risk, the design of the fMRI task included catch trials, in which no switch occurs, to reduce the expectation of a switch. The pupil study, however, did not include such catch trials.

      We agree that this is a limitation of the current study, which we previously highlighted in the methods section.

      - The paper uses RNN-based modelling to provide mechanistic insight into the role of gain modulation in perceptual switches. However, the RNN solves a task that differs markedly from that performed by human participants, which may limit the explanatory value of the model. The RNN is provided with two inputs characterising the sensory evidence supporting the first and last image category in the sequence (e.g. plane and shark). In contrast, observers in the task were naïve as to the identity of the last image at the beginning of the sequence. The brain first receives sensory evidence about the image category (e.g. plane) with which the sequence begins, which is very easy to recognise, then it sees a sequence of morphed images and has to discover what the final image category will be. To discover the final image category, the brain has to search a vast space of possible second images (it is a shark?, a frog?, a bird?, etc.), rather than comparing the likelihood of just two categories. This search process and the perceptual switch in the task appear to be mechanistically different from the competition between two inputs in the RNN.

      We appreciate the critical analysis of the experimental paradigm but disagree with the reviewers conclusions for two keys reasons: 1) Participants prior exposure to the images, such that they could create an expectation about what stimulus category a particular image would transition into (i.e., the image could not switch into any possible category); and 2) even if the reviewers’ concern was founded, models of K winner-take-all decision making are structured identically irrespective of whether the options are 2 or K options all that changes is the simulated reaction times which depend linearly on the K (for an example model see Hugh Wilson’s textbook Spikes, Decisions, and Actions, 1999, p.89-91). For these reasons, we maintain that the RNN is a sensible representation of the behavioural task.

      - Another aspect of the motivation for the RNN model remains unclear. The authors introduce dynamic gain modulation in the RNN, but it is not clear what the added value of dynamic gain modulation is. Both static (Fig. S1) and dynamic (Fig. 2F) gain modulation lead to the predicted effect: faster switching when the gain is larger.

      While we agree that the effect is observable with both static and dynamic gain, the stronger construct validity associated with the dynamic approach, including a stronger link with the observed pupil dynamics and a rich literature associated with modelling the behavioural consequences of surprise/uncertainty led us to the conclusion that the dynamical approach was a better representation of our hypothesis.

      - Fig 1C: I don't see a "top grey bar" indicating significance.

      Thank you for catching this, the caption has been amended. The text was from an older version of the manuscript.

      - p. 10, reference to fig 3F seems incorrect: there is Fig 3F upper and Fig 3F lower, and nothing on Fig 3 and its legend mention the lesion of units

      This has been amended. We meant to refer to 2F.

      - In the response letter you mention a MATLAB tutorial, but I could not find it.

      This has been amended. Github repository can be found at https://github.com/ShineLabUSYD/AmbiguousFigures

    1. eLife Assessment

      In this important study, Baniulyte and Wade provide convincing evidence that translation of a short ORF denoted toiL positioned upstream of the topAI-yjhQP operon is responsive to different ribosome-targeting antibiotics, consequently controlling translation of the TopAI toxin as well as Rho-dependent transcription termination. Strengths of the study include combining a genetic screen to identify 23S rRNA mutations that affect topA1 expression and a creative approach to map the different locations of ribosome stalling within toiL induced by different antibiotics, with ribosome profiling and RNA structure probing by SHAPE to examine consequences of different antibiotics on toiL-mediated regulation. The work leaves unanswered how bacteria benefit by activating expression of the genes using the proposed strategy and the mechanism underlying ToiL's sensing of structurally distinct antibiotics.

    2. Reviewer #1 (Public review):

      Summary:

      The manuscript reports that expression of the E. coli operon topAI/yjhQ/yjhP is controlled by the translation status of a small open reading frame, that authors have discovered and named toiL, located in the leader region upstream of the operon. Authors propose the following model for topAI activation: Under normal conditions, toiL is translated but topAI is not expressed because of Rho-dependent transcription termination within the topAI ORF and because its ribosome binding site and start codon are trapped in an mRNA hairpin. Ribosome stalling at various codons of the toiL ORF, prompted in this work by some ribosome-targeting antibiotics, triggers an mRNA conformational switch which allows translation of topAI and, in addition, activation of the operon's transcription because presence of translating ribosomes at the topAI ORF blocks Rho from terminating transcription. The model is appealing and several of the experimental data mainly support it. However, it remains unanswered what is the true trigger of the translation arrest at toiL and what is the physiological role of the induced expression of the topAI/yjhQ/yjhP operon.

    3. Reviewer #2 (Public review):

      Summary:

      Baniulyte and Wade describe how translation of an 8-codon uORF denoted toiL upstream of the topAI-yjhQP operon is responsive to different ribosome-targeting antibiotics, consequently controlling translation of the TopAI toxin as well as Rho-dependent termination with the gene.

      Strengths:

      The authors used multiple different approaches such as a genetic screen to identify factors such as 23S rRNA mutations that affect topA1 expression and ribosome profiling to examine the consequences of various antibiotics on toiL-mediated regulation.

      Weaknesses: Future experiments will be needed to better understand the physiological role of the toiL-mediated regulation and elucidate the mechanism of specific antibiotic sensing.

      The results are clearly described, and the revisions have helped to improve the presentation of the data.

    4. Reviewer #3 (Public review):

      The authors provide convincing data to support an elegant model in which ribosome stalling by ToiL promotes downstream topAI translation and prevents premature Rho-dependent transcription termination. However, the physiological consequences of activating topAI-yjhQP expression upon exposure to various ribosome-targeting antibiotics remain unresolved. The authors have satisfactorily addressed all major concerns raised by the reviewers, particularly regarding the SHAPE-seq data. Overall, this study underscores the diversity of regulatory ribosome-stalling peptides in nature, highlighting ToiL's uniqueness in sensing multiple antibiotics and offering significant insights into bacterial gene regulation coordinated by transcription and translation.

      [Editors' note: The earlier public reviews are included. No additional reviews were requested.]

    5. Author response:

      The following is the authors’ response to the previous reviews

      Public Reviews:

      Reviewer #1 (Public review):

      Summary:

      The manuscript reports that expression of the E. coli operon topAI/yjhQ/yjhP is controlled by the translation status of a small open reading frame, that authors have discovered and named toiL, located in the leader region upstream of the operon. Authors propose the following model for topAI activation: Under normal conditions, toiL is translated but topAI is not expressed because of Rho-dependent transcription termination within the topAI ORF and because its ribosome binding site and start codon are trapped in an mRNA hairpin. Ribosome stalling at various codons of the toiL ORF, prompted in this work by some ribosome-targeting antibiotics, triggers an mRNA conformational switch which allows translation of topAI and, in addition, activation of the operon's transcription because presence of translating ribosomes at the topAI ORF blocks Rho from terminating transcription. The model is appealing and several of the experimental data mainly support it. However, it remains unanswered what is the true trigger of the translation arrest at toiL and what is the physiological role of the induced expression of the topAI/yjhQ/yjhP operon.

      Reviewer #2 (Public review):

      Summary:

      Baniulyte and Wade describe how translation of an 8-codon uORF denoted toiL upstream of the topAI-yjhQP operon is responsive to different ribosome-targeting antibiotics, consequently controlling translation of the TopAI toxin as well as Rho-dependent termination with the gene.

      Strengths:

      The authors used multiple different approaches such as a genetic screen to identify factors such as 23S rRNA mutations that affect topA1 expression and ribosome profiling to examine the consequences of various antibiotics on toiL-mediated regulation.

      Weaknesses:

      Future experiments will be needed to better understand the physiological role of the toiL-mediated regulation and elucidate the mechanism of specific antibiotic sensing.

      The results are clearly described, and the revisions have helped to improve the presentation of the data.

      Reviewer #3 (Public review):

      In this revised manuscript, the authors provide convincing data to support an elegant model in which ribosome stalling by ToiL promotes downstream topAI translation and prevents premature Rho-dependent transcription termination. However, the physiological consequences of activating topAI-yjhQP expression upon exposure to various ribosome-targeting antibiotics remain unresolved. The authors have satisfactorily addressed all major concerns raised by the reviewers, particularly regarding the SHAPE-seq data. Overall, this study underscores the diversity of regulatory ribosome-stalling peptides in nature, highlighting ToiL's uniqueness in sensing multiple antibiotics and offering significant insights into bacterial gene regulation coordinated by transcription and translation.

      Recommendations for the authors:

      Reviewer #1 (Recommendations for the authors):

      - Showing the ribosome density profiles of topAI/yjhQP and toiL in control and tetracycline treated cells is necessary to support that ribosome arrest at toiL increases translation of topAI/yjhQP.

      Figure 7B shows ribosome density around the start of toiL. Ribosome density increases across topAI in the presence of tetracycline, but we have opted not to show this region because we cannot say whether the increase in ribosome occupancy (represented in Figure 7A) is due to an increase in translation efficiency, RNA level, or both.

      - The subinhibitory antibiotic concentrations used in the reporter assays were based on MICs reported in the literature. This is not appropriate since MICs can greatly vary between strains, antibiotic solution stocks, and experimental conditions.

      Reported MICs were used as an initial guide for selecting antibiotic concentrations to test in our reporter assays. We have added text to indicate this, and to highlight that MICs vary considerably between strains.

      - toiL sequence may have evolved to maintain base-pairing with the topAI upstream region rather than, as authors suggest in Discussion, to respond to antibiotic-mediated arrest in an amino acid sequence specific manner.

      We have chosen to frame this as speculation.

      - Authors may consider commenting on the possibility that chloramphenicol does not induce because ToiL lacks alanine residues, whose presence at specific places of a nascent protein have been shown to promote chloramphenicol action (2016 PNAS 113:12150; 2022 NSMB 29:152).

      This is a great point as none of our stalling reporters included an ORF with alanine. We now include a short paragraph in the Discussion section to raise this possibility.

      - Tetracycline was added at the "subinhibitory concentration" of 8 ug/mL for the reporter assays but at 1 ug/mL for the ribosome profiling experiments. Authors should explain what was the rational for this.

      We think the reviewer is mixing up the epidemiological cut-off value of 8 ug/mL with the concentration used in experiments (0.5-1 ug/mL for reporter assays and ribosome profiling). The text was confusing, so we have added a sentence to the Methods section to indicate that epidemiological cut-off values and MICs were only a guide for selecting antibiotic concentrations to test.

      Reviewer #2 (Recommendations for the authors):

      I wish the authors had been slightly less dismissive of the reviewers' comments. At a minimum, it would be nice if the authors could be consistent about the ribosome representation throughout the manuscript;

      We apologize if our previous responses gave the impression of being dismissive. That was certainly not our intention. We greatly value the reviewers' feedback, and we appreciate the opportunity to clarify any misunderstandings. We believe the reviewer is referring to the different shape and color of the ribosome in Figures 8 and 9, and Figure 8 figure supplement 2, which we have now corrected.

    1. eLife Assessment

      This valuable work provides solid evidence that a neuronal metallothionein, GIF/MT-3, incorporates metal-persulfide clusters. A variety of well-designed assays support the authors' hypothesis, revealing that sulfane sulfur is released from MT-3. However, the sufane sulfur content in the canonical induced MT-1 and MT-2 has not been demonstrated. Thus, the biological role of the persulfidated form is not yet clearly defined. There are caveats to the findings that limit the study, but the work will nevertheless prompt major follow-up work.

    2. Reviewer #2 (Public review):

      Summary:

      In this manuscript, the authors reveal that GIF/MT-3 regulates the zinc homeostasis depending on the cellular redox status. The manuscript technically sounds, and their data concretely suggest that the recombinant MTs, not only GIF/MT-3 but also canonical MTs such as MT-1 and MT-2, contain sulfane sulfur atoms for the Zn-binding. The scenario proposed by the authors seems to be reasonable to explain the Zn homeostasis by the cellular redox balance.

      Strengths:

      The data presented in the manuscript solidly reveal that recombinant GIF/MT-3 contains sulfane sulfur.

      Weaknesses:

      It remains unclear whether native MTs, in particular induced MTs in vivo contain sulfane sulfur or not.

      Comments on revisions:

      Although the authors have revealed the sulfane sulfur content in native MT-3, my question, namely, whether canonical MT-1 and MT-2 contained sulfane sulfur after the induction has been left.<br /> The authors argue that the biological significance of sulfane sulfur in MTs lies in its ability to contribute to metal binding affinity, provide a sensing mechanism against oxidative stress, and aid in the regulation of the protein. Due to their biological roles, induced MT-1 and MT-2 could contain sulfane sulfur in their molecules. Thus, I expect the authors to evaluate or explain the sulfane sulfur content in induced MT-1 and MT-2.

    3. Reviewer #3 (Public review):

      Summary:

      The authors were trying to show that a novel neuronal metallothionein of poorly defined function, GIF/MT3, is actually heavily persulfidated in both the Zn-bound and apo (metal-free) forms of the molecule as purified from a heterologous (bacterial) or native host. Evidence in support of this conclusion is strong, with both spectroscopic and mass spectrometry evidence strongly consistent with this general conclusion. The authors would appear to have achieved their aims.

      Strengths:

      The analytical data in support of the author's primary conclusions are strong. The authors also provide some modeling evidence that supports the contention that MT3 (and other MTs) can readily accommodate a sulfane sulfur on each of the 20 cysteines in the Zn-bound structure, with little perturbation of the overall structure. This is not the case with Cys trisulfides, which suggests that the persulfide-metallated state is clearly positioned at lower energy relative to the immediately adjacent thiolate- or trisulfidated metal coordination complexes.

      Weaknesses:

      The biological significance of the findings is not entirely clear. On the one hand, the analytical data are solid (albeit using a protein derived from a bacterial over-expression experiment), and yes, it's true that sulfane S can protect Cys from overoxidation, but everything shown in the summary figure (Fig. 9D) can be done with Zn release from a thiol by ROS, and subsequent reduction by the Trx/TR system. In addition, it's long been known that Zn itself can protect Cys from oxidation. I view this as a minor shortcoming that will motivate follow-up studies.

      Impact:

      The impact will be high since the finding is potentially disruptive to the MT field for sure. The sulfane sulfur counting experiment (the HPE-IAM electrophile trapping experiment) may well be widely adopted by the field. Those in the metals field always knew that this was a possibility, and it will interesting to see the extent to which metal binding thiolates broadly incorporate sulfane sulfur into their first coordination shells.

      Comments on revisions:

      The revised manuscript is only slightly changed from the original, with the inclusion of a supplementary figure (Fig. S2) and minor changes in the text. The authors did not choose to carry out the quantitative Zn binding experiment (which I really wanted to see), but given the complexities of the experiment, I'll let it go.

    4. Author response:

      The following is the authors’ response to the previous reviews

      Reviewer #2 (Public Review):

      Comments on revisions:

      Although the authors have revealed the sulfane sulfur content in native MT-3, my question, namely, whether canonical MT-1 and MT-2 contained sulfane sulfur after the induction has been left.

      The authors argue that the biological significance of sulfane sulfur in MTs lies in its ability to contribute to metal binding affinity, provide a sensing mechanism against oxidative stress, and aid in the regulation of the protein. Due to their biological roles, induced MT-1 and MT-2 could contain sulfane sulfur in their molecules. Thus, I expect the authors to evaluate or explain the sulfane sulfur content in induced MT-1 and MT-2.

      Thank you for your valuable comments. In this study, we were not able to examine the role of sulfane sulfur in the induced forms of MT-1 and MT-2. However, this topic is undoubtedly important and intriguing; therefore, we will continue to explore it in future studies.

      Reviewer #3 (Public Review):

      Comments on revisions:

      The revised manuscript is only slightly changed from the original, with the inclusion of a supplementary figure (Fig. S2) and minor changes in the text. The authors did not choose to carry out the quantitative Zn binding experiment (which I really wanted to see), but given the complexities of the experiment, I'll let it go.

      Fig. 9: the authors imply in the mechanistic "redox-switch" figure that Trx/TR can not reduce persulfide linkages. A number of groups have shown this to be the case. I recommend modifying the figure legend or text to make this clear to the reader.

      Thank you for your understanding. Regarding the "redox-switch" figure, although some groups have demonstrated the ability of Trx to reduce persulfide moieties, as you pointed out, we have addressed this discrepancy in the Discussion section as follows (lines 357-361): “In contrast, Trx has been proposed to reduce the persulfide moiety of PTP1B (37) and albumin (38, 39). A possible explanation for this discrepancy is that apo-GIF/MT-3-persulfide is rapidly changed into a different conformation that is topologically resistant to Trx reduction. In other words, Trx may exhibit substrate specificity.” Additionally, we have inserted the following sentence just before the above discussion to further clarify this point:“This suggests that the persulfide moiety in GIF/MT-3 appears to be relatively stable against Trx reduction.”

    1. eLife Assessment

      This valuable study demonstrates that the GSK-3 inhibitor AZD2858 inhibits the formation of TOPBP1 condensates and hence DNA damage responses in colorectal cancer cells. The evidence supporting the claims of the authors is convincing, although uncovering how this drug blocks bio-condensate formation would have strengthened the study. The work will be of interest to cancer researchers searching for synergistic drug combination strategies.

      [Editors' note: this paper was reviewed by Review Commons.]

    2. Reviewer #1 (Public review):

      Summary:

      Laura Morano and colleagues have performed a screen to identify compounds that interfere with the formation of TopBP1 condensates. TopBP1 plays a crucial role in the DNA damage response, and specifically the activation of ATR. They found that the GSK-3b inhibitor AZD2858 reduced the formation of TopBP1 condensates and activation of ATR and its downstream target CHK1 in colorectal cancer cell lines treated with the clinically relevant irinotecan active metabolite SN-38. This inhibition of TopBP1 condensates by AZD2858 was independent from its effect on GSK-3b enzymatic activity. Mechanistically, they show that AZD2858 thus can interfere with intra-S-phase checkpoint signaling, resulting in enhanced cytostatic and cytotoxic effects of SN-38 (or SN-38+Fluoracil aka FOLFIRI) in vitro in colorectal carcinoma cell lines.

      Major comments from the first round of peer review:

      Overall the work is rigorous and the main conclusions are convincing. However, they only show the effects of their combination treatments on colorectal cancer cell lines. I'm worried that blocking the formation of TopB1 condensates will also be detrimental in non-transformed cells. Furthermore it is somewhat disappointing that it remains unclear how AZD2858 blocks self-assembly of TopBP1 condensates, although I understand that unraveling this would be complex and somewhat out-of-reach for now. Here are some specific points for improvement:

      1) The authors conclude that "These data supports [sic] the feasibility of targeting condensates formed in response to DNA damage to improve chemotherapy-based cancer treatments". To support this conclusion the authors need to show that proliferating non-transformed cells (e.g. primary cell cultures or organoids) can tolerate the combination of AZD2858 + SN-38 (or FOLFIRI) better than colorectal cancer cells.

      2) Page 19 "This suggests that the combination... arrests the cell cycle before mitosis in a DNA-PKsc-dependent manner." I find the remark that this arrest would be DNA-PKcs-dependent too speculative. I suppose that the authors base this claim on reference 55 but if they want to support this claim they need to prove this by adding DNA-PKcs inhibitors to their treated cells.

      3) When discussing Figure S5B the authors claim that SN-38 + AZD2858 progressively increases the fractions of BrdU positive cells, but this is not supported by statistical analysis. The fractions are still very small, so I would like to see statistics on these data. Alternatively, the authors could take out this conclusion.

      Comments on revised version:

      I have reviewed the revised manuscript and read the rebuttal. The authors have carefully addressed my concerns. There is however one point that needs further work:

      This follows up on my major point #1 in my initial review. I had I asked the authors to demonstrate that FOLFIRI + AZD are less toxic to untransformed colorectal cells than colorectal cancer cell lines.

      It is good to see that the authors took my advice and show effects of the drug treatments on the untransformed colorectal cell line CCD841. It seems to be less sensitive to AZD and FOLFIRI in the figure in the rebuttal. What surprises me is that I cannot find these new figures anywhere in the revised manuscript. Also, the data seem preliminary, because I do not see any standard errors in the graphs, and I cannot find a description of the time of drug incubation. I ask the authors to make sure that the CCD841 data are reproducible, and make sure they incorporate the data in the revised manuscript.

    3. Reviewer #2 (Public review):

      Summary:

      In 2021 (PMID: 33503405) and 2024 (PMID: 38578830) Constantinou and colleagues published two elegant papers in which they demonstrated that the Topbp1 checkpoint adaptor protein could assemble into mesoscale phase-separated condensates that were essential to amplify activation of the PIKK, ATR, and its downstream effector kinase, Chk1, during DNA damage signalling. A key tool that made these studies possible was the use of a chimeric Topbp1 protein bearing a cryptochrome domain, Cry2, which triggered condensation of the chimeric Topbp1 protein, and thus activation of ATR and Chk1, in response to irradiation with blue light without the myriad complications associated with actually exposing cells to DNA damage.

      In this current report Morano and co-workers utilise the same optogenetic Topbp1 system to investigate a different question, namely whether Topbp1 phase-condensation can be inhibited pharmacologically to manipulate downstream ATR-Chk1 signalling. This is of interest, as the therapeutic potential of the ATR-Chk1 pathway is an area of active investigation, albeit generally using more conventional kinase inhibitor approaches.

      The starting point is a high throughput screen of 4730 existing or candidate small molecule anti-cancer drugs for compounds capable of inhibiting the condensation of the Topbp1-Cry2-mCherry reporter molecule in vivo. A surprisingly large number of putative hits (>300) were recorded, from which 131 of the most potent were selected for secondary screening using activation of Chk1 in response to DNA damage induced by SN-38, a topoisomerase inhibitor, as a surrogate marker for Topbp1 condensation. From this the 10 most potent compounds were tested for interactions with a clinically used combination of SN-38 and 5-FU (FOLFIRI) in terms of cytotoxicity in HCT116 cells. The compound that synergised most potently with FOLFIRI, the GSK3-beta inhibitor drug AZD2858, was selected for all subsequent experiments.

      AZD2858 is shown to suppress the formation of Topbp1 (endogenous) condensates in cells exposed to SN-38, and to inhibit activation of Chk1 without interfering with activation of ATM or other endpoints of damage signalling such as formation of gamma-H2AX or activation of Chk2 (generally considered to be downstream of ATM). AZD2858 therefore seems to selectively inhibit the Topbp1-ATR-Chk1 pathway without interfering with parallel branches of the DNA damage signalling system, consistent with Topbp1 condensation being the primary target. Importantly, neither siRNA depletion of GSK3-beta, or other GSK3-beta inhibitors were able to recapitulate this effect, suggesting it was a specific non-canonical effect of AZD2858 and not a consequence of GSK3-beta inhibition per se.

      To understand the basis for synergism between AZD2858 and SN-38 in terms of cell killing, the effect of AZD2858 on the replication checkpoint was assessed. This is a response, mediated via ATR-Chk1, that modulates replication origin firing and fork progression in S-phase cell under conditions of DNA damage or when replication is impeded. SN-38 treatment of HCT116 cells markedly suppresses DNA replication, however this was partially reversed by co-treatment with AZD2858, consistent with the failure to activate ATR-Chk1 conferring a defect in replication checkpoint function.

      Figures 4 and 5 demonstrate that AZD2858 can markedly enhance the cytotoxic and cytostatic effects of SN-38 and FOLFIRI through a combination of increased apoptosis and growth arrest according to dosage and treatment conditions. Figure 6 extends this analysis to cells cultured as spheroids, sometimes considered to better represent tumor responses compared to single cell cultures.

      Significance:

      Liquid phase separation of protein complexes is increasingly recognised as a fundamental mechanism in signal transduction and other cellular processes. One recent and important example was that of Topbp1, whose condensation in response to DNA damage is required for efficient activation of the ATR-Chk1 pathway. The current study asks a related but distinct question; can protein condensation be targeted by drugs to manipulate signalling pathways which in the main rely on protein kinase cascades?

      Here, the authors identify an inhibitor of GSK3-beta as a novel inhibitor of DNA damage-induced Topbp1 condensation and thus of ATR-Chk1 signalling.

      This work will be of interest to researchers in the fields of DNA damage signalling, biophysics of protein condensation, and cancer chemotherapy.

      Comments on latest version:

      Morano et al. have revised their manuscript in response to the points raised by reviewer #3 as follows.

      1) Fig. 2E: Correcting the previously erroneous labelling of this Fig. makes it match the textual description.

      2) Figs 3A and B: The revised textual description of the flow cytometry BrdU incorporation is now precise.

      3) Fig. 3E: Removing the suspect WB images is a pragmatic decision that does not significantly affect the overall conclusions of the paper.

      4) Fig. 3D: Despite its puzzling appearance this data is now described accurately in the text as "DSBs remained elevated after the combined treatment" rather than "increased after the combined treatment. A more convincing increase in the presumed damaged DNA band is evident in Fig. 4D when AZD2858 is combined with a much lower concentration of SN38 (1.5nM) which could mean that the concentration used in Fig. 3D (300nM) induced maximal damage that could not be further enhanced.

    4. Reviewer #3 (Public review):

      Summary:

      The authors have extended their previous research to develop TOPBP1 as a potential drug target for colorectal cancer by inhibiting its condensation. Utilizing an optogenetic approach, they identified the small molecule AZD2858, which inhibits TOPBP1 condensation and works synergistically with first-line chemotherapy to suppress colorectal cancer cell growth. The authors investigated the mechanism and discovered that disrupting TOPBP1 assembly inhibits the ATR/Chk1 signaling pathway, leading to increased DNA damage and apoptosis, even in drug-resistant colorectal cancer cell lines.

      Comments on latest version:

      The authors have addressed most of the concerns that I raised in the first round of revision and I have no further questions. I appreciate the authors's efforts in carrying out an preliminary in vivo work, although as the authors pointed out the compound seems to be not effective in vivo. Future work is desired to address this to clarify the significance of the work.

    5. Author response:

      Reviewer #1 (Evidence, reproducibility and clarity (Required)): 

      Summary: 

      Laura Morano and colleagues have performed a screen to identify compounds that interfere with the formation of TopBP1 condensates. TopBP1 plays a crucial role in the DNA damage response, and specifically the activation of ATR. They found that the GSK-3b inhibitor AZD2858 reduced the formation of TopBP1 condensates and activation of ATR and its downstream target CHK1 in colorectal cancer cell lines treated with the clinically relevant irinotecan active metabolite SN-38. This inhibition of TopBP1 condensates by AZD2858 was independent from its effect on GSK-3b enzymatic activity. Mechanistically, they show that AZD2858 thus can interfere with intra-S-phase checkpoint signaling, resulting in enhanced cytostatic and cytotoxic effects of SN-38 (or SN-38+Fluoracil aka FOLFIRI) in vitro in colorectal carcinoma cell lines. 

      Major comments: 

      Overall the work is rigorous and the main conclusions are convincing. However, they only show the effects of their combination treatments on colorectal cancer cell lines. I'm worried that blocking the formation of TopB1 condensates will also be detrimental in non-transformed cells. Furthermore it is somewhat disappointing that it remains unclear how AZD2858 blocks selfassembly of TopBP1 condensates, although I understand that unraveling this would be complex and somewhat out-of-reach for now. 

      We appreciate your feedback and fully recognize the importance of understanding how AZD2858 blocks the assembly of TopBP1 condensates. While we understand your disappointment, addressing this question remains a key focus for us. Keeping in mind that unravelling such a mechanism in vitro or in vivo is rather challenging, we have consulted an expert who has made efforts to predict the potential docking sites of AZD2858 on TopBP1, which may provide valuable insights for future experimental investigations. Using an AlphaFold model (no crystal or cryo-EM structure available) and looking for suitable pockets or cavities in which AZD2858 could bind, the analyses, though requiring cautious interpretation, suggested that AZD2858 may target the BRCT1 and BRCT8 domains (as shown below, two pockets n°1 and 7 with sufficient volume and surrounded by b-sheets structures like other GSK3 inhibitor) of TopBP1.

      However, these are preliminary results that require further exploration and experimental validation to confirm their significance and mechanistic implications.

      Author response image 1.

      Here are some specific points for improvement: 

      (1) The authors conclude that "These data supports [sic] the feasibility of targeting condensates formed in response to DNA damage to improve chemotherapy-based cancer treatments". To support this conclusion the authors need to show that proliferating non-transformed cells (e.g. primary cell cultures or organoids) can tolerate the combination of AZD2858 + SN-38 (or FOLFIRI) better than colorectal cancer cells. 

      We would like to thank the reviewer for this vital suggestion to prove that this combination is effective on tumor cells and not very toxic on healthy cells. We therefore used a healthy colon cell line (CCD841) and tested the efficacy of each treatment alone (FOLFIRI and AZD2858) as well as the combination FOLFIRI+AZD2858. We compared the results obtained in the CCD841 cell line with those obtained in the HCT116 colorectal cancer cell line. The results presented below show not only that each treatment alone is much less effective on CCD841 lines, but also that the combination is not synergistic.

      Author response image 2.

      Page 19 "This suggests that the combination... arrests the cell cycle before mitosis in a DNAPKsc-dependent manner." I find the remark that this arrest would be DNA-PKcs-dependent too speculative. I suppose that the authors base this claim on reference 55 but if they want to support this claim they need to prove this by adding DNA-PKcs inhibitors to their treated cells. 

      Thank you for your thoughtful comment. We agree with the reviewer that claiming the G2/M arrest is DNA-PKcs-dependent without direct experimental evidence is speculative. While we initially based this hypothesis on reference 55, we acknowledge that further experiments, such as the use of DNA-PKcs inhibitors, would be necessary to robustly support this claim.

      Given that this observation was intended as a potential explanation for the G2/M arrest observed at 6 and 12 hours of treatment with AZD2858 + SN-38 (compared to SN-38 alone), and considering that exploring this pathway is not the primary focus of our study, we have decided to remove this hypothesis from both the figure and the text to avoid any ambiguity.

      We appreciate the reviewer’s input and will consider investigating this pathway in future studies.

      (2) When discussing Figure S5B the authors claim that SN-38 + AZD2858 progressively increases the fractions of BrdU positive cells, but this is not supported by statistical analysis.

      The fractions are still very small, so I would like to see statistics on these data. Alternatively, the authors could take out this conclusion. 

      Thank you for your valuable comment. In response, we have conducted a statistical analysis (Mann-Whitney test) on the data, and the results have been added to Figure S5C for the 6-hour time point and Figure S5D for the 12-hour time point, based on three independent biological replicates. We hope this provides the necessary clarification.

      Minor comments: 

      - Page 5 Materials and methods - Cell culture. Last sentence "Add in what medium you cultured them" looks like an internal review remark and should probably be removed? 

      We apologize for this oversight. The medium has now been specified, and the sentence has been removed.

      - The numbers in all the synergy matrices (in white font) are extremely small and virtually unreadable, and visually distracting. I recommend taking these out altogether. 

      We believe that the reduction in figure quality may be due to the PDF compression, which affected the resolution of the figures. We are happy to provide high-resolution versions of the figures separately for clarity. If the issue persists even with the higher resolution, we will consider removing the numbers, as suggested.

      - The legends of the synergy matrices (for example Fig 1D, 4E, 5, 6) are often extremely small, making it difficult to understand them intuitively. Please enlarge them and label them more clearly, and use larger fonts. In the legend of Figure 5D,E a green matrix indicating % live cells is mentioned but I don't see it. Do they mean the grey matrix? 

      We have enlarged the figure legends and will provide high-resolution versions of the figures to ensure all details are clearly readable. Regarding Figure 5D,E: we acknowledge that the color may appear differently (more green or gray) depending on the display or printer settings. To avoid any confusion, we have corrected the legend to specify that the color in question is khaki, rather than green. Moreover, following suggestions of the reviewer #2, these figures have been respectively moved to Figure S6B and S6C.

      - Figure S2. Perhaps I misunderstand the PML body experiment but the authors seem to use PML body formation to support their idea that AZD2858 blocks TopBP1 condensate formation and not just any condensate formation. However, if this is the case they would need a proper positive control, i.e. an additional experimental condition in which they do see PLM bodies. 

      Arsenic is a well-known positive control for experiments involving PML bodies due to its ability to induce specific responses in PML proteins and modify PML nuclear bodies (NBs) structure and function (Jaffray et al., 2023, JCB ; Zhu et al., 1997, PNAS). Thus, we used Arsenic as a positive control and observed a significant increase in PML NBs vs the other conditions (Kruskal-Wallis test) as indicated below. We thus implemented the results in the corresponding figure S2B and text.

      Author response image 3.

      PML condensates were tested after 2 h of incubation. AZD2858 : 100nM ; SN-38 : 300nM ; Arsenic : 6µM. ****: p<0.0001 (Kruskal-Wallis test).

      - The quantification of the flow cytometry data needs to be clarified. I find it strange that in the figures (for example Figure 3A and 3C) representative examples are shown of apparently 3 replicates, and that the percentages shown in these examples are then the given in the text as the overall numbers; for example on page 18 "...BrdU incorporation increased from 16.11% (SN38 alone) to 41.83% (combination)...". This type of description is done in multiple places in the Results section and is confusing. It would be clearer if the authors show proper quantifications (mean +/- sem) of the percentages of (the relevant) gated populations. Besides, I don't think it make a lot of sense to mention in the text the percentages with 2 decimals behind the comma. This suggests a level of precision that does not seem justified in flow cytometry data. Finally, all flow cytometry plots look visually very busy and all the text is crammed in with really small fonts. Cleaning them up and enlarging the fonts of the remaining text/numbers would really improve the readability of the figures. 

      Thank you for your helpful comments. We understand your concern regarding the flow cytometry quantification. Indeed, the percentages presented in the figures are derived from representative replicates, and we acknowledge that this presentation could be confusing. To address this, we have included a table summarizing the data from all replicates to improve readability [Table S2 and S3 in the new version]. Second, we specified in the text that the data are representative biological replicates when needed. Third, we have performed statistical analyses on the three replicates when necessary, as shown in Supplementary Figure S5C-F in the new version. The text has been revised to reflect the correct statistical interpretation.

      Regarding the use of two decimal, we are unable to remove them due to limitations in the software (Kaluza) used for flow cytometry analysis. However, we agree that this level of precision may not be warranted, and we have revised the text where appropriate to reduce confusion.

      - In Figure 5G the authors show that FOLFIRI + AZD2858 are synergistic in two SN-38-resistant cell lines. They conclude that this combination may overcome drug resistance. But tried to figure out the used FOLFIRI concentrations used in these cell lines and they still seem far higher than the SN-38-sensitive HCT116 cell lines, so I would like to see a bit more nuance in their interpretation. I think overcoming drug resistance is an overstatement, and perhaps alleviating would be a better term 

      Thank you for highlighting this important point; we have adjusted the text accordingly.

      - The legend in Table S2 refers to Figure 5A-B; this should be Figure 4A-B. 

      Thank you, this has been corrected and Table S2 is now moved to Table S4 .

      Reviewer #1 (Significance (Required)): 

      The finding that AZD2858 block TOPbp1 condensate formation via a pleiotropic effect of this compound is interesting and convincing. To my best knowledge it's a novel finding which is interesting to the potential target audience mentioned below. Their findings that inhibition of TOPbp1 condensation and ATR signaling via AZD2858 may synergize with FOLFIRI therapy in colorectal cancer cells are still very preliminary, because the effects on non-cancerous cells are not tested. 

      Researchers involved in early cancer drug discovery and cell biologists studying DNA damage responses in cancer cells seem to me typical audience interested and influenced by this paper. 

      I'm a cell biologist studying cell cycle fate decisions, and adaptation of cancer cells & stem cells to (drug-induced) stress. My expertise aligns well with the work presented throughout this paper. 

      Reviewer #2 (Evidence, reproducibility and clarity (Required)): 

      The authors have extended their previous research to develop TOPBP1 as a potential drug target for colorectal cancer by inhibiting its condensation. Utilizing an optogenetic approach, they identified the small molecule AZD2858, which inhibits TOPBP1 condensation and works synergistically with first-line chemotherapy to suppress colorectal cancer cell growth. The authors investigated the mechanism and discovered that disrupting TOPBP1 assembly inhibits the ATR/Chk1 signaling pathway, leading to increased DNA damage and apoptosis, even in drug-resistant colorectal cancer cell lines. Addressing the following concerns would enhance clarity and further in vivo work may improve significance: 

      (1) How does the optogenetic method for inducing condensates compare to the DNA damage induction mechanism? 

      Optogenetics provides a versatile and precise approach for controlling the condensation of scaffold proteins in both space and time. This method enables us to study the role of biomolecular condensates with minute-scale resolution, separating their formation from potentially confounding upstream events, such as DNA damage, and providing valuable insights into their specific function. Importantly, based on our previous publications on TopBP1 or SLX4 optogenetic condensates, we have substantial evidence indicating that light-induced condensates closely mimic those formed in response to DNA damage:

      - Functional similarity: Optogenetic condensates recapitulate endogenous condensates formed upon exposure of the cells of DNA damaging agents, and include most known partner proteins involved in the DNA damage response. It was shown for light induced-TopBP1 and SLX4 condensates (1-3).

      - Dynamic reversibility: Optogenetic condensates and DNA damage induced condensates are both dynamic and reversible. They dissolve within 15 minutes of light deactivation or after removal of the damaging agent (1,3).

      - Chromatin association: Both optogenetic and DNA damage-induced condensates are bound to chromatin or localized at sites of DNA damage (3).

      - Regulation: Both types of condensates are regulated similarly, with their formation triggered by the same signaling pathways. ATR basal activity drives the nucleation of opto-TopBP1 condensates and endogenous TopBP1 structures upon light exposure (1). Likewise, sumoylation modifications regulate the formation of opto-SLX4 condensates and endogenous SLX4 condensates (3).

      - Structurally: Using super-resolution imaging by stimulation-emission-depletion (STED) microscopy, we observed that endogenous SLX4 nanocondensates formed globular clusters that were indistinguishable from recombinant light induced SLX4 condensates (1,3).  

      (1) Frattini C, Promonet A, Alghoul E, Vidal-Eychenie S, Lamarque M, Blanchard MP, et al. TopBP1 assembles nuclear condensates to switch on ATR signaling. Molecular Cell. 18 mars 2021;81(6):1231-1245.e8. 

      (2) Alghoul E, Basbous J, Constantinou A. An optogenetic proximity labeling approach to probe the composition of inducible biomolecular condensates in cultured cells. STAR Protocols. 2021;2(3):100677. 

      (3) Alghoul E, Basbous J, Constantinou A. Compartmentalization of the DNA damage response: Mechanisms and functions. DNA Repair. août 2023;128:103524.

      (2) Why wasn't the initial screen conducted on the HCT116-SN50 resistant cell line? 

      Thank you for raising this important question, which we also considered at the outset of the project. After careful consideration, we decided to use the HCT116 WT cells in order to obtain initial data from an unmodified cell line. It is worth mentioning that HCT116-SN50 cells exhibit slower proliferation compared to WT cells, and they also express an efflux pump capable of pumping out SN38. We were concerned that these factors might interfere with the optogenetic assay, which is why we chose to perform the screen using the WT HCT116 cells.

      (3) The labels in Fig. 1D are difficult to recognize. 

      This issue was also raised by Reviewer #1. We suspect that the PDF conversion may have reduced the resolution of the figures, so we will provide them separately in high resolution. In addition, we have increased the size of some labels to improve their clarity.

      The selected cell image in Fig. 2A for SN-38 seems over-representative; unselected cells appear similar to other groups. Why does AZD2858 itself induce TopBP1 condensates in the plot, yet this is not evident in the images? 

      Thank you for your comment; we have updated the figure with a more representative image. We indeed observe that AZD2858 alone induces a slight increase in TopBP1 condensates. However, this increase did not lead to the activation of the ATR/Chk1 signaling pathway, as shown by the Western blot data presented in Fig. 2B. In addition, AZD2858 specifically prevents the formation of TopBP1 condensates induced by SN38 treatment, and the level of TopBP1 condensates does not return to the basal levels observed in untreated cells, but rather to those observed with AZD2858 treatment. During the 2-hour AZD2858 treatment, the progression of replication forks was unaffected (Fig. 3A and 3B). However, when AZD2858 was added alone to the Xenopus egg extracts, there was increased recruitment of TopBP1 to the chromatin (Fig. 2E). This result suggests that AZD2858 alone can induce the assembly of TopBP1 on chromatin to initiate DNA replication (a well-established role of TopBP1), but the number and concentration of TopBP1 molecules did not reach levels sufficient to activate the ATR/Chk1 pathway.

      (4) In Fig. 3A, despite the drastic change in the FACS plot shape, the quantifications appear quite similar. 

      Thank you for this insightful observation. The gates for the S phase were intentionally set wider to avoid biasing the results and inadvertently excluding the population that incorporates BrdU weakly (but still incorporates it) in the SN-38 only condition. As a result, the percentage of cells within this gate remains similar, even though the overall shape of the FACS plot changes, reflecting a shift in the distribution of BrdU incorporation. This point has now been clarified in the legend of the Figure 3A.

      This effect can also be attributed to the relatively short treatment time (2 hours), which captures early changes in DNA synthesis. The effect becomes more pronounced at later time points, as shown in Figure 3C. For example, after 6 hours of treatment, the percentage of BrdU-positive cells increases from 15% with SN-38 alone to 41% with the AZD2858 combination, demonstrating a clearer impact on DNA synthesis. A graph summarizing the statistical analysis has been added to Figure S5C for the 6-hour time point and Figure S5D for the 12-hour time point, based on data from three independent biological replicates.

      (5) The results section is imbalanced; Figs. 5 and 6 could be combined into one figure. 

      We have combined Figures 5 and 6 into a single figure to optimize the presentation of results. To avoid overloading the new figure, some of the data have been moved to supplementary figures, ensuring the main figure remains clear and focused.

      (6) An in vivo study is anticipated to assess the drug's efficacy. 

      Although AZD2858 was developed a few years ago, there is a limited amount of in vivo data available, which led us to consider potential issues related to the drug's biodistribution or its pharmacokinetics (PK). Despite these concerns, we proceeded with preliminary in vivo studies, testing various diluents and injection routes for AZD2858. However, we observed that the compound was not effective in vivo. Given the strong synergistic effects observed in vitro, we concluded that AZD2858 was likely not being distributed properly in the mice. As a result, we have decided to conduct a more detailed investigation into the pharmacokinetics (PK), pharmacodynamics (PD), and absorption, distribution, metabolism, and excretion (ADME) of AZD2858 to better understand its in vivo behavior and efficacy. Therefore, the in vivo evaluation of AZD2858 will be addressed in a separate study specifically focused on this aspect.

      Reviewer #2 (Significance (Required)): 

      Addressing the stated concerns would enhance clarity and further in vivo work may improve significance. 

      Reviewer #3 (Evidence, reproducibility and clarity (Required)): 

      Summary 

      In 2021 (PMID: 33503405) and 2024 (PMID: 38578830) Constantinou and colleagues published two elegant papers in which they demonstrated that the Topbp1 checkpoint adaptor protein could assemble into mesoscale phase-separated condensates that were essential to amplify activation of the PIKK, ATR, and its downstream effector kinase, Chk1, during DNA damage signalling. A key tool that made these studies possible was the use of a chimeric Topbp1 protein bearing a cryptochrome domain, Cry2, which triggered condensation of the chimeric Topbp1 protein, and thus activation of ATR and Chk1, in response to irradiation with blue light without the myriad complications associated with actually exposing cells to DNA damage. 

      In this current report Morano and co-workers utilise the same optogenetic Topbp1 system to investigate a different question, namely whether Topbp1 phase-condensation can be inhibited pharmacologically to manipulate downstream ATR-Chk1 signalling. This is of interest, as the therapeutic potential of the ATR-Chk1 pathway is an area of active investigation, albeit generally using more conventional kinase inhibitor approaches. 

      The starting point is a high throughput screen of 4730 existing or candidate small molecule anticancer drugs for compounds capable of inhibiting the condensation of the Topbp1-Cry2mCherry reporter molecule in vivo. A surprisingly large number of putative hits (>300) were recorded, from which 131 of the most potent were selected for secondary screening using activation of Chk1 in response to DNA damage induced by SN-38, a topoisomerase inhibitor, as a surrogate marker for Topbp1 condensation. From this the 10 most potent compounds were tested for interactions with a clinically used combination of SN-38 and 5-FU (FOLFIRI) in terms of cytotoxicity in HCT116 cells. The compound that synergised most potently with FOLFIRI, the GSK3-beta inhibitor drug AZD2858, was selected for all subsequent experiments. 

      AZD2858 is shown to suppress the formation of Topbp1 (endogenous) condensates in cells exposed to SN-38, and to inhibit activation of Chk1 without interfering with activation of ATM or other endpoints of damage signalling such as formation of gamma-H2AX or activation of Chk2 (generally considered to be downstream of ATM). AZD2858 therefore seems to selectively inhibit the Topbp1-ATR-Chk1 pathway without interfering with parallel branches of the DNA damage signalling system, consistent with Topbp1 condensation being the primary target. Importantly, neither siRNA depletion of GSK3-beta, or other GSK3-beta inhibitors were able to recapitulate this effect, suggesting it was a specific non-canonical effect of AZD2858 and not a consequence of GSK3-beta inhibition per se. 

      To understand the basis for synergism between AZD2858 and SN-38 in terms of cell killing, the effect of AZD2858 on the replication checkpoint was assessed. This is a response, mediated via ATR-Chk1, that modulates replication origin firing and fork progression in S-phase cell under conditions of DNA damage or when replication is impeded. SN-38 treatment of HCT116 cells markedly suppresses DNA replication, however this was partially reversed by co-treatment with AZD2858, consistent with the failure to activate ATR-Chk1 conferring a defect in replication checkpoint function. 

      Figures 4 and 5 demonstrate that AZD2858 can markedly enhance the cytotoxic and cytostatic effects of SN-38 and FOLFIRI through a combination of increased apoptosis and growth arrest according to dosage and treatment conditions. Figure 6 extends this analysis to cells cultured as spheroids, sometimes considered to better represent tumor responses compared to single cell cultures. 

      Major comments 

      Most of the data presented is of good technical quality and supports the conclusions drawn. There are however a small number of instances where this is not true; ie where the data are of insufficient technical quality, or where the description or interpretation of the results is at variance with the data which is presented. Some examples: 

      (1) Fig.2E - the claim that "we observed an increase in RPA, Topb1 and Pol-epsilon levels when CPT and AZD2858 were added together" do not seem to be justified by the data provided. It is also unclear what the purpose/ significance of this experiment is. 

      Thank you for pointing out the contradiction in Figure 2E. Upon review, we identified an error in the labeling of conditions (CPT and AZD2858 were inadvertently swapped). The corrected figure now clearly shows that, at the 60-minute timepoint after starting replication, the combination of

      CPT and AZD2858 results in a greater accumulation of TopBP1, Pol ε, and RPA on chromatin compared to CPT alone. We have revised the sentence to: "Our data demonstrate that combining CPT and AZD2858 earlier enhances the accumulation of replication-related factors (RPA, TopBP1, and Pol ε) on chromatin compared to CPT treatment alone, particularly visible at the 60minute after starting replication."

      The significance of this experiment lies in its connection to the earlier observation that AZD2858 restores BrdU incorporation when combined with SN-38, as shown in flow cytometry data (Figure 3A). At a molecular level, this was further supported by DNA fiber assays, which revealed that replication tracks (CldU tracts) were longer in the combination treatment compared to SN-38 alone (Figure 3B).

      To strengthen and validate these findings, we chose to employ the Xenopus egg extract system for several reasons. This model provides a highly controlled environment where DNA replication occurs without confounding effects from transcription or translation. Moreover, replication is limited to a single round, offering a unique opportunity to specifically interrogate replication mechanisms. These attributes make the Xenopus model an ideal system to confirm that AZD2858 facilitates replication recovery in the presence of replication stress induced by agents like CPT. This will lead, in longer treatment, to accumulation of DNA damage and apoptosis (Figure 3D-E and Figure 4A-D)

      (2) Figs. 3 A and C certainly show that the SN-38-mediated suppression of DNA synthesis is modified and partially alleviated by co-treatment with AZD2858. The statement however that "prolonged co-incubation with AZD2858 for 6 and 12 hours effectively abolished the SN-38 induced S-phase checkpoint" is clearly misleading. If this were true, then the BrdU incorporation profiles of the respective samples would be similar or identical to control, which clearly they are not. Clearly AZD2858 is affecting the imposition of the S-phase checkpoint in some way, but not "abolishing" it. 

      We appreciate the reviewer’s detailed observations regarding Figures 3A and 3C and the phrasing in our manuscript. We agree that the term "abolished" is not precise in describing the effects of AZD2858 on the SN-38-induced S-phase checkpoint.

      To clarify: our data indicate that co-treatment with AZD2858 modifies and partially alleviates the SN-38-induced suppression of DNA synthesis, as demonstrated by increased BrdU incorporation relative to SN-38 treatment alone. However, as the reviewer correctly points out, the BrdU incorporation profiles of the co-treated samples do not fully return to control non treated cells levels. This suggests that while AZD2858 significantly mitigates the S-phase checkpoint, it does not completely abolish it.

      We have revised the statement in the manuscript to better reflect these findings, as follows: "Prolonged co-incubation with AZD2858 for 6 and 12 hours significantly alleviated the SN-38induced S-phase checkpoint, as evidenced by the partially increased BrdU incorporation. However, the population of co-treated cells is heterogeneous: some cells exhibit BrdU incorporation levels similar to those of untreated control cells, while others incorporate BrdU at levels comparable to cells treated with SN-38 alone. This indicates that AZD2858 does not fully restore DNA synthesis to control levels across the entire cell population."

      This revised phrasing aligns with the data presented and acknowledges the partial recovery of DNA synthesis observed. Thank you for bringing this to our attention and helping us improve the accuracy of our conclusions.

      (3) Fig. 3 E. The western blots of pDNA-PKcs (S2056) and total DNA-PKcs are really not interpretable. It is possible to sympathise that these reagents are probably extremely difficult to work with and obtain clear results, however uninterpretable results are not acceptable. 

      We agree that the data presented in the Fig3E are difficult to interpret. As noted by Reviewer 1, we recognize the challenge of obtaining clear and reliable results with these specific reagents. Based on this feedback, and to ensure the robustness of our conclusions, we have decided to exclude these specifics blots from the revised manuscript.

      We believe that this adjustment will enhance the clarity and reliability of the manuscript while focusing on the other, more interpretable data presented. Thank you for pointing this out, and we appreciate your understanding.

      (4) Fig. 3D. This is a puzzling image. Described as a PFGE assay, it presumably depicts an agarose gel, with intact genomic DNA at the top and a discrete band below representing fragmented genomic DNA. This is a little surprising, as fragmented genomic DNA does not usually appear as a specific band but as a heterogenous population or "smear". Nevertheless, even if one accepts this premise, it is unclear what is meant by "DSBs remained elevated after the combined treatment" when the intensity of this band is equivalent for both SN-38 and SN-38 + AZD2858 treatments. 

      We thank the reviewer for his insightful comments regarding the PFGE results in Figure 3D. We agree that the appearance of a discrete band, rather than a heterogeneous smear, is atypical for fragmented genomic DNA in this assay. However, by enhancing the signal intensity (as shown below), the expected smear becomes more appreciable.

      Author response image 4.

      Regarding the interpretation of the band intensities, we agree that the signals for SN-38 and SN38 + AZD2858 appear similar under these specific conditions. At the relatively high concentration of SN-38 used in this experiment (300 nM), it is indeed challenging to observe a more pronounced effect on DNA breaks. This is why we proposed the "DSBs remained elevated after the combined treatment" because the band intensity of SN-38 single agent treated cells or combined with AZD2858 is comparable. However, we note a slightly more intense γH2AX signal over time when AZD2858 is combined with SN-38 compared to SN-38 alone (Figure 3E). Furthermore, under lower, sub-optimal doses of SN-38 and over extended incubation treatment (48h), we observe a clearer increase in fragmented DNA bands, as demonstrated in Figure 4D.

      Minor comments 

      (1) Fig. 1. A surprisingly large number of compounds scored positive in the primary screen for inhibition of Topbp1 condensation (>300). Of the 131 of these selected for secondary screening using Chk1 activation (S345 phosphorylation) as a readout approximately 2/3 were negative, implying that a majority of the tested compounds inhibited Topbp1 condensation but not Chk1 activation. What could explain that?

      Thank you for this thoughtful comment. The discrepancy between the large number of compounds scoring positive for TopBP1 condensation inhibition and the smaller number inhibiting Chk1 activation (S345 phosphorylation) could be attributed to several factors:

      • Different cell lines and induction methods: The initial screen was conducted in HEK293 TrexFlpin cells overexpressing optoTopBP1, while the secondary screen used HCT116 cells. In addition, the methods used to induce the respective pathways were distinct: in the primary screen, we employed a blue light induction of opto-TopBP1 condensates, whereas in the secondary screen, we used an SN-38 treatment to induce DNA replication stress and activate the Chk1 pathway. These differences could account for the varying responses observed in the two screens.

      • The compounds that inhibited TopBP1 condensation might not fully block Chk1 activation. While they disrupt TopBP1 condensation, they may still allow for partial activation of Chk1 or Chk1 activation through alternative mechanisms. For instance, Chk1 activation could be mediated by other signaling pathways or molecules, such as ETAA1, a known Chk1 activator (1). Thus, TopBP1 condensation inhibition does not necessarily translate to complete inhibition of Chk1 activation, especially if ETAA1 is employed by cells as a rescue activator.

      • Some compounds may affect chromosome dynamics, potentially generating mechanical forces or torsional stress that could activate the ATR/Chk1 pathway independently of TopBP1

      (2).

      These factors suggest that while the compounds effectively disrupt TopBP1 condensation, they may not always fully inhibit the downstream Chk1 activation, pointing to the complexity of the DNA damage response pathways. 

      (1) Bass, T. E. et al. ETAA1 acts at stalled replication forks to maintain genome integrity. Nat Cell Biol 18, 1185–1195 (2016).

      (2) Kumar, A. et al. ATR Mediates a Checkpoint at the Nuclear Envelope in Response to Mechanical Stress. Cell 158, 633–646 (2014).

      (2) Fig. 2D. The protein-protein interaction assay shown demonstrates that AZD2858 ablates the light-induced auto-interaction between exogenous opto-Topbp1 molecules and ATR plus or minus SN-38, but clearly endogenous Topbp1 molecules do not participate. Why is this? 

      The biotin proximity labeling assay was conducted without exposing cells to light, using a TurboID module fused to TopBP1-mCherry-CRY2. Stable cell lines were then generated in HEK293 TrexFlpIn cells, where endogenous TopBP1 is still expressed. Upon adding doxycycline, the recombinant TurboID-TopBP1-mCherry-Cry2 (opto-TopBP1) is induced at levels comparable to endogenous TopBP1 (Fig 2D).

      Since the opto-TopBP1 construct exhibits behavior similar to that of endogenous TopBP1 (1), we used it to investigate whether TopBP1 self-assembly and its interaction with ATR are influenced by AZD2858 alone or in combination with SN38. Our results show that treatment with SN38 increases the proximity between opto-TopBP1 and the endogenous TopBP1 (not fused to TurboID). However, AZD2858, either alone or in combination with SN38, disrupts the selfassembly of recombinant TopBP1 with itself as well as its interaction with endogenous TopBP1.

      (1) Frattini C, Promonet A, Alghoul E, Vidal-Eychenie S, Lamarque M, Blanchard MP, et al. TopBP1 assembles nuclear condensates to switch on ATR signaling. Molecular Cell. 18 mars 2021;81(6):1231-1245.e8.

      Reviewer #3 (Significance (Required)): 

      Significance 

      Liquid phase separation of protein complexes is increasingly recognised as a fundamental mechanism in signal transduction and other cellular processes. One recent and important example was that of Topbp1, whose condensation in response to DNA damage is required for efficient activation of the ATR-Chk1 pathway. The current study asks a related but distinct question; can protein condensation be targeted by drugs to manipulate signalling pathways which in the main rely on protein kinase cascades? 

      Here, the authors identify an inhibitor of GSK3-beta as a novel inhibitor of DNA damage-induced Topbp1 condensation and thus of ATR-Chk1 signalling. 

      This work will be of interest to researchers in the fields of DNA damage signalling, biophysics of protein condensation, and cancer chemotherapy.

    1. eLife Assessment

      This valuable study focuses on defining how the HSP70 chaperone system utilizes J-domain proteins to regulate the heat shock response-associated transcription factor HSF1. Using a combination of orthogonal techniques in yeast, this manuscript provides compelling evidence that the J-domain protein Apj1 facilitates attenuation of HSF1 transcriptional activity through a mechanism involving its dissociation from heat shock gene promoter regions. This work improves our understanding of HSF1 regulation and will be of broad interest to cell biologists interested in proteostasis, chaperone networks, and stress-responsive signaling.

    2. Reviewer #1 (Public review):

      Summary:

      In this study, the authors present a thorough mechanistic study of the J-domain protein Apj1 in Saccharomyces cerevisiae, establishing it as a key repressor of Hsf1 during the attenuation phase of the heat shock response (HSR). The authors integrate genetic, transcriptomic (ribosome profiling), biochemical (ChIP, Western), and imaging data to dissect how Apj1, Ydj1, and Sis1 modulate Hsf1 activity under stress and non-stress conditions. The work proposes a model where Apj1 specifically promotes displacement of Hsf1 from DNA-bound heat shock elements, linking nuclear PQC to transcriptional control.

      Strengths:

      Overall, the work is highly novel - this is the first detailed functional dissection of Apj1 in Hsf1 attenuation. It fills an important gap in our understanding of how Hsf1 activity is fine-tuned after stress induction, with implications for broader eukaryotic systems. I really appreciate the use of innovative techniques, including ribosome profiling and time-resolved localization of proteins (and tagged loci) to probe the Hsf1 mechanism. The overall proposed mechanism is compelling and clear - the discussion proposes a phased control model for Hsf1 by distinct JDPs, with Apj1 acting post-activation, while Sis1 and Ydj1 suppress basal activity.

      The manuscript is well-written and will be exciting for the proteostasis field and beyond.

    3. Reviewer #2 (Public review):

      Despite over 50 years of investigation, our understanding of how the ubiquitous heat shock response, governed by the transcription factor HSF1, was regulated was minimal. In recent years, a coordinated yet simple negative feedback circuit has been elucidated in high detail that centers on the chaperone Hsp70 as a direct-binding inhibitor of HSF1 transcriptional activation. However, roles for the obligatory Hsp70 J-domain partner co-chaperones are currently poorly understood. The present study applies several orthogonal techniques to the question and uncovers an unexpected role for the nuclear JDP Apj1 in attenuation of the heat shock response (HSR) via removal of Hsf1 from HSEs in heat shock gene promoter regions. Interestingly, Apj1 appears to play no role in initiating repression of Hsf1, as null mutants do not exhibit constitutive derepression of the HSR. This role is likely filled by the general nucleo/cytoplasmic JDP Ydj1, as previously reported. These results enhance understanding of HSR regulation and underscore the pivotal role that chaperones play in controlling pro-survival gene expression.

      Overall, the work is exceptionally well done and controlled, and the results are properly and appropriately interpreted. Several of the approaches, while powerful, are somewhat indirect (i.e., following gene expression via ribosomal profiling) but ultimately provide a compelling answer to the main question being asked. However, at the end of the day, there is really only one major finding here: Apj1 regulates Hsf1 attenuation via Hsp70. That finding is strongly supported by the experimental data but lacks the one piece of mechanistic evidence found in other recent papers - differential binding of Ssa1/2 to Hsf1 at either the N- or C-terminal binding sites.

    4. Reviewer #3 (Public review):

      Summary:

      The heat shock response (HSR) is an inducible transcriptional program that has provided paradigmatic insight into how stress cues feed information into the control of gene expression. The recent elucidation that the chaperone Hsp70 controls the DNA binding activity of the central HSR transcription factor Hsf1 by direct binding has spurred the question of how such a general chaperone obtains specificity. This study has addressed the next logical question: how J-domain proteins execute this task in budding yeast, the leading cell model for studying the HSR. While an involvement and in part overlapping function of general class A and B J-domain proteins, Ydj1 and Sis1 are indicated by the genetic analysis, a highly specific role for the class A Apj1 in displacing Hsf1 from the promoters is found, unveiling specificity in the system.

      Strengths

      The central strong point of the paper is the identification of class A J-domain protein Apj1 as a specific regulator of the attenuation of the HSR by removing Hsf1 from HSEs at the promoters. The genetic evidence and the ChIP data strongly support this claim. This identification of a specific role for a lowly expressed nuclear J-domain protein changes how the wiring of the HSR should be viewed. It also raises important questions regarding the model of chaperone titration, the concept that a chaperone with limited availability is involved in a tug of war involving competing interactions with misfolded protein substrates and regulatory interactions with Hsf1. Perhaps Apj1, with its low levels and interactions with misfolded and aggregated proteins in the nucleus, is the titrated Hsp70 (co)chaperone that determines the extent of the HSR? This would mean that Apj1 is at the nexus of the chaperone titration mechanism. Although Apj1 is not a highly conserved J domain protein among eukaryotes the strength of the study is that is provides a conceptual framework for what may be required for chaperone titration in other eukaryotes: One or more nuclear J-domain proteins with low nuclear levels that has an affinity for Hsf1 and that can become limiting due to interactions with misfolded Hsp70 proteins. The provides a pathway for how these may be identified using, for example, ChIP-seq.

      Weaknesses

      A built-in challenge when studying the mechanism of the HSR is the general role of the Hsp70 chaperone system and its J domain proteins. Indeed, a weakness of the study is that it is unclear which of the phenotypic effects have to do with directly recruiting Hsp70 to Hsf1 dependent on a J domain protein and what instead is an indirect effect of protein misfolding caused by the mutation. This interpretation problem is clearly and appropriately dealt with in the manuscript text and in experiments, but is of such fundamental nature that it cannot easily be fully ruled out. One way forward is a reconstituted biochemical system that monitors how Hsf1 DNA binding is affected by the Hsp70 system, misfolded proteins, and the various J domain proteins. Yet this approach is clearly beyond the scope of this study.

    5. Author response:

      Reviewer 1:

      We thank the reviewer for his/her very positive comments.

      Reviewer 2:

      We thank the reviewer for his/her positive evaluation. We plan to add RNAseq data of yeast wild-type and JDP mutant strains as more direct readout for the role of Apj1 in controlling Hsf1 activity. We agree with the reviewer that our study includes one major finding: the central role of Apj1 in controlling the attenuation phase of the heat shock response. In accordance with the reviewer we consider this finding highly relevant and interesting for a broad readership. We agree that additional studies are now necessary to mechanistically dissect how the diverse JDPs support Hsp70 in controlling Hsf1 activity. We believe that such analysis should be part of an independent study but we will indicate this aspect as part of an outlook in the discussion section of a revised manuscript.

      Reviewer 3:

      We thank the reviewer for his/her suggestions. We agree that it is sometimes difficult to distinguish direct effects of JDP mutants on heat shock regulation from indirect ones, which can result from the accumulation of misfolded proteins that titrate Hsp70 capacity. We also agree that an in vitro reconstitution of Hsf1 displacement from DNA by Apj1/Hsp70 will be important, also to dissect Apj1 function mechanistically. We will add this point as outlook to the revised manuscript.

    1. eLife Assessment

      This important and creative study finds that the uplift of the Qinghai-Tibet Plateau-via its resultant monsoon system rather than solely its high elevation-has shifted avian migratory directions from a latitudinal to a longitudinal orientation. However, the main claims are incomplete and only partially supported, as the reliance on eBird data-which lacks the resolution to capture population-specific teleconnections-combined with a limited tracking dataset covering only seven species leaves key aspects of the argument underdetermined, and the critical assumption of niche conservatism is not sufficiently foregrounded in the manuscript. More clearly communicating these limitations would significantly enhance the interpretability of the results, ensuring that the major conclusions are presented in the context of these essential caveats.

    2. Reviewer #1 (Public review):

      Strengths:

      This is an interesting topic and a novel theme. The visualisations and presentation are to a very high standard. The Introduction is very well-written and introduces the main concepts well, with a clear logical structure and good use of the literature. The Methods are detailed and well described and written in such a fashion that they are transparent and repeatable.

      Weaknesses:

      I only have one major issue, which is possibly a product of the structure requirements of the paper/journal. With the Results and Discussion, line 91 onwards. I understand the structure of the paper necessitates delving immediately into the results, but it is quite hard to follow due to lack of background information. In comparison to the Methods, which are incredibly detailed, the Results in the main section read quite superficial. They provide broad overviews of broad findings but I found it very hard to actually get a picture of the main results in its current form. For example, how the different species factor in, etc.

      The authors have done a good job of responding to the reviewer's comments, and the paper is now much improved.

    3. Reviewer #2 (Public review):

      I would like to thank the authors for the revision and the input they invested in this study.

      With the revised text of the study, my earlier criticism holds, and your arguments about the counterfactual approach are irrelevant to that. The recent rise of the counterfactual approach might likely mirror the fact that there are too many scientists behind their computers, and few go into the field to collect in situ data. Studies like the one presented here are a good intellectual exercise but the real impact is questionable. All your main conclusions are inferred from published studies on 7! bird species. In addition, spatial sampling in those seven species was not ideal in relation to your target questions. Thus, no matter how fancy your findings look, the basic fact remains that your input data were for 7 bird species only! Your conclusion, „our study provides a novel understanding of how QTP shapes migration patterns of birds, " is simply overstretching.

      The way you respond to my criticism on L 81-93 is something different than what you admit in the rebuttal letter. The text of the ms is silent about the drawbacks and instead highlights your perspective. I understand you; you are trying to sell the story in a nice wrapper. In the rebuttal you state: „we assume species' responses to environments are conservative and their evolution should not discount our findings." But I do not see that clearly stated in the main text.

      In your rebuttal, you respond to my criticism of "No matter how good the data eBird provides is, you do not know population-specific connections between wintering and breeding sites" when you responded: ... "we can track the movement of species every week, and capture the breeding and wintering areas for specific populations" I am having a feeling that you either play with words with me or do not understand that from eBird data nobody will be ever able to estimate population-specific teleconnections between breeding and wintering areas. It is simply impossible as you do not track individuals. eBird gives you a global picture per species but not for particular populations. You cannot resolve this critical drawback of your study. I am sorry that you invested so much energy into this study, but I see it as a very limited contribution to understanding the role of a major barrier in shaping migration.

      My modest suggestion for you is: go into the field. Ideally use bird radars along the plateau to document whether the birds shift the directions when facing the barrier.

    4. Author response:

      The following is the authors’ response to the current reviews.

      eLife Assessment

      This important and creative study finds that the uplift of the Qinghai-Tibet Plateau-via its resultant monsoon system rather than solely its high elevation-has shifted avian migratory directions from a latitudinal to a longitudinal orientation. However, the main claims are incomplete and only partially supported, as the reliance on eBird data-which lacks the resolution to capture population-specific teleconnections-combined with a limited tracking dataset covering only seven species leaves key aspects of the argument underdetermined, and the critical assumption of niche conservatism is not sufficiently foregrounded in the manuscript. More clearly communicating these limitations would significantly enhance the interpretability of the results, ensuring that the major conclusions are presented in the context of these essential caveats.

      We appreciate your positive comments and constructive suggestions. We fully acknowledge your concerns about clearly communicating the limitations associated with the data used and analytical assumptions. We will try to get more satellite tracking data of birds migrating across the plateau. We will carefully consider the insights that our paper can deliver and make sure the limitations of our datasets and the critical assumption of niche conservatism are clearly presented. By explicitly clarifying these caveats, we believe the transparency and interpretability of the findings will be much improved.

      Public Reviews:

      Reviewer #1 (Public review):

      The authors have done a good job of responding to the reviewer's comments, and the paper is now much improved.

      Again, we thank the reviewer for constructive comments during review.

      Reviewer #2 (Public review):

      I would like to thank the authors for the revision and the input they invested in this study.

      We are grateful for your thoughtful feedback and enthusiasms, which will help us improve our manuscript.

      With the revised text of the study, my earlier criticism holds, and your arguments about the counterfactual approach are irrelevant to that. The recent rise of the counterfactual approach might likely mirror the fact that there are too many scientists behind their computers, and few go into the field to collect in situ data. Studies like the one presented here are a good intellectual exercise but the real impact is questionable.

      We understand your question about the relevance of the counterfactual approach used in our study. Our intent in using a counterfactual scenario (reconstructing migration patterns assuming pre-uplift conditions on the QTP) was to isolate the potential influence of the plateau’s geological history on current migration routes. We agree that such an approach must be used properly. In the revision, we will explicitly clarify why this counterfactual comparison is useful – namely, it provides a theoretical baseline to test how much the QTP’s uplift (and the associated monsoon system) might have redirected migration paths. We acknowledge that the counterfactual results are theoretical and will explicitly emphasise the assumptions involved (e.g. species–environment relationships hold between pre- and post- lift environments) in the main text. Nonetheless, we defend the approach as a valuable study design: it helps generate testable hypotheses about migration (for instance, that the plateau’s monsoon-driven climate, rather than just its elevation, introduces an east–west shift en route). We will also tone down the language around this analysis to avoid overstating its real-world relevance. In summary, we will clarify that the counterfactual analysis is meant to complement, not replace, empirical observations, and we will discuss its limitations so that its role is appropriately bounded in the paper.

      All your main conclusions are inferred from published studies on 7! bird species. In addition, spatial sampling in those seven species was not ideal in relation to your target questions. Thus, no matter how fancy your findings look, the basic fact remains that your input data were for 7 bird species only! Your conclusion, “our study provides a novel understanding of how QTP shapes migration patterns of birds” is simply overstretching.

      Thank you for your comments. We apologise for any confusion regarding the scope of our dataset. Our main conclusions are not solely derived from seven bird species. Rather, we integrated a full list of 50 bird species that migrate across the QTP and analysed their migratory patterns with eBird data. We studied the factors influencing their choices of migratory routes with seven species that were among the few with available tracking data across the QTP. In this revision, we will clarify the role of these seven species and the rationale for their selection. Additionally, we attempt to include more satellite tracking data to improve spatial coverage, as recommended by the reviewer and editor. Based on discussions with potential collaborators, we will hopefully include a number of at least 10 more species with available tracking data.

      The way you respond to my criticism on L 81-93 is something different than what you admit in the rebuttal letter. The text of the ms is silent about the drawbacks and instead highlights your perspective. I understand you; you are trying to sell the story in a nice wrapper. In the rebuttal you state: “we assume species' responses to environments are conservative and their evolution should not discount our findings.” But I do not see that clearly stated in the main text.

      Thanks, as suggested we will clearly state the assumptions of niche conservatism in the Introduction.

      In your rebuttal, you respond to my criticism of "No matter how good the data eBird provides is, you do not know population-specific connections between wintering and breeding sites" when you responded: ... "we can track the movement of species every week, and capture the breeding and wintering areas for specific populations" I am having a feeling that you either play with words with me or do not understand that from eBird data nobody will be ever able to estimate population-specific teleconnections between breeding and wintering areas. It is simply impossible as you do not track individuals. eBird gives you a global picture per species but not for particular populations. You cannot resolve this critical drawback of your study.

      We agree that inferring population-specific migratory connections (teleconnections) from eBird data is challenging and inherently limited. eBird provides occurrence records for species, but it generally cannot distinguish which breeding population an individual bird came from or exactly where it goes for winter. However, in this study we intend to infer broad-scale movement patterns (e.g. general directions and stopover regions) rather than precise one-to-one population linkages. In the revision, we will carefully rephrase those sections to make clear that our inferences are at the species level and at large spatial scales. We will also explicitly state in the Discussion that confirming population connectivity would require targeted tracking or genetic studies, and that our eBird-based analysis can only suggest plausible routes and region-to-region linkages. We will contrast migratory routes identified by using eBird data and satellite tracking for the same species to check their similarity. We argue that, even with its limits, the eBird dataset can still yield useful insights (such as identifying major flyway corridors over the QTP).

      I am sorry that you invested so much energy into this study, but I see it as a very limited contribution to understanding the role of a major barrier in shaping migration.

      Thank you for recognising our efforts in the study. By integrating both satellite tracking and community-contributed data, we explored how the uplift of the QTP could shape avian migration across the area. We believe our findings provide important insights of how birds balance their responses to large-scale climate change and geological barrier, which yields the most comprehensive picture to date of how the QTP uplift shapes migratory patterns of birds. We will also acknowledge the study’s limitations to ensure that readers understand the context and constraints of our findings.

      My modest suggestion for you is: go into the field. Ideally use bird radars along the plateau to document whether the birds shift the directions when facing the barrier.

      We appreciate your suggestions to incorporate field tracking or radar studies to strengthen our results. All coauthors have years of field experiences, even on the QTP and Arctic. For example, the tracking data of peregrine falcons (Falco peregrinus) that we will incorporate in the revision are collected with during our own fieldwork in the Arctic for more than six years. We agree that more direct tracking (through GPS tagging or radar) would be an ideal way to validate migration pathways and population connectivity. In this revision, as stated above we will try to more species with satellite tracking data. We will also note that future studies should build on our findings by using dedicated tracking of more individual birds and radar monitoring of migration over the QTP. We will cite recent advances in these techniques and suggest that incorporating more tracking data could further test the hypotheses generated by our analyses.

      Recommendations for the authors:

      Reviewer #2 (Recommendations for the authors):

      L55 "an important animal movement behaviour is.." Is there any unimportant animal movement? I mean this sentence is floppy, empty.

      We will rewrite this sentence to remove any ambiguous phrasing.

      L 152-154 This sentence is full of nonsense or you misinterpretation. First of all, the issue of inflexible initiation of migration was related to long-distance migrants only! The way you present it mixes apples and oranges (long- and short-distance migrants). It is not "owing to insufficient responses" but due to inherited patterns of when to take off, photoperiod and local conditions.

      We will remove the sentence to avoid misinterpretation.

      L 158 what is a migration circle? I do not know such a term.

      We will amend it as “annual migration cycle”, which is a more common way to describe the yearly round-trip journey between breeding and wintering grounds of birds.

      L 193 The way you present and mix capital and income breeding theory with your simulation study is quite tricky and super speculative.

      We will present this idea as an inference rather than a conclusion: “This pattern could be consistent with a ‘capital breeding’ strategy — where birds rely on energy reserves acquired before breeding — rather than an ‘income’ strategy that depends on food acquired during breeding. However, we note that this interpretation would require further study.” By adding this caution, we will make it clear that we are not asserting this link as proven fact, only suggesting it as one possible explanation. We will also double-check that the rest of the discussion around this point is framed appropriately.


      The following is the authors’ response to the previous reviews

      eLife Assessment

      This study addresses a novel and interesting question about how the rise of the Qinghai-Tibet Plateau influenced patterns of bird migration, employing a multi-faceted approach that combines species distribution data with environmental modeling. The findings are valuable for understanding avian migration within a subfield, but the strength of evidence is incomplete due to critical methodological assumptions about historical species-environment correlations, limited tracking data, and insufficient clarity in species selection criteria. Addressing these weaknesses would significantly enhance the reliability and interpretability of the results.

      We would like to thank you and two anonymous reviewers for your careful, thoughtful, and constructive feedback on our manuscript. These reviews made us revisit a lot of our assumptions and we believe the paper is much improved as a result. In addition to minor points, we have made three main changes to our manuscript in response to the reviews. First, we addressed the concerns on the assumptions of historical species-environment correlations from perspectives of both theoretical and empirical evidence. Second, we discussed the benefits and limitations of using tracking data in our study and demonstrate how the findings of our study are consolidated with results of previous studies. Third, we clarified our criteria for selecting species in terms of both eBird and tracking data.

      Below, we respond to each comment in turn. Once again, we thank you all for your feedback.

      Public Reviews:

      Reviewer #1 (Public review):

      Strengths:

      This is an interesting topic and a novel theme. The visualisations and presentation are to a very high standard. The Introduction is very well-written and introduces the main concepts well, with a clear logical structure and good use of the literature. The methods are detailed and well described and written in such a fashion that they are transparent and repeatable.

      We are appreciative of the reviewer’s careful reading of our manuscript, encouraging comments and constructive suggestions.

      Weaknesses:

      I only have one major issue, which is possibly a product of the structure requirements of the paper/journal. This relates to the Results and Discussion, line 91 onwards. I understand the structure of the paper necessitates delving immediately into the results, but it is quite hard to follow due to a lack of background information. In comparison to the Methods, which are incredibly detailed, the Results in the main section reads as quite superficial. They provide broad overviews of broad findings but I found it very hard to actually get a picture of the main results in its current form. For example, how the different species factor in, etc.

      Yes, it is the journal request to format in this way (Methods follows the Results and Discussion) for the article type of short reports. As suggested, in the revision we have elaborated on details of our findings, in terms of (i) shifts of distribution of avian breeding and wintering areas under the influence of the uplift of the Qinghai-Tibet Plateau (Lines 102-116), and (ii) major factors that shape current migration patterns of birds in the plateau (Lines 118-138). We have also better referenced the approaches we used in the study.

      Reviewer #2 (Public review):

      Summary:

      The study tries to assess how the rise of the Qinghai-Tibet Plateau affected patterns of bird migration between their breeding and wintering sites. They do so by correlating the present distribution of the species with a set of environmental variables. The data on species distributions come from eBird. The main issue lies in the problematic assumption that species correlations between their current distribution and environment were about the same before the rise of the Plateau. There is no ground truthing and the study relies on Movebank data of only 7 species which are not even listed in the study. Similarly, the study does not outline the boundaries of breeding sites NE of the Plateau. Thus it is absolutely unclear potentially which breeding populations it covers.

      We are very grateful for the careful review and helpful suggestions. We have revised the manuscript carefully in response to the reviewer’s comments and believe that it is much improved as a result. Below are our point-by-point replies to the comments.

      Strengths:

      I like the approach for how you combined various environmental datasets for the modelling part.

      We appreciate the reviewer’s encouragement.

      Weaknesses:

      The major weakness of the study lies in the assumption that species correlations between their current distribution and environments found today are back-projected to the far past before the rise of the Q-T Plateau. This would mean that species responses to the environmental cues do not evolve which is clearly not true. Thus, your study is a very nice intellectual exercise of too many ifs.

      This is a valid concern. We have addressed this from both the perspectives of the theoretical design of our study and empirical evidence.

      First, we agree with the reviewer that species responses to environmental cues might vary over time. Nonetheless, the simulated environments before the uplift of the plateau serve as a counterfactual state in our study. Counterfactual is an important concept to support causation claims by comparing what happened to what would have happened in a hypothetical situation: “If event X had not occurred, event Y would not have occurred” (Lewis 1973). Recent years have seen an increasing application of the counterfactual approach to detect biodiversity change, i.e., comparing diversity between the counterfactual state and real estimates to attribute the factors causing such changes (e.g., Gonzalez et al. 2023). Whilst we do not aim to provide causal inferences for avian distributional change, using the counterfactual approach, we are able to estimate the influence of the plateau uplift by detecting the changes of avian distributions, i.e., by comparing where the birds would have distributed without the plateau to where they currently distributed. We regard the counterfactual environments as a powerful tool for eliminating, to the extent possible, vagueness, as opposed to simply description of current distributions of birds. Therefore, we assume species’ responses to environments are conservative and their evolution should not discount our findings. We have clarified this in the Introduction (Lines 81-93).

      Second, we used species distribution modelling to contrast the distributions of birds before and after the uplift of the plateau under the assumption that species tend to keep their ancestral ecological traits over time (i.e., niche conservatism). This indicates a high probability for species to distribute in similar environments wherever suitable. Particularly, considering bird distributions are more likely to be influenced by food resources and vegetation distributions (Qu et al. 2010, Li et al. 2021, Martins et al. 2024), and the available food and vegetation before the uplift can provide suitable habitats for birds (Jia et al. 2020), we believe the findings can provide valuable insights into the influence of the plateau rise on avian migratory patterns. Having said that, we acknowledge other factors, e.g., carbon dioxide concentrations (Zhang et al. 2022), can influence the simulations of environments and our prediction of avian distribution. We have clarified the assumptions and evidence we have for the modelling in Methods (Lines 362-370).

      The second major drawback lies in the way you estimate the migratory routes of particular birds. No matter how good the data eBird provides is, you do not know population-specific connections between wintering and breeding sites. Some might overwinter in India, some populations in Africa and you will never know the teleconnections between breeding and wintering sites of particular species. The few available tracking studies (seven!) are too coarse and with limited aspects of migratory connectivity to give answer on the target questions of your study.

      We agree with the reviewer that establishing interconnections for birds is important for estimating the migration patterns of birds. We employed a dynamic model to assess their weekly distributions. Thus, we can track the movement of species every week, and capture the breeding and wintering areas for specific populations. That being said, we acknowledge that our approach can be subjected to the patchy sampling of eBird data. In contrast, tracking data can provide detailed information of the movement patterns of species but are limited to small numbers of species due to the considerable costs and time needed. We aimed to adopt the tracking data to examine the influence of focal factors on avian migration patterns, but only seven species, to the best of our ability, were acquired. Moreover, similar results were found in studies that used tracking data to estimate the distribution of breeding and wintering areas of birds in the plateau (e.g., Prosser et al. 2011, Zhang et al. 2011, Zhang et al. 2014, Liu et al. 2018, Kumar et al. 2020, Wang et al. 2020, Pu and Guo 2023, Yu et al. 2024, Zhao et al. 2024). We believe the conclusions based on seven species are rigour, but their implications could be restricted by the number of tracking species we obtained. We have better demonstrated how our findings on breeding and wintering areas of birds are reinforced by other studies reporting the locations of those areas. We have also added a separate caveat section to discuss the limitations stated above (Lines 202-215).

      Your set of species is unclear, selection criteria for the 50 species are unknown and variability in their migratory strategies is likely to affect the direction of the effects.

      In this revision, we have clarified the selection criteria for the 50 species and outlined the boundaries of the breeding areas of all birds (Lines 243-249). Briefly, we first obtained a full list of birds in the plateau from Prins and Namgail (2017). We then extracted species identified as full migrants in Birdlife International (https://datazone.birdlife.org/species/spcdistPOS) from the full list. Migratory birds may follow a capital or income migratory strategy depending on how much birds ingest endogenous reserved energy gained prior to reproduction. We have added discussions on how these migratory strategies might influence the effects of environment on migratory direction (Lines 183-200).

      In addition, the position of the breeding sites relative to the Q-T plate will affect the azimuths and resulting migratory flyways. So in fact, we have no idea what your estimates mean in Figure 2.

      We calculated the azimuths not only by the angles between breeding sites and wintering sites but also based on the angles between the stopovers of birds. Therefore, the azimuths are influenced by the relative positions of breeding, wintering and stopover sites. This would minimize the possible errors by just using breeding areas such as the biases caused by relative locations of breeding areas to the QTP as the reviewer pointed. We have better explained this both in the Introduction, Methods and legend of Figure 2.

      There is no way one can assess the performance of your statistical exercises, e.g. performances of the models.

      As suggested, we have reported Area Under the Curve (AUC) of the Receiver Operator Characteristic (ROC)assess the performances of the models (Table S1). AUC is a threshold-independent measurement for discrimination ability between presence and random points (Phillips et al. 2006). When the AUC value is higher than 0.75, the model was considered to be good (Elith et al. 2006). (Lines 379-383).

      Recommendations for the authors:

      Reviewer #1 (Recommendations for the authors):

      This is an interesting topic and a novel theme. The visualisations and presentation are to a very high standard. The Introduction is very well-written and introduces the main concepts well, with a clear logical structure and good use of the literature. The Methods are detailed and well described and written in such a fashion that they are transparent and repeatable.

      I only have one major issue, which is possibly a product of the structure requirements of the paper/journal. With the Results and Discussion, line 91 onwards. I understand the structure of the paper necessitates delving immediately into the results, but it is quite hard to follow due to a lack of background information. In comparison to the Methods, which are incredibly detailed, the Results in the main section read quite superficial. They provide broad overviews of broad findings but I found it very hard to actually get a picture of the main results in its current form. For example, how the different species factor in, etc.

      Please see our responses above.

      Reviewer #2 (Recommendations for the authors):

      Methodological issues:

      Line 219 Why have you selected only 64 species and what were the selection criteria?

      We have clarified the selection criteria (Lines 243-248). Briefly, we first obtained a full list of birds in the plateau from Prins and Namgail (2017). We then extracted species identified as full migrants in Birdlife International (https://datazone.birdlife.org/species/spcdistPOS) from the full list.

      Minor:

      Line 219 eBird has very uneven distribution, especially in vast areas of Russia. How can your exercise on Lines 232-238 overcome this issue?

      Yes, eBird data can be biased due to patchy sampling and variation of observers’ skills in identifying species. To address this issue, we have developed an adaptive spatial-temporal modelling (stemflow; Chen et al. 2024) to correct the imbalance distribution of data and modelled the observer experience to address the bias in recognising species. The stemflow was developed based on a machine learning modelling framework (AdaSTEM) which leverages the spatio-temporal adjacency information of sample points to model occurrence or abundance of species at different scales. It has been frequently used in modelling eBird data (Fink et al. 2013, Johnston et al. 2015, Fink et al. 2020) and has been proven to be efficient and advanced in multi-scale spatiotemporal data modelling. We have better explained this (Lines 251-270; Lines 307-321).

      Line 54 This sentence sounds very empty and in fact does not tell us much.

      We have adjusted this sentenced to “Animal movement underpins species’ spatial distributions and ecosystem processes”.

      Line 55 Again a sentence that implies a causality of the annual cycle to make the species migrate. It does not make sense.

      We have revised this sentence as “An important animal movement behaviour is migrating between breeding and wintering grounds”.

      Line 58 How is our fascination with migratory journeys related to the present article? I think this line is empty.

      We have changed this sentence to “Those migratory journeys have intrigued a body of different approaches and indicators to describe and model migration, including migratory direction, speed, timing, distance, and staging periods”.

      Figure 1 - ABC insets are OK, but a combination of lati- and longitudinal patterns is possible, e.g. in species with conservative strategies or for whatever other reason.

      Thank you for the suggestion. We kept the ABC insets rather than combining them together as we believe this can deliver a clear structure of influence of QTP uplift under different scenarios.

      The legend to Figure 2 is not self-explanatory. Please make it clear what the response variable is and its units. The first line of the legend should read something like The influence of environmental factors on the direction of avian migration.

      Thank you. We have amended the legends of Figure 2 as suggested:

      “Figure 2. The influence of environmental factors on the direction of avian migration.  Migratory directions are calculated based on the azimuths between each adjacent stopover, breeding and wintering areas for each species. We employ multivariate linear regression models under the Bayesian framework to measure the correlation between environmental factors and avian migratory directions. Wind represents the wind cost calculated by wind connectivity. Vegetation is measured by the proportion of average vegetation cover in each pixel (~1.9° in latitude by 2.5° in longitude). Temperature is the average annual temperature. Precipitation is the average yearly precipitation. All environmental layers are obtained using the Community Earth System Model. West QTP, central QTP, and East QTP denote areas in the areas west (longitude < 73°E), central (73°E ≤ longitude < 105°E), and east of (longitude ≥ 105°E) the Qinghai-Tibet Plateau, respectively.”

      References

      Chen, Y., Z. Gu, and X. Zhan. 2024. stemflow: A Python Package for Adaptive Spatio-Temporal Exploratory Model. Journal of Open Source Software 9:6158.

      Elith, J., C. H. Graham, R. P. Anderson, M. Dudík, S. Ferrier, A. Guisan, R. J. Hijmans, F. Huettmann, J. R. Leathwick, A. Lehmann, J. Li, L. G. Lohmann, B. A. Loiselle, G. Manion, C. Moritz, M. Nakamura, Y. Nakazawa, J. McC. M. Overton, A. Townsend Peterson, S. J. Phillips, K. Richardson, R. Scachetti-Pereira, R. E. Schapire, J. Soberón, S. Williams, M. S. Wisz, and N. E. Zimmermann. 2006. Novel methods improve prediction of species' distributions from occurrence data. Ecography 29:129-151.

      Fink, D., T. Auer, A. Johnston, V. Ruiz-Gutierrez, W. M. Hochachka, and S. Kelling. 2020. Modeling avian full annual cycle distribution and population trends with citizen science data. Ecological Applications 30:e02056.

      Fink, D., T. Damoulas, and J. Dave. 2013. Adaptive Spatio-Temporal Exploratory Models: Hemisphere-wide species distributions from massively crowdsourced eBird data. Pages 1284-1290 in Proceedings of the AAAI Conference on Artificial Intelligence.

      Gonzalez, A., J. M. Chase, and M. I. O'Connor. 2023. A framework for the detection and attribution of biodiversity change. Philosophical Transactions of the Royal Society B: Biological Sciences 378.

      Jia, Y., H. Wu, S. Zhu, Q. Li, C. Zhang, Y. Yu, and A. Sun. 2020. Cenozoic aridification in Northwest China evidenced by paleovegetation evolution. Palaeogeography, Palaeoclimatology, Palaeoecology 557:109907.

      Johnston, A., D. Fink, M. D. Reynolds, W. M. Hochachka, B. L. Sullivan, N. E. Bruns, E. Hallstein, M. S. Merrifield, S. Matsumoto, and S. Kelling. 2015. Abundance models improve spatial and temporal prioritization of conservation resources. Ecological Applications 25:1749-1756.

      Kumar, N., U. Gupta, Y. V. Jhala, Q. Qureshi, A. G. Gosler, and F. Sergio. 2020. GPS-telemetry unveils the regular high-elevation crossing of the Himalayas by a migratory raptor: implications for definition of a “Central Asian Flyway”. Scientific Reports 10:15988.

      Lewis, D. 1973. Counterfactuals. Oxford: Blackwell.

      Li, S.-F., P. J. Valdes, A. Farnsworth, T. Davies-Barnard, T. Su, D. J. Lunt, R. A. Spicer, J. Liu, W.-Y.-D. Deng, J. Huang, H. Tang, A. Ridgwell, L.-L. Chen, and Z.-K. Zhou. 2021. Orographic evolution of northern Tibet shaped vegetation and plant diversity in eastern Asia. Science Advances 7:eabc7741.

      Liu, D., G. Zhang, H. Jiang, and J. Lu. 2018. Detours in long-distance migration across the Qinghai-Tibetan Plateau: individual consistency and habitat associations. PeerJ 6:e4304.

      Martins, L. P., D. B. Stouffer, P. G. Blendinger, K. Böhning-Gaese, J. M. Costa, D. M. Dehling, C. I. Donatti, C. Emer, M. Galetti, R. Heleno, Í. Menezes, J. C. Morante-Filho, M. C. Muñoz, E. L. Neuschulz, M. A. Pizo, M. Quitián, R. A. Ruggera, F. Saavedra, V. Santillán, M. Schleuning, L. P. da Silva, F. Ribeiro da Silva, J. A. Tobias, A. Traveset, M. G. R. Vollstädt, and J. M. Tylianakis. 2024. Birds optimize fruit size consumed near their geographic range limits. Science 385:331-336.

      Phillips, S. J., R. P. Anderson, and R. E. Schapire. 2006. Maximum entropy modeling of species geographic distributions. Ecological Modelling 190:231-259.

      Prins, H. H. T., and T. Namgail. 2017. Bird migration across the Himalayas : wetland functioning amidst mountains and glaciers. Cambridge University Press, Cambridge.

      Prosser, D. J., P. Cui, J. Y. Takekawa, M. Tang, Y. Hou, B. M. Collins, B. Yan, N. J. Hill, T. Li, Y. Li, F. Lei, S. Guo, Z. Xing, Y. He, Y. Zhou, D. C. Douglas, W. M. Perry, and S. H. Newman. 2011. Wild Bird Migration across the Qinghai-Tibetan Plateau: A Transmission Route for Highly Pathogenic H5N1. Plos One 6:e17622.

      Pu, Z., and Y. Guo. 2023. Autumn migration of black-necked crane (Grus nigricollis) on the Qinghai-Tibetan and Yunnan-Guizhou plateaus. Ecology and Evolution 13:e10492.

      Qu, Y., F. Lei, R. Zhang, and X. Lu. 2010. Comparative phylogeography of five avian species: implications for Pleistocene evolutionary history in the Qinghai-Tibetan plateau. Molecular Ecology 19:338-351.

      Wang, Y., C. Mi, and Y. Guo. 2020. Satellite tracking reveals a new migration route of black-necked cranes (Grus nigricollis) in Qinghai-Tibet Plateau. PeerJ 8:e9715.

      Yu, X., G. Song, H. Wang, Q. Wei, C. Jia, and F. Lei. 2024. Migratory flyways and connectivity of Brown Headed Gulls (Chroicocephalus brunnicephalus) revealed by GPS tracking. Global Ecology and Conservation 56:e03340.

      Zhang, G.-G., D.-P. Liu, Y.-Q. Hou, H.-X. Jiang, M. Dai, F.-W. Qian, J. Lu, T. Ma, L.-X. Chen, and Z. Xing. 2014. Migration routes and stopover sites of Pallas’s Gulls Larus ichthyaetus breeding at Qinghai Lake, China, determined by satellite tracking. Forktail 30:104-108.

      Zhang, G.-G., D.-P. Liu, Y.-Q. Hou, H.-X. Jiang, M. Dai, F.-W. Qian, J. Lu, Z. Xing, and F.-S. Li. 2011. Migration Routes and Stop-Over Sites Determined with Satellite Tracking of Bar-Headed Geese (Anser indicus) Breeding at Qinghai Lake, China. Waterbirds 34:112-116, 115.

      Zhang, R., D. Jiang, C. Zhang, and Z. Zhang. 2022. Distinct effects of Tibetan Plateau growth and global cooling on the eastern and central Asian climates during the Cenozoic. Global and Planetary Change 218:103969.

      Zhao, T., W. Heim, R. Nussbaumer, M. van Toor, G. Zhang, A. Andersson, J. Bäckman, Z. Liu, G. Song, M. Hellström, J. Roved, Y. Liu, S. Bensch, B. Wertheim, F. Lei, and B. Helm. 2024. Seasonal migration patterns of Siberian Rubythroat (Calliope calliope) facing the Qinghai–Tibet Plateau. Movement Ecology 12:54.

    1. eLife Assessment

      This valuable study proposes a network implementation of the "re-aiming" learning strategy, which has been hypothesized to underlie brain-computer interface learning. Combining theoretical arguments, numerical simulations, and analysis of experimental data, the authors provide convincing evidence for their hypothesis. This paper will likely be of broad interest to the systems neuroscience community.

    2. Reviewer #1 (Public review):

      Summary:

      This study considers learning with brain-computer interfaces (BCIs) in nonhuman primates, and in particular, the high speed and flexibility with which subjects learn to control these BCIs.

      The authors raise the hypothesis that such learning is based on controlling a small number of input or control variables, rather than directly adapting neural connectivity within the network of neurons that drive the BCI. Adapting a small number of input variables would circumvent the issue of credit assignment in high dimensions and allow for quick learning, potentially using cognitive strategies ("re-aiming"). Based on a computational model, the authors show that such a strategy is viable in a number of experimental settings and reproduces previous experimental observations:

      (1) Differences in learning with decoders either within or outside of the neural manifold (the space spanned by the dominant modes of neural activity).

      (2) A novel, theory-based prediction on biases in BCI learning due to the positivity of neural firing rates, which is then confirmed in data from previous experiments.

      (3) An example of "illusory credit assignment": Changes in neurons' tuning curves depending on whether these neurons are affected by changes in the BCI decoder, even though learning only happens on the level of low-dimensional control variables.

      (4) A reproduction of results from operant conditioning of individual neurons, in particular, the observation that it is difficult to change the firing rates of neurons strongly correlated before learning in different directions (up vs down).

      Taken together, these observations yield strong evidence for the plausibility that subjects use such a learning strategy, at least during short-term learning.

      Strengths:

      Text and figures are clearly structured and allow readers to understand the main concepts well. The study presents a very clear and simple model that explains a number of seemingly disparate or even contradictory observations (neuron-specific credit assignment vs. low-dimensional, cognitive control). The predicted and tested bias due to positivity of firing rates provides a neat example of how such a theory can help understand experimental results. The idea that subjects first use a small number of command variables (those sufficient in the calibration task) and later, during learning, add more variables provides a nice illustration of the idea that learning takes place on multiple time scales, potentially with different mechanisms at play. On a more detailed level, the study is a nice example of closely matching the theory to the experiment, in particular regarding the modeling of BCI perturbations.

      Weaknesses:

      Overall, I find only two minor weaknesses. First, the insights of this study are, first and foremost, of feed-forward nature, and a feed-forward network would have been enough (and the more parsimonious model) to illustrate the results. While using a recurrent neural network (RNN) shows that the results are, in general, compatible with recurrent dynamics, the specific limitations imposed by RNNs (e.g., dynamical stability, low-dimensional internal dynamics) are not the focus of this study. Indeed, the additional RNN models in the supplementary material show that under more constrained conditions for the RNN (low-dimensional dynamics), using the input control alone runs into difficulties.

      Second, explaining the quantitative differences between the model and data for shifts in tuning curves seems to take the model a bit too literally. The model serves greatly for qualitative observations. I assume, however, that many of the unconstrained aspects of the model would yield quantitatively different results.

    3. Reviewer #2 (Public review):

      Summary :

      The paper proposes a model to explain the learning that occurs in brain-computer interface (BCI) tasks when animals need to adapt to novel BCI decoders. The model consists of a network formulation of the "re-aiming" learning strategy, which assumes that BCI learning does not modify the underlying neural circuitry, but instead occurs through a reorganization of existing neural activity patterns.

      The authors formalize this in a recurrent neural network (RNN) model, driven by upstream inputs that live in a low-dimensional space.

      They show that modelling BCI learning as reorganization of these upstream inputs can explain several experimental findings, such as the difference in the ability of animals to adapt to within vs outside-manifold perturbations, biases in the decoded behaviour after within-manifold perturbations, or qualitative changes in the neural responses observed during credit assignment rotation perturbations or operant conditioning of individual neurons.

      Overall, while the idea of re-aiming as a learning strategy has previously been proposed in the literature, the authors show how it can be formalized in a network model, which allows for more direct comparisons to experimental data.

      Strengths:

      The paper is very well written. The presentation of the model is clear, and the use of vanilla RNN dynamics driven by upstream inputs that are constant in time is consistent with the broader RNN modeling literature.

      The main value of the paper lies in the fact that it proposes a network implementation for a learning strategy that had been proposed previously. The network model has a simple form, but the optimization problem is performed in the space of inputs, which requires the authors to solve a nonlinear optimization problem in that space.

      While some of the results (eg the fact that the model can adapt to within but not outside-manifold perturbations) are to be expected based on the model assumptions, having a network model allows to make more direct and quantitative comparisons to experiments, to investigate analytically how much the dimension of the output is constrained by the input, and to make predictions that can be tested in data.

      The authors perform such comparisons across three different experiments. The results are clearly presented, and the authors show that they hold for various RNN connectivities.

      Weaknesses :

      The authors mention alternative models (eg, based on synaptic plasticity in the RNN and/or input weights) that can explain the same experimental data that they do, they do not provide any direct comparisons to those models.

      Thus, the main argument that the authors have in favor of their model is the fact that it is more plausible because it relies on performing the optimization in a low-dimensional space. It would be nice to see more quantitative arguments for why the re-aiming strategy may be more plausible than synaptic plasticity (either by showing that it explains data better, or explaining why it may be more optimal in the context of fast learning).

      In particular, the authors model the adaptation to outside-manifold perturbations (OMPs) through a "generalized re-aiming strategy". This assumes the existence of additional command variables, which are not used in the original decoding task, but can then be exploited to adapt to these OMPs. While this model is meant to capture the fact that optimization is occurring in a low-dimensional subspace, the fact that animals take longer to adapt to OMPs suggests that WMPs and OMPs may rely on different learning mechanisms, and that synaptic plasticity may actually be a better model of adaptation to OMPs. It would be important to discuss how exactly generalized re-aiming would differ from allowing plasticity in the input weights, or in all weights in the network. Do those models make different predictions, and could they be differentiated in future experiments?

    4. Author response:

      Reviewer #1 (Public Review):

      Overall, I find only two minor weaknesses. First, the insights of this study are, first and foremost, of feed-forward nature, and a feed-forward network would have been enough (and the more parsimonious model) to illustrate the results. While using a recurrent neural network (RNN) shows that the results are, in general, compatible with recurrent dynamics, the specific limitations imposed by RNNs (e.g., dynamical stability, low-dimensional internal dynamics) are not the focus of this study. Indeed, the additional RNN models in the supplementary material show that under more constrained conditions for the RNN (low-dimensional dynamics), using the input control alone runs into difficulties.

      We thank the reviewer for raising this important point. While we agree that recurrent dynamics were not the focus of this study, we would like to point out that 1) dynamics, of some kind, are necessary to simulate the decoder fitting process and 2) recurrent neural networks (RNNs) are valuable for obtaining general insights on how biological constraints shape the reachable manifold:

      (1) To simulate the decoder fitting process, we had to simulate neural activity during the so-called “calibration task”. Some dynamics to these responses are necessary to produce a population response with dimensionality resembling what was found in experiments (10 dimensions). Moreover, dynamics are necessary to create a common direction of high variance across population responses to the calibration task stimuli (see Supplementary Figure 2a and surrounding discussion), which is necessary to reproduce the biases in readouts demonstrated in Figure 4 (as many within-manifold decoder perturbations are aligned with it; Supplementary Figure 2b).

      Because feed-forward networks lack dynamics, reproducing our results with a feed-forward network would require using an input with dynamics. Rather than making an arbitrary choice for these input dynamics, we chose to keep the input static and instead generate the dynamics with a RNN, which is in line with recent models of motor cortex.

      We agree, however, that this is an important point worth clarifying in the manuscript. In our revision we will aim to add a demonstration of how to reproduce a subset of our results with a feed-forward network and a dynamic input.

      (2) While we agree that RNNs impose certain limitations over feed-forward networks, we see these limitations as an advantage because they provide a framework for understanding the structure of the reachable manifold in terms of biological constraints. For example, our simulations in Supplementary Figure 1 show that the dimensionality of the reachable manifold is highly dependent on recurrent connectivity: inhibition-stabilized connectivity makes it higher-dimensional whereas task-specific optimized connectivity makes it lower-dimensional. Such insights are valuable to understand the broader implications and experimental predictions of the re-aiming strategy.

      Because feed-forward networks are untied from the reality of recurrent cortical circuitry, they cannot be characterized in terms of such biological constraints. For instance, as the reviewer points out, dynamical stability is not a well-defined property of feed-forward networks. Such models therefore cannot provide any insight into how the biological constraint of dynamical stability could influence the reachable manifold (which we show it does in Figure 5b). Relatedly, feed-forward networks cannot be optimized to solve complex spatiotemporal tasks like the ballistic reaching task we used for our task-optimized RNN (Supplementary Figure 1, right column), so cannot be used to understand how such behavioral constraints would influence the reachable manifold.

      We agree that these reasons for using RNNs are subtle and left implicit in how they are currently exposed in the text. We will add a discussion point clarifying these in our revision.

      Second, explaining the quantitative differences between the model and data for shifts in tuning curves seems to take the model a bit too literally. The model serves greatly for qualitative observations. I assume, however, that many of the unconstrained aspects of the model would yield quantitatively different results.

      We completely agree: our model is best used to provide a qualitative description of the capabilities of the re-aiming strategy. We will be sure to revise our manuscript to keep such quantitative comparisons at a minimum.

      Reviewer #2 (Public Review):

      The authors mention alternative models (eg, based on synaptic plasticity in the RNN and/or input weights) that can explain the same experimental data that they do, they do not provide any direct comparisons to those models. Thus, the main argument that the authors have in favor of their model is the fact that it is more plausible because it relies on performing the optimization in a low-dimensional space. It would be nice to see more quantitative arguments for why the re-aiming strategy may be more plausible than synaptic plasticity (either by showing that it explains data better, or explaining why it may be more optimal in the context of fast learning).

      We agree this remains a limitation of our study. To contrast our re-aiming model with models of synaptic plasticity (in the input and/or recurrent weights), we have included substantial discussion of these alternative models in two sections of the manuscript:

      • Introduction, where we elaborate on the argument that synaptic plasticity requires solving an exceptionally difficult optimization problem in high dimensions

      • Discussion section “The role of synaptic plasticity in BCI learning”, where we review a number of synaptic plasticity models and experimental results they can account for

      We fully agree that more quantitative comparisons remain an important follow-up to this line of research. However, it is worth noting that there are many such models out there. Moreover, as is the case with many computational models, the results one can achieve with any given model can be highly sensitive to a number of different hyperparameters (e.g. learning rates). We therefore feel that a more rigorous comparison requires deeper study and is out of scope of this manuscript.

      In particular, the authors model the adaptation to outside-manifold perturbations (OMPs) through a "generalized re-aiming strategy". This assumes the existence of additional command variables, which are not used in the original decoding task, but can then be exploited to adapt to these OMPs. While this model is meant to capture the fact that optimization is occurring in a low-dimensional subspace, the fact that animals take longer to adapt to OMPs suggests that WMPs and OMPs may rely on different learning mechanisms, and that synaptic plasticity may actually be a better model of adaptation to OMPs. 

      We thank the reviewer for raising this question. We agree that the fact that animals take longer to adapt to OMPs suggests that the underlying learning strategy is somehow different. But the argument we try to make in this section of the paper is that it in fact does not require an entirely different mechanism. Our simulations show that the same mechanism of re-aiming can suffice to learn OMPs, but it simply requires re-aiming in the larger space of all command variables available to the motor system (rather than just the two command variables evoked by the calibration task). Because this is a much higher-dimensional search space (10-20 vs. 2 dimensions, which is a substantial difference due to the curse of dimensionality), we argue that learning should be slower, even though the mechanism (i.e. re-aiming) is the same.

      This is an important and somewhat surprising takeaway from these simulations, which we will try to bring up more explicitly and clearly in the revision.

      It would be important to discuss how exactly generalized re-aiming would differ from allowing plasticity in the input weights, or in all weights in the network. Do those models make different predictions, and could they be differentiated in future experiments?

      They do in fact make different predictions, and we thank the reviewer for asking and pointing out the lack of discussion of this point. The key difference between these two learning mechanisms is demonstrated in Figure 5b: under generalized re-aiming, there is a fundamental limit to the set of activity patterns one can learn to produce in the brain-computer interface (BCI) learning task. This is quantified in that analysis by the asymptotic participation ratio of the reachable manifold as K increases, which indicates that there is a limited ~12-dimensional subspace that the reachable manifold can occupy. The specific orientation of this subspace is determined by the (recurrent and input) connectivity of the recurrent neural network. With synaptic plasticity in any of the weight matrices (Wrec,Win,U), this subspace could be re-oriented in any arbitrary direction. Our theory of “generalized re-aiming” therefore predicts that the reachable manifold is 1) constrained to a low-d subspace and 2) is not modified when learning BCIs with outside-manifold perturbations.

      Experimentally testing this would require a within-/outside- manifold perturbation BCI learning task akin to that of Sadtler et al, but where the “intrinsic manifold” is measured from population responses evoked by every possible motor command so as to entirely contain the full reachable manifold at max K. This would require measuring motor cortical activity during naturalistic behavior under a wide range of conditions, rather than just in response to the 2D cursor movements on the screen used in the calibration task of the original study. In this case, learning outside-manifold perturbations would require re-orienting the reachable manifold, so a pure generalized re-aiming strategy would fail to learn them. Synaptic plasticity, on the other hand, would not.

      We will be sure to elaborate further on this claim in the revised manuscript.

    1. eLife Assessment

      This important study combines an innovative experimental approach with mathematical modeling to demonstrate that genes separated by strong topological boundaries can exhibit coordinated transcriptional bursting, providing new insights into how regulatory information is transmitted across the genome. The evidence is solid within the studied locus, but the interpretation and generality of the findings would be strengthened by additional validation using simulated data and broader application beyond a single genomic region. This work will be of interest to cell biologists and biophysicists working on transcription and chromatin.

    2. Reviewer #1 (Public review):

      In this manuscript, Kerlin et al. introduce a novel and conceptually important framework for analyzing allelic transcriptional heterogeneity using single-molecule microscopy. The authors aim to distinguish regulatory interactions occurring in cis-between genes on the same allele-from those in trans, between alleles, thereby extending classical models of transcriptional noise into the spatial and allelic domain. They apply this approach to three genes within the FOS locus in MCF7 cells, under both basal and estrogen-induced conditions, and report distinct patterns of transcriptional coordination that depend on gene proximity and chromatin insulation.

      A major strength of this work lies in its innovative methodology and the clarity with which the analytical framework is described. The authors effectively build on foundational ideas in gene expression variability and adapt them to resolve a previously underexplored question - how nearby genes on the same allele may influence each other's transcriptional activity. The imaging data are of high quality, the mathematical derivation is comprehensive, and the overall presentation is strong. The study makes a compelling argument for the value of allele-resolved analysis, highlighting that failure to account for allelic and chromatin context may lead to inaccurate or incomplete interpretations of regulatory mechanisms.

      That said, the scope of the data is currently limited to a single locus in one cell type. As such, some of the general conclusions, particularly those in the abstract and discussion, may be overstated. The evidence supports the findings within the FOS locus, but it remains unclear whether the observed patterns apply broadly across the genome. The utility and generality of the method would be significantly strengthened by additional validation.

      One specific area where the analysis could be improved is through the inclusion of randomized control comparisons. For example, the results presented in Figure 2D and analyzed in Figure 3 could be compared against randomized datasets to establish a baseline of what would be expected by chance. This would help determine the significance of the observed correlations and strengthen confidence in the model's specificity.

      Additionally, the framework should be tested on simulated datasets with a known ground truth to evaluate the robustness of its assumptions and the reliability of its outputs. Testing the approach against existing allele-specific single-cell datasets from other studies would also help assess its generalizability. While the authors suggest the framework could be extended to transcriptomics and spatial omics, these possibilities are not explored in the current study, and future work in this direction should be clearly marked as such.

      In summary, this manuscript presents a methodologically rigorous and biologically significant advance in the study of gene regulation. The approach fills an important gap by enabling allele-resolved, locus-specific analysis of transcriptional coordination, with implications for both basic science and clinical applications. The conclusions are well supported within the studied context, but further validation - particularly through randomized data comparison, simulations, and broader application - would be valuable in assessing the broader utility of the framework.

    3. Reviewer #2 (Public review):

      Summary:

      I am not familiar with mathematical modeling of gene expression, so I will evaluate this manuscript solely from a biological point of view.

      Kerlin et al. combined single-molecule RNA FISH and mathematical modeling approaches to quantitatively characterize changes in the transcriptional dynamics of three neighboring genes at the FOS locus in response to estradiol (E2) stimulation. They showed that the neighboring JDP2 and BATF genes, located on the same side of the TAD boundary, exhibit highly coordinated bursting dynamics. While FOS and JDP2/BATF are strongly insulated (~7:1 intra-to-inter-domain contact ratio) by the TAD boundary, correlated bursting dynamics were still observed between these gene pairs, suggesting that enhancers can bypass strong insulation sites. The authors proposed that burst co-occurrence arises from the activity of ERα-bound enhancers at the locus. They also proposed that the burst size correlation between two neighboring genes located on the same side of the TAD boundary results from local spreading of histone marks.

      Strengths:

      The direct visualization of coordinated transcriptional bursting across a strong insulation site is novel. This finding was carefully analyzed using the mathematical framework developed by the authors.

      Weaknesses:

      Several models were proposed based on single-molecule RNA FISH analysis of the FOS locus, but the generality of these findings remains uncertain. The proposed models were not directly tested through follow-up experiments, leaving the authors' conclusions largely speculative.

    4. Reviewer #3 (Public review):

      Summary

      Kerlin et.al combined single-molecule RNA FISH with oligonucleotide-based DNA FISH to directly examine the transcriptional activities of three adjacent genes at individual alleles in MCF7 cells. Importantly, they provided quantitative methods to resolve allele-specific (cis) and cell-to-cell (trans) variation and quantified the contribution of burst co-occurrence and burst size, which may help to more accurately analyze transcription coregulation. They found that transcriptional variability is largely gene-autonomous, and by disentangling burst co-occurrence and burst size after E2 induction, they proposed two distinct mechanisms of local gene regulation.

      Strengths:

      (1) Innovative Research Methods: Successfully integrates single-molecule RNA FISH with oligonucleotide-based DNA FISH to directly image the transcriptional activities of three adjacent genes at individual alleles. This enables the observation of transcriptional dynamics more precisely and provides a powerful tool for studying gene regulation.

      (2) Novel Data Analysis Approaches: Develops two new analysis methods to dissect the sources of gene activity (co)variation. One approach separates allele-extrinsic, allele-intrinsic, and gene-autonomous components, and the other quantifies the contributions of burst co-occurrence and burst size correlations. These methods help to more accurately analyze transcriptional correlations between genes and reveal potential regulatory mechanisms.

      Weaknesses:

      Biological Insights: The findings challenge the traditional view of contact insulation sites as strict regulators of gene coregulation and suggest two distinct coregulatory mechanisms influenced by local chromosome folding. However, expression activity of multiple genes is differentially correlated at the population-level or cell-level versus single-allele-level. More in-depth analysis is needed for further biological insights.

    1. eLife Assessment

      This study presents a valuable finding on the intersection between tuberculosis and diabetes and the impact on immune responses, notably T cell and myeloid cell responses. The single-cell data collected and analyzed are convincing and provide a rich dataset to develop a more detailed understanding of cellular responses during Mtb infection of diabetic mice. Some of the mechanistic claims are incomplete, as there are no experiments performed to clearly define a role for IL-16 or IL-17 in disease. Inclusion of analysis of human samples would have strengthened the conclusions in the paper for translational impact, as well as the inclusion of a DM group alone in addition to DM-TB vs TB in some of the experiments.

    2. Reviewer #1 (Public review):

      Summary:

      The authors hypothesized that the lung immune landscape in mice with diabetes and TB comorbidity is different from that of mice with DM-only or TB-only, or healthy mice. Systematically, the authors established the 'basal' lung immune landscape in DM or healthy animals before infection with Mycobacterium tuberculosis, allowing them to tease out changes in cell types with TB infection and focused subsequent studies on DM-TB and TB comparisons. The authors chose day 21 post-Mtb infection as the point of analysis since this is the peak of immune responses to Mtb infection as per an earlier study (Das et al. 2021). As expected, the authors found differences in the cellular composition of the DM mice with or without TB or TB-only mice, including reduced IFNg response, elevated Th17 cells, increased IL-16 signaling, and altered naive CD4+ and naive CD8+ T cell numbers. The authors have used a series of techniques for methodological and analytical approaches to identify potential pathways that can be targeted for therapies against DM-TB. However, the authors have failed to propose a model that could explain their observations at the time point tested, lowering enthusiasm for the conclusions of the study.

      Strengths:

      The strength of the study is the use of a validated model of mouse DM-TB and a meticulous approach to establish and define a 'baseline" lung cellular landscape in DM and healthy mice before Mtb infection. The use of an up-to-date analytical pipeline by the authors is commendable.

      The literature review is exhaustive, and the authors have put considerable effort into borrowing from other conditions where the identified genes of pathways have been implicated.

      Weaknesses:

      The key limitations of the study include:

      (1) The authors have failed to link a specific cell type, that is, Th17 cell activation, to or with IL-16 signaling as the drivers regulating conditions that contribute significantly to the dysregulated immune responses in DM-TB. For context, naive CD4+ and naive CD8+ T cells cannot be considered "specific cell types" because they have no determined cell fate; they could mature to any other cell type - cytotoxic T cells, Th1, or even Th17 or Tc17 cells.

      (2) Since day 21 post-Mtb infection is an earlier timepoint, the authors should have provided data on cellular composition in the experiments in Figure 7. From the work of Kornfeld and colleagues, there is delayed cell recruitment in DM-TB, but it is likely that later on, due to persistent inflammation (from chronic hyperglycemia), DM-TB mice have more or equal cell numbers in the lung. Anecdotally, the authors found differences in CFU at a later time point but not at 21 days post-infection. This fits with human studies where there is a higher prevalence of cavities in DM-TB compared to TB-only patients. The authors missed the opportunity to clarify this important point by excluding cellular data from the 56-day post-infection experiments.

      (3) The power of the study would be improved by the direct comparisons of three groups: DM vs DM-TB vs TB to recapitulate the human populations and allow the authors to address the question of 'why does DM worsen TB outcome?'. The current analysis of DM-TB vs TB is not fit for this because the TB is on a healthy background, while DM-TB is a result of two conditions that independently perturb immune homeostasis.

    3. Reviewer #2 (Public review):

      Summary:

      While immune cell distribution in tuberculosis (TB) is well documented, research on its disruption in diabetes-tuberculosis (DM-TB) comorbidity remains limited. In this study, Chaudhary et al. explore immune cell perturbations in DM-TB using single-cell RNA sequencing (scRNA-seq), providing key insights into the impaired host immune response. By elucidating the molecular mechanisms underlying immune dysfunction in DM-TB, this study addresses an important knowledge gap. The study demonstrates that diabetes impairs lung immune cell infiltration and contributes to a dampened immune response against Mycobacterium tuberculosis. Reduced Th1 and M1 macrophage populations indicate a compromised ability to mount an effective pro-inflammatory response, which is essential for TB control. The observed increase in IL-16 signaling and reduction in TNF and IFN-II responses suggest a shift toward a more immunosuppressive or dysregulated inflammatory state. The interplay between chronic inflammation, hyperglycemia, and dyslipidemia in diabetes further exacerbates immune dysfunction, reinforcing the idea that metabolic disorders significantly impact TB pathogenesis.

      Strengths:

      This well-designed study employs robust methodology, well-executed experiments, and a well-written manuscript. The use of scRNA-seq is a notable strength, offering high-resolution analysis of immune cell heterogeneity in the lung environment. Additionally, the study corroborates its findings in a long-term infection model, demonstrating that chronic M. tuberculosis (H37Rv) infection in diabetic mice leads to increased bacterial burden and worsened tissue pathology.

      Weaknesses:

      (1) The study focuses on CD3⁺ and CD11c⁺ cells but does not extensively examine other key immune players that may contribute to DM-TB pathogenesis. Given that diabetes affects multiple immune compartments, a broader immune profiling approach would provide a more comprehensive understanding.

      (2) While the study identifies increased IL-16 signaling and reduced TNF/IFN-II responses, the precise molecular mechanisms driving these changes remain unclear. Further investigation into metabolic-immune crosstalk (e.g., how hyperglycemia affects immune cell differentiation and cytokine secretion) would strengthen the mechanistic depth of the findings.

      (3) The study suggests targeting IL-16 and Th17 cells as potential therapeutic strategies; however, no experimental validation (e.g., testing IL-16 inhibitors in DM-TB models) is provided. Validating these interventions would enhance their translational relevance.

      (4) Incorporating clinical samples (e.g., PBMCs from DM-TB patients) could help bridge the gap between murine and human studies, offering more translational insights into disease mechanisms.

      Overall, this study provides valuable findings, but addressing these concerns would further strengthen its impact on understanding DM-TB immunopathogenesis.

    1. eLife Assessment

      This valuable study reports the conservation of sperm-egg envelope binding by demonstrating successful recognition of the micropyle in fish eggs by the mouse sperm. However, the evidence supporting the conclusions drawn remains incomplete. In particular, the proposed specific role of CatSper in micropyle recognition and passage is not fully demonstrated. This study will be of interest to reproductive biologists and clinicians studying the biology of fertilization and fertility.

    2. Reviewer #1 (Public review):

      Summary:

      The paper is well written and investigates the cross-species insemination of fish eggs with mouse sperm. I have a few major and minor comments.

      Strengths:

      The experiments are well executed and could provide valuable insights into the complex mechanisms of fertilization in both species. I found the information presented to be very interesting,

      Weaknesses:

      The rationale of some of the experiments is not well defined.

      Major Comments:

      (1) Figure 5<br /> I do not understand the rationale for performing experiments using CatSper-null sperm and CD9-null oocytes. It is well established that CatSper-null sperm are unable to penetrate the zona pellucida (ZP), so the relevance of this approach is unclear.

      (2) Micropyle penetration and sperm motility<br /> CatSper-null sperm are reportedly unable to cross the micropyle, but this could be due to their reduced motility rather than a lack of hyperactivation per se. Were these experiments conducted using capacitated or non-capacitated spermatozoa? What was the observed motility of CatSper-null sperm during these assays? Clarifying these conditions is essential to avoid drawing incorrect conclusions from the results.

      (3) Rheotaxis and micropyle navigation<br /> Previous studies have shown that CatSper-null sperm fail to undergo rheotaxis. Could this defect be related to their inability to locate and penetrate the micropyle? Exploring a potential shared mechanism could be informative.

      (4) Lines 61-74<br /> This paragraph omits important information regarding acrosomal exocytosis, which occurs prior to sperm-egg fusion. Including this detail would strengthen the discussion.

    3. Reviewer #2 (Public review):

      Summary:

      Garibova et al. investigated the conservation of sperm recognition and interaction with the egg envelope in two groups of distantly related animals: mammals (mouse) and fish (zebrafish). Previous work and key physiological differences between these two animal groups strongly suggest that mouse sperm would be incapable of interaction with the zebrafish egg envelope (chorion) and its constituent proteins, though homologous to the mammalian zona pellucida (ZP). Indeed, the authors showed that mouse sperm do not bind recombinant zebrafish ZP proteins nor the intact chorion. Surprisingly, however, mouse sperm are able to locate and bind to the zebrafish micropyle, a specialized canal within the chorion that serves as the egg's entry point for sperm. This study suggests that sperm attraction to the egg might be highly conserved from fish to mammals and depends on the presence of a still unknown glycosylated protein within the micropyle. The authors further demonstrate that mouse sperm are able to enter the micropyle and accumulate within the intrachorionic space, potentially through a CatSper-dependent mechanism.

      Strengths:

      The authors convincingly demonstrate that mouse sperm do not bind zebrafish ZP proteins or the chorion. Furthermore, they make the interesting observation that mouse sperm are able to locate and enter the zebrafish micropyle in an MP-dependent manner, which is quite unexpected given the large evolutionary distance between these species, the many physiological differences between mouse and zebrafish gametes, and the largely different modes of both fertilization and reproduction in these species. This may indicate that the sperm chemoattractant in the egg is conserved between mammals and fish; however, whether zebrafish sperm are attracted to mouse eggs was not tested.

      Weaknesses:

      The key weakness of this study lies in the rationale behind the overall investigation. In mammals, the zona pellucida (ZP) has been implicated in binding sperm in a taxon-specific manner, such that human sperm are incapable of binding the mouse ZP. Indeed, work by the corresponding author showed that this specificity is mediated by the N-terminal region of the ZP protein ZP2 (Avella et al., 2014). The N-termini of human and mouse ZP2 share 48% identity, which is higher than the overall identity between mouse and zebrafish ZP2, with the latter ortholog entirely lacking the N-terminal domain that is essential for sperm binding to the ZP. Given this known specificity for mouse vs. human sperm-ZP binding, it does not follow that mouse sperm would bind ZP proteins from not only a species that is much more distantly related, but also one that is not even a mammal, the zebrafish. Furthermore, the fish chorion does not play a role in sperm binding at all, while the mammalian ZP can bind sperm at any location. On the contrary, the zebrafish chorion prevents polyspermy by limiting sperm entry to the single micropyle.

      In addition, though able to provide some information regarding the broad conservation of sperm-egg interaction mechanisms, the biological relevance of these findings is difficult to describe. Fish and mammals are not only two very distinct and distantly related animal groups, but also employ opposite modes of fertilization and reproduction (external vs. internal, oviparous vs viviparous). Fish gametes interact in a very different environment compared to mammals and lack many typically mammalian features of fertilization (e.g., sperm capacitation, presence of an acrosome, interaction with the female reproductive tract), making it difficult to make any physiologically relevant claims from this study. While this study may indicate conserved mechanisms of sperm attraction to the egg, the identity of the molecular players involved is not investigated. With this knowledge, the reader is forced to question the motivation behind much of the study.

      During fertilization in fish, the sperm enters the micropyle and subsequently, the egg, as it is simultaneously activated by exposure to water. During egg activation, the chorion lifts as it separates from the egg and fills with water. This mechanism prevents supernumerary sperm from entering the egg after the successfully fertilizing sperm has bound and fused. In this study, the authors show that mouse sperm enter the micropyle and accumulate in the intrachorionic space. Whether any sperm successfully entered the egg is not addressed, and the status of egg activation is not reported. In Supplementary Videos 3-4, the egg shown has been activated for some time, as evident by the separation of yolk and cytoplasm, yet the chorion is only partially expanded (likely due to mouse IVF conditions). How multiple sperm were able to enter the micropyle but presumably not the egg is not addressed, yet this suggests that the zebrafish mechanism of blocking polyspermy (fertilization by multiple sperm) is not effective for mouse sperm or is rendered ineffective due to mouse IVF conditions. The authors do not discuss these observations in the context of either species' physiological process of fertilization, highlighting the lack of biological context in interpreting the results.

      The authors further show that the zebrafish micropyle does not trigger the acrosome reaction in mouse sperm. Whether the acrosome reacts is not correlated with a sperm's ability to cross the micropyle opening, as both acrosome-intact and acrosome-reacted sperm were observed within the intrachorionic space. While the acrosome reaction is a key event during mammalian fertilization and is required for sperm to fertilize the egg, zebrafish sperm do not contain an acrosome. Thus, these results are particularly difficult to interpret biologically, bringing into question whether this observation has biological relevance or is a byproduct of egg activation/chorion lifting that indirectly draws sperm into the chorion.

      The final experiments regarding CatSper1's role in mediating mouse sperm entry into the micropyle/chorion are not convincing. As no molecular interactions are described or perturbed, the reader cannot be sure whether the sperm's failure to enter is due to signaling via CatSper1 or whether the overall failure to undergo hyperactivation limits sperm motility such that the mutant sperm can no longer find and enter the zebrafish micropyle. Indeed, in Figure 5E, no CatSper1 mutant sperm are visible near any part of the egg, suggesting that overall motility is impaired, and this is not a phenotype specific to interactions with the micropyle.

    1. eLife Assessment

      This fundamental study explores a novel cellular mechanism underlying the degeneration of locus coeruleus neurons during chronic restraint stress. The evidence supporting the overexpression of LC neurons after chronic stress is compelling. However, to fully support the broad implications for LC degeneration and Alzheimer's disease, the study would benefit from stronger causal integration and validation in age-relevant models.

    2. Reviewer #1 (Public review):

      Summary:

      This study investigates how chronic stress may contribute to LC dysfunction in AD by examining the mechanisms underlying NA accumulation and α2A-AR internalization. Using electrophysiological recordings and molecular analyses, the authors propose that stress-induced receptor internalization impairs autoinhibition, leading to excessive NA accumulation and increased MAO-A activity. The findings have potential implications for understanding the progression of AD-related neurodegeneration and targeting noradrenergic dysfunction as a therapeutic strategy.

      Strengths:

      (1) The study integrates electrophysiology and molecular approaches to explore the mechanistic effects of chronic stress on LC neurons.

      (2) The evidence supporting NA accumulation and α2A-AR internalization as contributing factors to LC dysfunction is novel and relevant to AD pathology.

      (3) The electrophysiological findings, particularly the loss of spike-frequency adaptation and reduction in GIRK currents, provide functional insights into stress-induced changes in LC activity.

      Weaknesses:

      (1) The manuscript's logical flow is challenging and hard to follow, and key arguments could be more clearly structured, particularly in transitions between mechanistic components.

      (2) The causality between stress-induced α2A-AR internalization and the enhanced MAO-A remains unclear. Direct experimental evidence is needed to determine whether α2A-AR internalization itself or Ca2+ drives MAO-A activation, and how they activate MAO-A should be considered.

      (3) The connection between α2A-AR internalization and increased cytosolic NA levels lacks direct quantification, which is necessary to validate the proposed mechanism.

      (4) The chronic stress model needs further validation, including measurements of stress-induced physiological changes (e.g., corticosterone levels) to rule out systemic effects that may influence LC activity. Additional behavioral assays for spatial memory impairment should also be included, as a single behavioral test is insufficient to confirm memory dysfunction.

      (5) Beyond b-arrestin binding, the role of alternative internalization pathways (e.g., phosphorylation, ubiquitination) in α2A-AR desensitization should be considered, as current evidence is insufficient to establish a purely Ca²⁺-dependent mechanism.

      (6) NA leakage for free NA accumulation is also influenced by NAT or VMAT2. Please discuss the potential role of VMAT2 in NA accumulation within the LC in AD.

      (7) Since the LC is a small brain region, proper staining is required to differentiate it from surrounding areas. Please provide a detailed explanation of the methodology used to define LC regions and how LC neurons were selected among different cell types in brain slices for whole-cell recordings.

      Impact:

      This study provides valuable insights into the impact of chronic stress on LC function and its relevance to AD pathogenesis. The proposed mechanism linking NA dysregulation and receptor internalization may have implications for developing therapeutic strategies targeting the noradrenergic system in neurodegenerative diseases. However, additional validation is needed to strengthen the mechanistic claims before the findings can be fully integrated into the field.

    3. Reviewer #2 (Public review):

      Summary:

      This manuscript investigates the mechanism by which chronic stress induces locus coeruleus (LC) neuron degeneration. The authors demonstrate that chronic stress leads to internalization of α2A-adrenergic receptors (α2A-ARs) on LC-neurons, causing increased cytosolic noradrenaline (NA) accumulation and subsequent production of the neurotoxic metabolite DOPEGAL via monoamine oxidase A (MAO-A). The study suggests a mechanistic link between stress-induced α2A-AR internalization, disrupted autoinhibition, elevated NA metabolism, asparagine endopeptidase (AEP) activation, and Tau pathology relevant to Alzheimer's disease (AD). The conclusions of this paper are mostly well supported by data, but some aspects of image acquisition need to be extended.

      Strengths:

      This study clearly demonstrates the effects of chronic stimulation on the excitability of LC neurons using electrophysiological techniques. It also elucidates the role of α2-adrenergic receptor (α2-AR) internalization and the associated upstream and downstream signaling pathways of GIRK1 using a range of pharmacological agents, highlighting the innovative nature of the work.

      Additionally, the study identifies the involvement of the MAO-A-DOPEGAL-AEP pathway in this process. The topic is timely, the proposed mechanistic pathway is compelling, and the findings have translational relevance, particularly regarding therapeutic strategies targeting α2A-AR internalization in neurodegenerative diseases.

      Weaknesses:

      (1) The manuscript reports that chronic stress for 5 days increases MAO-A levels in LC neurons, leading to the production of DOPEGAL, activation of AEP, and subsequent tau cleavage into the tau N368 fragment, ultimately contributing to neuronal damage. However, the authors used wild-type C57BL/6 mice, and previous literature has indicated that AEP-mediated tau cleavage in wild-type mice is minimal and generally insufficient to cause significant behavioral alterations. Please clarify and discuss this apparent discrepancy.

      (2) It is recommended that the authors include additional experiments to examine the effects of different durations and intensities of stress on MAO-A expression and AEP activity. This would strengthen the understanding of stress-induced biochemical changes and their thresholds.

      (3) Please clarify the rationale for the inconsistent stress durations used across Figures 3, 4, and 5. In some cases, a 3-day stress protocol is used, while in others, a 5-day protocol is applied. This discrepancy should be addressed to ensure clarity and experimental consistency.

      (4) The abbreviation "vMAT2" is incorrectly formatted. It should be "VMAT2," and the full name (vesicular monoamine transporter 2) should be provided at first mention.

    4. Reviewer #3 (Public review):

      Summary:

      The authors present a technically impressive data set showing that repeated excitation or restraint stress internalises somato dendritic α2A adrenergic autoreceptors (α2A ARs) in locus coeruleus (LC) neurons. Loss of these receptors weakens GIRK-dependent autoinhibition, raises neuronal excitability, and is accompanied by higher MAO-A, DOPEGAL, AEP, and tau N368 levels. The work combines rigorous whole-cell electrophysiology with barbadin-based trafficking assays, qPCR, Western blotting, and immunohistochemistry. The final schematic is appealing and could, in principle, explain early LC hyperactivity followed by degeneration in ageing and Alzheimer's disease.

      Strengths:

      (1) Multi-level approach - The study integrates electrophysiology, pharmacology, mRNA quantification, and protein-level analysis.

      (2) The use of barbadin to block β-arrestin/AP-2-dependent internalisation is both technically precise and mechanistically informative.

      (3) Well-executed electrophysiology.

      (4) Translation relevance - converges to a model that can be discussed by peers (scientists can only discuss models - not data!).

      Weaknesses:

      Nevertheless, the manuscript currently reads as a sequence of discrete experiments rather than a single causal chain. Below, I outline the key points that should be addressed to make the model convincing.

    5. Author response:

      Reviewer #1 (Public review):

      Weaknesses:

      (1) The manuscript's logical flow is challenging and hard to follow, and key arguments could be more clearly structured, particularly in transitions between mechanistic components.

      We will revise our manuscript so as to make it easy to follow the logical flow in transitions between mechanistic components.

      (2) The causality between stress-induced α2A-AR internalization and the enhanced MAO-A remains unclear. Direct experimental evidence is needed to determine whether α2A-AR internalization itself or Ca<sup>2+</sup> drives MAO-A activation, and how they activate MAO-A should be considered.

      We believe that the causality between stress-induced α2A-AR internalization and the enhancement of MAO-A is clearly demonstrated by our current experiments, while our explanations may be improved by making them easier to understand especially for those who are not expert on electrophysiology.

      Firstly, it is well established that autoinhibition in LC neurons is mediated by α2A-AR coupled-GIRK (Arima et al., 1998, J Physiol; Williams et al., 1985, Neuroscience). We found that spike frequency adaptation in LC neurons was also mediated by α2A-AR coupled GIRK-I (Fig. 1A-I), and that α2A-AR coupled GIRK-I underwent [Ca<sup>2+</sup>]<sub>i</sub>-dependent rundown (Figs. 2, S1, S2), leading to an abolishment of spike-frequency adaptation (Figs. S4). [Ca<sup>2+</sup>]<sub>i</sub>-dependent rundown of α2A-AR coupled GIRK-I was prevented by barbadin (Fig 2G-J), which prevents the internalization of G-protein coupled receptor (GPCR) channels.

      Abolishment of spike frequency adaptation itself, i.e., “increased spike activity” can increase [Ca<sup>2+</sup>]<sub>i</sub> because [Ca<sup>2+</sup>]<sub>i</sub> is entirely dependent on the spike activity as shown by Ca<sup>2+</sup> imaging method in Figure S3.

      Thus, α2A-AR internalization can increase [Ca<sup>2+</sup>]<sub>i</sub> through the abolishment of autoinhibition or spike frequency adaptation, and a [Ca<sup>2+</sup>]<sub>i</sub> increase drives MAO-A activation as reported previously (Cao et al., 2007, BMC Neurosci). The mechanism how Ca<sup>2+</sup> activates MAO-A is beyond the scope of the current study.

      Our study just focused on the mechanism how chronic or sever stress can cause persistent overexcitation and how it results in LC degeneration.

      (3) The connection between α2A-AR internalization and increased cytosolic NA levels lacks direct quantification, which is necessary to validate the proposed mechanism.

      Direct quantification of the relationship between α2A-AR internalization and increased cytosolic NA levels may not be possible, and may not be necessarily needed to be demonstrated as explained below.

      The internalization of α2A-AR can increase [Ca<sup>2+</sup>]<sub>i</sub> through the abolishment of autoinhibition or spike frequency adaptation, and [Ca<sup>2+</sup>]<sub>i</sub> increases can facilitate NA autocrine (Huang et al., 2007), similar to the transmitter release from nerve terminals (Kaeser & Regehr, 2014, Annu Rev Physiol).

      Autocrine released NA must be re-uptaken by NAT (NA transporter), which is firmly established (Torres et al., 2003, Nat Rev Neurosci). Re-uptake of NA by NAT is the only source of intracellular NA, and NA re-uptake by NAT should be increased as the internalization of NA biding site (α2A-AR) progresses in association with [Ca<sup>2+</sup>]<sub>i</sub> increases (see page 11, lines 334-336).

      Thus, the connection between α2A-AR internalization and increased cytosolic NA levels is logically compelling, and the quantification of such connection may not be possible at present (see the response to the comment made by the Reviewer #1 as Recommendations for the authors (2) and beyond the scope of our current study.

      (4) The chronic stress model needs further validation, including measurements of stress-induced physiological changes (e.g., corticosterone levels) to rule out systemic effects that may influence LC activity. Additional behavioral assays for spatial memory impairment should also be included, as a single behavioral test is insufficient to confirm memory dysfunction.

      It is well established that restraint stress (RS) increases corticosterone levels depending on the period of RS (García-Iglesias et al., 2014, Neuropharmacology), although we are not reluctant to measure the corticosterone levels. In addition, there are numerous reports that showed the increased activity of LC neurons in response to various stresses (Valentino et al., 1983; Valentino and Foote, 1988; Valentino et al., 2001; McCall et al., 2015), as described in the text (page 4, lines 96-98). Measurement of cortisol levels may not be able to rule out systemic effects of CRS on the whole brain.

      We had already done another behavioral test using elevated plus maze (EPM) test.

      By combining the two tests, it may be possible to more accurately evaluate the results of Y-maze test by differentiating the memory impairment from anxiety. However, the results obtained by these behavioral tests are just supplementary to our current aim to elucidate the cellular mechanisms for the accumulation of cytosolic free NA. Its subsequent anxiety and memory impairment are just supplementary to our current study. We will soften the implication of anxiety and memory impairment.

      (5) Beyond b-arrestin binding, the role of alternative internalization pathways (e.g., phosphorylation, ubiquitination) in α2A-AR desensitization should be considered, as current evidence is insufficient to establish a purely Ca<sup>2+</sup>-dependent mechanism.

      We can hardly agree with this comment.

      It was clearly demonstrated that repeated application of NA itself did not cause desensitization of α2A-AR (Figure S1A-D), and that the blockade of b-arrestin binding by barbadin completely suppressed the Ca<sup>2+</sup>-dependent downregulation of GIRK (Fig. 2G-K). These observations can clearly rule out the possible involvement of phosphorylation or ubiquitination for the desensitization.

      Not only the barbadin experiment, but also the immunohistochemistry and western blot method clearly demonstrated the decrease of α2A-AR expression on the cell membrane (Fig. 3).

      Ca<sup>2+</sup>-dependent mechanism of the rundown of GIRK was convincingly demonstrated by a set of different protocols of voltage-clamp study, in which Ca<sup>2+</sup> influx was differentially increased. The rundown of GIRK-I was orderly potentiated or accelerated by increasing the number of positive command pulses each of which induces Ca<sup>2+</sup> influx (compare Figure S1E-J, Figure S2A-E and Figure S2F-K along with Fig. 2A-F). The presence or absence of Ca<sup>2+</sup> currents and the amount of Ca<sup>2+</sup> currents determined the trend of the rundown of GIRK-I (Figs. 2, S1 and S2). Because the same voltage protocol hardly caused the rundown when it did not induce Ca<sup>2+</sup> currents in the absence of TEA (Fig. S1F; compare with Fig. 2B), blockade of Ca<sup>2+</sup> currents by nifedipine would not be so beneficial.

      We believe the series of voltage-clamp protocols convincingly demonstrated the orderly involvement of [Ca<sup>2+</sup>]<sub>i</sub> in accelerating the rundown of GIRK-I.

      (6) NA leakage for free NA accumulation is also influenced by NAT or VMAT2. Please discuss the potential role of VMAT2 in NA accumulation within the LC in AD.

      We will discuss the role of VMAT2 in NA accumulation, especially when VMAT2 was impaired. Indeed, it has been demonstrated that reduced VMAT2 levels increased susceptibility to neuronal damage: VMAT2 heterozygote mice displayed increased vulnerability to MPTP as evidenced by reductions in nigral dopamine cell counts (Takahashi et al, 1997, PNAS). Thus, when the activity of VMAT2 in LC neurons were impaired by chronic restraint stress, cytosolic NA levels in LC neurons would increase. We will add such discussion in the revised manuscript.

      (7) Since the LC is a small brain region, proper staining is required to differentiate it from surrounding areas. Please provide a detailed explanation of the methodology used to define LC regions and how LC neurons were selected among different cell types in brain slices for whole-cell recordings.

      LC neurons were identified immunohistochemically and electrophysiologically as we previously reported (see Fig. 2 in Front. Cell. Neurosci. 16:841239. doi: 10.3389/fncel.2022.841239). A delayed spiking pattern in response to depolarizing pulses (Figure S9) applied at a hyperpolarized membrane potential was commonly observed in LC neurons in many studies (Masuko et al., 1986; van den Pol et al., 2002; Wagner-Altendorf et al., 2019).

      Reviewer #2 (Public review):

      Weaknesses:

      (1) The manuscript reports that chronic stress for 5 days increases MAO-A levels in LC neurons, leading to the production of DOPEGAL, activation of AEP, and subsequent tau cleavage into the tau N368 fragment, ultimately contributing to neuronal damage. However, the authors used wild-type C57BL/6 mice, and previous literature has indicated that AEP-mediated tau cleavage in wild-type mice is minimal and generally insufficient to cause significant behavioral alterations. Please clarify and discuss this apparent discrepancy.

      In our study, normalized relative value of AEP-mediated tau cleavage (Tau N368) was much higher in CRS mice than non-stress wild-type mice. It is not possible to compare AEP-mediated tau cleavage between our non-stress wild type mice and those observed in previous study (Zhang et al., 2014, Nat Med), because band intensity is largely dependent on the exposure time and its numerical value is the normalized relative value. In view of such differences, our apparent band expression might have been intensified to detect small changes.

      (2) It is recommended that the authors include additional experiments to examine the effects of different durations and intensities of stress on MAO-A expression and AEP activity. This would strengthen the understanding of stress-induced biochemical changes and their thresholds.

      GIRK rundown was almost saturated after 3-day RS and remained the same in 5-day RS mice (Fig. 4A-G), which is consistent with the downregulation of α2A-AR and GIRK1 expression by 3-day RS (Fig. 3C, F and G; Fig. 4J and K). However, we examine the protein levels of MAO-A, pro/active-AEP and Tau N368 only in 5-day RS mice without examining in 3-day RS mice. This is because we considered the possibility that 3-day RS may be insufficient to induce changes in MAO-A, AEP and Tau N368 and some period of high [Ca<sup>2+</sup>]<sub>i</sub> condition may be necessary to induce such changes. We will discuss this in the revised manuscript.

      (3) Please clarify the rationale for the inconsistent stress durations used across Figures 3, 4, and 5. In some cases, a 3-day stress protocol is used, while in others, a 5-day protocol is applied. This discrepancy should be addressed to ensure clarity and experimental consistency.

      Please see our response to the comment (2).

      (4) The abbreviation "vMAT2" is incorrectly formatted. It should be "VMAT2," and the full name (vesicular monoamine transporter 2) should be provided at first mention.

      Thank you for your suggestion. We will revise accordingly.

    1. eLife Assessment

      This useful study describes a physical mechanism for the emergence of spiral patterns in the outer epithelial layer of the mammalian cornea independent of pre-patterning or guidance cues, using an agent-based model of self-propelled particles with alignment. The model is well constructed, however the central premise of the manuscript, that the spiral patterning of epithelial corneal cells occurs without guidance cues, is incomplete and not fully supported. Several significant questions remain unanswered, such as the role of the corneal curvature or the importance of topological defects. Furthermore, comparison between the model and data are qualitative at best for the moment.

    2. Reviewer #1 (Public review):

      Summary:

      The manuscript by Kostanjevec et al. investigates the mechanism behind spiral pattern formation in the cornea. The authors demonstrate that the spiral motion pattern on the mammalian corneal surface emerges from the interaction between the limbus position, cell division, extrusion, and collective cell migration. Using LacZ mosaic murine corneas, they reveal a tightening spiral flow pattern and show that their cell-based, in silico model accurately reproduces these patterns without global guidance cues. Additionally, they present a continuum model that extends the XYZ hypothesis to describe cell flux on the cornea, offering a quantitative explanation for tissue-scale processes on curved surfaces.

      Strengths:

      The manuscript is well-written, with a systematic approach that clearly explains experimental setups, model construction, assumptions, parameter selection, and predictions. The discussion also provides insightful perspectives on the broader implications of the results for both physics and biology.

      Weaknesses:

      The central premise of the manuscript, that the spiral patterning of epithelial corneal cells occurs without guidance cues, is not fully supported. The authors overlook the potential role of axons in guiding epithelial cells, despite clear evidence of spiral axon patterns in their own Fig. 1b. Previous literature indicates that axon patterning precedes epithelial cell patterning, suggesting that epithelial migration might be influenced by pre-existing neural structures (e.g., Leiper et al. 2002, IOVS 2013). The authors need to address this point, possibly by exploring whether axonal patterns serve as a template for epithelial cell migration, or by providing experimental evidence to rule out axon-based guidance.

      While the model is well-constructed, it currently falls short of its stated goal of elucidating the mechanisms of spiral formation. Key questions remain unanswered:<br /> Is the curvature of the cornea necessary for spiral formation, or would a simpler disk geometry suffice?<br /> What role do boundary conditions play?<br /> How well do the model's predictions quantitatively match experimental data?<br /> The current comparisons in Fig. 4c-f lack quantitative agreement, and this discrepancy should be discussed with possible explanations.

      The authors emphasize polar alignment as a key feature of the spiral pattern based on simulation results. However, they do not provide experimental evidence for this polar alignment. The manuscript includes discussions of polar and nematic symmetries that, without supporting data, feel somewhat distracting. If direct experimental evidence for polar alignment is not available, the authors could instead quantify nematic alignment as the spiral forms. This would also allow them to explore potential crosstalk between nematic cell orientation and the polar alignment of self-propulsion, especially considering recent studies showing alternative mechanisms for vortex formation in similar systems.

    3. Reviewer #2 (Public review):

      In K. Kostanjevec et.al, the authors study a possible mechanism for the formation of spiral patterns in the cornea. First the authors analyze an inferred velocity field, which is deduced from images of fixed corneas, and then determine the position-dependent spiral angle of this velocity fields. Next, the authors analysed two possible markers of cell polarity: the direction of the centrosome-nuclei and the axis of mitosis. Then the authors introduce a stochastic agent-based model of self-propelled particles with over-damped dynamics and with aligning interactions to the orientation of the nearest neighbors and to the particle's velocity. The authors claim to be able to reproduce the equal-time autocorrelation function and the velocity Fourier spectrum. Then the authors introduce the geometry of the cornea by constraining the dynamics on a spherical cap and show that their model can reproduce a typical trajectory in experiments. Finally, the authors produce a phase diagram of the states at a fixed time point as a function of the spherical cap radius and the strength of the coupling aligning constant. Finally, the authors propose an interpretation of the cell fluxes based on the equation of mass conservation.

    4. Author response:

      We thank the referees for finding our work well written and systematic. We are planning a revision of the manuscript based on the public review and the confidential recommendations of the referees.

      The role of axons:

      Indeed, radial axon projections appear before mature epithelial stripes in the cornea (Iannaccone et al., 2012). Our claim is, however, not that guidance cues are absent, but that global cues are unnecessary. The alignment term in our model, together with evidence that corneal epithelial cells follow contact-mediated substrate cues (Walczysko et al., 2016), show that corneal cells migration is responsive to external forces, and the underlying patterns of axonal projections could be one of those cues.

      Experiments (Collinson et al., 2002) and simulations in this work show that a rapid spiral epithelial flow forms first, with cells migrating radially for ~2 weeks before stripes become visible. Axons seeking the path of least resistance within this moving basal layer would therefore appear radial early on. By contrast, establishing visible stripes requires an entire cohort of epithelial cells to travel from the limbus to the central cornea (Fig. 7). Extensive in-vivo studies (Song et al., 2004; Leiper et al., 2009) find no evidence that axons direct epithelial migration; if anything, epithelial flow dictates axonal trajectories.

      Geometry and boundaries:

      The spiral also forms on a flat disc, but its exact shape changes with curvature and cap angle; this variation is seen across mammals, including humans (Dua et al., 1993) and in diseases such as keratoconus. On a spherical cap the boundary winding number fixes the interior index, so ongoing limbal influx keeps the total index = 1. 

      In the revised version, we will therefore simulate a range of curvatures, cap angles, a prolate ellipsoid, and cases without limbal division, then compare with published data and disease states.

      In-vitro data and parameter fits:

      Although our dataset is limited, the inferred parameters match three independent invitro estimates (Kostanjevec et al. 2020; Saraswathibhatla et al. 2021; Kammeraat et al. in prep.). Spatial correlations exceed those expected from persistence alone, implying some polar alignment - consistent with Saraswathibhatla et al. 2021.  Slide-scanner images that we will include in the revision show cells are neither elongated nor nematically ordered. In the revision we will detail our parameter extraction, highlight evidence for alignment, stress the substrate-based activity mechanism, and draw attention to the supplementary videos.

      Topological clarification:

      Stagnation points can be seen as topological defects because classification depends only on vector directions. Boundary conditions can remove such defects in fluids, yet two sources/sinks still interact via the same logarithmic Green’s function that governs disclinations, despite di^erent physics. The Euler characteristic is a property of the surface; while the boundary winding number fixes the field index, it does not alter the surface’s Euler characteristic. 

      In the revision, we will add a concise primer on the di^erential-geometric concepts to make these points explicit.

    1. eLife Assessment

      This study demonstrates the application of END-seq, originally developed to study genome-wide DNA double-strand breaks, to telomere biology; the work packs a punch, concisely demonstrating the utility of this approach and the new insights that can be gained. The authors confirm that telomeres in telomerase-positive cells terminate with 5'-ATC in a Pot1-dependent manner, and demonstrate that this principle holds true in telomerase-negative ALT cells as well; S1-END-seq is similarly developed for telomeres, showing that ALT cells harbor several regions of ssDNA. The study is well-executed, the new insights are fundamental and compelling, and the optimized END-seq approaches will be widely utilized. The interest of the paper could be heightened by deepening the discussion of potential biases in telomere representation, the origin of the ssDNA captured in ALT cells, and the occurrence of variant telomere repeats in the cell lines studied.

    2. Reviewer #1 (Public review):

      Summary:

      This manuscript from Azeroglu et al. presents the application of END-Seq to examine the sequence composition of chromosome termini, i.e., telomeres. END-seq is a powerful genome sequencing strategy developed in Andre Nussesweig's lab to examine the sequences at DNA break sites. Here, END-Seq is applied to explore the nucleotide sequences at telomeres and to ascertain (i) whether the terminal end sequence is conserved in cells that activate the ALT telomere elongation mechanism and (ii) whether the processes responsible for telomere end sequence regulation are conserved. With these aims clearly articulated, the authors convincingly show the power of this technique to examine telomere end-processing.

      Strengths:

      (1) The authors effectively demonstrate the application of END-seq for these purposes. They verify prior data that 5'terminal sequences of telomeres in HeLa and RPE cells end in a canonical ATC sequence motif. They verify that the same sequence is present at the 5' ends of telomeres by performing END-seq across a panel of ALT cancer cells. As in non-ALT cells, the established role of POT1, a ssDNA telomere binding protein, in coordinating the mechanism that maintains the canonical ATC motif is likewise verified. However, by performing END-Seq in mouse cells lacking POT1 isoforms, POT1a and POT1b, the authors uncover that POT1b is dispensable for this process. This reveals a novel, important insight relating to the evolution of POT1 as a telomere regulatory factor.

      (2) The authors then demonstrate the utility of S1-END-seq, a variation of END-Seq, to explore the purported abundance of single-stranded DNA at telomeres within telomeres of ALT cancer cells. Here, they demonstrate that ssDNA abundance is an intrinsic aspect of ALT telomeres and is dependent on the activity of BLM, a crucial mediator of ALT.

      Overall, the authors have effectively shown that END-seq can be applied to examine processes maintaining telomeres in normal and cancerous cells across multiple species. Using END-Seq, the authors confirm prior cell biological and sequencing data and the role of POT1 and BLM in regulating telomere termini sequences and ssDNA abundance. The study is nice and well-written, with the experimental rationale and outcomes clearly explained.

      Weaknesses:

      This reviewer finds little to argue with in this study. It is timely and highly valuable for the telomere field. One minor question would be whether the authors could expand more on the application of END-Seq to examine the processive steps of the ALT mechanism? Can they speculate if the ssDNA detected in ALT cells might be an intermediate generated during BIR (i.e., is the ssDNA displaced strand during BIR) or a lesion? Furthermore, have the authors assessed whether ssDNA lesions are due to the loss of ATRX or DAXX, either of which can be mutated in the ALT setting?

    3. Reviewer #2 (Public review):

      This is a short yet very clear manuscript demonstrating that two methods (END-seq and S1-END-seq), previously developed in the Nussenzweig laboratory to study DSBs in the genome, can also be applied to the 5' ends of mammalian telomeres and the accumulation of telomeric single-stranded DNA.

      The authors first validate the applicability of END-seq using different approaches and confirm that mammalian telomeres preferentially end with an ATC 5' end through a mechanism that requires intact POT1 (POT1a in mice). They then extend their analysis to cells that maintain telomeres through the ALT mechanism and demonstrate that, in these cells as well, telomeres frequently end in an ATC 5' sequence via a POT1-dependent mechanism. Using S1-END-seq, the authors further show that ALT telomeres contain single-stranded DNA and estimate that each telomere in ALT cells harbors at least five regions of ssDNA.

      I find this work very interesting and incisive. It clearly demonstrates that END-seq can be applied with unprecedented depth and precision to the study of telomeric features such as the 5' end and ssDNA. The data are very clear and thoroughly interpreted, and the manuscript is well written. The results are carefully analyzed and effectively presented. Overall, I find this manuscript worthy of publication, as the optimized END-seq methods described here will likely be widely utilized in the telomere field.

      I only have a few minor suggestions:

      How can we be sure that all telomeres are equally represented? The authors seem to assume that END-seq captures all chromosome ends equally, but can we be certain of this? While I do not see an obvious way to resolve this experimentally, I recommend discussing this potential bias more extensively in the manuscript.

      I believe Figures 1 and 2 should be merged.

      Scale bars should be added to all microscopy figures.

    4. Reviewer #3 (Public review):

      Summary:

      A subset of cancer cells attain replicative immortality by activating the ALT mechanism of telomere maintenance, which is currently the subject of intense research due to its potential for novel targeted therapies. Key questions remain in the field, such as whether ALT telomeres adhere to the same end-protection rules as telomeres in telomerase-expressing cells, or if ALT telomeres possess unique properties that could be targeted with new, less toxic cancer therapies. Both questions, along with the approaches developed by the authors to address them, are highly relevant.

      Strengths:

      Since chromosome ends resemble one-ended DSBs, the authors hypothesized that the previously described END-SEQ protocol could be used to accurately sequence the 5' end of telomeres on the C-rich strand. As expected, most reads corresponded to the C-rich strand and, confirming a previous observation by de Lange's group, most chromosomes end with the ATC-5' sequence, a feature that was found to be dependent on POT1 and to be conserved in both human ALT cells and mouse cells. Through a complementary method, S1-END-SEQ, the authors further explored ssDNA regions at telomeres, providing new insights into the characteristics of ALT telomeres. The study is original, the experiments were well-controlled and excellently executed.

      Weaknesses:

      Overall, the discussion section is lacking depth and should be expanded and a few additional experiments should be performed to clarify the results.

      (1) The finding that the abundance of variant telomeric repeats (VTRs) within the final 30 nucleotides of the telomeric 5' ends is similar in both telomerase-expressing and ALT cells is intriguing, but the authors do not address this result. Could the authors provide more insight into this observation and suggest potential explanations? As the frequency of VTRs does not seem to be upregulated in POT1-depleted cells, what then drives the appearance of VTRs on the C-strand at the very end of telomeres? Is CST-Pola complex responsible?

      (2) The authors also note that, in ALT cells, the frequency of VTRs in the first 30 nucleotides of the S1-END-SEQ reads is higher compared to END-SEQ, but this finding is not discussed either. Do the authors think that the presence of ssDNA regions is associated with the VTRs? Along this line, what is the frequency of VTRs in the END-SEQ analysis of TRF1-FokI-expressing ALT cells? Is it also increased? Has TRF1-FokI been applied to telomerase-expressing cells to compare VTR frequencies at internal sites between ALT and telomerase-expressing cells?

      Finally, in these experiments (S1-END-SEQ or END-SEQ in TRF1-Fok1), is the frequency of VTRs the same on both the C- and the G-rich strands? It is possible that the sequences are not fully complementary in regions where G4 structures form.

      (3) Based on the ratio of C-rich to G-rich reads in the S1-END-SEQ experiment, the authors estimate that ALT cells contain at least 3-5 ssDNA regions per chromosome end. While the calculation is understandable, this number could be discussed further to consider the possibility that the observed ratios (of roughly 0.5) might result from the presence of extrachromosomal DNA species, such as C-circles. The observed increase in the ratio of C-rich to G-rich reads in BLM-depleted cells supports this hypothesis, as BLM depletion suppresses C-circle formation in U2OS cells. To test this, the authors should examine the impact of POLD3 depletion on the C-rich/G-rich read ratio. Alternatively, they could separate high-molecular-weight (HMW) DNA from low-molecular-weight DNA in ALT cells and repeat the S1-END-SEQ in the HMW fraction.

      (4) What is the authors' perspective on the presence of ssDNA at ALT telomeres? Do they attribute this to replication stress? It would be helpful for the authors to repeat the S1-END-SEQ in telomerase-expressing cells with very long telomeres, such as HeLa1.3 cells, to determine if ssDNA is a specific feature of ALT cells or a result of replication stress. The increased abundance of G4 structures at telomeres in HeLa1.3 cells (as shown in J. Wong's lab) may indicate that replication stress is a factor. Similar to Wong's work, it would be valuable to compare the C-rich/G-rich read ratios in HeLa1.3 cells to those in ALT cells with similar telomeric DNA content.

      Minor Points:

      (1) The Y-axes of Figure 4 should be relabeled to account for the G-strand reads. Additionally, statistical analyses are absent in Figure 4 and Figure S3.

      (2) A careful proofreading of the manuscript is necessary.

    5. Author response:

      We thank the reviewers for their thoughtful and generous assessment of our work. Overall, the reviewers found our work to be novel and relevant. In particular: reviewer #1 found that our manuscript “It is timely and highly valuable for the telomere field” reviewer #2 stated, “Overall, I find this manuscript worthy of publication, as the optimized END-seq methods described here will likely be widely utilized in the telomere field.” Reviewer #3 stated that “The study is original, the experiments were well-controlled and excellently executed.”

      We are extremely grateful for these comments and want to thank all the reviewers and the editors for their time and effort in reviewing our work.

      The reviewers had a number of suggestions to improve our work. We have addressed all the points as highlighted in the point-by-point responses below.

      Reviewer 1:

      One minor question would be whether the authors could expand more on the application of END-Seq to examine the processive steps of the ALT mechanism? Can they speculate if the ssDNA detected in ALT cells might be an intermediate generated during BIR (i.e., is the ssDNA displaced strand during BIR) or a lesion? Furthermore, have the authors assessed whether ssDNA lesions are due to the loss of ATRX or DAXX, either of which can be mutated in the ALT setting?

      We appreciate the reviewer’s insightful questions regarding the application of our assays to investigate the nature of the ssDNA detected in ALT telomeres. Our primary aim in this study was to establish the utility of END-seq and S1-END-seq in telomere biology and to demonstrate their applicability across both ALT-positive and -negative contexts. We agree that exploring the mechanistic origins of ssDNA would be highly informative, and we anticipate that END-seq–based approaches will be well suited for such future studies. However, it remains unclear whether the resolution of S1-END-seq is sufficient to capture transient intermediates such as those generated during BIR. We have now included a brief speculative statement in the revised discussion addressing the potential nature of ssDNA at telomeres in ALT cells.

      Reviewer #2:

      How can we be sure that all telomeres are equally represented? The authors seem to assume that END-seq captures all chromosome ends equally, but can we be certain of this? While I do not see an obvious way to resolve this experimentally, I recommend discussing this potential bias more extensively in the manuscript.

      We thank the reviewer for raising this important point. END-seq and S1-END-seq are unbiased methods designed to capture either double-stranded or single-stranded DNA that can be converted into blunt-ended double-stranded DNA and ligated to a capture oligo. As such, if a subset of telomeres cannot be processed using this approach, it is possible that these telomeres may be underrepresented or lost. However, to our knowledge, there are no proposed telomeric structures that would prevent capture using this method. For example, even if a subset of telomeres possesses a 5′ overhang, it would still be captured by END-seq. Indeed, we observed the consistent presence of the 5′-ATC motif across multiple cell lines and species (human, mouse, and dog). More importantly, we detected predictable and significant changes in sequence composition when telomere ends were experimentally altered, either in vivo (via POT1 depletion) or in vitro (via T7 exonuclease treatment). Together, these findings support the robustness of the method in capturing a representative and dynamic view of telomeres across different systems.

      That said, we have now included a brief statement in the revised discussion acknowledging that we cannot fully exclude the possibility that a subset of telomeres may be missed due to unusual or uncharacterized structures

      I believe Figures 1 and 2 should be merged.

      We appreciate the reviewer’s suggestion to merge Figures 1 and 2. However, we feel that keeping them as separate figures better preserves the logical flow of the manuscript and allows the validation of END-seq and its application to be presented with appropriate clarity and focus. We hope the reviewer agrees that this layout enhances the clarity and interpretability of the data.

      Scale bars should be added to all microscopy figures.

      We thank the reviewer for pointing this out. We have now added scale bars to all the microscopy panels in the figures and included the scale details in the figure legends.

      Reviewer #3:

      Overall, the discussion section is lacking depth and should be expanded and a few additional experiments should be performed to clarify the results.

      We thank the reviewer for the suggestions. Based on this reviewer’s comments and comments for the other reviewers, we incorporated several points into the discussion. As a result, we hope that we provide additional depth to our conclusions.

      (1) The finding that the abundance of variant telomeric repeats (VTRs) within the final 30 nucleotides of the telomeric 5' ends is similar in both telomerase-expressing and ALT cells is intriguing, but the authors do not address this result. Could the authors provide more insight into this observation and suggest potential explanations? As the frequency of VTRs does not seem to be upregulated in POT1-depleted cells, what then drives the appearance of VTRs on the C-strand at the very end of telomeres? Is CST-Pola complex responsible?

      The reviewer raises a very interesting and relevant point. We are hesitant at this point to speculate on why we do not see a difference in variant repeats in ALT versus non-ALT cells, since additional data would be needed. One possibility is that variant repeats in ALT cells accumulate stochastically within telomeres but are selected against when they are present at the terminal portion of chromosome ends. However, to prove this hypothesis, we would need error-free long-read technology combined with END-seq. We feel that developing this approach would be beyond the scope of this manuscript.

      (2) The authors also note that, in ALT cells, the frequency of VTRs in the first 30 nucleotides of the S1-END-SEQ reads is higher compared to END-SEQ, but this finding is not discussed either. Do the authors think that the presence of ssDNA regions is associated with the VTRs? Along this line, what is the frequency of VTRs in the END-SEQ analysis of TRF1-FokI-expressing ALT cells? Is it also increased? Has TRF1-FokI been applied to telomerase-expressing cells to compare VTR frequencies at internal sites between ALT and telomerase-expressing cells?

      Similarly to what is discussed above, short reads have the advantage of being very accurate but do not provide sufficient length to establish the relative frequency of VTRs across the whole telomere sequence. The TRF1-FokI experiment is a good suggestion, but it would still be biased toward non-variant repeats due to the TRF1-binding properties. We plan to address these questions in a future study involving long-read sequencing and END-seq capture of telomeres.

      Finally, in these experiments (S1-END-SEQ or END-SEQ in TRF1-Fok1), is the frequency of VTRs the same on both the C- and the G-rich strands? It is possible that the sequences are not fully complementary in regions where G4 structures form.

      We thank the reviewer for this observation. While we do observe a higher frequency of variant telomeric repeats (VTRs) in the first 30 nucleotides of S1-END-seq reads compared to END-seq in ALT cells, we are currently unable to determine whether this difference is significant, as an appropriate control or matched normalization strategy for this comparison is lacking. Therefore, we refrain from overinterpreting the biological relevance of this observation.

      The reviewer is absolutely correct. Our calculation did not exclude the possibility of extrachromosomal DNA as a source of telomeric ssDNA. We have now addressed this point in our discussion.

      The reviewer is correct in pointing out that we still do not know what causes ssDNA at telomeres in ALT cells. Replication stress seems the most logical explanation based on the work of many labs in the field. However, our data did not reveal any significant difference in the levels of ssDNA at telomeres in non-ALT cells based on telomere length. We used the HeLa1.2.11 cell line (now clarified in the Materials section), which is the parental line of HeLa1.3 and has similarly long telomeres (~20 kb vs. ~23 kb). Despite their long telomeres and potential for replication-associated challenges such as G-quadruplex formation, HeLa1.2.11 cells did not exhibit the elevated levels of telomeric ssDNA that we observed in ALT cells (Figure 4B). Additional experiments are needed to map the occurrence of ssDNA at telomeres in relation to progression toward ALT.

      (3) Based on the ratio of C-rich to G-rich reads in the S1-END-SEQ experiment, the authors estimate that ALT cells contain at least 3-5 ssDNA regions per chromosome end. While the calculation is understandable, this number could be discussed further to consider the possibility that the observed ratios (of roughly 0.5) might result from the presence of extrachromosomal DNA species, such as C-circles. The observed increase in the ratio of C-rich to G-rich reads in BLM-depleted cells supports this hypothesis, as BLM depletion suppresses C-circle formation in U2OS cells. To test this, the authors should examine the impact of POLD3 depletion on the C-rich/G-rich read ratio. Alternatively, they could separate high-molecular-weight (HMW) DNA from low-molecular-weight DNA in ALT cells and repeat the S1-END-SEQ in the HMW fraction.

      The reviewer is absolutely correct. Our calculation did not exclude the possibility of extrachromosomal DNA as a source of telomeric ssDNA. We have now addressed this point in our discussion.

      (4) What is the authors' perspective on the presence of ssDNA at ALT telomeres? Do they attribute this to replication stress? It would be helpful for the authors to repeat the S1-END-SEQ in telomerase-expressing cells with very long telomeres, such as HeLa1.3 cells, to determine if ssDNA is a specific feature of ALT cells or a result of replication stress. The increased abundance of G4 structures at telomeres in HeLa1.3 cells (as shown in J. Wong's lab) may indicate that replication stress is a factor. Similar to Wong's work, it would be valuable to compare the C-rich/G-rich read ratios in HeLa1.3 cells to those in ALT cells with similar telomeric DNA content.

      The reviewer is correct in pointing out that we still do not know what causes ssDNA at telomeres in ALT cells. Replication stress seems the most logical explanation based on the work of many labs in the field. However, our data did not reveal any significant difference in the levels of ssDNA at telomeres in non-ALT cells based on telomere length. We used the HeLa1.2.11 cell line (now clarified in the Materials section), which is the parental line of HeLa1.3 and has similarly long telomeres (~20 kb vs. ~23 kb). Despite their long telomeres and potential for replication-associated challenges such as G-quadruplex formation, HeLa1.2.11 cells did not exhibit the elevated levels of telomeric ssDNA that we observed in ALT cells (Figure 4B). Additional experiments are needed to map the occurrence of ssDNA at telomeres in relation to progression toward ALT.

      Finally, Reviewer #3 raises a list of minor points:

      (1) The Y-axes of Figure 4 have been relabeled to account for the G-strand reads.

      (2) Statistical analyses have been added to the figures where applicable.

      (3) The manuscript has been carefully proofread to improve clarity and consistency throughout the text and figure legends.

      (4) We have revised the text to address issues related to the lack of cross-referencing between the supplementary figures and their corresponding legends.

    1. eLife Assessment

      This important study provides evidence for asymptomatic Bordetella pertussis carriage among mothers in a longitudinal cohort in Zambia, significantly advancing understanding of transmission dynamics. The evidence presented is convincing, with strengths including routine sampling irrespective of symptoms and rigorous qPCR methodology, although confirmatory diagnostics would further strengthen the claims. Overall, the study represents an influential contribution to the field of infectious disease epidemiology.

    2. Reviewer #1 (Public review):

      Summary:

      The study investigates the role of asymptomatic pertussis carriage in transmission between mothers and their infants, in particular. The authors used a longitudinal cohort study that involved 1,315 mother-infant dyads in Lusaka, Zambia, and they utilized qPCR-based detection of IS481 to track Bordetella pertussis transmission over time. Insights from the study suggest that minimally symptomatic or asymptomatic mothers may act as a reservoir for B. pertussis transmission in the infants, thus challenging the traditional surveillance methods that focus on symptomatic cases. Additionally, the study also identified a subgroup of persistently colonized individuals where mothers were majorly asymptomatic despite sustained bacterial presence.

      The authors aimed to improve comprehension of pertussis transmission dynamics in high-burden low-resource settings, and they advocated for enhanced molecular surveillance strategies to capture full pertussis infection, including those that might have gone undetected.

      Strengths:

      The strengths are the use of innovative study design, especially the longitudinal approach and routine sampling, rather than symptom-driven testing that minimizes bias in the study. The methodology was also rigorous and transparent by evaluating the IS481 signal strength to classify pertussis detection and conducting retesting to assess qPCR reliability. There were also important epidemiological insights, and the findings challenge the traditional wisdom by suggesting that pertussis transmission may frequently occur outside of symptomatic cases. The findings also showed its relevance to global health and policy by arguing for the incorporation of molecular tools like qPCR for surveillance of pertussis in low-resource settings.

      Weaknesses:

      These include reliability on qPCR-based detection without additional validation measures like confirmatory culture or serology. There are also potential alternate explanations for transmission patterns observed in the study such as shared environmental exposure or household transmission. Additionally, there is limited generalizability as the study was done in a single urban site in Zambia. There is also a lack of functional immune data.

    3. Reviewer #2 (Public review):

      Summary:

      In this paper, the authors describe the results of a longitudinal study of pertussis infection in mother/infant dyads in Lusaka, Zambia. Unlike many past studies, the authors assessed the infection status of individuals independently of whether they were symptomatic for a respiratory infection. As a result, this work represents one of the first studies specifically designed to assess asymptomatic transmission of pertussis. Using qPCR, the authors find strong evidence for the role of asymptomatic transmission from mothers to infants and also evidence for long-term bacterial carriage. This work represents an important contribution to our understanding of the global burden of pertussis. Also, it highlights the still under-appreciated role of asymptomatic transmission across many infectious diseases (including vaccine-preventable ones).

      Strengths:

      Unlike many past studies, the authors assessed the infection status of individuals independently of whether they were symptomatic for a respiratory infection. As a result, this work represents one of the first studies specifically designed to assess asymptomatic transmission of pertussis. Using qPCR, the authors find strong evidence for the role of asymptomatic transmission from mothers to infants and also evidence for long-term bacterial carriage.

      Weaknesses:

      While I am quite enthusiastic about the work, I am concerned that a number of likely relevant confounders were not discussed and that the broader implications of their findings were not well grounded in the existing literature. For example, I could not find information on the vaccination status of the mothers in the study. Given the conclusions about asymptomatic transmission and the durability of immunity, it is important to know the vaccination status of the mothers. Moreover, did the authors have other metadata on the mother/infant dyads, e.g., household size, vaccination status of household members, etc.? Given the potential implications of more widespread asymptomatic transmission associated with pertussis infection, I believe the authors should better couch their results in the context of the broader debate around asymptomatic transmission.

    1. eLife Assessment

      Cardiac Ca2+/Na+ exchange is mediated by the NCX1 antiporter, whose activity is tightly regulated. This important manuscript describes the structural basis of activation by the lipid DiC8-PIP2 and inhibition by binding of a small molecule to NCX1. These results provide convincing insights into NCX1 regulation and the structural basis of cellular Ca2+ signaling.

    2. Reviewer #1 (Public review):

      This study uses structural and functional approaches to investigate regulation of the Na/Ca exchanger NCX1 by an activator, PIP2 and an inhibitor, SEA0400. Previous functional studies suggest both of these compounds interact with the Na-dependent inactivation process to mediate their effects.

      State of the art methods are employed here, and the data are of high quality and presented very clearly. While there is merit in combining structural studies on both compounds as they relate to Na-dependent activation, in the end it is somewhat disappointing that neither is explored in further depth.

      The novel aspect of this work is the study on PIP2. Unfortunately, technical limitations precluded structural data on binding of the native PIP2, and so an unnatural short-chained analog, di-C8 PIP2, was used instead. This raises the question of whether these two molecules, which have similar but very distinctly different profiles of activation, actually share the same binding pocket and mode of action. The authors conduct a "competition" experiment, arguing the effect of di-C8-PIP2 addition subsequent to PIP2 suggests competition for a single binding site. In this scenario, PIP2 would need to vacate the binding site prior to di-C8-PIP2 occupying it. However, the lack of an effect of washout alone, suggests PIP2 does not easily unbind. This raises the possibility (probability?) of a non-competitive effect of di-C8-PIP2 at a different site. An additionally informative experiment would be to determine if a saturating concentration of di-C8-PIP2 could prevent the full activation induced by subsequent PIP2 addition. However, the relative affinities of the two ligands might make such an experiment challenging in practice.

      In an effort to address the binding site directly, the authors mutate key residues predicted to be important in liganding the phosphorylated head group of PIP2. However, the only mutations that have a significant effect in PIP2 activation also influence the Na-dependent inactivation process independently of PIP2. While these data are consistent with altering PIP2 binding (which cannot be easily untangled from its functional effect on Na-dependent inactivation), a primary effect on Na-inactivation, rather than PIP2 binding, cannot be fully ruled out. A more extensive mutagenic study, based on other regions of the di-C8 PIP2 binding site, would have given more depth to this work and might have been more revealing mechanistically.

      The SEA0400 aspect of the work does not integrate particularly well with the rest of the manuscript. This study confirms the previously reported structure and binding site for SEA0400 but provides little further information. While interesting speculation is presented regarding the connection between SEA0400 inhibition and Na-dependent inactivation, further experiments to test this idea are not included here.

      Comments on revisions:

      (1) The competition assay data for di-C8-PIP2 and PIP2 is a nice addition, but in its description in the text, the authors should be a bit more circumspect about their conclusions, based on the possibility/probability that the effect observed is actually non-competitive (as detailed above).<br /> (2) The authors should acknowledge the formal possibility that the functional effects of the mutations studies are a consequence of a direct effect on Na-dependent inactivation, independent of PIP2 binding.<br /> (3) The authors might strengthen their arguments for combining studies on PIP2 and SEA0400.<br /> (4) The authors could be clearer where their work on SEA0400 extends beyond the previously published observations.