- Nov 2024
-
www.biorxiv.org www.biorxiv.org
-
eLife Assessment
This study provides valuable insights into the evolutionary histories and cellular infection responses of two Salmonella Dublin genotypes. While the evidence is compelling, a more phylogenetically diverse bacterial collection would enhance the findings. This research is relevant to scientists studying Salmonella and gastroenteritis-related pathogens.
-
Reviewer #1 (Public review):
The manuscript consists of two separate but interlinked investigations: genomic epidemiology and virulence assessment of Salmonella Dublin. ST10 dominates the epidemiological landscape of S. Dublin, while ST74 was uncommonly isolated. Detailed genomic epidemiology of ST10 unfolded the evolutionary history of this common genotype, highlighting clonal expansions linked to each distinct geography. Notably, North American ST10 was associated with more antimicrobial resistance compared to others. The authors also performed long-read sequencing on a subset of isolates (ST10 and ST74) and uncovered a novel recombinant virulence plasmid in ST10 (IncX1/IncFII/IncN). Separately, the authors performed cell invasion and cytotoxicity assays on the two S. Dublin genotypes, showing differential responses between the two STs. ST74 replicates better intracellularly in macrophages compared to ST10, but both STs induced comparable cytotoxicity levels. Comparative genomic analyses between the two genotypes showed certain genetic content unique to each genotype, but no further analyses were conducted to investigate which genetic factors were likely associated with the observed differences. The study provides a comprehensive and novel understanding of the evolution and adaptation of two S. Dublin genotypes, which can inform public health measures.
The methodology included in both approaches was sound and written in sufficient detail, and data analysis was performed with rigour. Source data were fully presented and accessible to readers. Certain aspects of the manuscript could be clarified and extended to improve the manuscript.
(1) For epidemiology purposes, it is not clear which human diseases were associated with the genomes included in this manuscript. This is important since S. Dublin can cause invasive bloodstream infections in humans. While such information may be unavailable for public sequences, this should be detailed for the 53 isolates sequenced for this study, especially for isolates selected to perform experiments in vitro.
(2) The major AMR plasmid in described S. Dublin was the IncC associated with clonal expansion in North America. While this plasmid is not found in the Australian isolates sequenced in this study, the reviewer finds that it is still important to include its characterization, since it carries blaCMY-2 and was sustainedly inherited in ST10 clade 5. If the plasmid structure is already published, the authors should include the accession number in the Main Results.
(3) The reviewer is concerned that the multiple annotations missing in<br /> (a) plasmid structures in Supplementary Figures 5 & 6, and<br /> (b) genetic content unique to ST10 and ST74 was due to insufficient annotation by Prokka. I would recommend the authors use another annotation tool, such as Bakta (https://www.ncbi.nlm.nih.gov/pmc/articles/PMC8743544/) for plasmid annotation, and reconstruction of the pangenome described in Supplementary Figure 10. Since the recombinant virulence plasmid in ST10 is a novel one, I would recommend putting Supplementary Figure 5 as a main figure, with better annotations to show the virulence region, plasmid maintenance/replication, and possible conjugation cluster.
(4) The authors are lauded for the use of multiple strains of ST10 and ST74 in the in vitro experiment. While results for ST74 were more consistent, readouts from ST10 were more heterogenous (Figure 5, 6). This is interesting as the tested ST10 were mostly clade 1, so ST10 was, as expected, of lower genetic diversity compared to tested ST74 (partly shown in Figure 1D. Could the authors confirm this by constructing an SNP table separately for tested ST10 and ST74? Additionally, the tested ST10 did not represent the phylogenetic diversity of the global epidemiology, and this limitation should be reflected in the Discussion.
(5) The comparative genomics between ST10 and ST74 can be further improved to allow more interpretation of the experiments. Why were only SPI-1, 2, 6, and 19 included in the search for virulome, how about other SPIs? ST74 lacks SPI-19 and has truncated SPI-6, so what would explain the larger genome size of ST74? Have the authors screened for other SPIs using more well-annotated databases or references (S. Typhi CT18 or S. Typhimurium ST313)? The mismatching between in silico prediction of invasiveness and phenotypes also warrants a brief discussion, perhaps linked to bigger ST74 genome size (as intracellular lifestyle is usually linked with genome degradation).
(6) On the epidemiology scale, ST10 is more successful, perhaps due to its ongoing adaptation to replication inside GI epithelial cells, favouring shedding. ST74 may tend to cause more invasive disease and less transmission via fecal shedding. The presence of T6SS in ST10 also can benefit its competition with other gut commensals, overcoming gut colonization resistance. The reviewer thinks that these details should be more clearly rephrased in the Discussion, as the results highly suggested different adaptations of two genotypes of the same serovar, leading to different epidemiological success.
-
Reviewer #2 (Public review):
This is a comprehensive analysis of Salmonella Dublin genomes that offers insights into the global spread of this pathogen and region-specific traits that are important to understanding its evolution. The phenotyping of isolates of ST10 and ST74 also offers insights into the variability that can be seen in S. Dublin, which is also seen in other Salmonella serovars, and reminds the field that it is important to look beyond lab-adapted strains to truly understand these pathogens. This is a valuable contribution to the field. The only limitation, which the authors also acknowledge, is the bias towards S. Dublin genomes from high-income settings. However, there is no selection bias; this is simply a consequence of publically available sequences.
-
-
www.biorxiv.org www.biorxiv.org
-
eLife Assessment
Following up on their previous work, the authors investigated whether cell-to-cell transmission of HIV-1 activates the CARD8 inflammasome in macrophages. This is important given that inflammasome activation in myeloid cells triggers proinflammatory cytokine release. The data are solid and support the idea that CARD8 is activated by the viral protease and promotes inflammation. However, time-course analyses in primary T cells and macrophages and further information on the specific inflammasome involved would further increase the significance of the study.
-
Joint Public Review:
Following up on their previous work, the authors investigated whether cell-to-cell transmission of HIV-1 activates the CARD8 inflammasome in macrophages, an important question given that inflammasome activation in myeloid cells triggers proinflammatory cytokine release. The data support the idea that CARD8 is activated by the viral protease and promotes inflammation. However, time-course analyses in primary T cells and macrophages and further information on the specific inflammasome involved would further increase the significance of the study.
Strengths:
The manuscript is well-written and the data is of good quality. The evidence that CARD8 senses the HIV-1 protease in the context of cell-to-cell transmission is important since cell-to-cell transmission is thought to play a key role in viral spread in vivo, and inflammation is a major driver of disease progression. Clean knockout experiments in primary macrophages are a notable strength and the results clearly support the role of CARD8 in protease-dependent sensing of viral spread and the induction of IL1β release and cell death. The finding that HIV-1 strains are resistant to protease inhibitors differ in CARD8 activation and IL1β production is interesting and underscores the potential clinical relevance of these results.
Weaknesses:
One weakness is that the authors used T cell lines which might not faithfully reflect the efficiency of HIV-1 production and cell-cell transfer by primary T cells. To assess whether CARD8 is also activated by protease from incoming viral particles earlier time points should be analyzed. Finally, while the authors exclude the role of NLRP3 in IL-1b and the death of macrophages it would be interesting to know whether the effect is still Gasdermin D dependent.
-
Author response:
Thank you for the positive and constructive feedback on our manuscript. We appreciate you highlighting the importance of our work advancing our understanding of the molecular etiology of acquired immunodeficiency syndrome (AIDS). To extend and further substantiate the observation that the CARD8 inflammasome is activated in response to viral protease during HIV-1 cell-to-cell transmission, we are in the process of completing additional experiments that are responsive to reviewer feedback, including:
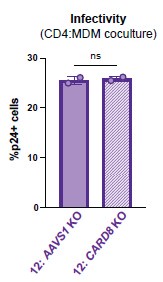
• Primary CD4+ T cell to monocyte-derived macrophage (MDM) transmission: We have now repeated the cell-to-cell experiments with HIV-1 transfer from primary CD4+ T cells to primary monocyte-derived macrophages, and our findings are consistent with CARD8-dependent IL-1β release from HIV-1-infected macrophages in this more physiologic context. We are in the process of repeating these experiments with additional donors and will add these results to the revised manuscript.
• Heterogeneity amongst blood donors: We have now repeated the cell-to-cell transfer and CARD8 knockout in MDMs with additional donors. While we continue to observe heterogeneity amongst donors, the key observation that CARD8 is require for inflammasome responses to HIV-1 infection is consistent. We note that some donors, including the one individual reported in the first submission, have markedly diminished CARD8 activity (to both HIV-1 and VbP).
• Time course experiments: We did conduct a time course experiment when initially establishing these assays. We have now repeated these experiments with additional timepoints and in the presence or absence of the RT inhibitor nevirapine. The results of these experiments will be included in the revised manuscript.
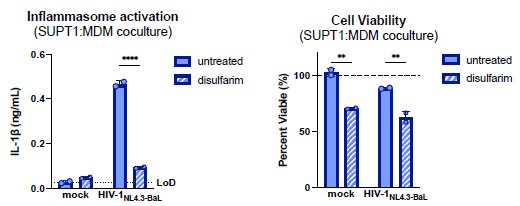
• The role of Gasdermin D: We are mostly interested in the release of IL-1β from the infected macrophages due to its potential contribution to myeloid-driven inflammation in PLWH. To date, there is no evidence that any other pore-forming protein other than GSDMD can initiate IL-1β release (and pyroptosis) downstream of CARD8. Nonetheless, we will attempt this experiment with the Gasdermin D inhibitor, disulfiram.
We believe these and other experiments will further support the importance of the CARD8 inflammasome in myeloid-driven inflammation in PLWH and look forward to submitting the revision.
-
-
www.biorxiv.org www.biorxiv.org
-
eLife Assessment
This valuable study investigates prey capture by archer fish, showing that even though the visuomotor behavior unfolds very rapidly (within 40-70 ms), it is not hardwired; it can adapt to different simulated physics and different prey shapes. Although there was agreement that the model system, experimental design, and main hypothesis are certainly interesting, opinions were divided on whether the evidence supporting the central claims is incomplete. A more rigorous definition and assessment of "reflex speed", more detailed evidence of stimulus control, and a more detailed analysis of individual subjects could potentially increase confidence in the main conclusions.
-
Reviewer #1 (Public review):
Summary:
The authors test whether the archerfish can modulate the fast response to a falling target. By manipulating the trajectory of the target, they claim that the fish can modulate the fast response. While it is clear from the result that the fish can modulate the fast response, the experimental support for the argument that the fish can do it for a reflex-like behavior is inadequate.
Strengths:
Overall, the question that the authors raised in the manuscript is interesting.
Weaknesses:
(1) The argument that the fish can modulate reflex-like behavior relies on the claim that the archerfish makes the decision in 40 ms. There is little support for the 40 ms reaction time. The reaction time for the same behavior in Schlegel 2008, is 60-70 ms, and in Tsvilling 2012 about 75 ms, if we take the half height of the maximum as the estimated reaction time in both cases. If we take the peak (or average) of the distribution as an estimation of reaction time, the reaction time is even longer. This number is critical for the analysis the authors perform since if the reaction time is longer, maybe this is not a reflex as claimed. In addition, mentioning the 40 ms in the abstract is overselling the result. The title is also not supported by the results.
(2) A critical technical issue of the stimulus delivery is not clear. The frame rate is 120 FPS and the target horizontal speed can be up to 1.775 m/s. This produces a target jumping on the screen 15 mm in each frame. This is not a continuous motion. Thus, the similarity between the natural system where the target experiences ballistic trajectory and the experiment here is not clear. Ideally, another type of stimulus delivery system is needed for a project of this kind that requires fast-moving targets (e.g. Reiser, J. Neurosci.Meth. 2008). In addition, the screen is rectangular and not circular, so in some directions, the target vanishes earlier than others. It must produce a bias in the fish response but there is no analysis of this type.
(3) The results here rely on the ability to measure the error of response in the case of a virtual experiment. It is not clear how this is done since the virtual target does not fall. How do the authors validate that the fish indeed perceives the virtual target as the falling target? Since the deflection is at a later stage of the virtual trajectory, it is not clear what is the actual physics that governs the world of the experiment. Overall, the experimental setup is not well designed.
-
Reviewer #2 (Public review):
Summary:
This manuscript studies prey capture by archer fish, which observe the initial values of motion of aerial prey they made fall by spitting on them, and then rapidly turn to reach the ballistic landing point on the water surface. The question raised by the article is whether this incredibly fast decision-making process is hardwired and thus unmodifiable or can be adjusted by experience to follow a new rule, namely that the landing point is deflected from a certain amount of the expected ballistic landing point. The results show that the fish learn the new rule and use it afterward in a variety of novel situations that include height, side, and speed of the prey, and which preserve the speed of the fish's decision. Moreover, a remarkable finding presented in this work is the fact that fish that have learned to use the new rule can relearn to use the ballistic landing point for an object based on its shape (a triangle) while keeping simultaneously the 'deflected rule' for an object differing in shape (a disc); in other words, fish can master simultaneously two decision-making rules based on the different shape of objects.
Strengths:
The manuscript relies on a sophisticated and clever experimental design that allows changing the apparent landing point of a virtual prey using a virtual reality system. Several robust controls are provided to demonstrate the reliability and usefulness of the experimental setup.
Overall, I very much like the idea conveyed by the authors that even stimuli triggering apparently hardwired responses can be relearned in order to be associated with a different response, thus showing the impressive flexibility of circuits that are sometimes considered mediating pure reflexive responses. This is the case - as an additional example - of the main component of the Nasanov pheromone of bees (geraniol), which triggers immediate reflexive attraction and appetitive responses, and which can, nevertheless, be learned by bees in association with an electric shock so that bees end up exhibiting avoidance and the aversive response of sting extension to this odorant (1), which is a fully unnatural situation, and which shows that associative aversive learning is strong enough to override preprogrammed responding, thus reflecting an impressive behavioral flexibility.
Weaknesses:
As a general remark, there is some information that I missed and that is mandatory in the analysis of behavioral changes.
Firstly, the variability in the performances displayed. The authors mentioned that the results reported come from 6 fish (which is a low sample size). How were the individual performances in terms of consistency? Were all fish equally good in adjusting/learning the new rule? How did errors vary according to individual identity? It seems to me that this kind of information should be available as the authors reported that individual fish could be recognized and tracked (see lines 620-635) and is essential for appreciating the flexibility of the system under study.
Secondly, the speed of the learning process is not properly explained. Admittedly, fish learn in an impressive way the new rule and even two rules simultaneously; yet, how long did they need to achieve this? In the article, Figure 2 mentions that at least 6 training stages (each defined as a block of 60 evaluated turn decisions, which actually shows that the standard term 'Training Block' would be more appropriate) were required for the fish to learn the 'deflected rule'. While this means 360 trials (turning starts), I was left with the question of how long this process lasted. How many hours, days, and weeks were needed for the fish to learn? And as mentioned above, were all fish equally fast in learning? I would appreciate explaining this very important point because learning dynamics is relevant to understanding the flexibility of the system.
Reference:
(1) Roussel, E., Padie, S. & Giurfa, M. Aversive learning overcomes appetitive innate responding in honeybees. Anim Cogn 15, 135-141, doi:10.1007/s10071-011-0426-1 (2012).
-
Author response:
Public Reviews:
Reviewer #1 (Public review):
Summary:
The authors test whether the archerfish can modulate the fast response to a falling target.
We have not tested whether archerfish can 'modulate the fast response'. We quantitatively test specific hypotheses on the rules used by the fish. For this the accuracy of the decisions is analyzed with respect to specific points that can be calculated precisely in each experiment. The ill-defined term 'modulate' does in no way capture what is done here. This assessment might explain the question, raised by the reviewer, of 'what is the difference of this study and Reinel, 2016' (i.e. Reinel and Schuster, 2016). In that study, all objects were strictly falling ballistically, and latency and accuracy of the turn decisions were determined when the initial motion was not only horizontal but had an additional vertical component of speed. The question of that study was if the need to account to an additional variable (vertical speed) in the decision would affect its latency or accuracy. The study showed that also then archerfish rapidly turn to the later impact point. It also showed that accuracy and latency (defined in this study exactly as in the present study) were not changed by the added degree of freedom. This is a completely different question and by its very nature does not leave the realm of ballistics.
By manipulating the trajectory of the target, they claim
that the fish can modulate the fast response.
While it is clear from the result that the fish can modulate the fast response, the experimental support for the argument that the fish can do it for a reflex-like behavior is inadequate.
This is disturbing: The manuscript is full of data that directly report response latency (a parameter that's critical in all experiments) and there are even graphical displays of the distribution of latency (Figs. 2, 5). How fast the responses are, can also already be seen in the first video. Most importantly, the nature of the 40 ms limit has been discovered and has been reported by our group in 2008 (Schlegel and Schuster, 2008, Fig. 4). For easy reference, we attach Schlegel and Schuster, 2008 with the relevant passages marked in yellow. But later studies also using high speed video (ie. typically 500 fps) and simultaneously evaluating accuracy and kinematics (in the same ways as used here!) to address various questions repeatedly report and even graphically represent minimum latencies of 40 ms, e.g. Krupczynski and Schuster, 2013 (e.g. Fig. 2); Reinel and Schuster, 2014; Reinel and Schuster, 2016; Reinel and Schuster, 2018a, b (e.g. see Fig. 7 in the first part) and report how latency is increased as urgency is decreased (if the fish are too close or time of falling is increased), as temperature is decreased or as viewing conditions and their homogeneity across the tank change. Moreover, even a field study is available (Rischawy, Blum and Schuster, 2015) that shows why the speed is needed. This is because of massive competition with at least some of the competitor fish also be able to turn to the later impact point. So, speed is an absolute necessity if competitors are around. Interestingly, when the fish are isolated, latency goes up and eventually the fish will no longer respond with C-starts (Schlegel and Schuster, 2008).
Another aspect: considering the introduction it would not even have mattered if not 40 ms but instead 150 ms were the time needed for an accurate start (which is not the case). That would still be faster than an Olympic sprinter responds to a gun shot. Moreoever, please also note that we carefully talk of reflex-speed not of a reflex-behavior (which is as easy to verify as any other if the false statements made).
Strengths:
Overall, the question that the authors raised in the manuscript is interesting.
Given the statement of no difference between the present study and Reinel and Schuster, 2016, it is not clear what this assessment refers to.
Weaknesses:
(1) The argument that the fish can modulate reflex-like behavior relies on the claim that the archerfish makes the decision in 40 ms. There is little support for the 40 ms reaction time.
The 'little support' is a paper in Science in which this important aspect is directly analyzed (Fig. 4 of that paper) and that has been praised by folks like Yadin Dudai (e.g . in Faculty 1000). The support is also data on latency as presented in the present paper. Furthermore, additional publications are available on the reaction time (see above).
The reaction time for the same behavior in Schlegel 2008, is 60-70 ms, and in Tsvilling 2012 about 75 ms, if we take the half height of the maximum as the estimated reaction time in both cases. If we take the peak (or average) of the distribution as an estimation of reaction time, the reaction time is even longer. This number is critical for the analysis the authors perform since if the reaction time is longer, maybe this is not a reflex as claimed.
See above.
In addition, mentioning the 40 ms in the abstract is overselling the result.
See above.
Just for completeness: Considering a very interesting point raised by reviewer 2 we add an additional panel to further emphasize the exciting point that accuracy and latency are unrelated in the start decisions. That point was already made in Fig.4 of the paper in Science but can be directly addressed.
The title is also not supported by the results.
No: the title is clearly supported by the results that are reported in the paper.
(2) A critical technical issue of the stimulus delivery is not clear.
The stimulus delivery is described in detail. Most importantly we emphasize (even mentioning frame rate) that all VR setups require experimental confirmation that they work for the species and for the behavior at hand. Ideally, they should elicit the same behavior (in all aspects) as a real stimulus does that the VR approach intends to mimic. Whether VR works in a given animal and for the behavior at hand in that animal cannot be known or postulated a priori. It must be shown in direct critical experiments. Such experiments and the need to perform them are described in detail in Figure 2 and in the text that is associated with that figure.
The frame rate is 120 FPS and the target horizontal speed can be up to 1.775 m/s. This produces a target jumping on the screen 15 mm in each frame. This is not a continuous motion. Thus, the similarity between the natural system where the target experiences ballistic trajectory and the experiment here is not clear. Ideally, another type of stimulus delivery system is needed for a project of this kind that requires fast-moving targets (e.g. Reiser, J. Neurosci.Meth. 2008).
See above. It is quite funny that one of the authors of the present study had been involved in developing a setup with a complete panorama of 6000 LEDs (Strauss, Schuster and Götz, 1997; and appropriately cited in Reiser) that has been the basis for Reiser. This panorama was also used to successfully implement VR in freely walking Drosophila (Schuster et al., Curr. Biol., 2002). However, an LED based approach was abandoned because of insufficient spatial resolution (that, in archerfish, is very different from that of Drosophila).
But the crucial point really is this: Just looking at Figure 2 shows that our approach could not have worked better in any way - it provided the input needed to cause turn decisions that are in all aspects just as those with real objects. Achieving this was not at all trivial and required enormous effort and many failed attempts. But it allows addressing our questions for the first time after 20 years of studying these interesting decisions.
In addition, the screen is rectangular and not circular, so in some directions, the target vanishes earlier than others. It must produce a bias in the fish response but there is no analysis of this type.
Why 'must' it produce a bias? Is it not conceivable that you can only use a circular part of the screen? Briefly, and as could have been checked by quickly looking into the methods section, this is what we did. But still, why would it have mattered in our strictly randomized design? It could have mattered only in a completely silly way of running the experiments in which exclusively long trajectories are shown in one condition and exclusively short ones in another.
(3) The results here rely on the ability to measure the error of response in the case of a virtual experiment. It is not clear how this is done since the virtual target does not fall.
Well, of course it does not fall!!! That is the whole point that enables the study, and this is explained in connection with the glass plate experiment of Fig. 1 and quite some text is devoted to say that this is the starting point for the present analysis. The ballistic impact point is calculated (just as explained in our very first paper on the start decisions, Rossel, Corlija and Schuster, 2002) from the initial speed and height of the target, using simple high-school physics and the justification for that is also in that paper. This has been done already more than 20 years ago. How else could that paper have arrived at the conclusion that the fish turned to the virtual impact point even though nothing is falling? We also describe this for the readers of the present study, illustrate how accuracy is determined in Figures, in all videos and in an additional Supplementary Figure. Consulting the paper reveals that orientation of the fish is determined immediately at the end of stage 2 of its C-start and the error directly reports how close continuing in that direction would lead the fish to the (real or virtual) impact point. This measure has also been used since the first paper in 2002 in our lab and it is very useful because it provides an invariant measure that allows pooling all the different conditions (orientation and position of responding fish as well as direction, speed and height of target).
How do the authors validate that the fish indeed perceives the virtual target as the falling target?
See above. The fish produce C-starts (whose kinematics are analyzed and reported in Figures), whose latency is measured (from onset of target motion to onset of C-start) and whose accuracy in aligning them to the calculated virtual impact point is measured (see above). Additionally, the errors are also analyzed to other points of interest, for instance landmarks, the ballistic landing point in the re-trained fish or points calculated on the basis of specific hypotheses in the generalization experiments.
Since the deflection is at a later stage of the virtual trajectory, it is not clear what is the actual physics that governs the world of the experiment.
As explained in the text what we need is substituting the ballistic connection with another fixed relation between initial target motion and the landing point. This other relation needs to produce a large error in the aims when they remain based on the ballistic virtual landing point. It is directly shown in the key experiments that the fish need not see the deflection but can respond appropriately to the initial motion after training (Figs. 3, 5 and corresponding paragraphs in the text as well as additional movies). Please also note that after training the decision is based on the initial movement. This is shown in the interspersed experiments in which nothing than the initial (pre-deflection) movement was shown.
Overall, the experimental setup is not well designed.
It is obviously designed well enough to mimic the natural situation in every aspect needed (see Fig. 2) and well enough to answer the questions we have asked.
Reviewer #2 (Public review):
Summary:
This manuscript studies prey capture by archer fish, which observe the initial values of motion of aerial prey they made fall by spitting on them, and then rapidly turn to reach the ballistic landing point on the water surface. The question raised by the article is whether this incredibly fast decision-making process is hardwired and thus unmodifiable or can be adjusted by experience to follow a new rule, namely that the landing point is deflected from a certain amount of the expected ballistic landing point. The results show that the fish learn the new rule and use it afterward in a variety of novel situations that include height, side, and speed of the prey, and which preserve the speed of the fish's decision. Moreover, a remarkable finding presented in this work is the fact that fish that have learned to use the new rule can relearn to use the ballistic landing point for an object based on its shape (a triangle) while keeping simultaneously the 'deflected rule' for an object differing in shape (a disc); in other words, fish can master simultaneously two decision-making rules based on the different shape of objects.
Strengths:
The manuscript relies on a sophisticated and clever experimental design that allows changing the apparent landing point of a virtual prey using a virtual reality system. Several robust controls are provided to demonstrate the reliability and usefulness of the experimental setup.
Overall, I very much like the idea conveyed by the authors that even stimuli triggering apparently hardwired responses can be relearned in order to be associated with a different response, thus showing the impressive flexibility of circuits that are sometimes considered mediating pure reflexive responses.
Thank you so much for this precise assessment of what we have shown!
This is the case - as an additional example - of the main component of the Nasanov pheromone of bees (geraniol), which triggers immediate reflexive attraction and appetitive responses, and which can, nevertheless, be learned by bees in association with an electric shock so that bees end up exhibiting avoidance and the aversive response of sting extension to this odorant (1), which is a fully unnatural situation, and which shows that associative aversive learning is strong enough to override preprogrammed responding, thus reflecting an impressive behavioral flexibility.
That's very interesting, thanks.
Weaknesses:
As a general remark, there is some information that I missed and that is mandatory in the analysis of behavioral changes.
Firstly, the variability in the performances displayed. The authors mentioned that the results reported come from 6 fish (which is a low sample size). How were the individual performances in terms of consistency? Were all fish equally good in adjusting/learning the new rule? How did errors vary according to individual identity? It seems to me that this kind of information should be available as the authors reported that individual fish could be recognized and tracked (see lines 620-635) and is essential for appreciating the flexibility of the system under study.
Secondly, the speed of the learning process is not properly explained. Admittedly, fish learn in an impressive way the new rule and even two rules simultaneously; yet, how long did they need to achieve this? In the article, Figure 2 mentions that at least 6 training stages (each defined as a block of 60 evaluated turn decisions, which actually shows that the standard term 'Training Block' would be more appropriate) were required for the fish to learn the 'deflected rule'. While this means 360 trials (turning starts), I was left with the question of how long this process lasted. How many hours, days, and weeks were needed for the fish to learn? And as mentioned above, were all fish equally fast in learning? I would appreciate explaining this very important point because learning dynamics is relevant to understanding the flexibility of the system.
First, it is very important to keep the question in mind that we wanted to clarify: Does the system have the potential to re-tune the decisions to other non-ballistic relations between the input variables and the output? This would have been established if one fish was found capable of doing that. However, we do have sufficient evidence to say that all six fish learned the new law and that at least one (actually four) individual was capable of simultaneously handling the two laws. We will explain this much better (hopefully) in our revised version. We also have to stress that not all archerfish might actually be able to do this and that not all archerfish might learn in the same way, at the same speed, or using the same strategies. These questions are extremely interesting and we therefore definitely will include all evidence that we have. If some individuals are better than others in quickly adjusting, then even observational learning could become a part of the story. However, we needed to make and document the first steps. Understanding these is essential and apparently is difficult enough.
Reference:
(1) Roussel, E., Padie, S. & Giurfa, M. Aversive learning overcomes appetitive innate responding in honeybees. Anim Cogn 15, 135-141, doi:10.1007/s10071-011-0426-1 (2012).
Thanks for this reference!
-
-
www.biorxiv.org www.biorxiv.org
-
eLife Assessment
This study provides evidence that cerebellar projections to the thalamus are required for learning and execution of motor skills in the accelerating rotarod task. This important study adds to a growing body of literature on the interactions between the cerebellum, motor cortex, and basal ganglia during motor learning. The data presentation is generally sound, especially the main observations, with some limitations in describing the statistical methods and a lack of support for two segregated cerebello-thalamic pathways, which is incomplete in supporting the overall claim.
-
Reviewer #1 (Public review):
This is an interesting manuscript tackling the issue of whether subcircuits of the cerebellum are differentially involved in processes of motor performance, learning, or learning consolidation. The authors focus on cerebellar outputs to the ventrolateral thalamus (VL) and to the centrolateral thalamus (CL), since these thalamic nuclei project to the motor cortex and striatum respectively, and thus might be expected to participate in diverse components of motor control and learning. In mice challenged with an accelerating rotarod, the investigators reduce cerebellar output either broadly, or in projection-specific populations, with CNO targeting DREADD-expressing neurons. They first establish that there are not major control deficits with the treatment regime, finding no differences in basic locomotor behavior, grid test, and fixed-speed rotarod. This is interpreted to allow them to differentiate control from learning, and their inter-relationships. These manipulations are coupled with chronic electrophysiological recordings targeted to the cerebellar nuclei (CN) to control for the efficacy of the CNO manipulation. I found the manuscript intriguing, offering much food for thought, and am confident that it will influence further work on motor learning consolidation. The issue of motor consolidation supported by the cerebellum is timely and interesting, and the claims are novel. There are some limitations to the data presentation and claims, highlighted below, which, if amended, would improve the manuscript.
(1) Statistical analyses: There is too little information provided about how the Deming regressions, mean points, slopes, and intercepts were compared across conditions. This is important since in the heart of the study when the effects of inactivating CL- vs VL- projecting neurons are being compared to control performance, these statistical methods become paramount. Details of these comparisons and their assumptions should be added to the Methods section. As it stands I barely see information about these tests, and only in the figure legends. I would also like the authors to describe whether there is a criterion for significance in a given correlation to be then compared to another. If I have a weak correlation for a regression model that is non-significant, I would not want to 'compare' that regression to another one since it is already a weak model. The authors should comment on the inclusion criteria for using statistics on regression models.
(2) The introduction makes the claim that the cerebellar feedback to the forebrain and cortex are functionally segregated. I interpreted this to mean that the cerebellar output neurons are known to project to either VL or CL exclusively (i.e. they do not collateralize). I was unaware of this knowledge and could find no support for the claim in the references provided (Proville 2014; Hintzer 2018; Bosan 2013). Either I am confused as to the authors' meaning or the claim is inaccurate. This point is broader however than some confusion about citation. The study assumes that the CN-CL population and CN-VL population are distinct cells, but to my knowledge, this has not been established. It is difficult to make sense of the data if they are entirely the same populations, unless projection topography differs, but in any event, it is critical to clarify this point: are these different cell types from the nuclei?; how has that been rigorously established?; is there overlap? No overlap? Etc. Results should be interpreted in light of the level of this knowledge of the anatomy in the mouse or rat.
(3) It is commendable that the authors perform electrophysiology to validate DREADD/CNO. So many investigators don't bother and I really appreciate these data. Would the authors please show the 'wash' in Figure 1a, so that we can see the recovery of the spiking hash after CNO is cleared from the system? This would provide confidence that the signal is not disappearing for reasons of electrode instability or tissue damage/ other.
(4) I don't think that the "Learning" and "Maintenance" terminology is very helpful and in fact may sow confusion. I would recommend that the authors use a day range " Days 1-3 vs 4-7" or similar, to refer to these epochs. The terminology chosen begs for careful validation, definitions, etc, and seems like it is unlikely uniform across all animals, thus it seems more appropriate to just report it straight, defining the epochs by day. Such original terminology could still be used in the Discussion, with appropriate caveats.
(5) Minor, but, on the top of page 14 in the Results, the text states, "Suggesting the presence of a 'critical period' in the consolidation of the task". I think this is a non-standard use of 'critical period' and should be removed. If kept, the authors must define what they mean specifically and provide sufficient additional analyses to support the idea. As it stands, the point will sow confusion.
-
Reviewer #2 (Public review):
Summary:
This study examines the contribution of cerebello-thalamic pathways to motor skill learning and consolidation in an accelerating rotarod task. The authors use chemogenetic silencing to manipulate the activity of cerebellar nuclei neurons projecting to two thalamic subregions that target the motor cortex and striatum. By silencing these pathways during different phases of task acquisition (during the task vs after the task), the authors report valuable findings of the involvement of these cerebellar pathways in learning and consolidation.
Strengths:
The experiments are well-executed. The authors perform multiple controls and careful analysis to solidly rule out any gross motor deficits caused by their cerebellar nuclei manipulation. The finding that cerebellar projections to the thalamus are required for learning and execution of the accelerating rotarod task adds to a growing body of literature on the interactions between the cerebellum, motor cortex, and basal ganglia during motor learning. The finding that silencing the cerebellar nuclei after a task impairs the consolidation of the learned skill is interesting.
Weaknesses:
While the controls for a lack of gross motor deficit are solid, the data seem to show some motor execution deficit when cerebellar nuclei are silenced during task performance. This deficit could potentially impact learning when cerebellar nuclei are silenced during task acquisition. Separately, I find the support for two separate cerebello-thalamic pathways incomplete. The data presented do not clearly show the two pathways are anatomically parallel. The difference in behavioral deficits caused by manipulating these pathways also appears subtle.
-
Reviewer #3 (Public review):
Summary:
Varani et al present important findings regarding the role of distinct cerebellothalamic connections in motor learning and performance. Their key findings are that:<br /> (1) cerebellothalamic connections are important for learning motor skills<br /> (2) cerebellar efferents specifically to the central lateral (CL) thalamus are important for short-term learning<br /> (3) cerebellar efferents specifically to the ventral anterior lateral (VAL) complex are important for offline consolidation of learned skills, and<br /> (4) that once a skill is acquired, cerebellothalamic connections become important for online task performance.
The authors went to great lengths to separate effects on motor performance from learning, for the most part successfully. While one could argue about some of the specifics, there is little doubt that the CN-CL and CN-VAL pathways play distinct roles in motor learning and performance. An important next step will be to dissect the downstream mechanisms by which these cerebellothalamic pathways mediate motor learning and adaptation.
Strengths:
(1) The dissociation between online learning through CN-CL and offline consolidation through CN-VAL is convincing.
(2) The ability to tease learning apart from performance using their titrated chemogenetic approach is impressive. In particular, their use of multiple motor assays to demonstrate preserved motor function and balance is an important control.
(3) The evidence supporting the main claims is convincing, with multiple replications of the findings and appropriate controls.
Weaknesses:
(1) Despite the care the authors took to demonstrate that their chemogenetic approach does not impair online performance, there is a trend towards impaired rotarod performance at higher speeds in Supplementary Figure 4f, suggesting that there could be subtle changes in motor performance below the level of detection of their assays.
(2) There is likely some overlap between CN neurons projecting to VAL and CL, somewhat limiting the specificity of their conclusions.
-
Author response:
Public Reviews:
Reviewer #1 (Public review):
This is an interesting manuscript tackling the issue of whether subcircuits of the cerebellum are differentially involved in processes of motor performance, learning, or learning consolidation. The authors focus on cerebellar outputs to the ventrolateral thalamus (VL) and to the centrolateral thalamus (CL), since these thalamic nuclei project to the motor cortex and striatum respectively, and thus might be expected to participate in diverse components of motor control and learning. In mice challenged with an accelerating rotarod, the investigators reduce cerebellar output either broadly, or in projection-specific populations, with CNO targeting DREADD-expressing neurons. They first establish that there are not major control deficits with the treatment regime, finding no differences in basic locomotor behavior, grid test, and fixed-speed rotarod. This is interpreted to allow them to differentiate control from learning, and their inter-relationships. These manipulations are coupled with chronic electrophysiological recordings targeted to the cerebellar nuclei (CN) to control for the efficacy of the CNO manipulation. I found the manuscript intriguing, offering much food for thought, and am confident that it will influence further work on motor learning consolidation. The issue of motor consolidation supported by the cerebellum is timely and interesting, and the claims are novel. There are some limitations to the data presentation and claims, highlighted below, which, if amended, would improve the manuscript.
We thank the reviewer for the positive comments and insightful critics.
(1.1) Statistical analyses: There is too little information provided about how the Deming regressions, mean points, slopes, and intercepts were compared across conditions. This is important since in the heart of the study when the effects of inactivating CL- vs VL- projecting neurons are being compared to control performance, these statistical methods become paramount. Details of these comparisons and their assumptions should be added to the Methods section. As it stands I barely see information about these tests, and only in the figure legends. I would also like the authors to describe whether there is a criterion for significance in a given correlation to be then compared to another. If I have a weak correlation for a regression model that is non-significant, I would not want to 'compare' that regression to another one since it is already a weak model. The authors should comment on the inclusion criteria for using statistics on regression models.
Currently the Methods indeed explain that groups are compared by testing differences of distributions of residuals of treatment and control groups around the Deming regression of the control groups: “To test if treatments altered the relationship between initial performance vs learning or daily vs overnight learning, we compared the distribution of signed distance to the control Deming regression line between groups.” But this shall indeed be explained in more details.
The performance on a given day depends on a cumulative process, so that the average measure of performance is not fully informative on what is learned or what is changed by a treatment (this is further explained in the text p9-10).The challenge is to deal with the multivariate relationships where initial performance, daily learning, and consolidated learning are interdependent. While in control groups these quantities show linear relationships, this is far less the case in treatment groups; this may indeed be due to the variability of the effect of the treatment (efficacy of viral injections) which adds up to the intrinsic variability in the absence of treatment.
Our choice to see if there is a shift in these relationships following treatments, is to see to which extent treatment points in bivariate comparisons (initial perf x daily learning, daily learning x consolidated learning) are evenly distributed around the control group regression line. We take the presence of a significant difference in the distribution of residuals between the control and treatment group as an indication that the process represented in group is disrupted by the treatment: e.g. if the residuals of the treatment group are lower than those of the control group in the initial performance * daily learning comparison, it indicates that learning is slower (or larger). If the residuals of the treatment group are lower than those of the control group in the daily learning * consolidated learning comparison, it indicates that consolidation is lower. This shall be clarified in a revised version.
(1.2a) The introduction makes the claim that the cerebellar feedback to the forebrain and cortex are functionally segregated. I interpreted this to mean that the cerebellar output neurons are known to project to either VL or CL exclusively (i.e. they do not collateralize). I was unaware of this knowledge and could find no support for the claim in the references provided (Proville 2014; Hintzer 2018; Bosan 2013). Either I am confused as to the authors' meaning or the claim is inaccurate. This point is broader however than some confusion about citation.
The references are not cited in the context of collaterals: “They [basal ganglia and cerebellum] send projections back to the cortex via anatomically and functionally segregated channels, which are relayed by predominantly non-overlapping thalamic regions (Bostan, Dum et al. 2013, Proville, Spolidoro et al. 2014, Hintzen, Pelzer et al. 2018). ” Indeed, the thalamic compartments targeted by the basal ganglia and cerebellum are distinct, and in the Proville 2014, we showed some functional segregation of the cerebello-cortical projections (whisker vs orofacial ascending projections). We do not claim that there is a full segregation of the two pathways, there is indeed some known degree of collateralization (see below).
(1.2b) The study assumes that the CN-CL population and CN-VL population are distinct cells, but to my knowledge, this has not been established. It is difficult to make sense of the data if they are entirely the same populations, unless projection topography differs, but in any event, it is critical to clarify this point: are these different cell types from the nuclei?; how has that been rigorously established?; is there overlap? No overlap? Etc. Results should be interpreted in light of the level of this knowledge of the anatomy in the mouse or rat.
Actually, the study does not assume that CL-projecting and VAL-projecting neurons are entirely separate populations (actually it is known that there is an overlap), but states that inhibition of neurons following retrograde infections from the CL and VAL do not produce identical results.
There is indeed a paragraph devoted to the discussion of this point (middle paragraph p20). “Interestingly, both Dentate and Interposed nuclei contain some neurons with collaterals in both VAL and CL thalamic structures (Aumann and Horne 1996, Sakayori, Kato et al. 2019), suggesting that the effect on learning could be mediated by a combined action on the learning process in the striatum (via the CL thalamus) and in the cortex (via the VAL thalamus). However, consistent with (Sakayori, Kato et al. 2019), we found that the manipulations of cerebellar neurons retrogradely targeted either from the CL or from the VAL produced different effects in the task. This indicates that either the distinct functional roles of VAL-projecting of CL-projecting neurons reported in our study is carried by a subset of pathway-specific neurons without collaterals, or that our retrograde infections in VAL and CL preferentially targeted different cerebello-thalamic populations even if these populations had axon terminals in both thalamic regions.”. In other words, we actually know from the literature that there is a degree of collateralization (CN neurons projecting to both VAL and CL, see refs cited above), but as the reviewer says, it does not seem logically possible that the exact same population would have different effects, which are very distinct during the first learning days. The only possible explanation is the CN-CL and CN-VAL retrograde infections recruit somewhat different populations of neurons. This could be due to differences in density of collaterals in CL and VAL of neurons with collaterals in both regions, or presence of CL-projecting neurons without collaterals in VAL, and VAL-projecting neurons without collaterals in CL in addition to the (established) population of neurons with collaterals in both regions. The lesional approach of CN-thalamus neurons in Sakayori et al. 2019 also observed separate effects for CL and VL injections consistent with the differential recruitment of CN populations by retrograde infections.
This should be improved in a revised version of the manuscript.
(1.3) It is commendable that the authors perform electrophysiology to validate DREADD/CNO. So many investigators don't bother and I really appreciate these data. Would the authors please show the 'wash' in Figure 1a, so that we can see the recovery of the spiking hash after CNO is cleared from the system? This would provide confidence that the signal is not disappearing for reasons of electrode instability or tissue damage/ other.
We do not have the wash data on the same day, but there is no significant change in the baseline firing rate across recording days.
(1.4) I don't think that the "Learning" and "Maintenance" terminology is very helpful and in fact may sow confusion. I would recommend that the authors use a day range " Days 1-3 vs 4-7" or similar, to refer to these epochs. The terminology chosen begs for careful validation, definitions, etc, and seems like it is unlikely uniform across all animals, thus it seems more appropriate to just report it straight, defining the epochs by day. Such original terminology could still be used in the Discussion, with appropriate caveats.
This shall be indeed corrected in a revised version.
(1.5) Minor, but, on the top of page 14 in the Results, the text states, "Suggesting the presence of a 'critical period' in the consolidation of the task". I think this is a non-standard use of 'critical period' and should be removed. If kept, the authors must define what they mean specifically and provide sufficient additional analyses to support the idea. As it stands, the point will sow confusion.
This shall be indeed corrected in a revised version
Reviewer #2 (Public review):
Summary:
This study examines the contribution of cerebello-thalamic pathways to motor skill learning and consolidation in an accelerating rotarod task. The authors use chemogenetic silencing to manipulate the activity of cerebellar nuclei neurons projecting to two thalamic subregions that target the motor cortex and striatum. By silencing these pathways during different phases of task acquisition (during the task vs after the task), the authors report valuable findings of the involvement of these cerebellar pathways in learning and consolidation.
Strengths:
The experiments are well-executed. The authors perform multiple controls and careful analysis to solidly rule out any gross motor deficits caused by their cerebellar nuclei manipulation. The finding that cerebellar projections to the thalamus are required for learning and execution of the accelerating rotarod task adds to a growing body of literature on the interactions between the cerebellum, motor cortex, and basal ganglia during motor learning. The finding that silencing the cerebellar nuclei after a task impairs the consolidation of the learned skill is interesting.
We thank the reviewer for the positive comments and insightful critics below.
Weaknesses:
(2.1) While the controls for a lack of gross motor deficit are solid, the data seem to show some motor execution deficit when cerebellar nuclei are silenced during task performance. This deficit could potentially impact learning when cerebellar nuclei are silenced during task acquisition.
One of our key controls are the tests of the treatment on fixed speed rotarod, which provides the closest conditions to the ones found in the accelerating rotarod (the main difference between the protocols being the slow steady acceleration of rod rotation [+0.12 rpm per s]- in the accelerating version).
In the CN experiments, we found clear deficits in learning and consolidation while there was no effect on the fixed speed rotarod (performance of the DREAD-CNO are even slightly better than some control groups), consistent with a separation of the effect on learning/consolidation from those on locomotion on a rotarod. However, small but measurable deficits are found at the highest speed in the fixed speed rotarod in the CN-VAL group; there was no significant effect in the CN-CL group, while the CN-CL actually shows lower performances from the second day of learning; we believe this supports our claim that the CN-CL inhibition impacted more the learning process than the motor coordination. In contrast the CN-VAL group only showed significantly lower performance on day 4 of the accelerating rotarod consistent with intact learning abilities. Of note, under CNO, CN-VAL mice could stay for more than a minute and half at 20rpm, while on average they fell from the accelerating rotarod as soon as the rotarod reached the speed of ~19rpm (130s).
The text currently states “The inhibition of CN-VAL neurons during the task also yielded lower levels of performance in the Maintenance stage,[[NB: day 5-7]] suggesting that these neurons contribute also to learning and retrieval of motor skills, although the mild defect in fixed speed rotarod could indicate the presence of a locomotor deficit, only visible at high speed.” Following the reviewers’ comment, we shall however revise the sentence above in the revised version of the MS to say that we cannot fully disambiguate the execution / learning-retrieval effect at high speed for these mice.
(2.2a) Separately, I find the support for two separate cerebello-thalamic pathways incomplete. The data presented do not clearly show the two pathways are anatomically parallel.
As explained above (point 1.2a), it is already known that these pathways overlap to some degree (discussion p 20), but yet their targeting differentially affects the behavior, consistent with separate contributions. A similar finding was observed for a lesional (irreversible) approach in Sakayori et al. 2019.
(2.2b) The difference in behavioral deficits caused by manipulating these pathways also appears subtle.
While we agree that after 3-4 days of learning the difference of performance between the groups becomes elusive, we respectfully disagree with the reviewer that in the early stages these differences are negligible and the impact of inhibition on "learning rate" (ie. amount of learning for a given daily initial performance) and consolidation (i.e. overnight retention of daily gain of performance) exhibit different profiles for the two groups (fig 3h vs 3k).
Reviewer #3 (Public review)
Summary:
Varani et al present important findings regarding the role of distinct cerebellothalamic connections in motor learning and performance. Their key findings are that:
(1) cerebellothalamic connections are important for learning motor skills
(2) cerebellar efferents specifically to the central lateral (CL) thalamus are important for short-term learning
(3) cerebellar efferents specifically to the ventral anterior lateral (VAL) complex are important for offline consolidation of learned skills, and
(4) that once a skill is acquired, cerebellothalamic connections become important for online task performance.
The authors went to great lengths to separate effects on motor performance from learning, for the most part successfully. While one could argue about some of the specifics, there is little doubt that the CN-CL and CN-VAL pathways play distinct roles in motor learning and performance. An important next step will be to dissect the downstream mechanisms by which these cerebellothalamic pathways mediate motor learning and adaptation.
Strengths:
(1) The dissociation between online learning through CN-CL and offline consolidation through CN-VAL is convincing.
(2) The ability to tease learning apart from performance using their titrated chemogenetic approach is impressive. In particular, their use of multiple motor assays to demonstrate preserved motor function and balance is an important control.
(3) The evidence supporting the main claims is convincing, with multiple replications of the findings and appropriate controls.
We thank the reviewer for the positive comments and insightful critics below.
Weaknesses:
(3.1) Despite the care the authors took to demonstrate that their chemogenetic approach does not impair online performance, there is a trend towards impaired rotarod performance at higher speeds in Supplementary Figure 4f, suggesting that there could be subtle changes in motor performance below the level of detection of their assays.
This is also discussed in point 2.1 above. In our view, the fixed speed rotarod is a control very close to the accelerating rotarod condition, with very similar requirements between the two tasks (yet unfortunately rarely tested in accelerating rotarod studies). We do not exclude the presence of motor deficits, but the main argument is that these do not suffice to explain the differences observed in the accelerating rotarod. No detectable deficit was found in the CN group while very clear deficits in learning/consolidation were observed. A mild deficit is only significant in the CN-VAL group, while the deficit is not significant in the fixed-speed rotarod for the CN-CL group which shows the strongest deficit in accelerating rotarod during the first days: e.g. on day 2, the CN-CL group is already below the control group with latencies to fall ~100s (corresponding to immediate fall at ~15rpm) while the fixed speed rotarod performances at 15s of the control and CNO-treated groups show an ability to stay more than 1 min at this speed. The text shall be improved to clarify this point.
(3.2) There is likely some overlap between CN neurons projecting to VAL and CL, somewhat limiting the specificity of their conclusions.
There is indeed published evidence for some degree of anatomical overlap, but also for some differential contribution of CN-VAL and CN-CL to the task. The answer to this point is developed in the points 1.2a 2.2a above. Although this point was exposed in the discussion (p20), the text shall be improved in a revised version of the MS to clarify our statement.
-
-
www.biorxiv.org www.biorxiv.org
-
eLife Assessment
This important study advances our understanding of the way neurons in the auditory cortex of mice respond to unpredictable sounds. Through the use of state-of-the-art recording methods, compelling evidence is provided that responses to local and global violations in sound sequences are prediction errors and not simply the consequence of stimulus-specific adaptation. Although the cell-type-specific results are intriguing, further work is needed to establish their reliability.
-
Reviewer #1 (Public review):
Summary:
The authors successfully detected distinct mechanisms signalling prediction violations in the auditory cortex of mice. For this purpose, an auditory pure-tone local-global paradigm was presented to awake and anaesthetised mice. In awake rodents, the authors also evaluated interneuron cell types involved in responses to the interruption of the regularity imposed by local-global sequences. By performing two-photon calcium imaging and single-unit electrophysiology, the authors disentangled three phenomena underlying responses to violations of the distinct local-global regularity levels: Stimulus-specific adaptation, surprise and surprise adaptation. Both stimulus-specific adaptation and surprise-or deviant-evoked responses are observable<br /> under anaesthesia. Altogether, this work advances our understanding of distinct predictive processes computing prediction violations upon the complexity of the regularity imposed by the auditory sequence.
Strengths:
it is an elegant study beautifully executed.
Weaknesses:
No weaknesses were identified by this reviewer.
-
Reviewer #2 (Public review):
Summary:
Oddball responses are increases in sensory responses when a stimulus is encountered in an unexpected location in a sequence of predictable stimuli. There are two computational interpretations for these responses: stimulus-specific adaptation and prediction errors. In recent years, evidence has accumulated that a significant part of these sequence violation responses cannot be explained simply by stimulus-specific adaptation. The current work elegantly adds to this evidence by using a sequence paradigm based on two levels of sequence violations: "Local" sequence violations of repetitions of identical stimuli, and "global" sequence violations of stimulus sequence patterns. The authors demonstrate that both local and global sequence violation responses are found in L2/3 neurons of the mouse auditory cortex. Using sequences with different inter-stimulus intervals, they further demonstrate that these sequence violation responses cannot be explained by stimulus-specific adaption.
Strengths:
The work is based on a very clever use of a sequence violation paradigm (local-global paradigm) and provides convincing evidence for the interpretation that there are at least two types of sequence violation responses and that these cannot be explained by stimulus-specific adaption. Most of the conclusions are based on a large dataset, and are compelling.
Weaknesses:
The final part of the paper focuses on the responses of VIP and PV-positive interneurons. The responses of VIP interneurons appear somewhat variable and difficult to interpret (e.g. VIP neurons exhibit omission responses in the A block, but not the B block). The conclusions based on these data appear less solid.
-
Reviewer #3 (Public review):
Summary:
In their manuscript entitled "Parallel mechanisms signal a hierarchy of sequence structure violations in the auditory cortex", Jamali et al. provide evidence for cellular-level mechanisms in the auditory cortex of mice for the encoding of predictive information on different temporal and contextual scales. The study design separates more clearly than previous studies between the effects of local and global deviants and separates their respective effects on the neuronal responses clearly through the use of various contextual conditions and short and long time scales. Further, it identifies a contribution from a small set of VIP interneurons to the detection of omitted sounds, and shows the influence of isofluorane anesthesia on the neural responses.
Strengths:
(1) The study provides a rather encompassing set of experimental techniques to study the cellular level responses, using two complementary recording techniques in the same animal and similar cortical location.
(2) Comparison between awake and anesthetized states are conducted in the same animals, which allows for rather a direct comparison of populations under different conditions, thus reducing sampling variability.
(3) The set of paradigms is well developed and specifically chosen to provide appropriate and meaningful controls/comparisons, which were missing from previous studies.
(4) The addition of cell-type specific recordings is valuable and in particular in combination with the contrast of awake and anesthetized animals provides novel insights into the cellular level representation of deviant signals, such as surprise, prediction error, and general adaptation.
(5) The analysis and presentation of the data are clear and quite complete, yet remain succinct and perform insightful contrasts.
(6) The study will have an impact on multiple levels, as it introduces important variations in the paradigm and analytical contrasts that both human and animal researchers can pick up and improve their studies. The cell-type-specific results are particularly intriguing, although these would likely require replication before being completely reliable. Further, the study provides a substantial and diverse dataset that others can explore.
Weaknesses:
(1) The responses from cells recorded via Neuropixel and 2p differ qualitatively, as noted by the authors, with NP-recorded cells showing much more inhibited/reduced responses between acoustic stimulations. The authors briefly qualify these differences as potentially indicating a sampling issue, however, this matter deserves more detailed consideration in my opinion. Specifically, the authors could try to compare the different depths at which these neurons were sampled or relate the locations in the cortex to each other (as the Neuropixel recordings were collected in the same animals, a subset of the 2p recordings could be compared to the Neuropixel recordings.).
(2) The current study did not monitor the attentional state of the mouse in relation to the stimulus by either including a behavioral component or pupil monitoring, which could influence the neural responses to deviant stimuli and omissions. .
(3) Given the complexity and variety of the paradigms, conditions, and analyzed cell-types, the manuscript could profit from a more visual summary figure that provides an easy-to-access overview of what was found.
-
Author response:
Reviewer #1 (Public review):
Summary:
The authors successfully detected distinct mechanisms signalling prediction violations in the auditory cortex of mice. For this purpose, an auditory pure-tone local-global paradigm was presented to awake and anaesthetised mice. In awake rodents, the authors also evaluated interneuron cell types involved in responses to the interruption of the regularity imposed by local-global sequences. By performing two-photon calcium imaging and single-unit electrophysiology, the authors disentangled three phenomena underlying responses to violations of the distinct local-global regularity levels: Stimulus-specific adaptation, surprise and surprise adaptation. Both stimulus-specific adaptation and surprise-or deviant-evoked responses are observable under anaesthesia. Altogether, this work advances our understanding of distinct predictive processes computing prediction violations upon the complexity of the regularity imposed by the auditory sequence.
Strengths:
it is an elegant study beautifully executed.
Weaknesses:
No weaknesses were identified by this reviewer.
Reviewer #2 (Public review):
Summary:
Oddball responses are increases in sensory responses when a stimulus is encountered in an unexpected location in a sequence of predictable stimuli. There are two computational interpretations for these responses: stimulus-specific adaptation and prediction errors. In recent years, evidence has accumulated that a significant part of these sequence violation responses cannot be explained simply by stimulus-specific adaptation. The current work elegantly adds to this evidence by using a sequence paradigm based on two levels of sequence violations: "Local" sequence violations of repetitions of identical stimuli, and "global" sequence violations of stimulus sequence patterns. The authors demonstrate that both local and global sequence violation responses are found in L2/3 neurons of the mouse auditory cortex. Using sequences with different inter-stimulus intervals, they further demonstrate that these sequence violation responses cannot be explained by stimulus-specific adaption.
Strengths:
The work is based on a very clever use of a sequence violation paradigm (local-global paradigm) and provides convincing evidence for the interpretation that there are at least two types of sequence violation responses and that these cannot be explained by stimulus-specific adaption. Most of the conclusions are based on a large dataset, and are compelling.
Weaknesses:
The final part of the paper focuses on the responses of VIP and PV-positive interneurons. The responses of VIP interneurons appear somewhat variable and difficult to interpret (e.g. VIP neurons exhibit omission responses in the A block, but not the B block). The conclusions based on these data appear less solid.
We agree with the referee that the response modulations observed in VIP and PV-Positive interneurons are weak and variable. This is indicated in the manuscript. Probably, larger scale recordings are necessary to ascertain fully the presence and distribution of omission responses.
Reviewer #3 (Public review):
Summary:
In their manuscript entitled "Parallel mechanisms signal a hierarchy of sequence structure violations in the auditory cortex", Jamali et al. provide evidence for cellular-level mechanisms in the auditory cortex of mice for the encoding of predictive information on different temporal and contextual scales. The study design separates more clearly than previous studies between the effects of local and global deviants and separates their respective effects on the neuronal responses clearly through the use of various contextual conditions and short and long time scales. Further, it identifies a contribution from a small set of VIP interneurons to the detection of omitted sounds, and shows the influence of isofluorane anesthesia on the neural responses.
Strengths:
(1) The study provides a rather encompassing set of experimental techniques to study the cellular level responses, using two complementary recording techniques in the same animal and similar cortical location.
(2) Comparison between awake and anesthetized states are conducted in the same animals, which allows for rather a direct comparison of populations under different conditions, thus reducing sampling variability.
(3) The set of paradigms is well developed and specifically chosen to provide appropriate and meaningful controls/comparisons, which were missing from previous studies.
(4) The addition of cell-type specific recordings is valuable and in particular in combination with the contrast of awake and anesthetized animals provides novel insights into the cellular level representation of deviant signals, such as surprise, prediction error, and general adaptation.
(5) The analysis and presentation of the data are clear and quite complete, yet remain succinct and perform insightful contrasts.
(6) The study will have an impact on multiple levels, as it introduces important variations in the paradigm and analytical contrasts that both human and animal researchers can pick up and improve their studies. The cell-type-specific results are particularly intriguing, although these would likely require replication before being completely reliable. Further, the study provides a substantial and diverse dataset that others can explore.
Weaknesses:
(1) The responses from cells recorded via Neuropixel and 2p differ qualitatively, as noted by the authors, with NP-recorded cells showing much more inhibited/reduced responses between acoustic stimulations. The authors briefly qualify these differences as potentially indicating a sampling issue, however, this matter deserves more detailed consideration in my opinion. Specifically, the authors could try to compare the different depths at which these neurons were sampled or relate the locations in the cortex to each other (as the Neuropixel recordings were collected in the same animals, a subset of the 2p recordings could be compared to the Neuropixel recordings.).
We agree with the referee that the sampling issue, which we propose as a possible explanation for the large difference between our Neuropixel and 2P imaging recordings, must be investigated more thoroughly. This is, however, largely outside of the scope of this study. We have reported the depth and location of Neuropixel recordings in Figure S2. The depth is similar for both techniques covering mostly layers 2, 3 and 4. The location spans mostly the primary auditory cortex for two photon imaging and Neuropixel recordings. One Neuropixel recording is located in the ventral secondary auditory cortex. We could not find any evidence that the response to global violations in Neuropixel data stems specifically from this particular recording.
(2) The current study did not monitor the attentional state of the mouse in relation to the stimulus by either including a behavioral component or pupil monitoring, which could influence the neural responses to deviant stimuli and omissions.
As reported by Bekinschtein et al. 2009, the attentional state influences responses to global violation in human subjects. It is extremely difficult to precisely compare attentional states in mice and human subjects. We have performed recordings in mice that had to attend to sound to detect a white noise sound in between the sequence to obtain a reward. This did not lead to increased global violation response. However, as the sequence themselves did not predict reward in this context they may divert attention. Therefore, this result is inconclusive and not worth including in our manuscript. If the sequence predicts rewards, there is a potential confound between violation responses and reward expectations or motor preparation signals. Pupil monitoring could be an alternative which we did not investigate.
(3) Given the complexity and variety of the paradigms, conditions, and analyzed cell-types, the manuscript could profit from a more visual summary figure that provides an easy-to-access overview of what was found.
This is an excellent suggestion, although given the complexity and diversity of our observations it may be hard to fit everything in one understandable figure.
-
-
www.biorxiv.org www.biorxiv.org
-
eLife Assessment
This important study partially fills the gap in the knowledge of olfaction at the level of the Anterior Olfactory Nucleus (AON) and Piriform Cortex with functional magnetic resonance imaging, electrophysiology, and modeling. The methods used are convincing. Some of the findings confirm ongoing hypotheses, such as the behavioral importance of AON for odor source discrimination. Other results shed light on the dynamics of the connection between the olfactory system and the rest of the brain.
-
Reviewer #1 (Public review):
Summary:
This manuscript combined rat fMRI, optogenetics, and electrophysiology to examine the large-scale functional network of the olfactory system as well as its alteration in an aged rat model.
Strengths:
Overall methodology is very solid and the results provided an interesting perspective on large-scale functional network perturbation of the olfactory system.
Weaknesses:
The biological relevance and validation of the current results can be improved.
(1) Figure 1.1, on the top of the figure, CHR2 may be replaced by CHR2-mCherry, as only mCherry is fluorescent. And also, it's somewhat surprising that in AON and Pir regions (where only axon fibers should be labelled as red), most fluorescence appeared dot-like and looked more similar to cell body instead of typical fiber. The authors may want to double-check this.
(2) The authors primarily presented 1Hz stimulation results. What is the most biologically relevant frequency (e.g., perhaps firing frequency under natural odor stimulation) among all frequencies that were used?
(3) In Figure 2, the statistical thresholding is confusing: in the figure legend, it was stated that "t > 3.1 corresponding to P < 0.001" but later "further corrected for multiple comparisons with threshold-free cluster enhancement with family-wise error rate (TFCE-FWE) at P < 0.05"? Regardless of the statistical thresholding, such BOLD activation seemed to be widespread (almost whole-brain activation). Does such activation remain specific to the optogenetic stimulation, or something more general (e.g., arousal level change)? Furthermore, how those results (I assume they are group-level results) were obtained was not described very clearly. Is it just a simple average of individual-level results, or (more conventionally) second-level analysis?
(4) In Figure 2, why use AUC to quantify the activation, not the more conventional beta value in the GLM analysis?
(5) For Figure 2D, the way that it was quantified can be better described as "relative" activation within one condition, and I don't how to interpret the comparison among the relative fraction of activated regions. Perhaps comparison using percentage change (i.e., beta values) is more straightforward.
(6) For Figure 3, it may be more convenient for readers to include the results of 1st activation for direct comparison. The current layout makes it difficult to make direct, visual comparisons among all 3 activations. Again I think using beta values (instead of AUC) may be more conventional.
(7) Can the DCM results (at least part of it) be verified using the current electrophysiological data? For example, the long-range inhibitory effective connectivity of AON is rather intriguing. If that can be verified using ephys. data, it would be really great. In the current form, the DCM and ephys. results seem to be totally unrelated.
(8) In Figure 6, it would be great if the adaptation of BOLD and ephys. signals can be correlated at the brain region level. The current figure only demonstrated there is adaptation in ephys. signal, but did not show if such adaptation is related to the BOLD adaptation.
-
Reviewer #2 (Public review):
Summary:
Ma and colleagues presented a study on the characterization of brain-wide spatio-temporal impact of olfactory cortical outputs. They take advantage of multi-modal techniques on rats: fMRI, optogenetics, and electrophysiology. In addition, they used cutting-edge analytical techniques and modeling to support and interpret their data. The main findings of the study are:
(1) The neurons in the Olfactory Bulb (OB) predominantly activate primary olfactory network regions, while stimulation of OB afferents in Anterior Olfactory Nucleus (AON) and Piriform Cortex (Pir) primarily orthodromically activates hippocampal/striatal and limbic networks, respectively.
(2) Non-specified adaptation or habituation mechanisms may play a significant role in modulating olfactory outputs over subsequent fMRI sessions.
(3) Artificially induced aging in rats induces profound modification in the functional interaction between olfactory cortices and multiple brain regions.
The results on AON are of particular interest because of the lack of functional information on this region, despite its recognized importance in shaping OB output and behavior (odor localization tasks).
Strengths:
The manuscript is very accurate. The figures are well-crafted, and clear and provide much information with the most appropriate plots and graphics. The study's amount and data quality are remarkable, and the experimental size adequately addresses the scientific questions. I particularly appreciated the details in the description of the methods regarding the missing data and the size of the different animal groups. The supplementary data complete the leading figures and provide information at a single animal level.
Weaknesses:
(1) One of the main reasons the Piriform Cx is understudied in rodents is because of the proximity to air, which creates artifacts in fMRI images. This issue becomes more critical at ultra-high magnetic fields, but I would expect it also at 7T. One main achievement of this study is, indeed, the acquisition of fMRI data from Piriform, and this point should be highlighted by showing raw functional data from a rat. The best would be if an fMRI data sample for a rat, no matter which stimulation, is shared on a public repository, like Zenodo or similar. I am curious to check the quality of the BOLD data from such an 'enormous' field of view, particularly in the OB, with a single-shot sequence. Also, the visual inspection of raw data is essential to appreciate how many 0.5 x 0.5 x 1 mm voxels fit into AON, and others analyzed small brain structures, like the amygdala, etc. Was the amygdala entirely visible in BOLD, or did the air in the ear channel make an artifact partially shadowing it?
(2) Surprisingly, the only information missing in the methods is the post-surgery period and the time between two consecutive fMRI sessions. How much time was accorded to rats to recover from the surgeries, and what time interval between two scans? This information is crucial for interpreting the decrease in most BOLD responses in subsequent recordings. The supposed adaptation should fit into the known time frames for odor adaptation. Usually, fast adaptation does not last for days (and it should be measured within a single experiment: is it the case?), while for long-lasting adaptation the stimulus (odor or opto) should be maintained constantly ON. This does not seem to be the case in this study. The hypothesis, alternative to adaptation, of a less efficient light activation, for example, due to gliosis around the fiber tips, should be discarded with more evidence than the preservation of OB > Pir responses or acknowledged in the manuscript.
(3) The D-galactose experiments were conducted only after administering the aging molecule, with no baseline/reference data on the same animals. Then, comparisons were made with healthy rats, but the two groups not only can be discriminated with respect to D-galactose administration but also with age (10 VS 18 weeks). A control group for 18-weeks-old rats with no D-galactose treatment would better compare the D-galactose effect and avoid any potential bias from group comparisons of rats at different ages. Do you confirm that D-galactose was injected into each rat 56 times/day in a row, or am I mistaken?
Overall, if my concerns are addressed, this is outstanding work, and I congratulate the authors.
-
Author response:
We appreciate the insightful comments and suggestions, which will significantly improve our work. We will revise the manuscript to address the reviewer’s concerns. Here, we list some of the key aspects of those concerns and our preliminary plans to address them.
Both reviewers pointed out that we did not sufficiently justify the chosen optogenetic stimulation frequencies. We acknowledge and concur with their assessment, and will discuss it more extensively from a biological perspective (e.g., the neural firing rates in the olfactory bulb, OB, anterior olfactory nucleus, AON, and piriform cortex, Pir, under natural odor stimulation and respiration rhythm). Reviewer #1 suggested using beta values (b) rather than the area under the BOLD signal profile (AUC) to quantify the fMRI activations as they are more conventional for general linear model (GLM) analysis. We are aware of b and have used them for quantification of the amplitude of fMRI activations in our previous rodent fMRI studies1-3. However, in this study, we chose to utilize AUC as it offers a more comprehensive measure of BOLD signal change over time, including shape, duration, and magnitude, thereby capturing the bulk of neural activities and their dynamics throughout the stimulation period. b primarily represents the peak amplitude of BOLD responses (i.e., the % BOLD signal change)4 and can be constrained by the assumptions and limitations of the GLM analysis, such as the shape of the hemodynamic response function (HRF). AUC provides greater flexibility in capturing different aspects of neural responses across various brain regions, such as transient peaks and sustained responses.
As mentioned by reviewer #1, correlating the adaptation of BOLD and electrophysiology signals at the brain region level would better signify our findings. We will pursue additional analysis to address this in our forthcoming responses. Reviewer #2 would like us to clarify the image and signal quality of our echo planar imaging (EPI)-based fMRI data, especially in the regions close to the air-tissue interface such as OB, Pir, entorhinal cortex and amygdala, and the methodology for some of the experimental protocols implemented in our study. We will show the raw EPI fMRI images from a representative animal and revise the results, discussion, and methods sections of the manuscript to address reviewer #2's concerns.
In our forthcoming detailed responses to the reviewers' comments and recommendations, we will revise the text, figures, and captions accordingly to address and clarify the questions brought up by both reviewers.
References
(1) Gao, P.P., Zhang, J.W., Chan, R.W., Leong, A.T.L. & Wu, E.X. BOLD fMRI study of ultrahigh frequency encoding in the inferior colliculus. Neuroimage 114, 427-437 (2015).
(2) Leong, A.T.L., Wong, E.C., Wang, X. & Wu, E.X. Hippocampus Modulates Vocalizations Responses at Early Auditory Centers. Neuroimage 270, 119943 (2023).
(3) Gao, P.P., Zhang, J.W., Fan, S.J., Sanes, D.H. & Wu, E.X. Auditory midbrain processing is differentially modulated by auditory and visual cortices: An auditory fMRI study. Neuroimage 123, 22-32 (2015).
(4) Goddard, E. & Mullen, K.T. fMRI representational similarity analysis reveals graded preferences for chromatic and achromatic stimulus contrast across human visual cortex. Neuroimage 215, 116780 (2020).
-
-
www.biorxiv.org www.biorxiv.org
-
eLife Assessment
This important collection of over 800 new cell type-specific driver lines will be an invaluable resource for researchers studying associative learning in Drosophila. Thoroughly characterized and well documented, this collection will permit researchers to selectively target neurons that deliver information to, or receive it from, the memory center of the fly brain called the Mushroom Body. Given the wealth of new drivers and the genetic access they provide to over 300 cell types, this compelling work will be of interest not only to researchers studying the mechanisms of associative learning but more generally to those dissecting sensorimotor circuits in the fly nervous system.
-
Reviewer #1 (Public Review):
Summary:
The emergence of Drosophila EM connectomes has revealed numerous neurons within the associative learning circuit. However, these neurons are inaccessible for functional assessment or genetic manipulation in the absence of cell-type-specific drivers. Addressing this knowledge gap, Shuai et al. have screened over 4000 split-GAL4 drivers and correlated them with identified neuron types from the "Hemibrain" EM connectome by matching light microscopy images to neuronal shapes defined by EM. They successfully generated over 800 split-GAL4 drivers and 22 split-LexA drivers covering a substantial number of neuron types across layers of the mushroom body associative learning circuit. They provide new labeling tools for olfactory and non-olfactory sensory inputs to the mushroom body; interneurons connected with dopaminergic neurons and/or mushroom body output neurons; potential reinforcement sensory neurons; and expanded coverage of intrinsic mushroom body neurons. Furthermore, the authors have optimized the GR64f-GAL4 driver into a sugar sensory neuron-specific split-GAL4 driver and functionally validated it as providing a robust optogenetic substitute for sugar reward. Additionally, a driver for putative nociceptive ascending neurons, potentially serving as optogenetic negative reinforcement, is characterized by optogenetic avoidance behavior. The authors also use their very large dataset of neuronal anatomies, covering many example neurons from many brains, to identify neuron instances with atypical morphology. They find many examples of mushroom body neurons with altered neuronal numbers or mistargeting of dendrites or axons and estimate that 1-3% of neurons in each brain may have anatomic peculiarities or malformations. Significantly, the study systematically assesses the individualized existence of MBON08 for the first time. This neuron is a variant shape that sometimes occurs instead of one of two copies of MBON09, and this variation is more common than that in other neuronal classes: 75% of hemispheres have two MBON09's, and 25% have one MBON09 and one MBON08. These newly developed drivers not only expand the repertoire for genetic manipulation of mushroom body-related neurons but also empower researchers to investigate the functions of circuit motifs identified from the connectomes. The authors generously make these flies available to the public. In the foreseeable future, the tools generated in this study will allow important advances in the understanding of learning and memory in Drosophila.
Strengths:
(1) After decades of dedicated research on the mushroom body, a consensus has been established that the release of dopamine from DANs modulates the weights of connections between KCs and MBONs. This process updates the association between sensory information and behavioral responses. However, understanding how the unconditioned stimulus is conveyed from sensory neurons to DANs, and the interactions of MBON outputs with innate responses to sensory context remains less clear due to the developmental and anatomic diversity of MBONs and DANs. Additionally, the recurrent connections between MBONs and DANs are reported to be critical for learning. The characterization of split-GAL4 drivers for 30 major interneurons connected with DANs and/or MBONs in this study will significantly contribute to our understanding of recurrent connections in mushroom body function.
(2) Optogenetic substitutes for real unconditioned stimuli (such as sugar taste or electric shock) are sometimes easier to implement in behavioral assays due to the spatial and temporal specificity with which optogenetic activation can be induced. GR64f-GAL4 has been widely used in the field to activate sugar sensory neurons and mimic sugar reward. However, the authors demonstrate that GR64f-GAL4 drives expression in other neurons not necessary for sugar reward, and the potential activation of these neurons could introduce confounds into training, impairing training efficiency. To address this issue, the authors have elaborated on a series of intersectional drivers with GR64f-GAL4 to dissect subsets of labeled neurons. This approach successfully identified a more specific sugar sensory neuron driver, SS87269, which consistently exhibited optimal training performance and triggered ethologically relevant local searching behaviors. This newly characterized line could serve as an optimized optogenetic tool for sugar reward in future studies.
(3) MBON08 was first reported by Aso et al. 2014, exhibiting dendritic arborization into both ipsilateral and contralateral γ3 compartments. However, this neuron could not be identified in the previously published Drosophila brain connectomes. In the present study, the existence of MBON08 is confirmed, occurring in one hemisphere of 35% of imaged flies. In brains where MBON08 is present, its dendrite arborization disjointly shares contralateral γ3 compartments with MBON09. This remarkable phenotype potentially serves as a valuable resource for understanding the stochasticity of neurodevelopment and the molecular mechanisms underlying mushroom body lobe compartment formation.
Comments on revised version:
I only suggested minor changes, and these have been resolved.
-
Reviewer #2 (Public Review):
Summary:
The article by Shuai et al. describes a comprehensive collection of over 800 split-GAL4 and split-LexA drivers, covering approximately 300 cell types in Drosophila, aimed at advancing the understanding of associative learning. The mushroom body (MB) in the insect brain is central to associative learning, with Kenyon cells (KCs) as primary intrinsic neurons and dopaminergic neurons (DANs) and MB output neurons (MBONs) forming compartmental zones for memory storage and behavior modulation. This study focuses on characterizing sensory input as well as direct upstream connections to the MB both anatomically and, to some extent, behaviorally. Genetic access to specific, sparsely expressed cell types is crucial for investigating the impact of single cells on computational and functional aspects within the circuitry. As such, this new and extensive collection significantly extends the range of targeted cell types related to the MB and will be an outstanding resource to elucidate MB-related processes in the future.
Strengths:
The work by Shuai et al. provides novel and essential resources to study MB-related processes and beyond. The resulting tools are publicly available and, together with the linked information, will be foundational for many future studies. The importance and impact of this tool development approach, along with previous ones, for the field cannot be overstated. One of many interesting aspects arises from the anatomical analysis of cell types that are less stereotypical across flies. These discoveries might open new avenues for future investigations into how such asymmetry and individuality arise from development and other factors, and how it impacts the computations performed by the circuitry that contains these elements.
Comments on revised version:
From my side they have addressed the few issues I had sufficiently.
-
Reviewer #3 (Public Review):
Summary:
Previous research on the Drosophila mushroom body (MB) has made this structure the best-understood example of an associative memory center in the animal kingdom. This is in no small part due to the generation of cell-type specific driver lines that have allowed consistent and reproducible genetic access to many of the MB's component neurons. The manuscript by Shuai et al. now vastly extends the number of driver lines available to researchers interested in studying learning and memory circuits in the fly. It is an 800-plus collection of new cell-type specific drivers target neurons that either provide input (direct or indirect) to MB neurons or that receive output from them. Many of the new drivers target neurons in sensory pathways that convey conditioned and unconditioned stimuli to the MB. Most drivers are exquisitely selective, and researchers will benefit from the fact that whenever possible, the authors have identified the targeted cell types within the Drosophila connectome. Driver expression patterns are beautifully documented and are publicly available through the Janelia Research Campus's Flylight database where full imaging results can be accessed. Overall, the manuscript significantly augments the number of cell type-specific driver lines available to the Drosophila research community for investigating the cellular mechanisms underlying learning and memory in the fly. Many of the lines will also be useful in dissecting the function of the neural circuits that mediate sensorimotor circuits.
Strengths:
The manuscript represents a huge amount of careful work and leverages numerous important developments from the last several years. These include the thousands of recently generated split-Gal4 lines at Janelia and the computational tools for pairing them to make exquisitely specific targeting reagents. In addition, the manuscript takes full advantage of the recently released Drosophila connectomes. Driver expression patterns are beautifully illustrated side-by-side with corresponding skeletonized neurons reconstructed by EM. A comprehensive table of the new lines, their split-Gal4 components, their neuronal targets, and other valuable information will make this collection eminently useful to end-users. In addition to the anatomical characterization, the manuscript also illustrates the functional utility of the new lines in optogenetic experiments. In one example, the authors identify a specific subset of sugar reward neurons that robustly promotes associative learning.
Comments on revised version:
Overall, I thought the authors addressed my comments well with the possible exception of what is actually new here. This was the most important thing that I thought should be included in the revision. Although the authors rewrote the paragraph describing the lines presented in the paper, I still can't tell exactly which ones haven't been previously published. Their revised paragraph says that 40 lines have been "previously used," but Supplemental Table 1 shows references for over 200 of the lines, which sounds more reasonable based on papers that have come out.
Also, in the revised paragraph they state that "All transgenic lines newly generated in this study are listed in Supplementary File 2" but that table lists only the 36 LexA hemidriver lines! Confusingly, this comment cites the same 8 references as are cited for the 40 line that they say were previously published. I am thus only more confused about how many previously uncharacterized lines are presented in this paper.
Further clarification would be helpful. On the one hand, I think this paper is a very nice summary of a ton of work and brings it all under one umbrella in a way that will be useful for many in the field. In that sense, the manuscript is worth publishing simply as a useful resource even if all the lines were previously published. On the other hand, it would be useful for readers to know which lines were previously characterized in other publications and which ones were not. This information may or may not be in Supplementary Tables 1 and 2 (but I can't tell).
-
Author response:
The following is the authors’ response to the original reviews.
Public Reviews:
Reviewer #1 (Public Review):
Summary:
The emergence of Drosophila EM connectomes has revealed numerous neurons within the associative learning circuit. However, these neurons are inaccessible for functional assessment or genetic manipulation in the absence of cell-type-specific drivers. Addressing this knowledge gap, Shuai et al. have screened over 4000 split-GAL4 drivers and correlated them with identified neuron types from the "Hemibrain" EM connectome by matching light microscopy images to neuronal shapes defined by EM. They successfully generated over 800 split-GAL4 drivers and 22 split-LexA drivers covering a substantial number of neuron types across layers of the mushroom body associative learning circuit. They provide new labeling tools for olfactory and non-olfactory sensory inputs to the mushroom body; interneurons connected with dopaminergic neurons and/or mushroom body output neurons; potential reinforcement sensory neurons; and expanded coverage of intrinsic mushroom body neurons. Furthermore, the authors have optimized the GR64f-GAL4 driver into a sugar sensory neuron-specific split-GAL4 driver and functionally validated it as providing a robust optogenetic substitute for sugar reward. Additionally, a driver for putative nociceptive ascending neurons, potentially serving as optogenetic negative reinforcement, is characterized by optogenetic avoidance behavior. The authors also use their very large dataset of neuronal anatomies, covering many example neurons from many brains, to identify neuron instances with atypical morphology. They find many examples of mushroom body neurons with altered neuronal numbers or mistargeting of dendrites or axons and estimate that 1-3% of neurons in each brain may have anatomic peculiarities or malformations. Significantly, the study systematically assesses the individualized existence of MBON08 for the first time. This neuron is a variant shape that sometimes occurs instead of one of two copies of MBON09, and this variation is more common than that in other neuronal classes: 75% of hemispheres have two MBON09's, and 25% have one MBON09 and one MBON08. These newly developed drivers not only expand the repertoire for genetic manipulation of mushroom body-related neurons but also empower researchers to investigate the functions of circuit motifs identified from the connectomes. The authors generously make these flies available to the public. In the foreseeable future, the tools generated in this study will allow important advances in the understanding of learning and memory in Drosophila.
Strengths:
(1) After decades of dedicated research on the mushroom body, a consensus has been established that the release of dopamine from DANs modulates the weights of connections between KCs and MBONs. This process updates the association between sensory information and behavioral responses. However, understanding how the unconditioned stimulus is conveyed from sensory neurons to DANs, and the interactions of MBON outputs with innate responses to sensory context remains less clear due to the developmental and anatomic diversity of MBONs and DANs. Additionally, the recurrent connections between MBONs and DANs are reported to be critical for learning. The characterization of split-GAL4 drivers for 30 major interneurons connected with DANs and/or MBONs in this study will significantly contribute to our understanding of recurrent connections in mushroom body function.
(2) Optogenetic substitutes for real unconditioned stimuli (such as sugar taste or electric shock) are sometimes easier to implement in behavioral assays due to the spatial and temporal specificity with which optogenetic activation can be induced. GR64f-GAL4 has been widely used in the field to activate sugar sensory neurons and mimic sugar reward. However, the authors demonstrate that GR64f-GAL4 drives expression in other neurons not necessary for sugar reward, and the potential activation of these neurons could introduce confounds into training, impairing training efficiency. To address this issue, the authors have elaborated on a series of intersectional drivers with GR64f-GAL4 to dissect subsets of labeled neurons. This approach successfully identified a more specific sugar sensory neuron driver, SS87269, which consistently exhibited optimal training performance and triggered ethologically relevant local searching behaviors. This newly characterized line could serve as an optimized optogenetic tool for sugar reward in future studies.
(3) MBON08 was first reported by Aso et al. 2014, exhibiting dendritic arborization into both ipsilateral and contralateral γ3 compartments. However, this neuron could not be identified in the previously published Drosophila brain connectomes. In the present study, the existence of MBON08 is confirmed, occurring in one hemisphere of 35% of imaged flies. In brains where MBON08 is present, its dendrite arborization disjointly shares contralateral γ3 compartments with MBON09. This remarkable phenotype potentially serves as a valuable resource for understanding the stochasticity of neurodevelopment and the molecular mechanisms underlying mushroom body lobe compartment formation.
Weaknesses:
There are some minor weaknesses in the paper that can be clarified:
(1) In Figure 8, the authors trained flies with a 20s, weak optogenetic conditioning first, followed by a 60s, strong optogenetic conditioning. The rationale for using this training paradigm is not explicitly provided.
These experiments were designed to test if flies could maintain consistent performance with repetitive and intense LED activation, which is essential for experiments involving long training protocols or coactivation of other neurons inside a brain.
In Figure 8E, if data for training with GR64f-GAL4 using the same paradigm is available, it would be beneficial for readers to compare the learning performance using newly generated split-GAL4 lines with the original GR64f-GAL4, which has been used in many previous research studies. It is noteworthy that in previously published work, repeating training test sessions typically leads to an increase in learning performance in discrimination assays. However, this augmentation is not observed in any of the split-GAL4 lines presented in Figure 8E. The authors may need to discuss possible reasons for this.
As the reviewer pointed out, many previous studies including ours used the original Gr64f-GAL4 in olfactory conditioning. Figure 1H of Yamada et al., 2023 (https://doi.org/10.7554/eLife.79042) showed such a result, where the first and second-order olfactory conditioning were assayed. Indeed, the first-order conditioning scores were gradually augmented over repeated training. In this experiment, we used low red LED intensity for the optogenetic activation. In the Figure 8E of the present paper, the first memory test was after 3x pairing of 20s odor with five 1s red LED without intermediate tests. Therefore, flies were already sufficiently trained to show a plateau memory level in “Test1”. In the revision of another recent report (Figure 1C-F of Aso et al., 2023; https://doi.org/10.7554/eLife.85756), we included the learning curve data of our best Gr64f-split-GAL4, SS87269. Under a less saturated training conditioning, SS87269 did show learning augmentation over repeated training.
(2) In line 327, the authors state that in all samples, the β'1 compartment is arborized by MBON09. However, in Figure 11J, the probability of having at least one β'1 compartment not arborized is inferred to be 2%. The authors should address and clarify this conflict in the text to avoid misunderstanding.
The chance of visualizing MBON08 in MCFO images was 21/209 in total (Figure 11I). If we assume that each of four cells adopt MBON08 development fate at this chance, we can calculate the probability for each case of MBON08/09 cell type composition. From this calculation, we inferred approximately 2% of flies would lack innervations to β'1 compartment in at least one hemisphere. However, we didn't observe a lack of β'1 arborizations in 169 sample flies. If these MBONs independently develop into MBON08 at 21/209 odds, the chance of never observing two MBON08s in either hemisphere of all 169 samples is 3.29%. Therefore, some developmental mechanisms may prevent the emergence of two MBON08 in the same hemisphere.
In the revised manuscript, we displayed these estimated probability for each case separately, and annotated actual observation on the right side.
(3) In general, are the samples presented male or female? This sample metadata will be shown when the images are deposited in FlyLight, but it would be useful in the context of this manuscript to describe in the methods whether animals are all one sex or mixed sex, and in some example images (e.g. mAL3A) to note whether the sample is male or female.
The samples presented in this study are mixed sex, except for Figure 11I, where genders are specified. We provided metadata information of the presented images in Supplemental File 7, and we added a paragraph in the in the method section:
“Most samples were collected from females, though typically at least one male fly was examined for each driver line. While we noticed certain lines such as SS48900, exhibited distinct expression patterns in females and males, we did not particularly focus on sexual dimorphism, which is analyzed elsewhere (Meissner et al. 2024). Therefore, unless stated otherwise, the presented samples are of mixed gender.
Detailed metadata, including gender information and the reporter used, can be found in Supplementary File 7.”
Reviewer #2 (Public Review):
Summary:
The article by Shuai et al. describes a comprehensive collection of over 800 split-GAL4 and split-LexA drivers, covering approximately 300 cell types in Drosophila, aimed at advancing the understanding of associative learning. The mushroom body (MB) in the insect brain is central to associative learning, with Kenyon cells (KCs) as primary intrinsic neurons and dopaminergic neurons (DANs) and MB output neurons (MBONs) forming compartmental zones for memory storage and behavior modulation. This study focuses on characterizing sensory input as well as direct upstream connections to the MB both anatomically and, to some extent, behaviorally. Genetic access to specific, sparsely expressed cell types is crucial for investigating the impact of single cells on computational and functional aspects within the circuitry. As such, this new and extensive collection significantly extends the range of targeted cell types related to the MB and will be an outstanding resource to elucidate MB-related processes in the future.
Strengths:
The work by Shuai et al. provides novel and essential resources to study MB-related processes and beyond. The resulting tools are publicly available and, together with the linked information, will be foundational for many future studies. The importance and impact of this tool development approach, along with previous ones, for the field cannot be overstated. One of many interesting aspects arises from the anatomical analysis of cell types that are less stereotypical across flies. These discoveries might open new avenues for future investigations into how such asymmetry and individuality arise from development and other factors, and how it impacts the computations performed by the circuitry that contains these elements.
Weaknesses:
Providing such an array of tools leaves little to complain about. However, despite the comprehensive genetic access to diverse sensory pathways and MB-connected cell types, the manuscript could be improved by discussing its limitations. For example, the projection neurons from the visual system seem to be underrepresented in the tools produced (or almost absent). A discussion of these omissions could help prevent misunderstandings.
We internally distributed efforts to produce split-GAL4 lines at Janelia Research Campus. The recent preprint (Nern et al., 2024; doi: https://doi.org/10.1101/2024.04.16.589741) described the full collection of split-GAL4 driver lines in the optic lobe including the visual projection neurons to the mushroom body. We cited this preprint in the revised manuscript by adding a short paragraph of discussion.
“Although less abundant than the olfactory input, the MB also receives visual information from the visual projection neurons (VPNs) that originate in the medulla and lobula and are targeted to the accessory calyx (Vogt et al. 2016; Li et al. 2020). A recent preprint described the full collection of split-GAL4 driver lines in the optic lobe, which includes the VPNs to the MB (Nern et al. 2024).”
Additionally, more details on the screening process, particularly the selection of candidate split halves and stable split-GAL4 lines, would provide valuable insights into the methodology and the collection's completeness.
The details of our split-GAL4 design and screening procedures were described in previous studies (Aso et al., 2014; Dolan et al., 2019). Available data and tools to design split-GAL4 changed over time, and we took different approaches accordingly. Many of split-GAL4 lines presented in this study were designed and screened in parallel to the lines for MBONs and DANs in 2010-2014 when MCFO images of GAL4 drivers and EM connectome were not yet available. With knowledge of where MBONs and DANs project, I (Y.A.) manually examined and annotated thousands of confocal stacks (Jenett et al., 2012; https://doi.org/10.1016/j.celrep.2012.09.011) to find candidate cell types that may concat with them.
Later I used more advanced computational tools (Otsuna et al., 2018; doi: https://doi.org/10.1101/318006) and MCFO images aligned to the standard brain volume (Meissner et al., 2023; DOI: 10.7554/eLife.80660.). Now, if one needs to further generate split-GAL4 lines for cell type identified in EM connectome data, neuron bridge website (https://neuronbridge.janelia.org/) can be very helpful to provide a list of GAL4 drivers that may label the neuron of interest.
Reviewer #3 (Public Review):
Summary:
Previous research on the Drosophila mushroom body (MB) has made this structure the best-understood example of an associative memory center in the animal kingdom. This is in no small part due to the generation of cell-type specific driver lines that have allowed consistent and reproducible genetic access to many of the MB's component neurons. The manuscript by Shuai et al. now vastly extends the number of driver lines available to researchers interested in studying learning and memory circuits in the fly. It is an 800-plus collection of new cell-type specific drivers target neurons that either provide input (direct or indirect) to MB neurons or that receive output from them. Many of the new drivers target neurons in sensory pathways that convey conditioned and unconditioned stimuli to the MB. Most drivers are exquisitely selective, and researchers will benefit from the fact that whenever possible, the authors have identified the targeted cell types within the Drosophila connectome. Driver expression patterns are beautifully documented and are publicly available through the Janelia Research Campus's Flylight database where full imaging results can be accessed. Overall, the manuscript significantly augments the number of cell type-specific driver lines available to the Drosophila research community for investigating the cellular mechanisms underlying learning and memory in the fly. Many of the lines will also be useful in dissecting the function of the neural circuits that mediate sensorimotor circuits.
Strengths:
The manuscript represents a huge amount of careful work and leverages numerous important developments from the last several years. These include the thousands of recently generated split-Gal4 lines at Janelia and the computational tools for pairing them to make exquisitely specific targeting reagents. In addition, the manuscript takes full advantage of the recently released Drosophila connectomes. Driver expression patterns are beautifully illustrated side-by-side with corresponding skeletonized neurons reconstructed by EM. A comprehensive table of the new lines, their split-Gal4 components, their neuronal targets, and other valuable information will make this collection eminently useful to end-users. In addition to the anatomical characterization, the manuscript also illustrates the functional utility of the new lines in optogenetic experiments. In one example, the authors identify a specific subset of sugar reward neurons that robustly promotes associative learning.
Weaknesses:
While the manuscript succeeds in making a mass of descriptive detail quite accessible to the reader, the way the collection is initially described - and the new lines categorized - in the text is sometimes confusing. Most of the details can be found elsewhere, but it would be useful to know how many of the lines are being presented for the first time and have not been previously introduced in other publications/contexts.
We revised the text as below.
“Among the 828 lines, a subset of 355 lines, collectively labeling at least 319 different cell types, exhibit highly specific and non-redundant expression patterns are likely to be particularly valuable for behavioral experiments. Detailed information, including genotype, expression specificity, matched EM cell type(s), and recommended driver for each cell type, can be found in Supplementary File 1. A small subset of 40 lines from this collection have been previously used in studies (Aso et al., 2023; Dolan et al., 2019; Gao et al., 2019; Scaplen et al., 2021; Schretter et al., 2020; Takagi et al., 2017; Xie et al., 2021; Yamada et al., 2023). All transgenic lines newly generated in this study are listed in Supplementary File 2 (Aso et al., 2023; Dolan et al., 2019; Gao et al., 2019; Scaplen et al., 2021; Schretter et al., 2020; Takagi et al., 2017; Xie et al., 2021; Yamada et al., 2023).”
And where can the lines be found at Flylight? Are they listed as one collection or as many?
They are listed as one collection - “Aso 2021” release. It is named “2021” because we released the images and started sharing lines in December of 2021 without a descriptive paper. We added a sentence in the Methods section.
“All splitGAL4 lines can be found at flylight database under “Aso 2021” release, and fly strains can be requested from Janelia or the Bloomington stock center.”
Also, the authors say that some of the lines were included in the collection despite not necessarily targeting the intended type of neuron (presumably one that is involved in learning and memory). What percentage of the collection falls into this category?
We do not have a good record of split-GAL4 screening to calculate the chance to intersect unintended cell types, but it was rather rare. Those unintended cell types can still be a part of circuits for associative learning (e.g. olfactory projection neurons) or totally unrelated cell types. For instance, among a new collection of split-LexA lines using Gr43a-LexADBD hemidriver (Figure 7-figure supplement 2), one line specifically intersected T1 neurons in the optic lobe despite that the AD line was selected to intersect sugar sensory neurons. We suspect that this is due to ectopic expression of Gr43a-LexADBD. Nonetheless, we included it in the paper because cell-type-specific Split-LexA driver for T1 will be useful irrespective of whether the expression of Gr43a gene is expressed in T1 or not.
And what about the lines that the authors say they included in the collection despite a lack of specificity? How many lines does this represent?
For a short answer, there are about 100 lines in the collection that lack the specificity for behavioral experiments.
We ranked specificity of split-GAL4 drivers in the Supplementary File 1. Rank 2 are the ideal lines, Rank 1 are less ideal but acceptable, and Rank 0 is not suitable for activation screening in behavioral experiments. Out of the 828 split-GAL4 lines reported here, there are 413, 305 and 103 lines in rank2, rank1 and rank0 categories respectively. 7 lines are not ranked for specificity because only flipout expression data are available.
Recommendations for the authors:
Reviewer #2 (Recommendations For The Authors):
As mentioned elsewhere and in addition to the minor points below, it is advisable for the authors to elaborate on the details of the screening process. Furthermore, a discussion about the circuits not targeted by their research, such as the visual projection neurons, would be beneficial.
See the response above to Reviewer #2’s public review.
Line 32-33: The citations are very fly-centric. the authors might want to consider reviews on the MB of other insect species regarding learning and memory.
We additionally cited Rybak and Menzel 2017’s book chapter on honey bee mushroom body.
Line 43-44: Citations should be added, e.g. Séjourné et al. (2011), Pai et al. (2013), Plaçais et al. (2013).
Citation added
Line 50-52: Citation Hulse et al. (2021) should be added.
Citation added
Line 162: In this part, it might be valuable for the reader to understand which of these PNs are actually connecting with KCs.
A full list of cell types within the MB were provided in Supplementary File 4 of the revised manuscript. See also response to Reviewer 3, Lines 150-1.
Line 179: Citation Burke et al. (2012) should be mentioned.
Citation added
Line 181: Thermogenic might be thermogenetic.
Corrected
Line 189: Citations add Otto et al. (2020) and Felsenberg et al. (2018).
Citations added
Line 208ff: The authors should consider discussing why they did not use other GR and IR promoters. For example, Gr5a is prominent in sugar-sensing, while Ir76b could be a reinforcement signal related to yeast food (Steck et al., 2018; Ganguly et al., 2017; see also Corfas et al., 2019 for local search).
We focused on the Gr64f promoter because of its relatively broad expression and successful use of Gr64f-GAL4 for fictive reward experiment. We added the Split-LexA lines with Gr43a and Gr66a promoters (Figure 7-figure supplement 2). Other gustatory sensory neurons also have the potential to be reinforcement signals, but we just did not have the bandwidth to cover them all.
Line 319: Consider citing Linneweber et al. (2020) for a neurodevelopmental account of such individuality.
We added a sentence and cited this reference.
“On the other hand, the neurodevelopmental origin of neuronal morphology appeared to have functional significance on behavioral individuality (Linneweber et al. 2020).”
Line 352: Citation add Hulse et al. (2021).
Citations added
Line 356ff: The utility and value of Split-LexA may not be apparent to non-expert readers. Moreover, how were LexADBDs chosen for creating these lines?
We have added an introductory sentence at the beginning of the paragraph and explained that these split-LexA lines were a conversion of split-GAL4 lines that were published in 2014 and frequently used in studying the mushroom body circuit.
“Split-GAL4 lines enable cell-type-specific manipulation, but some experiments require independent manipulation of two cell types. Split-GAL4 lines can be converted into split-LexA lines by replacing the GAL4 DNA binding domain with that of LexA (Ting et al., 2011). To broaden the utility of the split-GAL4 lines that have been frequently used since the publication in 2014 (Aso et al., 2014a), we have generated over 20 LexADBD lines to test the conversions of split-GAL4 to split-LexA. The majority (22 out of 34) of the resulting split-LexA lines exhibited very similar expression patterns to their corresponding original split-GAL4 lines (Figure 12).”
Line 374: Italicize Drosophila melanogaster.
Revised as suggested.
Reviewer #3 (Recommendations For The Authors):
Major Comments:
As mentioned in the Public Review, the drivers are nicely classified in the various subsections of the manuscript, but the statements in the text summarizing how many lines there are in specific categories are often confusing. For example, line 129 refers to "drivers encompassing 111 cell types that connect with the DANs and MBONs", but Figure 1E indicates that 46 new cell types downstream of MBONs and upstream of DANs have been generated. This seems like a discrepancy.
The 46 cell types in Figure 1E consider only the CRE/SMP/SIP/SLP area, where MBON downstreams and DAN upstreams are highly enriched, while the 111 cell types include all. To avoid confusion, we removed the “MBON downstream and DAN upstream” counting in Figure 1E in the revised manuscript.
Also, at line 75 the MBON lines previously generated by Rubin and Aso (2023) are referred to as though they are separate from the 828 described "In this report." Supplementary file 1 suggests, however, that they are included as part of this report.
Twenty five lines generated in Rubin and Aso (2023) were initially included in Supplementary file 1 for the convenience of users, but they were not counted towards the 828 new lines described in this report. To avoid confusion, we removed these 25 lines in the revised manuscript. Now all lines listed in Supplementary file 1 were generated in this study (“Aso 2021” release), and if a line has been used in earlier studies, or introduced in other contexts, for example the accompanying omnibus preprint (Meissener 2024, doi: 10.1101/2024.01.09.574419), the citations are listed in the reference column.
More generally, in lines 94-102 "828 useful lines based on their specificity, intensity and non-redundancy" are referred to, but they are subsequently subdivided into categories of lines with lower specificity (i.e. with off-target expression) and lines that did not target intended cell types (presumably ones unlikely to be involved in learning and memory). It would be useful to know how many lines (at least roughly) fall into these subcategories.
See the response above to Reviewer #3’s public review.
Finally, Figures 3B & C indicate cell types connected to DANs and MBONs and the number for which Split-Gal4 lines are available. The text (lines 136-7) states that the new collection covers 30 of these major cell types (Figure 3C)," but Figure 3C clearly has more than 30 dots showing the drivers available. Presumably existing and new driver lines are being pooled, but this should either be explained or the two should be distinguished.
“(Figure 3C)” was replaced with “(Supplementaryl File 3)” in the revised manuscript to correct the reference. Figure 3B & C are plots of all MB interneurons, not just the major cell types.
Minor Comments:
Although the paper is generally well written there are minor grammatical errors throughout (e.g. dropped articles, odd constructions, etc.) that somewhat detract from an otherwise smooth and enjoyable reading experience. A quick editing pass by a native speaker (i.e. any of several of the authors) could clean up these and numerous other small mistakes. A few examples: line 138 "presented" should be present; line 204: "contain off-targeted expressions" should be "have off-target expression;" line 219: "usage to substitute reward" is awkward at best and could be something like "use in generating fictive rewards"; line 326 "arborize[s]"; l. 331 "Based on the likelihood" should be something like "based on these observations"'; line 349 "[is] likely to appear"; l. 352 "extensive connection[s]"; line 353 "has [a] strong influence;" l. 963 "Projections" should be singular; etc.
All the mentioned examples have been corrected, and we have asked a native speaker to edit through the revised manuscript.
Lines 81-3: Is the lookup table referred to Suppl. File 1? A reference is desirable.
Yes, the lookup table referred to “Supplementary File 1” and a reference was added.
Lines 111-2: what is a "non-redundant set of...cell types?" Cell types that are represented by a single cell (or bilateral pair)? Or does this sentence mean that of the 828 lines, 355 are specific to a single cell type, and in total 319 cell types are targeted? The statement is confusing.
We revised the text as below.
“Figure 1E provides an overview of the categories of covered cell types. Among the 828 lines, a subset of 355 lines, collectively labeling at least 319 different cell types, exhibit highly specific and non-redundant expression patterns are likely to be particularly valuable for behavioral experiments. Detailed information, including genotype, expression specificity, matched EM cell type(s), and recommended driver for each cell type, can be found in Supplementary File 1. A small subset of 40 lines from this collection have been previously used in studies (Aso et al.,
2023; Dolan et al., 2019; Gao et al., 2019; Scaplen et al., 2021; Schretter et al., 2020; Takagi et al., 2017; Xie et al., 2021; Yamada et al., 2023). All transgenic lines newly generated in this study are listed in Supplementary File 2 (Aso et al., 2023; Dolan et al., 2019; Gao et al., 2019; Scaplen et al., 2021; Schretter et al., 2020; Takagi et al., 2017; Xie et al., 2021; Yamada et al., 2023).”
Line 148: "MB major interneurons" is a confusing descriptor for postsynaptic partners of MBONs.
We added a sentence to clarify the definition of the “MB major interneurons”.
“In the hemibrain EM connectome, there are about 400 interneuron cell types that have over 100 total synaptic inputs from MBONs and/or synaptic outputs to DANs. Our newly developed collection of split-GAL4 drivers covers 30 types of these ‘major interneurons’ of the MB (Supplementary File 3).”
Lines 150-1: Not sure what is meant by "have innervations within the MB." Sounds like cells are presynaptic to KCs, DANS, and MBONs, but Figure 3 Figure Supplement 1 indicates they include neurons that both provide and receive innervation to/from MB neurons. Please clarify.
For clarification, in the revised manuscript we have included a full list of cell types within the MB in Supplementary File 4. Included are all neurons with >= 50 pre-synaptic connections or with >=250 post-synaptic connections in the MB roi in the hemibrain (excluding the accessory calyx). The cell types include KCs, MBONs, DANs, PNs, and a few other cell types. The coverage ratio was updated based on this list.
Also, in line 152, what does it mean that they "may have been overlooked previously?" this seems unnecessarily ambiguous. Were they overlooked or weren't they?
Changed the text to “These lines offer valuable tools to study cell types that previously are not genetically accessible. Notably, SS85572 enables the functional study of LHMB1, which forms a rare direct pathway from the calyx and the lateral horn (LH) to the MB lobes (Bates et al., 2020). ”
Line 158 refers to PN cells within the MB, which are not mentioned in any place else as MB components.
What are these PNs and how do they differ from MBONs?
See responses to Lines 150-1 for clarification of cell types within the MB.
Line 188: not clear what is meant by "more continual learning tasks".
We rephrase it as “more complex learning tasks” to avoid jargon.
Line 235: Not clear why "extended training with high LED intensity" wouldn't promote the formation of robust memories. Is this for some reason unexpected based on previous experiments? Please explain.
See responses to weakness #1 of the same reviewer
Lines 317-9: It would be useful to state here that MB0N08 and MB0N09 are the two neurons labeled by MB083C.
Revised as suggested.
Line 368: Presumably the "lookup table" referred to is Supplementary File 1, but a reference here would be useful.
Yes, Supplementary File 1 and a reference was added.
Comments on Figures:
Figure 1C The "Dopamine Neurons" label position doesn't align with the Punishment and Reward labels, which is a bit confusing.
They are intentionally not aligned, because dopamine neurons are not reward/punishment per se. We intend to use the schematic to show that the punishment and reward are conveyed to the MB through the dopamine neuron layer, just as the output from the MB output neuron layer is used to guide further integration and actions. To keep the labels of “Dopamine neurons” and “MB Output Neurons” in a symmetrical position, we decide to keep the original figure unchanged. But we thank the reviewer for the kind suggestion.
Figure 1F and Figure 1 - Figure Supplement 1: the light gray labels presumably indicate the (EM-identified) neuron labeled by each line, but this should be explicitly stated in the figure legends. It would also be useful in the legends to direct the reader to the key (Supplementary File 1) for decoding neuronal identities.
Revised as suggested.
Figure 2: For clarity, I'd recommend titling this figure "LM-EM Match of the CRE011-specific driver SS45245". This reduces the confusion of mixing and matching the driver and cell-type names. Also, it would be helpful to indicate (e.g. with labels above the figure parts) that A & B represent the MCFO characterization step and C & D represent the LM-EM matching step of the pipeline. Revised as suggested.
Figure 6: For clarity, it would be useful to separately label the PN and sensory neuron groups. Also, for the sensory neurons at the bottom, what is the distinction between the cell names in gray and black font?
Figure 6 was updated to separate the non-olfactory PN and sensory neuron groups. The gray was intended for olfactory receptor neuron cell types that are additionally labeled in the driver lines. To avoid confusion, the gray cell types were removed in the revised figure, and a clarification sentence was added to the legend.
“Other than thermo-/hygro-sensory receptor neurons (TRNs and HRNs), SS00560 and MB408B also label olfactory receptor neurons (ORNs): ORN_VL2p and ORN_VC5 for SS00560, ORN_VL1 and ORN_VC5 for MB408B.”
Figure 7A: It's unclear why the creation of 6 Gr64f-LexADBD lines is reported. Aren't all these lines the same? If not, an explanation would be useful.
These six Gr64f-LexADBD lines are with different insertion sites, and with the presence or absence of the p10 translational enhancer. Explanation was added to legend. Enhanced expression level with p10 can be helpful to compensate for the general tendency that split-LexA is weaker than split-GAL4. Different insertions will be useful to avoid transvections with split-GAL4s, which are mostly in attP40 and attP2.
Figure 8F: It would help to include in the legend a brief description of each parameter being measured-essentially defining the y-axis label on the graphs as in Figure Supplement 2. Also, how is the probability of return calculated and what behavioral parameter does the change of curvature refer to?
We added a brief description to the behavioral parameters in the legend of Figure 8F.
“Return behavior was assessed within a 15-second time window. The probability of return (P return) is the percentage of flies that made an excursion (>10 mm) and then returned to within 3 mm of their initial position. Curvature is the ratio of angular velocity to walking speed.”
Figure 9E: What are the parenthetical labels for lines SS49267, SS49300, and SS35008?
They are EM bodyIDs. Figure legend was revised.
-
-
www.biorxiv.org www.biorxiv.org
-
Author response:
The following is the authors’ response to the original reviews.
eLife Assessment
This study compiles a wide range of results on the connectivity, stimulus selectivity, and potential role of the claustrum in sensory behavior. While most of the connectivity results confirm earlier studies, this valuable work provides incomplete evidence that the claustrum responds to multimodal stimuli and that local connectivity is reduced across cells that have similar long-range connectivity. The conclusions drawn from the behavioral results are weakened by the animals' poor performance on the designed task.This study has the potential to be of interest to neuroscientists.
We thank the editor and the reviewers for their feedback on our work, which we have incorporated to help improve interpretation of our findings as outlined in the response below. While we agree with the editor that further work is necessary to provide a comprehensive understanding of claustrum circuitry and activity, this is true of most scientific endeavors and therefore we feel that describing this work as “incomplete” unfairly mischaracterizes the intent of the experiments performed which provide fundamental insights into this poorly understood brain region. Additionally, as identified in the main text, methods section, and our responses to the comments below, we disagree that the behavioral results are “weakened” by the performance of the animals. Our goal was to assess what information animals learned and used in an ambiguous sensory/reward environment, not to shape them toward a particular behavior and interpret the results solely based on their accuracy in performing the task.
Public Reviews:
Reviewer #1 (Public Review):
Summary:
The paper by Shelton et al investigates some of the anatomical and physiological properties of the mouse claustrum. First, they characterize the intrinsic properties of claustrum excitatory and inhibitory neurons and determine how these different claustrum neurons receive input from different cortical regions. Next, they perform in vitro patch clamp recordings to determine the extent of intraclaustrum connectivity between excitatory neurons. Following these experiments, in vivo axon imaging was performed to determine how claustrum-retrosplenial cortex neurons are modulated by different combinations of auditory, visual, and somatosensory input. Finally, the authors perform claustrum lesions to determine if claustrum neurons are required for performance on a multisensory discrimination task
Strengths:
An important potential contribution the authors provide is the demonstration of intra-claustrum excitation. In addition, this paper provides the first experimental data where two cortical inputs are independently stimulated in the same experiment (using 2 different opsins). Overall, the in vitro patch clamp experiments and anatomical data provide confirmation that claustrum neurons receive convergent inputs from areas of the frontal cortex. These experiments were conducted with rigor and are of high quality.
We thank the reviewer for their positive appraisal of our work.
Weaknesses:
The title of the paper states that claustrum neurons integrate information from different cortical sources. However, the authors did not actually test or measure integration in the manuscript. They do show physiological convergence of inputs on claustrum neurons in the slice work. Testing integration through simultaneous activation of inputs was not performed. The convergence of cortical input has been recently shown by several other papers (Chia et al), and the current paper largely supports these previous conclusions. The in vivo work did test for integration because simultaneous sensory stimulations were performed. However, integration was not measured at the single cell (axon) level because it was unclear how activity in a single claustrum ROI changes in response to (for example) visual, tactile, and visual-tactile stimulations. Reading the discussion, I also see the authors speculate that the sensory responses in the claustrum could arise from attentional or salience-related inputs from an upstream source such as the PFC. In this case, claustrum cells would not integrate anything (but instead respond to PFC inputs).
We thank the reviewer for raising this point. In response, we have provided a definition of “integration” in the manuscript text (lines 112-114, 353-354):
“...single-cell responsiveness to more than one input pathway, e.g. being capable of combining and therefore integrating these inputs.”
The reviewer’s point about testing simultaneous input to the claustrum is well made but not possible with the dual-color optogenetic stimulation paradigm used in our study as noted in the Results and Discussion sections (see also Klapoetke et al., 2014, Hooks et al., 2015). The novelty of our paper comes from testing these connections in single CLA neurons, something not shown in other studies to-date (Chia et al., 2020; Qadir et al., 2022), which average connectivity over many neurons.
Finally, we disagree with the reviewer regarding whether integration was tested at the single-axon level and provide data and supplementary figures to this effect (Fig. 6, Supp. Fig. S14, lines 468-511) . Although the possibility remains that sensory-related information may arise in the prefrontal cortex, as we note, there is still a large collection of studies (including this one) that document and describe direct sensory inputs to the claustrum (Olson & Greybeil, 1980; Sherk & LeVay, 1981; Smith & Alloway, 2010; Goll et al., 2015; Atlan et al., 2017; etc.). We have updated the wording of these sections to note that both direct and indirect sensory input integration is possible.
The different experiments in different figures often do not inform each other. For example, the authors show in Figure 3 that claustrum-RSP cells (CTB cells) do not receive input from the auditory cortex. But then, in Figure 6 auditory stimuli are used. Not surprisingly, claustrum ROIs respond very little to auditory stimuli (the weakest of all sensory modalities). Then, in Figure 7 the authors use auditory stimuli in the multisensory task. It seems that these experiments were done independently and were not used to inform each other.
The intention behind the current manuscript was to provide a deep characterisation of claustrum to inform future research into this enigmatic structure. In this case, we sought to test pathways in vivo that were identified as being weak or absent in vitro to confirm and specifically rule out their influence on computations performed by claustrum. We agree with the reviewer’s assessment that it is not surprising that claustrum ROIs respond weakly to auditory stimuli. Not testing these connections in vivo because of their apparent sparsity in vitro would have represented a critical gap in our knowledge of claustrum responses during passive sensory stimulation.
One novel aspect of the manuscript is the focus on intraclaustrum connectivity between excitatory cells (Figure 2). The authors used wide-field optogenetics to investigate connectivity. However, the use of paired patch-clamp recordings remains the ground truth technique for determining the rate of connectivity between cell types, and paired recordings were not performed here. It is difficult to understand and gain appreciation for intraclaustrum connectivity when only wide-field optogenetics is used.
We thank the reviewer for acknowledging the novelty of these experiments. We further acknowledge that paired patch-clamp recordings are the gold standard for assessing synaptic connectivity. Typically such experiments are performed in vitro, a necessity given the ventral location of claustrum precluding in vivo patching. In vitro slice preparations by their very nature sever connections and lead to an underestimate of connectivity as noted in our Discussion. Kim et al. (2016) have done this experiment in coronal slices with the understanding that excitatory-excitatory connectivity would be local (<200 μm) and therefore preserved. We used a variety of approaches that enabled us to explore connectivity along the longitudinal axis of the brain (the rostro-caudal, e.g. “long” axis of the claustrum), providing fresh insight into the circuitry embedded within this structure that would be challenging to examine using dual recordings. Further, our optogenetic method (CRACM, Petreanu et al., 2007), has been used successfully across a variety of brain structures to examine excitatory connectivity while circumventing artifacts arising from the slice axis.
In Figure 2, CLA-rsp cells express Chrimson, and the authors removed cells from the analysis with short latency responses (which reflect opsin expression). But wouldn't this also remove cells that express opsin and receive monosynaptic inputs from other opsin-expressing cells, therefore underestimating the connectivity between these CLA-rsp neurons? I think this needs to be addressed.
The total number of opsin-expressing CLA neurons in our dataset is 4/46 tested neurons. Assuming all of these neurons project to RSP, they would have accounted for 4/32 CLARSP neurons. Given the rate of monosynaptic connectivity observed in this study, these neurons would only contribute 2-3 additional connected neurons. Therefore, the exclusion of these neurons does not significantly impact the overall statistical accuracy of our connectivity findings.
In Figure 5J the lack of difference in the EPSC-IPSC timing in the RSP is likely due to 1 outlier EPSC at 30 ms which is most likely reflecting polysynaptic communication. Therefore, I do not feel the argument being made here with differences in physiology is particularly striking.
We thank the reviewer for their attention to detail about this analysis. We have performed additional statistics and found that leaving this neuron out does not affect the significance of the results (new p-value = 0.158, original p-value = 0.314, Mann-Whitney U test). We have removed this datapoint from the figure and our analysis.
In the text describing Figure 5, the authors state "These experiments point to a complex interaction ....likely influenced by cell type of CLA projection and intraclaustral modules in which they participate". How does this slice experiment stimulating axons from one input relate to different CLA cell types or intra-claustrum circuits? I don't follow this argument.
We have removed this speculation from the Results section.
In Figure 6G and H, the blank condition yields a result similar to many of the sensory stimulus conditions. This blank condition (when no stimulus was presented) serves as a nice reference to compare the rest of the conditions. However, the remainder of the stimulation conditions were not adjusted relative to what would be expected by chance. For example, the response of each cell could be compared to a distribution of shuffled data, where time-series data are shuffled in time by randomly assigned intervals and a surrogate distribution of responses generated. This procedure is repeated 200-1000x to generate a distribution of shuffled responses. Then the original stimulus-triggered response (1s post) could be compared to shuffled data. Currently, the authors just compare pre/post-mean data using a Mann-Whitney test from the mean overall response, which could be biased by a small number of trials. Therefore, I think a more conservative and statistically rigorous approach is warranted here, before making the claim of a 20% response probability or 50% overall response rate.
We appreciate the reviewer's thorough analysis and suggestion for a more conservative statistical approach. We acknowledge that responses on blank trials occur about 10% of the time, indicating that response probabilities around this level may not represent "real" responses. To address this, we will include the responses to the blank condition in the manuscript (lines 505-509). This will allow readers to make informed decisions based on the presented data.
Regarding Figure 6, a more conventional way to show sensory responses is to display a heatmap of the z-scored responses across all ROIs, sorted by their post-stimulus response. This enables the reader to better visualize and understand the claims being made here, rather than relying on the overall mean which could be influenced by a few highly responsive ROIs.
We apologize to the reviewer that our data in this figure was challenging to interpret. We have included an additional supplemental figure (Supp. Fig. S15) that displays the requested information.
For Figure 6, it would also help to display some raw data showing responses at the single ROI level and the population level. If these sensory stimulations are modulating claustrum neurons, then this will be observable on the mean population vector (averaged df/f across all ROIs as a function of time) within a given experiment and would add support to the conclusions being made.
We appreciate the reviewer’s desire to see more raw data – we would have included this in the figure given more space. However, the average df/f across all ROIs is shown as a time series with 95% confidence intervals in Fig. 6D.
As noted by the authors, there is substantial evidence in the literature showing that motor activity arises in mice during these types of sensory stimulation experiments. It is foreseeable that at least some of the responses measured here arise from motor activity. It would be important to identify to what extent this is the case.
While we acknowledge that some responses may arise from motor-related activity, addressing this comprehensively is beyond the scope of this paper. Given the extensive number of trials and recorded axonal segments, we believe that motor-related activity is unlikely to significantly impact the average response across all trials. Future studies focusing specifically on motor activity during sensory stimulation experiments would be needed to elucidate this aspect in detail.
All claims in the results for Figure 6 such as "the proportion of responsive axons tended to be highest when stimuli were combined" should be supported by statistics.
We have provided additional statistics in this section (lines 490-511) to address the reviewer’s comment.
In Figure 7, the authors state that mice learned the structure of the task. How is this the case, when the number of misses is 5-6x greater than the number of hits on audiovisual trials (S Figure 19). I don't get the impression that mice perform this task correctly. As shown in Figure 7I, the hit rate is exceptionally low on the audiovisual port in controls. I just can't see how control and lesion mice can have the same hit rate and false alarm rate yet have different d'. Indeed, I might be missing something in the analysis. However, given that both groups of mice are not performing the task as designed, I fail to see how the authors' claim regarding multisensory integration by the claustrum is supported. Even if there is some difference in the d' measure, what does that matter when the hits are the least likely trial outcome here for both groups.
We thank the reviewer for their comments and hope the following addresses their confusion about the performance of animals during our multimodal conditioning task.
Firstly, as pointed out by the reviewer, the hit-rate (HR) is lower than false-alarm-rate (FR) but crucially only when assessed explicitly within-condition (e.g. just auditory or just visual stimulation). Given the multimodal nature of the assay, HR and FR could also be evaluated across different trials, unimodal and multimodal, for both auditory and visual stimuli. Doing so resulted in a net positive d', as observed by the reviewer. From this perspective, and as documented in the Methods (Multimodal Conditioning and Reversal Learning) and Supplemental Figures, mice do indeed learn the conditioning task and perform at above-chance levels.
Secondly, as raised in the Discussion, an important caveat of this assay was that it was unnecessary for mice to learn the task structure explicitly but, rather, that they respond to environmental cues in a reward-seeking manner that indicated perception of a stimulus. "Performance" as it is quantified here demonstrates a perceptual difference between conditions that is observed through behavioral choice and timing, not necessarily the degree to which the mice have an understanding of the task per se.
In the discussion, it is stated that "While axons responded inconsistently to individual stimulus presentations, their responsivity remained consistent between stimuli and through time on average...". I do not understand this part of the sentence. Does this mean axons are consistently inconsistent?
The reviewer’s interpretation is correct – although recorded axons tended to have a preferred stimulus or combination of stimuli, they displayed variability in their responses (response probability), though little or no variability in their likelihood to respond over time (on average).
In the discussion, the authors state their axon imaging results contrast with recent studies in mice. Why not actually do the same analysis that Ollerenshaw did, so this statement is supported by fact? As pointed out above, the criteria used to classify an axon as responsive to stimuli were very liberal in this current manuscript.
While we appreciate this comment from the reviewer, we feel that it was not necessary to perform similar analyses to those of Ollerenshaw et al in order to appreciate that methodological differences between these studies would have confounded any comparisons made, as we note in the Discussion.
I find the discussion wildly speculative and broad. For example, "the integrative properties of the CLA could act as a substrate for transforming the information content of its inputs (e.g. reducing trial-to-trial variability of responses to conjunctive stimuli...)". How would a claustrum neuron responding with a 10% reliability to a stimuli (or set of stimuli) provide any role in reducing trial-to-trial variability of sensory activity in the cortex?
We thank the reviewer for their feedback. We acknowledge the reviewer's concern regarding the speculative nature of our discussion. To address the specific point raised, while a neuron with a 10% reliability might appear limited in reducing trial-to-trial variability in sensory activity, it's possible that such neurons are responsive to a combination of stimuli or conditions not fully controlled or recorded in our current setup. For instance, variables like the animal’s attentional or motivational states could influence the responsiveness of claustrum neurons, thus integrating these inputs could theoretically modulate cortical processing. We have refined this section to clarify these points (now lines 810-813).
Reviewer #2 (Public Review):
Summary:
In this manuscript, Shelton et al. explore the organization of the Claustrum. To do so, they focus on a specific claustrum population, the one projecting to the retrosplenial cortex (CLA-RSP neurons). Using an elegant technical approach, they first described electrophysiological properties of claustrum neurons, including the CLA-RSP ones. Further, they showed that CLA-RSP neurons (1) directly excite other CLA neurons, in a 'projection-specific' pattern, i.e. CLA-RSP neurons mainly excite claustrum neurons not projecting to the RSP and (2) receive excitatory inputs from multiple cortical territories (mainly frontal ones). To confirm the 'integrative' property of claustrum networks, they then imaged claustrum axons in the cortex during singleor multi-sensory stimulations. Finally, they investigated the effect of CLA-RSP lesion on performance in a sensory detection task.
Strengths:
Overall, this is a really good study, using state-of-the-art technical approaches to probe the local/global organization of the Claustrum. The in-vitro part is impressive, and the results are compelling.
We thank the reviewer for their positive appraisal of our work.
Weaknesses:
One noteworthy concern arises from the terminology used throughout the study. The authors claimed that the claustrum is an integrative structure. Yet, integration has a specific meaning, i.e. the production of a specific response by a single neuron (or network) in response to a specific combination of several input signals. In this study, the authors showed compelling results in favor of convergence rather than integration. On a lighter note, the in-vivo data are less convincing, and do not entirely support the claim of "integration" made by the authors.
We thank the reviewer for their clarity on this issue. We absolutely agree that without clear definition in the study, interpretation of our data could be misconstrued for one of several possible meanings. We have updated our Introduction, Results, and Discussion text to reflect the definition of ‘integration’ we used in the interpretation of our work and hope this clarifies our intent to the reader.
Reviewer #3 (Public Review):
The claustrum is one of the most enigmatic regions of the cerebral cortex, with a potential role in consciousness and integrating multisensory information. Despite extensive connections with almost all cortical areas, its functions and mechanisms are not well understood. In an attempt to unravel these complexities, Shelton et al. employed advanced circuit mapping technologies to examine specific neurons within the claustrum. They focused on how these neurons integrate incoming information and manage the output. Their findings suggest that claustrum neurons selectively communicate based on cortical projection targets and that their responsiveness to cortical inputs varies by cell type.
Imaging studies demonstrated that claustrum axons respond to both single and multiple sensory stimuli. Extended inhibition of the claustrum significantly reduced animals' responsiveness to multisensory stimuli, highlighting its critical role as an integrative hub in the cortex.
However, the study's conclusions at times rely on assumptions that may undermine their validity. For instance, the comparison between RSC-projecting and non-RSC-projecting neurons is problematic due to potential false negatives in the cell labeling process, which might not capture the entire neuron population projecting to a brain area. This issue casts doubt on the findings related to neuron interconnectivity and projections, suggesting that the results should be interpreted with caution. The study's approach to defining neuron types based on projection could benefit from a more critical evaluation or a broader methodological perspective.
We thank the reviewer for their attention to the methods used in our study. We acknowledge that there is an inherent bias introduced by false-negatives as a result of incomplete labeling but contend that this is true of most modern tracing experiments in neuroscience, irrespective of the method used. Moreover, if false-negative biases are affecting our results, then they likely do so in the direction of supporting our findings – perfect knowledge of claustrum connectivity would likely enhance the effects seen by increasing the pool of neurons for which we find an effect. For example, our cortico-claustal connectivity findings in Figure 3 likely would have shown even larger effects should false-negative CLARSP neurons have been positively identified.
Where appropriate we have provided estimates of variability and certainty in our experimental findings and do not claim any definitive knowledge of the true rate and scope of claustrum connectivity.
Nevertheless, the study sets the stage for many promising future research directions. Future work could particularly focus on exploring the functional and molecular differences between E1 and E2 neurons and further assess the implications of the distinct responses of excitatory and inhibitory claustrum neurons for internal computations. Additionally, adopting a different behavioral paradigm that more directly tests the integration of sensory information for purposeful behavior could also prove valuable.
We thank the reviewer for their outlook on the future directions of our work. These avenues for study, we believe, would be very fruitful in uncovering the cell-type-specific computations performed by claustrum neurons.
Recommendations for the authors:
Reviewing Editor (Recommendations for the Authors):
The editor recommends addressing the issues raised by the reviewers about the statistical significance of sensory response with respect to blank stimuli, and solving the issue generated by the exclusion of monosynaptically connected neurons in the connectivity study, to raise the assessment strength of evidence from incomplete to solid. Moreover, as the reported result stands, the behavioral task does not seem to be learned by the animals as the animals are above chance for visual and auditory but largely below chance level for multisensory. It seems that the animals do not perform a multisensory task. The authors should clarify this.
Reviewer #1 (Recommendations For The Authors):
Several references were missing from the manuscript, where mouse CLA-retrosplenial or CLA-frontal neurons were investigated and would be highly relevant to both the discussion of claustrum function and the context of the methodologies used here. (Wang et al., 2023 Nat Comm; Nair et al., 2023 PNAS, Marriott et al. 2024 Cell Reports ; Faig et al., 2024 Current
Biology).
Reviewer #2 (Recommendations For The Authors):
Let me be clear, this is an excellent study, using state-of-the-art technical approaches to probe the local/global organization of the Claustrum. However, the study is somehow disconnected, with a fantastic in-vitro part, and, in my opinion, a less convincing in-vivo one.
As stated in the public review, I'm concerned about the use of the term "integration", as, in my opinion, the data presented in this study (which I repeat are of excellent level) do not support that claim.
Below are my main points regarding the article:
(1) My main comment relates to the use of the term 'integration'. It might be a semantic debate, but I think that this is an important one. In my opinion, neural integration is the "summing of several neural input signals by a single neuron to produce an output signal that is some function of those inputs". As the authors state in the discussion, they were not able to "assess the EPSP response magnitude to the conjunction of stimuli due to photosensitivity of ChrimsonR opsins to blue light". Therefore, the authors did not specifically prove integration, but rather input convergence. This does not mean that the results presented are not important or of excellent quality, but I encourage the authors to either tone down the part on integration or to give a clear definition of what they call integration.
(2) The in vivo imaging data are somehow confusing. First, the authors image two claustral populations simultaneously (the CLA-RSP and the CLA-ACA axons). I may be missing the information, but there is no evidence that these cells overlap in the CLA (no data in the supplement and existing literature only support partial overlap). Second, in the results part, the authors claim that 96% of the sensory-responsive axons displayed multisensory response. This, combined with the 47% of axons responsive to at least one stimulus should lead to a global response of around 45% of the axons in multisensory trials. Yet, in Figures 6F-G, one can see that the response probability is actually low (closer to 20%). To be honest, I cannot really understand how to make sense of these results. At first, I thought that most of the multisensory responsive axons show no response during multisensory stimulus (but one in the unimodal stimulus). This hypothesis is however unlikely, as response AUC is biased toward positivity in Figure 6H. Overall, I'm not totally convinced by the imaging data, and I think that the authors should be more cautious about interpreting their results (as they are in the discussion part, but less in the results part).
(3) The TetTox approach used in the study ablates all neurons expressing the CRE in the CLA. If the hypothesis proposed by the authors is true, then ablating one subpopulation should not impact that much the functioning of the whole CLA, as other neurons will likely "integrate" information coming from multiple cortices (Figures 3 and 4), the local divergence (Figure 1) will then allow the broadcasting of this information back to multiples cortices. Do the authors think that such an approach deeply modified intra-claustral network connectivity? If this is not the case, shouldn't we expect less effect after lesioning a specific sub-population of CLA neurons?
(4) The behavioral protocol is also confusing. If I understand correctly, the aim of the task was to probe the D-Prime factor, as all trials, whatever the response of the animal are rewarded. From the Figure 7I, one can see that the mice cannot properly answer to the audiovisual cues, clearly indicating that both groups show impaired response to this type of trial. The whole conclusion of the authors is therefore drawn from the D-Prime calculation. However, even if D-Prime should represent a measure of sensitivity (i.e. is unaffected by response bias), two assumptions need to be met: (1) the signal and noise distributions should be both normal, and (2) the signal and noise distributions should have the same standard deviation. However, these assumptions cannot be tested in the task used by the authors (one would need rating tasks). The authors might want to use nonparametric measures of sensitivity such as A' (see Pollack and Norman 1964).
Reviewer #3 (Recommendations For The Authors):
While the study is comprehensive, some of its conclusions are based on assumptions that potentially weaken their validity. A significant issue arises in the comparison between neurons that project to the retrosplenial cortex (RSC) and those that do not. This differentiation is based on retrograde labeling from a single part of the RSC. However, CTB labeling, the technique used, does not capture 100% of the neurons projecting to a brain area. The study itself demonstrates this by showing that injecting the dye into three sections of the RSC results in three overlapping populations of neurons in the claustrum. Therefore, limiting the injection to just one of these areas inevitably leads to many false negatives-neurons that project to the RSC but are not marked by the CTB. This issue recurs in the analysis of neurons projecting to both the RSC and the prelimbic cortex (PL), where assumptions about interconnectivity are made without a thorough examination of overlap between these populations. The incomplete labeling complicates the interpretation of the data and draws firm conclusions from it.
Minor.
There is a reference to Figure 1D where claustrum->cortical connections are described. This should be 5D.
This is a correct reference pointing back to our single-cell characterizations of CLA morphoelectric types.
End of Page 22. Implies should be imply.
This has been resolved in the manuscript text.
-
eLife Assessment
This study compiles a wide range of results on the connectivity, stimulus selectivity, and potential role of the claustrum in sensory behavior. While most of the connectivity results confirm earlier studies, this valuable work provides incomplete evidence that the claustrum responds to multimodal stimuli and that local connectivity is reduced across cells that have similar long-range connectivity. The conclusions drawn from the behavioral results are weakened by the animals' poor performance on the designed task. This study has the potential to be of interest to neuroscientists.
-
Reviewer #1 (Public review):
Summary:
The paper by Shelton et al investigates some of the anatomical and physiological properties of the mouse claustrum. First, they characterize the intrinsic properties of claustrum excitatory and inhibitory neurons and determine how these different claustrum neurons receive input from different cortical regions. Next, they perform in vitro patch clamp recordings to determine the extent of intraclaustrum connectivity between excitatory neurons. Following these experiments, in vivo axon imaging was performed to determine how claustrum-retrosplenial cortex neurons are modulated by different combinations of auditory, visual, and somatosensory input. Finally, the authors perform claustrum lesions to determine if claustrum neurons are required for performance on a multisensory discrimination task
Strengths:
An important potential contribution the authors provide is the demonstration of intra-claustrum excitation. In addition, this paper does provide the first experimental data where two cortical inputs are independently stimulated in the same experiment (using 2 different opsins). Overall, the in vitro patch clamp experiments and anatomical data provide confirmation that claustrum neurons receive convergent inputs from areas of frontal cortex. These experiments were conducted with rigor and are of high quality.
Weaknesses:
The title of the paper states that claustrum neurons integrate information from different cortical sources. However, the authors did not actually test or measure integration in the manuscript. They do show physiological convergence of inputs on claustrum neurons in the slice work. Testing integration through simultaneous activation of inputs was not performed. The convergence of cortical input has been recently shown by several other papers (Chia et al), and the current paper largely supports these previous conclusions. The in vivo work did test for integration, because simultaneous sensory stimulations were performed. However, integration was not measured at the single cell (axon) level because it was unclear how activity in a single claustrum ROI changes in response to (for example) visual, tactile, and visual-tactile stimulations. Reading the discussion, I also see the authors speculate that the sensory responses in the claustrum could arise from attentional or salience related inputs from an upstream source such as the PFC. In this case, claustrum cells would not integrate anything (but instead respond to PFC inputs).
The different experiments in different figures often do not inform each other. For example, the authors show in Figure 3 that claustrum-RSP cells (CTB cells) do not receive input from the auditory cortex. But then, in Figure 6 auditory stimuli are used. Not surprisingly, claustrum ROIs respond very little to auditory stimuli (the weakest of all sensory modalities). Then, in Figure 7 the authors use auditory stimuli in the multisensory task. It seems that these experiments were done independently and were not used to inform each other.
One novel aspect of the manuscript is the focus on intraclaustrum connectivity between excitatory cells (Figure 2). The authors used wide-field optogenetics to investigate connectivity. However, the use paired patch clamp recordings remains the ground truth technique for determining the rate of connectivity between cell types, and paired recordings were not performed here. It is difficult to understand and gain appreciation for intraclaustrum connectivity when only wide-field optogenetics is used.
In Figure 2, CLA-rsp cells express Chrimson, and the authors removed cells from the analysis with short latency responses (which reflect opsin expression). But wouldn't this also remove cells that express opsin and receive monosynaptic inputs from other opsin expressing cells, therefore underestimating the connectivity between these CLA-rsp neurons? I think this needs to be addressed.
In Figure 5J the lack of difference in the EPSC-IPSC timing in the RSP is likely due to 1 outlier EPSC at 30ms which is most likely reflecting polysynaptic communication. Therefore, I do not feel the argument being made here with differences in physiology is particularly striking.
In the text describing Figure 5, the authors state "These experiments point to a complex interaction ....likely influenced by cell type of CLA projection and intraclaustral modules in which they participate". How does this slice experiment stimulating axons from one input relate to different CLA cell types or intra-claustrum circuits? I don't follow this argument.
In Figure 6G and H the blank condition yields a result similar to many of the sensory stimulus conditions. This blank condition (when no stimulus was presented) serves as a nice reference to compare the rest of the conditions. However, the remainder of the stimulation conditions were not adjusted relative to what would be expected by chance. For example, the response of each cell could be compared to a distribution of shuffled data, where time-series data are shuffled in time by randomly assigned intervals and a surrogate distribution of responses generated. This procedure is repeated 200-1000x to generate a distribution of shuffled responses. Then the original stimulus triggered response (1s post) could be compared to shuffled data. Currently, the authors just compare pre/post mean data using a Mann Whitney test from the mean overall response, which could be biased by a small number of trials. Therefore, I think a more conservative and statistically rigorous approach is warranted here, before making the claim of a 20% response probability or 50% overall response rate.
Regarding Figure 6, a more conventional way to show sensory responses is to display a heatmap of the z-scored responses across all ROIs, sorted by their post-stimulus response. This enables the reader to better visualize and understand the claims being made here, rather than relying on the overall mean which could be influenced by a few highly responsive ROIs.
For Figure 6 it would also help to display some raw data showing responses at the single ROI level and the population level. If these sensory stimulations are modulating claustrum neurons, then this will be observable on the mean population vector (averaged df/f across all ROIs as a function of time) within a given experiment and would add support to the conclusions being made.
As noted by the authors, there is substantial evidence in the literature showing that motor activity arises in mice during these types of sensory stimulation experiments. It is foreseeable that at least some of the responses measured here arise from motor activity. It would be important to identify to what extent this is the case.
All claims in the results for Figure 6 such as "the proportion of responsive axons tended to be highest when stimuli were combined" should be supported by statistics.
For Figure 7, the authors state that mice learned the structure of the task. How is this the case, when the number of misses are 5-6x greater than the number of hits on audiovisual trials (S Fig 19). I don't get the impression that mice perform this task correctly. As shown in Figure 7I, the hit rate is exceptionally low on the audiovisual port in controls. I just can't see how control and lesion mice can have the same hit rate and false alarm rate yet have different d'. Indeed, I might be missing something in the analysis. However, given that both groups of mice are not performing the task as designed, I fail to see how the authors claim regarding multisensory integration by the claustrum is supported. Even if there is some difference in the d' measure, what does that matter when the hits are the least likely trial outcome here for both groups.
In the discussion, it is stated that "While axons responded inconsistently to individual stimulus presentations, their responsivity remained consistent between stimuli and through time on average...". I do not understand this part of the sentence. Does this mean axons are consistently inconsistent?
In the discussion the authors state their axon imaging results contrast with recent studies in mice. Why not actually do the same analysis that Ollerenshaw did, so this statement is supported by fact? As pointed out above, the criteria used to classify an axon as responsive to stimuli was very liberal in this current manuscript.
I find the discussion wildly speculative and broad. For example, "the integrative properties of the CLA could act as a substrate for transforming the information content of its inputs (e.g. reducing trial to trial variability of responses to conjunctive stimuli...)". How would a claustrum neuron responding with a 10% reliability to a stimuli (or set of stimuli) provide any role in reducing trial to trial variability of sensory activity in the cortex?
Comments on the latest version: The authors have revised the manuscript, by adding 1 new supplementary figure, and some minor changes to the text. Overall, my comments regarding the manuscript were not sufficiently addressed. Here is one example:
The authors don't seem to be taking the comments regarding the statistical significance of the sensory responses seriously. If there is a response in 10% of the axons in the blank condition, and a 11 % response in the auditory stimulation, then that means that it is more accurate to say that 1% of axons actually respond to auditory stimulation. "leaving to reader to make their own decisions" as the authors suggest, but then having authors read text such as "All modalities could evoke responses in at least some claustrum neurons", is misleading because no attempt was made to correct for a chance level of detection that is clearly observed in the blank condition. Another interpretation of the authors data would be that in the case of the auditory/visual/somatosensory combined stimuli resulted in 21%(observed) - 10% (blank) = 11% of axons. Therefore, a conclusion that more accurately reflects the data would be that 89% of claustrum axons do not respond, even when the mouse received multisensory stimuli. I tried to get the authors to run some basic stats to more accurately test the true degree of responsiveness, but these changes did not appear in the manuscript.
-
Reviewer #2 (Public review):
Summary:
In this manuscript, Shelton et al. explore the organization of the Claustrum. To do so, they focus on a specific claustrum population, the one projecting to the retrosplenial cortex (CLA-RSP neurons). Using elegant technical approach, they first described electrophysiological properties of claustrum neurons, including the CLA-RSP ones. Further, they showed that CLA-RSP neurons 1) directly excite other CLA neurons, in a 'projection-specific' pattern, i.e. CLA-RSP neurons mainly excite claustrum neurons not projecting to the RSP and 2) received excitatory inputs from multiple cortical territories (mainly frontal ones). In an effort to confirm the 'integrative' property of claustrum networks, they then imaged claustrum axons in the cortex during single- or multi-sensory stimulations. Finally, they investigated the effect of CLA-RSP lesion on performance in a sensory detection task.
Strengths:
Overall, this is a really good study, using state of the art technical approaches to probe the local/global organization of the Claustrum. The in-vitro part is impressive, and the results are compelling.
Weaknesses:
One noteworthy concern arises from the terminology used throughout the study. The authors claimed that the claustrum is an integrative structure. Yet, integration has a specific meaning, i.e. the production of a specific response by a single neuron (or network) in response to a specific combination of several input signals. In this study, the authors showed compelling results in favor of convergence rather than integration. On a lighter note, the in-vivo data are less convincing, and do not entirely support the claim of "integration" made by the authors.
-
Reviewer #3 (Public review):
Public review:
The claustrum is one of the most enigmatic regions of the cerebral cortex, with a potential role in consciousness and integrating multisensory information. Despite extensive connections with almost all cortical areas, its functions and mechanisms are not well understood. In an attempt to unravel these complexities, Shelton et al. employed advanced circuit mapping technologies to examine specific neurons within the claustrum. They focused on how these neurons integrate incoming information and manage the output. Their findings suggest that claustrum neurons selectively communicate based on cortical projection targets and that their responsiveness to cortical inputs varies by cell type.
Imaging studies demonstrated that claustrum axons respond to both single and multiple sensory stimuli. Extended inhibition of the claustrum significantly reduced animals' responsiveness to multisensory stimuli, highlighting its critical role as an integrative hub in the cortex.
However, the study's conclusions at times rely on assumptions that may undermine their validity. For instance, the comparison between RSC projecting and non-RSC projecting neurons is problematic due to potential false negatives in the cell labeling process, which might not capture the entire neuron population projecting to a brain area. This issue casts doubt on the findings related to neuron interconnectivity and projections, suggesting that the results should be interpreted with caution. The study's approach to defining neuron types based on projection could benefit from a more critical evaluation or a broader methodological perspective.
Nevertheless, the study sets the stage for many promising future research directions. Future work could particularly focus on exploring the functional and molecular differences between E1 and E2 neurons and further assess the implications of the distinct responses of excitatory and inhibitory claustrum neurons for internal computations. Additionally, adopting a different behavioral paradigm that more directly tests the integration of sensory information for purposeful behavior could also prove valuable.
-
-
www.biorxiv.org www.biorxiv.org
-
eLife Assessment
This valuable study investigates the relationship between neuronal dynamics in the thalamus and brain state modulation. The claims that a specific channel is a critical player in the regulation of brain-states and ethanol-resistance in mice are supported by convincing evidence. The work will be of interest to systems neuroscientists interested in brain dynamics and behavioural states.
-
Reviewer #1 (Public review):
Summary:
This is an interesting and valuable study that uses multiple approaches to understand the role of bursting involving voltage-gated calcium channels within the mediodorsal thalamus in the sedative-hypnotic effects of alcohol. Given its unique functional roles and connectivity pattern, the finding that the mediodorsal thalamus has a fundamental role in regulating alcohol-induced transitions in consciousness state is both important for researchers investigating thalamocortical dynamics and more broadly interesting for understanding brain function. In addition, the author's examination of the role of the voltage-gated calcium channel Cav3.1 provides considerable evidence that burst-firing mediated by this channel in the thalamus is functionally important for behavioral-state transitions. While many previous studies have suggested an analogous role for these channels in sleep-state regulation, the evidence for a role of this type of bursting in sedative-induced transitions is more limited so the evidence presented is of considerable value to the field. By performing comparative experiments across multiple thalamic nuclei which have been implicated in controlling state-transitions, the authors also validate their claim and establish the unique role of the mediodorsal thalamus. Overall, this study provides substantial mechanistic insight into how the thalamus influences drug induced transitions between different states of consciousness and opens avenues for future research into how thalamocortical interactions enable brain function.
Strengths:
This study employes multiple, complementary research approaches including behavioral assays, sh-RNA based localized knockdown, single-unit recordings, and patterned optogenetic interventions to examine the role of activity in the mediodorsal thalamus in the sedative-hypnotic effects of alcohol. Experiments and analysis included in the manuscript generally appear well conceived and generally well executed. Sample sizes are sufficiently large and statistical analysis appears generally appropriate. The findings presented are novel and provide interesting insight into the role of the thalamus as well as voltage gated calcium channels within this region in controlling behavioral state-transitions induced by alcohol. In particular, the observed effects of selective knockout along with recordings in total knockout oof the voltage gated calcium channel, Cav3.1, which has previously been implicated in bursting dynamics as well as state transitions, particularly in sleep, together suggest that the transition of thalamic neurons to a bursting pattern of firing from a more constant firing is important for transition to the sedated state produced by ethanol intoxication. While previous studies have similarly implicated Cav3.1 bursting in behavioral state-transitions, the direct optogenetic interventions and single-unit recordings provide valuable new insight. These findings may also have valuable implications for the relationship between sleep process disruption associated with ethanol dependence.
Weaknesses:
While the authors have made substantial improvements to the analysis and presented important additional results, some of the methods given in the supplemental are still somewhat minimal in their description of the methods employed. In addition, the text of the manuscript still has multiple problematic issues with writing and editing that should be addressed. Such writing issues appear throughout the manuscript including in the abstract as well as in all other sections. While they do not reduce the value of the findings presented, they do make them more difficult to understand and so should be corrected.
-
Reviewer #2 (Public review):
This study explores the role of the mediodorsal thalamus (MD) and the T-type calcium channel Cav3.1 in ethanol-induced behavioral changes, focusing on transitions between sedation and shifts in brain-states. The authors utilize genetic knockdown, optogenetic manipulation, and electrophysiological recording techniques in mice to assess the contribution of MD Cav3.1 channels to ethanol's sedative effects. The central hypothesis is that Cav3.1-mediated burst firing in the MD is essential for regulating ethanol-induced sedation and arousal transitions.
The authors' detailed responses to reviewers' comments significantly improved the manuscript, particularly regarding experimental specificity and methodological transparency. They addressed concerns about the specificity of MD knockdowns versus neighboring thalamic nuclei by adding quantifications, enhancing figure clarity, and providing lesion localization data. The revised figures, with added quantification panels, strengthened the claim that the manipulations specifically targeted the MD. Improvements in lesion validation figures and electrode placement explanations further clarified the accuracy of their methods.
One major limitation, as highlighted by Reviewer 1, is the lack of direct evidence from inhibitory optogenetic studies to validate the role of Cav3.1 channels in modulating ethanol-induced transitions in the MD. While the authors acknowledged the challenges of such experiments, citing technical issues like the inability of Cav3.1 knockout to allow rebound burst firing, the absence of these controls limits definitive causal conclusions about the MD's role. Alternative experiments with varying ethanol doses and data on tonic versus burst firing were presented, but these do not fully compensate for the missing inhibitory optogenetics, leaving some uncertainty regarding the attribution of observed behavioral effects solely to Cav3.1-mediated burst activity in the MD.<br /> Another challenge is the complexity of distinguishing the specific contribution of the MD from that of other thalamic nuclei involved in regulating arousal and brain-states. Although additional quantification was provided to demonstrate MD specificity, control experiments targeting adjacent regions like the central lateral nucleus (CL) would have strengthened the manuscript. While the practical constraints are understandable, this limitation slightly weakens the argument regarding the MD's unique role in state transitions. The provided explanations about spatial targeting and electrophysiological methods were reasonable, but a broader set of thalamic controls would have offered a more comprehensive understanding.
Overall, the authors successfully achieved their aims, providing strong evidence that Cav3.1-mediated burst firing in the MD is crucial for ethanol-induced sedation. The knockdown experiments showed a clear reduction in ethanol sensitivity, and the behavioral assays supported the conclusion that MD Cav3.1 activity plays a key role in regulating arousal states. The combined use of Cav3.1 knockdown and optogenetic stimulation effectively linked MD activity to ethanol-induced behavioral changes. The evidence presented establishes a clear mechanistic connection between neuronal activity and behavioral responses.
The expanded discussion and clarifications in response to reviewer feedback enhanced the manuscript's coherence, and the revisions to the figures improved the transparency of the findings. Despite not implementing all the additional experiments suggested by Reviewer 1, the authors provided sufficient alternative evidence and a clear explanation of practical limitations, making their conclusions credible given the available data.
This study significantly advances our understanding of thalamic involvement in behavioral state transitions, particularly ethanol-induced sedation. By clarifying the role of Cav3.1-mediated burst firing in the MD, the research provides new insights into how specific neuronal activity patterns influence global brain states and behavioral arousal, which has implications for understanding mechanisms underlying anesthesia, sedation, and sleep regulation. Moreover, the transparency in data sharing and detailed methodological revisions make this work a valuable resource for replication or adaptation in similar studies.
-
Author response:
The following is the authors’ response to the original reviews.
Public Reviews:
Reviewer #1 (Public Review):
Summary:
This is an interesting and valuable study that uses multiple approaches to understand the role of bursting involving voltage-gated calcium channels within the mediodorsal thalamus in the sedative-hypnotic effects of alcohol. Given its unique functional roles and connectivity pattern, the idea that the mediodorsal thalamus may have a fundamental role in regulating alcohol-induced transitions in consciousness state would be both important for researchers investigating thalamocortical dynamics and more broadly interesting for understanding brain function. In addition, the author's examination of the role of the voltage-gated calcium channel Cav3.1 provides some evidence that burst-firing mediated by this channel in the thalamus is functionally important for behavioral-state transitions. While many previous studies have suggested an analogous role for sleep-state regulation, the evidence for an analogous role of this type of bursting in sedative-induced transitions is more limited. Despite the importance of these results, however, there is some concern that the manipulations and recording approaches employed by the authors may affect other thalamic nuclei adjacent to the MD, such as the central lateral nucleus, which has also been implicated in controlling state transitions. The evidence for a specific role of the mediodorsal thalamus is therefore somewhat incomplete, and so additional validation is needed.
Strengths:
This study employs multiple, complementary research approaches including behavioral assays, sh-RNAbased localized knockdown, single-unit recordings, and patterned optogenetic interventions to examine the role of activity in the mediodorsal thalamus in the sedative-hypnotic effects of alcohol. Experiments and analyses included in the manuscript generally appear well conceived and are also generally well executed. Sample sizes are sufficiently large and statistical analysis appears generally appropriate though in some cases additional quantification would be helpful. The findings presented are novel and provide some interesting insight into the role of the thalamus as well as voltage-gated calcium channels within this region in controlling behavioral state transitions induced by alcohol. In particular, the observed effects of selective knockout along with recordings in total knockout of the voltage-gated calcium channel, Cav3.1, which has previously been implicated in bursting dynamics as well as state transitions, particularly in sleep, together suggest that the transition of thalamic neurons to a bursting pattern of firing from a more constant firing is important for transition to the sedated state produced by ethanol intoxication. While previous studies have similarly implicated Cav3.1 bursting in behavioral state transitions, the direct optogenetic interventions and single-unit recordings provide valuable new insight. These findings may also have interesting implications for the relationship between sleep process disruption associated with ethanol dependence, although the authors do not appear to examine this directly or extensively discuss these implications of their findings.
Weaknesses:
A key claim of the study is that the mediodorsal thalamus is specifically important for the sedative-hypnotic effect of ethanol and that a transition to a bursting pattern of firing in this circuit facilitates these effects due to a loss of a more constant tonic firing pattern. Despite the generally clear observed effects across the included experiments, however, the evidence presented does not fully support that the mediodorsal thalamus, in particular, is involved. This distinction is important because some previous studies have suggested that another thalamic nucleus which is very close to the mediodorsal thalamus, the central-lateral thalamus, has previously been suggested to play a role in preventing sedative-induced transitions. Despite its proximity to the mediodorsal thalamus, the central-lateral thalamus has a substantially different pattern of connectivity so distinguishing which region is impacted is important for understanding the findings in the manuscript. While sh- RNA knockdown appears to be largely centered in the mediodorsal thalamus in the example shown, (Figure 2) this is rather minimal evidence and it is also not well explained (indeed, the relevant panels do not even appear to be referenced in the text of the manuscript) and the consistency of the knockdown targeting is not quantified. Additional evidence should be provided to validate this approach. Similarly, while an example is shown for the expression of ChR2 (Fig. 5) there seems to be some spread of expression outside of the mediodorsal thalamus even in his example raising a concern about how regionally specific this effect.
The recordings targeting the mediodorsal thalamus could provide evidence of a direct association between changes in activity specifically in this part of the thalamus with the behavioral measures but there are currently some issues with making this link. One difficulty is that, although lesions are shown in Figure S5 to validate recording locations, this figure is relatively unclear and the examples appear to be taken from a different anterior/posterior location compared to the reference diagram. A larger image and improved visualization of the overall set of lesion locations that includes multiple anterior/posterior coronal sections would be helpful. Moreover, even for these example images, it is difficult to evaluate whether these are in the mediodorsal thalamus, particularly given the small size of the image shown. Ideally, an example image that is more obviously in the mediodorsal thalamus would also be included. Finally, an assessment of the relationship between the approximate locations of recorded neurons across the tetrode arrays and the behavioral measures would be very helpful in supporting the unique role of the mediodorsal thalamus. The lack of these direct links, in combination with the histological issues, reduces the insight that can be gained from this study.
In addition to the key experimental issues mentioned above, there are often problems in the text of the manuscript with reasoning or at least explanation as well as numerous minor issues with editing. The most substantial such issue is the lack of clarity in discussing the mediodorsal thalamus and other adjacent thalamic nuclei, such as the central-lateral nucleus, in the author's discussion of previous findings. Given that at last one of the manuscripts cited by the authors (Saalman, Front. Sys. Neuro. 2014) has directly claimed that central-lateral, rather than the mediodorsal, thalamus is important for arousal regulation related to a conscious state, this distinction should be addressed clearly in the discussion rather than papered over by grouping multiple thalamic nuclei as being medial. As part of this discussion, it would be important to consider additional relevant literature including Bastos et al., eLife, 2021 and Redinbaugh et al., Neuron, 2020 which are quite critical but currently do not appear to be cited. Considering additional literature relevant to the function of the mediodorsal thalamus would also be beneficial. While the methods employed generally seem sound, the description in the methods section is lacking in detail and is often difficult to follow. Analysis methods such as the burst index appear to only be given a brief explanation in the text and appear not to be mentioned in the methods section. Similarly, the staining method used in Figure 2 does not appear to be described in the methods section. The most substantial case is for the UMAP approach used in Figure 4-E which does not appear to be described in the methods or even described in the main text. The lack of detailed descriptions makes it difficult to evaluate the applicability and quality of the experimental and analytical approaches. Citations justifying the use of methods such as the approach to separate regular spiking and narrow spiking neuron subtypes are also needed.
Beyond the problems with content and reasoning discussed above, there are also some relatively minor issues with the clarity of writing throughout the paper (for example, in the abstract the authors refer to "the ethanol resistance behavior in WT mice" but it is difficult to parse what they mean by this statement. Similarly, the next sentence "These results support that the maintenance..." while clearer, is not well phrased. Though individually minor, issues like this re-occur throughout the manuscript and sometimes make it difficult to follow so the text should be revised to correct them. There are also some problems with labels such as the labels of A1/A2 in Figure 4, which appear to be incorrect. Also, S7 has no label] on the B panels. Finally, some references are not included (only a label of [ref]).
Reviewer #2 (Public Review):
In the current study, Latchoumane and collaborators focus on the Cav3.1 calcium channels in the mediodorsal thalamic nucleus as critical players in the regulation of brain-states and ethanol resistance in mice. By combining behavioural, electrophysiological, and genetic techniques, they report three main findings. First, KO Cav3.1 mice exhibit resistance to ethanol-induced sedation and sustained tonic firing in thalamocortical units. Second, knocked-down Cav3.1 mice reproduce the same behaviour when the mediodorsal, but not the ventrobasal, thalamic nucleus is targeted. Third, either optogenetic or electric stimulation of the mediodorsal thalamus reduces ethanol-induced sedation in control animals.
Overall, the study is well designed and performed, correctly controlled for confounds, and properly analysed. Nonetheless, it is important to address some aspects of the report. The results support the conclusions of the study. These results are likely to be relevant in the field of systems neuroscience, as they increase the molecular evidence showing how the thalamus regulates brain states.
Reviewer #1 (Recommendations For The Authors):
Aside from the additional quantification and clarification of the analysis discussed in the weakness section, in general, the experiments included in the manuscript seem reasonable. However, I would suggest one additional experiment as well as one control, both of which are relatively straightforward optogenetic experiments, that I feel would be helpful to further improve the study. First, as the authors note, the optogenetic interventions used do not directly address the relevance of the changes in bursting patterns observed in the knockout (KO), which are by far the most robust effect, with the changes in alcohol sensitivity. One approach that could help address this would be to use patterned suppression via inhibitory opsins (e.g. halorhodopsin) to "rescue" the periods of inhibition associated with bursting in the KO. Localizing this inhibition to the mediodorsal thalamus would also lend further credence to their claim that this nuclei is the relevant circuit for their observed effects. For the control, tonic activation of the ventrobasal nucleus, as the authors did for the mediodorsal nucleus, would be beneficial to rule out the possibility that the observed effect would occur with any thalamic nucleus. In addition to these experiments, I did not note the strategy for sharing data obtained through this study so this should be added.
R1 – 1: A key claim of the study is that the mediodorsal thalamus is specifically important for the sedative-hypnotic effect of ethanol and that a transition to a bursting pattern of firing in this circuit facilitates these effects due to a loss of a more constant tonic firing pattern. Despite the generally clear observed effects across the included experiments, however, the evidence presented does not fully support that the mediodorsal thalamus, in particular, is involved. This distinction is important because some previous studies have suggested that another thalamic nucleus which is very close to the mediodorsal thalamus, the central-lateral thalamus, has previously been suggested to play a role in preventing sedative-induced transitions. Despite its proximity to the mediodorsal thalamus, the central-lateral thalamus has a substantially different pattern of connectivity so distinguishing which region is impacted is important for understanding the findings in the manuscript.
R1-A1: The reviewer is right that CL has been pointed as another candidate structure with causal influence on arousal and consciousness. We have focused our efforts in including only recording single units that were from tetrode located in the MD specifically using the lesion code we explain in the method section and in response to R1 question#3. We also produced a quantification of Cav3.1 knock-down that clearly demonstrates that the KD experiment was itself specific to MD, bilaterally, and that CL to CM were minimally impacted by the knock-down process (Fig. 2C and D). Moreover, the optogenetic (fiber incidence was 30 degrees guaranteeing a central coverage rather than lateral; Fiber optic NA = 0.22) and electric stimulation (bipolar twisted electrodes, 50uA) experiments were also very selective and specific to the MD (Fig.S5). It remains clear that MD might not be the sole structure involved in the brain state control towards sedation and “anesthetic states”, and CL might be a significant contributor as well, however, we show that CL manipulations were rather irrelevant in our experiments (Fig. 2, S5, S9 and S11).
R1-2: While sh-RNA knockdown appears to be largely centered in the mediodorsal thalamus in the example shown, (Figure 2) this is rather minimal evidence and it is also not well explained (indeed, the relevant panels do not even appear to be referenced in the text of the manuscript) and the consistency of the knockdown targeting is not quantified. Additional evidence should be provided to validate this approach.
R1-A2: In order to address this important question, we have created an additional panel quantification to fig2D. We have then quantified the intensity per area of Cav3.1 expression in sub zones of 4 regions of interest: MD (left, right; 2 subzones each), Centro Medial (CM; 1 subzones in total), Centrolateral/Paraventricular nucleus (CL/PCN; left, right; 2 subzones each) and the submedial nucleus (SMT; left, right; used as a control for the intensity normalization; 1 subzones in total). This panel clearly illustrates that MD was knocked-down bilaterally (p<0.001). Moreover, CM (p<0.05) and CL (p<0.01) were also partially and unilaterally knocked down, as well. This analysis confirms that our KD had a high specificity to MD.
We added the relevant figure caption and text:
[Result section, Cav3.1 silencing in the MD, but not VB, increased ethanol resistance in mice, paragraph 3]
“We then characterized the change in Cav3.1 expression following the shControl and shCav3.1 knockdown injections in three test regions MD (left and right), CM (centromedial nucleus) and CL (centrolateral nuclei, left and right side) and a negative control region SMT (submedial thalamic nuclei, left and right side). The average intensity was obtained from two coronal brain slices for each mice used in the experiment (see Methods sections, Cav3.1 Intensity quantification). Our results show that the targeting of the knockdown was very specific to the bilateral MD (p<0.001; Fig. 2D). We noted that the CM (p<0.05) and a marginal unilateral knock-down of the CL were also observed (p<0.01). Notably, we tested the correlation between the level of knock-down in MD and the total time in LOM and observed a significant association (Fig. 2D inset; R = 0.599, p = 0.018). This result highlights that the Cav3.1 knock-down was specific to MD and with an intensity associated with ethanol-induced loss of motion.”
R1-3: One difficulty is that, although lesions are shown in Figure S5 to validate recording locations, this figure is relatively unclear and the examples appear to be taken from a different anterior/posterior location compared to the reference diagram. A larger image and improved visualization of the overall set of lesion locations that includes multiple anterior/posterior coronal sections would be helpful. Moreover, even for these example images, it is difficult to evaluate whether these are in the mediodorsal thalamus, particularly given the small size of the image shown. Ideally, an example image that is more obviously in the mediodorsal thalamus would also be included. Finally, an assessment of the relationship between the approximate locations of recorded neurons across the tetrode arrays and the behavioral measures would be very helpful in supporting the unique role of the mediodorsal thalamus.
R1-A3: Related to fig.S5, we re-distributed the position of the recordings from the tetrode electrode burned positions over 3 representative coronal planes that best represent the implant positions. We also provided additional snapshots of tetrode location. To identify the positions of four tetrodes in each animal, we encoded the positions with different electrical lesion strategies as follows: 1 lesion(tetrode 1), 2 lesions while we redrew the tetrode with 100 um interval (tetrode 2), 3 lesions with 200um interval (tetrode 3), 4 lesions with 50um intervals (tetrode4). Tetrodes that were found outside of the MD delimited region were discarded post analysis. A straight relationship between the closeness of the electrode is unfortunately not possible for tetrode recording, a straight silicone probe which maintains the spatial spacing in recording would have been a better approach in that case, but unfortunately, it was not performed in our study.
R1-4: In addition to the key experimental issues mentioned above, there are often problems in the text of the manuscript with reasoning or at least explanation as well as numerous minor issues with editing. The most substantial such issue is the lack of clarity in discussing the mediodorsal thalamus and other adjacent thalamic nuclei, such as the central-lateral nucleus, in the author's discussion of previous findings. Given that at last one of the manuscripts cited by the authors (Saalman, Front. Sys. Neuro. 2014) has directly claimed that central-lateral, rather than the mediodorsal, thalamus is important for arousal regulation related to a conscious state, this distinction should be addressed clearly in the discussion rather than papered over by grouping multiple thalamic nuclei as being medial. As part of this discussion, it would be important to consider additional relevant literature including Bastos et al., eLife, 2021 and Redinbaugh et al., Neuron, 2020 which are quite critical but currently do not appear to be cited. Considering additional literature relevant to the function of the mediodorsal thalamus would also be beneficial.
R1-A4: We thank the reviewer for his comments and suggestions. We agree that the added references mentioned by the reviewers are highly relevant and should be integrated in the manuscript. We have integrated the above-mentioned references and further developed on the discussion on the role of MD relative to other thalamic nuclei (ILN and CL in particular). We believe that this better-referenced and clarified text does improve the manuscript greatly.
[introduction section, paragraph 3]
“The centrolateral (CL) thalamic nucleus has been implicated in the modulation of arousal, behavior arrest 31, and improvement of level of consciousness during seizures 32. Notably, the direct electrical stimulation of the intralaminar nuclei (ILN) and, in particular CL, promoted hallmarks of arousal and awakening in primate under propofol and ketamine propofol anesthesia.”
[Discussion section, paragraph 1]
“In this work, we identified that the neural activity in MD plays a causal role in the maintenance of consciousness. Whole body Cav3.1 KO and MD-specific Cav3.1 KD mice showed resistance to loss of consciousness induced by hypnotic dose of ethanol. In WT mice, MD neurons demonstrated a reduced firing rate in natural (sleep) and ethanol-induced unconscious states compared to awake states. This neural activity reduction was impaired in KO mice. In particular, transition to an unconscious state was accompanied with a switch of firing mode from tonic firing to burst firing in WT mice whereas this modeshift disappeared in KO mice. Finally, optogenetic or electric stimulations of the MD after ethanol injection were sufficient to induce a resistance to loss of motion, supporting that the level of neural firing in the MD is critical to maintain conscious state and delay unconscious state. We showed that the expression of Cav3.1 t-type calcium channels in MD is a cellular modulator associated with this effect.”
[Discussion section, MD is a modulator of consciousness, paragraph 2 and 3]
“The MD is known to innervate limbic region, basal ganglia and medial prefrontal cortex 50 and increased activity in MD might modulate the stability of cortical UP states (e.g. awaken, aroused and attentive states) and synchronization 9,26. Thus, MD might be a major hub involved in cortical state control and brain state stabilization.
Supporting the brain state stabilization theory and the ethanol resistance of Cav3.1 mutants, Choi et al.34 demonstrated that the loss of Cav3.1 T-type calcium channel reduced the bilateral coherence between PFC and MD under ketamine anesthesia and ethanol hypnosis, especially in the delta frequency bands. More importantly, under propofol anesthesia, Bastos et al.35 showed that intralaminar nucleus and MD stimulation lead to increased wake-up subscore and arousal, together with an increased in cortico-cortico and thalamo-cortical slow (delta) frequency power.
In the present study, we observed that MD KD (Fig. 2A), but not VB KD (Fig. S3) of Cav3.1 increased and is associated (Fig. 2D) with ethanol resistance in mice. We found that MD neurons in Cav3.1 mutant mice exhibited tonic firing within range of wakefulness (Fig. 3 and 4), indicative of resistance to ethanol and wake-like brain state. In addition, we found a strong association between the normalized tonic firing in MD and the arousal through brain states (i.e. walk to wake to sleep states), supporting that MD tonic firing could be interpreted both as a thalamic readout and a modulator of the brain state 11 (Fig. 3). Finally, direct optogenetic and electric MD stimulation increased resistance to loss of consciousness in WT mice (Fig.5 and Fig. S10). To our knowledge, this is the first report demonstrating the causal involvement of mediodorsal thalamic nucleus in the modulation of wakefulness and the resistance to ethanol-induced loss of consciousness in mice.”
R1-5: While the methods employed generally seem sound, the description in the methods section is lacking in detail and is often difficult to follow. Analysis methods such as the burst index appear to only be given a brief explanation in the text and appear not to be mentioned in the methods section.
R1-A5: We have added a clear definition in the supplementary method following the original work used:
[Supplementary Method section, Single Unit recording, sorting and analysis, last paragraph]
“The bursting index was derived as described in (Royer et al. 2012). Namely, the burst index was estimated from the spike auto-correlogram (1-ms bin size) by subtracting the mean value between 40 and 50 ms (baseline) from the peak measured between 0 and 10 ms. Positive burst amplitudes were normalized to the peak and negative amplitudes were normalized to the baseline to obtain indexes ranging from −1 to 1.” We also edited its mention in the text for clarity:
[Result section, Lack of Ca3.1 in MD neurons removes thalamic burst in NREM sleep, paragraph 2]
“[…] and a clear reduction in total bursting represented as bursting index (Fig. 3-B; ratio of spikes count <10 ms and >50 ms based on auto-cross-correlogram).”
R1-6: Similarly, the staining method used in Figure 2 does not appear to be described in the methods section.
R1-A6: The staining method can be found in the supplementary method of the paper. [supplementary method, Immunohistochemistry]
R1-7: The most substantial case is for the UMAP approach used in Figure 4-E which does not appear to be described in the methods or even described in the main text.
R1-A7: Regarding the method, the UMAP approach is described in the supplementary method document [Uniform Manifold Approximation and Projection (UMAP)]. We believe that only a succinct description was needed here considering the extent of the analysis. Regarding the inserts in the main text, we agree that the main text was lacking the description of these results and we have amended the main text to reflect a clear description of this result and what it entails. The following paragraph was added:
[Result section, Under ethanol, MD neurons lacking Cav3.1 show no burst and a wake state-like neural activity, second to last paragraph]
“Finally, we asked whether the firing modes and properties (tonic firing rate, burst firing rate; see supplementary methods) of single MD neurons would form distinct qualitative representation of “brain stages” using a lowered dimensional UMAP representation (Uniform Manifold Approximation and Projection42 ). We observed that for awake and active (i.e. walk), the brain state representation formed two adjacent clusters that confounded both wild and mutant neurons (Fig. 4E, left panel). The REM and NREM states, the wild type neurons formed 2 additional interconnected clusters, whereas the mutant neurons tend to overlap with the clusters attributed to the “awake” brain state (Fig. 4E, second to left panel). Ethanol induced fLOM, similarly to REM and NREM clusters, was distinct from awake clusters in wild type mice and overlapped with the NREM clusters (Fig. 4E, third to left panel). Here also, mutant MD neurons showed overlap with the awake clusters rather than the “low consciousness” brain states. These results indicate that the firing mode and properties could define a brain state representation that shows distinctions in levels of consciousness. Moreover, the mutant showed a representation of “low consciousness” states overlapping with wild type “awake” states consistent with the hypothesis of resistance to loss of consciousness.”
R1-8: Citations justifying the use of methods such as the approach to separate regular spiking and narrow spiking neuron subtypes are also needed.
R1-A8: We have added two references related to the observation of the two subpopulations of spiking neurons [Schiff and Reyes, 2012; Destexhe, 2008].
R1-9: Beyond the problems with content and reasoning discussed above, there are also some relatively minor issues with the clarity of writing throughout the paper (for example, in the abstract the authors refer to "the ethanol resistance behavior in WT mice" but it is difficult to parse what they mean by this statement.
R1-A9: We addressed this issue by editing and revising the manuscript for clarity and flow.
R1-10: Similarly, the next sentence "These results support the maintenance..." while clearer, is not well phrased. Though individually minor, issues like this re-occur throughout the manuscript and sometimes make it difficult to follow so the text should be revised to correct them.
R1-A10: We thank the reviewer for highlighting this point. We have edited the overall text to improve clarity and flow.
[abstract]
These results suggest that maintaining MD neural firing at a wakeful level is sufficient to induce resistance to ethanol-induced hypnosis in WT mice.
R1-11: There are also some problems with labels such as the labels of A1/A2 in Figure 4, which appear to be incorrect.
R1-A11: We noted this issue and have rectified the figure for clarity.
R1-12: Also, S7 has no label on the B panels.
R1-A12: We thank the reviewer for pointing out this lack. We have added the y-label on the panel for clarity.
R1-13: Finally, some references are not included (only a label of [ref]).
R1-A13: We have completed the missing reference and thank the reviewer for pointing that out.
Additional comments
R1-14: Aside from the additional quantification and clarification of the analysis discussed in the weakness section, in general, the experiments included in the manuscript seem reasonable. However, I would suggest one additional experiment as well as one control, both of which are relatively straightforward optogenetic experiments, that I feel would be helpful to further improve the study. First, as the authors note, the optogenetic interventions used do not directly address the relevance of the changes in bursting patterns observed in the knockout (KO), which are by far the most robust effect, with the changes in alcohol sensitivity. One approach that could help address this would be to use patterned suppression via inhibitory opsins (e.g. halorhodopsin) to "rescue" the periods of inhibition associated with bursting in the KO.
R1-A14: Here the reviewer proposes an interesting experiment which we have attempted to perform, however, poses several technical challenges. First, the KO do not have burst firing as they are depleted from Cav3.1 low-threshold calcium channel. Therefore, under ethanol, even if there might exist a rhythmic inhibition that activates Cav3.1 channels and causes a rebound burst, the KO are unable to have it. Therefore, an optogenetic inhibition would only accentuate the total inhibition and could potentially induce an overall decrease in MD firing, resulting in an increase in LOM features. Alternatively, we showed that in a WT with low ethanol dose (where LOM induction is harder), the increased rhythmic inhibition does indeed increase significantly LOM duration and marginally decreases latency to LOM (Fig. S12), indicating that increased inhibition could indeed explain the hypothesis: “ the stronger the decrease in MD firing, the faster and longer the LOM.” The only caveat of using WT here is that optogenetic inhibition might also include rebound burst post-inhibition. Injecting bursts only did not alter the response to ethanol (Fig. S10). These results point to the role of loss of firing in MD as a main factor for LOM, and potentially the contribution of burst necessitating a concurrent inhibition/loss of firing.
We agree that inhibition in KO would further validate this hypothesis, controlling for the role of burst. We regret that we are not in the capacity to perform additional experiments involving the KO mice.
R1-15: For the control, tonic activation of the ventrobasal nucleus, as the authors did for the mediodorsal nucleus, would be beneficial to rule out the possibility that the observed effect would occur with any thalamic nucleus.
R1-A15: We agree with the reviewer that we could have added an additional region control to the gain/loss of function experiments. We would even go further as to suggest that a better control nucleus would be a high order nucleus such as PO or an unrelated sensory relay nucleus such as LGN. VB being a motor relay nucleus, could also mediate movement initiation, which could be hard to interpret. Since the complete control study for all thalamic nuclei Cav3.1 KD is outside the scope of this study, we opted not to redo these experiments and keep the focus of the manuscript on the manipulation of MD activity rather than the various available thalamic nuclei. We also do not claim that MD is the sole center able to initiate a switch in the loss of consciousness, and a more in-depth study on that matter would be clearly needed.
R1-16: In addition to these experiments, I did not note the strategy for sharing data obtained through this study so this should be added.
R1-A16: We have uploaded data and code for most figures at the following repository and provided a clearer statement regarding data sharing. We thank the reviewer for pointing out this missing element.
The link for the repository is the following:
It contains:
- Excel spreadsheet file of all behavior values, including the newly quantified Cv3.1 expression in MD/CL/SMT
- Excel spreadsheet follow-up of all MD cells (single unit; tetrode) analyzed
- Folders for all groups studied with representative figures showing EEG power over time and normalized activity (WT vs KO for 2, 3 and 4 g/kg; MDshKD vs shCTR, VBshKD vs shCTR; CHR2 NOSTIM vs STIM; ESTIM Groups and ARCH NOSTIM vs STIM)
- A1G LORRvsLOM and OPEN FIELD Matlab data
- Matlab and ImageJ Codes: single unit analysis, characterization, brain state characterization, sleep stages, LOM, open field analysis and statistical analysis.
We have added the data sharing subsection in the acknowledgements:
“Part of the analyzed data and codes are available on the open access platform, mendeley:
Latchoumane, Charles-francois (2024), “Mediodorsal thalamic nucleus mediates resistance to ethanol through Cav3.1 T-type Ca2+ regulation of neural activity”, Mendeley Data, V1, doi: 10.17632/7fr427426m.1
Additional data (large size recording and images) can be provided upon reasonable requests.”
Reviewer #2 (Recommendations For The Authors):
R2-1. Consciousness is a contentious subject. Even in humans, there is still intense research on the topic, not to mention animals, about which we still know very little. Moreover, consciousness is not quantified in this study, as there is no standard metric to do so. Accordingly, talking about 'modulation', 'transition', ́level ', or 'reduction' of consciousness can be misleading. Hence, it is probably safer to strictly refer to brain-states and/or stages of the sleep-wake cycle in this study and reframe it entirely around these concepts.
R2-A1. The reviewer points to an important point and we appreciate this highlight. Agreeing that the definition of consciousness is rather loose and arguably difficult to pinpoint. Here, we settle on a definition that relies on the loss of motion and loss of righting reflex. This definition is widely accepted as the “verified” state in which the absence of responsiveness (to continuous stimuli, inducing reflex or discomfort) is observed and uninterrupted by jerks and spurious movements. Additional metrics needed would be the recording of EMG to quantify atonia and EEG to the settling of a dominantly slow-wave frequency (~4 Hz; ethanol-induced sedation at theta rhythm), as shown in Fig S1A. The driver of this 4Hz frequency and its correlation has been investigated previously (e.g. Choi et al, PNAS, 2012), leading to the accepted link between LOM/LORR and loss of consciousness. Our data present the advantage of showing single neuron recordings and that LOM is a state where the lowest firing activity is present (Fig S7AB) and comparable to deep sleep state activity (Fig3D). The first LOM is the most important as it highlights the deepest loss of consciousness before the ethanol starts to be metabolized and cleared, which would be consistent between animals.
As a result, we have edited the manuscript to clarify all mentions related to brain states and states of unconsciousness.
R2-2. It is not clear why the authors focus on the mediodorsal nucleus. This should be better explained in the introduction and developed in the discussion.
R2-A2. This comment converges with the Reviewer 1 comments and we are addressing this lack in the discussion as suggested. We have addressed it with this previous comment and believe it is now clearer.
R2-3. The discussion mentions that 'increased activity in MD might modulate the stability of cortical UP state and synchronization' (pg 21). This point should be either further developed and put into context, or removed. In its current state, it does not seem to contribute much to the discussion of results.
R2-A3. We understand that the working “UP state” might not be clear enough. We have modified this sentences as follows to clarify that UP state could be either a state of where the animal is awake, aroused or attentive:
[Discussion section, MD is a modulator of consciousness, first paragraph]
“The MD is known to innervate limbic region, basal ganglia and medial prefrontal cortex 50 and increased activity in MD might modulate the stability of cortical UP states (e.g. awaken, aroused and attentive states) and synchronization 9,26. Thus, MD might be a major hub involved in cortical state control and brain state stabilization.“
R2-4. The discussion states that 'mutant mice did not exhibit a decreased arousal level (i.e. increased locomotor activity)' (pg 23). This is confusing as decreased arousal should be reflected in decreased locomotor activity.
R2-A4. We understand that the formulation of this sentence may be confusing and we have edited this portion of the text to improve quality in the revised version of the manuscript. To clarify, mutant mice do not exhibit reduced or increased arousal (not quantified, just observational), they do have a phenotypic hyperlocomotion. This comes in contrast with a lower basal firing rate in the MD, which in our interpretation, is not synonymous with lower arousal. We believe that the relative change in MD determines the change in arousal, and that the absolute firing is not indicative of arousal in itself, only in comparison.
[Discussion section, The lower variability in MD Firing reflects Ethanol Resistance in Cav3.1 mutant mice, paragraph 2]
“Mutant RS neurons in MD showed an overall lower excitability and variability of firing in various natural conscious and unconscious states compared to wild type mice. Remarkably, Cav3.1 mutant mice exhibited a clear increased locomotor activity and an increased resistance to ethanol. The general lower firing rate and the high “arousal” observed in mutant mice suggests that the relative change from state to state in tonic firing in MD, and not the absolute value of firing, might be a better correlate of change in brain state in the mice.”
R2-5. The methods (pg 27) state that two genetic backgrounds (129/svjae and C57BL/6J ) were used in the study. Authors should show whether there were significant differences between those backgrounds in the key parameters assessed in the study (particularly resistance to ethanol sedation).
R2-A5. As mentioned in the method section, we only used the F1-background mice, which are the firstgeneration offspring produced by crossing 129/svjae and C57BL/6J strains. To produce F1 KO mice, we kept the heterozygote mice in two strains. We unfortunately did not study the particular difference of the respective KO of these two backgrounds; however, the pure C57BL/6J KO has been used in other studies by our group (Kim et al 2001; Na et al, 2008; Park et al., 2010). The F1 background allows us to work with mice that are less aggressive and can be handled with less inherent stress.
R2-6. It would be convenient to produce a supplementary figure associated with Figure 1C to show the same data with averages per mouse. That is, 9 points for control and 9 points for KO mice. This also applies to all cases where data is not presented per mouse but pooled between animals.
R2-A6. We have added a panel C in Figure S1, to show the scatter values for all the mice corresponding to the figure 1C. We have also generalized this presentation for all behavior graphics showing all the animals in the scatter plot next to the boxplot. We believe that this presentation increases further the transparency of the manuscript. We have then added the scatter plot for all mice in figure Fig1, Fig2, Fig5, Fig.S2, Fig.S3, Fig.S10 and Fig.S12.
R2-7. It would be informative to make a supplementary figure associated with Figure 1D to compare baseline raw activity levels (i.e., baseline walking recording) between control and KO mice. That is, do KO and control mice cover comparable distances and at similar speeds during baseline conditions? Figure 1D and Figure 4A suggest that the variability of locomotor activity is larger in KO mice. Hence, this parameter should be quantified and reported.
R2-A7. We thank the reviewer for this comment. We strived to answer to this question in the manuscript in two ways:
- We first measure the overall hyperlocomotion of the mice using the open field total distance parkoured in our mice cohorts (FigS4C). We did observe that the KO mutant showed hyperlocomotion, but not MD or VB knock-down mice. Which indicates that the hyperlocomotion component is not specific to the two thalamic nuclei studied.
- Using the forced walking task, we impose on the animal to keep a steady pace of roughly 6cm/s. This assay allows to normalize the general walking behavior to a relatively fixed pace making it comparable for all animals.
The reviewer suggested reporting the mean and variance in walking of WT and KO during baseline (prior to the ethanol I.P. injection). We believe that the two points mentioned above are sufficient to describe in a more quantitative way the WT vs KO locomotion differences. Moreover, by construction the normalized locomotion on the forced walking task will return similar means for the baseline, the standard deviation would, however, potentially show differences but would remain inconclusive.
R2-8. The legend in Figure 1 states that 'the loss of consciousness is evaluated using normalized moving index using either video analysis (differential pixel motion), on- head accelerometer-based motion, or neck electromyograms'. Authors should clarify whether these methods are equivalent and support it with data.
R2-A8. We understand the reviewer point and we have made a few modifications to the method description aligning better with what was done. For most mice, video analysis was used to obtain the moving index. When video recording was not available (2 mice), we had an accelerometer attached to the animal’s head stage which helped us derive a moving index that was similar to the video moving index. The neck electromyogram was rather used for animals implanted with the tetrodes to identify sleep stages based on local field potential frequency and muscle tone. We have then clarified the method for this matter and Figure 1 to avoid this confusion. Since no concurrent recording of both video and accelerometer was performed, we do not have the data to compute the correlation between the two measures, however, no noticeable deviation from loss of motion was observed between the two methods. We realize that this may be a weak argument, however, our observations showed that video and accelerometers returned very similar timings for loss of motion (only a few comparative instances insufficient to present a statistical comparison).
R2-9. How were spike bursts defined? The authors should try different criteria and verify the consistency of results.
R2-A9 For in vivo single unit recording, we opted for a definition that is validated from our works and others as a silencing of at least 100 ms followed by a minimum of 3 spikes with:
- First spike pairs interspike interval less than 4 ms
- Remaining spike pairs interspike interval less than 20 ms
We have performed this analysis using a minimum of 2 spikes, and varied silencing periods between 50 and 100ms, without observing significant deviation of the results. As shown in Figure S6B, with this approach we observed that the burst distribution had a majority with <10 spikes per burst. Figure S6C indicated that with a clear distribution of ISI for first spike within 2-4ms as observed in previous works (Desai and Varela, 2021; Alitto et al, 2019), importantly, not clearly capped at 4 ms, showing that the range for the first ISI might indeed be lower than 4ms for thalamic burst. Within burst spike waveforms can become very variable and the choice of 3 over 2 spikes minimum per burst stems from the aim to reduce false positive detection of ultra-short bursts, which in single unit recording remains controversial (Gray et al. 1995).
Minor:
R2-10: Figure 4A2 'Cav3.1(+/+)' should presumably be Cav3.1(-/-).
R2-A10: this is correct and we have corrected the figure label [This sentence is ambiguous. What is ‘this’ that is correct?]
R2-11: Figure S2C legend states 'Post-hoc group comparison was performed using.' The sentence seems to be incomplete.
R2-A11: We have completed the sentence for clarity.
R2-12: In the methods (pg 29) virus concentration is reported as '107 TU/ul', which probably refers to 10e7.
R2-A12: We have corrected it by superscripting the power 7.
R2-13: Verify Fig 1C1 and correct Y-axis overlap between title and units.
R2-A13: We edited the figure for clarity, thank you.
R2-14: On page 24 there is a '[ref]' that probably stands for (a missing) reference.
R2-A14: the missing reference has been added.
-
-
www.biorxiv.org www.biorxiv.org
-
eLife Assessment
This important study investigates how AD(H)D affects attention using neural and physiological measures in a Virtual Reality (VR) environment. Solid evidence is provided that individuals diagnosed with AD(H)D differ from control participants in both the encoding of the target sound and the encoding of acoustic interference. The VR paradigm here can potentially bridge lab experiments and real-life experiments. However, the reviewers identified a few potential technical issues that will need to be verified and discussed.
-
Reviewer #1 (Public review):
Summary:
This is an interesting study on AD(H)D. The authors combine a variety of neural and physiological metrics to study attention in a VR classroom setting. The manuscript is well written and the results are interesting, ranging from an effect of group (AD(H)D vs. control) on metrics such as envelope tracking, to multivariate regression analyses considering alpha-power, gaze, TRF, ERPs, and behaviour simultaneously. I find the first part of the results clear and strong. The multivariate analyses in Tables 1 and 2 are good ideas, but I think they would benefit from additional clarification. Overall, I think that the methodological approach is useful in itself. The rest is interesting in that it informs us on which metrics are sensitive to group effects and correlated with each other. I think this might be one interesting way forward. Indeed, much more work is needed to clarify how these results change with different stimuli and tasks. So, I see this as an interesting first step into a more naturalistic measurement of speech attention.
Strengths:
I praise the authors for this interesting attempt to tackle a challenging topic with naturalistic experiments and metrics. I think the results broadly make sense and they contribute to a complex literature that is far from being linear and cohesive.
Weaknesses:
Nonetheless, I have a few comments that I hope will help the authors improve the manuscript. Some aspects should be clearer, some methodological steps were unclear (missing details on filters), and others were carried out in a way that doesn't convince me and might be problematic (e.g., re-filtering). I also suggested areas where the authors might find some improvements, such as deriving distinct markers for the overall envelope reconstruction and its change over time, which could solve some of the issues reported in the discussion (e.g., the lack of correlation with TRF metrics).
I also have some concerns regarding reproducibility. Many details are imprecise or missing. And I did not find any comments on data and code sharing. A clarification would be appreciated on that point for sure.
There are some minor issues, typically caused by some imprecisions in the write-up. There are a few issues that could change things though (e.g., re-filtering; the worrying regularisation optimisation choices), and there I'll have to see the authors' reply to determine whether those are major issues or not. Figures should also be improved (e.g., Figure 4B is missing the ticks).
-
Reviewer #2 (Public review):
Summary:
While selective attention is a crucial ability of human beings, previous studies on selective attention are primarily conducted in a strictly controlled context, leaving a notable gap in underlying the complexity and dynamic nature of selective attention in a naturalistic context. This issue is particularly important for classroom learning in individuals with ADHD, as selecting the target and ignoring the distractions are pretty difficult for them but are the prerequisites of effective learning. The authors of this study have addressed this challenge using a well-motivated study. I believe the findings of this study will be a nice addition to the fields of both cognitive neuroscience and educational neuroscience.
Strengths:
To achieve the purpose of setting up a naturalistic context, the authors have based their study on a novel Virtual Reality platform. This is clever as it is usually difficult to perform such a study in a real classroom. Moreover, various techniques such as brain imaging, eye-tracking, and physiological measurement are combined to collect multi-level data. They found that, different from the controls, individuals with ADHD had higher neural responses to the irrelevant rather than the target sounds, and reduced speech tracking of the teacher. Additionally, the power of alpha-oscillations and frequency of gaze shifts away from the teacher are found to be associated with ADHD symptoms. These results provide new insights into the mechanism of selective attention among ADHD populations.
Weaknesses:
It is worth noting that nowadays there have been some studies trying to do so in the real classroom, and thus the authors should acknowledge the difference between the virtual and real classroom context and foresee the potential future changes.
The approach of combining multi-level data has the advantage of obtaining reliable results, but also raises significant difficulty for the readers to understand the main results.
An appraisal of whether the authors achieved their aims, and whether the results support their conclusions.
As expected, individuals with ADHD showed anomalous patterns of neural responses, and eye-tracking patterns, compared to the controls. But there are also some similarities between groups such as the amount of time paying attention to teachers, etc. In general, their conclusions are supported.
A discussion of the likely impact of the work on the field, and the utility of the methods and data to the community, would highlight the contributions of the work.
The findings are an extension of previous efforts in understanding selective attention in the naturalistic context. The findings of this study are particularly helpful in inspiring teacher's practice and advancing the research of educational neuroscience. This study demonstrates, again, that it is important to understand the complexity of cognitive processes in the naturalistic context.
-
Reviewer #3 (Public review):
Summary:
The authors conducted a well-designed experiment, incorporating VR classroom scenes and background sound events, with both control and ADHD participants. They employed multiple neurophysiological measures, such as EEG, eye movements, and skin conductance, to investigate the mechanistic underpinnings of paying attention in class and the disruptive effects of background noise.
The results revealed that individuals with ADHD exhibited heightened sensory responses to irrelevant sounds and reduced tracking of the teacher's speech. Overall, this manuscript presented an ecologically valid paradigm for assessing neurophysiological responses in both control and ADHD groups. The analyses were comprehensive and clear, making the study potentially valuable for the application of detecting attentional deficits.
Strengths:
• The VR learning paradigm is well-designed and ecologically valid.
• The neurophysiological metrics and analyses are comprehensive, and two physiological markers are identified capable of diagnosing ADHD.
• This research provides a valuable dataset that could serve as a benchmark for future studies on attention deficits.
Weaknesses:
• Several results are null results, i.e., no significant differences were found between ADHD and control populations.
• Although the paradigm is well-designed and ecologically valid, the specific contributions or insights from the results remain unclear.
• Lack of information regarding code and data availability.
-
Author response:
We are glad that the reviewers found our work to be interesting and appreciate its contribution to enhancing ecological validity of attention research. We also agree that much more work is needed to solidify this approach, and that some of the results should be considered “exploratory” at this point, but appreciate the recognition of the novelty and scientific potential of the approach introduced here.
We will address the reviewers’ specific comments in a revised version of the paper, and highlight the main points here:
· We agree that the use of multiple different neurophysiological measures is both an advantage and a disadvantage, and that the abundance of results can make it difficult to tell a “simple” story. In our revision, we will make an effort to clarify what (in our opinion) are the most important results and provide readers with a more cohesive narrative.
· Important additional discussion points raised by the reviewers, which will be discussed in a revised version are a) the similarities and differences between virtual and real classrooms; b) the utility of the methods and data to the community and c) the implication of these results for educational neuroscience and ADHD research.
· In the revision, we will also clarify several methodological aspects of the data analysis, as per the reviewers’ requests.
· After final publication, the data will be made available for other researchers to use.
-
-
www.biorxiv.org www.biorxiv.org
-
eLife Assessment
This study describes a new analysis strategy to compare active neurons during behavioral tasks across the brain. This is significant because analysing how different brain areas are active during behavior requires better methods. The evidence provided in support of the method is solid. Although useful now, the work may increase its significance following appropriate revisions.
-
Reviewer #1 (Public review):
Summary:
In this manuscript, Jin et. al., describe SMARTR, an image analysis strategy optimized for analysis of dual-activity ensemble tagging mouse reporter lines. The pipeline performs cell segmentation, then registers the location of these cells into an anatomical atlas, and finally, calculates the degree of co-expression of the reporters in cells across brain regions. They demonstrate the utility of the method by labeling two ensemble populations during two related experiences: inescapable shock and subsequent escapable shock as part of learned helplessness.
Strengths:
(1) We appreciated that the authors provided all documentation necessary to use their method and that the scripts in their publicly available repository are well commented.
(2) The manuscript was well-written and very clear, and the methods were generally highly detailed.
Weaknesses:
(1) The heatmaps (for example, Figure 3A, B) are challenging to read and interpret due to their size. Is there a way to alter the visualization to improve interpretability? Perhaps coloring the heatmap by general anatomical region could help? We feel that these heatmaps are critical to the utility of the registration strategy, and hence, clear visualization is necessary.
(2) Additional context in the Introduction on the use of immediate early genes to label ensembles of neurons that are specifically activated during the various behavioral manipulations would enable the manuscript and methodology to be better appreciated by a broad audience.
(3) The authors mention that their segmentation strategies are optimized for the particular staining pattern exhibited by each reporter and demonstrate that the manually annotated cell counts match the automated analysis. They mention that alternative strategies are compatible, but don't show this data.
(4) The authors provided highly detailed information for their segmentation strategy, but the same level of detail was not provided for the registration algorithms. Additional details would help users achieve optimal alignment.
-
Reviewer #2 (Public review):
Summary:
This manuscript describes a workflow and software package, SMARTR, for mapping and analyzing neuronal ensembles tagged using activity-dependent methods. They showcase this pipeline by analyzing ensembles tagged during the learned helplessness paradigm. This is an impressive effort, and I commend the authors for developing open-source software to make whole-brain analyses more feasible for the community. Software development is essential for modern neuroscience and I hope more groups make the effort to develop open-source, easily usable packages. However, I do have concerns over the usability and maintainability of the SMARTR package. I hope that the authors will continue to develop this package, and encourage them to make the effort to publish it within either the Bioconductor or CRAN framework.
Strengths:
This is a novel software package aiming to make the analysis of brain-wide engrams more feasible, which is much needed. The documentation for the package and workflow is solid.
Weaknesses:
While I was able to install the SMARTR package, after trying for the better part of one hour, I could not install the "mjin1812/wholebrain" R package as instructed in OSF. I also could not find a function to load an example dataset to easily test SMARTR. So, unfortunately, I was unable to test out any of the packages for myself. Along with the currently broken "tractatus/wholebrain" package, this is a good example of why I would strongly encourage the authors to publish SMARTR on either Bioconductor or CRAN in the future. The high standards set by Bioc/CRAN will ensure that SMARTR is able to be easily installed and used across major operating systems for the long term.
The package is quite large (several thousand lines include comments and space). While impressive, this does inherently make the package more difficult to maintain - and the authors currently have not included any unit tests. The authors should add unit tests to cover a large percentage of the package to ensure code stability.
Why do the authors choose to perform image segmentation outside of the SMARTR package using ImageJ macros? Leading segmentation algorithms such as CellPose and StarMap have well-documented APIs that would be easy to wrap in R. They would likely be faster as well. As noted in the discussion, making SMARTR a one-stop shop for multi-ensemble analyses would be more appealing to a user.
Given the small number of observations for correlation analyses (n=6 per group), Pearson correlations would be highly susceptible to outliers. The authors chose to deal with potential outliers by dropping any subject per region that was> 2 SDs from the group mean. Another way to get at this would be using Spearman correlation. How do these analyses change if you use Spearman correlation instead of Pearson? It would be a valuable addition for the author to include Spearman correlations as an option in SMARTR.
I see the authors have incorporated the ability to adjust p-values in many of the analysis functions (and recommend the BH procedure) but did not use adjusted p-values for any of the analyses in the manuscript. Why is this? This is particularly relevant for the differential correlation analyses between groups (Figures 3P and 4P). Based on the un-adjusted p-values, I assume few if any data points will still be significant after adjusting. While it's logical to highlight the regional correlations that strongly change between groups, the authors should caution ¬ which correlations are "significant" without adjusting for multiple comparisons. As this package now makes this analysis easily usable for all researchers, the authors should also provide better explanations for when and why to use adjusted p-values in the online documentation for new users.
The package was developed in R3.6.3. This is several years and one major version behind the current R version (4.4.3). Have the authors tested if this package runs on modern R versions? If not, this could be a significant hurdle for potential users.
-
Author response:
Reviewer #1 (Public review):
Weaknesses:
(1) The heatmaps (for example, Figure 3A, B) are challenging to read and interpret due to their size. Is there a way to alter the visualization to improve interpretability? Perhaps coloring the heatmap by general anatomical region could help? We feel that these heatmaps are critical to the utility of the registration strategy, and hence, clear visualization is necessary.
We thank the reviewers for this point on aesthetic improvement, and we agree that clearer visualization of our correlation heatmaps is important. To address this point, we have incorporated the capability of grouping “child” subregions in anatomical order by their more general “parent” region into the package function, plot_correlation_heatmaps(). Parent regions will be visually represented as smaller sub-facets in the heatmaps, and we will be submitting our full revised manuscript with these visual changes.
(2) Additional context in the Introduction on the use of immediate early genes to label ensembles of neurons that are specifically activated during the various behavioral manipulations would enable the manuscript and methodology to be better appreciated by a broad audience.
We thank the reviewers for this suggestion and will be revising parts of our Introduction to reflect the broader use and appeal of immediate early genes (IEGs) for studying neural changes underlying behavior.
(3) The authors mention that their segmentation strategies are optimized for the particular staining pattern exhibited by each reporter and demonstrate that the manually annotated cell counts match the automated analysis. They mention that alternative strategies are compatible, but don't show this data.
We thank the reviewers for this comment. We also appreciate that integration with alternative strategies is a major point of interest to readers, given that others may be interested in compatibility with our analysis and software package, rather than completely revising their own pre-existing workflows.
This specific point on segmentation refers to the import_segmentation_custom()function in the package. As there is currently not a standard cell segmentation export format adopted by the field, this function still requires some data wrangling into an import format saved as a .txt file. However, we chose not to visually demonstrate this capability in the paper for a few reasons.
i. A figure showing the broad testing of many different segmentation algorithms, (e.g., Cellpose, Vaa3d, Trainable Weka Segmentation) would better demonstrate the efficacy of segmentation of these alternative approaches, which have already been well-documented. However, demonstrating importation compatibility is more of a demonstration of API interface, which is better shown in website documentation and tutorial notebooks.
ii. Additionally, showing importation with one well-established segmentation approach is still a demonstration of a single use case. There would be a major burden-of-proof in establishing importation compatibility with all potential alternative platforms, their specific export formats, which may be slightly different depending on post-processing choices, and the needs of the experimenters (e.g., exporting one vs many channels, having different naming conventions, having different export formats). For example, output from Cellpose can take the form of a NumPy file (_seg.npy file), a .png, or Native ImageJ ROI archive output, and users can have chosen up to four channels. Until the field adopts a standardized file format, one flexible enough to account for all the variables of experimental interest, we currently believe it is more efficient to advise external groups on how to transform their specific data to be compatible with our generic import function.
Internally, in collaborative efforts, we have validated the ability to import datasets generated from completely different workflows for segmentation and registration. We intend on releasing this documentation in coming updates on our package website, which we believe will be more demonstrative on how to take advantage of our analysis package, without adopting our entire workflow.
(4) The authors provided highly detailed information for their segmentation strategy, but the same level of detail was not provided for the registration algorithms. Additional details would help users achieve optimal alignment.
We apologize for this lack of detail. The registration strategy depends upon the WholeBrain package for registration to the Allen Mouse Common Coordinate Framework. While this strategy has been published and documented elsewhere, we will be revising our methods to better incorporate details of this approach.
Reviewer #2 (Public review):
Weaknesses:
(1) While I was able to install the SMARTR package, after trying for the better part of one hour, I could not install the "mjin1812/wholebrain" R package as instructed in OSF. I also could not find a function to load an example dataset to easily test SMARTR. So, unfortunately, I was unable to test out any of the packages for myself. Along with the currently broken "tractatus/wholebrain" package, this is a good example of why I would strongly encourage the authors to publish SMARTR on either Bioconductor or CRAN in the future. The high standards set by Bioc/CRAN will ensure that SMARTR is able to be easily installed and used across major operating systems for the long term.
We thank reviewers for pointing out this weakness; long-term maintenance of this package is certainly a mutual goal. Loading an .RDATA file is accomplished by either double-clicking directly on the file in a directory window, or by using the load() function, (e.g., load("directory/example.RData")). We will explicitly outline these directions in the online documentation and in our full revision.
Moreover, we will submit our package to CRAN. Currently, SMARTR is not dependent on the WholeBrain package, which remains optional for the registration portion of our workflow. Ultimately, this independence will allow us to maintain the analysis and visualization portion of the package independently, and allow for submission to a more centralized software repository such as CRAN.
(2) The package is quite large (several thousand lines include comments and space). While impressive, this does inherently make the package more difficult to maintain - and the authors currently have not included any unit tests. The authors should add unit tests to cover a large percentage of the package to ensure code stability.
We appreciate this feedback and will add unit testing to improve the reliability of our package in the full revision.
(3) Why do the authors choose to perform image segmentation outside of the SMARTR package using ImageJ macros? Leading segmentation algorithms such as CellPose and StarMap have well-documented APIs that would be easy to wrap in R. They would likely be faster as well. As noted in the discussion, making SMARTR a one-stop shop for multi-ensemble analyses would be more appealing to a user.
We appreciate this feedback. We believe parts of our response to Reviewer 1, comment 3, are relevant to this point. Interfaces for CellPose and ClusterMap (which processes in situ transcriptomic approaches like STARmap) are both in python, and currently there are ways to call python from within R (https://rstudio.github.io/reticulate/index.html). We will certainly explore incorporating these APIs from R. However, we would anticipate this capability is more similar to “translation” between programming languages, but would not currently preclude users from the issue of still needing some familiarity with the capabilities of these python packages, and thus with python syntax.
(4) Given the small number of observations for correlation analyses (n=6 per group), Pearson correlations would be highly susceptible to outliers. The authors chose to deal with potential outliers by dropping any subject per region that was> 2 SDs from the group mean. Another way to get at this would be using Spearman correlation. How do these analyses change if you use Spearman correlation instead of Pearson? It would be a valuable addition for the author to include Spearman correlations as an option in SMARTR.
We thank reviewers for this suggestion and will provide a supplementary analysis of our results using Spearman correlations.
(5) I see the authors have incorporated the ability to adjust p-values in many of the analysis functions (and recommend the BH procedure) but did not use adjusted p-values for any of the analyses in the manuscript. Why is this? This is particularly relevant for the differential correlation analyses between groups (Figures 3P and 4P). Based on the un-adjusted p-values, I assume few if any data points will still be significant after adjusting. While it's logical to highlight the regional correlations that strongly change between groups, the authors should caution which correlations are "significant" without adjusting for multiple comparisons. As this package now makes this analysis easily usable for all researchers, the authors should also provide better explanations for when and why to use adjusted p-values in the online documentation for new users.
We appreciate the feedback and will more explicitly outline that in our paper, our dataset is presented as a more demonstrative and exploratory resource for readers and, as such, we accept a high tolerance for false positives, while decreasing risk of missing possible interesting findings. As noted by Reviewer #2, it is still “logical to highlight the regional correlations that strongly change between groups.” We will further clarify in our methods that we chose to present uncorrected p-values when speaking of significance. We will also include more statistical detail on our online documentation regarding FDR correction. Ultimately, the decision to correct for multiple comparisons and FDR choice of threshold, should still be informed by standard statistical theory and user-defined tolerance for inclusion of false-positives and missing of false-negatives. This will be influenced by factors, such as the nature and purpose of the study, and quality of the dataset.
(6) The package was developed in R3.6.3. This is several years and one major version behind the current R version (4.4.3). Have the authors tested if this package runs on modern R versions? If not, this could be a significant hurdle for potential users.
We thank reviewers for pointing out concerns regarding versioning. Analysis and visualization capabilities are currently supported using R version 4.1+. The recommendation for R 3.6.3 is primarily for users interested in using the full workflow, which requires installation of the WholeBrain package. We anticipate supporting of visualization and network analysis capabilities with updated packages and R versions, and maintaining a legacy version for the full workflow presented in this paper.
-
-
www.biorxiv.org www.biorxiv.org
-
Author response:
The following is the authors’ response to the previous reviews.
Public Reviews:
Reviewer #1 (Public Review):
Summary:
The authors present a new application of the high-content image-based morphological profiling Cell Painting (CP) to single cell type classification in mixed heterogeneous induced pluripotent stem cellderived mixed neural cultures. Machine learning models were trained to classify single cell types according to either "engineered" features derived from the image or from the raw CP multiplexed image. The authors systematically evaluated experimental (e.g., cell density, cell types, fluorescent channels) and computational (e.g., different models, different cell regions) parameters and convincingly demonstrated that focusing on the nucleus and its surroundings contains sufficient information for robust and accurate cell type classification. Models that were trained on mono-cultures (i.e., containing a single cell type) could generalize for cell type prediction in mixed co-cultures, and describe intermediate states of the maturation process of iPSC-derived neural progenitors to differentiation neurons.
Strengths:
Automatically identifying single-cell types in heterogeneous mixed-cell populations holds great promise to characterize mixed-cell populations and to discover new rules of spatial organization and cell-cell communication. Although the current manuscript focuses on the application of quality control of iPSC cultures, the same approach can be extended to a wealth of other applications including an in-depth study of the spatial context. The simple and high-content assay democratizes use and enables adoption by other labs.
The manuscript is supported by comprehensive experimental and computational validations that raise the bar beyond the current state of the art in the field of high-content phenotyping and make this manuscript especially compelling. These include (i) Explicitly assessing replication biases (batch effects); (ii) Direct comparison of feature-based (a la cell profiling) versus deep-learning-based classification (which is not trivial/obvious for the application of cell profiling); (iii) Systematic assessment of the contribution of each fluorescent channel; (iv) Evaluation of cell-density dependency; (v) Explicit examination of mistakes in classification; (vi) Evaluating the performance of different spatial contexts around the cell/nucleus; (vii) Generalization of models trained on cultures containing a single cell type (mono-cultures) to mixed co-cultures; (viii) Application to multiple classification tasks.
I especially liked the generalization of classification from mono- to co-cultures (Figure 4C), and quantitatively following the gradual transition from NPC to Neurons (Figure 5H).
The manuscript is well-written and easy tofollow.
Thank you for the positive appreciation of our work and constructive comments.
Weaknesses:
I am not certain how useful/important the specific application demonstrated in this study is (quality control of iPSC cultures), this could be better explained in the manuscript.
To clarify the importance we have added an additional explanation to the introduction (page 3) and also come back to it in the discussion (page 17).
Text from the introduction:
“However, genetic drift, clonal and patient heterogeneity cause variability in reprogramming and differentiation efficiency10,11. The differentiation outcome is further strongly influenced by variations in protocol12. This can significantly impact experimental outcomes, leading to inconsistent and potentially misleading results and consequently, it hinders the use of iPSC-derived cell systems in systematic drug screening or cell therapy pipelines. This is particularly true for iPSC-derived neural cultures, as their composition, purity and maturity directly affect gene expression and functional activity, which is essential for modelling neurological conditions13,14. Thus, from a preclinical perspective, there is the need for a fast and cost-effective QC approach to increase experimental reproducibility and cell type specificity15. From a clinical perspective in turn, robust QC is required for safety and regulatory compliance (e.g., for cell therapeutic solutions). This need for improved standardization and QC is underscored by large-scale collaborative efforts such as the International Stem Cell Banking Initiative16, which focusses on clinical quality attributes and provides recommendations for iPSC validation testing for use as cellular therapeutics, or the CorEuStem network, aiming to harmonize iPSC practices across core facilities in Europe.”
Text from the discussion:
“Many groups highlight the difficulty of reproducible neural differentiation and attribute this to culture conditions, cultivation time and variation in developmental signalling pathways in the source iPSC material43,44. Spontaneous neural differentiation has previously been shown to require approximately 80 days before mature neurons arise that can fire action potentials and show neural circuit formation. Although these differentiation processes display a stereotypical temporal sequence34, the exact timing and duration might vary. This variation negatively affects the statistical power when testing drug interventions and thus prohibits the application of iPSC-culture derivatives in routine drug screening. Current solutions (e.g., immunocytochemistry, flow cytometry, …) are often cost-ineffective, tedious, and incompatible with longitudinal/multimodal interrogation. CP is a much more cost-effective solution and ideally suited for this purpose. Routine CP-based could add confidence to and save costs for the drug discovery pipeline. We have shown that CP can be leveraged to capture the morphological changes associated with neural differentiation.”
Another issue that I feel should be discussed more explicitly is how far can this application go - how sensitively can the combination of cell painting and machine learning discriminate between cell types that are more subtly morphologically different from one another?
Thank you for this interesting question. The fact that an approach based on a subregion not encompassing the whole cell (the “nucleocentric” approach) can predict cell types equally well, suggests that the cell shape as such is not the defining factor for accurate cell type profiling. And, while clearly neural progenitors, neurons or glia have vastly different cell shapes. We have shown that cells with closer phenotypes such as 1321N1 vs. SH-SY5Y or astrocytes vs. microglia can be distinguished with equal performance. However, triggered by the reviewers’ question, we have now tested additional conditions with more subtle phenotypes, including the classification of 1321N1 vs. two related retinal pigment epithelial cells with much more similar morphology (ARPE and RPE1 cells). We found that the CNN could discriminate these cells equally well and have added the results on page 8 and in Fig. 3D. To address this question from a different angle, we have also performed an experiment in which we changed cell states to assess whether discriminatory power remains high. Concretely, we exposed co-cultures of neurons and microglia to LPS to trigger microglial activation (more subtly visible as cytoskeletal changes and vacuole formation). This revealed that our approach still discriminates both cell types (neurons vs. microglia) with high accuracy, regardless of the microglial state. Furthermore, using a two-step approach, we could also distinguish LPS-treated (assumed to be activated) from unchallenged microglia (assumed to be more homeostatic), albeit with a lower accuracy. This experiment has been added as an extra results section (Cell type identification can be applied to mixed iPSC-derived neuronal cultures regardless of activation state, p12) and Fig. 7c. Finally, we have also added our take on what the possibilities could be for future applications in even more complex contexts such as tissue slice, 3D and live cell applications (page 17-18).
Regarding evaluations, the use of accuracy, which is a measure that can be biased by class imbalance, is not the most appropriate measurement in my opinion. The confusion matrices are a great help, but I would recommend using a measurement that is less sensitive for class imbalance for cell-type classification performance evaluations.
Across all CNNs trained in this manuscript, the sample size of the input classes has always been equalized, ruling out any effects of class imbalance. Nevertheless, to follow the reviewers’ recommendation, we have now used the F-score to document performance as it is insensitive to such imbalance. For clarity, we have now also mentioned the input number (ROIs/class) in every figure.
Another issue is that the performance evaluation is calculated on a subset of the full cell population - after exclusion/filtering. Could there be a bias toward specific cell types in the exclusion criteria? How would it affect our ability to measure the cell type composition of the population?
As explained in the M&M section, filtering was performed based on three criteria:
(1) Nuclear size: values below a threshold of 160, objects are considered to represent debris;
(2) DAPI intensity: values below a threshold of 500 represent segmentation errors;
(3) IF staining intensity: gates were set onto the intensity of the fluorescent markers used with posthoc IF to only retain cells that are unequivocally positive for either marker and to avoid inclusion of double positive (or negative) cells in the ground truth training.
One could argue that the last criterion introduces a certain bias in that it does not consider part of the cell population. However, this is also not the purpose of our pioneering study that aims at identifying unique cell types for which ground truth is as pure and reliable as possible. Not filtering out these cells with a ‘dubious’ IF profile (e.g., cells that might be transitioning or are of a different type) would negatively affect the model by introducing noise. It is correct that the predictions are based only on these inputs and so cells of a subsequent test set will only be classified according to these labels. For example, in the neuronal differentiation experiment (Fig. 6G-H), cells are either characterized as NPC or as neurons, which leaves the transitioning (or undefined) cells in either category. Despite this simplification, the model adequately predicted the increase in neuron/NPC ratio with culture age. In future iterations, one could envision defining more refined cell (sub-)types in a population based on richer post-hoc information (e.g., through cyclic immunofluorescence or spatial single cell transcriptomics) or longitudinal follow-up of cell-state transitions using live imaging. This notion has been added to page 17 of the manuscript.
I am not entirely convinced by the arguments regarding the superiority of the nucleocentric vs. the nuclear representations. Could it be that this improvement is due to not being sensitive/ influenced by nucleus segmentation errors?
The reviewer has a valid point that segmentation errors may occur. However, the algorithm we have used (Stardist classifier), is very robust to nuclear segmentation errors. To verify the performance, we have now quantified segmentation errors in 20 images for 3 different densities and found a consistently low error rate (0.6 -1.6%) without correlation to the culture density. Moreover, these errors include partial imperfections (e.g., a missed protrusion or bleb) as well as over- (one nucleus detected as more) or under- (more nuclei detected as one) segmentations. The latter two will affect both the nuclear and nucleocentric predictions and should thus not affect the prediction performance. In the case of imperfect segmentations, there may be a specific impact on the nucleus-based predictions (which rely on blanking the non-nuclear part), but this alone cannot explain the significantly higher gain in accuracy for nucleocentric predictions (>5%). Therefore, we conclude that segmentation errors may contribute in part, but not exclusively, to the overall improved performance of nucleocentric input models. We have added this notion in the discussion (pages 14-15 and Suppl. Fig. 1E).
GRADCAM shows cherry-picked examples and is not very convincing.
To help convince the reviewer and illustrate the representativeness of selected images, we have now randomly selected for each condition and density 10 images (using random seeds to avoid cherrypicking) and added these in a Suppl. Fig. 3.
There are many missing details in the figure panels, figure legend, and text that would help the reader to better appreciate some of the technical details, see details in the section on recommendations for the authors.
Please see further for our specific adaptations.
Reviewer #2 (Public Review):
This study uses an AI-based image analysis approach to classify different cell types in cultures of different densities. The authors could demonstrate the superiority of the CNN strategy used with nucleocentric cell profiling approach for a variety of cell types classification. The paper is very clear and well-written. I just have a couple of minor suggestions and clarifications needed for the reader.
The entire prediction model is based on image analysis. Could the authors discuss the minimal spatial resolution of images required to allow a good prediction? Along the same line, it would be interesting to the reader to know which metrics related to image quality (e.g. signal to noise ratio) allow a good accuracy of the prediction.
Thank you for the positive and relevant feedback.
The reviewer has a good point that it is important to portray the imaging conditions that are required for accurate predictions. To investigate this further we have performed additional experiments that give a better view on the operating window in terms of resolution and SNR (manuscript page 7-8 and new figure panels Fig. 3B-C). The initial image resolution was 0.325 µm/pixel. To understand the dependency on resolution we performed training and classifications for image data sets that were progressively binned. We found that a two-fold reduction in resolution did not significantly affect the F-score, but further degradation decreased the performance. At a resolution of 6,0 µm/pixel (20-fold binning), the F-score dropped to 0.79±0.02, comparable to the performance when only the DAPI (nuclear) channel was used as input. The effect of reduced image quality was assessed in a similar manner, by iteratively adding more Gaussian noise to the image. We found that above an SNR of 10 the prediction performance remains consistent but below it starts to degrade. While this exercise provides a first impression of the current confines of our method, we do believe it is plausible that its performance can be extended to even lower-quality images for example by using image restoration algorithms. We have added this notion in the discussion (page 14).
The authors show that nucleocentric-based cell feature extraction is superior to feeding the CNN-based model for cell type prediction. Could they discuss what is the optimal size and shape of this ROI to ensure a good prediction? What if, for example, you increase or decrease the size of the ROI by a certain number of pixels?
To identify the optimal input, we varied the size of the square region around the nuclear centroid from 0.6 to 150 µm for the whole dataset. Within the nuclear-to-cell window (12µm- 30µm) the average Fscore is limited, but an important observation is the increasing error and differences in precision and recall with increasing nucleocentric patch sizes, which will become detrimental in cases of class imbalance. The F-score is maximal for a box of 12-18µm surrounding the nuclear centroid. In this “sweet spot”, the precision and recall are also in balance. Therefore, we have selected this region for the actual density comparison experiment. We have added our results to the manuscript (page 9 and 15).
It would be interesting for the reader to know the number of ROI used to feed each model and know the minimal amount of data necessary to reach a high level of accuracy in the predictions.
The figures have now been adjusted so that the number of ROIs used as input to feed the model are listed. The minimal number of ROIs required to obtain high level accuracy is tested in Figure 2C. By systematically increasing the number of input ROIs for both RF and CNN, we found that a plateau is reached at 5000 input ROIs (per class) for optimal prediction performance. This is also documented in the results section page 6.
From Figure 1 to Figure 4 the author shows that CNN based approach is efficient in distinguishing 1321N1 vs SH-SY5Y cell lines. The last two figures are dedicated to showing 2 different applications of the techniques: identification of different stages of neuronal differentiation (Figure 5) and different cell types (neurons, microglia, and astrocytes) in Figure 6. It would be interesting, for these 2 two cases as well, to assess the superiority of the CNN-based approach compared to the more classical Random Forest classification. This would reinforce the universal value of the method proposed.
To meet the reviewer’s request, we have now also compared CNN to RF for the classification of cells in iPSC-derived models (Figures 6 and 7). As expected, the CNN performed better in both cases. We have now added these results in Fig. 6 D and 7 C and pages 12 and 13 of the manuscript.
Reviewer #3 (Public Review):
Induced pluripotent stem cells, or iPSCs, are cells that scientists can push to become new, more mature cell types like neurons. iPSCs have a high potential to transform how scientists study disease by combining precision medicine gene editing with processes known as high-content imaging and drug screening. However, there are many challenges that must be overcome to realize this overall goal. The authors of this paper solve one of these challenges: predicting cell types that might result from potentially inefficient and unpredictable differentiation protocols. These predictions can then help optimize protocols.
The authors train advanced computational algorithms to predict single-cell types directly from microscopy images. The authors also test their approach in a variety of scenarios that one may encounter in the lab, including when cells divide quickly and crowd each other in a plate. Importantly, the authors suggest that providing their algorithms with just the right amount of information beyond the cells' nuclei is the best approach to overcome issues with cell crowding.
The work provides many well-controlled experiments to support the authors' conclusions. However, there are two primary concerns: (1) The model may be relying too heavily on the background and thus technical artifacts (instead of the cells) for making CNN-based predictions, and (2) the conclusion that their nucleocentric approach (including a small area beyond the nucleus) is not well supported, and may just be better by random chance. If the authors were to address these two concerns (through additional experimentation), then the work may influence how the field performs cell profiling in the future.
Thank you very much for confirming the potential value of our work and raising these relevant items. To better support our claims we have now performed additional validations, which we detail below.
(1) The model may be relying too heavily on the background and thus technical artifacts (instead of the cells) for making CNN-based predictions
To address the first point, we have adapted the GradCAM images to show an overlay of the input crop and GradCAM heatmap to give a better view of the structures that are highlighted by the CNN. We further investigated the influence of the background on the prediction performance. Our finding that a CNN trained on a monoculture retains a relatively high performance on cocultures implies that the CNN uses the salient characteristics of a cell to recognize it in more complex heterogeneous environments. Assuming that the background can vary between experiments, the prediction of a pretrained CNN on a new dataset indicates that cellular characteristics are used for robust prediction. When inspecting GradCAM images obtained from the nucleocentric CNN approaches (now added in Suppl. Fig. 3), we noticed that the nuclear periphery typically contributed the most (but not exclusively) to the prediction performance. When using only the nuclear region as input, GradCAMs were more strongly (but again not exclusively) directed to the background surrounding the nuclei. To train the latter CNN, we had cropped nuclei and set the background to a value of zero. To rule out that this could have introduced a bias, we have now performed the exact same training and classification, but setting the background to random noise instead (Suppl. Fig. 2). While this effectively diverted the attention of the GradCAM output to the nucleus instead of the background, the prediction performance was unaltered. We therefore assume that irrespective of the background, when using nuclear crops as input, the CNN is dominated by features that describe nuclear size. We observe that nuclear size is significantly different in both cell types (although intranuclear features also still contribute) which is also reflected in the feature map gradient in the first UMAP dimension (Suppl. Fig. 2). This notion has been added to the manuscript (page 9) and Suppl. Fig. 2.
(2) The conclusion that their nucleocentric approach (including a small area beyond the nucleus) is not well supported, and may just be better by random chance.
To address this second concern, which was also raised by reviewer 2, we have performed a more extensive analysis in which the patch size was varied from 0.6 to 120µm around the nuclear centroid (Fig. 4E and page 9 of the manuscript). We observed that there is little effect of in- or decreasing patch size on the average F-score within the nuclear to cell window, but that the imbalance between the precision and recall increases towards the larger box sizes (>18µm). Under our experimental conditions, the input numbers per class were equal, but this will not be the case in situations where the ground truth is unknown (and needs to be predicted by the CNN). Therefore, a well-balanced CNN is of high importance. This notion has been added to page 15 of the manuscript.
The main advantage of nucleocentric profiling over whole-cell profiling in dense cultures is that it relies on a more robust nuclear segmentation method and is less sensitive to differences in cell density (Suppl. Fig. 1D). In other words, in dense cultures, the segmentation mask will contain similar regional input as the nuclear mask and the nucleocentric crop will contain more perinuclear information which contributes to the prediction accuracy. Therefore, at high densities, the performance of the CNN on whole-cell crops decreases owing to poorer segmentation performance. A CNN that uses nucleocentric crops, will be less sensitive to these errors. This notion has been added to pages 14-15 of the manuscript.
Additionally, the impact of this work will be limited, given the authors do not provide a specific link to the public source code that they used to process and analyze their data.
The source code is now available on the Github page of the DeVos lab, under the following URL: https://github.com/DeVosLab/Nucleocentric-Profiling
Recommendations for the authors:
Reviewing Editor (Recommendations For The Authors):
Evaluation summary
The authors present a new application of the high-content image-based morphological profiling Cell Painting (CP) to single cell type classification in mixed heterogeneous induced pluripotent stem cellderived mixed neural cultures. Machine learning models were trained to classify single cell types according to either "engineered" features derived from the image or from the raw CP multiplexed image. The authors systematically evaluated experimental (e.g., cell density, cell types, fluorescent channels, replication biases) and computational (e.g., different models, different cell regions) parameters and argue that focusing on the nucleus and its surroundings contains sufficient information for robust and accurate cell type classification. Models that were trained on mono-cultures (i.e., containing a single cell type) could generalize for cell type prediction in mixed co-cultures, and describe intermediate states of the maturation process of iPSC-derived neural progenitors to differentiation neurons.
Strengths:
Automatically identifying single-cell types in heterogeneous mixed-cell populations is an important application and holds great promise. The simple and high-content assay democratizes use and enables adoption by other labs. The manuscript is supported by comprehensive experimental and computational validations. The manuscript is well-written and easy to follow.
Weaknesses:
The conclusion is that the nucleocentric approach (including a small area beyond the nucleus) is not well supported, and may just be better by random chance. If better supported by additional experiments, this may influence how the field performs cell profiling in the future. Model interpretability (GradCAM) analysis is not convincing. The lack of a public source code repository is also limiting the impact of this study. There are missing details in the figure panels, figure legend, and text that would help the reader to better appreciate some of the technical details.
Essential revisions:
To reach a "compelling" strength of evidence the authors are requested to either perform a comprehensive analysis of the effect of ROI size on performance, or tune down statements regarding the superior performance of their "nucleocentric" approach. Further addition of a public and reproducible source code GitHub repository will lead to an "exceptional" strength of evidence.
To answer the main comment, we have performed an experiment in which we varied the size of the nucleocentric patch and quantified CNN performance. We have also evaluated the operational window of our method by varying the resolution and SNR and we have experimented with different background blanking methods. We have expanded our examples of GradCAM images and now also made our source code and an example data set available via GitHub.
Reviewer #1 (Recommendations For The Authors):
I think that an evaluation of how the excluded cells affect our ability to measure the cell type composition of the population would be helpful to better understand the limitations and practical measurement noise introduced by this approach. A similar evaluation of the excluded cells can also help to better understand the benefit of nucleocentric vs. cell representations by more convincingly demonstrating the case for the nucleocentric approach. In any case, I recommend discussing in more depth the arguments for using the nucleocentric representation and why it is superior to the nuclear representation.
The benefits of nucleocentric representation over nuclear and whole-cell representation are discussed more in depth at pages 14-15 of the manuscript.
“The nucleocentric approach, which is based on more robust nuclear segmentation, minimizes such mistakes whilst still retaining input information from the structures directly surrounding the nucleus. At higher cell density, the whole-cell body segmentation becomes more error-prone, while also loosing morphological information (Suppl. Fig. 1D). The nucleocentric approach is more consistent as it relies on a more robust segmentation and does not blank the surrounding region. This way it also buffers for occasional nuclear segmentation errors (e.g., where blebs or parts of the nucleus are left undetected).”
It is not entirely clear to me why Figure 5 moves back to "engineered" features after previous figures showed the superiority of the deep learning approach. Especially, where Figure 6 goes again to DL. Dimensionality reduction can be also applied to DL-based classifications (e.g., using the last layer).
Following up on the reviewers’ interesting comment, we extracted the embeddings from the trained CNN and performed UMAP dimensionality reduction. The results are shown in Fig. 3D, 6F and supplementary figure 1B and added to the manuscript on pages 6, 8 and 12.
We concluded that unsupervised dimensionality reduction using the feature embeddings could separate cell type clusters, where the distance between the clusters reflected the morphological similarity between the cell lines.
I would recommend including more comprehensive GRADCAM panels in the SI to reduce the concern of cherry-picking examples. What is the interpretation of the nucleocentric area?
A more extensive set of GradCAM images have now been included in supplementary material (Supplementary figure 3) using the same random seeds for all conditions, thus avoiding any cherry picking. We interpret the GradCAM maps on the nucleocentric crops as highlighting the structures surrounding the nucleus (reflecting ER, mitochondria, Golgi) indicating their importance in correct cell classification. This was added to the manuscript on pages 9 and 15.
Missing/lacking details and suggestions in the figure panels and figure legend:
- Scale bars missing in some of the images shown (e.g., Figure 2F, Figure 3D, Figure 4, Supplementary Figure 4), what are the "composite" channels (e.g., Figure 2F), missing x-label in Figure 3B.
These have now been added.
- Terms that are not clear in the figure and not explained in the legend, such as FITC and cy3 energy (Figure 1C).
The figure has been adapted to better show the region, channel and feature. We have now added a Table (Table 5), detailing the definition of each morphological feature that is extracted. On page 27, information on feature extraction is noted.
- Details that are missing or not sufficiently explained in the figure legends such as what each data point represents and what is Gini importance (Figure 1D)
We have added these explanations to the figure legends. The Gini importance or mean decrease in impurity reflects how often this feature is used in decision tree splits across all random forest trees.
Is it the std shown in Figure 2C?
Yes, this has now been added to the legend.
It is not fully clear what is single/mixed (Figure 2D)
Clarification is added to the legend and in the manuscript on page 6.
explain what is DIV 13-90 in the legend (Figure 5).
DIV stands for days in vitro, here it refers to the days in culture since the start of the neural induction process. This has been added in the legend.
and state what are img1-5 (Supplementary Figures 1B-C) Clarification has been added to the legend.
- Supplementary Figure 1. What is the y-axis in panel C and how do the results align with the cell mask in panel B?
The y-axis represents the intersection over union (IoU). The IoU quantifies the overlap between ground truth (manually segmented ROI) and the ROI detected by the segmentation algorithm. It is defined as the area of the overlapping region over the total area. This clarification has been added to the legend.
- Supplementary Figure 1 and Methods. Please explain when CellPose and when StarDist were applied.
Added to supplementary figure and methods at page 24. In the case of nuclear segmentation (nucleus and nucleocentric crops), Stardist was used. For whole-cell crops, cell segmentation using Cellpose was used.
- Supplementary Figure 4C - the color code is different between nuclear and nucleocentric - this is confusing.
We have changed to color code to correspond in both conditions in Fig. 1A.
- Figure 3B - better to have a normalized measure in the x-axis (number of cells per area in um^2)
We agree and have changed this.
Suggestions and missing/lacking details in the text:
- Line #38: "we then applied this" because it is the first time that this term is presented.
This has been rephrased.
- Line #88: a few words on what were the features extracted would be helpful.
Short description added to page 26-27 and detailed definition of all features added in table 5.
- Line #91: PCA analysis - the authors can highlight what (known) features were important to PC1 using the linear transformation that defined it.
The 5 most important features of PC1 were (in order of decreasing importance): channel 1 dissimilarity, channel 1 homogeneity, nuclear perimeter, channel 4 dissimilarity and nuclear area.
- Line #92: Order of referencing Supplementary Figure 4 before referencing Supplementary Figure 13.
The order of the Supplementary images was changed to follow the chronology.
- Line #96: Can the authors show the data supporting this claim?
The unsupervised UMAP shown in fig. 1B is either color coded by cell type (left) or replicate (right). Based on this feature map, we observe clustering along the UMAP1 axis to be associated with the cell type. Variations in cellular morphology associated with the biological replicate are more visible along the UMAP2 axis. When looking at fig. 1C, the feature map reflecting the cellular area shows a gradient along the UMAP1 direction, supporting the assumption that cell area contributes to the cell type separation. On the other hand, the average intensity (Channel 2 intensity) has a gradient within the feature map along the UMAP2 direction. This corresponds to the pattern associated with the inter-replicate variability in panel B.
- Line #108: what is "nuclear Cy3 energy"?
This represents the local change of pixel intensities within the ROI in the nucleus in the 3rd channel dimension. This parameter reflects the texture within the nuclear region for the phalloidin and WGA staining. The definitions of all handcrafted features are added in table 5 of the manuscript.
- Line #110-112: Can the authors show the data supporting this claim?
The figure has been changed to include the results from a filtered and unfiltered dataframe (exclusion and inclusion of redundant features). Features could be filtered out if the correlation was above a threshold of 0.95. This has been added to page 6 of the manuscript and fig. 1D.
- Line #115-116: please state the size of the mask.
Added to the text (page 6). We used isotropic image crops of 60µm centred on individual cell centroids.
- Lines 120-122: more details will make this more clear (single vs. mixed).
This has been changed on page 6 of the manuscript.
- Line #142: "(mimics)" - is it a typo?
Tissue mimics refers to organoids/models that are meant to replicate the physiological behaviour.
- Line #159: the bounding box for nucleocentric analysis is 15x15um (and not 60), as stated in the Methods.
Thank you for pointing out this mistake. We have adapted this.
- Line #165: what is the interpretation of what was important for the nucleocentric classification?
The colour code in GradCAM images is indicative of the attention of the CNN (the more to the red, the more attention). In fig. 4D and Suppl. Fig. 3 the structures directly surrounding the nucleus receive high attention from the CNN trained on nucleocentric crops. This has been added to the manuscript page 9 and 15.
- Section starting in line #172: not explicitly stated what model was used (nucleocentric?).
Added in the legend of fig. 5. For these experiments, the full cell segmentation was still used.
- Section starting in line #199: why use a feature-based model rather than nucleocentric? A short sentence would be helpful.
For CNN training, nucleocentric profiling was used. In response to a legitimate question of one of the reviewers, the feature-based UMAP analysis was replaced with the feature embeddings from the CNN.
- Line #213: Fig. 5B does not show transitioning cells.
Thank you for pointing this out, this was a mistake and has been changed.
Lines #218-220: not fully clear to some readers (culture condition as a weak label), more details can be helpful.
We changed this at page 11 of the manuscript for clarity.
“This gating strategy resulted in a fractional abundance of neurons vs. total (neurons + NPC) of 36,4 % in the primed condition and 80,0% in the differentiated condition (Fig. 6C). We therefore refer to the culture condition as a weak label as it does not take into account the heterogeneity within each condition (well).”
- Line #230: "increasing dendritic outgrowth" - what does it mean? Can you explicitly highlight this phenotype in Figure 5G?
When the cells become more mature during differentiation, the cell body becomes smaller and the neurons form long, thin ramifications. This explanation has been added to page 12 of the manuscript.
- Line #243: is it the nucleocentric CNN?
Yes.
- Lines #304-313, the authors might want to discuss other papers dealing with continuous (non-neural) differentiation state transitions (eg PMID: 38238594).
A discussion of the use of morphological profiling for longitudinal follow-up of continuous differentiation states has been added to the manuscript at page 18.
- Line #444: cellpose or stardist? How did the authors use both?
Clarification has been added to supplementary figure 1 and methods at page 24. Stardist was used for nuclear segmentation, whereas Cellpose was used for whole-cell segmentation.
- Line #470-474: I would appreciate seeing the performance on the full dataset without exclusions.
Cells have been excluded based on 3 arguments: the absence of DAPI intensity, too small nuclear size and absence of ground truth staining. The first two arguments are based on the assumption that ROIs that contain no DAPI signal or are too small are errors in cell segmentation and therefore should not be taken along in the analysis. The third filtering step was based on the ground-truth IF signal. Not filtering out these cells with a ‘dubious’ IF profile (e.g., cells that might be transitioning or are of a different type) would negatively affect the model by introducing noise. It is correct that the predictions are based only on these inputs and so cells of a subsequent test set will only be classified according to these labels which might introduce bias. However, the model could predict increase in neuron/NPC ratio with culture age in absence of ground-truth staining (and thus IF-based filtering).
Reviewer #2 (Recommendations For The Authors):
Figure 1A: it would be interesting to the reader to see the SH-SY5Y data as well.
This has been added in fig. 1A.
Figure 3A: 95-100% image: showing images with the same magnification as the others would help to appreciate the cell density.
Now fig. 4A. The figure has been changed to make sure all images have the same magnification.
Figure Supp 4 (line 132) is referred to before Figure Supp1 (line 152).
The image order and numbering has been changed to solve this issue.
Figure Supp 2 & 3 are not referred to in the text.
This has been adjusted.
Line 225: a statistical test would help to convince of the accuracy of these results (Figure 5C vs Figure 5F)?
These figures represent the total ROI counts and thus represent a single number.
Line 227: Could you explain to the reader, in a few words, what a dual SMAD inhibition is?
This has been added to the manuscript at page 20.
“This dual blockade of SMAD signalling in iPSCs is induces neural differentiation by synergistically causing the loss of pluripotency and push towards neuroectodermal lineage.”
Reviewer #3 (Recommendations For The Authors):
I have a few concerns and several comments that, if addressed, may strengthen conclusions, and increase clarity of an already technically sound paper.
Concerns
- The results presented in Figure 3 panel D, may indicate a critical error in data processing and interpretation that the authors must address. The GradCAM method highlights the background as having the highest importance. While it can be argued in the nucleocentric profiling method that GradCAM focuses on the nuclear membrane, the background is highly important even for the nuclear profiling method, which should provide little information. What procedure did the authors use for mask subtraction prior to CNN training? Could the segmentation algorithm be performing differently between cell lines? The authors interpret the GradCAM results to indicate a proxy for nuclear size, but then why did the CNN perform so much better than random forest using hand-crafted features that include this variable? The authors should also present size distributions between cell lines (and across seeding densities, in case one of the cell lines has different compaction properties with increasing density).
Perhaps clarifying this sentence (lines 166-168) would help as well: "As nuclear area dropped with culture density, the dynamic range decreased, which could explain the increased error rate of the CNN for high densities unrelated to segmentation errors (Suppl. Fig. 4B)." What do the authors mean by "dynamic range" and it is not clear how Supplementary Figure 4B provides evidence for this?
The dynamic range refers to the difference between the minimum and maximum nuclear area. We expect the difference to decrease at highe rdensity owing to the crowding that forces all nuclei to take on a more similar (smaller) size.
More clarification on this has been added to page 9 of the manuscript.
I certainly understand that extrapolating the GradCAM concern to the remaining single-cell images using only four (out of tens of thousands of options) is also dangerous, but so is "cherry-picking" these cells to visualize. Finally, I also recommend that the authors quantitatively diagnose the extent of the background influence according to GradCAM by systematically measuring background influence in all cells and displaying the results per cell line per density.
To avoid cherry picking of GradCAM images, we have now randomly selected for each condition and density 10 images (using random seeds to avoid cherry-picking) and added these in a Suppl. Fig. 3.
In answer to this concern, we refer to the response above:
“To address the first point, we have adapted the GradCAM images to show an overlay of the input crop and GradCAM heatmap to give a better view of the structures that are highlighted by the CNN. We further investigated the influence of the background on the prediction performance. Our finding that a CNN trained on a monoculture retains a relatively high performance on cocultures implies that the CNN uses the salient characteristics of a cell to recognize it in more complex heterogeneous environments. Assuming that the background can vary between experiments, the prediction of a pretrained CNN on a new dataset indicates that cellular characteristics are used for robust prediction. When inspecting GradCAM images obtained from the nucleocentric CNN approaches (now added in Suppl. Fig. 3), we noticed that the nuclear periphery typically contributed the most (but not exclusively) to the prediction performance. When using only the nuclear region as input, GradCAMs were more strongly (but again not exclusively) directed to the background surrounding the nuclei. To train the latter CNN, we had cropped nuclei and set the background to a value of zero. To rule out that this could have introduced a bias, we have now performed the exact same training and classification, but setting the background to random noise instead (Suppl. Fig. 2). While this effectively diverted the attention of the GradCAM output to the nucleus instead of the background, the prediction performance was unaltered. We therefore assume that irrespective of the background, when using nuclear crops as input, the CNN is dominated by features that describe nuclear size. We observe that nuclear size is significantly different in both cell types (although intranuclear features also still contribute) which is also reflected in the feature map gradient in the first UMAP dimension (Suppl. Fig. 2). This notion has been added to the manuscript (page 9) and Suppl. Fig. 2.”
- The data supporting the conclusion about nucleocentric profiling outperforming nuclear and full-cell profiling is minimal. I am picking on this conclusion in particular, because I think it is a super cool and elegant result that may change how folks approach issues stemming from cell density disproportionately impacting profiling. Figures 3B and 3C show nucleocentric slightly outperforming full cell, and the result is not significant. The authors state in lines 168-170: "Thus, we conclude that using the nucleocentric region as input for the CNN is a valuable strategy for accurate cell phenotype identification in dense cultures." This is somewhat of a weak conclusion, that, with additional analysis, could be strengthened and add high value to the community. Additionally, the authors describe the nucleocentric approach insufficiently. In the methods, the authors state (lines 501-503): "Cell crops (60μm whole cell - 15μm nucleocentric/nuclear area) were defined based on the segmentation mask for each ROI." This is not sufficient to reproduce the method. What software did the authors use?
Presumably, 60μm refers to a box size around cytoplasm? Much more detail is needed. Additionally, I suggest an analysis to confirm the impact of nucleocentric profiling, which would strengthen the authors' conclusions. I recommend systematically varying the subtraction (-30μm, -20μm, -10μm, 5μm, 0, +5μm, +10μm, etc.) and reporting the density-based analysis in Figure 3B per subtraction. I would expect to see some nucleocentric "sweet spot" where performance spikes, especially in high culture density. If we don't see this difference, then the non-significant result presented in Figures 3B and C is likely due to random chance. The authors mention "iterative data erosion" in the abstract, which might refer to what I am recommending, but do not describe this later.
More detail was added to the methods describing the image crops given as input to the CNN (page 28 of the manuscript).
“Crops were defined based on the segmentation mask for each ROI. The bounding box was cropped out of the original image with a fixed patch size (60µm for whole cells, 18µm for nucleus and nucleocentric crops) surrounding the centroid of the segmentation mask. For the whole cell and nuclear crops, all pixels outside of the segmentation mask were set to zero. This was not the case for the nucleocentric crops. Each ROI was cropped out of the original morphological image and associated with metadata corresponding to its ground truth label.”
To address this concern, we also refer to the answer above.
“We have performed a more extensive analysis in which the patch size was varied from 0.6 to 120µm around the nuclear centroid (Fig. 4E and page 9 of the manuscript). We observed that there is little effect of in- or decreasing patch size on the average F-score within the nuclear to cell window, but that the imbalance between the precision and recall increases towards the larger box sizes (>18µm). Under our experimental conditions, the input numbers per class were equal, but this will not be the case in situations where the ground truth is unknown (and needs to be predicted by the CNN). Therefore, a well-balanced CNN is of high importance. This notion has been added to page 12 of the manuscript.
The main advantage of nucleocentric profiling over whole-cell profiling in dense cultures is that it relies on a more robust nuclear segmentation method and is less sensitive to differences in cell density (Suppl. Fig. 1D). In other words, in dense cultures, the segmentation mask will contain similar regional input as the nuclear mask and the nucleocentric crop will contain more perinuclear information which contributes to the prediction accuracy. Therefore, at high densities, the performance of the CNN on whole-cell crops decreases owing to poorer segmentation performance. A CNN that uses nucleocentric crops, will be less sensitive to these errors. This notion has been added to pages 14-15 of the manuscript.“
Comments
- There is a disconnect between the abstract and the introduction. The abstract highlights the nucleocentric model, but then it is not discussed in the introduction, which focuses on quality control. The introduction would benefit from some additional description of the single-cell or whole-image approach to profiling.
We highlight the importance of QC of complex iPSC-derived neural cultures as an application of morphological profiling. We used single-cell profiling to facilitate cell identification in these mixed cultures where the whole-image approach would be unable to deal with the heterogeneity withing the field of view. In the introduction, we added a description of the whole-image vs. single-cell approach to profiling (page 4). In the discussion (page 18), we further highlight the application of this single-cell profiling approach for QC purposes.
- Comments on Figure 1. It is unclear how panel B shows "without replicate bias".
In response to this comment, we refer to the answer above: “The unsupervised UMAP shown in fig. 1B is either color coded by cell type (left) or replicate (right). Based on this feature map, we observe clustering along the UMAP1 axis to be associated with the cell type. Variations in cellular morphology associated with the biological replicate are more visible along the UMAP2 axis. When looking at fig. 1C, the feature map reflecting the cellular area shows a gradient along the UMAP1 direction, supporting the assumption that cell area contributes to the cell type separation. On the other hand, the average intensity (Channel 2 intensity) has a gradient within the feature map along the UMAP2 direction. This corresponds to the pattern associated with the inter-replicate variability in panel B.” We added this notion to page 5 of the manuscript.
The paper would benefit from a description of how features were extracted sooner.
Information on the feature extraction was added to the manuscript at page 27. An additional table (table 5) has been added with the definition of each feature.
- Comments on Supplementary Figure 4. The clustering with PCA is only showing 2 dimensions, so it is not surprising UMAP shows more distinct clustering.
We used two components for UMAP dimensionality reduction, so the data was also visualized in two dimensions. However, we agree that UMAP can show more distinct clustering as this method is non-linear.
Why is Figure S4 the first referenced Supplementary Figure?
This has been changed.
- Comments on Figure 2. Need discussion of the validation set - how was it determined? Panel E might have the answer I am looking for, but it is difficult to decipher exactly what is being done. The terminology needs to be defined somewhere, or maybe it is inconsistent. It is tough to tell. For example, what exactly are the two categories of model validation (cross-validation and independent testing)?
Additional clarification has been added to the manuscript at pages 6-7 and figure 2.
The metric being reported is accuracy for the independent replicate if the other two are used to train?
Yes.
Panel C is a very cool analysis. Panel F needs a description of how those images were selected, randomly?
Added in the methods section (page 29). GradCAM analysis was used to visualize the regions used by the CNN for classification. This map is specific to each cell. Images are selected randomly out the full dataset for visualization.
They also need scale bars.
Added to the figures.
Panel G would benefit from explicit channel labels (at least a legend would be good!).
Explanation has been added to the legend. All color code and channel numbering are consistent with fig. 1A.
What do the dots and boxplots represent? The legend says, "independent replicates", but independent replicates of, I assume, different model initializations?
Clarification has been added to the figure legends. For plots showing the performance of a CNN or RF classifier, each dot represents a different model initialization. Each classifier has been initialized at least 3 times. When indicated, the model training was performed with different random seeds for data splitting.
- Comments on Figure 3. Panel A needs scale bar. See comment on Panel D in concern #1 described above.
This has been added.
- Comments on Supplementary Figure 1. A reader will need a more detailed description in panel C. I assume that the grey bar is the average of the points, and the points represent different single cells?
How many cells? How were these cells selected?
This information on the figure (now Suppl. Fig. 1D), has been added to the legend.
“Left: Representative images of 1321N1 cells with increasing density alongside their cell and nuclear mask produced using resp. Cellpose and Stardist. Images are numbered from 1-5 with increasing density. Upper right: The number of ROIs detected in comparison to the ground truth (manual segmentation). A ROI was considered undetected when the intersection over union (IoU) was below 0,15. Each bar refers to the image number on the left. The IoU quantifies the overlap between ground truth (manually segmented ROI) and the ROI detected by the segmentation algorithm. It is defined as the area of the overlapping region over the total area. IoU for increasing cell density for cell and nuclear masks is given in the bottom right. Each point represents an individual ROI. Each bar refers to the image number on the left.”
- Comments on Figure 4. More details on quenching are needed for a general audience. The markers chosen (EdU and BrdU) are generally not specific to cell type but to biological processes (proliferation), so it is confusing how they are being used as cell-type markers.
The base analogues were incorporated into each cell line prior to mixing them, i.e. when they were still growing in monoculture so they could be labelled and identified after co-seeding and morphological profiling. Additional clarification has been added to the manuscript (page 26)
It is also unclear why reducing CV is an important side-effect of finetuning. CV of what? The legend says, "model iterations", but what does this mean?
The dots in the violinplot are different CNN initializations. A lower variability between model initializations is an indicator of certainty of the results. Prior to finetuning, the results of the CNN were highly variable leading to a high CoV between the different CNNs. This means the outcome after finetuning is more robust.
- Comments on Figure 5. This is a very convincing and well-described result, kudos! This provides another opportunity to again compare other approaches (not just nucleocentric). Additionally, since the UMAP space uses hand-crafted features. The authors could consider interpreting the specific morphology features impacted by the striking gradual shift to neuron population by fitting a series of linear models per individual feature. This might confirm (or discover) how exactly the cells are shifting morphology.
The supervised UMAP on the handcrafted features did not highlight any features contributing to the separation. Using the supervised UMAP, the clustering is dominated by the known cell type. Unsupervised UMAP on the handcrafted features does not show any clustering. In response to a previous comment, we adapted the figure to show UMAP dimensionality reduction using the feature embeddings from the cell-based CNN. This unsupervised UMAP does show good cell type separation, but it does not use any directly interpretable shape descriptors.
- General comments on Methods. The section on "ground truth alignment" needs more details. Why was this performed?
Following sequential staining and imaging rounds, multiple images were captured representing the same cell with different markers. Lifting the plate of the microscope stage and imaging in sequential rounds after several days results in small linear translations in the exact location of each image. These linear translations need to be corrected to align (or register) morphological with ground truth image data within the same ROI. This notion has been added to the manuscript at page 26.
Handcrafted features extracted using what software?
The complete analysis was performed in python. All packages used are listed in table 4. Handcrafted features were extracted using the scikit-image package (regionprops and GLCM functions). This has been added to the manuscript at page 27.
Software should be cited more often throughout the manuscript.
Lastly, the GitHub URL points to the DeVosLab organization, but should point to a specific repository. Therefore, I was unable to review the provided code. A well-documented and reproducible analysis pipeline should be included.
A test dataset and source code are available on GitHub: https://github.com/DeVosLab/Nucleocentric-Profiling
-
eLife Assessment
This study presents an important application of high-content image-based morphological profiling to quantitatively and systematically characterize induced pluripotent stem cell-derived mixed neural cultures cell type compositions. Compelling evidence through rigorous experimental and computational validations support new potential applications of this cheap and simple assay.
-
Joint Public Review:
Summary:
The authors present a new application of the high-content image-based morphological profiling Cell Painting (CP) to single cell type classification in mixed heterogeneous induced pluripotent stem cell-derived mixed neural cultures. Machine learning models were trained to classify single cell types according to either "engineered" features derived from the image or from the raw CP multiplexed image. The authors systematically evaluated experimental (e.g., cell density, cell types, fluorescent channels) and computational (e.g., different models, different cell regions) parameters and convincingly demonstrated that focusing on the nucleus and its surroundings contain sufficient information for robust and accurate cell type classification. Models that were trained on mono-cultures (i.e., containing a single cell type) could generalize for cell type prediction in mixed co-cultures, and to describe intermediate states of the maturation process of iPSC-derived neural progenitors to differentiation neurons.
Strengths:
Automatically identifying single cell types in heterogeneous mixed cell populations hold great promise to characterize mixed cell populations and to discover new rules of spatial organization and cell-cell communication. Although the current manuscript focuses on the application of quality control of iPSC cultures, the same approach can be extended to a wealth of other applications including in depth study of the spatial context. The simple and high-content assay democratizes use and enables adoption by other labs.
The manuscript is supported by comprehensive experimental and computational validations that raises the bar beyond the current state of the art in the field of high-content phenotyping and makes this manuscript especially compelling. These include (i) Explicitly assessing replication biases (batch effects); (ii) Direct comparison of feature-based (a la cell profiling) versus deep-learning-based classification (which is not trivial/obvious for the application of cell profiling); (iii) Systematic assessment of the contribution of each fluorescent channel; (iv) Evaluation of cell-density dependency; (v) explicit examination of mistakes in classification; (vi) Evaluating the performance of different spatial contexts around the cell/nucleus; (vii) generalization of models trained on cultures containing a single cell type (mono-cultures) to mixed co-cultures; (viii) application to multiple classification tasks.
Comments on latest version:
I have consulted with Reviewer #3 and both of us were impressed by revised manuscript, especially by the clear and convincing evidence regarding the nucleocentric model use of the nuclear periphery and its benefit for the case of dense cultures. However, there are two issues that are incompletely addressed (see below). Until these are resolved, the "strength of evidence" was elevated to "compelling".
First, the analysis of the patch size is not clearly indicating that the 12-18um range is a critical factor (Fig. 4E). On the contrary, the performance seems to be not very sensitive to the patch size, which is actually a desired property for a method. Still, Fig. 4B convincingly shows that the nucleocentric model is not sensitive to the culture density, while the other models are. Thus, the authors can adjust their text saying that the nucleocentric approach is not sensitive to the patch size and that the patch size is selected to capture the nucleus and some margins around it, making it less prone to segmentation errors in dense cultures.
Second, the GitHub does not contain sufficient information to reproduce the analysis. Its current state is sparse with documentation that would make reproducing the work difficult. What versions of the software were used? Where should data be downloaded? The README contains references to many different argparse CLI arguments, but sparse details on what these arguments actually are, and which parameters the authors used to perform their analyses. Links to images are broken. Ideally, all of these details would be present, and the authors would include a step-by-step tutorial on how to reproduce their work. Fixing this will lead to an "exceptional" strength of evidence.
-
-
www.biorxiv.org www.biorxiv.org
-
Author response:
The following is the authors’ response to the original reviews.
Reviewer 1:
Comment 1. In Figure 1, the MafB antibody (Sigma) was used to identify Renshaw cells at P5. However, according to the supplementary Figure 3D, the specificity of the MafB antibody (Sigma) is relatively low. The image of MafB-GFP, V1-INs, and MafB-IR at P5 should be added to the supplementary figure. The specificity of MaFB-IR-Sigma in V1 neurons at P5 should be shown. This image also might support the description of the genetically labeled MafB-V1 distribution at P5 (page 8, lines 28-32).
We followed the reviewer’s suggestion and moved analyses of the MafB-GFP mouse to a supplemental figure (Fig S3). The characterization of MafB immunoreactivities is now in supplemental Figure S2 and the related text in results was also moved to supplemental to reduce technicalities in the main text. We added confocal images of MafB-GFP V1 interneurons at P5 showing immunoreactivities for both MafB antibodies, as suggested by the reviewer (Fig S2A,B). We agree with the reviewer that this strengthens our comparisons on the sensitivity and specificity of the two MafB antibodies used in this study.
As explained in the preliminary response we cannot show lack of immunoreactivity for MafB antibodies in MafB GFP/GFP knockout mice at P5 because MafB global KOs die at birth. This is why we used tissues from late embryos to check MafB immunoreactivities (Figure S2C and S2D). We made this point clearer in the text and supplemental figure legends.
Comment 2. The proportion of genetically labeled FoxP2-V1 in all V1 is more than 60%, although immunolabeled FoxP2-V1 is approximately 30% at P5. Genetically labeled Otp-V1 included other nonFoxP2 V1 clades (Fig. 8L-M). I wonder whether genetically labeled FoxP2-V1 might include the other three clades. The authors should show whether genetically labeled FoxP2-V1 expresses other clade markers, such as pou6f2, sp8, and calbindin, at P5.
We included the requested data in Figure 3E-G. Lineage-labeled Foxp2-V1 neurons in our genetic intersection do not include cells from other V1-clades.
Reviewer 2:
Comment 1. The current version of the paper is VERY hard to read. It is often extremely difficult to "see the forest for the trees" and the reader is often drowned in methodological details that provide only minor additions to the scientific message. Non-specialists in developmental biology, but still interested in the spinal cord organization, especially students, might find this article challenging to digest and there is a high risk that they will be inclined to abandon reading it. The diversity of developmental stages studied (with possible mistakes between text and figures) adds a substantial complexity in the reading. It is also not clear at all why authors choose to focus on the Foxp2 V1 from page 9. Naively, the Pou6f2 might have been equally interesting. Finally, numerous discrepancies in the referencing of figures must also be fixed. I strongly recommend an in-depth streamlining and proofreading, and possibly moving some material to supplement (e.g. page 8, and elsewhere).
The whole text was re-written and streamlined with most methodological discussion (including the section referred to by the reviewer) transferred to supplemental data. Nevertheless, enough details on samples, stats and methods were retained to maintain the rigor of the manuscript.
The reasons justifying a focus on Foxp2-V1 interneurons were fully explained in our preliminary response. Briefly, we are trying to elucidate V1 heterogeneity, and prior data showed that this is the most heterogeneous V1 clade (Bikoff et al., 2016), so it makes sense it was studied further. We agree that the Pou6f2 clade is equally interesting and is in fact the subject of several ongoing studies.
Comment 2. … although the different V1 populations have been investigated in detail regarding their development and positioning, their functional ambition is not directly investigated through gain or loss of function experiments. For the Foxp2-V1, the developmental and anatomical mapping is complemented by a connectivity mapping (Fig 6s, 8), but the latter is fairly superficial compared to the former. Synapses (Fig 6) are counted on a relatively small number of motoneurons per animal, that may, or may not, be representative of the population. Likewise, putative synaptic inputs are only counted on neuronal somata. Motoneurons that lack of axo-somatic contacts may still be contacted distally. Hence, while this data is still suggestive of differences between V1 pools, it is only little predictive of function.
We fully answered the question on functional studies in the preliminary response. Briefly, we are currently conducting these studies using various mouse models that include chronic synaptic silencing using tetanus toxin, acute partial silencing using DREADDs, and acute cell deletion using diphtheria toxin. Each intervention reveals different features of Foxp2-V1 interneuron functions, and each model requires independent validation. Moreover, these studies are being carried out at three developmental stages: embryos, early postnatal period of locomotor maturation and mature animals. Obviously, this is all beyond the goals and scope of the present study. The present study is however the basis for better informed interpretations of results obtained in functional studies.
Regarding the question on synapse counts, we explained in the preliminary results fully why we believe our experimental designs for synapse counting at the confocal level are among the most thorough that can be found in the literature. We counted a very large number of motoneurons per animal when adding all motor column and segments analyzed in each animal. Statistical power was also enough to detect fundamental variation in synaptic density among motor columns.
We focus our analyses on motoneuron cells bodies because analysis of full dendritic arbors on all motor columns present throughout all lumbosacral segments is not feasible. Please see Rotterman et al., 2014 (J. of Neuroscience; doi: 10.1523/JNEUROSCI.4768-13.2014) for evaluation of what this entails for a single motoneuron. We agree with the reviewer that analyses of V1 synapses over full dendrite arbors in specific motoneurons will be very relevant in further studies. These should be carried out now that we know which motor columns are of high interest. Nevertheless, inhibitory synapses exert the most efficient modulation of neuronal firing when they are on cell bodies, and our analyses clearly suggest a difference in in cell body inhibitory synapses targeting between different V1 interneuron types that we find very relevant.
Comment 3. I suggest taking with caution the rabies labelling (Figure 8). It is known that this type of Rabies vectors, when delivered from the periphery, might also label sensory afferents and their postsynaptic targets in the cord through anterograde transport and transneuronal spread (e.g., Pimpinella et al., 2022). Yet I am not sure authors have made all controls to exclude that labelled neurons, presumed here to be premotoneurons, could rather be anterogradely labelled from sensory afferents.
Over the years, we performed many extensive controls and validation of rabies virus transsynaptic tracing methods. These were presented at two SfN meetings (Gomez-Perez et al., 2015 and 2016; Program Nos. 242.08 and 366.06). Our validation of this technique was fully explained in our preliminary response. We also pointed out that the methods used by Pimpinella et al. have a very different design and therefore their results are not comparable to ours. In this study we injected the virus at P15 into leg muscles, and not directly into the spinal cord. In our hands, and as cited in Pimpinella et al., the rabies virus loses tropism for primary afferents with age when injected in muscle. The lack of primary afferent labeling in key lumbosacral segments (L4 and L5) is now illustrated in a new supplemental figure (Figure S6). This figure also shows some starter motoneurons. As explained in the text and in our previous response, these are few in number because of the reduced infection rate when using this method in mature animals (after P10).
Comment 4. The ambition to differentiate neuronal birthdate at a half-day resolution (e.g., E10 vs E10.5) is interesting but must be considered with caution. As the author explains in their methods, animals are caged at 7pm, and the plug is checked the next morning at 7 am. There is hence a potential error of 12h.
We agree with the reviewer, and we previously explicitly discussed these temporal resolution caveats. We have now further expanded on this in new text (see middle paragraph in page 5). Nevertheless, the method did reveal the temporal sequence of neurogenesis of V1 clades with close to 12-hour resolution.
As explained in text and preliminary response this is because we analyzed a sufficient number of animals from enough litters and utilized very stringent criteria to count EdU positives.
Moreover, our results fit very well with current literature. The data agree with previous conclusions from Andreas Sagner group (Institut für Biochemie, Friedrich-Alexander-Universität Erlangen-Nürnberg), on spinal interneurons (including V1s) birthdates based on a different methodology (Delile J et al.
Development. 2019 146(12):dev173807. doi: 10.1242/dev.173807. PMID: 30846445; PMCID: PMC6602353). In the discussion we compared in detail both the data and methods between Delile article and our results. We also cite Sagner 2024 review as requested later in the reviewer’s detailed comments. Our results also confirmed our previous report on the birthdates of V1-derived Renshaw cells and Ia inhibitory interneurons (Benito-Gonzalez A, Alvarez FJ J Neurosci. 2012 32(4):1156-70. doi: 10.1523/JNEUROSCI.3630-12.2012. PMID: 22279202; PMCID: PMC3276112). Finally, we recently received a communication notifying us that our neurogenesis sequence of V1s has been replicated in a different vertebrate species by Lora Sweeney’s group (Institute of Science and Technology Austria; direct email from this lab) and we shared our data with them for comparison. This manuscript is currently close to submission. Therefore, we are confident that despite the limitations of EdU birthdating we discussed, the conclusions we offered are strong and are being validated by other groups using different methods and species. We also want to acknowledge the positive comments of reviewer 3 regarding our birthdating study, indicating it is one the most rigorous he or she has ever seen.
Reviewer 3:
Comment 1. My only criticism is that some of the main messages of the paper are buried in technical details. Better separation of the main conclusions of the paper, which should be kept in the main figures and text, and technical details/experimental nuances, which are essential but should be moved to the supplement, is critical. This will also correct the other issue with the text at present, which is that it is too long.
Similar to our response to comment 1 from Reviewer 2 we followed the reviewers’ recommendations and greatly summarized, simplified and removed technical details from the main text, trying not to decrease rigor.
Reviewer #1 (Recommendations For The Authors):
In Figure 1, the definition of the area to analyze MafB ventral and MafB dorsal is unclear. It should be described.
This has been clarified in both text and supplemental figure S3.
“We focused the analyses on the brighter dorsal and ventral MafB-V1 populations defined by boxes of 100 µm dorsoventral width at the level of the central canal (dorsal) or the ventral edge of the gray matter (ventral) (Supplemental Figure S3B).”
Problems with figure citation.
We apologize for the mistakes. All have been corrected.
Reviewer #2 (Recommendations For The Authors):
As indicated in the public review, I'd recommend to substantially revise the writing, for clarity. As such, the paper is extremely hard to read. I would also recommend justifying the focus on Foxp2 neurons.
Also, the scope of the present paper is not clearly stated in the introduction (page 4).
Done. We also modified the introduction such that the exact goals are more clearly stated.
I would also recommend toning down the interpretation that V1 clades constitute "unique functional subsets" (discussion and elsewhere). Functional investigation is not performed, and connectomic data is partial and only very suggestive.
We include the following sentence at the end of the 1st paragraph in the discussion:
“This result strengthens the conclusion that these V1 clades defined by their genetic make-up might represent distinct functional subtypes, although further validation is necessary in more functionally focused studies.”
Different post-natal stages are used for different sections of the manuscript. This is often confusing, please justify each stage. From the beginning even, why is the initial birthdating (Figure 1) done here at p5, while the previous characterization of clades was done at p0? I am not sure to understand the justification that this was chosen "to preserve expression of V1 defining TFs". Isn't the sooner the better?
The birthdating study was carried out at P5. P5 is a good time point because there is little variation in TF expression compared to P0, as demonstrated in the results. Furthermore, later tissue harvesting allows higher replicability since it is difficult to consistently harvest tissue the day a litter is born (P0). Also technically, it is easier to handle P5 tissue compared to P0. The analysis of VGUT1 synapses was also done at P5 rather than later ages. This has two advantages: TFs immunoreactivities are preserved at this age, and also corticospinal projections have not yet reached the lumbar cord reducing interpretation caveats on the origins of VGUT1 synapses in the ventral horn (although VGLUT1 synapses are still maturing at this age, see below).
Other parts of the study focus on different ages selected to be most adequate for each purpose. To best study synaptic connectivity, it is best to study mature spinal cords after synaptic plasticity of the first week. For the tracing study we thoroughly explain in the text the reasons for the experimental design (see also below in detailed comments). For counting Foxp2-V1 interneurons and comparing them to motor columns we analyze mature animals. For testing our lineage labeling we use animals of all ages to confirm the consistency of the genetic targeting strategy throughout postnatal development and into adulthood.
Figure 5: wouldn't it be worth quantifying and illustrating cellular densities, in addition to the average number of Foxp2 neurons, across lumbar segments (panel D & E)? Indeed, the size of - and hence total number of cells within - each lumbar segment might not be the same, with a significant "enlargement" from L2 to L4 (this is actually visible on the transverse sections). Hence, if the total number of cells is in the higher in these enlarged segments, but the total number of Foxp2-V1 is not, it may mean that this class is proportionally less abundant.
We believe the critical parameter is the ratio of Foxp2-V1s to motoneurons. This informs how Foxp2-V1 interneurons vary according to the size of the motor columns and the number of motoneurons overall.
The question asked by the reviewer would best be answered by estimating the proportion of Foxp2-V1 neurons to all NeuN labeled interneurons. This is because interneuron density in the spinal cord varies in different segments. We are not sure what this additional analysis will contribute to the paper.
Why, in the Rabies tracing scheme (Fig 8), the Rabies injection is performed at p15? As the authors explain in the text, rabies uptake at the neuromuscular junction is weak after p10. It is not clear to me why such experiments weren't done all at early postnatal stages, with a "classical" co-injection of TVA and Rabies.
First, we do not need TVA in this experiment because we are using B19-G coated virus and injecting it into muscles, not into the spinal cord directly.
Second, enhanced tracing occurs when the AAV is injected a few days before rabies virus. This is because AAV transgene expression is delayed with respect to rabies virus infection and replication. We have performed full time courses and presented these data in one abstract to SfN: Gomez-Perez et al., 2015 Program Nos. 242. We believe full description of these technical details is beyond the scope of this manuscript that has already been considered too technical.
Third, the justification of P15 timing of injections for anterograde primary afferent labeling and retrograde monosynaptic labeling of interneurons is fully explained in the text.
“To obtain transcomplementation of RVDG-mCherry with glycoprotein in LG motoneurons, we first injected the LG muscle with an AAV1 expressing B19-G at P4. We then performed RVDG and CTB injections at P15 to optimize muscle targeting and avoid cross-contamination of nearby muscles. Muscle specificity was confirmed post-hoc by dissection of all muscles below the knee. Analyses were done at P22, a timepoint after developmental critical windows through which Ia (VGLUT1+) synaptic numbers increase and mature on V1-IaINs (Siembab et al., 2010)”
Furthermore, CTB starts to decrease in intensity 7 days after injection because intracellular degradation and rabies virus labeling disappears because cell death. Both limit the time of postinjection for analyses.
Likewise, I am surprised not to see a single motoneuron in the rabies tracing (Fig 8, neither on histology nor on graphs (Fig 8). How can authors be certain that there was indeed rabies uptake from the muscle at this age, and that all labelled cells, presumed to be preMN, are not actually sensory neurons? It is known that Rabies vectors, when delivered from the periphery, might also label sensory afferents and their post-synaptic targets through anterograde transport and transneuronal spread (e.g., Pimpinella et al., 2022). This potential bias must be considered.
This is fully explained in our previous response to the second reviewer’s general comments. We have also added a confocal image showing starter motoneurons as requested (Figure S6A).
Please carefully inspect the references to figures and figure panels, which I suspect are not always correct.
Thank you. We carefully revised the manuscript to correct these deficiencies and we apologize for them.
Reviewer #3 (Recommendations For The Authors):
Figure 1: Data here is absolutely beautiful and provides one of the most thorough studies, in terms of timepoints, number of animals analyzed, and precision of analysis, of edU-based birth timing that has been published for neuron subtypes in the spinal cord so far. My only suggestion is to color code the early and late born populations (in for example, different shades of green for early; and blue for late, to better emphasize the differences between them). It is very difficult to differentiate between the purple, red and black colors in G-I, which this would also fix. The antibody staining for Pou6f2 (F) is also difficult to see; gain could be increased on these images or insets added for clarity.
The choice of colors is adapted for optimal visualization by people with different degrees of color blindness. Shades of individual colors are always more difficult to discriminate. This is personally verified by the senior corresponding author of this paper who has some color discrimination deficits. Moreover, each line has a different symbol for the same purpose of easing differentiation.
Figure 2: This is also a picture-perfect figure showing further diversity by birth time even within a clade. One small aesthetic comment is that the arrows are quite unclear and block the data. Perhaps the contours themselves could be subdivided by region and color coded by birth time-such that for example the dorsal contours that emerge in the MafB clade at E11 are highlighted in their own color. Some quantification of the shift in distribution as well as the relative number of neurons within each spatially localized group would also be useful. For MafB, for example, it looks as though the ventral cells (likely Renshaw) are generated at all times in the contour plots; in the dot plots however, it looks like the most ventral cells are present at e10.5. This is likely because the contours are measuring fractional representations, not absolute number. An independent measure of absolute number of ventral and dorsal, by for example, subdividing the spinal cord into dorsoventral bins, would be very useful to address this ambiguity.
We believe density plots already convey the message of the shift in positions with birthdate. We are not sure how we can quantify this more accurately than showing the differences in cellular density plots. We used dorsoventral and mediolateral binning in our first paper decades ago (Avarez et al., 2005). This has now been replaced by more rigorous density profiles that describe better cell distributions. Unfortunately, to obtain the most accurate density profiles we need to pool all cells from all animals precluding statistical comparisons. This is because for some groups there have very few cells per animal (for example early born Sp8 or Foxp2 cells).
Figure 3 and Figure 4: These, and all figures that compare the lineage trace and antibody staining, should be moved to the supplement in my opinion-as they are not for generalist readers but rather specialists that are interested in these exact tools. In addition, the majority of the text that relates to these figures should be transferred to the supplement as well. Figure 5: Another great figure that sets the stage for the analysis of FoxP2V1-to-MN synaptic connectivity, and provides basic information about the rostrocaudal distribution of this clade, by analyzing settling position by level. I have only minor comments. The grid in B obscures the view of the cells and should be removed. The motor neuron cell bodies in C would be better visible if they were red.
We moved some of the images to supplemental (see new supplemental Fig S4). However, we also added new data to the figure as requested by reviewers (Fig 3E-G). We preserved our analyses of Foxp2 and non-Foxp2 V1s across ages and spinal segments because we think this information is critical to the paper. Finally, we want to prevent misleading readers into believing that Foxp2 is a marker that is unique to V1s. Therefore, we also preserved Figures 3H to 3J showing the non-V1 Foxp2 population in the ventral horn.
Figure 6: Very careful and quantitative analysis of V1 synaptic input to motor neurons is presented here. For the reader, a summary figure (similar to B but with V1s too) that schematizes V1 FoxP2 versus Renshaw cell connectivity with LMC, MMC, and PGC motor neurons are one level would be useful.
Thanks for the suggestion. A summary figure has now been included (Figure 5G).
Figure 7: The goal of this figure is to highlight intra-clade diversity at the level of transcription factor expression (or maintenance of expression), birth timing and cell body position culminating in the clear and concise diagram presented in G. In panels A-F however, it takes extra effort to link the data shown to these I-IV subtypes. The figure should be restructured to better highlight these links. One option might be to separate the figure into four parts (one for each type): with the individual spatial, birth timing and TF data for each population extracted and presented in each individual part.
We agree with the reviewer that this is a very busy figure. We tried to re-structure the figure following the suggestions of the reviewer and also several alternative options. All resulted in designs that were more difficult to follow than the original figure. We apologize for its complexity, but we believe this is the best organization to describe all the data in the simplest form.
Figure 8: in A-D, the main point of the figure - that V1FoxP2Otp preferentially receive proprioceptive synapses is buried in a bunch of technical details. To make it easier for the reader, please:
(1) add a summary as in B of the %FoxP2-V1 Otp+ cells (82%) with Vglut1 synapses to make the point stronger that the majority of these cells have synapses.
We added this graph by extending the previous graph to include lineage labeled Foxp2-V1s with OTP or Foxp2 immunoreactivity. It is now Figure 7B.
(2) Additionally, add a representative example that shows large numbers of proximal synapses on an FoxP2-V1 Otp+.
The image we presented before as Figure 8A was already immunostained for OTP, so we just added the OTP channel to the images. Now all this information is in panels that are subparts of Figure 7A.
(3) Move the comparison between FoxP2-V1 and FoxP2AB+V1s to the supplement.
We preserved the quantitative data on Foxp2-V1 lineage cells with Foxp2-immunoreactivity but made this a standalone figure, so it is not as busy.
(4) Move J-M description of antibody versus lineage trace of Otp to supplement as ending with this confuses the main message of the paper (see comment above).
All results for the Otp-V1 mouse model have now been placed in a supplemental figure (Figure 5S).
Discussion: A more nuanced and detailed discussion of how the temporal pattern of subtype generation presented here aligns with the established temporal transcription factor code (nicely summarized in Sagner 2024) would be helpful to place their work in the broader context of the field.
This aspect of the discussion was expanded on pages 20 and 21. We replaced the earlier cited review (Sagner and Briscoe, 2019, Development) with the updated Sagner 2024 review and further discussed the data in the context of the field and neurogenesis waves throughout the neural tube, not only the spinal cord. We previously carefully compared our data with the spinal cord data from Sagner’s group (Delile et, 2019, Development). We have now further expanded this comparison in the discussion.
-
eLife Assessment
This study provides a valuable description of subtypes of V1 neurons, including birthdates and connections to motor neurons. V1 neurons are one of the main groups of inhibitory neurons in the spinal cord. The methods of data collection and analysis are convincing. This work will interest developmental biologists and neuroscientists working on spinal circuits.
-
Reviewer #1 (Public review):
To understand spinal locomotor circuits, we need to reveal how various types of spinal interneurons work in them. So far, the general roles of the cardinal groups of spinal interneurons (dI6, V0, V1, V2a, V2b, and V3) in locomotion have been studied but not fully understood. Each group is believed to contain some subgroups with more detailed functional differences. However, each character and function of these subgroups has yet to be elucidated.
In this study, Worthy et al. investigated V1 neurons, one of the main groups of inhibitory neurons in the spinal cord. Previous reports proposed four major clades in V1 neurons defined by the expression of transcription factors (MafA/MafB, Foxp2, sp8, and pou6f2). The authors investigated the birth time for V1 neurons in each of the four clades and showed the postnatal location in the spinal cord with different birthdates. Next, the authors investigated the Foxp2-V1 population in detail using genetically labeled Foxp2-V1 mice. They found some FoxP2-V1 located near LMC motor neurons that innervate limbs. They showed that most of the synapses of V1 neurons on the cell bodies of LMC motor neurons were from Foxp2-V1 and Renshaw cells, and the proportion of Foxp2-V1 synapses in V1 synapses on motor neurons was relatively high in LMC compared to other motor columns. They also proposed that Foxp2-V1 can be further classified according to the expression of transcription factors Otp and Foxp4. The results of this paper are well supported by the data obtained using widely used methods.
This study will be helpful for future analyses of the development and function of V1 neurons. In particular, the discovery of strong synaptic connections between Foxp2-V1 and LMC motor neurons will be beneficial in analyzing the role of V1 neurons in motor circuits that generate movement of the limbs.
-
Reviewer #2 (Public review):
Summary:
This work brings important information regarding the composition of interneurons in the mammalian spinal cord, with a developmental perspective. Indeed, for the past decades, tools inspired from developmental biology have opened up promising avenues for challenging the functional heterogeneity in the spinal cord. They rely on the fact that neurons sharing similar mature properties also share a largely similar history of expression of specific transcription factor (TF) genes during embryogenic and postnatal development. For instance, neurons originating from p1 progenitors and expressing the TF Engrailed-1, form the V1 neuronal class. While such "cardinal" neuronal classes defined by one single RF indeed share numerous features - e.g., for the case of V1 neurons, a ventral positioning, an inhibitory nature and ipsilatetal projections - there is accumulating evidence for a finer-grained diversity and specialization in each class which is still largely obscure. The present work studies the heterogeneity of V1 interneurons and describes multiple classes based on their birthdate, final positioning, and expression of additional TF. It brings in particular a solid characterization of the Foxp2-expressing V1 interneurons for which authors also delve into the connectivity, and hence, possible functional implication. The work will be of interest to developmental biologists and those interested in the organization of the locomotor spinal network.
Strengths:
This study has deeply analyzed the diversity of V1 neurons by intersecting multiple criteria: TF expression, birthdate, location in the spinal cord, diversity along the rostro-caudal axis, and for some subsets, connectivity. This illustrates and exemplifies the absolute need to not consider cardinal classes, defined by one single TF, as homogeneous. Rather, it highlights the limits of single-TF classification and exemplifies the existence of further diversity within the cardinal class.
Experiments are generally well performed with a satisfactory number of animals and adequate statistical tests.
Authors have also paid strong attention to potential differences in cell-type classification when considering neurons currently expressing of a given TF (e.g., using antibodies), from those defined as having once expressed that TF (e.g., defined by a lineage-tracing strategy). This ambiguity is a frequent source of discrepancy of findings across studies.
Furthermore, there is a risk in developmental studies to overlook the fact that the spinal cord is functionally specialized rostro-caudally, and to generalize features that may only be applicable to a specific segment and hence to a specific motor pool. While motoneurons share the same dorso-ventral origin and appear homogenous on a ChAT staining, specific clusters are dedicated to specific muscle groups, e.g., axial, hypaxial or limb muscles. Here, the authors make the important distinction between different lumbar levels and detail the location and connectivity of their neurons of interest with respect to specific clusters of MN.
Finally, the authors are fully transparent on inter-animal variability in their representation and quantification. This is crucial to avoid the overgeneralization of findings but to rather provide a nuanced understanding of the complexities of spinal circuits.
Weaknesses:
The different V1 populations have been investigated in detail regarding their development and positioning, but their functional ambition is not directly investigated through gain or loss of function experiments in the present study. While the putative inputs onto motoneurons are interesting and suggestive of differences between V1 pools, they are only a little predictive of function.
-
-
www.biorxiv.org www.biorxiv.org
-
Author response:
The following is the authors’ response to the original reviews.
Reviewer #1:
In this manuscript by Napoli et al, the authors study the intracellular function of Cytosolic S100A8/A9 a myeloid cell soluble protein that operates extracellularly as an alarmin, whose intracellular function is not well characterized. Here, the authors utilize state-of-the-art intravital microscopy to demonstrate that adhesion defects observed in cells lacking S100A8/A9 (Mrp14-/-) are not rescued by exogenous S100A8/A9, thus highlighting an intrinsic defect. Based on this result subsequent efforts were employed to characterize the nature of those adhesion defects.
The authors thank reviewer #1 for his/her insightful comments and suggestions. Please find our point to point responses below.
(1) Ex vivo characterization of the function of S100A8/A9 in adhesion, spreading, and calcium signaling requires at least one rescue experiment to support the direct role of these proteins in the biological processes under study.
We thank the reviewer for this comment. We agree that rescue experiments would be helpful to confirm the direct role of intracellular S100A8/A9 in adhesion, spreading, and Ca2+ signaling. Although transfection of primary cells, especially neutrophils, poses challenges due to their short half-life, we now have undertaken additional in vitro rescue experiments. Specifically, we used extracellular S100A8/A9 and coated Ibidi flow chambers with E-selectin, ICAM-1 and CXCL1 alone or alongside S100A8/A9, and measured rolling and adhesion of blood neutrophils. Our data reveal that extracellular S100A8/A9 can induce increased adhesion in WT neutrophils but fails to rescue the adhesion defect in Mrp14-/- neutrophils (Author response image 1). This result corroborates our in vivo findings, emphasizing that the observed adhesion defect is due to the lack of intracellular S100A8/A9.
Author response image 1.
Extracellular S100A8/A9 does not rescue the adhesion defect in Mrp14/- neutrophils. Analysis of number of adherent leukocytes FOV-1 normalized to the WBC of WT and Mrp14-/- mice. Whole blood was harvested through a carotid artery catheter and perfused with a high precision pump at constant shear rate using flow cambers coated with either E-selectin, ICAM-1 and CXCL1 or E-selectin, ICMA-1, CXCL1 and S100A8/A9. [mean+SEM, n=5 mice per group, 12 (WT) and 14 (Mrp14-/-) flow chambers, 2way ANOVA, Sidak’s multiple comparison]. ns, not significant; *p≤0.05, **p≤0.01, ***p≤0.001.
(2) There is room for improvement in the analysis of signaling pathways presented in Figures 3 H and I. Western blots and analyses are not convincing, in particular for p-Pax.
We acknowledge the reviewer's concern regarding the clarity of the signaling pathway analysis, particularly the western blots for p-Paxillin. To address this, we have repeated the western blot experiments using murine neutrophils. Our new data confirm the defective paxillin phosphorylation upon CXCL1 stimulation and ICAM-1 binding in the absence of cytosolic S100A8/A9. We have now integrated these new findings with the original data and included the updated results in the manuscript (Figure 3I revised). These enhanced analyses provide a more robust and convincing demonstration of the signaling defects in Mrp14-/- neutrophils.
(3) At least one western blot showing a knockdown of S100A8/A9 should be included towards the beginning of the result section.
We appreciate the reviewer's suggestion to include a western blot demonstrating the knockout of S100A8/A9 early in the results section. In a recent publication by our group, we have already demonstrated the absence of S100A8/A9 at the protein level in Mrp14-/- neutrophils via western blotting ([1], please refer to Extended Data Fig. 1h). We agree that visual confirmation of the absence of S100A8/A9 protein is crucial for establishing the validity of our study.
(4) The Ca2+ measurements at LFA-1 nanoclusters using the Mrp14-/- Lyz2xGCamP5 are interesting; It is understood that the authors are correcting calcium levels by normalizing by LFA-1 cluster areas and that seems fine to me. The issue is that the total calcium signal seems decreased in Mrp14-/- cells compared to WT cells (Fig. 4E)...why is totalCa2+ low? Please discuss.
We thank the reviewer for this insightful comment. Indeed, our observations reveal reduced overall Ca2+ levels in Mrp14-/- neutrophils compared to WT neutrophils. Initially, we noticed a general decrease in Ca2+ intensity (Author response image 2A-B) and lifetime in Mrp14-/- neutrophils (Author response image 2C-D). Further analysis indicated that these differences in Ca2+ levels are localized specifically to the LFA-1 nanocluster sites. In contrast, the cytosolic Ca2+ levels outside of the LFA-1 nanocluster areas were comparable between Mrp14-/- and WT neutrophils (Figure 4H-J). This suggests that the reduced total Ca2+ levels observed in Mrp14-/- neutrophils are primarily due to the impaired Ca2+ supply at the LFA-1 nanocluster areas. Our data support the notion that cytosolic S100A8/A9 plays a crucial role in actively supplying Ca2+ to LFA-1 nanoclusters during neutrophil crawling. In the absence of S100A8/A9, the increase in overall Ca2+ levels (summing both inside and outside LFA-1 nanocluster areas) is minimal, further highlighting the specific role of S100A8/A9 in maintaining localized Ca2+ concentrations at these crucial sites.
Author response image 2.
Overall Ca2+ levels in WT and Mrp14-/- neutrophils (A) Representative confocal images of neutrophils from WT Lyz2xGCaMP5 and Mrp14-/- Lyz2xGCaMP5 mice, labeled with Lyz2 td Tomato marker. The images illustrate overall cytosolic Ca2+ levels during neutrophil crawling flow chambers coated with E-selectin, ICAM-1, and CXCL1 (scale bar=10μm). (B) Quantitative analysis of total cytosolic Ca2+ intensity in single cells from WT Lyz2xGCaMP5 and Mrp14-/- Lyz2xGCaMP5 neutrophils measured over three time intervals: min 0-1, 5-6 and 9-10 [mean+SEM, n=5 mice per group, 56 (WT) and 54 (Mrp14-/-) neutrophils, 2way ANOVA, Sidak’s multiple comparison]. (C) Representative traces and (D) single cell analysis of total Ca2+ lifetime over the first 5 minutes in WT Lyz2xGCaMP5 and Mrp14-/- Lyz2xGCaMP5 neutrophils crawling on Eselectin, ICAM-1, and CXCL1 coated flow chambers recorded with FLIM microscopy [mean+SEM, n=3 mice per group, 111 (WT) and 95 (Mrp14-/-) neutrophils, 2way ANOVA, Sidak’s multiple comparison]. ns, not significant; *p≤0.05, **p≤0.01, ***p≤0.001.
(5) Even if the calcium level outside LFA-1 nanoclusters is not significant (Figure 4J), the data at min 9-10 in Figure 4J seems to be affected by a single event that may be an outlier. Additional data may be needed here.
We appreciate the reviewer’s attention to this detail. To address the concern regarding a potential outlier in the Ca2+ level measurements at 9-10 minutes in Figure 4J, we rigorously tested the dataset using the GraphPad outlier calculator. The analysis revealed that no data point was statistically identified as an outlier. Given that the current dataset is robust and the statistical analysis confirms the integrity of the data, we believe that the results accurately reflect the biological variability observed in our experiments. Therefore, we have not added additional data points at this stage but remain open to discussing this further.
(6) Finally, even though there is less calcium at LFA-1 clusters, that does not necessarily mean that "cytosolic S100A8/A9 plays an important role in Ca2+ "supply" at LFA-1 adhesion spots" as proposed. S100A8/A9 may play an indirect role in calcium availability. The analysis of the subcellular localization of S100A8/A9 at LFA-1 clusters together with calcium dynamics in stimulated WT cells would help support the authors' interpretation, which although possibly correct, seems speculative at this point.
We thank the reviewer for this insightful comment and fully agree that additional evidence regarding the subcellular localization of S100A8/A9 would strengthen our conclusions. Although live cell imaging of intracellular S100A8/A9 was initially challenging due to technical limitations, we have now performed additional experiments to address this issue. We conducted end-point measurements where we allowed WT neutrophils to crawl on E-selectin, ICAM-1, and CXCL1 coated flow chambers for 10 minutes. Following this, we fixed and permeabilized the cells to stain intracellular S100A9, along with LFA-1 and a cell tracker for segmentation. Confocal microscopy and subsequent single-cell analysis revealed a significant enrichment of S100A8/A9 at LFA-1 positive nanocluster areas compared to the surrounding cytosol (Figure 4K and 4L, new). This finding supports our hypothesis that S100A8/A9 plays a direct role in the localized supply of Ca2+ at LFA-1 adhesion spots, thus facilitating efficient neutrophil crawling under shear stress. These new data have been included in the revised manuscript, providing stronger evidence for our proposed mechanism.
Reviewer #2:
Napoli et al. provide a compelling study showing the importance of cytosolic S100A8/9 in maintaining calcium levels at LFA-1 nanoclusters at the cell membrane, thus allowing the successful crawling and adherence of neutrophils under shear stress. The authors show that cytosolic S100A8/9 is responsible for retaining stable and high concentrations of calcium specifically at LFA-1 nanoclusters upon binding to ICAM-1, and imply that this process aids in facilitating actin polymerisation involved in cell shape and adherence. The authors show early on that S100A8/9 deficient neutrophils fail to extravasate successfully into the tissue, thus suggesting that targeting cytosolic S100A8/9 could be useful in settings of autoimmunity/acute inflammation where neutrophil-induced collateral damage is unwanted.
The authors appreciate reviewer #2's insightful comments and suggestions. Below are our detailed responses:
(1) Extravasation is shown to be a major defect of Mrp14-/- neutrophils, but the Giemsa staining in Figure 1H seems to be quite unspecific to me, as neutrophils were determined by nuclear shape and granularity. It would have perhaps been more clear to use immunofluorescence staining for neutrophils instead as seen in Supplementary Figure 1A (staining for Ly6G or other markers instead of S100A9).
We acknowledge the reviewer's concern. However, Giemsa staining is a well-established method in hematology, histology, cytology, and bacteriology, widely recognized for its ability to distinguish leukocyte subsets based on nuclear shape and cytoplasmic characteristics. This method is extensively documented in the literature [2-5]. Its advantages are the easy morphological discrimination of leukocytes based on nuclear and cytoplasmic shape and conformation (Author response image 3).
Author response image 3.
Giemsa staining of extravasated leukocyte subsets. (A) Representative image of Giemsa-stained cremaster muscle tissue post-TNF stimulation. The image clearly differentiates leukocyte subsets (white arrow = neutrophils, yellow arrow = eosinophils, red arrow = monocytes). Scale bar = 50µm.
(2) The representative image for Mrp14-/- neutrophils used in Figure 4K to demonstrate Ripley's K function seems to be very different from that shown above in Figures 4C and 4F.
The reviewer correctly observed that the cell in Figure 4K is different from those in Figures 4C and 4F. This is intentional, as Figure 4K is meant to show a representative image that accurately reflects the overall results of the experiments. We assure the reviewer that all cells analyzed in Figures 4C and 4F were also included in the analysis for Figure 4K.
(3) Although the authors have done well to draw a path linking cytosolic S100A8/9 to actin polymerisation and subsequently the arrest and adherence of neutrophils in vitro, the authors can be more explicit with the analysis - for example, is the F-actin co-localized with the LFA-1 nanoclusters? Does S100A8/9 localise to the membrane with LFA-1 upon stimulation? Lastly, I think it would have been very useful to close the loop on the extravasation observation with some in vitro evidence to show that neutrophils fail to extravasate under shear stress.
We thank the reviewer for this comment and questions.
Concerning the co-localization of F-actin with LFA-1 nanoclusters and S100A8/9 localization: We appreciate the reviewer's interest in the co-localization between F-actin and LFA-1. Unfortunately, due to the limitations of our GCaMP5 mouse model (with neutrophils labeled with td-Tomato and eGFP for LyzM and Ca2+), we could only stain for either LFA-1 or F-actin at a time. However, in our F-actin movies, we observed that F-actin predominantly localizes at the rear of the cell, while LFA-1 is more uniformly distributed at the plasma membrane.
Regarding S100A8/A9 localization, as mentioned in response to Reviewer 1's sixth point, we now conducted endpoint measurements. We stained neutrophils with cell tracker green CMFDA and LFA-1, allowed them to crawl on E-selectin, ICAM-1, and CXCL1-coated flow chambers, and then performed intracellular S100A9 staining after fixation and permeabilization. Our analysis shows higher S100A9 intensity at LFA-1 positive areas compared to LFA-1 negative areas (Figure 4K and 4L, new). This indicates that S100A8/A9 indeed concentrates Ca2+ at LFA-1 nanoclusters, supporting adhesion and post-arrest modification events under flow.
Regarding the extravasation defect under shear stress: To address the reviewer's suggestion, we performed transwell migration assays under static conditions. Our results show no significant difference in transmigration between WT and Mrp14-/- neutrophils without flow, indicating that the extravasation defect in Mrp14-/- neutrophils is shear-dependent. This supports our hypothesis that S100A8/A9-mediated Ca2+ supply at LFA-1 nanoclusters is critical under flow conditions (Author response image 4).
Author response image 4.
Static Transmigration assay. (a) Transmigration of WT and Mrp14-/- neutrophils in static transwell assays (3um pore size, 45min migration time) showing spontaneously migration (PBS) or migration towards CXCL1. [mean+SEM, n=3 mice per group, 2way ANOVA, Sidak’s multiple comparison]. ns, not significant; *p≤0.05, **p≤0.01, ***p≤0.001.
Additional References
(1) Pruenster, M., et al., E-selectin-mediated rapid NLRP3 inflammasome activation regulates S100A8/S100A9 release from neutrophils via transient gasdermin D pore formation. Nature Immunology, 2023. 24(12): p. 2021-2031.
(2) Kuwano, Y., et al., Rolling on E- or P-selectin induces the extended but not high-affinity conformation of LFA-1 in neutrophils. Blood, 2010. 116(4): p. 617-24.
(3) Porse, B., Mouse Hematology – A Laboratory Manual. European Journal of Haematology, 2010. 84(6): p. 554-554.
(4) Frommhold, D., et al., Protein C concentrate controls leukocyte recruitment during inflammation and improves survival during endotoxemia after efficient in vivo activation. Am J Pathol, 2011. 179(5): p. 2637-50.
(5) Braach, N., et al., RAGE Controls Activation and Anti-Inflammatory Signalling of Protein C. PLOS ONE, 2014. 9(2): p. e89422.
-
eLife Assessment
This important study investigates the contribution of cytosolic S100A/8 to neutrophil migration to inflamed tissues. The authors provide convincing evidence for how the loss of cytosolic S100A/8 specifically affects the ability of neutrophils to crawl and subsequently adhere under shear stress. This study will be of interest in fields where inflammation is implicated, such as autoimmunity or sepsis.
-
Reviewer #1 (Public review):
Summary:
In this manuscript by Napoli et al, the authors study the intracellular function of Cytosolic S100A8/A9 a myeloid cell soluble protein that operates extracellularly as an alarmin, whose intracellular function is not well characterized. Here, the authors utilize state-of-the-art intravital microscopy to demonstrate that adhesion defects observed in cells lacking S100A8/A9 (Mrp14-/-) are not rescued by exogenous S100A8/A9, thus highlighting an intrinsic defect. Based on this result subsequent efforts were employed to characterize the nature of those adhesion defects.
Strengths:
The authors convincingly show that Mrp14-/- neutrophils have normal rolling but defective adhesion caused by impaired CD11b activation (deficient ICAM1 binding). Analysis of cellular spreading (defective in Mrp14-/- cells) are also sound. The manuscript then focuses on selective signaling pathways and calcium measurements. Overall, this is a straightforward study of biologically important proteins and mechanisms.
Weaknesses:
Some suggestions are included below to improve this manuscript.
-
Reviewer #2 (Public review):
Summary:
Napoli et al. provide a compelling study showing the importance of cytosolic S100A8/9 in maintaining calcium levels at LFA-1 nano clusters at the cell membrane, thus allowing the successful crawling and adherence of neutrophils under shear stress. The authors show that cytosolic S100A8/9 is responsible for retaining stable and high concentrations of calcium specifically at LFA-1 nanoclusters upon binding to ICAM-1, and imply that this process aids in facilitating actin polymerisation involved in cell shape and adherence. The authors show early on that S100A8/9 deficient neutrophils fail to extravasate successfully into the tissue, thus suggesting that targeting cytosolic S100A8/9 could be useful in settings of autoimmunity/acute inflammation where neutrophil-induced collateral damage is unwanted.
Strengths:
Using multiple complementary methods from imaging to western blotting and flow cytometry, including extracellular supplementation of S100A8/9 in vivo, the authors conclusively prove a defect in intracellular S100A8/9, rather than extracellular S100A8/9 was responsible for the loss in neutrophil adherence, and pinpointed that S100A8/9 aided in calcium stabilisation and retention at the plasma membrane.
Weaknesses:
(1) Extravasation is shown to be a major defect of Mrp14-/- neutrophils, but the Giemsa staining in Figure 1H seems to be quite unspecific to me, as neutrophils were determined by nuclear shape and granularity, which could be affected by the angle at which the nucleus is viewed. It would have perhaps been cleaner/clearer to use immunofluorescence staining for neutrophils instead as seen in Supplementary Figure 1A (staining for Ly6G or other markers instead of S100A9).
Addressed issues:
(1) The representative image for Mrp14-/- neutrophils used in Figure 4K to demonstrate the Ripley's K function seems to be very different from that shown above in Figure 4C and 4F. In their response to reviewers, the authors reassure that all data has been included in the analysis.
(2) In the initial submission the authors needed to provide a more direct linkage between cytosolic S100A8/9 and actin polymerisation, which subsequently results in the arrest and adherence of neutrophils. The authors did an additional experiment indicating the co-localization of S100A8/9 with LFA-1, indicating that the spatial localisation of S100A8/9 does shift towards the membrane with activation. Further, the authors confirm that the defect is only apparent only in conditions of shear stress, as transwell migration of Mrp14-/- neutrophils is not affected.
-
-
www.biorxiv.org www.biorxiv.org
-
Author response:
The following is the authors’ response to the original reviews.
Public Reviews:
Reviewer #1 (Public Review):
Summary:
The study characterized the cellular and molecular mechanisms of spike timing-dependent long-term depression (t-LTD) at the synapses between excitatory afferents from lateral (LPP) and medial (MPP) perforant pathways to granule cells (GC) of the dentate gyrus (DG) in mice.
Strengths:
The electrophysiological experiments are thorough. The experiments are systematically reported and support the conclusions drawn.
This study extends current knowledge by elucidating additional plasticity mechanisms at PP-GC synapses, complementing existing literature.
We thank the reviewer for the positive assessment of our work and the constructive suggestions to improve the manuscript.
Weaknesses:
To more conclusively define the pivotal role of astrocytes in modulating t-LTD at MPP and LPP GC synapses through SNARE protein-dependent glutamate release, as posited in this study, the authors could adopt additional methods, such as alternative mouse models designed to regulate SNARE-dependent exocytosis, as well as optogenetic or chemogenetic strategies for precise astrocyte manipulation during t-LTD induction. This would provide more direct evidence of the influence of astrocytic activity on synaptic plasticity.
We thank the reviewer for the suggestion. As stated in the manuscript and in figure 4, we already used two different approaches (aBAPTA to interfere with astrocyte calcium signalling and dnSNARE mice (that have vesicular release impaired) to determine the involvement of astrocytes in the discovered forms of LTD, and both approaches clearly indicated the requirement of astrocytes for t-LTD. In BAPTA-treated astrocytes and in dnSNARE mice, t-LTD was prevented. Notwithstanding this, and as suggested by the reviewer, we used two additional approaches to confirm astrocyte participation. We loaded astrocytes with the light chain of the tetanus toxin (TeTxLC), which is known to block exocytosis by cleaving the vesicle-associated membrane protein, an important part of the SNARE complex (Schiavo et al., 1992, Nature 359, 832-835). In this experimental condition, we observed a clear lack of t-LTD at both (lateral and medial) pathways, thus confirming the requirement of astrocytes and the SNARE complex and vesicular release for both types of t-LTD. In addition, to gain more insight into the fact that glutamate is released by astrocytes, we blocked glutamate release from astrocytes by loading the astrocytes with Evans blue, known to interfere with glutamate uptake into vesicles as it inhibits the vesicular glutamate transporter (VGLUT). In this experimental condition, again t-LTD was prevented, indicating that t-LTD requires Ca2+dependent exocytosis of glutamate from astrocytes.
Reviewer #2 (Public Review):
Summary:
This work reports the existence of spike timing-dependent long-term depression (t-LTD) of excitatory synaptic strength at two synapses of the dentate gyrus granule cell, which are differently connected to the entorhinal cortex via either the lateral or medial perforant pathways (LPP or MPP, respectively). Using patch-clamp electrophysiological recording of tLTD in combination with either pharmacology or a genetically modified mouse model, they provide information on the differences in the molecular mechanism underlying this t-LTD at the two synapses.
Strengths:
The two synapses analyzed in this study have been understudied. This new data thus provides interesting new information on a plasticity process at these synapses, and the authors demonstrate subtle differences in the underlying molecular mechanisms at play. Experiments are in general well controlled and provide robust data that are properly interpreted.
We thank the reviewer for the positive assessment of our work and the constructive suggestions to improve the manuscript.
Weaknesses:
- Caution should be taken in the interpretation of the results to extrapolate to adult brain as the data were obtained in P13-21 days old mice, a period during which synapses are still maturing and highly plastic.
We thank the reviewer for noticing this. In fact, our experiments were intentionally performed in young animals (P13-21), just knowing that this is a critical period of plasticity. We indicate that in the methods, results, and discussion (where we discuss that in some detail) sections.
- In experiments where the drug FK506 or thapsigargin are loaded intracellularly, the concentrations used are as high as for extracellular application. Could there be an error of interpretation when stating that the targeted actors are necessarily in the post-synaptic neuron? Is it not possible for the drug to diffuse out of the cell as it is evident that it can enter the cell when applied extracellularly?
We thank the reviewer for rising this point. While it would be possible that these compounds cross the cell membranes, to do it and to pass to other cells, this would, in principle, require a relatively long time to occur. Additionally, to have any effect, the same concentration or a relatively high concentration of that we put into the pipette has to reach other cells. Furthermore, even if a compound is able to cross a cell membrane during the duration of an experiment, after this, it may be exposed to the extracellular fluid where will be diluted and most probably washed out. For all these reasons, we do not see this very plausible. Notwithstanding this, and as suggested, we have repeated the experiments using lower concentrations of thapsigargin (1 uM) and FK506 (1 uM), and have obtained the same results. These data are now included in the figure 3 and in the text.
- The experiments implicating glutamate release from astrocytes in t-LTD would require additional controls to better support the conclusions made by the authors. As the data stand, it is not clear, how the authors identified astrocytes to load BAPTA and if dnSNARE expression in astrocytes does not indirectly perturb glutamate release in neurons.
We thank the reviewer for rising this point. We now indicate how astrocytes have been identified to load BAPTA. We reply to this in detail in the “Recommendations for the authors” from reviewer 2.
Significance:
While this is the first report of t-LTD at these synapses, this plasticity process has been mechanistically well investigated at other synapses in the hippocampus and in the cortex. Nevertheless, this new data suggests that mechanistic differences in the induction of t-LTD at these two DG synapses could contribute to the differences in the physiological influence of the LPP and MPP pathways.
Reviewer #3 (Public Review):
Coatl et al. investigated the mechanisms of synaptic plasticity of two important hippocampal synapses, the excitatory afferents from lateral and medial perforant pathways (LPP and MPP, respectively) of the entorhinal cortex (EC) connecting to granule cells of the hippocampal dentate gyrus (DG). They find that these two different EC-DG synaptic connections in mice show a presynaptically expressed form of long-term depression (LTD) requiring postsynaptic calcium, eCB synthesis, CB1R activation, astrocyte activity, and metabotropic glutamate receptor activation. Interestingly, LTD at MPP-GC synapses requires ionotropic NMDAR activation whereas LTD at LPP-GC synapse is NMDAR independent. Thus, they discovered two novel forms of t-LTD that require astrocytes at EC-GC synapses. Although plasticity of EC-DG granule cell (GC) synapses has been studied using classical protocols, These are the first analysis of the synaptic plasticity induced by spike timing dependent protocols at these synapses. Interestingly, the data also indicate that t-LTD at each type of synapse require different group I mGluRs, with LPP-GC synapses dependent on mGluR5 and MPP-GC t-LTD requiring mGluR1.
The authors performed a detailed analysis of the coefficient of variation of the EPSP slopes, miniature responses and different approaches (failure rate, PPRs, CV, and mEPSP frequency and amplitude analysis) they demonstrate a decrease in the probability of neurotransmitter release and a presynaptic locus for these two forms of LTD at both types of synapses. By using elegant electrophysiological experiments and taking advantage of the conditional dominant-negative (dn) SNARE mice in which doxycycline administration blocks exocytosis and impairs vesicle release by astrocytes, they demonstrate that both LTD forms require the release of gliotransmitters from astrocytes. These data add in an interesting way to the ongoing discussion on whether LTD induced by STDP participates in refining synapses potentially weakening excitatory synapses under the control of different astrocytic networks. The conclusions of this paper are mostly well supported by data, but some aspects the results must be clarified and extended.
We thank the reviewer for the positive assessment of our work and the constructive suggestions to improve the manuscript.
(1) It should be clarified whether present results are obtained with or without the functional inhibitory synapse activation. It is not clear if GABAergic synapses are blocked or not. If GABAergic synapses are not blocked authors must discuss whether the LTD of the EPSPs is due to a decrease in glutamatergic receptor activation or an increase in GABAergic receptor activation. Moreover, it should be recommended to analyze not only the EPSPs but also the EPSCs to address whether the decrease in synaptic transmission is caused by a decrease in the input resistance or by a decrease in the space constant (lambda).
We thank the reviewer for rising these points. GABAergic inhibition was not blocked in our experiments. The observed forms of t-LTD seem to be due to a decrease in glutamate release probability as indicated in the manuscript, mediated by the mechanism we uncover and describe here. To determine and clarify whether GABA receptors have any role in these forms of t-LTD, we repeated the experiments in the presence of the GABAA and GABAB receptors antagonists bicuculline and SCH50911, respectively. Blocking GABA receptors do not prevent or affect t-LTD at LPP- or MPP-GC synapses, that is still present and with a similar magnitude that controls. These results indicating that these receptors are not involved in these forms of t-LTD. These results are now included in the text in the results section (page 8) and as a new figure S1. In our experiments, no changes in input resistance or space constant were observed, and importantly, no changes were observed in the amplitude/slopes of EPSP in the control pathway that does not undergo plasticity protocol that we routinely use in our experiments.
(2) Authors show that Thapsigargin loaded in the postsynaptic neuron prevents the induction of LTD at both synapses. Analyzing the effects of blocking postsynaptic IP3Rs (Heparin in the patch pipette) and Ryanodine receptors (Ruthenium red in the patch pipette) is recommended for a deeper analysis of the mechanism implicated in the induction of this novel forms of LTD in the hippocampus.
We thank the reviewer for this suggestion. We repeated the experiments loading the postsynaptic cell with heparin and ruthenium red using the path pipette. In these experimental conditions, we observed that t-LTD was not affected by the heparin treatment (discharging a role of IP3Rs), but that it was prevented by the ruthenium red treatment (indicating the requirement of ryanodine receptors). We include now this data in the text (page 12) and in the Figure 3a, b, e, f.
(3) Authors nicely demonstrate that CB1R activation is required in these forms of LTD by blocking CB1Rs with AM251, however an interesting unanswered question is whether CB1R activation is sufficient to induce this synaptic plasticity. This reviewer suggests studying whether applying puffs of the CB1R agonist, WIN 55,212-2, could induce these forms of LTD.
We thank the reviewer for this suggestion. We repeated the experiments adding WIN55, 212-2 as suggested. The activation of CB1R by puffs of the agonist WIN 55, 212-2 to the astrocyte, directly induced LTD at both LPP- and MPP-GC synapses. We include now this data in the text (page 14) and in the Figure 3c, d, g, h.
(4) Finally, adding a last figure with a cartoon summarizing the proposed model of action in these novel forms of LTD would add a positive value and would help the reading of the manuscript, especially in those aspects related with the discussion of the results.
We thank the reviewer for the suggestion. We include now a figure showing the proposed mechanisms (Figure 5).
The extension of these results would improve the manuscript, which provides interesting results showing two novel forms of presynaptic t-LTD in the brain synapses with different action mechanisms probably implicated in the different aspects of information processing.
Recommendations for the authors:
Reviewer #1 (Recommendations For The Authors):
There are just a few aspects that could be clarified to bolster the authors' conclusions.
The author centered the conclusion of their study on the role of astrocytic activity in regulating these two forms of plasticity (see title). To strengthen the evidence that astrocytes are key regulators of t-LTD at MPP and LPP GC synapses by regulating SNARE protein-dependent glutamate release, additional complementary approaches should be considered, such as other mouse models enabling the control of SNARE-dependent exocytosis and/or optogenetic/chemogenetic tools to selectively manipulate astrocytes during the induction of t-LTD, thereby directly assessing the impact of astrocytic activity on synaptic plasticity. Implementing calcium imaging or glutamate sensors to visualize the dynamics of astrocytic calcium signaling and glutamate release during t-LTD could be also considered.
We thank the reviewer for the suggestion. As stated in the manuscript and in figure 4, we already used two different approaches (aBAPTA to interfere with astrocyte calcium signalling and dnSNARE mice (that have vesicular release impaired) to determine the involvement of astrocytes in the discovered forms of LTD, and both approaches clearly indicated the requirement of astrocytes for t-LTD. In BAPTA-treated astrocytes and in dnSNARE, t-LTD was prevented. Notwithstanding this, and as suggested by the reviewer, we used two additional approaches to confirm astrocytes participation. We loaded astrocytes with the light chain of the tetanus toxin (TeTxLC), which is known to block exocytosis by cleaving the vesicle-associated membrane protein, an important part of the SNARE complex (Schiavo et al., 1992, Nature 359, 832-835). In this experimental condition, we observed a clear lack of t-LTD at both (lateral and medial) pathways, thus confirming the requirement of astrocytes and the SNARE complex and vesicular release for both types of t-LTD. In addition, to gain more insight into the fact that glutamate is released by astrocytes, we blocked glutamate release from astrocytes by loading the astrocytes with Evans blue, known to interfere with glutamate uptake into vesicles as it inhibits the vesicular glutamate transporter (VGLUT). In this experimental condition, again t-LTD was prevented, indicating that t-LTD requires Ca2+-dependent exocytosis of glutamate from astrocytes. This information is now included in the text, pages 14 and 15 and in figure 4.
- How were astrocytes identified to be loaded with BAPTA? The author should clarify this methodological aspect and provide confocal images of patched astrocytes situated 50-100 um from the recorded neuron.
We thank the reviewer for the comment. We include now this information in the Methods section (page 6) and in figure S3. Astrocytes were identified by their rounded morphology under differential interference contrast microscopy, and were characterized by low membrane potential, low membrane resistance and passive responses (they do not show action potentials) to both negative and positive current injection.
- Please provide confocal images of EGFP expression in the DG astrocytes of dnSNARE mice both on and off Dox, to verify transgene expression in astrocytes
We thank the reviewer for this suggestion. We now include an image of GFP expression in the DG astrocytes of off Dox dnSNARE mice. We did not provide the animals with doxycycline since birth and thus the gene was constantly expressed. We now show this image in Fig. S3. All the pups and mice are not DOX fed, meaning that the transgenes are continuously being expressed and therefore the exocytosis should be blocked in astrocytes.
Minor points:
Lines 250-253: It is mentioned that TTX is added at baseline, washed out for the t-LTD experiment, and then reapplied post t-LTD. I suggest clarifying the timing and rationale for this application for a broad audience.
We thank the reviewer for the suggestion. We now include some information related to the timing and rationale of the experiment phases (page 9).
The discussion is quite detailed and provides a comprehensive overview of the study's findings. To enhance clarity and impact, the authors might consider to,
-
add subheadings and bullet points for key findings. This will improve readability.
-
this section could benefit from streamlining to avoid redundancy.
-
some sentences could be made more concise without losing meaning.
We thank the reviewer for these suggestions. We now include subheadings in the discussion section to improve readability and have made some sentences more concise and simple without losing meaning.
In figure legends, consistency with capitalization should be maintained, for example in the statistical significance notation, ***P < 0.001" or ***p < 0.001")
We now include p<0.001 in the figure legend 4 for consistency.
Reviewer #2 (Recommendations For The Authors):
Major:
- All results were obtained in young still quite immature synapses. To strengthen the significance of the findings, the authors could repeat some of the main experiments in adult mice (8 weeks and beyond). If not, they should state clearly that these mechanisms were only evidenced in early post-natal conditions.
We thank the reviewer for noticing this. In fact, our experiments were intentionally performed in young animals (P13-21), just knowing that this is a critical period of plasticity. As the reviewer suggests, we indicate that in the methods (page 5), results (page 8), and discussion (page 19) (where we discuss that in some detail) sections.
- Lines 246-249 and fig 1f,p: Authors need to perform a statistical test on these two graphs to support their claim that 'A plot of CV-2 versus the change in the mean evoked EPSP 246 slope (M) before and after t-LTD mainly yielded points below the diagonal line at LPP-GC and MPP-GC synapses'.
That could not be clear in the previous version. We observed an error in the points (with some points missing) of one of the graphs that we have corrected. In addition, and as suggested by the reviewer we performed a regression analysis that confirms the conclusions stated. This is now included in the text (page 9). Thus, we have added information about mean values ± SEM in the text and the linear regression of the data for LPP-GC (Mean = 0.607 ± 0.054 vs 1/CV2 = 0.439 ± 0.096, R2 = 0.337; n = 14) and MPP-GC synapses (Mean = 0.596 ± 0.056 vs 1/CV2 = 0.461 ± 0.090, R2 = 0.168; n = 13), respectively. Data yielded on the dotted horizontal line, 1/CV2 = 1, indicates no change in the probability of release, in contrast, data yielded below the dotted diagonal line is suggestive of a change in the probability of release parameters (for review, see Brock et al., 2020, Front Synaptic Neurosci 12, 11).
- We are not sure that the experiment with the MK801 provided in the patch pipet can be interpreted correctly (Figure 2 a,b and e,f). How sure are the authors that, when applying MK801 in the patch pipet, it can reach its binding site within the pore? The concentration of MK801 is also very high (500 microM) and used at the same concentration extracellularly and intracellularly. Why did the authors not use lower concentration when applied intracellularly?
We thank the reviewer for rising this point. MK801 in the pipette is reaching the pore when loaded postsynaptically as when we record NMDA currents from postsynaptic neurons loaded with MK801, these currents are blocked. We include now a control experiment showing the effect of postsynaptic MK801 on NMDA current in the text (page 10). NMDA currents has been recorded at +40 mV, blocking AMPAR and GABAR with NBQX and bicuculline. Related to the concentration, it has been described that the affinity from the internal site is much lower (several orders of magnitude) than from the extracellular side(Sun et al., 2018 Neuropharmacology, 143, 122-129) and the concentrations used have been extensively used in previous studies. It is clear that the concentrations used in the present work blocked NMDAR currents but did not prevent LTD.
- Linked to the point above, for the intracellular application of FK506 and thapsigargin, the concentrations used extracellularly and intracellularly are identical. The authors could have used lower concentrations for the intracellular application. Also, how can they be sure of the correct interpretation of these data as the drug essentially reaching a post-synaptic target when applied intracellularly? If the drug can enter the neuron, why could it not diffuse out of the neuron especially when loaded at a high concentration? Maybe using a lower concentration when applied intracellularly could at least partially address this issue.
It is evident that it can enter the cell when applied extracellularly?
We thank the reviewer for rising this point. While it would be possible that these compound cross the cell membranes, to do it and to pass to other cells, this would, in principle, require a relatively long time to occur. Additionally, to have any effect, the same concentration or a relatively high concentration of that we put into the pipette has to reach other cells. Furthermore, even if a compound is able to cross a cell membrane during the duration of an experiment, after this, it may be exposed to the extracellular fluid where it will be diluted and most probably washed out. For all these reasons, we do not see this very plausible. Notwithstanding this, we have repeated the experiments using lower concentrations of thapsigargin (1 uM) and FK506 (1 uM) and have obtained the same results. These data are now included in the figure 3 and the numbers in the text have been updated (pages 12-13).
- The data supporting the possibility of glutamate release by astrocytes as a main source of glutamate to promote t-LTD needs to be strengthened. In experiment Figure a-h, it is not clear how the authors recognize astrocytes to patch. No details are provided in the methods or in the main text. If we understand correctly, it is only by performing a current steps protocol to ensure that the patched cell did not produce action potentials. If this was the case, the authors need to be more specific and provide details of this protocol. More importantly, the one trace that was provided in Figures 4a and 4f suggests, albeit by a rough estimation that we made with a ruler, that the highest current step only depolarized the cell to about -40 mV. This is not sufficient to ensure that the recorded cell is not a neuron. The authors should increase their steps to high depolarizing currents to ensure that the patched cell is not a neuron. Better yet, they should load the cell with an dye to process the slice after the electrophysiological recording for immunohistochemistry to ensure that it was indeed an astrocyte. Alternatively, they can try to aspirate the cell content at the end of the recording to perform a qPCR for astrocyte markers eg. GFAP.
We thank the reviewer for the comment. We include now information regarding how astrocytes were identified (also raised by reviewer 1) in the Methods section (page 6) and in figure S3. Astrocytes were identified by their rounded morphology under differential interference contrast microscopy, eGFP fluorescence (astrocytes from dnSNARE mice), and were characterized by low membrane potential, low membrane resistance and passive responses (they do not show action potentials) to both negative and positive current injection.
We agree with the reviewer that in figure 4a and 4f, the step protocol might not be completely clear. For this, we revised that and now include in a clearer way that we applied pulses that depolarized astrocytes beyond -20 mV, with no action potentials found at any point. We also include now this in figure S3.
- Related to the point above, the use of the model expressing dnSNARE in astrocytes is elegant. Yet, to really interpret the data obtained in these slices as a lack of vesicle release (and most importantly glutamate) we think that the authors should ensure that glutamate release from nearby neurons is not impacted. They could patch nearby neurons in dnSNARE slices and test PPR or synaptic fatigue when stimulating either the LPP or MPP. The authors should avoid overinterpretation of these results. As it stands, it is not evident that dnSNARE expression does not perturb other mechanisms within the astrocyte that in turn perturb pre-synaptic glutamate release. Adding back glutamate as puffs does not help to disentangle this issue.
To gain more insight into the fact that glutamate is released by astrocytes we blocked glutamate release from astrocytes by loading the astrocytes with Evans blue, known to interfere with glutamate uptake into vesicles as it inhibits the vesicular glutamate transporter (VGLUT). In this experimental condition, as indicated above, t-LTD was prevented, indicating that t-LTD requires Ca2+-dependent exocytosis of glutamate from astrocytes. This is included in the text (page 15) and in figure 4d,e, i, j.
In addition, we loaded astrocytes with the light chain of the tetanus toxin (TeTxLC) which is known to block exocytosis by cleaving the vesicle-associated membrane protein, an important part of the SNARE complex (Schiavo et al., 1992, Nature 359, 832-835). In this experimental condition, we observed a clear lack of t-LTD at both (lateral and medial) pathways, thus confirming the requirement of astrocytes and the SNARE complex and vesicular release for both types of t-LTD. These data indicate that t-LTD requires Ca2+-dependent exocytosis of glutamate from astrocytes. This information is now included in the text, page 14 and in figure 4.
Minor points:
- line 107, did the authors mean t-LTP and t-LTD? we don't understand STDP mentioned here.
We meant to say t-LTP. This is now corrected.
- line 108: should STDP be replaced by t-LTD as the authors only focused on this plasticity mechanism.
We agree, we indicate now t-LTD.
- line 131-132 : it is not clear when the animals were fed with doxycycline. If it was from birth, then the 'not' should be removed. Otherwise the authors should clearly state when the doxycyline was provided.
DOX was not provided and that means that the transgene was continuously expressed and therefore the exocytosis should be blocked in astrocytes. We express that clearer in page 5, methods section.
- line 223 : which hippocampal synapses? needs to be stated
As suggested this is now included in the text as for cortical synapses. Synapses are Schaffer collaterals SC-CA1 for hippocampus and layer L4-L2/3 for cortical synapses (page 8).
- line 273: what do the authors mean when writing 'from'? We don't understand the data provided on this line.
We thank the reviewer for noticing this. That refers to the amplitude of NMDAR-mediated currents average before and after D-AP5 or MK801. We express this now in a clearer way (page 10, from 57±8 pA to 6±5 pA).
- line 286 : why do the authors point out work on GluN2B and GluN3A only here when they first investigate GluN2A contribution to t-LTD? what about previous data on GluN2A?
We have now expressed this in a different way to make it clear. We wanted to indicate that the available data for presynaptic NMDAR at MPP-GC synapses has been indicated to contain GluN2B and GluN3A subunits and to our knowledge, no data indicate that they contain GluN2A subunits.
- line 428 : what do the authors mean by 'not least' ?
This is a typo and we have removed that from the text.
Reviewer #3 (Recommendations For The Authors):
My only suggestion for improving data presentation in the manuscript would be to split some figures of the paper. In my opinion, the figures are too dense and therefore difficult to follow for the broad audience of eLife readers. In addition, a real image of the recorded dentate granule cells in the slice showing also the location of the real stimulation electrodes would significantly improve the presentation of Figure 1.
We thank the reviewer for the suggestion, but we would prefer to let the figures as they are organized, as while we agree in some cases they are a bit big, in this way it is easier to compare lateral and medial pathways. For this, it could be better to let information regarding the two pathways in the same figure. Nevertheless, we try now to make figures clearer to use a columnar organization of the figures for each pathway what we think, would make easier to compare pathways. As the reviewer suggests we include now a real image of the recorded dentate granule cells in the slice showing also the location of the real stimulation electrodes in Figure 1, that we agree will improve the presentation of this figure and thank the reviewer for the suggestion.
-
eLife Assessment
This valuable study reports the existence of specific spike-timing dependent synaptic plasticity processes at two excitatory synapses of the dentate gyrus granule cells. These synapses link the entorhinal cortex and the dentate gyrus but via different circuits. With state-of-the-art patch-clamp electrophysiological analysis, the authors provide convincing information on the molecular mechanisms underlying these 2 forms of synaptic plasticity showing a critical role for astrocytes in both alongside some features distinctive to each pathway. These results will be of interest to neuroscientists as they uncover detailed plasticity mechanisms involving the hippocampus.
-
Reviewer #1 (Public review):
Summary:
The study characterized the cellular and molecular mechanisms of spike timing-dependent long-term depression (t-LTD) at the synapses between excitatory afferents from lateral (LPP) and medial (MPP) perforant pathways to granule cells (GC) of the dentate gyrus (DG) in mice.
Strengths:
The electrophysiological experiments are thorough. The experiments are systematically reported and support the conclusions drawn.<br /> This study extends current knowledge by elucidating additional plasticity mechanisms at PP-GC synapses, complementing existing literature.
Comments on the revised version:
The revised study introduces two additional approaches to confirm astrocyte involvement in t-LTD: loading astrocytes with tetanus toxin light chain to inhibit exocytosis, and using Evans blue to block vesicular glutamate uptake. These new findings further reinforce the conclusion that t-LTD relies on Ca2+-dependent glutamate exocytosis from astrocytes.
-
Reviewer #2 (Public review):
Summary:
This work reports the existence of spike timing-dependent long-term depression (t-LTD) of excitatory synaptic strength at two synapses of the dentate gyrus granule cell, which are differently connected to the entorhinal cortex via either the lateral or medial perforant pathways (LPP or MPP, respectively). Using patch-clamp electrophysiological recording of tLTD in combination with either pharmacology or a genetically modified mouse model, they provide information on the differences in the molecular mechanism underlying this t-LTD at the two synapses.
Strengths:
The two synapses analyzed in this study have been understudied. This new data thus provides interesting new information on a plasticity process at these synapses, and the authors demonstrate subtle differences in the underlying molecular mechanisms at play. Experiments are in general well controlled and provide robust data that are properly interpreted.<br /> The data provided to demonstrate that glutamate release from astrocytes is necessary for these plasticity mechanisms are strong. This is particularly interesting as another example of how astrocytes regulate synapse plasticity.
Weaknesses:
This work was performed at young synapses and the highlighted mechanisms are therefore pertinent to this age, as acknowledged by the authors. We currently don't know if these mechanisms are still at play at the adult synapse.
Significance:
While this is the first report of t-LTD at these synapses, this plasticity process has been mechanistically well investigated at other synapses in the hippocampus and in the cortex. Nevertheless, this new data suggests that mechanistic differences in the induction of t-LTD at these two DG synapses could contribute to the differences in the physiological influence of the LPP and MPP pathways.
-
Reviewer #3 (Public review):
Coatl et al. investigated the mechanisms of synaptic plasticity of two important hippocampal synapses, the excitatory afferents from lateral and medial perforant pathways (LPP and MPP, respectively) of the entorhinal cortex (EC) connecting to granule cells of the hippocampal dentate gyrus (DG). They find that these two different EC-DG synaptic connections in mice show a presynaptically expressed form of long-term depression (LTD) requiring postsynaptic calcium, eCB synthesis, CB1R activation, astrocyte activity, and metabotropic glutamate receptor activation. Interestingly, LTD at MPP-GC synapses requires ionotropic NMDAR activation whereas LTD at LPP-GC synapse is NMDAR independent. Thus, they discovered two novel forms of t-LTD that require astrocytes at EC-GC synapses. Although plasticity of EC-DG granule cell (GC) synapses has been studied using classical protocols, These are the first analyses of the synaptic plasticity induced by spike timing dependent protocols at these synapses. Interestingly, the data also indicate that t-LTD at each type of synapse require different group I mGluRs, with LPP-GC synapses dependent on mGluR5 and MPP-GC t-LTD requiring mGluR1.
The authors performed a detailed analysis of the coefficient of variation of the EPSP slopes, miniature responses and different approaches (failure rate, PPRs, CV, and mEPSP frequency and amplitude analysis) they demonstrate a decrease in the probability of neurotransmitter release and a presynaptic locus for these two forms of LTD at both types of synapses. By using elegant electrophysiological experiments and taking the advantage of the conditional dominant-negative (dn) SNARE mice in which doxycycline administration blocks exocytosis and impairs vesicle release by astrocytes, they demonstrate that both LTD forms require the release of gliotransmitters from astrocytes. These data add in an interesting way to the ongoing discussion on whether LTD induced by STDP participates in refining synapses potentially weakening excitatory synapses under the control of different astrocytic networks. The conclusions of this paper are well supported by data.
-
-
www.biorxiv.org www.biorxiv.org
-
Author response:
The following is the authors’ response to the original reviews.
The reviewers found this manuscript to present convincing evidence for associative and non-associative behaviors elicited in male and female mice during a serial compound stimulus Pavlovian fear conditioning task. The work adds to ongoing efforts to identify multifaceted behaviors that reflect learning in classic paradigms and will be valuable to others in the field. The reviewers do note areas that would benefit from additional discussion and some minor gaps in data reporting that could be filled by additional analyses or experiments.
We thank the reviewers and the editors for their thoughtful and constructive critiques of our manuscript. We have updated our manuscript with data from additional experiments as suggested by the reviewers, and we have significantly edited the text and figures to reflect these additions. Our detailed, point-by-point responses are below.
Reviewer #1 (Public Review):
The main goal of the study was to tease apart the associative and non-associative elements of cued fear conditioning that could influence which defensive behaviors are expressed. To do this, the authors compared groups conditioned with paired, unpaired, or shock only procedures followed by extinction of the cue. The cue used in the study was not typical; serial presentation of a tone followed by a white noise was used in order to assess switches in behavior across the transition from tone to white noise. Many defensive behaviors beyond the typical freezing assessments were measured, and both male and female mice were included throughout. The authors found changes in behavioral transitions from freezing to flight during conditioning as the tone transitioned into white noise, and a switch in freezing during extinction such that it became high during the white noise as flight behavior decreased. Overall, this was an interesting analysis of transitions in defensive behaviors to a serially presented cue consisting of two auditory stimuli during conditioning and then extinction.
We thank the Reviewer for their supportive insight.
There are some concerns regarding the possibility that the white noise is more innately aversive than the tone, inducing more escape-like behaviors compared to a tone, especially since the shock only group also showed increased escape-like behaviors during the white noise versus tone. This issue would have been resolved by adding a control group where the order of the auditory stimuli was reversed (white noise->tone).
We appreciate this concern, and we have added two additional groups to address this possibility. We have conducted the same experimental paradigm with 2 reverse-SCS groups (WN—tone), one with paired (new PA-R group), and one with unpaired (new UN-R group), presentations to shock during conditioning. These experiments revealed that during conditioning day 2 in both reverse order groups, WN causes reductions in freezing and increases in locomotor activity (see revised Figure 2D), an effect that is stronger in the UN-R compared to the PA-R group. This locomotor effect is neither darting nor escape jumping in the PA-R group (revised Figure 3G, I; Figure 4G). In the UN-R group, WN induces more activity than the PA-R group (Figure 2D), including some jumping at WN onset (Figure 3H), but no darting (Figure 4G). It is worth noting that WN does not elicit defensive behavior before conditioning at the sound intensity we use (75dB; see Fadok et al. 2017, Borkar et al. 2020, Borkar et al. 2024). Together, these results suggest that WN is an inherently more salient stimulus than tone, and it can elicit defensive behaviors in shock-sensitized mice through non-associative mechanisms. Indeed, stimulus salience is a key factor in this paradigm for inducing activity (see Hersman et al. 2020).
While the more complete assessment of defensive behaviors beyond freezing is welcomed, the main conclusions in the discussion are overly focused on the paired group and the associative elements of conditioning, which would likely not be surprising to the field. If the goal, as indicated in the title, was to tease apart the associative and non-associative elements of conditioning and defensive behaviors, there needs to be a more emphasized discussion and explicit identification of the non-associative findings of their study, as this would be more impactful to the field.
We have rewritten the Discussion to provide a greater emphasis on the findings of the study that are more related to non-associative mechanisms. For example, we argue that cue-salience and changes in stimulus intensity can induce non-associative increases in locomotor behavior and tail rattling in shock-sensitized mice.
Reviewer #2 (Public Review):
Summary:
The authors examined several defensive responses elicited during Pavlovian conditioning using a serial compound stimulus (SCS) as the conditioned stimulus (CS) and a shock unconditioned stimulus (US) in male and female mice. The SCS consisted of tone pips followed by white noise. Their design included 3 treatment groups that were either exposed to the CS and US in a paired fashion, in an unpaired fashion, or only exposed to the shock US. They compared freezing, jumping, darting, and tail rattling across all groups during conditioning and extinction. During conditioning, strong freezing responses to the tone pips followed by strong jumping and darting responses to the white noise were present in the paired group but less robust or not present in the unpaired or shock only groups. During extinction, tone-induced freezing diminished while the jumping was replaced by freezing and darting in the paired group. Together, these findings support the idea that associative pairings are necessary for conditioned defensive responses.
Strengths:
The study has strong control groups including a group that receives the same stimuli in an unpaired fashion and another control group that only receives the shock US and no CS to test the associative value of the SCS to the US. The authors examine a wide variety of defensive behaviors that emerge during conditioning and shift throughout extinction: in addition to the standard freezing response, jumping, darting, and tail rattling were also measured.
We thank the Reviewer for their supportive appraisal of this study’s strengths.
Weaknesses:
This study could have greater impact and significance if additional conditions were added (e.g., using other stimuli of differing salience during the SCS), and determining the neural correlates or brain regions that are differentially recruited during different phases of the task across the different groups.
In the revised manuscript, we have conducted experiments with 2 reverse-SCS groups (WN—tone): one with paired (new PA-R group), and one with unpaired (new UN-R group), presentations to shock during conditioning. These experiments revealed that during conditioning day 2 in both reverse order groups, WN causes reductions in freezing and increases in locomotor activity (see revised Figure 2D), an effect that is stronger in the UN-R compared to the PA-R group. This locomotor effect is neither darting nor escape jumping in the PA-R group (revised Figure 3G, I; Figure 4G). In the UN-R group, WN induces more activity than the PA-R group (Figure 2D), including some jumping at WN onset (Figure 3H), but no darting (Figure 4G). Indeed, stimulus salience is a key factor in this paradigm for inducing activity (see Hersman et al. 2020). Together, these results suggest that WN is an inherently more salient stimulus than tone, and it can elicit defensive behaviors in shock-sensitized mice through non-associative mechanisms. It is worth noting that WN does not elicit defensive behavior before conditioning at the sound intensity we use (75dB; see Fadok et al. 2017, Borkar et al. 2020, Borkar et al. 2024).
We agree that determining the neuronal correlates and brain regions that are involved in defensive ethograms at various stages within this paradigm is of great importance, but we feel that those experiments are beyond the scope of the current study, which is focused on identifying behavioral differences based on associative and non-associative factors.
Reviewer #1 (Recommendations For The Authors):
In LINES 72-73, authors say they used a "truly random procedure" as one of their control groups. Then in LINES 113-116, they describe this group as "unpaired" where the "SCS could not reliably predict footshock". Combined, it is unclear if this group is random or unpaired. The "truly random procedure" is defined, by the cited Rescorla paper, as "the two events are programmed entirely randomly and independently in such a way that some "pairings" of CS and US may occur by chance alone". So, truly random would indicate that the shock may occur during the cue, while unpaired indicates the shock was explicitly unpaired from the cue. If the authors used a random procedure, the groups need to be labeled as random, not unpaired, and the # of cues that happened to coincide with footshock per animal needs to be reported somewhere. If the authors used an unpaired procedure (which appears to be the case based on 40-60s ITI between SCS and footshock being reported), it needs to be clearer and consistent throughout that it was explicitly unpaired, as well as removing the claim in LINE 72-73 that they used a "truly random procedure".
We did indeed use an explicitly unpaired procedure. We have adjusted the text and figures to better reflect this, and we removed any mentions of randomness with regards to the presentations of SCS and footshock.
Despite the lack of significant sex differences, it would still be helpful if data panels with individual data points (e.g. Fig 2E-J), were presented as identifiable by sex (e.g. closed vs open circles for males vs females).
The revised manuscript now compares four or five groups per figure, making data presentation complicated. Providing the individual data points in each panel reduces figure clarity, therefore, we feel it is best to present the data as box-and-whisker plots without them. However, the source data files for each figure are available to the reader and the data are clearly labeled to be identifiable by sex.
Is it not odd that all groups showed similar levels of contextual freezing during the 3min baseline? If shocks are unsignaled in the UN and SO groups, one would expect higher levels of contextual freezing compared to a paired group.
We are not certain why one would expect higher levels of contextual freezing in the UN and SO groups compared to the PA group at the beginning of conditioning day 2. Another study also looked at baseline freezing in a contextual fear group (which is the same as shock only in our study) and in an auditory cued fear conditioning group within the conditioning context, and their data show that freezing during the baseline period is equivalent between groups (Sachella et al., 2022).
During baseline on Extinction Day 1, it does seem that the unpaired and SO groups tend to have higher freezing levels compared to the paired groups. Author response image 1 shows baseline freezing during the first 3 minutes of extinction day 1. After two days of conditioning in the conditioned flight paradigm, contextual freezing either is, or trends to be significantly higher in the UN, UN-R, and SO groups than the PA and PA-R groups.
Author response image 1.
Baseline Freezing levels for all groups during the first extinction session. Baseline period is defined as the first 180 seconds of the session, before any auditory stimulus was presented. PA, Paired; UN, Unpaired; SO, Shock Only; PA-R, Paired Reverse; UN-R, Unpaired Reverse. *p<0.05, **p<0.01, ****p<0.0001.
Do the tone and WN elicit similar levels of defensive behaviors in a naïve mouse? Or have the authors tested WN followed by tone? Is there a potential issue that the WN may be innately aversive which is then amplified with training? i.e. does a tone preferentially induce freezing while WN induces active behaviors, regardless of which sensory stimulus is temporally closer to the shock? If the change in behavior is really due to the pairing and temporal proximity to shock, then there should be increased jumps, etc to the tone if trained with WN->tone.
WN can indeed be used as an aversive stimulus under certain conditions and at sufficiently high decibel levels. In the conditioned flight paradigm, WN is presented at 75dB, which is below the threshold for eliciting an acoustic startle response in a C57BL/6J mouse (Fadok et al. 2009). Also, during pre-exposure, when animals are naïve to the SCS, tone and WN stimuli do not elicit defensive behaviors (see Fadok et al. 2017, Borkar et al. 2020, 2024).
As suggested by the Reviewer, during revision we have included reverse-SCS paired (PA-R) and unpaired (UN-R) groups to test for the role of stimulus salience and stimulus order on defensive ethograms. During conditioning day 2, the PA-R group exhibited little freezing to the WN, with a slightly elevated activity index, and they exhibited robust freezing during tone (revised Figure 2A-H). The activity during the WN in the PA-R group was significantly lower than that of the PA group (Figure 2L). The PA-R group also did not respond to WN with escape jumps or darting (Figure 3I, 4G). The UN-R group displayed greater activity during the WN than the UN and PA-R groups, but less activity than the PA group (Figure 2D, H). The UN-R group did not dart but this group displayed some jumping at WN onset (Figure 3H), like what was observed in the UN group.
These data suggest that WN has inherent, salient properties that can induce some non-associative activity after the mouse has been sensitized by shock (see also Hersman et al. 2020 for more detailed analysis of stimulus salience in the conditioned flight paradigm). However, only in the PA group is robust flight behavior (comprised of high numbers of escape jumps and darting) observed. Therefore, both stimulus salience and temporal order are important for eliciting transitions from freezing to flight.
Fig 3G/4G are hard for me to understand. The figure legends say they're survival graphs but the y-axis labels "Latency to initial jump/dart (% of cohort)" confuses me. What is the purpose of these graphs? Perhaps they are not needed. Or consider presenting them similar to Fig 7C, D as those were more intuitive and faster for me to grasp.
We had intended these plots to show that a greater proportion of the paired group jumps and darts during WN compared to the unpaired group, and that the percentage of the cohort that jumps and darts increases across conditioning trials. Because these graphs were not clear, we have removed them, and we have replaced them with graphs comparing total cohort percentages that jumped (Figure 3I) or darted (Figure 4G) over the whole CD2 session.
For the extinction data, I did not see within group analyses for within or between session fear extinction to the tone. So, for the paired group, were the last 4 trials of Ext 1 significantly lower than the first 4 trials? If not, then they did not show within-session extinction. Also, for the paired group, were the last 4 trials of Ext 1 significantly different than the first 4 trials of Ext 2? This would test for long-term retention and spontaneous recovery.
In the original submission and in the revised manuscript, we calculated a delta change score for freezing during tone in the early versus late blocks of 4 trials, and then we statistically compared these differences across groups (Figure 5C, D). This allowed us to assess between-group differences in changes to tone-evoked freezing during extinction. Freezing to tone did decrease significantly over the first extinction session for the paired group (Early Ext1 vs Late Ext1, paired t-test, t(31) \= 6.23, p<0.0001), and when comparing late Ext1 and early Ext2, we found that tone-evoked freezing did significantly increase (Late Ext1 vs Early Ext2, paired t-test, t(31) \= 5.26, p<0.0001). This increase in cue-induced freezing between days of extinction is characteristic of C57BL/6J mice (Hefner et al., 2008). Our study did not test for more distal timepoints, so we cannot comment on the efficacy of long-term retention or spontaneous recovery.
For the conditioning and extinction data across Figs 2, 5 and 6, what I gather from them is that freezing is high to the tone and low to the WN during conditioning, and then low to the tone, and high to the WN across extinction. Then for activity levels I see they are low to the tone and high to the WN during conditioning, and then low to the WN during extinction. The piece that is missing is what are activity levels like to the tone during extinction. Are they low like in conditioning and remain low in extinction? Or do they increase across extinction as freezing decreases? As I was going through these graphs I drew myself out step function summaries of the freezing and activity levels between tone/WN for conditioning vs extinction; maybe the authors could consider a summary figure.
We thank the Reviewer for their interest. We found that within the paired group, activity to tone remained low throughout both days of extinction (though increased within each session) and did not return to normal activity levels. We present this data in Author response image 2. We thank the Reviewer for the suggestion of a summary figure, but we feel there are too many axes of classification (between-group, within-group, multiple behaviors, tone/WN, conditioning/extinction) to coherently present our findings in a single figure.
Author response image 2.
Trial-by-trial plot of activity index during the tone period of SCS across both extinction sessions for the PA group. SCS, Serial compound stimulus; Ext, extinction; PA, Paired.
In the discussion (LINE 592-3), they discuss that shock sensitization in the SO group may prime a stressed animal to dart more readily to WN upon stimulus transition. Should this not also happen during the transition of silence to tone? What is special about a transition between two auditory stimuli that would result in panic like behavior in an animal that only received shock presentations? This also gets back to an earlier concern above regarding the potentially innately aversiveness of the WN.
After 2 days of shock sensitization, we observe that mice exhibit freezing to the tone during the first three trials of extinction day 1 (Figure 5A). This non-associative freezing response is like that observed in other studies of non-associative fear processing (please see Kamprath and Wotjak, 2004). As trials progress during extinction day 1, mice do become mildly activated during the tone (Author response image 3). The transition to WN in the shock-only group during extinction induces non-associative darting responses, but it does not induce escape jumping behavior (Figure 7). We hypothesize that the innate salience of the WN is a vital factor contributing to these escalated responses. The importance of stimulus salience in conditioned flight was also demonstrated by Hersman et al., 2020 for SCS conditioning, and by Furuyama et al., 2023 for single tone conditioning. Just as with conditional freezing responses (Kamprath and Wotjak, 2004), we believe that conditional flight is controlled by summative components, one being associative and the other non-associative.
Author response image 3.
Trial-by-trial plot of activity index during the tone period of SCS across both extinction sessions for the SO group. SCS, Serial compound stimulus; Ext, extinction; SO, Shock Only.
In the discussion (LINE 583), they say that the development of explosive defensive behaviors are "not achievable with traditional single-cue Pavlovian conditioning paradigms". The authors should include a caveat here that the current study did not compare their results to a group of mice that received just WN-shock pairings.
We thank the reviewer for this comment. This statement was meant to highlight that traditional paradigms do not offer an element of signaling the temporal imminence of threat, only its inevitability. It was not our intention to state that defensive escape behaviors were unachievable in single-cue conditioning paradigms, and we regret not making this clear. Indeed, the supplement of Fadok et al. 2017 shows that WN-shock conditioning is capable of inducing flight, Furuyama et al. 2023 shows that tone-shock conditioning is capable of inducing flight under specific parameters, and Gruene et al. 2015 demonstrates that single CS-US pairings induce conditional darting behaviors in female rats. We have adjusted the text to better reflect our intent.
Minor comment to LINE 613-5: Speaking as someone who has done fear conditioning in both mice and rats, tail rattling may be specific to mice (I have seen this often) and likely not observable in rats (never seen it).
We thank the Reviewer for this information. We have adjusted our text to mainly discuss mouse-specific tail rattling.
Reviewer #2 (Recommendations For The Authors):
The research questions in this study are novel and bring new insight to the field. However, there are some issues that can be addressed to improve the overall quality of the study, namely, the reader is left wanting to know more, especially about how neural circuits contribute to these different defensive behaviors during this task. Below are some recommendations for the authors that would greatly improve the impact and significance of this study.
(1) What are the neural correlates or circuits recruited during these different defensive behaviors across the course of conditioning and extinction? How might they differ between the PA and UN groups? What differences might emerge when an animal is shifting their defensive behavior from freezing to darting, for example? Answering these questions would require intensive additional experiments, therefore more discussion of possible neural mechanisms that might be recruited during this task would be appreciated, given the scope of the subject area.
We agree that understanding the neural circuits recruited during these behaviors and across conditioning and extinction is of vital importance. We are actively working on these questions, and we have published on the role of central amygdala circuits (Fadok et al. 2017) as well as on top-down control of flight by the medial prefrontal cortex (Borkar et al. 2024). Because the current manuscript is focused on learning mechanisms influencing defensive behavior, we would prefer to focus our discussion on that, rather than speculating on possible neural mechanisms. However, we have added a statement in the Discussion (LINES 706-707) emphasizing that future studies should investigate the neuronal mechanisms contributing to threat associations and different defensive behaviors.
(2) Were any vocalizations observed during conditioning or extinction phases? If not, could you speculate how type and occurrence of vocalizations might correlate with the different defensive responses observed?
Audible vocalizations were only observed during footshock presentations (squeaks). Unfortunately, we do not have the proper specialized recording equipment to monitor the full spectrum of mouse vocalizations, especially those in the ultrasonic range. Thus, we cannot speculate on the nuances of vocalizations in mice with respect to this behavioral paradigm. To the best of our knowledge, mice have not been reported to emit specific ultrasonic calls during conditioned threat like those of rats. That said, it would be of interest to determine if mice emit different vocalizations during different defensive behaviors.
(3) The transition from freezing to flight during the SCS is thought to be due to the close proximity of threat imminence between the WN CS and shock US. What if you switched the order of the SCS stimuli to WN followed by tone stimuli? If the salience of the WN stimulus is truly driving the jumping behavior, then it would be observed even if the WN stimulus preceded the pure tone stimulus and that would bring additional evidence that it is the associative value of the stimuli rather than its salience that's driving the defensive behaviors. What do you predict you would observe in rodents that were given a WN-tone SCS paired and unpaired in the same design of this study?
As suggested by the reviewer, we collected data from reverse-SCS paired and unpaired groups and reported our findings within the manuscript. Our detailed findings are also discussed above. Overall, we find that a combination of stimulus salience and temporal proximity, and a summation of non-associative and associative mechanisms, are necessary to elicit explosive flight behavior (escape jumping and darting).
References
Borkar CD, Dorofeikova M, Le QE, Vutukuri R, Vo C, Hereford D, Resendez A, Basavanhalli S, Sifnugel N, Fadok JP (2020) Sex differences in behavioral responses during a conditioned flight paradigm. Behavioural Brain Research 389:112623.
Borkar CD, Stelly CE, Fu X, Dorofeikova M, Le QE, Vutukuri R, Vo C, Walker A, Basavanhalli S, Duong A, Bean E, Resendez A, Parker JG, Tasker JG, Fadok JP (2024) Top-down control of flight by a non-canonical cortico-amygdala pathway. Nature 625: 743-749.
Fadok JP, Krabbe S, Markovic M, Courtin J, Xu C, Massi L, Botta P, Bylund K, Müller C, Kovacevic A, Tovote P, Lüthi A (2017) A competitive inhibitory circuit for selection of active and passive fear response. Nature 542:96-100.
Furuyama T, Imayoshi A, Iyobe T, Ono M, Ishikawa T, Ozaki N, Kato N, Yamamoto R (2023) Multiple factors contribute to flight behaviors during fear conditioning. Scientific Reports 13:10402.
Gruene TM, Flick K, Stefano A, Shea SD, Shansky RM (2015) Sexually divergent expression of active and passive conditioned fear responses in rats. eLIfe 4:e11352.
Hefner K, Whittle N, Juhasz J, Norcross M, Karlsson RM, Saksida LM, Bussey TJ, Singewald N, Holmes A (2008) Impaired Fear Extinction Learning and Cortico-Amygdala Circuit Abnormalities in a Common Genetic Mouse Strain. Journal of Neuroscience 6:8074-8085.
Hersman S, Allen D, Hashimoto M, Brito SI, Anthony T (2020) Stimulus salience determines defensive behaviors elicited by aversively conditioned serial compound auditory stimuli. elife 9:e53803.
Kamprath K and Wotjak CT (2004) Nonassociative learning processes determine expression and extinction of conditioned fear in mice. Learning & Memory 11:770-786.
Sachella TE, Ihidoype MR, Proulx CD, Pafundo DE, Medina JH, Mendez P & Piriz J (2022) A novel role for the lateral habenula in fear learning. Neuropsychopharmacology 47:1210-1219.
-
eLife Assessment
This study is deemed to be an important work that carefully deconstructs multi-faceted conditioned fear behavior in mice. The well-controlled experiments provide convincing data that will be of interest to other researchers in the field.
-
Reviewer #1 (Public review):
Summary
The main goal of the study was to tease apart the associative and non-associative elements of cued fear conditioning that could influence which defensive behaviors are expressed. To do this, the authors compared groups conditioned with paired, unpaired, or shock only procedures followed by extinction of the cue. The cue used in the study was not typical; serial presentation of a tone followed by a white noise (or reversed) was used in order to assess switches in behavior across the transition from tone to white noise. Many defensive behaviors beyond the typical freezing assessments were measured, and both male and female mice were included throughout. The authors found changes in behavioral transitions from freezing to flight during conditioning as the tone transitioned into white noise, and a switch in freezing during extinction such that it became high during the white noise as flight behavior decreased. Overall, this was an interesting analysis of transitions in defensive behaviors to a serially presented cue consisting of two auditory stimuli during conditioning and then extinction.
Strengths
The highlights in this study were the significant switches in freezing and escape-like behaviors as the cue transitioned between the two auditory stimuli during fear conditioning, and then adjustment of those behaviors across extinction.
These main findings were a result of thorough behavioral analyses with key control groups (reversed stimulus order, unpaired conditioning, and shock only groups), assessing freezing, jumping, darting and tail rattling to try to parse out associative versus non-associative features of the behavioral profiles.
Weaknesses
While the detailed analyses of defensive behaviors in mice in a situation of signaled imminent threat adds valuable knowledge to those studying fear conditioning, the caveat is that it is unclear how broadly applicable these findings truly will be. It makes sense that similar transitions in defensive behaviors will occur across organisms, but each organism and each psychiatric disorder will have unique profiles.
-
Reviewer #2 (Public review):
Summary:
The authors examined several defensive responses elicited during Pavlovian conditioning using a serial compound stimulus (SCS) as the conditioned stimulus (CS) and a shock unconditioned stimulus (US) in male and female mice. The SCS consisted of a tone pips followed by white noise. Their design included conditions in which mice were exposed to the CS and US in a paired fashion, in an unpaired fashion, or only exposed to the shock US, as well as paired and unpaired conditions that reversed the order of the SCS. They compared freezing, jumping, darting, and tail rattling across all groups during conditioning and extinction. During conditioning, strong freezing responses to the tone pips followed by strong jumping and darting responses to the white noise were present in the paired group but less robust or not present in the unpaired or shock only groups. During extinction, tone-induced freezing diminished while the jumping was replaced by freezing and darting in the paired group. Together, these findings support the idea that associative pairings are necessary for conditioned defensive responses.
Strengths:
The study has strong control groups including a group that receives the same stimuli in an unpaired fashion and another control group that only receives the shock US and no CS to test the associative value of the SCS to the US. The authors examine a wide variety of defensive behaviors that emerge during conditioning and shift throughout extinction: in addition to the standard freezing response, jumping, darting, and tail rattling were also measured.
The revised version has greatly strengthened this study by including additional control groups (e.g., reversing the order of the compound stimuli in both paired and unpaired conditions).
-
-
www.biorxiv.org www.biorxiv.org
-
Author response:
The following is the authors’ response to the current reviews.
We thank the Reviewer for all their effort and suggestions over multiple drafts. Their comments have encouraged us to read and think more deeply about the issue under discussion (BLA spiking in response to CS/US inputs), and to find the papers whose contents we think provide a potential solution. We agree that there is more to understand about the mechanisms underlying associative learning in the BLA. We offer our paper as providing a new way of understanding the role of circuit dynamics (rhythms) in guiding associative learning via STDP. As we pointed out in our response to the previous review, the issue highlighted by the Reviewer is an issue for the entire field of associative learning in BLA: our discussion of the issue suggests why the experimentally observed BLA spiking in response to CS inputs, performed in the absence of US inputs (as done in the papers cited by the Reviewer), may not be what occurs in the presence of the US. Since our explanation involves the role of neuromodulators, such as ACh and dopamine, the suggestion is open to further testing.
The following is the authors’ response to the original reviews.
Reviewer #1:
Public Review’s only objection: “Deficient in this study is the construction of the afferent drive to the network, which does elicit activities that are consistent with those observed to similar stimuli. It still remains to be demonstrated that their mechanism promotes plasticity for training protocols that emulate the kinds of activities observed in the BLA during fear conditioning.”
Recommendations for the Authors: “The authors have successfully addressed most of my concerns. I commend them for their thorough response. The one nagging issue is the unrealistic activation used to drive CS and US activation in their network. While I agree that their stimulus parameters are consistent with a contextual fear task, or one that uses an olfactory CS, this was not the focus of their study as originally conceived. Moreover, the types of activation observed in response to auditory cues, which is the focus of their study, do not follow what is reported experimentally. Thus, I stand by the critique that the proposed mechanism has not been demonstrated to work for the conditioning task which the authors sought to emulate (Krabbe et al. 2019). Frustratingly, addressing this is simple: run the model with ECS neurons driven so that they fire bursts of action potentials every ~1 sec for 30 sec, and with the US activation noncontiguous with that. If the model does not produce plasticity in this case, then it suggests that the mechanisms embedded in the model are not sufficient, and more work is needed to identify them. While 'memory' effects are possible that could extend the temporal contiguity of the CS and US, the authors need to provide experimental evidence for this occurring in the BLA under similar conditions if they want to invoke it in their model.
(1) Fair response. I accept the authors arguments and changes.
(2) The authors rightly point out that the simulated afferents need not perfectly match the time courses of the peripheral inputs, since what the amygdala receives them indirectly via the thalamus, cortex, etc. However, it is known how amygdala neurons respond to such stimuli, so it behooves the authors to incorporate that fact into their model.
Quirk et al. 1997 show that the response to the tone plummets after the first 100 ms in Figs 5A and 6B. The Herry et al. 2007 paper emphasizes the transient response to tone pips, with spiking falling back to a poisson low firing rate baseline outside of the time when the pip is delivered.
Regarding potential metabotropic glutamate activation, the stimulus in Whittington et al. 1995 was electrical stimulation at 100 Hz that would synchronously activate a large volume of tissue, which is far outside the physiological norm. I appreciate that metabotropic glutamate receptors may play a role here, but ultimately the model depends upon spiking activity for the plastic process to occur, and to the best of my knowledge the spiking activity in BLA in response to a sustained, unconditioned tone, is brief (see also Quirk, Repa, and Ledoux 1995). Perhaps a better justification for the authors would be Bordi and Ledoux 1992, which found that 18% of auditory responsive neurons showed a 'sustained' response, but the sustained response neurons appear to show much weaker responses than those with transient ones (Fig 2). I am willing to say that their paper IS relevant to contextual fear, but that is not what the authors set out to do.
(3) Fair response.
(4) Very good response!
Minor points: All points were addressed.”
We thank Reviewer 1 (R1) for the positive feedback and also for pointing out that, in R1’s opinion, there is still a nagging issue related to the activation in response to CS we modeled. In (Krabbe et al., 2019), CS is a pulsed input and US is delivered right after the CS offset. The current objection of R1 is that instead, we are modeling CS and US as continuous and overlapping. R1 suggested that we add the actual input and see if they will produce the desired outputs. The answer is simple: it will not work because we need the effects of CS and US on pyramidal cells to overlap. We note that the fear learning community appears to agree with us that such contingency is necessary for synaptic plasticity (Sun et al., 2020; Palchaudhuri et al., 2024). To the best of our understanding, the source of that overlap is not understood in the community, and the gap has been much noticed (Sun et al., 2020). We do note, however, that STDP may not be the only kind of plasticity in fear learning (Li et al., 2009; Kim et al., 2013, 2016).
It is important to emphasize that it is not the aim of our paper to model the origin of the overlap. Rather, our intent is to demonstrate the roles of brain rhythms in producing the appropriate timing for STDP, assuming that ECS and F cells can continue to be active after the offset of CS and US, respectively. This assumption is very close to how the field now treats the plasticity, even for auditory fear conditioning (Sun et al., 2020). Thus, our methodology does not contradict known results. However, the question raised by R1 is indeed very interesting, if not the point of our paper. Hence, below we give details about why our hypothesis is reasonable.
Several papers (Quirk, Repa and LeDoux, 1995; Herry et al, 2007; Bordi and Ledoux 1992) show that the pips in auditory fear conditioning increase the activity of some BLA neurons: after an initial transient, the overall spike rate is still higher than baseline activity. As R1 points out, we did not model the transient increase in BLA spiking activity that occurs in response to each pip in the auditory fear conditioning paradigm. However, we did model the low-level sustained activity that occurs in between pips of the CS in the absence of US (Quirk, Repa and LeDoux, 1995, Fig. 2) and after CS offset (see Fig. 2B, left hand part of our manuscript). We read the data of Quirk et al., 1995 as suggesting that the low-level activity can be sustained for some indefinite time after a pip (cut off of recording was at 500 ms with no noticeable decrease in activity). As such, even if the pips and the US do not overlap in time, as in (Krabbe et al., 2019), the spiking of the ECS can be sustained after CS offset and thus overlap with US, a condition necessary in our model for plasticity through STDP. In Herry et al., 2007 Fig. 3 shows that BLA neurons respond to a pip at the population level with a transient increase in spiking and return to a baseline Poisson firing rate. However, a subset of cells continues to fire at an increased-over-baseline rate after the transient effect wears off (Fig. 3C, top few neurons) and this increased rate extends to the end of the recording time (here ~ 300 ms). These are the cells we consider to be ECS in our model. In Quirk et al., 1997, Fig. 5A also shows sustained low level activity of neurons in BLA in response to a pip. The low-level activity is shown to increase after fear learning, as is also the case in our model since ECS now entrains F so that there are more pyramidal cells spiking in response to CS. The question remains as to whether the spiking is sustained long enough and at a high enough rate for STDP to take place when US is presented sometime after the stop of the CS.
Experimental recordings cannot speak to the rate of spiking of BLA neurons during US due to recording interference from the shock. However, evidence seems to suggest that ECS activity should increase during the US due to the release of acetylcholine (ACh) from neurons in the basal forebrain (BF) (Rajebhosale et al., 2024). Pyramidal cells of the BLA robustly express M1 muscarinic ACh receptors (Muller et al., 2013; McDonald and Mott, 2021). Thus, ACh from BF should elicit a depolarization in pyramidal cells. Indeed, the pairing of ACh with even low levels of spiking of BLA neurons results in a membrane depolarization that can last 7 – 10 s (Unal et al., 2015). This should induce higher spiking rates and more sustained activity in the ECS and F neurons during and after the presentation of US, thus ensuring a concomitant activation of ECS and fear (F) neurons necessary for STDP to take place. Other modulators, including dopamine, may also play a role in producing the sustained activity. Activation of US leads to increased dopamine release in the BLA (Harmer and Phillips, 1999; Suzuki et al., 2002). D1 receptors are known to increase the membrane excitability of BLA projection neurons by lowering their spiking threshold (Kröner et al., 2005). Thus, the activation of the US can lead to continued and higher firing rates of ECS and F. The effect of dopamine can last up to 20 minutes (Kröner et al., 2005). For CS-positive neurons, the ACh modulation coming from the firing of US may lead to a temporary extension of firing that is then amplified and continued by dopaminergic effects.
Hence, we suggest that a solution to the problem raised by R1 may be solved by considering the roles of ACh and dopamine in the BLA. The involvement of neuromodulators is consistent with the suggestion of (Sun et al., 2020). The model we have may be considered a “minimal” model that puts in by hand the overlap in activity due to the neuromodulation without explicitly modeling it. As R1 says, it is important for us to give the motivation of our hypotheses. We have used the simplest way to model overlap without assumptions about timing specificity in the overlap.
To account for these points in the manuscript, we first specified that we consider the effects of the US and CS inputs on the neuronal network as overlapping, while the actual inputs may not overlap. To do that, we added the following text:
(1) In the introduction:
“In this paper, we aim to show 1) How a variety of BLA interneurons (PV, SOM and VIP) lead to the creation of these rhythms and 2) How the interaction of the interneurons and the rhythms leads to the appropriate timing of the cells responding to the US and those responding to the CS to promote fear association through spike-timing-dependent plasticity (STDP). Since STDP requires overlap of the effects of the CS and US, and some conditioning paradigms do not have overlapping US and CS, we include as a hypothesis that the effects of the CS and US overlap even if the CS and US stimuli do not. In the Discussion, we suggest how neuromodulation by ACh and/or dopamine can provide such overlap. We create a biophysically detailed model of the BLA circuit involving all three types of interneurons and show how each may participate in producing the experimentally observed rhythms and interacting to produce the necessary timing for the fear learning.”
(2) In the Result section “With the depression-dominated plasticity rule, all interneuron types are needed to provide potentiation during fear learning”:
“The 40-second interval we consider has both ECS and F, as well as VIP and PV interneurons, active during the entire period: an initial bout of US is known to produce a long-lasting fear response beyond the offset of the US (Hole and Lorens, 1975) and to induce the release of neuromodulators. The latter, in particular acetylcholine and dopamine that are known to be released upon US presentation (Harmer and Phillips, 1999; Suzuki et al., 2002; Rajebhosale et al., 2024), may induce more sustained activity in the ECS, F, VIP, and PV neurons during and after the presentation of US, thus ensuring a concomitant activation of those neurons necessary for STDP to take place (see “Assumptions and predictions of the model” in the Discussion).”
(3) In the Discussion section “Synaptic plasticity in our model”:
“Synaptic plasticity is the mechanism underlying the association between neurons that respond to the neutral stimulus CS (ECS) and those that respond to fear (F), which instantiates the acquisition and expression of fear behavior. One form of experimentally observed long-term synaptic plasticity is spike-timing-dependent plasticity (STDP), which defines the amount of potentiation and depression for each pair of pre- and postsynaptic neuron spikes as a function of their relative timing (Bi and Poo, 2001; Caporale and Dan, 2008). All forms of STDP require that there be an overlap in the firing of the pre- and postsynaptic cells. In some fear learning paradigms, the US and the CS do not overlap. We address this below under “Assumptions and predictions of the model”, showing how the effects of US and CS on the spiking of the relevant neurons can overlap even in the absence of overlap of US and CS.”
To fully present our reasoning about the origin of the overlap of the effects of US and CS, we modified and added to the last paragraph of the Discussion section “Assumptions and predictions of the model”, which now reads as follows:
“Finally, our model requires the effect of the CS and US inputs on the BLA neuron activity to overlap in time in order to instantiate fear learning through STDP. Such a hypothesis, that learning uses spike-timing-dependent plasticity, is common in the modeling literature (Bi and Poo, 2001; Caporale and Dan, 2008; Markram et al., 2011). Current paradigms of fear conditioning include examples in which the CS and US stimuli do not overlap (Krabbe et al., 2019). Such a condition might seem to rule out the mechanisms in our paper. Nevertheless, the argument below suggests that the effects of the CS and US can cause an overlap in neuronal spiking of ECS, F, VIP, and SOM, even when CS and US inputs do not overlap.
Experimental recordings cannot speak to the rate of spiking of BLA neurons during US due to recording interference from the shock. However, evidence suggests that ECS activity should increase during the US due to the release of acetylcholine (ACh) from neurons in the basal forebrain (BF) (Rajebhosale et al., 2024). Pyramidal cells of the BLA robustly express M1 muscarinic ACh receptors (McDonald and Mott, 2021). Thus, ACh from BF should elicit a depolarization in pyramidal cells. Indeed, the pairing of ACh with even low levels of spiking of BLA neurons results in a membrane depolarization that can last 7 – 10 s (Unal et al., 2015). Other modulators, including dopamine, may also play a role in producing the sustained activity. Activation of US leads to increased dopamine release in the BLA (Harmer and Phillips, 1999; Suzuki et al., 2002). D1 receptors are known to increase the membrane excitability of BLA projection neurons by lowering their spiking threshold (Kröner et al., 2005). Thus, neuromodulator release should induce higher spiking rates and more sustained activity in the ECS and F neurons during and after the presentation of US, thus ensuring a concomitant activation of ECS and fear (F) neurons necessary for STDP to take place. Thus, the activation of the US can lead to continued and higher firing rates of ECS and F. The effect of dopamine can last up to 20 minutes (Kröner et al., 2005). For CS-positive neurons, the ACh modulation coming from the firing of US may lead to a temporary extension of firing that is then amplified and continued by dopaminergic effects.
Hence, we suggest that a solution to the problem apparently posed by the non-overlap US and CS in some paradigms of auditory fear conditioning (Krabbe et al., 2019) may be solved by considering the roles of ACh and dopamine in the BLA. The model we have may be considered a “minimal” model that puts in by hand the overlap in activity due to the neuromodulation without explicitly modeling it. We have used the simplest way to model overlap without assumptions about timing specificity in the overlap. We note that, even though ECS and F neurons have the ability to fire continuously when ACh and dopamine are involved, the participation of the interneurons enforces periodic silence needed for the depression-dominated STDP.”
In the Discussion (in section “Involvement of other brain structures”), we also acknowledged that the overlap between the effects of US and CS in the BLA may be provided by other brain structures by writing the following:
“In our model, the excitatory projection neurons and VIP and PV interneurons show sustained activity during and after the US presentation, thus allowing potentiation through STDP to take place. The medial prefrontal cortex and/or the hippocampus may provide the substrates for the continued firing of the BLA neurons after the 2-second US stimulation. We also discuss below that this network sustained activity may originate from neuromodulator release induced by US (see section “Assumptions and predictions of the model” in the Discussion).”
We also improved our discussion about the (Grewe et al., 2017) paper, which questions Hebbian plasticity in the context of fear conditioning based on several critiques. We included a new section in the Discussion entitled “Is STDP needed in fear conditioning?” to discuss those critiques and how our model may address them, which reads as follows:
“Is STDP needed in fear conditioning? The study in (Grewe et al., 2017) questions the validity of the Hebbian model in establishing associative learning during fear conditioning. There are several critiques we discuss here. The first critique is that Hebbian plasticity does not explain the experimental finding showing that both upregulation and downregulation of stimulus-evoked responses are present between coactive neurons. The upregulation is provided by our model, so the issue is the downregulation, which is not addressed by our model. However, our model highlights that coactivity alone does not create potentiation; the fine timing of the pre- and postsynaptic spikes determines whether there is potentiation or depression. Here, we find that PING networks are instrumental in setting up the fine timing for potentiation. We suggest that networks not connected to produce the PING may undergo depression when coactive.
The second critique raised by (Grewe et al., 2017) is that Hebbian plasticity alone does not explain why most of the cells exhibiting enhanced responses to the CS did not react to the US before fear conditioning. They suggest that neuromodulators may provide a third condition (besides the activity of the pre- and postsynaptic neurons) that changes the plasticity rule. Our model also does not explicitly address this experimental finding since it requires F to be initially activated by US in order for the fear association to be established. We agree that the fear cells described in (Grewe et al. 2017) may be depolarized by the US without reaching the spiking threshold; however, with neuromodulation provided during the fear training, the same input can lead to spiking, enabling the conditions for Hebbian plasticity. Our discussions above about how neuromodulators affect excitability are relevant to this point. We do not exclude that other forms of plasticity may play a role during fear conditioning in cells not initially activated by the US, but this is not the topic of our modeling study.
The third critique raised by (Grewe et al., 2017) is that Hebbian plasticity cannot explain why the majority of cells that were US- and CS-responsive before training have a reduced CS-evoked response afterward. The reduced response happens over multiple exposures of CS without US; this can involve processes similar to those present in fear extinction, which require plasticity in further networks, especially involving the infralimbic cortex (Milad and Quirk, 2002; Burgos-Robles et al., 2007). An extension of our model could investigate such mechanisms. In the fourth critique, (Grewe et al., 2017) suggests that the Hebbian plasticity rule cannot easily account for the reduction of the responses of many CS+-responsive cells, but not of the CS−-responsive cells. We suggest that the circuits involving paradigms similar to fear extinction do not involve the CS- cells.
Overall, we agree with (Grewe et al., 2017) that neuromodulators play a crucial role in fear conditioning, especially in prolonging the US- and CS-encoding activity as discussed in (see section “Assumptions and predictions of the model” in the Discussion), or even participating in changing the details of the plasticity rule. A possible follow-up of our work involves investigating how fear ensembles form and modify through fear conditioning and later stages. This follow-up work may involve using a tri-conditional rule, as suggested in (Grewe et al., 2017), in which the potential role of neuromodulators is taken into account in the plasticity rule in addition to the pre- and postsynaptic neuron activity. Another direction is to investigate a possible relationship between neuromodulation and a depression-dominated Hebbian rule.”
Finally, we made additional minor changes to the manuscript:
(1) In the Result section “Interneurons interact to modulate fear neuron output”, we specified the following:
“The US input on the pyramidal cell and VIP interneuron is modeled as a Poisson spike train at ~ 50 Hz and an applied current, respectively. In the rest of the paper, we will use the words “US” as shorthand for “the effects of US”.”
(2) In the Result section “Interneuron rhythms provide the fine timing needed for depression dominated STDP to make the association between CS and fear”, we also reported the following:
“Similarly to the US, in the rest of the paper, we will use the words “CS” as shorthand for “the effects of CS”. In our simulations, CS is modeled as a Poisson spike train at ~ 50 Hz, independent of the US input. Thus, we hypothesize that the time structure of the inputs sometimes used for the training (e.g., a series of auditory pips) is not central to the formation of the plasticity in the network.”
Reviewer #2 (Public Reviews):
The authors of this study have investigated how oscillations may promote fear learning using a network model. They distinguished three types of rhythmic activities and implemented an STDP rule to the network aiming to understand the mechanisms underlying fear learning in the BLA.
After the revision, the fundamental question, namely, whether the BLA networks can or cannot intrinsically generate any theta rhythms, is still unanswered. The author added this sentence to the revised version: "A recent experimental paper, (Antonoudiou et al., 2022), suggests that the BLA can intrinsically generate theta oscillations (3-12 Hz) detectable by LFP recordings under certain conditions, such as reduced inhibitory tone." In the cited paper, the authors studied gamma oscillations, and when they applied 10 uM Gabazine to the BLA slices observed rhythmic oscillations at theta frequencies. 10 uM Gabazine does not reduce the GABA-A receptor-mediated inhibition but eliminates it, resulting in rhythmic populations burst driven solely by excitatory cells. Thus, the results by Antonoudiou et al., 2022 contrast with, and do not support, the present study, which claims that rhythmic oscillations in the BLA depend on the function of interneurons. Thus, there is still no convincing evidence that BLA circuits can intrinsically generate theta oscillations in intact brain or acute slices. If one extrapolates from the hippocampal studies, then this is not surprising, as the hippocampal theta depends on extrahippocampal inputs, including, but not limited to the entorhinal afferents and medial septal projections (see Buzsaki, 2002). Similarly, respiratory related 4 Hz oscillations are also driven by extrinsic inputs. Therefore, at present, it is unclear which kind of physiologically relevant theta rhythm in the BLA networks has been modelled.
In our public reply to the Reviewer’s point, we reported the following:
(1) We kindly disagree that (Antonoudiou et al., 2022) contrasts with our study. (Antonoudiou et al., 2022) is a slice study showing that the BLA theta power (3-12 Hz) increases with gabazine compared to baseline. With all GABAergic currents omitted due to gabazine, the LFP is composed of excitatory currents and intrinsic currents. In our model, the high theta (6-12 Hz) comes from the spiking activity of the SOM cells, which increase their activity if the inhibition from VIP cells is removed. Thus, the model produces high theta in the presence of gabazine (see Fig. 1 in our replies to the Reviewers’ public comments). The model also shows that a PING rhythm is produced without gabazine, and that this rhythm goes away with gabazine because PING requires feedback inhibition from PV to fear cells. Thus, the high theta increase and gamma reduction with gabazine in the (Antonoudiou et al., 2022) paper can be reproduced in our model.
(2) We agree that (Antonoudiou et al., 2022) alone is not sufficient evidence that the BLA can produce low theta (3-6 Hz); we discussed a new paper (Bratsch-Prince et al., 2024) that provides further evidence of BLA ability to produce low theta and under what circumstances. The authors reported that intrinsic BLA theta is produced in slices with ACh stimulation (without needing external glutamate input) which, in vivo, would be provided by the basal forebrain (Rajebhosale et al., eLife, 2024) in response to salient stimuli. The low theta depends on muscarinic activation of CCK interneurons, a group of interneurons that overlaps with the VIP neurons in our model (Krabbe 2017; Mascagni and McDonald, 2003). We suspect that the low theta produced in (Bratsch-Prince et al., 2024) is the same as the low theta in our model. In future work, we will aim to show that ACh activates the BLA VIP cells, which are essential to the low theta generation in the network.
In the manuscript, we added to and modified the Discussion section “Where the rhythms originate, and by what mechanisms”. This text aims to better discuss (Antonoudiou et al. 2022) and introduce (Bratsch-Prince et al., 2024) with its connection to our hypothesis that the theta oscillations can be produced within the BLA. The new version is:
“Where the rhythms originate, and by what mechanisms. A recent experimental paper (Antonoudiou et al., 2022) suggests that the BLA can intrinsically generate theta oscillations (312 Hz) detectable by LFP recordings when inhibition is totally removed due to gabazine application. They draw this conclusion in mice by removing the hippocampus, which can volume conduct to BLA, and noticing that other nearby brain structures did not display any oscillatory activity. In our model, we note that when inhibition is removed, both AMPA and intrinsic currents contribute to the network dynamics and the LFP. Thus, interneurons with their specific intrinsic currents (i.e., D-current in the VIP interneurons, and NaP- and H- currents in SOM interneurons) can indeed affect the model LFP and support the generation of theta and gamma rhythms (Fig. 6G).
Another slice study, (Bratsch-Prince et al., 2024), shows that BLA is intrinsically capable of producing a low theta rhythm with ACh stimulation and without needing external glutamate input. ACh is produced in vivo by the basal forebrain in response to US (Rajebhosale et al., 2024). Although we did not explicitly include the BF and ACh modulation of BLA in our model, we implicitly include the effect of ACh in BLA by increasing the activity of the VIP cells, which then produce the low theta rhythm. Indeed, low theta in the BLA is known to depend on the muscarinic activation of CCK interneurons, a group of interneurons that overlaps with the class of VIP neurons in our model (Mascagni and McDonald, 2003; Krabbe et al., 2018).
Although the BLA can produce these rhythms, this does not rule out that other brain structures also produce the same rhythms through different mechanisms, and these can be transmitted to the BLA. Specifically, it is known that the olfactory bulb produces and transmits the respiratoryrelated low theta (4 Hz) oscillations to the dorsomedial prefrontal cortex, where it organizes neural activity (Bagur et al., 2021). Thus, the respiratory-related low theta may be captured by BLA LFP because of volume conduction or through BLA extensive communications with the prefrontal cortex. Furthermore, high theta oscillations are known to be produced by the hippocampus during various brain functions and behavioral states, including during spatial exploration (Vanderwolf, 1969) and memory formation/retrieval (Raghavachari et al., 2001), which are both involved in fear conditioning. Similarly to the low theta rhythm, the hippocampal high theta can manifest in the BLA. It remains to understand how these other rhythms may interact with the ones described in our paper. However, we emphasize that there is also evidence (as discussed above) that these rhythms arise within the BLA.”
Reviewer #2 (Recommendations for the Authors):
(1) Three different types of VIP interneurons with distinct firing patterns have been revealed in the BLA (Rhomberg et al., 2018). Does the generation of rhythmic activities depend on the firing features of VIP interneurons? Does it matter whether VIP interneurons fire burst of action potentials or they discharge more regularly?
(2) The authors used data for modeling SST interneurons obtained e.g., in the hippocampus. However, there are studies in the BLA where the intrinsic characteristics of SST interneurons have been reported (Unal et al., 2020; Guthman et al., 2020; Vereczki et al., 2021). Have the authors considered using results of studies that were conducted in the BLA?
We thank the Reviewer for their questions, which have helped us further improve our manuscript in response to similar queries from Reviewer 3 in the previous review round. More in detail:
(1) Although other electrophysiological types exist (Sosulina et al., 2010), we hypothesized that the electrophysiological type of VIP neurons that display intrinsic stuttering is the type that would be involved in mediating low theta oscillations during fear conditioning. This is because VIP intrinsic stuttering in cortical neurons is thought to involve the D-current, which helps create low theta bursting oscillations in the neuronal spiking patterns (Chartove et al., 2020). We think that the other subtypes of VIP interneurons are not essential for the low theta oscillatory dynamics observed during fear conditioning and, thus, did not provide an essential constraint for the phenomena we are trying to capture. VIP interneurons in our network must fire bursts at low theta to be effective in creating the pauses in ECS and F spiking needed for potentiation; single spikes at theta are not sufficient to create these pauses.
(2) In our model, we used the results conducted in a BLA study (Sosulina et al., 2010). SOM cells in the BLA display several physiologic types. We chose to include in our model the type showing early adaptation in response to a depolarizing current and inward (outward) rectification upon the initiation (release) of a hyperpolarizing current. We hypothesize that this type can produce high theta oscillations, a prominently observed rhythm in the BLA. Unal et al., 2020 (Unal et al., 2020) found two populations of SOM cells in the BLA, which have been previously recorded in (Sosulina et al., 2010), including the one type we chose to model. This SOM cell type shows a low threshold spiking profile characterized by spike frequency adaptation and voltage sag indicative of an H-current used in our model. Guthman et al., 2020, (Guthman et al., 2020), also found a population of SOM cells with hyperpolarization induced sag.
Our model also uses a NaP-current for which there is no data in the BLA. However, it is known to exist in hippocampal SOM cells and that NaP- and H- currents can produce such a high theta in hippocampal cells. It is a standard practice in modeling to use the best possible replacement for unknown currents. Of course, it is unfortunate to have to do this. We also note that models can be considered proof of principle, that can be proved or disproved by further experimental work. Both (Guthman et al., 2020) and (Vereczki et al., 2021) also uncover further heterogeneity among BLA SOM interneurons involving more than electrophysiology. We hypothesize that such a level of heterogeneity revealed by these three studies is not key to the question we are asking (where crucial ingredients are the rhythms) and, therefore, was not included in our minimal model.
We modified the Discussion section titled “Assumptions and predictions of the model” as follows:
“Our model, which is a first effort towards a biophysically detailed description of the BLA rhythms and their functions, does not include the neuron morphology, many other cell types, conductances, and connections that are known to exist in the BLA; models such as ours are often called “minimal models” and constitute most biologically detailed models. For example, although there is considerable variability in the activity patterns of both VIP cells and SOM cells (Sosulina et al., 2010; Guthman et al., 2020; Ünal et al., 2020; Vereczki et al., 2021), our focus was specifically on those subtypes that generate critical rhythms within the BLA. Such minimal models are used to maximize the insight that can be gained by omitting details whose influence on the answers to the questions addressed in the model are believed not to be qualitatively important. We note that the absence of these omitted features constitutes hypotheses of the model: we hypothesize that the absence of these features does not materially affect the conclusions of the model about the questions we are investigating. Of course, such hypotheses can be refuted by further work showing the importance of some omitted features for these questions and may be critical for other questions. Our results hold when there is some degree of heterogeneity of cells of the same type, showing that homogeneity is not a necessary condition.”
(3) The authors may double-check the reference list, as e.g., Cuhna-Reis et al., 2020 is not listed.
We thank the Reviewer for spotting this. We checked the reference list and all the references are now listed.
Finally, we wanted to acknowledge that we made other changes to the manuscript unrelated to the reviewers’ questions with the purpose of gaining clarity. More specifically:
(1) We included a section titled “Significance” after the abstract and keywords, which reads as follows:
“Our paper accounts for the experimental evidence showing that amygdalar rhythms exist, suggests network origins for these rhythms, and points to their central role in the mechanisms of plasticity involved in associative learning. It is one of the few papers to address high-order cognition with biophysically detailed models, which are sometimes thought to be too detailed to be adequately constrained. Our paper provides a template for how to use information about brain rhythms to constrain biophysical models. It shows in detail, for the first time, how multiple interneurons help to provide time scales necessary for some kinds of spike-timing-dependent plasticity (STDP). It spells out the conditions under which such interactions between interneurons are needed for STDP and why. Finally, our work helps to provide a framework by which some of the discrepancies in the fear learning literature might be reevaluated. In particular, we discuss issues about Hebbian plasticity in fear learning; we show in the context of our model how neuromodulation might resolve some of those issues. The model addresses issues more general than that of fear learning since it is based on interactions of interneurons that are prominent in the cortex, as well as the amygdala.”
(2) The Result section “Physiology of the interneuron types is critical to their role in depression-dominated plasticity”, which is now titled “Mechanisms by which interneurons contribute to potentiation in depression-dominated plasticity”, now reads as follows:
“Mechanisms by which interneurons contribute to potentiation during depressiondominated plasticity. The PV cell is necessary to induce the correct pre-post timing between ECS and F needed for long-term potentiation of the ECS to F conductance. In our model, PV has reciprocal connections with F and provides lateral inhibition to ECS. Since the lateral inhibition is weaker than the feedback inhibition, PV tends to bias ECS to fire before F. This creates the fine timing needed for the depression-dominated rule to instantiate plasticity. If we used the classical Hebbian plasticity rule (Bi and Poo, 2001) with gamma frequency inputs, this fine timing would not be needed and ECS to F would potentiate over most of the gamma cycle, and thus we would expect random timing between ECS and F to lead to potentiation (Fig. S4). In this case, no interneurons are needed (See Discussion “Synaptic plasticity in our model” for the potential necessity of the depression-dominated rule).
In this network configuration, the pre-post timing for ECS and F is repeated robustly over time due to coordinated gamma oscillations (PING, as shown in Fig. 4A, Fig. 1C) arising through the reciprocal interactions between F and PV (Feng et al., 2019). PING can arise only when PV is in a sufficiently low excitation regime such that F can control PV activity (Börgers et al., 2005), as in Fig. 4A. However, although such a low excitation regime establishes the correct fine timing for potentiation, it is not sufficient to lead to potentiation (Fig. 4A, Fig. S2C): the depression-dominated rule leads to depression rather than potentiation unless the PING is periodically interrupted. During the pauses, made possible only in the full network by the presence of VIP and SOM, the history-dependent build-up of depression decays back to baseline, allowing potentiation to occur on the next ECS/F active phase. (The detailed mechanism of how this happens is in the Supplementary Information, including Fig. S2). Thus, a network without the other interneuron types cannot lead to potentiation. Though a low excitation level for a PV cell is necessary to produce a PING, a higher excitation level is necessary to produce a pause in the ECS and F. This higher excitation level is consistent with the experimental literature showing a strong activation of PV after the onset of CS (Wolff et al., 2014). The higher excitation happens when the VIP cell is silent, whereas a low excitation level is achieved when the VIP cell fires and partially inhibits the PV cell (Fig. 4B, Fig. S2D). The interruption in the ECS and F activity requires the participation of another interneuron, the SOM cell (Figs. 2B, S2): the pauses in inhibition from the VIP periodically interrupt ECS and F firing by releasing PV and SOM from inhibition and thus indirectly silencing ECS and F. Without these pauses, depression dominates (see SI section “ECS and F activity patterns determine overall potentiation or depression”).”
We also removed a supplementary figure (Fig. S2).
(3) We wanted to be clear and motivate our choice to extend the low theta range to 2-6 Hz and the high theta range to 6-14 Hz, compared to the 3-6 Hz and 6-12 Hz, respectively in the BLA experimental literature. Our main reason for extending the ranges was because the peaks of low and high theta power in the VIP and SOM cells, respectively, (the cells that generate these oscillations) occurred at the borders of the experimental ranges. Thus, in order to include the peaks of the model LFP, we lowered the low theta range by 1 Hz and increased the high theta range by 2 Hz.
We present a new supplementary figure (Fig. S1) containing the power spectra of VIP, which is the source of low theta in our model, and SOM interneuron, which is the source of high theta:
We mention Fig. S1 in the Result section “Rhythms in the BLA can be produced by interneurons”, where we added the following text: o “In the baseline condition, the condition without any external input from the fear conditioning paradigm (Fig. 1B, top), our VIP neurons exhibit short bursts of gamma activity (~38 Hz) at low theta frequencies (~2-6 Hz) (peaking at ~3.5 Hz) (see Fig. S1A).” o “In our baseline model, SOM cells have a natural frequency of ~12 Hz (Fig. 1B, middle; Fig. S1B), which is at the upper limit of the experimental high theta range; this motivates our choice to extend the high theta range up to 14 Hz in order to include the peak.”
Knowing the natural frequencies of VIP and SOM interneurons from the Result section “Rhythms in the BLA can be produced by interneurons”, we specified more clearly that we quantify the change of power in the low and high theta range around the power peaks in those ranges. Specifically, we changed some sentences in the first paragraph of the Result section “Increased low-theta frequency is a biomarker of fear learning” as follows:
“We find that fear conditioning leads to an increase in low theta frequency power of the network spiking activity compared to the pre-conditioned level (Fig. 6 A,B); there is no change in the high theta power. We also find that the LFP, modeled as the linear sum of all the AMPA, GABA, NaP-, D-, and H- currents in the network, similarly reveals a low theta power increase when considering the peak of the low theta power, and no significant variation in the high theta power again when considering the peak of the high theta power (Fig. 6 C,D,E).”
Finally, we made a few other small changes:
In the Introduction, we mention the following: “We also note that there is not uniformity on the exact frequencies associated with low and high theta, e.g., ((Lorétan et al., 2004) used 2-6 Hz for low theta). Here, we use 2-6 Hz for the theta range and 6-14 Hz for the high theta range.”
In Fig. 6DE (reported below point 3)), we reran the statistics using a smaller interval for high theta (11.5-13 Hz) to focus around the peak. Our initial result showing significant change in low theta between pre and post fear conditioning and no change in high theta still holds.
In Fig. 6 of the Result section “Increase low-theta frequency is a biomarker of fear learning”, we switched the order of panels F and G. This change allows us to first focus on the AMPA currents, which are the major contributors of the low theta power increase, and to specify what AMPA current drives that increase. After that, we present the power spectrum of the GABA currents, as well.
The corresponding text in the Result section, now reads as follows:
“We find that fear conditioning leads to an increase in low theta frequency power of the network spiking activity compared to the pre-conditioned level (Fig. 6 A,B); there is no change in the high theta power. We also find that the LFP, modeled as the linear sum of all the AMPA, GABA, NaP-, D-, and H- currents in the network, similarly reveals a low theta power increase when considering the peak of the low theta power, and no significant variation in the high theta power again when considering the peak of the high theta power (Fig. 6 C,D,E). These results are consistent with the experimental findings in (Davis et al., 2017). Specifically, the newly potentiated AMPA synapse from ECS to F ensures F is active after fear conditioning, thus generating strong currents in the PV cells to which it has strong connections (Fig. 6F). It is the AMPA currents to the PV interneurons that are directly responsible for the low theta increase; it is the newly potentiated ECS to F synapse that paces the AMPA currents in the PV interneurons to go at low theta. Thus, the low theta increase is due to added excitation provided by the new learned pathway.”
(4) In the Discussion section “Assumptions and predictions of the model”, we specified the following:
“Our model predicts that blockade of D-current in VIP interneurons (or silencing VIP interneurons) will both diminish low theta and prevent fear learning. Finally, the model assumes the absence of significantly strong connections from the excitatory projection cells ECS to PV interneurons, unlike the ones from F to PV. Including those synapses would alter the PING rhythm created by the interactions between F and PV, which is crucial for fine timing between ECS and F needed for LTP.”
(5) Finally, to broaden the potential interest of our study, we added the following sentences:
At the conclusion of the abstract:
“The model makes use of interneurons commonly found in the cortex and, hence, may apply to a wide variety of associative learning situations.” - At the conclusion of the introduction:
“Finally, we note that the ideas in the model may apply very generally to associative learning in the cortex, which contains similar subcircuits of pyramidal cells and interneurons: PV, SOM and VIP cells.”
Also, changes in the emphasis of the paper led us to remove the following from the abstract: “Finally, we discuss how the peptide released by the VIP cell may alter the dynamics of plasticity to support the necessary fine timing.”
-
eLife Assessment
This valuable modeling study explores how biophysical properties of different interneuron subtypes in the basolateral amygdala (BLA) enable production of oscillations that facilitate functions such as spike-timing-dependent plasticity. Simulated networks provide solid evidence that highlights the importance of interactions between interneurons for some forms of spike-timing dependent plasticity. This work will likely be of interest to investigators studying interactions among interneurons, rhythms in the amygdala, and mechanisms of plasticity thought to underlie associative learning.
-
Reviewer #1 (Public review):
Plasticity in the basolateral amygdala (BLA) is thought to underlie the formation of associative memories between neutral and aversive stimuli, i.e. fear memory. Concomitantly, fear learning modifies the expression of BLA theta rhythms, which may be supported by local interneurons. Several of these interneuron subtypes, PV+, SOM+, and VIP+, have been implicated in the acquisition of fear memory. However, it was unclear how they might act synergistically to produce BLA rhythms that structure the spiking of principal neurons so as to promote plasticity. Cattani et al. explored this question using small network models of biophysically detailed interneurons and principal neurons.
Using this approach, the authors had four principal findings:
(1) Intrinsic conductances in VIP+ interneurons generate a slow theta rhythm that periodically inhibits PV+ and SOM+ interneurons, while disinhibiting principal neurons.<br /> (2) A gamma rhythm arising from the interaction between PV+ and principal neurons establishes the precise timing needed for spike-timing-dependent plasticity.<br /> (3) Removal of any of the interneuron subtypes abolishes conditioning-related plasticity.<br /> (4) Learning-related changes in principal cell connectivity enhance expression of slow theta in the local field potential.
The strength of this work is that it explores the role of multiple interneuron subtypes in the formation of associative plasticity in the basolateral amygdala. The authors use biophysically detailed cell models that capture many of their core electrophysiological features, which helps translate their results into concrete hypotheses that can be tested in vivo. Moreover, they try to align the connectivity and afferent drive of their model with those found experimentally.
A drawback to this study is the construction of the afferent drive to the network, which does not elicit activities that are consistent with the majority of those observed to similar stimuli. The authors discuss this issue in depth, and provide potential mechanisms that may overcome it.
Setting aside the issues with the conditioning protocol, the study offers a model for the generation of multiple rhythms in the BLA that is ripe for experimental testing. The most promising avenue would be in vivo experiments testing the role of local VIP+ neurons in the generation of slow theta. That would go a long way to resolving whether BLA theta is locally generated or inherited from medial prefrontal cortex or ventral hippocampus afferents.
The broader importance of this work is that it illustrates that we must examine the function of neurons not just in terms of their behavioral correlates, but by their effects on the microcircuit they are embedded within. No one cell type is instrumental in producing fear learning in the BLA. Each contributes to the orchestration of network activity to produce plasticity. Moreover, this study reinforces a growing literature highlighting the crucial role of theta and gamma rhythms in BLA function.
-
-
www.biorxiv.org www.biorxiv.org
-
Author response:
The following is the authors’ response to the original reviews.
Recommendations for the authors:
Reviewer #1 (Recommendations For The Authors):
The manuscript could be improved by addressing the following issues.
(1) Fig. 3: The analgesic effects after astrocyte ablation appear to recover after one week. Is this due to repopulation of astrocytes?
Although we did not detect the proliferation of astrocytes, we hypothesized that it was likely related to the microglia phagocytosis of astrocyte debris after astrocyte ablation. Microglia are known to have the function of phagocytosis of cell debris. Diphtheria toxin-mediated cell ablation caused AAV2/5-GfaABC1D-Cre labeled astrocytes death and cell fragmentation. We hypothesized that the microglia could phagocyte the astrocyte fragments and were stimulated to activate type I interferon signal. When microglia phagocyte debris ended, the activation of type I interferon signal was also declined. Reduced activation of type I interferon signal may also be accompanied by recurrence of pain.
(2) Fig. 3: Please justify the large sample size of n=30-36. Is this sample size based on previous studies or statistical estimation?
The number of mice was based on our previous report [1], and the increased number of mice may also ensure that the pain data would also be reliable. Not only did we explore the differences between the sexes, and we also needed to obtain samples at different times for different experiments.
(3) Please try to plot individual data points for some critical time points to demonstrate data distribution. It is also helpful to plot male and female data points separately for some time points.
Individual data have been plotted as your request and added in the supplementary material.
(4) It is unclear if the same number of males and females were used in this study, as females were typically used for SCI studies. I wonder if you can use repeated measures Two-Way ANOVA for statistical analysis.
According to our observations, the number of males and females was not the same, while both of them were sufficient for statistical analysis. In addition, in the process of breeding transgenic mice, we would obtain both male and female mice, and rational use of mice may be better for us. Indeed, previous studies have shown that female mice are more commonly used in pain studies. Although we did not observe a gender difference in this study, it has been reported in the previous studies that gender is one of the factors for pain differences. According to your suggestion, we adopted the Two-Way ANOVA for statistical analysis and updated it in the part of statistical methods, but the statistical results were consistent with the previous results, so we did not modify the statistical results of the pictures.
(5) Fig. 3C, D: The effects of astrocyte ablation on mechanical pain are mild, compared to thermal pain. Electronic von Frey apparatus may be difficult for mice. It works very well for rats and large animals.
Since the animals involved in this study were all mice, we did not know how electronic von Frey was used in rats and large animals. But after the using of electronic von Frey, it seems to us that electronic von Frey is very suitable for mouse experiments. Best of all, our electronic von Frey can achieve accuracy as low as 0.01g. This allows us to detect very sensitive pain data, which may be more accurate and intuitive than before.
(6) Fig. 2B: In the figure legend it states n = 3 biological repeats. There are many more dots in each column. Are these individual animals or spinal cord sections?
As we describe in our method, n = 3 biological repeats represented three biological repeats per group, i.e., three mice/group with three IF per mouse. We take three or more values in each ascending tract (depending on the partition size of the different ascending tracts of lumbar enlargements). So, we would get more data as shown in Figure 2, which could be also more reliable.
(7) Fig. 4C: It appears that GFAP is increased by toxin treatment. Please explain this result.
This figure was calculated for astrocyte activation in the lesion area (T9-10), but not for the lumbar enlargement.
Reviewer #2 (Recommendations For The Authors):
Specific Comments:
RNA-Sequencing Analysis: The strength of the RNA-sequencing data in elucidating the impact of astrocyte elimination is compelling. While the focus on IFN signaling is well-supported, the manuscript overlooks other differentially expressed genes. A deeper analysis or at least a discussion of these genes could enrich the study's conclusions, offering a more holistic view of the underlying mechanisms.
Although we did not focus more on other relevant differential genes, we focused on the most significant differential genes, for these differential genes have a more significant effect on pain.
Q2: Figure Presentation: Consolidating Figures 1-3 could increase the clarity of the result presentation, reducing distractions from the main narrative. Certain aspects, such as the comparison of different tracts in Figure 2B and the body weight data in Figure 3C, seem tangential and might be better suited for supplementary materials.
The comparison of astrocyte activation in different ascending tracts of lumbar enlargements explained the relationships between astrocyte activation and pain, and laid the foundation for the subsequent astrocyte elimination. The weight data is also important, reflecting not only the changes in the overall recovery process after spinal cord injury, but also the effect of astrocyte elimination on the overall effect of mice. Thus, the weight data together with the pain test results will be more intuitive for the reader to understand the change of overall conditions of mice after astrocyte elimination.
Q3: Schematic Clarity: The schematic in Figure 1A is confusing, particularly in distinguishing between transgenic mice and viral constructs. The inconsistent naming of Cre recombinase (alternatively referred to as Cre, CRE, and sometimes DRE) further complicates understanding. Standardizing these elements would greatly enhance clarity for the readers.
As we described in the part of method, Gt(ROSA)26Sorem1(CAG-LSL-RSR-tdTomato-2A-DTR)Smoc mice contain both Loxp-stop-Loxp sequence and Rox-stop-Rox sequence. In the process of reproduction, Gt(ROSA)26Sorem1(CAG-LSL-RSR-tdTomato-2A-DTR)Smoc mice crossed with C57BL/6JSmoc-Tg(CAG-Dre)Smoc mice could remove the Rox-stop-Rox sequence, which could further crossed with mice containing Cre recombinase, or with AAV2/5-GfaABC1D-Cre intervention to remove the Loxp-stop-Loxp sequence and induce the expression of tdTomato and DTR.
Q4: Pathway Analysis: The discussion of the signal pathway analysis in Figure 8 leans heavily on speculation without direct evidence from the study. Distinguishing clearly between findings and literature-derived hypotheses is crucial. A more detailed discussion that properly cites sources for each pathway element would strengthen the manuscript.
According to your question, we have added this figure to the supplementary picture.
Q5: Statistical Analysis: The use of one-way ANOVA, despite presenting data in groups, is misaligned with the data's structure. Employing two-way ANOVA followed by post-hoc comparisons is appropriate for statistical analysis.
According to your suggestions, we adopted the Two-Way ANOVA for statistical analysis and updated it in the part of statistical methods, but the statistical results are consistent with the previous ones. Therefore, we did not modify the statistical results of the pictures.
-
eLife Assessment
This important study demonstrated that ablation of astrocytes in the lumbar spinal cord not only reduced neuropathic pain but also caused microglia activation. The findings presented add considerable value to the current understanding of the role of astrocyte elimination in neuropathic pain, offering convincing evidence that supports existing hypotheses and insights into the interactions between astrocytes and microglial cells, likely through IFN-mediated mechanisms
-
Reviewer #1 (Public Review):
Summary:
In this study the authors demonstrated that ablation of astrocytes in lumbar spinal cord not only reduced neuropathic pain but also caused microglia activation. Furthermore, RNA sequencing and bioinformatics revealed an activation of STING/type I IFNs signal pathway in spinal cord microglia after astrocyte ablation.
Strengths:
The findings are novel and interesting and provide new insights into astrocyte-microglia interaction in neuropathic pain. This study may also offer a new therapeutic strategy for the treatment of debilitating neuropathic pain in patients with SCI.
Weaknesses:
The authors have provided a satisfactory explanation of the comments on sample size, statistics, and the sex of the animals. The statistic was reworked.
-
Reviewer #2 (Public Review):
Summary:
In the manuscript, Zhao et al. have carried out a thorough examination of the effects of targeted ablation of resident astrocytes on behavior, cellular responses, and gene expression after spinal cord injury. Employing transgenic mice models alongside pharmacogenetic techniques, the authors have successfully achieved the selective removal of these resident astrocytes. This intervention led to a notable reduction in neuropathic pain and induced a shift in microglial cell reactivation states within the spinal cord, significantly altering transcriptome profiles predominantly associated with interferon (IFN) signaling pathways.
Strengths:
The findings presented add considerable value to the current understanding of the role of astrocyte elimination in neuropathic pain, offering convincing evidence that supports existing hypotheses and valuable insights into the interactions between astrocytes and microglial cells, likely through IFN-mediated mechanisms. This contribution is highly relevant and suggests that further exploration in this direction could yield meaningful results.
Weaknesses:
The authors have satisfactorily addressed the comments regarding further clarifications and statistical methods.
-
-
www.biorxiv.org www.biorxiv.org
-
eLife Assessment
The study is valuable to the field, introducing a new model to test BM-periosteal stem cell function in vivo. The authors' findings suggested that periosteal stem cells are linked to hematopoietic regeneration. More comparisons with the conventional model and direct examination of periosteal stem cell factors in hematopoietic regeneration are missing. The observations are solid, however, the limitations in their experimental model made the overall impact incomplete; there is potential for improvements to be made in this area.
-
Reviewer #1 (Public review):
The manuscript under review investigates the role of periosteal stem cells (P-SSC) in bone marrow regeneration using a whole-bone subcutaneous transplantation model. While the model is somewhat artificial, the findings were interesting, suggesting the migration of periosteal stem cells into the bone marrow and their potential to become bone marrow stromal cells. This indicates a significant plasticity of P-SSC consistent with previous reports using fracture models (Cell Stem Cell 29:1547, Dev Cell 59:1192).
Major Concerns
(1) The authors assert that the periosteal layer was completely removed in their model, which is crucial for their conclusions. To substantiate this claim, it is recommended that the authors provide evidence of the successful removal of the entire periosteal stem cell (P-SSC) population. A colony-forming assay, with and without periosteal removal, could serve as a suitable method to demonstrate this.
(2) The observation that P-SSCs do not express Kitl or Cxcl12, while their bone marrow stromal cell (BM-MSC) derivatives do, is a key finding. To strengthen this conclusion, the authors are encouraged to repeat the experiment using Cxcl12 or Scf reporter alleles. Immunofluorescence staining that confirms the migration of periosteal cells and their transformation into Cxcl12- or Scf-reporter-positive cells would significantly enhance the paper's key conclusion.
(3) On page 8, line 20, the authors' statement regarding the detection of Periostin+ cells outside the periosteum layer could be misinterpreted due to the use of the periostin antibody. Given that periostin is an extracellular matrix protein, the staining may not accurately represent Periostin-expressing cells but rather the presence of periostin in the extracellular matrix. The authors should revise this section for greater precision.
-
Reviewer #2 (Public review):
Summary:
The authors have established a femur graft model that allows the study of hematopoietic regeneration following transplantation. They have extensively characterized this model, demonstrating the loss of hematopoietic cells from the donor femur following transplantation, with recovery of hematopoiesis from recipient cells. They also show evidence that BM MSCs present in the graft following transplantation are graft-derived. They have utilized this model to show that following transplantation, periosteal cells respond by first expanding, then giving rise to more periosteal SSCs, and then migrating into the marrow to give rise to BM MSCs.
Strengths:
These studies are notable in several ways:
(1) Establishment of a novel femur graft model for the study of hematopoiesis;
(2) Use of lineage tracing and surgery models to demonstrate that periosteal cells can give rise to BM MSCs.
Weaknesses:
There are a few weaknesses. First, the authors do not definitively demonstrate the requirement of periosteal SSC movement into the BM cavity for hematopoietic recovery. Hematopoiesis recovers significantly before 5 months, even before significant P-SSC movement has been shown, and hematopoiesis recovers significantly even when periosteum has been stripped. Second, it is not clear how the periosteum is changing in the grafts. Which cells are expanding is unclear, and it is not clear if these cells have already adopted a more MSC-like phenotype prior to entering the marrow space. Indeed, given the presence of host-derived endothelial cells in the BM, these studies are reminiscent of prior studies from this group and others that re-endothelialization of the marrow may be much more important for determining hematopoietic regeneration, rather than the P-SSC migration. Third, the studies exploring the preferential depletion of BM MSCs vs P-SSCs are difficult to interpret. The single metabolic stress condition chosen was not well-justified, and the use of purified cell populations to study response to stress ex vivo may have introduced artifacts into the system.
-
Reviewer #3 (Public review):
Summary:
Marchand, Akinnola, et al. describe the use of the novel model to study BM regeneration. Here, they harvest intact femurs and subcutaneously graft them into recipient mice. Similar to standard BM regeneration models, there is a rapid decrease in cellularity followed by a gradual recovery over 5 months within the grafts. At 5 months, these grafts have robust HSC activity, similar to HSCs isolated from the host femur. They find that periosteum skeletal stem cells (p-SSCs) are the primary source of BM-MSCs within the grafted femur and that these cells are more resistant to the acute stress of grafting the femur.
Strengths:
This is an interesting manuscript that describes a novel model to study BM regeneration. The model has tremendous promise.
Weaknesses:
The authors claim that grafting intact femurs subcutaneously is a model of BM regeneration and can be used as a replacement for gold standard BM regeneration assays such as sublethal chemo/irradiation. However, there isn't enough explanation as to how this model is equivalent or superior to the traditional models. For instance, the authors claim that this model allows for the study of "BM regeneration in vivo in response to acute injury using genetic tools." This can and has been done numerous times with established, physiologically relevant BM regeneration models. The onus is on the authors to discuss or perform the necessary experiments to justify the use of this model. For example, standard BM regeneration models involve systemic damage that is akin to therapies that require BM regeneration. How is studying the current model that provides only an acute injury more relevant and useful than other models? As it stands, it seems as if the authors could have done all the experiments demonstrating the importance of these p-SSCs in the traditional myelosuppressive BM regeneration models to be more physiologically relevant. Along these lines, the use of a standard BM regeneration model (e.g., sublethal chemo/irradiation) as a critical control is missing and should be included. Even if the control doesn't demonstrate that p-SSCs can contribute to the BM-MSC during regeneration, it will still be important because it could be the justification for using the described model to specifically study p-SSCs' regulation of BM regeneration.
The authors perform some analysis that suggests that grafting a whole femur mimics BM regeneration, but there are many experiments missing from the manuscript that will be necessary to support the use of this model. To demonstrate that this new model mimics current BM regeneration models, the authors need to perform a careful examination of the early kinetics of hematopoietic recovery post-transplant. Complete blood counts should be performed on the grafts, focusing on white blood cells (particularly neutrophils), red blood cells, platelets, all critical indicators of BM regeneration. This analysis should be done at early time points that include weekly analysis for a minimum of 28 days following the graft. Additionally, understanding how and when the vasculature recovers is critical. This is particularly important because it is well-established that if there is a delay in vascular recovery, there is a delay in hematopoietic recovery. As mentioned above, a standard BM regeneration model should be used as a control.
The contribution of donor and host cells to the BM regeneration of the graft is interesting. Particularly, the chimerism of the vasculature. One can assume that for the graft to undergo BM regeneration, there needs to be the delivery of nutrients into the graft via the vasculature. The chimerism of the vascular network suggests that host endothelial cells anastomose with the graft. Host mice should have their vascular system labeled with a dye such as dextran to determine if anastomosis has occurred. If not, the authors need to explain how this graft survives up to 5 months. If anastomosis does occur, then it is very surprising that the hematopoietic system of the graft is not a chimera because this would essentially be a parabiosis model. This needs to be explained.
Most of the data presented for the resistance of p-SSCs to stress suggests DNA damage response. Do p-SSCs demonstrate a higher ability to resolve DNA damage? Do they accumulate less DNA damage? Staining for DNA damage foci or performing comet assays could be done to further define the mechanism of stress resistance properties of p-SSCs.
Given the importance of BM-MSCs in hematopoiesis and that the majority of the emerging BM-MSCs appear to be derived from p-SSCs, the authors should perform experiments to determine if p-SSC-derived BM-MSCs are critical regulators of BM regeneration. For example, the authors could test this by crossing the Postn-creER mice with iDTR mice to ablate these cells and see if recovery is inhibited or delayed. This should be done with the described periosteum-wrapped femur graft model as well as a control BM regeneration model. Demonstrating that the deletion of these cells affects BM regeneration in both models would further justify the physiological relevance and utility of the femur graft model.
-
-
www.biorxiv.org www.biorxiv.org
-
Author response:
The following is the authors’ response to the original reviews.
Reviewer #1 (Public Review):
We appreciate the valuable and constructive comments of Reviewer #1 on our manuscript. We have addressed the comments from Reviewer #1 in the public review in the response to the recommendations for the authors, as the public review comments largely overlap with that of the recommendations for the authors.
Reviewer #1 (Recommendations For The Authors):
(1.1) Figure 1 did not use a mock-infected control for the development of R-loops but only a time before infection. I think it would have been a good control to have that after the same time of infection non-infected cells did not show increases in R-loops and this is not a product of the cell cycle.
We prepared our DRIPc-seq library using cell extracts harvested at 0, 3, 6, and 12 h post-infection (hpi), all at the same post-seeding time point. Each sample was infected with HIV-1 virus in a time-dependent manner. Therefore, it is unlikely that the host cellular R-loop induction observed in our DRIPc-seq results was due to R-loop formation during the cell cycle. In Lines 93–95 of the Results section of the revised manuscript, we have provided a more detailed description of our DRIPc-seq library experimental scheme. Thank you.
(1.2) Figure 2 should have included a figure showing the proportion of DRIPc-seq peaks located in different genome features relative to one another instead of whether they were influenced by time post-infection. Figure 2C was performed in HeLa cells, but primary T cell data would have been more relevant as primary CD4+ T cells are more relevant to HIV infection.
We have included a new figure presenting the relative proportion of DRIPc-seq peaks mapped to different genomic features at each hpi (Fig. 2C of the revised manuscript). We found that the proportion of DRIPc-seq peaks mapped to various genomic compartments remained consistent over the hours following the HIV-1 infection. This further supports our original claim that HIV-1 infection does not induce R-loop enrichment at specific genomic features but that the accumulation of R-loops after HIV-1 infection is widely distributed.
We considered HeLa cells as the primary in vitro infection model, therefore, we conducted RNA-seq only on HeLa cells. However, we agree with the reviewer's opinion that data from primary CD4+ T cells may be more physiologically relevant. Nevertheless, as demonstrated in the new figure (Fig. 2C of the revised manuscript), HIV-1 infection did not significantly alter the proportion of R-loop peaks mapped to specific genomic compartments, such as gene body regions, in HeLa, primary CD4+ T, and Jurkat cells. Therefore, we anticipate no clear correlation between changes in gene expression levels and R-loop peak detection upon HIV-1 infection, even in primary T cells. Thank you.
(1.3) Figure 5G is very hard to see when printed, is there a change in brightness or contrast that could be used? The arrows are helpful but they don't seem to be pointing to much.
We have highlighted the intensity of the PLA foci and magnified the images in Fig. 5G in the revised manuscript. While editing the images according to your suggestion, we found a misannotation regarding the multiplicity of infection in the number of PLA foci per nucleus quantification analysis graph in Fig. 5G of the original manuscript. We have corrected this issue and hope that it is now much clearer.
(1.4) The introduction provided a good background for those who may not have a comprehensive understanding of DNA-RNA hybrids and R-loops, but the rationale that integration in non-expressed sequence implies that R-loops may be involved is very weak and was not addressed experimentally. A better rationale would have been to point out that, although integration in genes is strongly associated with gene expression, the association is not perfect, particularly in that some highly expressed genes are, nonetheless, poor integration targets.
In accordance with the reviewer's comment, we revised the Introduction. We have deleted the statement and reference in the introduction "... the most favored region of HIV-1 integration is an intergenic locus, ...”, which may overstate the relevance of the R-loop in HIV-1 integration events in non-expressed sequences. Instead, we introduced a more recent finding that high levels of gene expression do not always predict high levels of integration, together with the corresponding citation (Lines 46– 47 of the revised manuscript), according to the reviewer’s suggestion in the reviewer's public review 2)-(a).
(1.5) The discussion was seriously lacking in connecting their conclusions regarding R-loop targeting of integration to how integration works at the structural level, where it is very clear that concerted integration on the two DNA strands ca 5 bp apart is essential to correct, 2-ended integration. It is very difficult to visualize how this would be possible with the triple-stranded R-loop as a target. The manuscript would be greatly strengthened by an experiment showing concerted integration into a triplestranded structure in vitro using PICs or pure integrase.
We believe there has been a misunderstanding of our interpretation regarding the putative role of R-loop structures in the HIV-1 integration site mechanism because of some misleading statements in our original manuscript. Based primarily on our current data, we believe that R-loop structures are bound by HIV-1 integrase proteins and lead to HIV-1 viral genome integration into the vicinity regions of the host genomic R-loops. By carefully revising our manuscript, we found that the title, abstract, and discussion of our original manuscript includes phrases, such as “HIV-1 targets R-loops for integration,” which may overstate our finding on the role of R-loop in HIV-1 integration site selection. We replaced these phrases. For example, we used phrases, such as, “HIV-1 favors vicinity regions of R-loop for the viral genome integration,” in the revised manuscript. We apologize for the inconvenience caused by the unclear and nonspecific details of our findings.
Using multiple biochemical experiments, we successfully demonstrated the interaction between the cellular R-loop and HIV-1 integrase proteins in cells and in vitro (Fig. 5 of the revised manuscript). However, we could not validate whether the center of the triple-stranded R-loops is the extraction site of HIV-1 integration, where the strand transfer reaction by integrase occurs. This is because an R-loop can be multi-kilobase in size (1, 2); therefore, we displayed a large-scale genomic region (30-kb windows) to present the integration sites surrounding the R-loop centers. Nevertheless, we believe that we validated R-loop-mediated HIV-1 integration in R-loop-forming regions using our pgR-poor and pgR-rich cell line models. When infected with HIV-1, pgR-rich cells, but not pgR-poor cells, showed higher infectivity upon R-loop induction in designated regions following DOX treatment (Fig. 3C and 3D of the revised manuscript). In addition, we quantified site-specific integration events in R-loop regions, and found that a greater number of integration events occurred in designated regions of the pgR-rich cellular genome upon R-loop induction by DOX treatment, but not in pgR-poor cells (Fig. 3E–G of the revised manuscript).
We agree with the reviewer that an experiment showing the concerted integration of purified PICs into a triple-stranded structure in vitro would greatly strengthen our manuscript. We attempted the purification of viral DNA (vDNA)-bound PICs using either Sso7d-tagged HIV-1 integrase proteins or non-tagged HIV-1 integrase proteins (F185K/C280S) procured from the NIH HIV reagent program (HRP-20203), following the method described by Passos et al., Science, 2017; 355 (89-92) (3). Despite multiple attempts, we could not purify the nucleic acid-bound protein complexes for in vitro integration assays. However, we believe that pgR-poor and pgR-rich cell line models provide a strong advantage in specificity of our primer readouts. Compounded with our in cellulo observation, we believe that our work provides strong evidence for a causative relationship between R-loop formation/R-loop sites and HIV-1 integration.
Additionally, in the Discussion section of the revised manuscript, we have expanded our discussion on the role of genomic R-loops contributing in molding the host genomic environment for HIV-1 integration site selection, and the potential explanation on how R-loops are driving integration over long-range genomic regions. Thank you.
(1.6) There are serious concerns with the quantitation of integration sites used here, which should be described in detail following line 503 but isn't. In Figure 3, E-G, they are apparently shown as reads per million, while in Figure 4B as "sites (%)" and in 4C as log10 integration frequency." Assuming the authors mean what they say, they are using the worst possible method for quantitation. Counting reads from restriction enzyme-digested, PCR-digested DNA can only mislead. At the numbers provided (MOI 0.6, 10 µg DNA assayed) there would be about 1 million proviruses in the samples assayed, so the probability of any specific site being used more than once is very low, and even less when one considers that a 10% assay efficiency is typical of integration site assays. Although the authors may obtain millions of reads per experiment, the number of reads per site is an irrelevant value, determined only by technical artefacts in the PCR reactions, most significantly the length of the amplicons, a function of the distance from the integration site to the nearest MstII site, further modified by differences in Tm. Better is to collapse identical reads to 1 per site, as may have been done in Figure 4B, however, the efficiency of integration site detection will still be inversely related to the length of the amplicon. Indeed, if the authors were to plot the read frequency against distance to the nearest MstII site, it is likely that they would get plots much like those in Figure 4B.
Detailed methods for integration site sequencing data processing are described in the Materials and Methods section of the revised manuscript (Line 621–631 of the revised manuscript). We primarily followed HIV-1 integration site sequencing data processing methods previously described by Li et al., mBio, 2020; 11(5) (4).
While it may be correct that the HIV-1 integration event cannot occur more than once at a given site, our Fig. 3E, 4C, and 4D of the revised manuscript present the number of integration-site sequencing read counts expressed in reads-per-million (RPM) units or as log10-normalized values. Based on the number of mapped reads from the integration site sequencing results, we can infer that there was an integration event at this site, whether it was a single or multiple event.
We believe that the original annotation of y-axis, “Integration frequency,” may be misleading as it can be interpreted as a probability of any specific site being used for HIV-1 integration. Therefore, we corrected it as “number of mapped read” for clarity (Fig. 3E–G, 4C and 4D, and the corresponding figure legends of the revised manuscript). We apologize for any confusion. Thank you.
Other points:
(1.7) Overall: There are numerous grammatical and usage errors, especially in agreement of subject and verb, and missing articles, sometimes multiple times in the same sentence. These must be corrected prior to resubmission.
The revised manuscript was edited by a professional editing service. Thank you.
(1.8) Line 126-134: A striking result, but it needs more controls, as discussed above, including a dose-response analysis.
We determined the doses of NVP and RAL inhibitors in HeLa cells by optimizing the minimum dose of drug treatment that provided a sufficient inhibitory effect on HIV1 infection (Author response image 1). The primary objective of this experiment was to determine R-loop formation while reverse transcription or integration of the HIV-1 life cycle was blocked, therefore, we do not think that a dose-dependent analysis of inhibitors is required.
Author response image 1.
(A and B) Representative flow cytometry histograms of VSV-G-pseudotyped HIV-1-EGFP-infected HeLa cells at an MOI of 1, harvested at 48 hpi. The cells were treated with DMSO, the indicated doses of nevirapine (NVP) (A) or indicated doses of raltegravir (RAL) (B) for 24 h before infection.
(1.9) Line 183: Please tell us what ECFP is and why it was chosen. Is there a reference for its failure to form R-loops?
Ibid: The human AIRN gene is a very poor target for HIV integration in PBMC.
A high GC skew value (> 0) is a predisposing factor for R-loop formation at the transcription site. This is because a high GC skew causes a newly synthesized RNA strand to hybridize to the template DNA strand, and the non-template DNA strand remains looped out in a single-stranded conformation (5) (Ref 36 in the revised manuscript). The ECFP sequence possessed a low GC skew value, as previously used for an R-loop-forming negative sequence (6) (Ref 17 of the revised manuscript). We have added this description and the corresponding references to Lines 188–192 of the revised manuscript.
The human AIRN gene (RefSeq DNA sequence: NC_000006.12) sequence possesses a GC skew value of -0.04, in a window centered at base 2186, while the mouse AIRN (mAIRN) sequence is characterized by a GC skew value of 0.213. The ECFP sequence gave a GC skew value of -0.086 in our calculation. We anticipated that the human AIRN gene region does not form a stable R-loop, and in fact, it did not harbor R-loop enrichment upon HIV-1 infection in our DRIPc-seq data analysis of multiple cell types (Author response image 2)
Author response image 2.
Genome browser screenshot over the chromosomal regions in 20-kb windows centered on human AIRN showing results from DRIPc-seq in the indicated HIV-1-infected cells (blue, 0 hpi; yellow, 3 hpi; green, 6 hpi; red, 12 hpi)
(1.10) Line 190: You haven't shown dependence. Associated is a better word.
Thank you for the suggestion. We have changed “R-loop-dependent site-specific HIV-1 integration events...” to “R-loop-associated site-specific HIV-1 integration events...” (Line 198 of the revised manuscript) according to the reviewer’s suggestion in the revised manuscript.
(1.11) Line 239: What happened to P1? What is the relationship of the P and N regions to genes?
We have added superimpositions of the P1 chromatin region on DRIPc-seq and the HIV-1 integration frequency to Figure 4C of the revised manuscript. We observed a relevant integration event within the P1 R-loop region, but to a lesser extent than in the P2 and P3 R-loop regions, perhaps because the P1 region has relatively less R-loop enrichment than the P2 and P3 regions, as examined by DRIP-qPCR in S3A Fig. of the revised manuscript.
Genome browser screenshots with annotations of accommodating genes in the P and N regions are shown in S2A–E Fig. of the revised manuscript, and RNA-seq analysis of the relative gene expression levels of the P1-3 and N1,2 R-loop regions are shown in S4 Table of the revised manuscript. Thank you.
(1.12) Line 261: But the binding affinity of integrase to the R-loop is somewhat weaker than to double-stranded DNA according to Figure 5A.
Nucleic acid substrates were loaded at the same molarity, and the percentage of the unbound fraction was calculated by dividing the intensity of the unbound fraction in each lane by the intensity of the unbound fraction in the lane with 0 nM integrase in the binding reaction. The calculated percentages of the unbound fraction from three independent replicate experiments are shown in Fig. 5A, right of the revised manuscript. In our analysis and measurements, the integrase proteins showed higher binding affinities to the R-loop and R-loop comprising nucleic acid structures than to dsDNA in vitro. We hope that this explanation clarifies this point.
(1.13) Line 337: "accumulate". This is a not uncommon misinterpretation of the results of studies on the distribution of intact proviruses in elite controllers. The only possible correct interpretation of the finding is that proviruses form everywhere else but cells containing them are eliminated, most likely by the immune system.
Thank you for the suggestion. We have changed the Line 337 of the original manuscript to “... HIV-1 proviruses in heterochromatic regions are not eliminated but selected by immune system,” in Lines 361-363 of the revised manuscript.
(1.14) Line 371 How many virus particles per cell does this inoculum amount to?
We determined the amount of GFP reporter viruses required to transduce ∼50% of WT Jurkat T cells, corresponding to an approximate MOI of 0.6. We repeatedly obtained 30–50% of VSV-G-pseudotyped HIV-1-EGFP positively infected cells for HIV1 integration site sequencing library construction for Jurkat T cells.
(1.15) Line 503 and Figures 3 and 4: There must be a clear description of how integration events are quantitated.
Detailed methods for integration site sequencing data processing are described in the Materials and Methods section of the revised manuscript (Line 621–631 of the revised manuscript). We primarily followed HIV-1 integration site sequencing data processing methods previously described in Li et al., mBio, 2020; 11(5) (4).
Reviewer #2 (Public Review):
Retroviral integration in general, and HIV integration in particular, takes place in dsDNA, not in R-loops. Although HIV integration can occur in vitro on naked dsDNA, there is good evidence that, in an infected cell, integration occurs on DNA that is associated with nucleosomes. This review will be presented in two parts. First, a summary will be provided giving some of the reasons to be confident that integration occurs on dsDNA on nucleosomes. The second part will point out some of the obvious problems with the experimental data that are presented in the manuscript.
We appreciate your comments. We have carefully addressed the concerns expressed as follows (your comments are in italics):
(2.1) 2017 Dos Passos Science paper describes the structure of the HIV intasome. The structure makes it clear that the target for integration is dsDNA, not an R-loop, and there are very good reasons to think that structure is physiologically relevant. For example, there is data from the Cherepanov, Engelman, and Lyumkis labs to show that the HIV intasome is quite similar in its overall structure and organization to the structures of the intasomes of other retroviruses. Importantly, these structures explain the way integration creates a small duplication of the host sequences at the integration site. How do the authors propose that an R-loop can replace the dsDNA that was seen in these intasome structures?
We do appreciate the current understanding of the HIV-1 integration site selection mechanism and the known structure of the dsDNA-bound intasome. Our study proposes an R-loop as another contributor to HIV-1 integration site selection. Recent studies providing new perspectives on HIV-1 integration site targeting motivated our current work. For instance, Ajoge et al., 2022 (7) indicated that a guanine-quadruplex (G4) structure formed in the non-template DNA strand of the R-loop influences HIV-1 integration site targeting. Additionally, I. K. Jozwik et al., 2022 (8) showed retroviral integrase protein structure bound to B-to-A transition in target DNA. R-loop structures are a prevalent class of alternative non-B DNA structures (9). We acknowledge the current understanding of HIV-1 integration site selection and explore how R-loop interactions may contribute to this knowledge in the Discussion section of our manuscript.
Primarily based on our current data, we believe that R-loop structures are bound by HIV-1 integrase proteins and lead to HIV-1 viral genome integration into the vicinity regions of the host genomic R-loops, but we do not claim that R-loops completely replace dsDNA as the target for HIV-1 integration. An R-loop can be multi-kilobase in size and the R-loop peak length widely varies depending on the immunoprecipitation and library construction methods (1, 2), therefore, we could not validate whether the center of triple-stranded R-loops is the extraction site of HIV-1 integration where the strand transfer reaction by integrase occurs. Therefore, we replaced phrases such as, “HIV-1 targets R-loops for integration,” which may overstate our finding on the role of R-loop in HIV-1 integration site selection, with phrases, such as, “HIV-1 favors vicinity regions of R-loop for the viral genome integration,” in the revised manuscript. We apologize for the inconvenience caused by the unclear and non-specific details of our findings. Nevertheless, we believe that we validated R-loop-mediated HIV-1 integration in R-loop-forming regions using our pgR-poor and pgR-rich cell line models. We quantified site-specific integration events in the R-loop regions, and found that a greater number of integration events occurred in designated regions of the pgR-rich cellular genome upon R-loop induction by DOX treatment, but not in pgR-poor cells (Fig. 3E–G of the revised manuscript).
dsDNA may have been the sole target of the intasome demonstrated in vitro possibly because dsDNA has only been considered as a substrate for in vitro intasome assembly. We hope that our work will initiate and advance future investigations on target-bound intasome structures by considering R-loops as potential new targets for integrated proteins and intasomes.
(2.2) As noted above, concerted (two-ended) integration can occur in vitro on a naked dsDNA substrate. However, there is compelling evidence that, in cells, integration preferentially occurs on nucleosomes. Nucleosomes are not found in R loops. In an infected cell, the viral RNA genome of HIV is converted into DNA within the capsid/core which transits the nuclear pore before reverse transcription has been completed. Integration requires the uncoating of the capsid/core, which is linked to the completion of viral DNA synthesis in the nucleus. Two host factors are known to strongly influence integration site selection, CPSF6 and LEDGF. CPSF6 is involved in helping the capsid/core transit the nuclear pore and associate with nuclear speckles. LEDGF is involved in helping the preintegration complex (PIC) find an integration site after it has been released from the capsid/core, most commonly in the bodies of highly expressed genes. In the absence of an interaction of CPSF6 with the core, integration occurs primarily in the lamin-associated domains (LADs). Genes in LADs are usually not expressed or are expressed at low levels. Depending on the cell type, integration in the absence of CPSF6 can be less efficient than normal integration, but that could well be due to a lack of LEDGF (which is associated with expressed genes) in the LADs. In the absence of an interaction of IN with LEDGF (and in cells with low levels of HRP2) integration is less efficient and the obvious preference for integration in highly expressed genes is reduced. Importantly, LEDGF is known to bind histone marks, and will therefore be preferentially associated with nucleosomes, not R-loops. LEDGF fusions, in which the chromatin binding portion of the protein is replaced, can be used to redirect where HIV integrates, and that technique has been used to map the locations of proteins on chromatin. Importantly, LEDGF fusions in which the chromatin binding component of LEDGF is replaced with a module that recognizes specific histone marks direct integration to those marks, confirming integration occurs efficiently on nucleosomes in cells. It is worth noting that it is possible to redirect integration to portions of the host genome that are poorly expressed, which, when taken with the data on integration into LADs (integration in the absence of a CPSF6 interaction) shows that there are circumstances in which there is reasonably efficient integration of HIV DNA in portions of the genome in which there are few if any R-loops.
Although R-loops may not wrap around nucleosomes, long and stable R-loops likely cover stretches of DNA corresponding to multiple nucleosomes (10). For example, R-loops are associated with high levels of histone marks, such as H3K36me3, which LEDGF recognizes (2, 11). R-loops dynamically regulate the chromatin architecture. Possibly by altering nucleosome occupancy, positioning, or turnover, R-loop structures relieve superhelical stress and are often associated with open chromatin marks and active enhancers (2, 10). These features are also distributed over HIV-1 integration sites (12). In the Discussion section of the revised manuscript, we explored the R-loop molding mechanisms in the host genomic environment for HIV-1 integration site selection and its potential collaborative role with LEDGF/p75 and CPSF6 governing HIV-1 integration site selection.
By carefully revising our original manuscript, with respect to the reviewer's comment, we recognized the need to tone down our statements. We found that the title, abstract, and discussion of our original manuscript includes phrases, such as, “HIV-1 targets Rloops for integration,” which may overstate our finding on the role of R-loop in HIV-1 integration site selection. We replaced these phrases. For example, we used phrases, such as “HIV-1 favors vicinity regions of R-loop for the viral genome integration,” in the revised manuscript. We apologize for the inconvenience caused by the unclear and non-specific details of our findings.
(2.3) Given that HIV DNA is known to preferentially integrate into expressed genes and that R-loops must necessarily involve expressed RNA, it is not surprising that there is a correlation between HIV integration and regions of the genome to which R loops have been mapped. However, it is important to remember that correlation does not necessarily imply causation.
We understand the reviewer's concern regarding the possibility of a coincidental correlation between the R-loop regions and HIV-1 integration sites, particularly when the interpretation of this correlation is primarily based on a global analysis.
Therefore, we designed pgR-poor and pgR-rich cell lines, which we believe are suitable models for distinguishing between integration events driven by transcription and the presence of R-loops. Although the two cell lines showed comparable levels of transcription at the designated region upon DOX treatment via TRE promoter activation (Fig. 3B of the revised manuscript), only pgR-rich cells formed R-loops at the designated regions (Fig. 3C of the revised manuscript). When infected with HIV1, pgR-rich cells, but not pgR-poor cells, showed higher infectivity after DOX treatment (Fig. 3D of the revised manuscript). Moreover, we quantified site-specific integration events in the R-loop regions, and found that a greater number of integration events occurred in designated regions of the pgR-rich cellular genome upon R-loop induction by DOX treatment, but not in pgR-poor cells (Fig. 3E of the revised manuscript). Therefore, we concluded that transcriptional activation without an R-loop (in pgR-poor cells) may not be sufficient to drive HIV-1 integration. We believe that our work provides strong evidence for a causative relationship between R-loop formation/Rloop sites and HIV-1 integration. We hope that our explanation addresses your concerns. Thank you.
If we consider some of the problems in the experiments that are described in the manuscript:
(2.4) In an infected individual, cells are almost always infected by a single virion and the infecting virion is not accompanied by large numbers of damaged or defective virions. This is a key consideration: the claim that infection by HIV affects R-loop formation in cells was done with a VSVg vector in experiments in which there appears to have been about 6000 virions per cell. Although most of the virions prepared in vitro are defective in some way, that does not mean that a large fraction of the defective virions cannot fuse with cells. In normal in vivo infections, HIV has evolved in ways that avoid signaling infected the cell of its presence. To cite an example, carrying out reverse transcription in the capsid/core prevents the host cell from detecting (free) viral DNA in the cytoplasm. The fact that the large effect on R-loop formation which the authors report still occurs in infections done in the absence of reverse transcription strengthens the probability that the effects are due to the massive amounts of virions present, and perhaps to the presence of VSVg, which is quite toxic. To have physiological relevance, the infections would need to be carried out with virions that contain HIV even under circumstances in which there is at most one virion per cell.
Our virus production and in vitro and ex vivo HIV-1 infection experimental conditions, designed for infecting cell types, such as HeLa cells and primary CD4+ T cells with VSV-G pseudotyped HIV, were based on a comprehensive review of numerous references. At the very beginning of this study, we tested HIV-1-specific host genomic R-loop induction using empty virion particles (virus-like particles, VLP) or other types of viruses (non-retrovirus, SeV; retroviruses, FMLV and FIV), all produced with a VSV G protein donor. We could not include a control omitting the VSV G protein or using natural HIV-1 envelope protein to prevent viral spread in culture. We observed that despite all types of virus stocks being prepared using VSV-G, only cells infected with HIV-1 viruses showed R-loop signal enrichment (Author response image 3). Therefore, we omitted the control for the VSV G protein in subsequent analyses, such as DRIPcseq. We have also revised our manuscript to provide a clearer description of the experimental conditions. In particular, we now clearly stated that we used VSV-G pseudotyped HIV-1 in this study, throughout the abstract, results, and discussion sections of the revised manuscript. Thank you.
Author response image 3.
(A) Dot blot analysis of the R-loop in gDNA extracts from HIV-1 infected U2OS cells with MOI of 0.6 harvested at 6 hpi. The gDNA extracts were incubated with or without RNase H in vitro before membrane loading (anti-S9.6 signal). (B) Dot blot analysis of the R-loop in gDNA extracts from HeLa cells infected with 0.3 MOI of indicated viruses. The infected cells were harvested at 6 hpi. The gDNA extracts were incubated with or without RNase H in vitro before membrane loading (anti-S9.6 signal).
HIV-1 co-infection may also be expected in cell-free HIV-1 infections. However, it was previously suggested that the average number of infection events varies within 1.02 to 1.65 based on a mathematical model that estimates the frequency of multiple infections with the same virus (Figure 4c of Ito et al., Sci. Rep, 2017; 6559) (13).
(2.5) Using the Sso7d version of HIV IN in the in vitro binding assays raises some questions, but that is not the real question/problem. The real problem is that the important question is not what/how HIV IN protein binds to, but where/how an intasome binds. An intasome is formed from a combination of IN bound to the ends of viral DNA. In the absence of viral DNA ends, IN does not have the same structure/organization as it has in an intasome. Moreover, HIV IN (even Sso7d, which was modified to improve its behavior) is notoriously sticky and hard to work with. If viral DNA had been included in the experiment, intasomes would need to be prepared and purified for a proper binding experiment. To make matters worse, there are multiple forms of multimeric HIV IN and it is not clear how many HIV INs are present in the PICs that actually carry out integration in an infected cell.
As the reviewer has noted, HIV IN, even with Sso7d tagging, is difficult. We attempted the purification of viral DNA (vDNA)-bound PICs using either Sso7d-tagged HIV-1 integrase proteins or non-tagged HIV-1 integrase proteins (F185K/C280S), procured from the NIH HIV reagent program (HRP-20203), following the method described by Passos et al., Science, 2017; 355 (89-92) (3). Despite multiple attempts, we were unable to purify the vDNA-bound IN protein complexes for in vitro assays. However, through multiple biochemical experiments, we believe that we have successfully demonstrated the interaction between cellular R-loops and HIV-1 integrase proteins both in cells and in vitro (Fig. 5A–F of the revised manuscript). We also observed a close association between integrase proteins and host cellular Rloops in HIV-1-infected cells, using a fluorescent recombinant virus (HIV-IN-EGFP) with intact IN-EGFP PICs (Fig. 5G of the revised manuscript).
(2.6) As an extension of comment 2, the proper association of an HIV intasome/PIC with the host genome requires LEDGF and the appropriate nucleic acid targets need to be chromatinized.
The interaction between cellular R-loops and HIV-1 integrase proteins in HeLa cells endogenously expressing LEDGF/p75 was examined using reciprocal immunoprecipitation assays in Fig. 5C–F, S6B, and S6D Fig. of the revised manuscript. In addition, as discussed in more detail in our response to comment [28], we observed a close association between host cellular R-loops and HIV-1 integrase proteins by PLA assay, in HIV-1-infected HeLa cells.
(2.7) Expressing any form of IN, by itself, in cells to look for what IN associates with is not a valid experiment. A major factor that helps to determine both where integration takes place and the sites chosen for integration is the transport of the viral DNA and IN into the nucleus in the capsid core. However, even if we ignore that important part of the problem, the IN that the authors expressed in HeLa cells won't be bound to the viral DNA ends (see comment 2), even if the fusion protein would be able to form an intasome. As such, the IN that is expressed free in cells will not form a proper intasome/PIC and cannot be expected to bind where/how an intasome/PIC would bind.
As discussed in more detail in our response to comment [2-8], we believe that our PLA experiment using the pVpr-IN-EGFP virus, which has previously been examined for virion integrity, as well as the IN-EGFP PICs (14), demonstrated a close association between host cellular R-loops and HIV-1 integrase proteins in HIV-1-infected cells.
(2.8) As in comment 1, for the PLA experiments presented in Figure 5 to work, the number of virions used per cell (which differs from the MOI measured by the number of cells that express a viral marker) must have a high, which is likely to have affected the cells and the results of the experiment. However, there is the additional question of whether the IN-GFP fusion is functional. The fact that the functional intasome is a complex multimer suggests that this could be a problem. There is an additional problem, even if IN-GFP is fully functional. During a normal infection, the capsid core will have delivered copies of IN (and, in the experiments reported here, the IN-GFP fusion) into the nucleus that is not part of the intasome. These "free" copies of IN (here IN-GFP) are not likely to go to the same sites as an intasome, making this experiment problematic (comment 4).
The HIV-IN-EGFP virus stock was produced by polyethylenimine-mediated transfection of HEK293T cells with 6 µg of pVpr-IN-EGFP, 6 µg of HIV-1 NL4-3 noninfectious molecular clone (pD64E; NIH AIDS Reagent Program 10180), and 1 µg of pVSV-G as previously described in (14), and described in the Materials and Methods section of our manuscript. The pVpr-IN-EGFP vector used to produce HIV-1-IN-EGFP virus stock was provided by Anna Cereseto group (Albanese et al., PLOS ONE, 2008; 6(6); Ref 34 of the revised manuscript). It was previously reported that the HIV-1INEGFP virions produced by IN-EGFP trans-incorporation through Vpr are intact and infective viral particles (Figure 1 of Albanese et al., PLOS ONE, 2008; 6(6)). Therefore, we believe that the HIV-IN-EGFP used in our PLA experiments was functional.
Additionally, Albanese et al. showed that the EGFP signal of HIV-IN-EGFP virions colocalizes with the viral protein matrix (p17MA) and capsid (P24CA) as well as with the newly synthesized cDNA produced by reverse transcriptase by labeling and visualizing the synthesized cDNA (14). In addition, the fluorescent recombinant virus (HIV-INEGFP) was structurally intact at the nuclear level (Figure 6 of Albanese et al., PLOS ONE, 2008; 6(6)). Therefore, we believe that our PLA experimental result is not likely misled as the reviewer concerns due to the integrity of the HIV-IN-EGFP virion as well as IN-EGFP PICs.
Furthermore, the in vitro HIV-1 infection setting of our PLA experiments was carefully determined based on multiple studies that performed image-based assays on HIV-1infected cells. For instance, Albanese et al. infected 4 × 10⁴ cells with viral loads equivalent to 1.5 or 3 µg of HIV-1 p24 for their immunofluorescence analysis, in their previous report (14). We titrated the fluorescent HIV-1 virus stocks by examining both the multiplicity of infection (MOI) and quantifying the HIV-1 p24 antigen content (Author response image 4). In our calculation, we infected 5 × 10⁴ HeLa cells with viral loads equivalent to 1.3 ug of HIV-1 p24, which is indicated as 2 MOI in Fig. 5G of our manuscript, for our PLA experiments.
Image-Based Assays often require increased and enhanced signal for statistical robustness. For example, Achuthan et al. infected cells with VSV-G-pseudotyped HIV1 at the approximate MOI of 350 for vDNA and PIC visualization (15). Therefore, we believe our experimental condition for PLA experiments, which we carefully designed based on previous study that are frequently referred, are reasonable. We really hope that our discussion sufficiently addressed the reviewer’s concern.
Author response image 4.
Gating strategy used to determine HIV-1-infectivity in HeLa cells at 48 hpi. Cells were infected with a known p24 antigen content in the stock of the VSV-G-pseudotyped HIV-1-EGFP-virus. The percentages of GFP-positive cell population are indicated.
(2.9) In the Introduction, the authors state that the site of integration affects the probability that the resulting provirus will be expressed. Although this idea is widely believed in the field, the actual data supporting it are, at best, weak. See, for example, the data from the Bushman lab showing that the distribution of integration sites is the same in cells in which the integrated proviruses are, and are not, expressed. However, given what the authors claim in the introduction, they should be more careful in interpreting enzyme expression levels (luciferase) as a measure of integration efficiency in experiments in which they claim proviruses are integrated in different places.
We thank the reviewer for the constructive comment. We have changed the statement in Lines 41–42 in the Introduction section of our original manuscript to “The chromosomal landscape of HIV-1 integration influences proviral gene expression, persistence of integrated proviruses, and prognosis of antiretroviral therapy.” (Lines 39-41 of the revised manuscript). We believe that this change can tone-down the relevance between the site of integration and the provirus expression level.
The piggyBac transposase randomly insert the “cargo (transposon)” into TTAA chromosomal sites of the target genome, generating efficient insertions at different genomic loci (16, 17). We believe that this random insertion of the pgR-poor/rich vector mediated by the piggyBac system allows us not to mislead the R-loop-mediated HIV1 integration site because of the genome locus bias of the vector insertion. Therefore, Figure 3 in our manuscript does not claim any relevance between the site of integration and the resulting provirus expression levels. Instead, as noted in Line 214 of the revised manuscript, using the luciferase reporter HIV-1 virus, we attempted to examine HIV-1 infection in cells with an "extra number of R-loops” in the host cellular genome. We observed that pgR-rich cells showed higher luciferase activity upon DOX treatment than pgR-poor cells (Fig. 3D of the revised manuscript). We believe that this is because a greater number of HIV-1 integration events may occur in pgR-rich cells, where DOX-inducible de novo R-loop regions are introduced. This has been further examined in Fig. 3E–G of the revised manuscript. We hope this explanation clarifies the Figure 3. Thank you.
(2.10) Using restriction enzymes to create an integration site library introduces biases that derive from the uneven distribution of the recognition sites for the restriction enzymes.
As described in the Materials and Methods section, we adopted a sequencing library construction method using a previously established protocol (18, 19). Although we recognize the advantages of DNA fragmentation by sonication, in in vitro or ex vivo HIV-1 infection settings, where the multiplicity of infection is carefully determined based on multiple references, more copies of integrated viral sequences are expected compared to that in samples from infected patients (18). Therefore, in these settings, restriction enzyme-based DNA fragmentation and ligation-mediated PCR sequencing are well-established methods that provide significant data sources for HIV-1 integration site sequencing (15, 20-22). Furthermore, our data showing the proportion of integration sites over R-loop regions (Fig. 4B of the revised manuscript) are presented alongside the respective random controls (i.e., proportion of integration sites within the 30-kb windows centered on randomized DRIPc-seq peaks, gray dotted lines; control comparisons between randomized integration sites with DRIPc-seq peaks, black dotted lines; and randomized integration sites with randomized DRIPcseq peaks, gray solid lines), which do not show such a correlation between the HIV-1 integration sites and nearby areas of the R-loop regions. Therefore, we believe that our results from the integration site sequencing data analysis are unlikely to be biased.
Reviewer #3 (Public Review):
In this manuscript, Park and colleagues describe a series of experiments that investigate the role of R-loops in HIV-1 genome integration. The authors show that during HIV-1 infection, R-loops levels on the host genome accumulate. Using a synthetic R-loop prone gene construct, they show that HIV-1 integration sites target sites with high R-loop levels. They further show that integration sites on the endogenous host genome are correlated with sites prone to R-loops. Using biochemical approaches, as well as in vivo co-IP and proximity ligation experiments, the authors show that HIV-1 integrase physically interacts with R-loop structures.
My primary concern with the paper is with the interpretations the authors make about their genome-wide analyses. I think that including some additional analyses of the genome-wide data, as well as some textual changes can help make these interpretations more congruent with what the data demonstrate. Here are a few specific comments and questions:
We are grateful for the time and effort we spent on our behalf and the reviewer’s appreciation for the novelty of our work, in particular, R-loop induction by HIV-1 infection and the correlation between host R-loops and the genomic site of HIV-1 integration. In the following sections, we provide our responses to your comments and suggestions. Your comments are in italics. We have carefully addressed the following issues.
(3.1) I think Figure 1 makes a good case for the conclusion that R-loops are more easily detected HIV-1 infected cells by multiple approaches (all using the S9.6 antibody). The authors show that their signals are RNase H sensitive, which is a critical control. For the DRIPc-Seq, I think including an analysis of biological replicates would greatly strengthen the manuscript. The authors state in the methods that the DRIPc pulldown experiments were done in biological replicates for each condition. Are the increases in DRIPc peaks similar across biological replicates? Are genomic locations of HIV-1-dependent peaks similar across biological replicates? Measuring and reporting the biological variation between replicate experiments is crucial for making conclusions about increases in R-loop peak frequency. This is partially alleviated by the locus-specific data in Figure S3A. However, a better understanding of how the genome-wide data varies across biological replicates will greatly enhance the quality of Figure 1.
DRIPc-seq experiments were conducted with two biological replicates. To define consensus DRIPc-seq peaks using these two replicates, we used two methods applicable to ChIP-seq analysis: the irreproducible discovery rate (IDR) method and sequencing data pooling. We found that the sequencing data pooling method yielded significantly more DRIPc-seq peaks than consensus peak identification through IDR, and we decided to utilize R-loop peaks from pooled sequencing data for our downstream analyses, as described in the figure legends and Materials and Methods of the revised manuscript.
As noted by the reviewer, it is important to verify whether the increasing trend in the number of R-loop peaks and genomic locations of HIV-1 dependent R-loops were consistently observed across the two biological replicates. Therefore, we independently performed R-loop calling on each replicate of the sequencing data of primary CD4+ T cells from two individual donors to verify that the increase in R-loop numbers was consistent (Author response image 5). Additionally, the overlap of the R-loop peaks between the two replicates was statistically significant across the genome (Author response table 1). Thank you.
Author response image 5.
Bar graph indicating DRIPc-seq peak counts for HIV-1-infected primary CD4+ T cells harvested at the indicated hours post infection (hpi). Pre-immunoprecipitated samples were untreated (−) or treated (+) with RNase H, as indicated. Each dot corresponds to an individual data set from two biologically independent experiments.
Author response table 1.
DRIPc-seq peak length and Chi-square p-value in CD4+ T cells from individual donor 1 and 2
(3.2) I think that the conclusion that R-loops "accumulate" in infected cells is acceptable, given the data presented. However, in line 134 the authors state that "HIV1 infection induced host genomic R-loop formation". I suggest being very specific about the observation. Accumulation can happen by (a) inducing a higher frequency of the occurrence of individual R-loops and/or (b) stabilizing existing R-loops. I'm not convinced the authors present enough evidence to claim one over the other. It is altogether possible that HIV-1 infection stabilizes R-loops such that they are more persistent (perhaps by interactions with integrase?), and therefore more easily detected. I think rephrasing the conclusions to include this possibility would alleviate my concerns.
We thank the reviewer for the considerable discussion on our manuscript. We have now changed Line 134 to, “HIV-1 infection induces host genomic R-loop enrichment” (Lines 132-133 of the revised manuscript), and added a new conclusion sentence implicating the possible explanation for the R-loop signal enrichment upon HIV-1 infection (Lines 133–135 of the revised manuscript), according to the reviewer's suggestion.
(3.3) A technical problem with using the S9.6 antibody for the detection of R-loops via microscopy is that it cross-reacts with double-stranded RNA. This has been addressed by the work of Chedin and colleagues (as well as others). It is absolutely essential to treat these samples with an RNA:RNA hybrid-specific RNase, which the authors did not include, as far as their methods section states. Therefore, it is difficult to interpret all of the immunofluorescence experiments that depend on S9.6 binding.
We understand the reviewer's concern regarding the cross-reactivity of the S9.6 antibody with more abundant dsRNA, particularly in imaging applications. We carefully designed the experimental and analytical methods for R-loop detection using microscopy. For example, we pre-extracted the cytoplasmic fraction before staining with the S9.6 antibody and quantified the R-loop signal by subtracting the nucleolar signal. Both of these steps were taken to eliminate the possibility of misdetecting Rloops via microscopy because of the prominent cytoplasmic and nucleolar S9.6 signals, which primarily originate from ribosomal RNA. In addition, we included R-loop negative control samples in our microscopy analysis that were subjected to intensive RNase H treatment (60U/mL RNase H for 36 h) and observed a significant reduction in the S9.6 signal (Figure 1E of the revised manuscript). RNase H-treated samples served as essential and widely accepted negative controls for R-loop detection.
We would like to point out that recent studies have reported strong intrinsic specificity of S9.6 anybody for DNA:RNA hybrid duplex over dsDNA and dsRNA, along with the structural elucidations of S9.6 antibody recognition of hybrids (23, 24). Therefore, our interpretation of host cellular R-loop enrichment after HIV-1 infection using S9.6 antibodies in multiple biochemical approaches is well supported. Nevertheless, we agree with the reviewer's opinion that additional negative controls for the detection of R-loops via microscopy, such as RNase T1-and RNase III-treated samples, could improve the robustness and accuracy of R-loop imaging data (25).
(3.4) Given that there is no clear correlation between expression levels and R-loop peak detection, combined with the data that show increased detection of R-loop frequency in non-genic regions, I think it will be important to show that the R-loop forming regions are indeed transcribed above background levels. This will help alleviate possible concerns that there are technical errors in R-loop peak detection.
Figures S5D and S5E in the revised manuscript show the relative gene expression levels of the R-loop-forming positive regions (P1-3) and the referenced Rloop-positive loci (RPL13A and CALM3). The gene expression levels of these R-loopforming regions were significantly higher than those of the ECFP or mAIRN genes without DOX treatment, which can be considered background levels of transcription in cells. Thank you.
(3.5) In Figures 4C and D the hashed lines are not defined. It is also interesting that the integration sites do not line up with R-loop peaks. This does not necessarily directly refute the conclusions (especially given the scale of the genomic region displayed), but should be addressed in the manuscript. Additionally, it would greatly improve Figure 4 to have some idea about the biological variation across replicates of the data presented 4A.
We thank the reviewer for the considerable comment on our study. First of all, we added an annotation for the dashed lines in the figure legends of Figures 4C and 4D in the revised manuscript.
We agree with the reviewer's interpretation of the relationship between the integration sites and R-loop peaks. Primarily based on our current data, we believe R-loop structures are bound by HIV-1 integrase proteins and lead HIV-1 viral genome integration into the “vicinity” regions of the host genomic R-loops. We displayed a large-scale genomic region (30-kb windows) to present integration sites surrounding R-loop centers because an R-loop can be multi-kilobase in size (1, 2). Depending on the immunoprecipitation and library construction methods, the R-loop peaks varied in size, and the peak length showed a wide distribution (Figure 3B of Malig et al., 2020, Figure 1B of Sanz et al., 2016, and Figure 2A of the revised manuscript). Therefore, presenting integration site events within a wide window of R-loop peaks could be more informative and better reflect the current understanding of R-loop biology.
R-loop formation recruits diverse chromatin-binding protein factors, such as H3K4me1, p300, CTCF, RAD21, and ZNF143 (Figure 6A and 6B of Sanz et al., 2016) (26), which allow R-loops to exhibit enhancer and insulator chromatin states, which can act as distal regulatory elements (26, 27). We have demonstrated physical interactions between host cellular R-loops and HIV-1 integrase proteins (Figure 5 of the revised manuscript), therefore, we believe that this ‘distal regulatory element-like feature’ of the R-loop can be a potential explanation for how R-loops drive integration over longrange genomic regions.
According to your suggestion, we added this explanation to the relevant literature in the Discussion section of the revised manuscript.
Author response image 6 which represents the biological variation across replicates of the data shown in Figure 4A. The integration site sequencing data for Jurkat cells were adopted from SRR12322252 (4), which consists of the integration site sequencing data of HIV-1-infected wild type Jurkat cells with one biological replicate. We hope that our explanations and discussion have successfully addressed your concerns. Thank you.
Author response image 6.
Bar graphs showing the quantified number of HIV-1 integration sites per Mb pair in total regions of 30-kb windows centered on DRIPc-seq peaks from HIV-1 infected HeLa cells and primary CD4+ T cells (magenta) or non-R-loop region in the cellular genome (gray). Each dot corresponds to an individual data set from two biologically independent experiments.
(3.6) The authors do not adequately describe the Integrase mutant that they use in their biochemical experiments in Figure 5A. Could this impact the activity of the protein in such a way that interferes with the interpretation of the experiment? The mutant is not used in subsequent experiments for Figure 5 and so even though the data are consistent with each other (and the conclusion that Integrase interacts with R-loops) a more thorough explanation of why that mutant was used and how it impacts the biochemical activity of the protein will help the interpretation of the data presented in Figure 5.
We appreciate the reviewer’s suggestions. In our EMSA analysis, we purified and used Sso7d-tagged HIV-1 integrase proteins with an active-site amino acid substitution, E152Q. First, we used the Sso7d-tagged HIV-1 integrase protein, as it has been suggested in previous studies that the fusion of small domains, such as Sso7d (DNA binding domain) can significantly improve the solubility of HIV integrase proteins without affecting their ability to assemble with substrate nucleic acids and their enzymatic activity (Figure 1B of Li et al., PLOS ONE, 2014;9 (8) (28, 29). We used an integrase protein with an active site amino acid substitution, E152Q, in our mobility shift assay, because the primary goal of this experiment was to examine the ability of the protein to bind or form a complex with different nucleic acid substrates. We thought that abolishing the enzymatic activity of the integrase protein, such as 3'-processing that cleaves DNA substrates, would be more appropriate for our experimental objective. This Sso7d tagged- HIV-1 integrase with the E152Q mutation has also been used to elucidate the structural model of the integrase complex with a nucleic acid substrate by cryo-EM (3) and has been shown to not disturb substrate binding. Based on the reviewer’s comments, we have added a description of the E152Q mutant integrase protein in Lines 268–270 of the revised manuscript. Thank you.
Reviewer #3 (Recommendations For The Authors):
The paper suffers from many grammatical errors, which sometimes interfere with the interpretations of the experiments. In the view of this reviewer, the manuscript must be carefully revised prior to publication. For example, lines 247-248 "Intasomes consist of HIV-1 viral cDNA and HIV-1 coding protein, integrases." It is unclear from this sentence whether there are multiple integrases or multiple proteins that interact with the viral genome to facilitate integration. This makes the subsequent experiments in Figure 5 difficult to interpret. There are many other examples, too numerous to point out individually.
We thoughtfully revised the original manuscript, making the best efforts to provide clearer details of our findings. We believe that we have made substantial changes to the manuscript, including Lines 247–248 of the original manuscript that the reviewer noted. Furthermore, the revised manuscript was edited by a professional editing service. Thank you. (1) M. Malig, S. R. Hartono, J. M. Giafaglione, L. A. Sanz, F. Chedin, Ultra-deep Coverage Singlemolecule R-loop Footprinting Reveals Principles of R-loop Formation. J Mol Biol 432, 22712288 (2020).
(2) L. A. Sanz et al., Prevalent, Dynamic, and Conserved R-Loop Structures Associate with Specific Epigenomic Signatures in Mammals. Mol Cell 63, 167-178 (2016).
(3) D. O. Passos et al., Cryo-EM structures and atomic model of the HIV-1 strand transfer complex intasome. Science 355, 89-92 (2017).
(4) W. Li et al., CPSF6-Dependent Targeting of Speckle-Associated Domains Distinguishes Primate from Nonprimate Lentiviral Integration. mBio 11, (2020).
(5) P. A. Ginno, Y. W. Lim, P. L. Lott, I. Korf, F. Chedin, GC skew at the 5' and 3' ends of human genes links R-loop formation to epigenetic regulation and transcription termination. Genome Res 23, 1590-1600 (2013).
(6) S. Hamperl, M. J. Bocek, J. C. Saldivar, T. Swigut, K. A. Cimprich, Transcription-Replication Conflict Orientation Modulates R-Loop Levels and Activates Distinct DNA Damage Responses. Cell 170, 774-786 e719 (2017).
(7) H. O. Ajoge et al., G-Quadruplex DNA and Other Non-Canonical B-Form DNA Motifs Influence Productive and Latent HIV-1 Integration and Reactivation Potential. Viruses 14, (2022).
(8) I. K. Jozwik et al., B-to-A transition in target DNA during retroviral integration. Nucleic Acids Res 50, 8898-8918 (2022).
(9) F. Chedin, C. J. Benham, Emerging roles for R-loop structures in the management of topological stress. J Biol Chem 295, 4684-4695 (2020).
(10) F. Chedin, Nascent Connections: R-Loops and Chromatin Patterning. Trends Genet 32, 828838 (2016).
(11) P. B. Chen, H. V. Chen, D. Acharya, O. J. Rando, T. G. Fazzio, R loops regulate promoterproximal chromatin architecture and cellular differentiation. Nat Struct Mol Biol 22, 9991007 (2015).
(12) A. R. Schroder et al., HIV-1 integration in the human genome favors active genes and local hotspots. Cell 110, 521-529 (2002).
(13) Y. Ito et al., Number of infection events per cell during HIV-1 cell-free infection. Sci Rep 7, 6559 (2017).
(14) A. Albanese, D. Arosio, M. Terreni, A. Cereseto, HIV-1 pre-integration complexes selectively target decondensed chromatin in the nuclear periphery. PLoS One 3, e2413 (2008).
(15) V. Achuthan et al., Capsid-CPSF6 Interaction Licenses Nuclear HIV-1 Trafficking to Sites of Viral DNA Integration. Cell Host Microbe 24, 392-404 e398 (2018).
(16) X. Li et al., piggyBac transposase tools for genome engineering. Proc Natl Acad Sci U S A 110, E2279-2287 (2013).
(17) Y. Cao et al., Identification of piggyBac-mediated insertions in Plasmodium berghei by next generation sequencing. Malar J 12, 287 (2013).
(18) E. Serrao, P. Cherepanov, A. N. Engelman, Amplification, Next-generation Sequencing, and Genomic DNA Mapping of Retroviral Integration Sites. J Vis Exp, (2016).
(19) K. A. Matreyek et al., Host and viral determinants for MxB restriction of HIV-1 infection. Retrovirology 11, 90 (2014).
(20) G. A. Sowd et al., A critical role for alternative polyadenylation factor CPSF6 in targeting HIV-1 integration to transcriptionally active chromatin. Proc Natl Acad Sci U S A 113, E10541063 (2016).
(21) B. Lucic et al., Spatially clustered loci with multiple enhancers are frequent targets of HIV-1 integration. Nat Commun 10, 4059 (2019).
(22) P. K. Singh, G. J. Bedwell, A. N. Engelman, Spatial and Genomic Correlates of HIV-1 Integration Site Targeting. Cells 11, (2022).
(23) C. Bou-Nader, A. Bothra, D. N. Garboczi, S. H. Leppla, J. Zhang, Structural basis of R-loop recognition by the S9.6 monoclonal antibody. Nat Commun 13, 1641 (2022).
(24) Q. Li et al., Cryo-EM structure of R-loop monoclonal antibody S9.6 in recognizing RNA:DNA hybrids. J Genet Genomics 49, 677-680 (2022).
(25) J. A. Smolka, L. A. Sanz, S. R. Hartono, F. Chedin, Recognition of RNA by the S9.6 antibody creates pervasive artifacts when imaging RNA:DNA hybrids. J Cell Biol 220, (2021).
(26) L. A. Sanz, F. Chedin, High-resolution, strand-specific R-loop mapping via S9.6-based DNARNA immunoprecipitation and high-throughput sequencing. Nat Protoc 14, 1734-1755 (2019).
(27) M. Merkenschlager, D. T. Odom, CTCF and cohesin: linking gene regulatory elements with their targets. Cell 152, 1285-1297 (2013).
(28) M. Li, K. A. Jurado, S. Lin, A. Engelman, R. Craigie, Engineered hyperactive integrase for concerted HIV-1 DNA integration. PLoS One 9, e105078 (2014).
(29) M. Li et al., A Peptide Derived from Lens Epithelium-Derived Growth Factor Stimulates HIV1 DNA Integration and Facilitates Intasome Structural Studies. J Mol Biol 432, 2055-2066 (2020).
-
eLife Assessment
This study presents two main findings regarding HIV-1 genomic integration. The first, based on convincing evidence in primary cell models, is that HIV-1 induces R loop formation, though the viral driver of this process remains undefined. The second, based on model cell systems with limited physiological relevance to HIV-1, is that a portion of HIV-1 genomes integrates in the vicinity of where R loops form. This finding has the potential to offer fundamental insight into HIV-1 integration, but the strength of the presented evidence was viewed as incomplete and needing additional validation by more direct experimental methods in order to understand what the mechanistic relationship between the formation of R loops and HIV-1 integration is.
-
Reviewer #1 (Public review):
(1) Significance of findings and strength of evidence.<br /> (a) The work presented in this manuscript is intended to support the authors' novel idea that HIV DNA integration strongly favors "triple-stranded" R-loops in DNA formed either during transcription of many, but not all, genes or by strand invasion of silent DNA by transcripts made elsewhere, and that HIV infection promotes R-loop formation mediated by incoming virions in the absence of reverse transcription. The authors were able to demonstrate a reverse transcription-independent increase in R-loop formation early during HIV infection, while also demonstrating increased integration into sequences that contain R-loop structures. Furthermore, this manuscript also identifies that R-loops are present in both transcriptional active and silent regions of the genome and that HIV integrase interacts with R-loops. Although the work presented supports a correlation between R-loop formation and HIV DNA integration, it does not prove the authors' hypothesis that R-loops are directly targeted for integration. Direct experimentation, such as in vitro integration into defined DNA targets, will be required. Further, the authors provide no explanation as to how current sophisticated structural models of concerted retroviral DNA integration into both strands of double-stranded DNA targets can accommodate triple-stranded structures. Finally, there are serious technical concerns with interpretation of the integration site analyses.<br /> This resubmitted manuscript has corrected some of the issues raised by the previous reviews - particularly the quality of the English - but otherwise the text and figures remain very much the same and concerns regarding the conclusions drawn regarding integration site specificity remain. The manuscript also still suffers from a lack of description of experimental detail necessary to understand the results as presented. In many cases, explanations given privately in the rebuttal o the earlier reviews need to be made available to all readers, not just the reviewers.
(2) Public review with guidance for readers around how to interpret the work, highlighting important findings but also mentioning caveats.<br /> (a) Introduction: The authors provide an excellent introduction to R-loops but they base the rationale for this study on mis-citation of earlier studies regarding integration in transcriptionally silent regions of the genome. The "most favored locus" cited in the very old reference 6 comprises only 5 events and has not been reproduced in more recent, much larger datasets For example, see the study of over 300.000 sites in ref 14. The laundry list of IN interactors in lines 43-44 is based on old experiments. It is now quite clear that the only direct interaction of importance is with LEDGF and that should be discussed here. Also discussed should be the role of the capsid in the nuclear entry and targeting. For example, one of the references cited, as well as a mention in the discussion (Line 326) concerns CPSF-6, which is now known to modulate nuclear entry and specificity by interacting with capsid, not integrase. The statement on lines 46-47 regarding that some highly expressed genes are, nonetheless, poor targets for integration is correct, but the experiment cited was done in PBMC with wild-type HIV-1and it is possible that those genes were expressed in non-target cells like B-cells or monocytes.
(b) Figure 1: Demonstrates models for HIV infections in both cell lines and primary human CD4+ T cells. R-loop formation was determined through a method called DRIPc-seq which utilizes an anti-body specific for DNA-RNA hybrid structures and sequences these regions of the genome using RNaseH treatment to show that when RNA-DNA hybrids are absent then no R-loops are detected. In these models of in vitro and ex vivo infection, the authors show that R-Loop formation increases following HIV infection between 6 hr. post-infection and 12 hrs. post-infection, depending on the cell model. However, these figures lack a mock infected control for each cell model to assess R-loop formation at the same time points. They would also benefit from a control showing that virus entry is necessary, such as omitting the VSV G protein donor.
(c) Figure 2: This figure shows that cells infected with HIV show more R-loops as well as longer sequences containing R-loop structures. Panel B shows that these R-loops were distributed throughout different genomic features, such as both genic and intergenic regions of the genome. However, the data are presented in such a way that it is impossible to determine the proportion of R-loops in each type of genomic feature. The reader has no way to tell, for example, the proportion of R-loops in genic vs intergenic DNA and how this value changes with time. Furthermore, increased R-loop formation due to HIV infection showed poor correlation with gene expression, suggesting that R-loops were not forming due to transcriptional activation, although the difference between 0 and the remaining timepoints is not apparent, nor is the meaning of the absurd p values.
The experiments presented in Figures 1 and 2 show that treatment of cells with VSV G-pseudotyped HIV-1 leads to a significant increase in R loops in all parts of the genome. Accumulation of R-loops at so soon after infection, as well as its resistance to RT and Integration inhibitors, rules out the involvement of newly synthesized viral DNA or any newly made viral protein (Figure S3). Rather, some component(s) of the virion, possibly protease, or an accessory gene product such as Vpr or Vif, must be directly responsible e (although the authors neglect to draw this conclusion in the description of these experiments, lines 125-135, leaving it hanging until the Discussion).
On the whole, and as a non-expert in this area, I find the overall conclusions of this part of the study convincing, but, as pointed out in one of the earlier reviews, the virologic significance of early effects seen at high multiplicity of infection (likely hundreds of particles per cell) needs to be taken with a grain of salt. At a minimum, this point should be discussed. Also, the study would have been greatly strengthened by a simple experiment to identify the virion protein responsible for the effect.<br /> Based on the results in the first two figures, the authors hypothesize that R-Loop induction early in infection plays an important role in HIV replication, specifically by interacting with the intasome and thus directing integration to regions of the host genome favorable for expression of the provirus. Experiments to test this idea and probe the mechanism are described in the remaining 3 figures, which, despite comments in the previous reviews, are unchanged from the previous version and still suffer from serious defects in experimental design and interpretation.
(d) Figure 3: This figure shows the use of cell lines carrying R-loop inducible (mAIRN) or non-inducible (ECFP) genes to model association of HIV integration with R-loop structures. The authors demonstrate the functional validation of R-loop induction in the cell line model. Additionally, when R-loops are induced there is a significant increase in HIV integration in the R-loop forming vector sequence when R-loops are induced with doxycycline. This result shows a correlation between expression and integration that is much stronger in the R-loop forming gene than in the unreferenced ECFP gene but does not prove that integration directly targets R-loops. It is possible, for example, that some feature of the DNA sequence, such as base composition affects both integration and R-loop formation independently. As described more fully below, there is also a serious concern regarding the method used to quantitate the integration frequencies. As before, There are a number of problems here.<br /> (1) The authors use a classic, but suboptimal integration site assay comprising restriction enzyme digestion followed by PCR to assess integration site distribution, and (despite statements to the contrary in the rebuttal) read counts to quantitate relative frequencies of target site use. See the legend and axis labels in Fig 3E, F, and G. This approach leads to serious bias in the ability to detect and count the use of integration sites that are either too close or too far from the sites of cleavage and can lead to artefactual misrepresentation of their chromosomal distribution.<br /> (2) The result shown in Figure 3D is uninterpretable. It is simply not possible that the 3-fold increase in luciferase activity is due addition of 25 10-kb sequences leading to A 3-fold increase in integration frequency into the target sequence, particularly when panel E shows that the measured frequency is on the order of 20 reads per million. Something else must be going on here.<br /> (3) Panels 3F and G show the read count distribution in the introduced target sequences plotted in a completely nonstandard way and is explained so poorly that I could not be sure what the authors were trying to show. The numbers on the bottom of the 2 plots appear to represent the only sites of integration seen in the 10-kb region studied. If so, this is not the expected result for the authors claim of greatly increasing regional integration. As can easily be seen in the figures of ref 14, high frequency gene targets are characterized by large numbers of sites, not by more frequent targeting of small numbers of sites as implied by the figures.
(e) Figure 4: This figure shows evidence of increased HIV integration within regions of the genome containing R-loops with additional preference with integration within the R-loop and decrease in frequency of integration further from the R-loop. Identifying a preference for R-loops is very intriguing but the authors do also demonstrate that integration does occur when R-loops are not present. Also Panel A, which shows that regions of cell DNA that form R-loops have a higher frequency of Integration sites than those that do not, should also be controlled for the level of gene expression of the two types of region. the result shown cannot be interpreted to mean that R-loops have anything to do with integration targeting. It is already well-established that about 80% of HIV integration sites are in expressed genes, which comprise about 20% of the genome. Since a gene must be expressed to contain an R-loop, the non-R-loop fraction will contain the 80% of the genome that is a 20-fold poorer target, giving the result shown, whether R-loops are involved or not. The rather weak correlation between R-Loop locations and integration site distribution in Fig 4C and D hardly seems consistent with the curves seen in 4B. Can the authors refute the hypothesis that the apparent correlation is simply because both integration and R-Loop formation frequency must correlate with level of gene expression and therefore their correlation with one another cannot be used to infer causality/ As pointed out in prior reviews, R-loops themselves cannot be targets for integration. In their rebuttal, the authors agree and have made slight modifications to their conclusion in the text, now concluding that Integration favors the vicinity of an R-loop. Why then do the peaks in correlation curves in Fig 4B center exactly on the center of the R-loops? It seems that this result would be more consistent with integration and R-loop formation favoring the same sites, but for different reasons (base composition for example).
(f) Figure 5: In this figure the authors demonstrate that HIV integrase binds to R-loops through a number of protein assays, but does not show that this binding is associated with enzymatic activity. EMSA of integrase identified increased binding to DNA-RNA over dsDNA. Additionally, precipitation of RNA-DNA hybrids pulled down HIV integrase. A proximity ligation assay detecting R-loops and HIV-integrase showed co-localization within the nucleus of HeLa cells. HeLa cells were probably used due to their efficiency of transduction but are not physiologically relevant cell types. Figure 5 suffers greatly in interpretability from the failure of the authors to use assembled intasomes, since the DNA binding properties are likely to be quite different. The authors excuse that they were unable to prepare intasomes (which needs to be included in the text, not just in the rebuttal) explains but does not justify the use of monomeric IN protein. Figure 5A shows that the IN binding is NOT specific to R-loops, since any single-stranded DNA binds equally. The authors should make this point in the text.<br /> The experiment using integrase overexpression in cells brings up some déjà vu to a retrovirologist. There is some history in retrovirology of experiments like this having been used to draw conclusions (like the role of integrase in nuclear import) that have since proven to be wrong. Also, Fig 5G is not interpretable quantitively, since the distribution of neither IN nor R-loops is probed, and we have no idea what proportion of each is in the PLA spots. Overall, this section would be much more convincing if it also included some direct experimentation, such as in vitro integration using intasomes, or infection of cells with viral mutants (or in the presence of inhibitors) affecting the function of whatever virion protein found to be important for R-loop formation.
(g) Discussion: In the discussion, the authors address how their work relates to previous evidence of HIV integration by association of LEDGF/p75 and CPSF6. They also cite that LEDGF/p75 has possible R-loop binding capabilities. They also discuss what possible mechanisms are driving increases in R-loop formation during HIV infection, pointing to possible HIV accessory proteins. They also state that how HIV integrates in transcriptionally silent regions is still unknown but do point out that they were able to show R-loops appear in many different regions of the genome but did not show that R-loops in transcriptional inactive regions are integration targets. More seriously, they failed to make a connection between their work and current understanding of the biochemical and structural mechanism of the integration reaction.
-
Reviewer #3 (Public review):
In this manuscript, Park and colleagues describe a series of experiments that investigate the role of R-loops in HIV-1 genome integration. The authors show that during HIV-1 infection, R-loops levels on the host genome accumulate. Using a synthetic R-loop prone gene construct, they show that HIV-1 integration sites target sites with high R-loop levels. They further show that integration sites on the endogenous host genome are correlated with sites prone to R-loops. Using biochemical approaches, as well as in vivo co-IP and proximity ligation experiments, the authors show that HIV-1 integrase physically interacts with R-loop structures.
The major strengths of this work is that the investigators use multiple independent experimental systems and multiple cell types to support their conclusions, including in vivo and biochemical experiments. Furthermore, their use of genome-wide analyses help to support their conclusion that HIV targets genomic regions enriched with R-loops versus those lacking such enrichment.
This work may have a significant impact on the field of HIV genomic integration by elucidating why transcription levels are not the sole determinant of HIV integration sites.
-
-
www.biorxiv.org www.biorxiv.org
-
eLife Assessment
This important study aimed to identify how chronic heat exposure affects subsequent behavior and brain function. This work positively expands the field of thermoregulation. The data were collected using a myriad of next-generation approaches, including extensive behavior testing, thermal monitoring, electrophysiology, circuit mapping, and manipulations. As a result the strength of evidence is mostly solid, however a few weaknesses drove the some of the conclusions to be incompletely supported. These largely circle around the question of how unique these effects are to thermal stress (as opposed to other forms of stress), a lack of statistical analyses and rigor in some of the experiments and figures, and the specificity of the POA-pPVT pathway compared to other inputs to the PVT in the control of observed effects.
-
Reviewer #1 (Public review):
Summary:
The manuscript by Cao et al. examines an important but understudied question of how chronic exposure to heat drives changes in affective and social behaviors. It has long been known that temperature can be a potent driver of behaviors and can lead to anxiety and aggression. However, the neural circuitry that mediates these changes is not known. Cao et al. take on this question by integrating optical tools of systems neuroscience to record and manipulate bulk activity in neural circuits, in combination with a creative battery of behavior assays. They demonstrate that chronic daily exposure to heat leads to changes in anxiety, locomotion, social approach, and aggression. They identify a circuit from the preoptic area (POA) to the posterior paraventricular thalamus (pPVT) in mediating these behavior changes. The POA-PVT circuit increases activity during heat exposure. Further, manipulation of this circuit can drive affective and social behavioral phenotypes even in the absence of heat exposure. Moreover, silencing this circuit during heat exposure prevents the development of negative phenotypes. Overall the manuscript makes an important contribution to the understudied area of how ambient temperature shapes motivated behaviors.
Strengths
The use of state-of-the-art systems neuroscience tools (in vivo optogenetics and fiber photometry, slice electrophysiology), chronic temperature-controlled experiments, and a rigorous battery of behavioral assays to determine affective phenotypes. The optogenetic gain of function of affective phenotypes in the absence of heat, and loss of function in the presence of heat are very convincing manipulation data. Overall a significant contribution to the circuit-level instantiation of temperature-induced changes in motivated behavior, and creative experiments.
Weaknesses
(1) There is no quantification of cFos/rabies overlap shown in Figure 2, and no report of whether the POA-PVT circuit has a higher percentage of Fos+ cells than the general POA population. Similarly, there is no quantification of cFos in POA recipient PVT cells for Figure 2 Supplement 2.
(2) The authors do not address whether stimulation of POA-PVT also increases core body temperature in Figure 3 or its relevant supplements. This seems like an important phenotype to make note of and could be addressed with a thermal camera or telemetry.
(3) In Figure 3G: is Day 1 vs Day 22 "pre-heat" significant? The statistics are not shown, but this would be the most conclusive comparison to show that POA-PVT cells develop persistent activity after chronic heat exposure, which is one of the main claims the authors make in the text. This analysis is necessary in order to make the claim of persistent circuit activity after chronic heat exposure.
(4) In Figure 4, the control virus (AAV1-EYFP) is a different serotype and reporter than the ChR2 virus (AAV9-ChR2-mCherry). This discrepancy could lead to somewhat different baseline behaviors.
(5) In Figure 5G, N for the photometry data: the authors assess the maximum z-score as a measure of the strength of calcium response, however the area under the curve (AUC) is a more robust and useful readout than the maximum z score for this. Maximum z-score can simply identify brief peaks in amplitude, but the overall area under the curve seems quite similar, especially for Figure 5N.
(6) For Fig 5V: the authors run the statistics on behavior bouts pooled from many animals, but it is better to do this analysis as an animal average, not by compiling bouts. Compiling bouts over-inflates the power and can yield significant p values that would not exist if the analysis were carried out with each animal as an n of 1.
(7) In general this is an excellent analysis of circuit function but leaves out the question of whether there may be other inputs to pPVT that also mediate the same behavioral effect. Future experiments that use activity-dependent Fos-TRAP labeling in combination with rabies can identify other inputs to heat-sensitive pPVT cells, which may have convergent or divergent functions compared to the POA inputs.
-
Reviewer #2 (Public review):
Summary
The study by Cao et al. highlights an interesting and important aspect of heat- and thermal biology: the effect of repetitive, long-term heat exposure and its impact on brain function.<br /> Even though peripheral, sensory temperature sensors and afferent neuronal pathways conveying acute temperature information to the CNS have been well established, it is largely unknown how persistent, long-term temperature stimuli interact with and shape CNS function, and how these thermally-induced CNS alterations modulate efferent pathways to change physiology and behavior. This study is therefore not only novel but, given global warming, also timely.
The authors provide compelling evidence that neurons of the paraventricular thalamus change plastically over three weeks of episodic heat stimulation and they convincingly show that these changes affect behavioral outputs such as social interactions, and anxiety-related behaviors.
Strengths
(1) It is impressive that the assessed behaviors can be (i) recruited by optogenetic fiber activation and (ii) inhibited by optogenetic fiber inhibition when mice are exposed to heat. Technically, when/how long is the fiber inhibition performed? It says in the text "3 min on and 3 min off". Is this only during the 20-minute heat stimulation or also at other times?
(2) It is interesting that the frequency of activity in pPVT neurons, as assessed by fiber photometry, stays increased after long-term heat exposure (day 22) when mice are back at normal room temperature. This appears similar to a previous study that found long-term heat exposure to transform POA neurons plastically to become tonically active (https://www.biorxiv.org/content/10.1101/2024.08.06.606929v1 ). Interestingly, the POA neurons that become tonically active by persistent heat exposure described in the above study are largely excitatory, and thus these could drive the activity of the pPVT neurons analyzed in this study.
(3) How can it be reconciled that the majority of the inputs from the POA are found to be largely inhibitory (Fig. 2H)? Is it possible that this result stems from the fact that non-selective POA-to-pPVT projections are labelled by the approach used in this study and not only those pathways activated by heat? These points would be nice to discuss.
(4) It is very interesting that no LTP can be induced after chronic heat exposure (Figures K-M); the authors suggest that "the pathway in these mice were already saturated" (line 375). Could this hypothesis be tested in slices by employing a protocol to extinguish pre-existing (chronic heat exposure-induced) LTP? This would provide further strength to the findings/suggestion that an important synaptic plasticity mechanism is at play that conveys behavioral changes upon chronic heat stimulation.
(5) It is interesting that long-term heat does not increase parameters associated with depression (Figure 1N-Q), how is it with acute heat stress, are those depression parameters increased acutely? It would be interesting to learn if "depression indicators" increase acutely but then adapt (as a consequence of heat acclimation) or if they are not changed at all and are also low during acute heat exposure.
Weaknesses/suggestions for improvements
(1) The introduction and general tenet of the study is, to us, a bit too one-sided/biased: generally, repetitive heat exposure --heat acclimation-- paradigms are known to not only be detrimental to animals and humans but also convey beneficial effects in allowing the animals and humans to gain heat tolerance (by strengthening the cardiovascular system, reducing energy metabolism and weight, etc.).
(2) The point is well taken that these authors here want to correlate their model (90 minutes of heat exposure per day) to heat waves. Nevertheless, and to more fully appreciate the entire biology of repetitive/chronic/persistent heat exposure (heat acclimation), it would be helpful to the general readership if the authors would also include these other aspects in their introduction (and/or discussion) and compare their 90-minute heat exposure paradigm to other heat acclimation paradigms. For example, many past studies (using mice or rats) have used more subtle temperatures but permanently (and not only for 90 minutes) stimulated them over several days and weeks (for example see PMID: 35413138). This can have several beneficial effects related to cardiovascular fitness, energy metabolism, and other aspects. In this regard: 38{degree sign}C used in this study is a very high temperature for mice, in particular when they are placed there without acclimating slowly to this temperature but are directly placed there from normal ambient temperatures (22{degree sign}C-24{degree sign}C) which is cold/coolish for mice. Since the accuracy of temperature measurement is given as +/- 2{degree sign}C, it could also be 40{degree sign}C -- this temperature, 40{degree sign}C, non-heat acclimated C57bl/6 mice will not survive for long.
The authors could consider discussing that this very strong, short episodic heat-stress model used here in this study may emphasize detrimental effects of heat, while more subtle long-term persistent exposure may be able to make animals adapt to heat, become more tolerant, and perhaps even prevent the detrimental cognitive effects observed in this study (which would be interesting to assess in a follow-up study).
(3) Line 140: It would help to be clear in the text that the behaviors are measured 1 day after the acute heat exposure - this is mentioned in the legend to the figure, but we believe it is important to stress this point also in the text. Similarly, this is also relevant for chronic heat stimulation: it needs to be made very clear that the behavior is measured 1 day after the last heat stimulus. If the behaviors had been measured during the heat stimulus, the results would likely be very different.
(4) Figure 2 D and Figure 2- Figure Supplement 1: since there is quite some baseline cFos activity in the pPVT region we believe it is important to include some control (room temperature) mice with anterograde labelling; in our view, it is difficult/not possible to conclude, based on Fig 2 supplement 2C, that nearly 100% of the cfos positive cells are contacted by POA fibre terminals (line 168). By eye there are several green cells that don't have any red label on (or next to) them; additionally, even if there is a little bit of red signal next to a green cell: this is not definitive proof that this is a synaptic contact. It is therefore advisable to revisit the quantification and also revisit the interpretation/wording about synaptic contacts.
In relation to the above: Figure 2h suggests that all neurons are connected (the majority receiving inhibitory inputs), is this really the case, is there not a single neuron out of the 63 recorded pPVT neurons that does not receive direct synaptic input from the POA?
(5) It would be nice to characterize the POA population that connects to the pPVT, it is possible/likely that not only warm-responsive POA neurons connect to that region but also others. The current POA-to-pPVT optogenetic fibre stimulations (Figure 4) are not selective for preoptic warm responsive neurons; since the POA subserves many different functions, this optogenetic strategy will likely activate other pathways. The referees acknowledge that molecular analysis of the POA population would be a major undertaking. Instead, this could be acknowledged in the discussion, for example in a section like "limitation of this study".
(6) Figure 3a the strategy to express Gcamp in a Cre-dependent manner: it seems that the Gcamp8f signal would be polluted by EGFP (coming from the Cre virus injected into the POA): The excitation peak for both is close to 490nm and emission spectra/peaks of GCaMP8f (510-520 nm) and EGFP (507-510 nm) are also highly overlapping. We presume that the high background (EGFP) fluorescence signal would preclude sensitive calcium detection via Gcamp8f, how did the authors tackle this problem?
(7) How did the authors perform the social interaction test (Figures 1F, G)? Was the intruder mouse male or female? If it was a male mouse would the interaction with the female mouse be a form of mating behavior? If so, the interpretation of the results (Figures 1F, G) could be "episodic heat exposure over the course of 3 weeks reduces mating behavior".
-
Reviewer #3 (Public review):
In this study, Cao et al. explore the neural mechanisms by which chronic heat exposure induces negative valence and hyperarousal in mice, focusing on the role of the posterior paraventricular nucleus (pPVT) neurons that receive projections from the preoptic area (POA). The authors show that chronic heat exposure leads to heightened activity of the POA projection-receiving pPVT neurons, potentially contributing to behavioral changes such as increased anxiety level and reduced sociability, along with heightened startle responses. In addition, using electrophysiological methods, the authors suggest that increased membrane excitability of pPVT neurons may underlie these behavioral changes. The use of a variety of behavioral assays enhances the robustness of their claim. Moreover, while previous research on thermoregulation has predominantly focused on physiological responses to thermal stress, this study adds a unique and valuable perspective by exploring how thermal stress impacts affective states and behaviors, thereby broadening the field of thermoregulation. However, a few points warrant further consideration to enhance the clarity and impact of the findings.
(1) The authors claim that behavior changes induced by chronic heat exposure are mediated by the POA-pPVT circuit. However, it remains unclear whether these changes are unique to heat exposure or if this circuit represents a more general response to chronic stress. It would be valuable to include control experiments with other forms of chronic stress, such as chronic pain, social defeat, or restraint stress, to determine if the observed changes in the POA-pPVT circuit are indeed specific to thermal stress or indicative of a more universal stress response mechanism.
(2) The authors use the term "negative emotion and hyperarousal" to interpret behavioral changes induced by chronic heat (consistently throughout the manuscript, including the title and lines 33-34). However, the term "emotion" is broad and inherently difficult to quantify, as it encompasses various factors, including both valence and arousal (Tye, 2018; Barrett, L. F. 1999; Schachter, S. 1962). Therefore, the reviewer suggests the authors use a more precise term to describe these behaviors, such as valence. Additionally, in lines 117 and 137-139, replacing "emotion" with "stress responses," a term that aligns more closely with the physiological observations, would provide greater specificity and clarity in interpreting the findings.
(3) Related to the role of POA input to pPVT,<br /> a) The authors showed increased activity in pPVT neurons that receive projections from the POA (Figure 3), and these neurons are necessary for heat-induced behavioral changes (Figures 4N-W). However, is the POA input to the pPVT circuit truly critical? Since recipient pPVT neurons can receive inputs from various brain regions, the reviewer suggests that experiments directly inhibiting the POA-to-pPVT projection itself are needed to confirm the role of POA input. Alternatively, the authors could show that the increased activity of pPVT neurons due to chronic heat exposure is not observed when the POA is blocked. If these experiments are not feasible, the reviewer suggests that the authors consider toning down the emphasis on the role of the POA throughout the manuscript and discuss this as a limitation.<br /> b) In the electrophysiology experiments shown in Figures 6A-I, the authors conducted in vitro slice recordings on pPVT neurons. However, the interpretation of these results (e.g., "The increase in presynaptic excitability of the POA to pPVT excitatory pathway suggested plastic changes induced by the chronic heat treatment.", lines 349-350) appears to be an overclaim. It is difficult to conclude that the increased excitability of pPVT neurons due to heat exposure is specifically caused by inputs from the POA. To clarify this, the reviewer suggests the authors conduct experiments targeting recipient neurons in the pPVT, with anterograde labeling from the POA to validate the source of excitatory inputs.
(4) The authors focus on the excitatory connection between the POA and pPVT (e.g., "Together, our results indicate that most of the pPVT-projecting POA neurons responded to heat treatment, which would then recruit their downstream neurons in the pPVT by exerting a net excitatory influence.", lines 169-171). However, are the POA neurons projecting to the pPVT indeed excitatory? This is surprising, considering i) the electrophysiological data shown in Figures 2E-K that inhibitory current was recorded in 52.4% of pPVT neurons by stimulation of POA terminal, and ii) POA projection neurons involved in modulating thermoregulatory responses to other brain regions are primarily GABAergic (Tan et al., 2016; Morrison and Nakamura, 2019). The reviewer suggests showing whether the heat-responsive POA neurons projecting to the pPVT are indeed excitatory (This could be achieved by retrogradely labeling POA neurons that project to the pPVT and conducting fluorescence in situ hybridization (FISH) assays against Slc32a1, Slc17a6, and Fos to label neurons activated by warmth). Alternatively, demonstrate, at least, that pPVT-projecting POA neurons are a distinct population from the GABAergic POA neurons that project to thermoregulatory regions such as DMH or rRPa. This would clarify how the POA-pPVT circuit integrates with the previously established thermoregulatory pathways.
-
-
www.biorxiv.org www.biorxiv.org
-
eLife Assessment
This valuable manuscript reports a large-scale, data-driven, biophysically detailed model of the non-barrel primary somatosensory cortex and generates numerous predictions that can further our understanding of how the multiscale organization of the cortex shapes neural activity. While the approach is solid, many of the findings are obtained using a much smaller portion of the model, which, together with the broad scope of the work, makes the narrative somewhat confusing and the strength of findings not entirely clear.
-
Reviewer #1 (Public review):
This paper presents a model of the whole somatosensory non-barrel cortex of the rat, with 4.2 million morphologically and electrically detailed neurons, with many aspects of the model constrained by a variety of data. The paper focuses on simulation experiments, testing a range of observations. These experiments are aimed at understanding how the multiscale organization of the cortical network shapes neural activity.
Strengths:
(1) The model is very large and detailed. With 4.2 million neurons and 13.2 billion synapses, as well as the level of biophysical realism employed, it is a highly comprehensive computational representation of the cortical network.
(2) Large scope of work - the authors cover a variety of properties of the network structure and activity in this paper, from dendritic and synaptic physiology to multi-area neural activity.
(3) Direct comparisons with experiments, shown throughout the paper, are laudable.
(4) The authors make a number of observations, like describing how high-dimensional connectivity motifs shape patterns of neural activity, which can be useful for thinking about the relations between the structure and the function of the cortical network.
(5) Sharing the simulation tools and a "large subvolume of the model" is appreciated.
Weaknesses:
(1) A substantial part of this paper - the first few figures - focuses on single-cell and single-synapse properties, with high similarity to what was shown in Markram et al., 2015. Details may differ, but overall it is quite similar.
(2) Although the paper is about the model of the whole non-barrel somatosensory cortex, out of all figures, only one deals with simulations of the whole non-barrel somatosensory cortex. Most figures focus on simulations that involve one or a few "microcolumns". Again, it is rather similar to what was done by Markram et al., 2015 and constitutes relatively incremental progress.
(3) With a model like this, one has an opportunity to investigate computations and interactions across an extensive cortical network in an in vivo-like context. However, the simulations presented are not addressing realistic specific situations corresponding to animals performing a task or perceiving a relevant somatosensory stimulus. This makes the insights into the roles of cell types or connectivity architecture less interesting, as they are presented for relatively abstract situations. It is hard to see their relationship to important questions that the community would be excited about - theoretical concepts like predictive coding, biophysical mechanisms like dendritic nonlinearities, or circuit properties like feedforward, lateral, and feedback processing across interacting cortical areas. In other words, what do we learn from this work conceptually, especially, about the whole non-barrel somatosensory cortex?
(4) Most comparisons with in vivo-like activity are done using experimental data for whisker deflection (plus some from the visual stimulation in V1). But this model is for the non-barrel somatosensory cortex, so exactly the part of the cortex that has less to do with whiskers (or vision). Is it not possible to find any in vivo neural activity data from the non-barrel cortex?
(5) The authors almost do not show raw spike rasters or firing rates. I am sure most readers would want to decide for themselves whether the model makes sense, and for that, the first thing to do is to look at raster plots and distributions of firing rates. Instead, the authors show comparisons with in vivo data using highly processed, normalized metrics.
(6) While the authors claim that their model with one set of parameters reproduces many experimentally established metrics, that is not entirely what one finds. Instead, they provide different levels of overall stimulation to their model (adjusting the target "P_FR" parameter, with values from 0 to 1, and other parameters), and that influences results. If I get this right (the figures could really be improved with better organization and labeling), simulations with P_FR closer to 1 provide more realistic firing rate levels for a few different cases, however, P_FR of 0.3 and possibly above tends to cause highly synchronized activity - what the authors call bursting, but which also could be called epileptic-like activity in the network.
(7) The authors mention that the model is available online, but the "Resource availability" section does not describe that in substantial detail. As they mention in the Abstract, it is only a subvolume that is available. That might be fine, but more detail in appropriate parts of the paper would be useful.
-
Reviewer #2 (Public review):
Summary:
This paper is a companion to Reminann et al. (2022), presenting a large-scale, data-driven, biophysically detailed model of the non-barrel primary somatosensory cortex (nbS1). To achieve this unprecedented scale of a bottom-up model, approximately 140 times larger than the previous model (Markram et al., 2015), they developed new methods to account for inputs from missing brain areas, among other improvements. Isbister et al. focus on detailing these methodological advancements and describing the model's ability to reproduce in vivo-like spontaneous, stimulus-evoked, and optogenetically modified activity.
Strengths:
The model generated a series of predictions that are currently impossible in vivo, as summarized in Table S1. Additionally, the tools used in this study are made available online, fostering community-based exploration. Together with the companion paper, this study makes significant contributions by detailing the model's constraints, validations, and potential caveats, which are likely to serve as a basis for advancing further research in this area.
Weaknesses:
That said, I have several suggestions to improve clarity and strengthen the validation of the model's in vivo relevance.
Major:
(1) For the stimulus-response simulations, the authors should also reference, analyze, and compare data from O'Connor et al. (2010; https://pubmed.ncbi.nlm.nih.gov/20869600/) and Yu et al .(2016; https://pubmed.ncbi.nlm.nih.gov/27749825/) in addition to Yu et al. 2019, which is the only data source the authors consider for an awake response. The authors mentioned bias in spike rate measurements, but O'Connor et al. used cell-attached recordings, which do not suffer from activity-based selection bias (in addition, they also performed Ca2+ imaging of L2/3). This was done in the exact same task as Yu et al., 2019, and they recorded from over 100 neurons across layers. Combining this data with Yu et al., 2019 would provide a comprehensive view of activity across layers and inhibitory cell types. Additionally, Yu et al. (2016) recorded VPM neurons in the same task, alongside whole-cell recordings in L4, showing that L4 PV neurons filter movement-related signals encoded in thalamocortical inputs during active touch. This dataset is more suitable for extracting VPM activity, as it was collected under the same behavior and from the same species (Unlike Diamond et al., 1992, which used anesthetized rats). Furthermore, this filtering is an interesting computation performed by the network the authors modeled. The validation would be significantly strengthened and more biologically interesting if the authors could also reproduce the filtering properties, membrane potential dynamics, and variability in the encoding of touch across neurons, not just the latency (which is likely largely determined by the distance and number of synapses).
(2) The authors mention that in the model, the response of the main activated downstream area was confined to L6. Is this consistent with in vivo observations? Additionally, is there any in vivo characterization of the distance dependence of spiking correlation to validate Figure 8I?
(3) Across the figures, activity is averaged across neurons within layers and E or I cell types, with a limited description of single-cell type and single-cell responses. Were there any predictions regarding the responses of particular cell types that significantly differ from others in the same layer? Such predictions could be valuable for future investigations and could showcase the advantages of a data-driven, biophysically detailed model.
(4) 2.4: Are there caveats to assuming the OU process as a model for missing inputs? Inputs to the cortex are usually correlated and low-dimensional (i.e., communication subspace between cortical regions), but the OU process assumes independent conductance injection. Can (weakly) correlated inputs give rise to different activity regimes in the model? Can you add a discussion on this?
(5) 2.6: The network structure is well characterized in the companion paper, where the authors report that correlations in higher dimensions were driven by a small number of neurons with high participation ratios. It would be interesting to identify which cell types exhibit high node participation in high-dimensional simplices and examine the spiking activity of cells within these motifs. This could generate testable predictions and inform theoretical cell-type-specific point neuron models for excitatory/inhibitory balanced networks and cortical processing.
Minor:
(1) Since the previous model was published in 2015, the neuroscience field has seen significant advancements in single-cell and single-nucleus sequencing, leading to the clustering of transcriptomic cell types in the entire mouse brain. For instance, the Allen Institute has identified ~10 distinct glutamatergic cell types in layer 5, which exceeds the number incorporated into the current model. Could you discuss 1) the relationship between the modeled me-types and these transcriptomic cell types, and 2) how future models will evolve to integrate this new information? If there are gaps in knowledge in order to incorporate some transcriptome cell types into your model, it would be helpful to highlight them so that efforts can be directed toward addressing these areas.
(2) For the optogenetic manipulation, it would be interesting if the model could reproduce the paradoxical effects (for example, Mahrach et al. reported paradoxical effects caused by PV manipulation in S1; https://pubmed.ncbi.nlm.nih.gov/31951197/). This seems a more relevant and non-trivial network phenomenon than the V1 manipulation the authors attempted to replicate.
-
-
www.biorxiv.org www.biorxiv.org
-
eLife Assessment
This study provides abundant valuable scRNA-Seq data that profiles fibroblasts involved in myocardium and coronary vasculature development. However, the evidence supporting the authors' claims is currently incomplete. The inclusion of additional citations, more in-depth discussions, and further analyses or experiments to validate the scRNA-Seq data would have significantly strengthened the study. Nonetheless, the scRNA-Seq expression data will be a resource that is of value to researchers in the field.
-
Reviewer #1 (Public review):
Summary:
The study by Deng et al reports single-cell expression analysis of developing mouse hearts and examines the requirements for cardiac fibroblasts in heart maturation. Much of this work is overlapping with previous studies, but the single-cell gene expression data may be useful to investigators in the field. The significance and scope of new findings are limited and major conclusions are largely based on correlative data.
Strengths:
The strengths of the manuscript are the new single-cell datasets and comprehensive approach to ablating cardiac fibroblasts in pre and postnatal development in mice.
Weaknesses:
There are several major weaknesses in the analysis and interpretation of the results.
(1) The major conclusions regarding collagen signaling and heart maturation are based on gene expression patterns and are not functionally validated. The potential downstream signaling pathways were not examined and known structural contributions of fibrillar collagen to heart maturation are not discussed.
(2) The heterogeneity of fibroblast populations and contributions to multiple structures in the developing heart are not well-considered in the analysis. The developmental targeting of fibroblasts will likely affect multiple structures in the embryonic heart and other organs. Lethality is described in some of these studies, but additional analysis is needed to determine the effects on heart morphogenesis or other organs beyond the focus on cardiomyocyte maturation being reported. In particular, the endocardial cushions and developing valves are likely to be affected in the prenatal ablations, but these structures are not included in the analyses.
(3) ECM complexity and extensive previous work on specific ECM proteins in heart development and maturation are not incorporated into the current study. Different types of collagen (basement membrane Col4, filamentous Col6, and fibrillar Col1) are known to be expressed in fibroblast populations in the developing heart and have been studied extensively. Much also has been reported for other ECM components mentioned in the current work.
-
Reviewer #2 (Public review):
This study aims to elucidate the role of fibroblasts in regulating myocardium and vascular development through signaling to cardiomyocytes and endothelial cells. This focus is significant, given that fibroblasts, cardiomyocytes, and vascular endothelial cells are the three primary cell types in the heart. The authors employed a Pdgfra-CreER-controlled diphtheria toxin A (DTA) system to ablate fibroblasts at various embryonic and postnatal stages, characterizing the resulting cardiac defects, particularly in myocardium and vasculature development. scRNA-seq analysis of the ablated hearts identified collagen as a crucial signaling molecule from fibroblasts that influences the development of cardiomyocytes and vascular endothelial cells.
This is an interesting manuscript; however, there are several major issues, including an over-reliance on the scRNA-seq data, which shows inconsistencies between replicates.<br /> Some of the major issues are described below.
(1) The CD31 immunostaining data (Figures 3B-G) indicate a reduction in endothelial cell numbers following fibroblast deletion using PdgfraCreER+/-; RosaDTA+/- mice. However, the scRNA-seq data show no percentage change in the endothelial cell population (Figure 4D). Furthermore, while the percentage of Vas_ECs decreased in ablated samples at E16.5, the results at E18.5 were inconsistent, showing an increase in one replicate and a decrease in another, raising concerns about the reliability of the RNA-seq findings.
(2) Similarly, while the percentage of Ven_CMs increased at E18.5, it exhibited differing trends at E16.5 (Figure 4E), further highlighting the inconsistency of the scRNA-seq analysis with the other data.
(3) Furthermore, the authors noted that the ablated samples had slightly higher percentages of cardiomyocytes in the G1 phase compared to controls (Figures 4H, S11D), which aligns with the enrichment of pathways related to heart development, sarcomere organization, heart tube morphogenesis, and cell proliferation. However, it is unclear how this correlates with heart development, given that the hearts of ablated mice are significantly smaller than those of controls (Figure 3E). Additionally, the heart sections from ablated samples used for CD31/DAPI staining in Figure 3F appear much larger than those of the controls, raising further inconsistencies in the manuscript.
(4) The manuscript relies heavily on the scRNA-seq dataset, which shows inconsistencies between the two replicates. Furthermore, the morphological and histological analyses do not align with the scRNA-seq findings.
(5) There is a lack of mechanistic insight into how collagen, as a key signaling molecule from fibroblasts, affects the development of cardiomyocytes and vascular endothelial cells.
(6) In Figure 1B, Col1a1 expression is observed in the epicardial cells (Figure 1A, E11.5), but this is not represented in the accompanying cartoon.
(7) What is the genotype of the control animals used in the study?
(8) Do the PdgfraCreER+/-; RosaDTA+/- mice survive after birth when induced at E15.5, and do they exhibit any cardiac defects?
-
Reviewer #3 (Public review):
The authors investigated fibroblasts' communication with key cell types in developing and neonatal hearts, with a focus on the critical roles of fibroblast-cardiomyocyte and fibroblast-endothelial cell networks in cardiac morphogenesis. They tried to map the spatial distribution of these cell types and reported the major pathways and signaling molecules driving the communication. They also used Cre-DTA system to ablate Pdgfra labeled cells and observed myocardial and endothelial cell defects at development. They screened the pathways and genes using sequencing data of ablated hearts. Lastly, they reported compensatory collagen expression in long-term ablated neonate hearts. Overall, this study provides us with important insight into fibroblasts' roles in cardiac development and will be a powerful resource for collagens and ECM-focused research.
Strengths:
The authors utilized good analyzing tools to investigate multiple databases of single-cell sequencing and Multi-seq. They identified significant pathways and cellular and molecular interactions of fibroblasts. Additionally, they compared some of their analytic findings with a human database, and identified several groups of ECM genes with varying roles in mice.
Weaknesses:
This study is majorly based on sequencing data analysis. At the bench, they used a very strident technique to study fibroblast functions by ablating one of the major cell populations of the heart. Considering the importance of the fibroblast population, intriguing in vivo findings were expected. Also, they analyzed the downstream genes in ablated hearts, but did not execute any experimental validation for any of the targets.
-
-
www.biorxiv.org www.biorxiv.org
-
eLife Assessment
This useful study presents a biologically realistic, large-scale cortical model of the rat's non-barrel somatosensory cortex, investigating synaptic plasticity of excitatory connections under varying patterns of external activations and characterizing relations between network architecture and plasticity outcomes. While the model demonstrates several interesting phenomena, the results are less explanatory of causal relationships and more observational in nature; hence the evidence supporting the main conclusions remains incomplete.
-
Reviewer #1 (Public review):
This paper investigates the dynamics of excitatory synaptic weights under a calcium-based plasticity rule, in long (up to 10 minutes) simulations of a 211,000-neuron biophysically detailed model of a rat cortical network.
Strengths
(1) A very detailed network model, with a large number of neurons, connections, synapses, etc., and with a huge number of biological considerations implemented in the model.
(2) A carefully developed calcium-based plasticity rule, which operates with biologically relevant variables like calcium concentration and NMDA conductances.
(3) The study itself is detailed and thorough, covering many aspects of the cellular and network anatomy and properties and investigating their relationships to plasticity.
(4) The model remains stable over long periods of simulations, with the plasticity rule maintaining reasonable synaptic weights and not pushing the network to extremes.
(5) The variety of insights the authors derive in terms of relationships between the cellular and network properties and dynamics of the synaptic weights are potentially interesting for the field.
(6) Sharing the model and the associated methods and tools is a big plus.
Weaknesses
(1) Conceptually, there seems to be a missed opportunity here in that it is not clear what the network learns to do. The authors present 10 different input patterns, the network does some plasticity, which is then analyzed, but we do not know whether the learning resulted in anything functionally significant. Did the network learn to discriminate the patterns much better than at the beginning, to capture or anticipate the timing of pattern presentation, detect similarities between patterns, etc.? This is important to understand if one wants to assess the significance of synaptic changes due to plasticity. For example, if the network did not learn much new functionally, relative to its initial state, then the observed plasticity could be considered minor and possibly insufficient. In that case, were the network to learn something substantial, one would potentially observe much more extensive plasticity, and the results of the whole study could change, possibly including the stability of the network. While this could be a whole separate study, this issue is of central importance, and it is hard to judge the value of the results when we do not know what the network learned to do, if anything.
(2) In this study, plasticity occurs only at E-to-E connections but not at others. However, it is well known that inhibitory connections in the cortex exhibit at the very least a substantial short-term plasticity. One would expect that not including these phenomena would have substantial consequences on the results.
(3) Lines 134-135: "We calibrated layer-wise spontaneous firing rates and evoked activity to brief VPM inputs matching in vivo data from Reyes-Puerta et al. (2015)."
(4) Can the authors show these results? It is an important comparison, and so it would be great to see firing rates (ideally, their distributions) for all the cell types and layers vs. experimental data, for the evoked and spontaneous conditions.
(5) That being said, the Reyes-Puerta et al. paper reports firing rates for the barrel cortex, doesn't it? Whereas here, the authors are simulating a non-barrel cortex. Is such a comparison appropriate?
(6) Comparison with STDP on pages 5-7 and Figure 2: if I got this right, the authors applied STDP to already generated spikes, that is, did not run a simulation with STDP. That seems strange. The spikes they use here were generated by the system utilizing their calcium-based plasticity rule. Obviously, the spikes would be different if STDP was utilized instead. The traces of synaptic weights would then also be different. The comparison therefore is not quite appropriate, is it?
(7) Section 2.3 and Figure 5: I am not sure this analysis adds much. The main finding is that plasticity occurs more among cells in assemblies than among all cells. But isn't that expected given what was shown in the previous figures? Specifically, the authors showed that for cells that fire more, plasticity is more prominent. Obviously, cells that fire little or not at all won't belong to any assemblies. Therefore, we expect more plasticity in assemblies.
(8) Section 2.4 and Figure 6: It is not clear that the results truly support the formulation of the section's title ("Synapse clustering contributes to the emergence of cell assemblies, and facilitates plasticity across them") and some of the text in the section. What I can see is that the effect on rho is strong for non-clustered synapses (Figure 6C and Figure S8A). In some cases, it is substantially higher than what is seen for clustered synapses. Furthermore, the wording "synapse clustering contributes to the emergence of cell assemblies" suggests some kind of causal role of clustered synapses in determining which neurons form specific cell assemblies. I do not see how the data presented supports that. Overall, it appears that the story about clustered synapses is quite complicated, with both clustered and non-clustered synapses driving changes in rho across the board.
(9) Section 2.5 and Figure 7: Can we be certain that it is the edge participation that is a particularly good predictor of synaptic changes and/or strength, as opposed to something simpler? For example, could it be the overall number of synapses, excitatory synapses, or something along these lines, that the source and/or target neurons receive, that determine the rho dynamics? And then, I do not understand the claim that edge participation allows one to "delineate potentiation from depression". The only related data I can find is in Figure 7A3, about which the authors write "this effect was stronger for potentiation than depression". But I don't see what they mean. For both depression and facilitation, the changes observed are in the range of ~12% of probability values. And even if the effect is stronger, does it mean one can "delineate" potentiation from depression better? What does it mean, to "delineate"? If it is some kind of decoding based on the edge participation, then the authors did not show that.
(10) "test novel predictions in the MICrONS (2021) dataset, which while pushing the boundaries of big data neuroscience, was so far only analyzed with single cells in focus instead of the network as a whole (Ding et al., 2023; Wang et al., 2023)." That is incorrect. For example, the whole work of Ding et al. analyzes connectivity and its relation to the neuron's functional properties at the network level.
-
Reviewer #2 (Public review):
Summary:
This paper aims to understand the effects of plasticity in shaping the dynamics and structure of cortical circuits, as well as how that depends on aspects such as network structure and dendritic processing.
Strengths:
The level of biological detail included is impressive, and the numerical simulations appear to be well executed. Additionally, they have done a commendable job in open-sourcing the model.
Weaknesses:
The main result of this work is that activity in their network model remains stable without the need for a homeostatic mechanism. However, as the authors acknowledge, this has been demonstrated in previous studies (e.g., Higgins et al. 2014). In those studies, stability was attributed to calcium-based rules combined with calcium concentrations at in vivo levels and background neuronal activity. Since the authors use the same calcium-based rule, it is unclear what new result, if any, is being presented. If the authors are suggesting that the mechanism in their simulations differs, that should be stated clearly, and evidence supporting that claim should be provided.
The other findings discussed in the paper are related to a characterization of the dependency of plastic changes on network structure. While this analysis is potentially interesting, it has the following limitations.
First, I believe the authors should include an analysis of the generality and specificity of their results. All the findings seem to be derived from a single run of the simulation. How do the results vary with different network initializations, simulation times, or parameter choices?
Second, the presentation of the results is difficult to follow. The characterization comes across as a long list of experiments, making it hard to identify a central message or distinguish key findings from minor details. The authors provide little intuition about why certain outcomes arise, and the complexity of the simulation makes it challenging - if not impossible - to determine which model elements are essential for specific results and which mechanisms drive emergent properties. Additionally, the text often lacks crucial details. For instance, the description of k-edge participation should be expanded, and an explanation of what this method quantifies should be included. Overall, I believe the authors should focus on a smaller set of significant results and provide a more in-depth discussion.
The comparison of the model with the MICrONS dataset could be improved. In Figure 7B, the authors should show how the same quantification looks in a network model without plasticity. In Figure 8B, the data aligns with the model before plasticity, so it's unclear how this serves as a verification of the theoretical predictions.
-
Reviewer #3 (Public review):
Summary:
Ecker et al. utilized a biologically realistic, large-scale cortical model of the rat's non-barrel somatosensory cortex, incorporating a calcium-dependent plasticity rule to examine how various factors influence synaptic plasticity under in vivo-like conditions. Their analysis characterized the resulting plastic changes and revealed that key factors, including the co-firing of stimulus-evoked neuronal ensembles, the spatial organization of synaptic clusters, and the overall network topology, play an important role in affecting the extent of synaptic plasticity.
Strengths:
The detailed, large-scale model employed in this study enables the evaluation of diverse factors across various levels that influence the extent of plastic changes. Specifically, it facilitates the assessment of synaptic organization at the subcellular level, network topology at the macroscopic level, and the co-activation of neuronal ensembles at the activity level. Moreover, modeling plasticity under in vivo-like conditions enhances the model's relevance to experiments.
Weaknesses:
(1) The authors claimed that, under in vivo-like conditions and in the presence of plasticity, firing rates and weight distributions remain stable without additional homeostatic mechanisms during a 10-minute stimulation period. However, the weights do not reach the steady state immediately after the 10-minute stimulation. Therefore, extended simulations are necessary to substantiate the claim.
(2) Another major limitation of the paper lies in its lack of mechanistic insights into the observed phenomena (particularly on aspects that are typically impossible to assess in traditional simplified models, like layer-specific and layer-to-layer pathways-specific plasticity changes), as well as the absence of discussions on the potential computational implications of the corresponding observed plastic changes.
-
- Oct 2024
-
www.biorxiv.org www.biorxiv.org
-
eLife Assessment
This important study explores the interplay between gene dosage and gene mutations in the evolution of antibiotic resistance. The authors provide solid evidence to connect proteostasis with gene duplication during experimental evolution in a model system. If the experiments are found to be rigorous and reproducible, then this paper will be of high interest to other researchers studying antibiotic resistance, proteostasis, and bacterial evolution.
-
Reviewer #1 (Public review):
Summary:
The study by Jena et al. addresses important questions on the fundamental mechanisms of genetic adaptation, specifically, does adaptation proceed via changes of copy number (gene duplication and amplification "GDA") or by point mutation. While this question has been worked on (for example by Tomanek and Guet) the authors add several important aspects relating to resistance against antibiotics and they clarify the ability of Lon protease to reduce duplication formation (previous work was more indirect).
A key finding Jena et al. present is that point mutations after significant competition displace GDA. A second one is that alternative GDA constantly arise and displace each other (see work on GDA-2 in Figure 3). Finally, the authors found epistasis between resistance alleles that was contingent on lon. Together this shows an intricate interplay of lon proteolysis for the evolution and maintenance of antibiotic resistance by gene duplication.
Strengths:
The study has several important strengths: (i) the work on GDA stability and competition of GDA with point mutations is a very promising area of research and the authors contribute new aspects to it, (ii) rigorous experimentation, (iii) very clearly written introduction and discussion sections. To me, the best part of the data is that deletion of lon stimulates GDA, which has not been shown with such clarity until now.
Weaknesses:
The minor weaknesses of the manuscript are a lack of clarity in parts of the results section (Point 1) and the methods (Point 2).
-
Reviewer #2 (Public review):
Summary:
In this strong study, the authors provide robust evidence for the role of proteostasis genes in the evolution of antimicrobial resistance, and moreover, for stabilizing the proteome in light of gene duplication events.
Strengths:
This strong study offers an important interaction between findings involving GDA, proteostasis, experimental evolution, protein evolution, and antimicrobial resistance. Overall, I found the study to be relatively well-grounded in each of these literatures, with experiments that spoke to potential concerns from each arena. For example, the literature on proteostasis and evolution is a growing one that includes organisms (even micro-organisms) of various sorts. One of my initial concerns involved whether the authors properly tested the mechanistic bases for the rule of Lon in promoting duplication events. The authors assuaged my concern with a set of assays (Figure 8).
More broadly, the study does a nice job of demonstrating the agility of molecular evolution, with responsible explanations for the findings: gene duplications are a quick-fix, but can be out-competed relative to their mutational counterparts. Without Lon protease to keep the proteome stable, the cell allows for less stable solutions to the problem of antibiotic resistance.
The study does what any bold and ambitious study should: it contains large claims and uses multiple sorts of evidence to test those claims.
Weaknesses:
While the general argument and conclusion are clear, this paper is written for a bacterial genetics audience that is familiar with the manner of bacterial experimental evolution. From the language to the visuals, the paper is written in a boutique fashion. The figures are even difficult for me - someone very familiar with proteostasis - to understand. I don't know if this is the fault of the authors or the modern culture of publishing (where figures are increasingly packed with information and hard to decipher), but I found the figures hard to follow with the captions. But let me also consider that the problem might be mine, and so I do not want to unfairly criticize the authors.
For a generalist journal, more could be done to make this study clear, and in particular, to connect to the greater community of proteostasis researchers. I think this study needs a schematic diagram that outlines exactly what was accomplished here, at the beginning. Diagrams like this are especially important for studies like this one that offer a clear and direct set of findings, but conduct many different sorts of tests to get there. I recommend developing a visual abstract that would orient the readers to the work that has been done.
Next, I will make some more specific suggestions. In general, this study is well done and rigorous, but doesn't adequately address a growing literature that examines how proteostasis machinery influences molecular evolution in bacteria.
While this paper might properly test the authors' claims about protein quality control and evolution, the paper does not engage a growing literature in this arena and is generally not very strong on the use of evolutionary theory. I recognize that this is not the aim of the paper, however, and I do not question the authors' authority on the topic. My thoughts here are less about the invocation of theory in evolution (which can be verbose and not relevant), and more about engagement with a growing literature in this very area.
The authors mention Rodrigues 2016, but there are many other studies that should be engaged when discussing the interaction between protein quality control and evolution.
A 2015 study demonstrated how proteostasis machinery can act as a barrier to the usage of novel genes: Bershtein, S., Serohijos, A. W., Bhattacharyya, S., Manhart, M., Choi, J. M., Mu, W., ... & Shakhnovich, E. I. (2015). Protein homeostasis imposes a barrier to functional integration of horizontally transferred genes in bacteria. PLoS genetics, 11(10), e1005612
A 2019 study examined how Lon deletion influenced resistance mutations in DHFR specifically: Guerrero RF, Scarpino SV, Rodrigues JV, Hartl DL, Ogbunugafor CB. The proteostasis environment shapes higher-order epistasis operating on antibiotic resistance. Genetics. 2019 Jun 1;212(2):565-75.
A 2020 study did something similar: Thompson, Samuel, et al. "Altered expression of a quality control protease in E. coli reshapes the in vivo mutational landscape of a model enzyme." Elife 9 (2020): e53476.
And there's a new review (preprint) on this very topic that speaks directly to the various ways proteostasis shapes molecular evolution:<br /> Arenas, Carolina Diaz, Maristella Alvarez, Robert H. Wilson, Eugene I. Shakhnovich, C. Brandon Ogbunugafor, and C. Brandon Ogbunugafor. "Proteostasis is a master modulator of molecular evolution in bacteria."
I am not simply attempting to list studies that should be cited, but rather, this study needs to be better situated in the contemporary discussion on how protein quality control is shaping evolution. This study adds to this list and is a unique and important contribution. However, the findings can be better summarized within the context of the current state of the field. This should be relatively easy to implement.
-
Reviewer #3 (Public review):
Summary:
This paper investigates the relationship between the proteolytic stability of an antibiotic target enzyme and the evolution of antibiotic resistance via increased gene copy number. The target of the antibiotic trimethoprim is dihydrofolate reductase (DHFR). In Escherichia coli, DHFR is encoded by folA and the major proteolysis housekeeping protease is Lon (lon). In this manuscript, the authors report the results of the experimental evolution of a lon mutant strain of E. coli in response to sub-inhibitory concentrations of the antibiotic trimethoprim and then investigate the relationship between proteolytic stability of DHFR mutants and the evolution of folA gene duplication. After 25 generations of serial passaging in a fixed concentration of trimethoprim, the authors found that folA duplication events were more common during the evolution of the lon strain, than the wt strain. However, with continued passaging, some folA duplications were replaced by a single copy of folA containing a trimethoprim resistance-conferring point mutation. Interestingly, the evolution of the lon strain in the setting of increasing concentrations of trimethoprim resulted in evolved strains with different levels of DHFR expression. In particular, some strains maintained two copies of a mutant folA that encoded an unstable DHFR. In a lon+ background, this mutant folA did not express well and did not confer trimethoprim resistance. However, in the lon- background, it displayed higher expression and conferred high-level trimethoprim resistance. The authors concluded that maintenance of the gene duplication event (and the absence of Lon) compensated for the proteolytic instability of this mutant DHFR. In summary, they provide evidence that the proteolytic stability of an antibiotic target protein is an important determinant of the evolution of target gene copy number in the setting of antibiotic selection.
Strengths:
The major strength of this paper is identifying an example of antibiotic resistance evolution that illustrates the interplay between the proteolytic stability and copy number of an antibiotic target in the setting of antibiotic selection. If the weaknesses are addressed, then this paper will be of interest to microbiologists who study the evolution of antibiotic resistance.
Weaknesses:
Although the proposed mechanism is highly plausible and consistent with the data presented, the analysis of the experiments supporting the claim is incomplete and requires more rigor and reproducibility. The impact of this finding is somewhat limited given that it is a single example that occurred in a lon strain and compensatory mutations for evolved antibiotic resistance mechanisms are described. In this case, it is not clear that there is a functional difference between the evolution of copy number versus any other mechanism that meets a requirement for increased "expression demand" (e.g. promoter mutations that increase expression and protein stabilizing mutations).
-
Author response:
Public Reviews:
Reviewer #1 (Public review):
[…] Strengths:
The study has several important strengths: (i) the work on GDA stability and competition of GDA with point mutations is a very promising area of research and the authors contribute new aspects to it, (ii) rigorous experimentation, (iii) very clearly written introduction and discussion sections. To me, the best part of the data is that deletion of lon stimulates GDA, which has not been shown with such clarity until now.
Weaknesses:
The minor weaknesses of the manuscript are a lack of clarity in parts of the results section (Point 1) and the methods (Point 2).
We thank the reviewer for their comments and suggestions on our manuscript. We also appreciate the succinct summary of key findings that the Reviewer has taken cognisance of in their assessment, in particular the association of the Lon protease with the propensity for GDAs as well as its impact on their eventual fate. Going ahead, we plan to revise the manuscript for greater clarity as suggested by Reviewer #1.
Reviewer #2 (Public review):
[…] The study does what any bold and ambitious study should: it contains large claims and uses multiple sorts of evidence to test those claims.
Weaknesses:
While the general argument and conclusion are clear, this paper is written for a bacterial genetics audience that is familiar with the manner of bacterial experimental evolution. From the language to the visuals, the paper is written in a boutique fashion. The figures are even difficult for me - someone very familiar with proteostasis - to understand. I don't know if this is the fault of the authors or the modern culture of publishing (where figures are increasingly packed with information and hard to decipher), but I found the figures hard to follow with the captions. But let me also consider that the problem might be mine, and so I do not want to unfairly criticize the authors.
For a generalist journal, more could be done to make this study clear, and in particular, to connect to the greater community of proteostasis researchers. I think this study needs a schematic diagram that outlines exactly what was accomplished here, at the beginning. Diagrams like this are especially important for studies like this one that offer a clear and direct set of findings, but conduct many different sorts of tests to get there. I recommend developing a visual abstract that would orient the readers to the work that has been done.
Next, I will make some more specific suggestions. In general, this study is well done and rigorous, but doesn't adequately address a growing literature that examines how proteostasis machinery influences molecular evolution in bacteria.
While this paper might properly test the authors' claims about protein quality control and evolution, the paper does not engage a growing literature in this arena and is generally not very strong on the use of evolutionary theory. I recognize that this is not the aim of the paper, however, and I do not question the authors' authority on the topic. My thoughts here are less about the invocation of theory in evolution (which can be verbose and not relevant), and more about engagement with a growing literature in this very area.
The authors mention Rodrigues 2016, but there are many other studies that should be engaged when discussing the interaction between protein quality control and evolution.
A 2015 study demonstrated how proteostasis machinery can act as a barrier to the usage of novel genes: Bershtein, S., Serohijos, A. W., Bhattacharyya, S., Manhart, M., Choi, J. M., Mu, W., ... & Shakhnovich, E. I. (2015). Protein homeostasis imposes a barrier to functional integration of horizontally transferred genes in bacteria. PLoS genetics, 11(10), e1005612
A 2019 study examined how Lon deletion influenced resistance mutations in DHFR specifically: Guerrero RF, Scarpino SV, Rodrigues JV, Hartl DL, Ogbunugafor CB. The proteostasis environment shapes higher-order epistasis operating on antibiotic resistance. Genetics. 2019 Jun 1;212(2):565-75.
A 2020 study did something similar: Thompson, Samuel, et al. "Altered expression of a quality control protease in E. coli reshapes the in vivo mutational landscape of a model enzyme." Elife 9 (2020): e53476.
And there's a new review (preprint) on this very topic that speaks directly to the various ways proteostasis shapes molecular evolution:
Arenas, Carolina Diaz, Maristella Alvarez, Robert H. Wilson, Eugene I. Shakhnovich, C. Brandon Ogbunugafor, and C. Brandon Ogbunugafor. "Proteostasis is a master modulator of molecular evolution in bacteria."
I am not simply attempting to list studies that should be cited, but rather, this study needs to be better situated in the contemporary discussion on how protein quality control is shaping evolution. This study adds to this list and is a unique and important contribution. However, the findings can be better summarized within the context of the current state of the field. This should be relatively easy to implement.
We thank the reviewer for their encouraging assessment of our manuscript. We appreciate that the manuscript may not be accessible for a general readership in its present form. We plan to revise the manuscript, in part by modifying figures and adding schematics, to afford greater clarity. We also appreciate the concern regarding situating this study in the context of other published work that relates proteostasis and molecular evolution. Indeed, this was a particularly difficult aspect for us given the different kinds of literature that were needed to make sense of our study. We plan on revising the manuscript by incorporating the references that the Reviewer has pointed out.
Reviewer #3 (Public review):
[…] Strengths:
The major strength of this paper is identifying an example of antibiotic resistance evolution that illustrates the interplay between the proteolytic stability and copy number of an antibiotic target in the setting of antibiotic selection. If the weaknesses are addressed, then this paper will be of interest to microbiologists who study the evolution of antibiotic resistance.
Weaknesses:
Although the proposed mechanism is highly plausible and consistent with the data presented, the analysis of the experiments supporting the claim is incomplete and requires more rigor and reproducibility. The impact of this finding is somewhat limited given that it is a single example that occurred in a lon strain and compensatory mutations for evolved antibiotic resistance mechanisms are described. In this case, it is not clear that there is a functional difference between the evolution of copy number versus any other mechanism that meets a requirement for increased "expression demand" (e.g. promoter mutations that increase expression and protein stabilizing mutations).
We thank the reviewer for their in-depth assessment of our work and appreciate their concerns regarding reproducibility and rigor in analysis of our data. We will incorporate this feedback and provide the necessary clarifications in the revised version of our manuscript.
-
-
www.biorxiv.org www.biorxiv.org
-
eLife Assessment
This valuable work explores the timely idea that aperiodic activity in human electrophysiology recordings shows changes in response to task events, which may be relevant for performance, and that these changes could be misinterpreted as oscillatory changes. While it is a timely and interesting topic in principle, in the present form, the analytic approach is incomplete. Further, the data offer inadequate support for the conclusions related to theta without demonstrations that the task evokes theta power. Impressions were split, but there was consensus that the Discussion should be tempered and that revisions would improve the manuscript.
-
Reviewer #1 (Public review):
Summary:
Frelih et al. investigated both periodic and aperiodic activity in EEG during working memory tasks. In terms of periodic activity, they found post-stimulus decreases in alpha and beta activity, while in terms of aperiodic activity, they found a bi-phasic post-stimulus steepening of the power spectrum, which was weakly predictive of performance. They conclude that it is crucial to properly distinguish between aperiodic and periodic activity in event-related designs as the former could confound the latter. They also add to the growing body of research highlighting the functional relevance of aperiodic activity in the brain.
Strengths:
This is a well-written, timely paper that could be of interest to the field of cognitive neuroscience, especially to researchers investigating the functional role of aperiodic activity. The authors describe a well-designed study that looked at both the oscillatory and non-oscillatory aspects of brain activity during a working memory task. The analytic approach is appropriate, as a state-of-the-art toolbox is used to separate these two types of activity. The results support the basic claim of the paper that it is crucial to properly distinguish between aperiodic and periodic activity in event-related designs as the former could confound the latter. They also add to the growing body of research highlighting the functional relevance of aperiodic activity in the brain. Commendably, the authors include replications of their key findings on multiple independent data sets.
Weaknesses:
The authors also claim that their results speak to the interplay between oscillatory and non-oscillatory activity, and crucially, that task-related changes in the theta frequency band - often attributed to neural oscillations in the field - are in fact only a by-product of non-oscillatory changes. I believe these claims are too bold and are not supported by compelling evidence in the paper. Some control analyses - e.g., contrasting the scalp topographies of purported theta and non-oscillatory effects - could help strengthen the latter argument, but it may be safest to simply soften these two claims.
In terms of the methodology used, I suggest the authors make it clearer to readers that the primary results were obtained on a sample of middle-aged-to-older-adults, some with subjective cognitive complaints, and note that while stimulus-locked event-related potentials (ERPs) were removed from the data prior to analyses, response-locked ERPs were not. This could potentially confound aperiodic findings. Contrasting the scalp topographies of response-related ERPs and the identified aperiodic components, especially the latter one, could bring some clarity here too.
I also found certain parts of the introduction to be somewhat confusing.
-
Reviewer #2 (Public review):
Summary:
In this manuscript, Frelih et al investigate the relationship between aperiodic neural activity, as measured by EEG, and working memory performance, and compare this to the more commonly analyzed periodic, and in particular theta, measures that are often associated with such tasks. To do so, they analyze a primary dataset of 57 participants engaging in an n-back task, as well as a replication dataset, and use spectral parameterization to measure periodic and aperiodic features of the data, across time. In doing so, they find both periodic and aperiodic features that relate to the task dynamics, but importantly the aperiodic component appears to explain away what otherwise looks like theta activity in a more traditional analysis. This study, therefore, helps to establish that aperiodic activity is a task-relevant dynamic feature in working memory tasks, and may be the underlying change in many other studies that reported 'theta' changes but did not use methods that could differentiate periodic and aperiodic features.
Strengths:
Key strengths of this paper include that it addresses an important question - that of properly adjudicating which features of EEG recordings relate to working memory tasks - and in doing so provides a compelling answer, with important implications for considering prior work and contributing to understanding the neural underpinnings of working memory. I do not find any significant faults or errors with the design, analysis, and main interpretations as presented by this paper, and as such, find the approach taken to be valid and well-enacted. The use of multiple variants of the working memory task, as well as a replication dataset significantly strengthens this manuscript, by demonstrating a degree of replicability and generalizability. This manuscript is also an important contribution to motivating best practices for analyzing neuro-electrophysiological data, including in relation to using baselining procedures.
Weaknesses:
Overall, I do not find any obvious weaknesses in this manuscript and its analyses that challenge the key results and conclusions. There are some minor reporting notes, on the methods and conclusions that I believe could be improved (details in the suggestions for authors). One aspect that could be improved is that while the figures demonstrate the main findings convincingly, the results as written could have more detailed quantifications of the analyzed effects (including, for example, more on the model results, effect sizes, and quantifications of the different features), in order to more fully report the dynamics of the analyzed features and to provide the reader with more information on the findings.
-
Reviewer #3 (Public review):
Summary:
Using a specparam (1/f) analysis of task-evoked activity, the authors propose that "substantial changes traditionally attributed to theta oscillations in working memory tasks are, in fact, due to shifts in the spectral slope of aperiodic activity." This is a very bold and ambitious statement, and the field of event-related EEG would benefit from more critical assessments of the role of aperiodic changes during task events. Unfortunately, the data shown here does not support the main conclusion advanced by the authors.
Strengths:
The field of event-related EEG would benefit from more critical assessments of the role of aperiodic changes during task events. The authors perform a number of additional control analyses, including different types of baseline correction, ERP subtraction, as well as replication of the experiment with two additional datasets.
Weaknesses:
The authors did not first show that their first task successfully evoked theta power, nor that specparam is capable of quantifying the background around a short theta burst, nor that theta effects are different between baseline corrected vs. spectral parameterized quantifications.
-
Author Response:
We would like thank reviewers for your comprehensive and insightful reviews of our manuscript. We highly value your constructive comments and suggestions and are preparing revisions that will enhance both the clarity and robustness of our study. Below is an outline of the changes we will implement in response to the points you raised.
All three reviewers expressed concerns regarding the robustness of our conclusions about the relationship between task-related theta activity and aperiodic changes. We will revise the manuscript to present these conclusions more cautiously, stating that the findings indicate a potential contribution of aperiodic activity to what is traditionally interpreted as theta activity. While our results emphasize the importance of distinguishing between periodic and aperiodic components, further research is necessary to fully understand this relationship. We will conduct additional control analyses, including a comparison of the scalp topographies of theta and aperiodic components, to better understand the relationship between aperiodic and periodic (theta) activity.
In response to Reviewer #1's request for greater transparency in our reporting of methodological details, we will provide key clarifications. We will add a clear statement noting that the primary results are based on data from middle-aged to older adults, some of whom had subjective cognitive complaints (SCC). However, it is important to note that no differences were observed between the SCC group and the control group regarding periodic or aperiodic changes in power. Additionally, the main findings were replicated in a sample of middle-aged adults.
To address potential confounding factors, we will include an analysis contrasting response-related ERPs with the identified aperiodic components. However, we do not entirely agree with the assertion that this will necessarily clarify the results. ERPs are not inherently distinct from aperiodic (or periodic) activity; they may reflect changes in aperiodic (or periodic) power. In our view, examining aperiodic and periodic power, ERPs, or time-frequency decomposition with baseline correction provides different perspectives on the same data. Nonetheless, the combined analyses and their results are intended to guide future researchers toward the most suitable approach for interpreting this data.
Reviewer #3 raised concerns regarding the task's effectiveness in evoking theta power and the ability of spectral parameterization method (specparam) to adequately quantify background activity around theta bursts. To address these concerns, we will include additional visualizations demonstrating that the task reliably elicited theta (and delta) activity. Regarding the reviewer's concerns about specparam and theta bursts, it is important to clarify that specparam, in the form we used, does not incorporate time information; rather, it can be applied to any power spectral density (PSD), independent of how the PSD is derived. Specparam’s performance depends on the methods used to estimate frequency content. For time-frequency decomposition, we employed superlets (https://doi.org/10.1038/s41467-020-20539-9), which have been shown to resolve short bursts of activity more effectively than other methods. To our knowledge, superlets provide the highest resolution in terms of both time and frequency. Moreover, to improve stability, we performed spectral parameterization on trial-averaged power (in contrast to the approach in https://doi.org/10.7554/eLife.77348). Nonetheless, we will conduct a simulation to test whether specparam can reliably resolve low-frequency peaks over the 1/f activity.
Reviewer #2 suggested that the manuscript would benefit from a more detailed account of the effects. In response, we will include more detailed quantifications of the analyzed effects, such as model error and R² values.
We believe that the planned revisions will strengthen the manuscript and address the primary concerns raised by the reviewers. We sincerely appreciate your thoughtful feedback and look forward to submitting an improved version of the manuscript soon.
Once again, thank you for your time and expertise in reviewing our work.
Sincerely,
Andraž Matkovič & Tisa Frelih
-
-
www.biorxiv.org www.biorxiv.org
-
Reviewer #2 (Public review):
Summary:
The authors conduct a causal analysis of years of secondary education on brain structure in late life. They use a regression discontinuity analysis to measure the impact of a UK law change in 1972 that increased the years of mandatory education by 1 year. Using brain imaging data from the UK Biobank, they find essentially no evidence for 1 additional year of education altering brain structure in adulthood.
Strengths:
The authors pre-registered the study and the regression discontinuity was very carefully described and conducted. They completed a large number of diagnostic and alternate analyses to allow for different possible features in the data. (Unlike a positive finding, a negative finding is only bolstered by additional alternative analyses).
Weaknesses:
While the work is of high quality for the precise question asked, ultimately the exposure (1 additional year of education) is a very modest manipulation and the outcome is measured long after the intervention. Thus a null finding here is completely consistent educational attainment (EA) in fact having an impact on brain structure, where EA may reflect elements of training after a second education (e.g. university, post-graduate qualifications, etc) and not just stopping education at 16 yrs yes/no.
The work also does not address the impact of the UK Biobank's well-known healthy volunteer bias (Fry et al., 2017) which is yet further magnified in the imaging extension study (Littlejohns et al., 2020). Under-representation of people with low EA will dilute the effects of EA and impact the interpretation of these results.
References:
Fry, A., Littlejohns, T. J., Sudlow, C., Doherty, N., Adamska, L., Sprosen, T., Collins, R., & Allen, N. E. (2017). Comparison of Sociodemographic and Health-Related Characteristics of UK Biobank Participants With Those of the General Population. American Journal of Epidemiology, 186(9), 1026-1034. https://doi.org/10.1093/aje/kwx246
Littlejohns, T. J., Holliday, J., Gibson, L. M., Garratt, S., Oesingmann, N., Alfaro-Almagro, F., Bell, J. D., Boultwood, C., Collins, R., Conroy, M. C., Crabtree, N., Doherty, N., Frangi, A. F., Harvey, N. C., Leeson, P., Miller, K. L., Neubauer, S., Petersen, S. E., Sellors, J., ... Allen, N. E. (2020). The UK Biobank imaging enhancement of 100,000 participants: rationale, data collection, management and future directions. Nature Communications, 11(1), 2624. https://doi.org/10.1038/s41467-020-15948-9
-
eLife Assessment
A regression discontinuity analysis finds essentially no effect of 1 additional year of secondary education on brain structure in adulthood. This is a valuable finding that adds to the literature on the impact of education on brain health. The evidence presented is solid, with strengths including methodological novelty as well as principled study design; the impact is, however, limited as the manipulated variable only relates to a single additional year of education (remaining in education to 15 vs 16 years of age). The interpretation is further missing discussion of the healthy volunteer bias of the UK Biobank sample, amplified in the imaging extension.
-
Reviewer #1 (Public review):
Summary:
This fascinating manuscript studies the effect of education on brain structure through a natural experiment. Leveraging the UK BioBank, these authors study the causal effect of education using causal inference methodology that focuses on legislation for an additional mandatory year of education in a regression discontinuity design.
Strengths:
The methodological novelty and study design were viewed as strong, as was the import of the question under study. The evidence presented is solid. The work will be of broad interest to neuroscientists
Weaknesses:
There were several areas which might be strengthed from additional consideration from a methodological perspective.
-
Reviewer #3 (Public review):
Summary:
This study investigates evidence for a hypothesised, causal relationship between education, specifically the number of years spent in school, and brain structure as measured by common brain phenotypes such as surface area, cortical thickness, total volume, and diffusivity.
To test their hypothesis, the authors rely on a "natural" intervention, that is, the 1972 ROSLA act that mandated an extra year of education for all 15-year-olds. The study's aim is to determine potential discontinuities in the outcomes of interest at the time of the policy change, which would indicate a causal dependence. Naturalistic experiments of this kind are akin to randomised controlled trials, the gold standard for answering questions of causality.
Using two complementary, regression-based approaches, the authors find no discernible effect of spending an extra year in primary education on brain structure. The authors further demonstrate that observational studies showing an effect between education and brain structure may be confounded and thus unreliable when assessing causal relationships.
Strengths:
(1) A clear strength of this study is the large sample size totalling up to 30k participants from the UK Biobank. Although sample sizes for individual analyses are an order of magnitude smaller, most neuroimaging studies usually have to rely on much smaller samples.
(2) This study has been preregistered in advance, detailing the authors' scientific question, planned method of inquiry, and intended analyses, with only minor, justifiable changes in the final analysis.
(3) The analyses look at both global and local brain measures used as outcomes, thereby assessing a diverse range of brain phenotypes that could be implicated in a causal relationship with a person's level of education.
(4) The authors use multiple methodological approaches, including validation and sensitivity analyses, to investigate the robustness of their findings and, in the case of correlational analysis, highlight differences with related work by others.
(5) The extensive discussion of findings and how they relate to the existing, somewhat contradictory literature gives a comprehensive overview of the current state of research in this area.
Weaknesses:
(1) This study investigates a well-posed but necessarily narrow question in a specific setting: 15-year-old British students born around 1957 who also participated in the UKB imaging study roughly 60 years later. Thus conclusions about the existence or absence of any general effect of the number of years of education on the brain's structure are limited to this specific scenario.
(2) The authors address potential concerns about the validity of modelling assumptions and the sensitivity of the regression discontinuity design approach. However, the possibility of selection and cohort bias remains and is not discussed clearly in the paper. Other studies (e.g. Davies et al 2018, https://www.nature.com/articles/s41562-017-0279-y) have used the same policy intervention to study other health-related outcomes and have established ROSLA as a valid naturalistic experiment. Still, quoting Davies et al. (2018), "This assumes that the participants who reported leaving school at 15 years of age are a representative sample of the sub-population who left at 15 years of age. If this assumption does not hold, for example, if the sampled participants who left school at 15 years of age were healthier than those in the population, then the estimates could underestimate the differences between the groups.". Recent studies (Tyrrell 2021, Pirastu 2021) have shown that UK Biobank participants are on average healthier than the general population. Moreover, the imaging sub-group has an even stronger "healthy" bias (Lyall 2022).
(3) The modelling approach used in this study requires that all covariates of no interest are equal before and after the cut-off, something that is impossible to test. Mentioned only briefly, the inclusion and exclusion of covariates in the model are not discussed in detail. Standard imaging confounds such as head motion and scanning site have been included but other factors (e.g. physical exercise, smoking, socioeconomic status, genetics, alcohol consumption, etc.) may also play a role.
-
Author response:
To Reviewer #1:
Thank you for your kind words regarding the novelty, study design, and evidence presented. We will clarify our language when describing fuzzy local-linear regression discontinuity analysis. We thank you for this feedback as our goals are to introduce these methods to a neuroscientific audience. Lastly, we will respond and clarify the methodological points, including post-selection inference, bandwidths, and Bayesian analysis in version 2.
To Reviewers #2 and #3:
We thank you both for your constructive feedback, specifically in highlighting 1) the scope of the intervention and 2) the UKB-neuro healthy volunteer bias. In the next manuscript version, we will expand our discussion of plausible reasons for not finding an effect – weighing up the strengths and limitations of our study in 3 aspects; statistical (RD power), design-based (lack of representativeness vs. large sample), and mechanistic (the impact/or lack thereof of one-year of education on neural plasticity decades later). As we believe the approach of natural experiments with RD designs has considerable promise for the field of population cognitive neuroscience beyond this particular study, we will address each of these points within a broader section focused on considerations on how to optimize the insight, power, and inferences gained in future work within and beyond Biobank. Moreover, we will situate our discussion on the magnitude of the educational intervention among a broader discussion of cognitive training versus education, and short - versus long-term effects. We believe revising the manuscript will improve interpretation for the reader and thank you for your in-depth feedback. Lastly, we will provide a point-by-point response in the next version.
-
-
www.biorxiv.org www.biorxiv.org
-
Author response:
The following is the authors’ response to the original reviews.
We greatly appreciate reviewer 2 comments with both insightful and clearly evaluated assessments of this study that include, much appreciated reframing and evaluation of the study’s advances in the sleep field. It is a constructive review and provides considerable added value to this study in better defining the biological significance of the findings, including both advances and limitations.
Reviewer 2 nicely summarized the work as “…highlight(ing) the accumulation and resolution of sleep need centered on the strength of excitatory synapses onto excitatory neurons.”. The reviewer succinctly placed one of the main electrophysiological findings in context of one of the sleep field’s most prevalent views, “that LTP associated with wake, leads to the accumulation of sleep need by increasing neuronal excitability, and by the "saturation" of LTP capacity.” It has been speculated that “This saturation subsequently impairs the capacity for further ongoing learning. This new data provides a satisfying mechanism of this saturation phenomenon (and its restoration by recovery sleep) by introducing the concept of silent synapses.” We want to emphasize that sleep need and its resolution involves more than just homeostasis of excitatory synaptic strength but may also be extended to include homeostasis of excitatory synaptic potential to undergo LTP (a homeostasis of meta-plasticity), with implications for learning and memory.
Reviewer 2 also identified another advance made by this study, summarized as, “The new snRNAseq dataset indicates the sleep need is primarily seen (at the transcriptional level) in excitatory neurons, consistent with a number of other studies.” References for these studies are nicely provided by the reviewer. Our analysis of this data extends the evidence for transcriptional sleep-need-driven changes, observed by us and others in excitatory neurons to more particularly involve the excitatory neurons in layers 2-5, targeting intra-telencephalic neurons.
Reviewer 2, importantly noted, “New snRNAseq analysis indicates that SD drives the expression of synaptic shaping components (SSCs) consistent with the excitatory synapse as a major target for the restorative basis of sleep function”, and that “SD-induced gene expression is also enriched for autism spectrum disorder (ASD) risk genes”. These comments are well appreciated as they emphasize that beyond identification of the major target cell type of sleep function, the major sleep-target, gene-ontological characteristics are starting to be addressed.
Reviewer 2 commented on the molecular sleep model, making a key observation that “SDinduced gene expression in excitatory neurons overlaps with genes regulated by the transcription factor MEF2C and HDAC4/5 (Figure 4),” and accurately discusses the significance with respect to the proposed model.
We are in complete agreement with the observation that the molecular sleep model presented is not “definitively supported by the new data and in this regard should be viewed as a perspective…”. One of the more glaring gaps in supporting evidence is the absence of understanding of the role of HDAC4/5 (part of the SIK3-HDAC4/5 pathway) in sleep need modulation of excitatory synapses. Resolution of this issue might be approached by assessment of the synaptic effects of constitutively nuclear HDAC4/5. The current study provides a first step in the assessment by showing a correlation between HDAC4/5 and MEF2c target genes and a subset of differentially expressed synaptic shaping component (SSC) genes that modulate excitatory synapse strength and phenotype. However, the functional studies have yet to be completed. Complimentary studies on SD-induced SSC-DEGs (identified in this study) are also needed for follow-up characterization of their sleep need induced functional impact (both strength and meta-plasticity modulation) on the most relevant excitatory synapses (as identified in the current study).
We agree with both reviewers 1 and 2 that, “Additional work is also needed to understand the mechanistic links between SIK3-HDAC4/5 signaling and MEF2C activity”. Reviewer 2 clarifies the key unresolved issue as, “cnHDAC4/5 suppresses NREM amount and NREM SWA but had no effect on the NREM-SWA increase following SD (Zhou et al., Nature 2022). Loss of MEF2C in CaMKII neurons had no effect on NREM amount and suppressed the increase in NREM-SWA following SD (Bjorness et al., 2020)”. One may conclude with reviewer 2, “These instances indicate that cnHDAC4/5 and loss of MEF2C do not exactly match suggesting additional factors are relevant in these phenotypes.”
An understanding of the mechanism(s) responsible for the relationship between sleep need and SWA are critical to the evaluation of sleep need’s correlation with sleep DEGs and synaptic transmission, including “additional factors” as suggested by reviewer 2. SWA might result from a decrease of cortical glutamatergic neurotransmission below some threshold, which might occur in response to prolonged waking (possibly in response to waking activity-induced local increases of adenosine?), rather than being a cause of, or, being intimately involved in resolving sleep need.
An increase of SWA in association with SD can result directly from an acute SD-induced increase in local adenosine concentration. This will elicit an ADORA1-mediated down-regulation of glutamate excitatory neurotransmission in the cortex (Bjorness et al., 2016) and in cholinergic arousal centers (Rainnie et al., 1994; Porkka-Heiskanen et al., 1997; Portas et al., 1997; Li et al., 2023). When MEF2c is derepressed by chronic loss of HDAC4 function, SWA is facilitated (Kim et al., 2022). It is plausible that loss of HDAC4 function contributes to the increased SWA by downscaling glutamate excitatory transmission (independent of sleep need). This is expected to result from derepressed, MEF2c mediated sleep-gene expression.
Similarly, over-expression of constitutively active HDAC4 (cnHD4) can contribute to chronic upscaling of cortical glutamate synaptic strength to depress SWA (again, independent of sleep need). Thus, facilitation or depression of SWA correlates with up or down scaling effects on cortical glutamate neurotransmission, respectively, even in the absence of a direct effects on sleep need (Figure 4D). Many reagents that reduce the excitability of glutamate pyramidal cells by various mechanisms, including anesthetics like isoflurane, barbiturates or benzodiazepines in addition to those activating ADORA1, increase SWA. Finally, it is important to acknowledge that direct evidence for this proposed link of SWA to cortical glutamate transmission remains in need of further investigation. Thus, SWA may reflect generalized cortical glutamate synaptic activity whether modulated by sleep function or by other agents.
Still, other factors that can have a role mediating some of the mis-match between cnHD4/5 DEGs and Mef2c-cKO DEGs, include the broader over-expression of AAV-cnHD4 compared to CamKII- driven Cre KO of Mef2c. The cnHD4 overexpression can increase arousal center activity in the hypothalamus and other arousal areas to interfere with SWA, but not to the exclusion of SD-DEG repression resulting from a repression of MEF2c-mediated sleep gene expression.
The critique by reviewer 1 raises a number of important technical issues with this study. A key, potentially critical issue raised by reviewer 1, is that of our method of experimental sleep deprivation (ESD). The reviewer suggests that “…neuronal activity/induction of plasticity”, peculiar to the ESD methodology employed in this study, “…rather than sleep/wake states are responsible for the observed results…”.
In this study, a slow-moving treadmill (SMTM; 0.1km/hour, as stated in the methods), requiring locomotion to avoid bumping into the backwall of a false bottomed plexiglass cage was used to induce ESD. A mouse, in its home cage, typically moves much faster than 0.1km/hour and the mouse is able to eat and drink freely while in the cage (see file: video 1). Furthermore, our observations using a beam-break cage, indicate that mice spontaneously travel for comparable to longer distances over 6 hours than the treadmill moves (during the ESD of 6 hours). Finally, our EEG recordings of mice on the active treadmill show 100% waking while it is on (Bjorness et al., 2009), whereas prevention of NREM sleep (including transition time) using the “gentle handling” (GH) technique occurs depending on the diligence of the experimenter.
The accommodation (one week prior to ESD) included exposure to the treadmill-on for 30minutes ~ZT=2 & ZT= 14 hours (now spelled out in the “Materials & Methods” section). Thus, the likelihood of motor learning seems vanishingly small.
As with all ESD methods, there must be some associated increase in sensory and motor neuronal activity to drive arousal and prevent transition to sleep. For example, the more widely employed GH method of ESD involves sensory stimulation (tactile and or auditory) of sufficient intensity to induce postural change from that associated with sleep to that associated with wake (often involving some locomotion). Like the SMTM, both sensory and motor systems are likely to be engaged. Unlike the SMTM method, the stimulation used in GH is variably-intermittent from mouse to mouse and from experimenter to experimenter as it is applied only when the experimenter judges the mouse to be falling asleep. . It can even be argued that the varied and unpredictable ways in which these interactions happen cause plastic changes with a higher likelihood than the constant slow motion of a treadmill – the mice know how to walk, after all. In other protocols, novel objects are introduced to the animals – those will certainly trigger plastic processes –something that is avoided using a slow-running treadmill to which the mouse has been accommodated, for sleep deprivation.
The changes induced by SMTM technique are reproducible and induce arousal by somatic stimulation of sufficient intensity to induce natural motor activity as with GH. All ESD methods induce motor activity and it is reasonable to speculate that induced, motor activity is essential for effective ESD for the prolonged durations (>4 hours in mice) that elicit high sleep need. Electrophysiological assessment of SD-evoked increases in mEPSC amplitude and frequency using GH-ESD (Liu et al., 2010) are similar in all respects to our observations of the response to SMTMESD (Bjorness et al., 2020). Further studies might directly address a comparison of SMTM-ESD to GH-ESD as suggested by reviewer 1 but are regrettably outside the scope and resources of our study.
The model presented in Figure 4C is consistent with the experimental findings with respect to the observed electrophysiological changes (including loss of silent synapses and increased AMPA/NMDA ratio after ESD of 6 hours) and altered gene expression that includes enrichment of SSC genes, many of which (7 candidates are listed) can affect both AMPA/NMDA ratio and silent synapses. No claim of mechanism linking the changed expression to altered AMPAR or NMDAR activity can be made at this point, even as to polarity of gene expression, related to electrophysiological outcome. Furthermore, some transcripts may involve receptor trafficking while others more directly affect activated receptor function. To help illustrate the complexity of interpreting gene up-regulation, consider the following hypothetical scenario. If a gene like upregulated Grin3a acts rapidly, it may facilitate reduction of NMDAR function (decreasing plasticity) during ESD, whereas upregulation of a gene like Kif17, if acting in a more delayed manner, might enhance NMDAR surface expression and activity (increasing silent synapses) in response to ESD, during recovery sleep. Relevant references, consistent with these various outcomes are supplied in the manuscript but further investigation is clearly needed, or as reviewer 2 so aptly commented, this work “…provides a framework to stimulate further research and advances on the molecular basis of sleep function”.
Several issues are raised by reviewer 1 concerning the electrophysiological methodology and statistical assessment. In regard to the former, we closely followed established protocols employed in the frontal neocortex (Myme et al., 2003). We did not include the details for series resistance monitoring. Series resistance values ranged between 8 and 15 MOhm and experiments with changes larger than 25% not used for further analyses. Thank you for bringing this oversight on our part, to our attention. This essential information, that is unfailingly gathered for all our whole cell recordings, is now added to the version of record.
The -90 mV holding potential was chosen according to precedent (Myme et al., 2003). It increases driving force and permits lower stimulus strength for the same response size – reducing the likelihood for polysynaptic responses. Experiments with multiple response peaks at -90 mV were not included in the analysis. The -90 mV holding potential also increases NMDA receptor Mg++ block resulting in a minimally contaminated AMPA response. This information is now added to our submitted version of record.
The statistical assessments shown in Table 1 refer to two sets of data measured from 3X2=6 different cohorts for each sleep condition (CS, SD, RS): 1) AMPA & NMDA EPSCs and 2) AMPA/NMDA FR ratios (FRR; now bolded in row 1, second tab, Table S1). As stated in the results section, “A two-way ANOVA analysis showed a significant interaction between AMPA matched to NMDA EPSC response for each neuron, and sleep condition (F (2, 21) = 7.268, p<0.004; Figure 1 A, C, E). When considered independently, neither the effect of sleep condition nor of EPSC subtype reached significance at p<0.05 (Figure 1 C)”.
As noted by reviewer 1, we inadvertently dropped one of the data points from the RS FR and FR ratio (FRR) statistical analysis (raw data in the third tab of Table S1, statistical data in fourth and fifth tab and illustrated in figure 1 F). Thanks to this appreciated, rigorous review, we can correct the oversight (using raw data unchanged in Table S1, third tab). The Table S1 and figure 1 F are now corrected for the version of record. For better clarity, we now use two tabs, the fourth and fifth tabs, respectively of Table S1, for separate stat analyses of FR and FRR data.
The significance of the AMPA/NMDA FRR across sleep conditions was assessed with the KruskalWallis test, a non-parametric method. The two-stage linear step-up procedure of Benjamini, Krieger, and Yekutieli (BKY) was used to control for the FDR across multiple sleep conditions, in the non-parametric Kruskal-Wallis test but it is usually less powerful than tests presuming normal distributions like the one-way ANOVA and Holm-Sidak’s test. We have now added re-analyzed FRR across CS, SD and RS conditions using a normal one-way ANOVA (Table S1, tab5). The results now read, “The difference between sleep conditions and FRR is significant (F (2, 19) = 11.3, Table S1, tab5). Multiple comparisons (Holm-Sidak, Table S1, tab5) indicate the near absence of silent synapses was reversed by either CS or RS (SD/CS; p<0.0011 and SD/RS: p<0.0006; Table S1, tab 5; Figure 1 F).”. These analyses compare well to the non-parametric assessment using the KruskalWallis test (significant at p= 0.0006) with BYK correction for multiple comparison analysis to give for CS-SD, p<= 0.0262 and for RS-SD, p<= 0.0006 (statistics also shown in Table S1, tab5). [Also shown in tab5 is the “standard approach of correcting for family wise error rate”, namely, Dunn’s test. It is more conservative but less powerful than the BYK correction- in general the tradeoff of greater power/ less conservative is better tolerated when many comparisons are made, however, it can be argued that in the present analysis type 2 errors are also potentially misleading and thus not well tolerated.] The modifications of our statistical analyses, inspired by reviewer 1, did not affect the interpretation of the data nor the conclusions.
Bjorness TE, Kelly CL, Gao T, Poffenberger V, Greene RW (2009) Control and function of the homeostatic sleep response by adenosine A1 receptors. The Journal of neuroscience : the official journal of the Society for Neuroscience 29:1267-1276.
Bjorness TE, Dale N, Mettlach G, Sonneborn A, Sahin B, Fienberg AA, Yanagisawa M, Bibb JA, Greene RW (2016) An Adenosine-Mediated Glial-Neuronal Circuit for
Homeostatic Sleep. The Journal of neuroscience : the official journal of the Society for Neuroscience 36:3709-3721.
Bjorness TE, Kulkarni A, Rybalchenko V, Suzuki A, Bridges C, Harrington AJ, Cowan CW, Takahashi JS, Konopka G, Greene RW (2020) An essential role for MEF2C in the cortical response to loss of sleep in mice. Elife 9.
Kim SJ et al. (2022) Kinase signalling in excitatory neurons regulates sleep quantity and depth. Nature 612:512-518.
Li B, Ma C, Huang YA, Ding X, Silverman D, Chen C, Darmohray D, Lu L, Liu S, Montaldo G, Urban A, Dan Y (2023) Circuit mechanism for suppression of frontal cortical ignition during NREM sleep. Cell 186:5739-5750 e5717.
Liu ZW, Faraguna U, Cirelli C, Tononi G, Gao XB (2010) Direct evidence for wake-related increases and sleep-related decreases in synaptic strength in rodent cortex. The Journal of neuroscience : the official journal of the Society for Neuroscience 30:8671-8675.
Myme CI, Sugino K, Turrigiano GG, Nelson SB (2003) The NMDA-to-AMPA ratio at synapses onto layer 2/3 pyramidal neurons is conserved across prefrontal and visual cortices. Journal of neurophysiology 90:771-779.
Porkka-Heiskanen T, Strecker RE, Thakkar M, Bjorkum AA, Greene RW, McCarley RW (1997) Adenosine: a mediator of the sleep-inducing effects of prolonged wakefulness. Science 276:1265-1268.
Portas CM, Thakkar M, Rainnie DG, Greene RW, McCarley RW (1997) Role of adenosine in behavioral state modulation: a microdialysis study in the freely moving cat. Neuroscience 79:225-235.
Rainnie DG, Grunze HC, McCarley RW, Greene RW (1994) Adenosine inhibition of mesopontine cholinergic neurons: implications for EEG arousal. Science 263:689692.
-
eLife Assessment
This important study showing that sleep deprivation increases functional synapses while depleting silent synapses supports previous findings that excitatory signaling increases during wakefulness. This manuscript focuses in particular on AMPA/NMDA ratios. An interesting, although speculative, aspect of the manuscript is the inclusion of a model for the accumulation of sleep need that is based upon the MEF2C transcription factor but also links to the sleep-regulating SIK3-HDAC4/5 pathway. The authors have clarified some questions raised in the previous review, but the evidence for major claims was still found to be incomplete, requiring additional experimentation.
-
Reviewer #1 (Public review):
Summary:
This manuscript by Vogt et al examines how the synaptic composition of AMPA and NMDA receptors changes over sleep and wake states. The authors perform whole-cell patch clamp recordings to quantify changes in silent synapse number across conditions of spontaneous sleep, sleep deprivation, and recovery sleep after deprivation. They also perform single nucleus RNAseq to identify transcriptional changes related to AMPA/NMDA receptor composition following spontaneous sleep and sleep deprivation. The findings of this study are consistent with a decrease in silent synapse number during wakefulness and an increase during sleep. However, these changes cannot be conclusively linked to sleep/wake states. Measurements were performed in motor cortex, and sleep deprivation was achieved by forced locomotion, raising the possibility that recent patterns of neuronal activity, rather than sleep/wake states, are responsible for the observed results.
Strengths:
This study examines an important question. Glutamatergic synaptic transmission has been a focus of studies in the sleep field, but AMPA receptor function has been the primary target of these studies. Silent synapses, which contain NMDA receptors but lack AMPA receptors, have important functional consequences for the brain. Exploring the role of sleep in regulating silent synapse number is important to understanding the role of sleep in brain function. The electrophysiological approach of measuring the failure rate ratio, supported by AMPA/NMDA ratio measurements, is a rigorous tool to evaluate silent synapse number.
The authors also perform snRNAseq to identify genes differentially expressed in the spontaneous sleep and sleep deprivation groups. This analysis reveals an intriguing pattern of upregulated genes controlled by HDAC4 and Mef2c, along with synaptic shaping component genes and genes associated with autism spectrum disorder, across cell types in the sleep deprivation group. This unbiased approach identifies candidate genes for follow-up studies. The finding that ASD-risk genes are differentially expressed during SD also raises the intriguing possibility that normal sleep function is disrupted in ASD.
Weaknesses:
A major consideration to the interpretation of this study is the use of forced locomotion for sleep deprivation. Measurements are made from motor cortex, and therefore the effects observed could be due to differences in motor activity patterns across groups, rather than lack of sleep per se. Considering that other groups have failed to find a difference in AMPA/NMDA ratio in mice with different spontaneous sleep/wake histories (Bridi et al., Neuron 2020), confirmation of these findings in a different brain region would greatly strengthen the study.
The electrophysiological measurements and statistical analyses raise several questions. Input resistance (cutoffs and actual values) are not provided, making it difficult to assess recording quality. Parametric one-way ANOVAs were used, although the data do not appear to be normally distributed. In addition, for the AMPA/NMDA and FRR measurements (Figures 1E, F), the SD group (rather than the control sleep group) was used as the control group for post-hoc comparisons, but it is unclear why. While the data appear in line with the authors' conclusions, the number of mice (3/group) and cells recorded is low, and adding more would better account for inter-animal variability and increase the robustness of the findings.
The snRNAseq data are intriguing. However, several genes relevant to the AMPA/NMDA ratio are mentioned, but the encoded proteins would be expected to have variable effects on AMPA/NMDA receptor trafficking and function, making the model presented in Figure 4C oversimplified. A more thorough discussion of the candidate genes and pathways that are upregulated during sleep deprivation, the spatiotemporal/posttranslational control of protein expression, and their effects on AMPA/NMDA trafficking vs function is warranted.
-
Reviewer #2 (Public review):
Summary:
Here Vogt et al., provide new insights into the need for sleep and the molecular and physiological response to sleep loss. The authors expand on their previously published work (Bjorness et al., 2020) and draw from recent advances in the field to propose a neuron-centric molecular model for the accumulation and resolution of sleep need and basis of restorative sleep function. While speculative, the proposed model successfully links important observations in the field and provides a framework to stimulate further research and advances on the molecular basis of sleep function. In my review, I highlight the important advances of this current work, the clear merits of the proposed model, and indicate areas of the model that can serve to stimulate further investigation.
Strengths:
Reviewer comment on new data in Vogt et al., 2024<br /> Using classic slice electrophysiology, the authors conclude that wakefulness (sleep deprivation (SD)) drives a potentiation of excitatory glutamate synapses, mediated in large part by "un-silencing" of NMDAR-active synapses to AMPAR-active synapses. Using a modern single nuclear RNAseq approach the authors conclude that SD drives changes in gene expression primarily occurring in glutamatergic neurons. The two experiments combined highlight the accumulation and resolution of sleep need centered on the strength of excitatory synapses onto excitatory neurons. This view is entirely consistent with a large body of extant and emerging literature and provides important direction for future research.
Consistent with prior work, wakefulness/SD drives an LTP-type potentiation of excitatory synaptic strength on principle cortical neurons. It has been proposed that LTP associated with wake, leads to the accumulation of sleep need by increasing neuronal excitability, and by the "saturation" of LTP capacity. This saturation subsequently impairs the capacity for further ongoing learning. This new data provides a satisfying mechanism of this saturation phenomenon by introducing the concept of silent synapses. The new data show that in mice well rested, a substantial number of synapses are "silent", containing an NMDAR component but not AMPARs. Silent synapses provide a type of reservoir for learning in that activity can drive the un-silencing, increasing the number of functional synapses. SD depletes this reservoir of silent synapses to essentially zero, explaining how SD can exhaust learning capacity. Recovery sleep led to restoration of silent synapses, explaining how recovery sleep can renew learning capacity. In their prior work (Bjorness et al., 2020) this group showed that SD drives an increase in mEPSC frequency onto these same cortical neurons, but without a clear change in pre-synaptic release probability, implying a change in the number of functional synapses. This prediction is now born out in this new dataset.
The new snRNAseq dataset indicates the sleep need is primarily seen (at the transcriptional level) in excitatory neurons, consistent with a number of other studies. First, this conclusion is corroborated by an independent, contemporary snRNAseq analysis recently available as a pre-print (Ford et al., 2023 BioRxiv https://doi.org/10.1101/2023.11.28.569011). A recently published analysis on the effects of SD in drosophila imaged synapses in every brain region in a cell-type dependent manner (Weiss et al., PNAS 2024), concluding that SD drives brain wide increases in synaptic strength almost exclusively in excitatory neurons. Further, Kim et al., Nature 2022, heavily cited in this work, show that the newly described SIK3-HDAC4/5 pathway promotes sleep depth via excitatory neurons and not inhibitory neurons.
The new experiments provided in Fig1-3 are expertly conducted and presented. This reviewer has no comments of concern regarding the execution and conclusions of these experiments.
Reviewer comment on model in Vogt et al., 2024<br /> To the view of this reviewer the new model proposed by Vogt et al., is an important contribution. The model is not definitively supported by new data, and in this regard should be viewed as a perspective, providing mechanistic links between recent molecular advances, while still leaving areas that need to be addressed in future work. New snRNAseq analysis indicates SD drives expression of synaptic shaping components (SSCs) consistent with the excitatory synapse as a major target for the restorative basis of sleep function. SD induced gene expression is also enriched for autism spectrum disorder (ASD) risk genes. As pointed out by the authors, sleep problems are commonly reported in ASD, but the emphasis has been on sleep amount. This new analysis highlights the need to understand the impact on sleep's functional output (synapses) to fully understand the role of sleep problems in ASD.
Importantly, SD induced gene expression in excitatory neurons overlap with genes regulated by the transcription factor MEF2C and HDAC4/5 (Fig. 4). In their prior work, the authors show loss of MEF2C in excitatory neurons abolished the SD transcriptional response and the functional recovery of synapses from SD by recovery sleep. Recent advances identified HDAC4/5 as major regulators of sleep depth and duration (in excitatory neurons) downstream of the recently identified sleep promoting kinase SIK3. In Zhou et al., and Kim et al., Nature 2022, both groups propose a model whereby "sleep-need" signals from the synapse activate SIK3, which phosphorylates HDAC4/5, driving cytoplasmic targeting, allowing for the de-repression and transcriptional activation of "sleep genes". Prior work shows that HDAC4/5 are repressors of MEF2C. Therefore, the "sleep genes" derepressed by HDAC4/5 may be the same genes activated in response to SD by MEF2C. The new model thereby extends the signaling of sleep need at synapses (through SIK3-HDAC4/5) to the functional output of synaptic recovery by expression of synaptic/sleep genes by MEF2C. The model thereby links aspects of expression of sleep need with the resolution of sleep need by mediating sleep function: synapse renormalization.
Weaknesses:
Areas for further investigation.<br /> In the discussion section Vogt et al., explore the links between excitatory synapse strength, arguably the major target of "sleep function", and NREM slow-wave activity (SWA), the most established marker of sleep need. SIK3-HDAC4/5 have major effects on the "depth" of sleep by regulating NREM-SWA. The effects of MEF2C loss of function on NREM SWA activity are less obvious, but clearly impact the recovery of glutamatergic synapses from SD. The authors point out how adenosine signaling is well established as a mediator of SWA, but the links with adenosine and glutamatergic strength are far from clear. The mechanistic links between SIK3/HDAC4/5, adenosine signaling, and MEF2C, are far from understood. Therefore, the molecular/mechanistic links between a synaptic basis of sleep need and resolution with NREM-SWA activity require further investigation.
Additional work is also needed to understand the mechanistic links between SIK3-HDAC4/5 signaling and MEF2C activity. The authors point out that constitutively nuclear (cn) HDAC4/5 (acting as a repressor) will mimic MEF2C loss of function. This is reasonable, however, there are notable differences in the reported phenotypes of each. Notably, cnHDAC4/5 suppresses NREM amount and NREM SWA but had no effect on the NREM-SWA increase following SD (Zhou et al., Nature 2022). Loss of MEF2C in CaMKII neurons had no effect on NREM amount and suppressed the increase in NREM-SWA following SD (Bjorness et al., 2020). These instances indicate that cnHDAC4/5 and loss of MEF2C do not exactly match suggesting additional factors are relevant in these phenotypes. Likely HDAC4/5 have functionally important interactions with other transcription factors, and likewise for MEF2C, suggesting areas for future analysis.
One emerging theme may be that the SIK3-HDAC4/5 axis are major regulators of the sleep state, perhaps stabilizing the NREM state once the transition from wakefulness occurs. MEF2C is less involved in regulating sleep per se, and more involved in executing sleep function, by promoting restorative synaptic modifications to resolve sleep need.
Finally, advances in the roles of the respective SIK3-HDAC4/5 and MEF2C pathways point towards transcription of "sleep genes", as clearly indicated in the model of Fig.4. Clearly more work is needed to understand how the expression of such genes ultimately lead to resolution of sleep need by functional changes at synapses. What are these sleep genes and how do they mechanistically resolve sleep need? Thus, the current work provides a mechanistic framework to stimulate further advances in understanding the molecular basis for sleep need and the restorative basis of sleep function.
-
-
www.biorxiv.org www.biorxiv.org
-
eLife Assessment
This useful study sheds light on the species-specific nature of sperm-oocyte interactions by examining sperm binding and penetration of the zona pellucida across various mammalian species. While the evidence remains incomplete, the authors propose that two distinct mechanisms drive mammalian sperm-oocyte recognition and penetration: a specific, zona pellucida (ZP)-mediated mechanism, and a non-specific, oviductal glycoprotein 1 (OVGP1)-mediated mechanism. Upon revision, this study would offer insights to reproductive biologists, potentially improving porcine in vitro fertilization (IVF) - which is particularly susceptible to polyspermy - and enhancing sperm selection processes in human IVF, ultimately leading to better outcomes in assisted reproduction techniques.
-
Reviewer #1 (Public review):
Summary:
This very interesting manuscript first shows that human, murine, and feline sperm penetrate the zona pellucida (ZP) of bovine oocytes recovered directly from the ovary, although first cleavage rates are reduced (Figure 1A). Similarly, bovine sperm can penetrate superovulated murine oocytes recovered directly from the ovary (Figure 1B). However, bovine oocytes incubated with oviduct fluid (30 min) are generally impenetrable by human sperm (Figure 1C).
Thereafter, the cytoplasm was aspirated from murine oocytes - obtained from the ovary (Figure 1D) or oviduct (Figure 1D). Binding and penetration by bovine and human sperm were reduced in both groups relative to homologous (murine) sperm. However, heterologous (bovine and human) sperm penetration was further reduced in oviduct vs. ovary derived empty ZP. These compelling data show that outer (ZP) not inner (cytoplasmic) oocyte alterations reduce heterologous sperm penetration as well as homologous sperm binding.
This was repeated using empty bovine ZP incubated (Figure 2B), or not (Figure 2A) with bovine oviduct fluid. Prior oviduct fluid exposure reduced non-homologous (human and murine) empty ZP penetration, polyspermy, and sperm binding. This demonstrates that species-specific oviduct fluid factors regulate ZP penetrability.
To test the hypothesis that OVGP1 is responsible, the authors obtained his-tagged bovine and murine OVGP1 and DDK-tagged human OVGP1 proteins. Tagging was to enable purification following overexpression in BHK-21 or HEK293T cells. The authors confirm these recombinant OVGP1 proteins bound to both murine (Figure 3C) and bovine (Figure 3D) oocytes. Moreover, previous data using oviduct fluid (Figure 1D-E and 2A-B) was mirrored using bovine oocytes supplemented with homologous (bovine) recombinant OVGP1 (Figure 4B) or not (Figure 4A). This confirms the hypothesis, at least in cattle.
Next, the authors exposed bovine (Figure 6A) and murine (Figure 6B) empty ZP to bovine, murine, and human recombinant OVGP1, in addition to bovine, murine, or human sperm. Interestingly, both species-specific ZP and OVGP1 seem to be required for optimal sperm binding and penetration.
Lastly, empty bovine (Figures 7A-B) and murine (Figures 7C-D) ZP were treated with neuraminidase, or not, with or without pre-treatment with homologous OVGP1. In each case, neuraminidase reduced sperm binding and penetration. This further demonstrates that both ZP and OVGP1 are required for optimal sperm binding and penetration.
Strengths:
The authors convincingly demonstrate that two mechanisms underpin mammalian sperm recognition and penetration, the first being specific (ZP-mediated) and the second non-specific (OVGP1-mediated). This may prove useful for improving porcine in vitro fertilization (IVF), which is notoriously prone to polyspermy, in addition to human IVF, for better intrinsic individual sperm selection.
Weaknesses:
In my estimation, the following would improve this manuscript:
(1) The physiological relevance of these data could be better highlighted. For instance, future work could revolve around incubating oocytes with oviduct fluid (or OVGP1) to reduce polyspermy in porcine IVF, and naturally improve sperm selection in human IVF.
(2) Biological and technical replicate values for each experiment are unclear - for semen, oocytes, and oviduct fluid pools. I suggest providing in the Materials and Methods and/or Figure legends.
(3) Although differences presented in the bar charts seem obvious, providing statistical analyses would strengthen the manuscript.
(4) Results are presented as {plus minus} SEM (line 677); however, I believe standard deviation is more appropriate.
(5) Given the many independent experimental variables and combinations, a schematic depiction of the experimental design may benefit readers.
(6) Attention to detail can be improved in parts, as delineated in the "author recommendation" review section.
-
Reviewer #2 (Public review):
In the manuscript entitled "Oviductin sets the species-specificity of the mammalian zona pellucida." The study analyzes the species specificity of sperm-egg recognition by looking at sperm binding and penetration of zonae pellucidae from different mammalian species and find a role for the oviductal protein OVGP1 in determining species specificity.
Strengths:
By combining sperm, oocytes, zona pellucida (ZP), and oviductal fluid from different mammalian species, they elucidate the essential role of OVGP1 in conferring species-specific fertilization.
Weaknesses:
The authors postulate a role for oviductal fluid in species-specific fertilization, but in my opinion, they cannot rule out hormonal effects or differences in the method of oocyte maturation employed.
They also cannot unequivocally prove that OVGP1 is the oviductal protein involved in the effect. Additional experiments are necessary to rule out these alternative explanations.
When performing the EZPT assay on mouse oocytes obtained either from the ovary or from the oviduct, the oocytes obtained from the ovary came from mice primed with eCG, whereas the ones collected from the oviduct were obtained from superovulated mice (eCG plus hCG). This difference in the hormonal environment may make a difference in the properties of the ZP. Additionally, the ones obtained from the ovary were in vitro matured, which is also different from the freshly ovulated eggs and, again, may change the properties of the ZP. I suggest doing this experiment superovulating both groups of mice but collecting the fully matured MII eggs from the ovary before they get ovulated. In that way the hormonal environment will be the same in both groups and in both groups, oocytes will be matured in vivo. Hence, the only difference will be the exposure to oviductal fluids.
Mice with OVGP1 deletion are viable and fertile. It would be quite interesting to investigate the species-specificity of sperm-ZP binding in this model. That would indicate whether OVGP1 is the only glycoprotein involved in determining species-specificity. Alternatively, the authors could immunodeplete OVGP1 from oviductal fluid and then ascertain whether this depleted fluid retains the ability to impede cross-species fertilization.
What is the concentration of OVGP1 in the oviduct? How did the authors decide what concentration of protein to use in the experiments where they exposed ZPs to purified OVGP1? Why did they use this experimental design to check the structure of the ZP by SEM? Why not do it on oocytes exposed to oviductal fluid, which would be more physiological?
None of the figures show any statistical analysis. Please perform analysis for all the data presented, include p values, and indicate which statistical tests were performed. The Statistical analysis section in the Methods indicating that repeated measures ANOVA was used must refer to the tables. Was normality tested? I doubt all the data are normally distributed, in which case using ANOVA is not appropriate.
Why was OVGP1 selected as the probable culprit of the species specificity? In the Results section entitled "Homology of bovine, human and murine OVGP1 proteins..." the authors delve into the possible role of this protein without any rationale for investigating it. What about other oviductal proteins?
-
Reviewer #3 (Public review):
Summary:
The present study reports findings from a series of experiments suggesting that bovine oviductal fluid and species-specific oviductal glycoprotein (OVGP1 or oviductin) from bovine, murine, or human sources modulate the species specificity of bovine and murine oocytes.
Strengths:
The study reported in the manuscript deals with an important topic of interest in reproductive biology.
Weaknesses:
The manuscript began with a well-written introduction, but problems started to surface in the Results section, in the Discussion, as well as in the Materials and Methods. Major concerns include inconsistencies, misinterpretation of results, lacking up-to-date literature search, numerous errors found in the figure legends, misleading and incorrect information given in the Materials and Methods, missing information regarding statistical analysis, and inadequate discussion. These concerns raise questions regarding the authenticity of the study, reliability of the findings, and interpretation of the results. The manuscript does not provide solid and convincing findings to support the conclusion.
-
Author response
We appreciate the positive comments and constructive suggestions from the editors and reviewers, which will help us improve our manuscript. We will implement the changes as requested by the reviewers, focusing primarily on revising and clarifying the following aspects:
First, we will clarify the use of biological and technical replicates in each experiment and provide more details about the statistical analyses conducted. Additionally, we plan to include a schematic representation of the experimental design.
Second, we will explain the experiment conducted to rule out hormonal effects or differences in the oocyte maturation method used. We will also indicate the concentration of OVGP1 in the oviduct and explain why we selected OVGP1 as the probable cause of species specificity.
Third, by addressing all of the reviewers' suggestions, we aim to resolve any concerns, inconsistencies, or minor errors identified by the reviewers.
We are committed to addressing all the issues raised by the reviewers and believe that the manuscript will greatly benefit from the insightful suggestions and invaluable contributions of the editors and reviewers.
-
-
www.biorxiv.org www.biorxiv.org
-
eLife Assessment
This useful study shows how genetic variation is associated with fecundity following a period of reproductive diapause in female Drosophila. The work identifies the olfactory system as central to successful diapause with associated changes in longevity and fecundity. While the methods used are solid, a limitation of the study, as of any other laboratory-based investigation is the challenge of demonstrating how well measures for fitness related to diapause and its recovery correlates with realities encountered during development in the wild.
-
Reviewer #1 (Public Review):
Summary:
The paper begins with phenotyping the DGRP for post-diapause fecundity, which is used to map genes and variants associated with fecundity. There are overlaps with genes mapped in other studies and also functional enrichment of pathways including most surprisingly neuronal pathways. This somewhat explains the strong overlap with traits such as olfactory behaviors and circadian rhythm. The authors then go on to test genes by knocking them down effectively at 10 degrees. Two genes, Dip-gamma and sbb are identified as significantly associated with post-diapause fecundity, which they also find the effects to be specific to neurons. They further show that the neurons in the antenna but not arista are required for the effects of Dip-gamma and sbb. They show that removing antenna has a diapause specific lifespan extending effect, which is quite interesting. Finally, ionotropic receptor neurons are shown to be required for the diapause associated effects.
Strengths:
Overall I find the experiments rigorously done and interpretations sound. I have no further suggestions except an ANOVA to estimate heritability of the post-diapause fecundity trait, which is routinely done in the DGRP and offers a global parameter regarding how reliable phenotyping is. A minor point is I cannot find how many DGRP lines are used.
Weaknesses:
None noted.
-
Reviewer #2 (Public Review):
Summary
In this study, Easwaran and Montell investigated the molecular, cellular, and genetic basis of adult reproductive diapause in Drosophila using the Drosophila Genetic Reference Panel (DGRP). Their GWAS revealed genes associated with variation in post-diapause fecundity across the DGRP and performed RNAi screens on these candidate genes. They also analyzed the functional implications of these genes, highlighting the role of genes involved in neural and germline development. In addition, in conjunction with other GWAS results, they noted the importance of the olfactory system within the nervous system, which was supported by genetic experiments. Overall, their solid research uncovered new aspects of adult diapause regulation and provided a useful reference for future studies in this field.
Strengths:
The authors used whole-genome sequenced DGRP to identify genes and regulatory mechanisms involved in adult diapause. The first Drosophila GWAS of diapause successfully uncovered many QTL underlying post-diapause fecundity variations across DGRP lines. Gene network analysis and comparative GWAS led them to reveal a key role for the olfactory system in diapause lifespan extension and post-diapause fecundity.
Comments on revised version:
While the authors have addressed many of the minor concerns raised by the reviewers, they have not fully resolved some of the key criticisms. Notably, two reviewers highlighted significant concerns regarding the phenotype and assay of post-diapause fecundity, which are critical to the study. The authors acknowledged that this assay could be confounded by the 'cold temperature endurance phenotype,' potentially altering the interpretation of their results. However, they responded by stating that it is not obvious how to separate these effects experimentally. This leaves the analysis in this research ambiguous, as also noted by Reviewer #3.
Additionally, I raised concerns about the validity of prioritizing genes with multiple associated variants. Although the authors agreed with this point, they did not revise the manuscript accordingly. The statement that 'Genes with multiple SNPs are good candidates for influencing diapause traits' is not a valid argument within the context of population and quantitative genetics.
In summary, the authors have not fully utilized the peer-review process to address the critical weaknesses identified, which ultimately leaves the quality of their work in question.
-
Author response:
The following is the authors’ response to the original reviews.
Public Reviews:
Reviewer #1 (Public Review):
Summary:
The paper begins with phenotyping the DGRP for post-diapause fecundity, which is used to map genes and variants associated with fecundity. There are overlaps with genes mapped in other studies and also functional enrichment of pathways including most surprisingly neuronal pathways. This somewhat explains the strong overlap with traits such as olfactory behaviors and circadian rhythm. The authors then go on to test genes by knocking them down effectively at 10 degrees. Two genes, Dip-gamma and sbb, are identified as significantly associated with post-diapause fecundity, and they also find the effects to be specific to neurons. They further show that the neurons in the antenna but not the arista are required for the effects of Dip-gamma and sbb. They show that removing the antenna has a diapause-specific lifespan-extending effect, which is quite interesting. Finally, ionotropic receptor neurons are shown to be required for the diapause-associated effects.
Strengths and Weaknesses:
Overall I find the experiments rigorously done and interpretations sound. I have no further suggestions except an ANOVA to estimate the heritability of the post-diapause fecundity trait, which is routinely done in the DGRP and offers a global parameter regarding how reliable phenotyping is. A minor point is I cannot find how many DGRP lines are used.
Thank you for the suggestions. We screened 193 lines and we will add that information to the methods. Additionally, we will add the heritability estimate of the post-diapause fecundity trait.
Reviewer #2 (Public Review):
Summary
In this study, Easwaran and Montell investigated the molecular, cellular, and genetic basis of adult reproductive diapause in Drosophila using the Drosophila Genetic Reference Panel (DGRP). Their GWAS revealed genes associated with variation in post-diapause fecundity across the DGRP and performed RNAi screens on these candidate genes. They also analyzed the functional implications of these genes, highlighting the role of genes involved in neural and germline development. In addition, in conjunction with other GWAS results, they noted the importance of the olfactory system within the nervous system, which was supported by genetic experiments. Overall, their solid research uncovered new aspects of adult diapause regulation and provided a useful reference for future studies in this field.
Strengths:
The authors used whole-genome sequenced DGRP to identify genes and regulatory mechanisms involved in adult diapause. The first Drosophila GWAS of diapause successfully uncovered many QTL underlying post-diapause fecundity variations across DGRP lines. Gene network analysis and comparative GWAS led them to reveal a key role for the olfactory system in diapause lifespan extension and post-diapause fecundity.
Weaknesses:
(1) I suspect that there may be variation in survivorship after long-term exposure to cold conditions (10ºC, 35 days), which could also be quantified and mapped using genome-wide association studies (GWAS). Since blocking Ir21a neuronal transmission prevented flies from exiting diapause, it is possible that natural genetic variation could have a similar effect, influencing the success rate of exiting diapause and post-diapause mortality. If there is variation in this trait, could it affect post-diapause fecundity? I am concerned that this could be a confounding factor in the analysis of post-diapause fecundity. However, I also believe that understanding phenotypic variation in this trait itself could be significant in regulating adult diapause.
We agree that it is possible that the ability to endure cool temperatures per se may influence post-diapause fecundity. However, cool temperature is the essential diapause-inducing condition in Drosophila, so it is not obvious how to separate those effects experimentally, and we agree that phenotypic variation in the cool-sensitivity trait itself could be significant in regulating diapause.
(2) On p.10, the authors conclude that "Dip-𝛾 and sbb are required in neurons for successful diapause, consistent with the enrichment of this gene class in the diapause GWAS." While I acknowledge that the results support their neuronal functions, I remain unconvinced that these genes are required for "successful diapause". According to the RNAi scheme (Figure 4I), Dip-γ and sbb are downregulated only during the post-diapause period, but still show a significant effect, comparable to that seen in the nSyb Gal4 RNAi lines (Figure 4K).
Our definition of successful diapause is the ability to produce viable adult progeny post-diapause, which requires that the flies enter, maintain, and exit diapause, alive and fertile. We will restate our conclusion to say that Dip-γ and sbb are required for post-diapause fecundity.
In addition, two other RNAi lines (SH330386, 80461) that did not show lethality did not affect post-diapause fecundity.
We interpret those results to mean that those RNAi lines were not effective since Dip-γ and sbb are known to be essential.
Notably, RNAi (27049, KK104056) substantially reduced non-diapause fecundity, suggesting impairment of these genes affects fecundity in general regardless of diapause experience. Therefore, the reduced post-diapause fecundity observed may be a result of this broader effect on fecundity, particularly in a more "sensitized" state during the post-diapause period, rather than a direct regulation of adult diapause by these genes.
Ubiquitous expression of RNAi lines #27049 or #KK104056 was lethal, so we included the tubGAL80ts repressor to prevent RNAi from taking effect during development. Flies had to be shifted to 30 °C to inactivate the repressor and thereby activate the RNAi. At 30 °C, fecundity of the controls (GFP RNAi lines #9331, KK60102) were also lower (average non-diapause fecundity = 12 and 19 respectively) and similar to #27049 or #KK104056. We also assessed the knockdown using Repo GAL4 and nSyb GAL4 and did not find a significant difference/decline in the non diapause fecundity for #27049 and #KK104056 as compared to a nonspecific RNAi control (#54037).
(3) The authors characterized 546 genetic variants and 291 genes associated with phenotypic variation across DGRP lines but did not prioritize them by significance. They did prioritize candidate genes with multiple associated variants (p.9 "Genes with multiple SNPs are good candidates for influencing diapause traits."), but this is not a valid argument, likely due to a misunderstanding of LD among variants in the same gene. A gene with one highly significantly associated variant may be more likely to be the causal gene in a QTL than a gene with many weakly associated variants in LD. I recommend taking significance into account in the analysis.
We agree with the reviewer, and in Supplemental Table S3 we list top-associated SNPs in order from the lowest (most significant) p-value. Most of the top-associated genes from this analysis were uncharacterized CG numbers for which there were insufficient tools available for validation purposes. Nevertheless, there is overlap amongst the highly significant genes by p-value and those with multiple SNPs. Amongst the top 15 genes with multiple associated SNPs- CG18636 & CR15280 ranked 3rd by p-value, CG7759 ranked 4th, CG42732 ranked 10th, and Drip ranked 30th (all above the conservative Bonferroni threshold of 4.8e-8) while three Sbb-associated SNPs also appear in Table 3 above the standard e-5 threshold.
Reviewer #3 (Public Review):
Summary:
Drosophila melanogaster of North America overwinters in a state of reproductive diapause. The authors aimed to measure 'successful' D. melanogaster reproductive diapause and reveal loci that impact this quantitative trait. In practice, the authors quantified the number of eggs produced by a female after she exited 35 days of diapause. The authors claim that genes involved with olfaction in part contribute to some of the variation in this trait.
Strengths:
The work used the power platform of the fly DRGP/GWAS. The work tried to verify some of the candidate loci with targeted gene manipulations.
Weaknesses:
Some context is needed. Previous work from 2001 established that D. melanogaster reproductive diapause in the laboratory suspends adult aging but reduces post-diapause fecundity. The work from 2001 showed the extent fecundity is reduced is proportional to diapause duration. As well, the 2001 data showed short diapause periods used in the current submission reduce fecundity only in the first days following diapause termination; after this time fecundity is greater in the post-diapause females than in the non-diapause controls.
The 2001 paper by Tatar et al. reports the number of eggs laid after 3, 6, or 9 weeks in diapause conditions. Thus the diapause conditions used in this study (35 days or 5 weeks) are neither short nor long, rather intermediate. Does the reviewer have a specific concern?
In this context, the submission fails to offer a meaningful concept for what constitutes 'successful diapause'. There is no biological rationale or relationship to the known patterns of post-diapause fecundity. The phenotype is biologically ambiguous.
We have unambiguously defined successful diapause as the ability to produce viable adult progeny post-diapause. Other groups have measured % of flies that arrest ovarian development or % of post-diapause flies with mature eggs in the ovary, or # eggs laid post-diapause; however we suggest that # of viable adult progeny produced post-diapause is more meaningful than the other measurements from the point of view of perpetuating the species.
I have a serious concern about the antenna-removal design. These flies were placed on cool/short days two weeks after surgery. Adults at this time will not enter diapause, which must be induced soon after eclosion. Two-week-old adults will respond to cool temperatures by 'slowing down', but they will continue to age on a time scale of day-degrees. This is why the control group shows age-dependent mortality, which would not be seen in truly diapaused adults. Loss of antennae increases the age-dependent mortality of these cold adults, but this result does not reflect an impact on diapause.
We carried out the lifespan study under two different conditions. We either removed the antenna and moved the flies directly to 10 °C or we removed the antenna and allowed a “wound healing” period prior to moving the flies to 10 °C (out of concern that the flies might die quickly because wound healing may be impaired at 10 °C). In both cases, antenna removal shortened lifespan. Furthermore the lifespan extension at 10 °C was similar regardless of whether flies had experienced two weeks at 25 °C or not.
• Appraisal of whether the authors achieved their aims, and whether the results support their conclusions.
The work falls well short of its aim because the concept of 'successful diapause' is not biologically established. The paper studies post-diapause fecundity, and we don't know what that means. The loci identified in this analysis segregate for a minimally constructed phenotype. The results and conclusions are orthogonal.
It is unclear to us why the reviewer has such a negative opinion of measuring post-diapause fecundity, specifically the ability to produce viable progeny post-diapause. The value of this measurement seems obvious from the point of view of perpetuating the species.
• The likely impact of the work on the field, and the utility of the methods and data to the community.
The work will have little likely impact. Its phenotype and operational methods are weakly developed. It lacks insight based on the primary literature on post-diapause. The community of insect diapause investigators are not likely to use the data or conclusions to understand beneficial or pest insects, or the impact of a changing climate on how they over-winter.
The reviewer has not explained why his/her opinion is so negative.
Recommendations for the authors:
Reviewer #1 (Recommendations For The Authors):
(1) Perform an ANOVA to estimate heritability.
We will do this.
(2) List the number of DGRP lines tested.
193
Reviewer #2 (Recommendations For The Authors):
[Minor suggestions]
(1) Check Drosophila italics
We will do this.
(2) It would be informative to include the number of DGRP lines used in this study in the Results and Methods section.
We will include the information that we assessed 193 DGRP lines.
(3) Figure 1C - several dots are missing at the top of the line.
We will correct.
(4) Figures 1E, F - Why use a discontinuous histogram for continuous distribution? Consider using a continuous histogram (e.g. Lafuente et al. (2018) Figure 1C).
We will do this.
(5) Figure 1F - Why have fewer bins than panel E?
Figure 1F is normalized post-diapause fecundity. Individual post-diapause fecundity was normalized to the mean non-diapause fecundity. Then the normalized individual post-diapause fecundity was averaged to get the mean normalized post-diapause fecundity for the DGRP line. So the bins are different in panel E. Please refer to Supplemental Table S1.
(6) Figure 2D - It would be informative to have fold enrichment stats.
The following will be added in the methods section: The Gene Ontology (GO) categories and Q-values from the false discovery rate (FDR)-corrected hypergeometric test for enrichment are reported. Additionally, coverage ratios for the number of annotated genes in the displayed network versus the number of genes with that annotation in the genome are provided. GeneMANIA estimates Q-values using the Benjamini-Hochberg procedure.
(7) Supplementary table (Table S5) or supplemental table (other supplementary tables)? Need consistency (to Supplementary?)
We will change ‘Supplementary Table S5’ to ‘Supplemental Table S5’.
(8) Figure 5D,E - unused ticks on the x-axis.
The unused ticks on the x-axis will be removed from Figures 5D and E.
Reviewer #3 (Recommendations For The Authors):
• Suggestions for improved or additional experiments, data or analyses.
The authors cannot redo the GWAS with an alternative trait that might better reflect 'successful diapause', and I am not even sure what such a trait would involve or mean. Given this limitation, the authors should consider how they can conduct additional experiments to better define, justify, and elaborate how post-diapause reproduction relates to the mechanisms, processes, depth, and 'success' of diapause.
We agree that it is entirely unclear what trait would be a better measure of successful diapause. Other investigators might have chosen to measure something different but there is no reason why a different choice would be a better choice. We do not believe that this is a “limitation.” We believe that we have unambiguously defined and justified post-diapause reproduction as a measurement of successful diapause with respect to perpetuating the species through a stressful period.
• Recommendations for improving the writing and presentation.
The mechanics of the writing are fine, aside from some typos/grammar issues. But, the paper is conceptually superficial and tautological. It claims to provide a 'stringent criterion' for 'successful diapause', then measures an unjustified trait, then claims this demonstrates variation for 'successful diapause'.
We respectfully disagree with this opinion.
This story is conducted without reference to prior, primary literature or on the mechanisms of reproductive diapause. The presentation may be improved by considering the literature and precedence for what and how reproductive diapause is induced, maintained, and terminated ... in many insects as well as Drosophila
We will revisit our citations of the literature and apologize for any inadvertent omissions.
-
-
www.biorxiv.org www.biorxiv.org
-
eLife Assessment
This study presents a useful investigation of the use of small, de novo-designed protein binding domains (mini-binders) against the Spike protein of SARS-CoV-2 and EGFR, as ligand binding domains on two classes of synthetic receptors, second-generation synNotch (SNIPR) and CAR. The methods and evidence supporting the focused claims are solid. This work will be of interest to synthetic biologists and cell engineers as a starting point to map out the rules for receptor engineering based on mini-binders and ultimately to advance them in biomedical applications.
-
Reviewer #2 (Public review):
Summary:
Weinberg et al. show that spike LCB minibinders can be used as the extracellular domain for SynNotch, SNIPR, and CAR. They evaluated their designs against cells expressing the target proteins and live virus.
Strengths:
This is a good fundamental demonstration of alternative use of the minibinder. The results are unsurprising but robust and solid in most cases.
Weaknesses:
The manuscript can benefit from better descriptions of the study's novelty. Given that LCB previously worked in SynNotch, what unexpected finding was uncovered by this study? It is well known that the extracellular domain of CAR is amendable to different types of binding domains (e.g., scFv, nanobody, DARPin, natural ligands). So, it is not surprising that a minibinder also works with CAR. We don't know if the minibinders are more or less likely to be compatible with CAR or SNIPR.
The demonstrations are all done using just 1 minibinder. It is hard to conclude that minibinders, as a unique class of protein binders, are generalizable in different contexts. All it can conclude is that this specific Spike minibinder can be used in synNotch, SNIPR, and CAR. The LCB3 minibinder seems to be much weaker.
The sensing of live viruses is interesting, but the output is very weak. It is difficult to imagine a utility for such a weak response.
-
Author response:
The following is the authors’ response to the original reviews.
In our initial submission, reviewers highlighted that the major limitations of our study were related to both the number of minibinders tested as well as the number of optimizations we evaluated for improving minibinder function. In this revision, we have focused on expanding the minibinders tested. To do so, we selected two previously published minibinders against the epidermal growth factor receptor (EGFR). Selection of EGFR as a target enabled us to evaluate two minibinders that bind at different sites, unlike the previously evaluated binders LCB1 and LCB3 which both bind the same interface on SARS-CoV-2 Spike. Further, using EGFR as a target enabled us to qualitatively compare the efficacy of minibinder-coupled chimeric antigen receptors against an existing anti-EGFR CAR. We believe the results here demonstrate broader generalizability of our approach across binding sites, targets, and minibinders. We hope this addition is sufficient to convince future would-be users of these tools to attempt synthetic receptor engineering using minibinders against their protein of choice.
Reviewers made comments about the presentation of flow data and the use of statistics throughout the manuscript. We did not modify how flow data are presented as the density plots we used are common throughout the field. We have opted to not include statistics – we believe that in the case of most of the experiments we show, our findings are obvious. In cases where statistics would be helpful for discerning whether subtle effects are real – for example, comparing the linker-based optimizations or comparing the anti-EGFR CARs – we believe that other experimental factors like construct expression are sufficient confounds that even in the presence of statistically significant effects we would be leading readers astray to make such claims about our data. As such, we have sought to limit the claims we make and hope that reviewers and audience agree we do not over interpret our data without statistical support.
On more minor points, both reviewers addressed the differences in Figure 5A and 5C, which we addressed in our figure legend and in the previous response to reviews is the result of these data originating from different time points of the same assay. Reviewer #2 believed we should be more staid in our comments about linker optimality, which we have addressed by changing the referenced line in the discussion. Otherwise, we have made no modifications to figures or text beyond the addition of new data.
-
-
www.biorxiv.org www.biorxiv.org
-
eLife Assessment
The authors developed a method to allow a hypothermic agent, neurotensin, to cross the blood-brain barrier so it could potentially protect the brain from seizures and the adverse effects of seizures. The work is important because it is known that cooling the brain can protect it but developing a therapeutic approach based on that knowledge has not been done. The paper is well presented and the data are convincing.
-
Reviewer #1 (Public review):
In this manuscript, Ferhat and colleagues describe their study aimed at developing a blood brain barrier (BBB) penetrant agent that could induce hypothermia and provide neuroprotection from the sequelae of status epilepticus (SE) in mice. Hypothermia is used clinically in an attempt to reduce neurological sequelae of injury and disease. Hypothermia can be effective, but physical means used to reduce core body temperature is associated with untoward effects. Pharmacological means to induce hypothermia could be as effective with fewer untoward complications. Intracerebroventricularly applied neurotensin can cause hypothermia; however, neurotensin applied peripherally is degraded and does not cross the BBB. Here the authors develop and characterize a neurotensin conjugate that can reach the brain, induce hypothermia, and reduce seizures, cognitive changes, and inflammatory changes associated with status epilepticus.
Strengths:
(1) In general, the study is well reasoned, well designed, and seemingly well executed.<br /> (2) Strong dose-response assessment of multiple neurotensin conjugates in mice.<br /> (3) Solid assessment of binding affinity, in vitro stability ion blood, and brain uptake of the conjugate.<br /> (4) Appropriate inclusion of controls for SE and for drug injections.<br /> (5) Multifaceted assessment of neurodegeneration, inflammation, and mossy fiber sprouting in the different groups.<br /> (6) Inclusion of behavioral assessments.<br /> (7) Evaluate NSTR1 receptor distribution in multiple ways.<br /> (8) Demonstrate that this conjugate can induce hypothermia and have positive effects on the sequelae of SE. Could have great impact on the application of pharmacologically-induced hypothermia as a neuroprotective measure in patients.
Weaknesses:
(1) The data suggest that the neurotensin conjugate causes hypothermia AND has favorable effects on the sequelae of SE. There is a limitation that they do not definitely show that the hypothermia caused by the neurotensin conjugate is necessarily responsible for the effects they see. The authors recognize and discuss this limitation in the manuscript.
-
Reviewer #2 (Public review):
Summary:
The authors generated analogs consisting of modified neurotensin (NT) peptides capable of binding to low density lipoprotein (LDL) and NT receptors. Their lead analog was further evaluated for additional validation as a novel therapeutic. The putative mechanism of action for NT in its antiseizure activity is hypothermia, and as therapeutic hypothermia has been demonstrated in epilepsy, NT analogs may confer antiseizure activity and avoid the negative effects of induced hypothermia.
Strengths:
The authors demonstrate an innovative approach, i.e. using LDLR as a means of transport into the brain, that may extend to other compounds. They systematically validate their approach and its potential through binding, brain penetration, in vivo antiseizure efficacy, and neuroprotection studies.
-
Author response:
The following is the authors’ response to the previous reviews.
We addressed the issue of “tolerability” in our answers to Reviewer 2 and in the revised manuscript where we had added data concerning tolerability, see the paragraph in the Results Section, page 11:
"Finally, tolerability studies were performed with the administration of up to 20 and 40 mg/kg eq. NT (i.e. 25.8 and 51.6 mg/kg of VH-N412) with n=3 for these doses. The rectal temperature of the animals did not fall below 32.5 to 33.2°C, similar to the temperature induced with the 4 mg/kg eq. NT dose. We observed no mortality or notable clinical signs other than those associated with the rapid HT effect such as a decrease in locomotor activity. We thus report a very interesting therapeutic index since the maximal tolerated dose (MTD) was > 40 mg/kg eq. NT, while the maximum effect is observed at a 10x lower dose of 4 mg/kg eq. NT and an ED50 established at 0.69 mg/kg as shown in Figure 1G.”
We have slightly modified the paragraph above to emphasize that the tolerability studies were performed in “naïve mice”.
"Finally, tolerability studies were performed in naïve mice with the administration of up to 20 and 40 mg/kg eq. NT (i.e. 25.8 and 51.6 mg/kg of VH-N412) with n=3 for these doses. The rectal temperature of the animals did not fall below 32.5 to 33.2°C, similar to the temperature induced with the 4 mg/kg eq. NT dose. We observed no mortality or notable clinical signs other than those associated with the rapid HT effect such as a decrease in locomotor activity. We thus report a very interesting therapeutic index since the maximal tolerated dose (MTD) was > 40 mg/kg eq. NT, while the maximum effect is observed at a 10x lower dose of 4 mg/kg eq. NT and an ED50 established at 0.69 mg/kg as shown in Figure 1G.”
We propose to add a sentence in the Results section, page 11, relative to the fact that we can also induce severe hypothermia in rats using conjugates similar to VH-N412.
We also added in the Discussion section (page 38) that we could induce hypothermia with different conjugates in mice, rats and pigs.
-
-
www.biorxiv.org www.biorxiv.org
-
eLife Assessment
Fallah et al carefully dissect projections from substantia nigra pars reticulata (SNr) and the globus pallidus externa (GPe) – two key basal ganglia nuclei – to the pedunculopontine nucleus (PPN), a brainstem nucleus that has a central role in motor control. They consider inputs from these two areas onto 3 types of downstream PPN neurons – GABAergic, glutamatergic, and cholinergic neurons – and carefully map connectivity along the rostrocaudal axis of the PPN. Overall, this valuable study provided convincing data on PPN connectivity with two key input structures that will provide a basis for further understanding PPN function.
-
Reviewer #1 (Public review):
Summary:
Fallah and colleagues characterize the connectivity between two basal ganglia output nuclei, the SNr and GPe, and the pedunculopontine nucleus, a brainstem nucleus that is part of the mesencephalic locomotor region. Through a series of systematic electrophysiological studies, they find that these regions target and inhibit different populations of neurons, with anatomical organization. Overall, SNr projects to PPN and inhibits all major cell types, while the GPe inhibits glutamatergic and GABAergic PPN neurons, and preferentially in the caudal part of the nucleus. Optogenetic manipulation of these inputs had opposing effects on behavior - SNr terminals in the PPN drove place aversion, while GPe terminals drove place preference.
Strengths:
This work is a thorough and systematic characterization of a set of relatively understudied circuits. They build on the classic notions of basal ganglia connectivity and suggest a number of interesting future directions to dissect motor control and valence processing in brainstem systems.
Weaknesses:
Characterization of the behavioral effects of manipulations of these PPN input circuits could be further parsed, for a better understanding of the functional consequences of the connections demonstrated in the ephys analyses.
All the cell type recording studies showing subtle differences in the degree of inhibition and anatomical organization of that inhibition suggest a complex effect of general optogenetic manipulation of SNr or GPe terminals in the PPN. It will be important to determine if SNr or GPe inputs onto a particular cell type in PPN are more or less critical for how the locomotion and valence effects are demonstrated here.
-
Reviewer #2 (Public review):
Summary:
Fallah et al carefully dissect projections from SNr and GPe - two key basal ganglia nuclei - to the PPN, an important brainstem nucleus for motor control. They consider inputs from these two areas onto 3 types of downstream PPN neurons: GABAergic, glutamatergic, and cholinergic neurons. They also carefully map connectivity along the rostrocaudal axis of the PPN.
Strengths:
The slice electrophysiology work is technically well done and provides useful information for further studies of PPN. The optogenetics and behavioral studies are thought-provoking, showing that SNr and GPe projections to PPN play distinct roles in behavior.
Weaknesses:
Although the optogenetics and behavioral studies are intriguing, they are somewhat difficult to fit together into a specific model of circuit function. Perhaps the authors can work to solidify the connection between these two arms of the work. Otherwise, there are a few questions whose answers could add context to the interpretation of these results:
(1) Male and female mice are used, but the authors do not discuss any analysis of sex differences. If there are no sex differences, it is still useful to report data disaggregated by sex in addition to pooled data.
(2) There is some lack of clarity in the current manuscript on the ages used - 2-5 months vs "at least 7 weeks." Is 7 weeks the time of virus injection surgery, then recordings 3 weeks later (at least 10 weeks)? Please clarify if these ages apply equally to electrophysiological and behavioral studies. If the age range used for the test is large, it may be useful to analyze and report if there are age-related effects.
(3) Were any exclusion criteria applied, e.g. to account for missed injections?
(4) 28-34degC is a fairly wide range of temperatures for electrophysiological recording, which could affect kinetics.
(5) It would be good to report the number of mice used for each condition in addition to n=cells. Statistically, it would be preferable not to assume that each cell from the same mouse is an independent measurement and to use a nested ANOVA.
-
Reviewer #3 (Public review):
Summary:
The study by Fallah et al provides a thorough characterization of the effects of two basal ganglia output pathways on cholinergic, glutamatergic, and GABAergic neurons of the PPN. The authors first found that SNr projections spread over the entire PPN, whereas GPe projections are mostly concentrated in the caudal portion of the nucleus. Then the authors characterized the postsynaptic effects of optogenetically activating these basal ganglia inputs and identified the PPN's cell subtypes using genetically encoded fluorescent reporters. Activation of inputs from the SNr inhibited virtually all PPN neurons. Activation of inputs from the GPe predominantly inhibited glutamatergic neurons in the caudal PPN, and to a lesser extent GABAergic neurons. Finally, the authors tested the effects of activating these inputs on locomotor activity and place preference. SNr activation was found to increase locomotor activity and elicit avoidance of the optogenetic stimulation zone in a real-time place preference task. In contrast, GPe activation reduced locomotion and increased the time in the RTPP stimulation zone.
Strengths:
The evidence of functional connectivity of SNr and GPe neurons with cholinergic, glutamatergic, and GABAergic PPN neurons is solid and reveals a prominent influence of the SNr over the entire PPN output. In addition, the evidence of a GPe projection that preferentially innervates the caudal glutamatergic PPN is unexpected and highly relevant for basal ganglia function.
Opposing effects of two basal ganglia outputs on locomotion and valence through their connectivity with the PPN.
Overall, these results provide an unprecedented cell-type-specific characterization of the effects of basal ganglia inputs in the PPN and support the well-established notion of a close relationship between the PPN and the basal ganglia.
Weaknesses:
The behavioral experiments require further analysis as some motor effects could have been averaged out by analyzing long segments. Additional controls are needed to rule out a motor effect in the real-time place preference task. Importantly, the location of the stimulation is not reported even though this is critical to interpret the behavioral effects.
There are some concerns about the possible recruitment of dopamine neurons in the SNr experiments.
-
Author Response:
Reviewer #1 (Public review):
Summary:
Fallah and colleagues characterize the connectivity between two basal ganglia output nuclei, the SNr and GPe, and the pedunculopontine nucleus, a brainstem nucleus that is part of the mesencephalic locomotor region. Through a series of systematic electrophysiological studies, they find that these regions target and inhibit different populations of neurons, with anatomical organization. Overall, SNr projects to PPN and inhibits all major cell types, while the GPe inhibits glutamatergic and GABAergic PPN neurons, and preferentially in the caudal part of the nucleus. Optogenetic manipulation of these inputs had opposing effects on behavior - SNr terminals in the PPN drove place aversion, while GPe terminals drove place preference.
Strengths:
This work is a thorough and systematic characterization of a set of relatively understudied circuits. They build on the classic notions of basal ganglia connectivity and suggest a number of interesting future directions to dissect motor control and valence processing in brainstem systems.
We thank the reviewers for these positive comments.
Weaknesses:
Characterization of the behavioral effects of manipulations of these PPN input circuits could be further parsed, for a better understanding of the functional consequences of the connections demonstrated in the ephys analyses.
We will further analyze our behavioral data to reveal more nuanced functional effects.
All the cell type recording studies showing subtle differences in the degree of inhibition and anatomical organization of that inhibition suggest a complex effect of general optogenetic manipulation of SNr or GPe terminals in the PPN. It will be important to determine if SNr or GPe inputs onto a particular cell type in PPN are more or less critical for how the locomotion and valence effects are demonstrated here.
This is a really interesting future direction and we will expand on these points in the discussion.
Reviewer #2 (Public review):
Summary:
Fallah et al carefully dissect projections from SNr and GPe - two key basal ganglia nuclei - to the PPN, an important brainstem nucleus for motor control. They consider inputs from these two areas onto 3 types of downstream PPN neurons: GABAergic, glutamatergic, and cholinergic neurons. They also carefully map connectivity along the rostrocaudal axis of the PPN.
Strengths:
The slice electrophysiology work is technically well done and provides useful information for further studies of PPN. The optogenetics and behavioral studies are thought-provoking, showing that SNr and GPe projections to PPN play distinct roles in behavior.
We appreciate the reviewer’s positive evaluation.
Weaknesses:
Although the optogenetics and behavioral studies are intriguing, they are somewhat difficult to fit together into a specific model of circuit function. Perhaps the authors can work to solidify the connection between these two arms of the work.
We will expand on these topics in the discussion.
(1) Male and female mice are used, but the authors do not discuss any analysis of sex differences. If there are no sex differences, it is still useful to report data disaggregated by sex in addition to pooled data.
While we do not have sufficient n for a well-powered analysis of sex differences in behavior, we find that both male and female mice increase movement in response to SNr axon stimulation and decrease movement in response to GPe axon stimulation. We will expand on this further in the revised manuscript.
(2) There is some lack of clarity in the current manuscript on the ages used - 2-5 months vs "at least 7 weeks." Is 7 weeks the time of virus injection surgery, then recordings 3 weeks later (at least 10 weeks)? Please clarify if these ages apply equally to electrophysiological and behavioral studies. If the age range used for the test is large, it may be useful to analyze and report if there are age-related effects.
7 weeks is the youngest age at which mice used for electrophysiology were injected, and all were used for electrophysiology between 2-5 months. For behavior, the youngest mice used were 11 weeks old at time of behavior (8 weeks old at injection). Mice in the GPe-stimulated condition were 110 ± 7.4 SEM days old and mice in the SNr-stimulated condition 132 ± 23.4 SEM days old. We will add these details to the revised manuscript.
In addition, we have correlated distance traveled at baseline and during stimulation with age for both SNr and GPe stimulated conditions. Baseline distance traveled did not correlate with age, but there was a trend toward more movement during stimulation with older mice in the SNr axon stimulation group. We will discuss this in the revised manuscript.
(3) Were any exclusion criteria applied, e.g. to account for missed injections?
All injection sites and implant sites were within our range of acceptability, so we did not exclude any mice for missed injections.
(4) 28-34degC is a fairly wide range of temperatures for electrophysiological recording, which could affect kinetics.
This is an important consideration. We have checked our main measurement of current amplitude in the condition where we found significant differences between rostral and caudal PPN (SNr to Vglut2 PPN neurons) against temperature and found no correlation (Pearson’s r value = -0.0076). Similarly, we found no correlation between baseline (pre-opto) firing frequency and temperature (r = -0.068).
(5) It would be good to report the number of mice used for each condition in addition to n=cells. Statistically, it would be preferable not to assume that each cell from the same mouse is an independent measurement and to use a nested ANOVA.
For electrophysiology, the number of mice used in each experiment was 6 (3 male, 3 female). In the manuscript ‘N’ represents number of mice and ‘n’ represents number of cells. Because of the unpredictability of how many healthy cells can be recorded from one mouse, our data were planned to be collected with n=cells, and are underpowered for a nested ANOVA. However, rostral and caudal data were collected from the same mice. While we do not have sufficient paired data for each parameter, analyzing one of our main and most important findings with a paired comparison (with biological replicates being mice) shows a statistically significant difference in the inhibitory effect of SNr axon stimulation on firing rate between rostral and caudal glutamatergic neurons (p=0.031, Wilcoxon signed rank test).
Reviewer #3 (Public review):
Summary:
The study by Fallah et al provides a thorough characterization of the effects of two basal ganglia output pathways on cholinergic, glutamatergic, and GABAergic neurons of the PPN. The authors first found that SNr projections spread over the entire PPN, whereas GPe projections are mostly concentrated in the caudal portion of the nucleus. Then the authors characterized the postsynaptic effects of optogenetically activating these basal ganglia inputs and identified the PPN's cell subtypes using genetically encoded fluorescent reporters. Activation of inputs from the SNr inhibited virtually all PPN neurons. Activation of inputs from the GPe predominantly inhibited glutamatergic neurons in the caudal PPN, and to a lesser extent GABAergic neurons. Finally, the authors tested the effects of activating these inputs on locomotor activity and place preference. SNr activation was found to increase locomotor activity and elicit avoidance of the optogenetic stimulation zone in a real-time place preference task. In contrast, GPe activation reduced locomotion and increased the time in the RTPP stimulation zone.
Strengths:
The evidence of functional connectivity of SNr and GPe neurons with cholinergic, glutamatergic, and GABAergic PPN neurons is solid and reveals a prominent influence of the SNr over the entire PPN output. In addition, the evidence of a GPe projection that preferentially innervates the caudal glutamatergic PPN is unexpected and highly relevant for basal ganglia function.
Opposing effects of two basal ganglia outputs on locomotion and valence through their connectivity with the PPN.
Overall, these results provide an unprecedented cell-type-specific characterization of the effects of basal ganglia inputs in the PPN and support the well-established notion of a close relationship between the PPN and the basal ganglia.
We thank the reviewer for their positive comments.
Weaknesses:
The behavioral experiments require further analysis as some motor effects could have been averaged out by analyzing long segments.
We will further analyze our motor effects in the revised manuscript.
Additional controls are needed to rule out a motor effect in the real-time place preference task.
This is an important point. Our use of unilateral stimulation in the RTPP task reduces potential motor effects, and our supplemental videos show that the mice can easily escape and enter the stimulated zone. However, we can't completely rule out a motor component. To delve into this further, we analyzed mouse speed in the RTPP task. We find that in both SNr and GPe stimulation conditions, the maximum speed of the mouse is not different in the stimulated vs unstimulated zone. We will further analyze mouse speed at the transition into and out of the stimulated zone to identify any acute motor effects in this experiment.
Importantly, the location of the stimulation is not reported even though this is critical to interpret the behavioral effects.
The implant locations were generally over the middle-to-rostral PPN and we will clarify this in the revised manuscript. These locations are shown in figure 7B.
There are some concerns about the possible recruitment of dopamine neurons in the SNr experiments.
We are very interested in this possibility and plan to discuss this with more clarity in a revised manuscript.
-
-
www.biorxiv.org www.biorxiv.org
-
eLife Assessment
This useful manuscript reports on a new mouse model for LAMA2-MD, a rare but very severe congenital muscular dystrophy; the knockout mice were generated by removing exon3 in the Lama2 gene, which results in a frameshift in exon4 and a premature stop codon. These animals lack any laminin-alpha2 protein and confirm results from previous Lama2 knockout models. Additionally, this study includes transcriptomics data that might be a good resource for the field. However, the experimental evidence supporting the main claims of the manuscript is incomplete, citations of previous Lama2 null mice studies are lacking, and both data presentation and interpretation need improvement.
-
Reviewer #1 (Public review):
Strengths:
This work adds another mouse model for LAMA2-MD that re-iterates the phenotype of previously published models. Such as dy3K/dy3K; dy/dy and dyW/dyW mice. The phenotype is fully consistent with the data from others.
One of the major weaknesses of the manuscript initially submitted was the overinterpretation and the overstatements. The revised version is clearly improved as the authors toned-down their interpretation and now also cite the relevant literature of previous work.
Weaknesses:
Unfortunately, the data on RNA-seq and scRNA-seq are still rather weak. scRNA-seq was conducted with only one mouse resulting in only 8000 nuclei. I am not convinced that the data allow us to interpret them to the extent of the authors. Similar to the first version, the authors infer function by examining expression. Although they are a bit more cautious, they still argue that the BBB is not functional in dyH/dyH mice without showing leakiness. Such experiments can be done using dyes, such as Evans-blue or Cadaverin. Hence, I would suggest that they formulate the text still more carefully.
A similar lack of evidence is true for the suggested cobblestone-like lissencephaly of the mice. There is no strong evidence that this is indeed occurring in the mice (might also be a problem because mice die early). Hence, the conclusions need to be formulated in such a way that readers understand that these are interpretations and not facts.
Finally, I am surprised that the only improvement in the main figures is the Western blot for laminin-alpha2. The histology of skeletal muscle still looks rather poor. I do not know what the problems are but suggest that the authors try to make sections from fresh-frozen tissue. I anticipate that the mice were eventually perfused with PFA before muscles were isolated. This often results in the big gaps in the sections.
Overall, the work is improved but still would need additional experiments to make it really an important addition to the literature in the LAMA-MD field.
-
Reviewer #2 (Public review):
Summary:
This revised manuscript describes the production of a mouse model for LAMA2-Related Muscular Dystrophy. The authors investigate changes in transcripts within the brain and blood barrier. The authors also investigate changes in the transcriptome associated with the muscle cytoskeleton.
Strengths:
(1) The authors produced a mouse model of LAMA2-CMD using CRISPR-Cas9
(2) The authors identify cellular changes that disrupted the blood-brain barrier.
Weaknesses:
(1) The authors throughout the manuscript overstate "discoveries" which have been previously described, published and not appropriately cited.
(2) Alternations in the blood brain barrier and in the muscle cell cytoskeleton in LAMA2-CMD have been extensively studied and published in the literature and are not cited appropriately.
(3) The authors have increased animal number to N=6, but this is still insufficient based on Power analysis results in statistical errors and conclusions that may be incorrect.
(4) The use of "novel mouse model" in the manuscript overstates the impact of the study.
(5) All studies presented are descriptive and do not more to the field except for producing yet another mouse model of LAMA2-CMD and is the same as all the others produced.
(6) Grip strength measurements are considered error prone and do not give an accurate measurement of muscle strength, which is better achieved using ex vivo or in vivo muscle contractility studies.
(7) A lack of blinded studies as pointed out of the authors is a concern for the scientific rigor of the study.
-
Author response:
The following is the authors’ response to the original reviews.
Reviewer #1 (Public Review):
(1) Some of the figures are of rather poor quality. For example, the H&E and Sirius Red stainings in Figures 3 and 4 are quite poor so it is difficult to see what is going on in the muscles. The authors should take note of another publication on dy3K/dy3K mice of similar age (PMID: 31586140) where such images are of much higher quality. Similarly, the Western blot for laminin-alpha2 (Figure 4B) of the wild-type mouse needs improvement. If the single laminin-alpha2 protein is not detected, there is an issue with the denaturation buffer used to load the protein.
Thank you for the valuable suggestions. We have read the study on dy3K/dy3K mice of similar age (PMID: 31586140) which showed dystrophic changes in dy3K/dy3K muscle throughout the disease course with the whole muscle and representative muscle area. We have generated new figures with higher quality including the whole muscle and representative muscle area for the H&E and Sirius Red stainings. However, due to the large images, we have added them in the new Figure supplement 2 and Figure supplement 3. Also, we have changed the denaturation buffer used to load the protein, and performed Western blot of laminin α2, the result of the laminin α2 protein of the wild-type mice (n =3) and dyH/dyH mice (n =3) detected by Western blot has been showed in Figure 4B.
(2) My biggest concern is, however, the many overstatements in the manuscript and the over-interpretation of the data. This already starts with the first sentence in the abstract where the authors write: "Understanding the underlying pathogenesis of LAMA2- related muscular dystrophy (LAMA2-MD) have been hampered by lack of genuine mouse model." This is not correct as the dy3K/dy3K, generated in 1997 (PMID: 9326364), are also Lama2 knockout mice; there are also other strains (dyW/dyW mice) that are severely affected and there are the dy2J/dy2J mice that represent a milder form of LAMA2-MD. Similarly, the last two sentences of the abstract "This is the first reported genuine model simulating human LAMA2-MD. We can use it to study the molecular pathogenesis and develop effective therapies." are a clear overstatement. The mechanisms of the disease are well studied and the above-listed mouse models have been amply used to develop possible treatment options. The overinterpretation concerns the results from transcriptomics. The fact that Lama2 is expressed in particular cell types of the brain does not at all imply that Lama2 knockout mice have a defect in the blood-brain barrier as the authors state. If there are no functional data, this cannot be stated. Indications for a blood-brain barrier defect come from work in dy3K/dy3K mice (PMID: 25392494) and this needs to be written like this.
Thank you for your comment and sorry for the overstatements in the manuscript. We have carefully considered our previous statements and corrected them accordingly. We have changed the first sentence in the abstract into "Our understanding of the molecular pathogenesis of LAMA2-related muscular dystrophy (LAMA2-MD) requires improving". Also, we have changed the last two sentences in the abstract with "In summary, this study provided useful information for understanding the molecular pathogenesis of LAMA2-MD".
We also agree that "Lama2 is expressed in particular cell types of the brain does not at all imply that Lama2 knockout mice have a defect in the blood-brain barrier", and the indications for a blood-brain barrier defect come from work in dy3K/dy3K mice (PMID: 25392494). Therefore, we have corrected the overstatement according to the suggestion with "It was reported that the deficiency of laminin α2 in astrocytes and pericytes was associated with a defective blood-brain barrier (BBB) in the dy3K/dy3K mice (Menezes et al., 2014). The defective BBB presented with altered integrity and composition of the endothelial basal lamina, reduced pericyte coverage, and hypertrophic astrocytic endfeet lacking appropriately polarized aquaporin4 channels."
(3) Finally, the bulk RNA-seq data also needs to be presented in a disease context. The authors, again, mix up changes in expression with functional impairment. All gene expression changes are interpreted as direct evidence of an involvement of the cytoskeleton. In fact, changes in the cytoskeleton are more likely a consequence of the severe muscle phenotype and the delay in muscle development. This is particularly possible as muscle samples from 14-day-old mice are compared; a stage at which muscle still develops and grows tremendously. Thus, all the data need to be interpreted with caution.
Thank you for your comment. We have changed the over-interpretation of the bulk RNA-seq data, and have corrected the last sentence in the Result with "These observations important data for the impaired muscle cytoskeleton and abnormal muscle development which were associated with the muscle pathology consequence of severe dystrophic changes in the dyH/dyH mice.".
(4) In summary, the authors need to improve data presentation and, most importantly, they need to tone down the interpretation and they must be fully aware that their work is not as novel as they present it.
Thank you for your comments and valuable suggestions, and we have changed the previous overstatements and interpretation of the results. We are sorry that we failed to clearly present our rational of making this mouse model. Indeed, there were many existing mouse models, which were all important to the research in the field. One of the reasons why we wished to create dyH/dyH is to make a mouse model without any trace of engineering (e.g., inserted bacterial elements for knockout). By doing so, we were hoping to provide a novel model suited for gene-editing-based gene therapy development. To this end, dyH/dyH was created to reflect the hot mutation region in the Chinese population. Hopefully, you will agree with our points and see that we were not trying to belittle previous models but were simply trying to provide a different option. The overstatements were largely rooted from language barriers, and we have tried to make our statements more cautious and acceptable to the readers.
Reviewer #2 (Public Review):
(1) The major weakness is the manuscript reads like this was the first-ever knockout mouse model generated for LAMA2-CMD. There are in fact many Lama2 knockout mice (dy, dy2J, dy3k, dyW, and more) which have all been extensively studied with publications. It is important for the authors to comment on these other published studies that have generated these well-studied mouse lines. Therefore, there is a lack of background information on these other Lama2 null mice.
Thank you for your comment. We have added background information on these other Lama2 null mice with the sentences "The most common mouse models for LAMA2-MD are the dy/dy, dy3k/dy3k, dyw/dyw and dy2J/dy2J mice (Xu et al., 1994; Michelson et al., 1995; Miyagoe et al., 1997; Kuang et al., 1998; Sunada et al., 1995). Among them, the dy/dy, dy3k/dy3k, dyw/dyw mice present severe muscular dystrophy, and dy2J/dy2J mice show mild muscular dystrophy and peripheral neuropathy (Gawlik and Durbeej, 2020). The mutation of the dy/dy mice has been still unclear (Xu et al., 1994; Michelson et al., 1995). The dy3k/dy3k mice were generated by inserting a reverse Neo element in the 3' end of exon 4 of Lama2 gene in 1997 (Miyagoe et al., 1997), and the dyw/dyw mice were created with an insertion of lacZ-neo in the exon 1 of Lama2 gene in 1998 (Kuang et al., 1998). The dy2J/dy2J mice were generated in 1970 by a spontaneous splice donor site mutation which resulted in a predominant transcript with a 171 base in-frame deletion, leading to the expression of a truncated laminin α2 with a 57 amino acid deletion (residues 34-90) and a substitution of Gln91Glu (Sunada et al., 1995). They were established in the pre-gene therapy era, leaving trace of engineering, such as bacterial elements in the Lama2 gene locus, thus unsuitable for testing various gene therapy strategies. Moreover, insufficient transcriptomic data of the muscle and brain of LAMA2-CMD mouse models limits the understanding of disease hallmarks. Therefore, there is a need to create new appropriate mouse models for LAMA2-CMD based on human high frequently mutated region using the latest gene editing technology such as clustered regularly interspaced short palindromic repeats (CRISPR)-Cas9."
(2) The phenotypes of dyH/dyH are similar to, if not identical to dy/dy, dy2J/dy2J, dy3k/dy3k, dyW/dyW including muscle wasting, muscle weakness, compromised blood-brain barrier, and reduced life expectancy. This should be addressed, and a comparison made with Lama2 deficient mice in published literature.
Thank you for your comment. We have added Table supplement 3 to make a comparison between dyH/dyH with other Lama2 deficient mice. We aslo have added the statement in Discussin with "Compared with other Lama2 deficient mice including dy/dy, dy2J/dy2J, dy3k/dy3k and dyW/dyW, the phenotype of the dyH/dyH mice presented with a very severe muscular dystrophy, which was similar to that of the dy3k/dy3k mice (Table supplement 3)."
(3) Recent published studies (Chen et al., Development (2023), PMID 36960827) show loss of Itga7 causes disruption of the brain-vascular basal lamina leading to defects in the blood-brain barrier. This should be referenced in the manuscript since this integrin is a major Laminin-211/221 receptor in the brain and the mouse model appears to phenocopy the dyH/dyH mouse model.
Thank you for your great suggestion. We have cited the published studies (Chen et al., Development (2023), PMID 36960827) and added statements in Discussion with "As reported, the aberrant BBB function was also associated with the adhesion defect of alpha7 integrin subunit in astrocytes to laminins in the Itga_7-/- mice (_Chen et al., 2023). In this study, loss of communications involving the laminins’ pathway between laminin α2 and integrins were predicted between vascular and leptomeningeal fibroblasts and astrocytes in the dyH/dyH brain, providing more evidence for the impaired BBB due to laminin α2 deficiency."
Recommendations for the authors:
Reviewer #1 (Recommendations For The Authors):
(1) Improve the data presentation (as mentioned above). Make a new picture of the histology; repeat the Western blots. Discuss the RNA-seq data with more caution and present it in a more attractive way. Tone down the wording.
Thank you for your recommendations. We have revised the overstatements and improved the RNA-seq data interpretation as suggested. Also,we have made a new picture of the histology, and repeated the Western blots.
Reviewer #2 (Recommendations For The Authors)
(1) There are many grammatical errors within the manuscript. The manuscript should be carefully proofread.
Thank you for your recommendations. We have carefully corrected the grammatical errors within the manuscript.
(2) Figure 2: The animal numbers used in this analysis were not indicated. Please include this number in the figure legend.
Thank you for your recommendations. We have added animal numbers in the figure legends wherever applicable.
(3) Figure 2: The forelimb grip strength is informative but has limitations. Ex vivo or in vivo muscle contractility is the gold standard for measuring muscle strength.
Thank you for your recommendations. We do agree that the ex vivo or in vivo muscle contractility is the gold standard for measuring muscle strength, and we really want to finish this experiment. However, we feel sorry that this test has not been finished due to the following reasons: (1) The forelimb grip strength for measuring muscle strength is a classic method and remains a commonly used method for measuring mouse muscle strength in the studies of different muscular dystrophies, such as LAMA2-MD (Amelioration of muscle and nerve pathology of Lama2-related dystrophy by AAV9-laminin-αLN linker protein. JCI Insight. 2022;7(13):e158397. PMID: 35639486), Duchenne muscular dystrophy (Investigating the role of dystrophin isoform deficiency in motor function in Duchenne muscular dystrophy. J Cachexia Sarcopenia Muscle. 2022;13(2):1360-1372. PMID: 35083887), facioscapulohumeral muscular dystrophy (Systemic delivery of a DUX4-targeting antisense oligonucleotide to treat facioscapulohumeral muscular dystrophy. Mol Ther Nucleic Acids. 2021;26:813-827. PMID: 34729250), and etc. (2) The forelimb grip strength for measuring muscle strength is also used in the human studies (PMID: 32366821; PMID: 29313844; PMID: 34499663, and etc). In view of reasons above, for measuring muscle strength, we used the forelimb grip strength, and have not finished the supplementary experiment of ex vivo or in vivo muscle contractility.
(4) Figure 3: Muscle fibrosis should be measured with a hydroxyproline assay.
Thank you for your recommendations. We do agree that the hydroxyproline assay is one of the most classic method to evaluate collagen content for measuring muscle fibrosis. However, we performed Sirius Red staining for measuring muscle fibrosis due to the following reasons: (1) Muscle fibrosis measured by Sirius Red staining can be observed more directly, and the other pathological features also can be observed, and compared through muscle pathology. (2) Sirius Red staining is also a classic method and remains a commonly used method for measuring muscle fibrosis, which has been previously reported in the mouse studies of muscle disorders, such as PMID: 22522482 (Losartan, a therapeutic candidate in congenital muscular dystrophy: studies in the dy(2J) /dy(2J) mouse. Ann Neurol. 2012;71(5):699-708.), PMID: 34337906 (Aging-related hyperphosphatemia impairs myogenic differentiation and enhances fibrosis in skeletal muscle. J Cachexia Sarcopenia Muscle. 2021;12(5):1266-1279.), PMID: 28798156 (Phosphodiesterase 4 inhibitor and phosphodiesterase 5 inhibitor combination therapy has antifibrotic and anti-inflammatory effects in mdx mice with Duchenne muscular dystrophy. FASEB J. 2017;31(12):5307-5320.), and etc. Therefore, we used Sirius Red staining to measure muscle fibrosis in this study.
(5) Figure 8: The N=3 is very low which could result in type I or II statistical errors. A larger sample size will reduce the chance of statistical errors.
Thank you for your recommendations. We have increased the number of animals to reduce the chance of statistical errors. We have performed the supplementary experiment, the number of animals for each group has been increased to 6 (3 male and female each). The results were consistent with previous data in Figure 8.
(6) Power analysis to estimate experimental animal numbers should be reported in the manuscript.
Thank you for your recommendations. Refer to previous study (Power and sample size. Nature Methods. 2013;10:1139–1140), “The distributions show effect sizes d = 1, 1.5 and 2 for n = 3 and α = 0.05. Right, power as function of d at four different a values for n = 3”, and “If we average seven measurements (n = 7), we are able to detect a 10% increase in expression levels (μ_A = 11, _d = 1) 84% of the time with α = 0.05.”, the experimental animal numbers estimated were 3 to 7. Moreover, if the increased number of experimental animals could be available, we would retain data.
(7) It is unclear if the studies were performed with adequate rigor. Were those scoring outcome measures blinded to the treatment groups?
Thank you for your recommendations. We performed the studies with those scoring outcome measures not blinded to the treatment groups, the groups were based on their genotype. Actually, it was easy to discriminate the dyH/dyH groups from the WT/Het mice due to their small body shape.
(8) Authors should appropriately cite previous studies that have generated Lama2 null mice.
Thank you for your recommendations. We have cited previous studies that have generated Lama2 null mice with the sentence “The most common mouse models for LAMA2-MD are the dy/dy, dy3k/dy3k, dyw/dyw and dy2J/dy2J mice (Xu et al., 1994; Michelson et al., 1995; Miyagoe et al., 1997; Kuang et al., 1998; Sunada et al., 1995)”.
(9) The number of animals should be increased to reduce the chance of statistical error.
Thank you for your recommendations. We have performed the supplementary experiment, the number of animals for each group has been increased to reduce the chance of statistical error.
(10) A power analysis should be performed to determine the number of experimental animals.
Thank you for your recommendations. We have performed a power analysis to determine the number of experimental animals as mentioned above.
(11) There are many grammatical errors within the manuscript. The manuscript should be carefully proofread.
Thank you for your recommendations. We have carefully corrected the grammatical errors within the manuscript.
-
-
www.biorxiv.org www.biorxiv.org
-
eLife Assessment
This study makes an important contribution by characterizing the role of the exocyst in secretory granule exocytosis in the Drosophila larval salivary gland. The results are solid and lead to the novel interpretation that the exocyst participates not only in exocytosis, but also in earlier steps of secretory granule biogenesis and maturation. However, the authors are urged to provide additional proof that the exocyst subunit knockdowns were effective and to acknowledge the possibility that inactivation of an essential exocytosis component could indirectly affect other parts of the secretory pathway.
-
Reviewer #1 (Public review):
Suarez-Freire et al. analyzed here the function of the exocyst complex in the secretion of the glue proteins by the salivary glands of the Drosophila larva. This is a widely used, genetically accessible system in which the formation, maturation and precisely timed exocytosis of the glue secretory granules can be beautifully imaged. Using RNAi, the authors show that all units of the exocyst complex are required for exocytosis. They show that not just granule fusion with the plasma membrane is affected (canonical role), but also, with different penetrance, that glue protein is retained in the ER, secretory granules fail to fuse homotypically or fail to acquire maturation features. The authors document these phenotypes and postulate specific roles for the exocyst in these additional processes to explain them: exocyst as a Golgi-Golgi, Golgi-granule or granule-granule tether.
Compared to the initial submission, this revised version of the study presents strengthened evidence for these novel roles. In particular, authors show juxta-Golgi localization of exocyst components and disruption of the trans-Golgi compartment upon exocyst loss. Additionally, the revised study contains controls indicating that glue secretion defects prior to plasma membrane exocytosis are not due to polarity loss or unspecific poor health of cells.
-
Reviewer #2 (Public review):
The manuscript from Wappner and Melani labs claims a novel for the exocyst subunits in multiple aspects of secretory granule exocytosis. This an intriguing paper for it suggests multiple roles of the exocyst in granule maturation and fusion with roles at the ER/Golgi interface, TGN, granule homotypic fusion.
A key strength is the breadth of the assays and study of all 8 exocyst subunits in a powerful model system (fly larvae). But why do KD of different exocysts have different effects on presumed granule formation? Also it can be hard to disentangle direct vs. secondary effects, as much of the TGN seems to be altered in the KDs. The authors ascribe many of the results to the holocomplex, but there are major differences between the proteins -- this may be all related to the different levels of expression (as the authors propose), but only limited mRNA was examined.
Unresolved Comments:
(A) Explanation variability of exocyst KD on the appearance of MSG. What is remarkable is a highly variable effect of different subunit KD on the percentage of cells with MLS (Fig. 4C). Controls = 100 %, Exo70=~75% (at 19 deg), Sec3 = ~30%, Sec10 = 0%, Exo84 = 100% ... This is interesting for the functional exocyst is an octameric holocomples, thus why the huge subunit variability in the phenotypes? One explanation is that the levels of KD varied between the subunits. Another is that not all subunits have equivalent roles (as seen for instance in exocyst's roles in autophagy).
This should be addressed by quantification of the KD of the 8 different exocyst proteins (and or mRNA as only 2 subunits were studied). If their data holds up then the underlying mechanism here needs to be considered. (Note: there is some precedent from the autophagy field of differential exocyst effects).
(B) Golgi: It is unclear from their model (Fig. 5) why after exocyst KD of Sec15 the cis-Golgi is more preserved than the TGN, which appears as large vacuoles.
(C) Granule homotypic fusion. Over-expression of just one subunit, Sec15-GFP, made giant secretory granules (SG) that were over 8 microns big. Does it act like a seed to promote exocyst assembly as the authors propose? If so is there evidence that there is biochemically more holocomplex with expression of Sec15, but not other subunits?
(D) The authors should better frame their interpretations of other studies of the exocyst that includes role in autophagy, Palade body trafficking and differential roles of the subunits.
In summary, there clearly are striking new effects on secretory granule biogenesis by dysfunction of the exocyst which are important and should inspire other studies for new roles of the exocyst; e.g. in non cannonical roles. Secondly, the power of the system to partially deplete proteins (if further validated) suggests that one may need to consider protein expression as an important variable that can be used to unmask multiple phenotypes in granule maturation. Last this paper implies new roles of the exocyst in homotypic fusion, which could be investigated in future work.
-
Reviewer #3 (Public review):
Freire and co-authors examine the role of the exocyst complex during the formation and secretion of mucins from secretory granules in the larval salivary gland of Drosophila melanogaster. Using transgenic lines with a tagged Sgs3 mucin, the authors KD expression of exocyst subunit members and observe a defect in secretory granules with a heterogeneity of phenotypes. By carefully controlling RNAi expression using a Gal4-based system, the authors can KD exocyst subunit expression to varying degrees. The authors find that the stronger the inhibition of expression of the exocyst is, the earlier the defect is in the secretory pathway. The manuscript is well written, the model system is physiological, and the techniques are innovative.
In my initial review, my major concern was the pleiotropic effect of the loss of exocyst. The authors have responded to this point with clarity and have argued that the multiple localisations of exocyst during the Sgs3 synthesis programme indicate it is likely a direct phenotype. They also performed some analysis of PM lipids but did not detect a difference. I accept the arguments presented. However, I remain concerned that these are due to a pleiotropic effect. It is very hard to absolutely prove a direct effect, and due to the unusual claim and nature of the evidence (depletion levels), I think that there is still the possibility of this being an indirect effect. Perhaps it is just worth the authors writing a paragraph in the discussion, at least accepting the possibility that it is an indirect effect so future readers are aware of that.
-
Author response:
The following is the authors’ response to the original reviews.
Public Reviews:
Reviewer 1:
(1) General comment: The evidence for these highly novel, potentially interesting roles (of the exocyst) would need to be more compelling to support direct involvement.
We wish to thank the reviewer for his/her comments, and for considering that the proposed functions are highly novel and potentially interesting. To strengthen the evidence supporting the new roles of the exocyst, we have performed a number of additional experiments that are depicted in novel figures or figure panels of the new version of the manuscript. Particularly, we aimed at providing further support of the direct involvement of the exocyst in different steps of the regulated secretory pathway. Please see the details below.
(2) For instance, the localization of exocyst to Golgi or to granule-granule contact sites does not seem substantial.
We have performed quantitative colocalization studies, as suggested by the reviewer to further substantiate our initial findings. We have carefully analysed GFP-Sec15 distribution in relation to the Golgi complex and secretory Glue granules at relevant time points of salivary gland development. Overall, we found that GFP-Sec15 distribution is dynamic during salivary gland development. Before Glue synthesis (72 h AEL), Sec15 was observed in close association (defined as a distance equal to, or less than 0.6 µm) with the Golgi complex (please see below Author response image 1). This association was lost once Glue granules have begun to form (96 h AEL). Importantly, we do not see relevant association between GFP-Sec15 and the ER (please see Author response image 2). These observations support our conclusion that the exocyst plays a role at the Golgi complex. New images supporting these conclusions, as well as quantitative data, have been included in Figure 5 of the new version of the manuscript. In addition, real time imaging, as well as 3D reconstruction analyses, confirming the close association between Sec15 and Golgi cisternae are now included in the manuscript. Please see Supplementary Videos 1-3. These new data are described in the text lines 200-210 of the Results section and text lines 359368 of the Discussion section.
Interestingly, at the time when Sec15-Golgi association is lost (96 h AEL), Sec15 foci associate instead with newly formed secretory granules (< 1µm diameter). This association persists during secretory granule maturation (100-116 h AEL), when Sec15 foci localize specifically in between neighbouring, immature secretory granules. When maturation has ended and Glue granule exocytosis begins (116-120 h AEL), this localization between granules is lost. These observations are consistent with a role of the exocyst in homotypic fusion during SG maturation. We have included new images showing that association between Sec15 and secretory granules is dynamic and depends on the developmental stage. We have quantified this association both during maturation and at a stage when SGs are already mature. We have in addition performed a 3D reconstruction analysis of these images to confirm the close association between Sec15 and immature SGs. These new data are now depicted in Figure 7BC, Supplementary Videos 4-5, and described in text lines 216-221 of the Results section. In addition, a lower magnification image is provided below in this letter (Author response image 3), quantifying the proportion of Sec15 foci localized in between SGs (yellow arrows) relative to the total number of Sec15 foci (yellow arrows + green arrowheads).
Author response image 1.
Criteria utilized to define Sec15 focithat were“associated” or“not associated” withthe trans-Golgi network in the experiments of Figure 5C-E of the manuscript.When the distance between maximal intensities of GFP-Sec15 and Golgi-RFP signals was equal or less than 0.6 m, the signals were considered “associated” (upper panels). When the distance was more than 0.6 m, the signals were considered “not associated” (lower panels).
Author response image 2.
Criteria utilized to define Sec15 focithat were“associated” or“not associated” withthe ERin the experiments of Figure 5A-Bof the manuscript.When the distance between maximal intensities of GFP-Sec15 and KDEL-RFP signals was equal or less than 0.6 m, the signals were considered “associated”. When the distance was more than 0.6 m, the signals were considered “not associated”.
Author response image 3.
(A) GFP-Sec15 foci (cyan) and SGs (red) are shown in cells bearing Immature SGs or (B) with mature SGs. Yellow arrows indicate GFP-Sec15 foci localized in between SGs; green arrowheads indicate GFP-Sec15 foci that arenot in between SGs. (C) Quantification of the percentage (%) of Sec15 foci localized in between SGs respect to the total number of Sec15 foci in cells filled with immature SGs (ISG)vs cells with mature SGs (MSG).
It is interesting to mention that previous evidence from mammalian cultured cells (Yeaman et al, 2001) show that the exocyst localizes both at the trans-Golgi network and at the plasma membrane, weighing in favour of our claim that the exocyst is required at various steps of the exocytic pathway. Thus, the exocyst may play multiple roles in the secretion pathway in other biological models as well. This concept has now been included at the Discussion section of the revised version of the manuscript (lines 359-368).
To make the conclusions of our work clearer, in the revised version of the manuscript, we have now included a graphical abstract, summarizing the dynamic localization of the exocyst in relation to the processes of SG biogenesis, maturation and exocytosis reported in our work.
(3) Instead, it is possible that defects in Golgi traffic and granule homotypic fusion are not due to direct involvement of the exocyst in these processes, but secondary to a defect in canonical exocyst roles at the plasma membrane. A block in the last step of glue exocytosis could perhaps propagate backward in the secretory pathway to disrupt Golgi complexes or cause poor cellular health due to loss of cell polarity or autophagy.
We thank the reviewer for these thoughtful comments. We have performed a number of additional experiments to assess “cellular health” or to identify possible defects in cell polarity after knock-down of exocyst subunits. These new data have been included in new supplementary figures 5 and 6 of the revised version of the manuscript (please see below).
In our view, the precise localization of GFP-Sec15 at the Golgi complex (Figure 5C-E), as well as in between immature secretory granules (Figure 7B-D), argues in favour of a direct involvement of the exocyst in SG biogenesis and homofusion respectively.
We truly appreciate the comment of the reviewer raising the possibility that the defects that we observe at early steps of the pathway (SG biogenesis and SG maturation) may actually stem from a backward effect of the role of the exocyst in SG-plasma membrane tethering. We wish to respectfully point out that the processes of biogenesis, maturation and plasma membrane tethering/fusion of SGs do not occur simultaneously in the Drosophila larval salivary gland in vivo, as they do in other secretory model systems (i.e. cell culture). In this regard, the experimental model is unique in terms of synchronization. In each cell of the salivary gland, the three processes (biogenesis, maturation and exocytosis) occur sequentially, and controlled by developmental cues. At the developmental stage when SGs fuse with the plasma membrane, SG biogenesis has already ceased many hours earlier: SG biogenesis occurs at 96-100 hours after egg lay (AEL), SG maturation takes place at 100-112 hours AEL, and SG-plasma membrane fusion happens only when all SGs have undergone maturation and are ready to fuse with the plasma membrane at 116-120 h AEL. Thus, in our view it is not conceivable that a defect in SG-plasma membrane tethering/fusion (116-120 h AEL) may affect backwards the processes of SG biogenesis or SG maturation, which have occurred earlier in development (96-112 h AEL).
As suggested by the reviewer, we have analysed several markers of cellular health and cell polarity, comparing conditions of exocyst subunit silencing (exo70RNAi, sec3RNAi or exo84RNAi) with wild type controls (whiteRNAi). These new data are depicted in Supplementary Figures 5 and 6, and described in lines 172-179 of the Results section of the revised version of the manuscript. Noteworthy, for these experiments we have applied silencing conditions that block secretory granule maturation, bringing about mostly immature SGs. Our analyses included: 1) Subcellular distribution of PI(4,5)P2, 2) subcellular distribution of the tetraspanin CD63, 3) of Rab11, 4) of filamentous actin, and 5) of CD8. We have also compared 6) nuclear size and nuclear general morphology, 7) the number and distribution of mitochondria, 8) morphology and subcellular distribution of the cis- and 9) trans-Golgi networks. Finally, 10) we have compared basal autophagy in salivary cells with or without knocking down exocyst subunits. The markers that we have analysed behaved similarly to those of control salivary glands, suggesting that the observed defects in regulated exocytosis indeed reflect different roles of the exocyst in the secretory pathway, rather than poor cellular health or impaired cell polarity.
Our conclusions are in line with previous studies in which apico-basal polarity, Golgi complex morphology and distribution, as well as apical membrane trafficking were also evaluated in exocyst mutant backgrounds, finding no anomalies (Jafar-Nejad et al, 2005).
Conversely, in studies in which apical polarity was disturbed by interfering with Crumbs levels, SG biogenesis, maturation and exocytosis were not affected (Lattner et al, 2019), indicating that these processes not necessarily interfere with one another.
(4) Final recommendation: In the absence of stronger evidence for these other exocyst roles, I would suggest focusing the study on the canonical role (interesting, as it was previously reported that Drosophila exocyst had no function in the salivary gland and limited function elsewhere [DOI: 10.1034/j.1600-0854.2002.31206.x]), and leave the alternative roles for discussion and deeper study in the future.
We appreciate the reviewer´s recommendation. However, we believe that the major strength of our work is the discovery of non-canonical roles of the exocyst complex, unrelated to its function as a tethering complex for vesicle-plasma membrane fusion. We believe that in the new version of our manuscript, we provide stronger evidence supporting the two novel roles of the exocyst:
a) Its participation in maintaining the normal structure of the Golgi complex, and b) Its function in secretory granule maturation.
Reviewer 2:
(5) General comment: A key strength is the breadth of the assays and study of all 8 exocyst subunits in a powerful model system (fly larvae). Many of the assays are quantitated and roles of the exocyst in early phases of granule biogenesis have not been ascribed.
We are grateful that the reviewer appreciates the novelty of our contribution.
(6) However there are several weaknesses, both in terms of experimental controls, concrete statements about the granules (better resolution), and making a clear conceptual framework. Namely, why do KD of different exocysts have different effects on presumed granule formation
The reviewer has raised a point that is central to the interpretation of all our data throughout the manuscript. The short answer is that the extent of RNAi-dependent silencing of exocyst subunits determines the phenotype:
1) Maximum silencing affects Golgi complex morphology and prevents SG biogenesis. 2) Intermediate silencing blocks SG maturation, without affecting Golgi complex morphology and SG biogenesis. 3) Weak silencing blocks SG tethering and fusion with the plasma membrane, without affecting Golgi complex morphology, SG biogenesis or SG maturation.
In other words, 1) Low levels of exocyst subunits are sufficient for normal Golgi complex morphology and SG biogenesis. 2) Intermediate levels of exocyst subunits are sufficient for SG maturation (and also sufficient for SG biogenesis). 3) High levels of exocyst subunits are required for SG tethering and subsequent fusion with the plasma membrane.
Based on the above notion, we have exploited the fact that temperature can fine-tune the level of Gal4/UAS-dependent transcription, thereby achieving different levels of silencing, as shown by Norbert Perrimon et al in their seminal paper “the level of RNAi knockdown can also be altered by using Gal4 lines of various strengths, rearing flies at different temperatures, or via coexpression of UAS-Dicer2” (Perkins et al, 2015).
We found in our system that indeed, by applying appropriate silencing conditions (RNAi line and temperature) to any of the eight subunits of the exocyst, we have been able to obtain one of the three alternative phenotypes: Impaired SG biogenesis, or impaired SG maturation, or impaired SG tethering/fusion with the plasma membrane.
These concepts are summarized below in Author response image 4. Please see also at point 26, the general comment of Reviewer #3.
We have conducted qRT-PCR assays to provide experimental support to the notions summarized above in Author response image 4. We measured the remaining levels of mRNAs of some of the exocyst subunits, after inducing RNAi-mediated silencing at different temperatures, or with different RNAi transgenic lines. The remaining RNA levels after silencing correlate well with the observed phenotypes, following the predictions of Author response image 4 and summarized in Author response image 5. These new data are now shown in Supplementary Figure 2 of the revised version of the manuscript, and described in lines 153-159 at the Results section.
(7) Why does just overexpression of a single subunit (Sec15) induce granule fusion?
The reviewer raises a very important point. Based on available data from the literature, Sec15 behaves as a seed for assembly of the holocomplex and it also mediates the recruitment of the holocomplex to SGs through its interaction with Rab11 (Escrevente et al, 2021; Bhuin and Roy, 2019; Wu et al, 2005; Zhang et al, 2004; Guo et al, 1999). Thus, overexpression of Sec15 is expected to enhance exocyst assembly, thereby potentiating the activities carried out by the complex in the cell, including SG homofusion. In the revised version of the manuscript we have also performed the overexpression of Sec8, finding that, unlike Sec15, Sec8 fails to induce homotypic fusion. These results were expected, as they confirm that Sec8 does not behave as a seed for mounting the whole complex. These new data have been included in Figure 7E-H, and are described in text lines 221-229 of the Results section.
Author response image 4.
Conceptual model of RNAi expression at different temperatures , remaining levels of mRNA/protein levels and phenotypes obtained at each temperature.
Author response image 5.
qRT-PCR assays presented in Supplementary Figure 2 are shown in combination with the phenotypes observed at each of the conditions analyzed. Note the correlation between phenotypes and the extent of mRNA downregulation.
(8) While the paper is fascinating, the major comments need to be addressed to really be able to make better sense of this work, which at present is hard to disentangle direct vs. secondary effects, especially as much of the TGN seems to be altered in the KDs.
We hope that our response to point 6) has helped to clarify this important point raised by the Reviewer. After applying silencing conditions where normal structure of the trans-Golgi network is impaired, SG biogenesis does not occur. Thus, since SGs do not form, it is not conceivable to detect defects in SG maturation or SG fusion with the plasma membrane in the same cell.
(9) The authors conveniently ascribe many of the results to the holocomplex, but their own data (Fig. 4 and Fig. 6) are at odds with this.
This is another central point of our work, so we thank the reviewer for his/her comment. In Figures 4A, 7A and 9A of the revised version of the manuscript, we show that, by inducing appropriate levels of silencing of any of the 8 subunits of the exocyst, each of the three alternative phenotypic manifestations can occur. In our opinion, this argues in favour of a function for the whole exocyst complex in each of the three specific activities proposed in our study: 1) SG biogenesis, 2) SG maturation, and 3) SG tethering/fusion with the plasma membrane. In detailed characterizations of these three phenotypes performed throughout the study, we decided to induce silencing of just two or three of the subunits of the exocyst, assuming that the whole complex accounts the mechanisms involved.
Major comments
(10) Resolution not sufficient. Identification of "mature secretory granules" (MSG) in Fig. 3 is based on low-resolution images in which the MSG are not clearly seen (see control in Fig. 3A) and rather appear as a diffuse haze, and not as clear granules. There may be granules here, but as shown it is not clear. Thus it would be helpful to acquire images at higher resolution (at the diffraction limit, or higher) to see and count the MSG.
We thank the reviewer for raising this point, as it may not be straightforward to the reader to identify the SGs throughout the figures of our study. To make it clearer, in Figure 3A (magnified insets on the right), we have delimitated individual SGs with a green dotted line, and included diagrams (far right), which we hope will help the identification of SGs. In Figure 3B, we show that after silencing Sec84, a mosaic phenotype was observed: In some cells SGs fail to undergo maturation, and remain smaller than normal. In other cells of this mosaic phenotype, biogenesis of SGs was impaired and the fluorescent cargo remained trapped in a mesh-like structure (that we later show that corresponds to the ER). The dotted line marks individual SGs, and the diagrams included on the right intend to help the interpretation of the phenotype. The mesh-like structures where Sgs3-GFP was retained are also marked with dotted line, and schematized on the right. These new schemes are described in the Figure 3 caption of the revised version of the manuscript.
We wish to mention that all the confocal images depicted in this figure and throughout the manuscript have been captured at high resolution, with a theoretical resolution limit of 168177nm (d = γ/2NA). Given that secretory granules range from 0.8-7µm in diameter, the resolution is more than sufficient to clearly resolve these structures.
(11) Note: the authors are not clear on which objective was used. Maybe the air objective as the resolution appears poor).
In this particular figure, we have utilized a Plan-Apochromat 63X/1.4NA oil objective of the inverted Carl Zeiss LSM 880 confocal microscope (mentioned in materials and methods).
(12) They need to prove that the diffuse Sgs3-GFP haze is indeed due to MSG.
If we interpret correctly the concern of the reviewer, what he/she calls “diffuse haze” is actually the distribution of Sgs3-GFP within individual SGs, which, as previously reported by other authors, is not homogeneous at this stage (Syed et al. 2022). We hope that the diagrams that we have included in Figure 3 A, B (point 10) will help the readers interpreting the images.
(13) Related it is unclear what are the granule structures that correspond to Immature secretory granules (ISG) and cells with mesh-like structures (MLS)?
We are confident that the diagrams now included in Figure 3A and B will help the interpretation, and particularly to identify immature granules and the mesh-like structure generated after silencing of exocyst subunits.
(14) Similarly, Sgs3 images of KD of 8 exocyst subunits were interpreted to be identical, in Fig. 4, but the resolution is poor.
We hope that the issue related to resolution of our images has been properly addressed in the response to point 10) of this letter. In Figure 4A, we show that after silencing of any of the 8 subunits (with the appropriate conditions), in all cases SG biogenesis was impaired, and Sgs3GFP was instead retained in a mesh-like structure. Images obtained after silencing different exocyst subunits are of course not identical, but in all cases, a mesh-like structure has replaced the formation of SGs (Figure 4A). Hopefully, the diagrams now included in Figure 3A and B help the correct interpretation of the phenotypes throughout the study.
To demonstrate that the structure in which Sgs3-GFP was retained upon exocyst complex knockdown corresponds to the ER, we performed a colocalization analysis between Sgs3-GFP and the ER markers GFP-KDEL or Bip-sfGFP-HDEL, after which we calculated the Pearsons Coefficient, which indicated substantial colocalization (Figure 4B-G and Supplementary Figures 7 and 8). These new data are described in lines 196-199 of the revised version of the manuscript. To facilitate the visualization of the results, in the revised version of the manuscript we have included magnified cropped areas of the images shown in Figure 4A.
(15) What is remarkable is a highly variable effect of different subunit KD on the percentage of cells with MLS (Fig. 4C). Controls = 100 %, Exo70=~75% (at 19 deg), Sec3 = ~30%, Sec10 = 0%, Exo84 = 100% ... This is interesting for the functional exocyst is an octameric holocomples, thus why the huge subunit variability in the phenotypes? The trivial explanation is either: i) variable exocyst subunit KD (not shown) or ii) variability between experiments (no error bars are shown). Both should be addressed by quantification of the KD of different proteins and secondly by replicating the experiments.
We agree with the reviewer statement. We believe that both, variability of KD efficiency (i) and variability between experiments (ii) contribute to the variable effect observed after knocking down the different subunits. As detailed in the response to point 6), we have performed qRT-PCR determinations to confirm that the severity of the phenotype depends on the efficiency of RNAimediated silencing. We chose to analyse in detail the effect on the subunits exo70 and sec3, which were those with the highest phenotypic differences between the three silencing temperatures utilized. We found that as expected, the levels of silencing were temperaturedependent, being higher at 29°C and lower at 19°C. These data were included in Supplementary Figure 2, and described lines 153-159 of the Results section and also summarized in Author response images 4 and 5 of this rebuttal letter.
We thank the reviewer for his/her comment on the replication of experiments and statistics. We failed to include detailed numerical information in the original submission, such as the number of replicas and standard deviations of the data depicted in Figure 3C and Supplementary Figure 1, so we apologize for this omission. In the revised version of the manuscript, we have included a table (Supplementary Table 3) in which all the raw data of Figure 3C and Supplementary Figure 1, including standard deviations, are now depicted.
(16) If their data holds up then the underlying mechanism here needs to be considered.
(Note: there is some precedent from the autophagy field of differential exocyst effects)
Our proposed mechanism is essentially that the holocomplex is required for multiple processes along the secretory pathway. Each of these actions (Golgi structure maintenance, SG maturation and SG tethering/fusion with the plasma membrane) requires different amounts of holocomplex activity, being this the reason why each phenotype manifests at different levels of RNAi-mediated silencing (Author response image 4 of this letter). The model predicts that Golgi structure maintenance requires minimal levels of complex activity, and that is why strong knock-down of exocyst subunits is required to obtain this phenotype. In line with our results, it has been reported that other tethering complexes of the CATCHR family are also required for maintaining Golgi cisternae stuck together (D'Souza et al, 2020; Khakurel and Lupashin, 2023; Liu et al, 2019). One possibility is that the exocyst may play a redundant role in the maintenance of the normal structure of the Golgi complex, along with other CATCHR complexes. This potential redundancy could explain why severe exocyst knock-down is required to observe structural anomalies at this organelle. On the other end of the spectrum, we propose that tethering/fusion with the plasma membrane is very susceptible to even slight reduction of complex activity, so that mild RNAi-mediated silencing is sufficient to provoke defects in this process. This proposed model is depicted in Author response image 4 and discussed in lines 395-405 of the Discussion section.
(17) In the salivary glands the authors state that the exocyst is needed for Sgs3-GFP exit from the ER. First, Pearson's coefficient should be shown so as to quantitate the degree of ER localizations of all KDs.
We thank the reviewer for this comment that helped us to strengthen the observation that when SG biogenesis is impaired, Sgs3-GFP remains trapped in the ER. In the revised version of the manuscript, we have calculated Pearson´s coefficient to assess colocalization between ER markers (GFP-KDEL or Bip-sfGFP-HDEL) and Sgs3-GFP in salivary gland cells that express sec15RNAi. The Pearson’s coefficient was around 0.6 for both ER markers, indicating that colocalization with Sgs3-GFP was substantial (Supplementary Figure 8, text lines 196-199 of the Results section).
(18) Second, there should be some rescue performed (if possible) to support specificity.
As suggested by the reviewer, we have performed a rescue experiment of the phenotype provoked by the expression of sec15 RNAi, which consisted on the retention of Sgs3-GFP in the endoplasmic reticulum: Expression of Sec15-GFP reverted substantially the ER retention phenotype, rescuing SG biogenesis and also SG maturation in most cells (over 60% of the cells). These new data are now shown in Supplementary Figure 4, and described in lines 168-171 of the Results section.
(19) Third, importantly other proteins that should traffic to the PM need to be shown to traffic normally so as to rule out a non-specific effect.
We have addressed this issue (also mentioned by Reviewer #1), by analyzing the localization of a number of polarization markers, finding that the overall polarization of the cell was not affected by loss of function of exocyst subunits. Please, see our response to the point 3) raised by Reviewer #1. The new data showing cell polarization markers are shown in Supplementary Figure 6 of the revised version of the manuscript, and described on text lines 172-179 of the Results section.
(20) It is unclear from their model (Fig. 5) why after exocyst KD of Sec15 the cis-Golgi is more preserved than the TGN, which appears as large vacuoles. This is not quantitated and not shown for the 8 subunits.
We thank the reviewer for this relevant comment. We agree that the phenotype of either, sec15 or sec3 loss-of-function cells manifests differently with cis-Golgi and trans-Golgi markers. While the cis-Golgi marker looked fragmented and aggregated, the trans-Golgi marker adopted a swollen appearance. However, in our view, the different appearance of the two markers does not necessarily imply that one compartment is more preserved than the other. In the revised version of the manuscript, we have quantified the penetrance of the phenotypes provoked by sec15 or sec3 silencing, using both cis-Golgi and trans-Golgi markers. In both cases, the penetrance was high, although even higher with the trans-Golgi marker. These new data are now depicted in Supplementary Figure 9 of the revised version of the manuscript.
It is interesting to mention that in HeLa cells, as well as in the retinal epithelial cell line hTERT, Golgi phenotypes similar to those we have described here have been reported after loss-offunction of other tethering complexes, which were shown to maintain the Golgi cisternae stuck together, including the GOC and GARP complexes (D'Souza et al, 2020, Khakurel and Lupashin, 2023; Shijie Liu et al, 2019). As we did throughout our work, not every aspect of the analysis included the silencing of all eight subunits. In this case, we chose to silence Sec3 and Sec15. Please note that we have modified the model depicted in Figure 6E-F, to highlight the cis- and transGolgi phenotypes upon exocyst knock-down, as well as the localization of the exocyst in cisternae of the Golgi complex.
(21) Acute/Chronic control: It would be nice to acutely block the exocyst so as to better distinguish if the effects observed are primary or secondary effects (e.g. on a recycling pathway).
We thank the reviewer for raising this important issue. To address this point, and to be able to induce silencing of exocyst subunits at specific time intervals of larval development, we utilized a strategy based on a thermosensitive variant of the Gal4 inhibitor Gal80 (Gal80ts)(Lee and Luo, 1999). We blocked Gal4 activity (and therefore RNAi expression) by maintaining the larvae at 18 °C during the 1st and 2nd instars (until 120 hours after egg lay), and then induced the activity of Gal4 specifically at the 3rd larval instar by raising the temperature to 29 ºC, a condition in which Gal80ts becomes inactive. After silencing the expression of sec3 or sec15 at the 3rd larval instar only, the phenotype was very similar to that observed after chronic silencing of exocyst subunits (larvae maintained at 29 ºC all throughout development, where Gal4 was never inhibited). These observations suggest that the defects observed in the secretory pathway after knock down of exocyst subunits reflect genuine functions of the exocyst in this pathway, rather than a secondary effect derived from impaired development of the salivary glands at early larval stages. These new results are now shown in Supplementary Figure 3, and described in manuscript lines 160-171 of the Results section.
(22) Granule homotypic fusion. Strangely over-expression of just one subunit, Sec15-GFP, made giant secretory granules (SG) that were over 8 microns big! Why is that, especially if normally the exocyst is normally a holocomplex. Was this an effect that was specific to Sec15 or all exocyst subunits? Is the Sec15 level rate limiting in these cells? It may be that a subcomplex of Sec15/10 plays earlier roles, but in any case this needs to be addressed across all (or many) of the exocyst subcomplex members.
Please, see our response to point 7) of this letter. Sec15 is believed to act as a seed for the formation of the whole complex.
(23) In summary, there are clearly striking effects on secretory granule biogenesis by dysfunction of the exocyst, however right now it is hard to disentangle effects on ERGolgi traffic, loss of the TGN, and a problem in maturation or fusion of granules.
As discussed in detail in our response to the point 3 raised by Reviewer #1, the secretory pathway is highly synchronized in each of the cells of the Drosophila salivary gland. SG biogenesis, SG maturation and SG fusion with the plasma membrane never occur simultaneously in the same cell. Thus, in a cell in which ER-Golgi traffic is impaired (and SG biogenesis does not occur), SGs do not exist, and therefore, they cannot exhibit defects in the process of maturation or fusion with the plasma membrane. In summary, we believe that our work has shown that in Drosophila larval salivary glands the exocyst holocomplex is required for (at least) three functions along the secretory pathway: 1) To maintain the appropriate Golgi complex architecture, thus enabling ERGolgi transport; 2) For secretory granule maturation: both, homotypic fusion and acquisition of maturation factors; 3) For secretory granule exocytosis: secretory granule tethering to enable subsequent fusion with the plasma membrane. As mentioned above (point 6 of this letter), these three functions require different amounts of the holocomplex, and therefore can be revealed by inducing different levels of silencing.
(24) It is also confusing if the entire exocyst holocomplex or subcomplex plays a key role
The fact that, by silencing any of the subunits (with the appropriate conditions) it is possible obtain any of the 3 phenotypes (impaired SG biogenesis, impaired SG maturation or impaired SG fusion with the plasma membrane) argues in favour of a function of the complex as a whole in each of these three functions.
Reviewer 3:
(25) General comment: Freire and co-authors examine the role of the exocyst complex during the formation and secretion of mucins from secretory granules in the larval salivary gland of Drosophila melanogaster. Using transgenic lines with a tagged Sgs3 mucin the authors KD expression of exocyst subunit members and observe a defect in secretory granules with a heterogeneity of phenotypes. By carefully controlling RNAi expression using a Gal4-based system the authors can KD exocyst subunit expression to varying degrees. The authors find that the stronger the inhibition of expression of exocyst the earlier in the secretory pathway the defect. The manuscript is well written, the model system is physiological, and the techniques are innovative.
We appreciate the reviewer´s assessment of our work.
(26) My major concern is that the evidence underlying the fundamental claim of the manuscript that "the exocyst complex participates" in multiple secretory processes lacks direct evidence.
We thank the reviewer for raising this important issue. We believe that the analysis of Sec15 subcellular localization during salivary gland development (Figures 5, 7B-D and 9E-F), in combination with the detailed analysis of the phenotypes provoked by loss-of-function of each of the exocyst subunits, provide evidence supporting multiple functions of the exocyst in the secretory pathway. We have also included 3D reconstructions and videos of GFP-Sec15 colocalization with Golgi and SG markers to support exocyst localization associated to these structures (Supplementary Videos 1-7), text lines 200-210; 216-221 and 303-305.
(27) It is clear from multiple lines of evidence, which are discussed by the authors, that exocyst is essential for an array of exocytic events. The fundamental concern is that loss of homeostasis on the plasma membrane proteome and lipidome might have severe pleiotropic effects on the cell.
We agree with the reviewer that this is an important point that needed to be addressed. As discussed in detail above at the response to point 3 raised by Reviewer #1, we have analysed several plasma membrane markers (including a PI(4,5)P2 lipid reporter), and found that overall, plasma membrane integrity and polarity were not substantially affected (Supplementary Figure 6). In addition, we have analyzed several markers of general cellular “health” that indicate that salivary gland cells do not seem to be distressed by the reduction of exocyst complex activity (Supplementary Figure 5). These new data are described in lines 172-179 of the Results section.
(28) Perhaps the authors have more evidence that exocyst is important for homeotypic fusion of the SGs, as supported by the localisation of Sec15 on the fusion sites.
We believe that the fact that, by silencing any of the exocyst subunits (with the appropriate conditions), immature smaller-than-normal granules were observed, argus in favour that the exocyst as a whole participates in SG homofusion (Figure 7A). In addition, we have included more images, quantifications, 3D reconstructions and videos of GFP-Sec15 localized just at the contact sites between immature SGs. We have quantified and compared GFP-Sec15 localization at immature SG vs its localization at mature SGs, finding that localizes preferentially at immature SGs, supporting a role of the exocyst as a tethering complex during homotypic fusion (shown Figure 7B-C and Supplementary Videos 4-6, and described in lines 216-221 of the Results section). Please see also our response to the point 2 raised by reviewer 1 in this rebuttal letter, and to Author response image 3 above in this letter.
(29) The second question that I think is important to address is, what exactly do the varying RNAi levels correspond to in terms of experiments, and have these been validated? Due to the fundamental claim being that the severity of the phenotype being correlated with the level of KD, I think validation of this model is absolutely essential.
We thank the Reviewer for raising this important point, and agree it was lacking in the original version of our manuscript. As discussed in our response to the point 6) raised by Reviewer #2, we have performed qRT-PCR determinations for exo70 and sec3 mRNA levels after inducing silencing of these subunits at different temperatures, or with different RNAi transgenic lines. The remnant mRNA levels correlate well with the observed phenotypes. Please see Supplementary Figure 2 of the revised manuscript, and Author response image 5 of this rebuttal letter; described in lines 155-159 of the Results section.
Recommendations for the authors:
Reviewer #1 (Recommendations For The Authors):
- The authors assert in the discussion that exocyst involvement in constitutive secretion is well documented. This is based on a very recent study in mammalian culture cells. Therefore, I would not dismiss the issue as completely settled. Furthermore, a previous study of Drosophila sec10 reported no roles outside the ring gland (DOI: 10.1034/j.1600-0854.2002.31206.x).
We have included these observations in the Discussion section. Lines 326-329.
- A salivary gland screening by Julie Brill's lab reported exocyst components as hits (DOI: 10.1083/jcb.201808017).
We have referred to this paper in the Discussion section. Lines 326-329.
- It should be explained in more detail what is measured in graphs 7C, F, and others quantifying fluorescence around secretory granules. Looking at the images, the decrease in Rab1 and Rab11 seems less convincing.
We have made a clearer description of how fluorescence intensity was measured in the Methods section lines 558-561. Also, we have uploaded a source data file in which the raw data of each experiment used for quantifications are disclosed.
Please note that the data indicates that Rab11 levels are higher in sec5 (Figure 8J-L) and sec3 (supplementary Figure 11M-R).
Reviewer #2 (Recommendations For The Authors):
No major issues.
Writing - The authors should better frame their interpretations of other studies of the exocyst that include the role in autophagy, Palade body trafficking, and differential roles of the subunits.
We have discussed these specific points in the Discussion section, lines 348-355 and 409-410.
Minor - Fig. 6A: Why are variable temperatures (19-29 deg C used for the 8 KD experiments)?
Please show it all at the same temperature (control too).
The need for the usage of specific temperatures to obtain specific phenotypes with each of the RNAi lines used was explained in point 6 of this letter.
Reviewer #3 (Recommendations For The Authors):
In the abstract, the authors refer to the exocytic process and go on to describe secretory granule biogenesis and exocytosis. However, there are many exocytic processes aside from secretory granule biogenesis, and I think the authors should clarify this.
Corrected in the Abstract. Lines 19-21
Page 17 Thomas, 2021 reference, there is a glitch with the reference.
Thanks for noticing. Fixed.
References
Bhuin T, Roy JK. Developmental expression, co-localization and genetic interaction of exocyst component Sec15 with Rab11 during Drosophila development. Exp Cell Res. 2019 Aug 1;381(1):94-104. doi: 10.1016/j.yexcr.2019.04.038. Epub 2019 May 7. PMID: 31071318.
D'Souza Z, Taher FS, Lupashin VV. Golgi inCOGnito: From vesicle tethering to human disease. Biochim Biophys Acta Gen Subj. 2020 Nov;1864(11):129694. doi: 10.1016/j.bbagen.2020.129694. Epub 2020 Jul 27. PMID: 32730773; PMCID: PMC7384418.
Escrevente C, Bento-Lopes L, Ramalho JS, Barral DC. Rab11 is required for lysosome exocytosis through the interaction with Rab3a, Sec15 and GRAB. J Cell Sci. 2021 Jun 1;134(11):jcs246694. doi: 10.1242/jcs.246694. Epub 2021 Jun 8. PMID: 34100549; PMCID: PMC8214760.
Guo W, Roth D, Walch-Solimena C, Novick P. The exocyst is an effector for Sec4p, targeting secretory vesicles to sites of exocytosis. EMBO J. 1999 Feb 15;18(4):1071-80. doi: 10.1093/emboj/18.4.1071. PMID: 10022848; PMCID: PMC1171198.
Jafar-Nejad H, Andrews HK, Acar M, Bayat V, Wirtz-Peitz F, Mehta SQ, Knoblich JA, Bellen HJ. Sec15, a component of the exocyst, promotes notch signaling during the asymmetric division of Drosophila sensory organ precursors. Dev Cell. 2005 Sep;9(3):351-63. doi: 10.1016/j.devcel.2005.06.010. PMID: 16137928.
Khakurel A, Lupashin VV. Role of GARP Vesicle Tethering Complex in Golgi Physiology. Int J Mol Sci. 2023 Mar 23;24(7):6069. doi: 10.3390/ijms24076069. PMID: 37047041; PMCID: PMC10094427.
Lattner J, Leng W, Knust E, Brankatschk M, Flores-Benitez D. Crumbs organizes the transport machinery by regulating apical levels of PI(4,5)P2 in Drosophila. Elife. 2019 Nov 7;8:e50900. doi: 10.7554/eLife.50900. PMID: 31697234; PMCID: PMC6881148.
Lee T, Luo L. Mosaic analysis with a repressible cell marker for studies of gene function in neuronal morphogenesis. Neuron. 1999 Mar;22(3):451-61. doi: 10.1016/s08966273(00)80701-1. PMID: 10197526.
Liu S, Majeed W, Grigaitis P, Betts MJ, Climer LK, Starkuviene V, Storrie B. Epistatic Analysis of the Contribution of Rabs and Kifs to CATCHR Family Dependent Golgi Organization. Front Cell Dev Biol. 2019 Aug 2;7:126. doi: 10.3389/fcell.2019.00126. PMID: 31428608; PMCID: PMC6687757.
Perkins LA, Holderbaum L, Tao R, Hu Y, Sopko R, McCall K, Yang-Zhou D, Flockhart I, Binari R, Shim HS, Miller A, Housden A, Foos M, Randkelv S, Kelley C, Namgyal P, Villalta C, Liu LP, Jiang X, Huan-Huan Q, Wang X, Fujiyama A, Toyoda A, Ayers K, Blum A, Czech B, Neumuller R, Yan D, Cavallaro A, Hibbard K, Hall D, Cooley L, Hannon GJ, Lehmann R, Parks A, Mohr SE, Ueda R, Kondo S, Ni JQ, Perrimon N. The Transgenic RNAi Project at Harvard Medical School: Resources and Validation. Genetics. 2015 Nov;201(3):843-52. doi: 10.1534/genetics.115.180208. Epub 2015 Aug 28. PMID: 26320097; PMCID: PMC4649654.
Wu S, Mehta SQ, Pichaud F, Bellen HJ, Quiocho FA. Sec15 interacts with Rab11 via a novel domain and affects Rab11 localization in vivo. Nat Struct Mol Biol. 2005 Oct;12(10):879-85. doi: 10.1038/nsmb987. Epub 2005 Sep 11. PMID: 16155582.
Yeaman C, Grindstaff KK, Wright JR, Nelson WJ. Sec6/8 complexes on trans-Golgi network and plasma membrane regulate late stages of exocytosis in mammalian cells. J Cell Biol. 2001 Nov 12;155(4):593-604. doi: 10.1083/jcb.200107088. Epub 2001 Nov 5. PMID: 11696560; PMCID: PMC2198873.
Zhang XM, Ellis S, Sriratana A, Mitchell CA, Rowe T. Sec15 is an effector for the Rab11 GTPase in mammalian cells. J Biol Chem. 2004 Oct 8;279(41):43027-34. doi: 10.1074/jbc.M402264200. Epub 2004 Jul 29. PMID: 15292201.
-
-
www.biorxiv.org www.biorxiv.org
-
eLife Assessment
In this important study, the authors use zebrafish to examine protein absorption in the gut. Using a combination of imaging and single-cell RNA-seq, they characterize a population of lysosome-rich enterocytes that are essential for protein uptake. They find that the microbiome impacts the ability of these cells to uptake protein. The RNA-seq provides a rich dataset for future functional experiments, which makes a convincing case for the importance of these cells.
-
Reviewer #1 (Public review):
The Bagnat and Rawls groups' previous published work (Park et al., 2019) described the kinetics and genetic basis of protein absorption in a specialized cell population of young vertebrates termed lysosome-rich enterocytes (LREs). In this study they seek to understand how the presence and composition of the microbiota impacts the protein absorption function of these cells and reciprocally, how diet and intestinal protein absorption function impact the microbiome.
Strengths of the study include the functional assays for protein absorption performed in live larval zebrafish, which provides detailed kinetics on protein uptake and degradation with anatomic precision, and the gnotobiotic manipulations. The authors clearly show that the presence of the microbiota or of certain individual bacterial members slows the uptake and degradation of multiple different tester fluorescent proteins.
To understand the mechanistic basis for these differences, the authors also provide detailed single-cell transcriptomic analyses of cells isolated based on both an intestinal epithelial cell identity (based on a transgenic marker) and their protein uptake activity. The data generated from these analyses, presented in Figures 3-5, are valuable for expanding knowledge about zebrafish intestinal epithelial cell identities, but of more limited interest to a broader readership. Some of the descriptive analysis in this section is circular because the authors define subsets of LREs (termed anterior and posterior) based on their fabp2 expression levels, but then go on to note transcriptional differences between these cells (for example in fabp2) that are a consequence of this initial subsetting.
Inspired by their single-cell profiling and by previous characterization of the genes required for protein uptake and degradation in the LREs, the authors use quantitative hybridization chain reaction RNA-fluorescent in situ hybridization to examine transcript levels of several of these genes along the length of the LRE intestinal region of germ-free versus mono-associated larvae. They provide good evidence for reduced transcript levels of these genes that correlate with the reduced protein uptake in the mono-associated larval groups.
The final part of the study (shown in Figure 7) characterized the microbiomes of 30-day-old zebrafish reared from 6-30 days on defined diets of low and high protein and with or without homozygous loss of the cubn gene required for protein uptake. The analysis of these microbiomes notes some significant differences between fish genotypes by diet treatments, but the discussion of these data does not provide strong support for the hypothesis that "LRE activity has reciprocal effects on the gut microbiome". The most striking feature of the MDS plot of Bray Curtis distance between zebrafish samples shown in Figure 7B is the separation by diet independent of host genotype, which is not discussed in the associated text. Additionally, the high protein diet microbiomes have a greater spread than those of the low protein treatment groups, with the high protein diet cubn mutant samples being the most dispersed. This pattern is consistent with the intestinal microbiota under a high protein diet regimen and in the absence of protein absorption machinery being most perturbed in stochastic ways than in hosts competent for protein uptake, consistent with greater beta dispersal associated with more dysbiotic microbiomes (described as the Anna Karenina principle here: https://pubmed.ncbi.nlm.nih.gov/28836573/). It would be useful for the authors to provide statistics on the beta dispersal of each treatment group.
Overall, this study provides strong evidence that specific members of the microbiota differentially impact gene expression and cellular activities of enterocyte protein uptake and degradation, findings that have a significant impact on the field of gastrointestinal physiology. The work refines our understanding of intestinal cell types that contribute to protein uptake and their respective transcriptomes. The work also provides some evidence that microbiomes are modulated by enterocyte protein uptake capacity in a diet-dependent manner. These latter findings provide valuable datasets for future related studies.
-
Reviewer #2 (Public review):
Summary:
The authors set out to determine how the microbiome and host genotype impact host protein-based nutrition.
Strengths:
The quantification of protein uptake dynamics is a major strength of this work and the sensitivity of this assay shows that the microbiome and even mono-associated bacterial strains dampen protein uptake in the host by causing down-regulation of genes involved in this process rather than a change in cell type.
The use of fluorescent proteins in combination with transcript clustering in the single cell seq analysis deepens our understanding of the cells that participate in protein uptake along the intestine. In addition to the lysozome-rich enterocytes (LRE), subsets of enteroendocrine cells, acinar, and goblet cells also take up protein. Intriguingly, these non-LRE cells did not show lysosomal-based protein degradation; but importantly analysis of the transcripts upregulated in these cells include dab2 and cubn, genes shown previously as being essential to protein uptake.
The derivation of zebrafish mono-associated with single strains of microbes paired with HCR to localize and quantify the expression of host protein absorption genes shows that different bacterial strains suppress these genes to variable extents.
The analysis of microbiome composition, when host protein absorption is compromised in cubn-/- larvae or by reducing protein in the food, demonstrates that changes to host uptake can alter the abundance of specific microbial taxa like Aeramonas.
Weaknesses:
The finding that neurons are positive for protein uptake in the single-cell data set is not adequately discussed. It is curious because the cldn:GFP line used for sorting does not mark neurons and if the neurons are taking up mCherry via trans-synaptic uptake from EECs, those neurons should be mCherry+/GFP-; yet methods indicate GFP+ and GFP+/mCherry+ cells were the ones collected and analyzed.
-
Reviewer #3 (Public review):
Summary:
Childers et al. address a fundamental question about the complex relationship within the gut: the link between nutrient absorption, microbial presence, and intestinal physiology. They focus on the role of lysosome-rich enterocytes (LREs) and the microbiota in protein absorption within the intestinal epithelium. By using germ-free and conventional zebrafishes, they demonstrate that microbial association leads to a reduction in protein uptake by LREs. Through impressive in vivo imaging of gavaged fluorescent proteins, they detail the degradation rate within the LRE region, positioning these cells as key players in the process. Additionally, the authors map protein absorption in the gut using single-cell sequencing analysis, extensively describing LRE subpopulations in terms of clustering and transcriptomic patterns. They further explore the monoassociation of ex-germ-free animals with specific bacterial strains, revealing that the reduction in protein absorption in the LRE region is strain-specific.
Strengths:
The authors employ state-of-the-art imaging to provide clear evidence of the protein absorption rate phenotype, focusing on a specific intestinal region. This innovative method of fluorescent protein tracing expands the field of in vivo gut physiology.
Using both conventional and germ-free animals for single-cell sequencing analysis, they offer valuable epithelial datasets for researchers studying host-microbe interactions. By capitalizing on fluorescently labelled proteins in vivo, they create a new and specific atlas of cells involved in protein absorption, along with a detailed LRE single-cell transcriptomic dataset.
Weaknesses:
While the authors present tangible hypotheses, the data are primarily correlative, and the statistical methods are inadequate. They examine protein absorption in a specific, normalized intestinal region but do not address confounding factors between germ-free and conventional animals, such as size differences, transit time, and oral gavage, which may impact their in vivo observations. This oversight can lead to bold conclusions, where the data appear valuable but require more nuance.
The sections of the study describing the microbiota or attempting functional analysis are elusive, with related data being overinterpreted. The microbiome field has long used 16S sequencing to characterize the microbiota, but its variability due to experimental parameters limits the ability to draw causative conclusions about the link between LRE activity, dietary protein, and microbial composition. Additionally, the complex networks involved in dopamine synthesis and signalling cannot be fully represented by RNA levels alone. The authors' conclusions on this biological phenomenon based on single-cell data need support from functional and in vivo experiments.
-
Author response:
Public Reviews:
Reviewer #1 (Public review):
The Bagnat and Rawls groups' previous published work (Park et al., 2019) described the kinetics and genetic basis of protein absorption in a specialized cell population of young vertebrates termed lysosome-rich enterocytes (LREs). In this study they seek to understand how the presence and composition of the microbiota impacts the protein absorption function of these cells and reciprocally, how diet and intestinal protein absorption function impact the microbiome.
Strengths of the study include the functional assays for protein absorption performed in live larval zebrafish, which provides detailed kinetics on protein uptake and degradation with anatomic precision, and the gnotobiotic manipulations. The authors clearly show that the presence of the microbiota or of certain individual bacterial members slows the uptake and degradation of multiple different tester fluorescent proteins.
To understand the mechanistic basis for these differences, the authors also provide detailed single-cell transcriptomic analyses of cells isolated based on both an intestinal epithelial cell identity (based on a transgenic marker) and their protein uptake activity. The data generated from these analyses, presented in Figures 3-5, are valuable for expanding knowledge about zebrafish intestinal epithelial cell identities, but of more limited interest to a broader readership. Some of the descriptive analysis in this section is circular because the authors define subsets of LREs (termed anterior and posterior) based on their fabp2 expression levels, but then go on to note transcriptional differences between these cells (for example in fabp2) that are a consequence of this initial subsetting.
Inspired by their single-cell profiling and by previous characterization of the genes required for protein uptake and degradation in the LREs, the authors use quantitative hybridization chain reaction RNA-fluorescent in situ hybridization to examine transcript levels of several of these genes along the length of the LRE intestinal region of germ-free versus mono-associated larvae. They provide good evidence for reduced transcript levels of these genes that correlate with the reduced protein uptake in the mono-associated larval groups.
The final part of the study (shown in Figure 7) characterized the microbiomes of 30-day-old zebrafish reared from 6-30 days on defined diets of low and high protein and with or without homozygous loss of the cubn gene required for protein uptake. The analysis of these microbiomes notes some significant differences between fish genotypes by diet treatments, but the discussion of these data does not provide strong support for the hypothesis that "LRE activity has reciprocal effects on the gut microbiome". The most striking feature of the MDS plot of Bray Curtis distance between zebrafish samples shown in Figure 7B is the separation by diet independent of host genotype, which is not discussed in the associated text. Additionally, the high protein diet microbiomes have a greater spread than those of the low protein treatment groups, with the high protein diet cubn mutant samples being the most dispersed. This pattern is consistent with the intestinal microbiota under a high protein diet regimen and in the absence of protein absorption machinery being most perturbed in stochastic ways than in hosts competent for protein uptake, consistent with greater beta dispersal associated with more dysbiotic microbiomes (described as the Anna Karenina principle here: https://pubmed.ncbi.nlm.nih.gov/28836573/). It would be useful for the authors to provide statistics on the beta dispersal of each treatment group.
Overall, this study provides strong evidence that specific members of the microbiota differentially impact gene expression and cellular activities of enterocyte protein uptake and degradation, findings that have a significant impact on the field of gastrointestinal physiology. The work refines our understanding of intestinal cell types that contribute to protein uptake and their respective transcriptomes. The work also provides some evidence that microbiomes are modulated by enterocyte protein uptake capacity in a diet-dependent manner. These latter findings provide valuable datasets for future related studies.
We thank the reviewer for their thorough and kind assessment. We appreciate the suggestion for edits and for pointing out areas that need further clarification.
One point that clearly needs further explanation is the use fabp6 (referred to as fabp2 by the reviewer) to define anterior LREs and their gene expression pattern. which includes high levels of fabp6. This was deemed by the reviewer as a “circular argument”. We would like to clarify that the rationale for using fabp6 as anchor is that we had previously reported overlap between fabp6 and LREs (see Fig.6C-E in Wen et al. PMID: 34301599) and thus were able here to define fabp6’s spatial pattern in relation to other LRE markers and the neighboring ileocyte population using transgenic markers and HCR. Thus, far from being a circular argument, using fabp6 allowed us to identify other markers that are differentially expressed between anterior and posterior LREs, which share a core program that we highlight in our study. In the revised manuscript we will clarify this point.
We will also add the analysis suggested for the 16S rRNA gene sequencing data, include statistics on beta dispersal, and expand the discussion of these data as suggested.
Reviewer #2 (Public review):
Summary:
The authors set out to determine how the microbiome and host genotype impact host protein-based nutrition.
Strengths:
The quantification of protein uptake dynamics is a major strength of this work and the sensitivity of this assay shows that the microbiome and even mono-associated bacterial strains dampen protein uptake in the host by causing down-regulation of genes involved in this process rather than a change in cell type.
The use of fluorescent proteins in combination with transcript clustering in the single cell seq analysis deepens our understanding of the cells that participate in protein uptake along the intestine. In addition to the lysozome-rich enterocytes (LRE), subsets of enteroendocrine cells, acinar, and goblet cells also take up protein. Intriguingly, these non-LRE cells did not show lysosomal-based protein degradation; but importantly analysis of the transcripts upregulated in these cells include dab2 and cubn, genes shown previously as being essential to protein uptake.
The derivation of zebrafish mono-associated with single strains of microbes paired with HCR to localize and quantify the expression of host protein absorption genes shows that different bacterial strains suppress these genes to variable extents.
The analysis of microbiome composition, when host protein absorption is compromised in cubn-/- larvae or by reducing protein in the food, demonstrates that changes to host uptake can alter the abundance of specific microbial taxa like Aeramonas.
Weaknesses:
The finding that neurons are positive for protein uptake in the single-cell data set is not adequately discussed. It is curious because the cldn:GFP line used for sorting does not mark neurons and if the neurons are taking up mCherry via trans-synaptic uptake from EECs, those neurons should be mCherry+/GFP-; yet methods indicate GFP+ and GFP+/mCherry+ cells were the ones collected and analyzed.
We thank the Reviewer for the kind and positive assessment of our work, for suggestions to improve the accessibility and clarity of the manuscript, and for pointing out an issue related to a neuronal population that needs further clarification.
We confirm that there is a population of neurons that express cldn15la (and cldn15la:GFP). They are not easily visualized by microscopy because IECs express this gene at a relatively much higher level. However, the endogenous cldn15la transcript can be found in a recently published dataset (PMID: 35108531) as well as in ours. We will add a Discussion point to clarify this issue.
Reviewer #3 (Public review):
Summary:
Childers et al. address a fundamental question about the complex relationship within the gut: the link between nutrient absorption, microbial presence, and intestinal physiology. They focus on the role of lysosome-rich enterocytes (LREs) and the microbiota in protein absorption within the intestinal epithelium. By using germ-free and conventional zebrafishes, they demonstrate that microbial association leads to a reduction in protein uptake by LREs. Through impressive in vivo imaging of gavaged fluorescent proteins, they detail the degradation rate within the LRE region, positioning these cells as key players in the process. Additionally, the authors map protein absorption in the gut using single-cell sequencing analysis, extensively describing LRE subpopulations in terms of clustering and transcriptomic patterns. They further explore the monoassociation of ex-germ-free animals with specific bacterial strains, revealing that the reduction in protein absorption in the LRE region is strain-specific.
Strengths:
The authors employ state-of-the-art imaging to provide clear evidence of the protein absorption rate phenotype, focusing on a specific intestinal region. This innovative method of fluorescent protein tracing expands the field of in vivo gut physiology.
Using both conventional and germ-free animals for single-cell sequencing analysis, they offer valuable epithelial datasets for researchers studying host-microbe interactions. By capitalizing on fluorescently labelled proteins in vivo, they create a new and specific atlas of cells involved in protein absorption, along with a detailed LRE single-cell transcriptomic dataset.
Weaknesses:
While the authors present tangible hypotheses, the data are primarily correlative, and the statistical methods are inadequate. They examine protein absorption in a specific, normalized intestinal region but do not address confounding factors between germ-free and conventional animals, such as size differences, transit time, and oral gavage, which may impact their in vivo observations. This oversight can lead to bold conclusions, where the data appear valuable but require more nuance.
The sections of the study describing the microbiota or attempting functional analysis are elusive, with related data being overinterpreted. The microbiome field has long used 16S sequencing to characterize the microbiota, but its variability due to experimental parameters limits the ability to draw causative conclusions about the link between LRE activity, dietary protein, and microbial composition. Additionally, the complex networks involved in dopamine synthesis and signalling cannot be fully represented by RNA levels alone. The authors' conclusions on this biological phenomenon based on single-cell data need support from functional and in vivo experiments.
We thank the reviewer for their assessment and for pointing out some areas that need to be explained better and/or discussed further.
The reviewer mentions some potential confounding factors (ie., size differences, transit time, oral gavage) in the gnotobiotic experiments. We would like to convey that these aspects have been addressed in our experimental design and will be clarified in our full in the revised manuscript by adding information to Methods or by adding data statements. Briefly: 1-larval sizes were recorded and found to be similar between GF and monoassociated larvae. A statement will be added to text.; 2-while intestinal transit time has been reported to be affected by microbes in larval zebrafish (PMIDs: 16781702, 28207737, 33352109) and is a topic of interest, it does not represent a confounding factor for our experiments. In our assay, luminal cargo is present at high concentrations throughout the gut and is not limiting at any point during the assay; 3-gavage, which is necessary for quantitative assays, is indeed an experimental manipulation that may somehow alter the subjects (the same is true for microscopy and virtually any research method). However, any potential effects of gavage manipulation would not explain differences between GF and CV animals or alter our conclusions about microbial or dietary effects. We will elaborate on this in the revised Discussion.
We acknowledge that microbiota composition is prone to relatively high degrees of interindividual and interexperimental variation, and that measuring microbiota composition using 16S rRNA gene sequencing is accompanied by inherent technical limitations such as limited taxonomic resolution, primer bias, etc. It is important to note that comparable assays such as shotgun metagenomic DNA sequencing are not currently suitable for samples such as larval zebrafish or their dissected digestive tracts where the relative superabundance of host DNA prevents adequate coverage of microbial DNA. However, 16S rRNA gene sequencing remains a mainstream assay in the larger microbial ecology field, has proven effective at revealing important impacts of environmental factors on the gut microbiota (PMIDs: 21346791, 31409661, 31324413). Our results here also illustrate how 16S rRNA gene sequencing can be a useful method to detect perturbations to the zebrafish gut microbiome. Reproducing previous findings, we detected in our samples many of the core zebrafish microbiota taxa that have been identified by other studies (PMIDs: 26339860, 21472014, 17055441). To increase the robustness of our results, we included several biological replicates for each condition, co-housed genotypes and included large sample sizes to minimize environmental variation between groups. Importantly, replicates housed in different tanks showed similar results. We will emphasize these points in the revised Discussion. To further underscore this in the revised manuscript, we will add a beta diversity plot and statistical analysis showing that the microbiome was not significantly affected by our experimental replicates.
Regarding dopamine pathways, we thank the reviewer for pointing out that the language we used in our interpretation of this and other pathways enriched in our scRNAseq data was too strong. In the revised manuscript, we will soften those conclusions, and instead indicate that these may be areas worthy of future dedicated investigation.
Finally, the reviewer mentions the use of inadequate statistical methods for some analyses but without specifying or indicating alternative analyses. Only the need to justify the use of two-way ANOVA was made explicit. In this point, we respectfully disagree and would like to emphasize that we use statistical methods that are standards in the field. We will nevertheless add a justification for the use of two-way ANOVA where appropriate. Briefly, the two-way ANOVA test was used to compare fluorescence profiles of gavages cargoes or HCR probes at each level along the length of the LRE region. This test accounts for differences in fluorescence between experimental conditions at each level (binned 30 μm areas) along the LRE region (~300 μm). This test allows us to capture differences in fluorescence between experimental conditions while accounting for heterogeneity in the LRE region.
-
-
www.biorxiv.org www.biorxiv.org
-
Author response:
The following is the authors’ response to the original reviews.
We summarized the main changes:
(1) In the Introduction part, we give a general definition of habitat fragmentation to avoid confusion, as reviewers #1 and #2 suggested.
(2) We clarify the two aspects of the observed “extinction”——“true dieback” and “emigration”, as reviewers #2 and #3 suggested.
(3) In the Methods part, we 1) clarify the reason for testing the temporal trend in colonization/extinction dynamics and describe how to select islands as reviewer #1 suggested; 2) describe how to exclude birds from the analysis as reviewer #2 suggested.
(4) In the Results part, we modified and rearranged Figure 4-6 as reviewers #1, #2 and #3 suggested.
(5) In the Discussion part, we 1) discuss the multiple aspects of the metric of isolation for future research as reviewer #3 suggested; 2) provide concrete evidence about the relationship between habitat diversity or heterogeneity and island area and 3) provide a wider perspective about how our results can inform conservation practices in fragmented habitats as reviewer #2 suggested.
eLife Assessment
This important study enhances our understanding of how habitat fragmentation and climate change jointly influence bird community thermophilization in a fragmented island system. The evidence supporting some conclusions is incomplete, as while the overall trends are convincing, some methodological aspects, particularly the isolation metrics and interpretation of colonization/extinction rates, require further clarification. This work will be of broad interest to ecologists and conservation biologists, providing crucial insights into how ecosystems and communities react to climate change.
We sincerely extend our gratitude to you and the esteemed reviewers for acknowledging the importance of our study and for raising these concerns. We have clarified the rationale behind our analysis of temporal trends in colonization and extinction dynamics, as well as the choice of distance to the mainland as the isolation metric. Additionally, we further discuss the multiple aspects of the metric of isolation for future research and provide concrete supporting evidence about the relationship between habitat diversity or heterogeneity and island area.
Incorporating these valuable suggestions, we have thoroughly revised our manuscript, ensuring that it now presents a more comprehensive and nuanced account of our research. We are confident that these improvements will further enhance the impact and relevance of our work for ecologists and conservation biologists alike, offering vital insights into the resilience and adaptation strategies of communities facing the challenges of climate change.
Reviewer #1 (Public Review):
Summary:
This study reports on the thermophilization of bird communities in a network of islands with varying areas and isolation in China. Using data from 10 years of transect surveys, the authors show that warm-adapted species tend to gradually replace cold-adapted species, both in terms of abundance and occurrence. The observed trends in colonisations and extinctions are related to the respective area and isolation of islands, showing an effect of fragmentation on the process of thermophilization.
Strengths:
Although thermophilization of bird communities has been already reported in different contexts, it is rare that this process can be related to habitat fragmentation, despite the fact that it has been hypothesized for a long time that it could play an important role. This is made possible thanks to a really nice study system in which the construction of a dam has created this incredible Thousand Islands lake. Here, authors do not simply take observed presence-absence as granted and instead develop an ambitious hierarchical dynamic multi-species occupancy model. Moreover, they carefully interpret their results in light of their knowledge of the ecology of the species involved.
Response: We greatly appreciate your recognition of our study system and the comprehensive approach and careful interpretation of results.
Weaknesses:
Despite the clarity of this paper on many aspects, I see a strong weakness in the authors' hypotheses, which obscures the interpretation of their results. Looking at Figure 1, and in many sentences of the text, a strong baseline hypothesis is that thermophilization occurs because of an increasing colonisation rate of warm-adapted species and extinction rate of cold-adapted species. However, there does not need to be a temporal trend! Any warm-adapted species that colonizes a site has a positive net effect on CTI; similarly, any cold-adapted species that goes extinct contributes to thermophilization.
Thank you very much for these thoughtful comments. The understanding depends on the time frame of the study and specifically, whether the system is at equilibrium. We think your claim is based on this background: if the system is not at equilibrium, then CTI can shift simply by having differential colonization (or extinction) rates for warm-adapted versus cold-adapted species. We agree with you in this case.
On the other hand, if a community is at equilibrium, then there will be no net change in CTI over time. Imagine we have an archipelago where the average colonization of warm-adapted species is larger than the average colonization of cold-adapted species, then over time the archipelago will reach an equilibrium with stable colonization/extinction dynamics where the average CTI is stable over time. Once it is stable, then if there is a temporal trend in colonization rates, the CTI will change until a new equilibrium is reached (if it is reached).
For our system, the question then is whether we can assume that the system is or has ever been at equilibrium. If it is not at equilibrium, then CTI can shift simply by having differential colonization (or extinction) rates for warm-adapted versus cold-adapted species. If the system is at equilibrium (at the beginning of the study), then CTI will only shift if there is a temporal change or trend in colonization or extinction rates.
Habitat fragmentation can affect biomes for decades after dam formation. The “Relaxation effect” (Gonzalez, 2000) refers to the fact that the continent acts as a potential species pool for island communities. Under relaxation, some species will be filtered out over time, mainly through the selective extinction of species that are highly sensitive to fragmentation. Meanwhile, for a 100-hectare patch, it takes about ten years to lose 50% of bird species; The smaller the patch area, the shorter the time required (Ferraz et al., 2003; Haddad et al., 2015). This study was conducted 50 to 60 years after the formation of the TIL, making the system with a high probability of reaching “equilibrium” through “Relaxation effect”(Si et al., 2014). We have no way of knowing exactly whether “equilibrium” is true in our system. Thus, changing rates of colonization-extinction over time is actually a much stronger test of thermophilization, which makes our inference more robust.
We add a note to the legend of Figure 1 on Lines 781-786:
“CTI can also change simply due to differential colonization-extinction rates by thermal affinity if the system is not at equilibrium prior to the study. In our study system, we have no way of knowing whether our island system was at equilibrium at onset of the study, thus, focusing on changing rates of colonization-extinction over time presents a much stronger tests of thermophilization.”
We hope this statement can make it clear. Thank you again for this meaningful question.
Another potential weakness is that fragmentation is not clearly defined. Generally, fragmentation sensu lato involves both loss of habitat area and changes in the spatial structure of habitats (i.e. fragmentation per se). Here, both area and isolation are considered, which may be slightly confusing for the readers if not properly defined.
Thank you for reminding us of that. Habitat fragmentation in this study involves both habitat loss and fragmentation per se. We have clarified the general definition in the Introduction on Lines 61-63:
“Habitat fragmentation, usually defined as the shifts of continuous habitat into spatially isolated and small patches (Fahrig, 2003), in particular, has been hypothesized to have interactive effects with climate change on community dynamics.”
Reviewer #2 (Public Review):
Summary:
This study addresses whether bird community reassembly in time is related to climate change by modelling a widely used metric, the community temperature index (CTI). The authors first computed the temperature index of 60 breeding bird species thanks to distribution atlases and climatic maps, thus obtaining a measure of the species realized thermal niche.
These indices were aggregated at the community level, using 53 survey transects of 36 islands (repeated for 10 years) of the Thousand Islands Lake, eastern China. Any increment of this CTI (i.e. thermophilization) can thus be interpreted as a community reassembly caused by a change in climate conditions (given no confounding correlations).
The authors show thanks to a mix of Bayesian and frequentist mixed effect models to study an increment of CTI at the island level, driven by both extinction (or emigration) of cold-adapted species and colonization of newly adapted warm-adapted species. Less isolated islands displayed higher colonization and extinction rates, confirming that dispersal constraints (created by habitat fragmentation per se) on colonization and emigration are the main determinants of thermophilization. The authors also had the opportunity to test for habitat amount (here island size). They show that the lack of microclimatic buffering resulting from less forest amount (a claim backed by understory temperature data) exacerbated the rates of cold-adapted species extinction while fostering the establishment of warm-adapted species.
Overall these findings are important to range studies as they reveal the local change in affinity to the climate of species comprising communities while showing that the habitat fragmentation VS amount distinction is relevant when studying thermophilization. As is, the manuscript lacks a wider perspective about how these results can be fed into conservation biology, but would greatly benefit from it. Indeed, this study shows that in a fragmented reserve context, habitat amount is very important in explaining trends of loss of cold-adapted species, hinting that it may be strategic to prioritize large habitats to conserve such species. Areas of diverse size may act as stepping stones for species shifting range due to climate change, with small islands fostering the establishment of newly adapted warm-adapted species while large islands act as refugia for cold-adapted species. This study also shows that the removal of dispersal constraints with low isolation may help species relocate to the best suitable microclimate in a heterogenous reserve context.
Thank you very much for your valuable feedback. We greatly appreciate your recognition of the scientific question to the extensive dataset and diverse approach. In particular, you provided constructive suggestions and examples on how to extend the results to conservation guidance. This is something we can’t ignore in the manuscript. We have added a paragraph to the end of the Discussion, stating how our results can inform conservation, on Lines 339-347:
‘Overall, our findings have important implications for conservation practices. Firstly, we confirmed the role of isolation in limiting range shifting. Better connected landscapes should be developed to remove dispersal constraints and facilitate species’ relocation to the best suitable microclimate. Second, small patches can foster the establishment of newly adapted warm-adapted species while large patches can act as refugia for cold-adapted species. Therefore, preserving patches of diverse sizes can act as stepping stones or shelters in a warming climate depending on the thermal affinity of species. These insights are important supplement to the previous emphasis on the role of habitat diversity in fostering (Richard et al., 2021) or reducing (Gaüzère et al., 2017) community-level climate debt.’
Strength:
The strength of the study lies in its impressive dataset of bird resurveys, that cover 10 years of continued warming (as evidenced by weather data), 60 species in 36 islands of varying size and isolation, perfect for disentangling habitat fragmentation and habitat amount effects on communities. This distinction allows us to test very different processes mediating thermophilization; island area, linked to microclimatic buffering, explained rates for a variety of species. Dispersal constraints due to fragmentation were harder to detect but confirms that fragmentation does slow down thermophilization processes.
This study is a very good example of how the expected range shift at the biome scale of the species materializes in small fragmented regions. Specifically, the regional dynamics the authors show are analogous to what processes are expected at the trailing and colonizing edge of a shifting range: warmer and more connected places display the fastest turnover rates of community reassembly. The authors also successfully estimated extinction and colonization rates, allowing a more mechanistic understanding of CTI increment, being the product of two processes.
The authors showed that regional diversity and CTI computed only by occurrences do not respond in 10 years of warming, but that finer metrics (abundance-based, or individual islands considered) do respond. This highlights the need to consider a variety of case-specific metrics to address local or regional trends. Figure Appendix 2 is a much-appreciated visualization of the effect of different data sources on Species thermal Index (STI) calculation.
The methods are long and diverse, but they are documented enough so that an experienced user with the use of the provided R script can follow and reproduce them.
Thank you very much for your profound Public Review. We greatly appreciate your recognition of the scientific question, the extensive dataset and the diverse approach.
Weaknesses:
While the overall message of the paper is supported by data, the claims are not uniformly backed by the analysis. The trends of island-specific thermophilization are very credible (Figure 3), however, the variable nature of bird observations (partly compensated by an impressive number of resurveys) propagate a lot of errors in the estimation of species-specific trends in occupancy, abundance change, and the extinction and colonization rates. This materializes into a weak relationship between STI and their respective occupancy and abundance change trends (Figure 4a, Figure 5, respectively), showing that species do not uniformly contribute to the trend observed in Figure 3. This is further shown by the results presented in Figure 6, which present in my opinion the topical finding of the study. While a lot of species rates response to island areas are significant, the isolation effect on colonization and extinction rates can only be interpreted as a trend as only a few species have a significant effect. The actual effect on the occupancy change rates of species is hard to grasp, and this trend has a potentially low magnitude (see below).
Thank you very much for pointing out this shortcoming. The R2 between STI and their respective occupancy trends is relatively small (R2\=0.035). But the R2 between STI and their respective abundance change trends are relatively bigger, in the context of Ecology research (R2\=0.123). The R2 between STI and their respective colonization rate (R2\=0.083) and extinction rate trends (R2\=0.053) are also relatively small. Low R2 indicates that we can’t make predictions using the current model, we must notice that except STI, other factors may influence the species-specific occupancy trend. Nonetheless, it is important to notice that the standardized coefficient estimates are not minor and the trend is also significant, indicating the species-specific response is as least related to STI.
The number of species that have significant interaction terms for isolation (Figure 6) is indeed low. Although there is uncertainty in the estimation of relationships, there are also consistent trends in response to habitat fragmentation of colonization of warm-adapted species and extinction of cold-adapted species. This is especially true for the effect of isolation, where on islands nearer to the mainland, warm-adapted species (15 out of 15 investigated species) increased their colonization probability at a higher rate over time, while most cold-adapted species (21 out of 23 species) increased their extinction probability at a higher rate. We now better highlight these results in the Results and Discussion.
While being well documented, the myriad of statistical methods used by the authors ampere the interpretation of the figure as the posterior mean presented in Figure 4b and Figure 6 needs to be transformed again by a logit-1 and fed into the equation of the respective model to make sense of. I suggest a rewording of the caption to limit its dependence on the method section for interpretation.
Thank you for this suggestion. The value on the Y axis indicates the posterior mean of each variable (year, area, isolation and their interaction effects) extracted from the MSOM model, where the logit(extinction rate) or logit(colonization rate) was the response variable. All variables were standardized before analysis to make them comparable so interpretation is actually quite straight forward: positive values indicate positive influence while negative values indicate negative influence. Because the goal of Figure 6 is to display the negative/positive effect, we didn’t back-transform them. Following your advice, we thus modified the caption of Figure 6 (now renumbered as Figure 5, following a comment from Reviewer #3, to move Figure 5 to Figure 4c). The modified title and legends of Figure 5 are on Lines 817-820:
“Figure 5. Posterior estimates of logit-scale parameters related to cold-adapted species’ extinction rates and warm-adapted species’ colonization rates. Points are species-specific posterior means on the logit-scale, where parameters >0 indicate positive effects (on extinction [a] or colonization [b]) and parameters <0 indicate negative effects...”
By using a broad estimate of the realized thermal niche, a common weakness of thermophilization studies is the inability to capture local adaptation in species' physiological or behavioral response to a rise in temperature. The authors however acknowledge this limitation and provide specific examples of how species ought to evade high temperatures in this study region.
We appreciate your recognition. This is a common problem in STI studies. We hope in future studies, researchers can take more details about microclimate of species’ true habitat across regions into consideration when calculating STI. Although challenging, focusing on a smaller portion of its distribution range may facilitate achievement.
Reviewer #3 (Public Review):
Summary:
Juan Liu et al. investigated the interplay between habitat fragmentation and climate-driven thermophilization in birds in an island system in China. They used extensive bird monitoring data (9 surveys per year per island) across 36 islands of varying size and isolation from the mainland covering 10 years. The authors use extensive modeling frameworks to test a general increase in the occurrence and abundance of warm-dwelling species and vice versa for cold-dwelling species using the widely used Community Temperature Index (CTI), as well as the relationship between island fragmentation in terms of island area and isolation from the mainland on extinction and colonization rates of cold- and warm-adapted species. They found that indeed there was thermophilization happening during the last 10 years, which was more pronounced for the CTI based on abundances and less clearly for the occurrence-based metric. Generally, the authors show that this is driven by an increased colonization rate of warm-dwelling and an increased extinction rate of cold-dwelling species. Interestingly, they unravel some of the mechanisms behind this dynamic by showing that warm-adapted species increased while cold-dwelling decreased more strongly on smaller islands, which is - according to the authors - due to lowered thermal buffering on smaller islands (which was supported by air temperature monitoring done during the study period on small and large islands). They argue, that the increased extinction rate of cold-adapted species could also be due to lowered habitat heterogeneity on smaller islands. With regards to island isolation, they show that also both thermophilization processes (increase of warm and decrease of cold-adapted species) were stronger on islands closer to the mainland, due to closer sources to species populations of either group on the mainland as compared to limited dispersal (i.e. range shift potential) in more isolated islands.
The conclusions drawn in this study are sound, and mostly well supported by the results. Only a few aspects leave open questions and could quite likely be further supported by the authors themselves thanks to their apparent extensive understanding of the study system.
Strengths:
The study questions and hypotheses are very well aligned with the methods used, ranging from field surveys to extensive modeling frameworks, as well as with the conclusions drawn from the results. The study addresses a complex question on the interplay between habitat fragmentation and climate-driven thermophilization which can naturally be affected by a multitude of additional factors than the ones included here. Nevertheless, the authors use a well-balanced method of simplifying this to the most important factors in question (CTI change, extinction, and colonization, together with habitat fragmentation metrics of isolation and island area). The interpretation of the results presents interesting mechanisms without being too bold on their findings and by providing important links to the existing literature as well as to additional data and analyses presented in the appendix.
We appreciate very much for your positive and constructive comments and suggestions. Thank you for your recognition of the scientific question, the modeling approach and the conclusions.
Weaknesses:
The metric of island isolation based on the distance to the mainland seems a bit too oversimplified as in real life the study system rather represents an island network where the islands of different sizes are in varying distances to each other, such that smaller islands can potentially draw from the species pools from near-by larger islands too - rather than just from the mainland. Thus a more holistic network metric of isolation could have been applied or at least discussed for future research. The fact, that the authors did find a signal of island isolation does support their method, but the variation in responses to this metric could hint at a more complex pattern going on in real-life than was assumed for this study.
Thank you for this meaningful question. Isolation can be measured in different ways in the study region. We chose the distance to the mainland as a measure of isolation based on the results of a previous study. One study in our system provided evidence that the colonization rate and extinction rate of breeding bird species were best fitted using distance to the nearest mainland over other distance-based measures (distance to the nearest landmass, distance to the nearest bigger landmass)(Si et al., 2014). Besides, their results produced almost identical patterns of the relationship between isolation and colonization/extinction rate (Si et al., 2014). That’s why we only selected “Distance to the mainland” in our current analysis and we do find some consistent patterns as expected. The plants on all islands were cleared out about 60 years ago due to dam construction, with all bird species coming from the mainland as the original species pool through a process called “relaxation”. This could be the reason why distance to the nearest mainland is the best predictor.
We agree with you that it’s still necessary to consider more aspects of “isolation” at least in discussion for future research. In our Discussion, we address these on Lines 292-299:
“As a caveat, we only consider the distance to the nearest mainland as a measure of fragmentation, consistent with previous work in this system (Si et al., 2014), but we acknowledge that other distance-based metrics of isolation that incorporate inter-island connections could reveal additional insights on fragmentation effects. The spatial arrangement of islands, like the arrangement of habitat, can influence niche tracking of species (Fourcade et al., 2021). Future studies should take these metrics into account to thoroughly understand the influence of isolation and spatial arrangement of patches in mediating the effect of climate warming on species.”
Further, the link between larger areas and higher habitat diversity or heterogeneity could be presented by providing evidence for this relationship. The authors do make a reference to a paper done in the same study system, but a more thorough presentation of it would strengthen this assumption further.
Thank you very much for this question. We now add more details about the relationship between habitat diversity and heterogeneity based on a related study in the same system. The observed number of species significantly increased with increasing island area (slope = 4.42, R2 = 0.70, p < .001), as did the rarefied species richness per island (slope = 1.03, R2 = 0.43, p < .001), species density (slope = 0.80, R2 = 0.33, p = .001) and the rarefied species richness per unit area (slope = 0.321, R2 = 0.32, p = .001). We added this supporting evidence on Lines 317-321:
“We thus suppose that habitat heterogeneity could also mitigate the loss of these relatively cold-adapted species as expected. Habitat diversity, including the observed number of species, the rarefied species richness per island, species density and the rarefied species richness per unit area, all increased significantly with island area instead of isolation in our system (Liu et al., 2020)”
Despite the general clear patterns found in the paper, there were some idiosyncratic responses. Those could be due to a multitude of factors which could be discussed a bit better to inform future research using a similar study design.
Thank you for these suggestions. We added a summary statement about the reasons for idiosyncratic responses on Lines 334-338:
“Overall, these idiosyncratic responses reveal several possible mechanisms in regulating species' climate responses, including resource demands and biological interactions like competition and predation. Future studies are needed to take these factors into account to understand the complex mechanisms by which habitat loss meditates species range shifts.”
Reviewer #1 (Recommendations For The Authors):
(1) Figure 1: I disagree that there should be a temporal trend in colonisation/extinction dynamics.
Thank you again for these thoughtful comments. We have explained in detail in the response to the Public Review.
(2) L 485-487: As explained before I disagree. I don't see why there needs to be a temporal trend in colonization and extinction.
Thank you again for these thoughtful comments. Because we can’t guarantee that the study system has reached equilibrium, changing rates of colonization-extinction over time is actually a much stronger test of thermophilization. More detailed statement can be seen in the response to the Public Review.
(3) L 141: which species' ecological traits?
Sorry for the confusion. The traits included continuous variables (dispersal ability, body size, body mass and clutch size) and categorical variables (diet, active layer, residence type). Specifically, we tested the correlation between STI and dispersal ability, body size, body mass and clutch size using Pearson correlation test. We also tested the difference in STI between different trait groups using the Wilcoxon signed-rank test for three Category variables: diet (carnivorous/ omnivorous/ herbivory), active layer (canopy/mid/low), and residence type (resident species/summer visitor). There is no significant difference between any two groups for each of the three category variables (p > 0.2). We added these on Lines 141-145:
“No significant correlation was found between STI and species’ ecological traits; specifically, the continuous variables of dispersal ability, body size, body mass and clutch size (Pearson correlations for each, |r| < 0.22), and the categorial variables of diet (carnivorous/omnivorous/herbivory), active layer (canopy/mid/low), and residence type (resident species/summer visitor)”
(4) L 143: CTIoccur and CTIabun were not defined before.
Because CTIoccur and CTIabun were first defined in Methods part (section 4.4), we change the sentence to a more general statement here on Lines 147-150:
“At the landscape scale, considering species detected across the study area, occurrence-based CTI (CTIoccur; see section 4.4) showed no trend (posterior mean temporal trend = 0.414; 95% CrI: -12.751, 13.554) but abundance-based CTI (CTIabun; see section 4.4) showed a significant increasing trend.”
(5) Figure 4: what is the dashed vertical line? I assume the mean STI across species?
Sorry for the unclear description. The vertical dashed line indicates the median value of STI for 60 species, as a separation of warm-adapted species and cold-adapted species. We have added these details on Lines 807-809:
“The dotted vertical line indicates the median of STI values. Cold-adapted species are plotted in blue and warm-adapted species are plotted in orange.”
(6) Figure 6: in the legend, replace 'points in blue' with 'points in blue/orange' or 'solid dots' or something similar.
Thank you for this suggestion. We changed it to “points in blue/orange” on Lines 823.
(7) L 176-176: unclear why the interaction parameters are particularly important for explaining the thermophilization mechanism: if e.g. colonization rate of warm-adapted species is constantly higher in less isolated islands, (and always higher than the extinction rate of the same species), it means that thermophilization is increased in less isolated islands, right?
Thank you for this question. This is also related to the question about “Why use temporal trends in colonization/extinction rate to test for thermophilization mechanisms”. Colonization-extinction over time is actually a much stronger test of thermophilization (more details refer to response to Public Review and Recommendations 1&2).
Based on this, the two main driving processes of thermophilization mechanism include the increasing colonization rate of warm-adapted species and the increasing extinction rate of cold-adapted species with year. The interaction effect between island area (or isolation) and year on colonization rate (or extinction rate) can tell us how habitat fragmentation mediates the year effect. For example, if the interaction term between year and isolation is negative for a warm-adapted species that increased in colonization rate with year, it indicates that the colonization rate increased faster on less isolated islands. This is a signal of a faster thermophilization rate on less-isolated islands.
(8) L201-203: this is only little supported by the results that actually show that there is NO significant interaction for most species.
Thank you for this comment. Although most species showed non-significant interaction effect, the overall trend is relatively consistent, this is especially true for the effect of isolation. To emphasize the “trend” instead of “significant effect”, we slightly modified this sentence in more rigorous wording on Lines 205-208:
“We further found that habitat fragmentation influences two processes of thermophilization: colonization rates of most warm-adapted species tended to increase faster on smaller and less isolated islands, while the loss rates of most cold-adapted species tended to be exacerbated on less isolated islands.”
(9) Section 2.3: can't you have a population-level estimate? I struggled a bit to understand all the parameters of the MSOM (because of my lack of statistical/mathematical proficiency) so I cannot provide more advice here.
Thank you for raising this advice. We think what you are mentioning is the overall estimate across all species for each variable. From MSOM, we can get a standardized estimate of every variable (year, area, isolation, interaction) for each species, separately. Because the divergent or consistent responses among species are what we are interested in, we didn’t calculate further to get a population-level estimate.
(10) L 291: a dot is missing.
Done. Thank you for your correction.
(11) L 305, 315: a space is missing
Done
(12) L 332: how were these islands selected?
Thank you for this question. The 36 islands were selected according to a gradient of island area and isolation, spreading across the whole lake region. The selected islands guaranteed there is no significant correlation between island area and isolation (the Pearson correlation coefficient r = -0.21, p = 0.21). The biggest 7 islands among the 36 islands are also the only several islands larger than 30 ha in the whole lake region. We have modified this in the Method part on Lines 360-363.
“We selected 36 islands according to a gradient of island area and isolation with a guarantee of no significant correlation between island area and isolation (Pearson r = -0.21, p = 0.21). For each island, we calculated island area and isolation (measured in the nearest Euclidean distance to the mainland) to represent the degree of habitat fragmentation.”
(13) L 334: "Distance to the mainland" was used as a metric of isolation, but elsewhere in the text you argue that the observed thermophilization is due to interisland movements. It sounds contradictory. Why not include the average or shortest distance to the other islands?
Thank you very much for raising this comment. Yes, “Distance to the mainland” was the only metric we used for isolation. We carefully checked through the manuscript where the “interisland movement” comes from and induces the misunderstanding. It must come from Discussion 3.1 (n Lines 217-221): “Notably, when tested on the landscape scale (versus on individual island communities), only the abundance-based thermophilization trend was significant, indicating thermophilization of bird communities was mostly due to inter-island occurrence dynamics, rather than exogenous community turnover.”
Sorry, the word “inter-island” is not exactly what we want to express here, we wanted to express that “the thermophilization was mostly due to occurrence dynamics within the region, rather than exogenous community turnover outside the region”. We have changed the sentence in Discussion part on Lines 217-221:
“Notably, when tested on the landscape scale (versus on individual island communities), only the abundance-based thermophilization trend was significant, indicating thermophilization of bird communities was mostly due to occurrence dynamics within the region, rather than exogenous community turnover outside the region.”
Besides, I would like to explain why we use distance to the mainland. We chose the distance to the mainland as a measure of isolation based on the results of a previous study. One study in our system provided evidence that the colonization rate and extinction rate of breeding bird species were best fitted using distance to the nearest mainland over other distance-based measures (distance to the nearest landmass, distance to the nearest bigger landmass)(Si et al., 2014). Besides, their results produced almost identical patterns of the relationship between isolation and colonization/extinction rate(Si et al., 2014). That’s why we only selected “Distance to the mainland” in our current analysis and we do find some consistent patterns as expected. The plants on all islands were cleared out about 60 years ago due to dam construction, with all bird species coming from the mainland as the original species pool through a process called “relaxation”. This may be the reason why distance to the nearest mainland is the best predictor.
In Discussion part, we added the following discussion and talked about the other measures on Lines 292-299:
“As a caveat, we only consider the distance to the nearest mainland as a measure of fragmentation, consistent with previous work in this system (Si et al., 2014), but we acknowledge that other distance-based metrics of isolation that incorporate inter-island connections could reveal additional insights on fragmentation effects. The spatial arrangement of islands, like the arrangement of habitat, can influence niche tracking of species (Fourcade et al., 2021). Future studies should take these metrics into account to thoroughly understand the influence of isolation and spatial arrangement of patches in mediating the effect of climate warming on species.”
(14) L 347: you write 'relative' abundance but this measure is not relative to anything. Better write something like "we based our abundance estimate on the maximum number of individuals recorded across the nine annual surveys".
Thank you for this suggestion, we have changed the sentence on Lines 377-379:
“We based our abundance estimate on the maximum number of individuals recorded across the nine annual surveys.”
(15) L 378: shouldn't the formula for CTIoccur be (equation in latex format):
CTI{occur, j, t} =\frac{\sum_{i=1}^{N_{j,t}}STI_{i}}{N_{j,t}}
Where Nj,t is the total number of species surveyed in the community j in year t
Thank you very much for this careful check, we have revised it on Lines 415, 417:
“where Nj,t is the total number of species surveyed in the community j in year t.”
Reviewer #2 (Recommendations For The Authors):
(1) Line 76: "weakly"
Done. Thank you for your correction.
(2) Line 98: I suggest a change to this sentence: "For example, habitat fragmentation renders habitats to be too isolated to be colonized, causing sedentary butterflies to lag more behind climate warming in Britain than mobile ones"
Thank you for this modification, we have changed it on Lines 99-101.
(3) Line 101: remove either "higher" or "increasing"
Done, we have removed “higher”. Thank you for this advice.
(4) Line 102: "benefiting from near source of"
Done.
(5) Line 104: "emigrate"
Done.
(6) Introduction: I suggest making it more explicit what process you describe under the word "extinction". At first read, I thought you were only referring to the dieback of individuals, but you also included emigration as an extinction process. It also needs to be reworded in Fig 1 caption.
Thank you for this suggestion. Yes, we can’t distinguish in our system between local extinction and emigration. The observed “extinction” of cold-adapted species over 10 years may involve two processes that usually occur in order: first “emigration” and then if can’t emigrate or withstand, “real local dieback”. It should also be included in the legend of Figure 1, as you said. We have modified the legend in Lines 780-781:
“Note that extinction here may include both the emigration of species and then the local extinction of species.”
There is also one part in the Discussion that mentions this on Lines 287-291: “While we cannot truly distinguish in our system between local extinction and emigration, we suspect that given two islands equal except in isolation, and if both lose suitability due to climate change, individuals can easily emigrate from the island nearer to the mainland, while individuals on the more isolated island would be more likely to be trapped in place until the species went locally extinct due to a lack of rescue”.
(7) I also suggest differentiating habitat fragmentation (distances between islands) and habitat amount (area) as explained in Fahrig 2013 (Rethinking patch size and isolation effects: the habitat amount hypothesis) and her latter paper. This will help the reader what lies behind the general trend of fragmentation: fragmentation per se and habitat amount reduction.
Thank you for this suggestion! Habitat fragmentation in this study involves both habitat loss and fragmentation per se. We now give a general definition of habitat fragmentation on Lines 61-63:
“Habitat fragmentation, usually defined as the shifts of continuous habitat into spatially isolated and small patches (Fahrig, 2003), in particular, has been hypothesized to have interactive effects with climate change on community dynamics.”
(8) Line 136: is the "+-" refers to the standard deviation or confidence interval, I suggest being explicit about it once at the start of the results.
Thank you for reminding this. The "+-" refers to the standard deviation (SD). The modified sentence is now on Lines 135-139:
“The number of species detected in surveys on each island across the study period averaged 13.37 ± 6.26 (mean ± SD) species, ranging from 2 to 40 species, with an observed gamma diversity of 60 species. The STI of all 60 birds averaged 19.94 ± 3.58 ℃ (mean ± SD) and ranged from 9.30 ℃ (Cuculus canorus) to 27.20 ℃ (Prinia inornate), with a median of STI is 20.63 ℃ (Appendix 1—figure 2; Appendix 1—figure 3).”
(9) Line 143: please specify the unit of thermophilization.
The unit of thermophilization rate is the change in degree per unit year. Because in all analyses, predictor variables were z-transformed to make their effect comparable. We have added on Line 151:
“When measuring CTI trends for individual islands (expressed as °/ unit year)”
(10) Line 289: check if no word is missing from the sentence.
The sentence is: “In our study, a large proportion (11 out of 15) of warm-adapted species increasing in colonization rate and half (12 out of 23) of cold-adapted species increasing in extinction rate were changing more rapidly on smaller islands.”
Given that we have defined the species that were included in testing the third prediction in both Methods part and Result part: 15 warm-adapted species that increased in colonization rate and 23 cold-adapted species that increased in extinction rate. We now remove this redundant information and rewrote the sentence as below on Lines 300-302:
“In our study, the colonization rate of a large proportion of warm-adapted species (11 out of 15) and the extinction rate of half of old-adapted species (12 out of 23) were increasing more rapidly on smaller islands.”
(11) Line 319: I really miss a concluding statement of your discussion, your results are truly interesting and deserve to be summarized in two or three sentences, and maybe a perspective about how it can inform conservation practices in fragmented settings.
Thank you for this profound suggestion both in Public Review and here. We have added a paragraph to the end of the Discussion, stating how our results can inform conservation, on Lines 339-347:
“Overall, our findings have important implications for conservation practices. Firstly, we confirmed the role of isolation in limiting range shifting. Better connected landscapes should be developed to remove dispersal constraints and facilitate species’ relocation to the best suitable microclimate. Second, small patches can foster the establishment of newly adapted warm-adapted species while large patches can act as refugia for cold-adapted species. Therefore, preserving patches of diverse sizes can act as stepping stones or shelters in a warming climate depending on the thermal affinity of species. These insights are important supplement to the previous emphasis on the role of habitat diversity in fostering (Richard et al., 2021) or reducing (Gaüzère et al., 2017) community-level climate debt.”
(12) Line 335: I suggest " ... the islands has been protected by forbidding logging, ..."
Thanks for this wonderful suggestion. Done. The new sentence is now on Lines 365-366:
“Since lake formation, the islands have been protected by forbidding logging, allowing natural succession pathways to occur.”
(13) Line 345: this speed is unusually high for walking, check the speed.
Sorry for the carelessness, it should be 2.0 km/h. It has been corrected on Lines 375-376:
“In each survey, observers walked along each transect at a constant speed (2.0 km/h) and recorded all the birds seen or heard on the survey islands.”
(14) Line 351: you could add a sentence explaining why that choice of species exclusion was made. Was made from the start of the monitoring program or did you exclude species afterward?
We excluded them afterward. We excluded non-breeding species, nocturnal and crepuscular species, high-flying species passing over the islands (e.g., raptors, swallows) and strongly water-associated birds (e.g., cormorants). These records were recorded during monitoring, including some of them being on the shore of the island or high-flying above the island, and some nocturnal species were just spotted by accident.
We described more details about how to exclude species on Lines 379-387:
“We excluded non-breeding species, nocturnal and crepuscular species, high-flying species passing over the islands (e.g., raptors, swallows) and strongly water-associated birds (e.g., cormorants) from our record. First, our surveys were conducted during the day, so some nocturnal and crepuscular species, such as the owls and nightjars were excluded for inadequate survey design. Second, wagtail, kingfisher, and water birds such as ducks and herons were excluded because we were only interested in forest birds. Third, birds like swallows, and eagles who were usually flying or soaring in the air rather than staying on islands, were also excluded as it was difficult to determine their definite belonging islands. Following these operations, 60 species were finally retained.”
(15) Line 370: I suggest adding the range and median of STI.
Thanks for this good suggestion. The range, mean±SD of STI were already in the Results part, we added the median of STI there as well. The new sentence is now in Results part on Lines 137-139:
“The STI of all 60 birds averaged 19.94 ± 3.58 ℃ (mean ± SD) and ranged from 9.30 ℃ (Cuculus canorus) to 27.20 ℃ (Prinia inornate), with a median of 20.63 ℃ (Appendix 1—figure 2; Appendix 1—figure 3).”
(16) Figure 4.b: Is it possible to be more explicit about what that trend is? the coefficient of the regression Logit(ext/col) ~ year + ...... ?
Thank you for this advice. Your understanding is right: we can interpret it as the coefficient of the ‘year’ effect in the model. More specifically, the ‘year’ effect or temporal trend here is the ‘posterior mean’ of the posterior distribution of ‘year’ in the MSOM (Multi-species Occupancy Model), in the context of the Bayesian framework. We modified this sentence on Lines 811-813:
“ Each point in (b) represents the posterior mean estimate of year in colonization, extinction or occupancy rate for each species.”
(17) Figure 6: is it possible to provide an easily understandable meaning of the prior presented in the Y axis? E.g. "2 corresponds to a 90% probability for a species to go extinct at T+1", if not, please specify that it is the logit of a probability.
Thank you for this question both in Public Review and here. The value on the Y axis indicates the posterior mean of each variable (year, area, isolation and their interaction effects) extracted from the MSOM model, where the logit(extinction rate) or logit(colonization rate) was the response variable. All variables were standardized before analysis to make them comparable. So, positive values indicate positive influence while negative values indicate negative influence. Because the goal of Figure 6 is to display the negative/positive effect, we didn’t back-transform them. Following your advice, we thus modified the caption of Figure 6 (now renumbered as Figure 5, following a comment from Reviewer #3, to move Figure 5 to Figure 4c). The modified title and legends of Figure 5 are on Lines 817-820:
“Figure 5. Posterior estimates of logit-scale parameters related to cold-adapted species’ extinction rates and warm-adapted species’ colonization rates. Points are species-specific posterior means on the logit-scale, where parameters >0 indicate positive effects (on extinction [a] or colonization [b]) and parameters <0 indicate negative effects.”
(18) Line 773: points in blue only are significant? I suggest "points in color".
Thank you for your reminder. Points in blue and orange are all significant. We have revised the sentence on Line 823:
“Points in blue/orange indicate significant effects.”
These are all small suggestions that may help you improve the readability of the final manuscript. I warmly thank you for the opportunity to review this impressive study.
We appreciate your careful review and profound suggestions. We believe these modifications will improve the final manuscript.
Reviewer #3 (Recommendations For The Authors):
I have a few minor suggestions for paper revision for your otherwise excellent manuscript. I wish to emphasize that it was a pleasure to read the manuscript and that I especially enjoyed a very nice flow throughout the ms from a nicely rounded introduction that led well into the research questions and hypotheses all the way to a good and solid discussion.
Thank you very much for your review and recognition. We have carefully checked all recommendations and addressed them in the manuscript.
(1) L 63: space before the bracket missing and I suggest moving the reference to the end of the sentence (directly after habitat fragmentation does not seem to make sense).
Thank you very much for this suggestion. The missed space was added, and the reference has been moved to the end of the sentence. We also add a general definition of habitat fragmentation. The new sentence is on Lines 61-64:
“Habitat fragmentation, usually defined as the shifts of continuous habitat into spatially isolated and small patches (Fahrig, 2003), in particular, has been hypothesized to have interactive effects with climate change on community dynamics.”
(2) L 102: I suggest to write "benefitting ..." instead.
Done.
(3) L 103: higher extinction rates (add "s").
Done.
(4) L 104: this should probably say "emigrate" and "climate warming".
Done.
(5) L 130-133: this is true for emigration (more isolated islands show slower emigration). But what about increased local extinction, especially for small and isolated islands? Especially since you mentioned later in the manuscript that often emigration and extinction are difficult to identify or differentiate. Might be worth a thought here or somewhere in the discussion?
Thank you for this good question. I would like to answer it in two aspects:
Yes, we can’t distinguish between true local extinction and emigration. The observed local “extinction” of cold-adapted species over 10 years may involve two processes that usually occur in order: first “emigration” and then, if can’t emigrate or withstand, “real local dieback”. Over 10 years, the cold-adapted species would have to tolerate before real extinction on remote islands because of disperse limitation, while on less isolated islands it would be easy to emigrate and find a more suitable habitat for the same species. Consequently, it’s harder for us to observe “extinction” of species on more isolated islands, while it’s easier to observe “fake extinct” of species on less isolated islands due to emigration. As a result, the observed extinction rate is expected to increase more sharply for species on less remote islands, while the observed extinction rate is expected to increase relatively moderately for the same species on remote islands.
We have modified the legend of Figure 1 on Lines 780-781:
“Note that extinction here may include both the emigration of species and then the local extinction of species.”
There is also one part in the Discussion that mentions this on Lines 287-291: “While we cannot truly distinguish in our system between local extinction and emigration, we suspect that given two islands equal except in isolation, if both lose suitability due to climate change, individuals can easily emigrate from the island nearer to the mainland, while individuals on the more isolated island would be more likely to be trapped in place until the species went locally extinct due to a lack of rescue”.
Besides, you said “But what about increased local extinction, especially for small and isolated islands?”, I think you are mentioning the “high extinction rate per se on remote islands”. We want to test the “trend” of extinction rate on a temporal scale, rather than the extinction rate per se on a spatial scale. Even though species have a high extinction rate on remote islands, it can also show a slower changing rate in time.
I hope these answers solve the problem.
(6) L 245: I think this is the first time the acronym appears in the ms (as the methods come after the discussion), so please write the full name here too.
Thank you for pointing out this. I realized “Thousand Island Lake” appears for the first time in the last paragraph of the Introduction part. So we add “TIL” there on Lines 108-109:
“Here, we use 10 years of bird community data in a subtropical land-bridge island system (Thousand Island Lake, TIL, China, Figure 2) during a period of consistent climatic warming.”
(7) L 319: this section could end with a summary statement on idiosyncratic responses (i.e. some variation in the responses you found among the species) and the potential reasons for this, such as e.g. the role of other species traits or interactions, as well as other ways to measure habitat fragmentation (see main comments in public review).
Thank you for this suggestion both in Public Review and here. We added a summary statement about the reasons for idiosyncratic responses on Lines 334-338:
“Overall, these idiosyncratic responses reveal several possible mechanisms in regulating species' climate responses, including resource demands and biological interactions like competition and predation. Future studies are needed to take these factors into account to understand the complex mechanisms by which habitat loss meditates species range shifts.”
We only strengthen “habitat loss” here, because idiosyncratic responses mainly come from the mediating effect of habitat loss. For the mediating effect of isolation, the response is relatively consistent (see Page 8, Lines 183-188): “In particular, the effect of isolation on temporal dynamics of thermophilization was relatively consistent across cold- and warm-adapted species (Figure 5a, b); specifically, on islands nearer to the mainland, warm-adapted species (15 out of 15 investigated species) increased their colonization probability at a higher rate over time, while most cold-adapted species (21 out of 23 species) increased their extinction probability at a higher rate”.
(8) L 333: what about the distance to other islands? it's more of a network than a island-mainland directional system (Figure 2). You could address this aspect in the discussion.
Thank you for this good question again. Isolation can be measured in different ways in the study region. We chose distance to the mainland because it was the best predictor of colonization and extinction rate of breeding birds in the study region, and produced similar results like the other distance-based measures, including distance to the nearest landmass, distance to the nearest larger landmass (Si et al., 2014). We still agree with you that it’s necessary to consider more aspects of “isolation” at least in discussion for future research. In Discussion part, we addressed these on Lines 292-299. For more details refer to the response to Public Review.
(9) Figure 2: Is B1 one of the sampled islands? It is clearly much larger than most other islands and I think it could thus serve as an important population source for many of the adjacent smaller islands? Thus, the nearest neighbor distance to B1 could be as important in addition to the distance to the mainland?
Yes, B1 is one of the sampled islands and is also the biggest island. In previous research in our study system, we tried distance to the nearest landmass, to the nearest larger landmass and the nearest mainland, they produced similar results (For more details refer to the response to Public Review). We agree with you that the nearest neighbor distance to B1 could be a potentially important measure, but need further research. In our Discussion, we address these on Lines 292-299:
“As a caveat, we only consider the distance to the nearest mainland as a measure of fragmentation, consistent with previous work in this system (Si et al., 2014), but we acknowledge that other distance-based metrics of isolation that incorporate inter-island connections could reveal additional insights on fragmentation effects. The spatial arrangement of islands, like the arrangement of habitat, can influence niche tracking of species (Fourcade et al., 2021). Future studies should take these metrics into account to thoroughly understand the influence of isolation and spatial arrangement of patches in mediating the effect of climate warming on species.”
(10) L 345: 20km/h walking seems impressively fast? I assume this is a typo.
Sorry for the carelessness, it should be 2.0 km/h. it has been corrected on Lines 375-376:
“In each survey, observers walked along each transect at a constant speed (2.0 km/h) and recorded all the birds seen or heard on the survey islands.”
(11) L 485: I had difficulties fully understanding the models that were fitted here and could not find them in the codes you provided (which were otherwise very well documented!). Could you explain this modeling step in a bit more detail?
Thank you for your recognition! According to Line 485 in the online PDF version (Methods part 4.6.3), it says: “An increasing colonization trend of warm-adapted species and increasing extinction trend of cold-adapted species are two main expected processes that cause thermophilization (Fourcade et al., 2021). To test our third prediction about the mediating effect of habitat fragmentation, we selected warm-adapted species that had an increasing trend in colonization rate (positive year effect in colonization rate) and cold-adapted species that had an increasing extinction rate (positive year effect in extinction rate)…..”
We carefully checked the code in Figshare link and found that the MOSM JAGS code was not uploaded before. Very sorry for that. Now it can be found in the document [MOSM.R] at https://figshare.com/s/7a16974114262d280ef7. Hope the code, together with the modeling process in section 4.5 in the Methods can help to understand the whole modeling process. Besides, we would like to explain how to decide the temporal trend in colonization or extinction of each species related to Line 485. Let’s take the model of species-specific extinction rate for example:
In this model, “Island” was a random effect, “Year” is added as a random slope, thus allowing “year effect” (that is: the temporal trend) of extinction rate of species to vary with “island”. Further, the interaction effect between island variables (isolation, area) was added to test if the “year effect” was related to island area or isolation.
Because we are only interested in warm-adapted species that have a positive temporal trend in colonization and cold-adapted species that have a positive temporal trend in extinction, which are two main processes underlying thermophilizaiton, we choose warm-adapted species that have a positive year-effect in colonization, and cold-adapted species that has a positive year-effect in extinction. Hope this explanation and the JAGS code can help if you are confused about this part.
Hope these explanations can make it clearer.
(12) Figure 1: to me, it would be more intuitive to put the landscape configuration in the titles of the panels b, c, and d instead of "only" the mechanisms. E.g. they could be: a) fragmented islands with low climate buffering; b) small islands with low habitat heterogeneity; c) isolated islands with dispersal limitations?
It is also slightly confusing that the bird communities are above "island" in the middle of the three fragmented habitats - which all look a bit different in terms of tree species and structure which makes the reader first think that it has something to do with the "new" species community. so maybe worth rethinking how to illustrate the three fragmented islands?
We would like to thank you for your nice proposition. Firstly, it’s a good idea to put the landscape configuration in the title of the panels b, c, d. The new title (a) is “Fragmented islands with low climate buffering”, title (b) is “Small islands with low habitat heterogeneity”, and title (c) is “Isolated patches with dispersal limitations”.
Second, we realized that putting the “bird community” above “island” in the middle of the three patches is a bit confusing. Actually, we wanted to show bird communities only on that one island in the middle. The other two patches are only there to represent a fragmented background. To avoid misunderstanding, we added a sentence in the legend of Figure 1 on Lines 778-780:
“The three distinct patches signify a fragmented background and the community in the middle of the three patches was selected to exhibit colonization-extinction dynamics in fragmented habitats.”
(13) Figure 4: please add the description of the color code for panel a.
Sorry for the unclear description. The vertical dashed line indicates the median value of STI for 60 species, as a separation of warm-adapted species and cold-adapted species. We have added these details on Lines 807-809:
“The dotted vertical line indicates the median of STI values. Cold-adapted species are plotted in blue and warm-adapted species are plotted in orange.”
(14) Figure 5: You could consider adding this as panel c to Figure 4 as it depicts the same thing as in 4a but for CTI-abundance.
Thank you for this advice. We have moved the original Figure 5 to Figure 4c. Previous Figure 6 thus turned into Figure 5. All corresponding citations in the main text were checked to adapt to the new index. The new figure is now on Lines 801-815:
References
Ferraz, G., Russell, G. J., Stouffer, P. C., Bierregaard Jr, R. O., Pimm, S. L., & Lovejoy, T. E. (2003). Rates of species loss from Amazonian forest fragments. Proceedings of the National Academy of Sciences, 100(24), 14069-14073. doi:10.1073/pnas.2336195100
Fourcade, Y., WallisDeVries, M. F., Kuussaari, M., van Swaay, C. A., Heliölä, J., & Öckinger, E. (2021). Habitat amount and distribution modify community dynamics under climate change. Ecology Letters, 24(5), 950-957. doi:10.1111/ele.13691
Gaüzère, P., Princé, K., & Devictor, V. (2017). Where do they go? The effects of topography and habitat diversity on reducing climatic debt in birds. Global Change Biology, 23(6), 2218-2229. doi:10.1111/gcb.13500
Gonzalez, A. (2000). Community relaxation in fragmented landscapes: the relation between species richness, area and age. Ecology Letters, 3(5), 441-448. doi:10.1046/j.1461-0248.2000.00171.x
Haddad, N. M., Brudvig, L. A., Clobert, J., Davies, K. F., Gonzalez, A., Holt, R. D., . . . Collins, C. D. (2015). Habitat fragmentation and its lasting impact on Earth’s ecosystems. Science advances, 1(2), e1500052. doi:10.1126/sciadv.1500052
Richard, B., Dupouey, J. l., Corcket, E., Alard, D., Archaux, F., Aubert, M., . . . Macé, S. (2021). The climatic debt is growing in the understorey of temperate forests: Stand characteristics matter. Global Ecology and Biogeography, 30(7), 1474-1487. doi:10.1111/geb.13312
Si, X., Pimm, S. L., Russell, G. J., & Ding, P. (2014). Turnover of breeding bird communities on islands in an inundated lake. Journal of Biogeography, 41(12), 2283-2292. doi:10.1111/jbi.12379
-
eLife Assessment
This fundamental study substantially advances our understanding of how habitat fragmentation and climate change jointly influence bird community thermophilization in a fragmented island system. The authors provide convincing evidence using appropriate and validated methodologies to examine how island area and isolation affect the colonization of warm-adapted species and the extinction of cold-adapted species. While minor clarifications regarding the definition of fragmentation could further enhance the presentation, the study is of high interest to ecologists and conservation biologists, as it provides insight into how ecosystems and communities respond to climate change.
-
Reviewer #3 (Public review):
Summary:
Juan Liu et al. investigated the interplay between habitat fragmentation and climate-driven thermophilization in birds in an island system in China. They used extensive bird monitoring data (9 surveys per year per island) across 36 islands of varying size and isolation from the mainland covering 10 years. The authors use extensive modeling frameworks to test a general increase of the occurrence and abundance of warm-dwelling species and vice versa for cold-dwelling species using the widely used Community Temperature Index (CTI), as well the relationship between island fragmentation in terms of island area and isolation from the mainland on extinction and colonization rates of cold- and warm-adapted species. They found that indeed there was thermophilization happening during the last 10 years, which was more pronounced for the CTI based on abundances and less clearly for the occurrence based metric. Generally, the authors show that this is driven by an increased colonization rate of warm-dwelling and an increased extinction rate of cold-dwelling species. Interestingly, they unravel some of the mechanisms behind this dynamic by showing that warm-adapted species increased while cold-dwelling decreased more strongly on smaller islands, which is - according to the authors - due to lowered thermal buffering on smaller islands (which was supported by air temperature monitoring done during the study period on small and large islands). They argue, that the increased extinction rate of cold-adapted species could also be due to lowered habitat heterogeneity on smaller islands. With regards to island isolation, they show that also both thermophilization processes (increase of warm and decrease of cold-adapted species) was stronger on islands closer to the mainland, due to closer sources to species populations of either group on the mainland as compared to limited dispersal (i.e. range shift potential) in more isolated islands.
The conclusions drawn in this study are sound, and mostly well supported by the results. Only few aspects leave open questions and could quite likely be further supported by the authors themselves thanks to their apparent extensive understanding of the study system.
Strengths:
The study questions and hypotheses are very well aligned with the methods used, ranging from field surveys to extensive modeling frameworks, as well as with the conclusions drawn from the results. The study addresses a complex question on the interplay between habitat fragmentation and climate-driven thermophilization which can naturally be affected by a multitude of additional factors than the ones included here. Nevertheless, the authors use a well balanced method of simplifying this to the most important factors in question (CTI change, extinction, colonization, together with habitat fragmentation metrics of isolation and island area). The interpretation of the results presents interesting mechanisms without being too bold on their findings and by providing important links to the existing literature as well as to additional data and analyses presented in the appendix.
Weaknesses:
The metric of island isolation based on distance to the mainland seems a bit too oversimplified as in real-life the study system rather represents an island network where the islands of different sizes are in varying distances to each other, such that smaller islands can potentially draw from the species pools from near-by larger islands too - rather than just from the mainland. Although the authors do explain the reason for this metric, backed up by earlier research, a network approach could be worthwhile exploring in future research done in this system. The fact, that the authors did find a signal of island isolation does support their method, but the variation in responses to this metric could hint on a more complex pattern going on in real-life than was assumed for this study.
-
-
www.biorxiv.org www.biorxiv.org
-
eLife assessment
This proof-of-concept study focuses on an A->G DNA base editing strategy that converts CAG repeats to CAA repeats in the human HTT gene, which causes Huntington's disease (HD). These studies are conducted in human HEK293 cells engineered with a 51 CAG canonical repeat and in HD knock-in mice harboring 105+ CAG repeats. The findings of this study are valuable for the HD field, applying state-of-the-art techniques. However, the key experiments have yet to be performed in neuronal systems or brains of these mice: actual disease-rectifying effects relevant to patients have yet to observed, leaving the work incomplete.
-
-
www.biorxiv.org www.biorxiv.org
-
eLife assessment
This study presents a useful examination of the prevalence of interactions between amino acids from different periods of Earth's history and coenzymes. While the premise of this work is well founded, the data lend themselves to alternative interpretations, suggesting that the main conclusions might be incompletely supported by the findings. The work would benefit from the inclusion of additional supplementary data and further analysis. This manuscript would be of interest to evolutionary biologists and biophysicists.
-
-
www.biorxiv.org www.biorxiv.org
-
eLife assessment
This is a valuable study of the mechanisms of microtubule organization in pancreatic islet beta cells that enable optimal insulin secretion. Using a combination of live imaging and photo-kinetic assays in an in vitro culture system, the authors provide solid evidence to demonstrate that kinesin-1-mediated microtubule sliding, which has previously been known from neurons and embryos, is essential for establishing the sub-membranous microtubule band in response to glucose levels in beta cells. The inclusion of an animal model or primary cells, as well as data on the physiological relevance of the finding, would have strengthened the study. The work will be of interest to cell biologists studying cytoskeletal dynamics and organelle trafficking and to translational biologists working on diabetes.
-
-
www.biorxiv.org www.biorxiv.org
-
eLife Assessment
In this valuable paper, the authors created a reporter mouse line in which the Axon Initial Segment (AIS) is intrinsically labeled by an ankyrin-G-GFP fusion protein activated by Cre recombinase, tagging the native Ank3 gene. Using confocal, superresolution, and two-photon microscopy as well as whole-cell patch-clamp recordings in vitro, ex vivo, and in vivo, the authors convincingly document that the subcellular scaffold of the AIS and electrophysiological parameters of labeled cells remain unchanged. They further uncover rapid AIS remodeling following increased network activity in this model system, as well as highly reproducible in vivo labeling of AIS over weeks.
-
-
www.biorxiv.org www.biorxiv.org
-
eLife Assessment
This in several parts valuable study confirms the roles of Dact1 and Dact2, two factors involved in Wnt signaling, during zebrafish gastrulation and demonstrates their genetic interactions with other Wnt components to modulate craniofacial morphologies. Unfortunately, there are several limitations associated with the study, making it challenging to distinguish the primary and secondary effects of each factor, and their roles in craniofacial morphogenesis. The findings of a new potential target of dact1/2-mediated Wnt signaling are potentially of value; however, experimental evidence supporting their functional significance remains incomplete due to inconsistent results and limitations inherent to the overexpression approach.
-
Reviewer #2 (Public review):
Summary:
Non-canonical Wnt signaling plays an important role in morphogenesis, but how different components of the pathway are required to regulate different developmental events remains an open question. This paper focuses on elucidating the overlapping and distinct functions of dact1 and dact2, two Dishevelled-binding scaffold proteins, during zebrafish axis elongation and craniofacial development. By combining genetic studies, detailed phenotypic analysis, lineage tracing, and single cell RNA-sequencing, the authors aimed to understand (1) the relative function of dact1/2 in promoting axis elongation, (2) their ability to modulate phenotypes caused by mutations in other non-canonical wnt components, and (3) pathways downstream of dact1/2.
Corroborating previous findings, this paper showed that dact1/2 is required for convergent extension during gastrulation and body axis elongation. Qualitative evidence was also provided to support dact1/2's role in genetically modulating non-canonical wnt signaling to regulate body axis elongation and the morphology of the ethmoid plate (EP). However, the spatiotemporal function of dact1/2 remains unknown. The use of scRNA-seq identified novel pathways and targets downstream of dact1/2. Calpain 8 is one such example, and its overexpression in some of the dact1/2+/- embryos was able to phenocopy the dact1/2-/- mutant EP morphology, pointing to its sufficiency in driving the EP phenotype in a few embryos. However, the same effect was not observed in dact1-/-; dact2+/- embryos, leading to the question of how significant calpain 8 really is in this context. The requirement of calpain 8 in mediating the phenotype is unclear as well. This is the most novel aspect of the paper, but some weaknesses remain in convincingly demonstrating the importance of calpain 8.
Strengths:
(1) The generation of dact1/2 germline mutants and the use of genetic approaches to dissect their genetic interactions with wnt11f2 and gpc4 provide unambiguous and consistent results that inform the relative functions of dact1 and dact2, as well as their combined effects.<br /> (2) Because the ethmoid plate exhibits a spectrum of phenotypes in different wnt genetic mutants, it is a useful system for studying how tissue morphology can be modulated by different components of the wnt pathway.<br /> (3) The authors leveraged lineage tracing by photoconversion to dissect how dact1/2 differentially impacts the ability of different cranial neural crest populations to contribute to the ethmoid plate. This revealed that distinct mechanisms via dact1/2 and shh can lead to similar phenotypes.<br /> (4) The use of scRNA-seq was a powerful approach and identified potential novel pathways and targets downstream of dact1/2.
Weaknesses:
(1) Connecting the expression of dact1/2 and wnt11f2 to their mutant phenotypes: Given that dact1/2 and wnt11f2 expression are quite distinct, at least in the stages examined, the claim that dact1/2 function downstream of wnt11f2 is not well supported. That conclusion was based on shared craniofacial phenotypes between dact1/2-/-, wnt11f2-/-, and dact1/2-/-;wnt11f2-/- mutants. However, because the craniofacial phenotype is likely a secondary effect of dact1/2 deletion, using it to interpret the signaling axis between dact1/2 and wnt11f2 is not appropriate.<br /> (2) Spatiotemporal function of dact1/2: Germline mutations limit the authors' ability to study a gene's spatiotemporal functional requirement. They, therefore, cannot concretely attribute nor separate early-stage phenotypes (during gastrulation) to/from late stage phenotypes (EP morphological changes), which the authors postulated to result from secondary defects in floor plate and eye field morphometry. As a result, whether dact1/2 are directly involved in craniofacial development is not addressed, and the mechanisms resulting in the craniofacial phenotypes are also unclear.<br /> (3) The functional significance of calpain 8: Because calpain 8 was upregulated in many dact1/2-/- mutant cell populations (although not in the neural crest) during gastrulation, the authors tested its function by overexpressing capn8 mRNA in embryos. While only 1 out of 142 calpain 8-overexpressing wild type animals phenocopied dact1/2 mutants, 7.5% of dact1/2+/- embryos overexpressing capn8 exhibited dact1/2-like phenotypes. However, the same effect was not observed in dact1-/-; dact2+/- embryos. Given the expression pattern of calpain 8 and results from the overexpression study, the function of capn8 remains inconclusive. The requirement of calpain 8 in driving the phenotype remains unclear. The authors stated these limitations in their study.
-
Reviewer #3 (Public review):
Summary:
In this manuscript the authors explore the roles of dact1 and dact2 during zebrafish gastrulation and craniofacial development. Previous studies used morpholino (MO) knockdowns to show that these scaffolding proteins, which interact with dissheveled (Dsh), are expressed during zebrafish gastrulation and suggested that dact1 promotes canonical Wnt/B-catenin signaling, while dact2 promotes non-canonical Wnt/PCP-dependent convergent-extension (Waxman et al 2004). This study goes beyond this work by creating loss-of-function mutant alleles for each gene and unlike the MO studies finds little (dact2) to no (dact1) phenotypic defects in the homozygous mutants. Interestingly, dact1/2 double mutants have a more severe phenotype, which resembles those reported with MOs as well as homozygous wnt11/silberblick (wnt11/slb) mutants that disrupt non-canonical Wnt signaling (Heisenberg et al., 1997; 2000). Further analyses in this paper try to connect gastrulation and craniofacial defects in dact1/2 mutants with wnt11/slb and other wnt-pathway mutants. scRNAseq conducted in mutants identifies calpain 8 as a potential new target of dact1/2 and Wnt signaling.
Previous comments:<br /> Strengths:
When considered separately the new mutants are an improvement over the MOs and the paper contains a lot of new data.
Weaknesses:
However, the hypotheses are very poorly defined and misinterpret key previous findings surrounding the roles of wnt11 and gpc4, which results in a very confusing manuscript. Many of the results are not novel and focus on secondary defects. The most novel result overexpressing calpain8 in dact1/2 mutants is preliminary and not convincing.
The authors addressed some of our comments, but not our main criticisms, which we reiterate here:
(1) The authors argue that morpholino studies are unreliable and here they made new mutants to solve this uncertainty for dap 1/2. However, creating stable mutant lines to largely confirm previous results obtained by using morpholino knock-down phenotypes does not justify publication in eLife.
(2) The authors argue that since it has not been shown conclusively that craniofacial defects in wnt11 and dap1/2 mutants are secondary to gastrulation defects there is no solid evidence preventing them from investigating these craniofacial defects. However, since it is extremely likely that the rod-like ethmoid plates of wnt11f2- and dact1/2 mutants focused on here are secondary to gastrulation defects previously described by others (Heisenberg and NussleinVolhard 1997; Waxman et al., 2004), the burden of proof is on the authors to provide much stronger evidence against this interpretation.
(3) The data for calpain overexpression remains too preliminary.
-
Author response:
The following is the authors’ response to the previous reviews.
Reviewer #1 (Recommendations For The Authors):
This is not a recommendation. While reading old literature, I found some interesting facts. The shape of the neurocranium in monotremes, birds, and mammals, at least in early stages, resembles the phenotype of 'dact'1/2, wnt11f2, or syu mutants. For more details, see DeBeer's: 'The Development of the Vertebrate Skull, !937' Plate 137.
Thank you for pointing this out. It is indeed interesting.
Minor Comments:
• Lines 64, 66, and 69: same citation without interruption: Heisenberg, Brand et al. 1996
Revised line 76.
• Lines 101 and 102: same citation without interruption: Li, Florez et al. 2013
Revised line 118.
• Lines 144, 515, 527, and 1147: should be wnt11f2 instead of wntllf2 - if not, then explain
Revised lines 185, 625, 640,1300.
• Lines 169 and 171: incorrect figure citation: Fig 1D - correct to Fig 1F
Revised lines 217, 219.
• Line 173: delete (Fig. S1)
Revised line 221.
• Line 207: indicate that both dact1 and dact2 mRNA levels increased, noting a 40% higher level of dact2 mRNA after deletion of 7 bp in the dact2 gene
Revised line 265.
• Line 215: Fig 1F instead of Fig 1D
Revised line 217.
• Line 248: unify naming of compound mutants to either dact1/2 or dact1/dact2 compound mutants
Revised to dact1/2 throughout.
• Line 259: incorrect figure citation: Fig S1 - correct to Fig S2D/E
Revised line 324.
• Line 302: correct abbreviation position: neural crest (NCC) cell - change to neural crest cell (NCC) population
Revised line 380.
• Line 349: repeating kny mut definition from line 70 may be unnecessary
Revised line 434.
• Line 351: clarify distinction between Fig S1 and Fig S2 in the supplementary section
Revised line 324.
• Line 436: refer to the correct figure for pathways associated with proteolysis (Fig 7B)
Revised line 530.
• Line 446-447: complete the sentence and clarify the relevance of smad1 expression, and correct the use of "also" in relation to capn8
Revised line 567.
• Line 462: clarify that this phenotype was never observed in wildtype larvae, and correct figure reference to exclude dact1+/- dact2+/-
Revised line 563, 568.
• Line 463: explain the injection procedure into embryos from dact1/2+/- interbreeding
Revised line 565.
• Lines 488 and 491: same citation without interruption: Waxman, Hocking et al. 2004
Revised line 591.
• Line 502: maintain consistency in referring to TGF-beta signaling throughout the article
Revised throughout.
• Line 523: define CNCC; previously used only NCC
Revised to cranial NCC throughout.
• Line 1105: reconsider citing another work in the figure legend
Revised line 1249.
• Line 1143: consider using "mutant" instead of "mu"
Revised line 1295.
• Fig 2A/B: indicate the number of animals used ("n")
N is noted on line 1274.
• Fig 2C, D, E: ensure uniform terminology for control groups ("wt" vs. "wildtype")
Revised in figure.
• Fig 7C: clarify analysis of dact1/2-/- mutant in lateral plate mesoderm vs. ectoderm
Revised line 1356.
• Fig 8A: label the figure to indicate it shows capn8, not just in the legend
Revised.
• Fig 8D: explain the black/white portions and simplify to highlight important data
Revised.
• Fig S2: add the title "Figure S2"
Revised.
• Consider omitting the sentence: "As with most studies, this work has contributed some new knowledge but generated more questions than answers."
Revised line 720.
Reviewer #2 (Recommendations For The Authors):
Major comments:
(1) The authors have addressed many of the questions I had, including making the biological sample numbers more transparent. It might be more informative to use n = n/n, e.g. n = 3/3, rather than just n = 3. Alternatively, that information can be given in the figure legend or in the form of penetrance %.
The compound heterozygote breeding and phenotyping analyses were not carried out in such a way that we can comment on the precise % penetrance of the ANC phenotype, as we did not dissect every ANC and genotype every individual that resulted from the triple heterozygote in crossings. We collected phenotype/genotype data until we obtained at least three replicates.
We did genotype every individual resulting from dact1/2 dHet crosses to correlate genotype to the phenotype of the embryonic convergent extension phenotype and narrowed ethmoid plate (Fig. 2A, Fig. 3) which demonstrated full penetrance.
(2) The description of the expression of dact1/2 and wnt11f2 is not consistent with what the images are showing. In the revised figure 1 legend, the author says "dact2 and wnt11f2 transcripts are detected in the anterior neural plate" (line 1099)", but it's hard to see wnt11f2 expression in the anterior neural plate in 1B. The authors then again said " wnt11f2 is also expressed in these cells", referring to the anterior neural plate and polster (P), notochord (N), paraxial and presomitic mesoderm (PM) and tailbud (TB). However, other than the notochord expression, other expression is actually quite dissimilar between dact2 and wnt11f2 in 1C. The authors should describe their expression more accurately and take that into account when considering their function in the same pathway.
We have revised these sections to more carefully describe the expression patterns. We have added references to previous descriptions of wnt11 expression domains.
(3) Similar to (2), while the Daniocell was useful in demonstrating that expression of dact1 and dact2 are more similar to expression of gpc4 and wnt11f2, the text description of the data is quite confusing. The authors stated "dact2 was more highly expressed in anterior structures including cephalic mesoderm and neural ectoderm while dact1 was more highly expressed in mesenchyme and muscle" (lines 174-176). However, the Daniocell seems to show more dact1 expression in the neural tissues than dact2, which would contradict the in situ data as well. I think the problem is in part due to the dataset contains cells from many different stages and it might be helpful to include a plot of the cells at different stages, as well as the cell types, both of which are available from the Daniocell website.
We have revised the text to focus the Daniocell analysis on the overall and general expression patterns. Line 220.
(4) The authors used the term "morphological movements" (line 337) to describe the cause of dact1/2 phenotypes. Please clarify what this means. Is it cell movement? Or is it the shape of the tissues? What does "morphological movements" really mean and how does that affect the formation of the EP by the second stream of NCCs?
We have revised this sentence to improve clarity. Line 416.
(5) In the first submission, only 1 out of 142 calpain-overexpressing animals phenocopied dact1/2 mutants and that was a major concern regarding the functional significance of calpain 8 in this context. In the revised manuscript, the authors demonstrated that more embryos developed the phenotype when they are heterozygous for both dact1/2. While this is encouraging, it is interesting that the same phenomenon was not observed in the dact1-/-; dact2+/- embryos (Fig. 6D). The authors did not discuss this and should provide some explanation. The authors should also discuss sufficiency vs requirement tested in this experiment. However, given that this is the most novel aspect of the paper, performing experiments to demonstrate requirements would be important.
We have added a statement regarding the non-effect in dact1-/-;dact2+/- embryos. Line 568-570. We have also added discussion of sufficiency vs necessity/requirement testing. Line 676-679.
(6) Related to (5), the authors cited figure 8c when mentioning 0/192 gfp-injected embryos developed EP phenotypes. However, figure 8c is dact1/2 +/- embryos. The numbers also doesn't match the numbers in Figure 8d either. Please add relevant/correct figures.
The text has been revised to distinguish between our overexpression experiment in wildtype embryos (data not shown) versus overexpression in dact1/2 double het in cross embryos (Fig 8).
Minor comments:
(1) Fig 1 legend line 1106 "the midbrain (MP)" should be MB
Revised line 1250.
(2) Wntllf2, instead of wnt11f2, (i.e. the letter "l" rather than the number "1") was used in 4 instances, line 144, 515, 527, 1147
Revised lines 185, 625, 640,1300.
(3) The authors replaced ANC with EP in many instances, but ANC is left unchanged in some places and it's not defined in the text. It's first mentioned in line 170.
Revised line 218.
-
-
www.biorxiv.org www.biorxiv.org
-
eLife Assessment
This important work presents a consolidated overview of the NeuroML2 open community standard and provides convincing evidence for its central role within a broader software ecosystem for the development of neuronal models that are open, shareable, reproducible, and interoperable. A major strength of the work is the continued development over more than two decades to establish, maintain, and adapt this standard to meet the evolving needs of the field. This work is of broad interest to the sub-cellular, cellular, computational, and systems neuroscience communities undertaking studies involving theory, modeling, and simulation.
-
Reviewer #1 (Public review):
Summary:
The manuscript gives a broad overview of how to write NeuroML, a brief description of how to use it with different simulators and for different purposes - cells to networks, simulation, optimization and analysis. From this perspective it can be an extremely useful document to introduce new users to NeuroML.
Strengths:
The modularity of NeuroML is indeed a great advantage. For example, the ability to specify the channel file allows different channels to be used with different morphologies without redundancy. The hierarchical nature of NeuroML also is commendable, and well illustrated.
The number of tools available to work with NeuroML is impressive.
Having a python API and providing examples using this API is fantastic. Exporting to NeuroML from python is also a great feature.
The tutorials should assist additional scientists in adopting NeuroML.
Weaknesses:
None noted.
-
Reviewer #2 (Public review):
Summary:
Developing neuronal models that are shareable, reproducible, and interoperable allows the neuroscience community to make better use of published models and to collaborate more effectively. In this manuscript, the authors present a consolidated overview of the NeuroML model description system along with its associated tools and workflows. They describe where different components of this ecosystem lay along the model development pathway and highlight resources, including documentation and tutorials, to help users employ this system.
Strengths:
The manuscript is well-organized and clearly written. It effectively uses the delineated model development life cycle steps, presented in Figure 1, to organize its descriptions of the different components and tools relating to NeuroML. It uses this framework to cover the breadth of the software ecosystem and categorize its various elements. The NeuroML format is clearly described, and the authors outline the different benefits to its particular construction. As primarily a means of describing models, NeuroML also depends on many other software components to be of high utility to computational neuroscientists; these include simulators (ones that both pre-date NeuroML and those developed afterwards), visualization tools, and model databases.
Overall, the rationale for the approach NeuroML has taken is convincing and well-described. The pointers to existing documentation, guides, and the example usages presented within the manuscript are useful starting points for potential new users. This manuscript can also serve to inform potential users of features or aspect of the ecosystem that they may have been unaware of, which could lower obstacles to adoption. While much of what is presented is not new to this manuscript, it still serves as a useful resource for the community looking for information about an established, but perhaps daunting, set of computational tools.
Weaknesses:
The manuscript in large part catalogs the different tools and functionalities that have been produced through the long development cycle of NeuroML. Overall, the interoperability of NeuroML is a benefit, but it does increase the complexity of choices facing users entering into the ecosystem.
In many respects this is an intractable fact of the current environment, but the authors do try to mitigate the issue with user guides (e.g., Table 1) and example code (e.g. Box 1) which address a range of target user audiences, from those learning about the ecosystem for the first time to those looking to implement specific model features. They also categorize different simulator options (Figure 5) and provide feature comparisons (Table 3), which could assist with the most daunting choice faced by new users.
Comments on revised version:
The authors have addressed my major concerns with the original manuscript. The discussion of simulators in particular is much clearer now, and the manuscript has been restructured so that specific details pertinent to a much more focused audience have been rewritten or shifted to more appropriate locations.
-
Author response:
The following is the authors’ response to the original reviews.
Public Reviews:
Reviewer #1 (Public Review):
Summary:
The manuscript gives a broad overview of how to write NeuroML, and a brief description of how to use it with different simulators and for different purposes - cells to networks, simulation, optimization, and analysis. From this perspective, it can be an extremely useful document to introduce new users to NeuroML.
We are glad the reviewer found our manuscript useful.
However, the manuscript itself seems to lose sight of this goal in many places, and instead, the description at times seems to target software developers. For example, there is a long paragraph on the board and user community. The discussion on simulator tools seems more for developers, not users. All the information presented at the level of a developer is likely to be distracting to eLife readership.
To make the paper less developer focussed and more accessible to the end user we have shortened the long paragraphs on the board and user community (and moved some of this text to the Methods section; lines: 524-572 in the document with highlighted changes). We have also made the discussion on simulator tools more focussed on the user (lines 334-406). However, we believe some information on the development and oversight of NeuroML and its community base are relevant to the end user, so we have not removed these completely from the main text.
Strengths:
The modularity of NeuroML is indeed a great advantage. For example, the ability to specify the channel file allows different channels to be used with different morphologies without redundancy. The hierarchical nature of NeuroML also is commendable, and well illustrated in Figures 2a through c.
The number of tools available to work with NeuroML is impressive.
The abstract, beginning, and end of the manuscript present and discuss incorporating NeuroML into research workflows to support FAIR principles.
Having a Python API and providing examples using this API is fantastic. Exporting to NeuroML from Python is also a great feature.
We are glad the reviewer appreciated the design of NeuroML and its support for FAIR principles.
Weaknesses:
Though modularity is a strength, it is unclear to me why the cell morphology isn't also treated similarly, i.e., specify the morphology of a multi-compartmental model in a separate file, and then allow the cell file to specify not only the files containing channels, but also the file containing the multi-compartmental morphology, and then specify the conductance for different segment groups. Also, after pynml_write_neuroml2_file, you would not have a super long neuroML file for each variation of conductances, since there would be no need to rewrite the multi-compartmental morphology for each conductance variation.
We thank the reviewer for highlighting this shortcoming in NeuroML2. We have now added the ability to reference externally defined (e.g. in another file) <morphology> and <biophysicalProperties> elements from <cells>. This has enabled the morphologies and/or specification of ionic conductances to be separated out and enables more streamlined analysis of cells with different properties, as requested. Simulators NEURON, NetPyNE and EDEN already support this new form. Information on this feature has been added to https://docs.neuroml.org/Userdocs/ImportingMorphologyFiles.html#neuroml2 and also mentioned in the text (lines 188-190).
This would be especially important for optimizations, if each trial optimization wrote out the neuroML file, then including the full morphology of a realistic cell would take up excessive disk space, as opposed to just writing out the conductance densities. As long as cell morphology must be included in every cell file, then NeuroML is not sufficiently modular, and the authors should moderate their claim of modularity (line 419) and building blocks (551).
We believe the new functionality outlined above addresses this issue, as a single file containing the <morphology> element could be referenced, while a much smaller file, containing the channel distributions in a <biophysicalProperties> element would be generated and saved on each iteration of the optimisation.
In addition, this is very important for downloading NeuroML-compliant reconstructions from NeuroMorpho.org. If the cell morphology cannot be imported, then the user has to edit the file downloaded from NeuroMorpho.org, and provenance can be lost.
While the NeuroMorpho.Org website does support converting reconstructed morphologies in SWC format to NeuroML, this export feature is no longer supported on most modern browsers due to it being based on Java Applet technologies. However, a desktop version of this application, CVApp, is actively maintained
(https://github.com/NeuroML/Cvapp-NeuroMorpho.org), and we have updated it to support export of the SWC to the standalone <morphology> element form of NeuroML discussed above. Additionally, a new Python application for conversion of SWC to NeuroML is in development and will be incorporated into PyNeuroML (Google Summer of Code 2024). Our documentation has been updated with the recommended use of SWC in NeuroML based modelling here: https://docs.neuroml.org/Userdocs/Software/Tools/SWC.html
We have also included URLs to the tool and the documentation in the paper (lines: 473-474).
SWC files, however, cannot be used “as is” for modelling since they only include information (often incomplete—for example a single point may represent a soma in SWC files) on the points that make the cell, but not on the sections/segments/cables that these form. Therefore, NeuroML and other simulation tools, including NEURON, must convert these into formats suitable for simulation. The suggested pipeline for use of NeuroMorpho SWC files would therefore be to convert them to NeuroML, check that they represent the intended compartmentalisation of the neuron and then use them in models.
To ensure that provenance is maintained in all NeuroML models (including conversions from other formats), NeuroML supports the addition of RDF annotations using the COMBINE annotation specifications in model files:
https://docs.neuroml.org/Userdocs/Provenance.html. We have added this information to the paper (lines: 464-465).
Also, Figure 2d loses the hierarchical nature by showing ion channels, synapses, and networks as separate main branches of NeuroML.
While an instance of an ion channel is on a segment, in a cell, in a population (and hence there is a hierarchy between them), in terms of layout in a NeuroML file the ion channel is defined at the “top level” so that it can be referenced and used by multiple cells, the cell definitions are also defined top level, and used in multiple populations, etc. There are multiple ways to depict these relationships between entities, and we believe Fig 2d complements Fig 2a-c (which is more hierarchical), by emphasising the different categories of entities present in NeuroML files. We have modified the caption of Figure 2d to clarify that it shows the main categories of elements included in the NeuroML standard in their respective hierarchies.
In Figure 5, the difference between the core and native simulator is unclear.
We have modified the figure and text (lines: 341) to clarify this. We now say “reference” simulators instead of “core”. This emphasises that jNeuroML and pyLEMS are intended as reference implementations in each of their languages of how to interpret NeuroML models, as opposed to high performance simulators for research use. We have also updated the categorization of the backends in the text accordingly.
What is involved in helper scripts?
Simulators such as NetPyNE can import NeuroML into their own internal format, but require some boilerplate code to do this (e.g. the NetPyNE scripts calls the importNeuroML2SimulateAnalyze() method with appropriate parameters). The NeuroML tools generate short scripts that use this boilerplate code. We have renamed “helper scripts” to “import scripts'' for clarity (Figure 5 and its caption).
I thought neurons could read NeuroML? If so, why do you need the export simulator-specific scripts?
The NEURON simulator does have some NeuroML functionality (it can export cells, though not the full network, to NeuroML 2 through its ModelView menu), but does not natively support reading/importing of NeuroML in its current version. But this is not a problem as jNeuroML/PyNeuroML translates the NeuroML model description into NEURON’s formats: Python scripts/HOC/Nmodl which NEURON then executes.
As NEURON is the simulator which allows simulation of the widest range of NeuroML elements, we have (in agreement with the NEURON developers) concentrated on incorporating the best support for NeuroML import/export in the latest (easy to install/update) releases of PyNeuroML, rather than adding this to the Neuron source code. NEURON’s core features have been very stable for years and many versions of the simulator are used by modellers - installing the latest PyNeuroML gives them the latest NEURON support without having to reinstall the latter.
In addition, it seems strange to call something the "core" simulation engine, when it cannot support multi-compartmental models. It is unclear why "other simulators" that natively support NeuroML cannot be called the core.
We agree that this terminology was confusing. As mentioned above, we have changed “core simulator” to “reference simulator”, to emphasise the roles of these simulation engine options.
It might be more helpful to replace this sort of classification with a user-targeted description. The authors already state which simulators support NeuroML and which ones need code to be exported. In contrast, lines 369-370 mention that not all NeuroML models are supported by each simulator. I recommend expanding this to explain which features are supported in each simulator. Then, the unhelpful separation between core and native could be eliminated.
As suggested, we have grouped the simulators in terms of function and removed the core/ non-core distinction. We have also added a table (Table 3) in the appendices that lists what features each simulation engine supports and updated the text to be more user focussed (lines: 348-394).
The body of the manuscript has so much other detail that I lose sight of how NeuroML supports FAIR. It is also unclear who is the intended audience. When I get to lines 336-344, it seems that this description is too much detail for the eLife audience. The paragraph beginning on line 691 is a great example of being unclear about who is the audience. Does someone wanting to develop NeuroML models need to understand XSD schema? If so, the explanation is not clear. XSD schema is not defined and instead explains NeuroML-specific aspects of XSD. Lines 734-735 are another example of explaining to code developers (not model developers).
We have modified these sentences to be more suitable for the general eLife audience: we have moved the explanation of how the different simulator backends are supported to the more technically detailed Methods section (lines 882-942).
While the results sections focus on documenting what users can do with NeuroML, the Methods sections include information on “how” the NeuroML and software ecosystem function. While the information in the methods sections may not be required by users who want to use the standard NeuroML model elements, those users looking to extend NeuroML with their own model entities and/or contribute these for inclusion in the NeuroML standard will require some understanding of how the schema and component types work.
We have tried to limit this information to the bare minimum, pointing to online documentation where appropriate. XSD schemas are, for example, briefly introduced at the beginning of the section “The NeuroML XML Schema”. We have also included a link to the W3C documentation on XSD schemas as a footnote (line 724).
Reviewer #2 (Public Review):
Summary:
Developing neuronal models that are shareable, reproducible, and interoperable allows the neuroscience community to make better use of published models and to collaborate more effectively. In this manuscript, the authors present a consolidated overview of the NeuroML model description system along with its associated tools and workflows. They describe where different components of this ecosystem lay along the model development pathway and highlight resources, including documentation and tutorials, to help users employ this system.
Strengths:
The manuscript is well-organized and clearly written. It effectively uses the delineated model development life cycle steps, presented in Figure 1, to organize its descriptions of the different components and tools relating to NeuroML. It uses this framework to cover the breadth of the software ecosystem and categorize its various elements. The NeuroML format is clearly described, and the authors outline the different benefits of its particular construction. As primarily a means of describing models, NeuroML also depends on many other software components to be of high utility to computational neuroscientists; these include simulators (ones that both pre-date NeuroML and those developed afterwards), visualization tools, and model databases.
Overall, the rationale for the approach NeuroML has taken is convincing and well-described. The pointers to existing documentation, guides, and the example usages presented within the manuscript are useful starting points for potential new users. This manuscript can also serve to inform potential users of features or aspects of the ecosystem that they may have been unaware of, which could lower obstacles to adoption. While much of what is presented is not new to this manuscript, it still serves as a useful resource for the community looking for information about an established, but perhaps daunting, set of computational tools.
We are glad the reviewer appreciated the utility of the manuscript.
Weaknesses:
The manuscript in large part catalogs the different tools and functionalities that have been produced through the long development cycle of NeuroML. As discussed above, this is quite useful, but it can still be somewhat overwhelming for a potential new user of these tools. There are new user guides (e.g., Table 1) and example code (e.g. Box 1), but it is not clear if those resources employ elements of the ecosystem chosen primarily for their didactic advantages, rather than general-purpose utility. I feel like the manuscript would be strengthened by the addition of clearer recommendations for users (or a range of recommendations for users in different scenarios).
To make Table 1 more accessible to users and provide recommendations we have added the following new categories: Introductory guides aimed at teaching the fundamental
NeuroML concepts; Advanced guides illustrating specific modelling workflows; and Walkthrough guides discussing the steps required for converting models to NeuroML. Box 1 has also been improved to clearly mark API and command line examples.
For example, is the intention that most users should primarily use the core NeuroML tools and expand into the wider ecosystem only under particular circumstances? What are the criteria to keep in mind when making that decision to use alternative tools (scale/complexity of model, prior familiarity with other tools, etc.)? The place where it seems most ambiguous is in the choice of simulator (in part because there seem to be the most options there) - are there particular scenarios where the authors may recommend using simulators other than the core jNeuroML software?
The interoperability of NeuroML is a major strength, but it does increase the complexity of choices facing users entering into the ecosystem. Some clearer guidance in this manuscript could enable computational neuroscientists with particular goals in mind to make better strategic decisions about which tools to employ at the outset of their work.
As mentioned in the response to Reviewer 1, the term “core simulator” for jNeuroML was confusing, as it suggested that this is a recommended simulation tool. We have changed the description of jNeuroML to a “reference simulator” to clarify this (Figure 5 and lines 341, 353).
In terms of giving specific guidance on which simulator to use, we have focussed on their functionality and limitations rather than recommending a specific tool (as simulator independent standards developers we are not in a position to favour particular simulators). While NEURON is the most widely used simulator currently, other simulation opinions (e.g. EDEN) have emerged recently which provide quite comprehensive NeuroML support and similar performance. Our approach is to document and promote all supported tools, while encouraging innovation and new developments. The new Table 3 in the Appendix gives a guide to assist users in choosing which simulator may best suit their needs and we have updated the text to include a brief description (lines 348-394).
Recommendations for the authors:
Reviewer #1 (Recommendations For The Authors):
I do not understand what the $comments mean in Box 1. It isn't until I get further in the text that I realize that those are command line equivalents to the Python commands.
We thank the reviewer for highlighting this confusion. We’ve now explicitly marked the API usage and command line usage example columns to make this clearer. We have also used “>” instead of “$” now to indicate the command line,
In Figure 9 Caption "Examples of analysis functions ..", the word analysis seems a misnomer, as these graphs all illustrate the simulation output and graphing of existing variables. I think analysis typically refers to the transformation of variables, such as spike counts and widths.
To clarify this we have changed the caption to “Examples of visualizing biophysical properties of a NeuroML model neuron”.
Figure 10: Why is the pulse generator part of a model? Isn't that the input to a model?
Whether the input to the model is described separately from the NeuroML biophysical description or combined with it is a choice for the researcher. This is possible because in NeuroML any entity which has time varying states can be a NeuroML element, including the current pulse generator. In this simple example the input is contained within the same file (and therefore <neuroml> element) as the cell. However, this does not need to be the case. The cell could be fully specified in its own NeuroML file and then this can be included in other files which add different inputs to facilitate different simulation scenarios. The Python scripting interface facilitates these types of workflows.
In the interest of modularity, can stim information be stored in a separate file and "included"?
Yes, as mentioned above, the stimulus could be stored in a separate file.
I find it strange to use a cell with mostly dimensionless numbers as an example. I think it would be more helpful to use a model that was more physiological.
In choosing an example model type to use to illustrate the use of LEMS (Fig 12), NeuroML (Fig 10), XML Schema (Fig 11), the Python API (Fig 13) and online documentation (Fig 15), we needed an example which showed a sufficiently broad range of concepts (dimensional parameters, state variables, time derivatives), but which is sufficiently compact to allow a concise depiction of the key elements in figures, that fit in a single page (e.g. Fig 12). We felt that the Hindmarsh Rose model, while not very physiological, was well suited for this purpose (explaining the underlying technologies behind the NeuroML specification). The simplicity of the Hindmarsh Rose model is counterbalanced in the manuscript by the detailed models of neurons and circuits in Figures 7 & 9. The latter shows a morphologically and biophysically detailed cortical L5b pyramidal cell model.
In lines 710-714, it is unclear what is being validated. That all parameters are defined? Using the units (or lack thereof) defined in the schema?
Validation against the schema is “level 1” validation where the model structure, parameters, parameter values and their units, cardinality, and element positioning in the model hierarchy are checked. We have updated the paragraph to include this information and to also point to Figure 6 where different levels of validation are explained.
Lines 740 to 746 are confusing. If 1-1 between XSD and LEMS (1st sentence) then how can component types be defined in LEMS and NOT added to the standard? Which is it? 1-1 or not 1-1?
For the curated model elements included in the NeuroML standard, there will be a 1-1 correspondence between their component type definitions in LEMS and type definitions in the XSD schema. New user defined component types (e.g. a new abstract cell model) can be specified in LEMS as required, and these do not need to be included in the XSD schema to be loaded/simulated. However, since they are not present in the schema definition of the core/curated elements, they cannot be validated against it (level 1 validation). We have modified the text to make this clearer (line: 778).
Nonetheless, if the new type is useful for the wider community, it can be accepted by the Editorial Board, and at that stage it will be incorporated into the core types, and added to the Schema, to be part of “valid NeuroML”.
Figure 12. select="synapses[*]/i" is not explained. Does /i mean that iSyn is divided by i, which is current (according to the sentence 3 lines after 766) or perhaps synapse number?
We thank the reviewer for highlighting this confusion. We have now explained the construct in the text (lines 810-812). It denotes “select the i (current) values from all Attachments which have the id ‘synapses’”. These multiple values should be reduced down to a single value through addition, as specified by the attribute: reduce=”add”.
The line after 766 says that "DerivedVariables, variables whose values depend on other variables". You should add "and that are not derivatives, which are handled separately" because by your definition derivatives are derived variables.
Thank you. We have updated the text with your suggestion
Reviewer #2 (Recommendations For The Authors):
- Figure 9: I found it somewhat confusing to have the header from the screenshot at the top ("Layer 5 Burst Accommodating Double Bouquet Cell (5)") not match the morphology shown at the bottom. It's not visually clear that the different panels in Figure 9 may refer to unrelated cells/models.
Thank you for pointing this out. We have replaced the NeuroML-DB screenshot with one of the same Layer 5b pyramidal cells shown in the panels below it.
Additional change:
Figure 7c (showing the NetPyNE-UI interface) has been replaced. Previously, this displayed a 3D model which had been created in NetPyNE itself, but now shows a model which has been created in NeuroML and imported for display/simulation in NetPyNE-UI, and therefore better illustrates NeuroML functionality.
-
-
www.biorxiv.org www.biorxiv.org
-
eLife Assessment
This useful study uses an intranasal mouse infection model with Streptococcus suis, a gram-positive bacterial pathogen that causes severe losses in pigs around the world. The manuscript provides insights that the capsular polysaccharide, one of the virulence factors of this pathogen, contributes to tissue dissemination and neurotropism in the host. However, the evidence is currently incomplete, and further experiments and careful interpretation of the current results and methods used are necessary to support the conclusions of the manuscript.
-
Reviewer #1 (Public review):
Summary:
The manuscript by Wang et al. investigates the interesting relationship between Streptococcus suis (S. suis) growth phases and levels of virulence factor, specifically the capsular polysaccharide (CPS), in the bacterial cell wall. S. suis is a gram positive bacterial pathogen that causes important losses in the swine industry worldwide. Interestingly, S. suis is also a resident bacteria in the pig tonsils. Vaccination against bacterial infections such as S. suis can be difficult, and understanding how the serotype of a bacterial pathogen impacts what body sites are infected and the dynamics of pathogen dissemination is critical. In this case, this manuscript looks at neuroinvasion of S. suis following intranasal delivery because this pathogen causes meningitis in infected hosts. Further, understanding host - pathogen interactions at early time points in the upper respiratory tract may have broad implications for vaccine development.
The authors use an understudied mouse intranasal infection model of S. suis to connect growth phase related CPS abundance to the pathogenicity of the bacteria in the nose and blood.
Adoptive transfer of serum against either CPS or V5 (five other virulence factors) supports the idea that S. suis CPS levels are an important factor that shapes how this bacterium reaches different organs.
Some conclusions are not completely supported by the present data, and at times the manuscript is disjoint and hard to follow. While the work has some interesting observations, additional experiments and controls are warranted to support the claims of the manuscript .
Strengths:
The model of intranasal infection is compelling to expand upon work previously done in vitro and with systemic routes of infection. The histology and fluorescent imaging of the olfactory epithelium and olfactory bulb complement work in figure 2 about the attachment of S. Suis to epithelial cells and the bacterial burden over time in different organs of figure 3. Histology was performed at 1 hour and 9 days after intranasal infection with stationary phase S. Suis and drives home that this pathogen can invade the olfactory nerve and may potentially cause bacterial meningitis seen in some infected swine.
The adoptive transfer of either anti-CPS or anti-V5 to mice before infection at both longer (12 hr), and shorter (1 hr) time points is useful to demonstrate that the changes in cell wall composition between the NALT/CSF and blood compartments result in different efficacy in clearing bacteria from those locations. This is fundamental for the development of vaccines for the swine industry and begs those developing other bacterial vaccines to consider what virulence factors are the most useful as neutralizing antibody targets at the sight of bacterial invasion.
Demonstrating that the amount of CPS within the cell wall of S. suis is related to the growth phase of the bacteria is an important consideration for vaccine development. While others had previously shown that CPS levels were higher in the blood than in the CNS, and that CPS decreases the invasion of epithelial cells, the close look at the olfactory epithelium at an early time point of 1 hr ties together in vitro findings. The control of a CPS-negative strain was critical to understanding their findings. The location and the microbial community that bacterial pathogens live within may change the growth phase and therefore also the cell wall components.
Weaknesses:
While the authors present compelling data that is relevant to the development of anti-bacterial vaccinations, the data does not completely match their assertions and there are places where some further investigation would further the impact of their interesting study.
Major concerns for the manuscript:
-The intranasal infections were done with S. suis in the stationary phase which has been shown to have less CPS on the cell wall. While this mimics the literature that shows S. Suis to have less CPS in the CNS, the difference in the pathogenesis of a log phase vs. stationary phage intranasal infection would be interesting. Especially because the bacteria is a part of the natural microbial community of swine tonsils, it is curious if the change in growth phase and therefore CPS levels may be a causative reason for pathogenic invasion in some pigs.
-The authors should consider taking the bacteria from NALT/CSF and blood and compare the lag times bacteria from different organs take to enter a log growth phase to show whether the difference in CPS is because S. suis in each location is in a different growth phase. If log phase bacteria were intranasally delivered, would it adapt a stationary phase life strategy? How long would that take?
-Authors should be cautious about claims about S. suis downregulating CPS in the NALT for increased invasion and upregulating CPS to survive phagocytosis in blood. While it is true that the data shows that there are different levels of CPS in these locations, the regulation and mechanism of the recorded and observed cell wall difference are not investigated past the correlation to the growth phase.
- The mouse model used in this manuscript is useful but cannot reproduce the nasal environment of the natural pig host. It is not clear if the NALTs of pigs and mice have similar microbial communities and how this may affect the pathogenesis of S. Suis in the mouse. Because the authors show a higher infection rate in the mouse with acetic acid, they may want to consider investigating what the mouse NALT microenvironment is naturally doing to exclude more bacterial invasion. Is it simply a host mismatch or is there something about the microbiome or steady-state immune system in the nose of mice that is different from pigs?
-I have some concerns regarding the images shown for neuroinvasion because I think the authors mistake several compartments of the mouse nasal cavity as well as the olfactory bulb. These issues are critical because neuroinvasion is one of the major conclusions of this work.
-
Reviewer #2 (Public review):
In this manuscript from Wang et al., the authors seek to examine the role of capsular polysaccharides (CPS) in invasive S. suis pathogenesis. They show that CPS thickness variations associate with isolation from different compartments within the infected mouse and that CPS promotes resistance to blood borne immune mechanisms. The authors conclude that thick CPS inhibits colonization/invasion of the NALT and rather antisera against non-CPS. These results are interesting and thought provoking and provide the continued basis for future experiments that delve further into immune mechanisms. However, there are serious concerns about data collection and interpretation that require further data to provide an accurate conclusion. Some of these concerns are highlighted below:
In figure 2, the authors conclude that high levels of CPS confer resistance to phagocytic killing in blood exposed S. suis. However, it seems equally likely that this is resistance against complement mediated killing. It would be important to compare S. suis killing in animals depleted of complement components (C3 and C5-9).
Intranasal administration non-CPS antisera provides a nice contrast to intravenous administration, especially in light of the recently identified "blood-olfactory barrier". Can the authors provide any insight into how long and where this antibody would be located after intranasal administration? Would this be antibody mediated cellular resistance, or something akin to simple antibody "neutralization"
The micrographs in Figure 7 depict anatomy from the respiratory mucosa. While there is no histochemical identification of neurons, the tissues labeled OE are almost certainly not olfactory and in fact respiratory. However, more troubling is that in figures 7A,a,b,e, and f, the lateral nasal organ has been labeled as the olfactory bulb. This undermines the conclusion of CNS invasion, and also draws into question other experiments in which the brain and CSF are measured.
Micrographs of brain tissue in 7B are taken from distal parts of the brain, whereas if olfactory neuroinvasion were occurring, the bacteria would be expected to arrive in the olfactory bulb. It's also difficult to understand how an inflammatory process would be developed to this point in the brain -even if we were looking at the appropriate region of the brain -within an hour of inoculation (is there a control for acetic acid induced brain inflammation?). Some explanations about the speed of the immune responses recorded are warranted.
The detected presence of S. suis in the CSF 0.5hr following intranasal inoculation is difficult to understand from an anatomical perspective. This is especially true when the amount of S. suis is nearly the same as that found within the NALT. Even motile pathogens would need far longer than 0.5hr to get into the brain, so it's exceedingly difficult to understand how this could occur so extensively in under an hour. The authors are quantifying CSF as anything that comes out of the brain after mincing. Firstly, this should more accurately be referred to as "brain", not CSF. Secondly, is it possible that the lateral nasal organ -which is mistakenly identified as olfactory bulb in figure 7- is being included in the CNS processing? This would explain the equivalent amounts of S. suis in NALT and "CSF".
To support their conclusions about neuroinvasion along the olfactory route and /CSF titer the authors should provide more compelling images to support this conclusion: sections stained for neurons and S. suis, images of the actual olfactory bulb (neurons, glomerular structure etc).
-
-
www.biorxiv.org www.biorxiv.org
-
eLife Assessment
This is an important study examining the role of conserved PCH-2 protein at different stages of C. elegans meiosis. The authors use elegant molecular genetic approaches to provide convincing evidence to support their claims. The work will be of interest to scientists studying meiosis, DNA recombination, and chromosome segregation.
-
Reviewer #1 (Public review):
The conserved AAA-ATPase PCH-2 has been shown in several organisms including C. elegans to remodel classes of HORMAD proteins that act in meiotic pairing and recombination. In some organisms the impact of PCH-2 mutations is subtle but becomes more apparent when other aspects of recombination are perturbed. Patel et al. performed a set of elegant experiments in C. elegans aimed at identifying conserved functions of PCH-2. Their work provides such an opportunity because in C. elegans meiotically expressed HORMADs localize to meiotic chromosomes independently of PCH-2. Work in C. elegans also allows the authors to focus on nuclear PCH-2 functions as opposed to cytoplasmic functions also seen for PCH-2 in other organisms.
The authors performed the following experiments:
(1) They constructed C. elegans animals with SNPs that enabled them to measure crossing over in intervals that cover most of four of the six chromosomes. They then showed that double-crossovers, which were common on most of the four chromosomes in wild-type, were absent in pch-2. They also noted shifts in crossover distribution in the four chromosomes.
(2) Based on the crossover analysis and previous studies they hypothesized that PCH-2 plays a role at an early stage in meiotic prophase to regulate how SPO-11 induced double-strand breaks are utilized to form crossovers. They tested their hypothesis by performing ionizing irradiation and depleting SPO-11 at different stages in meiotic prophase in wild-type and pch-2 mutant animals. The authors observed that irradiation of meiotic nuclei in zygotene resulted in pch-2 nuclei having a larger number of nuclei with 6 or greater crossovers (as measured by COSA-1 foci) compared to wildtype. Consistent with this observation, SPO11 depletion, starting roughly in zygotene, also resulted in pch-2 nuclei having an increase in 6 or more COSA-1 foci compared to wild type. The increased number at this time point appeared beneficial because a significant decrease in univalents was observed.
(3) They then asked if the above phenotypes correlated with the localization of MSH-5, a factor that stabilizes crossover-specific DNA recombination intermediates. They observed that pch-2 mutants displayed an increase in MSH-5 foci at early times in meiotic prophase and an unexpectedly higher number at later times. They conclude based on the differences in early MSH-5 localization and the SPO-11 and irradiation studies that PCH-2 prevents early DSBs from becoming crossovers and early loading of MSH-5. By analyzing different HORMAD proteins that are defective in forming the closed conformation acted upon by PCH-2, they present evidence that MSH-5 loading was regulated by the HIM-3 HORMAD.
(4) They performed a crossover homeostasis experiment in which DSB levels were reduced. The goal of this experiment was to test if PCH-2 acts in crossover assurance. Interestingly, in this background PCH-2 negative nuclei displayed higher levels of COSA-1 foci compared to PCH-2 positive nuclei. This observation and a further test of the model suggested that "PCH-2's presence on the SC prevents crossover designation."
(5) Based on their observations indicating that early DSBS are prevented from becoming crossovers by PCH-2, the authors hypothesized that the DNA damage kinase CHK-2 and PCH-2 act to control how DSBs enter the crossover pathway. This hypothesis was developed based on their finding that PCH-2 prevents early DSBs from becoming crossovers and previous work showing that CHK-2 activity is modulated during meiotic recombination progression. They tested their hypothesis using a mutant synaptonemal complex component that maintains high CHK-2 activity that cannot be turned off to enable crossover designation. Their finding that the pch-2 mutation suppressed the crossover defect (as measured by COSA-1 foci) supports their hypothesis.
Based on these studies the authors provide convincing evidence that PCH-2 prevents early DSBs from becoming crossovers and controls the number and distribution of crossovers to promote a regulated mechanism that ensures the formation of obligate crossovers and crossover homeostasis. As the authors note, such a mechanism is consistent with earlier studies suggesting that early DSBs could serve as "scouts" to facilitate homolog pairing or to coordinate the DNA damage response with repair events that lead to crossing over. The detailed mechanistic insights provided in this work will certainly be used to better understand functions for PCH-2 in meiosis in other organisms. My comments below are aimed at improving the clarity of the manuscript.
Comments
(1) It appears from reading the Materials and Methods that the SNPs used to measure crossing over were obtained by mating Hawaiian and Bristol strains. It is not clear to this reviewer how the SNPs were introduced into the animals. Was crossing over measured in a single animal line? Were the wild-type and pch-2 mutations made in backgrounds that were isogenic with respect to each other? This is a concern because it is not clear, at least to this reviewer, how much of an impact crossing different ecotypes will have on the frequency and distribution of recombination events (and possibly the recombination intermediates that were studied).
(2) The authors state that in pch-2 mutants there was a striking shift of crossovers (line 135) to the PC end for all of the four chromosomes that were tested. I looked at Figure 1 for some time and felt that the results were more ambiguous. Map distances seemed similar at the PC end for wildtype and pch-2 on Chrom. I. While the decrease in crossing over in pch-2 appeared significant for Chrom. I and III, the results for Chrom. IV, and Chrom. X. seemed less clear. Were map distances compared statistically? At least for this reviewer the effects on specific intervals appear less clear and without a bit more detail on how the animals were constructed it's hard for me to follow these conclusions.
(3) Figure 2. I'm curious why non-irradiated controls were not tested side-by-side for COSA-1 staining. It just seems like a nice control that would strengthen the authors' arguments.
(4) Figure 3. It took me a while to follow the connection between the COSA-1 staining and DAPI staining panels (12 hrs later). Perhaps an arrow that connects each set of time points between the panels or just a single title on the X-axis that links the two would make things clearer.
-
Reviewer #2 (Public review):
Summary:
This paper has some intriguing data regarding the different potential roles of Pch-2 in ensuring crossing over. In particular, the alterations in crossover distribution and Msh-5 foci are compelling. My main issue is that some of the models are confusingly presented and would benefit from some reframing. The role of Pch-2 across organisms has been difficult to determine, the ability to separate pairing and synapsis roles in worms provides a great advantage for this paper.
Strengths:
Beautiful genetic data, clearly made figures. Great system for studying the role of Pch-2 in crossing over.
Weaknesses:
(1) For a general audience, definitions of crossover assurance, crossover eligible intermediates, and crossover designation would be helpful. This applies to both the proposed molecular model and the cytological manifestation that is being scored specifically in C. Elegans.
(2) Line 62: Is there evidence that DSBs are introduced gradually throughout the early prophase? Please provide references.
(3) Do double crossovers show strong interference in worms? Given that the PC is at the ends of chromosomes don't you expect double crossovers to be near the chromosome ends and thus the PC?
(4) Line 155 - if the previous data in Deshong et al is helpful it would be useful to briefly describe it and how the experimental caveats led to misinterpretation (or state that further investigation suggests a different model etc.). Many readers are unlikely to look up the paper to find out what this means.
(5) Line 248: I am confused by the meaning of crossover assurance here - you see no difference in the average number of COSA-1 foci in Pch-2 vs. wt at any time point. Is it the increase in cells with >6 COSA-1 foci that shows a loss of crossover assurance? That is the only thing that shows a significant difference (at the one time point) in COSA-1 foci. The number of dapi bodies shows the loss of Pch-2 increases crossover assurance (fewer cells with unattached homologs). So this part is confusing to me. How does reliably detecting foci vs. DAPI bodies explain this?
(6) Line 384: I am confused. I understand that in the dsb-2/pch2 mutant there are fewer COSA-1 foci. So fewer crossovers are designated when DSBs are reduced in the absence of PCH-2. How then does this suggest that PCH-2's presence on the SC prevents crossover designation? Its absence is preventing crossover designation at least in the dsb-2 mutant.
(7) Discussion Line 535: How do you know that the crossovers that form near the PCs are Class II and not the other way around? Perhaps early forming Class I crossovers give time for a second Class II crossover to form. In budding yeast, it is thought that synapsis initiation sites are likely sites of crossover designation and class I crossing over. Also, the precursors that form class I and II crossovers may be the same or highly similar to each other, such that Pch-2's actions could equally affect both pathways.
-
Reviewer #3 (Public review):
Summary:
This manuscript describes an in-depth analysis of the effect of the AAA+ ATPase PCH-2 on meiotic crossover formation in C. elegant. The authors reach several conclusions, and attempt to synthesize a 'universal' framework for the role of this factor in eukaryotic meiosis.
Strengths:
The manuscript makes use of the advantages of the 'conveyor' belt system within the c.elegans reproductive tract, to enable a series of elegant genetic experiments.
Weaknesses:
A weakness of this manuscript is that it heavily relies on certain genetic/cell biological assays that can report on distinct crossover outcomes, without clear and directed control over other aspects and variables that might also impact the final repair outcome. Such assays are currently out of reach in this model system.
In general, this manuscript could be more generally accessible to non-C.elegans readers. Currently, the manuscript is hard to digest for non-experts (even if meiosis researchers). In addition, the authors should be careful to consider alternative explanations for certain results. At several steps in the manuscript, results could ostensibly be caused by underlying defects that are currently unknown (for example, can we know for sure that pch-2 mutants do not suffer from altered DSB patterning, and how can we know what the exact functional and genetic interactions between pch-2 and HORMAD mutants tell us?). Alternative explanations are possible and it would serve the reader well to explicitly name and explain these options throughout the manuscript.
-
Author response:
Public Reviews:
Reviewer #1 (Public review):
The conserved AAA-ATPase PCH-2 has been shown in several organisms including C. elegans to remodel classes of HORMAD proteins that act in meiotic pairing and recombination. In some organisms the impact of PCH-2 mutations is subtle but becomes more apparent when other aspects of recombination are perturbed. Patel et al. performed a set of elegant experiments in C. elegans aimed at identifying conserved functions of PCH-2. Their work provides such an opportunity because in C. elegans meiotically expressed HORMADs localize to meiotic chromosomes independently of PCH-2. Work in C. elegans also allows the authors to focus on nuclear PCH-2 functions as opposed to cytoplasmic functions also seen for PCH-2 in other organisms.
The authors performed the following experiments:
(1) They constructed C. elegans animals with SNPs that enabled them to measure crossing over in intervals that cover most of four of the six chromosomes. They then showed that doublecrossovers, which were common on most of the four chromosomes in wild-type, were absent in pch-2. They also noted shifts in crossover distribution in the four chromosomes.
(2) Based on the crossover analysis and previous studies they hypothesized that PCH-2 plays a role at an early stage in meiotic prophase to regulate how SPO-11 induced double-strand breaks are utilized to form crossovers. They tested their hypothesis by performing ionizing irradiation and depleting SPO-11 at different stages in meiotic prophase in wild-type and pch-2 mutant animals. The authors observed that irradiation of meiotic nuclei in zygotene resulted in pch-2 nuclei having a larger number of nuclei with 6 or greater crossovers (as measured by COSA-1 foci) compared to wildtype. Consistent with this observation, SPO11 depletion, starting roughly in zygotene, also resulted in pch-2 nuclei having an increase in 6 or more COSA-1 foci compared to wild type. The increased number at this time point appeared beneficial because a significant decrease in univalents was observed.
(3) They then asked if the above phenotypes correlated with the localization of MSH-5, a factor that stabilizes crossover-specific DNA recombination intermediates. They observed that pch-2
mutants displayed an increase in MSH-5 foci at early times in meiotic prophase and an unexpectedly higher number at later times. They conclude based on the differences in early MSH-5 localization and the SPO-11 and irradiation studies that PCH-2 prevents early DSBs from becoming crossovers and early loading of MSH-5. By analyzing different HORMAD proteins that are defective in forming the closed conformation acted upon by PCH-2, they present evidence that MSH-5 loading was regulated by the HIM-3 HORMAD.
(4) They performed a crossover homeostasis experiment in which DSB levels were reduced. The goal of this experiment was to test if PCH-2 acts in crossover assurance. Interestingly, in this background PCH-2 negative nuclei displayed higher levels of COSA-1 foci compared to PCH-2 positive nuclei. This observation and a further test of the model suggested that "PCH-2's presence on the SC prevents crossover designation."
(5) Based on their observations indicating that early DSBS are prevented from becoming crossovers by PCH-2, the authors hypothesized that the DNA damage kinase CHK-2 and PCH2 act to control how DSBs enter the crossover pathway. This hypothesis was developed based on their finding that PCH-2 prevents early DSBs from becoming crossovers and previous work showing that CHK-2 activity is modulated during meiotic recombination progression. They tested their hypothesis using a mutant synaptonemal complex component that maintains high CHK-2 activity that cannot be turned off to enable crossover designation. Their finding that the pch-2 mutation suppressed the crossover defect (as measured by COSA-1 foci) supports their hypothesis.
Based on these studies the authors provide convincing evidence that PCH-2 prevents early DSBs from becoming crossovers and controls the number and distribution of crossovers to promote a regulated mechanism that ensures the formation of obligate crossovers and crossover homeostasis. As the authors note, such a mechanism is consistent with earlier studies suggesting that early DSBs could serve as "scouts" to facilitate homolog pairing or to coordinate the DNA damage response with repair events that lead to crossing over. The detailed mechanistic insights provided in this work will certainly be used to better understand functions for PCH-2 in meiosis in other organisms. My comments below are aimed at improving the clarity of the manuscript.
We thank the reviewer for their concise summary of our manuscript and their assessment of our work as “convincing” and providing “detailed mechanistic insight.”
Comments
(1) It appears from reading the Materials and Methods that the SNPs used to measure crossing over were obtained by mating Hawaiian and Bristol strains. It is not clear to this reviewer how the SNPs were introduced into the animals. Was crossing over measured in a single animal line? Were the wild-type and pch-2 mutations made in backgrounds that were isogenic with respect to each other? This is a concern because it is not clear, at least to this reviewer, how much of an impact crossing different ecotypes will have on the frequency and distribution of recombination events (and possibly the recombination intermediates that were studied).
We will clarify these issues in the Materials and Methods of an updated preprint. The control and pch-2 mutants were isogenic in either the Bristol or Hawaiian backgrounds. Control lines were the original Bristol and Hawaiian lines and pch-2 mutants were originally made in the Bristol line and backcrossed at least 3 times before analysis. Hawaiian pch-2 mutants were made by backcrossing pch-2 mutants at least 7 times to the Hawaiian background and verifying the presence of Hawaiian SNPs on all chromosomes tested in the recombination assay. To perform the recombination assays, these isogenic lines were crossed to generate the relevant F1s.
(2) The authors state that in pch-2 mutants there was a striking shift of crossovers (line 135) to the PC end for all of the four chromosomes that were tested. I looked at Figure 1 for some time and felt that the results were more ambiguous. Map distances seemed similar at the PC end for wildtype and pch-2 on Chrom. I. While the decrease in crossing over in pch-2 appeared significant for Chrom. I and III, the results for Chrom. IV, and Chrom. X. seemed less clear. Were map distances compared statistically? At least for this reviewer the effects on specific intervals appear less clear and without a bit more detail on how the animals were constructed it's hard for me to follow these conclusions.
We hope that the added details above makes the results of these assays more clear. Map distances were compared and did not satisfy statistical significance, except where indicated. While we agree that the comparisons between control animals and pch-2 mutants may seem less clear with individual chromosomes, we argue that more general patterns become clear when analyzing multiple chromosomes. Indeed, this is why we expanded our recombination analysis beyond Chromosome III and the X Chromosomes, as reported in Deshong, 2014.
(3) Figure 2. I'm curious why non-irradiated controls were not tested side-by-side for COSA-1 staining. It just seems like a nice control that would strengthen the authors' arguments.
We will add these controls in the updated preprint.
(4) Figure 3. It took me a while to follow the connection between the COSA-1 staining and DAPI staining panels (12 hrs later). Perhaps an arrow that connects each set of time points between the panels or just a single title on the X-axis that links the two would make things clearer.
We will make changes in the updated preprint to make this figure more clear.
Reviewer #2 (Public review):
Summary:
This paper has some intriguing data regarding the different potential roles of Pch-2 in ensuring crossing over. In particular, the alterations in crossover distribution and Msh-5 foci are compelling. My main issue is that some of the models are confusingly presented and would benefit from some reframing. The role of Pch-2 across organisms has been difficult to determine, the ability to separate pairing and synapsis roles in worms provides a great advantage for this paper.
Strengths:
Beautiful genetic data, clearly made figures. Great system for studying the role of Pch-2 in crossing over.
We thank the reviewers for their constructive and useful summary of our manuscript and the analysis of its strengths.
Weaknesses:
(1) For a general audience, definitions of crossover assurance, crossover eligible intermediates, and crossover designation would be helpful. This applies to both the proposed molecular model and the cytological manifestation that is being scored specifically in C. elegans.
We will make these changes in an updated preprint.
(2) Line 62: Is there evidence that DSBs are introduced gradually throughout the early prophase? Please provide references.
We will reference Woglar and Villeneuve 2018 and Joshi et. al. 2015 to support this statement in the updated preprint.
(3) Do double crossovers show strong interference in worms? Given that the PC is at the ends of chromosomes don't you expect double crossovers to be near the chromosome ends and thus the PC?
Despite their rarity, double crossovers do show interference in worms. However, the PC is limited to one end of the chromosome. Therefore, even if interference ensures the spacing of these double crossovers, the preponderance of one of these crossovers toward one end (and not both ends) suggest something functionally unique about the PC end.
(4) Line 155 - if the previous data in Deshong et al is helpful it would be useful to briefly describe it and how the experimental caveats led to misinterpretation (or state that further investigation suggests a different model etc.). Many readers are unlikely to look up the paper to find out what this means.
We will add this to the updated preprint.
(5) Line 248: I am confused by the meaning of crossover assurance here - you see no difference in the average number of COSA-1 foci in Pch-2 vs. wt at any time point. Is it the increase in cells with >6 COSA-1 foci that shows a loss of crossover assurance? That is the only thing that shows a significant difference (at the one time point) in COSA-1 foci. The number of dapi bodies shows the loss of Pch-2 increases crossover assurance (fewer cells with unattached homologs). So this part is confusing to me. How does reliably detecting foci vs. DAPI bodies explain this?
We apologize for the confusion and will make this more clear in an updated perprint. The reviewer is correct that we do not see a difference in the average number of GFP::COSA1 foci at all time points in this experiment, even though we do see a difference in the number of DAPI stained bodies (an increase in crossover assurance in pch-2 mutants). What we meant to convey is that because of PCH-2’s dual role in regulating crossover formation (inhibiting it in early prophase, guaranteeing assurance later), the average number of GFP::COSA-1 foci at all time points also reflects this later role, resulting in this average being lower than if PCH-2 only inhibited crossovers early in meiotic prophase. We have shown that this later role does not significantly affect the average number of DAPI stained bodies, allowing us to see the role of PCH-2 in early meiotic prophase on crossover formation more clearly.
(6) Line 384: I am confused. I understand that in the dsb-2/pch2 mutant there are fewer COSA-1 foci. So fewer crossovers are designated when DSBs are reduced in the absence of PCH-2.
How then does this suggest that PCH-2's presence on the SC prevents crossover designation? Its absence is preventing crossover designation at least in the dsb-2 mutant.
We will also make this more clear in an updated preprint, as well as provide additional evidence to support this claim. In this experiment, we had identified three possible explanations for why PCH-2 persists on some nuclei that do not have GFP::COSA-1 foci: 1) PCH-2 removal is coincident with crossover designation; 2) PCH-2 removal depends on crossover designation; and 3) PCH-2 removal facilitates crossover designation. The decrease in the number of GFP::COSA-1 foci in dsb-2::AID;pch-2 mutants argues against the first two possibilities, suggesting that the third might be correct. We have additional evidence that we will include in an updated preprint that should provide stronger support and make this more clear.
(7) Discussion Line 535: How do you know that the crossovers that form near the PCs are Class II and not the other way around? Perhaps early forming Class I crossovers give time for a second Class II crossover to form. In budding yeast, it is thought that synapsis initiation sites are likely sites of crossover designation and class I crossing over. Also, the precursors that form class I and II crossovers may be the same or highly similar to each other, such that Pch-2's actions could equally affect both pathways.
We do not know that the crossovers that form near the PC are Class II but hypothesize that they are based on the close, functional relationship that exists between Class I crossovers and synapsis and the apparent antagonistic relationship that exists between Class II crossovers and synapsis. We agree that Class I and Class II crossover precursors are likely to be the same or highly similar, exhibit extensive crosstalk that may complicate straightforward analysis and PCH-2 is likely to affect both, as strongly suggested by our GFP::MSH-5 analysis. We present this hypothesis based on the apparent relationship between PCH-2 and synapsis in several systems but agree that it needs to be formally tested. We will make this argument more clear in an updated preprint.
Reviewer #3 (Public review):
Summary:
This manuscript describes an in-depth analysis of the effect of the AAA+ ATPase PCH-2 on meiotic crossover formation in C. elegant. The authors reach several conclusions, and attempt to synthesize a 'universal' framework for the role of this factor in eukaryotic meiosis.
Strengths:
The manuscript makes use of the advantages of the 'conveyor' belt system within the c.elegans reproductive tract, to enable a series of elegant genetic experiments.
We thank this reviewer for the useful assessment of our manuscript and the articulation of its strengths.
Weaknesses:
A weakness of this manuscript is that it heavily relies on certain genetic/cell biological assays that can report on distinct crossover outcomes, without clear and directed control over other aspects and variables that might also impact the final repair outcome. Such assays are currently out of reach in this model system.
In general, this manuscript could be more generally accessible to non-C.elegans readers. Currently, the manuscript is hard to digest for non-experts (even if meiosis researchers). In addition, the authors should be careful to consider alternative explanations for certain results. At several steps in the manuscript, results could ostensibly be caused by underlying defects that are currently unknown (for example, can we know for sure that pch-2 mutants do not suffer from altered DSB patterning, and how can we know what the exact functional and genetic interactions between pch-2 and HORMAD mutants tell us?). Alternative explanations are possible and it would serve the reader well to explicitly name and explain these options throughout the manuscript.
We will make the manuscript more accessible to non-C. elegans readers and discuss alternate explanations for specific results in an updated preprint.
-
-
www.biorxiv.org www.biorxiv.org
-
eLife Assessment
The manuscript provides important new insights into the mechanisms of statistical learning in early human development, showing that statistical learning in neonates occurs robustly and is not limited to linguistic features but occurs across different domains. The evidence is convincing, although an additional experimental manipulation with conflicting linguistic and non-linguistic information as well as further discussion about the linguistic vs non-linguistic nature of the stimulus materials would have strengthened the manuscript. The findings are highly relevant for researchers working in several domains, including developmental cognitive neuroscience, developmental psychology, linguistics, and speech pathology.
-
Reviewer #1 (Public review):
Summary:
Parsing speech into meaningful linguistic units is a fundamental yet challenging task that infants face while acquiring the native language. Computing transitional probabilities (TPs) between syllables is a segmentation cue well-attested since birth. In this research, the authors examine whether newborns compute TPs over any available speech feature (linguistic and non-linguistic), or whether by contrast newborns' favor the computation of TPs over linguistic content over non-linguistic speech features such as speaker's voice. Using EEG and the artificial language learning paradigm, they record the neural responses of two groups of newborns presented with speech streams in which either phonetic content or speaker's voice are structured to provide TPs informative of word boundaries, while the other dimension provides uninformative information. They compare newborns' neural responses to these structured streams to their processing of a stream in which both dimensions vary randomly. After the random and structured familiarization streams, the newborns are presented with (pseudo)words as defined by their informative TPs, as well as partwords (that is, sequences that straddle a word boundary), extracted from the same streams. Analysis of the neural responses shows that while newborns neural activity entrained to the syllabic rate (2 Hz) when listening to the random and structured streams, it additionally entrained at the word rate (4 Hz) only when listening to the structured streams, finding no differential response between the streams structured around voice or phonetic information. Newborns showed also different neural activity in response to the words and part words. In sum, the study reveals that newborns compute TPs over linguistic and non-linguistic features of speech, these are calculated independently, and linguistic features do not lead to a processing advantage.
Strengths:
This interesting research furthers our knowledge of the scope of the statistical learning mechanism, which is confirmed to be a general-purpose powerful tool that allows humans to extract patterns of co-occurring events while revealing no apparent preferential processing for linguistic features. To answer its question, the study combines a highly replicated and well-established paradigm, i.e. the use of an artificial language in which pseudowords are concatenated to yield informative TPs to word boundaries, with a state-of-the-art EEG analysis, i.e. neural entrainment. The sample size of the groups is sufficient to ensure power, and the design and analysis are solid and have been successfully employed before.
Weaknesses:
There are no significant weaknesses to signal in the manuscript. However, in order to fully conclude that there is no obvious advantage for the linguistic dimension in neonates, it would have been most useful to test a third condition in which the two dimensions were pitted against each other, that is, in which they provide conflicting information as to the boundaries of the words comprised in the artificial language. This last condition would have allowed us to determine whether statistical learning weighs linguistic and non-linguistic features equally, or whether phonetic content is preferentially processed.
To sum up, the authors achieved their central aim of determining whether TPs are computed over both linguistic and non-linguistic features, and their conclusions are supported by the results. This research is important for researchers working on language and cognitive development, and language processing, as well as for those working on cross-species comparative approaches.
-
Reviewer #2 (Public review):
Summary:
The manuscript investigates to what degree neonates show evidence for statistical learning from regularities in streams of syllables, either with respect to phonemes or with respect to speaker identity. Using EEG, the authors found evidence for both, stronger entrainment to regularities as well as ERP differences in response to violations of previously introduced regularities. In addition, violations of phoneme regularities elicited an ERP pattern which the authors argue might index a precursor of the N400 response in older children and adults.
Strengths:
All in all, this is a very convincing paper, which uses a clever manipulation of syllable streams to target the processing of different features. The combination of neural entrainment and ERP analysis allows for the assessment of different processing stages, and implementing this paradigm in a comparably large sample of neonates is impressive. I only have some smaller comments.
Weaknesses:
I am skeptical regarding the interpretation of the phoneme-specific ERP effect as a precursor of the N400 and would suggest toning it down. While the authors are correct in that infant ERP components are typically slower and more posterior compared to adult components, and the observed pattern is hence consistent with an adult N400, at the same time, it could also be a lot of other things. On a functional level, I can't follow the author's argument as to why a violation in phoneme regularity should elicit an N400, since there is no evidence for any semantic processing involved. In sum, I think there is just not enough evidence from the present paradigm to confidently call it an N400.
Why did the authors choose to include male and female voices? While using both female and male stimuli of course leads to a higher generalizability, it also introduces a second dimension for one feature that is not present for this other (i.e., phoneme for Experiment 1 and voice identity plus gender for Experiment 2). Hence, couldn't it also be that the infants extracted the regularity with which one gender voice followed the other? For instance, in List B, in the words, one gender is always followed by the other (M-F or F-M), while in 2/3 of the part-words, the gender is repeated (F-F and M-M). Wouldn't you expect the same pattern of results if infants learned regularities based on gender rather than identity?
Do you have any idea why the duplet entrainment effect occurs over the electrodes it does, in particular over the occipital electrodes (which seems a bit unintuitive given that this is a purely auditory experiment with sleeping neonates).
-
Reviewer #3 (Public review):
Summary:
This study is focused on testing whether statistical learning (a mechanism for parsing the speech signal into smaller chunks) preferentially operates over certain features of the speech at birth in humans. The features under investigation are phonetic content and speaker identity. Newborns are tested in an EEG paradigm in which they are exposed to a long stream of syllables. In Experiment 1, newborns are familiarized with a sound stream that comprises regularities (transitional probabilities) over syllables (e.g., "pe" followed by "tu" in "petu" with 1.0 probability) while the voices uttering the syllables remain random. In Experiment 2, newborns are familiarized with the same sound stream but, this time, the regularities are built over voices (e.g., "green voice" followed by "red voice" with 1.0 probability) while the concatenation of syllables stays random. At the test, all newborns listened to duplets (individual chunks) that either matched or violated the structure of the familiarization. In both experiments, newborns showed neural entrainment to the regularities implemented in the stream, but only the duplets defined by transitional probabilities over syllables (aka word forms) elicited a N400 ERP component. These results suggest that statistical learning operates in parallel and independently on different dimensions of the speech already at birth and that there seems to be an advantage for processing statistics defining word forms rather than voice patterns.
Strengths:
This paper presents an original experimental design that combines two types of statistical regularities in a speech input. The design is robust and appropriate for EEG with newborns. I appreciated the clarity of the Methods section. There is also a behavioral experiment with adults that acts like a control study for newborns. The research question is interesting, and the results add new information about how statistical learning works at the beginning of postnatal life, and on which features of the speech. The figures are clear and helpful in understanding the methods, especially the stimuli and how the regularities were implemented.
Weaknesses:
(1) I'm having a hard time understanding the link between the results of the study and the universality of statistical learning. The main goal of the study was testing whether statistical learning is a general mechanism for newborns that operates on any speech dimension, or whether it operates over linguistic features only. To test that, statistical regularities (TPs) were built over syllables (e.g., pe followed by tu in petu with 1.0 probability) or voices (e.g., green voice followed by red voice with 1.0 probability). Voices were considered as the non-linguistic dimension.
While it's true that voice is not essential for language (i.e., sign languages are implemented over gestures; the use of voices to produce non-linguistic sounds, like laughter), it is a feature of spoken languages. Thus I'm not sure if we can really consider this study as a comparison between linguistic and non-linguistic dimensions. In turn, I'm not sure that these results show that statistical learning at birth operates on non-linguistic features, being voices a linguistic dimension at least in spoken languages. I'd like to hear the authors' opinions on this.
Along the same line, in the Discussion section, the present results are interpreted within a theoretical framework showing statistical learning in auditory non-linguistic (string of tones, music) and visual domains as well as visual and other animal species. I'm not sure if that theoretical framework is the right fit for the present results.
(2) I'm not sure whether the fact that we see parallel and independent tracking of statistics in the two dimensions of speech at birth indicates that newborns would be able to do so in all the other dimensions of the speech. If so, what other dimensions are the authors referring to?
(3) Lines 341-345: Statistical learning is an evolutionary ancient learning mechanism but I do not think that the present results are showing it. This is a study on human neonates and adults, there are no other animal species involved therefore I do not see a connection with the evolutionary history of statistical learning. It would be much more interesting to make claims on the ontogeny (rather than philogeny) of statistical learning, and what regularities newborns are able to detect right after birth. I believe that this is one of the strengths of this work.
(4) The description of the stimuli in Lines 110-113 is a bit confusing. In Experiment 1, e.g., "pe" and "tu" are both uttered by the same voice, correct? ("random voice each time" is confusing). Whereas in Experiment 2, e.g., "pe" and "tu" are uttered by different voices, for example, "pe" by yellow voice and "tu" by red voice. If this is correct, then I recommend the authors to rephrase this section to make it more clear.
(5) Line 114: the sentence "they should compute a 36 x 36 TPs matrix relating each acoustic signal, with TPs alternating between 1/6 within words and 1/12 between words" is confusing as it seems like there are different acoustic signals. Can the authors clarify this point?
-
Author response:
Reviewer 1:
There are no significant weaknesses to signal in the manuscript. However, in order to fully conclude that there is no obvious advantage for the linguistic dimension in neonates, it would have been most useful to test a third condition in which the two dimensions were pitted against each other, that is, in which they provide conflicting information as to the boundaries of the words comprised in the artificial language. This last condition would have allowed us to determine whether statistical learning weighs linguistic and non-linguistic features equally, or whether phonetic content is preferentially processed.
We appreciate the reviewers' suggestion that a stream with conflicting information would provide valuable insights. In the present study, we started with a simpler case involving two orthogonal features (i.e., phonemes and voices), with one feature being informative and the other uninformative, and we found similar learning capacities for both. Future work should explore whether infants—and humans more broadly—can simultaneously track regularities in multiple speech features. However, creating a stream with two conflicting statistical structures is challenging. To use neural entrainment, the two features must lead to segmentation at different chunk sizes so that their effects lead to changes in power/PLV at different frequencies—for instance, using duplets for the voice dimension and triplets for the linguistic dimension (or vice versa). Consequently, the two dimensions would not be directly comparable within the same participant in terms of the number of distinguishable syllables/voices, memory demand, or SNR given the 1/F decrease in amplitude of background EEG activity. This would involve comparisons between two distinct groups counter-balancing chunk size and linguistic non-linguistic dimension. Considering the test phase, words for one dimension would have been part-words for the other dimension. As we are measuring differences and not preferences, interpreting the results would also have been difficult. Additionally, it may be difficult to find a sufficient number of clearly discriminable voices for such a design (triplets imply 12 voices). Therefore, an entirely different experimental paradigm would need to be developed.
If such a design were tested, one possibility is that the regularities for the two dimensions are calculated in parallel, in line with the idea that the calculation of statistical regularities is a ubiquitous implicit mechanism (see Benjamin et al., 2024, for a proposed neural mechanism). Yet, similar to our present study, possibly only phonetic features would be used as word candidates. Another possibility is that only one informative feature would be explicitly processed at a time due to the serial nature of perceptual awareness, which may prioritise one feature over the other.
Note: The reviewer’s summary contains a typo: syllabic rate (4 Hz) –not 2 Hz, and word rate (2 Hz) –not 4 Hz.
Reviewer 2:
N400: I am skeptical regarding the interpretation of the phoneme-specific ERP effect as a precursor of the N400 and would suggest toning it down. While the authors are correct in that infant ERP components are typically slower and more posterior compared to adult components, and the observed pattern is hence consistent with an adult N400, at the same time, it could also be a lot of other things. On a functional level, I can't follow the author's argument as to why a violation in phoneme regularity should elicit an N400, since there is no evidence for any semantic processing involved. In sum, I think there is just not enough evidence from the present paradigm to confidently call it an N400.
The reviewer is correct that we cannot definitively determine the type of processing reflected by the ERP component that appears when neonates hear a triplet after exposure to a stream with phonetic regularities. We interpreted this component as a precursor to the N400, based on prior findings in speech segmentation tasks without semantic content, where a ~400 ms component emerged when adult participants recognised pseudowords (Sander et al., 2002) or during structured streams of syllables (Cunillera et al., 2006, 2009). Additionally, the component we observed had a similar topography and timing to those labelled as N400 in infant studies, where semantic processing was involved (Parise et al., 2010; Friedrich & Friederici, 2011).
Given our experimental design, the difference we observed must be related to the type of regularity during familiarisation (either phonemes or voices). Thus, we interpreted this component as reflecting lexical search— a process which could be triggered by a linguistic structure but which would not be relevant to a non-linguistic regularity such as voices. However, we are open to alternative interpretations. In any case, this difference between the two streams reveals that computing regularities based on phonemes versus voices does not lead to the same processes. We will revise and tone down the corresponding part of the discussion to clarify that it is just a possible interpretation of the results.
Female and male voices: Why did the authors choose to include male and female voices? While using both female and male stimuli of course leads to a higher generalizability, it also introduces a second dimension for one feature that is not present for this other (i.e., phoneme for Experiment 1 and voice identity plus gender for Experiment 2). Hence, couldn't it also be that the infants extracted the regularity with which one gender voice followed the other? For instance, in List B, in the words, one gender is always followed by the other (M-F or F-M), while in 2/3 of the part-words, the gender is repeated (F-F and M-M). Wouldn't you expect the same pattern of results if infants learned regularities based on gender rather than identity?
We used three female and three male voices to maximise acoustic variability. The streams were synthesised using MBROLA, which provides a limited set of artificial voices. Indeed, there were not enough French voices of acceptable quality, so we also used two Italian voices (the phonemes used existed in both Italian and French).
Voices differ in timbre, and female voices tend to be higher pitched. However, it is sometimes difficult to categorise low-pitched female voices and high-pitched male voices. Given that gender may be an important factor in infants' speech perception (newborns, for instance, prefer female voices at birth), we conducted tests to assess whether this dimension could have influenced our results.
We first quantified the transitional probabilities matrices during the structured stream of Experiment 2, considering that there are only two types of voices: Female and Male.
For List A, all transition probabilities are equal to 0.5 (P(M|F), P(F|M), P(M|M), P(F|F)), resulting in flat TPs throughout the stream (see Author response image 1, top). Therefore, we would not expect neural entrainment at the word rate (2 Hz), nor would we anticipate ERP differences between the presented duplets in the test phase.
For List B, P(M|F)=P(F|M)=0.66 while P(M|M)=P(F|F)=0.33. However, this does not produce a regular pattern of TP drops throughout the stream (see Author response image 1, bottom). As a result, strong neural entrainment at 2 Hz was unlikely, although some degree of entrainment might have occasionally occurred due to some drops occurring at a 2 Hz frequency. Regarding the test phase, all three Words and only one Part-word presented alternating patterns (TP=0.6). Therefore, the difference in the ERPs between Words and Partwords in List B might be attributed to gender alternation.
However, it seems unlikely that gender alternation alone explains the entire pattern of results, as the effect is inconsistent and appears in only one of the lists. To rule out this possibility, we analysed the effects in each list separately.
Author response image 1.
Transition probabilities (TPs) across the structured stream in Experiment 2, considering voices processed by gender (Female or Male). Top: List A. Bottom: List B.
We computed the mean activation within the time windows and electrodes of interest and compared the effects of word type and list using a two-way ANOVA. For the difference between Words and Part-words over the positive cluster, we observed a main effect of word type (F(1,31) = 5.902, p = 0.021), with no effects of list or interactions (p > 0.1). Over the negative cluster, we again observed a main effect of word type (F(1,31) = 10.916, p = 0.0016), with no effects of list or interactions (p > 0.1). See Author response image 2.
Author response image 2.
Difference in ERP voltage (Words – Part-words) for the two lists (A and B); W=Words; P=Part-Words,
We conducted a similar analysis for neural entrainment during the structured stream on voices. A comparison of entrainment at 2 Hz between participants who completed List A and List B showed no significant differences (t(30) = -0.27, p = 0.79). A test against zero for each list indicated significant entrainment in both cases (List A: t(17) = 4.44, p = 0.00036; List B: t(13) = 3.16, p = 0.0075). See Author response image 3.
Author response image 3.
Neural entrainment at 2Hz during the structured stream of Experiment 2 for Lists A and B.
Words entrainment over occipital electrodes: Do you have any idea why the duplet entrainment effect occurs over the electrodes it does, in particular over the occipital electrodes (which seems a bit unintuitive given that this is a purely auditory experiment with sleeping neonates).
Neural entrainment might be considered as a succession of evoked response induced by the stream. After applying an average reference in high-density EEG recordings, the auditory ERP in neonates typically consists of a central positivity and a posterior negativity with a source located at the electrical zero in a single-dipole model (i.e. approximately in the superior temporal region (Dehaene-Lambertz & Dehaene, 1994). In adults, because of the average reference (i.e. the sum of voltages is equal to zero at each time point) and because the electrodes cannot capture the negative pole of the auditory response, the negativity is distributed around the head. In infants, however, the brain is higher within the skull, allowing for a more accurate recording of the negative pole of the auditory ERP (see Author response image 4 for the location of electrodes in an infant head model).
Besides the posterior electrodes, we can see some entrainment on more anterior electrodes that probably corresponds to the positive pole of the auditory ERP.
Author response image 4.
International 10–20 sensors' location on the skull of an infant template, with the underlying 3-D reconstruction of the grey-white matter interface and projection of each electrode to the cortex. Computed across 16 infants (from Kabdebon et al, Neuroimage, 2014). The O1, O2, T5, and T6 electrodes project lower than in adults.
Reviewer 3:
(1) While it's true that voice is not essential for language (i.e., sign languages are implemented over gestures; the use of voices to produce non-linguistic sounds, like laughter), it is a feature of spoken languages. Thus I'm not sure if we can really consider this study as a comparison between linguistic and non-linguistic dimensions. In turn, I'm not sure that these results show that statistical learning at birth operates on non-linguistic features, being voices a linguistic dimension at least in spoken languages. I'd like to hear the authors' opinions on this.
On one hand, it has been shown that statistical learning (SL) operates across multiple modalities and domains in human adults and animals. On the other hand, SL is considered essential for infants to begin parsing speech. Therefore, we aimed to investigate whether SL capacities at birth are more effective on linguistic dimensions of speech, potentially as a way to promote language learning.
We agree with the reviewer that voices play an important role in communication (e.g., for identifying who is speaking); however, they do not contribute to language structure or meaning, and listeners are expected to normalize across voices to accurately perceive phonemes and words. Thus, voices are speech features but not linguistic features. Additionally, in natural speech, there are no abrupt voice changes within a word as in our experiment; instead, voice changes typically occur on a longer timescale and involve only a limited number of voices, such as in a dialogue. Therefore, computing regularities based on voice changes would not be useful in real-life language learning. We considered that contrasting syllables and voices was an elegant way to test SL beyond its linguistic dimension, as the experimental paradigm is identical in both experiments.
Along the same line, in the Discussion section, the present results are interpreted within a theoretical framework showing statistical learning in auditory non-linguistic (string of tones, music) and visual domains as well as visual and other animal species. I'm not sure if that theoretical framework is the right fit for the present results.
(2) I'm not sure whether the fact that we see parallel and independent tracking of statistics in the two dimensions of speech at birth indicates that newborns would be able to do so in all the other dimensions of the speech. If so, what other dimensions are the authors referring to?
The reviewer is correct that demonstrating the universality of SL requires testing additional modalities and acoustic dimensions. However, we postulate that SL is grounded in a basic mechanism of long-term associative learning, as proposed in Benjamin et al. (2024), which relies on a slow decay in the representation of a given event. This simple mechanism, capable of operating on any representational output, accounts for many types of sequence learning reported in the literature (Benjamin et al., in preparation). We will revise the discussion section to clarify this theoretical framework.
(3) Lines 341-345: Statistical learning is an evolutionary ancient learning mechanism but I do not think that the present results are showing it. This is a study on human neonates and adults, there are no other animal species involved therefore I do not see a connection with the evolutionary history of statistical learning. It would be much more interesting to make claims on the ontogeny (rather than philogeny) of statistical learning, and what regularities newborns are able to detect right after birth. I believe that this is one of the strengths of this work.
We did not intend to make claims about the phylogeny of SL. Since SL appears to be a learning mechanism shared across species, we use it as a framework to suggest that SL may arise from general operational principles applicable to diverse neural networks. Thus, while it is highly useful for language acquisition, it is not specific to it. We will revise this section to tone down our claims.
(4) The description of the stimuli in Lines 110-113 is a bit confusing. In Experiment 1, e.g., "pe" and "tu" are both uttered by the same voice, correct? ("random voice each time" is confusing). Whereas in Experiment 2, e.g., "pe" and "tu" are uttered by different voices, for example, "pe" by yellow voice and "tu" by red voice. If this is correct, then I recommend the authors to rephrase this section to make it more clear.
To clarify, in Experiment 1, the voices were randomly assigned to each syllable, with the constraint that no voice was repeated consecutively. This means that syllables within the same word were spoken by different voices, and each syllable was heard with various voices throughout the stream. As a result, neonates had to retrieve the words based solely on syllabic patterns, without relying on consistent voice associations or specific voice relationships.
In Experiment 2, the design was orthogonal: while the syllables were presented in a random order, the voices followed a structured pattern. Similar to Experiment 1, each syllable (e.g., “pe” and “tu”) was spoken by different voices. The key difference is that in Experiment 2, the structured regularities were applied to the voices rather than the syllables. In other words, the “green” voice was always followed by the “red” voice for example but uttered different syllables.
We will revise the methods section to clarify these important points.
(5) Line 114: the sentence "they should compute a 36 x 36 TPs matrix relating each acoustic signal, with TPs alternating between 1/6 within words and 1/12 between words" is confusing as it seems like there are different acoustic signals. Can the authors clarify this point?
Thank you for highlighting this point. To clarify, our suggestion is that neonates might not track regularities between phonemes and voices as separate features. Instead, they may treat each syllable-voice combination as a distinct item—for example, "pe" spoken by the "yellow" voice is one item, while "pe" spoken by the "red" voice is another. Under this scenario, there would be a total of 36 unique items (6 syllables × 6 voices), and infants would need to track regularities between these 36 combinations.
We will rephrase this sentence in the manuscript to make it clearer.
-
-
www.biorxiv.org www.biorxiv.org
-
Reviewer #1 (Public review):
Summary:
The central question of this manuscript is the role of RNase III in supporting Salmonella infection. The authors begin with an RNAseq analysis of a collection of food or clinical Salmonella isolates from China, identifying RNase III (encoded by rnc) as an upregulated gene in clinical ("high virulence") isolates. Based on follow-up studies with knockout and complemented strains, the authors propose that RNase III has two roles - one in the upregulation of sodA expression to counter host-derived ROS, and the other in general degradation of dsRNA to dampen host immune responses. Overall, the manuscript is logical and the authors make largely reasonable interpretations of their data. However, the depth of supporting evidence limits the breadth of the authors' conclusions in their current form. Thus, this manuscript will be useful to researchers in directly related fields of study, but more work is required to understand how these proposed mechanisms function during infection.
Strengths:
(1) The use of comparative RNAseq between different isolates to identify potential virulence mechanisms is a powerful approach to understanding what makes certain strains more likely to cause infection over others.
(2) The experiments identifying dsRNA as the factor contributing to increased innate immune induction in the rnc knockout strain are particularly thorough.
(3) The authors observed an in vivo mammalian infection defect for RNase III-deficient Salmonella, a novel finding for the field and strong evidence that this protein is required to support pathogen fitness.
Weaknesses:
(1) The strengths of the manuscript are in places obscured by a lack of clarity and justification in the manuscript about strain selection and rationale for using some backgrounds over others. Moreover, several aspects of the organization and flow of the manuscript could be improved, as data is described out of order and the text description of results does not always align with the data presented.
(2) The specific claim that the relatively modest increase in expression of RNase III in some isolates (Figure 1A) accounts for their "virulence" is not well-supported, since the only comparisons in the study are between total knockouts or wild-type (and not overexpression) and the actual protein levels of RNase III are not quantified.
(3) Although the experiments on dsRNA are strong, they would have benefited from measurements of cytokine production/immune responses during infection with the actual knockout strains instead of transfected RNA along with quantification of Salmonella burdens.
(4) The contribution of RNase III catalytic activity (i.e., through the use of a catalytically dead mutant) was not assessed, which means that a role for general RNA binding or protein-protein interactions cannot be ruled out from this study.
(5) The in vivo work was limited to survival analysis, so whether the proposed mechanisms account for the defects observed could not be resolved.
(6) Statistical analysis throughout the manuscript is inconsistently applied, making it hard in places to determine whether the differences seen in phenotypes are biologically significant.
-
eLife Assessment
This useful study examines the function of the rnc gene, which encodes the RNase III ribonuclease, as it relates to virulence of Salmonella Enteritidis. The authors demonstrate that the rnc gene is markedly upregulated in strains proposed to exhibit high virulence and that the product of the rnc gene promotes the expression of SodA, which contributes to the survival of Salmonella Enteritidis in the face of oxidative stress. The study also suggests that elevated levels of rnc gene expression assist Salmonella Enteritidis in evading immune responses by diminishing the presence of accumulated double-stranded RNA (dsRNA), although the evidence substantiating this and the above assertions remains incomplete.
-
Reviewer #2 (Public review):
Summary:
This work attempted to investigate how the gene rnc, which showed higher expression in clinical strains of Salmonella Enteritidis compared to those isolated from food, affects the virulence of this bacteria through modulating dsRNA levels and the immune response of host cells.
Strengths:
The authors clearly demonstrated that the deletion of rnc Salmonella Enteritidis leads to an accumulation of dsRNA inside the cells, which further activates the immune response of host cells. It is also well demonstrated that the rnc gene deletion results in an increased ROS level through regulating the SodA protein.
Weaknesses:
(1) It is unclear whether the higher rnc expression in clinical strains of Salmonella Enteritidis is universal or just specific to several strains, because of the inadequate data provided and different strains used for different tests in this study.
(2) A lot of specific information is missing in the Figure legends and Method section, which makes it hard to understand some of the key results in the manuscript.
-
-
www.biorxiv.org www.biorxiv.org
-
eLife Assessment
This paper contains valuable ideas for methodology concerned with the identification of genes associated with disease prognosis in a broad range of cancers. However, there are concerns that the statistical properties of MEMORY are incompletely investigated and described. Further, more precise details about the implementation of the method would increase the replicability of the findings by other researchers.
-
Reviewer #1 (Public review):
Summary:
The authors propose a new technique which they name "Multi-gradient Permutation Survival Analysis (MEMORY)" that they use to identify "Genes Steadily Associated with Prognosis (GEARs)" using RNA-seq data from the TCGA database. The contribution of this method is one of the key stated aims of the paper. The vast majority of the paper focuses on various downstream analyses that make use of the specific GEARs identified by MEMORY to derive biological insights, with a particular focus on lung adenocarcinoma (LUAD) and breast invasive carcinoma (BRCA) which are stated to be representative of other cancers and are observed to have enriched mitosis and immune signatures, respectively. Through the lens of these cancers, these signatures are the focus of significant investigation in the paper.
Strengths:
The approach for MEMORY is well-defined and clearly presented, albeit briefly. This affords statisticians and bioinformaticians the ability to effectively scrutinize the proposed methodology and may lead to further advancements in this field.
The scientific aspects of the paper (e.g., the results based on the use of MEMORY and the downstream bioinformatics workflows) are conveyed effectively and in a way that is digestible to an individual who is not deeply steeped in the cancer biology field.
Weaknesses:
I was surprised that comparatively little of the paper is devoted to the justification of MEMORY (i.e., the authors' method) for the identification of genes that are important broadly for the understanding of cancer. The authors' approach is explained in the methods section of the paper, but no rationale is given for why certain aspects of the method are defined as they are. Moreover, no comparison or reference is made to any other methods that have been developed for similar purposes and no results are shown to illustrate the robustness of the proposed method (e.g., is it sensitive to subtle changes in how it is implemented).
For example, in the first part of the MEMORY algorithm, gene expression values are dichotomized at the sample median and a log-rank test is performed. This would seemingly result in an unnecessary loss of information for detecting an association between gene expression and survival. Moreover, while dichotomizing at the median is optimal from an information theory perspective (i.e., it creates equally sized groups), there is no reason to believe that median-dichotomization is correct vis-à-vis the relationship between gene expression and survival. If a gene really matters and expression only differentiates survival more towards the tail of the empirical gene expression distribution, median-dichotomization could dramatically lower the power to detect group-wise differences.
Specifically, the authors' rationale for translating the Significant Probability Matrix into a set of GEARs warrants some discussion in the paper. If I understand correctly, for each cancer the authors propose to search for the smallest sample size (i.e., the smallest value of k_{j}) were there is at least one gene with a survival analysis p-value <0.05 for each of the 1000 sampled datasets. I base my understanding on the statement "We defined the sampling size k_{j} reached saturation when the max value of column j was equal to 1 in a significant-probability matrix. The least value of k_{j} was selected". Then, any gene with a p-value <0.05 in 80% of the 1000 sampled datasets would be called a GEAR for that cancer. The 80% value here seems arbitrary but that is a minor point. I acknowledge that something must be chosen. More importantly, do the authors believe this logic will work effectively in general? Presumably, the gene with the largest effect for a cancer will define the value of K_{j}, and, if the effect is large, this may result in other genes with smaller effects not being selected for that cancer by virtue of the 80% threshold. One could imagine that a gene that has a small-to-moderate effect consistently across many cancers may not show up as a gear broadly if there are genes with more substantive effects for most of the cancers investigated. I am taking the term "Steadily Associated" very literally here as I've constructed a hypothetical where the association is consistent across cancers but not extremely strong. If by "Steadily Associated" the authors really mean "Relatively Large Association", my argument would fall apart but then the definition of a GEAR would perhaps be suboptimal. In this latter case, the proposed approach seems like an indirect way to ensure there is a reasonable effect size for a gene's expression on survival.
The paper contains numerous post-hoc hypothesis tests, statements regarding detected associations and correlations, and statements regarding statistically significant findings based on analyses that would naturally only be conducted in light of positive results from analyses upstream in the overall workflow. Due to the number of statistical tests performed and the fact that the tests are sometimes performed using data-driven subgroups (e.g., the mitosis subgroups), it is highly likely that some of the findings in the work will not be replicable. Of course, this is exploratory science, and is to be expected that some findings won't replicate (the authors even call for further research into key findings). Nonetheless, I would encourage the authors to focus on the quantification of evidence regarding associations or claims (i.e., presenting effect estimates and uncertainty intervals), but to avoid the use of the term statistical significance owing to there being no clear plan to control type I error rates in any systematic way across the diverse analyses there were performed.
A prespecified analysis plan with hypotheses to be tested (to the extent this was already produced) and a document that defines the complete scope of the scientific endeavor (beyond that which is included in the paper) would strengthen the contribution by providing further context on the totality of the substantial work that has been done. For example, the focus on LUAD and BRCA due to their representativeness could be supplemented by additional information on other cancers that may have been investigated similarly but where results were not presented due to lack of space.
-
Reviewer #2 (Public review):
Summary:
The authors are trying to come up with a list of genes (GEAR genes) that are consistently associated with cancer patient survival based on TCGA database. A method named "Multi-gradient Permutation Survival Analysis" was created based on bootstrapping and gradually increasing the sample size of the analysis. Only the genes with consistent performance in this analysis process are chosen as potential candidates for further analyses.
Strengths:
The authors describe in detail their proposed method and the list of the chosen genes from the analysis. The scientific meaning and potential values of their findings are discussed in the context of published results in this field.
Weaknesses:
Some steps of the proposed method (especially the definition of survival analysis similarity (SAS) need further clarification or details since it would be difficult if anyone tries to reproduce the results. In addition, the multiplicity (a large number of p-values are generated) needs to be discussed and/or the potential inflation of false findings needs to be part of the manuscript.
If the authors can improve the clarity of the proposed method and there is no major mistake there, the proposed approach can be applied to other diseases (assuming TCGA type of data is available for them) to identify potential gene lists, based on which drug screening can be performed to identify potential target for development.
-
Reviewer #3 (Public review):
Summary:
The authors describe a valuable method to find gene sets that may correlate with a patient's survival. This method employs iterative tests of significance across randomised samples with a range of proportions of the original dataset. Those genes that show significance across a range of samples are chosen. Based on these gene sets, hub genes are determined from similarity scores.
Strengths:
MEMORY allows them to assess the correlation between a gene and patient prognosis using any available transcriptomic dataset. They present several follow-on analyses and compare the gene sets found to previous studies.
Weaknesses:
Unfortunately, the authors have not included sufficient details for others to reproduce this work or use the MEMORY algorithm to find future gene sets, nor to take the gene findings presented forward to be validated or used for future hypotheses.
-
Reviewer #4 (Public review):
The authors apply what I gather is a novel methodology titled "Multi-gradient Permutation Survival Analysis" to identify genes that are robustly associated with prognosis ("GEARs") using tumour expression data from 15 cancer types available in the TCGA. The resulting lists of GEARs are then interrogated for biological insights using a range of techniques including connectivity and gene enrichment analysis.
I reviewed this paper primarily from a statistical perspective. Evidently, an impressive amount of work has been conducted, and concisely summarised, and great effort has been undertaken to add layers of insight to the findings. I am no stranger to what an undertaking this would have been. My primary concern, however, is that the novel statistical procedure proposed, and applied to identify the gene lists, as far as I can tell offers no statistical error control or quantification. Consequently, we have no sense of what proportion of the highlighted GEAR genes and networks are likely to just be noise.
Major comments:
(1) The main methodology used to identify the GEAR genes, "Multi-gradient Permutation Survival Analysis" does not formally account for multiple testing and offers no formal error control. Meaning we are left with no understanding of what the family-wise (aka type 1) error rate is among the GEAR lists, nor the false discovery rate. I would generally recommend against the use of any feature selection methodology that does not provide some form of error quantification and/or control because otherwise we do not know if we are encouraging our colleagues and/or readers to put resources into lists of genes that contain more noise than not. There are numerous statistical techniques available these days that offer error control, including for lists of p-values from arbitrary sets of tests (see expansion on this and some review references below).
(2) Similarly, no formal significance measure was used to determine which of the strongest "SAS" connections to include as edges in the "Core Survival Network".
(3) There is, as far as I could tell, no validation of any identified gene lists using an independent dataset external to the presently analysed TCGA data.
(4) There are quite a few places in the methods section where descriptions were not clear (e.g. elements of matrices referred to without defining what the columns and rows are), and I think it would be quite challenging to re-produce some aspects of the procedures as currently described (more detailed notes below).
(5) There is a general lack of statistical inference offered. For example, throughout the gene enrichment section of the results, I never saw it stated whether the pathways highlighted are enriched to a significant degree or not.
-
-
www.biorxiv.org www.biorxiv.org
-
eLife Assessment
The study is important - not only for its comprehensive transcriptomic analysis of the developmental trajectory of syncytiotrophoblasts (STBs), but also for its comparative evaluation of primary human placental tissues and two human trophoblast organoid models. The study highlights the utility of these organoid models in advancing research on human STB biology. The conclusions of this work are supported by compelling analyses and experimental evidence.
-
Reviewer #1 (Public review):
Summary:
This study provides an in-depth analysis of syncytiotrophoblast (STB) gene expression at the single-nucleus (SN) and single-cell (SC) levels, using both primary human placental tissues and two trophoblast organoid (TO) models. The authors compare the older TO model, where STB forms internally (STBin), with a newer model where STB forms externally (STBout). Through a series of comparative analyses, the study highlights the necessity of using both SN and SC techniques to fully understand placental biology. The findings demonstrate that the STBout model shows more differentiated STBs with higher expression of canonical markers and hormones compared to STBin. Additionally, the study identifies both conserved and distinct gene expression profiles between the TO models and human placenta, offering valuable insights for researchers using TOs to study STB and CTB differentiation.
Strengths:
The study offers a comprehensive SC- and SN-based characterization of trophoblast organoid models, providing a thorough validation of these models against human placental tissues. By comparing the older STBin and newer STBout models, the authors effectively demonstrate the improvements in the latter, particularly in the differentiation and gene expression profiles of STBs. This work serves as a critical resource for researchers, offering a clear delineation of the similarities and differences between TO-derived and primary STBs. The use of multiple advanced techniques, such as high-resolution sequencing and trajectory analysis, further enhances the study's contribution to the field.
Weaknesses:
While the study is robust, some areas could benefit from further clarification. The importance of the TO model's orientation and its impact on outcomes could be emphasized more in the introduction. The differences in cluster numbers/names between primary tissue and TO data need a clearer explanation, and consistent annotation could aid in comparison. The rationale for using SN sequencing over SC sequencing for TO evaluations should be clarified, especially regarding the potential underrepresentation of certain trophoblast subsets. Additionally, more evidence could be provided to support the claims about STB differentiation in the STBout model and to determine whether its differentiation trajectory is unique or simply more advanced than in STBin.
-
Reviewer #2 (Public review):
Summary:
In this study, the authors aimed to elucidate the formation and differentiation of syncytiotrophoblast (STB) cells by analyzing placental tissue and trophoblast organoids (TOs) using single-nucleus (SN) and single-cell (SC) RNA sequencing. They identified three distinct nuclear subtypes within the STB and explored the relationship between STB gene expression changes, developmental stages, and environmental contexts. The study emphasizes the utility of TOs as models for understanding STB differentiation and highlights novel gene markers, such as RYBP, involved in STB development.
Strengths:
(1) The use of SN and SC RNA sequencing provides a detailed analysis of STB formation and differentiation.
(2) The identification of distinct STB subtypes and novel gene markers such as RYBP offers new insights into STB development.
Weaknesses:
(1) Inconsistencies in data presentation.
(2) Questionable interpretation of lncRNA signals: The use of long non-coding RNA (lncRNA) signals as cell type-specific markers may represent sequencing noise rather than true markers.
To improve the study's validity and significance, it is crucial to address the inconsistencies and to provide additional evidence for the claims. Supplementing with immunofluorescence staining for validating the distribution of STB_in, STB_out, and EVT_enrich in the organoid models is recommended to strengthen the results and conclusions.
-
Reviewer #3 (Public review):
In this report, Keenen et al. present a thoroughly characterized platform for identifying potential molecular mechanisms regulating syncytiotrophoblast cell functions in placental biology. The application of single-cell assessments to identify developmental trajectories of this lineage has been challenging due to the complex, multinucleated structure of the syncytium. The authors provide a comprehensive comparative assessment of term placental tissue and three independent trophoblast organoid models. They use single-cell and single-nucleus RNA sequencing followed by differential gene expression and pseudotime analyses to identify subpopulations and differentiation trajectories. They further compare the datasets generated in this study to publicly available datasets from first-trimester placental tissue. The work is timely as optimization of trophoblast organoids is an evolving topic in placental research. Careful characterization of in vitro models has been noted as essential for model selection and result interpretation in the field.
The study elucidates syncytiotrophoblast nucleus subtypes and proportions in three different organoid models and compares subtypes and gene expression signatures to placental tissues. This work advances the field by demonstrating the utility of different trophoblast organoids to model syncytiotrophoblast differentiation. The in-depth characterization of cell types comprising the different organoid models and how they compare to placental tissue will help to inform model selection for future experimentation in the field. Defining cell composition and cell differentiation trajectories will also aid in data interpretation for data generated by these tissue and model sources. Overall, the conclusions presented in the manuscript are well supported by the data. The figures, as presented, are informative and striking.
The authors present outstanding progress toward their aim of identifying, "the underlying control of the syncytiotrophoblast". They identify the chromatin remodeler, RYBP, as well as other regulatory networks that they propose are critical to syncytiotrophoblast development. This study is limited in fully addressing the aim, however, as functional evidence for the contributions of the factors/pathways to syncytiotrophoblast cell development is needed. Future experimentation testing the hypotheses generated by this work will define the essentiality of the identified factors to syncytiotrophoblast development and function. Localization and validation of the identified factors within tissue and at the protein level will also provide further contextual evidence to address the hypotheses generated.
-
-
www.biorxiv.org www.biorxiv.org
-
eLife Assessment
This valuable study uses robust time-dependent microscopy assays to show that during HIV-1 infection, the viral accessory protein Vif causes cell cycle arrest during metaphase and not G2/M as previously thought. The conclusions are convincing in the context of the immortalized cellular models used, and they serve as a starting point to determine whether Vif-dependent regulation of the cell cycle modulates HIV-1 replication and pathogenesis in more physiologically relevant primary cells or in vivo.
-
Reviewer #1 (Public review):
Summary:
Ghone et al show that HIV-1 Vif causes a pseudo-metaphase arrest rather than a G2 arrest. The metaphase arrest correlates with misregulation of the kinetochore which could be explained by the loss of phosphatase functions that determine chromosome-microtubule interactions.
Strengths:
The single-cell imaging using different reporters of cell cycle progression is very elegant and the quantitation is convincing. The authors clearly show that what others have characterized as a G2 arrest by flow cytometry is somewhat later in metaphase and correlates with kinetochore misregulation.
Weaknesses:
(1) The major problem with the paper is trying to connect what is observed in tumor cell lines with actual infections in primary T cells. While all of the descriptive work in cell lines is convincing, none of these cells are relevant targets and tumor cells have different cell death and cell cycle regulation than primary T cells. Thus, while Vif might well do all of the things described in the manuscript, it is a stretch to connect any of it to what happens in vivo.
(2) Line 109 and elsewhere. The ability of Vif to cause cell cycle arrest and bind PP2A subunits is not a completely conserved feature. Rather, it is quite variable in different HIV-1 strains. (e.g. https://doi.org/10.1016/j.bbrc.2020.04.123 and https://elifesciences.org/articles/53036). Therefore, it is necessary for the authors to quite clearly use strain designations in the manuscript rather than a generic "Vif", and to more clearly describe the viruses being used.
(3) Figure 5: This figure shows disruption of PP2A-B56 at the kinetochores. However, is this specific to the kinetochores? Since Vif has been described to more broadly degrade PP2A-B56, could this not be a result of a more general decrease in PP2A activity throughout the cell?
-
Reviewer #2 (Public review):
Summary
The authors characterize the cell-cycle arrest induced by HIV-1 Vif in infected cells. They show this arrest is not at G2/M as previously thought but during metaphase. They show that the metaphase plate forms normally but progression to anaphase is massively delayed, and chromosome segregation is dysregulated in a manner consistent with impaired assembly of microtubules at the kinetochore. This correlates with the lack of recruitment of B56-subunits of PP2 phosphatase which are known degradation targets of Vif, suggesting that this weakens and unbalances the microtubule-mediated forces on the separating chromosomes.
Strengths
The authors present a very well-performed set of quantitative live cell imaging experiments that convincingly show a difference between Vif and Vpr-mediated cell cycle arrests. Through an in-depth characterization of the Vif-mediated block in metaphase, they make a strong case for this phenotype being tied to the degradation of PP2-B56 by Vif. Furthermore, it is important that they have performed most of these experiments with virally infected cells, meaning that their observations are observable at relevant viral expression levels of Vif.
Weaknesses
Experimentally there is very little to criticize with respect to the cellular systems used. Data from 10.1016/j.bbrc.2020.04.123 has identified selective mutants that fail to degrade B56 while maintaining A3G degradation by Cul5, and it would be nice to confirm that such a mutant behaves like the delta-Vif virus when examining metaphase, but selective ablation of B56 during mitosis to mimic Vif is would expect to be very challenging and beyond the scope.
Where I would raise some criticism is in the relevance of these observations to the replication and pathogenesis of the virus itself, which the authors do not address or discuss. Firstly, despite clear data that both Vpr and Vif can lead to a cell cycle arrest in cycling cells, it has never been particularly clear why the virus does this. While I would agree with the authors that Vif results in the metaphase arrest through targeting B56-PP2A, this may not be the reason WHY the virus targets one of the cell's major phosphatases, but rather a knock-on effect of doing so. I appreciate that this is beyond the scope of the study, but it is something I feel should be discussed rather than the narrow mechanistic points made in the discussion. Secondly, the authors suggest that this activity of Vif is a major cause of apoptosis in infected cells and perhaps CD4+ T cell depletion in vivo. It would be good to quantify how much apoptosis is Vif-dependent in infected primary human CD4+ T cells rather than transformed tumor cells, and whether this correlates with the Vif-mediated induction of a pseudometaphase.
-
-
www.biorxiv.org www.biorxiv.org
-
eLife Assessment
This important work investigates the mechanism that underlies the switch between feeding and mating behaviors in the oriental fruit fly, Bactrocera dorsalis. Using a variety of approaches, the authors show that this switch is mediated by the neuropeptide, sulfakinin, acting peripherally through the sulfakinin receptor 1 to regulate the expression of antennal odorant receptors. The evidence is solid in support of the hypothesis that sulfakinin signaling mediates changes in the periphery, although additional experimental details would strengthen these claims.
-
Joint Public Review:
Summary:
The behavioral switch between foraging and mating is important for resource allocation in insects. This study investigated the role of the neuropeptide, sulfakinin, and of its receptor, the sulfakinin receptor 1 (SkR1), in mediating this switch in the oriental fruit fly, Bactrocera dorsalis. The authors use genetic disruption of sulfakinin and of SkR1 to provide strong evidence that changes in sulfakinin signaling alter odorant receptor expression profiles and antennal responses and that these changes mediate the behavioral switch. The combination of molecular and physiological data is a strength of the study. Additional work would be needed to determine whether the physiological and molecular changes observed account for the behavioral changes observed.
Strengths:
(1) The authors show that sulfakinin signaling in the olfactory organ mediates the switch between foraging and mating, thereby providing evidence that peripheral sensory inputs contribute to this important change in behavior.
(2) The authors' development of an assay to investigate the behavioral switch and their use of different approaches to demonstrate the role of sulfakinin and SkR1 in this process provides strong support for their hypothesis.
(3) The manuscript is overall well-organized and documented.
Weaknesses:
(1) The authors claim that sulfakinin acts directly on SkR1-positive neurons to modulate the foraging and mating behaviors in B. dorsalis. The authors also indicated in the schematic that satiation suppresses SkR1 expression. Additional experiments and more a detailed discussion of the results would help support these claims.
(2) The findings reported could be strengthened with additional experimental details regarding time of day versus duration of starvation effects and additional genetic controls, amongst others.
-
-
www.biorxiv.org www.biorxiv.org
-
eLife Assessment
Shen et al. present a computational account of individual differences in mouse exploration when faced with a novel object in an open field from a previously published study (Akiti et al.) that relates subject-specific intrinsic exploration and caution about potential hazards to the spectrum of behaviors observed in this setting. Overall, this computational study is an important contribution that leverages a very general modeling framework (a Bayes Adaptive Markov Decision Process) to quantify and interrogate distinct drivers of exploratory behavior under potential threat. Given their assumptions, the modeling results are convincing: the authors are able to describe a substantial amount of the behavioral features and idiosyncracies in this dataset, and their model affords a normative interpretation related to inherent risk aversion and predation hazard "flexibility" of individual animals and should be of broad interest to researchers working to understand open-ended exploratory behaviors.
-
Reviewer #1 (Public review):
Summary:
This work computationally characterized the threat-reward learning behavior of mice in a recent study (Akiti et al.), which had prominent individual differences. The authors constructed a Bayes-adaptive Markov decision process model and fitted the behavioral data by the model. The model assumed (i) hazard function starting from a prior (with free mean and SD parameters) and updated in a Bayesian manner through experience (actually no real threat or reward was given in the experiment), (ii) risk-sensitive evaluation of future outcomes (calculating lower 𝛼 quantile of outcomes with free 𝛼 parameter), and (iii) heuristic exploration bonus. The authors found that (i) brave animals had more widespread hazard priors than timid animals and thereby quickly learned that there was in fact little real threat, (ii) brave animals may also be less risk-aversive than timid animals in future outcome evaluation, and (iii) the exploration bonus could explain the observed behavioral features, including the transition of behavior from the peak to steady-state frequency of bout. Overall, this work is a novel interesting analysis of threat-reward learning, and provides useful insights for future experimental and theoretical work. However, there are several issues that I think need to be addressed.
Strengths:
(1) This work provides a normative Bayesian account for individual differences in braveness/timidity in reward-threat learning behavior, which complements the analysis by Akiti et al. based on model-free threat reinforcement learning.
(2) Specifically, the individual differences were characterized by (i) the difference in the variance of hazard prior and potentially also (ii) the difference in the risk-sensitivity in the evaluation of future returns.
Weakness:
(1) Theoretically the effect of prior is diluted over experience whereas the effect of biased (risk-aversive) evaluation persists, but these two effects could not be teased apart in the fitting analysis of the current data.
(2) It is currently unclear how (whether) the proposed model corresponds to neurobiological (rather than behavioral) findings, different from the analysis by Akiti et al.
Major points:
(1) Line 219<br /> It was assumed that the exploration bonus was replenished at a steady rate when the animal was at the nest. An alternative way would be assuming that the exploration bonus slowly degraded over time or experience, and if doing so, there appears to be a possibility that the transition of the bout rate from peak to steady-state could be at least partially explained by such a decrease in the exploration bonus.
(2) Line 237- (Section 2.2.6, 2.2.7, Figures 7, 9)<br /> I was confused by the descriptions about nCVaR. I looked at the cited original literature Gagne & Dayan 2022, and understood that nCVaR is a risk-sensitive version of expected future returns (equation 4) with parameter α (α-bar) (ranging from 0 to 1) representing risk preference. Line 269-271 and Section 4.2 of the present manuscript described (in my understanding) that α was a parameter of the model. Then, isn't it more natural to report estimated values of α, rather than nCVaR, for individual animals in Section 2.2.6, 2.2.7, Figures 7, 9 (even though nCVaR monotonically depends on α)? In Figures 7 and 9, nCVaR appears to be upper-bounded to 1. The upper limit of α is 1 by definition, but I have no idea why nCVaR was also bounded by 1. So I would like to ask the authors to add more detailed explanations on nCVaR. Currently, CVaR is explained in Lines 237-243, but actually, there is no explanation about nCVaR rather than its formal name 'nested conditional value at risk' in Line 237.
(3) Line 333 (and Abstract)<br /> Given that animals' behaviors could be equally well fitted by the model having both nCVaR (free α) and hazard prior and the alternative model having only hazard prior (with α = 1), may it be difficult to confidently claim that brave (/timid) animals had risk-neutral (/risk-aversive) preference in addition to widespread (/low-variance) hazard prior? Then, it might be good to somewhat weaken the corresponding expression in the Abstract (e.g., add 'potentially also' to the result for risk sensitivity) or mention the inseparability of risk sensitivity and prior belief pessimism (e.g., "... although risk sensitivity and prior belief pessimism could not be teased apart").
-
Reviewer #2 (Public review):
Shen and Dayan build a Bayes adaptive Markov decision process model with three key components: an adaptive hazard function capturing potential predation, an intrinsic reward function providing the urge to explore, and a conditional value at risk (CvaR, closely related to probability distortion explanations of risk traits). The model itself is very interesting and has many strengths including considering different sources of risk preference in generating behavior under uncertainty. I think this model will be useful to consider for those studying approach/avoid behaviors in dynamic contexts.
The authors argue that the model explains behavior in a very simple and unconstrained behavioral task in which animals are shown novel objects and retreat from them in various manners (different body postures and patterns of motor chunks/syllables). The model itself does capture lots of the key mouse behavioral variability (at least on average on a mouse-by-mouse basis) which is interesting and potentially useful. However, the variables in the model - and the internal states it implies the mice have during the behavior - are relatively unconstrained given the wide range of explanations one can offer for the mouse behavior in the original study (Akiti et al). This reviewer commends the authors on an original and innovative expansion of existing models of animal behaviour, but recommends that the authors revise their study to reflect the obvious challenges. I would also recommend a reduction in claiming that this exercise gives a normative-like or at least quantitative account of mental disorders.
My main comment is that this paper is a very nice model creation that can characterize the heterogeneity rodent behavior in a very simple approach/avoid context (Akiti et al; when a novel object is placed in an arena) that itself can be interpreted in a multitude of ways. The use of terms like "exploration", "brave", etc in this context is tricky because the task does not allow the original authors (Akiti et al) to quantify these "internal states" or "traits" with the appropriate level of quantitative detail to say whether this model is correct or not in capturing the internal states that result in the rodent behavior. That said, the original behavioral setup is so simple that one could imagine capturing the behavioral variability in multiple ways (potentially without evoking complex computations that the original authors never showed the mouse brain performs). I would recommend reframing the paper as a new model that proposes a set of internal states that could give rise to the behavioral heterogeneity observed in Akiti et al, but nonetheless is at this time only a hypothesis. Furthermore, an explanation of what would be really required to test this would be appreciated to make the point clearer.
-
Reviewer #3 (Public review):
Summary:
The manuscript presents computational modelling of the behaviour of mice during encounters with novel and familiar objects, originally reported by Akiti et al. (Neuron 110, 2022). Mice typically perform short bouts of approach followed by a retreat to a safe distance, presumably to balance exploration to discover possible rewards with the potential risk of predation. However, there is considerable heterogeneity in this exploratory behaviour, both across time as an individual subject becomes more confident in approaching the object, and across subjects; with some mice rapidly becoming confident to closely explore the object, while other timid mice never become fully confident that the object is safe. The current work aims to explain both the dynamics of adaptation of individual animals over time, and the quantitative and qualitative differences in behaviour between subjects, by modelling their behaviour as arising from model-based planning in a Bayes adaptive Markov Decision Process (BAMDP) framework, in which the subjects maintain and update probabilistic estimates of the uncertain hazard presented by the object, and rationally balance the potential reward from exploring the object with the potential risk of predation it presents.
In order to fit these complex models to the behaviour the authors necessarily make substantial simplifying assumptions, including coarse-graining the exploratory behaviour into phases quantified by a set of summary statistics related to the approach bouts of the animal. Inter-individual variation between subjects is modelled both by differences in their prior beliefs about the possible hazard presented by the object and by differences in their risk preference, modelled using a conditional value at risk (CVaR) objective, which focuses the subject's evaluation on different quantiles of the expected distribution of outcomes. Interestingly these two conceptually different possible sources of inter-subject variation in brave vs timid exploratory behaviour turn out not to be dissociable in the current dataset as they can largely compensate for each other in their effects on the measured behaviour. Nonetheless, the modelling captures a wide range of quantitative and qualitative differences between subjects in the dynamics of how they explore the object, essentially through differences in how subject's beliefs about the potential risk and reward presented by the object evolve over the course of exploration, and are combined to drive behaviour.
Exploration in the face of risk is a ubiquitous feature of the decision-making problem faced by organisms, with strong clinical relevance, yet remains poorly understood and under-studied, making this work a timely and welcome addition to the literature.
Strengths:
(1) Individual differences in exploratory behaviour are an interesting, important, and under-studied topic.
(2) Application of cutting-edge modelling methods to a rich behavioural dataset, successfully accounting for diverse qualitative and qualitative features of the data in a normative framework.
(3) Thoughtful discussion of the results in the context of prior literature.
Limitations:
(1) The model-fitting approach used of coarse-graining the behaviour into phases and fitting to their summary statistics may not be applicable to exploratory behaviours in more complex environments where coarse-graining is less straightforward.
(2) Some aspects of the work could be more usefully clarified within the manuscript.
-