Author Response
The following is the authors’ response to the original reviews.
Response to reviewer’s comments
Reviewer #1 (Public Review):
In this study, the structural characteristics of plant AlaDC and SerDC were analyzed to understand the mechanism of functional differentiation, deepen the understanding of substrate specificity and catalytic activity evolution, and explore effective ways to improve the initial efficiency of theanine synthesis.
On the basis of previous solid work, the authors successfully obtained the X-ray crystal structures of the precursors of theanine synthesis-CsAlaDC and AtSerDC, which are key proteins related to ethylamine synthesis, and found a unique zinc finger structure on these two crystal structures that are not found in other Group II PLP-dependent amino acid decarboxylases. Through a series of experiments, it is pointed out that this characteristic zinc finger motif may be the key to the folding of CsAlaDC and AtSerDC proteins, and this discovery is novel and prospective in the study of theine synthesis.
In addition, the authors identified Phe106 of CsAlaDC and Tyr111 of AtSerDC as key sites of substrate specificity by comparing substrate binding regions and identified amino acids that inhibit catalytic activity through mutation screening based on protein structure. It was found that the catalytic activity of CsAlaDCL110F/P114A was 2.3 times higher than that of CsAlaDC. At the same time, CsAlaDC and AtSerDC substrate recognition key motifs were used to carry out evolutionary analysis of the protein sequences that are highly homologous to CsAlaDC in embryos, and 13 potential alanine decarboxylases were found, which laid a solid foundation for subsequent studies related to theanine synthesis.
In general, this study has a solid foundation, the whole research idea is clear, the experimental design is reasonable, and the experimental results provide strong evidence for the author's point of view. Through a large number of experiments, the key links in the theanine synthesis pathway are deeply studied, and an effective way to improve the initial efficiency of theanine synthesis is found, and the molecular mechanism of this way is expounded. The whole study has good novelty and prospectivity, and sheds light on a new direction for the efficient industrial synthesis of theanine
Response: Thank you very much for taking time to review this manuscript. We appreciate all your insightful comments and constructive suggestions.
Reviewer #1 (Recommendations For The Authors):
(1) If some test methods are not original, references or method basis should be indicated.
Response: Thank you very much for your careful reading of the manuscript and valuable suggestions. We have added references for the enzymatic activity experiments performed to measure the synthesis of theanine in the revised manuscript.
(2) The conclusion is a little lengthy, and the summary of the whole study is not well condensed.
Response: Thank you very much for your valuable suggestions. We have refined the conclusion in the revised manuscript, and it is as follows:
In conclusion, our structural and functional analyses have significantly advanced understanding of the substrate-specific activities of alanine and serine decarboxylases, typified by CsAlaDC and AtSerDC. Critical amino acid residues responsible for substrate selection were identified—Tyr111 in AtSerDC and Phe106 in CsAlaDC—highlighting pivotal roles in enzyme specificity. The engineered CsAlaDC mutant (L110F/P114A) not only displayed enhanced catalytic efficiency but also substantially improved L-theanine yield in a synthetic biosynthesis setup with PsGS or GMAS. Our research expanded the repertoire of potential alanine decarboxylases through the discovery of 13 homologous enzyme candidates across embryophytic species and uncovered a special motif present in serine protease-like proteins within Fabale, suggesting a potential divergence in substrate specificity and catalytic functions. These insights lay the groundwork for the development of industrial biocatalytic processes, promising to elevate the production of L-theanine and supporting innovation within the tea industry.
Reviewer #2 (Public Review)
Summary:
The manuscript focuses on the comparison of two PLP-dependent enzyme classes that perform amino acyl decarboxylations. The goal of the work is to understand the substrate specificity and factors that influence the catalytic rate in an enzyme linked to theanine production in tea plants.
Strengths:
The work includes x-ray crystal structures of modest resolution of the enzymes of interest. These structures provide the basis for the design of mutagenesis experiments to test hypotheses about substrate specificity and the factors that control catalytic rate. These ideas are tested via mutagenesis and activity assays, in some cases both in vitro and in plants.
Weaknesses:
The manuscript could be more clear in explaining the contents of the x-ray structures and how the complexes studied relate to the reactant and product complexes. The structure and mechanism section would also be strengthened by including a diagram of the reaction mechanism and including context about reactivity. As it stands, much of the structural results section consists of lists of amino acids interacting with certain ligands without any explanation of why these interactions are important or the role they play in catalysis. The experiments testing the function of a novel Zn(II)-binding domain also have serious flaws. I don't think anything can be said at this point about the function of the Zn(II) due to a lack of key controls and problems with experimental design.
Response: Thank you very much for your thoughtful comments and feedback on our manuscript. We are pleased to hear that the work's strengths, such as the X-ray crystal structures and the mutagenesis experiments tied to the catalytic rate and substrate specificity, align with the goals of our research.
We recognize the areas identified for improvement and appreciate the suggestions provided. We have emphasized how we use the structural information obtained to infer the roles of key amino acid residues in the reaction. Additionally, we have added a diagram of the reaction mechanism in the Supplementary figure to provide clearer context on reactivity and improve the overall understanding of the catalytic process. Regarding the structural results section, we have included a discussion that contextualizes the list of amino acids and their interactions with the ligands by explaining their significance and roles in catalysis. We acknowledge the weaknesses you've pointed out in the experiments concerning the novel Zn(II)-binding domain, but we would like to clarify that the focus of our study was not primarily on the zinc structure. While we agree that there may be limitations in the experimental design and controls for the zinc binding domain, we believe that these flaws do not significantly impact the overall findings of the study. The experiment served as a preliminary exploration of the potential functionality of the domain, and further studies are required to fully understand its role and mechanism.
Reviewer #2 (Recommendations For The Authors):
(1) In addition to the points raised in the public review, it would be ideal to provide some context for the enzymatic characterization. Why are the differences in kinetic parameters for AlaDC and SerDC significant?
Response: Thank you for your comments and suggestions. The Km values for CsAlaDC and SerDCs are comparable, suggesting similar substrate affinities. However, CsAlaDC exhibits a significantly lower Vmax compared to AtSerDC and CsSerDC. This discrepancy implies that CsAlaDC and SerDCs may differ in the rates at which they convert substrate to product when saturated with substrate. SerDCs may have a faster turnover rate, meaning they convert substrate to product and release the enzyme more quickly, resulting in a higher Vmax. Differences in the stability or correct folding of the enzymes under assay conditions can also affect their Vmax. If SerDCs are more stable, they might maintain their catalytic activity better at higher substrate concentrations, contributing to a higher Vmax. We have added these to the part of “Enzymatic properties of CsAlaDC, AtSerDC, and CsSerDC” in our revised manuscript.
(2) Why is Phe106/Tyr111 pair critical for substrate specificity? Does the amino acid contact the side chain? It might be helpful to a reader to formulate a hypothesis for this interaction.
Response: Thank you for the question and comments. We conducted a comparison between the active sites of CsAlaDC and AtSerDC and observed a distinct difference in only two amino acids: F106 in CsAlaDC and Y111 in AtSerDC. The remaining amino acids were found to be identical. Expanding on previous research concerning Group II PLP-dependent amino acid decarboxylases, it was postulated and subsequently confirmed that these specific amino acids play a crucial role in substrate recognition. However, since we lack the structure of the enzyme-substrate complex, we are unable to elucidate the precise interactions occurring between the substrate and the amino acids at this particular site based solely on structural information.
(3) Line 55 - Define EA again.
Response: Thank you very much for your careful reading of the manuscript and valuable suggestions. We have redefined “EA” as the abbreviation for ethylamine in the revised manuscript.
(4) Line 58 - The meaning of "determined by the quality formation of tea" is not clear.
Response: Thank you very much for your careful reading of the manuscript and valuable suggestions. We have modified it in the revised manuscript.
(5) Line 65 - Missing words between "despite they".
Response: Thank you very much for your careful reading of the manuscript. We have corrected it in the revised manuscript.
(6) Line 67 - Need a reference for the statement about lower activity?
Response: Thank you for the question and comments. We have provided the following reference to support this statement in the revised manuscript.
Reference: Bai, P. et al. (2021) Biochemical characterization of specific Alanine Decarboxylase (ADC) and its ancestral enzyme Serine Decarboxylase (SDC) in tea plants (Camellia sinensis). BMC Biotechnol. 21,17.
(7) Line 100-101 - The meaning of "its closer relationship was Dicots plants." is not clear.
Response: We have revised the sentence in the revised manuscript, as follows: “Phylogenetic analysis indicated that CsAlaDC is homologous with SerDCs in Dicots plants.”
(8) Line 139 - Missing a word between "as well as" and "of".
Response: Thank you very much for your careful reading of the manuscript and valuable suggestions. We have corrected it in the revised manuscript.
(9) Line 142 - The usage of comprised here is not correct. It would be more correct to say "The overall architecture of CsAlaDC and AtSerDC is homodimeric with the two subunits...".
Response: Thank you very much for your careful reading of the manuscript and valuable suggestions. We have corrected it in the revised manuscript.
(10) Line 148-149 - I didn't understand the statement about the "N-terminal structures" Are these structures obtained from protein samples that have a truncated N-terminus?
Response: Group II PLP-dependent amino acid decarboxylases are comprised of three distinct structural domains: the N-terminal domain, the large domain, and the C-terminal domain. Each of these domains possesses unique structural features. Similarly, CsAlaDC and AtSerDC can also be classified into three structural domains based on their specific characteristics. To achieve more stable proteins for further experiments, we conducted truncation on both of these proteins. The truncated section pertains to a subsection of the N-terminal domain and is truncated from the protein's N-terminus.
(11) Line 153 - Say "is composed of" instead of "composes of".
Response: Thank you very much for your careful reading of the manuscript and valuable suggestions. We have corrected it in the revised manuscript.
(12) Line 156 - I didn't understand the statement about the cofactor binding process. What is the cofactor observed? And how can we say anything about the binding process from a single static structure of the enzyme? It might be better to say that the cofactor binding site is located at the subunit junction - but the identity of the cofactor still needs to be defined first.
Response: Thank you for your comments and suggestions. The cofactor mentioned here is PLP. We aim to elucidate the binding state of PLP at the active site, excluding the binding process. The description has been revised in the revised manuscript.
(13) Lines 157-158 - I didn't understand the conclusion about the roles of each monomer. In the images in Figure 3 - both monomers appear to bind PLP but the substrate is not present - so it's not clear how conclusions can be drawn about differential substrate binding in the two subunits.
Response: Thank you very much for your careful reading and valuable suggestions. The main idea we want to convey is that this protein possesses two active sites. At each active site, the two monomers carry out distinct functions. Of course, our previous conclusion is inaccurate due to the non-existence of the substrate. So, we have made the necessary amendments in the revised manuscript.
(14) Line 161 - I would say loop instead of ring.
Response: Thank you very much for your careful reading of the manuscript and valuable suggestions. We have corrected it in the revised manuscript.
(15) Line 165 - Please provide some references for this statement. It would also be ideal to state the proximity of the Zn-binding motif to the active site or otherwise provide some information about the role of the motif based on its location.
Response: Thank you for your comments and suggestions. We have provided the following references to support this statement in the revised manuscript.
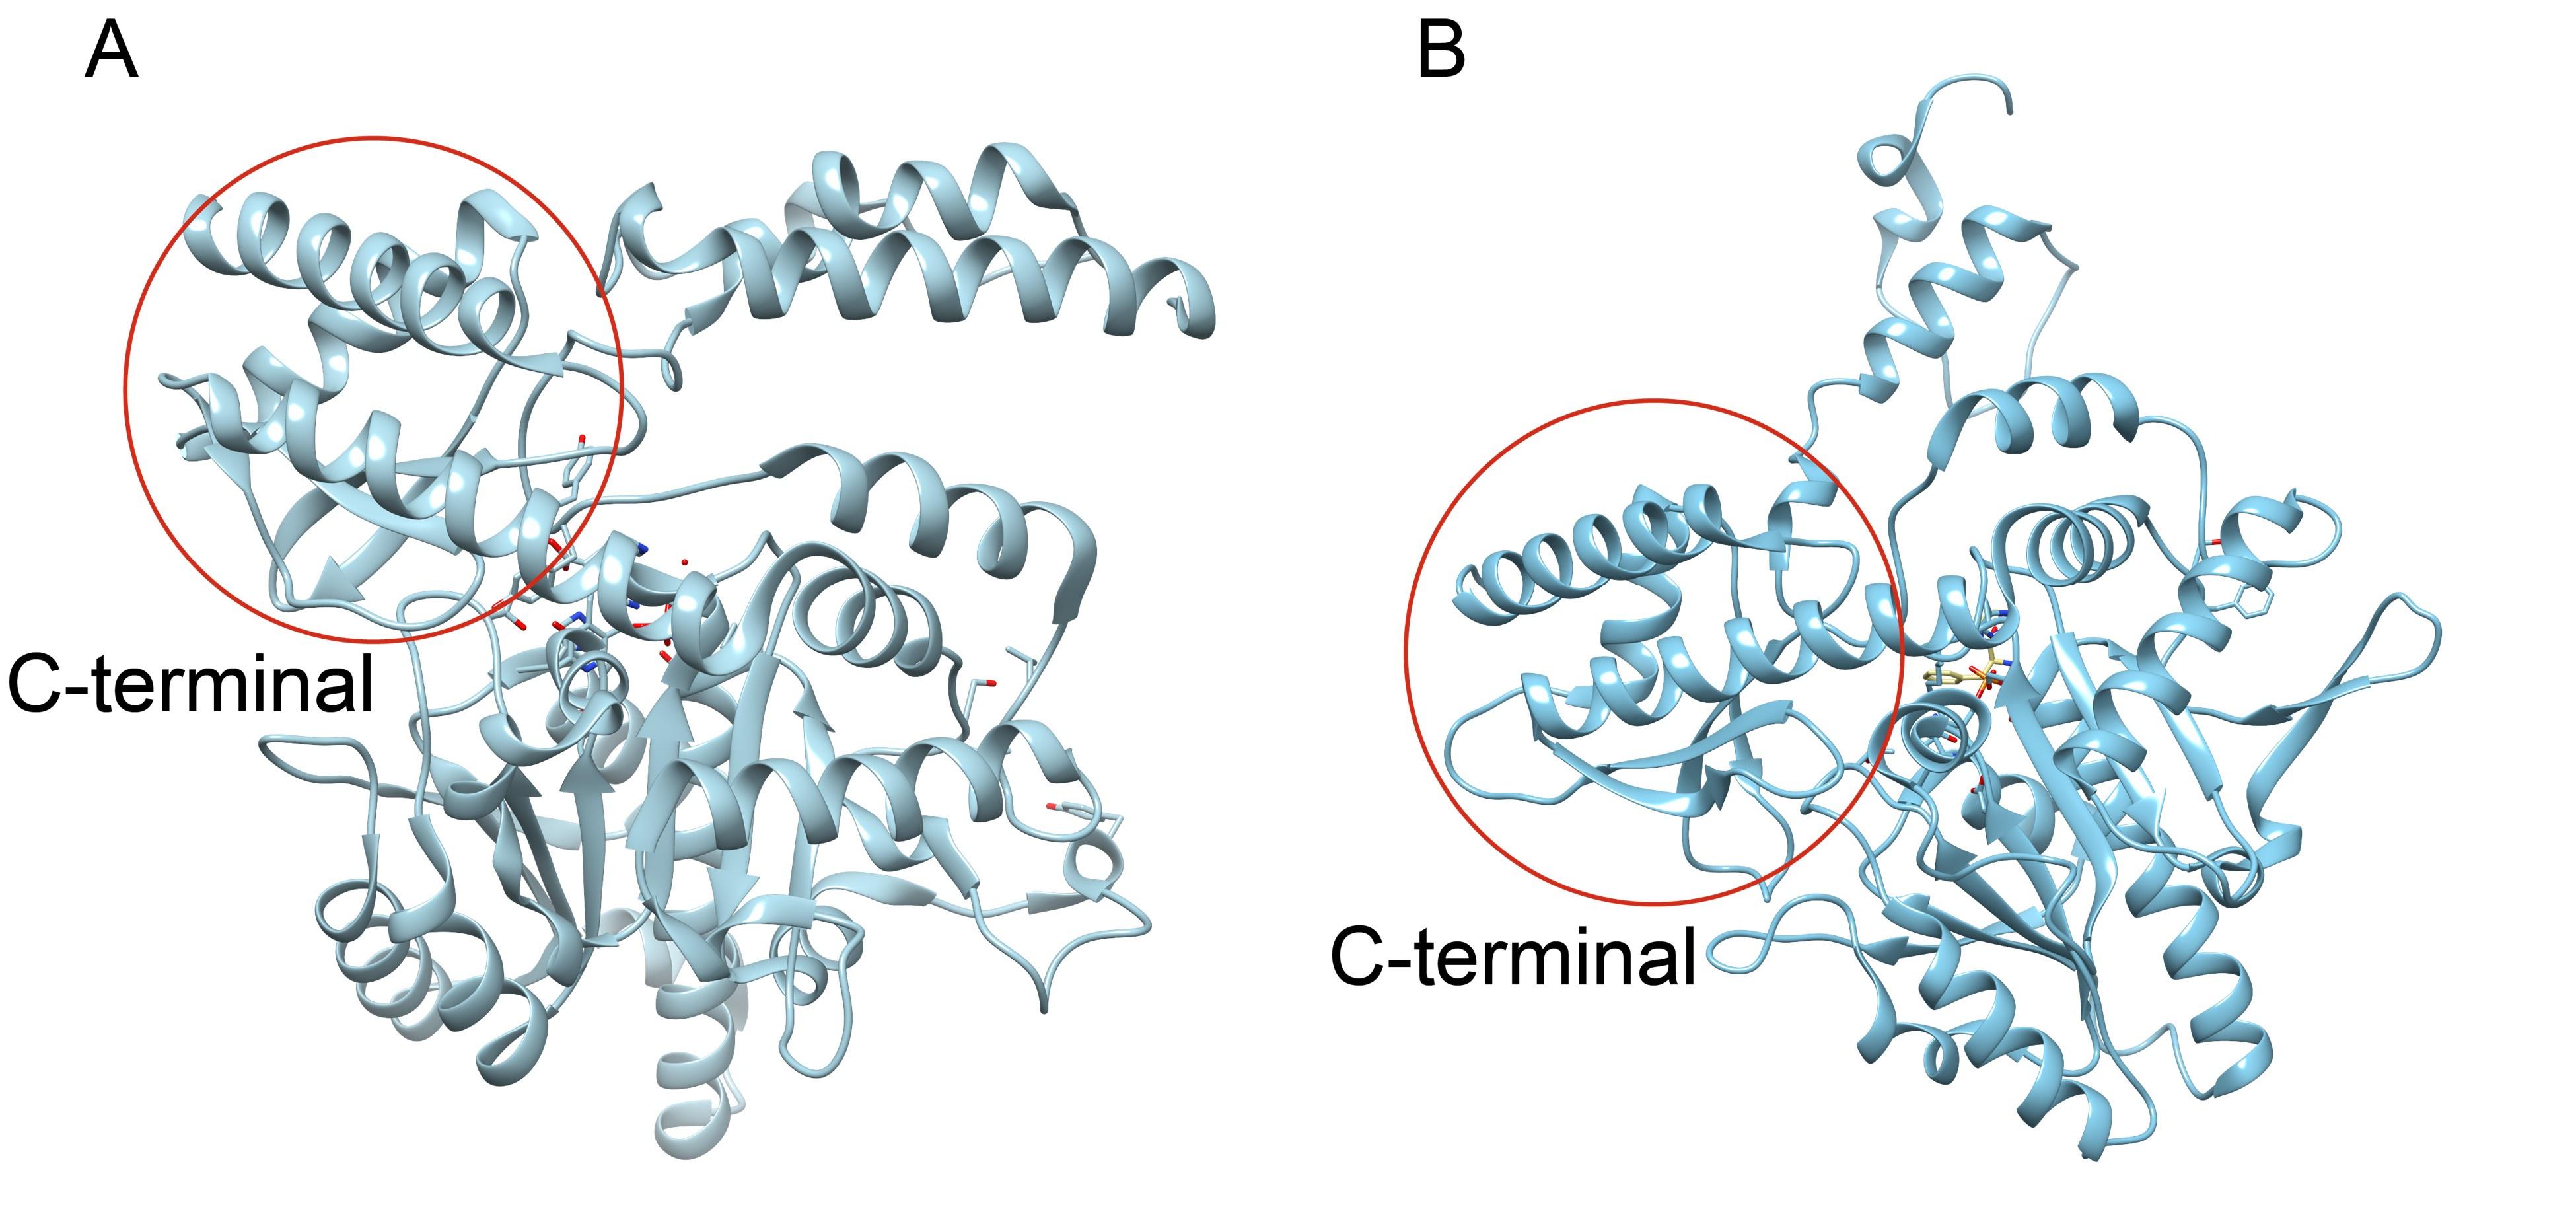
Author response image 1.
(A) Structure of histidine decarboxylase. (B) Structure of glutamate decarboxylase.
Reference:
30 Komori, H. et al. (2012) Structural study reveals that Ser-354 determines substrate specificity on human Histidine Decarboxylase. J Biol Chem. 287, 29175-83.
31 Huang, J. et al. (2018) Lactobacillus brevis CGMCC 1306 glutamate decarboxylase: Crystal structure and functional analysis. Biochem Biophys Res Co. 503, 1703-1709
In CsAlaDC, the zinc is positioned at a distance of 29.6 Å from the active center, whereas in AtSerDC, the zinc is situated 29 Å away from the active center. Hence, we hypothesize that this structure does not impact the enzyme's catalytic activity but might be correlated with its stability.
(16) Lines 166-178 - This paragraph appears to be a list of all of the interactions between the protein, PLP, and the EA product. It would be ideal to provide some text to explain why these interactions are important and what we can learn from them.
Response: Thank you very much for your careful reading of the manuscript and valuable suggestions. We have been conducting additional analysis on the functional roles of amino acid residues involved in the interaction between the active site and PLP. This analysis focuses on aiding PLP binding, determining its orientation, and understanding enzyme catalytic mechanisms. These details are mentioned in the revised manuscript.
(17) Line 192 - Bond not bound.
Response: Thank you very much for your careful reading of the manuscript and valuable suggestions. We have made corrections in the revised manuscript.
(18) Lines 201-207 - It would be ideal to verify that the inclusion of 5 mM DTT affects Zn binding. It's not clear to me that this reagent would necessarily disrupt Zn binding. Under certain circumstances, it could instead promote Zn association. For example, if the Cys ligands are oxidized initially but then become reduced? I don't think the current experiment really provides any insight into the role of the Zn.
Response: Thank you for your valuable insights regarding the role of DTT and its potential effects on Zn binding in our experiments. The main function of DTT is to protect or restore the reduced state of proteins and other biological molecules, particularly by disrupting the crosslinking formed by thiol (-SH) groups and disulfide bonds to maintain the function and structure of proteins. Therefore, the reason for DTT's inhibition of enzyme activity is unknown, and we cannot provide a reasonable explanation for this phenomenon. As a result, we have removed the section discussing the inhibition of enzyme activity by DTT in our revised manuscript.
Reviewer #3 (Public Review):
In the manuscript titled "Structure and Evolution of Alanine/Serine Decarboxylases and the Engineering of Theanine Production," Wang et al. solved and compared the crystal structures of Alanine Decarboxylase (AlaDC) from Camellia sinensis and Serine Decarboxylase (SerDC) from Arabidopsis thaliana. Based on this structural information, the authors conducted both in vitro and in vivo functional studies to compare enzyme activities using site-directed mutagenesis and subsequent evolutionary analyses. This research has the potential to enhance our understanding of amino acid decarboxylase evolution and the biosynthetic pathway of the plant-specialized metabolite theanine, as well as to further its potential applications in the
tea industry.
Response: Thank you very much for taking the time to review this manuscript. We appreciate all your insightful comments.
Reviewer #3 (Recommendations For The Authors):
Page 6, Figure 2, Page 23 (Methods)
"The supernatants were purified with a Ni-Agarose resin column followed by size-exclusion chromatography."
What kind of SEC column did the authors use? Can the authors provide the SEC elution profile comparison results and size standard curve?
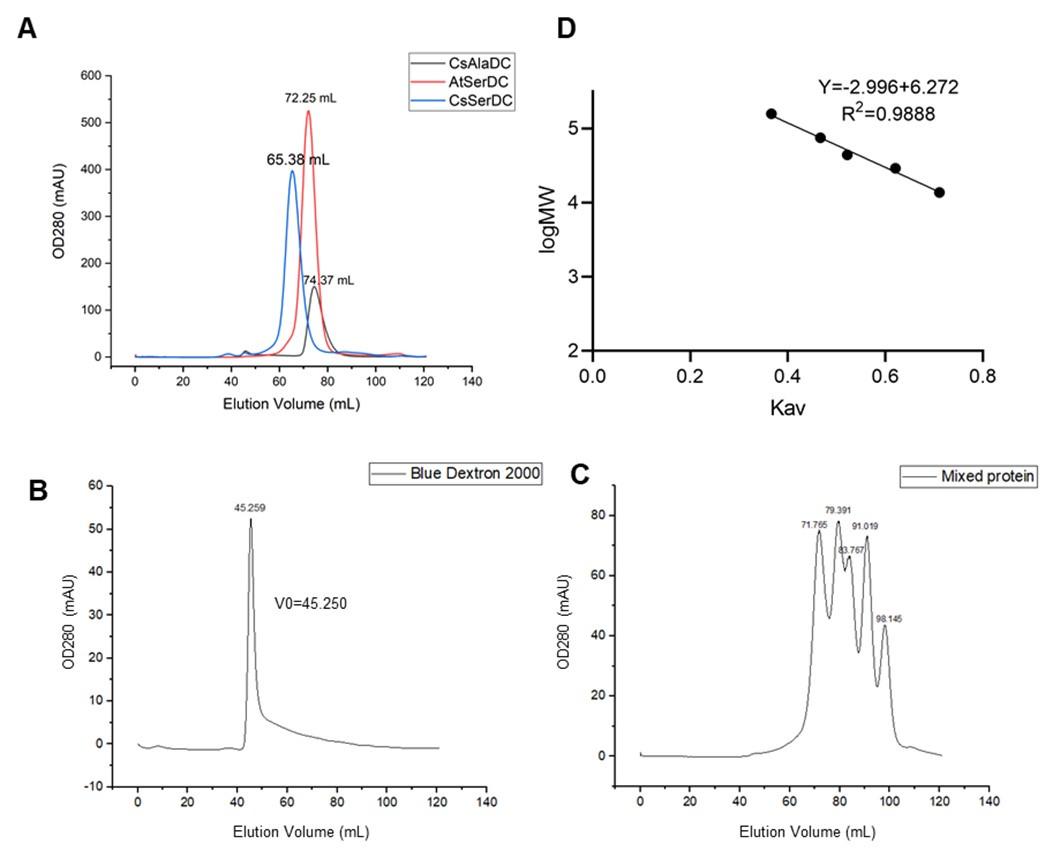
Response: We use a Superdex 200 (Hiload 16/600) column for size exclusion chromatography. The comparison results of SEC elution profiles for AtSerDC and CsAlaDC, along with the standard curve of SEC column, are presented below.
Author response image 2.
(A) Comparison of elution profiles of CsAlaDC and AtSerDC. (B) Elution profile of Blue Dextron 2000. (C) Elution profile of mixed protein (Aldolase, 158000 Da,71.765ml; Conalbumin, 75000 Da,79.391ml; Ovalbumin, 44000 Da,83.767ml; Carbonic anhydrase, 29000 Da,90.019ml; Ribonuclease A, 13700 Da,98.145ml). (D) Size standard curves of Superdex 200 (Hiload 16/600) column.
Page 6 & Page 24 (Methods)
"The 100 μL reaction mixture, containing 20 mM substrate (Ala or Ser), 100 mM potassium phosphate, 0.1 mM PLP, and 0.025 mM purified enzyme, was prepared and incubated at standard conditions (45 ℃ and pH 8.0 for CsAlaDC, 40 ℃ and pH 8.0 for AtSerDC for 30 min)."
(1) The enzymatic activities of CsAldDC and AtSerDC were measured at two different temperatures (45 and 40 ℃, but their activities were directly compared. Is there a reason for experimenting at different temperatures?
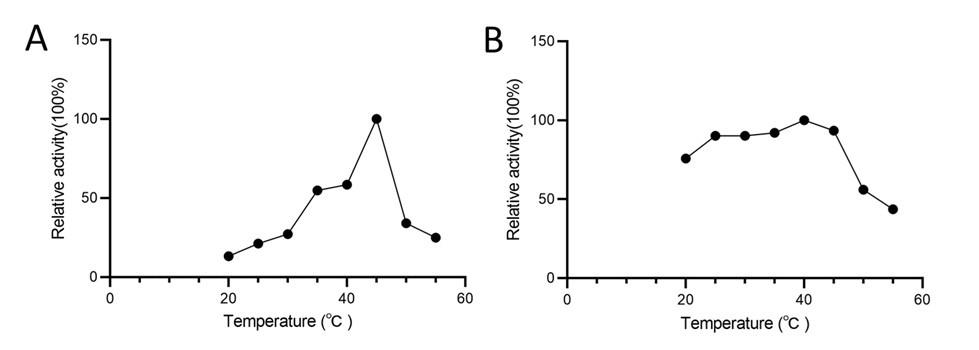
Response: We determined that the optimal reaction temperature for AtSerDC is 40°C and for CsAlaDC is 45°C through our verification process. Consequently, all subsequent experiments were performed at these specific temperatures.
Author response image 3.
(A) Relative activity of CsAlaDC at different temperatures. (B) Relative activity of AtSerDC at different temperatures.
(2) Enzyme activities were measured at temperatures above 40℃, which is not a physiologically relevant temperature and may affect the stability or activity of the proteins. At the very least, the authors should provide temperature-dependent protein stability data (e.g., CD spectra analysis) or, if possible, temperature-dependent enzyme activities, to show that their experimental conditions are suitable for studying the activities of these enzymes.
Response: Thank you very much for your careful reading. We have already validated that the experimental temperature we used did not significantly affect the stability of the protein before experimenting. The results are shown in the figure below:
Author response image 4.
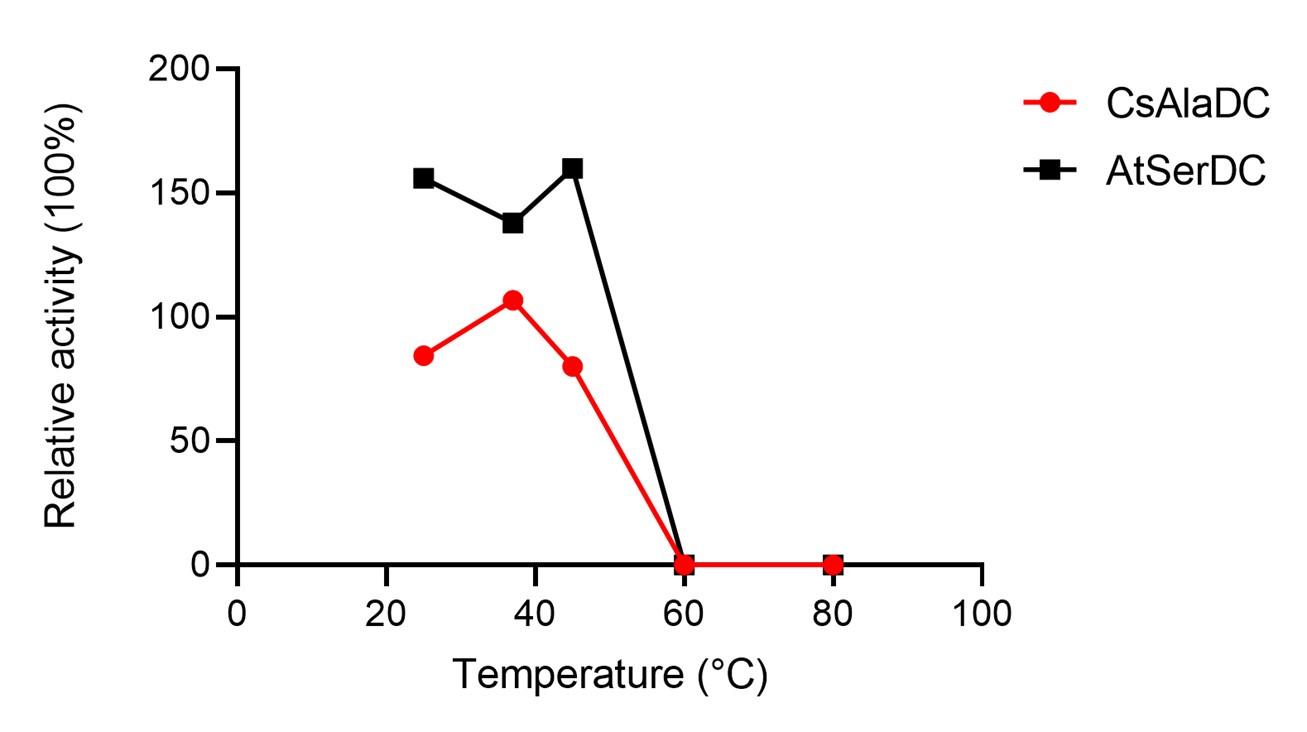
Place the two proteins individually into water baths set at temperatures of 25°C, 37°C, 45°C, 60°C, and 80°C for 15 minutes. Subsequently, carry out enzymatic reactions utilizing a standard reaction system, with untreated enzymes serving as the experimental control within the said system. The experimental results suggest that the temperature at which we experimented does not have a significant impact on the stability of the enzyme.
(3) The authors used 20 mM of substrate. What are the physiological concentrations of alanine and serine typically found in plants?
Response: The content of alanine in tea plant roots ranges from 0.28 to 4.18 mg/g DW (Yu et al., 2021; Cheng et al., 2017). Correspondingly, the physiological concentration of alanine is 3.14 mM to 46.92 mM, in tea plant roots. The content of serine in plants ranges from 0.014 to 17.6 mg/g DW (Kumar et al., 2017). Correspondingly, the physiological concentration of serine is 0.13 mM to 167.48 mM in plants. In this study, the substrate concentration of 20 mM was close to the actual concentrations of alanine and serine in plants.
Yu, Y. et al. (2021) Glutamine synthetases play a vital role in high accumulation of theanine in tender shoots of albino tea germplasm "Huabai 1". J. Agric. Food Chem. 69 (46),13904-13915.
Cheng, S. et al. (2017) Studies on the biochemical formation pathway of the amino acid L-theanine in tea (Camellia sinensis) and other plants.” J. Agric. Food Chem. 65 (33), 7210-7216.
Kumar, V. et al. (2017) Differential distribution of amino acids in plants. Amino Acids. 49(5), 821-869.
Pages 6-7 & Table 1
(1) Use the correct notation for Km and Vmax. Also, the authors show kinetic parameters and use multiple units (e.g., mmol/L or mM for Km).
Response: Thank you very much for your careful reading of the manuscript and valuable suggestions. We have corrected this in the revised manuscript.
(2) When comparing the catalytic efficiency of enzymes, kcat/Km (or Vmax/Km) is generally used. The authors present a comparison of catalytic activity from results to conclusion. A clarification of what results are being compared is needed.
Response: Thank you for your comments and suggestions. The catalytic activity is assessed by comparing reaction rates.
Page 7 & Figure 3
In Figure 3A, the authors describe the overall structure, but a simple explanation or labeling within the figure should be added.
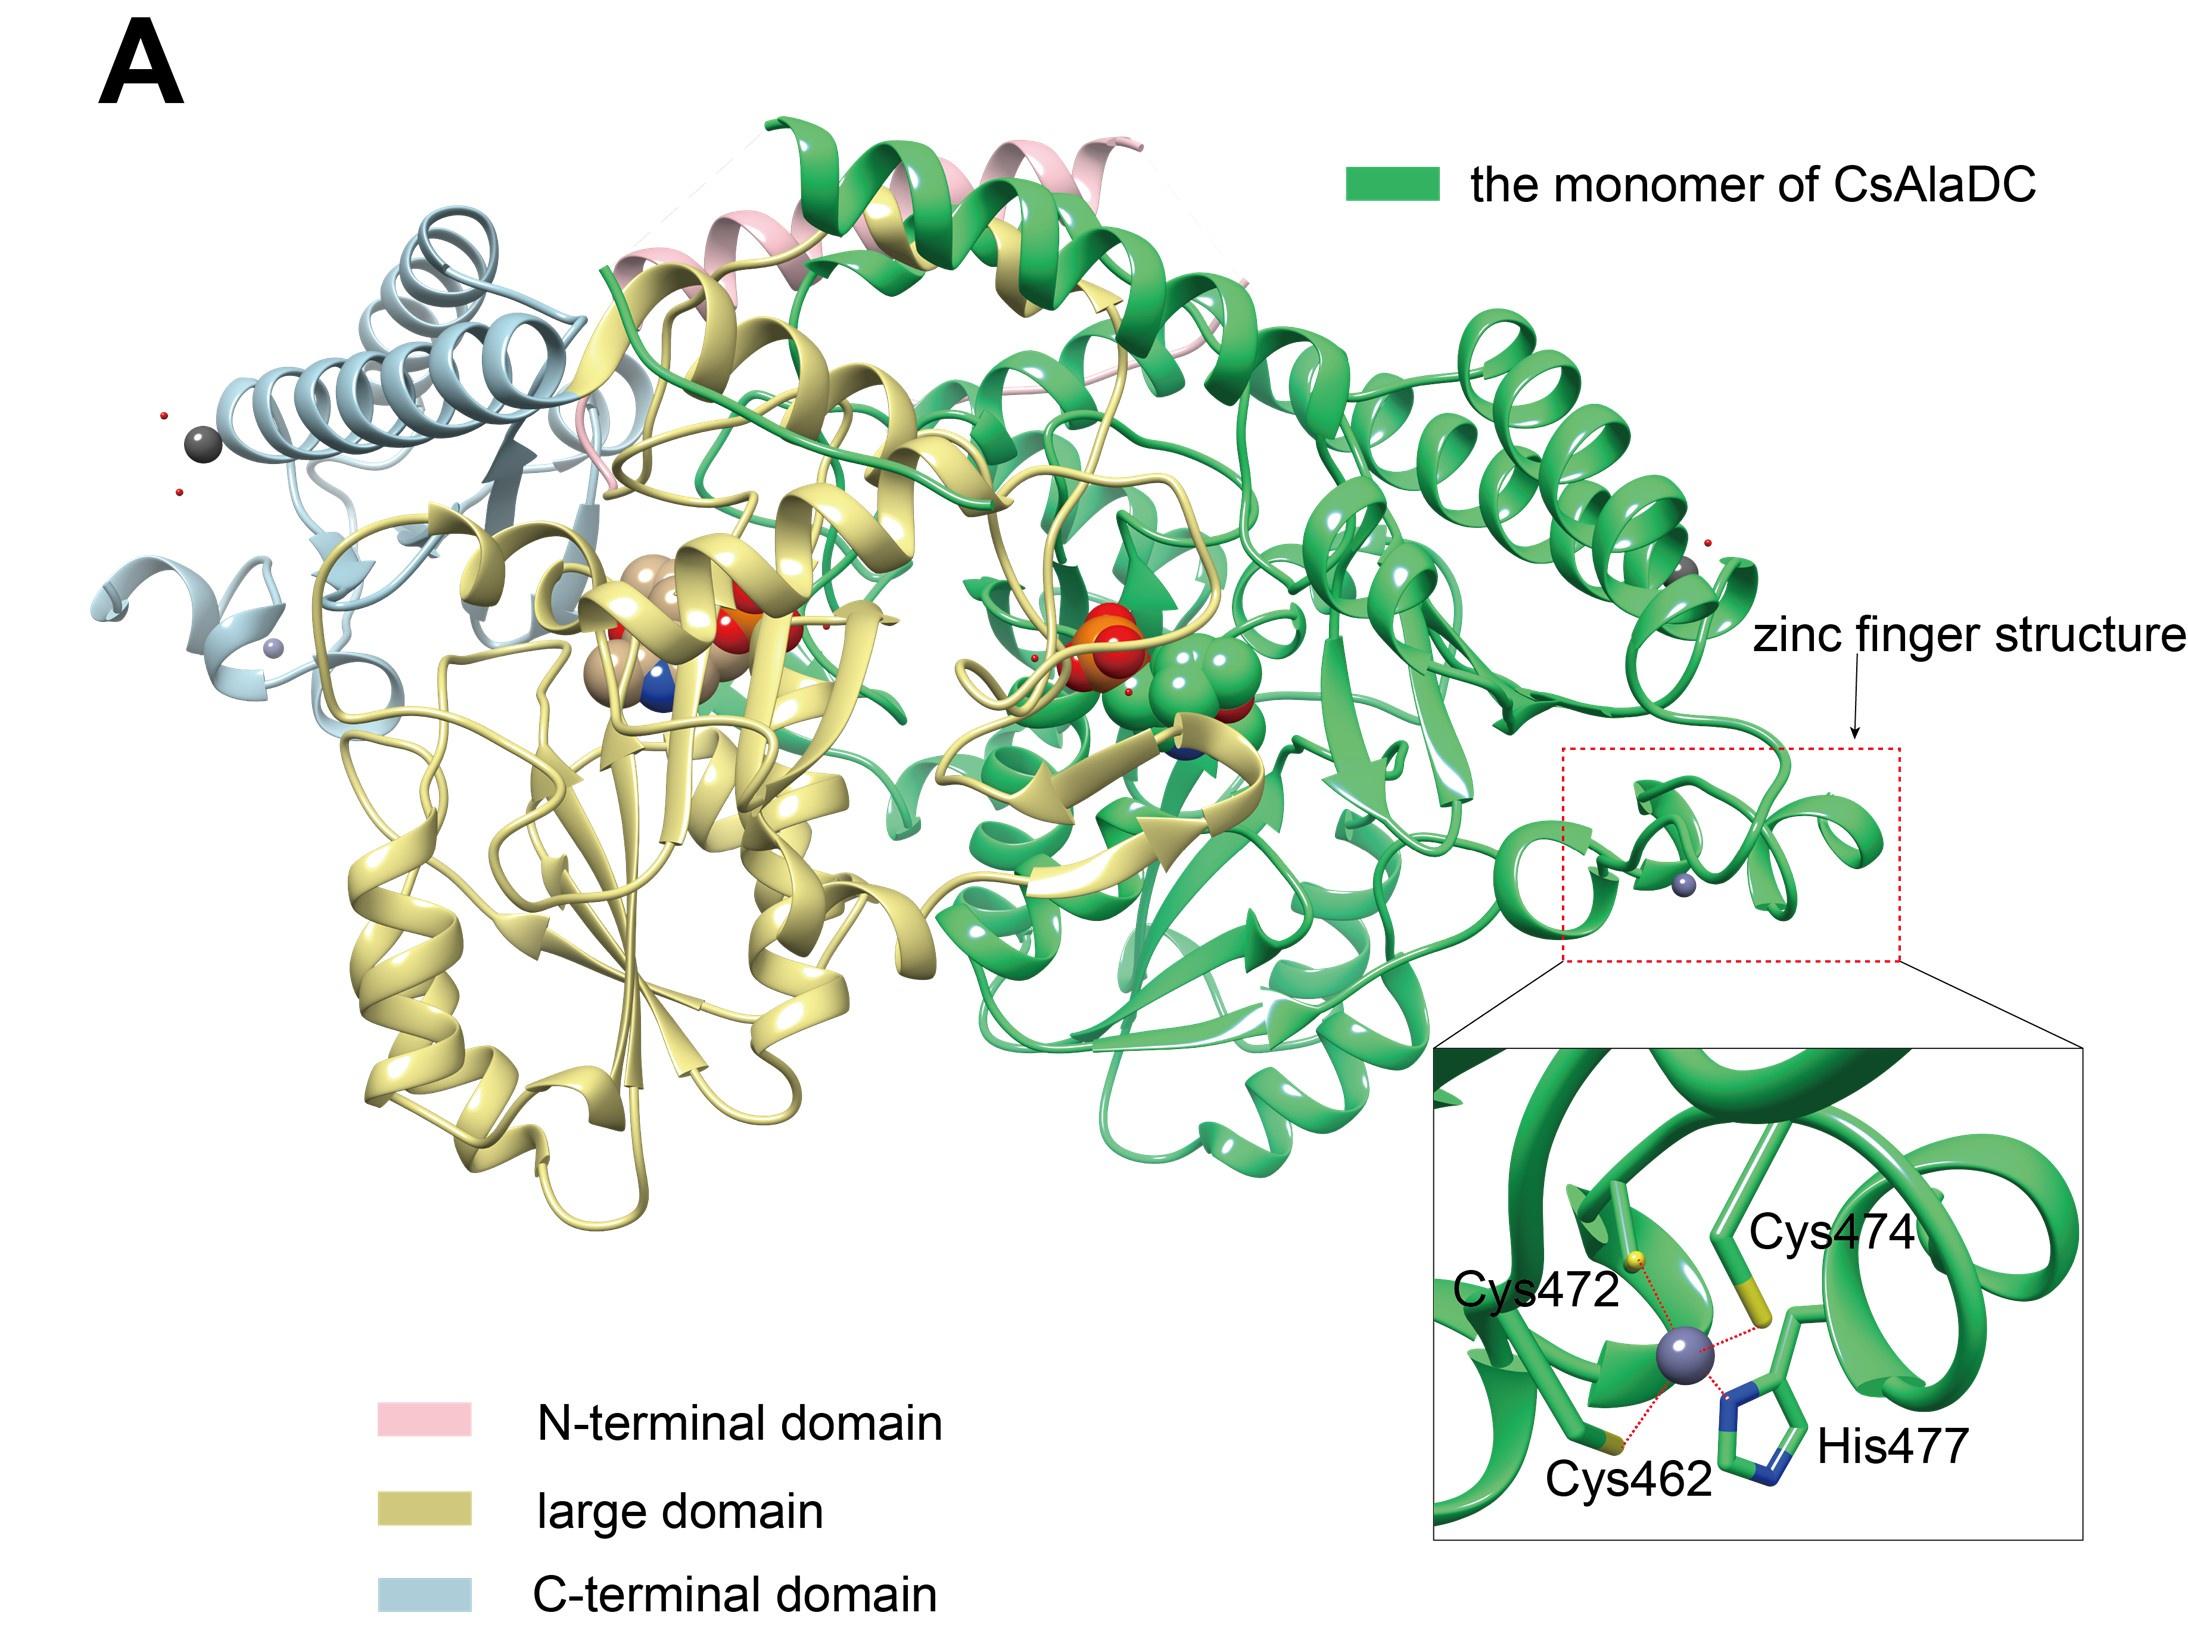
Response: Thank you very much for your suggestions, we have made modifications to Figure 3A as follows:
Author response image 5.
Crystal structures of CsAlaDC and AtSerDC. (A) Dimer structure of CsAlaDC. The color display of the N-terminal domain, large domain, and C-terminal domains of chain A is shown in light pink, khaki and sky blue, respectively. Chain B is shown in spring green. The PLP molecule is shown as a sphere model. The zinc finger structure at the C-terminus of CsAlaDC is indicated by the red box. The gray spheres represent zinc ions, while the red dotted line depicts the coordination bonds formed by zinc ions with cysteine and histidine.
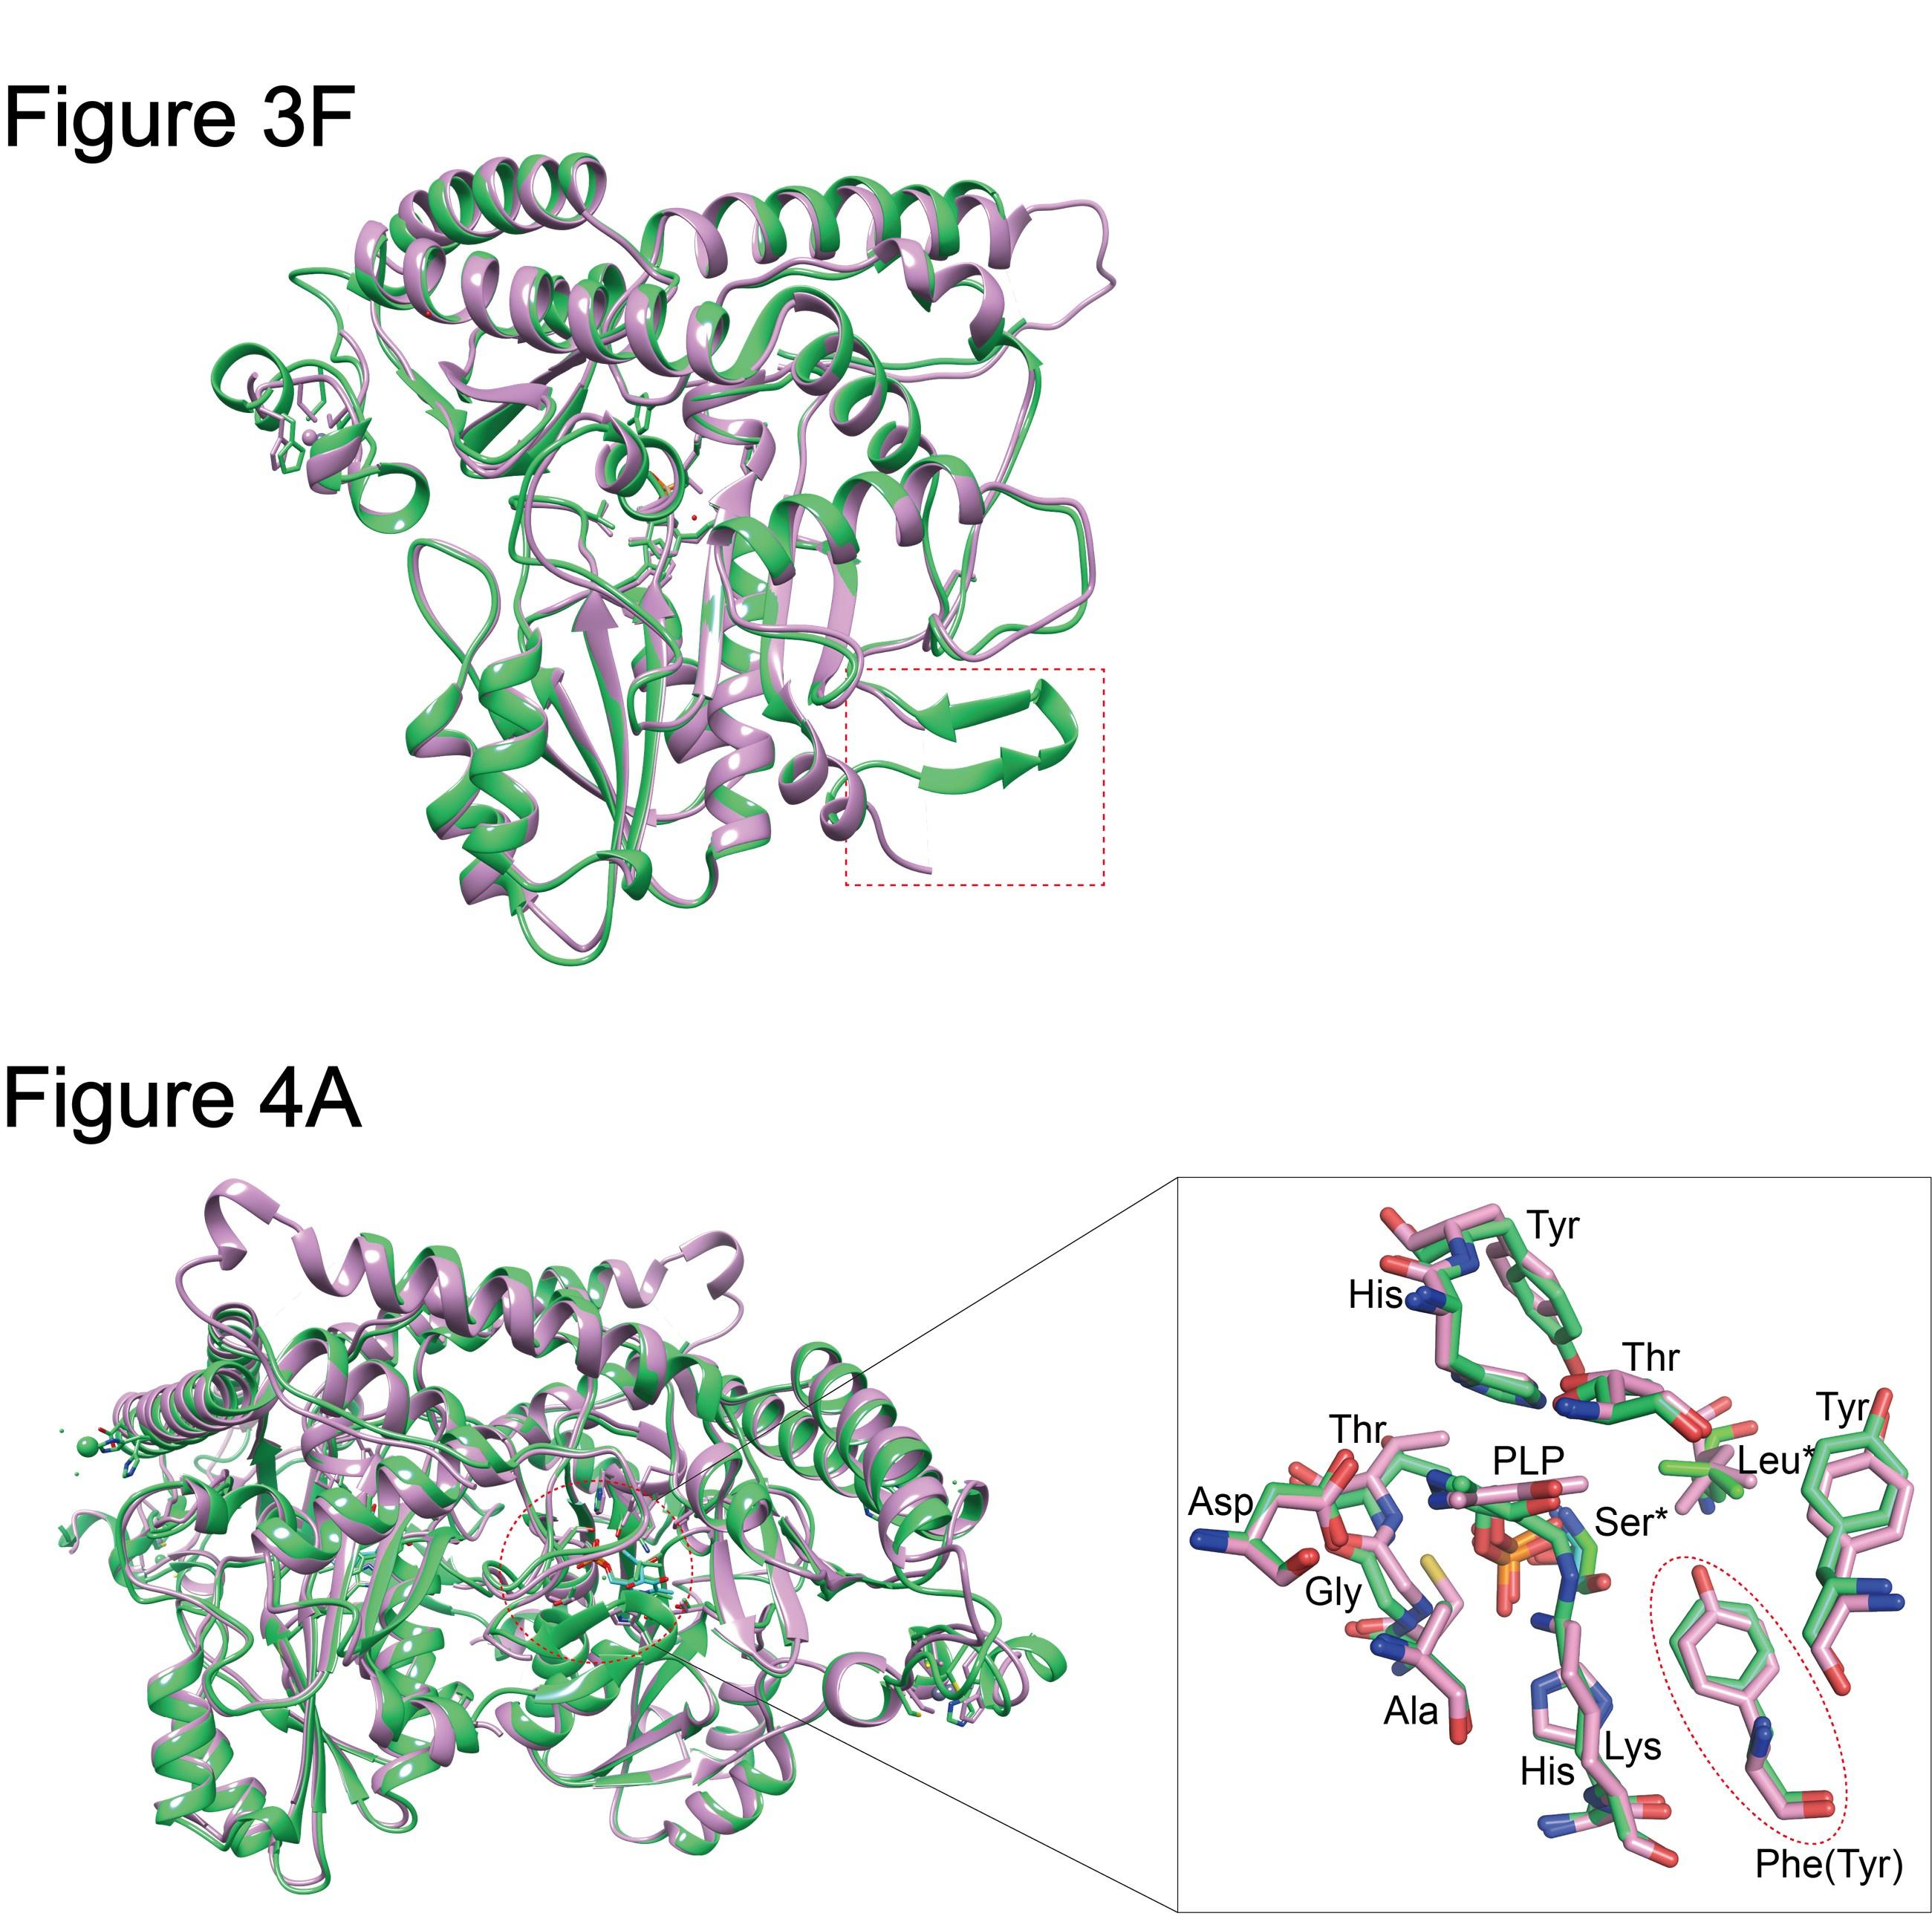
Figures 3F & 4A
In these figures, the two structures are overlaid and compared, but the colors are very similar to see the differences. The authors should use a different color scheme.
Response: Thank you very much for your suggestions, we have made modifications to the Figure 3F & 4A as follows:
Author response image 6.
(Figure 3F) - The monomers of CsAlaDC and AtSerDC are superimposed. CsAlaDC is depicted in spring green, while AtSerDC is shown in plum. The conserved amino acid catalytic ring is indicated by the red box. (Figure 4A) - Superposition of substrate binding pocket amino acid residues in CsAlaDC and AtSerDC. The amino acid residues of CsAlaDC are shown in spring green, the amino acid residues of AtSerDC are shown in plum, with the substrate specificity-related amino acid residue highlighted in a red ellipse.
Pages 7 & 8
Figures 3 and 4 do not include illustrations of what the authors describe in the text. The reader will not be able to understand the descriptions until they download and view the structures themselves. The authors should create additional figures to make it easier for readers to understand the structures.
Response: Thank you very much for your suggestions, we have included supplementary figure 1 in the revised manuscript, which presents more elaborate structural depictions of the two proteins.
Pages 9 & 10
"This result suggested this Tyr is required for the catalytic activity of CsAlaDC and AtSerDC."
The author's results are interesting, but it is recommended to perform the experiments in a specific order. First, experiments should determine whether mutagenesis affects the protein's stability (e.g., CD, as discussed earlier), and second, whether mutagenesis affects ligand binding (e.g., ITC, SPR, etc.), before describing how site-directed mutagenesis alters enzyme activity. In particular, the authors' hypothesis would be much more convincing if they could show that the ligand binding affinity is similar between WT and mutants.
Response: Thank you for your insightful feedback on our manuscript, which we greatly appreciate. Your suggestion to methodically sequence the experiments provides a clear pathway to bolster the strength and conclusiveness of our results.
We agree that it is crucial to first assess the stability of the mutant proteins, as changes therein could inadvertently affect catalytic activity. To this end, we have employed circular dichroism (CD) to study the potential structural alterations in the proteins induced by mutations. The experimental results are shown in the following figure:
Author response image 7.
(A) Circular Dichroism Spectra of CsAlaDC (WT). (B) Circular Dichroism Spectra of CsAlaDC (Y336F). (C) Circular Dichroism Spectra of CD of AtSerDC (WT). (D) Circular Dichroism Spectra of AtSerDC (Y341F).
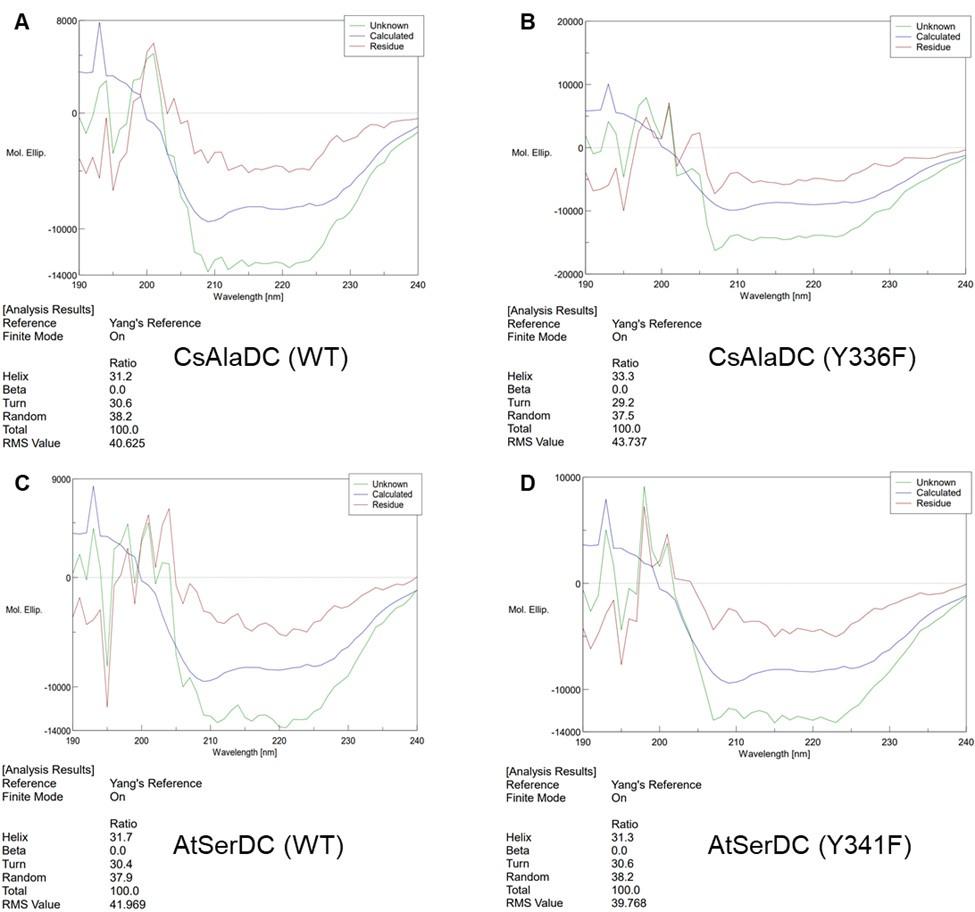
The experimental results indicate that the secondary structure of the mutant proteins remains unchanged, which means the mutations do not alter the protein's stability.
The ligand PLP forms a Schiff base structure with the ε-amino group of a lysine residue in the protein, with maximum absorbance around 420-430 nm. Since we have already added PLP during the protein purification process, as long as the absorbance of mutant proteins and wild-type proteins is the same at 420-430 nm at equivalent concentrations, it indicates that the mutant proteins do not affect the binding of the ligand PLP. Therefore, we scanned the UV-visible absorption spectra of both the wild-type and mutant proteins, and the results are as presented in the following figure:
Author response image 8.
(A) UV-Visible Absorption Spectra of CsAlaDC (WT) compared to CsAlaDC (Y336F). (B) UV-Visible Absorption Spectra of AtSerDC (WT) compared to AtSerDC (Y341F).
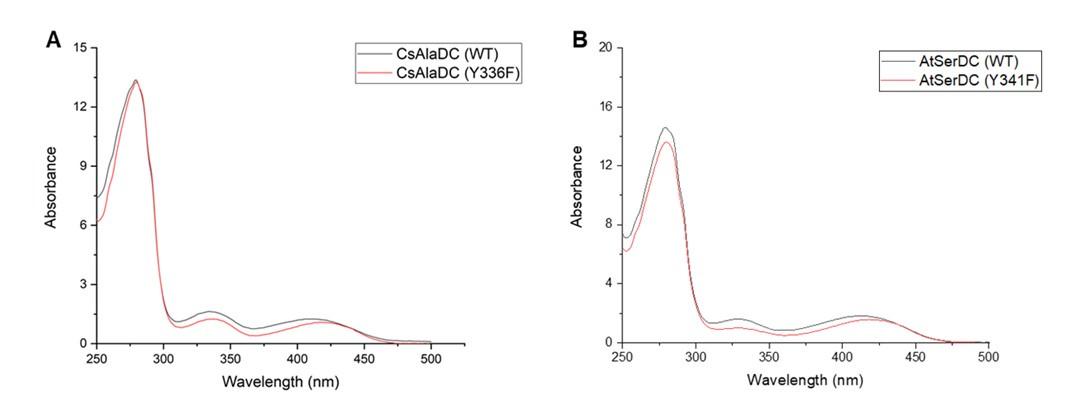
The mutant protein and the wild-type protein exhibit similar absorbance at 420-430 nm, indicating that the mutation does not affect the binding of PLP to the protein.
The above experiments have confirmed that the mutations do not significantly affect the stability of the protein or the affinity for the ligand, so we can more confidently attribute changes in enzyme activity to the specific role of the tyrosine residue in question. We believe this comprehensive approach will substantiate our hypothesis and illustrate the necessity of this Tyr residue for the catalytic activity of CsAlaDC and AtSerDC enzymes.
Figure 3
In the 3D structure figure provided by the authors, the proposed reaction mechanism of the enzyme and the involved amino acids are not included. Can the authors add a supplementary figure with a schematic drawing that includes more information, such as distances?
Response: Thank you for your valuable feedback on our manuscript. We completely agree that a schematic drawing with additional details, including distances, would enhance the clarity and understanding of the enzymatic mechanism. In response to your suggestion, we have added a supplementary figure 2 in the revised manuscript that accurately illustrates the proposed reaction pathway, highlighting the key amino acids involved.
Page 10
"The results showed that 5 mM L-DTT reduced the relative activity of CsAlaDC and AtSerDC to 22.0% and 35.2%, respectively"
The authors primarily use relative activity to compare WT and mutants. Can the authors specify the exact experiments, units, and experimental conditions? Is it Vmax or catalytic efficiency? If so, under what specific experimental conditions?
Response: Thank you for your attention and review of our research paper, we appreciate your suggestions and feedback. The experimental protocol employed to evaluate the influence of DTT on protein catalytic efficiency is outlined as follows:
The 100 μL reaction mixture, containing 20 mM substrate (Ala or Ser), 100 mM potassium phosphate, 0.1 mM PLP, 5 mM L-DTT, and 0.025 mM purified enzyme, was prepared and incubated at standard conditions (45 °C and pH 8.0 for CsAlaDC for 5 min, 40 °C and pH 8.0 for AtSerDC for 2 min). DTT is absent as a control in the reaction system. Then the reaction was stopped with 20 μL of 10% trichloroacetic acid. The product was derivatized with 6-aminoquinolyl-N-hydroxy-succinimidyl carbamate (AQC) and subjected to analysis by UPLC. All enzymatic assays were performed in triplicate.
However, due to the unknown mechanism of DTT inhibition on protein activity, we have removed this part of the content in the revised manuscript.
Pages 10-12
The identification of 'Phe106 in CsAlaDC' and 'Tyr111 in AtSerDC,' along with the subsequent mutagenesis and enzymatic activity assays, is intriguing. However, the current manuscript lacks an explanation and discussion of the underlying reasons for these results. As previously mentioned, it would be helpful to gain insights and analysis from WT-ligand and mutant-ligand binding studies (e.g., ITC, SPR, etc.). Furthermore, the authors' analysis would be more convincing with accompanying structural analysis, such as steric hindrance analysis.
Response: Thank you for your insightful comments and constructive feedback on our manuscript. We appreciate the interest you have expressed in the identification of 'Phe106 in CsAlaDC' and 'Tyr111 in AtSerDC' and their functional implications based on mutagenesis and enzymatic assays.
In order to investigate the binding status of the mutant protein and the ligand PLP,we scanned the UV-visible absorption spectra of both the wild-type and mutant proteins, and the results are as presented in the following figure:
Author response image 9.
(A) UV-Visible Absorption Spectra of CsAlaDC (WT) compared to CsAlaDC (F106Y). (B) UV-Visible Absorption Spectra of AtSerDC (WT) compared to AtSerDC (Y111F).
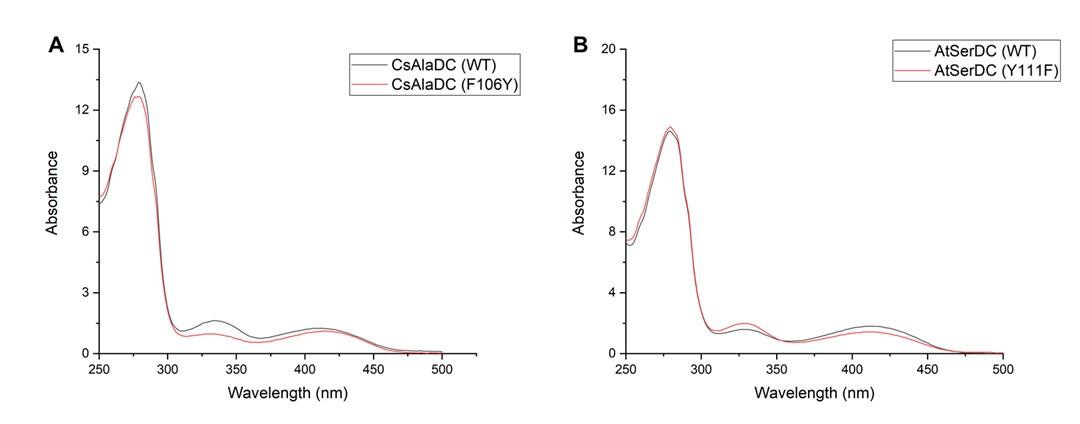
The mutant protein and the wild-type protein exhibit similar absorbance at 420-430 nm, indicating that the mutation does not affect the binding of PLP to the protein. Therefore, we can conclude that the change in activity of the mutant protein is caused by the substitution of the amino acid at that site, i.e., the amino acid at that site affects substrate specificity. By combining the structure of the two proteins, we can see that the Lys at position 111 of AtSerDC is a hydrophilic amino acid, which increases the hydrophilicity of the active site, and thus the substrate is the hydrophilic amino acid Ser. In contrast, the amino acid at the corresponding site in CsAlaDC is Phe, which, lacking a hydroxyl group compared to Lys, increases the hydrophobicity of the active site, making the substrate lean towards the hydrophobic amino acid Ala. We have added a discussion of the potential reasons for this result to the revised manuscript's discussion section.
Page 5 & Figure 1B
"As expected, CsSerDC was most closed to AtSerDC, which implies that they shared similar functions. However, CsAlaDC is relatively distant from CsSerDC."
In Figure 1B, CsSerDC and AtSerDC are in different clades, and this figure does not show that the two enzymes are closest. To provide another quantitative comparison, please provide a matrix table showing amino acid sequence similarities as a supplemental table.
Response: Many thanks for your constructive suggestion. We added a matrix table showing amino acid sequence similarities in the supplemental materials. The results showed that the similarity of amino acid sequences between CsSerDC and AtSerDC is 86.21%, which is higher than that between CsAlaDC and CsSerDC (84.92%). This data exactly supports the description of Figure 1B. We added the description of the amino acid sequence similarities analysis in the revised manuscript. The description of "As expected, CsSerDC was most closed to AtSerDC, which implies that they shared similar functions. " is not accurate enough, so we revised it to "As expected, CsSerDC was closer to AtSerDC, which implies that they shared similar functions.", in the revised manuscript.
Page 5 & Figure 1C
Figure 1C, which shows a multiple sequence alignment with the amino acid sequences of the 6 SerDCs and CsAlaDC, clearly shows the differences between the sequences of AlaDC and other SerDCs. However, the authors' hypothesis would be more convincing if they showed that this difference is also conserved in AlaDCs from other plants. Can the authors show a new multiple-sequence alignment by adding more amino acid sequences of other AlaDCs?
Response: Thank you for your comments and suggestions. We aim to discover additional alanine decarboxylase. However, at present, the only experimentally confirmed alanine decarboxylase is CsAlaDC. No experimentally verified alanine decarboxylases have been found in other plant species.
Figure 5A
Figure 5A is missing the error bar.
Response: Figure 5A serves as a preliminary screening for these mutants, without conducting repeated experiments. Subsequently, only the L110F and P114A mutants, which exhibited significantly improved activity, underwent further experimental verification to confirm their enhanced functionality.