Claude can even automatically learn from _other_ Slack channels and data sources, if it's granted permission.
大多数人认为AI应该严格限制在特定任务和数据集内,以避免信息污染和边界模糊,但作者认为AI应该能够跨渠道学习并整合不同来源的信息。这挑战了人们对AI应用范围和数据隔离的传统认知,暗示未来AI将更像是具有广泛知识背景的团队成员。
Claude can even automatically learn from _other_ Slack channels and data sources, if it's granted permission.
大多数人认为AI应该严格限制在特定任务和数据集内,以避免信息污染和边界模糊,但作者认为AI应该能够跨渠道学习并整合不同来源的信息。这挑战了人们对AI应用范围和数据隔离的传统认知,暗示未来AI将更像是具有广泛知识背景的团队成员。
We now spend much more of our time delegating tasks to many Claudes in parallel.
大多数人认为AI会取代人类工作,导致失业,但作者认为AI实际上改变了人类工作方式,让人们转向更高层次的任务分配和管理。这挑战了关于AI与就业关系的传统叙事,表明AI可能创造新的工作形式而非简单替代人类。
Today, 65% of our product team's code is created by our internal version of Claude Tag.
大多数人认为AI辅助编程只是辅助工具,主要用于代码补全或简单任务,但作者认为AI已经成为主要代码生产者,因为内部版本已经完成了产品团队65%的代码生成。这挑战了人们对AI在软件开发中角色的传统认知,表明AI已从辅助工具转变为核心生产力工具。
Note: This preprint has been reviewed by subject experts for Review Commons. Content has not been altered except for formatting.
Learn more at Review Commons
In their manuscript entitled " Single-molecule behavior and cell-growth regulation in human RTKs" Abe et al. demonstrate automated single-particle tracking of 52 receptor tyrosine kinases (RTKs) in both resting state and upon stimulation with the respective ligands. The approach is based on transient transfection of cells with each RTK tagged with a Halo-tag, allowing for subsequent dye labeling and live cell video recording using TIRF microscopy. Subsequently, a seemingly commercial analysis software is used to then obtain particle trajectories from single molecule localizations and analyze their properties using a hidden Markov model. The authors have previously demonstrated pioneering work in the field of single-particle tracking with respect to automation (Yasui et al, 2018) and analysis (Yanagawa et al, 2021), and in this work they scale their approach up to characterize a broad set of RTKs. The resulting observations are a powerful demonstration of the benefits of SPT in general and significantly advance our understanding of the dynamics of RTKs as a class, beyond the most prominently studied candidate EGFR, as well as promising evolutionary insights.
Comments and questions:
The manuscript by Abe et al. represents a significant advancement in the field of single-particle tracking (SPT) by scaling up recording 52 human receptor tyrosine kinases (RTKs), offering comprehensive insights into their dynamics beyond the traditionally studied EGFR. While the study demonstrates cutting edge single-particle tracking and provides promising evolutionary insights, it currently lacks certain methodological details that are essential for reproducibility, such as specific parameters used in particle localization and trajectory analysis. The exclusion of 6 out of 58 human RTKs without discussion also requires further explanation, but overall, the study fills a knowledge gap by providing a broad overview of RTK dynamics and their diffusion behavior. Overall, this work should have broad appeal to fields such as cell signaling as well as methods development int the area of single-particle tracking.
a decade ago or more I invented the notion of on page notation.processor that can be activated on any line in an HTML editor on demand
recently I discovered that I was 20 years behind Engelbart's work, again, reinventing another idea of his community: the notation.processor
The Command Language Interpreter that was at the heeart of the Mother of All Demos that became MetaIV, is very much in the small ball partk, the ability to define the input to a program as a language, in their case, as it was an interactive program, they gone meta too, and defined the command language interpreter using explicit meta linguistic formalism, noation, and the program becomes a command langauge interpreeter
Reviewer #1 (Public review):
Summary:
This study investigates epigenetic and three-dimensional chromatin alterations associated with primary trastuzumab resistance in HER2-positive breast cancer using integrated CUT&Tag, RNA-seq, and Micro-C analyses in JIMT1 (resistant) and SKBR3 (sensitive) cell models. The authors identify widespread remodeling of histone modification landscapes, chromatin compartment organization, and promoter-enhancer looping, highlighting SGK1 as a candidate epigenetically activated mediator associated with intrinsic resistance. The manuscript provides a technically solid and extensive multi-omic resource for the study of HER2-positive breast cancer resistance states.
Strengths:
The study integrates multiple state-of-the-art epigenomic and chromatin conformation approaches, including CUT&Tag, RNA-seq, and Micro-C, generating a comprehensive dataset that will likely be valuable to the field. The analyses are generally technically rigorous and well executed, and the manuscript is overall clearly written. The integration of chromatin architecture, enhancer activity, transcriptional regulation, and histone modification profiling provides an informative overview of large-scale epigenomic remodeling associated with resistant versus sensitive HER2-positive breast cancer states. The identification of SGK1-associated chromatin activation and enhancer rewiring is particularly interesting and supported by multiple orthogonal datasets.
The inclusion of both intrinsic and acquired trastuzumab resistance models also strengthens the study conceptually, even if the biological interpretation remains somewhat complex.
Weaknesses:
The major limitation of the study is that many of the central mechanistic conclusions remain largely correlative. Although coordinated changes in chromatin architecture, histone modifications, enhancer activity, and SGK1 expression are observed, direct evidence demonstrating that these epigenetic alterations causally drive SGK1 activation or trastuzumab resistance is currently lacking.
In addition, the interpretation of SGK1 as a broader trastuzumab-resistance driver is somewhat weakened by the analyses in the acquired resistant SKBR3_HR model, where SGK1-associated chromatin and transcriptional changes appear largely absent. This raises the possibility that SGK1 dependency may reflect a lineage- or model-specific vulnerability intrinsic to JIMT1 cells rather than a generalizable resistance mechanism.
The study also remains descriptive in several sections. Numerous chromatin interactions and compartment changes are cataloged without sufficient biological contextualization or mechanistic integration. As a result, parts of the manuscript currently read more as a comprehensive epigenomic profiling resource than a fully mechanistic study of resistance biology.
Finally, the translational impact is limited by the lack of patient-level validation linking SGK1 activation to trastuzumab response or clinical outcome in HER2-positive breast cancer cohorts.
Reviewer #2 (Public review):
Summary:
Duan, Hua et al. used CUT&Tag and Micro-C to investigate that in primary trastuzumab-resistant HER2+ breast cancer cells, promoter H3K4me3 rather than H3K27me3 is strongly correlated with transcriptional activity. Resistant cells also exhibited more abundant promoter-enhancer loops and enriched cohesin at loop anchors, accompanied by shifts in A/B compartment status. Through multi-omics integration, the authors identified SGK1 as a key gene showing elevated promoter H3K4me3 levels, enhancer activation, strengthened chromatin loops, and upregulated transcription in resistant cells, and validated SGK1 as a potential therapeutic target. These findings reveal the coordinated interplay between three-dimensional chromatin architecture and epigenetic modifications, offering important insights into trastuzumab resistance in HER2+ breast cancer.
Strengths:
Previous investigations into trastuzumab resistance have largely focused on genetic mutations or individual epigenetic modifications. In contrast, this study moves beyond genetic or single epigenetic views by integrating histone modifications and 3D chromatin architecture into a unified framework, proposing a synergistic model of promoter H3K4me3, enhancer activation, and chromatin looping that underlies non-genetic resistance. It provides a new conceptual basis for understanding non-genetic resistance mechanisms. Secondly, using high-resolution epigenomic and conformational mapping together with bidirectional in vitro and in vivo functional validation, it establishes a solid link between epigenetic changes and phenotypes, and demonstrates that SGK1 inhibition suppresses tumor growth in a xenograft model, revealing clear translational potential.
Weaknesses:
(1) All findings are based on a single pair of cell lines, JIMT1 and SKBR3, which does not allow exclusion of cell line‑specific effects. The authors did not examine SGK1 expression levels, promoter H3K4me3 status, or relevant chromatin loops in tumor tissues from patients with clinical trastuzumab resistance. Consequently, whether the conclusions can be extrapolated to actual patient populations remains unclear, which limits the clinical relevance of the findings. It is recommended that the authors directly validate the key findings using tumor samples from patients with clinical trastuzumab resistance or analyze the correlation between SGK1 expression levels and disease-free survival or pathological complete response using data from public databases for HER2+ breast cancer patients, which would help address the current limitation of lacking clinical sample validation and the uncertainty regarding the association of SGK1 with patient prognosis and treatment response.
(2) In the Discussion, the authors propose that SGK1 may assume the role of AKT to sustain mTOR activation, thereby bypassing the dependence on HER2 signaling following trastuzumab inhibition. Although this hypothesis is supported by published literature, the present study provides no direct signaling evidence, such as examining phosphorylation changes of SGK1, AKT, mTOR, or their downstream effectors.
Reviewer #3 (Public review):
Summary:
Previous work from the Cahalan lab used fluorescent Genetically Encoded Ca2+ Indicators (GECI), like GCaMP6f, tethered to the N- or C- terminus of Orai1 to monitor CRAC channel optical signals (Dynes et al., PNAS 2016 PMID: 26712003; J Gen Physiol 2020 PMID: 32589186; PNAS 2023 PMID: 37729200). In this study from the Lewis lab, the HaloTag system enables C-terminal labeling of Orai1 with a reactive JF646-BAPTA loaded into cells. The article raises two key issues with the Ca2+ indicator probe that may limit potential applications: probe loading conditions and blinking.
Making Sense of Probe Probe-lems:
This is a three-component system: the hexameric Orai1 channel, the Halo tag, and the Ca2+ indicator (four components if you count the GFP- or mCherry-tagged STIM1 in the endoplasmic reticulum membrane that activates the plasma membrane Orai1 channel). The Orai1 channel, tagged with the Halo protein, appears to function normally, judging from the characteristic inwardly rectifying Ca2+ current first observed in T lymphocytes (Lewis and Cahalan, Cell Regulation 1989 PMID: 2519622). One problem is to find a condition for indicator dye loading that results in complete and uniform labeling with the covalently linked JF646 indicator. JF646-BAPTA is a far-red fluorescent indicator related to BAPTA, with a Kd of ~150 nM. The esterified form can be loaded into cells, as is routinely done for Ca2+ indicators like fura-2 or fluo-4. Ideally, to monitor local Ca2+ in the cytosolic nanodomain of the Orai1 channel, the indicator should react with each and every Halo tag of the hexameric channel. The authors assessed published methods by varying the exposure time to the JF646-BAPTA-esterified probe. The authors then used green JF552 labeling following red JF646-BAPTA loading to assess the completeness of labeling. Even overnight incubation of Halo-tagged cells was not sufficient. The addition of Pluronic treatment for 1 hr improved labeling, and a standard condition was adopted. Under this condition, no additional labeling with the green JF552 was seen, implying complete labeling with JF646-BAPTA. However, even with complete labeling, several additional effects might reduce the effective signal-to-noise, which is lower in these studies than expected from in vitro measurements - for example, if the JF646-BAPTA molecules are incompletely de-esterified, or if there is quenching between the closely spaced probes attached to the channel hexamer.
A second, more serious problem analyzed by this article is that the JF646-BAPTA probe blinks on and off spontaneously, making it problematic to monitor true single-channel events in which the channel open state is assessed by the fluorescent probe. The authors distinguish blinking from channel-gating events by carefully noting the residual level of fluorescence in the absence of Ca2+ influx. Blinking events occur in bursts that reduce fluorescence transiently to zero, whereas the closed channel labeled with JF646-BAPTA retains a low level of fluorescence (~20%). To circumvent the blinking issue, the authors use whole-cell patch recording, in conjunction with optical recording (Patch-TIRF). This allows channel-gating events to be identified by step-wise changes in fluorescence due to Ca2+ entry upon hyperpolarization to -100 mV, above a baseline level of fluorescence at +30 mV, which the authors presume represents the closed channel level of fluorescence. Irreversible photobleaching is an additional issue, limiting the recording times to less than 1 minute.
Visualizing Orai1 Single-Channels:
With the blinking problem circumvented, at least in part, the authors uncovered a wide variety of single-channel events. Cells with low expression levels of Orai1 revealed 0-3 active Orai1 channels per STIM1 puncta. The range of gating behavior at the single-channel level is one of the revelations in this study. A substantial fraction (11%) of puncta contained "silent" channels that did not open (detected by the non-zero level of baseline fluorescence for closed channels). At the other extreme, some channels remained open for tens of seconds. On average, channels that opened and closed stochastically exhibited a bi-exponential distribution of bright states (open channels), with a major component of fast events (92 ms) and a minor component of slower ones (1190 ms), as well a single-exponential distribution of dark states (closed channels), and open probabilities >0.7. Channel open/closed times and the high open probability of active Orai1 channels seen here reinforce previous work based on analysis of CRAC current fluctuations in whole-cell recording, and optical single-channel recording using a different genetically encoded Ca2+ indicator, G-GECO1, tethered to Orai1 (Prakriya and Lewis, J Gen Physiol 2006 PMID: 16940559; Dynes et al., PNAS 2016 PMID: 26712003).
Expression levels for single-channel optical recording must be low; accordingly, puncta contained only 0-3 active channels. However, under conditions of high STIM1 and Orai1 expression, conventionally used to investigate channel function, as in Figure 1, cells with large currents express many thousands of active channels. The number of active channels per cell can be calculated by dividing the peak current (~-100 pA) by the voltage (-100 mV); this corresponds to a whole-cell conductance (G) of ~1 nS (conductance is measured in Siemens). The single channel conductance (gamma, too low to detect electrically) is estimated by noise analysis to be 20-40 fS. Thus, the number of active channels is given by G / gamma corresponding to a range of > 25,000 - 50,000 open channels per cell. Under similar conditions of high STIM1/Orai1 co-expression in HEK cells, individual Orai1 channels were visualized at high density in puncta by freeze-fracture electron microscopy (Perni et al., PNAS 2015 PMID: 26351694), revealing puncta packed with Orai1 particles corresponding to hundreds to >1000 channels per punctum. Measuring the center-to-center distances between particles in puncta revealed two peaks in a distribution of inter-particle lengths: 9 nm (consistent with the approximate width of the Orai1 channel hexamer) and 15 nm (possibly due to two adjacent Orai1 channels held together by intervening STIM1 dimers).
Strengths:
The authors do an excellent job of analyzing and discussing probe artifacts that can confound measurements at the single-channel level. On the technical side, we thank the authors for including a photon 'budget' for their imaging experiments by including: the conversion factor from camera intensity units (c.u.) to photoelectrons, cell background fluorescence levels, and nominally Ca2+ free single channel fluorescence levels. One parameter missing from the list is the size of the region of interest used for channel recording. We expect the intensity measurements provided in the channel traces to correspond to mean ROI intensity levels. Upon knowing the ROI size in pixels, the magnitude of fluorescent signals could then be calculated in photons. Taken together, these values will aid comparisons to previous work and help guide subsequent researchers doing their own optical recording.
The most important finding of this study is the ability to analyze single-channel properties of active Orai1 channels using the HaloTag approach. By direct measurement, the authors confirm previous work that there are at least two open states and that the CRAC channel open probability is greater than 0.7.
Like any good study, this work suggests opportunities for further work. At the chemistry level, one focus should be the development of new probes that don't blink and have lower affinity for Ca2+ to circumvent unwanted responses to global Ca2+ signaling. Far-red probes like JF646-BAPTA have the advantage of reduced scattering for in vivo imaging applications. At the level of channel molecular function, the results pave the way for unraveling mechanisms of channel gating, such as the requirement for STIM1 binding to activate sub-states of Orai1, and how the channel undergoes Ca2+-dependent inactivation. At the cellular physiology level, localized Ca2+ probes should help to clarify mechanisms that couple to changes in gene expression and reveal Ca2+ signaling in subcellular structures, including dendritic spines. As a nice proof of principle, Halo-tagging enabled Ca2+ signals to be measured in primary cilia (Deo et al., J Am Chem Soc 2019 PMID: 31430138). Future users of HaloTag and GECI Ca2+ indicators will need to confront the issues (probe-lems) at the single-channel level that are carefully raised and analyzed in this article.
Weaknesses:
The major confounding issue identified here is probe blinking. The authors find a way to circumvent the issue, but not to prevent it. Is it triggered by high laser light intensity? Do the six JF646-BAPTA molecules tagging a single Orai1 channel exhibit quenching or correlated blinking?
Which type of probe is better for understanding more about the CRAC channel function? It is difficult to evaluate the pros and cons of the HaloTag and GECI approaches without a side-by-side comparison under identical conditions (except for the probe, obviously). With respect to Ca2+ affinities, higher Kd values (lower affinity) are probably better. JF646-BAPTA has a relatively low Kd value (150 nm) compared to Orai1-GCaMP6f (620 nM in situ), which may account for the saturation of optical signals at potentials more negative than -75 mV in this study. In contrast, saturation did not occur at negative potentials with Orai1-GCaMP6f in the study by Dynes et al., 2020. Lower affinity also makes the probe more resistant to unwanted signals from global increases in Ca2+. With respect to response kinetics, the finding that JF646-BAPTA has faster Ca2+ binding and unbinding kinetics than GECIs in Deo et al., 2019, occurred before publication of the jGCaMP8 series indicators in Y. Zhang et al., Nature 2023. Kinetic measurement of Orai1-jGCaMP8f fusions was reported in Dynes et al., PNAS 2023, and these measurements were performed using the same patch-TIRF approach as the present manuscript. While photoinactivation of jGCaMP8f fused to Orai1 interfered with kinetic measurements, Orai1-jGCaMP8f V203Y (a mutant with greatly reduced photoinactivation) exhibited a tauon of 10 ms and tauoff of 15 ms, roughly twice as fast as the values reported for Orai1-HaloTag-JF646-BAPTA in the present manuscript. The manuscript text comparing Halo-Tag kinetics with GECI should be revised accordingly.
The authors suggest that single-channel events reported previously for Piezo1 channels (Bertaccini et al., Nat Comm 2025 PMID: 40593468) may be due to probe blinking. However, that study included two critical controls that demonstrate that signals reflect bona fide channel activity rather than blinking artifacts. Notably: (1) treatment with channel activator Yoda1 increased bright-state occupancy (Figure 3C - 3G), and (2) increasing channel open probability by administering a mechanical stimulus increased bright-state occupancy (Supplementary Figure 13).
For a new unit with context ccc, we write a unified empirical objective: ˆθ(c)∈argminθ∈Θ∑(i,j)∈S(c)ℓ(hθ(xij),yij)context-dependent support+R(θ;c)context-structured regularization,(★)(★)θ^(c)∈argminθ∈Θ∑(i,j)∈S(c)ℓ(hθ(xij),yij)⏟context-dependent support+R(θ;c)⏟context-structured regularization, \widehat{\theta}(c)\in\arg\min_{\theta\in\Theta}\; \underbrace{\sum_{(i,j)\in S(c)} \ell\!\big(h_\theta(x_{ij}),y_{ij}\big)}_{\text{context-dependent support}} \;+\; \underbrace{\mathcal{R}(\theta;\,c)}_{\text{context-structured regularization}}, \tag{★} where ℓℓ\ell is a proper loss (e.g., squared, logistic), S(c)⊆{1,…,n}×NS(c)⊆{1,…,n}×NS(c)\subseteq\{1,\dots,n\}\times\mathbb{N} is a support set selected for context ccc, and R(θ;c)R(θ;c)\mathcal{R}(\theta;c) encodes how parameters are allowed to vary with context (smoothness, sparsity, low-rank, hierarchy, etc.).
I believe this particular form was used in Mladen, Le, Xing 2029, and then systematically studied in Estimating time-varying networks, AOAO 2010 Mladen Kolar, Le Song, Amr Ahmed, Eric P Xing
Author response:
The following is the authors’ response to the original reviews.
Public Reviews:
Reviewer #1 (Public review):
Summary:
Kashiwagi et al. undertook a population analysis of dendritic spine nanostructure applied to the objective grouping of 8 mouse models of neuropsychiatric disorders. They report that spine morphology in cultured hippocampal neurons shows a higher similarity among schizophrenia mouse models (compared with autism spectrum disorder (ASD) mouse models), and identify an effect of Ecrg4 (encoding small secretory peptides) on spine dynamics and shape in these models.
Strengths:
The study developed a method for objectively comparing spine properties in primary hippocampal neuron cultures from 8 mouse models of psychiatric disorders at the population level using high-resolution structured illumination microscopy (SIM) imaging. This novel technique identified two distinct groups of mouse models according to the population-level spine properties: those with ASD-related gene mutations and those with schizophreniarelated gene mutations. Functional studies, including gene knockdown and overexpression experiments, identified an effect of Ecrg4 on the spine phenotype of the schizophrenia model mice.
We thank the reviewer for finding our strategy novel and useful for identifying molecules associated with the spine phenotype in schizophrenia-related mouse models.
Weaknesses:
The main weakness is that the study is wholly in vitro, using cultured hippocampal neurons. The authors present this as an advantage, however, arguing that spine morphology as measured in a reduced culture system can demonstrate direct effects of gene mutations on neuronal phenotypes in the absence of indirect influences from non-neuronal cells or specific environments.
We appreciate this reviewer's concern about the limitation of cultured hippocampal neurons in extracting disease-related spine phenotypes. While we fully recognize this limitation, we consider that this in vitro system has several advantages that contribute to translational research on mental disorders.
First, our culture system has been shown to support the development of spine morphology similar to that of the hippocampal CA1 excitatory synapse in vivo. High-resolution imaging techniques confirmed that the in vitro spine structure was highly preserved compared with in vivo preparations (Kashiwagi et al., Nature Communications, 2019). The present study used the same culture system and SIM imaging. Therefore, the difference we detected in samples derived from disease models is likely to reflect impairment of molecular mechanisms underlying native structural development in vivo.
Second, super-resolution imaging of thousands of spines in tissue preparations under precisely controlled conditions cannot be practically applied using currently available techniques. The advantage of our imaging and analytical pipeline is its reproducibility, which enabled us to compare the spine population data from eight different mouse models without normalization.
Third, a reduced culture system can demonstrate the direct effects of gene mutations on synapse phenotypes, independent of environmental influences. This property is highly advantageous for screening chemical compounds that rescue spine phenotypes. Neuronal firing patterns and receptor functions can also be easily controlled in a culture system. The difference in spine structure between ASD- and schizophrenia-related mouse models is valuable information to establish a drug screening system.
Fourth, establishing an in vitro system for evaluating synapse phenotypes could reduce the need for animal experiments. Researchers should be aware of the 3Rs principles. In the future, combined with differentiation techniques for human iPS cells, our in vitro approach will enable the evaluation of disease-related spine phenotypes without the need for animal experiments. The effort to establish a reliable culture system should not be eliminated.
We modified our text to have a balanced discussion on both advantages and disadvantages of the in vitro culture system in the study of mental disorder mouse models, as follows:
"Finally, while the spine phenotype identified in the human postmortem brain undoubtedly resulted from complex interactions among genetic background, environmental influences, and regulation by non-neuronal cells, data from pure neuronal cultures are more likely to reflect the direct effects of schizophrenia-related gene mutations on synaptic functions. This property may be advantageous for identifying synaptic molecules that regulate synapse phenotypes in schizophrenia-related mouse models. However, the phenotype observed in the culture system requires confirmation using in vivo experiments of mouse models or human tissue samples. Efficient in vitro screening combined with reliable in vivo evaluation of synapses will facilitate translational research on mental disorders."
Another weakness is that CaMKIIαK42R/K42R mutant mice are presented as a schizophrenia model, the authors justifying this by saying that "CaMKII-related signaling pathway disruption has been implicated in the working memory deficits found in schizophrenia patients". Since mutations in CAMK2A cause autosomal dominant intellectual developmental disorder-53 (OMIM 617798) and autosomal recessive intellectual developmental disorder-63 (OMIM 618095), and mice carrying the CAMK2A E183V mutation exhibit ASD-related synaptic and behavioral phenotypes (PMID: 28130356), I think it's stretching credibility to refer to the CaMKIIαK42R/K42R mice as a schizophrenia model.
We agree with this reviewer that CAMK2A mutations in humans are linked to multiple mental disorders, including developmental disorders, ASD, and schizophrenia. Association of gene mutations with the categories of mental disorders is not straightforward, as the symptoms of these disorders also overlap with each other. For the CaMKIIα K42R/K42R mutant, we considered the following points in its characterization as a model of mental disorder. Analysis of CaMKIIα +/- mice in Dr. Tsuyoshi Miyakawa's lab has provided evidence for the reduced CaMKIIα in schizophrenia-related phenotypes (Yamasaki et al., Mol Brain 2008; Frankland et al., Mol Brain Editorial 2008). It is also known that the CaMKIIα R8H mutation in the kinase domain is linked to schizophrenia (Brown et al., 2021). Both CaMKIIα R8H and CaMKIIα K42R mutations are located in the N-terminal domain and eliminate kinase activity. On the other hand, the representative CaMKIIα E183V mutation identified in ASD patients exhibits unique characteristics, including reduced kinase activity, decreased protein stability and expression levels, and disrupted interactions with ASD-associated proteins such as Shank3 (Stephenson et al., 2017). Importantly, reduced dendritic spines in neurons expressing CaMKIIα E183V is a property opposite to that of the CaMKIIα K42R/K42R mutant, which showed increased spine density (Koeberle et al. 2017).
References related to this discussion.
(1) Yamasaki et al., Mol Brain. 2008 DOI: 10.1186/1756-6606-1-6
(2) Frankland et al. Mol Brain. 2008 DOI: 10.1186/1756-6606-1-5
(3) Stephenson et al., J Neurosci. 2017 DOI: 10.1523/JNEUROSCI.2068-16.2017
(4) Koeberle et al. Sci Rep. 2017 DOI: 10.1038/s41598-017-13728-y
(5) Brown et al., iScience. 2021 DOI: 10.1016/j.isci.2021.103184
We fully agree with the reviewer that different CAMK2A mutations likely cause distinct phenotypes observed in the broad spectrum of mental disorders. In the revised manuscript, we include a discussion of the relevant literature to categorize this mouse model appropriately.
"CaMKII-related signaling pathway disruption has been implicated in the working memory deficits found in schizophrenia patients [45,46]. CAMK2A mutations in humans are linked to multiple mental disorders, including developmental disorders, ASD, and schizophrenia [47]. The K42R mutation of CAMK2A does not correspond to any known human genetic variant, but the CAMK2A R8H mutation is linked to schizophrenia [48]. Both R8H and K42R mutations in the N-terminal domain of CaMKIIα eliminate kinase activity; these mutations may have a similar impact on human mental disorders."
Although the manuscript is largely well written, there are some instances of ambiguous/unspecific language. This extends to the title (Decoding Spine Nanostructure in Mental Disorders Reveals a Schizophrenia-1 Linked Role for Ecrg4), which gives no indication that the work was in vitro on cultured neurons derived from mouse models.
We appreciate the reviewer for pointing out the lack of information about the experimental system in the title of this manuscript. According to the suggestion of the reviewer, we modified the title as "Decoding spine nanostructure in cultured neurons derived from mouse models of mental disorder reveals a schizophrenia-linked role for Ecrg4".
Reviewer #2 (Public review):
Okabe and colleagues build on a super-resolution-based technique that they have previously developed in cultured hippocampal neurons, improving the pipeline and using it to analyze spine nanostructure differences across 8 different mouse lines with mutations in autism or schizophrenia (Sz) risk genes/pathways. It is a worthy goal to try to use multiple models to examine potential convergent (or not) phenotypes, and the authors have made a good selection of models. They identify some key differences between the autism versus the Sz risk gene models, primarily that dendritic spines are smaller in Sz models and (mostly) larger in autism risk gene models. They then focus on three models (2 Sz - 22q11.2 deletion, Setd1a; 1 ASD - Nlgn3) for time-lapse imaging of spine dynamics, and together with computational modelling provide a mechanistic rationale for the smaller spines in Sz risk models. Bulk RNA sequencing of all 8 model cultures identifies several differentially expressed genes, which they go on to test in cultures, finding that ecgr4 is upregulated in several Sz models and its misexpression recapitulates spine dynamics changes seen in the Sz mutants, while knockdown rescues spine dynamics changes in the Sz mutants. Overall, these have the potential to be very interesting findings and useful for the field. However, I do have a number of major concerns.
We thank the reviewer for evaluating our findings as potentially very interesting and useful.
(1) The main finding of spine nanostructure changes is done by carrying out a PCA on various structural parameters, creating spine density plots across PC1 and PC2, and then subtracting the WT density plot from the mutant. Then, spines in the areas with obvious differences only are analyzed, from which they derive the finding that, for example, spine sizes are smaller. However, this seems a circular approach. It is like first identifying where there might be a difference in the data, then only analyzing that part of the data. I welcome input from a statistician, but to me, this is at best unconventional and potentially misleading. I assume the overall means are not different (although this should be included), but could they look at the distribution of sizes and see if these are shifted?
We appreciate the reviewer's concern regarding our analysis of spine population data. The intention of pre-selecting the areas showing differences between wild-type and mutant was to make a direct comparison between two subareas (one is enriched with wild-type spines and the other is enriched with mutant spines) and clarify that the spines of schizophreniarelated mouse models were smaller than wild-type spines. Conventional methods of comparing the total spine population using simple size parameters are not useful for this purpose, as shown in Supplementary Figure 2.
To clarify the reviewer's concern, we revised the analysis of the spine population data for both Figure 3 and Figure 8.
Figure 3: We first divided the feature space projected onto PC1 and PC2 into four areas with distinct structural properties: (1) small and short, (2) small and long, (3) large and short, and (4) large and long. Next, we calculated the normalized spine counts in the four areas for both wild-type and mutant spines and obtained the relative ratio (mutant/wild-type) for each area. As we performed three independent SIM imaging experiments (in one, we imaged both wild type and mutant culture dishes prepared from the same pregnant mouse), there are three independent datasets from 8 mouse models.
We found that the spine ratio (mutant/wild-type) only in area 2 (small and long spines) differed significantly between genotypes. This result is shown in Fig. 3 and explained in the text. The spine ratios in areas 1 and 3 did not show a clear relationship to the genotypes, while the ratio in area 4 showed the opposite trend to that in area 2. The opposite trend between areas 2 and 4 indicates enrichment of both small and long spines in schizophrenia-related mouse models, consistent with our previous analysis.
Figure 8: In this analysis, we aimed to evaluate the rescue effect of Ecrg4 shRNA relative to that of control shRNA. If Ecrg4 shRNA is effective, the spine population enriched in the control shRNA condition should be reduced in the Ecrg4 shRNA condition. To confirm this point in the revised manuscript, we first defined areas in the projected PC1-PC2 plane showing either enrichment or depletion of spines in the control shRNA condition (spine numbers increasing or decreasing by more than 3 × SD). We next measured the difference in spine numbers between the control and Ecrg4 shRNA conditions in either enriched or depleted areas. The expectation is that Ecrg4 shRNA treatment reduces the extent of both enrichment and depletion. The effect was significant in both the 22qdel and Setd1a mouse models, as indicated by permutation tests. This analysis was explained in the revised manuscript.
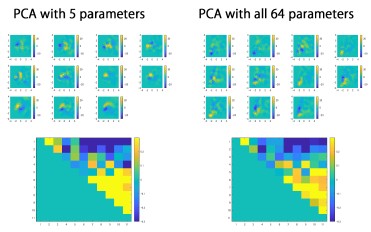
(2) Despite extracting 64 parameters describing spine structure, only 5 of these seemed to be used for the PCA. It should be possible to use all parameters and show the same results. More information on PC1 and PC2 would be helpful, given that the rest of the paper is based on these - what features are they related to?
We thank the reviewer for the advice on providing the rationale for parameter selection in PCA. We divided spines into 160-nm segments along their long axis, and the spine segments were used to calculate the 64 parameters, which include volume of each spine segment (20 segments), convex hull volume of each spine segment (20 segments), and convex hull ratio of each spine segment (20 segments). As most spines are shorter than 0.16 × 20 =3.2 μm, these segment-related parameters contain a large fraction of zero values, which affect the proper calculation of principal components. Therefore, we selected two parameters that reflect the principal structural features (length and volume), together with three other parameters that were mutually independent and also independent from the first two parameters (pairwise correlation coefficients < 0.3). These selection criteria were described in the original manuscript. We also confirmed that PCA using all 64 parameters yields a cross correlation map similar to that shown in Fig. 2B.
Author response image 1.
We provided additional information in the Materials and Methods section of the revised manuscript.
As described previously, the pattern of four areas with distinct spine structures (1. small and short, 2. small and long, 3. large and short, 4. large and long) supports the idea that the PC1PC2 plane reflects the relationship between spine volume and length (Fig. 3A and B).
These specific features could then be analyzed in the full dataset, without doing the cherry picking above.
We provided the dataset for the relative enrichment of spine counts across four areas of the PC1-PC2 plane in Fig. 3A and B. This analysis provides a comprehensive view of spine population properties related to spine volume and length, without relying on a pre-set region of interest.
It would also be helpful to demonstrate whether PC1 and 2 differ across groups - for example, the authors could break their WT data into 2 subsets and repeat the analysis.
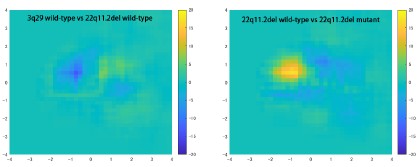
We noticed differences in the pattern of spine distribution across the PC1-PC2 planes in each experiment. The subtraction of the distributional data between wild-type and mutant samples effectively cancels out such differences. In general, the difference between two wild-type samples is smaller than that between wild-type and mutant samples, as shown in Author response image 2.
Author response image 2.
We added a description of variation across groups to the revised manuscript.
(3) Throughout the paper, the 'n' used for statistical analysis is often spine, which is not appropriate. At a minimum, cell should be used, but ideally a nested mixed model, which would take into account factors like cell, culture, and animal, would be preferable. Also, all of these factors should be listed, with sufficient independent cultures.
We agree that nested mixed models are more appropriate for evaluating genotype effects in most of our datasets. We confirm that the results of statistical analysis using nested mixed models were consistent with our previous conclusions in most cases.
Figure 3: We performed three independent primary cultures of embryonic hippocampal tissue with genotypes of both wild-type and mutant from the same pregnant mice for each mouse model. In our new Figure 3, each data point represents an independent culture experiment, and group comparisons were performed using one-way ANOVA followed by Tukey's post hoc test. In this analysis, statistical analysis using neurons as units of 'n' is not possible, as the number of spines measured from a single neuron is insufficient to generate the density map shown in Figure 3. The statistical analysis was described in the revised text. The details of experimental conditions related to Figure 3 are provided in Supplementary Table 1.
Figure 5A-C: We analyzed spine turnover rate using a linear mixed-effects model with genotype as a fixed effect and plate, cell, and dendrite as nested random effects. In both 22q deletion model and Setd1a model, there were significant effects of genotype (F(1,25) = 5.79, p = 0.024 for 22q deletion model and F(1,22) = 7.33, p = 0.013 for Setd1a model). In contrast, Nlgn3 mutant neurons did not show a significant difference (F(1,14) = 1.35, p = 0.26). This analysis was described in the revised text.
Figure 5D-F: Spine lifetime was analyzed using a linear mixed-effects model accounting for the hierarchical structure of the data (spines nested within dendrites, cells, and culture plates). The analysis revealed a significant effect of genotype in both 22q deletion mutant and Setd1a mutant (22qdel mutant; F(1,336) =5.33, p=0.022, Setd1a mutant; F(1,282)=6.38, p=0.012 ). The neurons of both mutants exhibited significantly longer spine lifetimes compared with wild-type neurons (22qdel mutant; ratio = 1.28, 95% CI 1.04–1.58, Setd1a mutant; ratio = 1.35, 95% CI 1.07–1.70). In contrast, Nlg3 mutation did not significantly alter spine lifetime (ratio = 0.86, 95% CI 0.61–1.22; F(1,220)=0.69, p=0.41). This analysis was described in the revised text.
Figure 5G-I: Spine volume trajectories were analyzed using linear mixed-effects models incorporating nested random effects (spine/dendrite/cell/culture plate) to account for the hierarchical structure of the data. In the 22q deletion model, newly formed spines were significantly smaller than those in wild-type neurons (genotype effect: p < 0.001). The spines in Setd1a mutant neurons also displayed significantly smaller volume than those in wild-type neurons (p < 10<sup>-7</sup>). There were also differences in the temporal profiles of spine growth in these two mutants (p < 0.001). In contrast, newly formed spines in the Nlgn3 mutant neurons were significantly larger than those in wild-type neurons (p < 10<sup>-4</sup>) with preserved time-course of spine growth. This analysis was described in the revised text.
Figure 5J-L: Similar analyses using linear mixed-effects models incorporating nested random effects (spine within dendrite within cell within culture plate) identified significantly smaller initial spine size in the 22q deletion model (p < 10<sup>⁻6</sup>), while no significant differences in the initial spine volume were found for Setd1a mutants. The temporal trajectories of spine shrinkage before their loss were also not significantly altered in both 22qdel and Setd1a mutants. The Nlg3 mutant showed a significantly different time-course of spine shrinkage (p < 0.05), while the initial spine size was not altered. This analysis was described in the revised text.
Figure 7A overexpression dataset: We analyzed plate-averaged lifetime values using a linear mixed-effects model with treatment as a fixed effect. There exists a significant main effect of treatment (F(3,8) = 4.59, p = 0.038), with post hoc examination showing a significant increase in lifetime by Ecrg4 overexpression (β = 0.49 ± 0.16 SE, t(8) = 3.16, p = 0.013). Figure 7A shRNA dataset: We also applied a linear mixed-effects model for plate-averaged lifetime values with treatment as a fixed effect. The analysis revealed no significant effect of treatment (F(2,6) = 0.29, p = 0.76).
The analyses of overexpression and shRNA datasets were described in the revised text.
Figure 8: As in Figure 3, we performed three independent primary cultures of embryonic hippocampal tissue with genotypes of both wild-type and mutant from the same pregnant mice for each mouse model. The culture plates were transfected with either a control shRNA or an Ecrg4 shRNA construct. Each data point represents an independent culture experiment, and the effect of Ecrg4 shRNA relative to that of control shRNA was evaluated using a permutation test. The data analysis was described in the revised text. The details of experimental conditions related to Figure 8 are provided in Supplementary Table 1.
(4) The authors should confirm that all mutants are also on the C57BL/6J background, and clarify whether control cultures are from littermates (this would be important). Also, are control versus mutant cultures done simultaneously? There can be significant batch effects with cultures.
The mutant mice we used in this study are on C57BL/6J or C57BL/6N background. It is known that C57BL/6J or C57BL/6N mice exhibit distinct phenotypes across a range of physiological, biochemical, and behavioral systems. However, it is less likely that our analysis is affected by differences between C57BL/6J and C57BL/6N, as we compared wild-type and mutant littermates on the same genetic background. This experimental design can also reduce the batch effects with different culture preparations. This point was described in the revised text.
(5) The spine analysis uses cultures from 18-22 DIV - this is quite a large range. It would be worth checking whether age is a confounder or correlated with any parameters / principal components.
We described in the method sections that culture samples were processed for imaging at 18-22 DIV. However, all the SIM imaging experiments for eight mutant mouse models were performed on samples fixed at DIV 19. The wide range of imaging experiments (DIV 18-22) includes test samples we used to optimize imaging conditions. In the revised manuscript, we specified the timing of SIM imaging.
(6) The computational modelling is interesting, but again, I am concerned about some circularity. Parameter optimization was used to identify the best fit model that replicated the spine turnover rates, so it is somewhat circular to say that this matched the observations when one of these is the turnover rate.
We appreciate the reviewer's comment on some circularity of the argument. We agree that the turnover rate is already incorporated into the simulation model and is not an appropriate criterion for the evaluation. We modified the text accordingly.
It is more convincing for spine density and size, but why not go back and test whether parameter differences are actually seen - for example, it would be possible to extract the probability of nascent spine loss, etc.
We thank the reviewer for giving this important suggestion. The probability of nascent spine loss is an important parameter, and we initially attempted to estimate it from the original data set. However, the upper limit of our time-lapse imaging is 24 h, which is insufficient to distinguish stable and nascent spines clearly. The difficulty of extracting all the necessary parameters for spine remodeling is our motivation for starting this computational modelling.
More compelling would be to repeat the experiments and see if the model still fits the data. In the interpretation (line 314-318) it is stated that '... reduced spine maturation rate can account for the three key properties of schizophrenia-related spines...', which is interesting if true, but it has just been stated that the probability of spine destabilization is also higher in mutants (line 303) - the authors should test whether if the latter is set to be the same as controls whether all the findings are replicated.
As suggested by the reviewer, we set the probability of spine destabilization equal across wild-type and mutant models and repeated the simulations. The results indicate that this modification has small effects on spine density (0.61 vs 0.62), spine turnover rate (0.22 vs 0.21), fraction of small spines (0.21 vs 0.20), and mean spine size (0.37 vs 0.36). We described this point in the revised manuscript.
(7) No validation for overexpression or knockdown is shown, although it is mentioned in the methods - please include.
As suggested by the reviewer, we validated overexpression and knockdown. The results are summarized in Supplementary Figure 8.
Supplementary Figure 8A-C shows the immunocytochemistry of anti-Ecrg4, anti-Cip4, and anti-NPAS4 for the confirmation of overexpression of these molecules.
Supplementary Figure 8D-E shows the confirmation of the appropriate size of exogenously expressed Ecrg4, Cip4, and NPAS4 by immunoblotting. (previous Supplementary Figure 10F is now Supplementary Figure 8E).
Supplementary Figure 8F-H indicates the efficient knockdown of exogenously expressed Met-GFP, ARHGAP15-GFP, and Ecrg4-HA by respective shRNA constructs in COS-7 cells. (previous Supplementary Figure 10G is now Supplementary Figure 8H)
Also, for the knockdown, a scrambled shRNA control would be preferable.
We used Stealth RNAi Negative Control Duplexes (Invitrogen) as the shRNA control in this study. To confirm that this RNAi sequence does not affect spine turnover, we performed timelapse imaging of neurons transfected with GFP alone or with GFP and the Stealth RNAi Negative Control. No detectable change in spine turnover was observed (Supplementary Figure 8I), indicating that this RNAi control sequence is suitable for our study.
(8) The finding regarding ecgr4 is interesting, but showing that some ecgr4 is expressed at boutons and spines and some in DCVs is not enough evidence to suggest that actively involved in the regulation of synapse formation and maturation (line 356).
To reveal the active roles of Ecrg4 in spine regulation, we exogenously applied a synthetic Ecrg4 peptide to wild-type neurons and monitored both spine density and turnover rate after Ecrg4 application. The Ecrg4 application increased the spine turnover rate, whereas samples treated with the scrambled peptide did not. This result supports the active role of Ecrg4 in regulating spine turnover. The data were added as Supplementary Figures 9F and G.
(9) The same caveats that apply to the analysis also apply to the ecgr4 rescue. In addition, while for 22q the control shRNA mutant vs WT looks vaguely like Figure 2, setd1a looks completely different.
We thank the reviewer for pointing out the apparent difference in the pattern of spine population data between Figure 2 and Figure 8. We performed SIM analysis using DiI-labeled neurons in Figure 2, whereas the data in Figure 8 are derived from GFP-expressing neurons. The images of cell-surface labeling and cytoplasmic labeling cannot be analyzed in the same way, as it is necessary to adjust parameters in SIM image processing and PCA-based dimensional reduction. Consequently, the distribution of the spine population projected onto the PC1-PC2 plane differs between DiI-labeled neurons and GFP-expressing neurons. To facilitate the comparison of PCA analysis applied to GFP-expressing neurons, we replaced the weight matrix for GFP-expressing neurons with that previously calculated for the DiIlabeled neurons. This adjustment increased the similarity of the data distributions shown in Figures 2 and 8. The explanation for the different patterns in the spine population map between Figure 2 and Figure 8 was added to the revised text. The related explanation for the data processing was described in the Materials and Methods.
And if rescued, surely shRNA in the mutant should now resemble control in WT, so there shouldn't be big differences, but in fact, there are just as many differences as comparing mutant vs wild-type? Plus, for spine features, they only compare mutant rescue with mutant control, but this is not ideal - something more like a 2-way ANOVA is really needed. Maybe input from a statistician might be useful here?
We appreciate the reviewer's important comment and agree that the analytical approach used in the original manuscript was not optimal. We therefore revised our analysis to examine whether the difference observed between wild-type and mutant neurons was reduced by suppression of Ecrg4 expression.
To this end, we first identified two regions in the PC1–PC2 plane where mutant spines were either enriched or depleted relative to wild-type neurons (Areas A and B). We then counted the number of spines located in Areas A and B in control shRNA-treated mutant neurons (normalized spine counts XA and XB). Next, we quantified spine counts in the same areas using data from Ecrg4-suppressed mutant neurons (normalized spine counts YA and YB). If XA > YA and XB < YB, suppression of Ecrg4 would indicate a shift toward rescue of the phenotype observed in control shRNA-treated mutant neurons. Indeed, the datasets were consistent with this shift in relative spine counts.
To determine whether these differences exceeded those expected from random variation in spine counts, we performed a permutation test. Specifically, spine identities were randomly shuffled between the two conditions while preserving the total number of spines in each dataset. The observed differences were then compared with the distribution obtained from the permuted datasets to assess statistical significance.
We found that all three culture replicates showed statistical significance in both areas A and B for both the 22qdel and Setd1a mutations. This analysis is described in the Result section.
(10) Although this is a study entirely focused on spine changes in mouse models for Sz, there is no discussion (or citation) of the various studies that have examined this in the literature. For example, for Setd1a, smaller spines or reduced spine densities have been described in various papers (Mukai et al, Neuron 2019; Chen et al, Sci Adv 2022; Nagahama et al, Cell Rep 2020).
We appreciate the reviewer's suggestion to include a discussion of schizophrenia-related mouse models. We added more information related to the Setd1a mouse model to the Discussion section.
"Population-level spine properties were more homogeneous in schizophrenia models (those with gene mutations implicated in schizophrenia) than in the other 4 models studied, in part due to a shared tendency for smaller spines. This observation is consistent with previous studies on Setd1a mutant mice, which showed reduced spine width, decreased mushroomtype spines, and lower spine density in the prefrontal cortex [43,56,57]. In contrast to these findings, several previous studies reported reduced numbers of small spines in the postmortem cortical tissues of schizophrenia patients [22,58]. "
(11) There is a conceptual problem with the models if being used to differentiate autism risk from Sz risk genes. It is difficult to find good mouse models for Sz, so the choice of 22q11.2del and Setd1a haploinsufficiency is completely reasonable. However, these are both syndromic. 22qdel syndrome involves multiple issues, including hearing loss, delayed development, and learning disabilities, and is associated with autism (20% have autism, as compared to 25% with Sz). Similarly, Setd1a is also strongly associated with autism as well as Sz (and also involves global developmental delay and intellectual disability). While I think this is still the best we can do, and it is reasonable to say that these models show biased risk for these developmental disorders, it definitely can't be used as an explanation for the higher variability seen in the autism risk models.
We appreciate the reviewer's suggestion for more careful consideration of the interpretation of phenotypes in mouse models, with regard to their relation to clinical phenotypes in human patients. According to the suggestion of the reviewer, we modified the relevant text as follows:
"The nanoscale features of dendritic spines in ASD-associated mouse models were more variable than those in schizophrenia-associated mouse models. This difference may be related to the broader clinical spectrum of ASD, which ranges from mild impairments in social skills to severe intellectual disability. The four ASD-associated mouse models examined in this study, Nlgn3<sup>R451C/(y or R451C) , Syngap1<sup>+/-</sup>, POGZ<sup>Q1038R/+</sup>, and 15q11-13<sup>dup/+</sup>, may represent subgroups with different levels of hippocampal dysfunction. Among the four ASD-associated mouse models, 15q11-13<sup>dup/+</sup> showed population-level spine properties closer to those of the schizophrenia models. To understand this similarity, further analysis of neural circuit changes in both ASD- and schizophrenia-associated mouse models will be necessary. Analysis of the relationships between rare genetic variants and synapse phenotypes in mouse models may contribute to their eventual categorization. This information should be useful to understand the underlying mechanisms of the broader clinical spectrum of ASD."
(12) I am not convinced that using dissociated cultures is 'more likely to reflect the direct impact of schizophrenia-related gene mutations on synaptic properties' - first, cultures do have non-neuronal cells, although here glial proliferation was arrested at 2 days, glia will be present with the protocol used (or if not, this needs demonstrating).
In our culture system, the density of non-neuronal cells is low, and most neurons are not in direct contact with non-neuronal cells. We reported this method in Nat. Neurosci. 1999, where we utilized this culture system to visualize GFP-tagged PSD-95 in neurons using recombinant adenovirus. Because recombinant adenovirus shows higher infection efficiency in glial cells, it was essential for us to establish a culture condition that isolates neurons from glial cells.
Second, activity levels will affect spine size, and activity patterns are very abnormal in dissociated cultures, so it is very possible that spine changes may not translate into in vivo scenarios. Overall, it is a weakness that the dissociated culture system has been used, which is not to say that it is not useful, and from a technical and practical perspective, there are good justifications.
We appreciate the reviewer's comment on the advantages and disadvantages of using an in vitro culture system. This comment aligns with the first reviewer's. We modified our text to have a balanced discussion on the role of the in vitro culture system in the study of mental disorder mouse models as follows:
"Finally, while the spine phenotype identified in the human postmortem brain undoubtedly resulted from complex interactions among genetic background, environmental influences, and regulation by non-neuronal cells, data from pure neuronal cultures are more likely to reflect the direct effects of schizophrenia-related gene mutations on synaptic functions. This property may be advantageous for identifying synaptic molecules that regulate synapse phenotypes in schizophrenia-related mouse models. However, the phenotype observed in the culture system requires confirmation using in vivo experiments of mouse models or human tissue samples. Efficient in vitro screening combined with reliable in vivo evaluation of synapses will facilitate translational research on mental disorders."
(13) As a minor comment, the spine time-lapse imaging is a strength of the paper. I wonder about the interpretation of Figure 5. For example, the results in Figure 5G and J look as if they may be more that the spines grow to a smaller size and start from a smaller size, rather than necessarily the rate of growth.
We thank the reviewer for the insightful comment. In the revised manuscript, we analyze the time-lapse data using linear mixed-effects models incorporating nested random effects (spine/dendrite/cell/culture plate). This analysis suggested the difference in the initial size of spines. This point is described in the revised manuscript as follows:
"Schizophrenia-associated mouse models showed higher similarity in spine morphology, driven by reduced size and growth of nascent spines."
"We further compared the initial increase in spine volume between genotypes (Figure 5G-I). Linear mixed-effects models incorporating nested random effects revealed significantly smaller initial spine volumes in both 22q11.2<sup>del/+</sup> and Setd1a<sup>+/-</sup> models (genotype effect: p < 0.001 for 22q11.2<sup>del/+</sup> and p < 10<sup>-7</sup> for Setd1a<sup>+/-</sup>). The spines in both mutants also displayed a significant reduction in spine volume increase (p < 0.001). In contrast, newly formed spines in the Nlgn3<sup>R451C/(y or R451C)</sup> neurons were significantly larger than those in wild-type neurons (p < 10<sup>-4</sup>) with preserved time-course of spine growth.”
We tested whether the initial size difference in spines can be incorporated into the computational simulation. However, due to the large variability in the initial spine size, it was difficult to perform parameter optimization in the model with additional factors. Therefore, we did not further pursue this possibility in this revision. This point is described in the revised text.
Recommendations for the authors:
Reviewer #1 (Recommendations for the authors):
The manuscript would be strengthened if the following issues were adequately addressed:
(1) It would be helpful to know more about the in/ex vivo dendritic spine phenotype of the mouse models of neuropsychiatric disorders, to allow readers to judge whether and how the in vitro spine phenotype in hippocampal neuronal cultures overlaps with/replicates the spine phenotype within the mouse brain.
We appreciate this comment, but our currently available data is insufficient to specify the difference between in vitro and in vivo spine phenotypes. Our previous study, published in Nature. Comm. (2019), provided data showing that the overall distribution of spine size is similar between in vivo and in vitro conditions in the mouse hippocampus.
(2) Although the manuscript is largely well written, there are instances of ambiguous language, particularly when describing the spine phenotypes. For example, we are told that "ASD mouse models showed a tendency of decreasing spine subpopulation with small volumes." This description and other examples should be expressed more clearly.
Following the reviewer's suggestions, we revised the text to improve clarity. We modified the sentence "ASD mouse models showed a tendency of decreasing spine subpopulation with small volumes" to "ASD-related mouse models showed an opposite spine phenotype."To avoid possible confusion for readers, we have revised several sentences in the text to clarify the intended meaning.
Also, I question whether the word "decoding", meaning to convert (a coded message) into intelligible language, is the most appropriate for the title and abstract.
The original meaning of the word "decoding" is the conversion of a coded message into an intelligible form; however, in this study, we use the term in a broader sense, referring to the extraction of latent population-level properties of dendritic spines from multidimensional structural parameters. We believe this usage is consistent with its common use in neuroscience and systems biology, where "decoding" often refers to inferring underlying biological states or information from complex datasets.
(3) The authors should reconsider whether CaMKIIαK42R/K42R mice should be described as a schizophrenia model, when mutations in CAMK2A are known to cause autosomal dominant intellectual developmental disorder-53 (OMIM 617798) and autosomal recessive intellectual developmental disorder-63 (OMIM 618095), and mice carrying the CAMK2A E183V mutation exhibit ASD-related synaptic and behavioral phenotypes (PMID: 28130356).
We provided a detailed answer to this question in the previous part of the rebuttal.
(4) The title doesn't adequately summarise the contents of the manuscript. It should mention mice/mouse models and cultured neurons.
We also responded to this request in the previous part of the rebuttal.
Reviewer #2 (Recommendations for the authors):
(1) Please provide a supplementary table with all DEGs. Also, DEGs are listed if present in 'more than 2' models - does this mean they had to be in 3 or more? Please clarify.
According to the reviewer's suggestion, we added data on DEGs shared by >2 mouse models in Supplementary Figure 7. We also added Supplementary Tables 2 and 3 for all DEGs. The phrase "in more than 2 models" means "in 3 or 4 models".
(2) There are several references to 'schizophrenia mouse models' - it is worth rephrasing this to make clear that these are not mice with schizophrenia.
We replaced the expression "schizophrenia (or ASD) mouse models" with "schizophrenia (or ASD)-associated mouse models" or similar appropriate wording throughout the manuscript.
(3) Line 66: 'a recent...' - 2014 is not really recent.
We removed the word "recent" from the sentence.
(4) Figure S1: The legend says A-D, but they are not on the figure. Also, make clear whether this data is only WT data - it seems to be from disorder models, with 4 colors for each model - please clarify.
We changed the sentence from "shown as A to D" to "shown as A to C". The datasets in Supplementary Figure 1 are wild-type only. Each graph uses four colors to represent wildtype data from four imaging datasets obtained from different mouse models. Graphs A to C correspond to spine length, surface area, and volume, respectively.
(5) Methods, line 680-4: More detail here would be helpful.
We added more explanation for the generation of subtraction maps.
(6) Line 193: Make it clear this is hippocampal in the main text.
We added "cultures of embryonic hippocampi" to the text.
(7) Figure 5, D-F: Make clear that these are transient spines (as per main text)
We added "Lifetimes of transient spines" to both the main text and figure legend.
(8) Figure 6B: More detail is needed; no idea what this is - no axis label. D - also not clear what numbers on the y-axis mean. E - color scale??
We added details to the figure legend, the axis labels for Figures 6B and 6D, and the color scale for Figure 6E.
(9) Supplementary Figure 9 - not clear what matrices are actually showing, nor what the scale refers to - is this the number of shared DEGs? If so, please make it clearer.
The matrices show the shared DEG numbers, as shown in their titles. The scale indicates DEG numbers. We added the explanation of the color code to the figure legend.
(10) Please make clear in the main text that ecgr4 affected the turnover rate. It would be good to measure other parameters as well.
We added the phrase "a significant increase in spine turnover rate by Ecrg4 overexpression" to the main text.
(11) Figure 7: Suggest to label C on images as well, so obvious which is GFP/anti-HA overlay (and respective colors) and which is anti-HA staining.
We added the labels with respective colors to Figure 7.
(12) Ecgr4 is a precursor protein that is cleaved to produce several hormone-like peptides. Where is the HA tag - so which cleavage products will it label? Any antibodies that work in immunocytochem?
HA tag was attached to the C-terminal domain. We predict that anti-HA binds to four cleavage products (the full-length Ecrg4, Augurin, Argilin, and Δ16). Among several commercially available antibodies, only the SIGMA product could detect cells expressing Ecrg4-HA by immunocytochemistry.
(13) Supplementary Figure 10: Synaptosome would be a good addition.
We isolated the fraction of synaptosomes using Syn-PER™ Synaptic Protein Extraction Reagent in Supplementary Figure 9A. We added this explanation to the Materials and Methods section.
Author response:
Public Reviews:
Reviewer #1 (Public review):
Summary:
The manuscript entitled "Essential function reflected in the phylodynamics of a multigene family - the pir genes of malaria parasites" by Jackson and colleagues investigates the global phylogeny of pir genes across 14 Plasmodium species and one Hepatocystis species. The authors also focus on the functional characterization of the conserved ortholog pirC1 and claim that pirC1 is not the founder of the family and that it plays an essential role in blood-stage growth.
Strengths:
Overall, the manuscript is well written and interesting, as it combines comparative genomics and evolutionary analysis with functional experiments. The phylogenetic analysis is rigorous and represents a major strength of the manuscript.
Weaknesses:
The general conclusions regarding the potential function of this gene family are not fully supported by the data presented. The manuscript moves too quickly from growth phenotype and localization studies to a specific mechanistic model. The discussion argues that PIRC1 may be involved in nutrient acquisition, host sensing, or metabolic support, but the data provided do not directly support these functions, and the manuscript in its present form remains speculative. Although the manuscript includes some experimental results, it lacks direct mechanistic validation of the specific functions of the pir genes, including pirC1. In its current form, the study does not yet establish a definitive role for pirC1 in metabolic processes.
The reviewer is correct that there is no definitive proof for the function of the PIRC1 protein. We speculate that this protein is involved in a metabolic process based on mutant phenotype – small, poorly developed parasites that do not produce the same amount of DNA as wildtype parasites (and hence likely fewer merozoites). That this occurs in an in vitro culture of Plasmodium knowlesi rules out a role in the interaction with the host organism, such as sequestration or facilitating passage through the spleen. The localization of the protein outside of the parasite is consistent with a role in nutrient uptake, but we agree that additional experiments are required to determine the role of the protein definitively. We aim to look at the differences in the transcriptome and the metabolome to gain more insight into the pirC1 phenotype; this should reveal metabolic deficiencies in the mutant parasite.
Reviewer #2 (Public review):
Summary:
This is an extensive study using phylogenetic comparison across multiple plasmodium species to gain new insights in relation to their evolutionary pathways and the potential function of pir. In addition to establishing a framework to identify related orthologues across species as well as expanding paralogues families within a species, the work also focuses on understanding loss and gain of different PIRs and how this indicates a relative lack of functional constraints and essentiality for most members of the gene family.
The authors provide evidence that at least pirC has a conserved function and plays an important role in parasite growth in multiple species.
While this study represents a significant effort and does provide interesting new insights that would help our understanding of this complex gene family in the future, it has a number of limitations.
Strengths:
Extensive and thorough phylogenetic analysis that is supported by some biological validation. Provides an indication that the PIR gene family has limited biological constraints and evolved independently across different species, leading to rapid expansion and deletion of orthologous groups. Identified pirC as a functional and important member of the family that is conserved across the species.
Weaknesses:
The phylogenetic tree is based on a truncated sequence that focuses on the more conserved parts of the pir sequence. This could potentially lead to missing the key functional drivers of evolution. The biological validation of the role of pirC has some inconsistencies that need to be addressed.
The reviewer is correct. We do not use the repetitive parts of the pir gene sequences for the phylogeny. We define these as the ‘distal variable’ and ‘proximal’ domains of the protein in Fig. S1, results text and supplementary results. We remove these parts from the alignment because they are only nominally homologous (they cannot be aligned) and so break the basic assumption of phylogenetic analysis. Amino acid repeats evolve quickly and are homoplasic (their similarities do not reflect ancestry) so omitting them is correct and makes the phylogeny more reliable. While these features do not contribute to the phylogenetic estimate, we propose in the results text and Fig. S3, in agreement with the reviewer, that they are an important demonstration of how pirs have differentiated and what is different between the subfamilies. The reviewer is also correct that we have considered the whole gene sequence when comparing Alphafold predictions and in selection analyses of closely related sequences (in these cases, the repeat sequences can be aligned).
A structural prediction for the sequence used in the alignment would mostly reflect the distal conserved domain but would be misleading because the alignment combines conserved regions that are not physically attached in reality. We will clarify these points.
Reviewer #3 (Public review):
This paper aims to classify, from an evolutionary perspective, the multigene family PIR found in malaria parasites infecting rodents and Old World monkeys, and to link this classification to functional diversification. The authors also hypothesize that PIR members conserved across species play important roles in parasite survival, and seek to clarify their functions.
To achieve these aims, the authors comprehensively analyze the evolution of PIR genes using genomic and transcriptomic information from many malaria parasite species. They focus on PIRC1, a member conserved across species, and attempt to clarify its function in rodent and simian malaria parasites by examining the phenotypes of parasites in which the corresponding genetic locus has been disrupted. They also attempt to determine its localization using PIRC1 tagged with an epitope sequence. However, although the locus-disrupted parasites appear to show an approximately 50% reduction in growth rate, this effect seems to be overestimated. Another weakness is that the cause of the reduced growth rate has not been clarified. The localization analysis also remains insufficiently conclusive.
Therefore, I consider that the first half of the paper, consisting of the bioinformatics analyses, achieves the objective of comprehensively summarizing PIR and may become a reference paper for discussing the evolution and function of the PIR gene family. On the other hand, regarding the function of PIRC1, no clear conclusion can be drawn from the results presented, and several additional experiments are necessary.
My major comments are as follows.
(1) The claim that the failure of eight disruption attempts indicates that pirC1 is essential is too strong.
Lines 319-321: The authors argue that a total of eight failed attempts to disrupt the pirC1 locus using two different construct designs suggest that pirC1 is essential in P. berghei. However, the failure of these attempts could also reflect technical issues with the construct design itself, such as the length of the homologous regions used for recombination, which are approximately 650 bp. Therefore, it is an overstatement to conclude that "pirC1 is essential for P. berghei blood-stage growth." Given that parasites with disruption of the corresponding locus could be obtained in both P. chabaudi and P. knowlesi, a more appropriate statement would be that "pirC1 is important for P. berghei blood-stage growth."
It is correct that we cannot rule out that the inability to delete the pirC1 gene is Plasmodium berghei is unrelated to an essential function. We are happy to change the text to the suggested description.
(2) The data on the mCherry-expressing P. berghei line shown in Supplementary Figure 11 are insufficient.
(a) Panel C: Southern blot analysis
To conclusively identify the lower band in panel C as chromosome 1, additional probes specific to genes located on chromosomes 1 and 2 would be required. In addition, a parental parasite control should also be included. The Southern blot image of the parental parasite should show only a single band at the higher position, with no band at the lower position. Probes specific to chromosomes 1 and 2 would help demonstrate that the lower band corresponds to chromosome 1, rather than chromosome 2.
To this end, the authors could describe the result as follows:
"In the parental parasite, only a single band corresponding to chromosome 7 was detected, indicating that the smaller chromosome was genetically modified. The size of the lower band detected with the dhfr probe was identical to that of the band detected with the control chromosome 1 probe, but distinct from that detected with the chromosome 2 probe, indicating that chromosome 1 was modified."
That said, this chromosome-level Southern blot analysis is not sufficient to demonstrate that the target PBANKA_0100500 locus was specifically modified. The authors should provide more direct evidence showing that the PBANKA_0100500 locus, rather than another genomic locus, was modified. For example, Southern blot analysis after restriction enzyme digestion would provide more definitive evidence. Diagnostic PCR may also provide more specific evidence.
Although we are confident that the parasites has been modified in the expected way, we are planning to generate PCR data confirming that the mCherry tag is correctly integrated into PBANKA_010050.
(b) Panel D: Flow cytometry analysis
To allow a more accurate interpretation of the percentage of mCherry-positive cells, flow cytometry data for the parental parasite line should also be presented.
We will repeat the flow cytometry experiments and include a wildtype strain in the analysis.
(3) There are unclear points in the PCR results shown in Supplementary Figure 12.
Supplementary Figure 12: In panel B, a PCR product should also be amplified from dPCHAS_0101200 using the P1-P3 primer pair. Why is this band absent? The authors should provide the uncropped electrophoresis image so that the larger band can be seen. In addition, if labels 1 and 2 indicate independent clones, this should be stated in the figure legend.
We will gladly supply the full, uncropped electrophoresis image and we will clarify what the numbers indicate in the legend.
(4) The growth rates of P. chabaudi and P. knowlesi parasites with disruption of the PIRC1 gene locus should be quantitatively analyzed.
The growth rates of P. chabaudi and P. knowlesi are described only qualitatively, but they should be evaluated quantitatively. In Figure 4A, the parasitemia of wild-type P. chabaudi increases from approximately 6.1% on day 6 to approximately 15.6% on day 8, corresponding to a 3.8-fold increase. However, because parasite growth may already be affected by immune-mediated suppression at this stage, this value should be regarded as a minimum estimate. In contrast, the mutant increases from approximately 3.2% on day 8 to approximately 6.8% on day 10, corresponding to a 2.1-fold increase. Based on these values, the daily growth rate of the mutant appears to be reduced to at least approximately 56% of that of the wild type. Similarly, from the growth curve of P. knowlesi in Fig. 5A, the DMSO-treated group appears to increase approximately two-fold per day, whereas the rapamycin-treated group increases only approximately one-fold per day. Thus, P. knowlesi also appears to show an approximately 50% reduction in growth rate. Taken together, both P. chabaudi and P. knowlesi appear to reproducibly show an approximately 50% reduction in growth capacity. A reduction of this magnitude is difficult to describe as a "severe growth defect"; a more appropriate wording would be simply that the parasites "showed a growth defect." In addition, the terms "a severe growth defect" and "essential" appear to be overstated throughout the manuscript, and the wording should be toned down. Finally, I recommend presenting Figure 4A and Figure 5A on a logarithmic scale so that the trend in growth rates can be more intuitively appreciated from the graphs.
It should be possible to determine the growth rate of the wildtype and mutant P. knowlesi parasites. In addition, we can change the text to reflect that although there is a growth phenotype in the two species in which we obtained mutants, the parasites do have the capacity to replicate. Note that in the case of P. knowlesi, the parasites numbers in vitro do not increase, hence any additional factors that decrease the growth rate, such as immune system and spleen, will lower the reproductive rate further and render the mutant parasite unable to proliferate.
(5) The evidence that disruption of the PIRC1 gene locus in P. knowlesi does not affect erythrocyte invasion is weak.
The authors describe that "the developmental cycle of the parasites lacking PIRCl is slightly longer than that of parasites that produce PIRCl (line 383-384)," and appear to support this interpretation with data showing that "mutant parasites are significantly smaller than wild-type parasites (line 414)" and that "the DNA content in ML10-arrested parasites lacking PIRCl is lower than that of DMSO-treated parasites (line 417-418)" at 24 hours after invasion. However, a slightly longer developmental cycle alone does not seem sufficient to explain a 50% growth reduction.
I think the erythrocyte invasion capacity has not been quantitatively evaluated, and therefore, the evidence supporting the conclusion that the phenotype of P. knowlesi parasites with disruption of the PIRC1 gene locus is unrelated to erythrocyte invasion is weak. The authors should assess invasion efficiency using purified merozoites. For P. chabaudi, it should also be possible to apply an in vitro or in vivo erythrocyte invasion assay similar to that used for other rodent malaria parasites, and this should be evaluated as well.
We can further investigate the invasion phenotype of the mutant P. knowlesi parasites. The presence of a clear phenotype during the intraerythrocytic stage indicates that the protein also has a role after invasion, but we agree that determining the effect on invasion directly will be useful.
Alternatively, the reduced DNA content in ML10-arrested parasites lacking PIRC1 (lines 416-417) could suggest that the number of merozoites formed per schizont may be reduced. To clarify this point, the authors should assess whether the number of merozoites per schizont is altered in P. knowlesi (and P. chabaudi parasites lacking PIRC1).
We aim to count merozoites and the level of invasion, which will allow us to determine the reproductive rate of the mutant parasites.
(7) The authors propose the possibility that PIRC1 expressed in merozoites is released after invasion; however, the evidence that PIRC1 localizes to intracellular organelles is weak.
Line 333: "a peripheral pattern around the parasite" is indicative of parasite plasma membrane, PV, or PVM. ", indicative of a parasitophorous vacuole (PV) or parasitophorous vacuole membrane (PVM) location" should be amended to ", indicative of parasite plasma membrane, a parasitophorous vacuole (PV) or parasitophorous vacuole membrane (PVM) location". In the Figure S14 image, red signals are uniformly detected from the merozoites formed in the schizont stage parasite (not really microorganelle patterns), but not from the PVM surrounding the schizont, suggesting parasite plasma membrane localization, not PVM. I agree that the signal is detected from the compartments extending into the iRBC cytosol, which may be difficult to explain if it is located on the parasite plasma membrane, but how frequently were such images seen?
To determine the localization of the protein in the merozoite, we will image P. knowlesi merozoites.
Figure 4D. In the images of liver-stage schizonts, AMA1 does not appear to localize to the micronemes in mature merozoites, suggesting this image is an immature schizont. Although PIRC1 appears to be expressed in liver-stage schizonts, it is difficult to clearly determine whether it localizes to intracellular organelles or to the parasite plasma membrane.
This is a valuable comment. It is difficult to impossible to determine the exact localization of the protein at this stage, irrespective of the exact stage of the parasite. It is clear from the images is that the protein is not secreted at this stage. The main aim of the experiment was to determine whether the protein is produced by the parasite during the liver stage, which the results confirm.
To clarify the above points, the authors should examine whether PIRC1 is detected in intracellular organelles or around the merozoites by analyzing its localization in purified merozoites.
This we aim to do.
At this level, touch interactions are important because they serve a relational maintenance purpose and communicate closeness, liking, care, and concern. The types of touching at this level also vary greatly from more formal and ritualized to more intimate, which means friends must sometimes negotiate their own comfort level with various types of touch
This reminds me a lot of a concept I heard, I believe from a video, a long time ago. It was about grooming habits between people and how it can be a reflection of comfort with physical intimacy. The video talked about the moment in a friendship or relationship when we feel comfortable enough to reach out and 'groom' the other person. That the closer a connection the more comfortable and willing we are to 'groom' the other. Someone in a newer relationship might point out something like a messy hair, lint, or a tag sticking out. As you move up levels of intimacy that moves onto just letting them know you're reaching to fix it. Finally reaching out and fixing the problem you noticed without having to say anything to them. It was supposed to be a sign to see how physically close two people were. As the person being groomed had the chance to reject the help offered and set a boundary. The person asking had a chance to express care for others appearance and or comfort. I'm not sure entirely how true observation was but this section reminded me of the video as it discusses levels of physical contact in comparison to the depth of the relationship.
Author response:
The following is the authors’ response to the original reviews.
eLife Statement
This valuable study characterizes the emergence of the membrane-associated periodic cytoskeleton (MPS) in the axons of human motor neurons derived from induced pluripotent stem cells. Super-resolution imaging of beta-II spectrin provides convincing evidence for the patterned assembly of spectrin-poor gaps and spectrin-rich MPS in the medial region of the axons and its enhancement by the kinase inhibitor staurosporine. The data advocates against gap formation by cytoskeleton disassembly in a continuous MPS. Instead, a continuous MPS may result from nascent MPS patches and their maturation, a model that would benefit from live imaging for validation.
(R1) We thank the reviewers and editor for their constructive and thoughtful feedback. We are pleased the reviewers found our evidence to be convincing and that our study provides a valuable framework for understanding the complex dynamics of MPS assembly.
Public Reviews:
Reviewer #1 (Public review):
Summary:
Ever since the surprising discovery of the membrane-associated Periodic Skeleton (MPS) in axons, a significant body of published work has been aimed at trying to understand its assembly mechanism and function. Despite this, we still lack a mechanistic understanding of how this amazing structure is assembled in neuronal cells. In this article, the authors report a "gap-and-patch" pattern of labelled spectrin in iPSC-derived human motor neurons grown in culture. The mid-sections of these axons exhibit patches with reasonably well-organized MPS that are separated by gaps lacking any detectable MPS and having low spectrin content. Further, they report that the intensity modulation of spectrin is correlated with intensity modulations of tubulin as well. However, neurofilament fluorescence does not show any correlation. Using DIC imaging, the authors show that often the axonal diameter remains uniform across segments, showing a patch-gap pattern. Gaps are seen more abundantly in the midsection of the axon, with the proximal section showing continuous MPS and the distal segment showing continuous spectrin fluorescence but no organized MPS. The authors show that spectrin degradation by caspase/calpain is not responsible for gap formation, and the patches are nascent MPS domains. The gap and patch pattern increases with days in culture and can be enhanced by treating the cells using the general kinase inhibitor staurosporine. Treatment with the actin depolymerizing agent Latrunculin A reduces gap formation. The reasons for the last two observations are not well understood/explained.
(R2) We thank the reviewer for the detailed and accurate description of the data shown and its relevance to further our understanding of MPS assembly mechanism and function.
Strengths:
The claims made in the paper are supported by extensive imaging work and quantification of MPS. Overall, the paper is well written and the findings are interesting. Although much of the reported data are from axons treated with staurosporine, this may be a convenient system to investigate the dynamics of MPS assembly, which is still an open question.
(R3) We thank the reviewer for the positive comments on the manuscript and the convenience of the experimental system developed to further study the dynamics of MPS assembly. We hope others turn into motor neurons to explore cortical cytoskeleton biology and hopefully shed light into their susceptibility in various degenerative diseases.
Weaknesses:
Much of the analysis is on staurosporine-treated cells, and the effects of this treatment can be broad. The increase in patch-gap pattern with days in culture is intriguing, and the reason for this needs to be checked carefully. It would have been nice to have live cell data on the evolution of the patch and gap pattern using a GFP tag on spectrin. The evolution of individual patches and possible coalescence of patches can be observed even with confocal microscopy if live cell super-resolution observation is difficult.
(R4) Because staurosporine may hit various kinases relevant to the phenomenon under study we did not elaborate too deeply on the likely targets in the discussion. We have, however, included the possibility that the relevant kinase in this matter could be PKC, in light of the new study published while our manuscript was under revision (Heller et al., 2025) (see second last paragraph in the Discussion section). Staurosporine represented a convenient initial approach that allowed us to find the phenomenon, and we are now conducting new studies dissecting the molecular pathways involved. However, the extent of such studies lies beyond the scope of the present report.
See R16 regarding possible live-imaging experiments using tagged βII-spectrin constructs.
Some more comments:
(1) Axons can undergo transient beading or regularly spaced varicosity formation during media change if changes in osmolarity or chemical composition occur. Such shape modulations can induce cytoskeletal modulations as well (the authors report modulations in microtubule fluorescence). The authors mention axonal enlargements in some instances. Although they present DIC images to argue that the axons showing gaps are often tubular, possible beading artefacts need to be checked. Beading can be transient and can be checked by doing media changes while observing the axons on a microscope.
(R5) As we acknowledge this possibility, we believe that, even if they occurred, they could not contribute to our observations of gaps-and-patches phenomenon since this latter subsisted long (hours and days) after any gross manipulation of media. Moreover fixed samples, when observed under DIC, confocal or STED did not evidence such beadings. We do refer to a characteristic local enlargement that was very localized and very low in numbers (see Fig.1C and E, and Suppl. Fig1C and E), so we don't believe these are transient, and do not resemble the structure referred to as beading. Structurally, beading is essentially different since it appears in rows of consecutive “beads” in long stretches, where round, small enlargements of axonal caliber are arranged in a consecutive manner, resembling pearls on a string. As mentioned by the reviewer, the beading phenomena can occur transiently when drastically changing media osmolarity (rarely done in cell culture manipulations) or non-tranciently when axons are undergoing degeneration. Indeed, to prevent gross changes in osmolarity, our routine fixation is a 4% PFA and 4% sucrose in PBS. In any case, we did not observe signs of beading in the cultures used for this study.
(2) Why do microtubules appear patchy? One would imagine the microtubule lengths to be greater than the patch size and hence to be more uniform.
(R6) Our stainings are for tubulin protein isoforms beta-III and alpha-II. That is, they would label microtubules, but free tubulin as well. Hence we don't think this is evidence for “patchy microtubules”. The slight decrease in intensity for tubulin within gaps is indeed something to investigate, and can indicate that tubulin prefers to accumulate within patches.
(3) Why do axons with gaps increase with days in culture? If patches are nascent MPS that progressively grow, one would have expected fewer gaps with increasing days in culture. Is this indicative of some sort of degeneration of axons?
(R7) We agree with the apparent discrepancy. However, one has to take into account that these axons are still elongating even at 2 weeks in culture and beyond. Hence, at any time point, there is a new axonal compartment recently added, and hence, with low βII-spectrin and no organized MPS. Also, the dynamical evolution of the gaps-and-patches structure has to take into account the rate of βII-spectrin supply and transport. If supply is somehow lower than a given threshold, it is expected that there will be more gaps, given the new, more distant parts of the axons have a lower supply of βII-spectrin. To explore this formally, we are working on simulations of these multifactorial dynamic systems to better understand this, that together with key experimental observations would enhance our understanding into our model of MPS assembly in growing axons. However, findings for this project will be the subject of another manuscript.
(4) It is surprising that Latrunculin A reduces gap formation induced by staurosporine (also seems to increase MPS correlation) while it decreases actin filament content. How can this be understood? If the idea is to block actin dynamics, have the authors tried using Jasplakinolide to stabilize the filaments?
(R8) The results with the co-treatment with Latrunculin A and Staurosporine are indeed intriguing, and provide clear evidence that the gap-and-patch pattern arises from local assembly of the MPS, requiring newly formed actin filaments. On the other hand, the fact that F-actin within the pre-formed MPS seems unaffected is not surprising. There are many different populations of F-actin in axons (i.e. MPS rings, longitudinal filaments, actin patches, actin trails), all of which have a different rate of monomer turnover. Latrunculin A affects filaments indirectly. The target of Latrunculin A is not actin filaments, but free monomers. Monomer sequestration ultimately affects actin filaments: filaments are constantly exchanging monomers, but, devoid of free monomers, filaments get shorter and eventually disappear. The drastic decrease in global F-actin in LatA-treated axons reflects that. The fact that F-actin in the MPS is preserved shows that these filaments are stable -if they are not losing monomers in the time frame of the treatment, the filament remains unaffected. This subject is extensively covered in the 8th paragraph of the Discussion section.
We have not used Jasplakinolide. The expected outcome will not mimic that of Latrunculin A since Jasplakinolide has a different mechanism of action (i.e. it binds -and stabilizes- the actin filament).
(5) The authors speculate that the patches are formed by the condensation of free spectrins, which then leaves the immediate neighborhood depleted of these proteins. This is an interesting hypothesis, and exploring this in live cells using spectrin-GFP constructs will greatly strengthen the article. Will the patch-gap regions evolve into continuous MPS? If so, do these patches expand with time as new spectrin and actin are recruited and merge with neighboring patches, or can the entire patch "diffuse" and coalesce with neighboring patches, thus expanding the MPS region?
(R9) We agree with the reviewer's interpretation. A virtue of our experimental model and our interpretations of the observations in fixed cells is that it gives rise to informative questions such as the ones posed by the reviewer. See R16 regarding possible live-imaging experiments using tagged βII-spectrin constructs.
Reviewer #2 (Public review):
Summary:
In this manuscript, Gazal et al. describe the presence of unique gaps and patches of BetaII-spectrin in medial sections of long human motor neuron axons. BII-spectrin, along with Alpha-spectrin, forms horizontal linkers between 180nm spaced F-actin rings in axons. These F-actin rings, along with the spectrin linkers, form membrane periodic structures (MPS) which are critical for the maintenance of the integrity, size, and function of axons. The primary goal of the authors was to address whether long motor axons, particularly those carrying familial mutations associated with the neurodegenerative disorder ALS, show defects in gaps and patches of BetaII-spectrin, ultimately leading to degradation of these neurons.
(R10) We thank the reviewer for the detailed and accurate description of the data shown.
Strengths:
The experiments are well-designed, and the authors have used the right methods and cutting-edge techniques to address the questions in this manuscript. The use of human motor neurons and the use of motor neurons with different familial ALS mutations is a strength. The use of isogenic controls is a positive. The induction of gaps and patches by the kinase inhibitor staurosporine and their rescue by Latrunculin A is novel and well-executed. The use of biochemical assays to explore the role of calpains is appropriate and well-designed. The use of STED imaging to define the periodicity of MPS in the gaps and patches of spectrin is a strength.
(R11) We thank the reviewer for the positive comments on the manuscript, the techniques used and the proposed model.
Weaknesses:
The primary weakness is the lack of rigorous evaluation to validate the proposed model of spectrin capture from the gaps into adjacent patches by the use of photobleaching and live imaging. Another point is the lack of investigation into how gaps and patches change in axons carrying the familial ALS mutations as they age, since 2 weeks is not a time point when neurodegeneration is expected to start.
(R12) See R16 regarding possible live-imaging experiments using tagged βII-spectrin constructs.
We don't discard the notion that axons carrying familial ALS mutations will show defects in MPS formation and/or stability when observed at longer culture times, or under culture conditions that promote neuronal aging (Guix et al., 2021). Thus, we continue to work with these cells, but the goal of such project lies well beyond the primary message of the present manuscript, as we discuss in the second paragraph of the Discussion section.
Reviewer #3 (Public review):
Summary:
Gazal et al present convincing evidence supporting a new model of MPS formation where a gap-and-patch MPS pattern coalesces laterally to give rise to a lattice covering the entire axon shaft.
Strengths:
(1) This is a very interesting study that supports a change in paradigm in the model of MPS lattice formation.
(2) Knowledge on MPS organization is mainly derived from studies using rat hippocampal neurons. In the current manuscript, Gazal et al use human IPS-derived motor neurons, a highly relevant neuron type, to further the current knowledge on MPS biology.
(3) The quality of the images provided, specifically of those involving super-resolution, is of a high standard. This adequately supports the conclusions of the authors.
(R13) We thank the reviewer for the positive comments on the manuscript, the techniques used and the proposed model.
Weaknesses:
(1) The main concern raised by the manuscript is the assumption that staudosporine-induced gap and patch formation recapitulates the physiological assembly of gaps and patches of betaII-spectrin.
(R14) Along the project, various gaps-and-patches parameters were measured in different conditions and stainings. In all these examinations the only parameter that changed considerably was their abundance. While this suggests that the gaps-and-patches features are comparable between control and staurosporine-treated cells, we acknowledge as a general caution regarding negative data—that subtle qualitative differences cannot be entirely ruled out. We have now emphasized this possibility in the 9th paragraph of the Discussion section.
(2) One technical challenge that limits a more compelling support of the new model of MPS formation is that fixed neurons are imaged, which precludes the observation of patch coalescence.
(R15) See R16 regarding possible live-imaging experiments using tagged βII-spectrin constructs.
Recommendations for the authors:
Reviewing Editor Comments:
The reviewers all agree that the work would strongly benefit from live imaging to assess the maturation dynamics of the gap/patch pattern.
(R16) Reviewers agreed that some of the conclusions of our manuscript would benefit from live imaging for validation. Various anticipated technical and biological challenges made these approaches not to be conducted for this initial study on human motor neurons. Just to mention the most important, from previous work of our labs, these cells themselves are difficult to transfect at 2 weeks in culture. Also, ectopically expression of tagged βII-spectrin escapes normal expression control and it has been noticed that ectopic expression yields to protein localization that does not necessarily reflect the endogenous distribution, or that produces cellular responses that precludes the observation of the phenomena under study. These difficulties in studying over-expressed tagged βII-spectrin have been reported in the field, with mentions that the analysed axons were those expressing “low levels of the construct” (Boyer et al., 2026; Zhong et al., 2014; Zhou et al., 2022). Taking this into account, we did not anticipate that, for the goals of the present project, live-imaging was to be included. However, given the positive comments and reception of our conclusions, we sought to try to perform this challenging and risky approach. To that end, we used a C-terminus tagged mouse βII-spectrin-GreenLantern plasmid to transfect our cells (a kind gift from Dr. Subjohit Roy, UCSD, USA). After 3 rounds of differentiating cells and trying various combinations of plasmid quantity, lipofectimine-to-DNA ratios and times of transfection (amongst other parameters), we have got an extremely low efficiency of transfection, and the few expressing neurons showed a distribution of βII-spectrin-GreenLantern that did not match our observations of immunolocalization of endogenous βII-spectrin. Taking all these into account, the present version of the manuscript will not include live-cell imaging on expressed tagged βII-spectrin. Given that reviewers found that some statements in the initial submission would have been better supported by live-imaging, we made changes in the manuscript so as to acknowledge the limitations of concluding dynamic mechanisms from fixed samples (see for example last sentences on 5th paragraph of the Discussion section). Having said so, we hope to be able, in the future, to overcome these experimental challenges and be able to establish live-imaging of βII-spectrin in neurons. For example, to avoid unregulated transgene expression, Heller and colleagues recently generated a βII- spectrin-mNeonGreen conditional knock-in (cKI) mice, consisting of a LoxP- flanked alternative final exon of endogenous βII-spectrin with a C- terminal mNeonGreen fusion that is expressed upon Cre expression (Heller et al., 2025). The implementation and further development of such approaches will be very helpful in new studies on the dynamics of βII-spectrin and the MPS as a whole. However, the scale of work needed to accomplish those approaches represent stand-alone projects.
Reviewer #1 (Recommendations for the authors):
In the section "The MPS is absent in beta-II spectrin gaps, the authors mention that the presence of MPS in patches suggests that the axons are not undergoing degeneration. I don't think this is a good criterion to use, despite the citations they take support from.
(R17) We agree with the reviewer's suggestion: in virtue of the unlikely connection between the cited developmental axon degeneration process in sensory neurons and the possible axon degeneration of long term cultures of human-iPSCs-derived motor neurons studied here, we have eliminated the sentence of reference
The authors show that degradation by proteases does not happen in their case. In this regard, they may want to discuss the recent article by Heller et al, Science 2025 (https://doi.org/10.1126/science.adn6712) and Hofmann et al, Sci. Rep., 2022 (https://doi.org/10.1038/s41598-022-18562-5)
(R18) By western blot analysis, we did not see evident changes in proteolysis-derived fragments. However it is likely that even when finding phenotypes with protease inhibitors, protein fragments accumulation is below the sensitivity of western blots. We were expecting gross changes observable by western blot in the case proteolysis explained gap formation.
Calpain and Caspase activity has been shown to be relevant in different aspects of MPS biology. To the works cited by the reviewer, now one has to add the very recent work by Fei and colleagues (Fei et al., 2026). We have modified part of the Discussion section to analyse our results in this broader context.
Briefly, Hofmann and colleagues found that acute treatment with calpain inhibitors right before axotomy lead to an increase in percentage of periodic βII-spectrin (referred by authors as “periodicity”) in the regenerated axons in a 2-hour period. Interestingly, the βII-spectrin patches they describe at distal portions did not increase in number, but they increased in size. This indicates that in the particular situation of axonal regeneration calpain activity puts a brake into MPS formation within patches. This invited us to re-examine our own protease inhibition experiments, and measured patch length in this. The new results are shown in Supplementary Fig. 6 and and further analysed in the Discussion section. In summary, our changes were much less notable than the ones found in regenerating axons, but follow the same trend: protease inhibitors made patches longer.
On the other hand, Heller and colleagues found in live-imaging studies that calpain activity contributes to the steady-state dynamics of βII-spectrin exchange in a mature MPS lattice. More recently, Fei and colleagues found that caspase or calpain inhibition does not change the steady-state organization of a mature MPS lattice when observing treated axons after fixation samples. Fei and colleagues find a relevant role for calpains whenever massive endocytosis (of any kind) is engaged experimentally. Interestingly, all these studies, including ours, examined calpains roles in MPS in different scenarios. When looked in detail, we don’t believe that these are contradictory results among them, and a complete picture of calpains (and caspases) roles in MPS assembly, growth, maintenance and remodeling will have to take into account all the above mentioned results, including ours. All these analyses are now included in the Discussion section.
Minor comments:
(1) "Recently, it was proposed that this continuous MPS organization arises from the coalescence of discontinuous "patches" of incomplete MPS units that originate in the distal axon and migrate proximally (Zhong et al. 2014)." Please check the citation. Should it be Hoffman et al. 2022?
(R19) The reviewer is correct. The proper citation has now been included.
(2) Is there an established link between ALS and spectrin? I would suggest decreasing the emphasis on this as no clear conclusions are achieved.
(R20) As stated in the text, the study of ALS mutations is justified from two aspects: one aspect is that there are several tubulin and other cytoskeletal proteins whose mutations are linked to ALS (Castellanos-Montiel et al., 2020) and microtubules dynamics has been shown to affect the cortical skeleton (Qu et al., 2017). Second, since human motor neurons are affected in ALS, we thought that a complete characterization of the βII-spectrin cortical cytoskeleton in these cells should include ALS-related mutations. We have now included an a basic MPS description in TDP43 and SOD1 mutation (Suppl. Fig. 5).
The aspect of ALS-related mutations only occupies two short paragraphs in the main text and some panels in Supplementary information. To follow the suggestions by the Reviewer, we have downplayed the relative relevance of these results in the text, without compromising the amount of data we show.
(3) There is a typo in the approximate symbol used for 150 kDa in the section where calpain and caspase activity is reported.
(R21) Typo corrected.
(4) Please add the Latrunculin concentration used in the main text, as it makes it easier for the reader.
(R22) Done.
(5) In the Discussion, paragraph starting with "We further showed ...", there is a typo where Zhong et al is cited.
(R23) Corrected.
(6) Supplementary Figure 1B: attachment instead of 'atachment'.
(R24) Corrected.
(7) Include DIVs or time in the schematic. It is easier for the reader to understand.
(R25) We have now included time references in schematics of Suppl. Fig1B.
(8) Supplementary Figure 1C
Unable to distinguish βII-spectrin and βIII-tubulin in the merged image. Separate figure panels will help.
(R26) The merged images in the reconstructions are merely to better show the tracing individual axons at such low magnification. Relevant portions with only βII-spectrin channels are shown in C1 and C2. Separated individual channels are shown elsewhere across the manuscript.
(9) Supplementary Figure 4D
Why is there so much cleavage product for αII-spectrin across DMSO and treatment? It varied over batches as well. Doesn't this mean that αII-spectrin is going through more proteolytic cleavage? Why?
(R27) The amount of cleavage product for αII-spectrin is not a surprise to us. For instance, although calpains and caspases can potentially process both α- and β-spectrin, in in vivo scenarios where calpain activity is triggered there are much more fragments of α-spectrin being produced (Czogalla & Sikorski, 2005). On the other hand, our staining of cleaved-αII-spectrin by the SNTF antibody by immunofluorescence (Fig4C) parallels the findings by western blot -high levels of cleaved-αII-spectrin across treatments. A similar strong staining using this antibody has been recently shown in the intact axon (Heller et al., 2025). It will be interesting in the future to address if these fragments have any biological significance beyond being mere byproducts of αII-spectrin processing.
Reviewer #2 (Recommendations for the authors):
Suggestions for improving the quality of the manuscript:
(1) Live imaging in combination with FRAP assays will help define whether the capture of spectrin from gaps into patches is true. Fixed neurons only provide static information and may not reflect real-time physiological effects.
(R28) See R16 regarding possible live-imaging experiments using tagged βII-spectrin constructs.
(2) Could the presence of F-actin trails in axons facilitate the formation of patches? Will the use of formin/Arp2/3 inhibitors rescue the effect of staurosporine, similar to Latrunculin A?
(R29) Very interesting suggestion. It is likely that different pools of F-actin contribute to the dynamic of MPS formation, and actin trails are definitely worth investigating in this context.
(3) Figure 8 lacks a latrunculin A treated condition? Why is this not present?
(R30) The quantification of that treatment was excluded for space and readability. We have now included the values of group LatA + DMSO in Fig8Cand D and rearranged the whole figure.
(4) Does neuronal stimulation have any effect (KCl treatment) on gaps and patches?
(R31) Very interesting suggestion. Unfortunately, we have not examined whereas neuronal stimulation affects any parameter of the gaps-and-patches structure.
(5) Please check the manuscript for typos and reference insertion points in the text. More than a couple were noted.
(R32) We have corrected typos.
Reviewer #3 (Recommendations for the authors):
This is a very interesting study that supports a change in paradigm in the model of MPS lattice formation.
(1) One major concern is the assumption that staudosporine-induced gap and patch formation recapitulates the physiological assembly of gaps and patches of betaII-spectrin, solely based on their morphological similarity. This should be further discussed in the manuscript. Further analysis of additional cytoskeleton components, including microtubules in staurosporine-treated neurons, could also be provided.
(R33) See R14.
(2) In Figure 1E, betaIII-tubulin and NF-H seem to accumulate in betaII-spectrin-rich axonal enlargements. If these are patches, how do you reconcile this finding with Figure 2C-D, where NF-M and alphaII-tubulin are not specifically enriched in betaII-spectrin patches?
(R34) We actually show that axonal enlargements and patches are structurally unrelated, in many aspects. We mention these axonal enlargements as a way to perform an exhaustive characterization of all βII-spectrin features found in these axons.
(3) One technical challenge that limits a more compelling support of the new model of MPS formation is that fixed neurons are imaged, which precludes the observation of patch coalescence. This should be further discussed in the revised version of the manuscript.
(R35) The limitation of the experimental approach is now further discussed (see for example last sentences on 5th paragraph of the Discussion section).
(4) On a more general note, the title of some of the Results sub-sections could be revised to convey the findings of those sub-sections and not the Methods that were used (example: "Quantitave and Qualitative analyses of betII-spectrin distribution....").
(R36) According to the suggestion, we have changed the title of this subsection.
References
Boyer, N. P., Sharma, R., Wiesner, T., Parperis, C., Delamare, A., Pelletier, F., Jullien, N., Bhatt, A. M., Parra-Rivas, L. A., Kearney, P. J., Shavarebi, F., Leterrier, C., & Roy, S. (2026). Spectrin condensates provide a nidus for assembling the axonal membrane-associated periodic skeleton. iScience, 29(1), 114454. https://doi.org/10.1016/j.isci.2025.114454
Castellanos-Montiel, M. J., Chaineau, M., & Durcan, T. M. (2020). The Neglected Genes of ALS: Cytoskeletal Dynamics Impact Synaptic Degeneration in ALS. Frontiers in Cellular Neuroscience, 14, 594975. https://doi.org/10.3389/fncel.2020.594975
Czogalla, A., & Sikorski, A. F. (2005). Spectrin and calpain: A “target” and a “sniper” in the pathology of neuronal cells. Cellular and Molecular Life Sciences: CMLS, 62(17), 1913–1924. https://doi.org/10.1007/s00018-005-5097-0
Guix, F. X., Capitán, A. M., Casadomé-Perales, Á., Palomares-Pérez, I., López Del Castillo, I., Miguel, V., Goedeke, L., Martín, M. G., Lamas, S., Peinado, H., Fernández-Hernando, C., & Dotti, C. G. (2021). Increased exosome secretion in neurons aging in vitro by NPC1-mediated endosomal cholesterol buildup. Life Science Alliance, 4(8), e202101055. https://doi.org/10.26508/lsa.202101055
Heller, E., Kurup, N., & Zhuang, X. (2025). The membrane skeleton is constitutively remodeled in neurons by calcium signaling. Science (New York, N.Y.), 389(6760), eadn6712. https://doi.org/10.1126/science.adn6712
Qu, Y., Hahn, I., Webb, S. E. D., Pearce, S. P., & Prokop, A. (2017). Periodic actin structures in neuronal axons are required to maintain microtubules. Molecular Biology of the Cell, 28(2), 296–308. https://doi.org/10.1091/mbc.E16-10-0727
Zhong, G., He, J., Zhou, R., Lorenzo, D., Babcock, H. P., Bennett, V., & Zhuang, X. (2014). Developmental mechanism of the periodic membrane skeleton in axons. eLife, 3, e04581. https://doi.org/10.7554/eLife.04581
Zhou, R., Han, B., Nowak, R., Lu, Y., Heller, E., Xia, C., Chishti, A. H., Fowler, V. M., & Zhuang, X. (2022). Proteomic and functional analyses of the periodic membrane skeleton in neurons. Nature Communications, 13(1), 3196. https://doi.org/10.1038/s41467-022-30720-x
Author response:
The following is the authors’ response to the original reviews.
We have addressed all the reviewers’ comments through new experiments, additional analyses, or, in some cases, additional text. Below is a summary of the major changes in the manuscript.
(1) We have added a considerable amount of new characterization of the biochemical enrichment of the ribosome clusters, including EM of the ribosome clusters, UV absorbance profiles, immunoblots of additional targets, and additional replicates (new Figure 1). In summary, we provide better evidence that (i) the biochemical enrichment is working and (ii) that the loss of FMRP has no effect on this biological enrichment of ribosomal clusters.
(2) We have now reanalyzed all of the data in Figs. 5-8 using only the data after removing PCR duplicates from the RPFs. Other than the comparison between the nuclease treatments (Fig. 3), only this data is now used. Moreover, we have reanalyzed this data using suggestions from the reviewers, including providing PCA analysis (Fig S5-1), GSEA analysis (Fig 5), and normalizing for group size when comparing significance to total mRNAs, (Fig 6-7). We now also include a new analysis (Fig S7-1) to better explain how the loss of FMRP affects mainly FMRP targets defined by CLIP, but not all mRNAs resistant to run-off.
(3) We are now more conservative in our nomenclature; we use "pellet" instead of "RNA granule (RG)" and "fraction 5/6" instead of "ribosome clusters (RC)". We have added a section to the discussion about the relationship between the RNA granules measured using imaging of hippocampal neurites and the biochemical purification of ribosome clusters in the pellet, as requested by the reviewers.
(4) We have made many other minor changes to the text and analysis, which can be found in the specific response to the reviewers.
(5) One major additional requested change that was not implemented was to repeat our experiments at different time points. We have added a paragraph to the discussion outlining (i) why this was not done and (ii) the caveats of our conclusions without this data being present.
Public Reviews:
Reviewer #1 (Public review):
Summary:
The authors have investigated the role of FMRP in the formation and function of RNA granules in mouse brain/cultured hippocampal neurons. Most of their results indicate that FMRP does not have a role in the formation or function of RNA granules with specific mRNAs, but may have some role in distal RNA granules in neurons and their response to synaptic stimulation. This is an important work (though the results are mostly negative) in understanding the composition and function of neuronal RNA granules. The last part of the work in cultured neurons is disjointed from the rest of the manuscript, and the results are neither convincing nor provide any mechanistic insight.
Strengths:
(1) The study is quite thorough, the methods and analysis used are robust, and the conclusion and interpretation are diligent.
(2) The comparative study of Rat and Mouse RNA granules is very helpful for future studies.
(3) The conclusion that the absence of FMRP does not affect the RNA granule composition and many of its properties in the system the authors have chosen to study is well supported by the results.
(4) The difference in the response to DHPG stimulation concerning RNA granules described here is very interesting and could provide a basis for further studies, though it has some serious technical issues.
Thank you for these positive comments on the paper.
Weaknesses:
(1) The system used for the study (P5 mouse brain or DIV 8-10 cultured neuron) is surprising, as the majority of defects in the absence of FMRP are reported in later stages (P30+ brain and DIV 14+ neurons). It is important to test if the conclusions drawn here hold good at different developmental stages.
Unfortunately, myelin strongly interferes with the ability to use this protocol to purify ribosome clusters in older brains (See Khandjian et al., 2004). It is possible to redo the ribopuromycylation results at later times in culture, but since we cannot compare this to a comparable time in the brain, we have chosen not to do this experiment. We acknowledge this limitation in the discussion, noting that our results are only a snapshot of development and that different results may be observed at different times.
(2) The term 'distal granules' is very vague. Since there is no structural or biochemical characterization of these granules, it is difficult to understand how they are different from the proximal granules and why FMRP has an effect only on these granules.
We agree with the reviewer and have removed all references to distal granules. We clarified that we did not measure RPM puncta close to the neuron because the much stronger RPM signal made defining puncta more difficult, and thus, we cannot determine if there are differences between proximal and distal puncta.
(3) Since the manuscript does not find any effect of FMRP on neuronal RNA granules, it does not provide any new molecular insight with respect to the function of FMRP
We would respectfully disagree that the study does not provide molecular insight into the function of FMRP, as disproving that FMRP is important for stalling and determining the position of stalling would remove one of the major hypotheses about the function of FMRP, and showing that a major hypothesis in the literature is unlikely to be correct, is at least to me, providing insight. Moreover, we do show an effect of the loss of FMRP on the RPM puncta that represent neuronal RNA granules containing stalled ribosomes. This also provides insight.
Reviewer #2 (Public review):
In the present manuscript, Li et al. use biochemical fractionation of "RNA granules" from P5 wildtype and FMR1 knock-out mouse brains to analyze their protein/RNA content, determine a single particle cryo-EM structure of contained ribosomes, and perform ribo-seq analysis of ribosome-protected RNA fragments (RPFs). The authors conclude from these that neither the composition of the ribosome granules, nor the state of their contained ribosomes, nor the mRNA positions with high ribosome occupancy change significantly. Besides minor changes in mRNA occupancy, the one change the authors identified is a decrease in puromycylated punctae in distal neurites of cultured primary neurons of the same mice, and their enhanced resistance to different pharmacological treatments. These results directly build on their earlier work (Anadolu et al., 2023) using analogous preparations of rat brains; the authors now perform a very similar study using WT and FMR1-KO mouse brains. This is an important topic, aiming to identify the molecular underpinnings of the FMRP protein, which is the basis of a major neurological disease. Unfortunately, several limitations of this study prevent it from being more convincing in its present form.
In order to improve this study, our main suggestions are as follows:
(1) The authors equate their biochemically purified "RG" fraction with their imaging-based detection of puromycin-positive punctae. They claim essentially no differences in RGs, but detect differences in the latter (mostly their abundance and sensitivity to DHPG/HHT/Aniso). In the discussion the authors acknowledge the inconsistency between these two modalities: "An inconsistency in our findings is the loss of distal RPM puncta coupled with an increase in the immunoreactivity for S6 in the RG." and "Thus, it may be that the RG is not simply made up of ribosomes from the large liquid-liquid phase RNA granules."
How can the authors be sure that they are analysing the same entities in both modalities? A more parsimonious explanation of their results would be that, while there might be some overlap, two different entities are analyzed. Much of the main message rests on this equivalence, and I believe the authors should show its validity.
Thank you for your comments. We have been more conservative in the revised paper, referring to the pellet fraction as the pellet fraction rather than the RNA granule fraction to acknowledge the possibility that these two modalities differ. However, we would respectfully disagree that our main message requires RPM-labeled RNA granules in neurites and the ribosome clusters isolated by sedimentation to be “equivalent”. We do believe they are related and added a section in the discussion on this important point.
(2) The authors show that increased nuclease digestion (and magnesium concentration) led to a reduction of their RPF sizes down to levels also seen by other researchers. Analyzing these now properly digested RPFs, the authors state that the CDS coverage and periodicity drastically improved, and that spurious enrichments of secretory mRNAs, which made up one of the major fractions in their previous work, are now reduced. In my opinion, this would be more appropriately communicated as a correction to their previous work, not as a main Figure in another manuscript.
We have removed all discussion of the secretory mRNAs, as our attempts to obtain independent evidence for this finding by examining ribophorin enrichment in the pellet across different Mg<sup>2+</sup> concentrations did not support this interpretation (data not shown in the paper). I understand that the change in nuclease is somewhat out of place narratively, but it is clearly relevant to this work. We would disagree with our previous work requiring a ‘correction’. We believe that the nuclease resistance of the mRNA at the entrance site is important. We reproduce our results from rats with similar nuclease treatment in mice as seen in our previous publication; thus, this work is not wrong. We have a paper in preparation that suggests the secondary structure of the mRNA at this location may be important for stalling and thus feel strongly that this result should remain in the manuscript.
(3) The fold changes reported in Figure 7 (ranging between log2(-0.2) and log2(+0.25)) are all extremely small and in my opinion should not be used to derive claims such as "The loss of FMRP significantly affected the abundance and occupancy of FMRP-Clipped mRNAs in WT and FMR1-KO RG (Fig 7A, 7B), but not their enrichment between RG and RCs".
We agree that the changes are small and indeed did not appear in the DEG analysis. However, because we are analyzing a large set of mRNAs in this analysis, the results are highly significant and remain significant when using the new statistical tests suggested by the reviewer below. We now emphasize that these are small changes and remind readers that none of the individual mRNA changes were significant in the DEG analysis.
(4) Figure 8 / S8-1 - The authors show that ~2/3 of their reads stem from PCR duplicates, but that even after removing those, the majority of peaks remain unaltered. At the same time, Figure S8-1 shows the total number of peaks to be 615 compared with 1392 before duplicate removal. Can the authors comment on this discrepancy? In addition, the dataset with properly removed artefacts should be used for their main display item instead of the current Figure 8.
We now use only the data after removing PCR duplicates for all the analyses except in Figure 3. The number of peaks observed is determined mainly by the threshold used, as stated in the methods “To be identified as a peak, the zenith of an abundance site for the reads must be 4x higher of the average of the total transcript.” Due the lower number of reads after the PCR duplicates fewer peaks reached this threshold.
(5) Figure 9 / S9-1, the density of punctae in both WT and FMR1-KO actually increases after treatment of HHT or Anisomycin (Figure S9-1 B-C). Even if a large fraction would now be "resistant to run-off", there should not be an increase. While this effect is deemed not significant, a much smaller effect in Figure 9C is deemed significant. Can the authors explain this? Given how vastly different the sample sizes are (ranging from 23 neurites in Figures S91 to 5,171 neurites in Figure 9), the authors should (randomly) sample to the same size and repeat their statistical analysis again, to improve their credibility.
The box and whisker plots emphasize the median and not the average. We now also show the averages in Figure S9-1, which indicate a slight decrease for both HHT and anisomycin.
We apologize for the typo in the figure legend in Figure 9, 171, not 5171. We now use random sampling in Figures 6 and 7, where the sample sizes differ substantially.
Reviewer #3 (Public review):
Summary:
Li et al describe a set of experiments to probe the role of FMRP in ribosome stalling and RNA granule composition. The authors are able to recapitulate findings from a previous study performed in rats (this one is in mice).
Strengths:
(1) The work addresses an important and challenging issue, investigating mechanisms that regulate stalled ribosomes that are part of stress granules, and focusing on the role of FMRP. This is a complicated problem, given the heterogeneity of the granules and the challenges related to their purification. This work is a solid attempt at addressing this issue, which is widely understudied.
(2) The interpretation of the results could be interesting if supported by solid data. The idea that FMRP could control the formation and release of stress granules, rather than the elongation by stalled ribosomes, is of high importance to the field, offering a fresh perspective into translational regulation by FMRP.
(3) The authors focused on recapitulating previous findings, published elsewhere (Anadolu et al., 2023) by the same group, but using rat tissue, rather than mouse tissue. Overall, they succeeded in doing so, demonstrating, among other findings, that stalled ribosomes are enriched in consensus mRNA motifs that are linked to FMRP. These interesting findings reinforce the role of FMRP in the formation and stabilization of RNA granules. It would be nice to see extensive characterization of the mouse granules as performed in Figure 1 of Anadolu et al., 2023.
(4) Some of the techniques incorporated aid in creating novel hypotheses, such as the ribopuromycilation assay and the cryo-EM of granule ribosomes.
Thank you for these positive comments. We have now added a more extensive characterization in Figure 1.
Weaknesses:
(1) The RNA granule characterization needs to be more rigorous. Coomassie is not proper for this type of characterization, simply because protein weight says little about its nature. The enrichment of key proteins is not robust and seems not to reach significance in multiple instances, including S6 and UPF1. Furthermore, S6 is the only proxy used for ribosome quantification. Could the authors include at least 3 other ribosomal proteins (2 from the small, 2 from the large subunit)?
We have increased N to improve the robustness of the enrichment analysis and added several additional RBPs. Along with Coomassie we now include analysis of UV absorbance and include EMs from these fractions showing the presence of 80S ribosomal clusters in the fractions we are using.
(2) Page 12-13 - The Gene Ontology analysis is performed incorrectly. First, one should not rank genes by their RPKM levels. It is well known that housekeeping genes, such as those related to actin dynamics, molecular transport, and translation, are highly enriched in sequencing datasets. It is usually more informative when significantly different genes are ranked by p-adjust or log2 Fold Change, then compared against a background to verify enrichment of specific processes. However, the authors found no DEGs. I would suggest the removal of this analysis and the incorporation of a gene set enrichment analysis (ranked by p-adjust). I further suggest that the authors incorporate a dimensionality reduction analysis to demonstrate that the lack of significance stems from biology and not experimental artifacts, such as poor reproducibility across biological replicates.
Thank you for the suggestion. We now use GSEA analysis to examine differences in gene sets between WT and FMR1- mice and find some significant changes (new Fig. 5). The old analysis is still included for comparison to our earlier paper as a supplemental figure. We have now included a PCA analysis (FigS5-1) to show reproducibility across biological replicates.
Recommendations for the authors:
Reviewer #1 (Recommendations for the authors):
(1) RNA sequencing comparison between WT and FMR1 KO mice should be carried out at a later developmental stage, which may provide a better difference between these two groups
There are a number of studies that have already done this analysis and in specific brain regions 10.1016/j.neuron.2017.07.013; 10.7554/eLife.46919; 10.3389/fnmol.2017.00340; https://doi.org/10.1016/j.neuron.2023.06.009. The main goal of our RNA-seq was to standardize for the RPF studies, not to identify differences in RNA-seq between WT and FMRP. In the response to public review point 1 we explain why we do not look at later developmental timepoints.
(2) The same is true in characterizing the effect of FMRP on the RNA granules.
See response to public review point 1, which addresses this point.
(3) No evidence is provided for the effectiveness of DHPG stimulation in DIV8-10 neurons; this is needed for justification using neurons at this stage.
We have previously shown that DHPG stimulation in these neurons at this developmental time from cultures made from rat brain is sufficient to decrease the number of RPM puncta and to induce an increase in the synthesis of proteins in an initiation resistant manner (Graber et al, 2013; Graber et al, 2017). This is now more clearly stated in the manuscript. Moreover, here we replicate the result of DHPG in WT mice at reducing the number of RPM puncta.
(4) In Figure 9 B, it is not clear whether the neurites indicated are axons or dendrites. Since neurons are still in the early stages of dendritogenesis/synaptogenesis, it is important to make that distinction.
We have previously characterized RNA granules in axons and dendrites in hippocampal cultures from rats at this time (Miller et al, 2009, MCN 40:485-495)) and they are similar. While it is likely that the vast majority of the neurites at this time are dendrites, since we did not use markers, we conservatively just use the term neurites.
(5) In Figure 1 (and elsewhere), fraction 5/6 is used as a polysome or RNA cluster. The authors have not provided a UV absorption profile and only have s6 as evidence to say this polysome. In the Coomassie gel, this fraction is any different than fractions 7/7 or 9/10; what is the justification for using this fraction?
The main justification for these fractions is to be consistent with our previous paper (Anadolu et al, 2023) and the Khandian study comparing polysomes to pellet using the same fractionation protocol (El-Fatimy et al, 2016). We now provide a UV absorption profile (Fig. 1C) and EM pictures (Fig. 1D) to show the ribosome clusters in this fraction. We do not believe our results would be fundamentally different from those obtained if we had used other heavy fractions.
Minor comments
(1) The font size very small in the figures, please increase it.
We have worked hard to increase the font size in all the figures.
(2) In the result section for Figure 3B - it is written 'majority of these mRNA are non-coding mRNA' - this doesn't make sense.
Corrected
Reviewer #2 (Recommendations for the authors):
(1) There are lots of mistakes (e.g. word omissions or duplications, grammatical errors) throughout the text, too many to list here.
We have carefully edited the text to try to minimize these mistakes.
(2) In many positions related to their improved nuclease digestion protocol, samples are labelled "M ...", which apparently stands for "high magnesium and high nuclease treatment group". I would suggest switching to something more intuitive, such as "... (improved digestion)".
We have removed most of the comparisons between these samples. What remains (Figure 3), we just use Low Nuclease when we refer to the sample with low Magnesium and low nuclease.
(3) Figure 1,3 - It would be tremendously illuminating to see a polysome trace (UV260 absorbance) in addition to Coomassie-stained SDS-PAGE to underscore the interpretation of the different fractions by the authors. As it stands, there is no way of telling whether there are any polysomes present at all. This can also be done by hand using a UV absorption reader if no built-in device is available to the authors.
We have now done this (Fig. 1C) and also provided EM of this fraction to show the presence of ribosomes in this fraction.
(4) I don't understand why the authors switched from calling fraction 5/6 the "polysome fraction" in their previous work to calling it "ribosome cluster fraction" in this work. The argument given "[...] due to its structural similarity to ribosomes in RNA Granules (Anadolu et al., 2023), we conservatively call this the ribosome cluster fraction (RC)." does not instill confidence that these two fractions are indeed distinct.
We agree with the reviewer and regret this decision. We now call the pellet, the pellet and Fraction 5/6, fraction 5/6.
(5) Figure 1C - There are clear scanning or compression artefacts in the blot images (most prominently in the eEF2 lanes) that should be corrected.
We have replaced all images in Figure 1 and have increased the N of this experiment considerably.
(6) Figure 1C - The authors claim that WT mouse RG is enriched in FMRP compared to RC or starter fraction, but there is also a lot more protein loaded in the RG (especially when compared to RC). It is also hard to believe from the Coomassie staining that despite the much stronger presence of low MW bands (which is where ribosomal proteins migrate) in fraction 5/6, the s6 western blot signal is actually comparable between RC and RG. Can the authors please provide more detail on the loading of these fractions and supply quantification of FMRP in all three fractions, normalized by total protein? This might also be the source of their discrepancy, stating that contrary to their expectation, ribosomes (as measured by s6 signal / s6 signal in starter fraction) are actually increased in FMR1-KO brains.
We have repeated all of these experiments and changed our method of quantification (See methods). We no longer use the starting material in our quantification. Indeed, with the additional data and change in method, we no longer see an increase in S6 in the FMR1- pellet fraction.
(7) Figure 1 - I believe "D-F)" should only read "D-E)" based on the axis titles, and instead "FG)" should be added before the next sentence. Instead of "Staufen" it should be specified in the Figure that "Stau2" was quantified. "Staufen (59kd)" should read "Stau2 (59 kDa)" and "anti-Staufen (52kb)" should read "anti-Stau2 (52 kDa)" and the same for all other similar instances. It is further hard to believe that e.g., "Staufen2 (59kd)" (see above) is not significantly enriched with N=5, a very low spread, and over 1.5x enrichment. The authors should double-check that the appropriate statistical test was employed.
Figure 1 has been completely redone, and the two Staufen bands are enriched in this new analysis.
(8) Figure S4-2 - Most of the detail in the corresponding figure legend should be moved to the Materials and Methods section.
Details relevant to the methods in this figure legend have been now moved to the Material and Methods section.
(9) Figure 4A - The displayed/segmented tRNA densities appear unusually distorted. I would recommend displaying segmented densities of the original homogeneous reconstructions, not of separated and later fused partial maps.
Figure 4 was modified according to the suggestions of this reviewer.’
(10) Figure 9 C-D, S9-1 B-E - Are not all conditions also including puromycin as in B above? If so, it should be added to both the figure and the figure legend.
The reviewer is correct and the figure and legend has been changed to reflect this.
Reviewer #3 (Recommendations for the authors):
(1) "Loss of FMRP causes Fragile X syndrome. In humans, the loss of FMRP occurs due to the expansion of a CGG repeat in the 5' untranslated region (UTR) of the gene, leading to excessive methylation and transcriptional inhibition."
Comment: Genes don't have 5'UTR, but exons encoding 5'UTR. I suggest rephrasing this statement.
This sentence has been rephrased.
(2) "Several of these functions have been implicated in Fragile X syndrome, including FMRP's regulation of miRNA repression, splicing, translation initiation, and translational elongation".
Comment: Is this a typo? miRNA instead of mRNA?
No, this is correct. FMRP has been implicated in the regulation of microRNAs (miRNAs) in a number of studies.
(3) "elongation rates are also increased in mouse models of FMRP".
Comment: Mouse models of Fragile X?
This has been corrected.
(4) "Parts of this work were included in the Master's thesis of the first author (Li, 2024)."
This has been removed.
(5) Comment: Graphs in Figure 1 need proper y-axis labeling. What is the normalization method? What are the values presented in the y-axis?
Figure 1 has been completely changed and the Y-axes are now clear in this new version.
(6) "Thus, by looking at the percentage of puromycylation present in the presence of anisomycin, we can estimate the number of ribosomes in this state. "
Comment: Are the authors really estimating the number of ribosomes in a resistant state? One could argue that they are collecting populational information regarding resistance to anisomycin.
We have rephrased this sentence to be more conservative about what we are measuring.
(7) Comment: Page 11 - Why did the authors assume magnesium would affect the conformation state of the ribosomes? What is the rationale behind increasing the [Mg2+]?
Most preparations using ribosomes use 10 mM MgCl<sub>2</sub>. However, most neuroscientists use physiological buffers that contain 2.5 mM MgCl<sub>2</sub>. In bacteria, this makes a large difference, but evidence from eukaryotes is not clear. Since this is a collaboration between these two schools of thought, we decided to switch to 10 mM MgCl<sub>2</sub>, since in the EM, there were some free 60S ribosomes (Anadolu et al, 2024).
(8) Page 11- "In other words, high Mg2+ decreased the abundance of mRNAs normally cotranslationally inserted into the ER which are unlikely to be components of transporting RNA granules containing stalled ribosomes and solidified our focus on the M protocol in the analyses below."
We have removed this from the paper, as additional experiments aimed to solidify this interpretation failed to detect an effect on secretory mRNAs.
(9) Comment: The whole "abundance", "enrichment", and "occupancy" nomenclature is hard to follow.
We have rewritten this section.
(10) Page 13 - "There were only 2 protein coding genes that were significantly different between the abundance of FMR1-KO and WT in protein coding genes - FMR1 and Wdfy1 (Extended Data Table 5-2). There were no significantly different genes between WT and FMR1-KO occupancy and enrichment. Thus, no difference rose to significance, given the large number of mRNAs used in this analysis."
Comment: It seems like this is repeating the same information three times.
This has been changed.
(11) Page 13 - "Similar to previous experiments with rats, the most abundant mRNAs resistant to run off were significantly abundant, occupied and enriched in both WT and FMRP RPFs (Fig 6)"
The Shah et al dataset we use was based on the most abundant mRNAs resistant to run-off. While we agree it is not surprising that they are also abundant in the pellet we observe, this would not necessarily be true unless the pellet is actually enriched in stalled mRNAs.
(12) Page 14 - "These mRNAs had been identified by cross-linking FMRP with mRNA, fragmenting the mRNA, immunoprecipitating the mRNA still associated with FMRP and sequencing this mRNA."
We shortened this description.
(13) Page 14 - "Interestingly, while still significant, there appeared to be a decrease in the relative abundance of these mRNAs in the FMR1-KO RG (Fig 6B)"
Comment: It is hard to observe this decrease in the boxplots. Second, the statistical tests for the bioinformatics analyses are not the most appropriate, given the large discrepancy in the number of mRNAs present in the experimental group ("All mRNAs") and the filtered groups.
We have redone the statistics using multiple random sampling of all the mRNAs such that the total number of mRNAs in the group was the same. This lowered the significance for some groups, but they are mostly still highly significant. This analysis has also been affected by switching to using the data from the PCR-subtracted RPFs. The changes we now observe are more evident in the whisker box plots due to this improvement in the data.
(14) Page 16 - "To rule out that peaks were due to amplification artifacts in the preparation of RPFs we repeated these analyses after removing PCR duplicates (Fig. S8-1; Extended Data Table S8-3) and found over 95% of the peaks identified without removing PCR duplicates were defined as a peak in at least one of the biological replicates after removing duplicates. More importantly, we found similar results with enrichment of FXS motif and enrichment of negatively charged amino acids in the FMR1-KO only, WT only and both peaks after removing PCR duplicates (Fig. S8-1; Extended Data Table S8-3)."
Comment: It is unclear why the authors needed to include the analysis without PCR duplicate removal. This is an essential step to guarantee the robustness of ribo-seq findings. I recommend removing the whole analysis from Figure 8 from the manuscript and including only the post-duplicate removal analysis.
As mentioned above, we completely agree with this statement and now show only this data and moreover have redone all the figures with only this data (except for Fig. 3).
(15) Figure 9 - I am unsure that the data is convincing enough to demonstrate reinitiation of mRNA granules induced by DHPG. I suggest a colocalization experiment with another protein well known to be localized to RNA granules, such as G3BP1. In addition, repeat the experiment with an additional group where elongation is blocked after the addition of DHPG, which presumably would prevent the reduction in the WT puncta density.
These are interesting additional experiments, but outside the scope of what we can manage. We have previously shown colocalization of Staufen, FMRP and UPF1 to these puncta (Graber et al, 2013; Graber et al, 2017) and shown that these puromycylated puncta also colocalize with nascent peptides detected using the Sun-Tag technique. While we think doing the experiment in the presence of an elongation inhibitor would be interesting, we disagree that it would prevent the reduction in WT puncta density, since we believe what is happening is the loss of the liquid-liquid phase separation of the ribosome clusters due to dephosphorylation of RBPs like FMRP and UPF1 (Graber et al, 2017), and this would reduce the puncta density whether or not the ribosomes were activated for translation.
Nevertheless, we have tried to temper the conclusions made from this result, emphasizing what we know (RPM puncta are decreased) as opposed to actual reactivation of stalled polysomes which we are not measuring.
Discussion - Page 18 - "Nevertheless, if FMRP binding was the critical determinant for presence in neuronal RNA granules, we would have expected to observe more differences." This is not true. If the data is poorly collected, you will not see differences.
This statement was removed.
(16) "A proportion of the stalled ribosomes that are not stored in large RNA granules may still be pelleted in the sucrose gradients. This fraction may be greater in the absence of FMRP."
Comment: The authors are right about this and touch on my original point that the characterization of the biochemical fractionation is not convincing enough. I'd suggest probing against more proteins that are contained in RNA granules.
We have added several proteins to the biochemical characterization shown in Figure 1. We have added a discussion about the relationship between neuronal RNA granules and the sedimented pellet fraction in the discussion section.
Reviewer #2 (Public review):
Summary:
In the manuscript by Walter-McNeill, Kruglyak and team, the authors provide solid evidence of another toxin-antidote (TA) system in C. elegans. Generally, TA systems involve selfish and linked genetic elements, one encoding a toxin that kills progeny inheriting it, unless an antidote (the second element) is also present. Currently, only two TA systems have been characterized in this species, pointing to the importance of identifying new instances of such systems to understand their transmission dynamics, prevalence, and functions in shaping worm populations.
The manuscript has been improved in some aspects upon revision. We remain enthusiastic for the overall findings and the identification of a new toxin/anti-toxin system and note that the strengths and weaknesses we detailed previously remain. We reiterate our critique regarding the strength of conclusions that can be made about small RNA pathway regulation based on meta-analysis of other datasets. While we agree that the observations presented are suggestive of small RNA regulation, likely due to piRNA targeting and subsequent 22G-RNA regulation, until these hypotheses are tested experimentally in the future by mutation of the piRNA target sites, testing ago/piRNA pathway and other 22G-RNA pathway mutants for tmrl-1 expression, etc., we think it is important to use precise language in presenting the conclusions. In particular, the abstract states:
"Multiple lines of evidence suggest that the N2 tmrl-1 allele is recognized by piRNAs, leading to MUT-16-dependent 22G siRNA production and post-transcriptional silencing of the transcript. The N2 haplotype represents the first naturally occurring unlinked toxin-antidote system where the toxin is post-transcriptionally suppressed by endogenous small RNA pathways."
We therefore recommend moderating this statement to "...is likely to be post-transcriptionally suppressed by endogenous small RNA pathways."
Previously noted strengths and weaknesses remain relevant to this revision.
Strengths:
This novel TA system (mll-1/smll-1) was identified on LGV in wild C. elegans isolates from the Hawaiian Islands, by crossing divergent strains and observing allele frequency distortions by high throughput genome sequencing after 10 generations. These allele frequency distortions were subsequently confirmed in another set of crosses with a separate divergent strain, and crosses of heterozygous males or hermaphrodites resulted in a pattern of L1 lethality in progeny (with a rod arrest phenotype) that suggested the maternal transmission of this TA system from the XZ1516 genetic background. By elegantly combining the use of near-isogenic lines, CRISPR editing to generate knock-outs, and a transgene rescue of the antidote gene, the authors identified the genes encoding the toxin and the antidote, which they refer to as mll-1 and smll-1. Moreover, the specific mll-1 isoform responsible for the production of the toxin was identified and mll-1 transcripts were observed by FISH in early and late embryos, as well as in larvae. Inducible expression of the toxin in various strains resulted in larval arrest and rod phenotypes. The authors then characterized the genetic variation of 550 wild isolates at the toxin/antidote region on LGV and distinguished three clades: 1) one with the conserved TA system, 2) one having lost the toxin and retaining a mostly functional antidote, and 3) one having lost the antidote and retaining a divergent yet coding toxin (this includes the reference strain Bristol N2, in which the homologous toxin gene has acquired mutations and is known as B0250.8). Further, the authors show that this region is under positive selection. These data are compelling and provide very strong evidence of a new TA system in this species.
Weaknesses:
The question remained as to how one clade, including N2, could retain the toxin gene but not possess a functional antidote. In the second part of the manuscript, the authors hypothesized that small RNA targeting (RNAi) of the toxin transcript could provide the necessary repression to allow worms to survive without the antidote. Through a meta-analysis of multiple small RNA datasets from the literature, the authors found evidence to support this idea, in which the toxin transcript is targeted by 22G siRNAs whose biogenesis is dependent on the Mutator foci protein, MUT-16. They note that from previous studies, mut-16 null mutants displayed a varied penetrance of larval arrest. In their own hands, mut-16 mutants displayed 15% varied larval arrest and 2% rod phenotypes. In an attempt to link B0250.8 to mut-16/siRNAs, they made a double mutant and examined body length as a proxy for developmental stage. Here, they observed a partial rescue of the mut-16 size defect by B0250.8 mutation. Finally, the authors also highlight data from further meta-analysis which predicts the recognition of B0250.8 by several piRNAs. Also based on existing data from the literature, the authors link loss of Piwi (PRG-1), which binds piRNAs, to a depletion of 22G-RNAs targeting B0250.8 and an upregulation of B0250.8 expression in gonads, suggesting that piRNAs are the primary small RNAs that target B0250.8 for down-regulation. The data in this portion of the manuscript are intriguing, but somewhat incomplete, as they are based on little primary experimentation and a collection of different datasets (which have been acquired by slightly different methods in most cases). This portion of the study would require subsequent experimentation to firmly establish this mechanistic link. For example, to be able to claim that "the N2 toxin allele has acquired mutations that enable piRNA binding to initiate MUT-16-dependent 22G small RNA amplification that targets the transcript for degradation" the identified piRNA sites should be mutated and protein and transcript levels analysed in wild-type and in the strain with mutated piRNA sites. At a minimum, the protein levels in wild-type and mut-16, prg-1, and/or wago-1 mutants should be measured by western blot and/or by live imaging (introducing a GFP or some other tag to the endogenous protein via CRISPR editing) to show that the toxin is not accumulated as a protein in wt, but increases in levels in these mutants. mRNA levels in Fig S5A suggest there is still some expression of the B0250.8 transcript in a wild type situation.
Comments on revised version.
We have no further recommendations for the authors, other than those provided above.
Author response:
The following is the authors’ response to the original reviews.
We incorporated Reviewer #2’s suggestion to change the name of mll-1 because of overlap with a human gene. We used the updated gene names in our responses below to minimize confusion. Below are the updated gene names for the toxin-antidote system we described.
tmrl-1 - Toxin-induced Maternal Rod Lethality (formerly mll-1). After we establish that B0250.8 is also a toxin, we refer to this gene as the “N2 tmrl-1 allele”.
amrl-1 - Antidote of Maternal Rod Lethality (formerly smll-1)
Public Reviews:
Reviewer #1 (Public review):
Summary:
The article by Zdraljevic et al. reports the discovery of a third toxin-antidote (TA) element in C. elegans, composed of the genes mll-1 (toxin) and smll-1 (antidote). Unlike previously characterized TA systems in C. elegans, this element induces larval arrest rather than embryonic lethality. The study identifies three distinct haplotypes at the TA locus, including a hyper-divergent version in the standard laboratory strain N2, which retains a functional toxin but lacks a functional antidote. The authors propose that small RNA-mediated silencing mechanisms, dependent on MUT-16 and PRG-1, suppress the toxicity of the divergent toxin allele. This work provides insights into the evolutionary dynamics of TA elements and their regulation through RNA interference (RNAi).
Overall, there are many things to like about this paper and only a few small quibbles, which will not require more than a little rewriting or relatively minor analyses.
Strengths:
(1) The discovery of a maternally deposited TA element with delayed toxicity due to delayed mRNA translation of the maternally deposited toxin mRNA is a significant addition to the literature on selfish genetic elements in metazoans.
(2) Identifying three haplotypes at the TA locus provides a snapshot of potential evolutionary trajectories for these elements, which are often inferred but rarely demonstrated in naturally occurring strains. The genomic analysis of 550 wild isolates contextualizes the findings within natural populations, revealing geographic clustering and evolutionary pressures acting on the TA locus.
(3) The study employs various techniques, including CRISPR/Cas9 knockouts, FISH, long-read RNA sequencing, and population genomics. The use of inducible systems to confirm toxicity and antidote functionality is particularly robust. This multifaceted approach strengthens the validity of the findings.
(4) The authors provide compelling evidence that small RNA pathways suppress toxin activity in strains lacking a functional antidote. This highlights an alternative mechanism for neutralizing selfish genetic elements.
Weaknesses:
(1) The introduction focuses strongly (for good reason) on bacterial TA systems and then jumps to TA systems in C. elegans. It's unclear why TA systems in other eukaryotes are not discussed.
We briefly introduced bacterial TA systems because of their ubiquitousness and focused on C. elegans TA systems. We chose certain aspects of previously described Caenorhabditis TA elements that were relevant to the narrative we presented. Furthermore, we have extensively reviewed TA systems previously and have added a citation to that review in the revised manuscript (Burga et al. 2020).
(2) Similarly, there is a missed opportunity to discuss an analogy between the suppressor mechanism discovered here and the hairpin RNA suppressors of meiotic drive identified by Eric Lai and colleagues. Discussing these will provide a fuller context of the present study's findings and will not affect their novelty.
Thank you for pointing this out. We added a mention of the Stellate and Dox systems in our discussion.
(3) While the evidence for RNAi-mediated suppression is strong, the claim that positive selection drove diversification at piRNA binding sites requires further discussion and clarification. The elevated dN and dS are unusual (how unusual relative to other genes in vicinity? What is hyper-divergent statistically speaking?), but there is no a priori reason that there would be selection on piRNA binding sites within the mll-1 transcript to facilitate its recognition by endogenous RNAi machinery; what is the selective pressure for mll-1 to do so? Most TA systems would like to avoid being suppressed by the host. One cannot make the argument that this was motivated by the loss of the antidote because the loss of the antidote would be instantly suicidal, so the cadence of events described requiring hypermutation of the mll-1 transcript does not work.
We largely agree with the reviewer’s point, which we believe is based on the following sentence in the discussion: “We propose that positive selection for piRNA binding sites in the tmrl-1 transcript drove the diversification of this gene toward the N2 version.” We have removed this argument from the discussion in the revised manuscript.
Reviewer #2 (Public review):
Summary:
In the manuscript by Walter-McNeill, Kruglyak, and team, the authors provide solid evidence of another toxin-antidote (TA) system in C. elegans. Generally, TA systems involve selfish and linked genetic elements, one encoding a toxin that kills progeny inheriting it, unless an antidote (the second element) is also present. Currently, only two TA systems have been characterized in this species, pointing to the importance of identifying new instances of such systems to understand their transmission dynamics, prevalence, and functions in shaping worm populations.
Strengths:
This novel TA system (mll-1/smll-1) was identified on LGV in wild C. elegans isolates from the Hawaiian islands, by crossing divergent strains and observing allele frequency distortions by high-throughput genome sequencing after 10 generations. These allele frequency distortions were subsequently confirmed in another set of crosses with a separate divergent strain, and crosses of heterozygous males or hermaphrodites resulted in a pattern of L1 lethality in progeny (with a rod arrest phenotype) that suggested the maternal transmission of this TA system from the XZ1516 genetic background. By elegantly combining the use of near-isogenic lines, CRISPR editing to generate knock-outs, and a transgene rescue of the antidote gene, the authors identified the genes encoding the toxin and the antidote, which they refer to as mll-1 and smll-1. Moreover, the specific mll-1 isoform responsible for the production of the toxin was identified and mll-1 transcripts were observed by FISH in early and late embryos, as well as in larvae. Inducible expression of the toxin in various strains resulted in larval arrest and rod phenotypes. The authors then characterized the genetic variation of 550 wild isolates at the toxin/antidote region on LGV and distinguished three clades: (1) one with the conserved TA system, (2) one having lost the toxin and retaining a mostly functional antidote, and (3) one having lost the antidote and retaining a divergent yet coding toxin (this includes the reference strain Bristol N2, in which the homologous toxin gene has acquired mutations and is known as B0250.8). Further, the authors show that this region is under positive selection. These data are compelling and provide very strong evidence of a new TA system in this species.
Weaknesses:
The question remained as to how one clade, including N2, could retain the toxin gene but not possess a functional antidote. In the second part of the manuscript, the authors hypothesized that small RNA targeting (RNAi) of the toxin transcript could provide the necessary repression to allow worms to survive without the antidote. Through a meta-analysis of multiple small RNA datasets from the literature, the authors found evidence to support this idea, in which the toxin transcript is targeted by 22G siRNAs whose biogenesis is dependent on the Mutator foci protein, MUT-16. They note that from previous studies, mut-16 null mutants displayed a varied penetrance of larval arrest. In their own hands, mut-16 mutants displayed 15% varied larval arrest and 2% rod phenotypes. In an attempt to link B0250.8 to mut-16/siRNAs, they made a double mutant and examined body length as a proxy for developmental stage. Here, they observed a partial rescue of the mut-16 size defect by B0250.8 mutation. Finally, the authors also highlight data from further meta-analysis, which predicts the recognition of B0250.8 by several piRNAs. Also based on existing data from the literature, the authors link loss of Piwi (PRG-1), which binds piRNAs, to a depletion of 22G-RNAs targeting B0250.8 and an upregulation of B0250.8 expression in gonads, suggesting that piRNAs are the primary small RNAs that target B0250.8 for downregulation. The data in this portion of the manuscript are intriguing, but somewhat preliminary and incomplete, as they are based on little primary experimentation and a collection of different datasets (which have been acquired by slightly different methods in most cases). This portion of the study would require subsequent experimentation to firmly establish this mechanistic link. For example, to be able to claim that "the N2 toxin allele has acquired mutations that enable piRNA binding to initiate MUT-16-dependent 22G small RNA amplification that targets the transcript for degradation" the identified piRNA sites should be mutated and protein and transcript levels analysed in wild-type and in the strain with mutated piRNA sites. At a minimum, the protein levels in wild-type and mut-16, prg-1, and/or wago-1 mutants should be measured by western blot and/or by live imaging (introducing a GFP or some other tag to the endogenous protein via CRISPR editing) to show that the toxin is not accumulated as a protein in wt, but increases in levels in these mutants. mRNA levels in Figure S5A suggest there is still some expression of the B0250.8 transcript in a wild-type situation.
We thank the reviewer for their thoughtful assessment of our manuscript, and we appreciate that they recognized that the data linking the small RNA machinery to B0250.8 suppression is intriguing. While the reviewer claims our analysis is preliminary and incomplete, we believe we present an appropriate multi-faceted approach for establishing the small RNA-mediated suppression mechanism we describe.
First, the reviewer states that we rely on “little primary experimentation”. Our primary experiments show that loss of the N2 tmrl-1 allele partially rescues ∆mut-16 developmental delay and arrest phenotypes. Therefore, we provide direct evidence that the N2 tmrl-1 functionally contributes to the ∆mut-16 phenotype. Furthermore, we overexpressed the N2 tmrl-1 allele to show that this gene is a toxin.
It is true that we use previously published datasets to establish a small RNA-mediated mechanism that likely explains our observations. The reviewer suggests that our claims are weakened by relying on a “collection of different datasets (which have been acquired by slightly different methods in most cases)”. We believe instead that evidence collected from multiple labs using an array of different techniques strengthens our conclusions. We show that N2 tmrl-1-targeting small RNAs have been identified across multiple datasets (references 26, 32, 33, 34). Taken together, these datasets support a mechanistic framework for the suppression of the N2 tmrl-1 that involves PRG-1-dependent piRNA binding, MUT-16-dependent 22G siRNA, and the secondary Ago WAGO-1 binding.
The reviewer suggests several experiments, but we do not view them as essential to support our claims.
(a) piRNA site mutatagenesis: we present multiple lines of evidence that the N2 tmrl-1 transcript is post-transcriptionally targeted by small RNAs in a piRNA-mediated manner, not that specific piRNA sites are necessary and sufficient for this silencing. The suggested experiment would be valuable for future work, but is beyond the scope of our study.
(b) Characterization of TMRL-1 protein levels: We agree that this experiment would provide definitive evidence of complete small RNA-mediated suppression of the N2 tmrl-1 transcript. As we explain above, however, we do show that removing the N2 tmrl-1 allele partially rescues the ∆mut-16 growth defect, demonstrating that when this gene’s regulation is disrupted, it induces toxicity. Importantly, we observed no tmrl-1-induced toxicity when we overexpressed a version of this gene with a stop codon, indicating that it acts as a protein.
Finally, the reviewer questions our claim that: "the N2 toxin allele has acquired mutations that enable piRNA binding to initiate MUT-16-dependent 22G small RNA amplification that targets the transcript for degradation."
We agree that this statement is too definitive given our current data. We have revised it to: "Multiple lines of evidence suggest that the N2 tmrl-1 allele is recognized by piRNAs, leading to MUT-16-dependent 22G siRNA production and post-transcriptional silencing of the transcript."
Recommendations for the authors:
Reviewer #1 (Recommendations for the authors):
(1) The paper suggests that antidote pseudogenization occurred because RNAi replaced its function, but does not explore whether this process is ongoing or complete across all N2-like strains.
We explored this possibility, but we realize that we did not explicitly state so in the manuscript. The B0250.4 (amrl-1) gene is pseudogenized in all strains within the N2 clade. We have modified the following sentence in the results section to explicitly state this observation:
“While the previously described C. elegans TA elements are characterized by their absence in susceptible strains (2, 3), all members of the N2-like susceptible clade harbor a divergent allele of tmrl-1 with an intact coding sequence, as well as a pseudogenized version of amrl-1.”
(2) Some figures (e.g., allele frequency distortions) could benefit from additional annotations to guide interpretation. In general, the figures make the reader work harder than they need to.
We attempted to add clarity to figure captions for clarity.
Although mll-1 and smll-1 were identified as toxin and antidote genes, their molecular mechanisms remain unclear and are very interesting.
We agree that identifying the molecular mechanism associated with the toxin and antidote would be of interest, but is beyond the scope of the current paper.
Reviewer #2 (Recommendations for the authors):
(1) Because the rod phenotype was important in identifying the TA system, it seems important to include representative images of this phenotype throughout the paper.
We added a supplemental figure showing the resulting self progeny from a QX1211/XZ1516 heterozygote: Fig S1B
(2) In Figure 2A, we were confused as to why there were so few reads of mll-1. We may be misunderstanding something, so could the authors explain this to us? We would have expected more reads of mll-1, given the diagram showing that the breakpoints of the NIL were beyond (closer to the right end of) the mll-1 locus, and the phenotype correlates with the presence of the toxin (frequency of .20 L1 arrest).
The lack of sequencing depth arises because the sequence divergence between QX1211 and XZ1516 is too high to accurately map short sequencing reads derived from QX1211 to the XZ1516 genome. We added the following sentence to the figure caption to add clarity:
“The XZ1516 and QX1211 genome are so diverged that short reads derived from QX1211 don’t align to the XZ1516 genome in the 200 bp windows with no corresponding read depth, as indicated by a lack of a gray bar.”
(3) The use of TOF in Figure 4 as a proxy of animal length instead of directly indicating or measuring animal length hinders the comparison of these results with other studies (i.e., most often in the literature, we see images of worms and measurements of their sizes or use of some other morphological marker to demonstrate the proportion of worms in a particular developmental stage). Nonetheless, we think the approach is clever and certainly enables analysis of a large sample population. However, a wild-type control is missing from these experiments to give a sense of the typical distribution one would expect. Without this, one interpretation of the B0250.8 knock out data shown in B is that loss of B0250.8 results in ~10% arrested larval, which seems higher than would be expected for a wild type N2 strain, and should be explained-but again, if the wild type control showed the same pattern, that would be useful to know. The title for Figure 4 should be revised, as this figure suggests, but does not provide definitive evidence that B0250.8 is suppressed by sRNAs/sRNA pathways. See the next point for providing more definitive data to support this model.
There is a long list of publications that rely on the large particle sorter to infer how growth rate is affected in various mutants and environmental conditions (See Andersen et al. 2015, ref 28 in the manuscript, and the papers that reference this work). As the reviewer pointed out, the use of time of flight, which is simply the amount of time an object obstructs a laser at a constant flow rate, enables accurate measurement of tens of thousands of individual animals for comparison.
The reviewer is correct to point out that without a wild type N2 control, it is impossible to tell what a typical distribution looks like. However, the experiment includes all strains necessary to make the comparisons that enable us to draw the conclusion that the N2 tmrl-1 allele contributes to larval arrest in the absence of MUT-16.
We agree with the reviewers point that this figure does not provide evidence that B0250.8 is suppressed by small RNAs and we have therefore changed the figure title.
The new figure title: The N2 tmrl-1 allele contributes to larval arrest in the absence of MUT-16
(4) To be able to claim that "the N2 toxin allele has acquired mutations that enable piRNA binding to initiate MUT-16-dependent 22G small RNA amplification that targets the transcript for degradation" the identified piRNA sites should be mutated and protein and transcript levels analysed in wild-type and in the strain with mutated piRNA sites. At a minimum, the protein levels in wild-type and mut-16, prg-1, and/or wago-1 mutants should be measured by western blot and/or by live imaging (introducing a GFP or some other tag to the endogenous protein via CRISPR editing) to show that the toxin is not accumulated as a protein in wt, but increases in levels in these mutants. mRNA levels in Figure S5A suggest there is still some expression of the B0250.8 transcript in a wild-type situation.
The reviewer makes several good suggestions for experiments to determine whether the conclusions we make from publicly available high-throughput sequencing datasets apply in our context. However, we disagree that the quoted statement “the N2 toxin allele has acquired mutations that enable piRNA binding to initiate MUT-16-dependent 22G small RNA amplification that targets the transcript for degradation” is not supported by the evidence we present from Reed et al. 2020. The data presented by Reed et al. clearly show that the N2 tmrl-1 transcript is heavily targeted by 22G siRNAs, and that the accumulation of these siRNAs depends on the presence of MUT-16 and PRG-1. The dependence on PRG-1 implicates piRNAs involvement in the mounting of a 22G response.
(5) Importantly, it is not the mll-1/B0250.8 transcript itself that was not shown to interact with WAGO-1 in the Seroussi et al. eLife paper (Lines 257-259). This study investigated sRNAs associated with every AGO, and computationally inferred the targets of each AGO using those enriched sRNA sequences. Therefore, it is the siRNAs antisense to mll-1/B0250.8 that were detected in association with WAGO-1, making it likely that WAGO-1 is the secondary AGO that targets this transcript. The argument the authors make holds true, but the authors should revise how they describe the evidence supporting that argument to accurately reflect the existing data.
Thank you for catching this mistake. We have updated the text to accurately reflect the results from the Seroussi et al 2023 publication:
“Recent work has shown that the N2 tmrl-1 transcript-derived small RNAs co-immunoprecipitated with WAGO-1, providing additional evidence that this transcript is regulated by the endogenous RNAi machinery”
(6) It seems likely that the authors explored the possibility that another antidote may be present in the third clade. Could they discuss what they did to rule out this explanation in lieu of piRNA/siRNA regulation?
We did not look for another antidote in the third clade because this clade is defined by the presence of an antidote and the absence of a toxin. Figure 3C shows the result of a cross between a third clade strain (NIC195) and XZ1516. The conclusion we draw from this experiment is that the antidote present in NIC195 provides near complete resistance to the XZ1516 toxin.
(7) Line 156, legend of Figure S3, and line 273: There was no marker used to indicate that these are the primordial germ cells. Best practices would indicate using a fluorescent marker (e.g., PIE-1 GFP or PGL-1 GFP or PRG-1 GFP, etc.) to definitively identify these as PGCs.
We agree with the reviewer’s point. As we do not have the perfect experiment, we do not definitively state that tmrl-1 transcripts localize in the primordial germ cells.
Minor comments:
(1) A minor suggestion: incorporating some of the results now shown in the supplementary figures - Figures S1, S3, and S4 - into the main figures may make the manuscript easier to read.
We constructed the manuscript in a way we thought was straightforward. The figures listed by the reviewer are supplemental to the main conclusions of the manuscript, so we decided to leave them as supplemental figures.
(2) Line 87, Figure S1A: include numbers in the y-axis.
The numbers are included on the y-axis and we explain the x-axis tick marks in the figure caption.
(3) Figures 1B, 2B, 3C, 4B, S1B, S4: statistical analyses missing.
We have added a summary of the statistical analysis to the captions of Figures 1B, 2B, 3C, and S1B. We added more detail from the analysis of 4A, which is the figure we draw conclusions from. Figure S4 is observational data, and the only conclusion drawn from that figure is that the N2 tmrl-1 gene encodes a toxin. It is toxic in 100% of individuals we looked at and therefore doesn’t warrant statistics.
(4) Line 100, "The rod progeny were all homozygous for QX1211 alleles at the locus on the right arm of chromosome V that displayed the allele frequency distortion in the mapping populations". Is this supported by data? While there is strong evidence to suggest it, the way it is currently written makes it seem that the rod progeny have been genotyped (by sequencing or PCR?). Is this the case? If not, the authors should revise the statement accordingly.
Yes, this is indeed the case and we have updated the text to reflect that we performed PCR of a QX1211-specific indel to verify the genotypes on the right arm of chromosome V.
(5) Figure 2A: lower panel missing x axis label.
The top panel is a cartoon representation of a NILs, and the x axis is labeled for the top panel, highlighting the mapped element.
(6) Line 140 to 148: The authors should provide data to support these statements.
Realizing i skipped this one – these are the lines they are referring to -> Long-read RNA sequencing revealed two distinct mll-1 isoforms, a short isoform with three predicted exons and a long isoform with eight predicted exons (Fig. S2A). We constructed plasmids with inducible versions of each mll-1 isoform. When we injected susceptible strains with the short mll-1 isoform array, every F1 individual carrying the array died, with 64% of larvae exhibiting the rod phenotype, indicating that uninduced expression levels of the short mll-1 isoform are sufficient to induce lethality. By contrast, we were able to isolate susceptible strains that maintained the long mll-1 isoform array or a short mll-1 isoform array with a premature stop codon in mll-1. We observed no rod progeny upon induction of these arrays, indicating that the short isoform encodes the functional toxin, and that the toxin acts as a protein.
(7) Line 193: It would be interesting to see if there is structural conservation between mll-1 and B0250.8 using alpha-fold. Have the authors done this?
We did attempt to look for structural conservation but we found the confidence in the structural predictions to be very low, which didn’t warrant a comparison.
(8) Line 206-207: Could the authors explain why the frequency of the rod phenotype is so low when presumably over-expressing B0250.8? Does this indicate that B0250.8 is not as functional a toxin as mll-1, or is it sufficiently repressed by sRNAs and not actually overexpressed? Further, what are "abnormal" phenotypes? This should be clarified for the reader.
It is likely that the overexpression and misexpression of toxic proteins is causing the abnormal phenotypes. The rod phenotype probably manifests when the gene is expressed at the appropriate developmental stage and tissue to cause the phenotype, whereas abnormal phenotypes manifest when the expression is not in the correct stage or location. A summary of the observed phenotypes is provided in Supplementary Table 7.
(9) Line 216 and thereafter: indicate that B0250.8 is now referred to as mll-1.
We incorporated this suggestion.
(10) Line 228-231: missing to state that this is shown in Figures 4A-B.
This and the following comment suggests that we did not provide enough clarity in this section. We modified the line to the following:
Consistent with this report, in an agar plate-based preliminary assay we observed that ~15% of ∆mut-16 progeny arrest at various larval stages, and 2% of progeny are rod, which is suggestive of derepression of tmrl-1 in N2.
This lets readers know that this initial characterization of the mut-16 knockout strain is different from the data presented in figure 4.
(11) Line 230: the Figure shows ~25% of arrest for the deletion mutant of mut-16, but the text says ~15%.
The 15% the reviewer points out was obtained from a preliminary agar plate-based experiment where we attempted to characterize the mut-16 deletion strains. We turned to a more high-throughput approach to screen through more animals for each genotype, which we report in figure 4.
(12) Line 233: TOF, and not animal length, was compared. The authors should indicate that TOF is used as a proxy for animal length.
We made the suggested change. The new sentences read:
To do so, we compared time of flight (TOF) measurements—a proxy for animal length, developmental stage, and growth rate (28)—between a strain with a single knockout of mut-16 and one with a double knockout of mut-16 and the N2 tmrl-1 (a strain with a single knockout of the N2 tmrl-1 served as a negative control). We observed a reduction in TOF and an increase in the fraction of worms in larval stages in the mut-16 knockout strain, and these effects were partially rescued in the double knockout strain (Fig. 4).
(13) Line 237-239: This claim may be overstated without additional data. Consider adding a "likely" to the statement.
The line in question:
These results indicate that the reduced growth rate observed in the mut-16 knockout strain is partially mediated by derepression of the N2 mll-1 allele.
We modified it to reflect the reviewer’s concern:
These results indicate that the reduced growth rate observed in the mut-16 knockout strain is partially mediated by the presence of the N2 tmrl-1 allele, likely because tmrl-1 is derepressed in mut-16 knockout strains.
(14) Line 257: Figure S5C should be moved to line 259.
We made the suggested move.
(15) Is the name mll-1 firmly established? We ask because MLL1 is a human mutation commonly associated with leukemia, and it may lead to some confusion in the field. This is a minor point, but we wanted to bring it forth.
This name was not firmly established. We modified the names to not overlap with known gene names:
tmrl-1 - Toxin-induced Maternal Rod Lethality
amrl-1 - Antidote of Maternal Rod Lethality
This study is an important contribution to our understanding of waterfowl conservation and population ecology in Europe. Recovery of marked birds, typically through harvest by waterfowl hunters, is an important means of obtaining data to assess survival and harvest probabilities in waterfowl, but the ability to differentiate between natural and harvest mortality requires a better understanding of reporting probabilities (the proportion of banded/ringed birds that are harvested by hunters that are also reported to banding authorities). In North America we have had numerous studies using reward bands to estimate this “band reporting rate”, but comparable studies have not been conducted elsewhere, until this study. I thoroughly reviewed this preprint and my overall assessment is strongly supportive. I have only a few suggestions for potential improvement.
It might be nice to bound the reporting rate estimates between 0 and 1 by formally including reporting rate in the model likelihoods rather than estimating it as a derived parameter. I can’t use the link to your code, so I’m unable to see exactly how you modeled this, but you could seemingly model reporting probability directly by including it in the likelihood anywhere that Brownie’s f or Seber’s r appears for birds marked with reward rings.
Lines 328-330: You conclude this paragraph with a statement about your results supporting additive mortality from hunting, but the rationale for this isn’t explained (I’m not disputing your claim, but you haven’t clearly articulated why you believe your results support partially additive mortality). The stark difference in estimated harvest probabilities between newly ringed and previously ringed (i.e., direct vs. indirect in North American terminology) suggests that heterogeneity in vulnerability to harvest might (also) be very important in these populations and thereby contribute to compensation of harvest. Coauthor Emilienne Grzegorczyk presented intriguing results on survival heterogeneity at the latest EURING conference and it might be worthy of a little bit of discussion here.
Minor edits: Line 77 or thereabouts: Because there is an extensive literature on reporting probabilities from North America, but quite different terminology, it might be nice to include a Methods paragraph clarifying ring/band/tag recovery as identical, young vs. adult and hatch-year vs. after-hatch-year, and define the terms direct vs. indirect recovery in terms of time since marking.
Line 154: In addition to the inscription included on reward rings, it would be helpful to indicate the exact inscription provided on standard rings. In North America we observed a pronounced increase in band reporting probabilities when band inscriptions were modified to include toll-free phone numbers and later, web addresses.
When do (most) of your recoveries occur? It would be helpful to include information on timing of harvest in France. Given that you include season of banding as a covariate on survival, subsequent estimates of survival beyond the first year will be hunting season to hunting season. It might be nice to more formally address timing of banding by including a “partial year survival” term in the first diagonal of your m-arrays. This could be a shared annual survival term, but partitioned into portions based on how much of the year an average bird would have to survive (e.g. S^(5/12) if 5 months or S^(9/12) if 9 months).
In North American ducks, we would expect to see pronounced differences in seasonal survival between sexes due to breeding risks incurred by females. For example, spring releases of female mallards would be expected to have lower survival to the first hunting season than spring releases of males. It might be nice to indicate in the methods that you ignored sex in your analysis given small sample sizes (given interactions with species, age, and timing, it might require 6-12 df to properly address), but future analyses based on additional data might wish to investigate sex differences in both survival and recovery probabilities.
You have a nice literature review, but there are a few additional papers that would be worth including: Lines 64-65: Either of the two Riecke et al. 2022 Journal of Animal Ecology papers would be good to cite for an example of how reporting probabilities can help partition annual survival into harvest and natural mortality. Koons et al. (2014, Wildfowl) would be a nice paper to cite here for life-history differences in relation to body size. The results from nasal-marked teal are intriguing, and I suspect that nasal markers might influence survival, vulnerability to harvest, and reporting probability. Arnold et al. 2016 J. Wildl. Manage., Szymanski et al. 2020 Wildl. Soc. Bull., Reinecke et al. 1992, J. Wildl. Manage., Caswell et al. 2012, J. Wildl. Manage.).
Minor changes to wording: Abstract, line 49: I think you mean “subjected” rather than “submitted”. Intro, line 57: “elaborate” rather than “elaborated”. Intro, line 83: use “to” instead of “on”. Intro, line 89: use “of” instead of “or”. Methods, line 126: use “drop-door” instead of “door-falling” Line 161: “departmental”. Line 196: “parameter” (not plural). Line 298: “a heavy predator-control program was in place”. Line 344-345: Curiosity effect has been hinted at in some other research.
Author response:
The following is the authors’ response to the original reviews.
Public Reviews:
Reviewer #1 (Public review):
Summary:
Freas and Wystrach present a computational model of steering in insects. In this model, the central complex provides an error signal indicating the animal should turn left or right; this error signal biases the function of an oscillator composed of two mutually inhibiting self-exciting units. The output of these units generates a "steering signal" that is used both to set the direction and speed of the ant. Additionally, a separate module induces pauses, and an inverse relation between forward speed and turning speed is externally imposed. Statistics of the trajectories generated by the model are compared to the measured behaviors of ants.
Strengths:
While the model is very simple compared to state-of-the-art models, that simplicity makes it a potentially useful guide to researchers studying insect navigation. Some predictions that emerge from the model appear to be experimentally testable, although a more complete description of the model and its parameters, as well as an analysis of how this model's predictions differ from previous models' predictions, would be required to design these experiments.
Weaknesses:
I found it difficult to identify evidence in the paper supporting central elements of the abstract. Hopefully, these difficulties can be resolved with a clearer presentation and the addition of supporting detail, especially in the methods.
(1) The model is not clearly described
In the Materials and Methods, there is no description of the model, just "The computational model is presented in Figure 1." (This is probably a typo and may refer to Figure 2A-C), and a link to Matlab source code. It is inappropriate to ask readers or reviewers to examine source code in lieu of providing a method, but I attempted to do so anyway.
We have now added a full description of the model in the methods.
To my eye, the source code does not match the model presented in 2A-C. For instance, in 2C, "Steering signal" inhibits "Freeze", but I couldn't find this in the source. "Freeze" is shown to inhibit "steering signal," but as "steering signal" is a signed quantity, it's not clear what this means. Literally, since "ang_speed_raw = L-R," it would seem to indicate the "freeze" would bias towards right turns. In the code, "freeze" appears to be implemented through the boolean variable "speed_inhibition_time." The logic controlled by this variable doesn't appear to inhibit the "steering signal" but instead (depending on control parameters) either reduces the movement speed and amplifies the turning rate, or it turns the angular speed output into a temporal integral of the control signal.
We understand the confusion. Our neural implementation does not go downstream of the neural steering signal (Left and Right Descending neurons), and the way it is transformed into a movement (ang_speed_raw = L-R) is not modelled neurally (the formula is explicitly shown on the right hand side of Figure 2). Indeed, we did not attempt to put forward any assumption about neural implementation for our freezing signal (see our response to comment 2 below). To avoid confusion, we have now removed the reciprocal inhibition portion as it was previously drawn in Figure 2C, and replaced it by a non neural sign (a cross, indicating that the signal is blocked) acting between steering signal and movement.
There are a number of parameters in the source code that aren't described at all in the paper, including the internal oscillator parameters.
We now provide all the parameters in the methods, together with figures showing the dynamics of oscillations across parameter range, and a rationale for their choice (see Supplemental Figure 2).
Together, these limitations make it difficult to understand what is being simulated, what parts of the model are tied to biology, and where the model improves on or departs from previous work.
It is absolutely essential that authors fully describe the computational model, that they explain the meaning of all parameters of the model, and that they explain how the particular values of these parameters were chosen.
This is now done in the methods section under the “Model Overview” subsection.
(2) The biological inspiration is unclear
A central claim of the paper is that the model is "biologically grounded." But some elements, for instance, using a signed quantity to represent left-right steering drive, are not biologically possible; at best, these are shorthand for biologically possible implementations, e.g., opposing groups of left-right driving neurons.
The mechanism that produces fixations and saccades - the "freeze" module - is not tied to any particular anatomy of the insect brain. Initiation of a freeze occurs at a specific time coded into the model by the authors; it is not generated by an internal model signal. Release of a freeze is by drawing a random variable; there is no neural mechanism proposed to generate this signal.
We now clarified what is neural from is not from the introduction onwards, for instance:
“Because we did not want to form pre-assumptions for how such a ‘freeze signal’ could be implemented in the insect nervous system; in our model this was achieved using a simple external signal that halts forward motion at random intervals.”
In some versions of the model, instead of directly controlling the signal, during fixations, the angular drive signal is integrated into a variable "cumul_drive." No neural substrate is proposed for this integrator. In the code, if cumul_drive passes a threshold, the angular heading of the ant changes (saccades), but only if this threshold is passed before the Poisson process ends the fixation. No neural substrate is proposed for any of this logic.
This has now also be clarified in the introduction:
“During scanning, real ants display rotational saccades of variable duration and angular magnitude (Figure 1A–C). To replicate this, we introduced a threshold-based mechanism: after each fixation (i.e., zero angular and forward speed), the underlying angular steering signal accumulates until surpassing a threshold, triggering a saccade. The resulting angular magnitude of the saccade corresponds to the sum of the angular drive accumulated during the fixation. Here also we stuck to a non-neural, straight-forward algorithmic level, as we did not want to make assumptions about how such a cumulate-and-release mechanism could be neurally implemented in the insect brain (see discussion for potential implementations).”
The model steps forward in time by a fixed increment - the actual duration (in seconds) of this time step is not specified. From Figure 4F, G, it appears a simulation time step is meant to be about 10ms. This would imply an oscillator frequency of about 2 Hz (Fig 2B), that the heading oscillates at a similar frequency (2G), and that a forward crawling ant stops moving every 500 ms (2I). Are these plausible? Can they be compared to an experiment? Model parameters, including the ones that control the frequency of the oscillator, are non-dimensionalized. It is not possible to evaluate whether these parameters are biologically plausible or match experimental results.
We now added a figure showing the oscillatory dynamics of the oscillator across parameter ranges (supplemental figure 2). The step increment (i.e., and thus the sampling rate along an oscillatory cycle) necessarily varies according to the inhibition strength and self decay parameter chosen (e.g., small parameter values will lead to small step increment, and thus a high sampling rate along the oscillatory cycle). We chose oscillatory parameters to ensure that the sampling rate will be high enough to resolve multiple saccades within one oscillatory cycle and that sampling rate is small enough for computation time to remain practical.
Beyond these constraints, the oscillator parameters can be chosen arbitrarily, and a conversion of time step to actual time (ms) would be equally arbitrary and give the illusion that the model captures the data quantitatively. Because we did not model spiking neural dynamics (or brain region low field potential frequencies), we can not constrain our model through a temporal link between brain clock and behavioural speed. We thus prefer to stick to the true and non-dimensional label ‘time steps’ in our figures.
(3) Claims that behaviors emerge from the model may be overstated
The abstract claims that steering correction and fixations/saccades emerge naturally from the same model. But it appears to me that fixations/saccades are externally imposed by the specification of specific times for a "freeze." Faster angular rotation during saccades than during course correction is imposed and does not emerge naturally from neural simulations.
The abstract now clarifies that what emerges spontaneously is not scannings per se (indeed, the inhibition of movement is externally imposed) but their dynamics. Note that our model captures many aspects of scanning dynamics that are not trivial and which results from the dynamical interactions and contingencies between modules (figure 3 to 7), hence justifying the word ‘emerge’ insofar as these behavioural dynamics cannot be reduced to one module or parameter. Regarding the faster angular rotation during scanning, we agree that its cause is rather straightforward to understand: it results from the added bodily constraints of forward speed to rotational movements. Nonetheless it is not ‘imposed’ during saccades in the sense that 1.) it is biologically/physically evident rather than cherry picked and 2.) it is continuously present in our model, even during forward navigation. We believe the new version of the manuscript now conveys this message in a transparent manner.
(4) Citations to previous literature are difficult to follow, and modeling results are presented as though they are experimental data
I would ask the authors to be much clearer in their description and citation of previous work. It should be clear whether the cited work was experimental or computational. To the extent possible, the actual measurement should be described succinctly. Instead of grouping references together to support a sentence with multiple claims, references should be cited for each claim. Studies of computational models should not be presented as proving a biological result.
Indeed, This we now clearly separated citations referring to experimental evidence vs. modelling. See examples citations below
For example:
(a) Lines 141-146:
"Previous studies have established many key components of insect navigation, including .... the intrinsic oscillatory dynamics in the lateral accessory lobes (LALs) that support continuous zigzagging locomotion (Clément et al., 2023; Kanzaki, 2005; Namiki and Kanzaki, 2016;
Steinbeck et al., 2020)."
The first reference is to one author's previous modeling work - it hypothesizes that oscillations in the LAL support zigzagging but includes no data that would "establish" the fact. Kanzaki et al. 2005 describes numerical modeling and simulation with a physical robot. Namiki and Kanzaki, 2016 is a review article that links the LAL to zigzagging behavior. It describes the LAL as a winner-take-all bistable network but does not describe or hypothesize that the LAL has intrinsic oscillatory dynamics. Steinbeck et al. 2020 is a more comprehensive review; it reinforces that the LAL is a winner-take-all bistable network that drives left-right steering, including during zig-zagging behavior. But in my reading, I could not find a statement that the LAL has intrinsic oscillatory dynamics (the closest is Steinbeck et al. saying the activity pattern switches regularly, as does the behavior; this doesn't imply that the LAL is intrinsically oscillatory.)
It now reads:
“Previous studies have established many key components of insect navigation, notably, how goal headings are set in the central complex (CX) (Fisher, 2022; Green and Maimon, 2018). Modelling efforts have shown that the CX circuitry can naturally accommodate innate and learnt guidance such as path integration, learn vectors, visual route following or homing as observed in ants and bees. In parallel, oscillatory dynamics in the lateral accessory lobes (LALs) - produced by reciprocal inhibition across both hemispheres and conveyed by so-called descending flip-flopping neurons - were shown to drive the spontaneous zigzags displayed by moths upon losing their pheromone plume (Kanzaki and Mishima, 1996; Mishima and Kanzaki, 1998, 1999; Wada and Kanzaki, 2005; Kanzaki et al., 2005; Iwano et al., 2010). Here also, subsequent modelling efforts have shown how these circuits can equally support the continuous lateral oscillations displayed by a wide range of insect species, including ants.”
(b) Lines 701-703:
"In plume-tracking moths, CX output has been shown to modulate LAL flip-flop neurons driving zigzagging (Adden et al., 2022)."
This reads as though an experimental measurement was made, but in fact, this is modeling work.
Yes, this could be clearer, it now reads:
“In moths, descending neurons in the LALs exhibit characteristic 'flip-flop' activity patterns that correlate with zigzagging maneuvers (Olberg, 1983; Kanzaki and Ikeda, 1994). Computational models suggest that having these LAL neurons modulated by the CX output can explain aspects of the moths’ plume-tracking behaviour (Adden et al., 2022).”
(c) Lines 703-706:
"In ants, strong goal signals in the CX - whether elicited by the path integrator or visual familiarity (Wehner et al., 2016; Wystrach et al., 2020b, 2015) do not only sharpen directional accuracy but also increase oscillation frequency (Clément et al., 2023)."
Here again, modeling results are presented as though they were experimental data.
Here, we are referring to the experimental part of these works, although this comment demonstrates that our statement should be more clear in stating what are biological results. It now reads:
“In ants, behavioural studies show that strong directional drives elicited by the path integrator or visual familiarity do not only gain behavioural weights and sharpen directional accuracy (Wehner et al., 2016; Wystrach et al. 2015, Legge et al. 2014) but also increase the ants’ oscillation frequency (Clément et al., 2023). Assuming that path integrator and visual familiarity modulate goal signals in the CX, as modelled here and elsewhere (Wystrach et al., 2020b, Stone et al., 2017) and that the intrinsic oscillator is in the LAL (Clément et al., 2023, Steinbeck et al., 2020), it suggests that CX output modulates the intrinsic oscillatory activity of the LAL”
Reviewer #2 (Public review):
Summary:
The paper by Freas and Wystrach is an interesting computational study, exploring the detailed mechanisms of how simple neural circuits could explain complex behavioral patterns observed in navigating ants. The authors compare detailed, high-speed video recordings of Australian desert ants (Melophorus bagoti) with predictions made by their new computational model and find convincing similarities between the model and the behavioral data, at a level of detail not previously studied. Particularly interesting are emerging properties of the model, yielding behavioral motifs it was not designed to reproduce, but which occur in natural ant behavior.
Strengths:
A strength of the study is that the model is based on previous models, without making major novel explicit assumptions. It combines existing models of the insect central complex with a model of the lateral accessory lobe and adds a stochastic inhibition of forward velocity to the interaction of central complex and lateral accessory lobes. The central complex provides corrective steering signals when the goal direction and the current heading of an insect are not aligned, while the lateral accessory lobes provide an intrinsic oscillator underlying the behavioral oscillations shown by walking ants at all times. These background oscillations are modulated by the steering signals from the central complex. Depending on which phase of the intrinsic oscillations coincides with the corrective signals, and how fast the ant is moving forward during this time, a complex set of behaviors emerges. Most prominently, scanning behaviors, which are regularly carried out by the ants, are recapitulated in great detail by the model. Additionally, other behaviors, such as full loops, emerge naturally from the model. While computational models are not to be seen as definite evidence for any biological reality, they can provide strong support for particular neural implementations. The current study is an excellent example in that it provides evidence for a serial arrangement of central complex circuits upstream of the lateral accessory lobe circuits, modulated by speed-regulating input. While the latter is hypothetical, it yields a clear hypothesis that can be validated by connectomics studies and functional work in the future.
The study shows that even complex behavioral motifs do not require dedicated neural modules, but can rather emerge from the interplay of already known circuits - highlighting the efficiency of insect brains and possibly providing the path towards embodied hardware solutions of such circuits in autonomous agents.
Weaknesses:
There are several weaknesses in the paper as it is.
Firstly, the model is not described in the methods, but only found when following the link to the authors' GitHub repository. This is clearly not sufficient and prevents readers from evaluating the model's assumptions directly. Most importantly, how natural do the emerging properties indeed emerge from the model? What parameters need to be tuned to generate a match between data and model?
We have now added a full description of the model in the Methods section.
These include:
Mathematical equations for model components
Complete parameter table along with justifications
Description of what is fitted vs. what emerges
Key assumptions and limitations
Regarding the emergence of scanning properties: The model has two types of parameters:
Parameters tuned to match general navigation behavior (independent of scanning):
Motor gains (g_ang, g_fwd, k): adjusted to produce realistic continuous walking paths and species differences between desert ants and Myrmecia
CX gain (g_CX = 0.5): set to produce appropriate corrective steering strength during continuous navigation
Oscillator parameters (α, β, s): are taken from Clément et al. (2023)
Parameters tuned to match scanning behavior:
CPG angular threshold (θ_CPG = 2.0): adjusted to generate realistic saccade timing Scan termination probability (p_stop = 0.5/timestep): matched to the Poisson-like distribution of scan durations in M. bagoti
Properties that emerge without specific tuning:
Fixation-saccade alternation structure (emerges from angular drive accumulation mechanism)
Directional reversals (arise from oscillator dynamics competing with CX steering)
Corrective saccade amplitude increasing with angular deviation (Figure 3)
Rare full-loop scans (emerge from CX signal shifting oscillator phase)
The behavioral continuum from straight paths → oscillations → voltes → scans (Figure 8)
We have clarified this distinction in the Methods section and emphasized that our goal was qualitative demonstration of emergence rather than quantitative parameter optimization.
Second, it is often not entirely clear what is biological data and what is a computational model. This relates to figures, text, and references. As a reader, this makes it difficult to clearly judge what is new in the current paper, how it adds to previous models, and what the predictions and assumptions are for biology.
Indeed, we have now clarified the manuscript, clearly separating when we refer to behavioural data, neurobiological data and modelling. In the figures, each panel now clearly indicates if it is model data or biological data so that any reader can immediately tell the data type.
Third, while neural data from bees and flies are taken to motivate and design the computational model, the discussion and interpretation revolve almost exclusively around ants. For the most part, this is justified, as the behavioral data used to benchmark the model are taken from ants. Nevertheless, more broadly discussing the newly defined circuit in the context of flying insects would give a better idea of the broad relevance of the neural circuits predicted by the model.
To address this suggestion we have now added two paragraphs in the discussion called: “Scanning in flying hymenopterans”.
Also happy to add more to this section if requested.
Recommendations for the authors:
Reviewer #2 (Recommendations for the authors):
As mentioned in the public review, I suggest fixing the two concerns I have regarding methods and discussion.
(1) Include a full description of the model in the methods, so that the model remains reproducible even if the GitHub repo is deleted in the future.
True, the code’s internal explanations could indeed be removed from GitHub later. The model component overview are now included in text.
(2) Include the relevance of the model for flying insects in the discussion more prominently. This seems to be an implicit assumption in the model, as neural data from bees and, more prominently, from Drosophila are used to motivate the model to explain ant data.
Add an “Expression in flying hymenopterans” section at ~line 834.
Minor points:
(1) Line 207: I suggest adding the recent review by Collett, Graham, and Heinze (2025, Current Biology), as it proposes interactions between LAL and CX as well.
Added
(2) Figure 4: I'm interested in the conversion from steps in the model to real units (ms) in the ants. In Figures 4F and G, it seems that 5 model steps represent circa 100ms. Does this allow us to define the neuronal time constants of the model neurons? If so, are the resulting values biologically plausible? This seems important when describing real-world dynamics being created by a model circuit.
No the model is time agnostic.
(3) Figure 7: Font sizes of axis labels are much too small. Also applies to other figures. Please ensure that when printed, labels can be read.
Enlarged axis labels in all figures.
(4) Line 645: proprieties -> properties?
Fixed. Thanks!
(5) Figure 7: The figure heading states: "Slow forward speed (Myrmecia) example". This sounds as if real data from ants are shown here, while these are modeling data. It is clear after reading the text and caption in detail, but I was taken off course briefly here. Please make sure that there is no possibility of being misled here.
We have altered the subtitle to “Slow forward speed (Myrmecia Model) example”.
Additionally, we have added a Model tag under each of the model image labels so classification can be done at a glance.
(6) General discussion: What about search dynamics, i.e., increasing loops when not finding the nest entrance after homing? Are those emerging from this circuit as well? Or would that need to be a separate module? There have been discussions about search emerging from the PI circuit, but as far as I know, this is not settled, and it would be good to know if the current circuit adds something useful to this aspect.
Because we kept a fixed goal heading, our model does not bring insight about overall trajectories such as search pattern. We now mention in the discussion:
“In our simulations, the CX goal representation remained fixed in both direction and strength throughout each trial. This simplification allowed us to isolate and compare the effects of different CX strengths on scanning behaviour (Figure 6). However, goal headings in the CX are likely to be updated continuously, including during scans, by novel input from visual recognition in the MB (ref). This would in turn bias saccades direction and duration. Exploring such dynamics lies beyond the scope of the present study but would represent an interesting direction for future work. Notably, our proposed CX-LAL-Body relationship could be implemented downstream of an existing path integration or visual-based model (or both) to form predictions about the occurrence and dynamic of scans along the path, as well as their impact on the emerging trajectories.”
(7) Line 690: The modulation of PFL3 by PFL2 was presented as a hypothesis in Westeinde et al., consistent with the data, but as far as I know, this is not an established fact.
You are correct. We have now softened the text, which now reads: “In Drosophila, it has been proposed that PFL2 neurons, which respond maximally when the fly faces away from the goal, modulate steering gain by converging with PFL3 neurons (which drive left or right turns) onto downstream descending neurons (Westeinde et al., 2024).”
(8) Please ensure that Drosophila is consistently spelled with a capital D and in italics.
Fixed throughout the text.
(9) Line 702: Reference Adden et al 2022: This reference is a modeling paper; it sounds as if you are referring to an experimental moth paper, though. Rephrase to clarify.
You are correct, this could be unpacked much better regarding what is modelled and what has been experimentally shown. Changed to:
Descending neurons in the LALs exhibit characteristic 'flip-flop' activity patterns that correlate with the zigzagging maneuvers of plume-tracking moths (Olberg, 1983; Kanzaki and Ikeda, 1994). Recent computational models suggest that CX output directly modulates these LAL circuits to coordinate orientation (Adden et al., 2022).
(10) Line 761: I would assume that during scans, information is acquired that would decrease uncertainty and thus, as a result change the amplitude of the CX steering signal. Maybe I missed this, but is this closed-loop interaction integrated in the model?
In our simulation the CX goal representation remains stable in direction and strength throughout the trial. This enabled us to compare neatly the effect of different CX strengths on scanning. However, we fully agree with you that goal headings in the CX might well be continuously updated, both during scans and between scans! The goal heading novel strength or direction may thus bias the scan further left, right, in front or in the back, and also up or down regulate scan duration in both directions.
Modelling this would require adding a layer of complexity to determine how the goal heading is updated, which is beyond the scope of the current work, but would form a remarkable project for the future. We now mention this in a dedicated paragraph in the discussion section “Model limitations and future directions”
(11) Line 814: Please add 'fly' in front of larva. Other insect larvae have a fully developed CX.
Corrected. Added fly to this sentence
(12) Line 815: Maybe add the recent review, Heinze 2025.
Added this one (Heinze 2024) which seems to fit the best and the 2025 Curr Biol Review doesn't quite fit this line (cited elsewhere though):
Heinze, S. (2024). Variations on an ancient theme—the central complex across insects. Current Opinion in Behavioral Sciences, 57, 101390.
(13) Methods: Subheading formatting should start with capital letters.
Ah yes, the second level of subheadings got formatted weirdly. Fixed now.
Note: This response was posted by the corresponding author to Review Commons. The content has not been altered except for formatting.
Learn more at Review Commons
The authors adapt MemPrep, a protocol they originally developed to purify organelle membranes from yeast, for use in human cell lines. To this end, they established immuno-isolation strategies based on tagged versions of the ER sheet protein SEC61β and the ER tubular protein REEP5 in HEK293T cells. Their purification strategy allowed them to generate highly pure ER sheet- and tubule-enriched fractions, which were then subjected to quantitative lipidomic and proteomic analyses.
Overall, this manuscript is well written and presents a careful interpretation of the data. It introduces MemPrep in mammalian cells as a method that will be useful for studying the membrane lipid and protein composition of organelles, with a particular focus on the ER. As such, the manuscript provides sufficient information and controls to assess the experiments in terms of reproducibility and clarity.
We thank the reviewer for a positive, thorough assessment and for raising important points that helped us to improve the manuscript.
Major comments:
- Based on the immunofluorescence images in Figure 1, it is not clear that the tagged and slightly overexpressed versions of SEC61β and REEP5 localize specifically to ER sheets and tubules, respectively, or that these proteins are enriched in these distinct ER subdomains. Perhaps reducing the fixation time, for example to a maximum of 2 minutes, or using PFA fixation, could help to better preserve ER sheet and tubular domains.
To address the localization of the bait proteins in the ER membrane network, we added new co-localization microscopy data and quantifications to the revised manuscript (new Figure 1E,F; new Supplementary Figure S1C,D). Despite its low level of overexpression (new Figure 1C; new Suppl. Fig. S1A), SEC61β localizes to the entire ER membrane network including ER tubules and the nuclear envelope (new Fig. 1E,F).
Considering the new data, we have carefully rephrased all sections regarding the subcellular localization of bait-SEC61β. In the revised manuscript, we use SEC61β as a general ER marker.
Intriguingly, quantitative proteomics of the SEC61β MemPrep isolate demonstrates a selective enrichment of ER sheet-associated proteins compared to the REEP5 MemPrep, which selectively enriches proteins associated with ER tubules (Fig. 5). While we do not claim to 'isolate' ER subdomains, we enrich ER subdomains.
We have performed additional microscopy experiments and adjusted our fixation protocol as suggested by the reviewer (Revision Fig. 1). Shortening the fixation time has no apparent impact on the ER structure, while any PFA fixation seems to largely disrupt the ER.
Does expression of tagged SEC61β or REEP5 influence the ER sheet:tubule ratio? In addition, does expression of these constructs affect the lipidome or proteome of the cells?
The reviewer raises an important point, which is experimentally not easy to address. Our imaging modality is not sufficient to make a firm statement about the sheet:tubule ratio in HEK293T cells. We are not aware of any study that firmly quantifies the relative content of sheets and tubules in HEK293T cells. Imaging the ER in HEK293T cells is challenging and most studies on the ER membrane networks use other cell types to study the impact of ER-shaping protein on the ER membrane network.
In the revised manuscript we state: 'We found no evidence that the expression of the bait constructs disrupts the tubule-to-sheet ratio or other aspects of the ER architecture, but distinguishing ER sheets and ER tubules is challenging in HEK293T cells.'
Furthermore, we have studied if the expression of the bait constructs affects the cellular proteome (new Suppl. Fig. S1A,B) and lipidome (new Suppl. Fig. S4A-H (previously Suppl. Fig. S3)). The expression of the bait constructs has no substantial impact of the cellular proteome. Most importantly, we find no evidence that proteins characteristic for ER sheets or ER tubules (other than the bait proteins) change their expression level (new Suppl. Fig. S1A,B). In the revised manuscript we state:
' We decided to go one step further and compared the proteomes of wildtype HEK293T cells with the two cell lines using TMT multiplexed, untargeted protein mass spectrometry (Suppl. Fig. S1A, B). This experiment revealed that bait proteins have only a minimal, neglectable impact on the cellular proteome (Suppl. Fig. S1A, B). We did not find evidence for a systematic deregulation of proteins known to localize exclusively to ER tubules or other ER subdomains. Furthermore, quantitative proteomics validated the results from immunoblotting (Fig. 1B, C): Expression of bait-SEC61β has barely any impact on the total cellular level of SEC61β (Suppl. Fig. S1A) while the expression of the REEP5-bait results in a 1.8-fold overabundance of REEP5 (Suppl. Fig. S1B).'
Likewise, the expression of the bait constructs has little to no effect on the cellular lipidome as shown in Suppl. Fig. S4A-J. In the revised manuscript we state:
'As a control, we also tested the impact of the bait constructs on the HEK293T whole cell lipidome (Suppl. Fig. 4A-J). Overall, the lipid composition of the virally transduced cells was indistinguishable from HEK293T cells with only minor impact on the level of CL and lysolipids (Suppl. Fig. 4A-J).'
Apart from hypotonic swelling and douncing, could the authors use alternative methods for cell disruption to exclude the possibility that mechanical stress confounds the interpretation of the data?
Thanks to the reviewer's comment, we became aware of a mistake. Our cell lysis buffer is hypertonic and not hypotonic (15% sucrose w/v, 10 mM 4-(2-hydroxyethyl)-1-piperazineethanesulfonic acid)(HEPES) pH 7.4, 300 mM NaCl, 1 mM EDTA freshly supplemented with protease inhibitor cocktail from Roche). We have corrected all relevant sections in the revised manuscript.
The reviewer is right that different means of mechanical lysis, and/or the incubation of the cells in hypo/hypertonic buffer are likely to have impact on the structure of the ER and to affect the isolation procedure. Changing such critical parameters will likely affect the purity of the preparation. Performing additional MemPrep isolations using different means of cell disruptions goes beyond the scope of this manuscript.
Upon establishing the MemPrep protocol, we have explored various mechanical cell disruptions: Different cannula, Dounce homogenizers, and a ball-bearing device. We experimented with both hypo- and hypertonic buffers. Given the costs and work associated with lipidomic and proteomic analyses, we have tried to find a suitable conditions for cell disruption without performing a full analysis each time. Therefore, we performed differential centrifugations as exemplary shown in Fig. 2B of the manuscript. Critical factors for our decision whether to further persue a certain condition was 1) the depletion of the mitochondrial TOM22 marker, 2) the enrichment of the ER markers, and 3) the total protein yield in the P100,000 fraction.
In the revised manuscript we state: 'Compared to the MemPrep procedure in yeast, we tested various means of cell disruption and optimized the differential centrifugation protocol.'
and
'Mild cell disruption by Dounce homogenization in a hypertonic buffer is crucial for cracking cells open, but these procedures can disrupt normal ER architecture and might facilitate the undesired mixing of previously well-defined ER subdomains. Despite these limitations, our data underscore the purity of our ER membrane preparations, demonstrate a differential enrichment of ER subdomains (Fig. 5), and establish the lipid composition of the ER membrane (Fig. 6)'.
What is the total amount of lipids and proteins isolated with REEP5- or SEC61β-based MemPrep? Are there differences in the total lipid:protein ratio between these isolates, and could this reflect differences in the ER sheet:tubule ratio?
In response to the reviewers' question, we have included a new Supplementary table 1 to the manuscript outlining the yield of total protein and total lipid of MemPrep.
The mammlian MemPrep protocol is not yet optimized for determining the lipid:protein ratio in the membrane. At this moment, we do not want to make a statement about the protein-to-lipid ratio in the ER or its subdomains. The isolates still contain material originating from the ER lumen.
The combined analysis of lipid and protein composition demonstrates the capacity of the method. To test that MemPrep can capture changes in ER membrane architecture, it would be useful to compare ER protein and lipid composition across different cellular states, such as stressed versus unstressed cells, or growing versus resting cells.
We agree with the reviewer that a comparison of the ER under different conditions would be extremely interesting. Currently, we see it beyond the scope of this study.
Minor comment:
- In line 335, the authors state: "To address this possibility, we performed a new round of REEP5 and SEC61β MemPreps for a direct comparison of the isolates (Fig. 5A, B)." It is unclear whether the MemPrep protocol was altered or whether this refers simply to an additional round of purification. Please clarify.
Thank you. This point was also raised by reviewer 2 and 3. We have clarified our statements. In the revised manuscript we state:
'Hence, we performed a new round of REEP5 and SEC61β MemPreps in triplicates for a direct comparison of the isolates (Fig. 5A, B) rather than comparing the changes in abundance relative to the respective cell lysates as performed in Figure 3. Knowing that non-ER proteins are less efficiently enriched by the MemPrep procedure than ER proteins (Fig. 3C, D) and that the sensitivity and comprehensiveness of mass spectrometry-based proteomics experiments are reduced with increasing sample complexity (Ting et al, 2011; Beck et al, 2011) , we were hoping to gain a better insight into the distribution of low abundant and challenging to quantify proteins in the two MemPrep isolates'.
Reviewer #1 (Significance (Required)):
General assessment:
The manuscript establishes MemPrep for mammalian cells as an important discovery tool to investigate how cells coordinate membrane lipid composition with membrane protein composition, and vice versa. This is a rapidly growing research field, which attracts a lot of interest.
MemPrep is based on an immuno-isolation strategy using tagged versions of the ER sheet protein SEC61β and the ER tubular protein REEP5 in HEK293T cells. The purification strategy allowed to generate highly pure ER sheet- and tubule-enriched fractions, which were then subjected to quantitative lipidomic and proteomic analyses.
The results show that the protein composition differs between the SEC61β- and REEP5-enriched fractions. Yet the lipid composition of ER sheets and tubules is largely indistinguishable. Both fractions are dominated by PC alongside other monounsaturated GPL, and hydroxylated ceramides. These physicochemical properties of the ER lipid bilayer are matched by ER-resident membrane proteins.
Thorough bioinformatic analysis of a subset of ER membrane proteins further revealed that their transmembrane domains have reduced hydrophobicity and increased polarity compared with those of plasma membrane proteins, matching the ER lipidome.
Hence the combined analysis of lipid and protein composition demonstrates the capacity of the method. Many variations of this approach will be possible in the future to understand on the molecular level how cells assemble and control their membranes.
Advance: Other immuno-isolation methods, or "organelle immunoprecipitation" approaches, have been established for lysosomes, the Golgi apparatus, and other organelles.
MemPrep is an important and complementary addition to the technical toolbox for organelle isolation, with a particular focus on the analysis of membrane lipid and protein content.
Audience: The manuscript will be of broad interest to researchers in basic biology as well as clinical and translational research.
Reviewer's field of expertise:
Molecular membrane biology.
__Reviewer #2 __
Jain and colleagues develop a biochemical fractionation procedure in which ER microsomes are enriched through small epitope tags. The manuscript is pitched around the concept that there are ER sheets and tubules and ER proteins differentially localise to them. The authors use REEP5 as a 'tubule' bait and SEC61beta as a 'sheet' bait. These baits are immuoisolated after a sensible membrane fractionation and ER membraned purified. There is a convincing ER proteome as a result, and this is used to compare the TMD properties of the organelles resident membrane proteins. The authors make the interesting observation that the transmembrane domains are more polar in the ER. They then compare the two sheet and tubule preparations and see a different in the proteome, before comparing the lipidome. There is no difference observed between the lipidome of the sheet and tubule preps, however they see a difference in the whole cell lysate and use that to compare the ER lipidome against the whole cell.
Overall the manuscript has an interesting premise and the data is well presented, the experiments well performed and the interpretations appropriate. I think there are some issues with the mechanistic insight and novelty, and essentially although the premise is with regards to sheets and tubules there is limited progress in that direction in terms of results. I am reluctant to be to critical overall as there are certainly interesting observations that may be insightful for future studies in the field. I have some more specific comments below:
We thank the reviewer for a thorough, constructive assessment and for highlighting important points that helped us improve the manuscript.
1) The authors cite nixon-abell, but they do not mention the major point of that manuscript which is that the 'sheets' in the cellular periphery are instead dense tubular networks. I think this is quite an omission for the introduction, as it points to the premise not being as clear as stated.
In the revised manuscript we refer to the Nixon-Abell study and two additional studies from the Jokitalo lab. Notably, the Nixon-Abell study does not rule out the existence of ER sheets.
In the revised manuscript we state: ' [...] dense tubular networks in the cell periphery can appear like ER sheets in diffraction-limited microscopy (Nixon-Abell et al, 2016). Furthermore, the edges of ER sheets are populated by curvature-stabilizing proteins also found in ER tubules (Shibata et al, 2010; Shemesh et al, 2014), and ER sheets show different degrees of fenestration dependent on the cell type and the cell cycle phase (Puhka et al, 2007, 2012; Nixon-Abell et al, 2016). Consistent with our microscopic data (Fig. 1E, F) and because ER sheets may be biochemically inseparable from ER tubules, we use SEC61β as a general ER marker.'
We performed additional co-localization studies of the bait proteins with RTN4 and CLIMP63 (new Fig. 1E,F) suggesting that SEC61B can localize across many ER subdomains including ER tubules and the nuclear envelope.
We have carefully revised our manuscript accordingly and shifting the focus of our discussion away from a molecular description of discrete ER subdomains.
2) The first section when the protocol is discussed essentially relies on looking at other papers to understand. As the manuscript is centrally about this protocol, I think a brief but clear description is more appropriate.
We agree with the reviewer. We added a short section to the results section providing an overview over the MemPrep procedure. We now state:
'To this end, we adapted the MemPrep procedure originally developed for the isolation of organelle membranes from Saccaromyces cerevisiae (S. cerevisiae) (Reinhard et al, 2023, 2024). Mammalian MemPrep relies on a gentle, detergent-free, mechanical lysis of the cells in a hypertonic buffer followed by differential centrifugation to separate ER-derived microsomes from mitochondria-derived membranes. Next, larger organelle fragments are disrupted by brief pulses of sonication, and the resulting vesicles are subjected to affinity purification using magnetic dynabead-coupled antibodies directed against the cleavable tag of the bait protein. Specifically bound, ER-derived membrane vesicles are washed with harsh, urea-containing buffers and selectively released by proteolytically cleaving the bait tag.'
3) In figure 1C the two markers are supposed to localise to sheets and tubules differentially. To me they look very similar. This, of course, is a major concern. Have the authors co-expressed them (at the same levels in these lines) and seen that indeed they do differentially localise?
The reviewer raises an important point regarding the localzation of the bait proteins. While we have not co-expressed the bait proteins in cells, we have performed additional co-localization experiments with RTN4 and CLIMP63 as markers for ER tubules and ER sheets, respectively (new Figure 1E,F; new Suppl. Fig. S1C,D). The implications of these data are discussed in the manuscript.
In light of these new data, we do not refer to SEC61β as an ER sheet marker any longer, instead we refer to SEC61β as a general ER marker. We carefully revised our discussion of the data throughout the manuscript along the line suggested by the reviewer in point 8.
4) I found the TMD polarity section very interesting, but it was not clear to me why they needed their proteomics for this? Could this not be done with annotated ER membrane proteins?
The reviewer is correct. The same type of analysis could have been performed with an even bigger dataset of all ER annotated proteins. One of the co-authors, Joseph Lorent, has performed such analysis at this larger scale (PMID: 40326394). The study by Lorent et al. addressed TMH length and side chain bulkiness (PMID: 40326394) in the ER, Golgi apparatus, and the PM. This work is referenced in the manuscript.
We focused our analysis on the smaller dataset of 83 single-pass proteins found in our proteomics experiments, because we initially planned to perform a comparative analysis of ER proteins in either of the two isolates.
In line of the reviewers' suggestion, we validate our new finding on the TMH hydrophobicity in the ER using a larger dataset covering all single pass TMHs of ER proteins (215 instead of 83), Golgi apparatus proteins (260), and plasma membrane proteins (1322) (Suppl. Fig. S3D).
5) It was not clear to me based on the results section text the difference between the figure 5 proteomics and the previous runs.
This point was also raised by reviewer 1 and 3. We clarified our statement in the revised manuscript:
'Hence, we performed a new round of REEP5 and SEC61β MemPreps in triplicates for a direct comparison of the isolates (Fig. 5A, B) rather than comparing the changes in abundance relative to the respective cell lysates as performed in Figure 3. Knowing that non-ER proteins are less efficiently enriched by the MemPrep procedure than ER proteins (Fig. 3C, D) and that the sensitivity and comprehensiveness of mass spectrometry-based proteomics experiments are reduced with increasing sample complexity (Ting et al, 2011; Beck et al, 2011) , we were hoping to gain a better insight into the distribution of low abundant and challenging to quantify proteins in the two MemPrep isolates.'
6) Again in figure 5- are the authors sure that the difference was not due to the over-expression (albeit mild) of their protein.
After performing an important control experiment, we are sure that the mild over-expression of the bait proteins has no impact.
We have compared HEK293T WT cells with the bait protein expressing cell lines by quantitative proteomics (new Suppl. Fig. S1A,B). The bait proteins have no impact of the cellular proteome and do not affect the abundance of proteins known to be enriched in ER sheets or ER tubules. Hence, the enrichment of these proteins in our MemPrep isolates as shown in Fig. 5 suggests that some of the identity of ER sheets and ER tubules is maintained in our preparations even though they are not resolved by our microscopy experiments (Fig. 1). In the revised manuscript, we carefully discuss the implications of these findings.
7) There were no differences in the ER lipidome between the two baits. This may be because there is no difference between the lipid profile of sheets and tubules, but it is very hard to conclude that.
The reviewer has a point. Even though our findings suggest that we can differentially enrich for ER subdomains (the proteomics data in Fig. 5 on MemPrep isolates can be regarded as a golded standard for this statement), we do not have any knowledge about their biochemical purity. Hence, we have carefully toned down our statements on the basis of new imaging data (Fig. 1E,F; Suppl. Fig. S1C,D) and new proteomics data (Suppl. Fig. S1A,B).
Along the reasoning of the reviewer, we also rephrased our statements on the difference/similarity of ER subdomains.
8) I do not see it as my job as a reviewer to propose reorganisations and rewrites, so I encourage the authors to feel free to ignore this comment. To me the lipidome and TMD polar observations are the key manuscript findings, and there is very limited insight into the tubules and sheets line of inquiry. I wonder if it would be worth changing the focus of the manuscript overall to rather be about the ER, and not the tubules and sheets.
Again, the reviewer raises an important point that we did not want 'to ignore'. We have carefully revised the manuscript and toned down our interpretations. In the revised manuscript we put more emphasis on the ER lipidome and less so on the composition of specific ER subdomains.
__Reviewer #2 (Significance (Required)): __
Overall the manuscript has an interesting premise and the data is well presented, the experiments well performed and the interpretations appropriate. I think there are some issues with the mechanistic insight and novelty, and essentially although the premise is with regards to sheets and tubules there is limited progress in that direction in terms of results. I am reluctant to be to critical overall as there are certainly interesting observations that may be insightful for future studies in the field.
Reviewer #3
Summary: Jain et al., provide a clear and thorough manuscript that extends their prior biochemical analysis of the yeast ER-lipidome (MEMPREP) to mammalian cells. They use detergent free lysis and differential speed centrifugation from 293T cells bearing reporters with affinity handles targeted to sheet-like or tubular-like subdomains of the ER and enrich membranes and membrane-embedded proteins from these sites. The lipidomics reveals a distinct ER-lipidome, heavily enriched in PC and PI, contains predominantly mono-unsaturated phospholipids and is surprisingly invariant across sheet-like and tubule-like domains. Additional hydrophobicity analysis suggests that ER-localised TMDs are more polar and shorter than PM-resident TMDs, and the authors speculate about co-evolution of the lipidome and proteome to ensure targeting.
Major comments:
I think the data are solid, clear and convincing. The similarity of the lipidomes from sheet and tubule regions of the ER give good indication of the robustness of the technique. Whilst the yield is low, the authors go to good lengths to demonstrate purity of ER capture and de-enrichment of other cellular membranes. There is good discussion of the limitations of the technique and good comparison to recent data from other labs, most notably, a recent preprint and I think the manuscripts support eachother well. There's a fair amount of speculation in the manuscript, e.g., about lipid headgroup charge density being inferred by the charge distribution on the -1 position, but the speculation is clearly acknowledged.
I think that blotting for SEC61B would really help. A clear comparison to endogenous SEC61B would be helpful. I appreciate that the authors lacked an antibody here, but there are several on CiteAb that seem to detect endogenous protein.
Following the reviewers' advice, we added new data using a commercial antibody directed against SEC61β (new Fig. 1C). We also added proteomics data comparing HEK293T WT cells with the bait expressing cell lines (new Suppl. Fig. S1A,B).
We also characterized the commercial Proteintech (15087-1-AP) antibody to make sure it recognizes the same epitopes in the tagged and untagged variant of SEC61β.
It's not brilliantly easy to see the 'sharp decline' in relative frequency of hydrophobic amino acids at 21 aa for ER and Golgi; whilst the individual amino acid information is interesting (and some comment could be made about the favouring of Leucines in ER and Golgi TMDs), would this be clearer if the relative frequencies were binned into hydrophobic/aromatic, polar, positive, negative?
The reviewer is right. We have removed our statement regarding a 'sharp decline'. In fact, the decline is rather gradual for ER and Golgi TMHs, but more clear for PM TMHs. This is also reflected in the data shown in Suppl. Fig. S3D and discussed in the revised manuscript.
We state: Confirming our expectations based on the predicted TMH length (Suppl. Fig. S3A), we observed a gradual decline in the relative frequency of hydrophobic and aromatic resides at about 21 amino acids for ER (Fig. 4E) and Golgi-associated TMHs (Fig. 4F). Such decline was more clearly defined for plasma membrane TMHs but only after 24 aa or more (Fig. 4G).'
We also state: 'We therefore challenged our finding and performed an additional analysis using this larger dataset of all annotated human single-pass TMHs (Fig. S3D) and compared the hydrophobicity profiles of TMHs from the ER (215), the Golgi apparatus (260), and the PM (1322) (Lorent et al, 2025). This analysis further substantiated our finding that the ER and the Golgi apparatus host less hydrophobic TMHs compared to the plasma membrane. Furthermore, we observed that the ER and Golgi profiles display a conical shape with hydrophobic maxima at the center of the membrane's hydrophobic core, while the PM TMH's possess higher hydrophobicity in the cytoplasmic part of the membrane, compared to the exoplasmic part (Fig. S3D).'
We decided to keep the Fig. 4 with its single amino acid 'resolution' was it was in the original manuscript, because we feel that this representation still has its value. It helps connecting physicochemical parameters of an average TMH in an organelle (Fig. 4A-D; Suppl. Fig. S3A-D) with the preferred amino acid composition and distribution (Fig. 4E-G). Nevertheless, some 'noise' in inherent to the data and we hope that the adaptations to the text avoids any possible confusion of the reader.
The frequency of leucine residues in TMHs from the PM (24.5%) is comparable to the frequency of TMHs from the ER (24.1%) and from the Golgi apparatus (26.3%). Our attempts to identify an organelle-selective usage of certain amino acids did not yield robust and significant results.
Related to this point, it's hard to correlate the degree of polar amino acid incorporation in the TMDs of Golgi, ER, PM proteins (which don't appear to vary in 4E, 4F and 4G) with the variance described in 4C. Is there a better way of displaying this data, or are the polarity measurements calculated by some other metric in 4C?
The reviewer is right. Figure 4A-D and Figure 4E-G are based on different metrics. Figure 4A-D considers different physicochemical parameters of the amino acid sidechains (Fig. 4C: Kyte-Dolittle scale). Figure 4E-G only represents the relative frequencies. We believe that both representations can be useful.
Notably, the relative incorporation of polar and apolar amino acids is significantly different between TMHs from the ER and the Golgi versus the TMHs from the PM (Suppl. Fig. S3B,C).
In the revised manuscript we state: 'Our new finding that the TMHs of ER proteins are more polar than the TMHs in the plasma membrane (Fig. 4C) is also reflected by the significantly different number of apolar and polar residues in the TMHs from ER-, Golgi apparatus-, and PM-derived proteins (Suppl. S3B, C)'.
Indeed, the polarity in Fig. 4A and Fig. 4C is calculated via the Kyte-Dolittle scale, while only the normalized frequency of the amino acid is color-coded in Fig. 4E-G.
Minor comments:
Panel 2D isn't labelled on the figure
We represented both MemPreps in a single Panel 2C because we aimed to label in the immunoblots only a single time to avoid redundancies. We are open to change our strategy of panel labeling if our current representation is confusing.
There is limited co-enrichment of non-ER proteins in the ER-affinity preps, and the authors have done well to deal with misannotated GO terms. It might be worthwhile adding to the discussion that all TMD proteins that localise at steady-state to post-ER compartments must necessarily pass through the ER during biosynthesis. As such, detection of non-ER proteins in ER fractions is not inherently unexpected.
This is of course correct. In the revised manuscript we state: 'Finding non-ER proteins in an ER proteome is not surprising, because a very large number of proteins are first delivered to the ER, before they are sent to other cellular destinations.'
I didn't understand the line on L377 about the new round of extraction featureing inherently less complex proteomes.
This point was also raised by reviewer 1 and 2. We clarified our statement in the revised manuscript:
'Hence, we performed a new round of REEP5 and SEC61β MemPreps in triplicates for a direct comparison of the isolates (Fig. 5A, B) rather than comparing the changes in abundance relative to the respective cell lysates as performed in Figure 3. Knowing that non-ER proteins are less efficiently enriched by the MemPrep procedure than ER proteins (Fig. 3C, D) and that the sensitivity and comprehensiveness of mass spectrometry-based proteomics experiments are reduced with increasing sample complexity (Ting et al, 2011; Beck et al, 2011) , we were hoping to gain a better insight into the distribution of low abundant and challenging to quantify proteins in the two MemPrep isolates.'
For line L390-391, in the speculation about progressively more unsaturation as you move ER-Golgi-postGolgi, is there any (published) data from ER-FLIPPR that could inform about the degree of membrane fluidity/packing as you traverse the secretory pathway?
We agree that mentioning evidence on the biophysical changes along the secretory pathway is helpful in this section. In the revised manuscript we state:
'These changes of the lipid acyl chains are associated with biophysical changes of the membrane properties along the secretory pathway as observed by molecular probes reporting on lipid packing and membrane tension (Goujon et al, 2019; López-Andarias et al, 2021, 2022; Wong & Budin, 2024).'
Reviewer #3 (Significance (Required)):
The strengths of the study are the conceptual novelty and information provided - I think this is the first comprehensive reporting of the ER lipidome. This is a major organelle and I think as the lipid biology field develops, resources like this are really important. Moreover, the MEMPREP protocol is applicable for protein extraction from these domains, which will help with functional characterisation of ER subdomains and is a strong technical advance.
Weaknesses relate to the single cell type and overexpression (albeit mild) methodologies. I'm not hugely fussed about this as this manuscript describes an important 1st step.
I'm a cell biologist studying the ER
Note: This response was posted by the corresponding author to Review Commons. The content has not been altered except for formatting.
Learn more at Review Commons
Reviewer #1
Evidence, reproducibility and clarity
This paper addresses a very interesting problem of non-centrosomal microtubule organization in developing Drosophila oocytes. Using genetics and imaging experiments, the authors reveal an interplay between the activity of kinesin-1, together with its essential cofactor Ensconsin, and microtubule organization at the cell cortex by the spectraplakin Shot, minus-end binding protein Patronin and Ninein, a protein implicated in microtubule minus end anchoring. The authors demonstrate that the loss of Ensconsin affects the cortical accumulation non-centrosomal microtubule organizing center (ncMTOC) proteins, microtubule length and vesicle motility in the oocyte, and show that this phenotype can be rescued by constitutively active kinesin-1 mutant, but not by Ensconsin mutants deficient in microtubule or kinesin binding. The functional connection between Ensconsin, kinesin-1 and ncMTOCs is further supported by a rescue experiment with Shot overexpression. Genetics and imaging experiments further implicate Ninein in the same pathway. These data are a clear strength of the paper; they represent a very interesting and useful addition to the field.
The weaknesses of the study are two-fold. First, the paper seems to lack a clear molecular model, uniting the observed phenomenology with the molecular functions of the studied proteins. Most importantly, it is not clear how kinesin-based plus-end directed transport contributes to cortical localization of ncMTOCs and regulation of microtubule length.
Second, not all conclusions and interpretations in the paper are supported by the presented data.
We thank the reviewer for recognizing the impact of this work. In response to the insightful suggestions, we performed extensive new experiments that establish a well-supported cellular and molecular model (Figure 7). The discussion has been restructured to directly link each conclusion to its corresponding experimental evidence, significantly strengthening the manuscript.
Below is a list of specific comments, outlining the concerns, in the order of appearance in the paper/figures.
Figure 1. The statement: "Ens loading on MTs in NCs and their subsequent transport by Dynein toward ring canals promotes the spatial enrichment of the Khc activator Ens in the oocyte" is not supported by data. The authors do not demonstrate that Ens is actually transported from the nurse cells to the oocyte while being attached to microtubules. They do show that the intensity of Ensconsin correlates with the intensity of microtubules, that the distribution of Ensconsin depends on its affinity to microtubules and that an Ensconsin pool locally photoactivated in a nurse cell can redistribute to the oocyte (and throughout the nurse cell) by what seems to be diffusion. The provided images suggest that Ensconsin passively diffuses into the oocyte and accumulates there because of higher microtubule density, which depends on dynein. To prove that Ensconsin is indeed transported by dynein in the microtubule-bound form, one would need to measure the residence time of Ensconsin on microtubules and demonstrate that it is longer than the time needed to transport microtubules by dynein into the oocyte; ideally, one would like to see movement of individual microtubules labelled with photoconverted Ensconsin from a nurse cell into the oocyte. Since microtubules are not enriched in the oocyte of the dynein mutant, analysis of Ensconsin intensity in this mutant is not informative and does not reveal the mechanism of Ensconsin accumulation.
As noted by Reviewer 3, the directional movement of microtubules traveling at ~140 nm/s from nurse cells toward the oocyte through Ring Canals was previously reported using a tagged Ens-MT binding domain reporter line by Lu et al. (2022). We have therefore added the citation of this crucial work in the novel version of the manuscript (lane 155-157) and removed the photo-conversion panel.
Critically, however, our study provides mechanistic insight that was missing from this earlier work: this mechanism is also crucial to enrich MAPs in the oocyte. The fact that Dynein mutants fail to enrich Ensconsin is a crucial piece of evidence: it supports a model of Ensconsin-loaded MT transport (Figure 1D-1F).
Figure 2. According to the abstract, this figure shows that Ensconsin is "maintained at the oocyte cortex by Ninein". However, the figure doesn't seem to prove it - it shows that oocyte enrichment of Ensonsin is partially dependent on Ninein, but this applies to the whole cell and not just to the cell cortex. Furthermore, it is not clear whether Ninein mutation affects microtubule density, which in turn would affect Ensconsin enrichment, and therefore, it is not clear whether the effect of Ninein loss on Ensconsin distribution is direct or indirect.
Ninein plays a critical role in Ensconsin enrichment and microtubule organization in the oocyte (new Figure 2, Figure 3, Figure S3). Quantification of total Tubulin signal shows no difference between control and Nin mutant oocytes (new Figure S3 panels A, B). We found decreased Ens enrichment in the oocyte, and Ens localization on MTs and to the cell cortex (Figure 2E, 2F, and Figure S3C and S3D).
Novel quantitative analyses of microtubule orientation at the anterior cortex, where MTs are normally preferentially oriented toward the posterior pole (Parton et al. 2011), demonstrate that Nin mutants exhibit randomized MT orientation compared to wild-type oocytes (new Figure 3C-3E).These findings establish that Ninein (although not essential) favors Ensconsin localization on MTs, Ens enrichment in the oocyte, ncMTOC cortical localization, and more robust MT orientation toward the posterior cortex. It also suggests that Ens levels in the oocyte acts as a rheostat to control Khc activation.
The observation that the aggregates formed by overexpressed Ninein accumulate other proteins, including Ensconsin, supports, though does not prove their interactions. Furthermore, there is absolutely no proof that Ninein aggregates are "ncMTOCs". Unless the authors demonstrate that these aggregates nucleate or anchor microtubules (for example, by detailed imaging of microtubules and EB1 comets), the text and labels in the figure would need to be altered.
We have modified the manuscript, we now refer to an accumulation of these components in large puncta, rather than aggregates, consistent with previous observations (Rosen et al., 2000). We acknowledge in the revised version that these puncta recruit Shot, Patronin and Ens without mentioning direct interaction (lane 218).
Importantly, we conducted a more detailed characterization of these Ninein/Shot/Patronin/Ens-containing puncta in a novel Figure S4. To rigorously assess their nucleation capacity, we analyzed Eb1-GFP-labeled MT comets, a robust readout of MT nucleation (Parton et al., 2011, Nashchekin et al., 2016). While few Eb1-positive comets occasionally emanate from these structures, confirming their identity as putative ncMTOCs, these puncta function as surprisingly weak nucleation centers (new Figure S4 E, Video S1) and, their presence does not alter overall MT architecture (new Figure S4 F). Moreover, these puncta disappear over time, are barely visible at stage 10B, they do not impair oocyte development or fertility (Figure S4 G and Table 1).
Minor comment: Note that a "ratio" (Figure 2C) is just a ratio, and should not be expressed in arbitrary units.
We have amended this point in all the figures.
Figure 3B: immunoprecipitation results cannot be interpreted because the immunoprecipitated proteins (GFP, Ens-GFP, Shot-YFP) are not shown. It is also not clear that this biochemical experiment is useful. If the authors would like to suggest that Ensconsin directly binds to Patronin, the interaction would need to be properly mapped at the protein domain level.
This is a good point: the GFP and Ens-GFP immunoprecipitated proteins are now much clearly identified on the blots and in the figure legend (new Figure 4G). Shot-YFP IP, was used as a positive control but is difficult to be detected by Western blot due to its large size (>106 Da) using conventional acrylamide gels (Nashchekin et al., 2016).
We now explicitly state that immunoprecipitations were performed at 4{degree sign}C, where microtubules are fully depolymerized, thereby excluding undirect microtubule-mediated interactions. We agree with this reviewer: we cannot formally rule out interactions through bridging by other protein components. This is stated in the revised manuscript (lane 238-239).
One of the major phenotypes observed by the authors in Ens mutant is the loss of long microtubules. The authors make strong conclusions about the independence of this phenotype from the parameters of microtubule plus-end growth, but in fact, the quality of their data does not allow to make such a conclusion, because they only measured the number of EB1 comets and their growth rate but not the catastrophe, rescue or pausing frequency."Note that kinesin-1 has been implicated in promoting microtubule damage and rescue (doi: 10.1016/j.devcel.2021).In the absence of such measurements, one cannot conclude whether short microtubules arise through defects in the minus-end, plus-end or microtubule shaft regulation pathways.
We thank the reviewer for raising this important point. Our data demonstrate that microtubule (MT) nucleation and polymerization rates remain unaffected under Khc RNAi and ens mutant conditions, indicating that MT dynamics alterations must arise through alternative mechanisms.
As the reviewer suggested, recent studies on Kinesin activity and MT network regulation are indeed highly relevant. Two key studies from the Verhey and Aumeier laboratories examined Kinesin-1 gain-of-function conditions and revealed that constitutively active Kinesin-1 induces MT lattice damage (Budaitis et al., 2022). While damaged MTs can undergo self-repair, Aumeier and colleagues demonstrated that GTP-tubulin incorporation generates "rescue shafts" that promote MT rescue events (Andreu-Carbo et al., 2022). Extrapolating from these findings, loss of Kinesin-1 activity could plausibly reduce rescue shaft formation, thereby decreasing MT rescue frequency and stability. Although this hypothesis is challenging to test directly in our system, it provides a mechanistic framework for the observed reduction in MT number and stability.
Additionally, the reviewer highlighted the role of Khc in transporting the dynactin complex, an anti-catastrophe factor, to MT plus ends (Nieuwburg et al., 2017), which could further contribute to MT stabilization. This crucial reference is now incorporated into the revised Discussion.
Importantly, our work also demonstrates the contribution of Ens/Khc to ncMTOC targeting to the cell cortex. Our new quantitative analyses of MT organization (new Figure 5 B) reveal a defective anteroposterior orientation of cortical MTs in mutant conditions, pointing to a critical role for cortical ncMTOCs in organizing the MT network.
Taken together, we propose that the observed MT reduction and disorganization result from multiple interconnected mechanisms: (1) reduced rescue shaft formation affecting MT stability; (2) impaired transport of anti-catastrophe factors to MT plus ends; and (3) loss of cortical ncMTOCs, which are essential for minus-end MT stabilization and network organization. The Discussion has been revised to reflect this integrated model in a dedicated paragraph ("A possible regulation of MT dynamics in the oocyte at both plus end minus MT ends by Ens and Khc" lane 415-432).
It is important to note in that a spectraplakin, like Shot, can potentially affect different pathways, particularly when overexpressed.
We agree that Shot harbors multiple functional domains and acts as a key organizer of both actin and microtubule cytoskeletons. Overexpression of such a cytoskeletal cross-linker could indeed perturb both networks, making interpretation of Ens phenotype rescue challenging due to potential indirect effects.
To address this concern, we selected an appropriate Shot isoform for our rescue experiments that displayed similar localization to "endogenous" Shot-YFP (a genomic construct harboring shot regulatory sequences) and importantly that was not overexpressed.
Elevated expression of the Shot.L(A) isoform (see Western Blot Figure S8 A), considered as the wild-type form with two CH1 and CH2 actin-binding motifs (Lee and Kolodziej, 2002), showed abnormal localization such as strong binding to the microtubules in nurse cells and oocyte confirming the risk of gain-of-function artifacts and inappropriate conclusions (Figure S8 B, arrows).
By contrast, our rescue experiments using the Shot.L(C) isoform (that only harbors the CH2 motif) provide strong evidence against such artifacts for three reasons. First, Shot-L(C) is expressed at slightly lower levels than a Shot-YFP genomic construct (not overexpressed), and at much lower levels than Shot-L(A), despite using the same driver (Figure S8 A). Second, Shot-L(C) localization in the oocyte is similar to that of endogenous Shot-YFP, concentrating at the cell cortex (Figure S8 B, compare lower and top panels). Taken together, these controls rather suggest our rescue with the Shot-L(C) is specific.
Note that this Shot-L(C) isoform is sufficient to complement the absence of the shot gene in other cell contexts (Lee and Kolodziej, 2002).
Unjustified conclusions should be removed: the authors do not provide sufficient data to conclude that "ens and Khc oocytes MT organizational defects are caused by decreased ncMTOC cortical anchoring", because the actual cortical microtubule anchoring was not measured.
This is a valid point. We acknowledge that we did not directly measure microtubule anchoring in this study. In response, we have revised the discussion to more accurately reflect our observations. Throughout the manuscript, we now refer to "cortical microtubule organization" rather than "cortical microtubule anchoring," which better aligns with the data presented.
Minor comment: Microtubule growth velocity must be expressed in units of length per time, to enable evaluating the quality of the data, and not as a normalized value.
This is now amended in the revised version (modified Figure S7).
A significant part of the Discussion is dedicated to the potential role of Ensconsin in cortical microtubule anchoring and potential transport of ncMTOCs by kinesin. It is obviously fine that the authors discuss different theories, but it would be very helpful if the authors would first state what has been directly measured and established by their data, and what are the putative, currently speculative explanations of these data.
We have carefully considered the reviewer's constructive comments and are confident that this revised version fully addresses their concerns.
First, we have substantially strengthened the connection between the Results and Discussion sections, ensuring that our interpretations are more directly anchored in the experimental data. This restructuring significantly improves the overall clarity and logical flow of the manuscript.
Second, we have added a new comprehensive figure presenting a molecular-scale model of Kinesin-1 activation upon release of autoinhibition by Ensconsin (new Figure 7D). Critically, this figure also illustrates our proposed positive feedback loop mechanism: Khc-dependent cytoplasmic advection promotes cortical recruitment of additional ncMTOCs, which generates new cortical microtubules and further accelerates cytoplasmic transport (Figure 7 A-C). This self-amplifying cycle provides a mechanistic framework consistent with emerging evidence that cytoplasmic flows are essential for efficient intracellular transport in both insect and mammalian oocytes.
Minor comment: The writing and particularly the grammar need to be significantly improved throughout, which should be very easy with current language tools. Examples: "ncMTOCs recruitment" should be "ncMTOC recruitment"; "Vesicles speed" should be "Vesicle speed", "Nin oocytes harbored a WT growth,"- unclear what this means, etc. Many paragraphs are very long and difficult to read. Making shorter paragraphs would make the authors' line of thought more accessible to the reader.
We have amended and shortened the manuscript according to this reviewer feed-back. We have specifically built more focused paragraphs to facilitates the reading.
Significance
This paper represents significant advance in understanding non-centrosomal microtubule organization in general and in developing Drosophila oocytes in particular by connecting the microtubule minus-end regulation pathway to the Kinesin-1 and Ensconsin/MAP7-dependent transport. The genetics and imaging data are of good quality, are appropriately presented and quantified. These are clear strengths of the study which will make it interesting to researchers studying the cytoskeleton, microtubule-associated proteins and motors, and fly development.
The weaknesses of this study are due to the lack of clarity of the overall molecular model, which would limit the impact of the study on the field. Some interpretations are not sufficiently supported by data, but this can be solved by more precise and careful writing, without extensive additional experimentation.
We thank the reviewer for raising these important concerns regarding clarity and data interpretation. We have thoroughly revised the manuscript to address these issues on multiple fronts. First, we have substantially rewritten key sections to ensure that our conclusions are clearly articulated and directly supported by the data. Second, we have performed several new experiments that now allow us to propose a robust mechanistic model, presented in new figures. These additions significantly strengthen the manuscript and directly address the reviewer's concerns.
My expertise is cell biology and biochemistry of the microtubule cytoskeleton, including both microtubule-associated proteins and microtubule motors.
Reviewer #2
Evidence, reproducibility and clarity
In this manuscript, Berisha et al. investigate how microtubule (MT) organization is spatially regulated during Drosophila oogenesis. The authors identify a mechanism in which the Kinesin-1 activator Ensconsin/MAP7 is transported by dynein and anchored at the oocyte cortex via Ninein, enabling localized activation of Kinesin-1. Disruption of this pathway impairs ncMTOC recruitment and MT anchoring at the cortex. The authors combine genetic manipulation with high-resolution microscopy and use three key readouts to assess MT organization during mid-to-late oogenesis: cortical MT formation, localization of posterior determinants, and ooplasmic streaming. Notably, Kinesin-1, in concert with its activator Ens/MAP7, contributes to organizing the microtubule network it travels along. Overall, the study presents interesting findings, though we have several concerns we would like the authors to address. Ensconsin enrichment in the oocyte 1. Enrichment in the oocyte • Ensconsin is a MAP that binds MTs. Given that microtubule density in the oocyte significantly exceeds that in the nurse cells, its enrichment may passively reflect this difference. To assess whether the enrichment is specific, could the authors express a non-Drosophila MAP (e.g., mammalian MAP1B) to determine whether it also preferentially localizes to the oocyte?
To address this point, we performed a new series of experiments analyzing the enrichment of other Drosophila and non-Drosophila MAPs, including Jupiter-GFP, Eb1-GFP, and bovine Tau-GFP, all widely used markers of the microtubule cytoskeleton in flies (see new Figure S2). Our results reveal that Jupiter-GFP, Eb1-GFP, and bovine Tau-GFP all exhibit significantly weaker enrichment in the oocyte compared to Ens-GFP. Khc-GFP also shows lower enrichment. These findings indicate that MAP enrichment in the oocyte is MAP-dependent, rather than solely reflecting microtubule density or organization. Of note, we cannot exclude that microtubule post-translational modifications contribute to differential MAP binding between nurse cells and the oocyte, but this remains a question for future investigation.
The ability of ens-wt and ens-LowMT to induce tubulin polymerization according to the light scattering data (Fig. S1J) is minimal and does not reflect dramatic differences in localization. The authors should verify that, in all cases, the polymerization product in their in vitro assays is microtubules rather than other light-scattering aggregates. What is the control in these experiments? If it is just purified tubulin, it should not form polymers at physiological concentrations.
The critical concentration Cr for microtubule self-assembly in classical BRB80 buffer found by us and others is around 20 µM (see Fig. 2c in Weiss et al., 2010). Here, microtubules were assembled at 40 µM tubulin concentration, i.e., largely above the Cr. As stated in the materials and methods section, we systematically induced cooling at 4{degree sign}C after assembly to assess the presence of aggregates, since those do not fall apart upon cooling. The decrease in optical density upon cooling is a direct control that the initial increase in DO is due to the formation of microtubules. Finally, aggregation and polymerization curves are widely different, the former displaying an exponential shape and the latter a sigmoid assembly phase (see Fig. 3A and 3B in Weiss et al., 2010).
Photoconversion caveatsMAPs are known to dynamically associate and dissociate from microtubules. Therefore, interpretation of the Ens photoconversion data should be made with caution. The expanding red signal from the nurse cells to the oocyte may reflect a any combination of dynein-mediated MT transport and passive diffusion of unbound Ensconsin. Notably, photoconversion of a soluble protein in the nurse cells would also result in a gradual increase in red signal in the oocyte, independent of active transport. We encourage the authors to more thoroughly discuss these caveats. It may also help to present the green and red channels side by side rather than as merged images, to allow readers to assess signal movement and spatial patterns better.
This is a valid point that mirrors the comment of Reviewers 1 and 3. The directional movement of microtubules traveling at ~140 nm/s from nurse cells toward the oocyte via the ring canals was previously reported by Lu et al. (2022) with excellent spatial resolution. Notably, this MT transport was measured using a fusion protein containing the Ens MT-binding domain. We now cite this relevant study in our revised manuscript and have removed this redundant panel in Figure 1.
Reduction of Shot at the anterior cortex• Shot is known to bind strongly to F-actin, and in the Drosophila ovary, its localization typically correlates more closely with F-actin structures than with microtubules, despite being an MT-actin crosslinker. Therefore, the observed reduction of cortical Shot in ens, nin mutants, and Khc-RNAi oocytes is unexpected. It would be important to determine whether cortical F-actin is also disrupted in these conditions, which should be straightforward to assess via phalloidin staining.
As requested by the reviewer, we performed actin staining experiments, which are now presented in a new Figure S5. These data demonstrate that the cortical actin network remains intact in all mutant backgrounds analyzed, ruling out any indirect effect of actin cytoskeleton disruption on the observed phenotypes.
MTs are barely visible in Fig. 3A, which is meant to demonstrate Ens-GFP colocalization with tubulin. Higher-quality images are needed.
The revised version now provides significantly improved images to show the different components examined. Our data show that Ens and Ninein localize at the cell cortex where they co-localize with Shot and Patronin (Figure 2 A-C). In addition, novel images show that Ens extends along microtubules (new Figure 4 A).
MT gradient in stage 9 oocytesIn ens-/-, nin-/-, and Khc-RNAi oocytes, is there any global defect in the stage 9 microtubule gradient? This information would help clarify the extent to which cortical localization defects reflect broader disruptions in microtubule polarity.
We now provide quantitative analysis of microtubule (MT) array organization in novel figures (Figure 3D and Figure 5B). Our data reveal that both Khc RNAi and ens mutant oocytes exhibit severe disruption of MT orientation toward the posterior (new Figure 5B). Importantly, this defect is significantly less pronounced in Nin-/- oocytes, which retain residual ncMTOCs at the cortex (new Figure 3D). This differential phenotype supports our model that cortical ncMTOCs are critical for maintaining proper MT orientation toward the posterior side of the oocyte.
Role of Ninein in cortical anchoringThe requirement for Ninein in cortical anchorage is the least convincing aspect of the manuscript and somewhat disrupts the narrative flow. First, it is unclear whether Ninein exhibits the same oocyte-enriched localization pattern as Ensconsin. Is Ninein detectable in nurse cells? Second, the Ninein antibody signal appears concentrated in a small area of the anterior-lateral oocyte cortex (Fig. 2A), yet Ninein loss leads to reduced Shot signal along a much larger portion of the anterior cortex (Fig. 2F)-a spatial mismatch that weakens the proposed functional relationship. Third, Ninein overexpression results in cortical aggregates that co-localize with Shot, Patronin, and Ensconsin. Are these aggregates functional ncMTOCs? Do microtubules emanate from these foci?
We now provide a more comprehensive analysis of Ninein localization. Similar to Ensconsin (Ens), endogenous Ninein is enriched in the oocyte during the early stages of oocyte development but is also detected in NCs (see modified Figure 2 A and Lasko et al., 2016). Improved imaging of Ninein further shows that the protein partially co-localizes with Ens, and ncMTOCs at the anterior cortex and with Ens-bound MTs (Figure 2B, 2C).
Importantly, loss of Ninein (Nin) only partially reduces the enrichment of Ens in the oocyte (Figure 2E). Both Ens and Kinesin heavy chain (Khc) remain partially functional and continue to target non-centrosomal microtubule-organizing centers (ncMTOCs) to the cortex (Figure 3A). In Nin-/- mutants, a subset of long cortical microtubules (MTs) is present, thereby generating cytoplasmic streaming, although less efficiently than under wild-type (WT) conditions (Figure 3F and 3G). As a non-essential gene, we envisage Ninein as a facilitator of MT organization during oocyte development.
Finally, our new analyses demonstrate that large puncta containing Ninein, Shot, Patronin, and despite their size, appear to be relatively weak nucleation centers (revised Figure S4 E and Video 1). In addition, their presence does not bias overall MT architecture (Figure S4 F) nor impair oocyte development and fertility (Figure S4 G and Table 1).
Inconsistency of Khc^MutEns rescueThe Khc^MutEns variant partially rescues cortical MT formation and restores a slow but measurable cytoplasmic flow yet it fails to rescue Staufen localization (Fig. 5). This raises questions about the consistency and completeness of the rescue. Could the authors clarify this discrepancy or propose a mechanistic rationale?
This is a good point. The cytoplasmic flows (the consequence of cargo transport by Khc on MTs) generated by a constitutively active KhcMutEns in an ens mutant condition, are less efficient than those driven by Khc activated by Ens in a control condition (Figure 6C). The rescued flow is probably not efficient enough to completely rescue the Staufen localization at stage 10.
Additionally, this KhcMutEns variant rescues the viability of embryos from Khc27 mutant germline clones oocytes but not from ens mutants (Table1). One hypothesis is that Ens harbors additional functions beyond Khc activation.
This incomplete rescue of Ens by an active Khc variant could also be the consequence of the "paradox of co-dependence": Kinesin-1 also transport the antagonizing motor Dynein that promotes cargo transport in opposite directions (Hancock et al., 2016). The phenotype of a gain of function variant is therefore complex to interpret. Consistent with this, both KhcMutEns-GFP and KhcDhinge2 two active Khc only rescues partially centrosome transport in ens mutant Neural Stem Cells (Figure S10).
Minor points: 1. The pUbi-attB-Khc-GFP vector was used to generate the Khc^MutEns transgenic line, presumably under control of the ubiquitous ubi promoter. Could the authors specify which attP landing site was used? Additionally, are the transgenic flies viable and fertile, given that Kinesin-1 is hyperactive in this construct?
All transgenic constructs were integrated at defined genomic landing sites to ensure controlled expression levels. Specifically, both GFP-tagged KhcWT and KhcMutEns were inserted at the VK05 (attP9A) site using PhiC31-mediated integration. Full details of the landing sites are provided in the Materials and Methods section. Both transgenic flies are homozygous lethal and the transgenes are maintained over TM6B balancers.
On page 11 (Discussion, section titled "A dual Ensconsin oocyte enrichment mechanism achieves spatial relief of Khc inhibition"), the statement "many mutations in Kif5A are causal of human diseases" would benefit from a brief clarification. Since not all readers may be familiar with kinesin gene nomenclature, please indicate that KIF5A is one of the three human homologs of Kinesin heavy chain.
We clarified this point in the revised version (lane 465-466).
On page 16 (Materials and Methods, "Immunofluorescence in fly ovaries"), the sentence "Ovaries were mounted on a slide with ProlonGold medium with DAPI (Invitrogen)" should be corrected to "ProLong Gold."
This is corrected.
Significance
This study shows that enrichment of MAP7/ensconsin in the oocyte is the mechanism of kinesin-1 activation there and is important for cytoplasmic streaming and localization non-centrosomal microtubule-organizing centers to the oocyte cortex
We thank the reviewers for the accurate review of our manuscript and their positive feed-back.
Reviewer #3
Evidence, reproducibility and clarity
The manuscript of Berisha et al., investigates the role of Ensconsin (Ens), Kinesin-1 and Ninein in organisation of microtubules (MT) in Drosophila oocyte. At stage 9 oocytes Kinesin-1 transports oskar mRNA, a posterior determinant, along MT that are organised by ncMTOCs. At stage 10b, Kinesin-1 induces cytoplasmic advection to mix the contents of the oocyte. Ensconsin/Map7 is a MT associated protein (MAP) that uses its MT-binding domain (MBD) and kinesin binding domain (KBD) to recruit Kinesin-1 to the microtubules and to stimulate the motility of MT-bound Kinesin-1. Using various new Ens transgenes, the authors demonstrate the requirement of Ens MBD and Ninein in Ens localisation to the oocyte where Ens activates Kinesin-1 using its KBD. The authors also claim that Ens, Kinesin-1 and Ninein are required for the accumulation of ncMTOCs at the oocyte cortex and argue that the detachment of the ncMTOCs from the cortex accounts for the reduced localisation of oskar mRNA at stage 9 and the lack of cytoplasmic streaming at stage 10b. Although the manuscript contains several interesting observations, the authors' conclusions are not sufficiently supported by their data. The structure function analysis of Ensconsin (Ens) is potentially publishable, but the conclusions on ncMTOC anchoring and cytoplasmic streaming not convincing.
We are grateful that the regulation of Khc activity by MAP7 was well received by all reviewers. While our study focuses on Drosophila oogenesis, we believe this mechanism may have broader implications for understanding kinesin regulation across biological systems.
For the novel function of the MAP7/Khc complex in organizing its own microtubule networks through ncMTOC recruitment, we have carefully considered the reviewers' constructive recommendations. We now provide additional experimental evidence supporting a model of flux self-amplification in which ncMTOC recruitment plays a key role. It is well established that cytoplasmic flows are essential for posterior localization of cell fate determinants at stage 10B. Slow flows have also been described at earlier oogenesis stages by the groups of Saxton and St Johnston. Building on these early publications and our new experiments, we propose that these flows are essential to promote a positive feedback loop that reinforces ncMTOC recruitment and MT organization (Figure 7).
1) The main conclusion of the manuscript is that "MT advection failure in Khc and ens in late oogenesis stems from defective cortical ncMTOCs recruitment". This completely overlooks the abundant evidence that Kinesin-1 directly drives cytoplasmic streaming by transporting vesicles and microtubules along microtubules, which then move the cytoplasm by advection (Palacios et al., 2002; Serbus et al, 2005; Lu et al, 2016). Since Kinesin-1 generates the flows, one cannot conclude that the effect of khc and ens mutants on cortical ncMTOC positioning has any direct effect on these flows, which do not occur in these mutants.
We regret the lack of clarity of the first version of the manuscript and some missing references. We propose a model in which the Kinesin-1- dependent slow flows (described by Serbus/Saxton and Palacios/StJohnston) play a central role in amplifying ncMTOC anchoring and cortical MT network formation (see model in the new Figure 7).
2) The authors claim that streaming phenotypes of ens and khs mutants are due to a decrease in microtubule length caused by the defective localisation of ncMTOCs. In addition to the problem raised above, However, I am not convinced that they can make accurate measurements of microtubule length from confocal images like those shown in Figure 4. Firstly, they are measuring the length of bundles of microtubules and cannot resolve individual microtubules. This problem is compounded by the fact that the microtubules do not align into parallel bundles in the mutants. This will make the "microtubules" appear shorter in the mutants. In addition, the alignment of the microtubules in wild-type allows one to choose images in which the microtubule lie in the imaging plane, whereas the more disorganized arrangement of the microtubules in the mutants means that most microtubules will cross the imaging plane, which precludes accurate measurements of their length.
As mentioned by Reviewer 4, we have been transparent with the methodology, and the limitations that were fully described in the material and methods section.
Cortical microtubules in oocytes are highly dynamic and move rapidly, making it technically impossible to capture their entire length using standard Z-stack acquisitions. We therefore adopted a compromise approach: measuring microtubules within a single focal plane positioned just below the oocyte cortex. This strategy is consistent with established methods in the field, such as those used by Parton et al. (2011) to track microtubule plus-end directionality. To avoid overinterpretation, we explicitly refer to these measurements as "minimum detectable MT length," acknowledging that microtubules may extend beyond the focal plane, particularly at stage 10, where long, tortuous bundles frequently exit the plane of focus. These methodological considerations and potential biases are clearly described in the Materials and Methods section and the text now mentions the possible disorganization of the MT network in the mutant conditions (lane 272-273).
In this revised version, we now provide complementary analyses of MT network organization.Beyond length measurements (and the mentioned limitations), we also quantified microtubule network orientation at stage 9, assessing whether cortical microtubules are preferentially oriented toward the posterior axis as observed in controls (revised Figure 3D and Figure 5B). While this analysis is also subject to the same technical limitations, it reveals a clear biological difference: microtubules exhibit posterior-biased orientation in control oocytes similar to a previous study (Parton et al., 2011) but adopt a randomized orientation in Nin-/-, ens, and Khc RNAi-depleted oocytes (revised Figure 3D and Figure 5B).
Taken together, these complementary approaches, despite their technical constraints, provide convergent evidence for the role of the Khc/Ens complex in organizing cortical microtubule networks during oogenesis.
3) "To investigate whether the presence of these short microtubules in ens and Khc RNAi oocytes is due to defects in microtubule anchoring or is also associated with a decrease in microtubule polymerization at their plus ends, we quantified the velocity and number of EB1comets, which label growing microtubule plus ends (Figure S3)." I do not understand how the anchoring or not of microtubule minus ends to the cortex determines how far their plus ends grow, and these measurements fall short of showing that plus end growth is unaffected. It has already been shown that the Kinesin-1-dependent transport of Dynactin to growing microtubule plus ends increases the length of microtubules in the oocyte because Dynactin acts as an anti-catastrophe factor at the plus ends. Thus, khc mutants should have shorter microtubules independently of any effects on ncMTOC anchoring. The measurements of EB1 comet speed and frequency in FigS2 will not detect this change and are not relevant for their claims about microtubule length. Furthermore, the authors measured EB1 comets at stage 9 (where they did not observe short MT) rather than at stage 10b. The authors' argument would be better supported if they performed the measurements at stage 10b.
We thank the reviewer for raising this important point. The short microtubule (MT) length observed at stage 10B could indeed result from limited plus-end growth. Unfortunately, we were unable to test this hypothesis directly: strong endogenous yolk autofluorescence at this stage prevented reliable detection of Eb1-GFP comets, precluding velocity measurements.
At least during stage 9, our data demonstrate that MT nucleation and polymerization rates are not reduced in both KhcRNAi and ens mutant conditions, indicating that the observed MT alterations must arise through alternative mechanisms.
In the discussion, we propose the following interconnected explanations, supported by recent literature and the reviewers' suggestions:
1- Reduced MT rescue events. Two seminal studies from the Verhey and Aumeier laboratories have shown that constitutively active Kinesin-1 induces MT lattice damage (Budaitis et al., 2022), which can be repaired through GTP-tubulin incorporation into "rescue shafts" that promote MT rescue (Andreu-Carbo et al., 2022). Extrapolating from these findings, loss of Kinesin-1 activity could plausibly reduce rescue shaft formation, thereby decreasing MT stability. While challenging to test directly in our system, this mechanism provides a plausible framework for the observed phenotype.
2- Impaired transport of stabilizing factors. As that reviewer astutely points out, Khc transports the dynactin complex, an anti-catastrophe factor, to MT plus ends (Nieuwburg et al., 2017). Loss of this transport could further compromise MT plus end stability. We now discuss this important mechanism in the revised manuscript.
3- Loss of cortical ncMTOCs. Critically, our new quantitative analyses (revised Figure 3 and Figure 5) also reveal defective anteroposterior orientation of cortical MTs in mutant conditions. These experiments suggest that Ens/Khc-mediated localization of ncMTOCs to the cortex is essential for proper MT network organization, and possibly minus-end stabilization as suggested in several studies (Feng et al., 2019, Goodwin and Vale, 2011, Nashchekin et al., 2016).
Altogether, we now propose an integrated model in which MT reduction and disorganization may result from multiple complementary mechanisms operating downstream of Kinesin-1/Ensconsin loss. While some aspects remain difficult to test directly in our in vivo system, the convergence of our data with recent mechanistic studies provides an interesting conceptual framework. The Discussion has been revised to reflect this comprehensive view in a dedicated paragraph ("A possible regulation of MT dynamics in the oocyte at both plus end minus MT ends by Ens and Khc" lane 415-432).
4) The Shot overexpression experiments presented in Fig.3 E-F, Fig.4D and TableS1 are very confusing. Originally , the authors used Shot-GFP overexpression at stage 9 to show that there is a decrease of ncMTOCs at the cortex in ens mutants (Fig.3 E-F) and speculated that this caused the defects in MT length and cytoplasmic advection at stage 10B. However the authors later state on page 8 that : "Shot overexpression (Shot OE) was sufficient to rescue the presence of long cortical MTs and ooplasmic advection in most ens oocytes (9/14), resembling the patterns observed in controls (Figures 4B right panel and 4D). Moreover, while ens females were fully sterile, overexpression of Shot was sufficient to restore that loss of fertility (Table S1)". Is this the same UAS Shot-GFP and VP16 Gal4 used in both experiments? If so, this contradictions puts the authors conclusions in question.
This is an important point that requires clarification regarding our experimental design.
The Shot-YFP construct is a genomic insertion on chromosome 3. The ens mutation is also located on chromosome 3 and we were unable to recombine this transgene with the ens mutant for live quantification of cortical Shot. To circumvent this technical limitation, we used a UAS-Shot.L(C)-GFP transgenic construct driven by a maternal driver, expressed in both wild-type (control) and ens mutant oocytes. We validated that the expression level and subcellular localization of UAS-Shot.L(C)-GFP were comparable to those of the genomic Shot-YFP (new Figure S8 A and B).
From these experiments, we drew two key conclusions. First, cortical Shot.L(C)-GFP is less abundant in ens mutant oocytes compared to wild-type (the quantification has been removed from this version). Second, despite this reduced cortical accumulation, Shot.L(C)-GFP expression partially rescues ooplasmic flows and microtubule streaming in stage 10B ens mutant oocytes, and restores fertility to ens mutant females.
5) The authors based they conclusions about the involvement of Ens, Kinesin-1 and Ninein in ncMTOC anchoring on the decrease in cortical fluorescence intensity of Shot-YFP and Patronin-YFP in the corresponding mutant backgrounds. However, there is a large variation in average Shot-YFP intensity between control oocytes in different experiments. In Fig. 2F-G the average level of Shot-YFP in the control sis 130 AU while in Fig.3 G-H it is only 55 AU. This makes me worry about reliability of such measurements and the conclusions drawn from them.
To clarify this point, we have harmonized the method used to quantify the Shot-YFP signals in Figure 4E with the methodology used in Figure 3B, based on the original images. The levels are not strictly identical (Control Figure 2 B: 132.7+/-36.2 versus Control Figure 4 E: 164.0+/- 37.7). These differences are usual when experiments are performed at several-month intervals and by different users.
6) The decrease in the intensity of Shot-YFP and Patronin-YFP cortical fluorescence in ens mutant oocytes could be because of problems with ncMTOC anchoring or with ncMTOCs formation. The authors should find a way to distinguish between these two possibilities. The authors could express Ens-Mut (described in Sung et al 2008), which localises at the oocyte posterior and test whether it recruits Shot/Patronin ncMTOCs to the posterior.
We tried to obtain the fly stocks described in the 2008 paper by contacting former members of Pernille Rørth's laboratory. Unfortunately, we learned that the lab no longer exists and that all reagents, including the requested stocks, were either discarded or lost over time. To our knowledge, these materials are no longer available from any source. We regret that this limitation prevented us from performing the straightforward experiments suggested by the reviewer using these specific tools.
7) According to the Materials and Methods, the Shot-GFP used in Fig.3 E-F and Fig.4 was the BDSC line 29042. This is Shot L(C), a full-length version of Shot missing the CH1 actin-binding domain that is crucial for Shot anchoring to the cortex. If the authors indeed used this version of Shot-GFP, the interpretation of the above experiments is very difficult.
The Shot.L(C) isoform lacks the CH1 domain but retains the CH2 actin-binding motif. Truncated proteins with this domain and fused to GST retains a weak ability to bind actin in vitro. Importantly, the function of this isoform is context-dependent: it cannot rescue shot loss-of-function in neuron morphogenesis but fully restores Shot-dependent tracheal cell remodeling (Lee and Kolodziej, 2002).
In our experiments, when the Shot.L(C) isoform was expressed under the control of a maternal driver, its localization to the oocyte cortex was comparable to that of the genomic Shot-YFP construct (new Figure S8). This demonstrates unambiguously that the CH1 domain is dispensable for Shot cortical localization in oocytes, and that CH2-mediated actin binding is sufficient for this localization. Of note, a recent study showed that actin network are not equivalent highlighting the need for specific Shot isoforms harboring specialized actin-binding domain (Nashchekin et al., 2024).
We note that the expression level of Shot.L(C)-GFP in the oocyte appeared slightly lower than that of Shot-YFP (expressed under endogenous Shot regulatory sequences), as assessed by Western blot (Figure S8 A).
Critically, Shot.L(C)-GFP expression was substantially lower than that of Shot.L(A)-GFP (that harbored both the CH1 and CH2 domain). Shot.L(A)-GFP was overexpressed (Figure 8 A) and ectopically localized on MTs in both nurse cells and the ooplasm (Figure S8 B middle panel and arrow). These observations are in agreement that the Shot.L(C)-GFP rescue experiment was performed at near-physiological expression levels, strengthening the validity of our conclusions.
8) Page 6 "converted in NCs, in a region adjacent to the ring canals, Dendra-Ens-labeled MTs were found in the oocyte compartment indicating they are able to travel from NC toward the oocyte through ring canals". I have difficulty seeing the translocation of MT through the ring canals. Perhaps it would be more obvious with a movie/picture showing only one channel. Considering that f Dendra-Ens appears in the oocyte much faster than MT transport through ring canals (140nm/s, Lu et al 2022), the authors are most probably observing the translocation of free Ens rather than Ens bound to MT. The authors should also mention that Ens movement from the NC to the oocyte has been shown before with Ens MBD in Lu et al 2022 with better resolution.
We fully agree on the caveat mentioned by this reviewer: we may observe the translocation of free Dendra-Ensconsin. The experiment, was removed and replaced by referring to the work of the Gelfand lab. The movement of MTs that travel at ~140 nm/s between nurse cells toward the oocyte through the Ring Canals was reported before by Lu et al. (2022) with a very good resolution. Notably, this directional directed movement of MTs was measured using a fusion protein encompassing Ens MT-binding domain. We decided to remove this inclusive experiment and rather refer to this relevant study.
9) Page 6: The co-localization of Ninein with Ens and Shot at the oocyte cortex (Figure 2A). I have difficulty seeing this co-localisation. Perhaps it would be more obvious in merged images of only two channels and with higher resolution images
10) "a pool of the Ens-GFP co-localized with Ch-Patronin at cortical ncMTOCs at the anterior cortex (Figure 3A)". I also have difficulty seeing this.
We have performed new high-resolution acquisitions that provide clearer and more convincing evidence for the localization cortical distribution of these proteins (revised Figure 2A-2C and Figure 4A). These improved images demonstrate that Ens, Ninein, Shot, and Patronin partially colocalize at cortical ncMTOCs, as initially proposed. Importantly, the new data also reveal a spatial distinction: while Ens localizes along microtubules extending from these cortical sites, Ninein appears confined to small cytoplasmic puncta adjacent but also present on cortical microtubules.
11) "Ninein co-localizes with Ens at the oocyte cortex and partially along cortical microtubules, contributing to the maintenance of high Ens protein levels in the oocyte and its proper cortical targeting". I could not find any data showing the involvement of Ninein in the cortical targeting of Ens.
We found decreased Ens localization to MTs and to the cell cortex region (new Figure S3 A-B).
12) "our MT network analyses reveal the presence of numerous short MTs cytoplasmic clustered in an anterior pattern." "This low cortical recruitment of ncMTOCs is consistent with poor MT anchoring and their cytoplasmic accumulation." I could not find any data showing that short cortical MT observed at stage 10b in ens mutant and Khc RNAi were cytoplasmic and poorly anchored.
The sentence was removed from the revised manuscript.
13) "The egg chamber consists of interconnected cells where Dynein and Khc activities are spatially separated. Dynein facilitates transport from NCs to the oocyte, while Khc mediates both transport and advection within the oocyte." Dynein is involved in various activities in the oocyte. It anchors the oocyte nucleus and transports bcd and grk mRNA to mention a few.
The text was amended to reflect Dynein involvement in transport activities in the oocyte, with the appropriate references (lane 105-107).
14) The cartoons in Fig.2H and 3I exaggerate the effect of Ninein and Ens on cortical ncMTOCs. According to the corresponding graphs, there is a 20 and 50% decrease in each case.
New cartoons (now revised Figure 3E and 4F), are amended to reflect the ncMTOC values but also MT orientation (Figure 3E).
Significance
Given the important concerns raised, the significance of the findings is difficult to assess at this stage.
We sincerely thank the reviewer for their thorough evaluation of our manuscript. We have carefully addressed their concerns through substantial new experiments and analyses. We hope that the revised manuscript, in its current form, now provides the clarifications and additional evidence requested, and that our responses demonstrate the significance of our findings.
Reviewer #4 (Evidence, reproducibility and clarity (Required)):
Summary: This manuscript presents an investigation into the molecular mechanisms governing spatial activation of Kinesin-1 motor protein during Drosophila oogenesis, revealing a regulatory network that controls microtubule organization and cytoplasmic transport. The authors demonstrate that Ensconsin, a MAP7 family protein and Kinesin-1 activator, is spatially enriched in the oocyte through a dual mechanism involving Dynein-mediated transport from nurse cells and cortical maintenance by Ninein. This spatial enrichment of Ens is crucial for locally relieving Kinesin-1 auto-inhibition. The Ens/Khc complex promotes cortical recruitment of non-centrosomal microtubule organizing centers (ncMTOCs), which are essential for anchoring microtubules at the cortex, enabling the formation of long, parallel microtubule streams or "twisters" that drive cytoplasmic advection during late oogenesis. This work establishes a paradigm where motor protein activation is spatially controlled through targeted localization of regulatory cofactors, with the activated motor then participating in building its own transport infrastructure through ncMTOC recruitment and microtubule network organization.
There's a lot to like about this paper! The data are generally lovely and nicely presented. The authors also use a combination of experimental approaches, combining genetics, live and fixed imaging, and protein biochemistry.
We thank the reviewer for this enthusiastic and supportive review, which helped us further strengthen the manuscript.
Concerns: Page 6: "to assay if elevation of Ninein levels was able to mis-regulate Ens localization, we overexpressed a tagged Ninein-RFP protein in the oocyte. At stage 9 the overexpressed Ninein accumulated at the anterior cortex of the oocyte and also generated large cortical aggregates able to recruit high levels of Ens (Figures 2D and 2H)... The examination of Ninein/Ens cortical aggregates obtained after Ninein overexpression showed that these aggregates were also able to recruit high levels of Patronin and Shot (Figures 2E and 2H)." Firstly, I'm not crazy about the use of "overexpressed" here, since there isn't normally any Ninein-RFP in the oocyte. In these experiments it has been therefore expressed, not overexpressed. Secondly, I don't understand what the reader is supposed to make of these data. Expression of a protein carrying a large fluorescent tag leads to large aggregates (they don't look cortical to me) that include multiple proteins - in fact, all the proteins examined. I don't understand this to be evidence of anything in particular, except that Ninein-RFP causes the accumulation of big multi-protein aggregates. While I can understand what the authors were trying to do here, I think that these data are inconclusive and should be de-emphasized.
We have revised the manuscript by replacing overexpressed with expressed (lanes 211 and 212). In addition, we now provide new localization data in both cortical (new Figure S4 A, top) and medial focal planes (new Figure S4 A, bottom), demonstrating that Ninein puncta (the word used in Rosen et al, 2019), rather than aggregates are located cortically. We also show that live IRP-labelled MTs do not colocalize with Ninein-RFP puncta. In light of the new experiments and the comments from the other reviewers, the corresponding text has been revised and de-emphasized accordingly.
Page 7: "Co-immunoprecipitations experiments revealed that Patronin was associated with Shot-YFP, as shown previously (Nashchekin et al., 2016), but also with EnsWT-GFP, indicating that Ens, Shot and Patronin are present in the same complex (Figure 3B)." I do not agree that association between Ens-GFP and Patronin indicates that Ens is in the same complex as Shot and Patronin. It is also very possible that there are two (or more) distinct protein complexes. This conclusion could therefore be softened. Instead of "indicating" I suggest "suggesting the possibility."
We have toned down this conclusion and indicated "suggesting the possibility" (lane 238-239).
Page 7: "During stage 9, the average subcortical MT length, taken at one focal plane in live oocytes (see methods)..." I appreciate that the authors have been careful to describe how they measured MT length, as this is a major point for interpretation. I think the reader would benefit from an explanation of why they decided to measure in only one focal plane and how that decision could impact the results.
We appreciate this helpful suggestion. Cortical microtubules are indeed highly dynamic and extend in multiple directions, including along the Z-axis. Moreover, their diameter is extremely small (approximately 25 nm), making it technically challenging to accurately measure their full length with high resolution using our Zeiss Airyscan confocal microscope (over several, microns): the acquisition of Z-stacks is relatively slow and therefore not well suited to capturing the rapid dynamics of these microtubules. Consequently, our length measurements represent a compromise and most likely underestimate the actual lengths of microtubules growing outside the focal plane. We note that other groups have encountered similar technical limitations (Parton et al., 2011).
Page 7: "... the MTs exhibited an orthogonal orientation relative to the anterior cortex (Figures 4A left panels, 4C and 4E)." This phenotype might not be obvious to readers. Can it be quantified?
We have now analyzed the orientation of microtubules (MTs) along the dorso-ventral axis. Our analysis shows that ens, Khc RNAi oocytes (new Figure 5B), and, to a lesser extent, Nin mutant oocytes (new Figure 3D), display a more random MT orientation compared to wild-type (WT) oocytes. In WT oocytes, MTs are predominantly oriented toward the posterior pole, consistent with previous findings (Parton et al., 2011).
Page 8: "Altogether, the analyses of Ens and Khc defective oocytes suggested that MT organization defects during late oogenesis (stage 10B) were caused by an initial failure of ncMTOCs to reach the cell cortex. Therefore, we hypothesized that overexpression of the ncMTOC component Shot could restore certain aspects of microtubule cortical organization in ens-deficient oocytes. Indeed, Shot overexpression (Shot OE) was sufficient to rescue the presence of long cortical MTs and ooplasmic advection in most ens oocytes (9/14)..." The data are clear, but the explanation is not. Can the authors please explain why adding in more of an ncMTOC component (Shot) rescues a defect of ncMTOC cortical localization?
We propose that cytoplasmic ncMTOCs can bind the cell cortex via the Shot subunit that is so far the only component that harbors actin-binding motifs. Therefore, we propose that elevating cytoplasmic Shot increase the possibility of Shot to encounter the cortex by diffusion when flows are absent. This is now explained lane 282-285.
I'm grateful to the authors for their inclusion of helpful diagrams, as in Figures 1G and 2H. I think the manuscript might benefit from one more of these at the end, illustrating the ultimate model.
We have carefully considered and followed the reviewer's suggestions. In response, we have included a new figure illustrating our proposed model: the recruitment of ncMTOCs to the cell cortex through low Khc-mediated flows at stage 9 enhances cortical microtubule density, which in turn promotes self-amplifying flows (new Figure 7, panels A to C). Note that this Figure also depicts activation of Khc by loss of auto-inhibition (Figure 7, panel D).
I'm sorry to say that the language could use quite a bit of polishing. There are missing and extraneous commas. There is also regular confusion between the use of plural and singular nouns. Some early instances include:
- Page 3: thought instead of "thoughted."
- Page 5: "A previous studies have revealed"
- Page 5: "A significantly loss"
- Page 6: "troughs ring canals" should be "through ring canals"
- Page 7: lives stage 9 oocytes
- Page 7: As ens and Khc RNAi oocytes exhibits
- Page 7: we examined in details
- Page 7: This average MT length was similar in Khc RNAi and ens mutant oocyte..
We apologize for errors. We made the appropriate corrections of the manuscript.
Reviewer #4 (Significance (Required)):
This work makes a nice conceptual advance by showing that motor activation controls its own transport infrastructure, a paradigm that could extend to other systems requiring spatially regulated transport.
We thank the reviewers for their evaluation of the manuscript and helpful comments.
Note: This preprint has been reviewed by subject experts for Review Commons. Content has not been altered except for formatting.
Learn more at Review Commons
Summary: This manuscript presents an investigation into the molecular mechanisms governing spatial activation of Kinesin-1 motor protein during Drosophila oogenesis, revealing a regulatory network that controls microtubule organization and cytoplasmic transport. The authors demonstrate that Ensconsin, a MAP7 family protein and Kinesin-1 activator, is spatially enriched in the oocyte through a dual mechanism involving Dynein-mediated transport from nurse cells and cortical maintenance by Ninein. This spatial enrichment of Ens is crucial for locally relieving Kinesin-1 auto-inhibition. The Ens/Khc complex promotes cortical recruitment of non-centrosomal microtubule organizing centers (ncMTOCs), which are essential for anchoring microtubules at the cortex, enabling the formation of long, parallel microtubule streams or "twisters" that drive cytoplasmic advection during late oogenesis. This work establishes a paradigm where motor protein activation is spatially controlled through targeted localization of regulatory cofactors, with the activated motor then participating in building its own transport infrastructure through ncMTOC recruitment and microtubule network organization.
There's a lot to like about this paper! The data are generally lovely and nicely presented. The authors also use a combination of experimental approaches, combining genetics, live and fixed imaging, and protein biochemistry.
Concerns:
Page 6: "to assay if elevation of Ninein levels was able to mis-regulate Ens localization, we overexpressed a tagged Ninein-RFP protein in the oocyte. At stage 9 the overexpressed Ninein accumulated at the anterior cortex of the oocyte and also generated large cortical aggregates able to recruit high levels of Ens (Figures 2D and 2H)... The examination of Ninein/Ens cortical aggregates obtained after Ninein overexpression showed that these aggregates were also able to recruit high levels of Patronin and Shot (Figures 2E and 2H)." Firstly, I'm not crazy about the use of "overexpressed" here, since there isn't normally any Ninein-RFP in the oocyte. In these experiments it has been therefore expressed, not overexpressed. Secondly, I don't understand what the reader is supposed to make of these data. Expression of a protein carrying a large fluorescent tag leads to large aggregates (they don't look cortical to me) that include multiple proteins - in fact, all the proteins examined. I don't understand this to be evidence of anything in particular, except that Ninein-RFP causes the accumulation of big multi-protein aggregates. While I can understand what the authors were trying to do here, I think that these data are inconclusive and should be de-emphasized.
Page 7: "Co-immunoprecipitations experiments revealed that Patronin was associated with Shot-YFP, as shown previously (Nashchekin et al., 2016), but also with EnsWT-GFP, indicating that Ens, Shot and Patronin are present in the same complex (Figure 3B)." I do not agree that association between Ens-GFP and Patronin indicates that Ens is in the same complex as Shot and Patronin. It is also very possible that there are two (or more) distinct protein complexes. This conclusion could therefore be softened. Instead of "indicating" I suggest "suggesting the possibility."
Page 7: "During stage 9, the average subcortical MT length, taken at one focal plane in live oocytes (see methods)..." I appreciate that the authors have been careful to describe how they measured MT length, as this is a major point for interpretation. I think the reader would benefit from an explanation of why they decided to measure in only one focal plane and how that decision could impact the results.
Page 7: "... the MTs exhibited an orthogonal orientation relative to the anterior cortex (Figures 4A left panels, 4C and 4E)." This phenotype might not be obvious to readers. Can it be quantified?
Page 8: "Altogether, the analyses of Ens and Khc defective oocytes suggested that MT organization defects during late oogenesis (stage 10B) were caused by an initial failure of ncMTOCs to reach the cell cortex. Therefore, we hypothesized that overexpression of the ncMTOC component Shot could restore certain aspects of microtubule cortical organization in ens-deficient oocytes. Indeed, Shot overexpression (Shot OE) was sufficient to rescue the presence of long cortical MTs and ooplasmic advection in most ens oocytes (9/14)..." The data are clear, but the explanation is not. Can the authors please explain why adding in more of an ncMTOC component (Shot) rescues a defect of ncMTOC cortical localization?
I'm grateful to the authors for their inclusion of helpful diagrams, as in Figures 1G and 2H. I think the manuscript might benefit from one more of these at the end, illustrating the ultimate model.
I'm sorry to say that the language could use quite a bit of polishing. There are missing and extraneous commas. There is also regular confusion between the use of plural and singular nouns. Some early instances include:
This work makes a nice conceptual advance by showing that motor activation controls its own transport infrastructure, a paradigm that could extend to other systems requiring spatially regulated transport.
eLife Assessment
This paper demonstrates that a genetic code expansion to tag two amyotrophic lateral sclerosis (ALS) proteins associated with stress granules is useful in an experimental context. The data are solid and demonstrate the feasibility of using ANAP-fluorescence for live cell imaging.
Reviewer #1 (Public review):
Summary:
The authors utilize genetic code expansion to tag TDP-43 and G3BP1, and evaluate this protein tagging system (ANAP) compared to antibodies and evaluate protein trafficking and stress granule formation in response to stress with sodium arsenite treatment. They find similar staining to antibodies in HeLa cells, mouse embryonic stem cells and primary mouse cortical neurons. By incorporating the intrinsically fluorescent noncanonical amino acid Anap at carefully selected sites, the authors enable live-cell and neuronal visualization of protein localization, stress-induced redistribution, and dynamic behavior without the structural and functional compromises often associated with large fluorescent protein tags. The work provides technical framework that will be useful for live imaging of tagged proteins.
Strengths:
A key strength is the demonstration of the specificity of the Anap fluorescence signal through appropriate controls and the agreement between Anap labeling and antibody-based detection across multiple cell types, including primary neurons. The ability to visualize stress-induced redistribution of both G3BP1 and TDP 43 in living cells highlights the practical value of this approach.
The functional validation of TDP 43-Anap is compelling. The rescue of both cell viability and RNA splicing defects in TDP 43 knockout models provides evidence that Anap incorporation preserves core protein functions. This is important, as functional disruption is a central concern for any alternative tagging strategy applied to aggregation-prone or RNA-binding proteins.
Weaknesses:
While some inherent limitations of genetic code expansion remain (e.g., variable amber suppression efficiency and the inability to directly assess endogenous protein behavior), these are acknowledged and discussed appropriately. Importantly, these limitations do not undermine the central contributions of the study.
Author response:
The following is the authors’ response to the original reviews.
eLife Assessment
Amyotrophic lateral sclerosis (ALS) affects nerve cells in the brain and spinal cord. The authors' approach to use genetic code expansion to tag two ALS proteins associated with stress granules has value and should be useful in the ALS field. Parts of the work are well done, but there are concerns that the evidence is incomplete overall, and additional controls would strengthen the study.
We thank the editors and reviewers for their thoughtful assessment and for highlighting the potential value of applying genetic code expansion (GCE) to study ALSassociated proteins involved in stress granule biology. Our goal in this work was to establish and validate a minimally perturbative labeling strategy using the noncanonical amino acid Anap to monitor the localization and stress-dependent behavior of TDP-43 and G3BP1.
We agree that additional controls can further strengthen the conclusions. In the revised manuscript, we have clarified the experimental design and added essential controls to better support the reliability of the Anap labeling approach (Supplementary Fig. 1).
Public Reviews:
Reviewer #1 (Public review):
Summary:
The authors utilize genetic code expansion to tag TDP-43 and G3BP1, and evaluate this protein tagging system (ANAP) compared to antibodies, and evaluate protein trafficking and stress granule formation in response to stress with sodium arsenite treatment. They find similar staining to antibodies in HeLa cells, mouse embryonic stem cells, and primary mouse cortical neurons. This is a useful study that demonstrates the utility of ANAP tagging to evaluate ALS proteins.
We sincerely thank the reviewer for the positive assessment of our work and for recognizing the utility of the Anap-based GCE system for studying ALS-associated proteins.
Strengths:
Rescue of cell survival by ANAP-tagged TDP-43 is compelling
We appreciate the reviewer’s highlighting of this point. Demonstrating that TDP43-Anap can rescue cell survival was an important validation in our study, as it indicates that incorporation of the noncanonical amino acid does not substantially disrupt the biological function of TDP-43. Additionally, we also tested the RNA splicing function recovery potency of TDP-43-Anap. As shown in Fig. 1K and 1L, a recovery of expression of PFKP, a protein undergoing cryptic exon when TDP-43 lost its function [1], was observed when expressing TDP-43-Anap in TDP-43 knockout Hela cells.
Weaknesses:
While the ANAP-tagged proteins had similar distributions to antibody staining, there were some discrepancies that may be more explained by the technique than by novel findings, as the authors suggested. The inclusion of additional controls to evaluate this would be helpful.
This is a helpful suggestion. To ensure that the fluorescence signal observed in our experiments was specifically derived from site-specific Anap incorporation rather than background fluorescence, we performed three control conditions. Specifically, we tested: (1) cells cultured with Anap supplement, (2) cells expressing the Anap incorporation system with the addition of Anap, and (3) cells expressing both the TAG-mutated protein plasmid and the Anap incorporation system but without the addition of Anap. These control experiments were performed for both TDP-43 and G3BP1, and no observable fluorescence signal was detected under any of these conditions (Supplementary Fig. 1). We have clarified this control experiment in the revised manuscript.
Reviewer #2 (Public review):
Summary:
In this manuscript, Chen and colleagues describe a novel means of labeling two RNAbinding proteins, G3BP1 and TDP-43, using genetic code expansion. Overexpressed constructs that incorporate the intrinsically fluorescent non-canonical amino acid Anap redistribute to cytoplasmic granules upon application of external stressors such as sodium arsenite. Similar labeling and redistribution of overexpressed G3BP1 and TDP43 were observed in cultures of mouse primary neurons.
We are grateful for the reviewer’s accurate summary of our study and recognition of the value of GCE strategy for labeling the RNA-binding proteins G3BP1 and TDP-43.
Strengths:
Genetic code expansion and non-canonical amino acid labeling have quite a few advantages over traditional fusion proteins for tracking protein redistribution in living cells. The authors show that they are able to label exogenous G3BP1 and TDP-43 with the non-canonical amino acid Anap and follow labeled proteins in living cells with and without stress.
We acknowledge the reviewer’s comment on the advantages of GCE-based noncanonical amino acid labeling for studying protein dynamics in living cells.
Weaknesses:
The authors do not convincingly leverage the advantages of genetic code expansion in the current study. There is no specific question posed by the authors that can be or is answered using this approach, and several of the experiments lack critical controls. This is also not the first example of TDP-43 labeling by genetic code expansion (see PMID: 38290242). As a result, the study as a whole adds little to our understanding of protein trafficking and behavior under stress.
We thank the reviewer for raising these important points. Although as reviewer mentioned, genetic code expansion has previously been applied to TDP-43 [2], it mainly employed the photocaged lysine incorporation system to optogenetic control of TDP-43 translocation, and the protein was still labeled by mRubby. Our paper has totally different goal, to establish and validate a minimally perturbative labeling strategy using the intrinsically fluorescent noncanonical amino acid Anap to monitor the localization and stress-dependent behavior of both TDP-43 and G3BP1. And our work extends this approach in several important ways.
First, we demonstrate that Anap incorporation enables visualization of stress-dependent redistribution of both TDP-43 and G3BP1, two key proteins involved in stress granule biology. Importantly, we validate this approach across multiple cellular systems, including HeLa cells, mouse embryonic stem cells, and primary mouse cortical neurons, which broadens the applicability of this labeling strategy.
Second, we provide functional validation of the Anap-tagged protein, showing that TDP43-Anap rescues both cell survival and RNA splicing activity in TDP-43 knockout cells, including restoration of PFKP expression, a known cryptic exon target of TDP-43. These results support that Anap incorporation does not substantially disrupt protein function.
We performed additional control experiments to ensure the specificity of the labeling system. Specifically, we tested three control conditions: (1) cells cultured with Anap supplement, (2) cells expressing the Anap incorporation system with the addition of Anap, and (3) cells expressing both the TAG-mutated protein plasmid and the Anap incorporation system but without the addition of Anap. These control experiments were performed for both TDP-43 and G3BP1, and no observable fluorescence signal was detected under any of these conditions (Supplementary Fig. 1).
We agree that the manuscript would benefit from clearer articulation of the advantages of genetic code expansion in this context. Accordingly, we have revised the manuscript to more explicitly emphasize how Anap labeling provides a minimally perturbative alternative to large fluorescent protein fusions, which can alter the phase behavior and localization of stress granule proteins.
“Conventional fluorescent protein tags have enabled visualization of TDP-43 and G3BP1 in living cells; however, these approaches can perturb the native biophysical properties of the proteins being studied. For example, GFP or other fluorescently tagged TDP-43 usually requires additional modifications, such as deletion of the nuclear localization signal (NLS) [3, 4], to induce cytoplasmic inclusion formation. Such manipulations introduce non-physiological conditions that may alter the native trafficking and aggregation behavior of TDP-43. As for G3BP1, tags like GFP may also cause unexpected effects on the phase separation or other dynamics of the protein. In contrast, Anap based GCE strategy allows the minimally perturbative labeling and visualization of protein localization and stress-induced redistribution while preserving native protein architecture and function of both proteins. Importantly, the approach provides a generalizable genetically encoded platform for quantitatively examining the behavior of ALS-associated proteins in living cells. By enabling faithful monitoring of protein trafficking and stressgranule dynamics without extensive protein engineering, Anap-based GCE can offer a powerful strategy for probing molecular-scale mechanisms underlying ALS-linked proteinopathies”.
Recommendations for the authors:
Reviewer #1 (Recommendations for the authors):
(1) Figure 1A
The authors report that the nuclear staining of G3BP1 by ANAP labeling shows the presence of nuclear pools of G3BP1 that aren't detected with antibody staining. However, unspecific nuclear staining by aminoacylated tRNAs bound to synthetases has been described. It would be important to have a control to evaluate for this possibility.
This is an important point. We agree that the nuclear ANAP signal should be carefully controlled to exclude the possibility of nonspecific staining arising from the Anap incorporation machinery itself, such as aminoacylated tRNAs and/or synthetases.
To address this concern, in methods and material part, we note that after DPBS washes to remove excess Anap, cells were incubated in fresh medium for 2 hours to allow sufficient time for the decay of unstable aminoacylated tRNAs, which are generally cleared within minutes to tens of munites [5].
Also, we performed three control conditions for both TDP-43 and G3BP1: (1) cells cultured with Anap supplement, (2) cells expressing the Anap incorporation system with the addition of Anap, and (3) cells expressing both the TAG-mutated protein plasmid and the Anap incorporation system but without the addition of Anap. Under all three conditions, we observed no detectable fluorescence signal (Supplementary Fig. 1).
In addition, as shown in Fig. 1I, the nuclear signal of G3BP1-Anap partially colocalizes with the nuclear signal of TIA-1 in several condensate-like structures. This observation further supports that the nuclear Anap signal reflects protein-associated localization rather than nonspecific fluorescence, as it overlaps with a known RNA-binding protein that can form nuclear condensates under certain conditions.
(2) Figure 1A, 1B
Anap labeling appears to stain fewer cytoplasmic structures compared to antibody staining for both G3BP1 and TDP-43 after sodium arsenite treatment. Quantification would be useful to address whether this is the case. If so, might this be due to unincorporated/truncated proteins competing with Anap-labeled proteins?
We appreciate the reviewer’s helpful suggestion. To address this point, we performed quantitative colocalization analysis using Fiji/ImageJ, calculating the Pearson correlation coefficient (R) for regions of interest between the Anap signal and antibody staining. These analyses indicate a strong overall agreement between the two detection methods under stress conditions, supporting that Anap labeling reliably reports the localization of both G3BP1 and TDP-43 (see Fig1. A, B).
Regarding the possibility that truncated or unincorporated proteins could influence the observed signal, we note that fluorescence from Anap depends on successful amber suppression and incorporation of Anap at the engineered TAG site. Proteins that fail to incorporate Anap, such as truncated products generated by premature termination, would not produce fluorescence, and therefore would not contribute to the Anap signal. Thus, the Anap fluorescence selectively reports the population of successfully labeled full-length proteins, whereas antibody staining detects both labeled and unlabeled protein pools. This difference may partially explain why antibody staining appears to label a larger number of cytoplasmic structures.
(3) Figure 1F
FRAP of G3BP1-GFP in stress granules is slower than in previous publications. The underlying reasons for this should also be addressed.
We thank the reviewer for this important observation. Differences in FRAP recovery kinetics of G3BP1 in stress granules may arise from several experimental variables that are known to influence stress granule dynamics. These include differences in cell type, expression levels of G3BP1-GFP, and imaging or photobleaching parameters. In our experiments, FRAP measurements were performed under specific conditions optimized for our experimental system, which may lead to recovery kinetics that differ from those reported in previous studies.
(4) Figure 1H
A full-size Western blot would be useful to evaluate for amount of truncated protein for G3BP1 and TDP-43. Could truncated proteins be competing with and altering ANAPtagged G3BP1 and TDP-43 localization in response to stress? This should be addressed.
We acknowledge this important point. Full-size Western blotting can provide information on the overall presence of truncated species in the transfected population; however, it represents a bulk measurement and does not capture cell-to-cell variability in amber suppression efficiency at the single-cell level. We therefore cannot exclude the possibility that truncated products are present at varying levels in individual cells and may contribute, directly or indirectly, to differences between antibody staining and Anap fluorescence.
Importantly, we observe that cells with successful Anap incorporation consistently exhibit strong antibody staining for TDP-43 or G3BP1, indicating that full-length protein is the predominant species in these cells. Because Anap fluorescence depends on successful amber suppression, it selectively reports the full-length protein population, whereas truncated products are not detected in the imaging assay. The concordance between Anap fluorescence and antibody staining therefore argues against a major contribution of truncated species to the observed localization patterns (Supplementary Fig. 1).
Accordingly, we interpret the Anap signal as reflecting the localization of successfully labeled full-length protein, while acknowledging that heterogeneity in suppression efficiency is an important limitation of the current approach.
(5) Figure 3
This is a well-designed diagram.
We are grateful for the reviewer’s positive feedback on the diagram and are pleased that the schematic effectively illustrates the experimental design and the principles of the genetic code expansion strategy used in this study.
Reviewer #2 (Recommendations for the authors):
The authors present a one-sided viewpoint concerning the connection between stress granules and disease (lines 45-46). A more balanced discussion is recommended, including data arguing against a role for abnormal stress granules in neurodegeneration.
This is an important suggestion. We agree that the relationship between stress granules and neurodegeneration remains an active area of investigation and that evidence both supporting and questioning a causal role of stress granules in disease has been reported. In the revised manuscript, we have modified the Introduction to provide a more balanced discussion of this topic.
“Altered stress-granule dynamics have been associated with ALS/FTD [6, 7]; however, whether stress granules directly drive neurodegeneration remains debated, as several studies suggest that stress granules primarily function as protective stress responses [8].”
(1) A central rationale for the study is missing. The authors state only that G3BP1 and TDP-43 'undergo dynamic stress-dependent redistribution, making them ideal candidates for minimally invasive, site-specific fluorescent labeling.' Is there a controversy or question that can be resolved using these approaches?
We thank the reviewer for raising this important point. The central motivation of this study is that the dynamic behavior and phase separation properties of stressgranule proteins are highly sensitive to protein modifications and tagging strategies.
“Conventional fluorescent protein tags have enabled visualization of TDP-43 and G3BP1 in living cells; however, these approaches can perturb the native biophysical properties of the proteins being studied. For example, GFP or other fluorescently tagged TDP-43 usually requires additional modifications, such as deletion of the nuclear localization signal (NLS) [3, 4], to induce cytoplasmic inclusion formation. Such manipulations introduce non-physiological conditions that may alter the native trafficking and aggregation behavior of TDP-43. As for G3BP1, tags like GFP may also cause unexpected effects on the phase separation or other dynamics of the protein.”
(2) Related to this, there is little context for how or why genetic code expansion is utilized for these studies
We agree that the rationale for using genetic code expansion should be more clearly explained. In this study, genetic code expansion was employed to enable sitespecific incorporation of the small fluorescent noncanonical amino acid Anap, allowing minimally perturbative labeling of proteins of interest.
“Anap based GCE strategy allows the minimally perturbative labeling and visualization of protein localization and stress-induced redistribution while preserving native protein architecture and function of both proteins. Importantly, the approach provides a generalizable genetically encoded platform for quantitatively examining the behavior of ALS-associated proteins in living cells. By enabling faithful monitoring of protein trafficking and stress-granule dynamics without extensive protein engineering, Anapbased GCE can offer a powerful strategy for probing molecular-scale mechanisms underlying ALS-linked proteinopathies.”
(3) The justification for the criteria for selecting the site for incorporation of non-canonical amino acids in G3BP1 or TDP-43 is missing.
We acknowledge this important comment and agree that the rationale for selecting the incorporation sites should be stated more clearly.
“For TDP-43, the incorporation site was selected to avoid the major functional domains involved in RNA binding, nuclear localization, and aggregation-related behavior, thereby reducing the likelihood that Anap incorporation would perturb its native trafficking or function. For G3BP1, the selected site was chosen to minimize interference with domains important for stress granule assembly, RNA binding, and protein-protein interactions. More generally, we aimed to place the ncAA at positions likely to be solventaccessible and tolerant of substitution, while avoiding highly conserved or functionally essential residues.”
(4) Studies in Figures 1 and 2 lack essential controls, including background signal from Anap in non-transfected cells, or those transfected with plasmids lacking the tRNA or tRS.
This is an important point, also raised by Reviewer 1. To evaluate potential background fluorescence arising from Anap or the labeling system, we performed several control experiments. Specifically, we examined three conditions: (1) cells cultured with Anap supplement, (2) cells expressing the Anap incorporation system with the addition of Anap, and (3) cells expressing both the TAG-mutated protein plasmid and the Anap incorporation system but without the addition of Anap. Under all three conditions, we observed no detectable fluorescence signal (Supplementary Fig. 1).
(5) Another marker of stress granules should be used for confirming the identity of G3BP1-Anap (+) or TDP-43-Anap (+) structures, including TIA1, TAF15, or polyA RNA.
We appreciate this helpful suggestion. To further confirm the identity of the stress granule structures observed in our experiments, we performed colocalization analysis with TIA-1, a well-established marker of stress granules. The results have been included in revised manuscript.
“Additionally, we examined the colocalization of G3BP1-Anap with TIA-1, another established stress granule marker. Under stress conditions, G3BP1-Anap largely colocalized with TIA-1 within stress granules. Interestingly, under basal conditions, the nuclear signal of G3BP1-Anap, which was not detected by antibody staining, appeared to partially colocalize with TIA-1 in several condensate-like structures. (Fig. 1I).”
(6) There is no information on the number of granules bleached or the number of cells selected for FRAP studies. There is no information on the shaded areas in Figure 1F or 1G, and no information on statistical comparisons between regressions in Figure 1F.
We thank the reviewer for pointing out these omissions. We have revised the figure legends to clarify these details.
“One granule from each of three independent cells was selected and photobleached for FRAP analysis.”
“Here, error bars with filled area are used for better data presentation. FRAP recovery curves were compared using two-way ANOVA.”
(7) Protein dynamics measured by FRAP are highly dependent on the concentration and/or expression level of each protein. Because of this, the authors need to control for expression level in all FRAP studies.
We agree that protein concentration and expression level can influence FRAP recovery kinetics. Since Anap incorporation is based on amber suppression, and the suppression rate in each cell varies, so it is difficult to control the expression of Anap labeled proteins, however, to minimize this potential effect, we performed FRAP measurements on cells exhibiting comparable fluorescence intensities, which served as a proxy for similar expression levels of the labeled proteins. In addition, FRAP analyses were conducted on individual granules within cells expressing moderate levels of the protein, avoiding cells with unusually high fluorescence intensity that might reflect overexpression.
Furthermore, fluorescence recovery was normalized to the pre-bleach intensity of the selected granules, which reduces variability arising from differences in overall expression levels between cells.
(8) There is no point of reference for TDP-43-Anap FRAP results in Figure 1G. Additional studies using variants harboring a mutated NLS (mNLS) can be used in place of TDP43-YFP.
This is a helpful suggestion. In response, we have performed additional FRAP experiments using TDP-43<sup>ΔNLS</sup>, a commonly used construct that promotes cytoplasmic localization and facilitates analysis of TDP-43 granules. The results from TDP-43<sup>ΔNLS</sup> have now been included as a reference for the FRAP measurements of TDP-43-Anap in the revised manuscript (Fig. 1D, 1G).
“We then used YFP-tagged nuclear localization signal (NLS)-deleted TDP-43 (TDP43<sup>ΔNLS</sup>-YFP) as a reference and performed FRAP analysis to compare the mobility of TDP-43-Anap and TDP-43<sup>ΔNLS</sup>-YFP. Fluorescence recovery of TDP-43-Anap reached ~45% within 20 s after photobleaching, consistent with liquid-like dynamics. In contrast, TDP-43<sup>ΔNLS</sup>-YFP showed only ~22% recovery, suggesting more solid-like dynamics (Fig. 1D, 1G). These results are consistent with previous reports describing relatively immobile aggregates formed by TDP-43<sup>ΔNLS4</sup>and illustrate the advantage of Anap-based labeling, which preserves native protein properties and enables real-time assessment of protein dynamics without introducing disruptive mutations.”
(9) There is no point of reference for comparing FRAP results from G3BP1-GFP to G3BP1-Anap. What is the 'gold standard'? Without this, it is difficult to conclude that "... Anap labeling better preserved the native mobility and biophysical properties of G3BP1 than the conventional GFP tag."
We acknowledge this important point and agree that there is currently no definitive gold standard for measuring the native mobility of endogenous G3BP1 within stress granules in living cells. Our intention was not to claim that the Anap-labeled protein definitively represents the native state, but rather to compare the relative effects of different labeling strategies.
Thus, we rewrite the sentence as “These results suggest that G3BP1-Anap displays higher mobility compared with G3BP1-GFP, indicating that Anap labeling may provide a less perturbative approach for monitoring G3BP1 dynamics.”
(10) The WB in Figure 1H is overexposed, making it difficult to compare expression levels between WT and V100Anap-transfected cells. In addition, there is no similar assay for confirming G3BP1-Anap expression.
Thank you for pointing this out. In the revised manuscript, we have replaced the image with a properly exposed Western blot to allow clearer comparison of protein expression levels.
In addition, we have now included a corresponding western blot analysis to confirm the expression of G3BP1-Anap in G3BP knockout U2OS cell (Fig. 1H). These results verify that the Anap-labeled proteins are expressed at detectable levels and support the interpretation of the imaging and FRAP experiments.
(11) Although survival studies in Figures 1I and J are promising, a more convincing demonstration of functional replacement of TDP-43 would involve an assessment of cryptic exon splicing, comparing WT to TDP-43 KO, V100Stop- and V100Anaptransfected cells.
This is a valuable suggestion.
“We also evaluated TDP-43-dependent RNA splicing activity by examining the expression of PFKP, a well-established target that undergoes cryptic exon inclusion upon loss of TDP-43 function17. As shown in Figures 1K and 1L, expression of TDP-43Anap in TDP-43 knockout HeLa cells restored PFKP expression, indicating that the Anap-labeled protein retains functional RNA splicing activity. These results demonstrate that TDP-43-Anap is capable of functionally compensating for endogenous TDP-43, supporting that the incorporation of Anap does not substantially disrupt the protein’s biological function.”
(12) Tuj1 staining in Figure 2 is inconsistent and often fails to confirm neuronal identity.
We thank the reviewer for this important comment. We acknowledge that Tuj1 staining in Figure 2 is variable and, in some cases, does not clearly delineate neuronal identity. Notably, the reduced Tuj1 signal is primarily observed in neurons that express Anap-labeled proteins under sodium arsenite treatment, which likely reflects the combined effects of transfection-associated stress and oxidative stress on neuronal morphology and cytoskeletal integrity.
In addition, transfection efficiency in primary neurons is inherently low and variable, and cells that successfully express the constructs may represent a more stress-sensitive subpopulation, further contributing to variability in staining quality. Despite optimization efforts, these technical constraints limit the consistency of Tuj1 labeling under these experimental conditions.
(13) Close-up images and correlation scatter plots in Figures 1 and 2 do not add very much information.
We thank the reviewer for this comment. To address the reviewer’s concern, we have revised the figure legends to better clarify the purpose of these panels and how they support the quantitative analysis presented in the manuscript.
For scatter plot, “Colocalization threshold analysis was performed in Fiji/ImageJ to calculate the Pearson correlation coefficient (R) for each region of interest (A, B, I, J). The X- and Y-axes represent the fluorescence intensity values of the red and green channels, respectively. When signals are colocalized, pixels with high intensity in one channel correspond to high intensity in the other, forming a diagonal distribution. In contrast, non-colocalized signals cluster along the axes. A higher R value indicates a greater degree of colocalization. Scale bar, 3 μm.”
Same information was added to figure legend of figure 2.
For the scheme, please see line 412-413 in the revised manuscript.
Reference:
(1) Rothstein, J.D. et al. Sporadic ALS induced pluripotent stem cell derived neurons reveal hallmarks of TDP-43 loss of function. Nature Communications 16, 7092 (2025).
(2) Shadish, J.A. & Lee, J.C. Genetically encoded lysine photocage for spatiotemporal control of TDP-43 nuclear import. Biophys Chem 307, 107191 (2024).
(3) Gasset-Rosa, F. et al. Cytoplasmic TDP-43 De-mixing Independent of Stress Granules Drives Inhibition of Nuclear Import, Loss of Nuclear TDP-43, and Cell Death. Neuron 102, 339–357.e337 (2019).
(4) Yan, X. et al. Intra-condensate demixing of TDP-43 inside stress granules generates pathological aggregates. Cell 188, 4123–4140.e4118 (2025).
(5) Walker, S.E. & Fredrick, K. Preparation and evaluation of acylated tRNAs. Methods 44, 81–86 (2008).
(6) Kassouf, T. et al. Targeting the NEDP1 enzyme to ameliorate ALS phenotypes through stress granule disassembly. Science Advances 9, eabq7585 (2023).
(7) Van Nerom, M. et al. C9orf72-linked arginine-rich dipeptide repeats aggravate pathological phase separation of G3BP1. Proceedings of the National Academy of Sciences 121, e2402847121 (2024).
(8) Wolozin, B. & Ivanov, P. Stress granules and neurodegeneration. Nat Rev Neurosci 20, 649–666 (2019).
Reviewer #3 (Public review):
The Sustar et al. manuscript catalogs glutamate receptor composition across distinct Drosophila NMJs: larval and adult abdominal NMJs, as well as NMJs on adult leg and flight muscles. This work is important and probably overdue. The larval NMJ is the exemplar NMJ in this system, and the identity of "essential" and "alternative" subunits at this stage is assumed by many to hold across developmental stages and NMJ types. Here, the authors show that there is surprising diversification among NMJ types and that the notion of essential/alternative subunits only holds true at larval NMJs.
The study will generate interest in the Clumsy GluR subunit, which has not been well-characterized at all, but is widely expressed at adult NMJs. They also find striking extrasynaptic expression of glutamate-gated chloride channel GluRClalpha in adult leg and flight muscles, raising questions about its role. The study is interesting, logical, and well-written. The figures are clear, and the discussion was particularly thoughtful. I have a couple of comments that the authors could consider.
(1) They cite Rivlin et al., (2004) in the Introduction as the sole previous study to investigate the molecular composition of adult NMJs, but do not mention this work again. In the Discussion, it would be helpful to compare/contrast their finding with those of the earlier work.
(2) Were these analyses done in adults of consistent ages? It seems possible that the GluR subunit composition could be different in very young adults or in aged flies. The age of the animals should be mentioned in the Methods.
(3) The broad expression of GluCl:V5 in adult leg and flight muscles is surprisingly robust and appears to light up the edges of all muscle fibers. Would the authors comment on the controls that were done to ensure that this staining is real and specific to animals carrying that V5 endogenous tag?
(4) The snRNAseq data in Figure S12 differ a bit from the IHC/GAL4 data summarized in the table in Figure 2. In particular, the data suggests that Ukar and Grik are widely expressed in adult muscles. Is there a reason not to include an "snRNA seq" column in Figure 2 alongside the data from GAL4 lines and IHC? To my mind, it is about as reliable as GAL4 lines that often capture only a subset of the full expression pattern. In this case, the snRNAseq data suggest that Ukar/Grik are likely at adult flight muscle NMJs, which might be important since NMJ was negative for everything except Neto-beta by IHC.
Die Oberfläche ist funktional, verrät aber ihre Desktop-Herkunft, und die Skalierung über einige hundert Bestellungen pro Tag hinaus verlangt meist kostenpflichtige Erweiterungen aus dem Extension Store.
make this: Die Oberfläche ist funktional, verrät aber ihre Desktop-Herkunft. Die Skalierung über einige hundert Bestellungen pro Tag hinaus verlangt meist kostenpflichtige Erweiterungen aus dem Extension Store.
reply to u/Beloved-21 at https://old.reddit.com/r/Zettelkasten/comments/1u2bw2s/index_cards_vs_digital_note_app/
There are a handful of affordances you get with paper over digital.
I'm sure you'll find various others hiding in a digital version of my notes: https://hypothes.is/users/chrisaldrich?q=tag%3A%22note+taking+affordances%22
The real question at the end of the day is what works best for you?!? Try them both out for a few weeks or a month or more and chose the version that works best for your modes of thinking. Experimenting is the only way to answer this question for yourself. You may find other affordances that don't apply to others' work.
Reviewer #1 (Public review):
Summary:
Eroglu and Hobert demonstrate that injecting CRISPR guides and repair constructs to target three genes at a time, tagging each with a different fluorescent protein, and selecting which gene to tag with which fluorophore based on genes' expression levels, can improve efficiency of gene tagging.
Strengths:
This manuscript demonstrates that three genes can be targeted efficiently with three different fluorophores. It also presents some practical considerations, like using the fluorophore least complicated by agar/worm autofluorescence for genes with low expression levels, and cost calculations if the same methods were used on all genes.
Weaknesses:
Eroglu has demonstrated in a previous publication that single-stranded DNA injection can increase efficiency of CRISPR in C. elegans, while inserting two fluorescent proteins and a co-CRISPR marker into three loci, and Paix et al 2015 demonstrated simultaneous insertion of two fluorescent tags. The current work is valuable and incremental advance. In general, I applaud the authors' willingness to strategize about how whole proteome tagging might be accomplished. I predict that the advance here will be one of many small advances that will get the field to that goal. The title oversells the advance presented, in my view, since seems like one among many key advances, and the first sentence of the Discussion seems a more apt summary of the key advance here.
Some injections targeted genes on the same chromosome together, which will create unnecessary issues when doing crossing that will be useful for some future experiments. This made me wonder if injecting 3 together really is helpful vs targeting each gene separately, since only 5 worms need to be injected. It cuts time down by 2/3, but perhaps avoiding targeting the same chromosome with two tags would be useful.
The limited utility of current blue fluorescent proteins makes me wonder if it's worth using at this stage, before there are better blue fluorescent proteins, or better yet, far red, to avoid issues with live imaging under phototoxic UV or near-UV illumination.
Reviewer #4 (Public review):
Summary:
Tagging the entire proteome of a metazoan would be a landmark achievement, providing a powerful complement and extension to existing "omic" catalogs in model systems. Here, Eroglu and Hobert argue that efficiently tagging multiple loci in a single "batch" would make the community-based achievement of this goal realistic. They provide rigorous evidence that such an approach is indeed feasible, exploring issues related to efficiency, design and screening strategies, disruption of gene function, and the potential for endogenously tagged alleles to reveal unexpected aspects of protein expression and localization. While the work has some minor gaps that are important to rigorously assess the feasibility of the proposed effort, the detailed and valuable insights that emerge should provide impetus to the community to coordinate efforts to make this ambitious goal a reality.
Strengths:
The work has numerous strengths. The authors provide compelling evidence that:
- three distinct loci can be efficiently targeted with three distinct fluorescent tags in a single injection.
- thoughtful targeting design can reduce the likelihood of disruption of function by the tag.
- systematic design principles based on expression level and predicted localization/function can be used to optimize tagging strategies.
- the resulting tags can provide unexpected insight into patterns of protein production and subcellular localization.
Not all of these advances are novel in themselves, but taken together, they represent an important technical and conceptual advance. The most important strength comes from the exceptionally high value of the goal itself, in that the work is that it has the potential to spur a community-wide effort toward achieving the ambitious goal of proteome-wide tagging.
Weaknesses:
The work's shortcomings are minor.
- One concern has to do with the feasibility of the proposed screening strategies. The experimental design cleverly coinjects tags for three loci in different gene expression 'zones'; this expression level determines which tag will be used. As the authors allude to, there is an important distinction between genes with the same overall FKPM value between those that are expressed broadly and those focally expressed in a specific tissue. The proposed strategy claims that there are a sufficient number of highly expressed genes "to be used as visible markers" for recovering successfully edited animals. It would be useful for the authors to discuss the issue of broad vs focused expression among this set of genes a bit more thoroughly, with an eye toward the issue of how likely it is that these genes could indeed consistently be used as visible markers, particularly for those at the low end of this limit.
- What fraction of the proteome (on a per-gene basis) is secreted proteins? How difficult will it be to screen these for successful tags? Are there specific tags that would be more optimal for secreted proteins? (The authors mention the use of an SL2 or T2A cassette to label the cells in which these proteins are expressed but note that there are technical challenges associated with doing this at scale.)
- For secreted and/or weakly expressed genes, it would be useful for the authors to estimate for what fraction of these would successful insertions need to be screened by PCR, and what resources (time and money) this would likely entail.
- For how many genes would a single tag not capture all predicted isoforms?
- Finally, some readers might object to the authors' assertion in the abstract that this work is "a first step in this direction" (presumably referring to designing a strategy for whole-proteome tagging). There is no concern that the authors are disregarding the extensive work of other groups, as they explicitly mention the contributions of other groups to the foundation that enables the present work. However, the spirit of the abstract could be misinterpreted by a well-intentioned reader.
Author response:
The following is the authors’ response to the previous reviews
Reviewer #1 (Public review):
Summary:
Eroglu and Hobert demonstrate that injecting CRISPR guides and repair constructs to target three genes at a time, tagging each with a different fluorescent protein, and selecting which gene to tag with which fluorophore based on genes' expression levels, can improve efficiency of gene tagging.
Strengths:
This manuscript demonstrates that three genes can be targeted efficiently with three different fluorophores. It also presents some practical considerations, like using the fluorophore least complicated by agar/worm autofluorescence for genes with low expression levels, and cost calculations if the same methods were used on all genes.
Weaknesses:
Eroglu has demonstrated in a previous publication that single-stranded DNA injection can increase efficiency of CRISPR in C. elegans, while inserting two fluorescent proteins and a co-CRISPR marker into three loci, and Paix et al 2015 demonstrated simultaneous insertion of two fluorescent tags. The current work is valuable and incremental advance. In general, I applaud the authors' willingness to strategize about how whole proteome tagging might be accomplished. I predict that the advance here will be one of many small advances that will get the field to that goal. The title oversells the advance presented, in my view, since seems like one among many key advances, and the first sentence of the Discussion seems a more apt summary of the key advance here.
Some injections targeted genes on the same chromosome together, which will create unnecessary issues when doing crossing that will be useful for some future experiments. This made me wonder if injecting 3 together really is helpful vs targeting each gene separately, since only 5 worms need to be injected. It cuts time down by 2/3, but perhaps avoiding targeting the same chromosome with two tags would be useful.
The limited utility of current blue fluorescent proteins makes me wonder if it's worth using at this stage, before there are better blue fluorescent proteins, or better yet, far red, to avoid issues with live imaging under phototoxic UV or near-UV illumination.
These comments are a repeat of the original comments, and we refer the reader to our response to the original comments.
Reviewer #2 (Public review):
Original Review:
The manuscript by Eroglu and Hobert presents a set of strains each harboring up to three fluorescently tagged endogenous proteins. While there is technically nothing wrong with the method and the images are beautiful, we struggled to appreciate the advance of this work - who is this paper for?
As a technical method, the advance is minimal since the first author had already demonstrated that three mutations (fluorophore insertion and co-CRISPR marker) could be introduced simultaneously.
As a pilot for creating genome-scale resources, it is not clear whether three different fluorophores in one animal, while elegantly designed and implemented, will be desired by the broader community.
Finally, the interpretation of the patterns observed in the created lines leaves much to be desired. A Table with all the observations must be included and can replace the tedious (and often wrong) descriptions of the observations with the different lines. It would be too much to point out every mistaken expectation of protein expression. Two examples include:
The expectation that ACDH-10 is enriched in the intestine and epidermal tissues (hypodermis) is naïve - there are multiple paralogs of this protein (look at WormPaths or WormFlux) that may share functions in different tissues. There is also no reason to assume that fatty acid metabolism does not occur in other tissues (including the germline). Finally, there are no published studies about this enzyme, so we really don't know for sure what it's doing.
The expectation that HXK-1 is ubiquitously expressed is similarly naïve. There are three paralogous enzymes that are all associated with the same reaction, and we have shown that these three function redundantly in vivo, perhaps in different tissues (PMID: 40011787). Moreover, single cell RNA-seq data (PMID: 38816550) also shows enrichment of hxk-1 in gonadal sheath cells.
The table should have at least the following information: gene/protein name - Wormbase ID - TPM levels of single cell data assigned to tissues for L2, L4 and adult (all published) - tissues in which expression is observed in the lines presented by the authors.
Other points:
(1) We would encourage the authors to provide systematic validation of the reported insertions. The manuscript reports that 24 of 30 tags were isolated and visible but does not clearly state whether each isolated line was confirmed by sequence‑level validation to be correctly in‑frame and free of unintended mutations at the target locus.
(2) The manuscript presents aggregated success counts (e.g., 8/10 mTagBFP2 tags, 9/10 mStayGold, 7/10 mScarlet3) and useful narrative descriptions of injection outcomes. We suggest also to include per‑locus success rates.
(3) For pools that required re‑injection after initial failures, we would like to see a description of the specific changes that were made to the injection mixes or procedures (e.g., new repair template prep, different Cas9 reagent lot, guide redesign). This will be useful troubleshooting information for others.
(4) The authors states that the fluorophore sequences are codon-optimized for C. elegans. We suggest they provide the exact donor/tag sequences used specifically state whether the fluorophore sequences contain any synthetic/artificial introns or other sequence modifications (e.g., silent PAM‑disrupting mutations) were included in the donor templates.
(5) Page 3: Include a reference for "The C. elegans genome encodes around 20,000 genes"
We hope these comments are useful.
Comments on Revised Version:
Overall, we found the responses to be quite recalcitrant.
We have one remaining composite concern about the comparison between observed expression patterns with the new strains versus published data.
First, the authors only report patterns for one stage while it should be not too much effort to image the different life stages. However, since this is a revision, we are not formally requesting they do this.
Second, in the now provided Table (thank you) 'observed expression' (last column) is lacking for 9 of the 30 proteins, and for 6 of these the procedure was not successful. Why not report patterns for the other three? It is confusing also because on page 5, the authors say that "overall, 24 of 30 tags ...all of which were visible with fluorescence stereomicroscopy" - are we missing something? Also, they then said that they "obtained 6/9 of the originally failed tags"; why are the corresponding patterns not included in table 1, and are 9 proteins still labeled as "no" in the "success?" Column?
We appreciate the chance to clarify this matter: There are only 6 “no” in the “success” column. In two cases, HAT-1 and CBP-1, expression was dim at F1 but still sufficient to pick positive worms and quantify success rate at the locus. We noted these as “dim” on the table to indicate that if expression was lower, we likely would not have been able to isolate them at F1. In one case, COX-6B, expression was too dim at F1 to be isolated but was sufficient at F2 to be visualized and isolated from parents that were positive for the other two tags. We now clarified this distinction in the table and accompanying text: “Fluorescent signals of HAT-1::mScarlet3 and CBP-1::mScarlet3 in F1 progeny were dim but still sufficiently visible for quantification of knock-in efficiency, indicating that they are at the lower end of detectability for mScarlet3.”
We imaged worms that had multiple tags as proof of principle and are happy to provide strains to those who would like to image/study them. At this point we are not convinced that imaging more worms would add to the conceptual framework.
Third, we strongly feel that the response to our comments about expression patterns is not adequate. On page 5 the authors say that "all proteins were expected to be ubiquitously expressed" and that "scRNA-seq indicated that transcript abundance was ubiquitous and without strong tissue-specific enrichment with few exceptions". However, in their rebuttal, the authors now argue for tissue-specific expression for proteins with paralogs, turning around their own argument! Moreover, their Table indicates that many genes show tissue-enriched expression by RNA-seq while many of their tagged proteins exhibit ubiquitous expression.
We respectfully disagree that there is contradiction. In our response, the discussion on paralogs was added as a clarification in response to the referee’s original comments (e.g., regarding ACDH-10): “There is also no reason to assume that fatty acid metabolism does not occur in other tissues (including the germline).” We wanted to make it clear that we were not concluding fatty acid metabolism (or other processes) does not occur in other tissues.
We wish to stress that we never argued that paralogs could not fulfil the same essential function across tissues. The proteins were selected because their biological functions (e.g., glycolysis, fatty acid β-oxidation, translation) are broadly required, and that scRNA seq generally predicted broad expression with few exceptions as detailed in the text. Paralogs with similar activities (e.g., hxk-1, -2, -3) may overlap broadly in expression, or individual paralogs may carry out the process in different tissues provided one carries out the reaction in each tissue. For acdh-10 and hxk-1 specifically, both appear broadly expressed across tissues by scRNA-seq, with no consistent enrichment or depletion across datasets. So, our central point is that: for a specific gene involved in an essential process, transcript data alone are not sufficient to accurately predict tissue specific enrichment. Not that the processes do not occur in tissues where one paralog is absent. The possibility that a paralog may compensate for lack of expression is in no way contradictory with our conclusion.
The table does not generally show tissue-enriched expression: it simply lists three tissues with the highest quantitative value in the respective dataset. For instance, taking the first gene from the list (Y82E9BR.3) and looking at the Ghaddar dataset, the top 3 tissues (log2(TPM)) are: pharyngeal muscle (13.4), gonadal sheath (12.9), marginal cells (12.9). The next 3 tissues are: body wall muscle (12.9), pharyngeal epithelium (12.8), and intestine (12.3). Even when there were apparent enrichments among the top 3 tissues, there were significant disagreements between datasets, and beyond top 3 even greater disagreements (the datasets agreed on the top tissue only 4 times over the 30 genes). These indicate that much of the variation is attributable to experimental noise rather than true predicted enrichment. The referee points to HXK-1 being correctly gonadal sheath enriched in one scRNA dataset; however, the other two datasets actually show different sites as being highest, and the same dataset misses effects in other cases. This is precisely why protein level data is needed.
We further clarified this issue in the text: “We thus selected 30 genes across a variety of bulk transcript expression ranges which are generally predicted to be broadly expressed based on molecular function or, where molecular function was unknown (e.g., ZK632.9), single cell RNA sequencing (scRNA-seq) data (Table 1, Fig. 2A, B) (Gao et al., 2024; Ghaddar et al., 2023; Taylor et al., 2021).”
Overall, this indicates that both the overall accomplishment of generating tagged protein strains and analyzing their expression is oversold.
We have tried to make clear that our contribution is not a handful of new tagged strains added to the many that already exist. Rather, as stated in the abstract and elsewhere, we propose a strategy and provide proof-of-concept for scaling up tagging efforts. We believe the importance of this cannot be oversold.
Reviewer #3 (Public review):
Summary:
The authors argue that establishing the expression pattern and sub-cellular localisation of an animal's proteome will highlight hypotheses for further study. This claim is probably accepted by many in the community. This manuscript seeks to confirm the feasibility of establishing such a resource, by using current transgenic methods to knock in DNA encoding different colored fluorescent tags into C. elegans genes.
Strengths:
The authors make the points above. For example, they provide evidence that the C. elegans germline harbors two populations of mitochondria that differ qualitatively in the proteins they express. They also confirm that labelling the whole proteome is an achievable goal with relatively limited resources and time.
Weaknesses:
The work is somewhat incremental in that it uses existing transgenic technology. Cell biology in C. elegans is challenging because of the small size of many of its cells, notably neurons. This can make establishing the sub-cellular localisation of a fluorescently tagged protein, or co-localizing it with another protein, tricky. The authors point out in their introduction that advances in light microscopy such as diSPIM, STED and ISM (a close relative of SIM), have increased the resolution of light microscopy. They also point out that recent advances in expansion microscopy can similarly help overcome the resolution limit. However, they do not use these technologies to characterize their transgenic strains.
Reviewer #4 (Public review):
Summary:
Tagging the entire proteome of a metazoan would be a landmark achievement, providing a powerful complement and extension to existing "omic" catalogs in model systems. Here, Eroglu and Hobert argue that efficiently tagging multiple loci in a single "batch" would make the community-based achievement of this goal realistic. They provide rigorous evidence that such an approach is indeed feasible, exploring issues related to efficiency, design and screening strategies, disruption of gene function, and the potential for endogenously tagged alleles to reveal unexpected aspects of protein expression and localization. While the work has some minor gaps that are important to rigorously assess the feasibility of the proposed effort, the detailed and valuable insights that emerge should provide impetus to the community to coordinate efforts to make this ambitious goal a reality.
Strengths:
The work has numerous strengths. The authors provide compelling evidence that:
Three distinct loci can be efficiently targeted with three distinct fluorescent tags in a single injection.
Thoughtful targeting design can reduce the likelihood of disruption of function by the tag.
Systematic design principles based on expression level and predicted localization/function can be used to optimize tagging strategies.
The resulting tags can provide unexpected insight into patterns of protein production and subcellular localization.
Not all of these advances are novel in themselves, but taken together, they represent an important technical and conceptual advance. The most important strength comes from the exceptionally high value of the goal itself, in that the work is that it has the potential to spur a community-wide effort toward achieving the ambitious goal of proteome-wide tagging.
We appreciate the referee’s enthusiasm and hope that this will engage members of the community in a collective effort.
Weaknesses:
The work's shortcomings are minor.
One concern has to do with the feasibility of the proposed screening strategies. The experimental design cleverly coinjects tags for three loci in different gene expression 'zones'; this expression level determines which tag will be used. As the authors allude to, there is an important distinction between genes with the same overall FKPM value between those that are expressed broadly and those focally expressed in a specific tissue. The proposed strategy claims that there are a sufficient number of highly expressed genes "to be used as visible markers" for recovering successfully edited animals. It would be useful for the authors to discuss the issue of broad vs focused expression among this set of genes a bit more thoroughly, with an eye toward the issue of how likely it is that these genes could indeed consistently be used as visible markers, particularly for those at the low end of this limit.
To give two examples, this principle aided us with screening F54C8.1 and HAT-1. We added additional discussion on this to the first paragraph of the discussion: “For instance, we could clearly visualize F54C8.1::mScarlet3 in adult sperm by fluorescence stereomicroscopy despite a bulk FPKM of 16. Similarly, nuclear localized proteins will likely be easier to detect even at low expression levels, given the concentration of signal in small subcellular compartments. Indeed, this helped us detect HAT-1::mScarlet3 (56 bulk FPKM), which may have been too dim if distributed more broadly within cells.”
What fraction of the proteome (on a per-gene basis) is secreted proteins? How difficult will it be to screen these for successful tags? Are there specific tags that would be more optimal for secreted proteins? (The authors mention the use of an SL2 or T2A cassette to label the cells in which these proteins are expressed but note that there are technical challenges associated with doing this at scale.)
We added some of these points to the discussion: “Moreover, around 17% of the C. elegans genome (3,484 genes) may encode for secreted proteins (Suh and Hutter, 2012). Endogenous tagging of a substantial fraction of these proteins could reveal spatial patterns of secretion, distinguishing components that remain near their cell of origin from those that disperse to distal sites (Keeley et al., 2020). Tagging secreted proteins can also reveal sites of secretion – such as apical or basolateral membranes, or neurites – as has been observed for specific insulins (Sural et al., 2025) and for neuropeptides that localize selectively to synaptic regions (Toker et al., 2025).”
Various tags have been used for secreted proteins including Venus, TagRFP, and mNeonGreen. The pH of secretory vesicles is ~5.0-5.5, so chosen FPs should have a pKa below this range to avoid denaturation. All 3 fluorophores used here (mStayGold, mScarlet3 and mTagBFP2) have pKa’s below this range and would likely be fluorescent within secretory vesicles.
For secreted and/or weakly expressed genes, it would be useful for the authors to estimate for what fraction of these would successful insertions need to be screened by PCR, and what resources (time and money) this would likely entail.
We think that the bulk of ECM proteins would likely be visualizable without PCR due to their broad and stable expression, and as mentioned a good portion of these have been already tagged. However, it is likely that most of the secreted small peptides will have to be screened by PCR. We use homemade Taq, which makes material cost of the reagents minimal. A pair of genotyping primers costs ~$8 (~$27,872 for all secreted genes).
Hands on time for lysis of 48-96 worms is approximately 20-30 minutes, with time to set up PCR around 5-10 minutes per target, and time to load a gel of 10 mins. In a given pool, 2/3 could be a putative secreted protein; thus, the same lysed population would enable screening for two targets at once. Collectively, around 40-60 mins of hands-on time would be required for two genes (around 20-30 mins per gene). Given 18 targets are injected per day, if 12 are screened by PCR, the screening could be done in 6 hours per day without affecting throughput. Most of the time spent on PCR would be replacing fluorescence screening time and would not overlap with the rate limiting injection step, performed by a separate specialist.
For how many genes would a single tag not capture all predicted isoforms?
Around 25% of C. elegans genes are thought to undergo alternative splicing (PMID: 21177968), with on average, ~2 isoforms per transcript. Among our selected genes, we only had one case where a single tag would not capture all isoforms (flad-1). We examined an additional 30 random genes and found no more examples by chance. So, in our view, this will be rare though we recognize in some cases a practical decision will need to be made, which could involve consideration of expression levels of each terminal exon.
Finally, some readers might object to the authors' assertion in the abstract that this work is "a first step in this direction" (presumably referring to designing a strategy for whole-proteome tagging). There is no concern that the authors are disregarding the extensive work of other groups, as they explicitly mention the contributions of other groups to the foundation that enables the present work. However, the spirit of the abstract could be misinterpreted by a well-intentioned reader.
We appreciate the referee’s perspective and have reworded this phrase in the abstract to: “As proof-of-principle for scalable pooled tagging, we undertook a pilot study in the nematode C. elegans, in which we set out to tag 30 different genetic loci with three different fluorophores, with 3 tags being introduced at a time.”
Author response:
The following is the authors’ response to the original reviews.
eLife Assessment
This study uses the yeast two-hybrid assay to identify proteins that may interact with yeast Set1 and other subunits of COMPASS/Set1C, the histone H3K4 methyltransferase, providing also some evidence for Set1 sumoylation and a role of SET1C methylating other factors in vitro. The results are valuable, and they should contribute to understanding the functions of the conserved SET1C complex, as they suggest potential functional connections with RNA biogenesis, chromatin remodeling, and non-histone methylation, whose implications would yet need to be explored. Nevertheless, apart from the fact that only a small subset of the Y2H interactions is further examined, the validating experiments are only partial or inconclusive, the strength of evidence being at this point incomplete.
We present a systematic SET1C interaction map that provides a structured resource for generating and testing new hypotheses on SET1C function. We emphasise that these interactions represent a hypothesis generating resource rather than a set of validated protein–protein interactions. To reflect this, the manuscript has been carefully revised to distinguish clearly between observation and interpretation, and to avoid overstatement of the data. Accordingly, we have revised the title and the abstract. Selected examples are explored further to illustrate how candidates from the dataset can be followed up, but the primary contribution of this work is to provide a structured framework and resource that can guide future mechanistic studies of SET1C function.
We thank the reviewers for their thoughtful comments. We have followed their recommendations by modifying the structure of the manuscript, removing distracting results and relocating some figures to the supplementary materials to improve the readability of the manuscript. At the same time, the reviewers acknowledge that the dataset is extensive and that aspects of the validation work are valuable.
The changes made to the manuscript's structure in accordance with the reviewers' recommendations are as follows:
(1) Figure 1 is accompanied by a table (Table S2) with the raw data describing all the interactions from the ten 2H screens. This table also lists common interactors found in the independent screens. I'm afraid Table S2 was omitted from the initial submission of the manuscript
(2) Figure 2 has been modified to include an AlphaFold modeling of a seven-subunit Set1C complex (Set1– Bre2–Sdc1<sub>2</sub>–Swd1–Swd3–Spp1) together with Kap104. Figure 2D has been moved to a new Figure S2
(3) The initial figure S2, which was problematic, has been removed, along with the accompanying text.
(4) Figure 3 of the original paper has been moved to the supplementary material and is now shown as a new Figure S3.
(5) Figure 5 in the original paper becomes Figure 3 in the revised version
(6) Figure S3 (Co-IP between Set1 and Prp22), which serves as validation data, has been moved to the main figures and is now presented as Figure 4.
(7) Figure 6 in the original paper becomes Figure 5 in the revised version
(8) Figure 4 from the original paper has been repositioned as the first figure (new Figure 6) of the biochemical characterization of the interaction between Snf2 and Set1C.
(9) Figure 7 has been removed from the manuscript. We have kept the original Figure 7E as a new Figure S6.
(10) Figures 8, 9, 10 become Figures 7, 8, 9.
Public Reviews:
Reviewer #1 (Public review):
We thank Reviewer 1 for the careful and thoughtful evaluation of our manuscript. We fully agree that yeast two hybrid screening provides candidate interactions that require cautious interpretation, and we recognise that our original version did not always make this sufficiently explicit.
In the revised manuscript, we have made substantial changes to address this central concern. All Y2H interactions are now consistently presented as candidate or potential interactions, and speculative statements have been either removed or explicitly framed as hypotheses. Our intention is that the reader can clearly separate the dataset itself from any proposed biological implications.
Second, we have refocused the manuscript to better reflect its primary contribution. We now present the Y2H screens as a comprehensive resource that defines a set of candidate interactions for SET1C, rather than as a set of validated functional relationships. In line with this, we have reduced the emphasis on speculative models and removed sections where the connection to experimental evidence was not sufficiently strong. This includes the removal of Fig. S2 and Fig. 7 and the associated text, as well as the relocation of several figures to the supplementary material. Where appropriate, we have added statements highlighting the limitations of the approaches used and the need for future work to establish physiological relevance.
More generally, we agree with the reviewer that the value of Y2H data lies in generating testable hypotheses rather than establishing conclusions. We have therefore revised the manuscript throughout to ensure that the interpretation remains proportionate to the strength of the evidence.
We hope that these changes address the reviewer’s concerns and result in a clearer and more appropriately balanced presentation of the data.
The manuscript by Luciano et al is a collection of experiments about the yeast histone 3 lysine 4 methyltransferase, Set1, starting with 10 yeast two-hybrid screens (Y2H). Y2H screens were briefly popular 20+ years ago, but the persistently unfavourable false-to-true positive ratios limited their utility, and the conclusion emerged that Y2H is an unreliable approach for gathering protein-protein interaction data. Y2H outcomes are candidate interaction lists at best, strongly contaminated by false positives. Here, the authors employed a company (Hybridomics) to perform the Y2H screens.
The primary data is not presented, and the outcomes are summarized using the Hybridomics in-house quality scoring system in Figure 1A. It is not possible to evaluate these data, and the manuscript presents cartoon summaries that the reader must accept as valuable.
Hybrigenics brings extensive experience from conducting numerous screens, enabling the team to recognize recurring false positives that commonly arise in screening assays. In their detailed analysis, Hybrigenics reports the number of clones recovered and the extent of overlap among interaction regions, both of which contribute to the confidence scores they assign. Table S2, provided in the revised version, more accurately reflects the raw data obtained by Hybrigenics. Nevertheless, we agree that false positives contaminate the list of potential interactors. Some interactions may also be indirect through a common interactor and do not reflect a physiological interaction.
(1) Based on the extensive knowledge about Set1C/COMPASS acquired from genetics and biochemistry by many labs (including the Geli lab), the results presented here from the 10 Y2H screens are notably patchy. Of the 7 subunits of this complex, only one (Spp1) was identified using Set1 as bait. Conversely, as baits, Swd2, Spp1, Shg1, captured Set1, and the Bre2-Sdc1 interaction was reciprocally identified. These interactions were scored at the highest confidence level, which lends some confidence to the screens. However, the missing interactions, even at the third confidence level, indicate that any Y2H conclusions using these data must be qualified with caution. The authors do not appear to be cautious in their lengthy evaluations of these candidate interactions, which are illustrated with cartoons in Figures 2 and 3, with some support from the literature but almost without additional evidence. Snf2 is a particularly interesting candidate, which the authors support with pull-down experiments after mixing the two proteins in vitro (Figure 4). After Y2H, this is the least convincing evidence for a protein-protein interaction, and no further, more reliable evidence is supplied.
We thank the reviewer for raising this important point regarding the strength of the evidence supporting the Set1– Snf2 interaction. We agree that the current data do not establish a definitive physiological interaction. In the discussion, we explicitly note the limitations of the current data.
For Figure 2, as recommended by referee 2, we performed AlphaFold modeling of a seven-subunit Set1C complex (Set1–Bre2–Sdc1<sub>2</sub>–Swd1–Swd3–Spp1) together with Kap104. Consistent with the Y2H data, the model recapitulates binding of the Kap104 SID to the PY-NLS region of Set1 (residues 40–90).
We have moved Figure 3 in the supplementary materials.
(2) Figure 5 continues the cartoon summary of extrapolations from the Y2H screens, again without supporting evidence, except that the authors state.
Figure 5 is now Figure 3. We have added the statement in the text: “It is not feasible to validate all of these interactions within the limits of this manuscript, and their validity should therefore be interpreted with caution. Nonetheless, these findings provide a useful basis for future research”.
"We have refined the interaction region between Set1, Prp8 and Prp22, showing that Prp8 and Prp22 interact strongly with Set1-F4 (n-SET). Prp22 interacts in addition with Set1-F1 (Figure S2)." However, Figure S2 does not show this evidence and is incoherent.
When we say that we have refined the interaction region between Set1, Prp8, and Prp22, we mean that we have restricted the interaction regions according to Y2H criteria. Indeed, we have not shown the spots illustrating the results. This statement has been deleted as well as Fig. S2
The figure legends for Figure S2B and C do not correspond to the figure.
(B) Expression of the F1-F5 fragments in yeast cells. Fusion proteins were detected with an anti-GAL4 monoclonal antibody. TOTO yeast cells (Hybrigenics) were transformed with the different pB66-Set1-F1 to F5 plasmids and subsequently with either P6, pP6-Snf2 762-968, pP6-Prp8 37-250, or pP6-Prp22 379-763 that were identified in the Y2H screens. Transformed cells were incubated 3 days at 30{degree sign}C on SD-LEU-TRP and then restreaked on SD-LEU-TRP-HIS with 3AT. Cell growth was monitored after 2 days at 30{degree sign}C.
(C) Solid and dotted arrows indicate that transformed TOTO cells transformed with pB66-Set1-F1 to F5 and the indicated prey (Snf2, Prp8, and Prp22) are growing in the presence of 20 mM and 5 mM of AT, respectively.
Figure S2D is two almost featureless dark grey panels accompanied by the figure legend D) Control experiment showing that TOTO cells transformed with p6 and pB66-Set1-F4 are not gowing (sic) in the presence of 5 mM or 20 mM AT.
We agree that the legend for Figure S2 was unclear and does not accurately describe the panels shown in the figure. Fig; S2 has been deleted in the revised version. The results shown in the original Fig. S2 add limited information and may detract from the clarity of the main points.
In the revised version, we have moved the CoIP analysis demonstrating the interaction between Set1 and Prp22 (previously shown in Figure S3) into the main figures (now Figure 4) to further support and validate the two-hybrid screening results presented there.
Line 343. Interestingly, the two-hybrid screens reveal that Set1 1-754 interacted with Gag capsid-like proteins of Ty1 (Figure S5), raising the possibility that Set1 binding to Ty1 mRNA is linked to the interaction of Set1 1-754 with Gag.
This is another example of the primary mistake repeatedly made by the authors -Y2H interactions are candidate results and not conclusive evidence.
This statement is supported by our previous findings showing that Set1 binds Ty1 mRNA independently of its dRRM domain and represses Ty1 mobility at a post-transcriptional stage (Luciano et al., Cell Discovery, 2017; PMID: 29071121). One possible explanation for Set1 association with Ty1 mRNA is its interaction with the Gag capsidlike protein. In this context, the observed interaction between Set1(1–754) and Gag capsid-like proteins is consistent with this model.
To further illustrate this point, the authors highlight the candidate interaction between Nis1 and 3 Set1C subunits.
While we agree that the Nis1-Set1C interaction has not been demonstrated beyond doubt, we feel that our Y2H and in vitro binding experiments provide reasonable evidence that the interactions may be relevant. It is important to consider that any interaction assay can provide negative (and false positive) results, this includes Y2H, in vitro binding and mass-spec analysis of purified complexes from cells. We feel that it is not appropriate to only trust protein interactions that are strong and stable enough to be demonstrated via purified complexes. It is clear that some protein interactions do occur in transient and weak manner and therefore are not compatible with biochemical purification approach. This indeed is the strength of alternative methods like Y2H and in vitro binding assays, that interactions can be identified and tested even if the physiological context of the interaction may be more complex.
(3) After multiple speculations based on the Y2H candidates, the authors changed to focus on sumoylation of Set1, which has previously reported to be sumoylated. Evidence identifying two sumoylation sites in Set1, in the N-SET and SET domains, is valuable and adds important progress to the role of sumoylation in the regulation of H3K4 methyltransferase, relevant for all eukaryotes. This illuminating part of the manuscript is only tenuously connected to the preceding Y2H screens and concomitant speculations.
We thank Referee 1 for their comment. While it is true that there is only a modest connection between Set1 interactors involved in direct or indirect sumoylation and the characterization of Set1 SUMOylation sites, we believe that this does not constitute a weakness of the manuscript.
(4) The manuscript then describes a red herring exercise involving Set1 methylation of Nrm1. In an already speculative and difficult manuscript, it is exasperating to read a paragraph about a failed idea. Apart from panel E, Figure 7 is a distraction, and I believe it should not be shared.
(5) However, despite the failure with Nrm1, Line 443 - The H3K4-like domain in Nrm1 raised our attention to other yeast proteins that carry such sequences.
This line of thinking is even less connected to the Y2H screens than the sumoylation work.
However, the authors present a reasonable evaluation of the yeast proteome screened for six amino acids similar to the known H3K4 motif ARTKQT (Figure 7e).
(6) However, this evaluation goes nowhere and has no connection with the next section of the manuscript, which is entirely speculation about the regulation of metabolism and stress responses based on the Y2H results and selected evidence from the literature.
In response to comments 4 and 5, we have removed Fig. 7 and the paragraph titled “The transcriptional corepressor Nrm1 interacts with SET1C.” Part of this paragraph and the section describing the screen of the yeast proteome for six–amino acid sequences resembling the H3K4 motif (ARTKQT) has been kept as Fig. S6.
In the abstract, we have removed the sentence: We demonstrate that the transcriptional corepressor Nrm1 is methylated by SET1C in vitro suggesting that H3K4-like domains may represent a class of non-histone substrates for SET1C.
At the end of the introduction, we have deleted “the transcriptional corepressor Nrm1” in the sentence: In addition, we demonstrate that the transcriptional corepressor Nrm1 and the Snf2 AT-hook are both methylated by SET1C in vitro
(7) The manuscript then describes more failed experiments regarding lysine methylation of Snf2 by Set1C, which unexpectedly reports arginine methylation rather than lysine. The manuscript does not currently meet the standard expected for this type of paper - the composition is somewhat incoherent and there are no previous reports of arginine methylation by SET domain proteins.
We have integrated extensive in vitro reconstruction experiments with complementary in vivo studies, all conducted according to the rigorous standards expected by leading journals. These approaches have allowed us to reach the conclusions presented in this manuscript. While some of these findings are unexpected, they are supported by the data. We have carefully discussed the results and their limitations to provide a comprehensive interpretation.
The manuscript presents a very experienced grasp of the literature and a sophisticated appreciation of the forefront issues, but a surprising failure to eliminate uninformative failures and peripheral distractions. The over interpretation of Y2H results is a dominating failure. There are some valuable parts within this manuscript, and hopefully, the authors can reformat to eliminate the defects and appropriately qualify the candidate data.
We thank Referee 1 for these insightful comments. In the revised version, we have followed the advice to remove non-informative failures and peripheral distractions. Additionally, we exercise greater caution to avoid over-interpreting the Y2H results.
Reviewer #2 (Public review):
Summary:
This paper starts with a large-scale yeast two-hybrid (Y2H) screen using Set1 (full-length and smaller parts) and other Set1C/COMPASS subunits as bait. There are hundreds of possible interactions identified, but only a small number are given any follow-up. While it's useful to document all the possible interactions, the unfocused and preliminary nature of the results makes the paper feel scattered and incomplete.
Strengths:
The Y2H screen was very comprehensive, producing lots of interesting possible leads for further experiments.
Weaknesses:
The results are useful but incomplete because only a small subset of the Y2H interactions is further examined. Even in the case of those that were further tested, the validating experiments are only partial or inconclusive.
Referee 2’s comments align in some respects with those of Referee 1. In the revised version, we have followed the detailed Referee 2 suggestions to reduce the scattered nature of the manuscript. In addition, we include an AlphaFold model of the interaction between the Set1 N-term 1-754 with the SID domain of Kap104 that involves the proposed Set1 PY-NLS sequence.
Reviewer #3 (Public review):
The SET1C/COMPASS complex is the histone H3K4 methyltransferase in Saccharomyces cerevisiae, where it plays pivotal roles in transcriptional regulation, DNA repair, and chromatin dynamics. While its canonical function in histone methylation is well-established, its full interactome remains poorly defined. Moreover, whether SET1C methylates non-histone substrates has been an open question. In this study, Luciano et al. employ systematic yeast two-hybrid (Y2H) screening to uncover novel interactors and functions of SET1C. Their findings reveal potential functional connections to RNA biogenesis, chromatin remodeling, and non-histone methylation.
The authors performed multiple Y2H screens using Set1 (full-length, N-terminal, and C-terminal fragments) and each of its seven subunits as baits. They identified high-confidence interactors that link SET1C to diverse cellular processes, including chromatin regulation (e.g., the SWI/SNF complex via Snf2), DNA replication (e.g., Mcm2, Orc6), RNA biogenesis (e.g., spliceosome components Prp8 and Prp22; polyadenylation factors Pta1 and Ref2), tRNA processing (e.g., Trm1, Trm732), and nuclear import/export (e.g., importins Kap104 and Kap123). Some of these interactions were further validated by immunoprecipitation or in vitro assays.
Given the interaction of Set1 with Slx5 and Wss1 - proteins involved in SUMO-dependent processes - the authors investigated and convincingly demonstrated that Set1 is sumoylated. This modification may influence the function and regulation of the SET1C complex.
Finally, the authors provide evidence that SET1C methylates proteins beyond histone H3K4, notably Nrm1, a transcriptional corepressor, and Snf2, the catalytic subunit of the SWI/SNF chromatin remodeling complex. Although Nrm1 contains a domain resembling the H3K4-methylated sequence (H3K4-like domain), this region does not appear to be required for its methylation. The search for other proteins containing similar domains as potential methylation candidates (p.12, first paragraph) seems less justified, given the lack of evidence supporting the requirement for the H3K4-like domain in methylation.
This study offers valuable insights into the interactome of SET1C, suggesting potential links between the complex and a wide range of cellular processes. However, the functional implications of the Y2H interactions remain to be explored further. Additionally, the study provides intriguing information on the possible regulation of Set1 by sumoylation. The discovery of Nrm1 and Snf2 as methylation substrates could significantly expand the known targets and functions of SET1C.
The results are supported by high-quality data.
We thank referee 3 for their positive comments
Recommendations for the authors:
Reviewer #1 (Recommendations for the authors):
Restructure the manuscript into at least two papers.
We thank the reviewer for this suggestion. In the revised manuscript, we have addressed this concern by substantially restructuring and streamlining the presentation. We consider the dataset, validation experiments, and functional observations to be closely integrated, and we believe that presenting them together provides the most coherent and impactful account of the work.
Minor points
There are several basic flaws in the manuscript that I feel indicate the co-authors have not proofread the manuscript sufficiently - 4 examples from early in the manuscript are listed below.
(1) The reference for Hybridomics is (73) - obviously from an earlier version that used a different referencing system that has not been corrected.
Thank you. This has been corrected.
(2) Line 194 - 197. These screens have proven their power and effectiveness. In particular, they identified ...... the CTD of Rpb1 as an interactor of the N-terminal region of Set1 (Bae et al, 2020) (Figure S1). Rbp1 interaction is not identified in the screens presented here, and Figure S1 is a cartoon and not primary evidence.
The interaction between the CTD of Rpb1 (Rpo21) and Set1 is reported in Table S2. The detailed characterization presented in Bae et al. (2020) was subsequently carried out as a direct follow-up to this screen.
(3) Line 205-211. The highly confident interactors of the seven SET1C subunits are shown in Figure 1C-E. We found that Spp1, Shg1 and Swd2 interact alone with Set1 (Figure 1C). The minimum Set1 region for which an interaction is found for each of these 3 subunits is shown in Figure 1C. The high confidence interactors of the seven SET1C subunits are shown in Figure 1C-E. We found that Spp1, Shg1 and Swd2 display Y2H interactions with Set1 (Figure 1C). The high confidence interactors of Spp1, Shg1 and Swd2 are indicated in Figure 1D (see also Table S2).
It is possible that Table S2 was omitted from the original submission, as it was requested during the production stage.
(4) Line 335. We have classified all Set1 and subunit interactors according to these SET1C roles (Figure S5). However, this refers to Figure S4 - many further references to Figure S5 are also to Figure S4.
Thank you. This has been corrected.
Reviewer #2 (Recommendations for the authors):
General recommendations:
(1) Figures 1, 2, 3, and 5 and their associated main text are essentially just lists of interactors, put in graphic form and grouped to allow speculation about possible biological functions for the interactions. But almost none of the ideas are tested, so these sections take much more space than warranted. Having so much preliminary Y2H data actually distracts attention from the follow-up experiments that are shown. I would move most or all of this to the supplement, consolidating the Y2H results into fewer figures (or even just the Table).
As mentioned earlier, the manuscript has been reorganized and Table S2 is provided.
(2) The Snf2 interaction gets the most follow-up, so separating Figure 4 from Figures 8-10 broke the flow of that story. I would group these figures together since all are related to the Snf2 AT hook story.
This was done accordingly.
(3) I understand that it's impossible to validate all the possible interactions, particularly if resources are limited. However, at least for the interactions that get further attention, it could be very useful to try some AlphaFold multimer predictions. A high confidence AlphaFold score would provide a second orthogonal piece of evidence to support the Y2H results.
We generated an AlphaFold model (Figure 2C) that recapitulates the key predictions for the Set1-Kap104 Y2H interaction.
Comments on specific sections:
(1) Y2H results. The text says Figure 1 shows all the high-confidence interactors. But the Set1 NTD interaction with the Rpb1 CTD is not shown here (it's in the supplement).
In Table S2, an interaction is observed between full-length Set1 and the Rpb1-CTD (14 repeats), where Rpb1 is referred to as Rpo21.
Figure 2 shows additional high-confidence interactors that do not appear in Figure 1, while others (like the Shg1Mog1 interaction) are shown in both Figures 1 and 2. It's confusing to scatter the data like this, which is why I recommend consolidating into a single figure or table.
In Figure 2, the high-confidence interactors of Set1 (1–754) are highlighted in red and green (Snf2, Gbp2, and Kap104), and all are also present in Figure 1. Dbp1, identified as a high-confidence interactor of Spp1, likewise appears in Figure 1. Table S2 summarizes all of these interactions.
(2) Line 219. How does a "high confidence" Set1-Kap104 Y2H interaction suggest the interaction is direct? Couldn't an indirect interaction also be tight and reproducible? This is an example where it would be worth seeing if AlphaFold also predicts an interaction and, if so, whether it involves the proposed NLS sequences.
Y2H screening indicated that Kap104 binds to the N-terminal region (aa 1–754) of Set1 via its Set1 interaction domain (SID). To validate this, we used AlphaFold to model the seven-subunit Set1C complex (Set1-Bre2-Sdc1(x2) Swd1-Swd3-Spp1) with Kap104. The resulting model showed borderline confidence for the overall fold (pTM = 0.53) and low confidence in subunit positioning (ipTM = 0.5). Visualization in PyMOL confirmed Kap104 SID binding to Set1(1–754), consistent with Y2H results. The structure highlights Kap104 SID interaction with Set1’s PY-NLS at residues 40–90; the second PY-NLS is neither visible nor engaged in this model.
(3) In the discussion of nuclear import interactors, what does it mean to say the Shg1-Mog1 interaction is "along the same line" as Set1-Kap104?
We meant that the interaction between Shg1 and Mog1 represents another example of an interaction between a Set1C subunit and a protein involved in nuclear import. Along the same line has been deleted in the revised version.
(4) To follow up on the Swd1-Nrm1 Y2H interaction, the paper shows that Nrm1 is methylated by Set1 in vitro (Figure 7), but it's not clear whether this has any biological significance. Without any in vivo follow-up, this figure is probably more appropriate for the Supplement.
As noted above, Figure 7 has been removed, only panel E of Figure 7 is retained in the revised version.
(5) Figures 6 and S8 show that Set1 is SUMOylated. Although it's not clear what this does to Set1 function or which E3 is responsible, the modification data looks convincing. The legend to Figures 6A and B says the Elutes samples are purified on nickel columns. Why are the Myc-Set1 and GB-Set1 proteins without the his-SUMO modification also binding to the nickel column? That's not happening in panels C and D. In the blots on the right for his-SUMO, is there any way to show that one of those bands is Set1? Maybe IP for MYC and then probe for the His tag?
We thank the reviewer for this observation. His-SUMO purification using Nickel beads was used to purify HisSUMOylated proteins. Purified proteins were analyzed by Western blot using anti-MYC or anti-GAL4 antibodies to detect SET1-His-SUMO, as well as anti-His antibodies to confirm the presence of purified His-SUMOylated proteins. As mentioned by the reviewer, we detected unmodified MYC-Set1 and GAL4-Set1 in both the (-) and (+) His-SUMO eluates. This phenomenon is most likely due to the stickiness of unmodified Set1 to the beads. This is a commonly observed phenomenon in this type of biochemical assay, particularly when analyzing large proteins such as Set1 (124 kDa). This stickiness behavior has been observed in similar SUMOylation assays, e.g., for Hpr1 (88 kDa) (Bretes H, 2014. PMID: 24500206), Nup1 (114 kDa), and Nup2 (78 kDa) (Folz H, 2019. PMID: 30837289). This stickiness was not observed when using Set1 fragments (panels C and D), most likely because the fragments lost the stickiness to the beads, a characteristic belonging only to the full-length Set1. We mention this point in the legend of the new figure 5.
(6) The Snf2 interaction gets the most follow-up. The GST pulldown validation of Set1 interaction with Snf2 AThook looks pretty good. However, the RGG repeats are necessary for the Set1 interaction with recombinant Snf2 proteins, but not for the co-IP of in vivo material. Again, AlphaFold could lend further support here.
Thank you for this helpful suggestion. We agree that structural modelling could, in principle, provide an additional and orthogonal line of support for the Set1-Snf2 interaction. We did explore this using AlphaFold. However, both Set1 and Snf2 contain extensive intrinsically disordered regions, including the regions implicated in the interaction, and none of the models we obtained provided interpretable structural insight into the interaction interface. In particular, the predicted complexes showed low confidence in relative domain positioning, which limits their usefulness for supporting or refining the interaction model. One possible explanation is that additional components are required to stabilise a meaningful interaction in silico. While we modelled Set1 within a seven-subunit Set1C complex, Snf2 was necessarily included in isolation from its native context. Given that Snf2 functions as part of multiple, heterogeneous chromatin remodelling complexes, the absence of its physiological binding partners may prevent AlphaFold from resolving a relevant interaction interface. In light of these limitations, we have not included the AlphaFold models in the manuscript, as we felt they would not provide reliable or informative support. Instead, we have focused on the experimental evidence presented. We have clarified this point in the revised discussion to acknowledge both the potential and the current limitations of structural prediction approaches in this context.
(7) The Snf2 methylation by Set1 is less convincing, and its biological significance is still unclear. I think it's pretty unlikely that Set1 could methylate arginine. The mass spectrometry is used for in vivo validation (mass spec), but mutating the lysines (Figure S11, S12) or Set1 deletion (Figure S14) doesn't seem to affect the signal. Could there be quantitative differences? Is there any way to quantitate the mass spec data to estimate the modified/unmodified ratio?
We thank the reviewer for highlighting the unexpected nature of the methylation results. We agree that the observation of arginine methylation in this context is surprising, particularly given that SET domain proteins are classically associated with lysine methylation. This is why we performed multiple in vitro and in vivo experiments, and careful interpretation data that were clear led us to conclude that Set1C methylates the arginines within the ARTSTRGR motif of the AT-hook. We agree that the biological significance of this modification remains unclear. We obtained data showing that deletion of the SID domain of Snf2 impairs yeast growth on lactate, whereas this mutant grows normally on glucose and galactose, in contrast to the Snf2Δ mutant, which exhibits poor growth on both glucose and galactose. In comparison, deletion of the RG motif of Snf2 does not affect growth on lactate. These results provide insight into the interaction between Set1 and Snf2 but do not shed light on the potential importance of methylation of the RG motif. We therefore chose not to include them. In the discussion, we acknowledge the limitations of the current evidence. Our intention is to retain these findings as potentially interesting observations while ensuring that their interpretation remains appropriately cautious.
Minor comments:
(1) Lines 153 and 163: Stress response is listed twice, but with different references. Maybe these need to be further defined or else combined?
We have deleted stress response line 163 and moved the references “Deshpande et al, 2022 and Nadal-Ribelles et al, 2015” line 153.
(2) Line 193: better to say the proteins were fused to the C- or N-terminus (rather than upstream/downstream). It would be worth mentioning if there was a reason why Swd2 was fused to the N-terminus, unlike all the others.
This has been done accordingly. In our hands, C-terminal fusions of Swd2 are not functional.
(3) Is the scoring scheme (highest, high, good) that produces the colors in Figure 1 shown in the table? It doesn't say what the tan color (two of the Bre2 interactors) means.
It is a mistake, Tea1 should be blue and Swi1 should not appear here. This has been fixed.
(4) Line 206. It's not clear what it means to say that three of the subunits "interact alone with Set1". It can't mean they only interact with Set1, since other interactors are shown in Figure 1B. If it meant to say the interactions don't require other COMPASS subunits? I don't see how you can tell that from the Y2H assay. Please clarify.
It means that these 3 subunits interact directly with Set1 without the need of another subunit, unlike of the other subunits.
(5) Line 252. While discussing the Set1 - Snf2 interaction, the paper cites Hirschhorn et al. That paper talks about Swi-Snf, but doesn't mention Set1 anywhere. Maybe the authors meant to cite a different paper?
We agree, this reference is not appropriated. It has been deleted.
(6) Figure S2 panels A and C are redundant and could easily be combined.
Figure S2 has been deleted.
(7) Figure S4: Should the green category also include transcription? Ssl1 is a TFIIH subunit, which could be involved in either transcription initiation or NER. Sen1 and Nrd1 are transcription termination factors, although Sen1 may also function in R-loop resolution.
We agree but it is already complicated as it is.
und die Skalierung über einige hundert Bestellungen pro Tag hinaus erfordert oft kostenpflichtige Module aus dem JTL Extension Store.
can we defend this claim? based on what are we saying this?
truffle recipes that don’t need a hefty price tag but are still just as delicious? Truffle products like sauces and oils are a great way to use truffles as an ingredient without worrying about your credit card charges.
Truff wants people to be more willing to buy their products since it's cheaper. But, how much truffle really is in their product? Someone should do the math. I'm sure they are still making a bunch of profit off of their product.
Note: This response was posted by the corresponding author to Review Commons. The content has not been altered except for formatting.
Learn more at Review Commons
Reviewer #1
Minor comments 1) The authors suggest that the weak 4th protomer in the HCMV UL52 3-mer map is a consequence of flexibility. This may be the case, but it may also be the case that the class is polluted with 4-mer particles leading to reduced occupancy. Erasing the weak density and running a multi-model 3D classification providing the erased 3-mer and a 4-mer starting map may separate these.
We performed additional analysis (i.e., 3-mer and 4-mer particles were combined into a multi-class ab initio reconstruction followed by multi-class heterogenous refinement) and found that the original 3-mer map was a mixture of 3-mer and 4-mer states.
We have updated Fig. 2a, Supplementary Fig. 2, Supplementary Fig. 3, Supplementary Table 1, Supplementary Movie 1, and removed the discussion of the weak protomer in the 3-mer map from the results section. We have updated our EMDB and PDB depositions accordingly.
- 2) I found the supplemental figure to show the DNA in the tripentamer map too small, this is an interesting finding and should be shown more clearly.*
We have increased the size of Supplementary Fig. 6 and moved the figure caption to another page to accommodate this enlargement.
Reviewer #2
*Major issues 1) There is a high probability that the tripentamer is an artifact of the cross-linking. Because of this, it'd be great to know more about the cross-linking reaction, ideally mass spec identification and quantification of cross-links. This would also address the authors' speculation of contacts that stabilize the tripentamer. *
Crosslinking is a commonly used technique to stabilize complexes that are observed through other means but do not survive the cryo-EM vitrification process. In an EMSA experiment (Supplementary Fig. 4a), UL32 binds 30 bp DNA and migrates slower than when bound to a 10 bp probe, consistent with formation of a supra-pentameric complex. The samples in the EMSA gels are not crosslinked. Additionally, an SDS-PAGE gel of the crosslinked product used for cryo-EM showed tight bands at molecular weights expected for oligomers, supporting specific crosslinking (Supplementary Fig. 4b). These results suggest that crosslinking stabilizes a species that can form but is relatively unstable in solution.
Moreover, the author's claim "However, mutation of K532A/C535A reduced infectious virion production by half (Fig. 4b), suggesting that the tripentamer interface may play a role in the viral life cycle." Seems to be an overreach. Perhaps this is semantics but the data just show that these residues play a role in viral replication (albeit not a huge role based on the modest effect).
We have modified the title of the results section (Line 216-217) to state that "Residues at the tripentamer interfaces contribute to infectious virion production in HSV-1" as well as Line 234 and 241 to indicate that the residues play a role in the viral life cycle.
2) The density for the potential DNA does not look very convincing, although it still remains the strongest hypothesis. The authors should try to strengthen their argument. Does this putative DNA contact residues that they show are necessary for viral replication? Showing seq conservation on the structure could help their argument for the shared function of DNA-binding.
The DNA likely contacts conserved residues at the base and midsection of the central channel (residues R302, R301, R293, K289, R580, R579, R572; see Fig. 6a). We have shown that these residues are important for the production of infectious virions (Fig. 6c): even a single point mutation (R572A) decreased production of infectious virus particles by more than 90%, and double and triple point mutants (R579A/R580A, K289A/R293A/R301A) eliminated production of infectious virus. Sequence conservation of these charged residues in the central channel regions is shown in Supplementary Fig. 1d, f.
3) My last major issue is stylistic and concerns the descriptions of cryoEM structures. I found that the paper was a bit of challenge to read when the authors would introduce each structure. It was a bit of a slog to get through. Descriptions of the structures veered off into overly detailed comparisons that required constant comparison with the figure and didn't really advance my understanding past "the outer surfaces of the three orthologs are different." This masked the more interesting aspects of the authors' findings. Perhaps this could be summarized in supplementary figures or a table. Because this is a stylistic suggestion, the authors should feel free to ignore this request.
We appreciate the reviewer's concerns about accessibility, but we are excited that these structures allowed us to thoroughly describe the convergent and divergent structural features across the Herpesviridae and hope that our in-depth analysis will allow for detailed mechanistic follow-up.
*Minor comments 1) The descriptions of structure determination in the text were often unclear. For example, "In the 3-mer map, a poorly-resolved fourth protomer is visible at low contour levels, suggesting that an additional protomer is present but highly flexible in this class (Supplementary Fig. 3a)." Alternatively, it could be that the classification algorithm wasn't able to fully separate particles that were 3-mers from the 4mers. *
The reviewer is correct. As described above (Reviewer #1 comment 1), we performed additional analysis and found that the original 3-mer map was a mixture of 3-mer and 4-mer states. We have updated Fig. 2a, Supplementary Fig. 2, Supplementary Fig. 3, Supplementary Table 1, Supplementary Movie 1, the EMDB and PDB depositions, and removed the discussion of the weak protomer in the 3-mer map from the results section.
*When describing the structure determination of the HSV1 accessory factor, the authors describe no other particles other than the tripentamer. Were there other particles observed? It'd be a bit surprising that all of the protein adopted the tripentamer state. *
We agree that this result is striking. We picked particles using a 'blob picker' to avoid introducing template bias and found that the tripentamer is the predominant species. Below we show the results of 2D classification of blob picked particles (classes sorted by particle number; obvious junk classes excluded for clarity). There is one class that suggests a pentamer, but template picking with a pentamer template (based on ORF68) did not yield a pentamer class.
Additionally, as we describe in the results section and show in Supplementary Fig. 6a, further processing of the consensus UL32 map showed that 60% of particles formed a complete tripentamer (i.e., 15-mer) while other the remaining 40% formed incomplete tripentamers, missing one or more protomers (e.g., 17% of particles formed a 14-mer).
Was symmetry applied, particularly for the tripentamer that appears to have C-3 symmetry? This is in materials and methods but not clear why it isn't mentioned when describing the structure determination and results.
No symmetry was applied in the reconstruction for either UL32 or UL52. While we previously noted this in the methods section and in Supplementary Table 1, we have added this information to the results section (Line 169-170), the Fig. 3 legend, and cryo-EM processing figures (Supplementary Figures 2, 5, 6) for clarity.
2) Throughout the paper, the authors use the word "remodel" to describe structural differences between orthologs. However, this word usually carries the implication of conformational rearrangement within a protein, and not across orthologs. Please consider a different description.
We agree with the reviewer and have removed the term "remodel" throughout the manuscript text (i.e., Lines 116, 118, 120, 122, 302, 306) and from Supplementary Figures 1, 3, and 5.
3) Figure 2F is confusing and difficult to interpret. It seems that the main point is that these interfaces are conserved, which might be more easily displayed as a standard sequence conservation score mapped onto the structure. I'm also not sure that this figure is necessary as a main figure and could be supplemental.
We agree that the conservation could also be shown this way and have added labels to universally conserved residues of the protomer interface to Supplementary Fig. 1b, c. We have also moved Fig. 2f to the supplement (now Supplementary Fig. 2g).
- 4) The authors write "UL32 bound to the shortest probe tested (10 bp, Supplementary Fig. 4a)." This implies that ONLY the shortest probe is bound and that others are not bound. Consider rephrasing.*
We have rephrased to clarify at all probes tested, included the shortest, bound DNA (Line 153).
- 5) Frustum is misspellt. ;)*
Thank you. Spelling has been corrected (Line 185).
6) In the discussion, the authors speculate that the variability of the outer surface is due to "virus- or host-specific interactions". I'm confused by "host-specific interactions", because the host is the same for all three viruses. Perhaps the authors mean that the different accessory factors could interact with different host factors? If so, are the authors making a Red Queen argument? If so, it'd be pretty cool to do dN/dS analysis to test that hypothesis.
The reviewer is correct in that all three viruses (HSV-1, HCMV, KSHV) infect the same host; however, they replicate in different cell types, which could potentially express different host factors. We have no evidence to support this hypothesis and intended to propose that UL32 and UL52 may be interacting/co-evolving with other viral factors required for genome packaging. We have clarified Line 308 to generalize that "these regions are involved in virus-specific interactions".
To me, this window into evolution of this factor is the biggest advance of the work, and tbh I felt that the authors could lean into this a bit more in the discussion section. Are there any differences in the packaging mechanisms of the different herpes families that can be related to their different behavior? Any other molecular evolution analyses (e.g. dN/dS ratio analysis) that could inform their study?
We agree that understanding the evolution of the packaging accessory factor is an interesting future area of research. There are differences in capsid structure and occupancy of capsid-associated factors across the herpesvirus family (PMID: 34696343). However, we lack a mechanistic (or structural) understanding of viral genome packaging components across the herpesviruses, raising the possibility that there are differences in packaging mechanisms.
Interestingly, the further diverged alloherpesviruses and malacoherpesviruses (other families in the order Herpesvirales) do not appear to encode a factor with similar predicted structure to the Herpesviridae packaging accessory factor (PMID: 41902279). It is unclear how the mechanism of packaging differs in the Orthoherpesviridae and whether replication in mammalian/avian/reptilian cells places additional evolutionary pressure on the viral genome packaging mechanism.
Reviewer #3
Major comments
*1) [I]t is not clear whether the structures presented in the manuscript reflect those produced during HCMV or HSV-1 infection. *
We agree with the reviewer that it is important to consider to what extent purified biomolecules resemble their in vivo counterparts. This criticism can be applied to any ex situ structural analysis. However, our experimental structures allowed us to make testable observations, including the correct assignment of structurally important zinc fingers and the identification of functionally important residues in the central channel.
2) HCMV UL52 was presented to form two distinct structures, a 3-mer and a 4-mer (Fig. 2a). However, the authors acknowledge that the 3-mer is actually a 4-mer when the threshold for the cryo-EM map is lowered. The density is also visible in the PDB validation report for the 3-mer; EMD-74418.
Reviewers #1 and #2 were also curious about the 3-mer. As described above, we performed additional analysis that showed that the original 3-mer map was a mixture of 3-mer and 4-mer states. We have updated Fig. 2a, Supplementary Fig. 2, Supplementary Fig. 3, Supplementary Table 1, Supplementary Movie 1, EMDB and PDB depositions, and removed the discussion of the weak protomer in the 3-mer map from the results section.
*Given that ORF68, BFLF1, and UL32 (Didychuk et al., 2021) form complete pentamer rings, with BFLF1 forming stacked rings, it would seem odd for a protein with conserved function to deviate from a pentamer configuration, suggesting that the structures reported do not reflect the natively produced and functional protein. *
We agree that this is a surprising finding; we initially anticipated that UL32 and UL52 would also form stable pentameric rings. While this study does not resolve a complete mechanism for this factor, it does provide the first structural evidence for the implications of their poor sequence conservation and lack of complementarity.
Furthermore, this is not the first example of a conserved herpesvirus factor that possesses different oligomeric states across different subfamily homologs. As mentioned in the discussion, herpesvirus encode a sliding clamp processivity factor (HSV-1 UL42/HCMV UL44/KSHV ORF59) that shares a common PCNA-like fold, but which has varied oligomeric state across these herpesviruses.
*3) Unlike ORF68 (Didychuk et al., 2021) and UL32 (Suppl. Fig. 4), dsDNA binding experiments were not performed with UL52. Could the partial pentamers simply be poorly formed due to expression in insect cells (mammalian cells were used for protein purification in Didychuk et al., 2021), absence of dsDNA, or inappropriate buffer conditions? Moreover, were the EM grid and vitrification parameters optimized? Grid geometries and chemistries can have profound effects of protein stability especially in the context of the air-water interface, leading to degradation of protein complexes (Glaeser, 2018; D'Imprima et al., 2019). Does UL52 form complexes with dsDNA? Data are shown for the HSV-1 packaging accessory factor. Perhaps dsDNA would stabilize the UL52 pentamer. *
We have purified ORF68 and homologs from both human and insect cell expression systems, and do not observe changes in oligomeric behavior. We find that ORF68 purified as a stable pentamer from human cells (Didychuk eLife 2021) and from insect cells (this work). We have also recombinantly expressed and purified UL32 from human cells. UL32 was largely monomeric after strep affinity purification (chromatogram below, unpublished), as we report from insect cells (this work, Fig. 1c). We switched to insect cell expression systems because of the easier scalability.
Our SEC-MALS data (Fig. 1d) shows that purified UL52 does not oligomerize into a pentamer in solution, so the observed sub-pentameric (3-mer/4-mer) assemblies are unlikely to be an artifact of cryo-EM freezing conditions or the air-water interface. We have not tested if UL52 forms complexes with dsDNA, although it likely does; it is possible that this interaction would stabilize a pentamer.
4) In Didychuk et al., 2021, HSV UL32 is shown to form pentameric rings; negative stained 2D class averages were generated from tagged protein (twin strep tag), produced in mammalian cells (HEK293T), and not purified using size exclusion chromatography. In the present study HSV UL32 was not observed to form pentameric complexes "We first attempted to visualize the pentameric species by negative stain electron microscopy but were unable to identify particles of the expected dimensions." However, it is not clear why this was the case. If the pentameric structures were readily produced in previous experiments, why was cross-linking needed in the current study? As such, the tripentamer complexes seem artifactual in nature.
While a sufficient number of particles were observed in a pentameric state to do 2D class averages in the eLife paper, this was not the dominant state. The results we report in this work are consistent with those reported in the eLife paper. Reviewer #2 (comment #1) was also concerned about the possibility of a crosslinking artifact: we reproduce our response below:
"Crosslinking is a commonly used technique to stabilize complexes that are observed through other means but do not survive the cryo-EM vitrification process. In an EMSA experiment (Supplementary Fig. 4a), UL32 binds 30 bp DNA and migrates slower than when bound to a 10 bp probe, consistent with formation of a supra-pentameric complex. The samples in the EMSA gels are not crosslinked. Additionally, an SDS-PAGE gel of the crosslinked product used for EM showed tight bands, supporting specific crosslinking (Supplementary Fig. 4b). These results suggest that crosslinking stabilizes a species that can form but is relatively unstable in solution."
We have updated Line 148 to clarify this. We have also included a negative stain micrograph, below, in which UL32 pentamers (purified from insect cells) are visible in the absence of crosslinking.
5) Although the data presented in Fig. 4b suggest that interface residues, K532 and C535, might play a role in the formation of the tripentamer and have a minor role in HSV-1 replication, these experiments are incomplete. Single mutations are needed for each residue to assess their individual contribution to tripentamer formation, evidence for a loss of tripentamer formation is needed, and evidence for protein expression is needed.
We agree that we have not unambiguously defined the role of the tripentamer, the precise contributions of residues K532 and C535, or defined the contribution of the tripentamer to HSV-1 viral replication. We seek to report this novel structure to lay the basis for future mechanistic work. Reviewer #2 (comment 1) also questioned the role of these residues in HSV-1 replication, and we addressed this by modifying the title of the results section (Line 216) to state that "Residues at the tripentamer interfaces contribute to infectious virion production in HSV-1" as well as Line 246 and 253 to indicate that the residues play a role in the viral life cycle.
Please refer to Supplementary Fig. 7e for a western blot showing that these mutants do not impact UL32 expression. We included explicit references to UL32 expression on Lines 239 and 288.
*6) In the previous negative stain electron micrographs reported by Didychuk et al., 2021, were the higher order tripentamer complexes seen? *
We did not observed tripentamers in the Didychuk et al. 2021 negative dataset. Tripentamer formation may be concentration dependent. Negative stain EM carried out at nanomolar concentrations would likely cause dissociation of tripentamers, but cryo-EM and EMSA in our work were carried out at micromolar concentrations and were able to capture the higher order tripentamer.
- 7) Formation of disulphide bonds between cysteine residues in vitro is not indicative of complexes forming in vivo during replication. What evidence is there for disulphide bond formation between packaging accessory factor pentamers for KSHV, EBV, and LCMV? In the present study, the disulphide bond could form due to proximity as a result of the cross-linking and the presence of molecular oxygen rather than a bona fide enzyme catalysed reaction during herpesvirus replication to generate packaging accessory factor tripentamers. *
We agree that it is unlikely that disulfide bonds form during infection and have removed this speculation from the manuscript (Line 343-346).
8) The DNA densities in Suppl. Fig. 6e to 6g are curious. As noted by the authors, the 30mer dsDNAs do not traverse through the central cavity of the pentamer. They appear to make contact with neighboring pentamers, again suggesting that these complexes are artefacts from cross-linking. This should be discussed more thoroughly.
Please refer to above discussion of crosslinking and Supplementary Fig. 4.
9) Previously proposed functional roles for ORF68 include a scaffold for terminase assembly, association of the terminase with the portal, generation of initial free ends, or coordination with other replication machinery (Didychuk et al., 2021). Presuming that the new structures for HCMV UL52 and HSV-1 UL32 occur naturally, how do they fit with the previously proposed functional roles of the herpesvirus packaging accessory factor? A more in-depth discussion of this would be valuable.
The common core fold and pentamer/pentamer-like assemble are common features, as is the conserved, positively-charged central channel. We have added additional discussion of this.
*Minor comments A lack of page numbers and line numbers made reviewing this manuscript more challenging than necessary. *
We have included page numbers and line numbers in the revised manuscript.
*As noted in the 'General comments' section above, ORF68 (3.37Å) and BFLF1 (3.60Å) both form pentamers (Didychuk et al., 2021) and were produced in mammalian systems HEK293T cells. Protein purification in the present study was performed in insect (SF9 or High Five) cells. Does this affect complex stability. Also, the tag was retained for UL32 in Didychuk et al., 2021; could this provide stability of the pentamer in the original studies? *
As discussed above, we have no evidence to suggest that expression in human vs. insect cell expression systems dramatically changes oligomerization behavior (Reviewer #3, comment 3). N-terminal purification tags were also retained in this study for structural work but were removed for SEC-MALS, which shows that UL32 is likely in concentration dependent equilibrium between (unstable) pentamers and monomers.
Suppl. Fig. 3 is missing.
We apologize for this oversight and have included Supplementary Fig. 3.
*"UL52 has two regions remodeled" The use of the word 'remodeled' is not appropriate in this context as it implies a single protein can form two shapes under different conditions rather than distinct structures between two disparate proteins; UL52 compared to ORF68. This should be rephrased. *
This was also noted by reviewer 2, and we have removed the term "remodel" throughout the manuscript text (i.e., Lines 134, 138, 140, 337, 341) and from Supplementary Figures 1, 3, and 5.
*What is the density in the central core of UL52 (Fig. 2a; Suppl. Fig. 2e)? Was any form of focused classification performed to establish the identity of the density within the central pseudocavity? *
As noted in the manuscript, this density could be which could be attributed to co-purified protein or nucleic acid, or part of the unresolved, negatively charged loop (residues 82-181) interacting with the positively charged central channel. We have done additional analysis of the central channel density (3D classification with a focus mask) and do not resolve any distinct densities, suggesting that the density is very dynamic.
*Does UL52 bind to dsDNA? To support the hypothesis that the herpesvirus packaging accessory factor has conserved functions across the three subfamilies dsDNA binding experiments should be performed. *
We have not done this experiment. We think that demonstrating this finding for two of the three herpesvirus subfamilies is sufficient.
There is no discussion about how these data relate to the previous functional model for ORF68 presented in Didychuk et al., 2021. Do the new data alter the previous functional models?
The precise mechanistic contribution of the packaging accessory factor remains unknown, and our data do not delineate between the proposed potential roles described in Didychuk et al. 2021. Importantly, our structural information, demonstration of pentameric ring formation, and significance of the positively charged central channel show that the core function of this factor is likely conserved across the virus family. This was not known before our work.
*There are some interesting grammatical phrases; please address throughout the manuscript. One example - "...a notable shared aspiration..." Proteins do not have aspirations. Please use a more formal scientific statement. *
We have updated the language on Line 327.
*Fig. 4b - Statistical analyses missing. Please provide. *
Fig. 6c - Statistical analyses are missing. Please provide. Protein folding/expression data missing; see Fig. 5C showing mutations that result in poor protein expression.
Suppl. Fig. 7f - Statistical analyses absent.
Statistical analysis of the viral complementation in Figs. 4b and 6c has been included. Note that the viral yields reported in Supplementary Fig. 7f were used to calculate complementation efficiency in Figs. 4b and 6c. Protein expression of mutants shown in Fig. 6c was previously included in Supplementary Fig. 7e and is referenced on Lines 288 and 293.
*Suppl. Fig. 2 and 5 - FSC curves have oddities, especially in the corrected curves. The cryo-EM resolution estimates calculated by CryoSPARC for the UL52 '3-mer' and 4-mer, and UL32 tripentamer are likely overestimated. In the PDB validation files each of the deposited structures has a warning for the resolution estimate "The value from deposited half-maps intersecting FSC 0.143 CUT-OFF 4.31 differs from the reported value 3.32 by more than 10 %", suggesting that the resolution estimates are inaccurate. The authors should provide a resolution estimate using loose masks and generate FSC curves using another software program such as RELION's postprocess to provide resolution estimates. *
Thank you for bringing this to our attention. The differences in the resolution estimates are a known issue and are highly influenced by the tightness of the mask. In the revised manuscript we have updated the FSC curves to not include auto-tightened masks and revised our resolution estimates. This slightly changed the resolution to 3.29 Å for both UL52 3-mer and 4-mer and to 3.09 Å for the UL32 consensus map. Please also see the local resolution estimation maps in Supplementary Figures 2e and 5e for an illustration of the range of resolutions in each map.
Suppl. Fig. 6f and 6g - Is there any visible density that might resemble the EGS crosslinking reagent?
We do not expect to observe density for EGS due to the long flexible linker (~16 Å) between the two reactive groups.
Note: This preprint has been reviewed by subject experts for Review Commons. Content has not been altered except for formatting.
Learn more at Review Commons
Summary.
The manuscript describes the cryo-EM structures of a conserved, necessary, herpesvirus genome packaging accessory factor for human cytomegalovirus (HCMV), UL52, and herpes simplex virus type-1 (HSV-1), UL32. Herpesvirus packaging accessory factors have unknown function but bind dsDNA. The UL52 and UL32 structures revealed a 5-fold symmetry similar to the previous X-ray crystallography structure for Kaposi's Sarcoma-associated herpesvirus (KSHV) ORF68 and the cryo-EM structure of Epstein-Barr virus (EBV) BFLF1. However, HCMV UL52 was reported to form two structures, a 3-mer and 4-mer whereas, HSV UL32 formed a supercomplex of trimeric pentamers (tripentamer) produced by dsDNA binding and crosslinking. Similar to previous studies with ORF68, mutagenesis of HSV-1 UL32 demonstrated the importance of zinc finger residues C297, C308, C544, and H581 for core fold stability and positively charged residues H563, R572 in the central channel in the pentamer for HSV-1 recovery in virus complementation assays. In addition, mutagenesis of K532 and C535 at the tripentamer interface helix reduced virus complementation by 50%. These findings have significant overlap and similarities to previously published experiments and confirm the properties of ORF68 and BFLF1, demonstrating the conserved nature of the required packaging accessory factor for herpesviruses.
Major comments.
The manuscript is generally well written with beautifully presented cryo-EM figures. Unfortunately, the new data seem to muddy the water rather than provide clarification about the role or function of the herpesvirus packaging accessory factor. Furthermore, it is not clear whether the structures presented in the manuscript reflect those produced during HCMV or HSV-1 infection. HCMV UL52 was presented to form two distinct structures, a 3-mer and a 4-mer (Fig. 2a). However, the authors acknowledge that the 3-mer is actually a 4-mer when the threshold for the cryo-EM map is lowered. The density is also visible in the PDB validation report for the 3-mer; EMD-74418. Given that ORF68, BFLF1, and UL32 (Didychuk et al., 2021) form complete pentamer rings, with BFLF1 forming stacked rings, it would seem odd for a protein with conserved function to deviate from a pentamer configuration, suggesting that the structures reported do not reflect the natively produced and functional protein. Unlike ORF68 (Didychuk et al., 2021) and UL32 (Suppl. Fig. 4), dsDNA binding experiments were not performed with UL52. Could the partial pentamers simply be poorly formed due to expression in insect cells (mammalian cells were used for protein purification in Didychuk et al., 2021), absence of dsDNA, or inappropriate buffer conditions? Moreover, were the EM grid and vitrification parameters optimized? Grid geometries and chemistries can have profound effects of protein stability especially in the context of the air-water interface, leading to degradation of protein complexes (Glaeser, 2018; D'Imprima et al., 2019). Does UL52 form complexes with dsDNA? Data are shown for the HSV-1 packaging accessory factor. Perhaps dsDNA would stabilize the UL52 pentamer.
In Didychuk et al., 2021, HSV UL32 is shown to form pentameric rings; negative stained 2D class averages were generated from tagged protein (twin strep tag), produced in mammalian cells (HEK293T), and not purified using size exclusion chromatography. In the present study HSV UL32 was not observed to form pentameric complexes "We first attempted to visualize the pentameric species by negative stain electron microscopy but were unable to identify particles of the expected dimensions." However, it is not clear why this was the case. If the pentameric structures were readily produced in previous experiments, why was cross-linking needed in the current study? As such, the tripentamer complexes seem artifactual in nature. Although the data presented in Fig. 4b suggest that interface residues, K532 and C535, might play a role in the formation of the tripentamer and have a minor role in HSV-1 replication, these experiments are incomplete. Single mutations are needed for each residue to assess their individual contribution to tripentamer formation, evidence for a loss of tripentamer formation is needed, and evidence for protein expression is needed. In the previous negative stain electron micrographs reported by Didychuk et al., 2021, were the higher order tripentamer complexes seen?
Formation of disulphide bonds between cysteine residues in vitro is not indicative of complexes forming in vivo during replication. What evidence is there for disulphide bond formation between packaging accessory factor pentamers for KSHV, EBV, and LCMV? In the present study, the disulphide bond could form due to proximity as a result of the cross-linking and the presence of molecular oxygen rather than a bona fide enzyme catalysed reaction during herpesvirus replication to generate packaging accessory factor tripentamers.
The DNA densities in Suppl. Fig. 6e to 6g are curious. As noted by the authors, the 30mer dsDNAs do not traverse through the central cavity of the pentamer. They appear to make contact with neighboring pentamers, again suggesting that these complexes are artefacts from cross-linking. This should be discussed more thoroughly.
Previously proposed functional roles for ORF68 include a scaffold for terminase assembly, association of the terminase with the portal, generation of initial free ends, or coordination with other replication machinery (Didychuk et al., 2021). Presuming that the new structures for HCMV UL52 and HSV-1 UL32 occur naturally, how do they fit with the previously proposed functional roles of the herpesvirus packaging accessory factor? A more in-depth discussion of this would be valuable.
Minor comments.
A lack of page numbers and line numbers made reviewing this manuscript more challenging than necessary.
As noted in the 'General comments' section above, ORF68 (3.37Å) and BFLF1 (3.60Å) both form pentamers (Didychuk et al., 2021) and were produced in mammalian systems HEK293T cells. Protein purification in the present study was performed in insect (SF9 or High Five) cells. Does this affect complex stability. Also, the tag was retained for UL32 in Didychuk et al., 2021; could this provide stability of the pentamer in the original studies?
Suppl. Fig. 3 is missing.
"UL52 has two regions remodeled" The use of the word 'remodeled' is not appropriate in this context as it implies a single protein can form two shapes under different conditions rather than distinct structures between two disparate proteins; UL52 compared to ORF68. This should be rephrased.
What is the density in the central core of UL52 (Fig. 2a; Suppl. Fig. 2e)? Was any form of focused classification performed to establish the identity of the density within the central pseudocavity?
Does UL52 bind to dsDNA? To support the hypothesis that the herpesvirus packaging accessory factor has conserved functions across the three subfamilies dsDNA binding experiments should be performed. There is no discussion about how these data relate to the previous functional model for ORF68 presented in Didychuk et al., 2021. Do the new data alter the previous functional models?
There are some interesting grammatical phrases; please address throughout the manuscript. One example - "...a notable shared aspiration..." Proteins do not have aspirations. Please use a more formal scientific statement.
Fig. 4b - Statistical analyses missing. Please provide.
Fig. 6c - Statistical analyses are missing. Please provide. Protein folding/expression data missing; see Fig. 5C showing mutations that result in poor protein expression.
Suppl. Fig. 2 and 5 - FSC curves have oddities, especially in the corrected curves. The cryo-EM resolution estimates calculated by CryoSPARC for the UL52 '3-mer' and 4-mer, and UL32 tripentamer are likely overestimated. In the PDB validation files each of the deposited structures has a warning for the resolution estimate "The value from deposited half-maps intersecting FSC 0.143 CUT-OFF 4.31 differs from the reported value 3.32 by more than 10 %", suggesting that the resolution estimates are inaccurate. The authors should provide a resolution estimate using loose masks and generate FSC curves using another software program such as RELION's postprocess to provide resolution estimates.
Suppl. Fig. 6f and 6g - Is there any visible density that might resemble the EGS crosslinking reagent?
Suppl. Fig. 7f - Statistical analyses absent.
References.
Didychuk AL, Gates SN, Gardner MR, Strong LM, Martin A, Glaunsinger BA. A pentameric protein ring with novel architecture is required for herpesviral packaging. Elife. 2021 Feb 8;10:e62261. doi: 10.7554/eLife.62261. PMID: 33554858; PMCID: PMC7889075.
D'Imprima E, Floris D, Joppe M, Sánchez R, Grininger M, Kühlbrandt W. Protein denaturation at the air-water interface and how to prevent it. Elife. 2019 Apr 1;8:e42747. doi: 10.7554/eLife.42747. PMID: 30932812; PMCID: PMC6443348.
Gardner MR, Glaunsinger BA. Kaposi's Sarcoma-Associated Herpesvirus ORF68 Is a DNA Binding Protein Required for Viral Genome Cleavage and Packaging. J Virol. 2018 Jul 31;92(16):e00840-18. doi: 10.1128/JVI.00840-18. PMID: 29875246; PMCID: PMC6069193.
Glaeser RM. PROTEINS, INTERFACES, AND CRYO-EM GRIDS. Curr Opin Colloid Interface Sci. 2018 Mar;34:1-8. doi: 10.1016/j.cocis.2017.12.009. Epub 2017 Dec 22. PMID: 29867291; PMCID: PMC5983355.
General assessment: The strengths of this manuscript are the structural information provide by the cryo-EM maps for the HCMV UL52 and HSV-1 UL32 and the mutagenesis studies that corroborate previous studies for the packaging accessory factor for gammaherpesviruses KSHV and EBV. However, there are limitations. These are centered on whether the structures are representative of UL52 and UL32 complexes produced during replication rather than over expression in insect cells and stabilization using chemical cross-linking.
There is a lack of novelty in the context of the herpesvirus packaging factor. The pentameric architecture, DNA binding, zinc fingers (4), and charged residues required for DNA binding were conclusively demonstrated in previous studies (Gardner and Glaunsinger, 2018; Didychuk et al., 2021). Thus, the novelty comes from the different pentameric structures; UL52 4-mer and UL32 tripentamer. However, if these are artefactual structures due to the expression system (mammalian versus insect) used, air-liquid interface induced protein instability, or cross-linking, the novelty is lost. That's not to say the data are not informative for the herpesvirus community.
Advance: The advance in this manuscript is the new structural information for the UL52 and UL32. Even if the higher order complexes are potential artefacts, high resolution structure information for the subunit is especially informative. The mutagenesis data for UL32 are also informative in that the provide important information about a conserved and necessary protein needed for herpesvirus replication and has the potential to be used as a novel druggable target.
Audience: The manuscript will appeal to specialized and broad audiences and could influence research into antiviral therapies for herpesviruses. My field of expertise is herpesvirology, structural biology, and cryogenic electron microscopy modalities,
Author response:
The following is the authors’ response to the original reviews.
Public Reviews:
Reviewer #1 (Public review):
In this manuscript, the authors investigate the relationship between genetic codes and their robustness to single-point mutations. They construct ten alternative genetic codes by reassigning nine codons to Leu, Ser, or Ala, and assess mutational robustness using three reporter proteins subjected to error-prone PCR. This represents an interesting experimental approach to addressing the hypothesis that the standard genetic code is optimized for mutational robustness.
We sincerely thank the reviewer for the positive evaluation of our experimental approach. We are encouraged that the reviewer recognizes the value of constructing multiple non-standard genetic codes in vitro and using them to experimentally examine the relationship between genetic code arrangement and mutational robustness. In the revised manuscript, we have further clarified the scope of our experimental system and the interpretation of the results, particularly emphasizing that our conclusions concern the mutational robustness of individual reporter protein activity measured in an in vitro translation system.
Major comment:
While I find the experimental design valuable, I am not fully convinced by the authors' conclusion that "alterations of the genetic code within the ranges explored in this study have no significant effect on mutational robustness". The current analysis is based on the functional output of three individual reporter proteins. Given that cellular systems involve far more complex interactions, it would be more appropriate to limit this conclusion to mutational robustness at the level of individual protein activity, rather than making broader generalizations.
We thank the reviewer for this important comment. We agree that our original wording was broader than what can be directly supported by the present experiments. Because our analysis is based on the functional outputs of three individual reporter proteins translated in a reconstituted in vitro system, the results do not directly address mutational robustness at the level of the cellular system, protein interaction networks, or organismal fitness.
Accordingly, we have revised the manuscript to limit our conclusion to the mutational robustness of individual reporter protein activity. In the revised Abstract, Results, and Discussion, we now state that within the experimentally tested range of non-standard genetic codes, we did not detect a dependence of the mutation-induced decrease in reporter protein activity on mutational cost. We have also added a statement in the Discussion noting that cellular systems involve many additional layers, including protein–protein interactions, metabolic networks, quality-control systems, and growth selection, and that whether genetic code arrangement affects robustness at these higher biological levels remains an important question for future work.
Specifically, we have added this explanation and the new experiment to the revised manuscript as follows.
Abstract
“This result provides direct experimental evidence that mutational robustness does not significantly change in individual reporter protein activity when the genetic code is altered within the range of mutational cost tested in this study…”
Introduction
“Random mutations decreased reporter protein function at similar levels across all genetic codes examined, implying that alterations of the genetic code within the ranges explored in this study have no significant effect on mutational robustness of individual protein activity.”
Result
“Taken together, these results indicate that mutational robustness of individual reporter protein function did not substantially differ among the genetic codes…”
Discussion
“…suggesting that mutational robustness of protein activity remained largely unchanged within at least the ranges of mutational cost tested in this study. It should be noted that this conclusion is limited to the activity of individual reporter proteins translated in a reconstituted in vitro system. Therefore, whether similar trends would be observed at the level of cellular fitness or long-term evolution remains an open question.”
Specific comments
(1) tRNA modification and expression efficiency (Page 5, line 131)
The authors attribute the observed inefficiency to the lack of chemical modifications in the tRNAs used. However, gene expression efficiency can also be strongly influenced by DNA sequence design. To better support this claim, it would be helpful to compare luciferase activity when expressed using native E. coli tRNAs. This comparison could clarify whether the observed effects are due to tRNA modification status or other sequence-dependent factors.
We thank the reviewer for this important suggestion. We agree that the translation efficiency of NanoLuc templates with 21-, 32-, and 46-codons may be affected not only by the chemical modification of tRNAs but also by sequence-dependent factors, such as codon context and mRNA structure.
To examine this possibility, we performed an additional comparison using native E. coli tRNAs in the tfPURE system. When the NanoLuc templates encoded with 21, 32, or 46 codons were translated using native E. coli tRNAs, the observed luminescence values were 1.2 × 10<sup>10</sup>, 0.78 × 10<sup>10</sup>, and 0.60 × 10<sup>10</sup>, respectively. Thus, the 46-codon NanoLuc template showed lower activity than the 21- and 32-codon templates even with native tRNAs, indicating that sequence-dependent effects indeed contribute to translation efficiency.
However, the difference among these templates with native E. coli tRNAs was within approximately two-fold. This effect was much smaller than the marked decrease observed when the 46-codon template was translated using the in vitro prepared 46 tRNAs SGC system. Therefore, while sequence-dependent effects cannot be excluded, the inefficient translation in the reconstructed 46 tRNAs SGC is likely to be mainly attributable to the limited functionality of unmodified tRNAs decoding NNA codons.
We have revised the manuscript to clarify this interpretation and have added the new comparison using native E. coli tRNAs.
“We also examined whether the lower translation efficiency of the 46-codon NanoLuc template could be explained by sequence-dependent effects, such as codon context or mRNA structure. When the 21-, 32-, and 46-codon NanoLuc templates were translated using native E. coli tRNAs in the tfPURE system (Figure 1–figure supplement 2), the 46-codon template showed lower activity than the 21- and 32-codon templates; however, this difference was within approximately two-fold. Accordingly, we decided to use only the 32 codons used in near-SGC (i.e., excluding NNA codons) in the subsequent construction of non-standard genetic codes.”
(2) Discrepancy between expression level and activity (Figure S7 vs Figure S8).
Although GAL expression levels appear similar across different genetic codes (Figure S7), their activities differ substantially (Figure S8), even in the low-mutation library. This discrepancy warrants further investigation. Possible explanations include differences in protein folding efficiency or translational error rates, as mentioned by the authors in the main text.
To address this, the authors could analyze the protein products using mass spectrometry. If this is not feasible due to low expression levels, alternative approaches such as SDS-PAGE (e.g., with radiolabeling or Western blotting) would still provide valuable information. Additionally, comparing activity after in vitro refolding could help distinguish between folding defects and sequence-level errors. While I understand that the primary aim of this study is to compare mutational robustness across genetic codes, discussing these observations would significantly enhance the mechanistic insight of the work.
We agree that the discrepancy between similar GAL expression levels and different GAL activities across genetic codes is important for interpreting the results.
In our experiment, GAL protein amounts were quantified using a C-terminal HiBiT tag. Because the HiBiT tag was fused to the C-terminus of GAL, this assay indicates that the amount of C-terminally completed GAL products did not differ substantially among genetic codes. However, we agree that this assay does not evaluate the sequence fidelity, amino acid misincorporation patterns, or folding state of the translated products. Therefore, the observed differences in GAL activity despite similar HiBiT signals may reflect genetic code-dependent differences in translational error rates, amino acid misincorporation, protein folding efficiency, or other effects on the fraction of catalytically active protein.
We have revised the Discussion to explicitly describe this interpretation and to clarify that detailed mechanistic dissection of these baseline activity differences, for example by mass spectrometry, SDS-PAGE/Western blotting, or refolding analysis, is an important future direction but beyond the scope of the present study. We also clarified that the main analysis in this study uses the ratio of activity from the high-mutation library to that from the corresponding low-mutation library within each genetic code.
We have added this explanation to the revised manuscript as follows.
“Although protein amounts quantified by the HiBiT tag were comparable among genetic codes, GAL activities differed substantially. This indicates that the activity differences among genetic codes were not primarily attributable to differences in the amount of C-terminally completed translation products. The HiBiT assay does not provide information on the fraction of catalytically active protein, including sequence fidelity or folding state, and therefore cannot distinguish among these possibilities. Detailed characterization of translated products by mass spectrometry would provide further mechanistic insight into how individual non-SGCs affect protein quality. However, the primary objective of the present study was to compare mutation-dependent activity loss across genetic codes. Therefore, we evaluated this effect by normalizing the activity of the high-mutation library to that of the corresponding low-mutation library within each genetic code.”
(3) Protein expression analysis for additional reporters.
Since protein expression levels are critical for interpreting reporter activity, similar analyses should also be performed for luciferase (Luc) and mSG in both high- and low-mutation libraries. This would ensure that differences in activity are not confounded by variations in protein abundance.
We agree that protein abundance is an important factor for interpreting reporter activity. In this study, we performed HiBiT-based protein quantification for GAL because GAL showed the largest variation in absolute activity among genetic codes, even in the low-mutation library. This analysis showed that the amount of C-terminally completed GAL products was broadly comparable among genetic codes and between low- and high-mutation libraries, indicating that the observed GAL activity differences were not primarily attributable to differences in total protein abundance.
For all three reporters, our main analysis was based on the ratio of activity from the high-mutation library to that from the corresponding low-mutation library within each genetic code. This normalization was intended to evaluate mutation-dependent activity loss while reducing the influence of code-specific baseline differences in expression level or protein quality. We believe that the data are sufficient to evaluate the effect of mutations on protein activities. Nevertheless, we agree that protein quantification for Luc and mSG would provide useful information regarding variation in the baseline levels of reporter activity, and this is an important direction for future work.
Reviewer #2 (Public review):
Summary:
The study addresses the long-standing question in molecular biology and genetics: why has nature selected the current genetic code (SGC, or standard genetic code)? The authors have tested 'error minimization theory', one of the prevailing hypotheses to explain this. Their approach is to create a minimum genetic code (MGC) and its variants (3^9 theoretical possible codes). Using three parameters to quantify the effect of mutations (Polarity, volume, and hydropathy), they computationally test the cost of these genetic codes (3^9) by simulations. Finally, they test this cost experimentally using an in vitro translation system with 10 select genetic code variants with a range of costs (low to high). They use three randomly mutated reporter genes for this purpose - beta-galactosidase, luciferase, and mSG. They find no correlation between the cost of the genetic code and the reporters' output. Based on these observations, they suggest that error-minimization theory may not explain the current egocentric code.
The question they are asking is very exciting, and their approach is solid. The authors are very careful in their analyses and conclusions.
We sincerely thank the reviewer for the positive assessment of our study and for the helpful suggestions. We are encouraged that the reviewer found the question exciting and the approach solid. In the revised manuscript, we have clarified the rationale for using the MGC/near-SGC framework, added further analyses and explanations of the mutational cost calculations, and revised the wording of our conclusions to more explicitly define the scope and limitations of the present experimental system.
(1) The rationale for using MGC instead of SGC: It is unclear why the authors rely on the MGC for this analysis when the central question concerns the SGC. If the goal is to evaluate whether the SGC minimizes mutational cost, a more direct approach would be to generate alternative variants of the SGC itself and compare their mutational cost distributions. At present, it is difficult to assess whether conclusions drawn from this comparison are fully relevant to the stated biological question.
We thank the reviewer for this important comment. We agree that directly constructing alternative variants of the SGC by changing amino acid assignment from SGC would be the most straightforward approach to testing whether the SGC minimizes mutational cost. However, this approach is currently not feasible in our reconstituted translation system for two reasons.
First, our attempt to construct a 46-tRNA SGC-like system revealed that translation using the 46-codon NanoLuc template was approximately 100-fold less efficient than translation using the MGC or near-SGC (Fig. 1). This low activity likely reflects inefficient decoding of NNA codons by in vitro-prepared tRNAs, which lack native post-transcriptional modifications. Because this system did not provide sufficient translational activity for systematic reporter assays, we restricted subsequent experiments to the 32-codon near-SGC framework, excluding NNA codons. We now describe this technical limitation more explicitly in the revised manuscript.
Second, the MGC framework provides vacant codons that can be reassigned by adding anticodon-variant tRNAs. This feature is essential for constructing multiple genetic code variants in parallel under controlled in vitro conditions. We, therefore, constructed the near-SGC-based non-SGC by adding each tRNA variant to the MGC as an experimentally tractable model system to verify whether differences in genetic code arrangement affect mutation-induced decreases in reporter protein activity.
We have added this explanation to the revised manuscript as follows.
“We first established a minimal genetic code, composed of 21 tRNAs with vacant codons, which allows multiple alternative codon assignments to be introduced under otherwise comparable translation conditions.”
Despite this technical limitation, we believe that the central conclusion of this study—that mutational robustness in individual reporter protein activity does not change significantly when the genetic code is altered within the range of mutational costs tested here—remains well-supported by the present results.
(2) The mutational cost analysis appears biologically oversimplified because all amino acid substitutions are treated equivalently. The analysis assumes that all mutations contribute equally to fitness consequences, which does not reflect biological reality. In natural proteins, the impact of an amino acid substitution depends strongly on its structural and functional context. For example, substitutions affecting catalytic residues, ligand-binding interfaces, phosphorylation sites, or other regulatory motifs can severely impair protein function even when associated changes in polarity, hydropathy, or volume are minimal. Conversely, substitutions in structurally permissive or functionally dispensable regions may have little or no measurable effect despite larger physicochemical differences. Therefore, changes in polarity, hydropathy, and volume alone do not necessarily predict functional consequences.
We agree that the mutational cost used in this study is a simplified measure and does not capture the full biological complexity of amino acid substitutions. As the reviewer pointed out, the functional consequence of a substitution depends strongly on its structural and functional context, including whether the affected residue is involved in catalysis, ligand binding, protein–protein interactions, regulatory motifs, folding, or structurally permissive regions.
In this study, we used physicochemical-property-based mutational costs because this type of definition has been widely used in classical formulations of the error minimization theory. Our aim was therefore not to construct a comprehensive predictor of protein fitness effects, but to experimentally test whether the conventional theoretical cost metrics used to discuss genetic code optimality are reflected in the average mutation-induced decrease in reporter protein activity. We have now clarified this rationale in the revised manuscript.
“It should be noted that this conclusion is limited to the activity of individual reporter proteins translated in a reconstituted in vitro system. Therefore, whether similar trends would be observed at the level of cellular fitness or long-term evolution remains an open question.”
(3) It is not clear why they increased the concentration of the two tRNAs in near-SGC. Have they maintained the same tRNA concentrations in experiments explained in Fig 5 for all 10 genetic codes tested?
We apologize that the rationale for increasing the concentrations of tRNA<sup>Val</sup><sub>CAC</sub> and tRNA<sup>Arg</sup><sub>CCU</sub> was not sufficiently clear in the original manuscript. As we wrote in the previous manuscript, “To improve translation efficiency with near-SGC, we focused on two tRNA concentrations (tRNA<sup>Val</sup><sub>CAC</sub> and tRNA<sup>Arg</sup><sub>CCU</sub>), which were suggested to have low activities in a previous study (Iwane et al., 2016),” we tested whether increasing their concentrations would improve translation efficiency. As shown in Figure 1–figure supplement 1, NanoLuc activity increased as the concentrations of these two tRNAs were raised and used at 100 ng/µL for tRNA<sup>Val</sup><sub>CAC</sub> and tRNA<sup>Arg</sup><sub>CCU</sub> in the optimized near-SGC, referred to as near-SGC (RV), and in all subsequent experiments. Additional anticodon-variant tRNAs required for each non-SGC were used at optimized concentrations determined from Figure 2–figure supplement 1. For each genetic code, the same tRNA composition and concentrations were used for the low- and high-mutation libraries (See Supplementary Table S7). To clarify this point, we added the sentence, “The increased concentrations of these two tRNAs were used in all the subsequent experiments,” in the corresponding part.
Reviewer #3 (Public review):
In this manuscript, Miyachi and Ichihashi investigate whether the arrangement of the genetic code affects mutational robustness. Using an in vitro minimal genetic code with vacant codons, they constructed 10 non-standard genetic codes by reassigning Ala, Ser, and Leu, generating codes with replacement costs that were generally higher than those of the standard genetic code across several amino acid property measures. They then tested how random mutations affected the activity of reporter proteins translated under these altered codes. Although error minimization theory predicts that higher-cost codes should make mutations more harmful, the authors report that protein function declined to a similar extent across all codes examined, suggesting that mutational robustness remains largely unchanged within the range of genetic code alterations tested here.
Strengths:
This is an interesting study that investigates one of the most fundamental and intriguing questions in molecular evolution: the emergence of the genetic code, which is nearly universal across nature. The in vitro approach is a powerful aspect of the work and provides an opportunity to examine this phenomenon experimentally at a depth that has previously been inaccessible.
Weaknesses:
However, the authors' use of random mutation libraries has certain limitations that prevent the study from realizing its full potential to uncover the mechanisms governing the molecular evolution of the genetic code.
We sincerely thank the reviewer for the positive evaluation of our study and for recognizing the strength of the in vitro approach. We are encouraged that the reviewer considers this system a powerful way to experimentally address the emergence of the genetic code.
We also appreciate the reviewer’s constructive comments regarding the limitations of random mutation libraries. We agree that pooled random libraries do not allow us to assign functional effects to individual mutations or to fully uncover the molecular mechanisms underlying mutational robustness. In the revised manuscript, we therefore clarify that our conclusions concern the library-averaged effects of random mutations on individual reporter protein activity, rather than the effects of specific mutations or cellular-level fitness. To address this limitation, we have added explanations of the scope and limitations of the present approach.
(1) Statistical analyses are missing for several of the manuscript's main claims. This issue applies throughout the paper, including, but not limited to, Figures 1D, 2B, 4B-D, and 5B.
We thank the reviewer for this important comment. We agree that statistical analyses are necessary to support the major claims of the manuscript. We have therefore added statistical analyses appropriate for the purpose and experimental design of each figure.
For Fig. 1D, we performed one-way ANOVA followed by Tukey’s post hoc test on NanoLuc activity to compare translation efficiencies among the MGC, near-SGC, near-SGC (RV), and SGC conditions. This analysis showed a significant overall difference among conditions (one-way ANOVA, p < 0.0001). Tukey’s post hoc test showed that near-SGC was significantly lower than MGC, that near-SGC (RV) significantly improved near-SGC translation, and that near-SGC (RV) was not significantly different from MGC. In contrast, the 46-tRNA SGC remained significantly less efficient than near-SGC (RV). We have summarized the major comparisons in Supplementary Table S8.
For Fig. 2B, we compared NanoLuc activity between the 21-code control and the corresponding 21+1-code condition for each codon reassignment using Welch’s t-test on luminescence. This analysis was added to statistically support whether each anticodon-variant tRNA increased NanoLuc translation from the corresponding reassigned template. The statistical results are summarized in Supplementary Table S9.
For Fig. 4B–D, we converted mutation rates per base to estimated numbers of mutations per gene and performed Spearman’s rank correlation analysis to evaluate whether reporter activity decreased monotonically with increasing mutational load. This analysis showed strong negative monotonic trends between mutation rate (estimated mutation number) and reporter activity for all three reporters (ρ = −0.90 to −1.00), supporting that the random mutation libraries reduced protein activity in a mutation-load-dependent manner.
For Fig. 5B, replicate-level data were available for GAL, and we therefore performed two-way ANOVA using genetic code and mutation level as factors. This analysis detected significant main effects of genetic code and mutation level, indicating that GAL activity differed among genetic codes and decreased in the high-mutation library. However, no significant interaction between genetic code and mutation level was detected, indicating that the magnitude of mutation-induced activity reduction was not strongly code-dependent under the conditions examined.
Finally, because the central claim of Fig. 5C, 5E, and 5G is that mutational cost does not systematically predict mutation-induced activity loss, we performed Spearman’s rank correlation analysis between each mutational cost metric and the high-/low-mutation activity ratio. No significant correlations were detected for any reporter or cost metric (Spearman’s ρ = −0.23 to 0.25), supporting the conclusion that mutational cost did not show a detectable monotonic relationship with mutation-induced activity loss within the tested range.
We have added these statistical analyses to the revised manuscript. The following sentences were added to the figure legends:
Fig. 1
“Statistical comparisons in (D) were performed using one-way ANOVA followed by Tukey’s post hoc test on NanoLuc activity; major comparisons are summarized in Table S8.”
Fig. 2
“For each template, NanoLuc activity in the 21-code and corresponding 21+1-code conditions was compared using Welch’s t-test on luminescence. Statistical results are summarized in Table S9.”
Fig. 4
“Spearman’s rank correlation coefficients were ρ = −0.90 for GAL, ρ = −1.00 for Luc, and ρ = −1.00 for mSG”
Fig. 5
“For GAL activity in (B), two-way ANOVA was performed using genetic code and mutation level as factors. Significant main effects of genetic code and mutation level were detected (both p < 0.0001), whereas their interaction was not significant. For (C), (E), and (G), Spearman’s rank correlation analysis was performed between each mutational cost metric and the high-/low-mutation activity ratio. Statistical details are summarized in Table S10.”
(2) In Figure 2A, the authors modify the NanoLuc gene by reassigning Ala, Leu, or Ser to new codons and elegantly show that the in vitro availability of the corresponding tRNAs is important for protein function. However, the functional importance of the specific modified positions within NanoLuc is not clear. As a result, it is difficult to determine what the expected consequences of these codon changes should be, which in turn limits the interpretation of the observed changes in protein activity. To improve the interpretability of this experiment, the authors should report exactly how many codons were modified in each variant and, ideally, examine the effect of progressively increasing the number of reassigned codons.
We agree that the exact positions and numbers of codon replacements should be clearly reported. In the revised manuscript, we have added a list of the modified amino acid positions. In brief, two Ala codons, three Ser codons, or four Leu codons were replaced with the target vacant codon; the modified positions were Ala16 and Ala120, Ser31, Ser49, and Ser150, and Leu32, Leu67, Leu144, and Leu170, respectively.
We also agree that progressively increasing the number of reassigned codons would provide additional mechanistic insight. However, the purpose of Fig. 2 was to test whether each vacant codon could be decoded by the corresponding anticodon-variant tRNA to produce functional NanoLuc, rather than to analyze the positional contribution of each replacement. We previously performed such progressive codon replacement analysis for one reassigned codon, ACG, in a related study (Miyachi et al., 2025), and the results supported the same qualitative interpretation. Although we did not repeat this progressive analysis for all codons in the present study, we expect that the qualitative interpretation of Fig. 2 would not be substantially changed.
We have revised the figure text to clarify the scope of the experiment and added the detailed codon replacement information.
“(A) Schematic illustration of reassignment experiments. Translation with the original MGC and NanoLuc template is shown at the top for comparison. An example of Ala reassignment to the UUG codon is shown at the bottom. In this example, three Ala codons in the NanoLuc sequence were replaced with one type of vacant codon (e.g., UUG), generating a 21 + 1 (UUG-Ala) codon set. Similar reassignment experiments were performed for three amino acids (Ala, Ser, and Leu) and nine vacant codons. Specifically, two Ala codons (Ala16 and Ala120), three Ser codons (Ser31, Ser49, and Ser150), or four Leu codons (Leu32, Leu67, Leu144, and Leu170) were replaced.”
(3) The calculations presented in Figure 3 raise an interesting conceptual question: why does the near-standard genetic code not exhibit the lowest cost? One possible explanation is that the standard genetic code evolved under multiple competing constraints and is therefore not expected to be optimal for any single cost metric, while still achieving strong overall performance. In this context, it would be informative if the authors combined the three cost measures into a single integrated index and examined whether the near-SGC performs more favorably when all three dimensions are considered together. Such an analysis could add important depth to the study.
We agree that the near-SGC is not necessarily expected to minimize each individual cost metric, because the standard genetic code may reflect multiple competing physicochemical, translational, biosynthetic, and evolutionary constraints rather than optimization of a single property.
To address this point, we added an integrated cost analysis combining the three physicochemical cost metrics, Cost<sub>PR</sub>, Cost<sub>MV</sub>, and Cost<sub>HI</sub>. Because these three metrics have different numerical scales, we normalized each metric before integration. We used two types of integrated indices.
First, for each metric m 𝛜 {PR, MV, HI}, we calculated a min–max normalized cost,
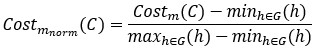
Where G denotes the set of 19,683 candidate non-SGCs generated by assigning Ala, Ser, or Leu to the nine vacant codon boxes. We then defined the integrated min–max cost as

Second, we calculated a z-score-normalized cost for each metric,
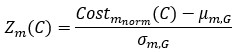
Where µ<sub>m,G</sub> and 𝜎<sub>m,G</sub> are the mean and standard deviation of Cost<sub>m<sub>norm</sub></sub> across the candidate non-SGCs. The integrated z-score cost was then defined as
Using both integrated indices, the near-SGC ranked first when compared with all 19,683 candidate non-SGCs; in other words, no candidate non-SGC showed a lower integrated cost than the near-SGC. The integrated min–max cost of the near-SGC was 0.01525, whereas the lowest value among candidate non-SGCs was 0.12301. Similarly, the integrated z-score cost of the near-SGC was −2.47947, whereas the lowest candidate value was −1.90838.
We have added this integrated cost analysis as Supplementary Figure 5–figure supplement 7. We have also revised the Discussion to note that the near-SGC does not necessarily minimize every individual physicochemical cost, but performs most favorably when PR, MV, and HI are considered comprehensively. This result is consistent with the idea that the standard genetic code may represent a compromise among multiple constraints rather than optimization of a single physicochemical property.
“We consider that the cost ranges examined in this study represent substantial fractions, especially for MV and HI. Although the near-SGC did not necessarily exhibit the lowest cost for each individual physicochemical metric, this does not mean that it is unfavorable in the multidimensional cost space. Because the SGC may reflect a balance among multiple physicochemical constraints rather than optimization of a single property, we also calculated integrated cost indices by combining Cost_PR, Cost_MV, and Cost_HI after min–max normalization or z-score normalization. In both integrated indices, the near-SGC showed the lowest overall cost when compared with all 19,683 candidate non-SGCs (Figure 5–figure supplement 7), indicating that no candidate non-SGC exhibited a lower combined cost than the near-SGC when the three physicochemical properties were considered comprehensively.”
(4) It is difficult to assess the consequences of the random mutations presented in Figure 4 on reporter gene function based solely on the reported "error rate/base" parameter. In particular, the x-axis in Figure 4B should be converted into the estimated number of mutations per gene. This would make the results more intuitive and would allow the reader to better evaluate the expected degree of disruption to protein function.
We agree that the mutation rate per base alone does not provide an intuitive sense of the expected mutational burden for each reporter gene. We therefore added a second x-axis to Fig. 4B–D showing the estimated number of mutations per gene. This value was calculated by multiplying the mutation rate per base by the coding sequence length of each reporter gene.
We retained the original mutation rate per base axis to preserve the direct link to the sequencing-based mutation rate measurement, while adding the estimated mutations per gene axis to improve interpretability. We have revised the figure and figure 4 legend accordingly.
“The lower x-axis indicates the estimated number of mutations per gene, calculated by multiplying the mutation rate per base by the coding sequence length of each reporter gene.”
(5) A central limitation of the random mutagenesis libraries used in Figure 5, which also underlie one of the manuscript's main claims, is that the exact mutations and their distribution across the reporter genes are not reported. In addition, protein activity is measured only at the level of the entire library, without directly linking individual mutations to their functional consequences. This substantially limits mechanistic interpretation. In my view, this issue can only be addressed convincingly if the authors test a set of defined variants carrying specific mutations and directly evaluate their functional effects.
(6) Related to the previous point, in Figures 5C, 5E, and 5G, the authors present the ratio between low-mutation-rate and high-mutation-rate libraries. However, because each library contains a different collection of mutations, it is unclear what can be inferred from these comparisons. To overcome this limitation, the authors should assess the effects of altered genetic codes on specific, defined mutations rather than on heterogeneous mutation pools alone.
(7) Along the same lines, in Figures 5C, 5E, and 5G, it is unclear why the effects of random mutations would be expected to correlate with the three calculated cost metrics, given that the positions, identities, and functional relevance of the mutations within the genes are not known. Without this information, the biological meaning of these correlations remains difficult to evaluate.
We agree that using pooled random mutation libraries does not allow us to directly link individual mutations to their functional consequences. We also agree that testing defined variants carrying specific mutations would provide a more direct and mechanistic understanding of how each genetic code affects the functional impact of particular amino acid substitutions. However, the purpose of the present study was different from such a defined-variant analysis. Our aim was to experimentally test whether the conventional mutational cost metrics used in error minimization theory predict the average effect of random mutational loads on protein activity. Because these theoretical costs are themselves defined as average expected physicochemical effects over many possible single-nucleotide substitutions, we reasoned that pooled random mutation libraries provide an appropriate first experimental framework to evaluate whether such average-cost metrics are reflected in the average functional output of translated proteins.
We agree that low- and high-mutation libraries do not contain identical sets of mutations. Therefore, the high-/low-mutation activity ratio should not be interpreted as the effect of the same individual variants before and after additional mutations. Rather, it represents the relative reduction in average activity caused by increasing the mutational burden in a heterogeneous mutation pool under each genetic code. We have revised the text to clarify this interpretation.
We also agree that the positions, identities, and functional relevance of individual mutations are not resolved in this pooled assay. This limitation prevents us from assigning mechanistic effects to specific substitutions. At the same time, using a small set of defined variants would introduce its own selection bias, because the conclusions could strongly depend on which mutations and which protein positions were chosen. Therefore, we consider the random-library approach to be a useful first step for testing library-averaged effects, whereas systematically defined variant analysis or genotype-resolved activity assays will be necessary to reveal mutation-specific mechanisms in future studies.
In response to the reviewer’s concern, we have revised the Discussion to explicitly limit our conclusion to library-averaged effects on individual reporter protein activity. We now state that this approach does not identify the functional effects of individual mutations and that future studies using defined variants or high-throughput genotype–phenotype mapping will be required to determine how specific substitutions contribute to genetic code-dependent mutational robustness.
Result
“To estimate the average activity reduction associated with increased mutational burden under each genetic code, we calculated the ratio of activity obtained from the high-mutation library to that from the corresponding low-mutation library and plotted this ratio against each of the three mutational costs (Fig. 5C).”
Discussion
“A further limitation of this study is that the reporter activities were measured at the level of pooled random mutation libraries. Therefore, the high-/low-mutation activity ratio used in this study should be interpreted as the relative reduction in average activity caused by increasing the mutational burden in a heterogeneous mutation pool, rather than as the effect of identical variants before and after additional mutations. This library-averaged approach was chosen because the mutational costs considered here are also defined as average expected physicochemical effects over many possible single-nucleotide substitutions. In addition, because the non-SGCs constructed in this study were generated by reassigning only Ala, Ser, and Leu, the detectable effects may depend on how frequently mutations involving these amino acids occur in each reporter gene and whether the affected positions are functionally important. If genetic code dependent effects are restricted to a small subset of deleterious variants, such effects may be masked in pooled activity measurements. Future studies using defined variants or high-throughput genotype–phenotype mapping assays will be required to determine the mutation-specific and position-specific mechanisms underlying genetic code dependent effects on protein function (Rozhoňová et al., 2024).”
(8) For each mutagenesis library, the number of variants, the average number of mutations per variant, and the distribution of mutation positions should be reported clearly and transparently. These details are important for evaluating the strength of the conclusions.
We agree that a more transparent characterization of the random mutagenesis libraries is necessary for evaluating the strength and limitations of our conclusions.
In the revised manuscript, we have added the estimated number of mutations per gene to the Results section. This value was calculated by multiplying the mutation rate per base by the coding sequence length of each reporter gene. For the high-mutation libraries used in Fig. 5, the estimated numbers of mutations per gene were approximately 8.0 for GAL, 4.5 for Luc, and 3.3 for mSG. We also added position-wise mutation profiles along each reporter gene (Figure 4–figure supplement 2), in addition to the heatmap shown in the original manuscript. These analyses clarify the mutational burden of each library and show that mutations were broadly distributed across the analyzed regions (approximately 300 nt in the middle of each gene) of the reporter genes.
Regarding the number of variants, the translation reactions were performed using 5 nM DNA template in a 5 µL reaction, corresponding to approximately 1.5 × 10<sup>10</sup> DNA molecules. However, this value represents the total number of DNA molecules introduced into the reaction and does not directly indicate the number of unique full-length sequence variants, because multiple molecules can share the same genotype, and our sequencing analysis was designed to quantify mutation frequencies and positional distributions rather than to reconstruct full-length genotypes of individual library members. Therefore, we do not infer the exact number of unique variants in each library. Instead, we report the average mutation burden and position-wise non-reference rate distributions.
We have revised the Results and added Supplementary Figure 4–figure supplement 2 accordingly.
“For this experiment, two random mutation libraries were used: a low-mutation library prepared using the high-fidelity polymerase and a high-mutation library prepared using Taq DNA polymerase at a Mn<sup>2+</sup> concentration that yields mutation rates of 0.002 – 0.005 per base (0.0026 for GAL, 0.0027 for Luc, and 0.0048 for mSG, corresponding to approximately 8.0, 4.5, and 3.3 mutations per gene). We also plotted position-wise non-reference rates along the analyzed regions of each reporter gene, confirming that mutations were broadly distributed across the amplicons (Figure 4–figure supplement 2).”
(9) Because only three amino acids were manipulated in the non-standard genetic codes, it remains unclear whether these particular amino acids occupy positions in the reporter proteins that are especially important for function and therefore likely to generate strong phenotypic effects. More broadly, it is not clear whether the assay is sufficiently sensitive to detect the effects of only a subset of deleterious variants within a pooled library. This point should be addressed more explicitly.
We agree that this is an important limitation of the present study. Because our non-SGCs were constructed by reassigning only Ala, Ser, and Leu, the mutation-dependent effects that can differ among genetic codes are limited to mutations involving these reassigned codons or amino acid substitutions affected by these assignments. Therefore, the sensitivity of the assay depends on how frequently such substitutions occur in the reporter genes and whether the affected Ala, Ser, and Leu-related positions are functionally important.
We have revised the Discussion to address this point more explicitly. In the revised manuscript, we now state that the absence of a detectable cost-dependent effect may reflect not only the limited cost range examined, but also the limited set of reassigned amino acids, the position-dependent importance of Ala/Ser/Leu residues in the reporter proteins, and the sensitivity limit of pooled activity measurements. We further note that future studies using genotype-resolved activity assays (defined variants) will be required to determine whether specific amino acid substitutions or specific protein positions exhibit stronger genetic code-dependent effects.
“A further limitation of this study is that the reporter activities were measured at the level of pooled random mutation libraries. Therefore, the high-/low-mutation activity ratio used in this study should be interpreted as the relative reduction in average activity caused by increasing the mutational burden in a heterogeneous mutation pool, rather than as the effect of identical variants before and after additional mutations. This library-averaged approach was chosen because the mutational costs considered here are also defined as average expected physicochemical effects over many possible single-nucleotide substitutions. In addition, because the non-SGCs constructed in this study were generated by reassigning only Ala, Ser, and Leu, the detectable effects may depend on how frequently mutations involving these amino acids occur in each reporter gene and whether the affected positions are functionally important. If genetic code-dependent effects are restricted to a small subset of deleterious variants, such effects may be masked in pooled activity measurements. Future studies using defined variants or high-throughput genotype–phenotype mapping assays will be required to determine the mutation-specific and position-specific mechanisms underlying genetic code-dependent effects on protein function (Rozhoňová et al., 2024).”
Recommendations for the authors:
Reviewing Editor Comments:
While we suggest that you address all the technical points raised by the reviewers, you may specifically want to limit the conclusion of the study to mutational robustness at the level of individual protein activity, rather than making broader generalizations. Also, the statistical analysis needs to be strengthened, as indicated in the reviews.
We thank the Reviewing Editor for these important suggestions. We agree that the conclusion of the original manuscript was broader than what can be directly supported by the present experiments. In the revised manuscript, we have therefore limited our conclusion to mutational robustness at the level of individual reporter protein activity measured in a reconstituted in vitro translation system. We now explicitly state that our results do not directly address robustness at the level of cellular fitness, protein interaction networks, or long-term evolution.
We have also strengthened the statistical analyses throughout the manuscript. Specifically, we added one-way ANOVA followed by Tukey’s post hoc test for Fig. 1D, Welch’s t-tests for Fig. 2B, Spearman’s rank correlation analyses for Fig. 4B–D and Fig. 5C/E/G, and two-way ANOVA for GAL activity in Fig. 5B. These analyses have been incorporated into the revised Results, figure legends, and supplementary information.
Reviewer #2 (Recommendations for the authors):
(1) Discuss other alternative hypotheses if the error minimization theory is unlikely.
We thank the reviewer for this helpful suggestion. We think that the absence of a detectable relationship between mutational cost and reporter protein activity in our assay should not be interpreted as excluding all possible roles of error minimization in the evolution of the genetic code. Our results specifically address one aspect of the error minimization theory: whether physicochemical-property-based mutational cost predicts the average effect of random point mutations on individual reporter protein activity within the experimentally accessible range of non-SGCs tested here.
In the revised Discussion, we have clarified that the organization of the SGC may have been shaped by multiple factors, including robustness to translational errors, historical constraints associated with genetic code expansion, biosynthetic or coevolutionary processes, stereochemical interactions, and the evolvability of proteins. Our results suggest that the contribution of mutational robustness at the level of individual protein activity may be limited within the range examined here, but they do not exclude the possibility that the SGC provides advantages under other forms of error, at the level of translation fidelity, cellular fitness, or long-term evolution.
We have added a short discussion to clarify this point without expanding the scope of the manuscript beyond the present experimental results.
“It should be noted that this conclusion is limited to the activity of individual reporter proteins translated in a reconstituted in vitro system. Therefore, whether similar trends would be observed at the level of cellular fitness or long-term evolution remains an open question. Moreover, our results do not exclude other possible roles of SGC organization. The SGC may have been shaped by multiple factors, including robustness to translational errors, historical constraints during genetic code expansion, biosynthetic or coevolutionary relationships among amino acids, stereochemical interactions, and effects on protein evolvability (Katoh and Suga, 2023; Koonin and Novozhilov, 2017, 2009; Novozhilov et al., 2007; Wong, 2005).”
(2) A brief description of the PURE translation system can be provided for people from outside the field.
We have added a brief description of the PURE system in the Introduction to make the experimental platform more accessible to readers outside the field. Specifically, we now explain that the PURE system is a reconstituted cell-free translation system composed of purified translation factors, ribosomes, aminoacyl-tRNA synthetases, tRNAs, amino acids, and energy-regeneration components. We also clarify that, in this study, we used a tRNA-free version of the PURE system, in which defined synthetic tRNA sets were supplied externally to reconstruct each genetic code.
Introduction
“A representative platform for such reconstitution is the PURE system (Shimizu et al., 2001), a reconstituted cell-free translation system composed of purified translation components, including ribosomes, translation factors, aaRSs, amino acids, and energy-regeneration components. In particular, a tRNA-free PURE system (Miyachi et al., 2022), in which endogenous tRNA activity is minimized and defined tRNA sets are supplied externally, enables genetic codes to be reconstructed by controlling the supplied tRNAs.”
(3) Figure 5D and F - Technical replicates are provided only for GAL. A similar approach should be taken for LUC and mSG.
We agree that replicate-level measurements for Luc and mSG would further improve reliability. However, repeating the full translation experiments for these reporters was not feasible in the current revision, as each experiment requires large amounts of freshly prepared tRNA-free PURE system and multiple defined tRNA mixtures for every genetic code variant tested. Given these material and technical constraints, we were unable to perform additional biological replicates within the scope of this revision. We would like to emphasize, however, that the GAL replicates shown in Fig. 5D and F are fully consistent across independent experiments, providing direct evidence for the reproducibility of the assay itself. Furthermore, the key metric in our analysis, the activity ratio between high- and low-mutation groups within each genetic code, is an internally normalized measure that is inherently less sensitive to between-experiment variability than absolute activity values. The correlation analyses further showed no significant relationship between mutational cost and this ratio across all three reporters, and this conclusion is consistent regardless of which reporter is examined. Together, we believe these results provide a robust basis for the conclusions drawn, even in the absence of full replication for Luc and mSG.
(4) Provide statistical analysis wherever it is relevant (e.g, to support a lack of correlation).
We have strengthened the statistical analyses throughout the revised manuscript. In particular, to support the lack of detectable correlation between mutational cost and mutation-induced activity loss, we performed Spearman’s rank correlation analyses between each mutational cost metric and the high-/low-mutation activity ratio for all three reporters. No significant correlations were detected for any reporter or cost metric. In addition, we added statistical analyses for other relevant figures, including one-way ANOVA followed by Tukey’s post hoc test for Fig. 1D, Welch’s t-tests for Fig. 2B, Spearman’s rank correlation analyses for Fig. 4B–D, and two-way ANOVA for GAL activity in Fig. 5B.
Reviewer #3 (Recommendations for the authors):
(1) In line 122, the phrase "as evenly as possible" is ambiguous and should be explained more precisely.
We thank the reviewer for pointing this out. We have revised the phrase “as evenly as possible” to describe the codon design more precisely. Specifically, we now state that the NanoLuc coding sequences were designed so that the codons available in each genetic code were used with minimal differences in codon counts, while preserving the amino acid sequence of NanoLuc.
“For near-SGC and SGC, the NanoLuc coding sequences were designed so that the codons available in each genetic code were used with minimal differences in codon counts, while preserving the amino acid sequence (Fig. 1B, 32 codons and 46 codons).”
(2) For Figure 1D, a Western blot or another protein gel-based assay would be helpful to exclude the possibility that the observed differences arise from variation in translation efficiency rather than differences in protein activity.
We agree that a protein gel-based assay such as Western blotting would in principle allow us to distinguish differences in translated protein amount from differences in specific activity, and we understand why such data would be informative. However, we would like to clarify that the primary purpose of Fig. 1D was to evaluate the overall functional translation output of each reconstructed genetic code, rather than to determine the mechanistic basis of any observed differences. In this context, NanoLuc luminescence serves as an integrated readout of the entire translation process, encompassing both translational efficiency and protein folding/activity. Crucially, regardless of whether the observed differences in NanoLuc luminescence reflect lower protein yield, reduced specific activity, or a combination of both, the conclusion of Fig. 1D remains the same. Although we did not perform Western blotting in this study, we believe that such an analysis would not change this interpretation and that the current data are sufficient to support this conclusion.
(3) The number 3^9 is not immediately intuitive. It would be helpful if the authors also stated that this corresponds to approximately 20,000 possible non-standard genetic codes.
We have revised the text to state both the exact number and the approximate value: 3<sup>9</sup> = 19,683, approximately 20,000 possible non-standard genetic codes.
(4) The rationale for using the three cost parameters (PR, MV, and HI) should be explained in greater detail. Because these parameters are central to the manuscript, a citation alone is not sufficient. A concise explanation of their biological relevance would improve the clarity and accessibility of the study.
We agree that the biological relevance of the three cost parameters should be explained more clearly. In the revised manuscript, we have added a concise explanation of why polar requirement (PR), molecular volume (MV), and hydropathy index (HI) were used.
These parameters were selected because they have been widely used in theoretical studies of genetic code optimality and represent distinct physicochemical aspects of amino acid substitutions. PR reflects polarity-related interactions and has been a classical metric in error minimization analyses of the genetic code. MV represents side-chain size and steric volume, which could influence packing and structural stability in proteins. HI reflects hydrophobicity, which is closely related to protein folding and hydrophobic core formation. We have also clarified that these metrics are simplified descriptors and do not capture residue-specific structural or functional context, which we now discuss as a limitation of the study.
“PR reflects polarity-related interactions of amino acids and has been used as a classical measure of amino acid similarity in error minimization analyses. MV represents side-chain size and steric volume, which could affect protein packing and structural stability, whereas HI reflects hydrophobicity, which could be closely related to protein folding or hydrophobic core formation.”
(5) In Figure 3, the experimental framework would be easier to follow if the authors included a schematic and data for one representative non-SGC, explicitly illustrating how it differs from the near-SGC with respect to each of the three cost measures.
We agree that showing one representative non-SGC would make the experimental framework and cost calculation more intuitive.
In the revised manuscript, we added a new panel to Fig. 3 comparing the near-SGC with a representative non-SGC. We selected the PR<sub>max</sub> code as the representative example because it clearly illustrates how reassignment of vacant codon boxes can increase one mutational cost metric relative to the near-SGC. In this panel, we first show the codon assignment schemes of the near-SGC and PR<sub>max</sub> code in the same genetic-code format used in Fig. 1. We then show the corresponding heatmap representations for the three physicochemical properties used in the cost calculation: polar requirement, molecular volume, and hydropathy index. The Cost<sub>PR</sub>, Cost<sub>MV</sub>, and Cost<sub>HI</sub> values are shown for each code.
This new panel illustrates how changes in codon assignment are translated into different physicochemical cost landscapes and clarifies how the representative non-SGC differs from the near-SGC with respect to each of the three cost measures.
“To make the design of non-SGCs more explicit, we show one representative non-SGC together with the near-SGC in Fig. 3B. This comparison illustrates how assignment of Ala, Ser, or Leu to the vacant codon boxes changes the three mutational cost metrics, Cost<sub>PR</sub>, Cost<sub>MV</sub>, and Cost<sub>HI</sub>.”
(6) In line 329, the phrase "similar pattern" is ambiguous and should be explained more explicitly.
We have revised the ambiguous phrase “similar pattern” to describe the observation more explicitly. Specifically, we now state that the relative differences in GAL activity among genetic codes observed in the low-mutation library were broadly retained in the high-mutation library, although overall activity decreased.
“For the high-mutation library, GAL activity decreased overall, while the relative differences in activity among genetic codes observed in the low-mutation library were broadly retained.”
(7) Figure S7 appears to be an important control for the experiments shown in Figure 5, and I recommend moving it to the main figures.
We thank the reviewer for this helpful suggestion. We agree that the HiBiT-based quantification of GAL protein amount is an important control for interpreting the GAL activity measurements in Fig. 5, and we appreciate the recommendation to increase its visibility. This analysis shows that the amount of C-terminally completed GAL products was broadly comparable among genetic codes, indicating that the large differences in GAL activity were not primarily attributable to differences in total translated protein amount.
After careful consideration, we have opted to retain this analysis in the supplementary figures because the main focus of Fig. 5 is the relationship between mutational cost and mutation-induced activity loss, quantified by the high-/low-mutation activity ratio. The HiBiT experiment addresses a related but distinct question: whether differences in absolute GAL activity among genetic codes can be explained by differences in protein abundance, and we felt that including it in the main figures might shift the emphasis away from the central message of Fig. 5. Nevertheless, we have added a clear reference to Figure 4–figure supplement 1 in the main text and the figure legend to ensure that readers are directed to this control when interpreting Fig. 5.
Author response:
Public Reviews:
Reviewer #1 (Public review):
This manuscript presents a tunable Bessel-beam two-photon fluorescence microscopy (tBessel-TPFM) platform that enables high-speed volumetric imaging with stable axial focus. The work is technically strong and broadly significant, as it substantially improves the flexibility and practicality of Bessel-beam-based two-photon microscopy. The demonstrations are generally strong and bridge a wide range of neuroimaging applications, namely vascular dynamics, neurovascular coupling, optogenetic perturbation, and microglial responses. These convincingly show that the approach enables biological measurements that are difficult or impractical with existing methods.
The evidence supporting the technical and biological claims is generally strong. The optical design is carefully motivated, clearly described, and validated through a combination of simulations and experimental characterization. The biological applications are diverse and well chosen to highlight the strengths of the proposed method, and the data are of high quality, with appropriate controls and comparative measurements where relevant.
Strengths:
(1) The optical innovation addresses a well-recognized limitation of existing Bessel-TPFM implementations, namely axial focus drift during tuning, and does so using a relatively simple, light-efficient, and cost-effective design.
(2) The manuscript provides convincing experimental evidence for this being a versatile platform to map flow dynamics across diverse vessel sizes and orientations in both healthy and pathological states.
(3) Biological demonstrations are comprehensive and span multiple domains such as hemodynamics, neurovascular coupling, and neuroimmune responses.
(4) Quantitative analyses of blood flow across vessel sizes and orientations, including kilohertz line scanning, are particularly compelling and clearly beyond the reach of standard Gaussian TPFM.
(5) Particular advantages are that higher blood slow speeds become measurable up to 23mm/sec (20x more than conventional frame scanning), and that simultaneous (Bessel-)imaging and (Gaussian-)perturbation are possible because of the stable axial focus.
We thank the reviewer for this thoughtful and encouraging evaluation of our work. We are particularly grateful for the recognition of both the technical rigor and the broad applicability of the tBessel-TPFM platform, as well as the assessment that our approach enables biological measurements that are difficult or impractical with existing methods. We appreciate the reviewer’s detailed summary of the strengths of the manuscript, including the identification of axial focus drift as a major limitation in prior Bessel-TPFM implementations, and the value of our center-stable, light-efficient, and accessible solution. We thank the reviewer for the encouraging comment that our biological demonstrations to be compelling and well supported by quantitative analysis.
Weaknesses:
(1) At present, the paper does not properly position the new Bessel-beam method against previous work, and fails to compare it to alternative fast volumetric imaging methods without Bessel beams.
We thank the reviewer for this important point. We agree that a more explicit comparison with existing fast volumetric imaging methods helps clarify the unique advantages of our system. Alternative fast volumetric imaging methods without Bessel beams include remote focusing (Sofroniew et al., 2016), acousto-optic deflectors (AOD) (Villette et al., 2019), piezoelectric objective stages (Göbel and Helmchen, 2007), tunable acoustic gradient lenses (TAG lens) (Huang et al., 2019), electrically tunable lenses (ETLs) (Grewe et al., 2011; Yang et al., 2018), and light beads microscopy (Demas et al., 2021). These methods have each enabled important forms of rapid volumetric imaging, but they differ in their speed, resolution, axial range, and optical complexity. For example, remote focusing can provide rapid axial refocusing while preserving high-resolution imaging but has limited defocus range and requires a carefully aligned relay system and aberration control to maintain image quality. AOD-based approaches enable fast random-access sampling, but introduce optical and calibration complexity associated with dispersion, and suffer light loss with limited diffractive efficiency. Piezoelectric objective scanning is comparatively simple and broadly accessible, but its mechanical inertia limits volume rate and can introduce artifacts during rapid or large axial motion. TAG lenses and ETLs provide compact non-mechanical axial scanning, but pose challenges on aberration control and synchronization. Light-beads microscopy achieves high volumetric throughput by near-simultaneously sampling multiple axial positions, but faces intrinsic compromise among axial coverage, number of sampling planes, and lateral sampling density, which limit lateral resolution when imaging over large depth ranges.
Previous Bessel-beam TPFM approaches address some of these limitations by converting volumetric imaging into two-dimensional scanning with an axially extended focus. However, many existing implementations either rely on a fixed Bessel beam profile, which limits the ability to adapt spatial resolution and axial coverage to different biological applications, or use spatial light modulators, which provide tunability but introduce higher cost, increased optical complexity, reduced light efficiency, and sequential rather than simultaneous multi-wavelength operation. Other axicon or lens based tunable Bessel approaches have also been reported, but these designs generally introduce axial displacement of the Bessel focus during tuning.
In contrast, our tBessel-TPFM design provides full tunability comparable with SLM based methods, maintaining a stable axial beam center, at the same time low cost, easy to implement, intrinsically high light efficiency and support simultaneous multi-color imaging. Therefore, tBessel-TPFM provides a unique solution for applications where axial projection is acceptable and where high-speed volumetric monitoring, tunable axial coverage, motion robustness, optical simplicity, and compatibility with simultaneous perturbation are valuable.
(2) The cost-effectiveness of the proposed method is not well described or supported by evidence; it would be useful to include more detail or remove this claim.
We thank the reviewer for requesting clarification and supporting evidence regarding the cost-effectiveness of our method. We now provide a detailed cost breakdown of the tBessel module. Briefly, the module consists of three axicons, three lenses, and one iris that together enable independent control of the NA and ΔNA of the generated Bessel beam. Based on the specified components, the three axicons (AX252B and AX255B, Thorlabs) cost $635 each, the three lenses (AC254-125-B×2 and AC254-150-B, Thorlabs) cost $110 each, and the iris (SM2D25D, Thorlabs) costs $105, resulting in a total system cost of approximately $2,340. For comparison, spatial light modulator (SLM)-based implementations that offer comparable tunability typically require an SLM module costing on the order of $20,000 USD, in addition to more complex optical alignment and reduced optical efficiency.
(3) Some biological conclusions, e.g., regarding novel features of microglial dynamics (i.e., the observed two-wave responses and coordinated extension-retraction), are based on relatively limited sample size and would benefit from clearer discussion of variability across animals and fields of view.
We thank the reviewer for this important comment regarding the limited sample size of the microglial dynamics study. We agree that a more comprehensive assessment across animals would be required to establish the generality of these biological findings. In the current study, our intent is not to draw broad biological conclusions, but rather to report observations enabled by the tBessel-TPFM platform. As noted in the manuscript, we have deliberately used descriptive language (e.g., “two distinct waves of process extension were observed” “process dynamics revealed…” and “advancing processes displayed…”) to avoid over claim of the biological findings beyond the data presented.
(4) The use of neural network-based denoising for microglial imaging is reasonable but introduces potential concerns about trustworthiness; additional clarification of validation or failure modes would strengthen confidence in these results.
We thank the reviewer for raising this important point regarding the reliability of neural network-based denoising. We agree that additional validation and discussion of potential failure modes are essential to build confidence in these results. To assess the fidelity of the CARE-denoised data, we performed several additional analyses (Author response image 1). First, we compared normalized raw and denoised images averaged over 10 frames. The difference between the two images was spatially uniform and primarily reflected residual noise present in the raw data, rather than structured discrepancies (Author response image 1a). As expected, brighter features like microglial somata exhibited smaller differences due to their intrinsically higher signal-to-noise ratio, whereas weaker processes showed larger noise-related differences. Second, we extended this comparison across the full time-lapse sequence by applying consistent color mapping to both raw and denoised videos and computing frame-by-frame difference maps. These analyses show that the observed differences are consistent with noise suppression, without introducing coherent structural features or altering the apparent microglial dynamics (Author response image 1b).
Author response image 1.
Validation of CARE-based denoising for microglial imaging. (a) Comparison of 10-frame averaged normalized raw (left), CARE-denoised (middle), and their pixel-wise difference (right) images. The second row shows a zoomed-in view of the boxed region. (b) Color-coded time-lapse projections over a 10-minutes imaging session for the raw (left) and CARE-denoised (middle) data, along with their pixel-wise difference (right).
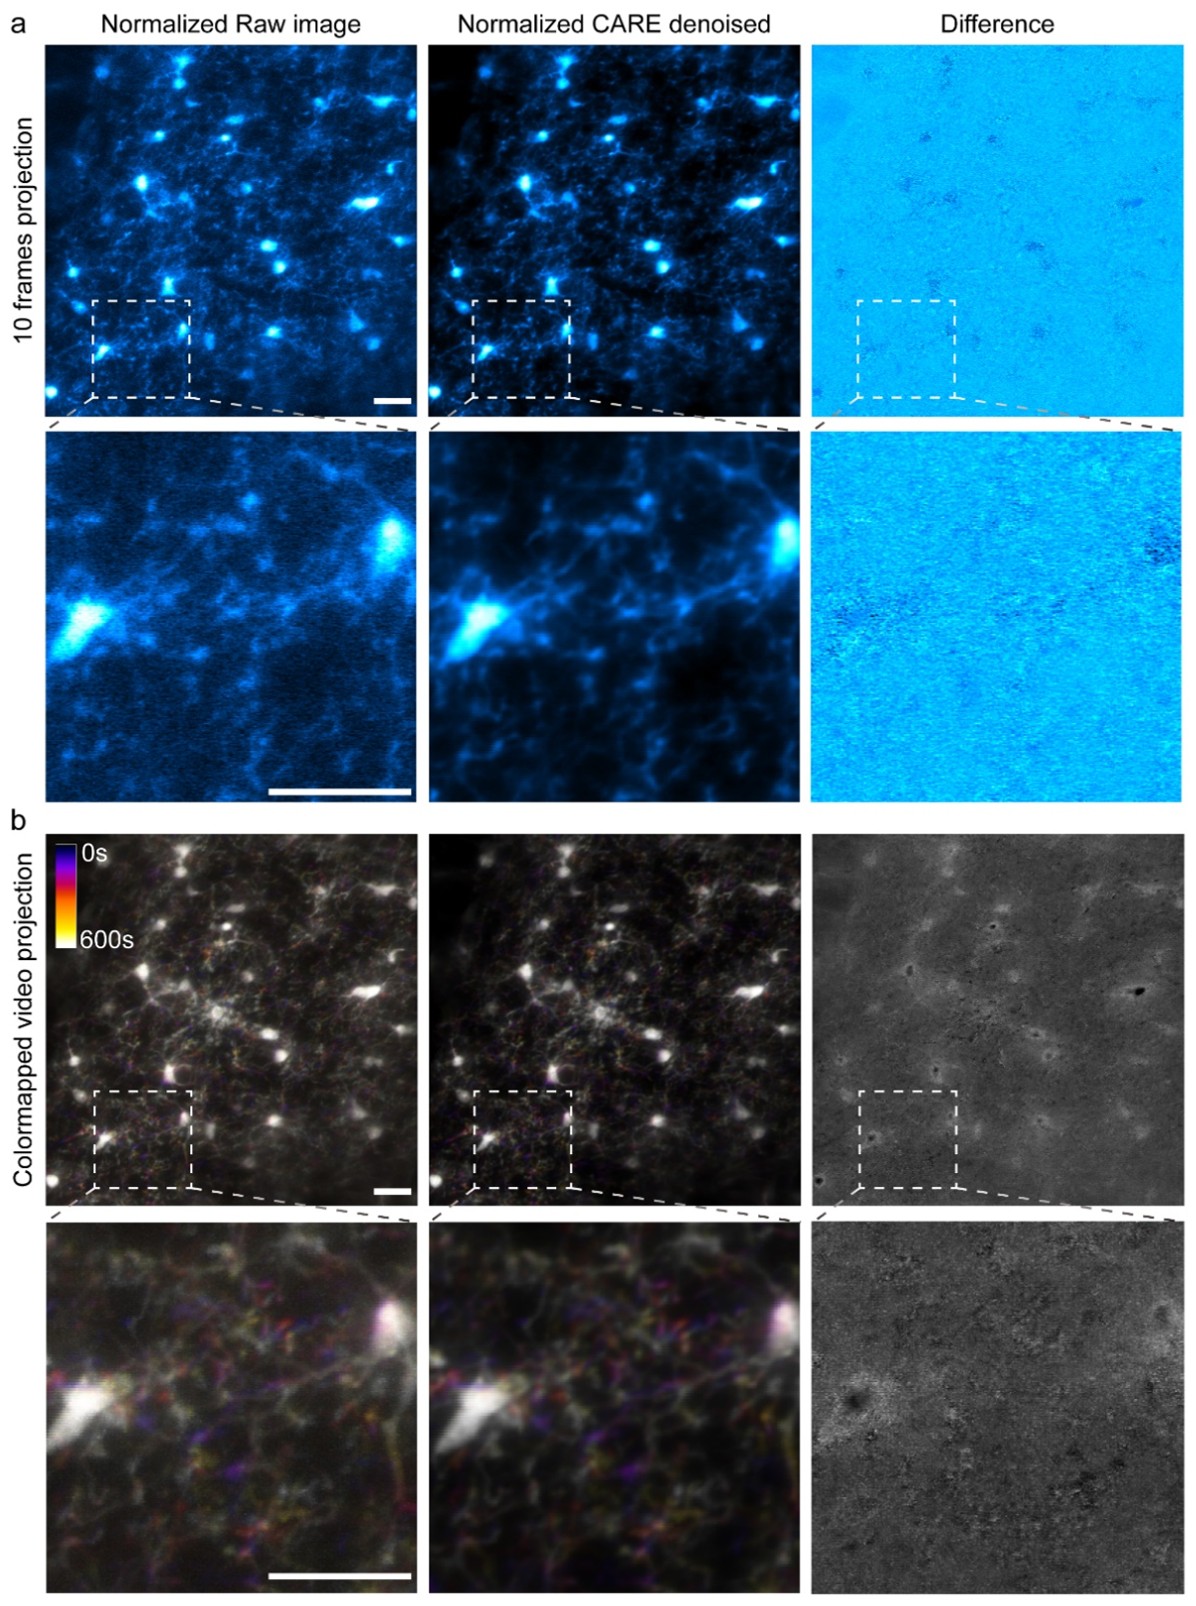
To conclude, most of the authors' claims are well supported by the data. The central conclusion, namely that tBessel-TPFM provides tunable volumetric imaging enabling experiments not feasible with existing two-photon approaches, is justified. Some biological interpretations would benefit from a more cautious framing, but they do not undermine the main technical and methodological contributions of the study. This is a strong and technically rigorous manuscript that makes a substantial methodological advance with clear relevance to neuroscience and intravital imaging. Minor clarifications and a slightly more measured discussion of certain biological findings are recommended.
We thank the reviewer for this thoughtful and encouraging summary of our work. We greatly appreciate the recognition that tBessel-TPFM provides a meaningful methodological advance and enables volumetric imaging experiments that are difficult or impractical with existing two-photon approaches.
Reviewer #2 (Public review):
The authors describe a tunable Bessel beam two-photon microscope (tBessel-TPFM) designed to overcome a common limitation of Bessel-based volumetric imaging: axial shifts of the effective focus during Bessel beam parameter tuning. Their optical design allows independent control of axial beam length and resolution while keeping the axial center fixed. This is extensively validated through simulations and experiments.<br /> Strengths:
A major strength of the work is the breadth of validation combined with the level of technical detail provided. The authors carefully characterize the optical performance of the system and clearly explain the design choices and underlying derivations, which will make it easier for others to understand and implement. The authors demonstrate the utility of the method across several in vivo applications, including neurovascular imaging, blood flow measurements, optogenetic stimulation, and microglial dynamics.
We thank the reviewer for their thoughtful and encouraging comments. We greatly appreciate the recognition of the technical rigor, breadth of validation, and clarity of explanation presented in our work.
Weaknesses:
In the in vivo demonstrations, the authors employ different Bessel beam configurations across experiments, but the beam parameters are not dynamically tuned during live imaging. A video example showing continuous or interactive tuning of the Bessel beam within a single in vivo imaging sequence would further highlight the practical advantages of this platform and strengthen the case for its potential applications.
We thank the reviewer for their suggestion. While we agree that continuous or interactive tuning of the Bessel beam during imaging would further highlight the practical flexibility of the platform, and changing the Bessel beam parameters during imaging session is feasible in our tBessel-TPFM implementation, for the in vivo applications presented in this manuscript, dynamic tuning during the actual recording is generally not required. In practice, the Bessel beam parameters are selected before data acquisition based on the biological target, desired axial coverage, spatial resolution, and acceptable level of projection overlap.
In addition, while excitation powers are reported, the manuscript does not place these values in the broader context of known photodamage thresholds for two-photon microscopy, which would be helpful to the readers.
We thank the reviewer for bringing up this important point. It is known that multiphoton imaging relies on relatively high illumination power, which causes brain heating and thus photodamage. Previous studies have reported that continuous illumination with a 920-nm laser beam at 0.8 NA over 1000s results in a peak temperature increase of ~1.73 °C/100 mW in the brain, with power above 300 mW observed to cause cellular damage. Power levels below 250 mW were considered to be safe for long-term imaging. (Podgorski and Ranganathan, 2016) In our experiments, the measured post-objective powers range from 20 mW to 149 mW, which are well below the established safe threshold.
Denoising/image restoration are applied in one of the in vivo examples, but it is unclear why this step was used specifically for this dataset and whether it was necessary to achieve adequate SNR or primarily included as an additional demonstration.
We thank the reviewer for requesting clarification on the usage of the CARE denoising model. The CARE-based denoising was applied only in Figure 5, the microglial imaging example, and was primarily included as an additional demonstration of how neural network–based image restoration can be used to enhance low-SNR volumetric datasets acquired with tBessel-TPFM. All other images and analyses in the manuscript were performed on raw data without any denoising. To assess the reliability of the CARE denoising method, we further compared raw and denoised data using 10-frame averages and color-mapped the full 10-minute time-lapse video, both showed minimal differences (Response Fig 1). These analyses confirm that the CARE denoising model did not introduce structural artifacts or affect the biological dynamics observations in our dataset.
Reviewer #3 (Public review):
The manuscript presents an elegant and cost-effective approach for generating a tunable Bessel beam on a conventional two-photon microscope. The authors assemble a compact optical module comprising three axicons and a series of lenses that permits rapid adjustment of both lateral resolution and axial extent without modifying the focal plane. This flexibility enables the system to be readily adapted to a variety of biological preparations. As a proof of concept, the authors employ the device to record blood flow velocities in cortical microcapillaries, arterioles, and venules, thereby directly visualizing vasodilatation and vasoconstriction dynamics and permitting quantitative analysis of neurovascular coupling across cortical layers in awake mice.
The authors demonstrate that the tunability of the Bessel beam can be exploited to match the numerical aperture to the vessel type: a high NA configuration, albeit slower scan, is optimal for resolving flow in capillaries, whereas a low NA setting provides faster acquisition suitable for arterioles and venules. By implementing a one-dimensional line scan with the Bessel beam, they achieve an imaging speed that is twentyfold faster than conventional frame-by-frame scanning, which proves sufficient to capture hemodynamic transients before and after an induced ischemic stroke.
In addition to pure observation, the authors integrate a co-propagating Gaussian line to the system, allowing simultaneous imaging and photostimulation within the same focal plane. This capability addresses a common limitation of other Bessel beam implementations, in which the observation and perturbation planes often become misaligned when the Bessel beam is altered. The manuscript also emphasizes the advantage of Bessel beam excitation for calcium imaging after a perturbation, because it captures neuronal activity in planes both above and below the nominal focal plane, signals that would be missed with a standard Gaussian focus. Finally, the authors apply the technique to investigate the neuroimmune response following targeted microglial ablation; they report that adjacent microglia extend processes toward the injury site while retracting processes in the opposite direction.
Overall, the work offers a technically straightforward yet powerful extension to existing two-photon platforms, providing high-speed, volumetric imaging and stimulation capabilities that are well-suited to a broad range of neurovascular and neuroimmune studies. The experimental validation is quite thorough, and the presented data convincingly illustrates the benefits of the approach.
Strengths:
The authors present a truly clever and inexpensive optical module that can be integrated into almost any two-photon microscope, providing a tunable Bessel beam with a minimal modification of the existing system. The experimental data and accompanying quantitative analysis convincingly demonstrate that the system can reveal physiological events, such as capillary flow, calcium transients across multiple axial planes, and microglial process dynamics, that are difficult or impossible to capture with a conventional Gaussian beam. The breadth of experiments chosen for the manuscript illustrates the practical utility of the device and supports the authors' conclusions that it extends the functional repertoire of standard two-photon microscopy.
We sincerely thank the reviewer for the thoughtful and encouraging feedback. We're glad that the technical design and broad applicability of the tBessel module came through clearly, and we appreciate the recognition of its ease of integration and ability to capture dynamic physiological processes.
Weaknesses:
The manuscript would benefit from a more detailed contextualisation of the claimed speed advantage. Although the authors mention other techniques in the introduction, they do not provide any direct comparison with other state-of-the-art high-speed two-photon approaches such as light beads microscopy (Demas et al., Nat. Methods 2021), temporal multiplexing schemes (Weisenburger et al., Cell 2019), or random access microscopy (Villette et al., Cell 2019). A brief comparison of imaging speed, spatial resolution, and instrumental complexity would enable readers to assess the relative merits of the present method.
We thank the reviewer for this important suggestion. We agree that a more explicit comparison with other high-speed two-photon imaging methods helps clarify the speed advantages of our system. Several existing approaches, including light-beads microscopy (LBM), temporal multiplexing, and AOD-based random-access microscopy, have demonstrated impressive high-speed volumetric imaging capabilities. Light-beads microscopy (Demas et al., 2021) reported imaging over a large volume of 5.4 × 6 × 0.5 mm<sup>3</sup> at 2 Hz. However, this large-volume acquisition used 5-μm lateral pixel sampling, corresponding to an effective lateral resolution of approximately 10 μm. In a more comparable mesoscopic volume, LBM imaged 0.6 × 0.6 × 0.5 mm<sup>3</sup> at 9.6 Hz with 1-μm lateral pixel sampling. In addition, the LBM module uses off-axis reflective concave mirrors, which require careful alignment, and the axial sampling range is not readily tunable. Temporal multiplexing approaches (Weisenburger et al., 2019), reported imaging over approximately 1 × 1 × 0.6 mm<sup>3</sup> at 17 Hz. However, this volume rate was achieved with relatively coarse spatial resolution of approximately 5 μm, together with a more complex optical design involving multiplexed excitation, detection, and synchronization. AOD-based random-access microscopy (Nadella et al., 2016; Villette et al., 2019) provides very fast point or region sampling, and reported 250 × 250 μm<sup>2</sup> imaging with 512 × 512 pixels and a 50-ns pixel dwell time, corresponding to ~0.5-μm pixel sampling and ~76 frames/s for two-dimensional imaging. However, volumetric imaging requires additional axial sampling, which lowers the effective 3D acquisition rate. In addition, AOD-based systems rely on diffractive beam steering, which introduces light loss due to finite diffraction efficiency and increases optical and calibration complexity. In comparison, tBessel-TPFM imaged a 0.4 × 0.4 × 0.12 mm<sup>3</sup> volume at 58 Hz with 0.2-μm lateral pixel sampling. Our largest demonstrated imaging volume reached 2.5 × 2.5 × 0.45 mm<sup>3</sup> while maintaining diffraction-limited lateral resolution. Therefore, compared with these high-speed volumetric approaches, tBessel-TPFM provides a distinct balance of volume rate and spatial sampling, and easier implementation simplicity.
A second limitation that warrants discussion is the inherent trade off between volumetric coverage and image specificity. Because the Bessel beam excites fluorescence throughout an extended axial range, the detector inevitably integrates signal from a three dimensional volume into a two dimensional image. In densely labelled tissue, this can lead to significant signal crosstalk, reducing contrast and complicating quantitative interpretation. A brief analysis of how labeling density affects the fidelity of flow or calcium measurements, or suggestions for mitigating crosstalk (e.g., computational deconvolution, adaptive excitation shaping, or combinatorial sparse labeling), would broaden the applicability of the technique.
We thank the reviewer for highlighting this important trade-off between volumetric coverage and image specificity in Bessel beam imaging. As Bessel beams project fluorescence from multiple features along the z-axis onto the same x–y plane, longer beams expand depth coverage at the same acquisition speed but can confound signals from axially spaced structures (Line 119-121 in manuscript). For densely labeled samples, the probability of having structures overlap in their x-y locations is high, and thus a shorter beam should be used. In sparsely labeled samples, structures have a lower probability of overlapping, and thus longer foci can be used (Line 166-168 in manuscript). Additionally, at the same NA, longer Bessel beam have more energy in the side rings surrounding the central peak, which may lead to higher background signal (Line 121-123 in manuscript) (Lu et al., 2017). These reasons necessitate to have not only NA tuning, but also independent length tuning (ΔNA tuning) to optimize imaging Bessel length to provide a balance between structural overlap that obscures signal localization, and the volumetric speedup, in any given sample based on labeling density and imaging goals, which are realized in our tBessel design.
Reference:
Demas, J., Manley, J., Tejera, F., Barber, K., Kim, H., Traub, F.M., Chen, B., Vaziri, A., 2021. High-speed, cortex-wide volumetric recording of neuroactivity at cellular resolution using light beads microscopy. Nat Methods 18, 1103–1111. https://doi.org/10.1038/s41592-021-01239-8
Göbel, W., Helmchen, F., 2007. In Vivo Calcium Imaging of Neural Network Function. Physiology 22, 358–365. https://doi.org/10.1152/physiol.00032.2007
Grewe, B.F., Voigt, F.F., van ’t Hoff, M., Helmchen, F., 2011. Fast two-layer two-photon imaging of neuronal cell populations using an electrically tunable lens. Biomed Opt Express 2, 2035–2046. https://doi.org/10.1364/BOE.2.002035
Huang, C., Tai, C.-Y., Yang, K.-P., Chang, W.-K., Hsu, K.-J., Hsiao, C.-C., Wu, S.-C., Lin, Y.-Y., Chiang, A.-S., Chu, S.-W., 2019. All-Optical Volumetric Physiology for Connectomics in Dense Neuronal Structures. iScience 22, 133–146. https://doi.org/10.1016/j.isci.2019.11.011
Lu, R., Sun, W., Liang, Y., Kerlin, A., Bierfeld, J., Seelig, J.D., Wilson, D.E., Scholl, B., Mohar, B., Tanimoto, M., Koyama, M., Fitzpatrick, D., Orger, M.B., Ji, N., 2017. Video-rate volumetric functional imaging of the brain at synaptic resolution. Nat Neurosci 20, 620–628. https://doi.org/10.1038/nn.4516
Nadella, K.M.N.S., Roš, H., Baragli, C., Griffiths, V.A., Konstantinou, G., Koimtzis, T., Evans, G.J., Kirkby, P.A., Silver, R.A., 2016. Random-access scanning microscopy for 3D imaging in awake behaving animals. Nat Methods 13, 1001–1004. https://doi.org/10.1038/nmeth.4033
Podgorski, K., Ranganathan, G., 2016. Brain heating induced by near-infrared lasers during multiphoton microscopy. Journal of Neurophysiology 116, 1012–1023. https://doi.org/10.1152/jn.00275.2016
Sofroniew, N.J., Flickinger, D., King, J., Svoboda, K., 2016. A large field of view two-photon mesoscope with subcellular resolution for in vivo imaging [WWW Document]. eLife. https://doi.org/10.7554/eLife.14472
Villette, V., Chavarha, M., Dimov, I.K., Bradley, J., Pradhan, L., Mathieu, B., Evans, S.W., Chamberland, S., Shi, D., Yang, R., Kim, B.B., Ayon, A., Jalil, A., St-Pierre, F., Schnitzer, M.J., Bi, G., Toth, K., Ding, J., Dieudonné, S., Lin, M.Z., 2019. Ultrafast Two-Photon Imaging of a High-Gain Voltage Indicator in Awake Behaving Mice. Cell 179, 1590-1608.e23. https://doi.org/10.1016/j.cell.2019.11.004
Weisenburger, S., Tejera, F., Demas, J., Chen, B., Manley, J., Sparks, F.T., Traub, F.M., Daigle, T., Zeng, H., Losonczy, A., Vaziri, A., 2019. Volumetric Ca2+ Imaging in the Mouse Brain Using Hybrid Multiplexed Sculpted Light Microscopy. Cell 177, 1050-1066.e14. https://doi.org/10.1016/j.cell.2019.03.011
Yang, W., Carrillo-Reid, L., Bando, Y., Peterka, D.S., Yuste, R., 2018. Simultaneous two-photon imaging and two-photon optogenetics of cortical circuits in three dimensions. eLife 7, e32671. https://doi.org/10.7554/eLife.32671
Subscription is verplicht voor applicaties in het domein. Applicaties die in een Koppeltaal-domein opereren registreren een Subscription op Patient-changes. Twee patronen zijn toegestaan: Tag-specifiek: Patient?_tag=...|DELETE_PENDING — meest gericht, hoogste signaal-ruisverhouding; alleen verwijderaankondigingen. Breed op Patient-changes: Patient of Patient?_id=... — applicatie ontvangt alle Patient-updates en filtert zelf op meta.tag. Past bij applicaties die om andere redenen ook Patient-changes willen volgen. Subscriben op AuditEvents is voor pre-delete signalen geen geldig alternatief: zolang de Patient nog bestaat, is de tag op de Patient de waarheid en is de AuditEvent slechts bewijslog. Voor het post-delete signaal (zie hieronder) ligt dat mogelijk anders, omdat de Patient dan niet meer bestaat als bron — dit is nog een open keuze.
Dit deel is nog wat complex en vraagt nogal veel aanpassingen in zowel voorzieningen als applicaties.: 1. Het zetten van de DELETE_PENDING tag mag niet gezien worden als een wijziging op de Patient omdat daarmee Patient-resources die 2 jaar bestaan en waarvoor nog nooit een Task is aangemaakt of Launch is uitgevoerd weer terug komt in een status dat die gewijzigd is en dus altijd blijft bestaan. Dit vraagt over verduidelijking van de verwachtingen ten aanzien van $meta-add. Specifiek: * Geen wijziging van meta.lastUpdated en meta.version * Geen REST Audit event * Daarom ook geen notificatie op basis van de standaard Patient-subscription (want de Patient is volgens bovenstaande niet gewijzigd) 2. De te versturen AuditEvents zijn nog niet voldoende gespecificeerd 3. Wat betreft de Notificaties: * Het is mijns inziens niet gewenst dat applicaties op de bestaande Patient subscription ook de delete_pending notificaties krijgen, dat zal alleen maar lijden tot verwarring * Omdat het gebruik van de noodrem feitelijk ongewenst isen als een advanced usecase moet worden gezien is het geen enkel probleem als applicaties geen subscriptie hebben * Al het bovenstaande pleit voor een specifieke subscriptie- en notificatie-endpoint voor alle notificaties rond het opschonen van patientdata * Ik ben van mening dat juist een subscriptie op de relevante AuditEvents het meest duidelijk en krachtig is.
<script src="https://unpkg.com/kubo-rpc-client/dist/index.min.js"></script>
kubo0rpc0client script tag
Reviewer #3 (Public review):
Summary:
The primary objective of this study was to establish a practical and functional framework for the propagation of stable transgenic cell lines of Blastocystis, a common animal gut microeukaryote. Although the work focused on Blastocystis ST7-B, a subtype with relatively low prevalence in humans, this choice is justified by its association with more frequent negative health effects. Beyond their relevance to the medical field, the methodological advances described here have the potential to also expand cell biology studies of this anaerobic organism, including its unusual mitochondria and redox metabolism.
Strengths:
Prior to this work, genetic tools for Blastocystis were very limited, relying on a single strong promoter-terminator combination. The authors successfully expanded the available promoter set across a range of expression strengths by testing two dozen variants in luciferase-based assays. Critically, they developed an integrated workflow from a modular transgenic construct design, to an expanded inventory of molecular components (promoters, reporters), optimized DNA delivery, stepwise antibiotic resistance-mediated clonal selection and propagation, and to reporter validation. The evaluation of several anaerobiosis-compatible labeling strategies for live (and fixed) cell optical imaging will be particularly useful, with the SNAP-tag system appearing especially promising for Blastocystis.
Weaknesses:
The presented data generally provide solid support for the conclusions that the work reached, but clarification of reasoning and several inconsistencies, as well as amendments to the visual presentation of the data, would be highly beneficial, as detailed below.
(1) Episomal persistence of the construct:<br /> The manuscript repeatedly assumes, including in its title, that constructs persist in Blastocystis in their episomal form, but no direct evidence is provided. Although this interpretation is plausible, it should be identified more clearly as provisional. Nuclear genomic integration (e.g., via NHEJ) remains a possible explanation unless supporting evidence or rationale is provided to exclude it. Testing whether the phenotype persists without drug-mediated selection in the generated transgenic cell lines would help strengthen the case for episomal maintenance.
(2) Promoters and terminators:<br /> 2.1) There is a discrepancy between the claimed number of loci (14), from which promoters used to drive luciferase expression were derived, and those detailed as having been actually generated in Table 1 (11). This inconsistency should be corrected or explained, as it creates uncertainty around the accuracy of the dataset.<br /> 2.2) Based on the presented evidence, constructs benchmarked in bioluminescence assays differed only in their promoter composition. Although terminator selection is mentioned in the Methods section, no additional details are provided; for instance, Table 1 and Figure 2 only list 23 promoters in total. Figure 2A likewise shows only promoter-dependent variation. If the terminator was held constant (LeguP1?), this should be stated explicitly. The authors may then consider revising the wording of having tested "23 promoter-terminator pairs" to better reflect that only promoters varied.<br /> 2.3) Promoter benchmarking was done with a plasmid lacking a selection marker, so it is unclear how the maintenance of the luciferase construct was ensured. Without selection, the observed reporter intensity could reflect differential or stochastic plasmid retention rather than promoter strength alone. The luminescence assay was performed 16-18 hours after transfection, but the rationale for this particular timeframe should be explained. In this context, the authors should explicitly state whether the experiments shown in Fig.2A represent biological triplicates or technical triplicates from a single transfection.
(3) Figure 2:<br /> 3.1) Several aspects of the current design may lead to ambiguity for the reader. The boxplots are colour-coded, but it is unclear whether the colours carry meaning or are purely decorative. Because the data are already spatially separated into bins, additional random colouring is redundant and may suggest distinctions that are not intended. In addition, part A of Figure 2 is split into two panels, with the scale for the left panel shown in the right panel and some of the boxplot colours falling in the range of the scale, but not in line with their counterparts in the left panel. Because the colour use is not consistent, it is difficult to tell whether the same scale should be applied to both panels or how it should be interpreted.<br /> 3.2) The left panel of part A uses a diverging blue-white-red colour scheme, which is most appropriate when the midpoint represents a meaningful central value such as zero. Because the values shown in this graph are only positive, a non-diverging 2-colour scale or a colour palette such as 'viridis' would make the plot easier to interpret.<br /> 3.3) A black background should be avoided: 'B' and 'C' labels are invisible, and it draws attention to a distracting design feature rather than the data themselves.
(4) Figure 3:<br /> 4.1) Individual snapshots should be separated more clearly, either by using a white background or by adding visible borders to make the overall composition clearer. As currently displayed, some boundaries between fluorescent channels resemble image artifacts rather than intentional panel divisions.<br /> 4.2) In parts B-D, the legend should explain more clearly what each image shows, and the figure itself would benefit from annotations. There seem to be three sub-panels in each 'condition' of part B (as well as C and D): while the middle and rightmost panel can be easily inferred to represent the fluorescent protein and bright-field image, what the leftmost panels represent is not specified. If DAPI was used to dye DNA, an explanation why mostly multiple labelled regions are visible should be provided.<br /> 4.3) Cell morphology and appearance differ markedly between UnaG/smURFP and SNAP-tag images, which should be explained. A microscope issue is mentioned in the main text, but if that was the cause, the authors should consider replacing the images, as the current distortions complicate interpretation.
Note: This repo does not publish or maintain a latest tag. Please declare a specific tag when pulling or referencing images from this repo.
RRID:Addgene_57819
DOI: 10.64898/2026.05.20.726613
Resource: RRID:Addgene_57819
Curator: @scibot
SciCrunch record: RRID:Addgene_57819
eLife Assessment
This important study combines single-molecule imaging and CUT&TAG to address the molecular mechanism underlying the differentiation process that initiates the formation of red blood cells in the bone marrow. The authors provide evidence that the transcription factor GATA2 transiently associates with a new set of genomic loci early in the differentiation process before it is replaced by GATA1. Together, the experiments across three biological systems are solid, but they could benefit from additional details and controls to strengthen the conclusions.
Reviewer #1 (Public review):
Summary:
During erythroid differentiation, hematopoietic progenitors relinquish multipotency and activate lineage programs. The switch from GATA2 to GATA1 is particularly important in this process, yet GATA2 chromatin‑binding kinetics remain undefined. The authors investigated GATA2-chromatin interaction dynamics during erythroid differentiation in three different cell systems using single‑molecule live‑cell imaging, and they also used CUT&Tag to profile GATA2 chromatin occupancy.
By single‑molecule imaging, the authors report two interaction modes for GATA2: short‑lived (<1 s) and long‑lived (>5 s) binding. The proportion of long‑lived molecules, the number of binding events, and the duration of long‑lived binding change (or are maintained) during differentiation. Notably, long‑lived chromatin engagement by GATA2 increases during early erythroid differentiation and decreases at the late stage. CUT&Tag identifies regulatory elements selectively occupied by GATA2 during the early transition stage. Together, these results support a model in which transcription factor kinetics form a dynamic chromatin‑engagement profile that characterizes the GATA2‑to‑GATA1 transition.
Strengths:
(1) Characterizing transcription‑factor binding kinetics during the GATA2->GATA1 transition addresses a fundamental mechanism in erythroid differentiation.
(2) Combining single‑molecule live imaging with CUT&Tag provides both dynamic and locus‑specific perspectives.
(3) Single-molecule analysis across three different cell systems strengthens the potential generalizability of the findings and highlights biological variability.
Weaknesses:
I agree that single‑molecule imaging is a powerful approach for investigating GATA2 kinetics, but the single‑molecule data are the most important part of the paper and need improvement. The analyses focus on three measures: (i) duration of long binding, (ii) proportion of short‑ and long‑binding molecules, and (iii) total binding events. However, several methodological and control issues limit confidence in the kinetic interpretations. The authors should address the following major concerns.
(1) Two binding states: justification and controls
The authors propose two states of GATA2 binding. Are there only two states? Studies that separate short‑ and long‑lived binding (e.g., Chen et al., 2014, PMID: 25342811) address two states of transcriptional factors very carefully. Some long‑binding duration distributions here are very long‑tailed (e.g., Figure 2D middle), suggesting a possible third state. The authors must explain how they determined that two states provide the "best fit" to the data and how they classified "short" versus "long" binding.
Controls should be included for long‑lived and short‑lived binding (e.g., histone proteins, HaloTag‑NLS, or a binding‑deficient GATA2 mutant) as in other studies. These controls are essential to exclude alternative explanations (see points below).
(2) Exclude photophysical and focal‑plane artifacts
The authors should exclude contributions from (i) photobleaching, (ii) blinking, and (iii) Z‑axis motion (disappearance from the focal plane). Although photobleaching correction is mentioned in the Methods, no details are provided. Describe and quantify the photobleaching correction and demonstrate that it was applied across all cell types and conditions.
Some spots in the supplementary movies appear to blink or to move substantially between frames. Provide analyses or controls that distinguish true dissociation events from photophysical blinking/bleaching or axial motion.
(3) HILO illumination and nuclear region sampled
HILO is powerful but sensitive to illumination angle: slight changes sample different nuclear regions (e.g., nuclear interior versus periphery). The nuclear periphery is enriched in heterochromatin and may bias binding statistics. Explain how the authors controlled the HILO angle and confirmed that comparable nuclear regions were imaged across cells and conditions.
(4) Quantification of event counts and long‑binding durations
The number of binding events and measured long‑binding durations are strongly affected by imaging conditions (labeling/staining, bleaching, nucleus size, cell cycle state, focal plane, spot detectability, etc.). Imaging clarity appears to differ among cells/conditions in the supplementary movie. Provide more careful analysis describing how these variables were controlled or corrected for, and assess the sensitivity of results to choices in detection and tracking parameters.
(5) Evidence that spots are single molecules
The authors state that spots represent single molecules but do not provide supporting evidence. Spot brightness varies considerably in the movies. Brightness differences may reflect axial position. Provide evidence supporting single‑molecule assignment (e.g., single‑step photobleaching traces, brightness distributions compared to a known single‑molecule control, or photon count analysis).
(6) Description of spot‑analysis pipeline
The manuscript lacks a sufficient description of the spot‑analysis method. I reviewed the STRAP pipeline paper cited (Haque and Coleman 2025 bioRxiv) and the GitHub code, but the Methods in the current manuscript should include a detailed STRAP pipeline. This would enable readers to evaluate and reproduce the analyses.
(7) Differences among cell systems
The three cell systems yield notably different results (e.g., Figure 2C vs 4C and Figure 2D/3D vs 4D). Provide a more detailed explanation for these differences and discuss how biological variability, technical differences, or imaging biases might account for the discrepancies.
Reviewer #3 (Public review):
Hobbs et al. use live-cell single-molecule tracking (SMT) of HaloTag- and SNAP-tagged GATA2 combined with CUT&Tag chromatin profiling to examine how GATA2 chromatin engagement evolves during erythroid differentiation. Across three complementary systems, G1E-ER4 cells, HPC7 cells, and primary bone marrow progenitors from a new Gata2-SNAP knock-in mouse, they report a transient strengthening of long-lived GATA2 chromatin binding at the "Early" (2 h) erythroid stage, manifested either as increased residence time (G1E-ER4) or expansion of the long-lived bound fraction (HPC7, primary cells). CUT&Tag identifies 1,167 Early-restricted GATA2 peaks partitioning into GATA2-only (promoter-proximal, GATA/RUNX motifs) and GATA2+GATA1 co-bound (distal, GATA/E-box motifs) subclasses. The authors propose that this kinetic phase represents a previously unappreciated dimension of the GATA switch.
This is a strong study with a genuinely novel finding-the non-monotonic kinetic behavior of GATA2 during erythroid priming, supported by complementary measurements in three biological systems. The issues below are largely clarifications, additional analyses of existing data, and modest refinements to the discussion. With these addressed, the manuscript will make a valuable contribution. I recommend a minor revision.
Specific points:
(1) Clarify the photobleaching correction and report per-cell bleach lifetimes.
The long-lived residence time claim in G1E-ER4 cells depends on careful accounting for photobleaching, which the Methods indicate was done via a right-censoring model. For reviewer and reader confidence, the authors should report the per-stage (or per-cell distribution of) photobleaching lifetimes and the photobleach-corrected residence time values alongside the apparent values in Figure 2D. If feasible, including a brief supplementary analysis with an H2B-Halo or similar long-lived control under matched conditions would further solidify the quantitative claims. This is an analysis of existing data and should not require new imaging.
(2) Unify or explicitly discuss the mechanistic differences across systems.
The three systems show qualitatively different signatures: residence time change in G1E-ER4, bound fraction expansion in HPC7, and primary cells. The authors currently group these under "enhanced engagement," but these signatures imply different underlying mechanisms (koff decrease vs. increased kon or increased specific-binding-competent pool). The Discussion partially addresses this by noting engineered vs. native differences, but a more explicit framing in both Results and Discussion would help readers. Specifically, reporting an on-rate proxy (for example, binding events per unit time normalized to detectable molecule number) alongside koff would let readers see how the mechanistic pieces fit together. I do not think this changes the central message; it sharpens it.
(3) Per-cell GATA2 concentration would strengthen the "uncoupling" claim.
A central claim of the Figure 6 model is that chromatin engagement is uncoupled from protein abundance. The ectopic Shield-1 stabilization system is a reasonable design choice, but quantifying total nuclear GATA2-Halo signal (for example, from the pre-bleach frame or a brief high-power acquisition) on a per-cell basis across stages would directly support the interpretation. For the primary cells, where the biological claim is strongest, a western blot or quantitative immunofluorescence on the flow-sorted populations would make the uncoupling argument much more defensible. I recognize this may be one additional experiment, but it is a high-value one.
(4) Additional single-cell distribution analysis.
Figure 1E and Figures 2 to 4 show substantial cell-to-cell heterogeneity, and the Early populations in particular look potentially bimodal. Given that the authors cite Wheat et al. and Palii et al. on probabilistic hematopoietic transitions, a brief supplementary analysis using distribution-based statistics (K-S test, or mixture model) rather than, or alongside, mean-based ANOVA would align the analysis with this conceptual framing and may reveal whether the Early state represents a subpopulation transition rather than a uniform shift. This is purely an analysis of existing data.
(5) Quantitative integration of CUT&Tag with SMT.
The manuscript presents SMT and CUT&Tag as complementary but does not attempt to quantitatively connect them. A back-of-the-envelope calculation of whether a 21% increase in residence time (G1E-ER4), or the fraction expansion in other systems, is consistent with the acquisition of the 1,167 Early-restricted sites, given plausible site affinities, would substantially strengthen integration. Even if the calculation is approximate, framing it explicitly would help readers appreciate that the two datasets reinforce each other.
(6) Short-lived kinetic interpretation and tracking parameters.
The 1.5 s gap allowance in tracking is long relative to the 0.55 to 0.73 s short-lived residence times reported in primary cells (Figure Supplement 1F), which could affect the interpretation of the "slowing of target search" claim. A brief sensitivity analysis with tighter gap parameters in the supplement would reassure readers that this effect is robust. Additionally, please clarify how the inferred slowing of search, which should reduce kon, is reconciled with the increased number of binding events per cell at the Early stage.
(7) CUT&Tag peak definition.
The Early-restricted peak set is defined by presence and absence at q less than 0.01, which can be sensitive to near-threshold peaks. Please report either (a) the CUT&Tag signal intensity distribution at the 1,167 sites across all three stages as a quantitative scatter or density plot, beyond the heatmap in Figure 5C, or (b) the result of a differential binding analysis (for example, DESeq2 on read counts in a union peak set) as a supplementary confirmation. Please also state the number of CUT&Tag replicates per stage and the overlap of Early-restricted sets across replicates.
(8) Knock-in mouse validation.
The Gata2-SNAP allele is a valuable new tool, and it would benefit from slightly more quantitative validation in the supplement. A brief characterization of basic hematopoietic parameters in homozygotes (CBC, LSK/HSPC frequencies, or colony assays) would confirm that the tagged allele is truly physiological and would serve the community that will want to use this mouse going forward. If this has been done, please include it; if not, a statement about what was checked would suffice.
Author response:
We are writing to provide our provisional response to the public reviews. We note that the reviewers’ comments focus primarily on strengthening technical rigor and quantitative interpretation. We have designed the planned revisions to directly address the reviewers’ major concerns and to strengthen the study’s evidentiary basis. We plan to submit a revised manuscript for the final Version of Record.
For clarity, we summarize below the major new experiments and analyses that address the reviewers’ primary concerns:
(1)Validation of Tracking Parameters (Reviewers 1 & 3): We will re-analyze our single molecule tracking data with tighter gap-time allowances (0 seconds) to demonstrate the robustness of our interpretations of short- and long-lived kinetics. We will also generate a supplementary movie with binding trajectories superimposed directly on detected molecules to visually confirm tracking robustness.
(2) Photobleaching & Two-State Controls (Reviewers 1 & 3): We will report per-cell photobleaching lifetimes derived from our global fluorescence decay. To strengthen this analysis, we will include supplementary measurements using a H2B-HaloTag control under matched imaging conditions and perform single-molecule tracking of GATA2 zinc-finger deletion mutants (N-terminal, C-terminal, and double) as a binding-deficient functional control.
(3) Protein Expression & Labeling Efficiency (Reviewers 1 & 2): To address concerns about transgene expression and competition with endogenous proteins, we will quantify Halo-GATA2 levels in G1E-ER4 and HPC7 cells and SNAP-GATA2 levels in primary cells using standardized titration methods with established Halo-CTCF and SNAP-RPB1 reference systems.
(4) Integration of SMT and CUT&Tag (Reviewer 3): We have conducted a quantitative foldchange analysis of our existing CUT&Tag dataset to complement our single-molecule kinetics.
However, as detailed in our specific response below (R3 point 5), we emphasize that directly integrating population-level genomic occupancy measurements with single-cell kinetic measurements is not straightforward. We will therefore frame the relationship between these datasets as a conceptual consistency check rather than a strict quantitative integration. This quantitative analysis supports and refines the Early-restricted peak set, identifying a high confidence strict subset consistent with the broader presence/absence-defined set described in Figure 5 of the manuscript (see Author response images 1–3 and our response to R3 point 7).
(5) Characterization of the GATA2-SNAP Mouse (Reviewer 3): We have characterized hematopoietic populations in the homozygous knock-in mouse, including lymphoid (CD3<sup>+</sup>/CD4<sup>+</sup>/CD8<sup>+</sup>/B220<sup>+</sup>/CD19<sup>+</sup>), myeloid (CD11b<sup>+</sup>/Gr1<sup>+</sup>), and erythroid (Ter119<sup>+</sup>) compartments. These data, presented in Author response image 4, indicate that normal mature hematopoietic output is preserved across genotypes. Statistical caveats are described in the corresponding figure legend and in our response to R3 point 8.
Public Reviews:
Reviewer 1 (Public review):
(1) Two binding states: justification and controls
The authors propose two states of GATA2 binding. Are there only two states? Some longbinding duration distributions here are very long-tailed (e.g., Figure 2D middle), suggesting a possible third state. The authors must explain how they determined that two states provide the best fit and how they classified short versus long binding. Controls should be included for long-lived and short-lived binding (e.g., histone proteins, HaloTag-NLS, or a binding-deficient GATA2 mutant).
Agreed in part; we will attempt the requested binding-deficient control using existing GATA2 deletion constructs, complemented by GRID and H2B-HaloTag controls.
We will clarify that the two-state framework is an operational model rather than a claim that GATA2 can occupy only two physical states. This approach is widely used in SMT studies of chromatin-associated transcription factors and transcription machinery (Gebhardt et al., 2013; Liu et al., 2014; Hansen et al., 2017; Kenworthy et al., 2022). In particular, Ling et al. (Science, 2026) recently used two-exponential survival-probability fitting across 58 Halotagged transcription-associated proteins to distinguish transient and stable chromatin-binding populations, while explicitly noting that the simplified two-state model provides a tractable framework even when the underlying physical behavior may be more heterogeneous.
We agree that our current two-state model may under-represent the diversity of GATA2 chromatin-binding populations in single cells. However, even within this simplified framework, the existing analysis already indicates increased upper-tail dispersion of kinetic measurements (e.g., residence time and/or percentage of stable events) at the single-cell level in early erythroid cells. To support the goodness-of-fit metrics from our two-state fitting, as Reviewer 3 recommends, we will provide a supplementary table containing confidence intervals for the rate parameters and an F-test metric describing the differences between one- and two-state fits.
To determine whether additional binding states exist, we will perform GRID (Genuine Rate Identification from Distributions), which does not bias the model toward a particular number of states and, in our experience across multiple proteins, yields fits with 3-5 binding populations. However, we have found that in many cases, GRID requires aggregating binding events from multiple cells to achieve consistently robust fits for the populations of relatively rare, long-lived (>~30 sec) binding events. Therefore, GRID will assess whether additional populations exist, but we will lose the ability to analyze changes in the cell populations at the single-cell level.
We will include the multi-state analysis as a new supplementary figure. We will additionally clarify in the Results and Methods exactly how short- and long-lived binding events are classified (1-second threshold consistent with prior single-molecule frameworks for transcription-factor chromatin interactions; Gebhardt et al., 2013; Liu et al., 2014; Kenworthy et al., 2022) and direct the reviewer to these passages.
For the requested controls, we will include H2B-HaloTag imaging under matched conditions as a long-lived reference for both photobleaching correction and as a positive control for stable chromatin association, addressing R1 point 2 and R3 point 1 simultaneously.
We will also attempt to address the reviewer’s request for a binding-deficient control. We have lentiviral constructs in hand that encode GATA2 with a C-terminal zinc-finger deletion (which removes the primary DNA-binding domain), an N-terminal zinc-finger deletion, and a double deletion. We will perform single-molecule tracking of these mutants in the engineered cell systems and test whether removing GATA2’s specific DNA-binding capacity produces the predicted reduction in long-lived chromatin engagement, providing a functional perturbation control. The interpretation of these experiments will depend on the mutants expressing and localizing appropriately, which we will validate before drawing kinetic conclusions. We note that an analogous binding-deficient mutant cannot be examined in the physiological context of the Gata2SNAP knock-in mouse, and we will frame the cell-line mutant analyses accordingly. Together with GRID and the H2B-HaloTag control, these mutants provide complementary lines of validation for the two-state kinetic framework.
(2) Photophysical and focal-plane artifacts
The authors should exclude contributions from (i) photobleaching, (ii) blinking, and (iii) Z-axis motion. Describe and quantify the photobleaching correction. Provide analyses or controls that distinguish true dissociation events from photophysical blinking/bleaching or axial motion.
Agreed.
We will substantially expand the methodological description and provide three new pieces of supplementary analysis:
- Photobleaching: A per-cell photobleaching-rate distribution will be plotted for each cell type and differentiation stage, and photobleach-corrected residence-time values will be reported alongside apparent values in the relevant figures. We will also perform H2B-HaloTag imaging under matched illumination, exposure, and dye conditions in each cell line as a longlived chromatin-bound reference, establishing per-cell-type bleach lifetimes to which the GATA2 measurements can be referenced. This approach follows recent SMT precedent in which H2B decay was used to correct residence-time measurements for photobleaching, chromatin and nuclear motion, microscope drift, defocalization, and dye photophysics (Ling et al., Science 2026). The right-censoring photobleach-correction model used in our analysis will be described in detail in the revised Methods, including parameter values and per-cell handling.
- Blinking: The STRAP single-particle tracking pipeline already accommodates fluorophore blinking when linking trajectories across successive frames, following the multiple-targettracing framework of Sergé et al. (Nature Methods, 2008). This use of short gap-frame allowances to avoid artificially splitting trajectories due to fluorophore blinking or transient defocalization is consistent with recent live-cell SMT studies of chromatin-associated factors (Ling et al., Science 2026). We will add an explicit statement to the Methods describing how blinking-tolerant linkage parameters are set, and we will reanalyze representative datasets
with stricter maximum off-frame settings to ensure this parameter does not drive our conclusions (also addressing R3 point 6).
- Z-axis motion: Given our 500-ms exposure and the ~500-nm axial detection range of the HiLo configuration, axial loss is expected to be a minor contributor. We will quantify this indirectly by plotting, as a supplementary analysis, the maximum in-plane 2D spatial exploration of each binding trajectory, defined as the long-axis diameter of the 2D trajectory envelope. Although this does not directly measure z-position, it serves as a control for large apparent displacements that could reflect molecules moving out of the HiLo detection volume and demonstrates that observed dissociation events are not dominated by axial drift.
Representative photobleaching traces from individual cells (lowest, highest, and median bleach rates) will be included to support the single-molecule interpretation (also addresses R1 point 5).
(3) HILO illumination and nuclear region sampled
HiLo is sensitive to illumination angle: slight changes sample different nuclear regions. Explain how the HiLo angle was controlled and confirmed comparable across cells and conditions.
Agreed.
We will add a Methods subsection describing our HiLo illumination procedure. In brief, we started at a TIRF-supercritical angle and reduced it toward epifluorescence just enough to achieve high imaging depth while minimizing out-of-focus background signal. Within each biological system (cell line or primary cells), the TIRF angle was held constant across Basal, Early, and Late conditions to ensure direct comparability of kinetic measurements across stages.
(4) Quantification of event counts and long-binding durations
The number of binding events and the duration of long-binding events are influenced by imaging conditions. Provide a more detailed analysis of how these variables were controlled and assess the sensitivity of the results to detection and tracking parameters.
Agreed.
We will (i) normalize per-cell binding-event counts to nuclear cross-sectional area (extracted from the segmented nuclear masks already in the STRAP pipeline) to control for differences in nuclear size; (ii) report the tracking-parameter sensitivity sweep described above; and (iii) confirm in the revised Methods that all imaging conditions (laser power, exposure, dye concentration, sample preparation) were held constant across stages and cell types, consistent with the existing manuscript text. Per the Reviewing Editor’s guidance, the planned labeling-efficiency and absolute-molecule-quantification experiments will further constrain the interpretation of binding-event counts across conditions.
(5) Evidence that spots are single molecules
Provide evidence that spots represent single molecules.
Agreed.
We will include a small number of per-event intensity traces from our STRAP tracking output, selected to illustrate the single-step photobleaching behavior characteristic of single-molecule emission (intensity remains approximately constant during the binding event and then drops to background in a single step). The nuclear-fluorescence measurements from the planned labeling-titration experiment will also allow us to confirm that bound-spot densities are consistent with single-molecule occupancy at the labeled fraction used for tracking.
(6) Description of the spot-analysis pipeline
The Methods should include a detailed STRAP pipeline description.
Partially agreed; the existing STRAP reference is appropriate, but the Methods will be expanded.
STRAP (Haque & Coleman, 2025) is a consolidated, automated implementation of two well-established, previously published frameworks: SLIMfast / multipletarget tracing (Sergé et al., 2008) and evalSPT (Normanno et al., 2015), both of which are cited in the original manuscript. We will expand the Methods to describe the parameter set used in our analysis (detection thresholds, linking radii, gap-frame allowance, photobleaching correction model) so that readers can assess the analysis without referring exclusively to the STRAP manuscript and code repository, while preserving the cited STRAP reference for the full algorithmic description. We respectfully suggest that a complete pipeline description duplicating Haque & Coleman (2025) would not be appropriate in a primary research article.
(7) Differences among cell systems
The three cell systems yield notably different results. Provide a more detailed explanation for these differences.
Agreed.
We will also explicitly describe the caveats of the engineered systems versus the native GATA2-SNAP primary-cell system, in which endogenous GATA2-SNAP remains under physiological regulation. Specifically, we will discuss how variables such as the GATA1null background, ectopic forced nuclear import of GATA1-ERT, and ectopic GATA2-Halo in G1E-ER4 cells, as well as ectopic GATA2-Halo, endogenous GATA1, and cytokine signaling in HPC7 cells, likely contribute to the observed differences in signatures.
Reviewer 2 (Public review):
(1) Expression levels of the GATA2-HaloTag transgene
Determine the expression levels of the GATA2-HaloTag transgene over the course of differentiation under the conditions used for single-molecule imaging.
Agreed.
This is the central concern flagged by the Reviewing Editor. For each cell line (G1E-ER4 and HPC7), we will (i) measure total nuclear GATA2-Halo fluorescence per cell under matched acquisition conditions and (ii) convert this fluorescence intensity to absolute molecules per cell using a Halo-CTCF/U2OS reference standard (Cattoglio et al., 2019; absolute CTCF abundance quantification applied previously by our group). This will provide per-cell GATA2Halo molecule counts at each differentiation stage (Basal, Early, Late). For the primary GATA2SNAP cells, we will perform the analogous comparison against a SNAP-RPB1/U2OS standard.
(2) Fraction of molecules labeled
Carry out a titration of the HaloTag ligand and compare the amount of labeled protein under single-molecule imaging conditions to that of saturating labeling.
Agreed.
We will perform HaloTag-ligand and SNAP-tag-ligand titrations in each cell type, comparing nuclear fluorescence under the limiting-label conditions used for single-molecule tracking with that under saturating labeling. This will yield a per-cell-type labeled fraction and allow us to confirm that comparisons of binding-event counts across conditions are not confounded by differences in labeling efficiency. The labeled-fraction values will be reported in a new supplementary figure and incorporated into our quantification of binding-event rates.
(3) Robust single-particle tracking
Show images of particle trajectories or movies superimposing trajectories on imaging data.
Agreed.
We will generate visualizations of selected long-lived binding events with single-particle trajectories overlaid on the imaging data — using a multi-frame color overlay (e.g., five sequential frames in distinct colors superimposed) so that linkage of the spot across frames is visually unambiguous — and include them as a new supplementary figure or movie. Examples will be drawn from each cell system to demonstrate consistent tracking quality.
Reviewer 3 (Public review):
(1) Photobleaching correction; per-cell bleach lifetimes
Report the per-stage (or per-cell) photobleaching lifetimes and the photobleachcorrected residence time values alongside apparent values, ideally with an H2B-Halo control.
Agreed.
Addressed by the photobleach-rate distribution and H2B-HaloTag control analyses described under R1 point 2. The supplementary figure will explicitly compare per-cell bleach lifetimes across stages, report photobleach-corrected residence-time values alongside apparent values and include H2B-HaloTag controls under matched conditions in each cell line.
(2) Mechanistic differences across systems
The three systems show qualitatively different signatures: residence time change in G1EER4, bound fraction expansion in HPC7 and primary cells. Reporting an on-rate proxy alongside k_off would help.
Agreed.
Addressed by the cross-system kinetic framing described under R1 point 7 and by the GRID state-spectrum analysis described under R1 point 1. We will explicitly frame the three systems in terms of underlying kinetic mechanism in both Results and Discussion, following the conceptual distinction emphasized by Ling et al. (Science 2026) in which residence time reports binding stability once engaged, whereas changes in bound fraction or event frequency can indicate altered association/recruitment efficiency. In this framework, the G1E-ER4 residencetime signature is consistent with reduced dissociation (a longer-lived bound state), while the longlived-fraction expansion in HPC7 and primary cells is consistent with an increased target-search efficiency or specific-binding-competent pool. Alongside the GRID-derived state-spectrum analysis, we will report an apparent engagement-rate proxy calculated as binding events per unit imaging time normalized to detectable molecule number; this proxy is an approximation, not a direct k_on measurement, as accurate determination of k_on from single-molecule tracking requires concentration-dependent on-rate experiments that are outside the scope of the present study. We thank the reviewer for this suggestion, which we agree sharpens rather than alters the central message.
(3) Per-cell GATA2 concentration and the uncoupling claim
Quantify total nuclear GATA2-Halo signal per cell across stages; for primary cells, a western blot or quantitative immunofluorescence on flow-sorted populations would make the uncoupling argument more defensible.
Agreed.
For the cell lines, the per-cell nuclear GATA2-Halo quantification described in our response to R2 point 1 addresses this point.
For primary cells, where the biological claim is strongest, we will exploit the endogenous Gata2SNAP knock-in itself as a quantitative reporter of total GATA2 protein. Specifically, we will label flow-sorted CD71/Ter119 populations from Gata2-SNAP mouse bone marrow with SNAP-Cell 647-SiR at saturating concentration in a parallel acquisition to the limiting-label single-molecule tracking experiment. Total nuclear SNAP-GATA2 fluorescence at saturating labeling provides a measure of endogenous GATA2 abundance per cell at each erythroid stage, in the same chemistry used for our single-molecule measurements, and will be benchmarked against a SNAPRPB1/U2OS reference standard for absolute molecule counting. This approach (i) measures the protein of interest in the labeling chemistry already established in this study; (ii) avoids reliance on quantitative immunofluorescence, which we have not been able to validate under our flowsorted-cell conditions; and (iii) extends the same analytical framework — saturating versus limiting labeling, with U2OS reference standards — across cell lines and primary cells. Quantitative western blotting on flow-sorted populations remains an alternative we will consider if specifically requested by the reviewers.
(4) Single-cell distribution analysis
Distribution-based statistics (K-S test, mixture model) rather than (or alongside) meanbased ANOVA, particularly for the Early populations, which look potentially bimodal.
Agreed.
We will perform Kolmogorov–Smirnov and Gaussian mixture model analyses of the single-cell long-lived fraction and residence-time distributions across stages, reporting these alongside the existing Welch ANOVA results in a new supplementary figure. This analysis is consistent with the conceptual framework cited in the manuscript (Wheat et al., 2020; Palii et al., 2019) for probabilistic hematopoietic transitions and may reveal subpopulation structure underlying the Early-stage signal. The GRID analysis further complements this by formally testing whether multi-state mixture models are statistically preferred at each stage. However, GRID analysis requires aggregating binding events across cells, which limits our ability to monitor changes in population dispersion at the single-cell level.
(5) Quantitative integration of CUT&Tag with SMT
Attempt a back-of-the-envelope calculation of whether the residence-time or fraction changes are quantitatively consistent with the acquisition of the 1,167 Early-restricted sites.
Partially agreed; will attempt an order-of-magnitude framing.
We thank the reviewer for this thoughtful suggestion. We agree that more explicit framing of the quantitative relationship between the two datasets will strengthen the integration. We will add a paragraph to the Discussion presenting an order-of-magnitude calculation linking the observed residence-time and long-lived-fraction changes to the steady-state occupancy increase predicted at competent regulatory sites, with explicit caveats regarding (i) the inherently semi-quantitative nature of CUT&Tag signal and (ii) the assumptions required to translate population-averaged occupancy into the genome-wide site count observed. For the G1EER4 cells, we observe relatively minor shifts in population-mean behavior as single-cell dispersion increases. Therefore, it may be difficult to directly link population-based measurements (e.g. CUT&Tag) with single-cell kinetic measurements (SPT). This distinction between occupancy and dynamics is consistent with recent systematic SMT analysis of the eukaryotic transcription machinery, in which factors appearing persistently associated in ensemble genomic assays were shown to exchange on second-scale timescales in living cells (Ling et al., Science 2026), emphasizing that population genomic occupancy and single-molecule residence time are complementary but not directly interchangeable measurements. Closing this gap rigorously is a major hurdle for the field and will require substantial technology development on quantitative single-cell CUT&Tag occupancy measurements. We will therefore frame our analysis as a consistency check rather than a strict quantitative integration. The reviewer notes that this analysis “does not change the central message; it sharpens it,” and we agree.
(6) Short-lived kinetic interpretation and tracking parameters
The 1.5 s gap allowance is long relative to the short-lived residence times in primary cells. A sensitivity analysis with tighter gap parameters would help. Also clarify how slowing of search reconciles with increased binding events at Early.
Agreed.
Addressed by the tracking-parameter sensitivity analysis described under R1 point 2. We apologize for the lack of clarity in our original description of the gap allowance. Our current maximum off-frame parameter is set to 2 frames, corresponding to a 0.5-s gap allowance. We will rerun the tracking analysis on representative datasets using a maximum off-frame parameter of 1, corresponding to no missed frames, and will report the resulting residence-time distributions alongside the original analysis to demonstrate robustness. We will also clarify in the Results and Discussion how changes in short-lived binding kinetics are reconciled with the increase in detectable binding events at the Early stage, drawing on the apparent engagement-rate proxy interpreted alongside the GRID-derived state-spectrum analysis.
(7) CUT&Tag peak definition and quantitative analysis
Report (a) signal intensity distribution at the 1,167 sites across stages (scatter or density plot beyond the heatmap) or (b) differential binding analysis (e.g., DESeq2). State replicate count and overlap of Early-restricted sets across replicates.
Agreed; normalized fold-change analysis completed, with replicate-aware differential binding analysis planned if additional replicates are generated.
We have performed a normalized count-based fold-change analysis of the union peak set from the existing GATA2 CUT&Tag dataset (14,468 peaks) using the goodpeaks framework previously used in our group, yielding per-peak log2 fold-change values and discrete dynamicstatus calls (Gained / Lost / Unchanged at |log2FC| ≥ 2) for each of the two transitions (Basal → Early at 0 vs 2 h, and Early → Late at 2 vs 24 h). This provides a conservative quantitative complement to the presence/absence peak-calling analysis presented in Figure 5; if additional replicate data are generated, we will perform replicate-aware differential binding analysis (DiffBind/DESeq2; Love et al., 2014; Stark & Brown, 2011) and report replicate overlap. This analysis addresses option (b) of the reviewer’s request and also enables the visualization requested in option (a) as a cross-stage scatter (Author response image 1). We present the quantitative analysis as a supplement to the presence/absence-defined Early-restricted set in Figure 5 of the manuscript, providing two orthogonal lines of evidence for the same biology. We note that the CUT&Tag experiments were initially performed as a validation step to confirm that the tagged GATA2-Halo constructs recapitulate endogenous chromatin-binding behavior, including appropriate genomic localization and expected GATA switch dynamics. This validation supports the conclusion that the observed single-molecule kinetics reflect physiologically relevant GATA2 engagement. Having established this, we subsequently extended the dataset to perform the quantitative analyses presented here.
Quantitative findings.
- 384 peaks were Gained (|log2FC| ≥ 2) at the Basal → Early transition.
- 1,006 peaks were Lost over the same transition.
- 178 peaks were Gained at Basal → Early and subsequently Lost at Early → Late, defining the strict differentially-restricted Early set (Author response image 1, red points). This set represents the higher-confidence subset of the manuscript’s broader presence/absence-defined Earlyrestricted set (n = 1,167; defined as MACS2 peaks at q < 0.01 present at Early but absent at Basal and Late).
- 200 peaks were Gained at Early and retained at Late, indicating stable acquisition.
- 49 peaks were acquired only at the Late stage.
The discrepancy between the broader presence/absence set (1,167) and the strict differential set (178) reflects the analytical choice the reviewer raised: presence/absence calls based on a peaksignificance threshold are sensitive to near-threshold peaks, whereas differential analysis with a fold-change cutoff captures only sites with quantitatively pronounced stage-restricted enrichment. We interpret these as two complementary definitions: the broader set captures all peaks meeting a stage-specific peak-calling criterion, and the strict subset isolates the most quantitatively dynamic core of that population.
Importantly, the three named example loci shown in Figure 5D of the manuscript — Nono (promoter-proximal), Nr3c1 (intron 2), and Gata3 (distal intergenic) — all survive the strict differential criterion (each shows |log<sup>2</sub>FC| ≥ 2 in both transitions, consistent with a clean Gainedthen-Lost signature). The published example panel therefore represents the high-confidence intersection of both definitions, supporting the robustness of the manuscript’s selected illustrative cases.
We will explicitly state the number of CUT&Tag replicates per stage in the revised Methods and figure legends. Where the differential analysis is currently based on a single replicate per stage, we will explicitly note this and treat the strict subset as a conservative confirmatory analysis. An additional replicate is under consideration for the full revision, and if performed, overlap of Earlyrestricted calls across replicates will be reported.
Motif cross-validation against a matched-GC background using HOMER and/or MEME-ChIP is planned for the strict differential subset and will be reported alongside the original SeqPos analysis in the revised Figure 5F or its supplement.
Author response image 1.
Cross-stage log<sub>2</sub> fold-change scatter for GATA2 CUT&Tag peaks. Each point represents a single peak in the union peak set (n = 14,468). The x-axis shows the log2 fold change from Basal (0 h) to Early (2 h); the y-axis shows the log2 fold change from Early (2 h) to Late (24 h). The sign convention follows the field-standard direction (positive log2FC = increased signal at the later time point). Peaks are colored by dynamic-status classification: unchanged/other (gray; n = 9,794); Lost at Early (blue; n = 109); Gained at Early and retained at Late (orange; n = 200); acquired only at Late (teal; n = 49); and Early-restricted, defined as Gained at Early and Lost at Late with |log2FC| ≥ 2 in both transitions (red; n = 178). The Early-restricted population occupies the lower-right quadrant, consistent with a transient kinetic peak of GATA2 binding.
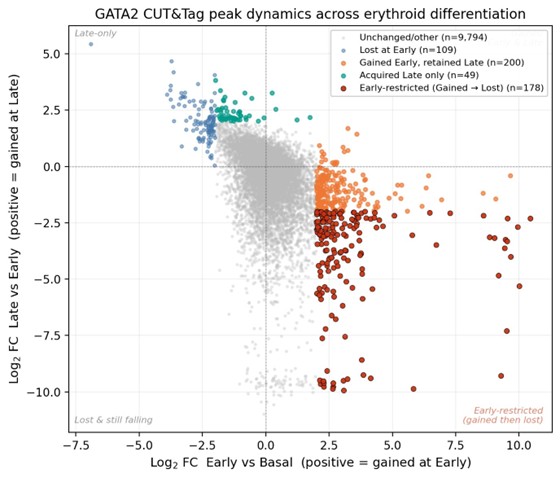
Author response image 2.
Density representation of GATA2 CUT&Tag peak dynamics with Early-restricted peaks highlighted.
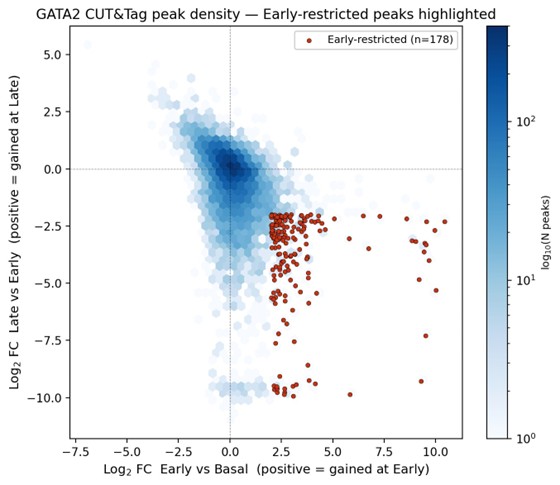
Author response image 2 is shown for illustrative reference and is not annotated with a separate legend; it presents the same data as Author response image 1 in a hexbin density format to emphasize the bulk of unchanged peaks at the origin and the spatial separation of the Early-restricted set.
Author response image 3.
Genomic-annotation comparison of newly acquired GATA2 binding at Early. Stacked-bar comparison of genomic annotations (ChIPseeker classification) for two definitions of the newly acquired GATA2 peaks at the Early erythroid stage: all peaks Gained at Basal → Early (orange; n = 384) and the strict Early-restricted subset (Gained then Lost; red; n = 178). Annotation categories shown: Promoter (≤1 kb of TSS), Intron, Distal Intergenic, and Other (Exon, 5′/3′ UTR, Downstream). Both peak sets contain substantial promoter-proximal and distal/intronic components, consistent with the two-subclass model described in Figure 5E–G of the manuscript (GATA2-only promoter-proximal peaks with GATA/RUNX motifs, and GATA2/GATA1 cobound distal peaks with composite GATA/E-box motifs). The strict subset shows a higher proportion of intronic and distal-intergenic sites and a lower proportion of promoter-proximal sites than the full Gained set; this difference will be discussed transparently in the revised Results. Motif analysis (HOMER/MEME-ChIP, planned for the full revision) will be performed on both peak sets to confirm that the GATA/RUNX and GATA/E-box subclass signatures are preserved.
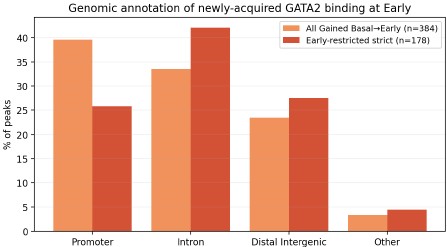
(8) Knock-in mouse hematopoietic validation
A brief characterization of basic hematopoietic parameters in homozygotes (CBC, LSK/HSPC frequencies, or colony assays) would confirm the tagged allele is physiological.
Agreed; data acquired and analyzed.
We have characterized mature trilineage hematopoietic populations in whole bone marrow from wild-type, heterozygous (Gata2Het), and homozygous (Gata2Homo) Gata2-SNAP knock-in mice (n = 5 per genotype). Bone marrow cells were stained for myeloid (CD11b<sup>+</sup> Gr1<sup>+</sup>), lymphoid (CD3<sup>+</sup>/CD4<sup>+</sup>/CD8<sup>+</sup>/B220<sup>+</sup>/CD19<sup>+</sup>), and erythroid (Ter119<sup>+</sup>) markers and analyzed by flow cytometry. Lineage frequencies are shown as percentages of live bone marrow cells in a new Figure Supplement in the revised manuscript.
For myeloid and erythroid populations, omnibus one-way ANOVA detected no significant differences across genotypes (Myeloid: F(2,12) = 2.616, P = 0.1140; Erythroid: F(2,12) = 0.4943, P = 0.6219). Dunnett’s multiple-comparisons test against the WT control did not detect significant pairwise differences for either knock-in genotype (Myeloid: WT vs Het P = 0.1351, WT vs Homo P = 0.9926; Erythroid: WT vs Het P = 0.7017, WT vs Homo P = 0.9602).
For the lymphoid compartment, although the omnibus ANOVA reached significance (F(2,12) = 6.690, P = 0.0112), no pairwise comparison against WT remained significant after multiplecomparisons correction (Dunnett’s adjusted P values: WT vs Het = 0.1217; WT vs Homo = 0.2078). We therefore interpret this result conservatively. Brown-Forsythe and Bartlett’s tests showed no significant differences in variance across genotypes (P = 0.1423 and P = 0.0908), so the result is not attributable to unequal variances. We do not interpret these data as indicating an unambiguous lymphoid phenotype in either heterozygous or homozygous Gata2-SNAP mice; this interpretation is consistent with the broader pattern across all three lineages, in which no pairwise comparison against WT survives multiple-comparisons correction. We will note in the figure legend and in the Results text that more granular HSPC-compartment analysis (LSK, MPP, lineage-restricted progenitor frequencies) and a complete blood count (CBC) remain valuable directions for future characterization of this resource and will be considered for the full revision if specifically requested.
Author response image 4.
Bone marrow trilineage frequencies in Gata2-SNAP knock-in mice. Bone marrow was harvested from the femurs and tibias of wild-type (WT), heterozygous (Gata2Het), and homozygous (Gata2Homo) Gata2-SNAP knock-in mice (n = 5 per genotype; mixed sex; 12–14 weeks). After ACK lysis, cells were stained for myeloid (CD11b<sup>+</sup> Gr1<sup>+</sup>), lymphoid (CD3<sup>+</sup>/CD4<sup>+</sup>/CD8<sup>+</sup>/B220<sup>+</sup>/CD19<sup>+</sup>), and erythroid (Ter119<sup>+</sup>) markers and analyzed by flow cytometry. Each dot represents one mouse, and horizontal bars indicate genotype means. Statistical results: Myeloid: ANOVA F(2,12) = 2.616, P = 0.1140; Dunnett’s adjusted P values WT vs Het = 0.1351, WT vs Homo = 0.9926. Lymphoid: ANOVA F(2,12) = 6.690, P = 0.0112 (omnibus); Dunnett’s adjusted P values WT vs Het = 0.1217, WT vs Homo = 0.2078. Erythroid: ANOVA F(2,12) = 0.4943, P = 0.6219; Dunnett’s adjusted P values WT vs Het = 0.7017, WT vs Homo = 0.9602. Brown-Forsythe and Bartlett’s tests for unequal variance were non-significant in all three lineages. Although the lymphoid omnibus ANOVA reached nominal significance, no pairwise comparison with WT remained significant after multiple-comparison correction; we therefore interpret this result conservatively (see response to R3 point 8).
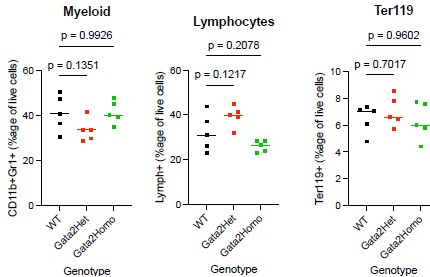
Summary
We thank the editors and the three reviewers for the constructive and detailed assessment. The planned revisions consist of:
- Four new experiments [planned] (HaloTag/SNAP labeling efficiency and absolute molecule counts via U2OS reference standards; H2B-HaloTag photobleaching reference; percell quantification of total endogenous GATA2 in flow-sorted primary Gata2-SNAP populations via saturating SNAP-tag labeling, benchmarked against a SNAP-RPB1/U2OS reference standard; single-molecule tracking of GATA2 N-terminal, C-terminal, and double zinc-finger deletion mutants in the engineered cell systems as a binding-deficient functional control).
- Six analyses of existing data (GRID multi-state fitting [planned]; per-cell bleach-rate distributions and photobleach-corrected residence times [planned]; tracking-parameter sensitivity [planned]; nuclear-area normalization and total-displacement controls [planned]; normalized fold-change CUT&Tag analysis [completed; motif cross-validation planned], presented in Author response images 1–3; distribution-based single-cell statistics [planned]).
- One previously-acquired dataset [completed] (trilineage hematopoietic flow cytometry of homozygous Gata2-SNAP knock-in mice; presented in Author response image 4 with full statistical detail).
- Substantial revisions to text and figures [planned] to address statistical reporting, methodological description, mechanistic framing of cross-system differences, and refinement of the Figure 6 schematic.
With respect to the requested binding-deficient single-molecule control, we will attempt to address this directly using sequence-validated lentiviral constructs in hand encoding GATA2 mutants lacking the C-terminal zinc finger, the N-terminal zinc finger, or both. These mutant analyses will be complemented by GRID multi-state analysis and H2B-HaloTag controls, providing converging lines of validation for the two-state kinetic framework. We note that an analogous mutant cannot be examined in the physiological context of the Gata2-SNAP knock-in mouse, and we will frame the cell-line mutant analyses accordingly.
We believe these revisions directly address the editors’ specific guidance regarding labeling efficiency and methodological clarification. We thank the editors and reviewers for their time and look forward to submitting the revised manuscript.
References cited in this response:
References listed below are cited in this provisional response in support of the planned analyses and methodology.
Cattoglio, C., Pustova, I., Walther, N., Ho, J. J., Hantsche-Grininger, M., Inouye, C. J., Hossain, M. J., Dailey, G. M., Ellenberg, J., Darzacq, X., Tjian, R., & Hansen, A. S. (2019). Determining cellular CTCF and cohesin abundances to constrain 3D genome models. eLife, 8, e40164. https://doi.org/10.7554/eLife.40164
Gebhardt, J. C. M., Suter, D. M., Roy, R., Zhao, Z. W., Chapman, A. R., Basu, S., Maniatis, T., & Xie, X. S. (2013). Single-molecule imaging of transcription factor binding to DNA in live mammalian cells. Nature Methods, 10(5), 421–426. https://doi.org/10.1038/nmeth.2411
Hansen, A. S., Pustova, I., Cattoglio, C., Tjian, R., & Darzacq, X. (2017). CTCF and cohesin regulate chromatin loop stability with distinct dynamics. eLife, 6, e25776. https://doi.org/10.7554/eLife.25776
Haque, N., & Coleman, R. A. (2025). Dynamic transcription pre-initiation complex assembly governs initiation efficiency. bioRxiv. https://doi.org/10.1101/2025.05.07.652662
Heinz, S., Benner, C., Spann, N., Bertolino, E., Lin, Y. C., Laslo, P., Cheng, J. X., Murre, C., Singh, H., & Glass, C. K. (2010). Simple combinations of lineage-determining transcription factors prime cis-regulatory elements required for macrophage and B cell identities. Molecular Cell, 38(4), 576–589. https://doi.org/10.1016/j.molcel.2010.05.004
Kaya-Okur, H. S., Wu, S. J., Codomo, C. A., Pledger, E. S., Bryson, T. D., Henikoff, J. G., Ahmad, K., & Henikoff, S. (2019). CUT&Tag for efficient epigenomic profiling of small samples and single cells. Nature Communications, 10(1), 1930. https://doi.org/10.1038/s41467-019-09982-5
Kenworthy, C. A., Haque, N., Liou, S.-H., Chandris, P., Wong, V., Dziuba, P., Lavis, L. D., Liu, W.-L., Singer, R. H., & Coleman, R. A. (2022). Bromodomains regulate dynamic targeting of the PBAF chromatin-remodeling complex to chromatin hubs. Biophysical Journal, 121(9), 1738–1752. https://doi.org/10.1016/j.bpj.2022.03.027
Ling, Y. H., Liang, C., Wang, S., & Wu, C. (2026). Live-cell single-molecule dynamics of eukaryotic RNA polymerase machineries. Science, 391, eads0960. https://doi.org/10.1126/science.ads0960
Liu, Z., Legant, W. R., Chen, B.-C., Li, L., Grimm, J. B., Lavis, L. D., Betzig, E., & Tjian, R. (2014). 3D imaging of Sox2 enhancer clusters in embryonic stem cells. eLife, 3, e04236. https://doi.org/10.7554/eLife.04236
Loeffler, D., Wang, W., Hopf, A., Hilsenbeck, O., Bourgine, P. E., Rudolf, F., Martin, I., & Schroeder, T. (2018). Mouse and human HSPC immobilization in liquid culture by CD43- or CD44-antibody coating. Blood, 131(13), 1425–1429. https://doi.org/10.1182/blood-2017-07-794131
Love, M. I., Huber, W., & Anders, S. (2014). Moderated estimation of fold change and dispersion for RNAseq data with DESeq2. Genome Biology, 15(12), 550. https://doi.org/10.1186/s13059-014-0550-8
Machanick, P., & Bailey, T. L. (2011). MEME-ChIP: motif analysis of large DNA datasets. Bioinformatics, 27(12), 1696–1697. https://doi.org/10.1093/bioinformatics/btr189
Normanno, D., Boudarène, L., Dugast-Darzacq, C., Chen, J., Richter, C., Proux, F., Bénichou, O., Voituriez, R., Darzacq, X., & Dahan, M. (2015). Probing the target search of DNA-binding proteins in mammalian cells using TetR as model searcher. Nature Communications, 6, 7357. https://doi.org/10.1038/ncomms8357
Palii, C. G., Cheng, Q., Gillespie, M. A., Shannon, P., Mazurczyk, M., Napolitani, G., Price, N. D., Ranish, J. A., Morrissey, E., Higgs, D. R., & Brand, M. (2019). Single-cell proteomics reveal that quantitative changes in co-expressed lineage-specific transcription factors determine cell fate. Cell Stem Cell, 24(5), 812–825.e5. https://doi.org/10.1016/j.stem.2019.02.016
Sergé, A., Bertaux, N., Rigneault, H., & Marguet, D. (2008). Dynamic multiple-target tracing to probe spatiotemporal cartography of cell membranes. Nature Methods, 5(8), 687–694. https://doi.org/10.1038/nmeth.1233
Stark, R., & Brown, G. D. (2011). DiffBind: Differential binding analysis of ChIP-Seq peak data. Bioconductor. http://bioconductor.org/packages/release/bioc/html/DiffBind.html
Taylor, S. J., Stauber, J., Bohorquez, O., Tatsumi, G., Kumari, R., Chakraborty, J., Bartholdy, B. A., Schwenger, E., Sundaravel, S., Farahat, A. A., Dutta, A., Koche, R. P., Steidl, U., & Wheat, J. C. (2024). Pharmacological restriction of genomic binding sites redirects PU.1 pioneer transcription factor activity. Nature Genetics, 56(10), 2213–2227. https://doi.org/10.1038/s41588-024-01911-7
Wheat, J. C., Salsman, J., Reekie, I., Mathhwala, A., Black, K. L., Tiedt, R., Shroff, H., & Steidl, U. (2020). Single-molecule imaging of transcription dynamics in somatic stem cells. Nature, 583(7816), 431– 436. https://doi.org/10.1038/s41586-020-2432-4
Reviewer #1 (Public review):
Summary:
Eroglu and Hobert demonstrate that injecting CRISPR guides and repair constructs to target three genes at a time, tagging each with a different fluorescent protein, and selecting which gene to tag with which fluorophore based on genes' expression levels, can improve efficiency of gene tagging.
Strengths:
This manuscript demonstrates that three genes can be targeted efficiently with three different fluorophores. It also presents some practical considerations, like using the fluorophore least complicated by agar/worm autofluorescence for genes with low expression levels, and cost calculations if the same methods were used on all genes.
Weaknesses:
Eroglu has demonstrated in a previous publication that single-stranded DNA injection can increase efficiency of CRISPR in C. elegans, while inserting two fluorescent proteins and a co-CRISPR marker into three loci, and Paix et al 2015 demonstrated simultaneous insertion of two fluorescent tags. The current work is valuable and incremental advance. In general, I applaud the authors' willingness to strategize about how whole proteome tagging might be accomplished. I predict that the advance here will be one of many small advances that will get the field to that goal. The title oversells the advance presented, in my view, since seems like one among many key advances, and the first sentence of the Discussion seems a more apt summary of the key advance here.
Some injections targeted genes on the same chromosome together, which will create unnecessary issues when doing crossing that will be useful for some future experiments. This made me wonder if injecting 3 together really is helpful vs targeting each gene separately, since only 5 worms need to be injected. It cuts time down by 2/3, but perhaps avoiding targeting the same chromosome with two tags would be useful.
The limited utility of current blue fluorescent proteins makes me wonder if it's worth using at this stage, before there are better blue fluorescent proteins, or better yet, far red, to avoid issues with live imaging under phototoxic UV or near-UV illumination.
Reviewer #2 (Public review):
Original Review:
The manuscript by Eroglu and Hobert presents a set of strains each harboring up to three fluorescently tagged endogenous proteins. While there is technically nothing wrong with the method and the images are beautiful, we struggled to appreciate the advance of this work - who is this paper for?
As a technical method, the advance is minimal since the first author had already demonstrated that three mutations (fluorophore insertion and co-CRISPR marker) could be introduced simultaneously.
As a pilot for creating genome-scale resources, it is not clear whether three different fluorophores in one animal, while elegantly designed and implemented, will be desired by the broader community.
Finally, the interpretation of the patterns observed in the created lines leaves much to be desired. A Table with all the observations must be included and can replace the tedious (and often wrong) descriptions of the observations with the different lines. It would be too much to point out every mistaken expectation of protein expression. Two examples include:
The expectation that ACDH-10 is enriched in the intestine and epidermal tissues (hypodermis) is naïve - there are multiple paralogs of this protein (look at WormPaths or WormFlux) that may share functions in different tissues. There is also no reason to assume that fatty acid metabolism does not occur in other tissues (including the germline). Finally, there are no published studies about this enzyme, so we really don't know for sure what it's doing.
The expectation that HXK-1 is ubiquitously expressed is similarly naïve. There are three paralogous enzymes that are all associated with the same reaction, and we have shown that these three function redundantly in vivo, perhaps in different tissues (PMID: 40011787). Moreover, single cell RNA-seq data (PMID: 38816550) also shows enrichment of hxk-1 in gonadal sheath cells.
The table should have at least the following information: gene/protein name - Wormbase ID - TPM levels of single cell data assigned to tissues for L2, L4 and adult (all published) - tissues in which expression is observed in the lines presented by the authors.
Other points:
(1) We would encourage the authors to provide systematic validation of the reported insertions. The manuscript reports that 24 of 30 tags were isolated and visible but does not clearly state whether each isolated line was confirmed by sequence‑level validation to be correctly in‑frame and free of unintended mutations at the target locus.
(2) The manuscript presents aggregated success counts (e.g., 8/10 mTagBFP2 tags, 9/10 mStayGold, 7/10 mScarlet3) and useful narrative descriptions of injection outcomes. We suggest also to include per‑locus success rates.
(3) For pools that required re‑injection after initial failures, we would like to see a description of the specific changes that were made to the injection mixes or procedures (e.g., new repair template prep, different Cas9 reagent lot, guide redesign). This will be useful troubleshooting information for others.
(4) The authors states that the fluorophore sequences are codon-optimized for C. elegans. We suggest they provide the exact donor/tag sequences used specifically state whether the fluorophore sequences contain any synthetic/artificial introns or other sequence modifications (e.g., silent PAM‑disrupting mutations) were included in the donor templates.
(5) Page 3: Include a reference for "The C. elegans genome encodes around 20,000 genes"
We hope these comments are useful.
Comments on Revised Version:
Overall, we found the responses to be quite recalcitrant.
We have one remaining composite concern about the comparison between observed expression patterns with the new strains versus published data.
First, the authors only report patterns for one stage while it should be not too much effort to image the different life stages. However, since this is a revision, we are not formally requesting they do this.
Second, in the now provided Table (thank you) 'observed expression' (last column) is lacking for 9 of the 30 proteins, and for 6 of these the procedure was not successful. Why not report patterns for the other three? It is confusing also because on page 5, the authors say that "overall, 24 of 30 tags ...all of which were visible with fluorescence stereomicroscopy" - are we missing something? Also, they then said that they "obtained 6/9 of the originally failed tags"; why are the corresponding patterns not included in table 1, and are 9 proteins still labeled as "no" in the "success?" Column?
Third, we strongly feel that the response to our comments about expression patterns is not adequate. On page 5 the authors say that "all proteins were expected to be ubiquitously expressed" and that "scRNA-seq indicated that transcript abundance was ubiquitous and without strong tissue-specific enrichment with few exceptions". However, in their rebuttal, the authors now argue for tissue-specific expression for proteins with paralogs, turning around their own argument! Moreover, their Table indicates that many genes show tissue-enriched expression by RNA-seq while many of their tagged proteins exhibit ubiquitous expression.
Overall, this indicates that both the overall accomplishment of generating tagged protein strains and analyzing their expression is oversold.
Reviewer #4 (Public review):
Summary:
Tagging the entire proteome of a metazoan would be a landmark achievement, providing a powerful complement and extension to existing "omic" catalogs in model systems. Here, Eroglu and Hobert argue that efficiently tagging multiple loci in a single "batch" would make the community-based achievement of this goal realistic. They provide rigorous evidence that such an approach is indeed feasible, exploring issues related to efficiency, design and screening strategies, disruption of gene function, and the potential for endogenously tagged alleles to reveal unexpected aspects of protein expression and localization. While the work has some minor gaps that are important to rigorously assess the feasibility of the proposed effort, the detailed and valuable insights that emerge should provide impetus to the community to coordinate efforts to make this ambitious goal a reality.
Strengths:
The work has numerous strengths. The authors provide compelling evidence that:
- three distinct loci can be efficiently targeted with three distinct fluorescent tags in a single injection.
- thoughtful targeting design can reduce the likelihood of disruption of function by the tag.
- systematic design principles based on expression level and predicted localization/function can be used to optimize tagging strategies.
- the resulting tags can provide unexpected insight into patterns of protein production and subcellular localization.
Not all of these advances are novel in themselves, but taken together, they represent an important technical and conceptual advance. The most important strength comes from the exceptionally high value of the goal itself, in that the work is that it has the potential to spur a community-wide effort toward achieving the ambitious goal of proteome-wide tagging.
Weaknesses:
The work's shortcomings are minor.
- One concern has to do with the feasibility of the proposed screening strategies. The experimental design cleverly coinjects tags for three loci in different gene expression 'zones'; this expression level determines which tag will be used. As the authors allude to, there is an important distinction between genes with the same overall FKPM value between those that are expressed broadly and those focally expressed in a specific tissue. The proposed strategy claims that there are a sufficient number of highly expressed genes "to be used as visible markers" for recovering successfully edited animals. It would be useful for the authors to discuss the issue of broad vs focused expression among this set of genes a bit more thoroughly, with an eye toward the issue of how likely it is that these genes could indeed consistently be used as visible markers, particularly for those at the low end of this limit.
- What fraction of the proteome (on a per-gene basis) is secreted proteins? How difficult will it be to screen these for successful tags? Are there specific tags that would be more optimal for secreted proteins? (The authors mention the use of an SL2 or T2A cassette to label the cells in which these proteins are expressed but note that there are technical challenges associated with doing this at scale.)
- For secreted and/or weakly expressed genes, it would be useful for the authors to estimate for what fraction of these would successful insertions need to be screened by PCR, and what resources (time and money) this would likely entail.
- For how many genes would a single tag not capture all predicted isoforms?
- Finally, some readers might object to the authors' assertion in the abstract that this work is "a first step in this direction" (presumably referring to designing a strategy for whole-proteome tagging). There is no concern that the authors are disregarding the extensive work of other groups, as they explicitly mention the contributions of other groups to the foundation that enables the present work. However, the spirit of the abstract could be misinterpreted by a well-intentioned reader.
Author response:
The following is the authors’ response to the original reviews.
eLife Assessment
The nematode C. elegans is an ideal model in which to achieve the ambitious goal of a genome-wide atlas of protein expression and localization. In this paper, the authors explore the utility of a new and efficient method for labeling proteins with fluorescent tags, evaluating its potential to be the basis for a larger, genome-wide effort that is likely to be very useful for the community. While the evidence for the method itself is solid, carrying out this project at a large scale will require significant additional feasibility studies.
We appreciate the editor’s recognition that the evidence for our method is solid and that a genome-wide protein atlas in C. elegans would be highly valuable to the community. However, we respectfully disagree that “significant additional feasibility studies” are required. Take the yeast proteome-wide GFP tagging project (Huh et al., Nature 2003). It achieved ~75% coverage of ~6,000 proteins directly from an established protocol without any prior significant feasibility studies, at least to our knowledge. While the C. elegans genome is 3 times in size, we would argue that our tagging protocol may even be less labor intensive as it does not involve any cloning and the screening is visual, requiring no molecular biology skills. Reviewer 3 notes: ‘They also provide convincing evidence that labelling the whole proteome is an achievable goal with relatively limited resources and time.’
Our pilot study validates all key parameters for genome-wide scaling: editing efficiency at novel loci with untested reagents, viability of tagged worms, and detectability of multiple spectrally separated fluorophores across expression ranges. These address the core technical, biological, and practical challenges of large-scale endogenous tagging in a multicellular organism, leaving no fundamental barriers in our view.
The proposed cost and timeline align quite favorably with established large-scale consortium projects: e.g., ENCODE pilot analyzed 1% of the human genome at ~$55 million over 4 years; Mouse Knockout Consortium scaled to ~20,000 genes over 20 years (ongoing) with ~$100 million; Human Protein Atlas mapped ~87% of proteins with antibodies in fixed cells (through much more labor intensive methods) over 20+ years at >$100 million. With ~8% of C. elegans genes already tagged (WormTagDB) and labs already tagging entire gene classes (PMID: 40463100), scaling our protocol to the proteome is feasible, potentially covering the genome in 5-6 years by a single lab or faster with distributed effort at a reagent cost of merely $2.2 million. The main barriers now are funding commitment and assembling collaborators, not further feasibility testing.
Public Reviews:
Reviewer #1 (Public review):
Summary:
Eroglu and Hobert demonstrate that injecting CRISPR guides and repair constructs to target three genes at a time, tagging each with a different fluorescent protein, and selecting which gene to tag with which fluorophore based on genes' expression levels, can improve the efficiency of gene tagging.
Strengths:
This manuscript demonstrates that three genes can be targeted efficiently with three different fluorophores. It also presents some practical considerations, like using the fluorophore least complicated by agar/worm autofluorescence for genes with low expression levels, and cost calculations if the same methods were used on all genes.
Weaknesses:
Eroglu has demonstrated in a previous publication that single-stranded DNA injection can increase the efficiency of CRISPR in C. elegans while inserting two fluorescent proteins and a co-CRISPR marker into three loci. The current work is, therefore, an incremental advance. In general, I applaud the authors' willingness to think ahead to how whole proteome tagging might be accomplished, but I predict that the advance here will be one of many small advances that will get the field to that goal.
Our manuscript indeed builds on prior multiplex editing (including our own co-CRISPR work), but the manuscript's primary contribution is not a novel technical breakthrough per se. Instead, our main goal was to pilot and strategize a feasible path to whole-proteome tagging in C. elegans and, most critically, test the following key parameters: (1) success rate of triple pools with prior untested reagents at novel targets; (2) utility of fluorophores across expression levels; (3) major effects on tagged protein function. In prior multiplexing, we used two targets which we already knew could be edited quite efficiently, with the 3rd target a point mutation with nearly 100% efficiency. Thus, it was not at all clear that picking 3 random genes and replacing the 3rd highly efficient locus with another less efficient large insertion would work or be sufficiently scalable for thousands of novel genes with unvalidated reagents at first pass.
The title vastly oversells the advance in my view, and the first sentence of the Discussion seems a more apt summary of the key advance here.
Some injections target genes on the same chromosome together, which will create unnecessary issues when doing necessary backcrossing, especially if the mutation rate is increased by CRISPR.
We disagree with the reviewer’s assessment of the need for backcrossing, for two reasons: (1) Prior studies have shown that off-target mutations are not a serious concern in C. elegans (reviewed in PMID: 26336798). For instance, WGS of strains after CRISPR/Cas9 found negligible off-target effects (PMID: 25249454, PMID: 30420468 – using similar RNP/ssDNA method and multiple guides; PMID: 23979577, PMID: 27650892 using other methods). Targeted sequencing studies have reported similar findings, using various CRISPR/Cas9 methods, with essentially no mutations at sites other than the intended target (PMID: 23995389; PMID: 23817069). (2) If the goal is to tag the entire genome, the introduction of backcrossing should not reasonably be a routine part of the initial tagging.
Lastly, if one really does want to backcross, the existence of tags on the same chromosome is actually an advantage because it permits selection for recombinants with wild-type chromosomes.
Also, the need for backcrossing and perhaps sequencing made me wonder if injecting 3 together really is helpful vs targeting each gene separately, since only 5 worms need to be injected.
Apart from our disagreement regarding backcrossing, we are puzzled by the reviewer’s comment. Why would one do single tagging at a time, rather than triple tagging if the whole point is to scale up tagging? It is important to keep in mind that the rate limiting step for tagging the whole genome is the number of injections that can be done per day. Since there is no cloning to generate the repair templates/guides and all other reagents are commercially available and not sample specific, these can be prepared quite rapidly. Being able to isolate multiple lines (together or independently) from the same injection increases throughput 3-fold and in our view does not provide any disadvantages as individual tags can be isolated independently if desired.
Beyond the numerous technical advantages pooling provides (also lower cost and throughput for making injection mixes as well as imaging), our results show that it yields epistemic benefits as well: we would never have noted the subcellular pattern in Fig. 6B, C with different sets of mitochondria being marked by different mitochondrial proteins had we imaged them separately or even aligned to a pan-mitochondrial landmark. As we mentioned in the discussion, grouping proteins predicted to localize to the same compartment together can simultaneously test how uniform or differentiated such compartments are during the screen.
The limited utility of current blue fluorescent proteins makes me wonder if it's worth using at all at this stage, before there are better blue (or far red) fluorescent proteins.
We do not think that the utility of current BFPs is that limiting. At least the theoretical brightness of mTagBFP2 is comparable to that of EGFP (PMID: 30886412), which was useful for the bulk of currently tagged proteins. Due to modestly higher autofluorescence in the blue spectrum, the practical brightness is somewhat less ideal, but we have shown that many proteins are expressed high enough to be detected quite well with mTagBFP2 by eye at low magnification. We also note that many tags that are not visible by eye under a dissection scope become visible with long exposure cameras of widefield microscopes or modern confocal (GaAsP) detectors, so the list of genes detectable with mTagBFP2 is likely to be much higher. We routinely use mTagBFP2 to super-resolve subnuclear structures with endogenous tags (e.g., in the nucleolus), with some tags having lower annotated FPKMs than the genes tested here.
Some literature reviews, particularly in the Introduction and Abstract, rely too much on recent examples from the authors' laboratory instead of presenting the state of the field. I'd like to have known what exactly has been done with simultaneous injection targeting multiple loci more thoroughly, comparing what has been accomplished to date by various laboratories' advances to date.
We are not sure what the reviewer is referring to. In the Abstract, we do not refer to any literature. In the Introduction, we cite 28 papers, 6 of those from our lab (4 of which providing examples of protein tags). We do not believe that this can be fairly called an unbalanced presentation of the state of the field.
This being said, we have gladly expanded our Introduction to provide more background on co-CRISPRing. Labs have routinely used co-conversion (“coCRISPR”) markers for picking out their intended edits (e.g., point mutations or insertions), as it has been shown by multiple groups that a CRISPR/Cas9 edit at one locus correlates with efficiency at other simultaneous targets (PMID: 25161212). Generally, making point mutations with the Cas9/RNP protocol is highly efficient, especially at specific loci such as dpy-10. However, multiple FP-sized insertions have not been routinely attempted. We and only one other group have successfully attempted it using previously working targets and reagents (e.g., 28% in PMID: 26187122). Importantly, the efficiency of such multiple insertions has never been assessed at scale and using entirely untested reagents at novel sites – critical parameters to determine for a whole genome approach. So, we test here (1) the efficiency of triple insertions and (2) the chance of getting them with new and untested guides and reagents.
In our view, since we have to use some injection/coCRISPR marker anyway for those genes which are not expressed at dissecting-scope visible levels (likely most genes), using highly expressed intended targets as improvised markers in a pooled approach makes our approach much more efficient. It allows us to find the worms with the highest chance of yielding CRISPR insertions, which we can screen with higher power methods for the dimmer targets, while enabling us to co-isolate other intended targets. Insertions, being often heterozygous in F1, can be segregated independently if desired, or homozygosed together to facilitate maintenance then outcrossed individually by those interested in studying specific genes in more detail.
In the revised version of this manuscript, we now discuss some of these points in the introduction section:
“Currently, around 1554 proteins representing 8% of the proteome are estimated to have been endogenously tagged (Leyhr et al., 2025). However, at current rates, tagging the proteome is projected to take around 100 years and likely involve numerous duplicate attempts on a small number of commonly studied proteins (Leyhr et al., 2025). It will thus be crucial for the field to coordinate tagging efforts and scale up tagging protocols to enable coverage of the entire genome at a reasonable timescale and cost. Given the number of injections is a major time-limiting factor, pooling multiple injections into one would at minimum cut tagging time by a factor of 3. In C. elegans, screening for novel CRISPR/Cas9-induced genomic edits is already facilitated either by use of co-injection markers (i.e., plasmids that form extrachromosomal arrays) that yield phenotypes or fluorescence in progeny of successfully injected worms, or co-editing well characterized loci using established and highly efficient reagents which likewise yield visible phenotypes. In the latter approach, termed “co-CRISPR”, worms edited at the marker locus are most likely to also carry the intended edit (Arribere et al., 2014). Recent methods for CRISPR/Cas9 mediated genomic insertions have pushed efficiencies to sufficient levels to simultaneously insert multiple fluorophores (e.g., mNeonGreen and mScarlet) as well as a co-CRISPR marker (dpy-10) at three independent loci in a single injection (Eroglu et al., 2023; Paix et al., 2015). These attempts pooled reagents previously established to work efficiently and targeted genes that were known to yield functional fusion proteins when tagged. Thus, while in principle current methods could allow tagging of at least 3 independent loci in one injection if a co-CRISPR marker is omitted, it is not known to what extent such an approach could be generalized across the genome with previously unvalidated reagents (i.e., guides and repair template homology arms) at novel loci to yield functional tags”
Reviewer #2 (Public review):
The manuscript by Eroglu and Hobert presents a set of strains each harboring up to three fluorescently tagged endogenous proteins. While there is technically nothing wrong with the method and the images are beautiful, we struggled to appreciate the advance of this work - who is this paper for?
We consider this paper to have two purposes: (1) motivate the community to come together to consider such genome-wide tagging approach; (2) provide a reference point for funding agencies that such an aim is not unreasonable and will provide novel interesting insights.
As a technical method, the advance is minimal since the first author had already demonstrated that three mutations (fluorophore insertion and co-CRISPR marker) could be introduced simultaneously.
We agree that the basic principle is similar. However, it was not clear that triple pooling three novel large edits would work, given the numbers in our original paper or that it would be scalable.
The dpy-10 coCRISPR marker previously used is a highly efficient single site, with close to 100% hit rate. We also knew in the earlier study that the two pooled insertions already worked quite efficiently and did not disrupt the function of targeted proteins. Exchanging these plus dpy-10 for three novel tags was not guaranteed to succeed for many potential reasons, including both biological and technical. For instance, such a “marker free” approach necessitates that a significant number of targets in the genome should be expressed highly enough to be visible by fluorescence stereomicroscopy when tagged with current best fluorophores. The chance of disrupting gene function by tagging was also not explored in detail in C. elegans, nor whether one untested guide is generally sufficient. We think that establishing these parameters was meaningful and necessary for the goal of whole genome tagging. We have clarified some of these points in the text.
As a pilot for creating genome-scale resources, it is not clear whether three different fluorophores in one animal, while elegantly designed and implemented, will be desired by the broader community.
The usage of three different fluorophores is largely driven by the ability to co-inject and therefore cut injection effort by a factor of three. Moreover, having all three fluorophores together facilitates imaging and maintenance. Lastly, co-labeling has the potential to reveal unexpected patterns of co-localization or lack thereof (example: two mitochondrial proteins that we found to not have overlapping distribution). We clarified this point in the revised text in both the results and discussion.
Finally, the interpretation of the patterns observed in the created lines is somewhat lacking. A Table with all the observations must be included. This can replace the descriptions of the observations with the different lines, which could be somewhat laborious for the reader, and are often wrong. There are numerous mistaken expectations of protein expression here, but two examples include:
We are not convinced that our expectations are mistaken. Below we respond to the reviewer’s specific examples, and we are open to hear from the reviewer about additional cases.
(1) The expectation that ACDH-10 is enriched in the intestine and epidermal tissues (hypodermis).
There are multiple paralogs of this protein (see WormPaths or WormFlux) that may share functions in different tissues. There is also no reason to assume that fatty acid metabolism does not occur in other tissues (including the germline). Finally, there are no published studies about this enzyme, so we really don't know for sure what it's doing.
The expression of acdh-10 is annotated in multiple scRNA datasets as intestine and epidermal enriched (CeNGEN/Taylor et al. 2021, highest in epidermis; Ghaddar et al 2023 highest in intestine). We did not mean to imply that fatty acid metabolism does not occur in the gonad, nor that a paralog of acdh-10 could not be performing the same function in tissues where acdh-10 is not expressed.
However, this raises an important question: why have different paralogs doing the same thing? Duplicate genes with the same function are generally not evolutionarily stable (PMID: 11073452, PMID: 24659815). That there are such striking tissue specific expression patterns of an essential or widely expressed protein class suggests that paralogs of the gene likely differ in some meaningful parameter that might align with tissue-specific functional needs or regulation. The reviewer’s statement that ‘there are no published studies about this enzyme, so we really don't know for sure what it's doing’ is in fact an excellent demonstration of our point; finding out where the duplicates are expressed can provide a starting point to uncover potential differences between the paralogs. At the very least it can delineate to what degree paralogs diverge in their expression across the proteome and identify which such cases merit further study. In a more ideal scenario, prior information of protein function could indicate that the involved pathway requires tissue specific regulation.
(2) The expectation that HXK-1 is ubiquitously expressed.
Three paralogous enzymes are all associated with the same reaction, and we have shown that these three function redundantly in vivo, perhaps in different tissues (PMID: 40011787).
The cited paper (PMID: 40011787) does not show where they are expressed. We discussed redundancy/paralogs above in point 1, and in our view the same applies here. They may perform the same reaction but are likely to differ in some meaningful way, be it regulation or rate of activity, for them to be stably maintained as functional genes over evolution.
Moreover, single-cell RNA-seq data (PMID: 38816550) also show enrichment of hxk-1 in gonadal sheath cells.
The Ghaddar et al. and CeNGEN/Taylor et al. datasets do not show this. The scRNA paper cited (PMID: 38816550) also shows enrichment in neurons, pharynx, coelomocyte and germ cells which we did not note. In our view, these in fact further support our goals: often, transcript datasets alone (frequently used to infer tissue function) do not sufficiently predict protein expression. One can post hoc find an scRNA-seq dataset that aligns somewhat with our protein observations, but how does one know which to trust a priori? Disagreements between transcript datasets will ultimately require resolution at the protein level, in our view.
To clarify these points, we added the following to the discussion section:
“We also noted unexpected cell type dependent distributions of proteins involved in broadly important metabolic processes such as ACDH-10, which was depleted from the germline compared to other tissues, and HXK-1, which was highly enriched in the gonadal sheath. Notably, for these as well as other cases, scRNA-seq datasets were not sufficient to deduce a priori the observed cell type specific differences at the protein level. Importantly, many genes encoding metabolic enzymes including acdh-10 and hxk-1 have paralogs that likely perform similar catalytic functions. Yet, duplicate genes with identical functions are generally not evolutionarily stable (Adler et al., 2014; Lynch and Conery, 2000); thus such genes are likely to differ in some meaningful parameter (e.g., regulation or activity) that might align with tissue-specific functional needs. Fully annotating the expression patterns of paralogs at the protein level could indicate which tissues require unique metabolic needs and indicate which paralogous genes have undergone sub- versus neo-functionalization. For those proteins that are less functionally understood, unexpected distributions might indicate which merit further study.”
The table should have at least the following information: gene/protein name - Wormbase ID - TPM levels of single cell data assigned to tissues for L2, L4, and adult (all published) - tissues in which expression is observed in the lines presented by the authors.
We added some of this information such as annotated expression levels in young adults from various scRNA datasets (but not larval datasets as we did not image these). We note that each of these studies use different pipelines and report different metrics (scaled TPM/Z-score versus Seurat average expression versus TPM), so comparisons between them are not informative unless they are integrated and analyzed together.
Reviewer #3 (Public review):
Summary:
The authors argue that establishing the expression pattern and subcellular localisation of an animal's proteome will highlight many hypotheses for further study. To make this point and show feasibility, they developed a pipeline to knock in DNA encoding fluorescent tags into C. elegans genes.
Strengths:
The authors effectively make the points above. For example, they provide evidence of two populations of mitochondria in the C. elegans germline that differ qualitatively in the proteins they express. They also provide convincing evidence that labelling the whole proteome is an achievable goal with relatively limited resources and time.
We appreciate the referee’s recognition that whole proteome tagging is feasible.
Weaknesses:
Cell biology in C. elegans is challenging because of the small size of many of its cells, notably neurons. This can make establishing the sub-cellular localisation of a fluorescently tagged protein, or co-localizing it with another protein, tricky. The authors point out in their introduction that advances in light microscopy, such as diSPIM, STED, and ISM (a close relative of SIM), have increased the resolution of light microscopy. They also point out that recent advances in expansion microscopy can similarly help overcome the resolution limit.
(1) Have the authors investigated if the three fluorescent tags they use are appropriate for super-resolution microscopy of C. elegans, e.g., STED or SIM? Would Elektra be better than mTAGBFP2? How does mScarlet3-S2 compare to mScarlet 3?
All three tags work for ISM (i.e., Airyscan). We previously tried Electra (not for the genes tested here) but could not isolate positive tags. Given Electra is not that much brighter on paper than mTagBFP2 we did not pursue it further, though we recognize that these may simply have been unlucky injections. mScarlet3-S2 is quite a bit dimmer than mScarlet3 on paper – the advantage is that it has higher photostability. In our view, the limiting factor will be having FPs that are bright enough to screen, image and scale to the whole genome, so brightness will likely provide an advantage over photostability at this stage.
(2) Have the authors investigated what tags could be used in expansion microscopy - that is, which retain antigenicity or even fluorescence after the protocol is applied? It may be useful to add different epitope tags to the knock-in cassettes for this purpose.
mSG and mSc3 retain fluorescence after fixing with formaldehyde. We have not tested mTagBFP2 fluorescence in fixed worms. We agree that adding different epitope tags would be useful.
The paper is fine as it stands. The experiments above could add value to it and future-proof it, but are not essential. If the experiments are not attempted, the authors could refer to the points above in the discussion.
Recommendations for the authors:
Reviewer #1 (Recommendations for the authors):
(1) Merged figures appear saturated, and use colors that won't work for red-green colorblind viewers.
For all figures, we also show individual channels separately, which is common practice for making fluorescence images accessible to colorblind readers (PMID: 33788834). Figures highlighting non-overlap like 6B and C are already in accessible colors when merged (blue/green) and include a numerical quantification. 3-color RGB images preserve the greatest information for the highest number of individuals.
(2) Targeting ubiquitously expressed genes as a proof of concept gives me some concern that this might underestimate the challenges that may be experienced with less widely expressed genes.
While the genes were predicted to be ubiquitously expressed, many were not in practice, like HXK-1 and F54C8.1, which were also among the lower expressed genes on our list and highly cell type restricted. As discussed, the more tissue restricted a gene, the likelier that bulk RNA levels underestimate expression. Such genes are therefore more likely to be detected in a specific tissue. We routinely isolate tissue restricted endogenous tags, including those expressed in only a few neurons, with bulk FPKMs lower than the ranges tested in this manuscript.
(3) Some results are not shown or referenced (autofluorescence, for example, is shown using a schematic in Figure 1C).
We now provide representative images alongside what would be expected to be observed by eye during screening.
(4) It would be useful to describe how to recover worms from what is shown in Figure 1A.
In the revised version, we added the following in the caption for Fig. 1A:
“Selected worms expressing the brighter tag can be screened for dimmer tags by higher magnification and long exposure imaging. Worms can be recovered directly from slides if immobilized by levamisole as described (Ghanta et al., 2021). Alternatively, single hermaphrodite worms can be isolated, allowed to lay eggs, then screened.”
(5) A blue bar of data must be missing from Figure 3B injection pool 5.
As stated in the text, “All but one tag (cox-6B::mTagBFP2) was visible in the F1 generation of injected P0 animals, and these were subsequently isolated among F2 worms positive for the other tags in the pool.”
To clarify that data points are not unintentionally omitted, we added the following text to the caption of Fig. 3B:
“For group 5 including cox-6B::mTagBFP2, worms with detectable levels of mTagBFP2 fluorescence were not recovered in the F1 generation but were isolated among progeny of F1s positive for mStayGold and mScarlet3; we were thus unable to quantify efficiency for this locus at F1.”
(6) Some expression or localization patterns were unexpected, but complications like germline silencing and protein mislocalization, with a small fraction localizing normally and rescuing function, were not presented as possibilities. Viability is used to confirm function, but without presenting whether this means 100% viability, less, or just the ability to maintain a strain.
We already do discuss mislocalization and functionality issues in the Discussion, as well as tradeoffs of alternate methods. Any existing method to observe biological molecules, be it protein, RNA or DNA, has multiple drawbacks and sources of artifacts, which are unlikely to be fully eliminated in the foreseeable future.
In regard to germline silencing of endogenously tagged genes in C. elegans, there is actually very little evidence for this. Collectively, various labs have now generated over 200 reporter alleles of germline-expressed genes (WormTagDB), with robust expression throughout the germline and retention of function. Likewise, numerous of our tags across fluorophores showed robust germline expressions including EEF-1A.1::mTagBFP2, Y22D7AL.10::mStayGold, and HAT-1::mScarlet3. In fact, overall transcript levels generally tended to underestimate germline enrichment at the protein level. We note that single-copy transgenes driven by eef-1A.1/eft-3 promoter by itself are frequently not expressed in the germline (PMID: 31064766); that we could detect EEF-1A.1 robustly in the germline when tagged endogenously is evidence that silencing is unlikely to be a widespread concern, and at the least less of a concern than single copy transgenes. We appreciate that for a transgene, presence/absence of specific sequence elements and genomic loci play a role in expression, but an endogenous tag captures all such information at a given locus.
Indeed, we found only two reports of endogenous tags being silenced in the germline, the first being a novel tag (not fluorophore) which initially prevented expression at the tagged locus (PMID: 30109984), but after making changes to the sequence to avoid silencing signals the authors could rescue expression and thereafter saw robust expression in various novel contexts with this tag. The second example (PMID: 34547227) leaves open the possibility that germline repression of that particular gene might be a part of its endogenous regulation.
Nevertheless, given it is probably rare if occurs at all, it will likely take a large scale tagging effort to uncover such cases at sufficient numbers to study. In our view, this further justifies tagging at large, ideally genomic, scales. If we do discover that there are numerous annotated germline proteins which we don’t observe by tagging, that would be interesting to study on its own.
(7) Halotag is presented in the Discussion as a small tag, but it is bigger than GFP.
Thank you for catching this. We have removed the discussion of Halotag. Given the comparable size to FPs, it would be unlikely to alleviate issues of tag functionality.
(8) It would be useful to include FPKMs and viability percentages in Table 1.
FPKM is included in column 6, but the title for this column is cut off. In the revised table FPKM values are now shown more clearly across stages.
We did not quantify viability percentage. In our view it does not yield an informative metric when there is little information about the protein’s required dosage for function, which was the case for most proteins here. A haplosufficient gene might yield a full brood size even if 50% of protein function is lost; conversely, a highly dose sensitive protein could yield penetrant and severe inviability with mild perturbation of function. It also is not actionable information at this stage if there is no alternate tagging strategy as a baseline of comparison. The worms we picked to image all have viable embryos as adults, so in those individuals the genes were likely to be sufficiently expressed and functional.
(9) Because establishing that a guide works well is a limiting step for many CRISPR experiments (once a guide works well, it's easy to inject 5 worms and get lines), I wondered if testing that for many genes is what is really needed in the field at this stage.
Guide quality is rarely an issue in C. elegans, as for all the genes here we tried only one guide, all of which were previously untested. We now clarified this in the discussion section:
“Notably, we find that previously untested guide RNAs and homology arms perform exceptionally well at novel loci, as we only tested one set of reagents for each locus which yielded satisfactory tagging rates.”
(10) For a manuscript where the injection is so central to what was done, I was surprised to read in the Acknowledgments that all of the injections were done by someone who is not included as an author.
We are likewise surprised by such a comment but gladly clarify: Chi Chen has been with us as an expert microinjection specialist for more than 25 years and her very important technical contributions have been acknowledged in many dozen papers. Multiple authorship guidelines, including COPE’s and ICMJE’s, state that technical contributions alone do not qualify for authorship.
Reviewer #2 (Recommendations for the authors):
(1) We would encourage the authors to provide systematic validation of the reported insertions. The manuscript reports that 24 of 30 tags were isolated and visible, but does not clearly state whether each isolated line was confirmed by sequence‑level validation to be correctly in‑frame and free of unintended mutations at the target locus.
We appreciate the reviewer’s concerns on fidelity. These parameters have been assessed in prior published work (e.g., PMID: 30504364, PMID: 34748534) and in our hands are in the range of 80% whenever we sequence non-fluorescent tags of similar sizes. The efficiencies we observed are high enough that one can expect to recover numerous worms with the exact intended sequence for each target, though we would argue mutations within the FP reporter are less likely to matter if it retains high fluorescence.
(2) The manuscript presents aggregated success counts (e.g., 8/10 mTagBFP2 tags, 9/10 mStayGold, 7/10 mScarlet3) and useful narrative descriptions of injection outcomes. We also suggest including per‑locus success rates.
Figure 3B shows per locus success rate and source data is provided for this figure. Each dot is an individual injection and the Y axis is per locus rate. We now worded this more clearly in the figure’s caption.
“Total insertion efficiencies per locus for the indicated targets across injection pools.”
(3) For pools that required re‑injection after initial failures, we would like to see a description of the specific changes that were made to the injection mixes or procedures (e.g., new repair template prep, different Cas9 reagent lot, guide redesign). This will be useful troubleshooting information for others.
We re-made the exact same injection mix but with nanodrop to ensure the purity of the repair templates as assessed by absorbance ratios (A260/230 and A260/280) were sufficient after each purification step. No other changes were made. This is now specified in the methods section in the following way:
“For re-runs of pools 4, 6 and 10 which failed initially, we regenerated the repair templates and ensured that after each column purification, the A260/230 ratio of the purified DNA was ≥2.2 and A260/280 was 1.8 ± 0.05 when measured with a Nanodrop spectrophotometer.”
(4) The authors state that the fluorophore sequences are codon-optimized for C. elegans. We suggest they provide the exact donor/tag sequences, specifically state whether the fluorophore sequences contain any synthetic/artificial introns, or whether other sequence modifications (e.g., silent PAM‑disrupting mutations) were included in the donor templates.
This information is provided in Supplementary Table 1.
(5) Page 3: Include a reference for "The C. elegans genome encodes around 20,000 genes"
We added a reference to the most recent release of the genome (WS237, May 2013). Spieth et al., 2014.
/apps/DefaultApp/DataStatusEvent
диаграмма:
Речь идет об отправке данных с одного клиента многим клиентам https://flashphoner.com/docs/api/WCS5/rest_api/latest/v3/#tag/Data/operation/sendData
reply to u/deleted at https://old.reddit.com/r/typewriters/comments/1te4u1i/state_of_the_typosphere/
Two or three typewriter repair shops have opened up in the past couple of years, though probably not enough to offset the retirements or deaths which include Tom Furrier (Cambridge Typewriter) and Duane Jensen (Phoenix Typewriter) respectively. Lucas Dul opened up a brick-and-mortar typewriter shop in Chicago.
Philly Typewriter and Bremerton Typewriter Company have started up typewriter repair schools/apprenticeships to expand on the trade.
Tom Hanks has continued donating typewriters to typewriter repair shops over the past few years, ostensibly to encourage the space as well as to slim down his own collection.
Richard Polt recently downsized his collection significantly. (His blog is generally a good source of the news of what's new in the past few years.)
Prices are up somewhat in general, but especially for Hermes 3000s, Olympias, Smith-Corona Silent Supers, and Olivetti Letteras even in poor condition.
Historical updates: https://typewriterdatabase.com/twdb.0.news-media
Type Pals has started up monthly meetups again: https://www.typepals.com/events
Lou Spirito designed a baseball scorecard for typewriters which was unveiled by Tom Hanks on March 29, 2025.
Qwertyfest seems to be going strong: https://www.qwertyfest.com/
Atlanta, Albuquerque, and Los Angeles have bee hosting type-ins a few times a year.
I've fleshed out some details and examples on typecasting for those interested in trying it out: https://indieweb.org/typecast
best match.
Circulation v. Reserve
Although UVA owns a lot of material, we don't have copies of every resource UVA library users might request. Our library has an Interlibrary Loan services department to help fill the gap by borrowing materials from libraries elsewhere when library users request items UVA library does not own.Interlibrary Loan (ILL) items are distinguished by an orange flap with the words "UVA Library Interlibrary Loan" that is secured to the cover of the item, and a purple slip with the borrower's name that will be sticking out of the item itself. The ILL barcode for ILL items is on the purple slip. It starts with the letters TN.ILL items are tracked and circulated in ILLiad WebCirc, they will not appear in our UVA catalog or in Workflows!ILLiad WebCirc is an online system used to track and circulate Interlibrary Loan materials.
Reserve Equipment
Reserve equipment are all the pieces in the vault with a BLUE tag. These items rarely have a UVA barcode, and tend to be higher-end.
The library information system we use to circulate reserve equipment is LibCal
UVA owns an abundance of books, manuscripts, DVDs, musical scores, and much more.All of these items will have a UVA barcode that is found on the item's cover. That's it! That's the neat trick for identifying UVA items. UVA items have a UVA barcode.And, (is this obvious?) all UVA materials are listed in our online library catalog, Virgo, and in the library information system we use for circulation, Workflows.
Circulation Equipment Circulation equipment are all the pieces in the vault with a GREEN tag. All of these items have a UVA barcode that is found in the equipment's case or on the largest piece of the equipment. That's it! That's the neat trick for identifying Circulation equipment.
Circulation equipment is labeled in GREEN and has a UVA BARCODE.
The library information system we use for circulation equipment is Workflows
Author response:
The following is the authors’ response to the original reviews.
We would like to express our deep appreciation to the editor and reviewers for their constructive comments and suggestions, which have significantly improved the quality of our manuscript. In response, we have carefully revised the manuscript, addressed all comments, and performed additional experiments and analyses to strengthen our findings.
(1) We repeated retrograde tracing using CTB-647 to verify precise targeting of SPN and DGC neurons, as shown in the new Figure 7.
(2) We performed dual retrograde tracing combined with fiber photometry or optogenetic activation to investigate the role of PMC dual-projecting neurons in the control of urination, as shown in Figure supplements 11 and 12.
(3) We conducted new experiments activating PMC<sup>ESR1+</sup> neurons after PDNx to assess their role in urination, as shown in new Figure 6.
(4) We added a more detailed analysis of the dynamics of neural responses in PMC<sup>ESR1+</sup> neurons in Figure supplements 3F-3G.
(5) We analyzed peak Ca<sup>2+</sup> signals in the PMC during and after the onset of EMG bursting, as shown in Figure supplement 4F.
(6) We added a comparison of spontaneous and light-induced spikes in PMC<sup>ESR1+</sup> neurons, as shown in Figure supplements 3B–3C.
(7) We expanded the Discussion to address how PMC<sup>ESR1+</sup> neurons coordinate bladder contraction and sphincter relaxation to control both the initiation and suspension of urination.
We hope these revisions meet the reviewers' expectations and contribute to the improvement of our manuscript.
Reviewer #1 (Public review):
Summary:
Urination requires precise coordination between the bladder and external urethral sphincter (EUS), while the neural substrates controlling this coordination remain poorly understood. In this study, Li et al. identify estrogen receptor 1-expressing neurons (ESR1+) in Barrington's nucleus as key regulators that faithfully initiate or suspend urination. Results from peripheral nerve lesions suggest that BarEsr1 neurons play independent roles in controlling bladder contraction and relaxation of the EUS. Finally, the authors performed region-specific retrograde tracing, claiming that distinct populations of BarEsr1 neurons target specific spinal nuclei involved in regulating the bladder and EUS, respectively.
Strengths:
Overall, the work is of high quality. The authors integrate several cutting-edge technologies and sophisticated, thorough analyses, including opto-tagged single unit recordings, combined optogenetics, and urodynamics, particularly those following distinct peripheral nerve lesions.
We are grateful for your insightful and constructive comments, which affirmed the importance and technical depth of our work. Thank you for dedicating your expertise and time to reviewing our manuscript. Guided by your suggestions, we have revised the paper as detailed below.
Weaknesses:
(1) My major concern is the novelty of this study. Keller et al. 2018 have shown that BarEsr1 neurons are active during urination and play an essential role in relaxing the external urethral sphincter (EUS). Minimally, substantial content that merely confirms previous findings (e.g. Figures 1A-E; Figures 3A-E) should be move to the supplementary datasets.
Thank you for this valuable and constructive comment. We fully agree that the novelty of our study relative to Keller et al., 2018 must be made explicit. Keller et al. established that PMC<sup>ESR1+</sup> neurons are active during socially evoked urine-marking behavior (voluntary urination) and demonstrated their essential role in relaxing the EUS. Their study mainly focused on behavioral context and EUS relaxation. In contrast, our work addresses a distinct, mechanistic question: how these same neurons participate in reflexive, physiological urination and coordinate both bladder detrusor contraction and EUS relaxation.
Novel aspects of the present study:
(1) Temporal dynamics of PMC<sup>ESR1+</sup> neurons during reflexive micturition.
Using opto-tagging and single-unit recordings, we reveal the precise firing pattern of PMC<sup>ESR1+</sup> neurons during reflexive voiding. Simultaneous fiber photometry, cystometry, and EUS-EMG recordings demonstrate that population-level activity of PMC<sup>ESR1+</sup> neurons precedes and tightly correlates with both bladder contraction and EUS relaxation a coordination not previously demonstrated.
(2) Causal role in reflexive urination.
Manual closed-loop optogenetic inhibition at the onset of reflexive voiding acutely terminates EUS bursting and bladder contraction, immediately halting urine release.
(3) Dual control of bladder and EUS.
Optogenetic activation combined with selective pelvic or pudendal nerve transection shows that PMC<sup>ESR1+</sup> neurons drive both bladder contraction and EUS relaxation, revealing a coordinating role beyond EUS relaxation alone.
(4) Anatomical substrate for coordinated control of bladder contraction and EUS relaxation in reflexive urination.
Retrograde tracing identifies three spinal-projecting sub-populations: SPN-only, DGC-only, and dual-targeting neurons, providing a circuit-level explanation for the simultaneous control of bladder and EUS.
Following your suggestion, panels that merely replicate Keller et al. (former Figures 1A–1E and Figures 3A–3E) have been moved to new Figure Supplements 1 and 7, respectively, so that the main figures now emphasize the new mechanistic findings.
(2) I also have concerns regarding the results showing that the inactivation of BarEsr1 neurons led to the cessation of EUS muscle firing (Figures 2G and S5C). As shown in the cartoon illustration of Figure 8, spinal projections of BarEsr1 neurons contact interneurons (presumably inhibitory) that innervate motor neurons, which in turn excite the EUS. I would therefore expect that the inactivation of BarEsr1 should shift the EUS firing pattern from phasic (as relaxation) to tonic (removal of relaxation), rather than stopping their firing entirely. Could the authors comment on this and provide potential reasons or mechanisms for this finding?
Thank you for this crucial comment. We apologize that the representative EUS-EMG traces in Figures 2G and S5C were too small to be clearly seen and that the corresponding results description was not sufficiently accurate. We have now replaced these EMG traces with enlarged versions (revised Figures 2G and S5C) and revised the corresponding Results section (lines 184, 197, 340-341). Based on the enlarged traces, we found that acute photoinhibition of PMC<sup>ESR1+</sup> neurons at the onset of phasic EUS-EMG bursting shifted the EUS firing pattern from large-amplitude phasic bursts to low-amplitude tonic firing. This suggests that ongoing activity of PMC<sup>ESR1+</sup> neurons is required to maintain phasic EUS bursting. A similar shift from phasic to tonic EUS-EMG activity during optogenetic silencing of PMC<sup>ESR1+</sup> neurons was reported by Keller et al., 2018 (Figure supplement 8C), confirming the reproducibility of the phenotype. We propose that the potential mechanism of this low-amplitude tonic activity may be mediated in part by a spinal reflex pathway (the guarding reflex) for preventing urination, whereby the loss of PMC<sup>ESR1+</sup> neurons-mediated supraspinal facilitation reduces inhibition of spinal interneurons, leading to enhanced baseline excitability of EUS motor neurons in response to bladder afferent input during bladder distension (William C. de Groat et al., Comprehensive Physiology. 2015, PMID: 25589273).
(3) Current evidence is insufficient to support the claim that the majority of BarEsr1 neurons innervate the SPN but not DGC. The current spinal images are uninformative, as the fluorescence reflects the distribution of Esr1- or Crh-expressing neurons in the spinal cord, along with descending BarEsr1 or BarCrh axons. Given the close anatomical proximity of these two nuclei, a more thorough histological analysis is required to demonstrate that the spinal injections were accurately confined to either the SPN or the DGC.
Thank you for raising this important concern. To rigorously verify that our spinal injections were confined to either the SPN or the DGC, we performed new retrograde-tracing experiments in ESR1-Cre and CRH-Cre mice. We injected a mixture of AAV-Retro-DIO-mCherry or AAV-Retro-DIO-EGFP with the retrograde tracer CTB-647 specifically into the SPN or DGC (Methods, lines 465-466). Only animals in which CTB-647 fluorescence was strictly limited to the target nucleus, without detectable spread to the adjacent region, were included in the analysis (new Figures 7A and 7E). These results confirm our original observation that PMC<sup>ESR1+</sup> neurons comprise three distinct spinal-projection subpopulations: one (19.0%) targeting the SPN, one (52.2%) innervating the DGC, and a third (28.8%) projecting to both regions (Results, lines 304–306; new Figures 7F–7H). In addition, the majority of PMC<sup>CRH+</sup> neurons project to the SPN but not the DGC (new Figures 7B–7D; Results, lines 297–301). We have assembled new Figure 7 using the newly acquired spinal images and the validated data.
Reviewer #1 (Recommendations for the authors):
From the abstract: "Anatomically, PMCESR1+ cells possess two subpopulations projecting to either the pelvic or pudendal nerve". I don't think these neurons directly project to either nerve.
Thank you for this precise comment. We apologize for incorrectly stating that PMC<sup>ESR1+</sup> cells project directly to the pelvic or pudendal nerves. In the revised Abstract (lines 32–36) we have rephrased the sentence to clarify the actual anatomy: “Anatomically, PMC<sup>ESR1+</sup> neurons consist of three distinct spinal-projection-based subpopulations: one targeting the sacral parasympathetic nucleus (SPN), one innervating the dorsal gray commissure (DGC), and a third that projects to both regions, thereby enforcing the coordination of bladder contraction and sphincter relaxation in a rigid temporal sequence.”. We trust this revision now accurately reflects the anatomical findings.
Reviewer #2 (Public review):
Summary:
The authors have performed a rigorous study to assess the role of ESR1+ neurons in the PMC to control the coordination of bladder and sphincter muscles during urination. This is an important extension of previous work defining the role of these brainstem neurons, and convincingly adds to the understanding of their role as master regulators of urination. This is a thorough, well-done study that clarifies how the Pontine micturition center coordinates different muscle groups for efficient urination, but there are some questions and considerations that remain.
Strengths:
These data are thorough and convincing in showing that ESR1+PMC neurons exert coordinated control over both the bladder and sphincter activity, which is essential for efficient urination. The anatomical distinctions in pelvic versus pudendal control are clear, and it's an advance to understand how this coordination occurs. This work offers a clearer picture of how micturition is driven.
We sincerely thank you for highlighting the rigor of our study and for recognizing the advance in understanding how PMC<sup>ESR1+</sup> neurons exert coordinated, anatomically segregated control over bladder and sphincter. We also appreciate the constructive suggestions that helped us further improve clarity, which we address point-by-point below.
Weaknesses:
The dynamics of how this population of ESR1+ neurons is engaged in natural urination events remains unclear. Not all ESR1+ neurons are always engaged, and it is not measured whether this is simply variation in population activity, or if more neurons are engaged during more intense starting bladder pressures, for instance. In particular, the response dynamics of single and doubly-projecting neurons are not defined. Additionally, the model for how these neurons coordinate with CRH+ neuron activity in the PMC is not addressed, although these cell types seem to be engaged at the same time. Lastly, it would be interesting to know how sensory input can likely modulate the activity of these neurons, but this is perhaps a future direction.
Thank you for this insightful comment. First, we agree that not all ESR1+ neurons are consistently engaged during urination (Figure 1B). Because bladder pressure was not measured during the opto-tagging experiments, we cannot determine whether this reflects trial-to-trial variability in population activity or pressure-dependent recruitment of additional neurons. We speculate that stronger starting bladder pressures may recruit a larger subset of ESR1+ neurons, analogous to graded, pressure-dependent recruitment observed in peripheral sensory neurons (Bruns et al., J Neural Eng. 2011, PMID: 21878706; Marshall et al., Nature. 2020, PMID: 33057202).
Second, using fiber photometry recording and optogenetic activation, we examined the dynamics of dual-projecting neurons in the PMC that were retrogradely labeled from the SPN and DGC. Their activity correlated with bladder contraction and sphincter relaxation, and optogenetic activation sequentially induced these events to trigger urination (see Recommendation #8). Although retrograde labeling captured only a subset of dual-projecting neurons, the results indicate that they coordinate bladder and sphincter activity.
Third, previous studies suggest that PMC<sup>CRH+</sup> cells are associated with bladder contraction and likely serve as an integration center for context-dependent micturition behavior (Hou et al., Cell. 2016, PMID: 27662084; Ito et al., Elife. 2020, PMID: 32347794). We therefore propose that PMC<sup>CRH+</sup> cells establish the baseline conditions and contextual readiness for voiding, whereas PMC<sup>ESR1+</sup> cells act as the executive command to reliably initiate and execute the event.
Finally, we agree that sensory inputs likely modulate PMC<sup>ESR1+</sup> neuron activity. Although this falls beyond the scope of the present study, it represents an important avenue for future investigation.
Reviewer #2 (Recommendations for the authors):
(1) In the introduction, the authors write that Keller 2018 only showed this ESR1 population to induce EUS relaxation, but those results also do show bladder contraction with photostimulation of this population. While the authors' work extends this finding in important ways, this should be acknowledged (line 60).
Thank you for this important correction. We have now revised the Introduction to explicitly acknowledge that stimulation of neurons expressing estrogen receptor 1 (ESR1) in the PMC (PMC<sup>ESR1+</sup>) contributes to sphincter relaxation and increased bladder pressure (Introduction, lines 60-62), as originally reported by Keller et al., 2018.
(2) I think a more detailed analysis of the dynamics of neural responses in the PMC ESR1 neurons would be valuable. For example: are the same cells always engaged before micturition, or do different populations activate on different trials? Can the authors comment on the half of the opto-tagged ESR1 population that is not firing during urination? Do they ever fire? A cell-by-cell analysis of which neurons are engaged over multiple trials would be very valuable to understand the dynamics of population activity. Figure 1H shows cumulative sessions, but what do single sessions look like?
Thank you for these valuable comments. In response, we have performed refined single-trial analyses of neuronal activity, as detailed in the point-by-point replies below.
For example: are the same cells always engaged before micturition, or do different populations activate on different trials?
Among 11 PMC<sup>ESR1+</sup> units that showed urination-related excitation, 8 units exhibited a consistent firing increase in every voiding trial, whereas the remaining 3 increased their discharge in >78 % of trials (Figure 1B; new Figure supplement 3F). Thus, the same PMC<sup>ESR1+</sup> cells are recruited repeatedly, rather than distinct populations being activated on different trials. We have added this clarification to Results (lines 106–108).
Can the authors comment on the half of the opto-tagged ESR1 population that is not firing during urination? Do they ever fire? A cell-by-cell analysis of which neurons are engaged over multiple trials would be very valuable to understand the dynamics of population activity.
Approximately half of the opto-tagged PMC<sup>ESR1+</sup> cells showed no increase in firing rate during urination, yet exhibited spontaneous spikes at other times (new Figure supplement 3G), confirming their electrical competence. Because the PMC also participates in defecation, uterine activity, and other pelvic functions (Rouzade-Dominguez et al., Eur J Neurosci. 2003, PMID: 14686905; Schellino et al., Frontiers in Neuroanatomy. 2020, PMID: 33013330; Quaghebeur et al., Auton Neurosci. 2021, PMID: 34391125), these ESR1+ neurons may serve functions other than urination. We have now added this cell-by-cell analysis and discussion to the manuscript (Results, lines 108-112).
Figure 1 H shows cumulative sessions, but what do single sessions look like?
As shown in new Figure supplements 3F–3G, single-session raster plots reveal that PMC<sup>ESR1+</sup> neurons display consistent firing patterns across individual trials. Neurons whose firing rate increased during urination did so in most trials (Figure supplement 3F), whereas neurons unrelated to voiding remained silent or showed no discernible rate change during voiding across trials (Figure supplement 3G). These single-session observations are consistent with the cumulative population analysis shown in Figure 1H (new Figure 1B).
(3) Supplemental Figure 4: It seems clear from this figure that NVCs are only occurring when the sphincter fails to engage. Can the authors quantify how often this is the case?
Thank you for this important point. We have now quantified the occurrence of non-voiding contractions (NVCs) across all 229 bladder contraction events from 3 mice shown in Supplemental Figure 4. NVCs were observed exclusively when the external urethral sphincter failed to relax, accounting for 62/229 events (27.1 %), whereas coordinated voiding contractions (VCs) occurred in the remaining 167 events (72.9 %). These new data are presented in Figure supplement 4C.
(4) Continuing from the above point: the authors say that the insufficient top-down drive or strength of activity from PMC ESR1 neurons is why NVCs occur. In looking closely, it also seems there is a small hump and subsequent increase in the calcium signal when the EUS bursting begins (particularly clear in Supplementary Figure 4). Could this instead mean that the bursting/urethral activity itself is feeding back onto the PMC to continue/enhance its activity, and it is instead the lack of sphincter bursting that results in the NVC? Could the authors analyze the signal during and after bursting starts? This model is consistent with one of the classic reflexes defined by Barrington, in which urethral fluid flow/activation enhances bladder contraction. The Figure 4 transection experiments do not fully answer this, as the authors are driving activity in the PMC at this time, but they could test this using PDN transection with fiber photometry recording.
Thank you for this important point. We fully agree that EUS bursting may provide excitatory feedback to the PMC that sustains or even amplifies its activity, and that the absence of such feedback could underlie NVCs. To test this possibility, we re-analyzed the fiber-photometry traces aligned to the onset and offset of each EUS bursting (new Figure supplement 4). A small but consistent hump in the Ca<sup>2+</sup> signal appeared before bursting onset and the Ca<sup>2+</sup> signal continued to rise throughout the bursting (Figure supplement 4B, yellow arrow). The amplitude at bursting offset was significantly higher than both the NVC peak and the level recorded at bursting onset. These observations support the interpretation that urethral fluid flow/activation supplies excitatory feedback that reinforces PMC activity and bladder contraction, consistent with Barrington’s classic reflex. We have incorporated these new analyses into the revised manuscript (lines 145–155 and Figure supplement 4F).
We agree that the positive-feedback loop described by Barrington’s classic urethra-to-bladder reflex is an intriguing mechanism. However, the PDN-transection experiment in Figure 4 was designed to determine if bladder contractions triggered by PMC<sup>ESR1+</sup> cells can proceed in the absence of sphincter bursting, not to evaluate this reflex. Incorporating simultaneous fiber-photometry recording into the PDN-transection experiment would therefore go beyond the scope of the present study. In future work we are keen to combine PDN transection with fiber photometry to further determine whether the urethra-to-bladder reflex contributes to the sustained PMC activity observed in our paradigm.
(5) In Figure 4, is the timing of sphincter engagement different with ChR2 stimulation from what normally occurs? It appears that the bursting happens immediately upon activation whereas bladder contraction is a bit delayed.
Thank you for this important observation. We have carefully re-examined the EMG traces from all animals shown in Figure 4. We confirm that the onset of sphincter bursting activity during ChR2 stimulation is indeed more rapid than during natural reflex voiding; nevertheless, the onset of phasic sphincter bursting during ChR2 stimulation remained delayed relative to the intravesical pressure rise (see Figure 8B).
The immediate sphincter discharge visible in some trials was tonic EUS discharge or rare irregular bursting, not the typical EUS bursting. This tonic pattern corresponds to the spinal guarding reflex that suppresses urine leakage (Fowler et al., Nature Reviews Neuroscience. 2008, PMID: 18490916; Keller et al., Nature Neuroscience. 2018, PMID: 30104734). These segments were identified by their amplitude and spectral content and excluded from burst-onset analysis. Our analysis protocol therefore distinguishes tonic guarding activity from true phasic bursting, ensuring that only the latter was used to determine burst timing.
(6) The explanation on line 299 about how spinal reflexes are impinging on this circuit is confusing. I agree that the bladder contraction stopping later than the EUS signal likely has something to do with spinal reflexes, but it seems this could instead be feedback from the urethral fluid flow, which continues bladder contractions (urethra-destrusor facilitative reflex). Could the authors clarify their thoughts here?
Thank you for highlighting this ambiguity. We agree that the delayed cessation of bladder contraction could equally reflect either (1) the urethra-to-bladder facilitative reflex driven by ongoing urethral fluid flow or (2) spinal reflexes that we described. In the revised manuscript (Results, lines 343–349), we have re-worded the paragraph to make this dual possibility explicit, thereby avoiding an overly strong emphasis on spinal mechanisms alone.
(7) A note on phrasing: the authors frequently say PMCESR1 cells drive sphincter relaxation, but then show an effect on sphincter bursting. Experienced readers might realize that relaxation and bursting are connected, but this might be confusing for readers and should be clarified in the text.
Thank you for highlighting the potential ambiguity. We agree that the sentence “PMC<sup>ESR1</sup> cells drive sphincter relaxation” can seem paradoxical when our data show increased EUS bursting. In adult mice, the EUS does not remain continuously relaxed during voiding; instead, it generates rhythmic bursting composed of high-frequency spike clusters (active periods) alternating with low tonic activity (silent periods), resulting in rhythmic contractions and relaxations of EUS. This phasic activity acts as a pump that facilitates urine flow through the narrow rodent urethra (Kadekawa et al., Am J Physiol Regul Integr Comp Physiol, 2016, PMID: 26818058). The EUS bursting activity we recorded is consistent with the results reported in previous studies (Keller et al., Nat Neurosci, 2018, PMID:30104734; Ito et al., Elife, 2020, PMID:32347794).
Consequently, when PMC<sup>ESR1</sup> neurons initiate bursting, they simultaneously generate the relaxation phases that separate the spikes. To make this explicit we have replaced the phrase “PMC<sup>ESR1+</sup> cells drive sphincter relaxation” with “PMC<sup>ESR1</sup> neurons trigger EUS bursting, which generates rhythmic sphincter contractions and relaxations.” (Results, page 7, lines 219-221). We have applied similar clarifications throughout the revised manuscript (Results, lines 125-129). We hope this revision eliminates any apparent contradiction.
(8) The question remains as to which neurons (dual projecting, single projecting, or all?) are active in natural urination. This is possible to do through dual injection of retrograde virus in SPN and DGC that could coordinately turn on Gcamp, but this challenging experiment is perhaps beyond the scope of this paper. Even still, the authors could discuss their model for whether the dual- and single-projecting neurons are all engaged at once in a natural urination event. Do the authors have any data that could provide insight as to when these sub-populations are active? Results from the opto-tagging in Figure 1 (and comment #2 about single neuron firing properties) might provide a foundation for hypotheses or insights.
Thank you for this valuable suggestion. We have now performed the experiment you proposed: dual injection of retrograde virus (AAV-Retro-Cre and AAV-Retro-DIO-GCaMP6s) in SPN and DGC were used to selectively label PMC dual-projecting neurons, and a 200-µm optic fiber was implanted above the PMC to record their Ca<sup>2+</sup> dynamics during natural urination (Figure supplement 11A and Methods, lines 470–474, 652-655). Dual-projecting neurons exhibited robust activation throughout the entire voiding phase that was tightly correlated with intravesical pressure rise and EUS bursting (Figure supplements 11A–11H). However, technical limits of current retrograde tools preclude selective isolation of single-projecting (SPN-only or DGC-only) subsets for independent fiber-photometry recordings and injection restricted to one target unavoidably labels both single- and dual-projecting cells. We now state this technical limitation explicitly (Discussion, lines 426-430).
Accordingly, in the revised Discussion (lines 389-406), we integrate fiber-photometry Ca<sup>2+</sup> signals with single-unit data from opto-tagged recordings to propose several testable, non-mutually-exclusive models for how dual- and single-projecting PMC<sup>ESR1+</sup> neurons are engaged during natural urination: “Based on population dynamics obtained by fiber photometry (Figures 1D-1H, Figure supplements 1A-1F, and Figure supplements 11A-11H) and single-neuron firing properties recorded via optrode (Figures 1A-1C), we propose several mechanistic models for the engagement of dual- and single-projecting PMC<sup>ESR1+</sup> neurons during natural micturition. One possibility is that all three populations (dual-projecting, SPN-projecting and DGC-projecting neurons) are co-activated, with the dual-projecting subset acting as a “bridging amplifier” that sustains rising bladder pressure while coordinating EUS relaxation. Alternatively, SPN-projecting neurons may be recruited first to initiate bladder contraction, followed by DGC-projecting neurons that evoke EUS bursting and facilitate urine entry into the urethra; once flow begins, the urethro-detrusor facilitative reflex could recruit dual-projecting neurons to further enhance voiding efficiency. In addition, contextual or state-dependent urination—such as scent-marking behavior characterized by multiple voiding events with smaller volumes than reflexive urination—may predominantly rely on sequential and cooperative activation of single-projecting neurons. Other recruitment sequences remain conceivable. Future studies combining diverse urination-related behavioral paradigms with simultaneous recordings from projection-specifically labeled PMC neurons will be required to validate and refine these models.”
Reviewer #3 (Public review):
Summary:
The paper by Li et al explored the role of Estrogen receptor 1 (Esr1) expressing neurons in the pontine micturition center (PMC), a brainstem region also known as Barrington's nucleus (Hou et al 2016, Keller et al 2018). First, the author conducted bulk Ca2+ imaging/unit recording from PMCESR1 to investigate the correlations of PMCESR1 neural activity to voiding behavior in conscious mice and bladder pressure/external urethral muscle activity in urethane anesthetized mice. Next, the authors conducted optogenetics inactivation/activation of PMCESR1 to confirm the contribution to the voiding behavior also conducted peripheral nerve transection together with optogenetics activation to confirm the independent control of bladder pressure and urethral sphincter muscle.
We sincerely thank you for providing a thoughtful summary and insightful comments on our study.
Weaknesses:
(1) The study demonstrates that pelvic nerve transection reduces urinary volume triggered by PMC ESR1+ cell photoactivation in freely moving mice. Could the role of pudendal nerve transection also be examined in awake mice to provide a more comprehensive understanding of neural involvement?
Thank you for this valuable suggestion. We conducted an additional experiment to determine the contribution of the pudendal nerve to PMC<sup>ESR1+</sup> neuron-driven voiding in awake mice. Bilateral pudendal nerve transection (PDNx) reduced the optogenetically evoked urine volume compared with sham-operated controls, yet photoactivation of PMC<sup>ESR1+</sup> neurons still reliably induced urination after PDNx (new Figure 6). Thus, bilateral integrity of the pudendal nerve is required for efficient PMC<sup>ESR1+</sup> neuron-driven voiding, most likely by transmitting the signals that entrain rhythmic EUS bursting. These data and experimental details have been incorporated into Figure 6, Results (lines 272–276), and Methods (lines 542–545).
(2) While the paper primarily focuses on PMCESR1+ cells in bladder-sphincter coordination, the analysis of PMCESR1+-DGC/SPN neural circuits - given their distinct anatomical projections in the sacral spinal cord - feels underexplored. How do these circuits influence bladder and sphincter function when activated or inhibited? Also, do you have any tracing data to confirm whether bladder-sphincter innervation comes from distinct spinal nuclei?
Thank you for this critical comment. To determine how PMC<sup>ESR1+</sup> neurons that target distinct sacral nuclei influence bladder–sphincter coordination, we first focused on the dual-projecting subset in a new experiment (Figures supplement 11 and Methods, lines 470–477, 652-655, 669-673). Dual retrograde virus injections into SPN and DGC selectively labelled PMC dual-projecting neurons, a subset of which are ESR1+. Fiber-photometry recordings showed that these cells were active during bladder contraction and sphincter relaxation (Figure supplements 11E-11H), whereas optogenetic activation reliably initiated urination: bladder pressure rose immediately and was followed by rhythmic EUS bursting (Figure supplements 11I-11N and 12B; Results, lines 309-313, 332-335). Thus, the dual-projecting sub-population is sufficient to coordinate bladder contraction with sphincter relaxation. Current retrograde tools do not allow selective isolation of single-projecting (SPN-only or DGC-only) subsets; injecting only one target unavoidably labels both single- and dual-projecting cells. Consequently, we cannot yet compare the functional impact of pure SPN-only versus DGC-only PMC populations. This limitation is now stated explicitly in the revised Discussion (lines 426–430).
In our 2025 paper (Yan et al., Commun Biol, 2025, PMID: 40259086), we used PRV-based retrograde tracing to show that SPN and DGC constitute two separate spinal nuclei controlling the bladder and the EUS, respectively. Classic studies have reached the same conclusion (Yao et al., Nat Neurosci, 2018, PMID: 30361547; Karnup & De Groat, IBRO Reports, 2020, PMID: 32775758; Karnup, Auton Neurosci, 2021, PMID: 34391124). These citations and a concise summary have been added to the Results (lines 289–294).
(3) Although the paper successfully identifies the physiological role of PMCESR1+ cells in bladder-sphincter coordination, the study falls short in examining the electrophysiological properties of PMC ESR1+-DGC/SPN cells. A deeper investigation here would strengthen the findings.
Thank you for this thoughtful suggestion. While a detailed electrophysiological characterization of PMC<sup>ESR1+-DGC/SPN</sup> neurons would provide complementary information, the primary goal of the present study was to define the in vivo functional dynamics and behavioral role of these neurons during natural urination. As you suggested, further electrophysiological analysis of PMC<sup>ESR1+-DGC/SPN</sup> neurons will be an important direction for our future work.
(4) The parameters for photoactivation (blue light pulses delivered at 25 Hz for 15 ms, every 30 s) and photoinhibition (pulses at 50 Hz for 20 ms) vary. What drove the selection of these specific parameters? Moreover, for photoactivation experiments, the change in pressure (ΔP = P5 sec - P0 sec) is calculated differently from photoinhibition (Δpressure = Ppeak - Pmin). Can you clarify the reasoning behind these differing approaches?
Thank you for this opportunity to clarify our experimental design. The photoactivation protocol (25 Hz, 15 ms pulses) was chosen because PMC<sup>ESR1+</sup> neurons faithfully follow this frequency without depolarisation block and it reliably triggers voiding (Keller et al., Nat Neurosci, 2018, PMID:30104734). For photoinhibition we originally stated “50 Hz, 20 ms pulses”, but this was an error. Consistent with the same study (Keller et al., Nat Neurosci, 2018, PMID:30104734), we used continuous light (constant illumination) to maintain sustained suppression. The Methods section has been corrected (lines 659-661, 690-691).
The ΔP formula was tailored to the temporal profile of each manipulation. For activation, ΔP (P<sub>5 sec</sub> - P<sub>0 sec</sub>) captures the rapid pressure rise after light onset; the same window was used in (Hou et al., Cell. 2016, PMID: 27662084). For inhibition, because saline infusion produces rhythmic reflex voiding, we delivered light at the onset of EUS bursting (i.e. when pressure was already at ~peak). Inhibition abruptly stops the bladder contraction, so the bladder cannot return to its pre-void baseline. The Δpressure (P<sub>peak</sub> – P<sub>min</sub>) was therefore used to quantify the extent to which the ongoing pressure wave was aborted by photoinhibition. P<sub>min</sub> is the lowest value reached before the next infusion-driven upswing, making the metric insensitive to the slow baseline drift produced by continuous infusion. These clarifications have been added to the Methods (Methods, lines 676-677, 679-680, 692-693).
(5) The discussion could further emphasize how PMCESR1+ cells coordinate bladder contraction and sphincter relaxation to control urination, highlighting their central role in the initiation and suspension of this process.
Thank you for this valuable comment. We have revised the Discussion to emphasize that PMC<sup>ESR1+</sup> neurons coordinate urination by sequentially driving bladder contraction followed by sphincter relaxation through their dual projections to the SPN and DGC. We also emphasized that this coordination is essential for the initiation and effective execution of voiding (Discussion, lines 369-388). In addition, in the revised Discussion (Discussion, lines 389-406), we integrate fiber-photometry Ca<sup>2+</sup> signals with single-unit data from opto-tagged recordings to propose several testable, non-mutually-exclusive models for how PMC<sup>ESR1+</sup> cells are engaged during natural urination.
(6) In Figure 8, The authors analyze the temporal sequence of bladder pressure and EUS bursting during natural voiding and PMC activation-induced voiding. It would be acceptable to consider the existence of a lower spinal reflex circuit, however, the interpretation of the data contains speculation. Bladder pressure measurement is hard to say reflecting efferent pelvic nerve activity in real time. (As a biological system, bladder contraction is mediated by smooth muscle, and does not reflect real-time efferent pelvic nerve activity. As an experimental set-up, bladder pressure measurement has some delays to reflect bladder pressure because of tubing, but EUS bursting has no delay.) Especially for the inactivation experiment, these factors would contribute to the interpretation of data. This reviewer recommends a rewrite of the section considering these limitations. Most of the section is suitable for the results.
We agree with the reviewer that bladder pressure, mediated by smooth muscle contraction, provides an indirect measure of efferent pelvic nerve activity and is subject to both physiological and experimental delays. Regarding potential delay from the tubing system, pressure propagates in fluid at approximately 1000 m/s (Kela & Pekka, Proceedings of World Academy of Science Engineering & Technology, 2009, DOI: 10.5281/zenodo.1080526). Given that the total tubing length in our setup is 0.5-1 meter, this gives an estimated transmission delay of only 0.5-1 ms. However, this delay is negligible compared with the observed time difference (~700 ms) between the cessation of EUS bursting and the termination of bladder contraction. Theoretically, pressure transmission is not expected to introduce a temporal delay. However, we cannot exclude the possibility that the pressure measurement itself may impose such a delay, because bladder pressure does not necessarily reflect efferent pelvic nerve activity in real time. Future studies using simultaneous recordings of bladder pressure and pelvic nerve discharges will help clarify whether a true temporal delay exists. Nevertheless, we agree that additional physiological or peripheral factors may also contribute to this difference in timing. As suggested by the reviewer, we have revised the discussion to consider the potential influence of other factors, such as urethra-detrusor facilitative reflex (Results, lines 343-349).
Reviewer #3 (Recommendations for the authors):
(1) In opto-tag experiments, a comparison of average AP waveform during behavior and during light stimulation should be included as criteria. It should be mostly the same waveform.
Thank you for bringing this to our attention. We have now added this comparison as an inclusion criterion in the revised manuscript. Figure supplement 3B shows representative examples of the average waveforms, and Figure supplement 3C displays the distribution of correlation coefficients between spontaneous and light-evoked spikes for all recorded PMC<sup>ESR1+</sup> units, all of which exhibited r > 0.8.
(2) Optical fiber implantation seems to be done in two different methods. In Figure 1 and Figure 2, the fiber tip is positioned just above PMC but in Figure 3 it seems to be angled. The information should be included in the Methods section.
Thank you for this important comment. We have now clarified in the Methods that for Figures 1 and 2, the optical fibers were implanted vertically above the PMC, whereas for Figure 3, the left optical fiber was implanted at a 33° lateral angle targeting the PMC (Methods, lines 499-503).
(3) In the closed-loop inhibition experiments of Figure 2, the parameters to start closed-loop photo-inactivation were not described in the method. If it is a manual closed loop, it should be described clearly.
Thank you for raising this important point. We apologize for omitting these details in the original Methods. We have now added a complete description of the manual closed-loop photo-inhibition protocol, including the triggering criteria and operator-controlled timing, in the revised Methods section (lines 602–605).
(4) In Figure 7A/E the authors provide a spinal cord image to show the injection site, but the image is misleading. The figure only shows AAV-infected CRH/ESR1 neurons in the spinal cord section. It does not indicate the AAV injection site or the terminal distribution.
Thank you for your important comment. We apologize for providing a spinal cord image that did not accurately depict the injection site. To rigorously verify that our spinal injections were confined to SPN or DGC, we performed new retrograde-tracing experiments in ESR1-Cre and CRH-Cre mice. A mixture of AAV-Retro-DIO-mCherry or AAV-Retro-DIO-EGFP with the retrograde tracer CTB-647 was injected specifically into SPN or DGC. Only animals in which CTB-647 fluorescence was strictly limited to the target nucleus, without spread to the adjacent region, were included (new Figures 7A and 7E). These data confirmed our original observations and have been pooled in Figure 7. The manuscript and figure have been updated accordingly (Results, lines 297-301, 304-306; Methods, lines 465–466).
Author response:
The following is the authors’ response to the original reviews.
eLife Assessment
This is a useful study presenting solid data indicating that the bacterial GTPases EngA and ObgE enable single-step reconstitution of functional 50S ribosomal subunits under near-physiological conditions. The study elegantly bridges the gap between the non-physiological aspects of the previous two-step reconstitution method and the extract-dependent iSAT system to enable ribosome assembly under translation-compatible conditions; however, it is limited by reliance on rRNA and proteins extracted from native ribosomes and does not achieve a true bottom-up reconstruction from all synthetic components. The evidence is incomplete in not characterizing the spectrum of reporter polypeptides produced and not comparing their rate and yield of synthesis from reconstituted ribosomes to that obtained with pure native ribosomes; and the impact of the study is limited by not including reporters to examine the fidelity of initiation, elongation or termination achieved with the reconstituted ribosomes.
As described below, based on the comments from the public reviewers, we have summarized at the end of the Discussion how this study contributes toward true bottom-up reconstruction from fully synthetic components, as well as the aspects that will require further development. In addition, we have newly provided data characterizing the reporter polypeptides from multiple perspectives, demonstrating that the assembled ribosomes do not exhibit issues such as reduced fidelity (Fig. 6, 7, Supplementary Data 2, 3). We believe that these data adequately address the limitations that were pointed out in the eLife Assessment.
Public Reviews:
Reviewer #1 (Public review):
This study presents evidence that the addition of the two GTPases EngA and ObgE to reactions comprised of rRNAs and total ribosomal proteins purified from native bacterial ribosomes can bypass the requirements for non-physiological temperature shifts and Mg+2 ion concentrations for in vitro reconstitution of functional E. coli ribosomes.
Strengths:
This advance allows ribosome reconstitution in a fully reconstituted protein synthesis system containing individually purified recombinant translation factors, with the reconstituted ribosomes substituting for native purified ribosomes to support protein synthesis. This work potentially represents an important development in the long-term effort to produce synthetic cells.
Weaknesses:
While much of the evidence is solid, the analysis is incomplete in certain respects that detract from the scientific quality and significance of the findings:
(1) The authors do not describe how the native ribosomal proteins (RPs) were purified, and it is unclear whether all subassemblies of RPs have been disrupted in the purification procedure. If not, additional chaperones might be required beyond the two GTPases described here for functional ribosome assembly from individual RPs.
Native ribosomal proteins (RPs) were prepared from native ribosomes, according to the well-established protocol described by Dr. Knud H. Nierhaus [Nierhaus, K. H. Reconstitution of ribosomes in Ribosomes and protein synthesis: A Practical Approach (Spedding G. eds.) 161-189, IRL Press at Oxford University Press, New York (1990)]. In this method, ribosome proteins are subjected to dialysis in 6 M urea buffer, a strong denaturing condition that may completely disrupt ribosomal structure and dissociate all ribosomal protein subassemblies. To make this point clear, we described the detailed ribosomal protein (RP) preparation procedure in the manuscript, rather than merely referring to the book.
In addition, we would like to clarify one point related to this comment. The focus of the present study is to show that the presence of two factors is required for single-step ribosome reconstitution under translation-compatible, cell-free conditions. We do not intend to claim that these two factors are absolutely sufficient for ribosome reconstitution. Hence, we have revised the manuscript to more explicitly state what this work does and does not conclude.
(2) Reconstitution studies in the past have succeeded by using all recombinant, individually purified RPs, which would clearly address the issue in the preceding comment and also eliminate the possibility that an unknown ribosome assembly factor that co-purifies with native ribosomes has been added to the reconstitution reactions along with the RPs.
As noted in the response to the Comment (1), the focus of the present study is the requirement of the two factors for functional ribosome assembly. Therefore, we consider that it is not necessary to completely exclude the possibility that unknown ribosome assembly factors are present in the RP preparation. Nevertheless, we agree that it is important to clarify what factors, if any, are co-present in the RP fraction. To address this, we performed proteomic analysis of the TP70 preparation (Supplementary Data 3) and stated the possibility of other factors’ inclusion.
We also agree that additional, as-yet-unidentified components, including factors involved in rRNA modification, could plausibly further improve assembly efficiency. We also consider that such studies may contribute to extending the system to the use of in vitro-transcribed rRNA and fully recombinant ribosomal proteins, which could be essentially a next step of this study. We noted the possibility of as-yet-unidentified components and the future perspectives in the Discussion.
(3) They never compared the efficiency of the reconstituted ribosomes to native ribosomes added to the "PURE" in vitro protein synthesis system, making it unclear what proportion of the reconstituted ribosomes are functional, and how protein yield per mRNA molecule compares to that given by the PURE system programmed with purified native ribosomes.
According to this suggestion, we measured the sfGFP synthesis rate from the increase in fluorescence over time under conditions where the template mRNA is in excess, and compared this rate directly between reconstituted and native ribosomes. We consider that this comparison provides insight into what fraction of ribosomes reconstituted in our system are functionally active (Fig. 6).
As noted in the provisional responses, quantifying protein yield per mRNA molecule is substantially more challenging. The translation system is complex, and the apparent yield per mRNA can vary depending on factors such as differences in polysome formation efficiency. In addition, the PURE system is a coupled transcription–translation setup that starts from DNA templates, which further complicates rigorous normalization on a per-mRNA basis. Because the main focus of this study is to determine how many functionally active ribosomes can be reconstituted under translation-compatible conditions, we addressed this comment by just carrying out the experiment comparing sfGFP synthesis rate.
(4) They also have not examined the synthesized GFP protein by SDS-PAGE to determine what proportion is full-length.
We have added an affinity tag to the sfGFP reporter, and then, purified the synthesized products from the reaction mixture and analyzed it by SDS–PAGE (Fig. 7a).
(5) The previous development of the PURE system included examinations of the synthesis of multiple proteins, one of which was an enzyme whose specific activity could be compared to that of the native enzyme. This would be a significant improvement to the current study. They could also have programmed the translation reactions containing reconstituted ribosomes with (i) total native mRNA and compared the products in SDS-PAGE to those obtained with the control PURE system containing native ribosomes; (ii) with specifc reporter mRNAs designed to examine dependence on a Shine-Dalgarno sequence and the impact of an in-frame stop codon in prematurely terminating translation to assess the fidelity of initiation and termination events; and (iii) an mRNA with a programmed frameshift site to assess elongation fidelity displayed by their reconstituted ribosomes.
Following the recommendation, we selected DHFR as an enzymatically active protein and used it as a reporter, confirming that it exhibited enzymatic activity comparable to that observed when synthesized by native ribosomes (Fig. 7c). In addition, MS analysis of the purified sfGFP used for SDS-PAGE analysis showed that nearly all peptide fragments were detected, covering almost the entire sequence from the initiator amino acid to the amino acid immediately preceding the stop codon (Fig. 7b, Supplementary Data 2. These results suggest that protein synthesis by the newly assembled ribosomes proceeds smoothly from initiation to termination, with no apparent problem in fidelity, and therefore indicate that functional ribosomes were successfully reconstituted.
Reviewer #2 (Public review):
This study presents a significant advance in the field of in vitro ribosome assembly by demonstrating that the bacterial GTPases EngA and ObgE enable single-step reconstitution of functional 50S ribosomal subunits under near-physiological conditions-specifically at 37 {degree sign}C and with total Mg<sup>2+</sup> concentrations below 10 mM.
This achievement directly addresses a long-standing limitation of the traditional two-step in vitro assembly protocol (Nierhaus & Dohme, PNAS 1974), which requires non-physiological temperatures (44-50 {degree sign}C), and high Mg<sup>2+</sup> concentrations (~20 mM). Inspired by the integrated Synthesis, Assembly, and Translation (iSAT) platform (Jewett et al., Mol Syst Biol 2013), leveraging E. coli S150 crude extract, which supplies essential assembly factors, the authors hypothesize that specific ribosome biogenesis factors-particularly GTPases present in such extracts-may be responsible for enabling assembly under mild conditions. Through systematic screening, they identify EngA and ObgE as the minimal pair sufficient to replace the need for temperature and Mg<sup>2+</sup> shifts when using phenol-extracted (i.e., mature, modified) rRNA and purified TP70 proteins.
However, several important concerns remain:
(1) Dependence on Native rRNA Limits Generalizability
The current system relies on rRNA extracted from native ribosomes via phenol, which retains natural post-transcriptional modifications. As the authors note (lines 302-304), attempts to assemble active 50S subunits using in vitro transcribed rRNA, even in the presence of EngA and ObgE, failed. This contrasts with iSAT, where in vitro transcribed rRNA can yield functional (though reduced-activity, ~20% of native) ribosomes, presumably due to the presence of rRNA modification enzymes and additional chaperones in the S150 extract. Thus, while this study successfully isolates two key GTPase factors that mimic part of iSAT's functionality, it does not fully recapitulate iSAT's capacity for de novo assembly from unmodified RNA. The manuscript should clarify that the in vitro assembly demonstrated here is contingent on using native rRNA and does not yet achieve true bottom-up reconstruction from synthetic parts. Moreover, given iSAT's success with transcribed rRNA, could a similar systematic omission approach (e.g., adding individual factors) help identify the additional components required to support unmodified rRNA folding?
We fully recognize the reviewer’s point that our current system has not yet achieved a true bottom-up reconstruction. Although we intended to state this clearly in the manuscript, the fact that this concern remains indicates that our description was not sufficiently explicit. We therefore added the paragraph to ensure that this limitation is clearly communicated to readers.
(2) Imprecise Use of "Physiological Mg<sup>2+</sup> Concentration"
The abstract states that assembly occurs at "physiological Mg<sup>2+</sup> concentration" (<10 mM). However, while this total Mg<sup>2+</sup> level aligns with optimized in vitro translation buffers (e.g., in PURE or iSAT systems), it exceeds estimates of free cytosolic [Mg<sup>2+</sup>] in E. coli (~1-2 mM). The authors should clarify that they refer to total Mg<sup>2+</sup> concentrations compatible with cell-free protein synthesis, not necessarily intracellular free ion levels, to avoid misleading readers about true physiological relevance.
We agree that this is a very reasonable point and revised the manuscript to clarify that we are referring to the total Mg<sup>2+</sup> concentration compatible with cell-free protein synthesis, rather than the intracellular free Mg<sup>2+</sup> level under physiological conditions. We also changed the term “physiological” to “near-physiological” to avoid the misunderstanding.
In summary, this work elegantly bridges the gap between the two-step method and the extract-dependent iSAT system by identifying two defined GTPases that capture a core functionality of cellular extracts: enabling ribosome assembly under translation-compatible conditions. However, the reliance on native rRNA underscores that additional factors - likely present in iSAT's S150 extract - are still needed for full de novo reconstitution from unmodified transcripts. Future work combining the precision of this defined system with the completeness of iSAT may ultimately realize truly autonomous synthetic ribosome biogenesis.
Recommendations for the authors:
Reviewing Editor Comments:
Recommendations for improvement:
(1) Assess the length distribution of GFP polypeptides being produced using SDS-PAGE.
SDS-PAGE was performed according to the comment 4 of the Reviewer #1 (Fig. 7b). Please refer to our response addressing the comment.
(2) Compare the rate and yield of GFP synthesized per mRNA using their reconstituted ribosomes to that obtained with pure native ribosomes.
The efficiency of the reconstituted ribosomes was compared to native ribosomes according to the comment 3 of the Reviewer #1 (Fig. 6). Please refer to our response addressing the comment.
(3) Expand the panel of reporter mRNAs being examined to compare the fidelity of initiation, elongation or termination achieved with reconstituted ribosomes to that obtained using native ribosomes.
DHFR synthesis was addressed and also MS analysis of synthesized sfGFP was performed according to the comment 5 of the Reviewer #1 (Fig. 7b, c). Please refer to our response addressing the comment.
(4) Revise the manuscript to clarify that the in vitro assembly demonstrated here is contingent on using native rRNA and thus does not achieve a true bottom-up reconstruction from synthetic parts.
We added to the Discussion a paragraph summarizing the findings of this study, limitations, and future perspectives according to the comment 1 and 2 of the Reviewer #1 and the comment 1 of the Reviewer #2. Please refer to our responses addressing these comments.
(5) Revise the manuscript to clarify that they are referring to total Mg2+ concentrations compatible with cell-free protein synthesis, not necessarily intracellular free ion levels, to avoid misleading readers about the physiological relevance of the reconstitution.
We revised the manuscript to clarify this point according to the comment 2 of the Reviewer #2. Please refer to our response addressing the comment.
(6) Revise the text to fully describe how the native ribosomal proteins (RPs) were purified and indicate whether all subassemblies of RPs were disrupted in the purification procedure.
We revised the Methods section to clarify how the native RPs were purified and that all subassemblies of RPs were disrupted according to the comment 1 of the Reviewer #1.
(7) Revise the text to indicate that achieving ribosome reconstitutions using all recombinant, individually purified RPs is required to achieve a true bottom-up reconstruction from all synthetic components.
As with our response to the comment 4, we have added the point at the end of the Discussion as a future perspective toward true bottom-up reconstruction from all synthetic components.
(8) Consider conducting a similar systematic omission approach (e.g., adding individual factors) to help identify the additional components required to support unmodified rRNA folding.
As with our response to the comment 4 and 7, we have added the point at the end of the Discussion as a future perspective toward identification of additional essential factors for true bottom-up reconstruction.
Reviewer #1 (Recommendations for the authors):
(1) Assessing the spectrum of GFP polypeptides being produced by SDS-PAGE and comparing the rate and yield of GFP produced to that obtained with pure native ribosomes would seem to be essential additional measurements needed to bolster the evidence supporting the main conclusions of the work.
SDS-PAGE and MS analysis of the synthesized sfGFP were performed (Fig. 7a, b). Comparison of the assembled ribosomes and native ones were also performed (Fig. 6).
(2) Examining translation of other reporter mRNAs designed to compare the fidelity of initiation, elongation or termination achieved with reconstituted ribosomes to that produced by native ribosomes in the PURE system would be required to elevate the scientific quality of the work and its significance to the field.
DHFR synthesis and its activity measurement were performed (Fig. 7c). Also, MS analysis of the purified sfGFP showed that nearly all peptide fragments were detected, covering almost the entire sequence from the initiator amino acid to the amino acid immediately preceding the stop codon (Fig. 7b). We consider that these findings indicate that there is no apparent problem with fidelity.
Reviewer #2 (Public review):
Summary:
Chapman, Determan et al. investigate how pathogenic mutations in DNMT3A, which cause Tatton-Brown-Rahman Syndrome (TBRS), disrupt human cortical developmental processes using a comprehensive panel of human pluripotent stem cell models spanning DNMT3A loss-of-function severity. The authors aim to identify the cellular and molecular mechanisms underlying TBRS-associated brain overgrowth and intellectual disability, and to test whether mechanistic convergence exists between TBRS and other overgrowth-intellectual disability disorders (OGIDs) caused by mutations in EZH2 (Weaver syndrome) or PIK3CA pathway components. Their central conclusion is that GABAergic interneuron development is selectively vulnerable to DNMT3A mutation, where reduced DNA methylation causes premature de-repression of neuronal and synaptic genes, driving precocious neuronal maturation and hyperactivity sufficient to disrupt neuronal network synchrony. This report adds to a growing literature supporting the vulnerability of GABAergic interneurons in NDDs and further provides a mechanistic view of this vulnerability, potentially convergent across OGIDs. The mechanistic claims around H3K27me3 compensation and mTOR-based therapeutic convergence, while promising, rest on more preliminary evidence and would benefit from the distinction between correlation and mechanism being made more explicit in the text. Overall, this is a compelling study with a rigorous experimental design and novel findings with a potential impact on a better understanding of the OGID pathophysiology.
Strengths:
(1) A major strength of this work is the breadth and rigor of the disease modeling approach. Four independent TBRS model systems are used in tandem: a patient-derived iPSC line with isogenic CRISPR-corrected control (R882H), a knock-in hESC model (P904L) with its wild-type isogenic, patient deletion iPSC lines (Del1/2), and CRISPRi knockdown models (G1/G2), collectively spanning a range of DNMT3A loss-of-function that correlates with phenotypic severity. This allelic series design substantially strengthens causal inference beyond what any single isogenic pair could provide.
(2) The multi-omic integration across matched developmental stages provides a strong mechanistic foundation for the cellular phenotyping and provides significantly enhanced novelty. RNA-seq, whole-genome bisulfite sequencing, and H3K27me3 CUT&Tag are combined in the same cell types, and timepoints show that DNMT3A loss reduces CG methylation at neuronal and synaptic gene loci, leading to premature transcriptional activation.
(3) The selective vulnerability of ventral (GABAergic) versus dorsal (glutamatergic) progenitors is one of the study's most important findings. This lineage specificity is consistently observed across all model systems and in both 2D and organoid formats, where ventral NPCs show increased proliferation, premature neuronal gene expression, and increased neurogenesis, while dorsal NPCs are largely unaffected at the transcriptomic and cellular level despite exhibiting comparable DNA methylation changes. This adds to a body of emerging work showing GABAergic interneuron vulnerability in NDDs where ubiquitously expressed genes such as chromatin modifiers are perturbed, and provides additional molecular insights into potential mechanisms of "resilience" of dorsal populations.
(4) The functional characterization follows a logical progression from single-neuron electrophysiology (demonstrating GABAergic hyperactivity with increased action potential amplitude and firing rate) to network-level analysis using high-density multi-electrode arrays. The HD-MEA experimental design - pairing TBRS or control GABAergic neurons with a constant background of control iGlut neurons - cleanly isolates GABAergic dysfunction as the driver of network hypersynchrony.
Weaknesses:
(1) The concomitant induction of proliferation and differentiation in TBRS V-NPCs is conceptually striking, since these are generally considered antagonistic developmental programs. The authors partially address this tension by noting that DNMT3A LOF alone is insufficient to initiate neuronal differentiation, i.e., V-NPCs upregulate neuronal and synaptic genes while retaining progenitor identity, implying that transcriptomic priming and commitment to differentiation are decoupled. However, the relationship between the proliferative phenotype and the epigenetic priming phenotype remains mechanistically unresolved. The manuscript documents mTOR pathway upregulation at the protein level and identifies shared DEGs that include proliferative regulators, but it does not establish whether mTOR-driven proliferation and mCG-loss-driven neuronal gene de-repression/enhanced differentiation are causally linked or represent two independent consequences of DNMT3A LOF.
(2) Relatedly, the rapamycin rescue experiment is a valuable proof-of-concept for the PIK3/AKT/mTOR convergence but is limited to a single dose in a single model (882) with a single readout (Ki67+ proliferation). Given the prominence of mTOR pathway convergence in the manuscript as a potential shared therapeutic avenue across OGIDs, the data supporting this claim are somewhat preliminary. It remains unknown whether mTOR inhibition rescues downstream phenotypes (neurogenesis, gene expression, neuronal maturation) or whether less severe TBRS models respond similarly. This might also help tackle the first comment above. e.g., if mTOR inhibition rescued proliferation but not the transcriptomic priming, that would support two independent mechanisms.
(3) The claim that H3K27me3 compensates for mCG loss is an important mechanistic point, but the current data do not distinguish between active compensation, in which EZH2 is recruited in response to methylation loss, and functional redundancy, in which H3K27me3 is independently established and becomes the dominant repressive mark once DNA methylation is reduced. The EZH2 knockdown/inhibition experiments show that H3K27me3 is sufficient to maintain repression at hypo-DMR sites, but they do not establish that H3K27me3 gain is itself a response to methylation loss. Because H3K27me3 profiling was performed only in the severe 882 model, it is also unclear whether H3K27me3 gain scales with DNMT3A LOF severity, as a compensatory model would predict. Finally, the EZH2 overexpression rescue is performed in V-NPCs, whereas the compensation model is developed primarily in D-NPCs, making it difficult to assess whether the same mechanism operates in the lineage where it was originally inferred.
(4) The narrative framing of dorsal neuron development as unaffected by DNMT3A LOF is somewhat at odds with the data presented. The 882 D-NPCs show substantial DNA methylation changes, and TBRS D-INs exhibit what the authors describe as "substantive transcriptomic differences" involving persistent expression of pluripotency and progenitor genes, which seems to be a distinct but potentially significant phenotype. The impact of DNMT3A loss between ventral and dorsal lineages might be more accurately framed as divergent in nature rather than specific to a certain population.
(5) SST stainings are not entirely convincing. They appear mostly nuclear, and some instances localized to rosettes in organoids, whereas the protein is largely confined to processes and is expected to be found outside progenitor-rich zones like rosettes.
Author response:
Public Reviews:
Reviewer #1 (Public review):
Summary:
This is an important study that describes the consequences of the DNMT3A mutation in human neuronal development for the first time. The selective impact of DNMT3A function on GABAergic interneurons is interesting and an important feature of future therapeutics. The claims made in that manuscript are supported by strong evidence for the most part. And the data are of high quality in general and presented well.
Strengths:
The strengths of the work include: Characterization of multiple DNMT3A loss-of-function alleles, including two misense variants, R882H, P904L, and a deletion allele. The missense mutation lines both include an ideal control with the same genetic background. The CRISPRi-mediated DNMT3A knockdown has also been included. The study identifies the mTOR-PI3K pathway as a factor of overgrowth issues found in the mutant organoid. In bulk mRNA sequencing and whole-genome bisulfite sequencing, identify hypomethylated genomic regions associated with gene expression repression. Again, this is more pronounced in the ventral organoid compared to the dorsal organoid. In addition, the extensive electrophysiological characterizations with a high-density microelectrode array support the more mature status of mutant interneurons.
Weaknesses:
Although a strong study overall, some weaknesses are noted. These include:
(1) The lack of validation data for the generated iPSCs and hESCs, such as the chromosomal contents, ploidy, and pluripotency states.
We thank the reviewer for their constructive feedback. We previously validated our 882 models with whole genome sequencing and teratoma formation upon mouse fat pad injection, while the parental human embryonic stem cell line (WA01 hESCs) used for P904L variant knock-in was validated by our Genome Engineering Stem Cell (GESC) core upon derivation of that variant knock-in model. We have now added both karyotyping and pluripotency staining (SOX2/OCT4) for all other hPSC lines as (new) Supplementary Figure S17 and included further description in our Methods section under “hPSC Model Generation and Culture”.
New Data: Supplemental Figure S17 (SOX2/OCT4 staining in hPSCs and karyotyping of all lines used)
Text edits: Additional language confirming hPSC line validation will be added to the Methods section under “hPSC Model Generation and Culture” on page 18.
(2) Other weaknesses relate to data interpretation and insufficient discussion of related matters, as detailed in the recommendations to the authors.
We thank the reviewer for their insightful suggestions and have detailed our responses in the “recommendations to the authors” section.
(3) Also, some errors are noted and detailed in the recommendation section.
We thank the reviewer for catching these errors and have since corrected them, with detailed responses below.
Reviewer #2 (Public review):
Summary:
Chapman, Determan et al. investigate how pathogenic mutations in DNMT3A, which cause Tatton-Brown-Rahman Syndrome (TBRS), disrupt human cortical developmental processes using a comprehensive panel of human pluripotent stem cell models spanning DNMT3A loss-of-function severity. The authors aim to identify the cellular and molecular mechanisms underlying TBRS-associated brain overgrowth and intellectual disability, and to test whether mechanistic convergence exists between TBRS and other overgrowth-intellectual disability disorders (OGIDs) caused by mutations in EZH2 (Weaver syndrome) or PIK3CA pathway components. Their central conclusion is that GABAergic interneuron development is selectively vulnerable to DNMT3A mutation, where reduced DNA methylation causes premature de-repression of neuronal and synaptic genes, driving precocious neuronal maturation and hyperactivity sufficient to disrupt neuronal network synchrony. This report adds to a growing literature supporting the vulnerability of GABAergic interneurons in NDDs and further provides a mechanistic view of this vulnerability, potentially convergent across OGIDs. The mechanistic claims around H3K27me3 compensation and mTOR-based therapeutic convergence, while promising, rest on more preliminary evidence and would benefit from the distinction between correlation and mechanism being made more explicit in the text. Overall, this is a compelling study with a rigorous experimental design and novel findings with a potential impact on a better understanding of the OGID pathophysiology.
Strengths:
(1) A major strength of this work is the breadth and rigor of the disease modeling approach. Four independent TBRS model systems are used in tandem: a patient-derived iPSC line with isogenic CRISPR-corrected control (R882H), a knock-in hESC model (P904L) with its wild-type isogenic, patient deletion iPSC lines (Del1/2), and CRISPRi knockdown models (G1/G2), collectively spanning a range of DNMT3A loss-of-function that correlates with phenotypic severity. This allelic series design substantially strengthens causal inference beyond what any single isogenic pair could provide.
(2) The multi-omic integration across matched developmental stages provides a strong mechanistic foundation for the cellular phenotyping and provides significantly enhanced novelty. RNA-seq, whole-genome bisulfite sequencing, and H3K27me3 CUT&Tag are combined in the same cell types, and timepoints show that DNMT3A loss reduces CG methylation at neuronal and synaptic gene loci, leading to premature transcriptional activation.
(3) The selective vulnerability of ventral (GABAergic) versus dorsal (glutamatergic) progenitors is one of the study's most important findings. This lineage specificity is consistently observed across all model systems and in both 2D and organoid formats, where ventral NPCs show increased proliferation, premature neuronal gene expression, and increased neurogenesis, while dorsal NPCs are largely unaffected at the transcriptomic and cellular level despite exhibiting comparable DNA methylation changes. This adds to a body of emerging work showing GABAergic interneuron vulnerability in NDDs where ubiquitously expressed genes such as chromatin modifiers are perturbed, and provides additional molecular insights into potential mechanisms of "resilience" of dorsal populations.
(4) The functional characterization follows a logical progression from single-neuron electrophysiology (demonstrating GABAergic hyperactivity with increased action potential amplitude and firing rate) to network-level analysis using high-density multi-electrode arrays. The HD-MEA experimental design - pairing TBRS or control GABAergic neurons with a constant background of control iGlut neurons - cleanly isolates GABAergic dysfunction as the driver of network hypersynchrony.
Weaknesses:
(1) The concomitant induction of proliferation and differentiation in TBRS V-NPCs is conceptually striking, since these are generally considered antagonistic developmental programs. The authors partially address this tension by noting that DNMT3A LOF alone is insufficient to initiate neuronal differentiation, i.e., V-NPCs upregulate neuronal and synaptic genes while retaining progenitor identity, implying that transcriptomic priming and commitment to differentiation are decoupled. However, the relationship between the proliferative phenotype and the epigenetic priming phenotype remains mechanistically unresolved. The manuscript documents mTOR pathway upregulation at the protein level and identifies shared DEGs that include proliferative regulators, but it does not establish whether mTOR-driven proliferation and mCG-loss-driven neuronal gene de-repression/enhanced differentiation are causally linked or represent two independent consequences of DNMT3A LOF.
We thank the reviewer for their comment and agree that this phenotype, whereby progenitors exhibited both increased proliferation and hallmarks of gene expression associated with neuronal differentiation is striking and interesting, given that these are typically antagonistic paradigms during normal development.
We documented that these phenotypes involve upregulated expression of both neuronal/synaptic and proliferative genes in V-NPCs (Figure 2d), with concomitant loss of repressive DNA methylation at regulatory elements associated with these genes (Figure 2f, Supplemental Data 5). In this work, DNMT3A mutation had a more prominent role in de-repressing neuronal and synaptic gene expression to promote hallmarks of neuron differentiation, while playing a relatively less central role in direct regulation of proliferation genes, as seen from the relative prominence of neuronal/synaptic- versus proliferation-related GO terms in our Supplemental Data 5 table.
To examine the mechanisms underlying increased V-NPC proliferation in our TBRS models, we assessed a potential relationship with the PIK3/AKT/mTOR pathway, as this is implicated in increased proliferation resulting from DNMT3A-associated mutation in myeloid leukemia (Dai et al., 2017, PMID: 28461508). In our work, DNMT3A mutation increased the expression and/or phosphorylation of mTOR signaling pathway targets specifically in V-NPCs (Figure 1q-r, Supplemental Figure S3a-d). However, while TBRS mutation directly affected repressive DNA methylation at a suite of cell proliferation-related genes, these did not include the PIK3/AKT/mTOR pathway genes themselves, suggesting an indirect relationship between altered DNA methylation and increased mTOR signaling.
Text Edits: We will incorporate further discussion of how DNMT3A-mediated gene repression and levels of PIK3/AKT/mTOR pathway signaling may be interacting, providing a framework for future studies to identify how these related OGID gene mutations may converge mechanistically.
(2) Relatedly, the rapamycin rescue experiment is a valuable proof-of-concept for the PIK3/AKT/mTOR convergence but is limited to a single dose in a single model (882) with a single readout (Ki67+ proliferation). Given the prominence of mTOR pathway convergence in the manuscript as a potential shared therapeutic avenue across OGIDs, the data supporting this claim are somewhat preliminary. It remains unknown whether mTOR inhibition rescues downstream phenotypes (neurogenesis, gene expression, neuronal maturation) or whether less severe TBRS models respond similarly. This might also help tackle the first comment above. e.g., if mTOR inhibition rescued proliferation but not the transcriptomic priming, that would support two independent mechanisms.
We thank the reviewer for their comment. We explored both the overall levels and phosphorylation of proteins involved in PIK3/AKT/mTOR signaling in the 882, 904, Del1, Del2, and KO V-NPC models (Figure 1q-r, Supplementary Figure S3a-d), finding specific increases of all proteins. We showed that rapamycin addition reversed the increased proportion of KI67+ proliferating cell nuclei resulting from 882 mutation in V-NPCs in main Figure 1s, while demonstrating that rapamycin also reduced the proportion of KI67+ nuclei observed in both less severe 904 and Del1 V-NPC models (Supplementary Figure S3e-f).
We agree that understanding whether rapamycin treatment can rescue TBRS neuronal phenotypes would be very interesting, as previous work on Tuberous Sclerosis Complex has utilized rapamycin and other mTOR inhibitors to effectively reverse TSC-related alterations of neuronal morphology and neuronal hyperexcitability (Buttermore et al., 2025, PMID: 40792287). Future studies examining convergent mechanisms and therapeutics for OGIDs should examine how similarly targeting this and related pathways rescues altered neuronal morphology, maturation, and function, as we have demonstrated that TBRS mutation has subsequent consequences for V-IN differentiation, maturation, and function. This point has been detailed in the discussion section on pages 15-16.
(3) The claim that H3K27me3 compensates for mCG loss is an important mechanistic point, but the current data do not distinguish between active compensation, in which EZH2 is recruited in response to methylation loss, and functional redundancy, in which H3K27me3 is independently established and becomes the dominant repressive mark once DNA methylation is reduced. The EZH2 knockdown/inhibition experiments show that H3K27me3 is sufficient to maintain repression at hypo-DMR sites, but they do not establish that H3K27me3 gain is itself a response to methylation loss. Because H3K27me3 profiling was performed only in the severe 882 model, it is also unclear whether H3K27me3 gain scales with DNMT3A LOF severity, as a compensatory model would predict. Finally, the EZH2 overexpression rescue is performed in V-NPCs, whereas the compensation model is developed primarily in D-NPCs, making it difficult to assess whether the same mechanism operates in the lineage where it was originally inferred.
We thank the reviewer for the opportunity to clarify our findings and experimental reasoning. A previous study using a conditional Dnmt3a knockout mouse model (Li et al., 2022, PMID: 35604009) demonstrated increased expression of multiple PRC2 components following the loss of Dnmt3a. This study demonstrated that sites which lost DNA methylation gained H3K27me3 in postnatal neurons upon Dnmt3a loss. Therefore, we hypothesize that the gain of H3K27me3 likely occurs in response to loss of DNMT3A methylation.
While we did not perform CUT&Tag for H3K27me3 in our less severe models, we did validate gene expression changes following EZH2 knockdown and inhibition in both the R882H (Figure 4g-h) and P904L (Supplementary Figure S8b) models, finding that gene expression was unchanged in the model with the less severe DNMT3A mutation (P904L). Based upon these findings, we hypothesized that compensatory H3K27me3 may occur only upon severe DNMT3A loss, as seen in the dominant-negative R882H model. Furthermore, as H3K27me3 compensation was more prominent in D-NPCs, we hypothesized that this might be sufficient to prevent de-repression and aberrant neuronal gene repression upon loss of DNMT3A-mediated repression in D-NPCs. However, since TBRS mutation caused the most prominent de-repression of neuronal gene expression in V-NPCs, we also tested whether EZH2 overexpression could reverse this, finding that it partially suppressed this dysregulated neuronal gene expression. To better clarify this logic and the findings, we will make text edits to this results section.
Text edits: We will clarify the reasoning for performing the EZH2 overexpression experiments in V-NPCs and reference Li et al., 2022 in both the results (pg. 9-10) and discussion.
(4) The narrative framing of dorsal neuron development as unaffected by DNMT3A LOF is somewhat at odds with the data presented. The 882 D-NPCs show substantial DNA methylation changes, and TBRS D-INs exhibit what the authors describe as "substantive transcriptomic differences" involving persistent expression of pluripotency and progenitor genes, which seems to be a distinct but potentially significant phenotype. The impact of DNMT3A loss between ventral and dorsal lineages might be more accurately framed as divergent in nature rather than specific to a certain population.
We thank the reviewer for their comment. While TBRS mutations appear to have a significantly stronger effect on V-NPCs and subsequently V-INs, both transcriptomic and methylation alterations do also occur upon TBRS mutation in D-NPCs and D-INs, as noted in Supplemental Figure S4d, S11, and Supplemental Data 2. However, we observed substantially greater molecular alterations in V-NPCs/V-INs, a lack of overt cellular phenotypes in D-NPCs where assayed, and a lack of functional consequences in matured D-INs, suggesting a more significant requirement for DNMT3A in regulating the differentiation and subsequent maturation of cortical inhibitory interneurons during embryonic and early pre-natal development, the developmental periods that we can readily model in hPSC-derived neurons.
It should also be noted that these hPSC differentiation models do not recapitulate post-natal deposition of non-CpG (mCA) DNA methylation, a mechanism disrupted postnatally by TBRS-associated mutations in our prior work in murine models (Harrison Gabel; e.g. Beard et al., 2023, PMID: 37952155). Therefore, we hypothesize that if we could sufficiently mature D-INs to a state that modeled postnatal development and recapitulated this non-CpG methylation, we might be able to detect cellular and functional phenotypes in later stage D-INs. To avoid misinterpretation, we will alter the language in the results section to confirm that there are both transcriptomic and methylation changes in our D-NPCs/D-INs, but that these are not accompanied by cellular phenotypes or neuronal dysfunction.
Text edits: We will better clarify that there are transcriptomic and methylation changes in D-NPCs/D-INs, but that these changes are minimal compared to those in V-NPCs/V-INs, as supported by the lack of cellular and functional phenotypes seen in D-NPCs/D-INs.
(5) SST stainings are not entirely convincing. They appear mostly nuclear, and some instances localized to rosettes in organoids, whereas the protein is largely confined to processes and is expected to be found outside progenitor-rich zones like rosettes.
We agree that the perinuclear SST staining detected in these young ventral telencephalic-patterned organoids at day 30 differs somewhat from the more process-localized and cytosolic signal seen in later stage organoids in other studies. This may be related to the use of different commercial SST antibodies across studies but also likely reflects SST immunoreactivity in newborn neurons near the onset of SST expression. For example, immature SST-immunoreactive neurons in the early postnatal rat cortex exhibit predominant SST staining in perinuclear cytoplasm and short processes (e.g. Fig. 3 in Lee et al, PMID: 9664223) while acquiring more cytosolic and process-localized staining as postnatal neuron maturation occurs. Evaluation of immunopositivity for other markers of neurogenesis (ASCL1) and immature neurons (TUJ1) is also congruent with these findings for SST, with TBRS-associated mutations increasing in the fraction of cells in V-NPCs/V-ORGs that express these three markers.
Reviewer #3 (Public review):
Summary:
In this manuscript, the authors investigated TBRS etiology by using new human pluripotent stem cell models, modeling varying levels of TBRS-associated loss of DNMT3A function. They identified increased lineage-specific proliferation of precursors in TBRS ventral MGE-like progenitors, which they propose was related to increased signaling through the PIK3/AKT/mTOR pathway. Furthermore, they show that reduced DNA methylation during MGE-like progenitor differentiation into GABAergic interneurons can cause a premature expression of neuronal and synaptic genes, triggering precocious neuronal maturation. In conclusion, they propose that TBRS-derived GABAergic neurons exhibit hyperactivity that can alters the development and structure of neuronal networks.
Strengths:
Overall, the data presented is convincing, from an early developmental point of view, given that the iPSC-derived 2D cultures or organoids used do not get to reach a mature state. Nonetheless, the data clearly show the effects that deleterious mutations in TBRS can cause during the period of neurogenesis, which was missing in the field.
Weaknesses:
(1) Li et al., 2022 (referred to in the manuscript) seems to already show the interplay between H3K27me3 and Dnmt3a discussed in this study i.e., that in the absence of DNA methylation, there is an expansion of polycomb-like repression. These data should be better acknowledged in the paragraph 'Repressive H3K27me3 compensates for severe loss of DNA methylation' (page 9), given it supports the data presented in this manuscript and suggests this as a common mechanism in the interplay between these two repressive marks, as it is well established in the literature.
We thank the reviewer for this suggestion and will incorporate this reference into both the results and the discussion when discussing the respective roles of DNMT3A and PCR2-mediated repression.
Text edits: We will add Li et al., 2022 to both the results section (pg. 9-10) and our discussion section.
(2) The authors should acknowledge that the omics data come from a mixed population of cells.
We thank the reviewer for their comment. We have validated that the established 2-D differentiation methods we used in this study generate cell populations with >85-90% enrichment for the desired progenitor and neuronal cell type, based upon marker expression, but acknowledge that these are bulk -omics data obtained from cells that may represent a mixed population and have now detailed this in the methods section under “Sequencing”.
Text edits: we will add language acknowledging that our omics data (bulk) was generated from mixed populations of cells.
(3) The authors are encouraged to further discuss whether the overgrowth observed in ventral GABAergic cultures or organoids compares to the overgrowth observed in diseased patients. One expects MRIs to have been performed in patients and that these could be harnessed to discern if overgrowth occurs in the cortex or ventral regions of the brain.
We thank the reviewer for their suggestion and do note that at least one published study documents increased cortical thickness in the MRIs of TBRS patients (Jiménez de la Peña et al., 2024, PMID: 37795572); however, to our knowledge studies have not examined regional or cell type-selective overgrowth of cortical tissue in TBRS patients. Future clinical studies examining the nature of the neuronal progenitor overgrowth and resulting consequences for patient brain imaging would be of interest to better understand TBRS-associated etiology of brain overgrowth and its manifestations.
Author response:
[Editors' note: The authors included an author response to reviews from another journal]
Reviewer #1 (Comments to the Authors):
In this manuscript the authors describe that cells in collective movements adopt a superdiffusive behavior to out pace individual cells. This behavior is regulated by cell-cell junctional stability and force transmission. The authors state that speed is regulated by vinculin through mechanosensitivity.
While is makes intuitive sense that cells may move more efficiently collectively as it reduces their exploratory space and therefore increases their efficiency of movement,
We agree that this is an intuitive explanation. However, previous literature had shown that confluent cells may or may not migrate depending on conditions that do not solely depend on the space available per cell, but also involve the intrinsic activity of the cell, its cortical tension, and its adhesion with its neighbors, with sometimes counterintuitive effects (doi: 10.1016/J.CEB.2021.07.011). This was the reason that motivated us to investigate how these various ingredients affected space exploration efficiency on different time scales.
Our results indeed refute the intuition that cells move more efficiently when their exploratory space is reduced by showing that the outcome depends on the time scale considered (Fig. S3B). Specifically, on short time scales (less than 3 hours), the area explored by individual MDCK cells is larger than that explored by MDCK cells at confluence. On a longer time scale (greater than 3 hours), however, the area explored by confluent MDCK cells is larger. This switch is a direct consequence of the change in migratory behavior from persistent random walk to superdiffusion, Moreover, its position in time depends on the cell line: extrapolation of our results on RPE-1 cells suggests that it should theoretically occur after approximately 300hrs, if this time scale was experimentally accessible (Fig. S3F).
…the role of junctions specifically is less clear.
We are sorry that we were not able to clearly convey the roles of junctions. We have substantially rewritten our text to address this and all the changes are highlighted in orange. As summarized in Fig. 6F, junctions have three roles. The first role is on persistence, through velocity coordination between neighbors, the second is on speed, through the stability of junctions, and the third role is on directionality, through the sensitivity of the monolayer to the wound edge.
The first role is evidenced thanks to the comparison of the MSD between single cell and confluent migration assays and the use of the alpha-catenin KD cell line. Alpha-catenin depletion is known to be the most potent disruptor of adherens junctions (DOI:10.1091/mbc.e06-05-0471, , DOI:10.1126/science.aaf7119, (DOI:10.1073/pnas.1002662107, DOI:10.1073/pnas.1119313109), and we show that it significantly alters the superdiffusive behavior that emerges in the confluent migration assay (Fig. 3E,F, 5C). Therefore, junction integrity is critical for the control of cell persistence.
Moreover, alpha-catenin depletion induces a loss of velocity coordination between neighbors (Fig. S3E), which we show through numerical simulations to induce superdiffusion (Fig. 3G). By contrast, E-cadherin KO and vinculin mutants have no effect on the superdiffusion of confluent cells (Fig. 3E, 4A). Therefore, the critical molecular ingredient is the link provided by alpha-catenin to the cytoskeleton that provides junction integrity.
The second role of junctions is evidenced thanks to the comparison of cell speeds between single and confluent migration assays with the vinculin mutants (Fig. S4A). Results show that cell speed is reduced of about 10µm/h by confluence, regardless of the mutant except for YE, whose only difference with other mutants is its lower stability (Fig. 4F). This supports that junction stability, and not the other effects of mutants, controls cell speed (we provide a detailed demonstration in the response to the following question). As expected, junction integrity is required as well, as seen from the higher cell speed of the alpha-catenin KD cell line compared to WT (first MSD point in Fig. 3B, E).
The third role of junctions is evidenced thanks to the comparison between confluent and directed migration assays (Fig. 6A). Results show that the wound healing rate is proportional to cell speed at confluence, regardless of the mutant except for YE, which displays no tension gradient in junctions from front to back cells (Fig. 6C). This supports that such gradient is required for cells to identify on which side is the wound edge. As expected, junction integrity is required as well, as seen from the loss of directional bias of the alpha-catenin KD cell line (Fig. 5F).
The authors chose vinculin as the basis by which to manipulate tensions at cell-cell junctions, but this comes with considerable drawbacks. Namely, since vinculin appears at both cell-cell and cell-matrix junctions, its role and the role of its mutations is not clear here. The authors state that the collective migration speed is related to junctional stability, but because vinculin is also at FA, how can this be concluded?
We apologize for the lack of clarity. We hope that the highlighted changes in the revised manuscript will improve this point. As exemplified above, comparing cell migration between isolated cells and confluent cells is essential to enable us to distinguish between the contributions of AJs and FAs. Indeed, since isolated cells lack AJs, the impact of vinculin mutants on single cell migration can only be explained by their effects on FAs. This is how we first determine the effects of vinculin mutants on migration that depend on FAs. Because confluent cells also have FAs, we expect that the effects of vinculin mutants on the migration of isolated cells will still be present in confluent cells, to which will be added the effects of these mutants on AJs and their consequences on migration, if any.
Therefore, when compared to WT cells, if a given mutant decreases or increases migration speed in individual cells, and does so in confluent cells in the same proportion, then its effects at confluence can be entirely explained by its effects in individual cells, and there are no additional effects of that mutant from AJs. This is indeed what we observe for all mutants except the YE mutant (Fig. S4C), leading us to conclude that none of the vinculin mutants, except the YE mutant, have an effect on migration at confluence that results from AJs. In contrast, the YE mutant has effects on migration at confluence that cannot be explained by its effect on individual cell migration. Therefore, the effects of YE at confluence depend on AJs, whether they result from alterations in AJs, FAs, or both. To distinguish between these scenarios, we proceed by elimination, comparing the effects of YE to those of other mutants on force transmission and adhesion stability, and how these two factors associate with migration speed, as explained below. In FAs, YE alters force transmission differently in individual cells and at confluence, but we already know from Fig. 2 that force transmission in FAs cannot alone explain the speed of migration. This result rules out an indirect effect of AJs on cell migration at confluence through FAs. Furthermore, in AJs, YE affects stability and force transmission, but TL has the same effect on force transmission as YE and we already know that none of the effects of TL on migration depend on AJs (Fig. 3, S4C). This result rules out an effect of force transmission in AJs on migration speed at confluence. We conclude that stability at the AJ level, which is the remaining property specifically impaired by YE, is what regulates migration speed at confluence.
The manuscript's logic and flow are not clear in some places, making the story hard to follow. As one example, the FRAP data, which the authors suggest is used to investigate vinculin's combined role does not help in this capacity as the interpretation and its connection to the bigger story are not clear.
We are sorry again for the lack of clarity. We used FRAP data to evaluate the effects of vinculin mutants on adhesion stability. Indeed, mutants have different effects on adhesion stability (Fig. 2E, 4F). In addition, they also have different effects on force transmission (Fig. 2D, 4D,E). The partial overlap in functional alterations caused by the mutants allows us to test the involvement of the overlapping function (here stability) in the overall migration outcome. For example, if two mutants have a similar effect on adhesion stability but different effects on migration speed (such as TL and T12), we can then rule out that speed results from adhesion stability. Similarly, if two mutants have different effects on stability but a similar effect on speed (such as TL and YE), we can also rule out that speed results from stability. We applied the same reasoning to force transmission to conclude that neither adhesion stability nor force transmission alone is sufficient for cells to migrate rapidly. However, the combination of the two enables rapid migration.
As another example, the information derived from the use of the mutants is not clear in the context of the message in the manuscript since they affect cell-cell and cell-matrix junctions and in some places show results that are counter intuitive and not well-explained, to which the authors admit they are surprising but then do not explain their meaning.
As such, it is very hard to follow the logic with regard to the information resulting from the mutant experiments.
We provide above a detailed break-down of our strategy to analyze the results. We regret that our manuscript did not adequately convey our conclusions and we hope that the new version of the manuscript improves this point.
Proliferation has been shown to play a role in wound healing. Does proliferation change in the various conditions?
This is an important point. The average speed of cells at confluence is approximately 20 µm/h (Fig. 4B), which means that each cell moves approximately its own size in one hour. During this time, assuming a 16-hour cell cycle, 6% of the cells would have divided, each of them likely pushing one of its neighbors a distance equivalent to the size of a cell. Therefore, cell proliferation accounts for at most a few percent of the total cell movement. For this reason, we can assume that growth does not account for a large part of the movement we observe. This is consistent with previous work showing that proliferation does not contribute significantly to wound healing (DOI: 10.1073/pnas.0705062104, DOI: 10.1083/jcb.201207148).
Minor comments:
The authors should provide a better description of the mutants: what does a tailless mutant not bind, or bind differently? More context is needed to help interpret the results. While the mutants have all been published on before, it would be helpful to have more information here so that the manuscript is easier to follow.
We are sorry that the information we provided was insufficient. We have now detailed the mutations to help the reader understand how interactions are altered.
Figure 1A is not necessary. Figure 1 overall is fairly predictable as there have been many papers using the persistent random walk as the best model to single cell migration (dating back to the early 1990's). The authors define a new term, angular memory, which they show decreases with increasing delta t as one would predict.
We acknowledge that persistent random walks have already been observed for individual cells, as in references 3-4 cited in the introduction. Nevertheless, we believe that Figure 1 is important because not all cells migrate as persistent random walkers when isolated. Some migrate in a more exotic manner, resulting in superdiffusive behavior, as in references 5-8 cited in the introduction. Since we observe superdiffusive behavior at confluence (Figure 2), it was therefore necessary to show whether or not single cells were superdiffusive too. We also use this figure to introduce angular memory, a measure that, to our knowledge, has never been used before. According to intuition, it decreases to 0 for persistent random walkers, just as another resembling measure, velocity autocorrelation, would do. However, the angular memory of fractional Brownian walkers does not vanish with increasing delta t (Fig. 3D), while velocity correlation would, just as that of persistent random walkers. This difference makes angular memory much more appropriate for distinguishing between the two migration behaviors, and prompted us to introduce it in the first figure as a reference.
In the wound healing assay, which cells were measured? Leading edge or interior, and does it matter?
Figure 5A shows that cells behave differently depending on their distance from the wound. This is because the traces shown correspond to the first few hours of the movie, during which the cells at the front begin to move first. Figure S5A shows the speed of the cells over time after the wound and indicates that the cells reach a stable speed after approximately 3 to 4 hours. Figure S5B shows the speed of the cells as a function of distance from the wound at steady state. These results show that the speed of the cells no longer depends on the distance from the wound at this stage. As indicated in the “Materials and Methods” section, we only considered time points beyond this stage for subsequent analyses of population-averaged MSD and velocity presented in Figure 5, so the location of cells at the front or rear was irrelevant.
Reviewer #2 (Comments to the Authors):
To migrate cells must spatially explore their environments, a process that is guided by intrinsic signals (adhesive and mechanical properties, etc) and extrinsic (gradient cues) signals. This exploration can occur on the single or multicellular level. In this study, the authors examine the effect of cell-cell interactions, guidance cues, and cell mechanics in the exploratory capacity of MDCK cells. The authors show that cell-cell adhesion provides a "infinite directional memory for migration" and cell speed is dependent upon the focal adhesion stability, cell mechanics, and the mobility of adherens junctions-these processes are modulated by vinculin.
My three major concerns with the manuscript are as follows:
(1) While there is potential new information about the role cell-cell junctions and guidance cues play in cell migration, there is not enough NEW insight presented. Rather the role of vinculin in these processes is expected given what is already known about its ability to control focal adhesion stability, mechanics, and adherens junctions.
We agree that our cell migration results make sense based on the effects of vinculin mutants on the stability and force transmission of adhesions. Nevertheless, we argue that this was not the only possible scenario. Indeed, we find that none of the effects of vinculin mutants on AJs (except YE) have an impact on cell migration (Fig. S4C). One might have expected that the increased stability provided by the TL and T12 mutants would reduce the speed of collective cell migration, just as the YE mutant increased cell speed due to its altered stability. This is not what we found, and this reveals a nonlinear relationship between AJ stability and migration speed that could be investigated more thoroughly in future studies. Another example is that the effects of the mutants on force transmission in AJs do not impact migration speed at confluence but do impact directed collective migration (Fig. 6). One might have expected that vinculin-mediated force transmission in AJs would impact collective migration, whether directed or not.
More importantly, we show that the role of intercellular adhesion in cell migration is more complex than expected. Indeed, it depends on the timescale considered: intercellular adhesion is detrimental to short-term spatial exploration and beneficial in the long term (Fig. S3B). Such a timescale-dependent behavior is impossible to predict from previously known effects of the mutants or other molecular considerations. Furthermore, we show that this behavior can be fully explained by the coordination of velocities between neighbors, which depends on intact connections between AJs and the cytoskeleton via alpha-catenin, but is independent of vinculin mutants that connect AJs to the cytoskeleton in parallel with alpha-catenin. One might have expected these connections to also have an impact on velocity coordination, and thus on spatial exploration, but we show that this is not the case (Fig. 3). Finally, we show that directed collective migration has a negligible impact on cell exploration at our experimental timescale (Fig. 5), whereas we initially expected the wound to make migration more ballistic. This reveals that such a directional signal affects spatial exploration at much longer timescales than expected.
Overall, our results quantify the outcome of competing effects and provide timescales at which one effect outweighs the other in influencing cell migration. We believe this is an original approach that provides substantial new insights into collective cell migration.
(2) The phenotypes of the cells expressing the mutant vinculins varying greatly. These phenotypes are not addressed despite the fact that they could potentially complicate the analyses. For example, there are dramatic differences between focal adhesion numbers and sizes in the cells expressing the different vinculin mutants; cell spreading is also dramatically altered. Likewise, the T12 mutant vinculin has previously been reported to have increased adhesive strength, increased traction forces, and cell spreading. How does this knowledge change the interpretation?
We agree that vinculin mutants may have effects on the size and number of FAs, cell spreading, and traction forces that we do not examine here. These consequences can be explained by the effects of these mutants on force transmission in FAs and on their stability, which we report in our work. They do not affect our interpretations. Here, we provide a predictive model of migration speed based on the combination of two consequences of vinculin function, namely stability and force transmission. An interesting avenue for future research would be to assess whether these combinations can be reduced to a single higherlevel effect of vinculin on the cellular phenotype that would be sufficient to predict migration speed. This work remains to be done, as neither FA size and number, cell spreading, adhesion force, nor traction forces alone are sufficient to predict migration speed.
Along the same lines, it has previously been established that tagged version of vinculin do not efficiently integrate into adherens junctions. Published work from the Nelson laboratory suggests that GFP-vinculins do not localize to cell-cell junctions and work from other laboratories suggests localization occurs only when the endogenous vinculin is silenced.
We are aware that some GFP-vinculin constructs may not localize as well as the endogenous protein at AJs. This is due to the localization of the GFP tag on the head of vinculin and depends on the length of the linker between GFP and the head of vinculin. The longer the linker, the easier the interaction with AJ partners. Unlike these constructs, the vinculinTSMod sensors we use in our work do not carry a GFP on the head and do not suffer from the same limitations.
Furthermore, vinculin recruitment to AJs depends on force, with little or no recruitment when tension on the AJs is relaxed (DOI: 10.1038/ncb2055). Vinculin recruitment has in fact already been used as an indicator of AJ tension in Drosophila (DOI: 10.1038/s41467-01807448-8). Consequently, the amount of vinculin visible at the AJs varies depending on the tension exerted on the AJs, which our results confirm: vinculin is more difficult to detect at the AJs in cells located at the front of a wound than in those located at the back (Fig. 6B), which is consistent with the difference in vinculin tension between front and back cells (Fig. 6C) and to the E-cadherin tension gradient between front and back cells (DOI: 10.1083/jcb.201706013). Overall, these results show that vinculin is not always easy to detect at AJs, but this is due to the properties of vinculin, which the constructs we use reproduce better than previous constructs (see also below).
The images in figure S2 and the prebleach images in figure S4 do not show convincing localization of the mutant vinculins to cell-cell adhesions. This is of special concern given that YE mutant protein hardly has any discernable localization to cell-cell junctions; additionally, none of the mutant proteins were tested for their ability to co-localize with adherens junction components. This raises the question if the parameters being examined and the conclusions drawn from them are affected by a difference in localization.
We agree that the recruitment of vinculin at intercellular contacts may be difficult to see.
Besides force-dependent effects mentioned above, other factors are involved. The images shown in Figures S2 and S4 are from live cells in which cytoplasmic vinculin is still present, and its level proportional to the mobility of vinculin. Indeed, the TL and T12 mutants show a more marked contrast between intercellular contacts and the cytoplasm, which is consistent with their greater stability at AJs (Fig. 4F). Conversely, YE shows lower contrast, which is consistent with the lower stability of this construct at AJs (Fig. 4F). The FL construct lies between the two. As a result, the cytoplasmic content can variably mask vinculin recruitment at the AJs depending on the mutant.
We have now performed additional quantifications of mutant recruitment at intercellular contacts as a function of distance from the basal surface of the cells and relative to their recruitment in FAs, in live cells. Results are shown in the new Fig. S4F. We find that all the constructs are recruited to intercellular contacts with a density that is at most half of that in FAs and that varies along the height. FL shows the highest density, localized more apically, consistent with the localization of an AJ-bound actin belt. The mutants appear to be more homogenously distributed along the height of the lateral surface, which may be explained by their impaired autoinhibition (TL, T12), or mechanosensitivity (YE). This variability also contributes to the difficulty in seeing vinculin recruitment in all cells in a single z-slice.
To confirm the proper recruitment of vinculin constructs to AJs we have performed immunofluorescence against alpha-catenin and phalloidin on each of the stable cell lines. Results are shown in the new Fig. S4D and E. In these experiments, cell permeabilization allows for the release of some of the cytoplasmic pool of vinculin, which highlights the recruitment of all vinculin constructs to intercellular contacts. There, all vinculin constructs colocalize with alpha-catenin and F-actin, as expected. Additionally, images displayed are maximum intensity projections to mitigate recruitment variability along the height.
Overall, our results clearly support the localization of vinculin at intercellular contacts, and the differences between the constructs are consistent with the effects of their mutations.
(3) There is a lack of new mechanistic insight. Conclusions are made about a role of vinculin dimerization. This conclusion appears to be based upon the usage of the mutant version of vinculin Y1065. Did the authors directly measure the ability of this mutant protein to dimerize? Is actin binding also affected.
The binding properties of the Y1065E mutant, including its dimerization and binding to actin, have already been characterized by other researchers (ref. 40 in our manuscript, as well as DOI:10.1111/j.1432-1033. 1997.01136.x or DOI: 10.1016/j.febslet.2013.02.042). We assumed that these properties are now well established and can be used to explain higher-level phenotypes that we show for the first time, to our knowledge.
Reviewer #3 (Comments to the Authors):
Canever et al. tracked two epithelial cell lines on collagen coated glass and showed that isolated cells (non confluent) move as persistent random walkers, whereas confluent monolayers migrate super diffusive, with long range directional memory. By systematically perturbing adhesion machinery they found that focal adhesion mutations mainly tune the speed of single cell tracks, but cannot create long range memory, while force bearing adherens junctions are essential for the super diffusive regime-genetically perturbing them collapses collective memory. These interesting results identify junctional tension as important to switch epithelial cells/sheets between individual and collective search modes - an important quantitative insight that is of clear relevance to cell biologists.
- The presented data is nicely quantitative and convincing, but I have subtle concerns about the generality of the findings. While the authors show that the differential behavior, they describe is not cell-line specific (MDCK, RPE), there are no experiments evaluating the generality of their conclusions across different matrix conditions. How are the measured migration parameters affected by matrix stiffness? Cell migration on collagen coated glass coverslips is a relatively narrow and artificial condition. How is the collective directional memory expected to behave on softer substrates? The generality of the conclusions could be strengthened by repeating measurements using hydrogels of varying stiffness. Further, it should be discussed to which tissues in the body the selected matrix conditions and migration modes plausibly apply.
We agree that the generality of our results and the relevance of glass-rigid substrates is an important point. In vivo, epithelial cells rest on a basement membrane with a typical stiffness of approximately 10 MPa, as demonstrated by experimental evaluations on various tissue explants, including renal glomeruli and Bruch's membrane, which are relevant to MDCK and RPE-1 cells (DOI: 10.1111/j.1742-4658.2007.05823.x, DOI: 10.1172/JCI106898, DOI:10.1038/eye.1987.35), we have added these references in the manuscript to support our experimental strategy. In vitro, the most significant effects of substrate stiffness on FAs and cell migration generally occur at much lower stiffnesses, between 0.2 and 100 kPa, and cell phenotypes generally plateau at levels comparable to those observed on glass, even below 100 kPa (DOI: 10.1242/jcs.133645, DOI: 10.1038/ncb3268, DOI:10.1039/c5ib00307e, DOI: 10.1039/c9sm01893j). Furthermore, substrate stiffness has much more moderate effects on confluent cells than on isolated cells. For example, it has been previously demonstrated that confluent layers of MCF10A epithelium showed no change in velocity coordination in the range of 3 to 65 kPa (DOI: 10.1083/jcb.201207148). Therefore, collagen-coated glass appears to be a reasonable model for the basement membrane. Overall, we believe that we have conducted our experiments under physiological conditions, and that our results apply to a wide range of substrate stiffnesses.
- It would be nice to see how long it takes confluent cell layers to close rectangular wounds of defined size when cells migrate as individual (adherens junctions perturbation) versus collective (wt) (on substrates of different stiffness). Presumably, there should be faster wound closure under the collective regime, at least for simple shaped wounds.
This is an interesting question, which our results indirectly address. In our study, we measured the wound healing speed of the WT MDCK cell line as well as lines expressing mutant vinculin constructs (Fig. 6A). These results show that this speed ranges from 5 to 15 µm/h depending on the construct expressed (and for reasons that we explain in the manuscript). These values make it easy to estimate the time required to close a wound based on its width. For example, it would take 5 hours to close a 100 µm wide wound for the WT cell line, which has a rate of 10 µm/h (on both sides of the wound).
Wound closure for cells with disrupted adhesive junctions has already been documented (DOI: 10.1083/jcb.200910041). The results show that wound closure is indeed slower than with WT cells. Although this previous study does not reveal the underlying causes, our work now shows that there are two factors: weaker directional memory due to impaired intercellular coordination and, in the longer term, an additional lack of sensitivity to the guidance signal provided by the wound.
- Akin to substrate stiffness variation, I am missing experiments that test the effect of cytoskeletal tension on these migration modes. Experiments with Rho kinase or myosin inhibitors could meaningfully broaden the scope of this study.
Rho kinase or myosin inhibitors applied to cells during the time required to assess migration patterns (a movie recorded overnight is necessary to obtain a statistically reliable calculation of MSD over 3 to 4 hours) are likely to affect many other cellular processes in addition to the cytoskeletal tension directly involved in migration. We believe that the accumulation of these effects will make interpretation of the results very difficult. For example, it has been shown that inhibition of ROCK by Y27 promotes healing of corneal endothelial lesions by affecting proliferation through cyclin D and p27 (DOI: 10.1167/iovs.13-12225), or by improving respiration, which would provide the energy necessary for migration (DOI: 10.1096/fj.202101442RR). Consistently, another study on HaCaT epidermal cells confirms that myosin phosphatase accelerates wound healing through proliferation (DOI: 10.1016/j.bbadis.2018.07.013). In contrast, in HUVEC cells, ROCK inhibition significantly impaired the proliferation and migration of vascular endothelial cells in vitro in a dose-dependent manner (DOI: 10.1097/ICO.0000000000000493).
Furthermore, previous studies have highlighted that differential contractility at the subcellular level is important for collective migration (DOI: 10.1038/ncb2133, DOI: 10.1083/jcb.201706013), which is not possible to examine with global activation or inhibition of contractility. This prompts the development of more refined and specific measurement and disruption strategies to assess the respective impact of cytoskeletal tension on cell-cell and cell-matrix adhesion mechanisms. Our work, which uses biosensors to assess how this tension differentially affects cell-cell and cell-matrix adhesions, is a step in this direction. The localized spatio-temporal activation or inhibition of myosin subtypes or Rho GTPase regulators specific to these adhesion structures will likely answer these questions in the future, but we believe that the development and application of these approaches will require a substantial amount of work that goes beyond the scope of our study.
Wear a Library Student Worker tag while working. You'll appear more professional and it will set you apart from student patrons.
Take this out - we don't have worker tags on the 3rd floor anymore
Wear a Library Student Worker tag while working. You'll appear more professional and it will set you apart from student patrons. Please don't wear brimmed hats or sunglasses as they can impede eye contact.
This is not RMC policy but we can discuss.
Cotton from BCI farms may be mixed with conventional cotton along the way, that's why we can't put a BCI-tag on our clothes.
This statement raises transparency issues because consumers may assume the cotton products are fully sustainable, even though the material can still be mixed with conventional cotton. Companies should clearly explain the limitations of sustainability claims to avoid confusion and misleading marketing.
Wenn Sie den Arzt, der Sie während der Geburt betreuen soll, gerne vorher kennen möchten und Ihnen die Wolfartklinik in Gräfelfing gut gefällt, dann steht ihnen Herr PD Dr. Raab jederzeit bei Tag oder Nacht zur Verfügung.
Streichen
find that we can split the users into a small group of power users who do the majority of the contributions, and a very large group of lurkers who contribute little to nothing. Fo
I find it interesting how we use the terms power users and lurkers for crowdsourcing sectors specfically. When raising money, you would think that you would not want to tag any donor, of any kind, of any donation, with any negative label. The term lurker makes it seem like a negative term to the person who is a lurker- like someone who didn't do all that they could to support. Meanwhile power users have that positive connotation, which makes sense, but its the dicotomy between the two labels that I find interesting. Not all donors are equal, but any donor is surely one you would want to tag with a good label? I understand for social media posts etc, this concept changes, but for crowdsourcing specifically I find this interesting.
Popular products in Wireless internationally
A signal phrase, also known as an attributive tag, is a device used to smoothly integrate quotations and paraphrases into your essay. It is important to use signal phrases to clearly attribute supporting evidence to its author or authors and to avoid interrupting the flow of an essay. Signal phrases can also be used as meaningful transitions, moving your readers between your ideas and those of your sources.
The use of signal phrases is often taught merely as citation tools, ignoring their role in creating a cohesive writing structure. These examples demonstrate how signal phrases can enhance the flow and readability of academic writing.
Author response:
Reviewer #1 (Evidence, reproducibility and clarity):
Summary:
This manuscript reports the identification of putative orthologues of mitochondrial contact site and cristae organizing system (MICOS) proteins in Plasmodium falciparum - an organism that unusually shows an acristate mitochondrion during the asexual part of its life cycle and then this develops cristae as it enters the sexual stage of its life cycle and beyond into the mosquito. The authors identify PfMIC60 and PfMIC19 as putative members and study these in detail. The authors at HA tags to both proteins and look for timing of expression during the parasite life cycle and attempt (unsuccessfully) to localise them within the parasite. They also genetically deleted both gene singly and in parallel and phenotyped the effect on parasite development. They show that both proteins are expressed in gametocytes and not asexuals, suggesting they are present at the same time as cristae development. They also show that the proteins are dispensible for the entire parasite life cycle investigated (asexuals through to sporozoites), however there is some reduction in mosquito transmission. Using EM techniques they show that the morphology of gametocyte mitochondria is abnormal in the knockout lines, although there is great variation.
Major comments:
The manuscript is interesting and is an intriguing use of a well studied organism of medical importance to answer fundamental biological questions. My main comments are that there should be greater detail in areas around methodology and statistical tests used. Also, the mosquito transmission assays (which are notoriously difficult to perform) show substantial variation between replicates and the statistical tests and data presentation are not clear enough to conclude the reduction in transmission that is claimed. Perhaps this could be improved with clearer text?
We would like to thank the reviewer for taking the time to review our manuscript. We are happy to hear the reviewer thinks the manuscript is interesting and thank the reviewer for their constructive feedback.
To clarify the statistical analyses used, we included a new supplementary dataset with all statistical analyses and p-values indicated per graph. Furthermore, figure legends now include the information on the exact statistical test used in each case.
Regarding mosquito experiments, while we indeed reported a reduction in transmission and oocysts numbers, we are aware that this effect might be due to the high variability in mosquito feeding assays. To highlight this point, we deleted the sentence “with the transmission reduction of [numbers]….” and we included the sentence “The high variability encountered in the standard membrane feeding assays, though, partially obstructs a clear conclusion on the biological relevance of the observed reduction in oocyst numbers“
More specific comments to address:
Line 101/Fig1E (and figure legend) - What is this heatmap showing. It would be helpful to have a sentence or two linking it to a specific methodology. I could not find details in the M+M section and "specialized, high molecular mass gels" does not adequately explain what experiments were performed. The reference to Supplementary Information 1 also did not provide information.
We added the information “high molecular mass gels with lower acrylamide percentage” to clarify methodology in the text. Furthermore, we extended the figure legend to include all relevant information. Further experimental details can be found in the study cited in this context, where the dataset originates from (Evers et al., 2021).
Line 115 and Supplementary Figure 2C + D - The main text says that the transgenic parasites contained a mitochondrially localized mScarlet for visualization and localization, but in the supplementary figure 2 it shows mitotracker labelling rather than mScarlet. This is very confusing. The figure legend also mentions both mScarlet and MitoTracker. I assume that mScarlet was used to view in regular IFAs (Fig S2C) and the MitoTracker was used for the expansion microscopy (Fig S2D)?
Please clarify.
We thank the reviewer for pointing this out – this was indeed incorrectly annotated. We used the endogenous mito-mScarlet signal in IFA and mitoTracker in U-ExM. The figure annotation has now been corrected.
Figure 2C - what is the statistical test being used (the methods say "Mean oocysts per midgut and statistical significance were calculated using a generalized linear mixed effect model with a random experiment effect under a negative binomial distribution." but what test is this?)?
The statistic test is now included in the material and method section with the sentence “The fitted model was used to obtain estimated means and contrasts and were evaluated using Wald Statistics”. The test is now also mentioned in the figure legend.
Also the choice of a log10 scale for oocyst intensity is an unusual choice - how are the mosquitoes with 0 oocysts being represented on this graph? It looks like they are being plotted at 10^-1 (which would be 0.1 oocysts in a mosquito which would be impossible).
As the data spans three orders of magnitude with low values being biologically meaningful, we decided that a log scale would best facilitate readability of the graph. As the 0 values are also important to show, we went with a standard approach to handle 0s in log transformed data and substituted the 0s with a small value (0.001). We apologize for not mentioning this transformation in the manuscript. To make this transformation transparent, we added a break at the lower end of the log-scaled y-axis and relabelled the lowest tick as ‘0’. This ensures that mosquitoes with zero oocysts are shown along the x-axis without being assigned an artificial value on the log scale. We would furthermore like to highlight that for statistics we used the true value 0 and not 0.001.
Figure 2D - it is great that the data from all feeding replicates has been shared, however it is difficult to conclude any meaningful impact in transmission with the knock-out lines when there is so much variation and so few mosquitoes dissected for some datapoints (10 mosquitoes are very small sample sizes). For example, Exp1 shows a clear decrease in mic19- transmission, but then Exp2 does not really show as great effect. Similarly, why does the double knock out have better transmission than the single knockouts? Sure there would be a greater effect?
We agree with the reviewer and with the new sentence added, as per major point, we hope we clarified the concept. Note that original Figure 2D has been moved to the supplementary information, as per minor comment of another reviewer.
Figure 3 legend - Please add which statistical test was used and the number of replicates.
Done
Figure 4 legend - Please add which statistical test was used and the number of replicates.
Done. Regarding replicates, note that while we measured over 100 cristae from over 30 mitochondria, these all stem from the same parasite culture.
Figure 5C - the 3D reconstructions are very nice, but what does the red and yellow coloring show?
Indeed, the information was missing. We added it to the figure legend.
Line 352 - "Still, it is striking that, despite the pronounced morphological phenotype, and the possibly high mitochondrial stress levels, the parasites appeared mostly unaffected in life cycle propagation, raising questions about the functional relevance of mitochondria at these stages."
How do the authors reconcile this statement with the proven fact that mitochondria-targeted antimalarials (such as atovaquone) are very potent inhibitors of parasite mosquito transmission?
Our original sentence was reductive. What we wanted to state was related to the functional relevance of crista architecture and overall mitochondrial morphology rather than the general functional relevance of the mitochondria. We changed the sentence accordingly.
Furthermore, even though we do not discuss this in the article, we are aware of mitochondria targeting drugs that are known to block mosquito transmission. We want to point out that it is difficult to discern the disruption of ETC and therefore an impact on energy conversion with the impact on the essential pathway of pyrimidine synthesis, highly relevant in microgamete formation. Still, a recent paper from Sparkes et al. 2024 showed the essentiality of mitochondrial ATP synthesis during gametogenesis so it is very likely that the mitochondrial energy conversion is highly relevant for transmission to the mosquito.
Reviewer #1 (Significance):
This manuscript is a novel approach to studying mitochondrial biology and does open a lot of unanswered questions for further research directions. Currently there are limitations in the use of statistical tests and detail of methodology, but these could be easily be addressed with a bit more analysis/better explanation in the text.
This manuscript could be of interest to readers with a general interest in mitochondrial cell biology and those within the specific field of Plasmodium research.
My expertise is in Plasmodium cell biology.
We thank the reviewer for the praise.
Reviewer #2 (Evidence, reproducibility and clarity):
Major comments:
(1) In my opinion, the authors tend to sensationalize or overinterpret their results. The title of the manuscript is very misleading. While MICOS is certainly important for crista formation, it is not the only factor, as ATP synthase dimer rows make a highly significant contribution to crista morphology. Thus, one can argue with equal validity that ATP synthase should be considered the 'architect', as it's the conformation of the dimers and rows modulate positive curvature. Secondly, while cristae are still formed upon mic60/mic19 gene knockout (KO), they are severely deformed, and likely dysfunctional (see below). Thus, I do not agree with the title that MICOS is dispensable for crista formation, because the authors results show that it clearly is essential. So, the title should be changed.
We thank the reviewer for taking the time to review our manuscript.
Based on the reviewers’ interpretation we conclude the title does not come across as intended. We have changed the title to: “The role of MICOS in organizing mitochondrial cristae in malaria parasites”
The Discussion section starting from line 373 also suffers from overinterpretation as well as being repetitive and hard to understand. The authors infer that MICOS stability is compromised less in the single KOs (sKO) in compared to the mic60/mic19 double KO (dKO). MICOS stability was never directly addressed here and the composition of the MICOS complex is unaddressed, so it does not make sense to speculate by such tenuous connections. The data suggest to me that mic60 and mic19 are equally important for crista formation and crista junction (CJ) stabilization, and the dKO has a more severe phenotype than either KO, further demonstrating neither is epistatic.
We do agree with the reviewer’s notion that we did not address complex stability, and our wording did not make this sufficiently clear. We shortened and rephrased the paragraph in question.
The following paragraphs (line 387 to 422) continues with such unnecessary overinterpretation to the point that it is confusing and contradictory. Line 387 mentions an 'almost complete loss of CJs' and then line 411 mentions an increase in CJ diameter, both upon Mic60 ablation. I do not think this discussion brings any added value to the manuscript and should be shortened. Yes, maybe there are other putative MICOS subunits that may linger in the KOS that are further destabilized in the dKO, or maybe Mic60 remains in the mic19 KO (and vice versa) to somehow salvage more CJs, which is not possible in the dKO. It is impossible to say with confidence how ATP synthase behaves in the KOs with the current data.
We shortened this paragraph.
(2) While the authors went through impressive lengths to detect any effect on lifecycle progression, none was found except for a reduction in oocyte count. However, the authors did not address any direct effect on mitochondria, such as OXPHOS complex assembly, respiration, membrane potential. This seems like a missed opportunity, given the team's previous and very nice work mapping these complexes by complexome profiling. However, I think there are some experiments the authors can still do to address any mitochondrial defects using what they have and not resorting to complexome profiling (although this would be definitive if it is feasible):
i) Quantification of MitoTracker Red staining in WT and KOs. The authors used this dye to visualize mitochondria to assay their gross morphology, but unfortunately not to assay membrane potential in the mutants. The authors can compare relative intensities of the different mitochondria types they categorized in Fig. 3A in 20-30 cells to determine if membrane potential is affected when the cristae are deformed in the mutants. One would predict they are affected.
Interesting suggestion. As our staining and imaging conditions are suitable for such analysis (as demonstrated by Sarazin et al., 2025, https://www.biorxiv.org/content/10.1101/2025.11.27.690934v1), we performed the measurements on the same dataset which we collected for Figure 3. We did, however, not detect any difference in mitotracker intensity between the different lines. The result of this analysis is included in the new version of Supplementary figure S6.
ii) Sporozoites are shown in Fig S5. The authors can use the same set up to track their motion, with the hypothesis that they will be slower in the mutants compared to WT due to less ATP. This assumes that sporozoite mitochondria are active as in gametocytes.
While theoretically plausible and informative, we currently do not know the relevance of mitochondrial energy conversion for general sporozoite biology or specifically features of sporozoite movement. Given the required resources and time to set this experiment up and the uncertainty whether it is a relevant proxy for mitochondrial functioning, we argue it is out of scope for this manuscript.
iii) Shotgun proteomics to compare protein levels in mutants compared to WT, with the hypothesis that OXPHOS complex subunits will be destabilized in the mutants with deformed cristae. This could be indirect evidence that OXPHOS assembly is affected, resulting in destabilized subunits that fail to incorporate into their respective complexes.
While this experiment could potentially further our understanding of the interaction between MICOS and levels of OXPHOS complex subunits we argue that the indirect nature of the evidence does not justify the required investments.
To expedite resubmission, the authors can restrict the cell lines to WT and the dKO, as the latter has a stronger phenotype that the individual KOs and conclusions from this cell line are valid for overall conclusions about Plasmodium MICOS.
I will also conclude that complexome/shotgun proteomics may be a useful tool also for identifying other putative MICOS subunits by determining if proteins sharing the same complexome profile as PfMic60 and Mic19 are affected. This would address the overinterpretation problem of point 1.
(3) I am aware of the authors previous work in which they were not able to detect cristae in ABS, and thus have concluded that these are truly acristate. This can very well be true, or there can be immature cristae forms that evaded detection at the resolution they used in their volumetric EM acquisitions. The mitochondria and gametocyte cristae are pretty small anyway, so it not unreasonable to assume that putative rudimentary cristae in ABS may be even smaller still. Minute levels of sampled complex III and IV plus complex V dimers in ABS that were detected previously by the authors by complexome profiling would argue for the presence of miniscule and/or very few cristae.
I think that authors should hedge their claim that ABS is acristate by briefly stating that there still is a possibility that miniscule cristae may have been overlooked previously.
We acknowledge that we cannot demonstrate the absolute absence of any membrane irregularities along the inner mitochondrial membrane. At the same time, if such structures were present, they would be extremely small and unlikely to contain the full set of proteins characteristic of mature cristae. For this reason, we consider it appropriate to classify ABS mitochondria as acristate. To reflect the reviewer’s point while maintaining clarity for readers, we have slightly adjusted our wording in the manuscript, changing ‘fully acristate’ to ‘acristate’.
This brings me to the claim that Mic19 and Mic60 proteins are not expressed in ABS. This is based on the lack of signal from the epitope tag; a weak signal is detected in gametocytes. Thus, one can counter that Mic19 and Mic60 are also expressed, but below the expression limits of the assay, as the protein exhibits low expression levels when mitochondrial activity is upregulated.
We agree with the reviewer that the absence of a detectable epitope-tag signal does not definitively exclude low-level expression, and we have therefore replaced the term ‘absent’ with ‘undetectable’ throughout the manuscript. In context with previous findings of low-level transcripts of the proteins in a study by Lopez-Berragan et al. and Otto et al., we also added the sentence “The apparent absence could indicate that transcripts are not translated in ABS or that the proteins’ expression was below detection limits of western blot analysis.” to the discussion. At the same time, we would like to clarify that transcript levels for both genes fall within the <25th percentile, suggesting that these low values likely represent background signal rather than biologically meaningful expression. This interpretation is further supported by proteomic datasets in PlasmoDB, which report PfMIC19 and PfMIC60 expression in gametocyte and mosquito stages, but not in asexual blood stages.”
To address this point, the authors should determine of mature mic60 and mic19 mRNAs are detected in ABS in comparison to the dKO, which will lack either transcript. RT-qPCR using polyT primers can be employed to detect these transcripts. If the level of these mRNAs are equivalent to dKO in WT ABS, the authors can make a pretty strong case for the absence of cristae in ABS.
We appreciate the reviewer’s suggestion. As noted in the Discussion, existing transcriptomic datasets already show detectable MIC19 and MIC60 mRNAs in ABS. For this reason, we expect RT-qPCR to reveal low (but not absent) levels of both transcripts, unlike the true loss expected to be observed in the dKO. Because such residual signals have been reported previously and their biological relevance remains uncertain, we do not believe transcript levels alone can serve as a definitive indicator of cristae absence in ABS.
They should highlight the twin CX9C motifs that are a hallmark of Mic19 and other proteins that undergo oxidative folding via the MIA pathway. Interestingly, the Mia40 oxidoreductase that is central to MIA in yeast and animals, is absent in apicomplexans (DOI: 10.1080/19420889.2015.1094593).
Searching for the CX9C motifs is a valuable suggestion. In response to the reviewer´s suggestion we analysed the conservation of the motif in PfMIC19 and included this in a new figure panel (Figure 1 F).
Did the authors try to align Plasmodium Mic19 orthologs with conventional Mic19s? This may reveal some conserved residues within and outside of the CHCH domain.
In response to this comment we made Figure 1 F, where we show conserved residues within the CHCH domains of a broad range of MIC19 annotated sequences across the opisthokonts, and show that the Cx9C motifs are conserved also in PfMIC19. Outside the CHCH domain, we did not find any meaningful conservation, as PfMIC19 heavily diverges from opisthokont MIC19.
(5) Statistical significance. Sometimes my eyes see population differences that are considered insignificant by the statistical methods employed by the authors, eg Fig. 4E, mutants compared to WT, especially the dKO. Have the authors considered using other methods such as student t-test for pairwise comparisons?
The graphs in figures 3, 4 and 5 got a makeover, such that they now are in linear scale and violin plots (also following a suggestion from further down in the reviewer’s comments). We believe that this improves interpretability. ANOVA was kept as statistical testing to assure the correction for multiple comparisons that cannot be performed with standard t-test. A full overview of statistics and exact pvalues can also be found in the newly added supplementary information 2.
Minor comments:
Line 33. Anaerobes (eg Giardia) have mitochondria that do produce ATP, unlike aerobic mitochondria
We acknowledge that producing ATP via OXPHOS is not a characteristic of all mitochondria-like organelles (e.g. mitosomes), which is why these are typically classified separately from canonical mitochondria. When not considering mitochondria-like organelles, energy conversion is the function that the mitochondrion is most well-known for and the one associated with cristae.
Line 56: Unclear what authors mean by "canonical model of mitochondria"
To clarify we changed this to “yeast or human” model of mitochondria.
Lines 75-76: This applies to Mic10 only
We removed the “high degree of conservation in other cristate eukaryotes” statement.
Line 80: Cite DOI: 10.1016/j.cub.2020.02.053
Done
Fig 2D: I find this table difficult to read. If authors keep table format, at least get rid of 'mean' column' as this data is better depicted in 2C. I suggest depicted this data either like in 3B depicting portion of infected vs unaffected flies in all experiments, then move modified Table to supplement. Important to point out experiment 5 appears to be an outlier with reduced infectivity across all cell lines, including WT.
To clarify: the mean reported in the table indicates the mean per replicate while the mean reported in figure 2C is the overall mean for a given genotype that corrects for variability within experiments. We agree that moving the table to the supplementary data is a good idea. We decided to not include a graph for infected and non-infected mosquitoes as this information would be partially misleading, highlighting a phenotype we argue to be influenced by the strong variability.
Fig. 3C-G: I feel like these data repeatedly lead to same conclusions. These are all different ways of showing what is depicted in Fig 2B: mitochondria gross morphology is affected upon ablation of MICOS. I suggest that these graphs be moved to supplement and replaced by the beautiful images.
Thank you for the nice comment on our images. We have now moved part of the graphs to supplementary figure 6 and only kept the Relative Frequency, Sphericity and total mitochondria volume per cell in the main figure.
Line 180: Be more specific with which tubulin isoform is used as a male marker and state why this marker was used in supplemental Fig S6.
We have now specified the exact tubulin isoform used as the male gametocyte marker, both in the main text and in Supplementary Fig. S6. This is a commercial antibody previously known to work as an effective male marker, which is why we selected it for this experiment. This is now clearly stated in the manuscript.
Line 196 and Fig 3C: the word 'intensities' in this context is very ambiguous. Please choose a different term (puncta, elements, parts?). This is related to major point 2i above.
To clarify the biological effect that we can conclude form the measurement, we added an explanation about it in the respective section of the results, and we decided to replace the raw results of the plug-in readout with the deduced relative dispersion.
Line 222: Report male/female crista measurements
We added Supplementary information 2, which contains exact statistical test and outcomes on all presented quantifications as well as a per-sex statistical analysis of the data from figure 4. Correspondingly, we extended supplementary information 2 by a per-sex colour code for the thin section TEM data.
Fig. 4B-E: depict data as violin plots or scatter plots like Fig. 2C to get a better grasp of how the crista coverage is distributed. It seems like the data spread is wider in the double KO. This would also solve the problem with the standard deviation extending beyond 0%.
We changed this accordingly.
Lines 331-333: Please clarify that this applies for some, but not all MICOS subunits. Please also see major point 1 above. Also, the authors should point out that despite their structural divergence, trypanosomal cryptic mitofilins Mic34 and Mic40 are essential for parasite growth, in contrast to their findings with PfMic60 (DOI: https://doi.org/10.1101/2025.01.31.635831).
This has been changed accordingly.
Line 320: incorrect citation. Related to point 1above.
Correct citation is now included in the text.
Lines 333-335. This is related to the above. Again, some subunits appear to affect cell growth under lab conditions, and some do not. This and the previous sentence should be rewritten to reflect this.
This has been changed accordingly.
Line 343-345: The sentence and citation 45 are strange. Regarding the former, it is about CHCHD10, whose status as a bona fide MICOS subunit is very tenuous, so I would omit this. About the phenomenon observed, I think it makes more sense to write that Mic60 ablation results in partially fragmented mitochondria in yeast (Rabl et al., 2009 J Cell Biol. 185: 1047-63). A fragmented mitochondria is often a physiological response to stress. I would just rewrite as not to imply that mitochondrial fission (or fusion) is impaired in these KOs, or at least this could be one of several possibilities.
The sentence has been substituted following the indication of the reviewer. Though we still include the data of the human cells as this has also been shown in Stephens et al. 2020.
Line 373: 'This indicates' is too strong. I would say 'may suggest' as you have no proof that any of the KOs disrupts MICOS. This hypothesis can be tested by other means, but not by penetrance of a phenotype.
Done
Line 376-377; 'deplete functionality' does not make sense, especially in the context of talking about MICOS subunit stability. In my opinion, this paragraph overinterprets the KO effects on MICOS stability. None of the experiments address this phenomenon, and thus the authors should not try to interpret their results in this context. See major point 1.
We removed the sentence. Also, the entire paragraph has been shortened, restructured and wording was changed to address major point 1.
Other suggestions for added value
(1) Does Plasmodium Sam50 co-fractionate with Mic60 and Mic19 in BN PAGE (Fig. 1E)
While we did identify SAMM50 in our BN PAGE, the protein does not co-migrate with the MICOS components but instead comigrates with other components of a putative sorting and assembly machinery (SAM) complex. As SAMM50, the SAM complex and the overarching putative mitochondrial membrane space bridging (MIB) complex are not mentioned in the manuscript, we decided to not include the information in Author response image 1.
Author response image 1.
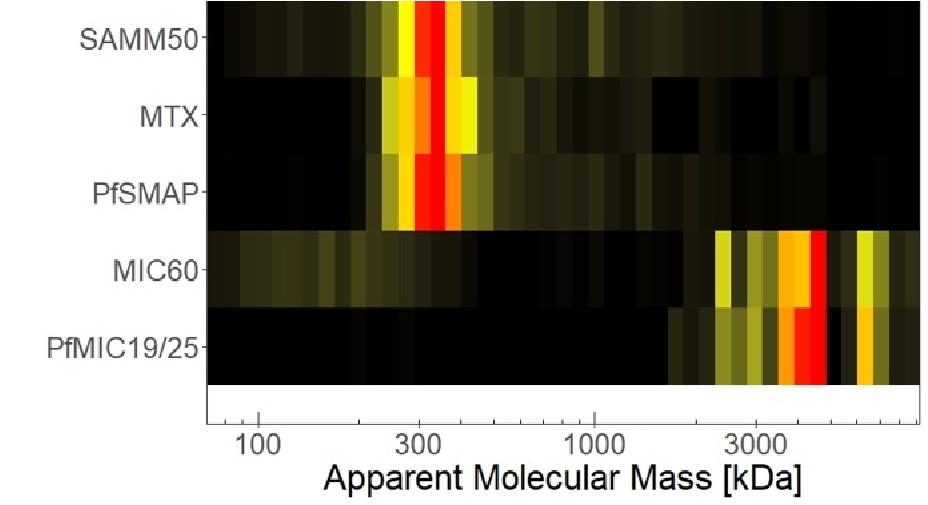
Reviewer #2 (Significance):
The manuscript by Tassan-Lugrezin is predicated on the idea that Plasmodium represents the only system in which de novo crista formation can be studied. They leverage this system to ask the question whether MICOS is essential for this process. They conclude based on their data that the answer is no, which the authors consider unprecedented. But even if their claim is true that ABS is acristate, this supposed advantage does not really bring any meaningful insight into how MICOS works in Plasmodium.
First the positives of this manuscript. As has been the case with this research team, the manuscript is very sophisticated in the experimental approaches that are made. The highlights are the beautiful and often conclusive microscopy performed by the authors. Only the localization of Mic60 and Mic19 was inconclusive due to their very low expression unfortunately.
The examination of the MICOS mutants during in vitro life cycle of Plasmodium falciparum is extremely impressive and yields convincing results. Mitochondrial deformation is tolerated by life cycle stage differentiation, with a modest but significant reduction of oocyte production, being observed.
However, despite the herculean efforts of the authors, the manuscript as it currently stands represents only a minor advance in our understanding of the evolution of MICOS, which from the title and focus of the manuscript, is the main goal of the authors.
In its current form, the manuscript reports some potentially important findings:
(1) Mic60 is verified to play a role in crista formation, as is predicted by its orthology to other characterized Mic60 orthologs.
(2) The discovery of a novel Mic19 analog (since the authors maintain there is no significant sequence homology), which exhibits a similar (or the same?) complexome profile with Mic60. This protein was upregulated in gametocytes like Mic60 and phenocopies Mic60 KO.
(3) Both of these MICOS subunits are essential (not dispensable) for proper crista formation
(4) Surprisingly, neither MICOS subunit is essential for in vitro growth or differentiation from ABS to sexual stages, and from the latter to sporozoites. This says more about the biology of plasmodium itself than anything about the essentiality of Mic60, i.e. plasmodium life cycle progression tolerates defects to mitochondrial morphology. But yes, I agree with the authors that Mic60's apparent insignificance for cell growth in examined conditions does differ with its essentiality in other eukaryotes. But fitness costs were not assayed (e.g. by competition between mutants and WT in infection of mosquitoes)
(5) Decreased fitness of the mutants is implied by a reduction of oocyte formation.
While interesting in their own way, collectively they do not represent a major advance in our understanding of MICOS evolution. Furthermore, the findings bifurcate into categories informing MICOS or Plasmodium biology. Both aspects are somewhat underdeveloped in their current form.
This is unfortunate because there seem to be many missed opportunities in the manuscript that could, with additional experiments, lead to a manuscript with much wider impact. For me, what is remarkable about Plasmodium MICOS that sets it apart from other iterations is the apparent absence of the Mic10 subunit. Purification of plasmodium MICOS via the epitope tagged Mic60 and Mic19 could have verified that MICOS is assembled without this core subunit. Perhaps Mic60 and Mic19 are the vestiges of the complex, and thus operate alone in shaping cristae. Such a reduction may also suggest the declining importance of mitochondria in plasmodium.
Another missed opportunity was to assay the impact of MICOS-depletion of OXPHOS in plasmodium.
This is a salient issue as maybe crista morphology is decoupled from OXPHOS capacity in Plasmodium, which links to the apparent tolerance of mitochondrial morphology in cell growth and differentiation. I suggested in section A experiments to address this deficit.
Finally, the authors could assay fitness costs of MICOS-ablation and associated phenotypes by assaying whether mosquito infectivity is reduced in the mutants when they are directly competing with WT plasmodium. Like the authors, I am also surprised that MICOS mutants can pass population bottlenecks represented by differentiation events. Perhaps the apparent robustness of differentiation may contribute plasmodium's remarkable ability to adapt.
I realize that the authors put a lot of efforts into their study and again, I am very impressed by the sophistication of the methods employed. Nevertheless, I think there is still better ways to increase the impact of the study aside from overinterpreting the conclusions from the data. But this would require more experiments along the lines I suggest in Section A and here.
We thank the reviewer for their extensive analysis of the significance of our findings, including the compliments on our microscopy images and the sophisticated experimental approaches. We hope we have convincingly argued why we could or could not include some of the additional analyses suggested by the reviewer in section 1 above.
With regard to the significance statement, we want to point out that our finding that PfMICOS is not needed for initial formation of cristae (as opposed to organization thereof), is a confirmation of something that has been assumed by the field, without being the actual focus of studies. We argue that the distinction between formation and organization of cristae is important and deserves some attention within the manuscript. The result of MICOS not being involved in the initial formation of cristae, we argue to be relevant in Plasmodium biology and beyond. As for the insights into how MICOS works in Plasmodium we have confirmed that the previously annotated PfMIC60 is indeed involved in the organization of cristae. Furthermore, we have identified and characterized PfMIC19. These findings, we argue, are indeed meaningful insights into PfMICOS.
Reviewer #3 (Evidence, reproducibility and clarity):
Summary:
MICOS is a conserved mitochondrial protein complex responsible for organising the mitochondrial inner membrane and the maintenance of cristae junctions. This study sheds first light on the role of two MICOS subunits (Mic60 and the newly annotated Mic19) in the malaria parasite Plasmodium falciparum, which forms cristae de novo during sexual development, as demonstrated by EM of thin section and electron tomography. By generating knockout lines (including a double knockout), the authors demonstrate that knockout of both MICOS subunits leads to defects in cristae morphology and a partial loss of cristae junctions. With a formidable set of parasitological assays, the authors show that despite the metabolically important role of mitochondria for gametocytes, the knockout lines can progress through the life stages and form sporozoites, albeit with diminished infection efficiency.
We thank the reviewer for their time and compliment.
Major comments:
(1) The authors should improve to present their findings in the right context, in particular by:
i) giving a clearer description in the introduction of what is already known about the role of MICOS. This starts in the introduction, where one main finding is missing: loss of MICOS leads to loss of cristae junctions and the detachment of cristae membranes, which are nevertheless formed, but become membrane vesicles. This needs to be clearly stated in the introduction to allow the reader to understand the consistency of the authors' findings in P. falciparum with previous reports in the literature.
We extended the introduction to include this information.
iii) at the end to the introduction, the motivating hypothesis is formulated ad hoc "conclusive evidence about its involvement in the initial formation of cristae is still lacking" (line 83). If there is evidence in the literature that MICOS is strictly required for cristae formation in any organism, then this should be explained, because the bona fide role of MICOS is maintenance of cristae junctions (the hypothesis is still plausible and its testing important).
To clarify we rephrased the sentence to: “Although MICOS has been described as an organizer of crista junctions, its role during the initial formation of nascent cristae has not been investigated.”
(2) Line 96-97: "Interestingly, PfMIC60 is much larger than the human MICOS counterpart, with a large, poorly predicted N-terminal extension." This statement is lacking a reference and presumably refers to annotated ORFs. The authors should clarify if the true N-terminus is definitely known - a 120kDa size is shown for the P. falciparum but this is not compared to the expected length or the size in S. cerevisiae.
To solve the reference issue, we added the uniprot IDs we compared to see that the annotated ORF is bigger in Plasmodium. We also changed the comparison to yeast instead of human, because we realized it is confusing to compare to yeast all throughout the figure, but then talk about human in this specific sentence.
Regarding whether the true N-terminus is known. Short answer: No, not exactly.
However, we do know that the Pf version is about double the size of the yeast protein.
As the reviewer correctly states, we show the size of 120kDa for the tagged protein in Figure 1G. Considering that we tagged the protein C-terminally, and observed a 120kDa product on western blot, it is safe to conclude that the true N-terminus does not deviate massively from the annotated ORF, and hence, that there is a considerable extension of the protein beyond a 60kDa protein. We do not directly compare to yeast MIC60 on our western blots, however, that comparison can be drawn from literature: Tarasenko et al., 2017 showed that purified MIC60 running at ~60kDa on SDS-PAGE actively bends membranes, suggesting that in its active form, the monomer of yeast MIC60 is indeed 60kDa in size.
To clarify, we now emphasize that we ran the Alphafold prediction on the annotated open reading frame (annotated and sequenced by Bohme et al. and Chapell et al. now cited in the manuscript), and revised the wording to make clear what we are comparing in which sentence.
(3) lines 244-245: "Furthermore, our data indicates the effect size increases with simultaneous ablation of both proteins?". The authors should explain which data they are referring to, as some of the data in Fig 3 and 4 look similar and all significance tests relate to the wild type, not between the different mutants, so it is not clear if any overserved differences are significant. The authors repeat this claim in the discussion in lines 368-369 without referring to a specific significance test. This needs to be clarified.
As a reply to this and other comments from the reviewers we added the multiple testing within all samples. In addition, to clarify statistics used we included a supplementary dataset with all p-values and statistical tests used.
(4) lines 304-306: "Though well established as the cristae organizing system, the role of MICOS in initial formation of cristae remains hidden in model organisms that constitutively display cristae.". This sentence is misleading since even in organisms that display numerous cristae throughout their life cycle, new cristae are being formed as the cells proliferate. Thus, failure to produce cristae in MICOS knockout lines would have been observable but has apparently not been reported in the literature. Thus, the concerted process in P. falciparum makes it a great model organism, but not fundamentally different to what has been studied before in other organisms.
We deleted this statement.
(5) lines 373-378. "where ablation of just MIC60 is sufficient to deplete functionality of the entire MICOS (11, 15),". The authors' claim appears to be contrary to what is actually stated in ref 15, which they cite:
"MICOS subunits have non-redundant functions as the absence of both MICOS subcomplexes results in more severe morphological and respiratory growth defects than deletion of single MICOS subunits or subcomplexes."
This seems in line with what the authors show, rather than "different".
This sentence has been removed.
(6) lines 380-385: "... thus suggesting that membrane invaginations still arise, but are not properly arranged in these knockout lines. This suggests that MICOS either isn't fully depleted,...". These conclusions are incompatible with findings from ref. 15, which the authors cite. In that study, the authors generated a ∆MICOS line which still forms membrane invaginations, showing that MICOS is not required at all for this process in yeast. Hence the authors' implication that MICOS needs to be fully depleted before membrane invaginations cease to occur is not supported by the literature.
This sentence has been deleted in the revised version of the manuscript.
Minor comments:
(1) The authors should consider if the first part of their title could be seen as misleading: It suggests that MICOS is "the architect" in cristae formation, but this is not consistent with the literature nor their own findings.
Title is changed accordingly
- Line 43, of the three seminal papers describing the discovery of MICOS in 2011, the authors only cite two (refs 6 and 7), but miss the third paper, Hoppins et al, PMID: 21987634, which should probably be corrected.
Done, the paper is now cited
- Page 2, line 58: for a more complete picture the authors should also cite the work of others here which shows that although at very low levels, e.g. complex III (a drug target) and ATP synthase do assemble (Nina et al, 2011, JBC).
Done
- Page 3, line 80: "Irrespective of the shape of an organism's cristae, the crista junctions have been described as tubular channels that connect the cristae membrane to the inner boundary membrane (22, 24)." This omits the slit-shaped cristae junctions found in yeast (Davies et al, 2011, PNAS), which the authors should include.
The paper and concept have been added to the manuscript, though the sentence has been moved up in the introduction, when crista junctions are first introduced.
- Line 97: "poorly predicted N-terminal extension", as there is no experimental structure, we don't know if the prediction is poor. Presumably the authors mean either poorly ordered or the absence of secondary structure elements, or the poor confidence score for that region in the prediction? This should be clarified or corrected.
We were referring to the poor confidence score. To address this comment as well as major point 2, we rewrote the respective paragraph. It now clearly states that confidence of the prediction is low, and we mention the tool that was used to identify conserved domains (Topology-based Evolutionary Domains).
- Line 98: "an antiparallel array of ten β-sheets". They are actually two parallel beta-sheets stacked together. The authors could find out the name of this fold, but the confidence of the prediction is marked a low/very low. So, its existence is unknown, not just its "function".
We adapted the domain description to “a stack of two parallel beta-sheets" and replaced the statement on unknown function by the statement “Because this domain is predicted solely from computational analysis, both its actual existence in the native protein and its biological function remain unknown.”
- Fig 1B: The authors show two alphafold predictions of S. cerevisiae and P. falciparum Mic60 structures. There is however an experimental Mic60/19 (fragment) structure from the former organism (PMID: 36044574), which should be included if possible.
We appreciate the reviewer’s suggestion and note that the available structural data indeed provides valuable insight into how MIC60 and MIC19 interact. However, these structures represent fusion constructs of limited protein fragments and therefore capture only a small portion of each protein, specifically the interaction interface. Because our aim in Fig. 1B is to compare the overall domain architecture of the full-length proteins, we believe that including fragment-based structures would be less informative in this context.
- Line: 318-321: "The same trend was observed for PfMIC19 and PfMIC60. Although transcriptomic data suggested that low-level transcripts of PfMIC19 and PfMIC60 are present in ABS (38), we did not detect either of the proteins in ABS by western blot analysis. While this statement is true, the authors should comment on the sensitivity of the respective methods - how well was the antibody working in their hands and how do they interpret the absence of a WB band compared to transcriptomics data?
The HA antibody used in our experiments is a standard commercial reagent that performs reliably in both WB and IFA, although it shows a low background signal in gametocytes. We agree that the sensitivity of the method and the interpretation of weak or absent bands should be addressed explicitly. Transcript levels for both PfMIC19 and PfMIC60 in asexual blood stages fall within the <25 percentile, suggesting that these signals likely represent background. Nevertheless, we acknowledge that low-level protein expression below the detection limit of western blot analysis cannot be excluded. To reflect these considerations, we added the sentence: ‘The apparent absence could indicate that transcripts are not translated in ABS or that the proteins’ expression was below detection limits of western blot analysis.
- Lines 322-323: would the authors not typically have expected an IFA signal given the strength of the band in Western blot? If possible, the authors should comment if the negative fluorescence outcome can indeed be explained with the low abundance or if technical challenges are an equally good explanation.
Considering the nature of the investigated proteins (embedded in the IMM and spread throughout the mitochondria) difficulties in achieving a clear signal in IFA or U-ExM are not very surprizing. While epitopes may remain buried in IFA, U-ExM usually increases accessibility for the antibodies. However, U-ExM comes at the cost of being prone to dotty background signals, therefore potentially hiding low abundance, naturally dotty signals such as the signal of MICOS proteins that localize to distinct foci (at the CJ) along the mitochondrion. Current literature suggests that, in both human and yeast, STED is the preferred method for accurate spatial resolution of MICOS proteins (https://www.ncbi.nlm.nih.gov/pubmed/32567732,https://www.ncbi.nlm.nih.gov/pubmed/3206734 4). Unfortunately, we do not have experience with, nor access to, this particular technique/method.
- Lines 357-365: the authors describe limitations of the applied methods adequately. Perhaps it would be helpful to make a similar statement about the analysis of 3D objects like mitochondria and cristae from 2D sections. E.g. the apparent cristae length depends on whether cristae are straight (e.g. coiled structures do not display long cross sections despite their true length in 3D).
The limitations of other methods are described in the respective results section.
We added a clarifying sentence in the results section of Figure 4:
“Note that such measurements do not indicate the true total length or width of cristae, as the data is two-dimensional. The recorded values are to be considered indicative of possible trends, rather than absolute dimensions of cristae.“
This statement refers to the length/width measurements of cristae.
In the context of Figure 4D we mention the following (see preprint lines 229 – 230): “We expect this effect to translate into the third dimension and thus conclude that the mean crista volume increases with the loss of either PfMIC19, PfMIC60, or both.”
For Figure 5, we included a clarifying statement in the results section of the preprint (lines 269 – 273): “Note that these mitochondrial volumes are not full mitochondria, but large segments thereof. As a result of the incompleteness of the mitochondria within the section, and the tomography specific artefact of the missing wedge, we were unable to confirm whether cristae were in fact fully detached from the boundary membrane, or just too long to fit within the observable z-range.”
- Line 404: perhaps undetected or similar would be a better description than "hidden"?
The sentence does not exist in the revised manuscript.
Reviewer #3 (Significance):
The main strength of the study is that it provides the first characterisation of the MICOS complex in P. falciparum, a human parasite in which the mitochondrion has been shown to be a drug target. Mic60 and the newly annotated Mic19 are confirmed to be essential for proper cristae formation and morphology, as well as overall mitochondrial morphology. Furthermore, the mutant lines are characterised for their ability to complete the parasite life cycle and defects in infection effectivity are observed. This work is an important first step for deciphering the role of MICOS in the malaria parasite and the composition and function of this complex in this organism. The limitation of the study stems from what is already known about MICOS and its subunits in great detail in yeast and humans with similar findings regarding loss of cristae and cristae defects. The findings of this study do not provide dramatic new insight on MICOS function or go substantially beyond the vast existing literature in terms of the extent of the study, which focuses on parasitological assays and morphological analysis. Exploring the role of MICOS in an early-divergent organism and human parasite is however important given the divergence found in mitochondrial biology and P. falciparum is a uniquely suited model system. One aspect that would increase the impact of the paper would be if the authors could mechanistically link the observed morphological defects to the decreased infection efficiency, e.g. by probing effects on mitochondrial function. This will likely be challenging as the morphological defects are diverse and the fitness defects appear moderate/mild.
As suggested by Reviewer 2, we examined mitochondrial membrane potential in gametocytes using MitoTracker staining and did not observe any obvious differences associated with the morphological defects. At present, additional assays to probe mitochondrial function in P. falciparum gametocytes are not sufficiently established, and developing and validating such methods would require substantial work before they could be applied to our mutant lines. For these reasons, a more detailed mechanistic link between the observed morphological changes and the reduced infection efficiency is currently beyond reach.
The advance presented in this study is to pioneer the study of MICOS in P. falciparum, thus widening our understanding of the role of this complex to different model organism. This study will likely be mainly of interest for specialised audiences such as basic research parasitologists and mitochondrial biologists. My own field of expertise is mitochondrial biology and structural biology.
I would need eleven additional tokens for digits 0 to 9 and PERIOD.
Nope. You could just use the traditional approach where most tokenizers only have a generic tag/discriminant for all number tokens. The every-non-text-token-is-one-character constraint is arbitrary and unnecessary.
Show some love for the moms in your life
(Perceivable Principle) I noticed this big promotional banner right away, but it made me wonder how it translates for someone using a screen reader. According to the Perceivable principle, the image next to this text needs a concise <alt> tag of 125 characters or less so visually impaired users don't miss out on the information. If it is just named something random like "IMG_098.jpg" in the code, the site is failing to make this content truly presentable to everyone.
A new Settings → Provide Strategy submenu lets you cut down on what your node announces to the DHT:

IPFS Desktop release v0.49.0
Note: This preprint has been reviewed by subject experts for Review Commons. Content has not been altered except for formatting.
Learn more at Review Commons
This study investigates the roles of Rab32 and Rab38 in hepatic lipid droplet metabolism. The authors propose that Rab32/38-positive lysosome-related organelles (LROs) mediate lipid droplet degradation through a mechanism independent of conventional macroautophagy. While the study addresses an interesting question, several conceptual and technical issues need to be addressed before the conclusions can be fully supported.
Major Concerns
1.The authors primarily define the Rab32/38-positive ring-like structures as "lysosome-related organelles (LROs)" based on their morphological characteristics and co-localization with LAMP1. However, this classification lacks biochemical validation. Would it be more appropriate to include a Lyso-IP assay to provide additional supporting evidence? 2.In hepatocytes, what is the operational definition of LROs? Beyond being "larger in size," how are these structures functionally distinguished from conventional lysosomes? If Rab32/38 defines LRO identity, why does GFP-Rab32/38 not co-localize with all LAMP1-positive structures (Figure S1A)? 3.In Figure 2A, the dextran pulse-chase experiment shows fluid-phase uptake into large vacuoles; however, dextran can enter any endocytic compartment after prolonged chase periods. What evidence supports that these structures are bona fide LROs rather than enlarged late endosomes or lysosomes resulting from long-term culture? What determines why only certain lysosomes become Rab32/38-positive? This heterogeneity is not explained. Does it imply that pre-existing lysosomes convert into LROs, or that LROs are newly formed under high-density stress? The developmental trajectory of these structures has not been explored. 4.The authors propose a microautophagy mechanism based on the "invagination-like" structures observed by light microscopy (Figure 3A). However, the resolution of light microscopy is insufficient to distinguish true membrane invaginations from lipid droplets that are closely apposed to, or partially wrapped by, the outer membrane of LROs in three-dimensional space. Would a CLEM experiment be necessary to confirm that lipid droplets are indeed located within the lumen of LROs, rather than in deep invaginations that remain connected to the cytosol? In addition, multilamellar membrane structures were observed after Bafilomycin A1 treatment (Figure 3A). Have these structures been validated by electron microscopy, or could they simply represent complex membrane infoldings within swollen lysosomes? The conclusions drawn from light microscopy alone appear somewhat insufficient. 5.The authors use ATG4B C74A overexpression to claim macroautophagy independence. However, while this mutant blocks LC3 lipidation, the study still lacks genetic evidence, such as ATG knockouts. In Figure S2B, the authors state that the "majority" of Rab38-positive LRO-associated lipid droplets are LC3-negative, but no quantitative data are provided. 6.The manuscript does not clearly distinguish the functions of Rab32 and Rab38. Although the authors describe these proteins as paralogs with overlapping roles, multiple data points indicate that they have differential effects on lipid droplet (LD) metabolism. Notably, Rab38-but not Rab32-significantly affects LD delivery to acidic compartments, exerts a stronger influence on LRO size, and responds more robustly to VPS4B perturbation. These observations suggest that Rab32 and Rab38 regulate distinct steps of LD metabolism rather than functioning redundantly. However, the manuscript does not clearly highlight these functional differences and lacks mechanistic validation. 7.Figure 5A shows that the PI3P probe (2×FYVE) forms ring-like structures inside or near the LRO membrane. However, LROs themselves are Rab5-negative (Figures 1C-E), and PI3P is typically generated by Vps34 on early endosomes. Where do these PI3P signals originate? Are they transported from other organelles, or is there a local PI3P-generating mechanism on the LRO membrane? If the latter, which kinase is responsible, and is Vps34 recruited to the LRO membrane? This issue is not discussed. If PI3P is indeed locally generated on LROs, it could represent a key feature distinguishing LROs from classical lysosomes.
Minor Concerns
1.The double-knockout mice exhibit obesity and fatty liver; however, Rab32 and Rab38 are expressed in multiple tissues. A whole-body knockout model cannot distinguish whether these effects are hepatocyte-autonomous or arise from contributions by adipose tissue or macrophages, emphasizing the need for liver-specific knockout animals or cell models. Serum TAG levels were unchanged, and the authors speculate that VLDL secretion may be impaired, but this was not directly tested. Furthermore, the authors do not address the observed sex-specific effects, which appear to be male-specific. 2.The concentration of Orlistat used is relatively high (50-200 μM) and may cause non-specific effects. Have dose-response experiments been performed, or have other LAL inhibitors (e.g., Lalistat) been tested? 3.LysoTracker reflects acidity rather than lysosome identity, and reduced acidification in DKD cells may affect co-localization analysis.
Assessment of Significance Overall Assessment
Strengths:
Conceptual novelty: Introduces lysosome-related organelles (LROs) into hepatic lipid metabolism, expanding the functional repertoire of Rab32/38 beyond pigment cells and macrophages.
Mechanistic exploration: Links LD uptake to PI3P/PI(3,5)P2 signaling and VPS4B, providing molecular handles for future studies.
In vivo validation: DKO mice show age-dependent obesity and HFD sensitivity, establishing physiological relevance.
Weaknesses:
Rab32 vs. Rab38 functions remain blurred: Data suggest differential roles (Rab38 in LD delivery, Rab32 in LD size regulation), but authors default to "redundancy" narrative.
Microautophagy evidence incomplete: Relies on light microscopy; EM/CLEM needed to confirm true internalization.
Model relevance unclear: High-confluence AML12 vacuoles lack clear physiological correlate in healthy liver.
Audience
Primary:
Lysosome biologists
Autophagy researchers
Lipid metabolism researchers
Secondary:
Cell biologists
Metabolic disease researchers
Geneticists
The price tag of the AI gold rush: $725 billion. Will it pay off?
这个7250亿美元的AI投资规模数据表明AI领域正在经历前所未有的资本投入。这一数字相当于许多中等规模国家的GDP,反映了市场对AI技术的极高期望。然而,文章质疑这种巨额投资是否能获得相应回报,暗示可能存在AI泡沫风险。
reply to https://www.facebook.com/groups/TypewriterCollectors/posts/10161712887224678/
to Steve Clancy Zach Hubbird Jean Brunet
I'm curious what the sourcing is on your differentiation of the two models? Are there manuals, advertising, or other details to back up the differences? From what I can see, the phrase "Rhythm Touch" seems to have been an advertising tag for the Underwood SS which started a few months after production of the SS began and there wasn't any difference in them other than the advertising tag.
Robert Messenger has some scant history on the machine and the differences, primarily due to a redesign at the time, at https://oztypewriter.blogspot.com/2012/11/on-this-day-in-typewriter-history_25.html. The primary change from the S to the SS seems to have been a move from a carriage shift to a basket shift and so it seems somewhat fitting that Underwood uses the phrase "Rhythm Touch" as an advertising gimmick much like Smith-Corona were doing with their "Floating Shift" marketing.
Generally standards at the time were not differentiated by different trim lines as standards had all the bells and whistles for office use (potentially aside from custom use cases like decimal tabulators or extra wide carriage). Meanwhile all the trim variations were generally seen in the portable market geared toward home use rather than office. This would seem to support the idea that there's only the SS and "Rhythm Touch" is only an advertising tag line as the SS was newly introduced in January of '46 and "Rhythm Touch" appears around July '46.
There's also some discussion on the TWdB in the commentary at https://typewriterdatabase.com/1950-underwood-ss.23202.typewriter which may add to the question.
I'm curious to hear everyone's thoughts on the idea/thesis that the only model is the Underwood SS which is being marketed as the "Rhythm Touch" or evidence to the contrary to refute the claim.
four commercial markers: Anzeige, Werbung, Advertorial meta tag, and “Verantwortlich für den Inhalt”.
Is it just me or are there only two of them visible on the picture?
Differentiating between an Underwood SS and the Underwood Rhythm Touch:
comment to James Grooms at https://typewriterdatabase.com/show.23202.typewriter
James, perhaps it's hiding somewhere else in the comments on the database, but I'm curious if you've come across definitive differences between the Underwood SS and the Underwood Rhythm Touch models which have separate pages within the database:<br /> - SS https://typewriterdatabase.com/Underwood.SS.4.bmys - Rhythm Touch https://typewriterdatabase.com/Underwood.Rhythm+Touch.4.bmys
Most of my Google searches don't return anything definitive or with actual sourcing of any sort.
The main page has the SS starting in May 1946 and the Rhythm Touch beginning in July of that year, but doesn't seem to specify between the two in any substantive way. Neither of the two models seems to have had a name printed on it.
Your description here uses both designators, but knowing your penchant for newspaper and magazine advertisements, I would suspect you may have seen specific differentiators.
This Facebook post has some handwaving differentiators: https://www.facebook.com/groups/TypewriterCollectors/posts/10161712887224678/ but none seem definitive or sourced. It also uses the phrase carriage shift, though presumably with these models Underwood had moved to a segment/basket shift on their standards.
Other than the chrome side detailing moving from 3 strips to 5 as you've noted, one of the few differentiators I can see in this era is the shift from the shorter carriage return lever to the longer armed version around 1948 which Robert Messenger notes in https://oztypewriter.blogspot.com/2012/11/on-this-day-in-typewriter-history_25.html. However that same page also has an advertisement on it with the words Rhythm Touch featuring a short armed (older style) carriage return.
Is there really a difference between the SS and the Rhythm Touch or are they the same model with the phrase "Rhythm Touch" used as a marketing tag to compete potentially with Smith-Corona's "Floating Shift"?
Thanks!
Author response:
The following is the authors’ response to the original reviews.
Public Reviews:
Reviewer #1 (Public review):
Summary:
Zacharia and colleagues investigate the role of the C-terminus of IFT172 (IFT172c), a component of the IFT-B subcomplex. IFT172 is required for proper ciliary trafficking and mutations in its C-terminus are associated with skeletal ciliopathies. The authors begin by performing a pull-down to identify binding partners of His-tagged CrIFT172968-C in Chlamydomonas reinhardtii flagella. Interactions with three candidates (IFT140, IFT144, and a UBX-domain containing protein) are validated by AlphaFold Multimer with the IFT140 and IFT144 predictions in agreement with published cryo-ET structures of anterograde and retrograde IFT trains. They present a crystal structure of IFT172c and find that a part of the C-terminal domain of IFT172 resembles the fold of a non-canonical U-box domain. As U-box domains typically function to bind ubiquitin-loaded E2 enzymes, this discovery stimulates the authors to investigate the ubiquitin-binding and ubiquitination properties of IFT172c. Using in vitro ubiquitination assays with truncated IFT172c constructs, the authors demonstrate partial ubiquitination of IFT172c in the presence of the E2 enzyme UBCH5A. The authors also show a direct interaction of IFT172c with ubiquitin chains in vitro. Finally, the authors demonstrate that deletion of the U-box-like subdomain of IFT172 impairs ciliogenesis and TGFbeta signaling in RPE1 cells.
However, some of the conclusions of this paper are only partially supported by the data, and presented analyses are potentially governed by in vitro artifacts. In particular, the data supporting autoubiquitination and ubiquitin-binding are inconclusive. Without further evidence supporting a ubiquitin-binding role for the C-terminus, the title is potentially misleading.
Strengths:
(1) The pull-down with IFT172 C-terminus from C. reinhardtii cilia lysates is well performed and provides valuable insights into its potential roles.
(2) The crystal structure of the IFT172 C-terminus is of high quality.
(3) The presented AlphaFold-multimer predictions of IFT172c:IFT140 and IFT172c:IFT144 are convincing and agree with experimental cryo-ET data.
Weaknesses:
(1) The crystal structure of HsIFT172c reveals a single globular domain formed by the last three TPR repeats and C-terminal residues of IFT172. However, the authors subdivide this globular domain into TPR, linker, and U-box-like regions that they treat as separate entities throughout the manuscript. This is potentially misleading as the U-box surface that is proposed to bind ubiquitin or E2 is not surface accessible but instead interacts with the TPR motifs. They justify this approach by speculating that the presented IFT172c structure represents an autoinhibited state and that the U-box-like domain can become accessible following phosphorylation. However, additional evidence supporting the proposed autoinhibited state and the potential accessibility of the U-box surface following phosphorylation is needed, as it is not tested or supported by the current data.
We thank the reviewer for this comment. IFT172C contains TPR region and Ubox-like region, which are admittedly tightly bound to each other. While there is a possibility that this region functions and exists as one domain, below are the reasons why we chose to classify these regions as two different domains.
(1) TPR and Ubox-like regions are two different structural classes
(2) TPR region is linked to Ubox-like region via a long linker which seems poised to regulate the relative movement between these regions.
(3) Many ciliopathy mutations are mapped to the interface of TPR region and the Ubox region hinting at a regulatory mechanism governed by this interface.
That said, we agree that the proposed autoinhibited state and its potential relief by phosphorylation remains a hypothesis that requires experimental validation. We have revised the manuscript to present this more clearly as a speculative model rather than an established mechanism. We clearly acknowledge this limitation on pg. 16-17 of the revised discussion: ‘The IFT172 U-box domain appears to be in an auto-inhibited state in our crystal structure of HsIFT172C2 (Fig. 2E), potentially explaining the absence of a robust auto-ubiquitination activity in-vitro. This structural inhibition is reminiscent of the RING ubiquitin ligase CBL [59], where phosphorylation and substrate binding trigger a conformational change that activates ligase activity [59,75]. Intriguingly, the phosphosite database [76] lists four residues (T1533, S1549, T1689, Y1691) at the U-box/TPR interface as phosphorylation sites (Fig. S2D). Phosphorylation of these residues could potentially alleviate the auto-inhibited state, suggesting a possible regulatory mechanism. Furthermore, a 30-residue linker connects the U-box domain to the last TPR of IFT172, likely providing significant conformational flexibility (Fig. 2A-B). This flexibility may be functionally crucial for the U-box domain, allowing it to adopt different conformations as needed for its various roles. However, we note that the proposed autoinhibition model and its potential regulation by phosphorylation remain hypothetical and require future experimental validation.
(2) While in vitro ubiquitination of IFT172 has been demonstrated, in vivo evidence of this process is necessary to support its physiological relevance.
We thank the reviewer for this important point. We agree that in vivo evidence of IFT172 ubiquitination would strengthen the physiological relevance of our findings. While our current study focuses on the in vitro characterization of this activity, we have revised the manuscript to more clearly state that demonstration of IFT172 ubiquitination activity in cells, including identification of bona fide substrates, is required to establish its physiological significance (p. 16). We consider this an important direction for future studies.
(3) The authors describe IFT172 as being autoubiquitinated. However, the identified E2 enzymes UBCH5A and UBCH5B can both function in E3-independent ubiquitination (as pointed out by the authors) and mediate ubiquitin chain formation in an E3-independent manner in vitro (see ubiquitin chain ladder formation in Figure 3A). In addition, point mutation of known E3-binding sites in UBCH5A or TPR/U-box interface residues in IFT172 has no effect on the mono-ubiquitination of IFT172c1. Together, these data suggest that IFT172 is an E3-independent substrate of UBCH5A in vitro. The authors should state this possibility more clearly and avoid terminology such as "autoubiquitination" as it implies that IFT172 is an E3 ligase, which is misleading. Similarly, statements on page 10 and elsewhere are not supported by the data (e.g. "the low in vitro ubiquitination activity exhibited by IFT172" and "ubiquitin conjugation occurring on HsIFT172C1 in the presence of UBCH5A, possibly in coordination with the IFT172 U-box domain").
We now consider this possibility and tone down our statements about the autoubiquitination activity of IFT172 in both the abstract and results/discussion parts of the revised version of the manuscript. We no longer refer to IFT172 as having auto-ubiquitination activity in the manuscript.
(4) Related to the above point, the conclusion on page 11, that mono-ubiquitination of IFT172 is U-box-independent while polyubiquitination of IFT172 is U-box-dependent appears implausible. The authors should consider that UBCH5A is known to form free ubiquitin chains in vitro and structural rearrangements in F1715A/C1725R variants could render additional ubiquitination sites or the monoubiquitinated form of IFT172 inaccessible/unfavorable for further processing by UBCH5A.
We agree and the conclusion on pg. 11 has now been changed to: Therefore, while mutations in the IFT172 U-box domain affect the formation of higher molecular weight ubiquitin conjugates, the prominent mono-ubiquitination of IFT172 is likely attributable to the E3-independent activity of UbcH5a, as this event is not impacted by these U-box mutations, rather than indicating an intrinsic auto-ubiquitination capacity of IFT172 itself.
(5) Identification of the specific ubiquitination site(s) within IFT172 would be valuable as it would allow targeted mutation to determine whether the ubiquitination of IFT172 is physiologically relevant. Ubiquitination of the C1 but not the C2 or C3 constructs suggests that the ubiquitination site is located in TPRs ranging from residues 969-1470. Could this region of TPR repeats (lacking the IFT172C3 part) suffice as a substrate for UBCH5A in ubiquitination assays?
We thank the reviewer for raising this important point about ubiquitination site identification. While not included in our manuscript, we did perform mass spectrometry analysis of ubiquitination sites using wild-type IFT172 and several mutants (P1725A, C1727R, and F1715A). As shown in Author response image 1, we detected multiple ubiquitination sites across these constructs. The wild-type protein showed ubiquitination at positions K1022, K1237, K1271, and K1551, while the mutants displayed slightly different patterns of modification. However, we should note that the MS intensity signals for these ubiquitinated peptides were relatively low compared to unmodified peptides, making it difficult to draw strong conclusions about site specificity or physiological relevance.
Author response image 1.
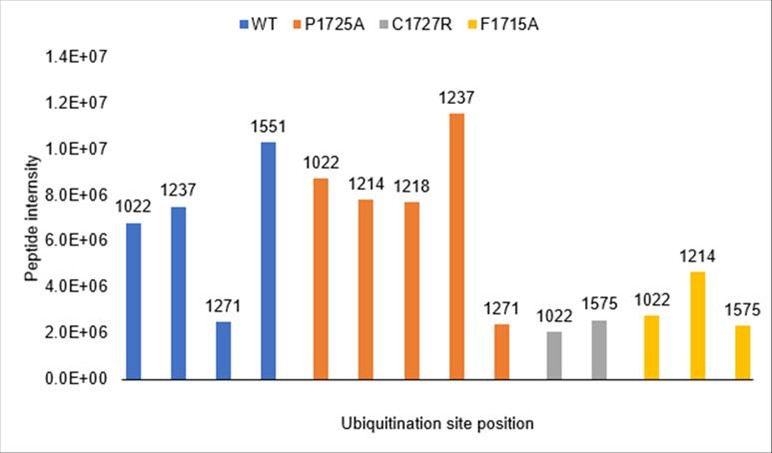
Consistent with the reviewer's suggestion, all detected ubiquitination sites fall within the TPR-containing region (residues 1022-1551), which is present in the C1 construct but absent from C2 and C3, explaining the construct-dependent ubiquitination pattern. We did not test the TPR region alone as a UBCH5A substrate, but this would be an informative experiment for future studies.
(6) The discrepancy between the molecular weight shifts observed in anti-ubiquitin Western blots and Coomassie-stained gels is noteworthy. The authors show the appearance of a mono-ubiquitinated protein of ~108 kDa in anti-ubiquitin Western blots. However, this molecular weight shift is not observed for total IFT172 in the corresponding Coomassie-stained gels (Figures 3B, D, F). Surprisingly, this MW shift is visible in an anti-His Western blot of a ubiquitination assay (Fig 3C). Together, this raises the concern that only a small fraction of IFT172 is being modified with ubiquitin. Quantification of the percentage of ubiquitinated IFT172 in the in vitro experiments could provide helpful context.
We acknowledge that the ubiquitin conjugation of IFT172 in vitro is weak, as stated in the manuscript (p. 16). The discrepancy between anti-ubiquitin Western blots and Coomassie-stained gels is consistent with only a small fraction of IFT172 being modified, which is expected given that the reaction likely reflects E3-independent ubiquitination by UBCH5A rather than a robust enzymatic activity of IFT172 itself. The anti-His Western blot (Fig. 3C) is more sensitive than Coomassie staining, explaining why the shift is visible there but not on Coomassie. We have not performed formal quantification of the ubiquitinated fraction, but based on the Coomassie data, we estimate it to be a minor proportion of total IFT172, consistent with the toned-down conclusions in our revised manuscript. The identification of physiological substrates and in vivo validation will be important future directions to establish the biological relevance of these observations.
(7) The authors propose that IFT172 binds ubiquitin and demonstrate that GST-tagged HsIFT172C2 or HsIFT172C3 can pull down tetra-ubiquitin chains. However, ubiquitin is known to be "sticky" and to have a tendency for weak, nonspecific interactions with exposed hydrophobic surfaces. Given that only a small proportion of the ubiquitin chains bind in the pull-down, specific point mutations that identify the ubiquitin-binding site are required to convincingly show the ubiquitin binding of IFT172.
We appreciate the reviewer's point regarding the potential for non-specific ubiquitin interactions and the value of mutational analysis for confirming specificity. While further mutagenesis of the predicted ubiquitin-binding interface was not performed for this revision, we note that our data show comparable tetra-ubiquitin pull-down by both the larger HsIFT172C2 construct and, importantly, the isolated HsIFT172C3 U-box domain itself (Fig. 4D). This localization of binding to the smaller U-box domain, coupled with our AlphaFold model predicting a specific interface with ubiquitin (Fig. 4E-F) and the observation that a mutation elsewhere (D1605R, Fig. 4C) does not abrogate this binding, collectively suggest a degree of specificity. We have revised the manuscript to more cautiously present these findings and acknowledge the need for future studies to definitively map the binding site. Specifically, we have now toned down the conclusion in the section on pg. 12-13 of the revised manuscript including a toned down heading: “IFT172 U-box domain pulls down ubiquitin in vitro”.
(8) The authors generated structure-guided mutations based on the predicted Ub-interface and on the TPR/U-box interface and used these for the ubiquitination assays in Fig 3. These same mutations could provide valuable insights into ubiquitin binding assays as they may disrupt or enhance ubiquitin binding (by relieving "autoinhibition"), respectively. Surprisingly, two of these sites are highlighted in the predicted ubiquitin-binding interface (F1715, I1688; Figure 4E) but not analyzed in the accompanying ubiquitin-binding assays in Figure 4.
We thank the reviewer for emphasizing the importance of mutational analysis to confirm the specificity of ubiquitin binding and for specifically inquiring about residues like F1715 and I1688 at the predicted ubiquitin interface. We tested purified HsIFT172C1 constructs containing the F1715A mutation (along with P1725A and C1727R variants) in pull-down assays with GST-Ubiquitin, see Author response image 2.
Author response image 2.
However, these experiments did not reveal a conclusive difference in ubiquitin binding for any of the tested variants compared to wild-type IFT172. The I1688A mutant, unfortunately, yielded insoluble protein and could not be evaluated. It is conceivable that the F1715A mutation was not disruptive enough to significantly alter binding, and future studies with different substitutions might be more informative. Nevertheless, our observations that the isolated HsIFT172C3 U-box domain itself pulls down tetra-ubiquitin (Fig. 4D), that our AlphaFold model predicts a specific interface (Fig. 4E-F), and that a mutation elsewhere (D1605R, Fig. 4C) does not abrogate this binding, collectively suggest a degree of specificity. We have revised the manuscript to present these ubiquitin binding findings cautiously, acknowledging the need for further investigation to definitively map the binding site and its functional relevance.
(9) If IFT172 is a ubiquitin-binding protein, it might be expected that the pull-down experiments in Figure S1 would identify ubiquitin, ubiquitinated proteins, or E2 enzymes. These were not observed, raising doubt that IFT172 is a ubiquitin-binding protein.
We acknowledge that the absence of ubiquitin or ubiquitinated proteins in our pull-down/MS experiment (Fig. S1) could raise questions about the ubiquitin-binding capacity of IFT172. However, several technical factors likely explain this. First, IFT172 appears to bind ubiquitin with low affinity, as indicated by our in vitro pull-downs and the AF-predicted interface. Second, we used extensive washes to remove non-specific interactors, which would also remove weak but potentially genuine ubiquitin interactions. Third, we did not include ubiquitination-preserving reagents such as NEM in our pull-down buffers, exposing ubiquitinated proteins to DUB-mediated deubiquitination during the experiment. These factors combined would strongly select against the detection of ubiquitin-related interactors under our experimental conditions.
(10) The cell-based experiments demonstrate that the U-box-like region is important for the stability of IFT172 but does not demonstrate that the effect on the TGFb pathway is due to the loss of ubiquitin-binding or ubiquitination activity of IFT172.
We acknowledge that our current data cannot definitively distinguish whether the TGFβ pathway defects arise from reduced IFT172 protein stability or from specific loss of ubiquitin-related functions of the U-box domain. Our experiments demonstrate that the U-box region is required for both IFT172 stability and proper TGFβ signaling, but we agree that establishing a direct mechanistic link between ubiquitin-binding/conjugation and signaling would require additional experiments such as point mutations that selectively disrupt ubiquitin-related activity without affecting protein stability. We have revised the discussion (p. 18-19) to more clearly acknowledge this limitation. Addition to text: “However, we note that our current experiments cannot distinguish whether these signaling effects result specifically from loss of ubiquitin-related functions of the U-box domain or from the reduced levels of functional IFT172 protein in the heterozygous U-box deleted cells. Targeted point mutations that selectively disrupt ubiquitin binding without affecting protein stability would be required to resolve this question.”
(11) The challenges in experimentally validating the interaction between IFT172 and the UBX-domain-containing protein are understandable. Alternative approaches, such as using single domains from the UBX protein, implementing solubilizing tags, or disrupting the predicted binding interface in Chlamydomonas flagella pull-downs, could be considered. In this context, the conclusion on page 7 that "The uncharacterized UBX-domain-containing protein was validated by AF-M as a direct IFT172 interactor" is incorrect as a prediction of an interaction interface with AF-M does not validate a direct interaction per se.
We agree with the reviewer that our AlphaFold-Multimer (AF-M) predictions alone do not constitute experimental validation of a direct interaction. We appreciate the reviewer's understanding of the technical challenges in validating this interaction experimentally. We have revised our text (p. 7) to state that "The uncharacterized UBX-domain-containing protein was predicted by AF-M as a potential direct IFT172 interactor" and discuss the AF-M predictions as computational evidence that suggests, but does not prove, a direct interaction.
Reviewer #2 (Public review):
Summary:
Cilia are antenna-like extensions projecting from the surface of most vertebrate cells. Protein transport along the ciliary axoneme is enabled by motor protein complexes with multimeric so-called IFT-A and IFT-B complexes attached. While the components of these IFT complexes have been known for a while, precise interactions between different complex members, especially how IFT-A and IFT-B subcomplexes interact, are still not entirely clear. Likewise, the precise underlying molecular mechanism in human ciliopathies resulting from IFT dysfunction has remained elusive.
Here, the authors investigated the structure and putative function of the to-date poorly characterised C-terminus of IFT-B complex member IFT172 using alpha-fold predictions, crystallography and biochemical analyses including proteomics analyses followed by mass spectrometry, pull-down assays, and TGFbeta signalling analyses using chlamydomonas flagellae and RPE cells. The authors hereby provide novel insights into the crystal structure of IFT172 and identify novel interaction sites between IFT172 and the IFT-A complex members IFT140/IFT144. They suggest a U-box-like domain within the IFT172 C-terminus could play a role in IFT172 auto-ubiquitination as well as for TGFbeta signalling regulation.
As a number of disease-causing IFT72 sequence variants resulting in mammalian ciliopathy phenotypes in IFT172 have been previously identified in the IFT172 C-terminus, the authors also investigate the effects of such variants on auto-ubiquitination. This revealed no mutational effect on mono-ubiquitination which the authors suggest could be independent of the U-box-like domain but reduced overall IFT172 ubiquitination.
Strengths:
The manuscript is clear and well written and experimental data is of high quality. The findings provide novel insights into IFT172 function, IFT complex-A and B interactions, and they offer novel potential mechanisms that could contribute to the phenotypes associated with IFT172 C-terminal ciliopathy variants.
Weaknesses:
Some suggestions/questions are included in the comments to the authors below.
Reviewer #3 (Public review):
Summary:
Zacharia et al report on the molecular function of the C-terminal domain of the intraflagellar transport IFT-B complex component IFT172 by structure determination and biochemical in vitro and cell culture-based assays. The authors identify an IFT-A binding site that mediates a mutually exclusive interaction to two different IFT-A subunits, IFT144 and IFT140, consistent with interactions suggested in anterograde and retrograde IFT trains by previous cryo-electron tomography studies. Additionally, the authors identify a U-box-like domain that binds ubiquitin and conveys ubiquitin conjugation activity in the presence of the UbcH5a E2 enzyme in vitro. RPE1 cell lines that lack the U-box domain show a reduction in ciliation rate with shorter cilia, and heterozygous cells manifest TGF-beta signaling defects, suggesting an involvement of the U-box domain in cilium-dependent signaling.
Strengths:
(1) The structural analyses of the C-terminal domain of IFT172 combine crystallography with structure prediction using state-of-the-art algorithms, which gives high confidence in the presented protein structures. The structure-based predictions of protein interactions are validated by further biochemical experiments to assess the specific binding of the IFT172 C-terminal domains with other proteins.
(2) The finding that the IFT172 C-terminus interactions with the IFT-A components IFT140 and IFT144 appear mutually exclusive confirm a suggested role in mediating the binding of IFT-B to IFT-A in anterograde and retrograde IFT trains, which is of very high scientific value.
(3) The suggested molecular mechanism of IFT train coordination explains previous findings in Chlamydomonas IFT172 mutants, in particular an IFT172 mutant that appeared defective in retrograde IFT, as well as mutations identified in ciliopathy patients.
(4) The identification of other IFT172 interactors by unbiased mass spectrometry-based proteomics is very exciting. Analysis of stoichiometries between IFT components suggests that these interactors could be part of IFT trains, either as cargos or additional components that may fulfill interesting functions in cilia and flagella.
(5) The authors unexpectedly identify a U-box-like fold in the IFT172 C-terminus and thoroughly dissect it by sequence and mutational analyses to reveal unexpected ubiquitin binding and potential intrinsic ubiquitination activity.
(6) The overall data quality is very high. The use of IFT172 proteins from different organisms suggests a conserved function.
Weaknesses:
(1) Interaction studies were carried out by pulldown experiments, which identified more IFT172 interaction partners. Whether these interactions can be seen in living cells remains to be elucidated in subsequent studies.
We agree with the reviewer that validation of protein-protein interactions in living cells provides important physiological context. While our pulldown experiments have identified several promising interaction partners and the AF-M predictions provide computational support for these interactions, we acknowledge that demonstrating these interactions in vivo would strengthen our findings. However, we believe our current biochemical and structural analyses provide valuable insights into the molecular basis of IFT172's interactions, laying important groundwork for future cell-based studies.
(2) The cell culture-based experiments in the IFT172 mutants are exciting and show that the U-box domain is important for protein stability and point towards involvement of the U-box domain in cellular signaling processes. However, the characterization of the generated cell lines falls behind the very rigorous analysis of other aspects of this work.
We thank the reviewer for noting that the characterization of our cell lines could be more rigorous. In the revised version of the manuscript, we have addressed this by providing additional validation data for all four engineered RPE1 cell lines. First, we performed Sanger sequencing to confirm precise in-frame integration of the GFP tag at the targeted loci and to exclude unintended insertions or deletions (indels), both for the full-length IFT172-eGFP lines (Fig. S6) and for the IFT172∆U-box-eGFP lines (Fig. S7). Second, we performed anti-IFT172 immunoblotting on all four cell lines alongside parental RPE1 cells, confirming expression of both the full-length and U-box-truncated IFT172 proteins (Fig. S8). Notably, the immunoblot revealed reduced steady-state levels of the IFT172∆U-box protein compared to full-length IFT172, providing direct biochemical evidence that loss of the U-box domain compromises IFT172 protein stability consistent with the ciliogenesis phenotype described in the main text. Together, these data verify the integrity of the edited loci at both the genomic and protein levels, and strengthen the validation of the cellular models used in this study.
Overall, the authors achieved to characterize an understudied protein domain of the ciliary intraflagellar transport machinery and gained important molecular insights into its role in primary cilia biology, beyond IFT. By identifying an unexpected functional protein domain and novel interaction partners the work makes an important contribution to further our understanding of how ciliary processes might be regulated by ubiquitination on a molecular level. Based on this work it will be important for future studies in the cilia community to consider direct ubiquitin binding by IFT complexes.
Conceptually, the study highlights that protein transport complexes can exhibit additional intrinsic structural features for potential auto-regulatory processes. Moreover, the study adds to the functional diversity of small U-box and ubiquitin-binding domains, which will be of interest to a broader cell biology and structural biology audience.
Additional comments:
The authors investigate the consequences of the U-box deletion on ciliary TGF-beta signaling. While a cilium-dependent effect of TGF-beta signaling on the phosphorylation of SMAD2 has been demonstrated, the precise function of cilia in AKT signaling has not been fully established in the field. Therefore, the relevance of this finding is somewhat unclear. It may help to discuss relevant literature on the topic, such as Shim et al., PNAS, 2020.
We appreciate the reviewer's comment highlighting that the role of primary cilia in AKT signaling is not as well established as for SMAD2/3. However, we note that a direct functional link between AKT signaling and ciliogenesis has been demonstrated, showing that AKT regulates ciliogenesis initiation through a Rab11-effector switch mechanism (Walia et al., 2019; PMID: 31204173, co-authored by the corresponding author of this study). Furthermore, Shim et al. (PMID: 33753495) demonstrated a cilia-dependent reciprocal activation of AKT1 and SMAD2/3. In the revised manuscript (p. 19, ref. 97), we have expanded the discussion to cite these studies and provide a clearer literature context for the cilia-AKT connection, while acknowledging that the precise mechanism by which the IFT172 U-box domain influences AKT activation requires further investigation.
Recommendations for the authors:
Reviewer #1 (Recommendations for the authors):
Points for the discussion:
(1) The discussion should mention that IFT-A subunits IFT121, IFT122 and IFT144 share a similar domain organization to IFT172 (TPRs terminating in Zn-finger-like domains). Do the authors consider these as potential ubiquitin-binding proteins with E3 ligase activity? The possibility that these Zn-finger-like regions share a common origin, and function to stabilize the proteins or mediate IFT subunit interactions without a role in ubiquitin biology should be considered.
We appreciate this important point. We agree that the shared domain architecture across IFT121, IFT122, IFT144, and IFT172 raises the question of whether these C-terminal domains primarily serve structural rather than ubiquitin-related roles. We have added a discussion paragraph (p. 16) acknowledging that a structural/stabilizing function is the more parsimonious explanation, while noting that whether IFT172's U-box-like domain has additionally acquired ubiquitin-related activity remains an open question.
(2) From their modeling data, do the authors have an explanation for why a substitution as conservative as D1605E would cause disease?
The D1605E substitution maps to the IFT172-IFT-A interaction interface (Fig. 1F). While this is a conservative change, D1605 is located at a tightly packed protein-protein interface where even the addition of a single methylene group (the difference between aspartate and glutamate) could introduce steric clashes with residues of IFT140 or IFT144, or alter the precise geometry of hydrogen bonds or salt bridges critical for the interaction. Unfortunately, this level of detail is beyond the resolution of AlphaFold models. However, the fact that this residue is positioned directly at the binding interface provides a plausible structural rationale for its pathogenicity.
(3) The authors speculate that the L1615P mutation in the Chlamydomonas fla11 strain causes a faulty switch to retrograde IFT and this provides a molecular basis for the retrograde IFT phenotype. However, because the mutation is also within the IFT144 binding site, why is anterograde IFT also not affected?
The fla11 L1615P mutation resides in helix αA, which participates in both IFT144 (anterograde) and IFT140 (retrograde) interactions. The predominantly retrograde phenotype can be rationalized by the fundamentally different structural roles of the IFT172 C-terminus in anterograde versus retrograde trains. In anterograde trains, the IFT172 C-terminus acts as a flexible tether in stoichiometric excess (2:1 IFT-B:IFT-A ratio), providing an avidity effect that likely compensates for reduced binding affinity caused by L1615P (Lacey et al., 2023). Additional lateral interactions between IFT-B subunits further stabilize the anterograde polymer independently of the IFT172-IFT144 link. In contrast, the retrograde train requires the IFT172 C-terminus to adopt a rigid, resolved conformation that is integral to the IFT-A dimeric interface, with no redundant lateral interactions to compensate (Lacey et al., 2024). The helix-breaking L1615P mutation would specifically disrupt this precise structural requirement, explaining the selective retrograde IFT defect in fla11. We have added this discussion to the revised manuscript (p. 16).
Minor:
(1) On page 5, the authors describe the fla11 phenotypes including accumulation of IFT particles at the tip and accumulation of ubiquitinated proteins in the cilium. Could the authors please expand on how this suggests that IFT172 could be involved in ciliary ubiquitination events and discuss an alternative scenario of impaired assembly of functional retrograde IFT in this strain leading to accumulation of ubiquitinated proteins?
In the revised manuscript (p. 16), we have expanded the discussion of the fla11 phenotype to address this point. We now discuss how the distinct structural roles of the IFT172 C-terminus in anterograde versus retrograde trains explain the selective retrograde IFT defect in fla11, and explicitly note that the accumulation of ubiquitinated proteins in fla11 cilia may reflect impaired retrograde IFT-mediated clearance rather than a direct role of IFT172 in ciliary ubiquitination.
(2) The authors should also expand on the literature of known UBX-IFT interactions in their manuscript (e.g. Raman et al. PMID 26389662).
We have expanded the discussion of UBX-IFT interactions in the revised manuscript (p. 7) by citing the work of Raman et al. (PMID 26389662), who identified a direct interaction between the UBX-domain protein UBXN10 and IFT-B via CLUAP1/IFT38 for VCP-mediated regulation of IFT complex integrity. This provides important context for our identification of a UBX-domain protein as an IFT172 interactor.
(3) On page 11, I1688 is incorrectly referred to as I688.
Fixed.
Reviewer #2 (Recommendations for the authors):
(1) The finding that the interaction with IFT140/144 is mutually exclusive is very interesting. Could you speculate on or do you have any data regarding the effects to the overall IFT-complex conformation and downstream biological effects depending on which partner is bound?
I am not a structural biologist so this may be an irrelevant/impossible-to-answer question: I was also wondering as Ref 46 has shown that the dynein-2 motor complex binds to the edge of IFT-B2 (for assembled trains): Could the IFT172 C-terminus be involved here or somehow influence this interaction? In your mass spec data from Cr cilia using CrIFT172_968-C you don`t mention pulling down dynein-2 components so there doesn`t seem to be a direct interaction, but could the IFT-B2 conformation depend on if IFT172 has bound IFT-140 or IFT144 and hence this interaction influence the dynein-2 binding?
We thank the reviewer for this insightful question. Based on recent cryo-ET structures of anterograde and retrograde IFT trains (Lacey et al., 2023; 2024), the switch from IFT144 to IFT140 binding fundamentally changes IFT172's structural role. In anterograde trains, the IFT172 C-terminus acts as a flexible tether tolerating the 2:1 IFT-B:IFT-A stoichiometry and permitting long polymer formation. In retrograde trains, it adopts a rigid conformation integral to the IFT-A dimeric interface, driving the formation of discrete retrograde units with distinct architecture.
Regarding Dynein-2: while IFT172 does not directly bind Dynein-2 (consistent with our MS data), the reviewer's intuition is correct that IFT172's binding partner influences Dynein-2 association. In anterograde trains, autoinhibited Dynein-2 binds a composite surface formed between adjacent IFT-B2 repeats. When IFT172 switches to IFT140 at the ciliary tip, the resulting train depolymerization destroys this composite binding site, releasing Dynein-2 from its cargo mode to function as an active retrograde motor. The IFT172 binding switch may thus indirectly acts as a structural checkpoint for Dynein-2 activation.
(2) The data provided regarding TGFbeta signalling effects in cells with heterozygous U-box-like domain deletions is interesting. While secondary effects of impaired ciliogenesis due to homozygous deletion of the U-box-like domain can cause difficulties to analysing cell signalling effects, it would still be interesting to check the effects of bi-allelic human IFT172 disease variants in this region as well (the human disease phenotype is recessive and human mutations are likely hypomorphic variants still allowing for ciliogenesis).
Also, while there may be secondary effects, it would still be interesting to check homozygous U-box deleted cells as an aggravated effect would further support the data from the het cells.
We agree that testing bi-allelic human disease variants would strengthen the physiological relevance of our findings. While generating knock-in RPE1 lines was beyond the scope of this revision, we have obtained preliminary data from patient-derived fibroblasts carrying bi-allelic IFT172 missense variants in the U-box region (NPH2161). TGF-β1 stimulation time courses in these fibroblasts show altered p-SMAD2 kinetics compared to control fibroblasts, consistent with the phenotype observed in our heterozygous U-box deleted RPE1 cells (see Author response image 3).
Author response image 3.
While these results are preliminary and require further replication, they support the involvement of the IFT172 U-box domain in TGF-β signaling regulation in a disease-relevant context. Regarding homozygous U-box deleted cells, the severe reduction in IFT172 protein levels and ciliogenesis defects (Fig. 5B,D) make it difficult to separate U-box-specific effects from secondary consequences of impaired cilia formation, as the reviewer notes. We consider this an important direction for future studies using targeted point mutations rather than domain deletions.
(3) Figure 5 E-G: Overall, the effects upon TGFB1 addition are rather small compared to previously published data eg Clement et al Cell reports 2013 where one of the authors is the senior. Are RPE cells less responsive or do you have another theory? Did you check TGFB receptor levels to ensure the differences are not due to different levels of receptor expression? I feel it could be interesting to also check ciliary phopsho-SMAD localisation by IF. In Clement et al, loss of IFT88 results in reduced phospho-SMAD2 levels, do you have any theory why these opposite effects compared to the IFT172 loss of function could occur?
We thank the reviewer for this insightful comment. The Tg737orpk fibroblasts used in Clement et al. (2013), which harbor a hypomorphic mutation in IFT88, exhibit severely stunted cilia. This defect broadly disrupts cilium-dependent signaling pathways, including R-SMAD activation, and is therefore expected to produce more pronounced signaling phenotypes. In contrast, our study utilizes RPE-1 cells with structurally intact cilia, enabling us to investigate more specific alterations in ciliary signaling associated with IFT172 function rather than the global effects of cilia loss. Consequently, the more modest effects observed in our system are consistent with the less severe structural and functional perturbation. Both fibroblasts and RPE-1 cells are known to express TGF-β receptors and to respond robustly to TGF-β stimulation, making it unlikely that differences in receptor abundance alone account for the observed discrepancies. We also note that increasing evidence supports a role for the primary cilium in fine-tuning TGF-β signaling output by coordinating both canonical (R-SMAD-mediated) and non-canonical (e.g., AKT/ERK-mediated) pathways. Our data raise the possibility that loss of the IFT172 U-box domain, or reduced IFT172 levels, may differentially affect this balance, rather than simply attenuating signaling uniformly, as seen with more severe ciliary defects such as IFT88 disruption in Tg737orpk cells. We agree that the current dataset does not fully resolve the underlying mechanism. We therefore consider it an important direction for future work to examine, in greater detail, the localization and phosphorylation status of key canonical and non-canonical signaling components in context of the primary cilium by IF analyses.
(4) In the summary conclusion at the end of the discussions, the authors propose that IFT72 could directly influence the fate of ubiquitinated TGFB receptors. Do you have any data supporting the theory that TGFB ubiquitination is influenced by IFT172 ?
We acknowledge that our current data are insufficient to establish a direct link between IFT172-dependent ubiquitination events and TGF-β receptor regulation. Accordingly, we have revised the Discussion (page 19) to remove our previous hypothesis proposing a role for IFT172 in modulating TGF-β receptor ubiquitination.
While our experiments demonstrate that the U-box region is required for both IFT172 stability and proper TGF-β signaling, we agree that establishing a direct mechanistic connection between ubiquitin-related activity of IFT172 and signaling outcomes would require additional approaches such as targeted point mutations that selectively disrupt ubiquitin-binding or conjugation functions.
Furthermore, we note that our current data do not allow us to distinguish whether the observed signaling phenotypes arise specifically from the loss of ubiquitin-related functions of the U-box domain or from reduced levels of functional IFT172 protein in the heterozygous U-box–deleted cells.
(5) Wording:
Abstract
"IFT72..is associated with several disease variants causing ciliopathies". I would change this to "..and several disease-causing IFT172 variants have been identified in ciliopathy patients".
Corrected.
Introduction
"Another cohort of patients with milder ciliopathy resembling BBS also presented with ...". I would reword this to "Another cohort of patients with phenotypically slightly different ciliopathy features resembling BBS also presented with ...". It`s not necessarily less severe (they may die of cardiovascular complications in their early thirties for example due to metabolic syndrome, they are intellectually impaired, become blind...), but rather different.
Changed according to the reviewer’s recommendations.
Reviewer #3 (Recommendations for the authors):
(1) Recommended modifications:
(a) The RPE lines generated should be described better, i.e. sequencing information should be provided, or some kind of evidence that the lines are what they are supposed to be.
As also noted above, we acknowledge that the characterization presented for the RPE cell lines was insufficient in the initial version of the manuscript. In the revised version, we have addressed this limitation by including detailed sequencing analyses to validate the modifications introduced. Specifically, we provide sequencing data confirming both the integration of the GFP tag and the successful deletion of the U-box domain in all four engineered RPE cell lines. These data verify the integrity of the edited loci and exclude the presence of unintended insertions or deletions at the targeted regions. The corresponding results are presented in Figures S6 and S7 of the revised manuscript, thereby strengthening the validation of the cellular models used in this study.
(b) It would be more convincing if more than one clone of the RPE lines were presented, as this could rule out possible clonal effects.
We acknowledge that only a single clone was characterized for each of the four genotypes (IFT172-FL homozygous, IFT172-FL heterozygous, IFT172∆U-box homozygous, IFT172∆U-box heterozygous), and we agree that independent clones would provide stronger protection against clonal artifacts. Generating and validating additional clones was not feasible within the scope of this revision. However, several features of our data mitigate this concern. First, the phenotypes scale with allele dosage: the homozygous ∆U-box line shows the strongest reduction in IFT172 protein level, ciliation, and cilium length, while the heterozygous line shows intermediate defects (Fig. 5B, D and Fig. S8). A clonal off-target effect would not be expected to produce this dose-dependent pattern across two independently isolated lines. Second, the reduced steady-state IFT172 level in the ∆U-box lines (Fig. S8) is consistent with our in vitro observation that the U-box/TPR interface is required for protein stability, providing an independent biochemical rationale for the cellular phenotype. Third, Sanger sequencing of all four lines confirmed precise in-frame integration with no indels at the targeted locus (Figs. S6, S7). We have added a sentence to the Discussion (p. 20) acknowledging that confirmation in additional independent clones remains an important goal for follow-up work.
(c) Figure 5C: distribution of the GFP-tagged IFT172∆U-box protein could be quantified to support the statement.
In the revised version of the manuscript, we have included additional quantification of GFP fluorescence across all four cell lines to support our conclusions regarding IFT172 ciliary localization. The corresponding data for each cell line are presented in Figure S5C–F.
(d) The final sentences include quite bold statements about a general function of IFT172 in signal regulation. Yet, the evidence is the weakest part of the work. It is only shown in i) one cell line, ii) in one cell clone that is not extensively characterized, and iii) for one signaling pathway that is not the best-studied cilia signaling pathway. Therefore, I recommend a more moderate statement.
Abstract last sentence has now been toned down and reads: Our findings suggest that IFT172, beyond its structural role in bridging IFT-A and IFT-B complexes within IFT trains, harbors a conserved U-box-like domain with potential involvement in ciliary ubiquitination processes and signaling, providing new insights into the molecular mechanisms underlying IFT172-related ciliopathies.
(e) The order of the figures is not followed in the main text, which is distracting.
The order of figures is now consecutive in the revised manuscript.
(2) Questions and comments to consider:
(a) It is unclear why tetra-ubiquitin chains have been used.
We thank the reviewer for this question. Recent evidence suggests that ubiquitin chains, rather than monomeric ubiquitin, act as sorting and signaling cues at the primary cilium (Shinde et al., 2020). To probe the ubiquitin-binding activity of IFT172, we therefore used a tetrameric ubiquitin chain as a model substrate, which better reflects the multivalent nature and binding avidity expected for physiological polyubiquitin signals than a ubiquitin monomer. Specifically, we used a recombinantly expressed linear (Met1-linked) tetra-ubiquitin chain, generated as a genetically encoded fusion. Linear ubiquitin chains are well-established non-degradative signaling chains recognized by a dedicated class of ubiquitin-binding domains, making them a suitable probe for detecting ubiquitin-binding activity outside the canonical proteasomal pathway. In addition, monomeric ubiquitin (~8 kDa) is poorly retained during membrane transfer in Western blotting, which further precluded its reliable use as a probe in our pull-down assays. Together, these considerations motivated the use of tetrameric ubiquitin as a biologically and technically appropriate substrate for assessing IFT172's ubiquitin-binding activity.
(b) Figure 4D: described in the text as "pulldown tetraubiquitin at comparable levels", which is not obvious from the figure presented, it appears reduced by at least 30%.
We thank the reviewer for this observation. As described on page 10 of the manuscript and evident from Figure 4D, the purified GST–HsIFT172C3 construct underwent substantial proteolytic cleavage during purification. This degradation limited our ability to include amounts of intact GST–HsIFT172C3 comparable to those of the full-length GST–HsIFT172C2 construct in the pull-down assays. Importantly, when accounting for the reduced proportion of full-length GST–HsIFT172C3 present in the assay, the observed differences in tetra-ubiquitin pull-down efficiency between the two constructs are expected to be comparable. This is supported by the Coomassie staining shown in Figure 4D, which reflects the relative abundance of the intact protein species used in the experiment.
(c) With the proposed model, why would the fla11 mutant only affect retrograde IFT?
We have revised our manuscript in page 16 of the discussion section providing a plausible explanation of why only retrograde IFT is affected in the fla11 mutant.
(3) Minor copy-editing:
(a) Page 3, first paragraph: led := leads.
(b) Kinesin-2 and Dynein-2 should be hyphenated.
(c) Page 4: wwp1 should be WWP1.
(d) Bonafide should be italicized: bona fide.
(e) Some abbreviations appear uncommon and therefore somewhat distracting: TGFB instead of TGF-beta, Cr in instances where specifically referred to the organism.
(f) Unprecise lab jargon: "very C-terminal".
(g) Lab jargon: "purified a C-terminal construct".
(h) Lab jargon: "pull-downs".
(i) Page 8: "DALI" only abbreviated.
(j) Page 9: "Appearance ... were observed" should be "was".
(k) Page 11: "I688" should be "I1688".
(l) Page 12: "PDs" unclear.
These minor points have been corrected.
We have revised the text and figures to ensure using the widely accepted nomenclature, using TGF-β to refer to the signaling pathway and TGF-β1 specifically when referring to the ligand.
We further revised the text to reflect the use “Chlamydomonas reinhardtii” in instances when referring to the organism and “Cr” when referring to the protein.
We have removed the informal phrases "very C-terminal" and "purified a C-terminal construct" from the revised manuscript. We have retained the term "pull-down," as this is well-established and widely used terminology in the biochemistry literature to describe the affinity-based co-isolation assays used here. PD has been replaced with pull-down.
The grammatical error on page 9 ("Appearance... “were observed") has been corrected to "was observed”.
Reviewer #1 (Public review):
Summary:
The authors Hall et al. establish a purification method for snake venom metalloproteinases (SVMPs). By generating a generic approach to purify this divergent class of recombinant proteins, they enhance the field's accessibility to larger quantity SVMPs with confirmed activity and, for some, characterized kinetics. In some cases, the recombinant protein displayed comparable substrate specificity and substrate recognition compared to the native enzyme, providing convincing evidence of the authors' successful recombinant expression strategy. Beyond describing their route towards protein purification, they further provide evidence for self-activation upon Zn2+ incubation. They further provide initial insights on how to design high throughput screening (HTS) methods for drug discovery and outline future perspectives for the in-depth characterization of these enzyme classes to enable the development of novel biomedical applications.
Strengths:
The study is well presented and structured in a compelling way and the universal applicability of the approach is nicely presented.<br /> The purification strategy results in highly pure protein products, well characterized by size exclusion chromatography, SDS page as well as confirmed by mass spectrometry analysis. Further, a significant portion of the manuscript focuses on enzyme activity, thereby validating function. Particularly convincing is the comparability between recombinant vs. native enzymes; this is successfully exemplified by insulin B digestion. By testing the fluorogenic substrate, the authors provide evidence that their production method of recombinant protein can open up possibilities in HTS. Since their purification method can be applied to three structurally variable SVMP classes, this demonstrates the robust nature of the approach.
Weakness
The product obtained from the purification protocol appears to be a heterogenous mixture of self-activated and intact protein species. The protocol would benefit from improved control over the self-activation process. The authors explain well why they cannot deplete Zn2+ in cell culture or increase the pH to prevent autoactivation during the current purification steps. However, this leads me to the suggestion, if the His tag could be exchanged to a different tag that is less pH sensitive and not dependent on divalent ions (Strep-Tactin XT?) to allow for removal of divalent ions and low pH during purification steps. Another suggestion would be if they could replace the endogenous protease cleavage site in their expression construct design to a TEV protease recognition site, for example, to have more control over activation of the recombinant proteins.
The graphic to explain the universal applicability of the approach, Figure S1, has some mistakes, like duplication of text, an arrow without a meaning and should be revised.
Overall, the authors successfully purified active SVMP proteins of all three structurally diverse classes in high quality and provided convincing evidence throughout the manuscript to support their claims. The described method will be of use for a broader community working with self-activating and cytotoxic proteases.
Comment on the revised version:
I find that the clarity and overall structure of the manuscript have improved. However, the weakness I previously highlighted has neither been addressed experimentally nor convincingly explained. Therefore, the assessment stayed unchanged from my side.
Author response:
The following is the authors’ response to the original reviews.
Reviewer #1 (Public review):
Summary:
The authors Hall et al. establish a purification method for snake venom metalloproteinases (SVMPs). By generating a generic approach to purify this divergent class of recombinant proteins, they enhance the field's accessibility to larger quantities of SVMPs with confirmed activity and, for some, characterized kinetics. In some cases, the recombinant protein displayed comparable substrate specificity and substrate recognition compared to the native enzyme, providing convincing evidence of the authors' successful recombinant expression strategy. Beyond describing their route towards protein purification, they further provide evidence for self-activation upon Zn2+ incubation. They further provide insights on how to design high-throughput screening (HTS) methods for drug discovery and outline future perspectives for the in-depth characterization of these enzyme classes to enable the development of novel biomedical applications.
Strengths:
The study is well-presented and structured in a compelling way. The purification strategy results in highly pure protein products, well characterized by size exclusion chromatography, SDS page as well as confirmed by mass spectrometry analysis. Further, a significant portion of the manuscript focuses on enzyme activity, thereby validating function. Particularly convincing is the comparability between recombinant vs. native enzymes; this is successfully exemplified by insulin B digestion. By testing the fluorogenic substrate, the authors provide evidence that their production method of recombinant protein can open up possibilities in HTS. Since their purification method can be applied to three structurally variable SVMP classes, this demonstrates the robust nature of the approach.
We thank the reviewer for their positive assessment of our work.
Weaknesses:
The universal applicability of the approach could be emphasized more clearly. The potential for this generic protocol for recombinant SVMP zymogen production to be adapted to other SVMPs is somewhat obscured by the detailed optimization steps. A general schematic overview would strengthen the manuscript, presented as a final model, to illustrate how this strategy can be extended to other targets with similar features. Such a schematic might, for example, outline the propeptide fusion design, including its tags, relevant optimizations during expression, lysis, purification (e.g., strategies for metal ion removal and maintenance of protease inactivity), as well as the controllable auto-activation.
In the revised version of the manuscript, we moved the detailed description of the optimisation of SVMP expression, including mature SVMP expression, Marimastat addition, active site mutations and fusion of propeptides, into the supplement as supplementary text. We hope this improves the clarity and flow. As suggested, we now include a new figure outlining the SVMP production strategy and optimisation steps in the revised manuscript (new Figure S1).
The product obtained from the purification protocol appears to be a heterogeneous mixture of selfactivated and intact protein species. The protocol would benefit from improved control over the selfactivation process. The Methods section does not indicate whether residual metal ions were attempted to be removed during the purification, which could influence premature activation.
We agree that improved control of self-activation would be desirable. However, there is an issue: Previous studies reported that (1) SVMP zymogens are processed within secretory cells of the venom gland (Portes-Junior et al., 2014), and (2) mature SVMPs accumulate in secretory vesicles during venom production (Carneiro et al., 2002). Accordingly, preventing the auto-processing of SVMP zymogens is difficult to achieve because this would require Zn<sup>2+</sup> depletion within the insect cells during production which would result in cytotoxicity. We have included this information in the updated Discussion section of the revised manuscript.
Additionally, it has not been discussed whether the shift to pH 8 in the purification process is necessary from the initial steps onwards, given that a lower pH would be expected to maintain enzyme latency.
The shift to pH 8 is required for the affinity purification of the SVMP zymogens from the medium, involving the poly-histidine-tag and immobilized metal affinity chromatography (IMAC). At lower pH, the histidines would become protonated, preventing binding of the His-tag to the column. Thus, with the His-tag the shift to pH 7.5 or pH 8 is necessary.
The characterization of PIII activity using the fluorogenic peptide effectively links the project to its broader implications for drug design. However, the absence of comparable solutions for PI and PII classes limits the overall scope and impact of the finding.
We agree that such assays would be extremely useful. However, the development of fluorescence based high-throughput assays to test for PI and PII SVMP activity is beyond the scope of this study. Here, our overarching objective is to report a broadly applicable production method for PI, PII and PIII SVMPs.
Overall, the authors successfully purified active SVMP proteins of all three structurally diverse classes in high quality and provided convincing evidence throughout the manuscript to support their claims. The described method will be of use for a broader community working with self-activating and cytotoxic proteases.
Thank you.
Reviewer #2 (Public review):
Summary:
The aim of the study by Hall et al. was to establish a generic method for the production of Snake Venom Metalloproteases (SVMPs). These have been difficult to purify in the mg quantities required for mechanistic, biochemical, and structural studies.
Strengths:
The authors have successfully applied the MultiBac system and describe with a high level of detail the downstream purification methods applied to purify the SVMP PI, PII, and PIII. The paper carefully presents the non-successful approaches taken (such as expression of mature proteins, the use of protease inhibitors, prodomain segments, and co-expression of disulfide-isomerases) before establishing the construct and expression conditions required. The authors finally convincingly describe various activity assays to demonstrate the activity of the purified enzymes in a variety of established SVMP assays.
We thank the reviewer for their positive assessment of our work.
Weaknesses:
The manuscript suffers from a lack of bottoming out and stringent scientific procedures in the methodology and the characterization of the generated enzymes.
As an example, a further characterization of the generated protein fragments in Figure 3 by intact mass spectroscopy would have aided in accurate mass determination rather than relying on SEC elution volumes against a standard. Protein shape and charge can affect migration in SEC.
We agree that intact MS would be useful to determine the mass of the produced SVMPs. In this manuscript, we performed SEC as a purification step, removing aggregates. Furthermore, SEC allowed determining if the SVMPs form monomers or dimers. MS characterisation of intact SVMPs (and their PTMs) is not trivial and beyond the scope of this manuscript (see below).
Also, the analysis of N-linked glycosylation demonstrates some reactivity of PIII to PNGase F, but fails to conclude whether one or more sites are occupied, or whether other types of glycosylation is present. Again, intact mass experiments would have resolved such issues.
We concur that glycosylation of SVMPs is an important question. However, analysing the glycosylation of the SVMPs is beyond the scope of this manuscript; it is actually a project on its own: Intact MS can indeed provide information on glycosylation but is not very precise. Unambiguous assignment of the number and occupancy of glycosylation sites is more challenging, especially for large, glycosylated proteins such as our PIII SVMP zymogen. In practice, confident mapping of glycosylation sites would require peptide-level mass spectrometry following enzymatic digestion (Trypsin and Multi-Enzymatic Limited Digestion, ideally). Sample preparation, method optimization, MS acquisition, and data analysis together would require a significant investment. Moreover, we do not have access to the native PIII SVMP from Echis carinatus sochureki venom - this is the main point of our manuscript: we describe a protocol to produce SVMPs which could not be purified from venom. Therefore, a comparison of the glycosylation of the recombinant SVMP and the native SVMP cannot be performed unfortunately (see below).
The activity assays in Figure 4 are not performed consistently with kinetic assays and degradation assays performed for some, but not all, enzymes, and there is no Echis ocellatus comparison in Figure 4h.
This is correct. The suggested control experiment is not possible for the PII SVMP and PIII SVMP because we cannot purify the native PII and PIII SVMPs from Echis venom. We have highlighted this information in the revised manuscript in the insulin B degradation section.
Overall, whilst not affecting the main conclusion, this leaves the reader with an impression of preliminary data being presented. For consistency, application of the same assays to all enzymes (high-grade purified) would have provided the reader with a fuller picture.
In the revised manuscript, we included new data showing the requested characterisations of all three SVMPs.
We have included the respective assays in Figure 5 and Supplementary Figure S11. In the original manuscript, we had omitted these assays as the data show no enzymatic activity in the respective assays. Specifically, we show that (1) PII does not cause insulin B degradation (Fig. S11b), (2) that the PI and PII SVMPs do not degrade the fluorogenic peptide which is prototypic for PIII SVMPs and MMPs (Fig. S11a), (3) PI and PIII do not cause platelet aggregation because they lack the entire disintegrin domain (PI) or the RGD motif (PIII) (Fig. 5a), and (4) that the PI and PII SVMPs, like the PIII SVMP, are not pro-coagulant and do not cause blood clotting (Fig. 5d,5e and Fig. S11c). We also included this new information in the main text of our revised manuscript.
Overall, the data presented demonstrates a very credible path for the production of active SVMP for further downstream characterization. The generality of the approach to all SVMP from different snakes remains to be demonstrated by the community, but if generally applicable, the method will enable numerous studies with the aim of either utilizing SVMPS as therapeutic agents or to enable the generation of specific anti-venom reagents, such as antibodies or small molecule inhibitors.
Thank you.
Reviewer #3 (Public review):
Summary:
The presented study describes the long journey towards the expression of members' SVMP toxins from snake venom, which are toxins of major importance in a snakebite scenario. As in the past, their functional analysis relied on challenging isolation; the toxins' heterologous expression offers a potential solution to some major obstacles hindering a better understanding of toxin pathophysiology. Through a series of laborious and elegantly crafted experiments, including the reporting of various failed attempts, the authors establish the expression of all three SVMP subtypes and prove their activity in bioassays. The expression is carried out as naturally occurring zymogens that autocleave upon exposure to zinc, which is a novel modus operandi for yielding fusion proteins and sheds also some new light on the potential mechanism that snakes use to activate enzymatic toxins from zymogenic preforms.
Strengths:
The manuscript draws from an extensive portfolio of well-reasoned and hypothesis-driven experiments that lead to a stepwise solution. The wetlands data generated is outstanding, although not all experiments along this rocky road to victory were successful. A major strength of the paper is that, translationally speaking, it opens up novel routes for biodiscovery since a first reliable platform for expression of an understudied, yet potent toxin class is established. The discovered strategy to pursue expression as zymogens could see broad application in venom biotechnology, where several toxin types are pending successful expression. The work further provides better insights into how snake toxins are processed.
We thank the reviewer for their positive assessment of our work.
Weaknesses:
The manuscript contains several chapters reporting failed experiments, which makes it difficult to follow in places.
Based on a similar comment of Reviewer 1, we now moved the ‘failed’ experiments reporting on SVMP expression optimisation to the supplement as new supplementary text. We hope that the revisions have improved the clarity and overall readability of our manuscript.
The reporting of experimental details, especially sample sizes and replicates, could be optimised.
The number of replicates has now been added to the figure legends in the revised manuscript. Detailed experimental information is found in the revised Methods part.
At the time of writing, it remains unclear whether the glycosilations detected at a pIII SVMP could have an impact on the bioactivities measured, which is a major aspect, and future follow-ups should clarify this.
A detailed analysis of glycosylation of the PIII SVMP is beyond the scope of our manuscript (see above, response to Reviewer 2). Our manuscript describes a generic protocol to produce active SVMPs. Importantly, we cannot purify the native PIII SVMP from Echis carinatus sochureki venom. Therefore, it is not possible to compare our PIII SVMP with the native PIII SVMP.
We agree that this is an important question, and we will aim in the future to perform such a comparison of a different insect cell-produced PIII with a native PIII SVMP that can be readily purified from venom.
Finally, the work, albeit of critical importance, would benefit from a more down-to-earth evaluation of its findings, as still various persistent obstacles that need to be overcome.
We consider cytotoxicity to be the principal bottleneck in SVMP production. In this study, we present a strategy to overcome this bottleneck.
Major comments to the manuscript:
(1) Lines 148-149: "indicating that expressing inactivated SVMPs could be a viable, although inefficient, approach". I think this text serves a good purpose to express some thoughts on the nature of how the current draft is set up. It is quite established that various proteases cause extreme viability losses to their expression host (whether due to toxicity, but surely also because of metabolic burden), which is why their expression as inactive fusion proteins is the default strategy in all cases I have thus far seen. I believe that, especially in venom studies, this is of importance given the increased toxicity often targeting cellular integrity, and especially here, because Echis are known to feed on arthropods at younger life history stages, making it very likely that some venom components are especially active against insects and other invertebrates. With that in mind, I would argue that exploring their production in inactive form is the obvious strategy one would come up with and not really the conclusion of a series of (well-conducted and scientifically sound!) experiments. For me, the insight of inactive expression is largely confirmatory of what is established, unless I miss something in the authors' rationale. If yes, it would be important to clarify that in the online version.
We agree that producing zymogens represents a straightforward strategy and now, in hindsight, would have wished we had tested this first thing, it would have saved us and apparently many others significant effort. However, realising this, and implementing this approach took us considerable time and insight as we described in this manuscript. The alternative strategies we describe in the manuscript, in particular the use of inhibitors and active-site mutation, have been successfully applied for recombinant production of diverse enzymes before, including enzymes that are toxic to host cells.
We have revised the manuscript as requested and moved the optimisation of SVMP expression to the Supplement. We hope this improved the clarity, overall readability of the text and thus addressed the reviewer’s comment.
(2) Line 173: Here, Alphafold 3 was used, whereas in previous sections (e.g., line 153, line 210), it was Alphafold 2. I suggest using one release across the manuscript.
Thank you for bringing this to our attention. In the revised version of the manuscript, we clarified that all models were generated using AlphaFold 3.
(3) Line 252-254: I fully agree, the PIII SVMP is glycosylated. Glycosylation is an important mediator of snake venom activity, and several works have described their importance in the field. This raises the question, which glycosylations have been introduced here in the SVMP, and to verify that these are glycosylations that belong to those found in snakes. This is important as insects facilitate thousands of N- and O- O-glycosylations to modulate the activity of their proteome, of which many are specific to insects. If some of these were integrated into the SVMP, this could have an impact on downstream produced bioassays and also antigenicity (the surface would be somewhat different from natural toxins, causing different selection).
We agree that glycosylation is important and warrants a follow-up in the future.
However, most publications we found reported that de-glycosylation has a negative effect on stability and solubility of SVMPs, which is expected to have a knock-on effect on toxin activity (e.g. AndradeSilva et al., 2025; DOI: 10.1021/acs.jproteome.5c00249). It will be difficult to separate the two effects from each other. We found only a few examples where SVMP glycosylation (sialylation and Nglycosylation) modulated proteolytic and haemorrhagic functions, including interaction with substrates such as e.g. fibrinogen (Schluga et al., 2024; https://doi.org/10.3390/toxins16110486; Chen et al., 2008; 10.1111/j.1742-4658.2008.06540.x; Nikai et al., 2000; DOI: 10.1006/abbi.2000.1795. PMID: 10871038). In our manuscript, we show that our PIII SVMP is very cytotoxic and highly active in casein, fibrinogen and ESO10 degradation assays, with a K<sub>M</sub> and k<sub>cat</sub>/K<sub>M</sub> comparing favourably with other SVMPs and MMPs. We are not aware of a specific substrate for this particular PIII SVMP that depends on a distinct glycosylation pattern. Recombinant production of such SVMPs with specific glycosylation pattern requirement would be a challenge in all commonly used expression systems (yeast, plant, insect cells and mammalian cells). In fact, insect cell expression systems could be advantageous in this respect because the Sf21 and High Five (Hi5) lepidopteran cell lines we utilised are well-characterized for their ability to perform posttranslational modifications on complex secreted proteins:
(1) N-Glycan conservation: Both Sf21 and Hi5 cells typically produce N-glycans that are trimmed to a core 'paucimannose' structure (Man3GlcNAc2), often with an alpha1,6-fucosylation. While snakes can produce more complex, sialylated N-glycans, glycomic studies of native venoms (e.g., Bothrops venom) have demonstrated that high-mannose and paucimannose structures are also prevalent in native SVMPs. Therefore, the recombinant glycoforms produced in our system are not 'unnatural' in the snake venom context but rather represent a subset of the native glycan microheterogeneity.
(2) Occupancy vs structure: The critical function of glycosylation in PIII SVMPs is thought to be often structural, facilitating correct folding and protecting the large metalloprotease and disintegrin-like domains from proteolytic degradation. Because Sf21 and Hi5 cells recognize the same Nglycosylation sequon (Asn-X-Ser/Thr) as reptilian cells, the site-occupancy remains consistent with the native protein, preserving the overall topography of the toxin.
(3) Activity and authentic self-processing: We acknowledge that insect-specific alpha1,3-fucosylation can occur in Hi5 cells and is potentially antigenic. As the recombinant SVMPs will be used for binder selections and for testing in silico designed binders, useful binders will be selected based on neutralising activity against venom toxins. Here, our assays focused on auto-activation and proteolytic activity, which is primarily driven by the catalytic Zn<sup>2+</sup>-site and the protein backbone.
As stated above, analysis of glycosylation pattern of the PIII SVMP is a project on its own and beyond the scope of this manuscript.
We have incorporated some of the above information into the discussion section of the revised manuscript to clarify that insect cell glycosylation does not recapitulate the full diversity of SVMP glycosylation observed in native venoms.
(4) General comment for the bioassays: It would be good to specify the replicates again and report the data, including standard deviations.
We included this information in the figure legends.
Discussion:
I think the data generated in the study is very valuable and will be instrumental for pushing the frontiers in SVMP research, but still I would like to see a bit of modesty in their discussion. As I have pointed out above, it is unclear which effect the glycosilations may have (i.e., are the glycosilations found reminiscent of natural ones?), despite their being functionally important. Also, yes, isolation of SVMPs is challenging, but the reality is that their expression is equally challenging, as evidenced by the heaps of presented negative data (with which I have no problems, I think reporting such is actually important). So far, the "generic" protocol has been used to express one member per structural class of Echis SVMP, but no evidence is provided that it would work equally well on other members from taxonomically more distant snakes (e.g., the pIII known from Naja oxiana). It is very likely, but at the time of writing, purely speculative.
We have expressed additional PIII SVMPs from Echis and Daboia species and will report their production and characterisation in due course.
Lastly, the reality is also that the expression in insect cells can only be carried out by highly specialized labs (even in the expression world, as most laboratories work with bacterial or fungal hosts), whereas the isolation can be attempted in most venom labs. That said, production in insect cells also has economic repercussions as it will be very challenging to generate yields that are economically viable versus other systems, which is pivotal because the authors talk about bioprospecting and the toxins used in snakebite agent research.
We thank the reviewer for this perspective on the practicalities of protein expression. However, we respectfully disagree with the characterization of insect cell expression as an inaccessible or economically non-viable platform for toxin research. We offer the following points:
(1) Prevalence and accessibility: Contrary to the suggestion that insect cell expression is restricted to highly specialized labs, the Baculovirus Expression Vector System (BEVS) has become a cornerstone of modern biologics production, structural biology and biochemistry. For instance, our MultiBac system (which is but one of several systems currently widely in use) is utilised by over 1,000 laboratories and institutions, academic and pharma/biotech, worldwide. The maturation of commercially available kits, automated platforms, and standardized protocols has moved this technology into the mainstream, making it a standard tool for any lab requiring high-quality eukaryotic proteins.
(2) Biological necessity: Bacterial (E. coli) and fungal (P. pastoris) systems are widely accessible, however, they appear to be fundamentally incapable of producing functional SVMPs. SVMPs require complex disulfide-bond formation, intricate folding, and N-glycosylation for stability and solubility. Bacterial systems have been widely tried by us and others but typically result in very low expression or misfolded inclusion bodies. Of note, originally, we had invested significant effort to adapt P. pastoris to the production of eukaryotic proteins we are interested in, without success, before moving on to the MultiBac system. The SVMPs that we analysed here are highly cytotoxic, rendering the baculovirus/insect cell system in a way a logical choice given that the cells are no longer 'living' after infection with the baculovirus (but more akin membrane-enveloped bioreactors). Thus, one can make the argument that insect cells represent the most accessible middle ground that provides folding apparatus and necessary post-translational modifications (PTMs) required for biological relevance, and it is possible to produce mg amounts of SVMP proteins per litre cell culture as reported here in our manuscript.
(3) Economic viability and bioprospecting: Regarding the economic argument, we contend that viability in bioprospecting is defined by functional yield rather than simple volume. Producing large quantities of non-functional or misfolded protein in a cheaper system is economically inefficient. Furthermore, for snakebite research, the ability to produce specific, pure isoforms recombinantly without the contamination of other toxic venom components found in native isolations is essential for high-throughput screening and drug design.
(4) Scalability: Historically, insect cell production was seen as expensive, but current bioreactor technology and reduction in consumables and media costs allow for significant scaling. Many therapeutic reagents (vaccines, viral vectors, protein biologics) are produced routinely in baculovirus/insect cells. For the purposes of bioprospecting and lead identification, the yields provided by our Hi5/Sf21 system are sufficient for rigorous downstream bioassays and structural characterization.
Again, I believe the paper is highly important and excellently crafted, but I think especially the discussion should see some refinement to address the drawbacks and to evaluate the paper's findings with more modesty.
Thank you. We included the discussion about glycosylation patterns.
Recommendations for the authors:
Reviewer #1 (Recommendations for the authors):
(1) It is not entirely clear to me if the final constructs are indeed "fusion-proteins" (line 172, 974), in the sense of chimeric proteins. From the current description, it appears that the prodomain is encoded in the same gene rather than fused as a separate domain. Thus, referring to these constructs as fusion proteins may overstate the degree of protein engineering involved in the study.
This is correct. In the revised manuscript, ‘fusion protein’ is only used in the context of the propeptide SVMP fusion construct to avoid confusion.
(2) Figure 2J: It is difficult to assess how much protein is secreted relative to the intracellular amounts. The blot is surely misleading, as the effective protein dilution differs substantially between intracellularly vs. extracellularly. Providing an estimate of the relative dilution of extracellular protein would help clarify the extent of secretion.
We estimate that the SNP and SN fractions are at least 10-times more concentrated than the media fraction. The blot is analytical and not quantitative.
(3) The manuscript appears to use both alphafold 2 and alphafold 3 for structural predictions. Clarification on the choice of the version and its impact on results would improve consistency.
In the revised version of the manuscript, we clarify that all structural models were generated using AlphaFold 3.
(4) Figure S3b and others: a clear description of the antibodies used in the Western blots would be appreciated (including in the methods).
We included this information in the figure legends and a paragraph in the methods section for Western blots in the revised manuscript.
(5) MTT cytotoxicity testing would be more convincing if done in a concentration-dependent manner.
We repeated this assay using different concentrations of SVMPs and show the results as a new Figure 5f in the revised manuscript.
(6) Figure S3c: It could be interesting to show the sequence coverage to get an impression of what part of the protein is there.
We have included this information as Supplementary Figure S4d in the revised manuscript.
Reviewer #2 (Recommendations for the authors):
Overall, the study is presented in a step-by-step manner, and its conclusions are valid.
(1) As suggested in the public review, further characterization of the purified material would be good, for example, by intact mass-spectroscopy to characterize the enzymes in further detail.
Preliminary MALDI-MS analysis (performed in Loic Quinton’s laboratory) of our PIII SVMP revealed a broad and heterogeneous mass distribution, consistent with heterogeneity caused by the presence of multiple glycoforms (which is not unlike the microheterogeneity in native snake venom). However, owing to the inherent limitations of MALDI-MS for the analysis of glycoproteins, our data do not allow determination of the number of occupied N-glycosylation sites or the identification of additional types of glycosylation.
Moreover, the relatively large molecular mass of these proteins (zymogen 70.2 kDa protein only, mature PIII 50.6 kDa protein only) makes analysis by electrospray ionisation mass spectrometry technically challenging.
An MS-based deep analysis of the glycosylation patterns would therefore be a project on its own, and beyond the scope of the present manuscript.
(2) The studies involving PII appear challenging due to low yields and stability of the enzyme and the mentioned self-degradation. Some studies, such as the casein-degradation, would benefit from working with a well-characterized batch of enzymes to ensure, it is not auto-degrading during the experiment.
We believe that the finding that the PII SVMP degrades itself after incubation with Zn<sup>2+</sup> is an important observation. It is novel to the best of our knowledge. Moreover, the key message of our manuscript is that we can produce and characterise novel SVMPs that cannot be readily purified from venom (and thus are not well characterised).
Besides, there are very few intact PII SVMPs in venom (e.g. Suntravat et al. BMC Molecular Biol 2016); the vast majority cleaves itself into a PI and a disintegrin.
(3) Figure 4h. Degradation of insulin is only shown for recombinant PIII, not the native enzyme, and therefore doesn't convey any information with respect to how well they compare.
We do not have available any native PII and PIII SVMPs for a comparison with the recombinant SVMPs (in our manuscript we show expression of new, uncharacterised SVMPs). We have included the PIII SVMP in the original manuscript to show that the enzyme is active and has a different specificity compared to PI SVMP. In the revised manuscript, we also included the PII SVMP insulin B degradation assay in Supplementary Figure S11b.
(4) Figure 5a. Inconsistent use of enzymes - data for PII is presented (both as mature protein and Zymogen) and compared to PIII, but not PI, as both zymogen and mature protein. The current data presentation is confusing and gives the idea of the manuscript assembled with figures produced during the exploratory phase of the study, and not from subsequent experiments systematically conducted for the purposes of clarity and completeness.
In the revised manuscript, we included the missing enzymatic characterisations in Figure 5 (panel a and e) and Supplementary Figure S11a-c. These data were initially not included because the respective enzymes are inactive in these assays.
(5) The manuscript would benefit from editing to make it more concise. For an early-career reader, it is of interest and utility to follow the thought and experimental processes that led to the successful solution, but there is a risk of losing the reader's interest along the way by going through expression experiments that did not "work" in the typical sense of the word. To this reviewer, there is no added value in a full paragraph around co-expression with disulfide isomerase, as it did not improve the protein yield. A single sentence, "co-expression with PDI did not improve yields," with a reference to a supplemental figure would convey that message.
We have moved the optimisation of SVMP expression to the Supplementary Information, which we hope has improved the clarity and flow of the main text.
We note that the hypothesis that co-expression of protein disulfide isomerases (PDIs) enhances yields of functional SVMPs, given the high expression of PDIs in snake venom gland cells, is well established in the field. While we consider PDIs (and other chaperones) likely to play an important role in SVMP expression, we were unable to demonstrate this effect using the baculovirus-insect cell expression system and hypothesize that efficient insect and/or baculoviral PDIs are already present.
(6) Similarly with N-linked glycosylation, the section needs a headline (line 241) and firming up of a sentence like "and possibly not all of the glycosylation..." which is vague and appears to state that it was not really of interest to pursue this further. My view is that either an experiment is done properly with a stated aim and purpose, interpreted, and then, based on whether the results are of interest to the main story or not, they are included. If N-linked glycosylation is to be included in the manuscript, it should be with a purpose (e.g., N-linked glycosylation affects enzyme activity). As it stands, the message is "there is some N-linked glycosylation" without further explanation, and this generates information without justifying the inclusion hereof.
Please see our reply above regarding an in-depth characterisation of insect cell glycosylation of the recombinant PIII SVMP without access to the native enzyme for comparison. In our revised manuscript, we confirm that the PIII SVMP is glycosylated and that this at least partly accounts for the apparent discrepancy in molecular weight observed in SEC and SDS PAGE. We have modified the text to clarify the purpose of the PNGase deglycosylation experiment.
(7) The manuscript, in its current form, appears to have been copied from a Thesis with very detailed step-by-step logic and description. While this is useful in a scholarly context, a scientific manuscript should be presented more compactly, assuming the readers know basic biochemistry.
We trust that this Reviewer finds the revised version of our manuscript more compact and concise.
Reviewer #3 (Recommendations for the authors):
(1) Material and Methods plus Figures:
Please report the number of replicates per experiment and how data is presented (means/ medians/ standard deviation/ others), and add error bars to the plots where needed.
In the revised manuscript we have included the number of repeats in the figure legends.
(2) Abstract
Line 4: I would not say that SVMPs are the most potent viper toxins. This place is probably taken by some of the highly neurotoxic PLA2, such as Crotoxin. Nevertheless, SVMPs are surely some of the most important toxins responsible for pathophysiological effects stemming from viper envenoming, but I would suggest rephrasing for accuracy.
In the revised manuscript, we have modified this sentence.
(3) Introduction
Lines 27-31: I would like to see a reference supporting the existence of all SVMP types across vipers.
We have included references supporting the existence of PI, PII and PIII SVMPs in viper venom. We also rewrote the sentence to state that “representatives of all three sub-classes are present in different viper venoms.” This clarifies that we do not say that all classes are present in all venoms.
Lines 59-60: I am not sure if this should be considered such an important impediment. Essentially, many vipers yield double- to triple-digit mg amounts of crude venom per specimen from only a single milking.
We have rewritten this text in the revised manuscript.
Currently, it is not possible to purify any given SVMP of interest from venom; in particular for E. ocellatus SVMP isoform mixtures are typically purified rather than individual enzymes (see also introduction section of our manuscript line 57ff). Also, many SVMPs are not present in sufficient amounts in the venom. Here, we provide an approach to recombinantly produce any SVMP of interest, independent of its abundance in the venom.
(4) Results
Line 102: The army-fallworms name is Spodoptera, not Spotoptera. Please correct the typo.
Done. Apologies for our oversight.
Line 311: Please provide the data at least as a supplement.
In the revised manuscript, we have included this experiment in Supplementary Figure S6c.
Line 432- 433: It would be useful to clarify whether the protein should have a pro-coagulant activity (or not).
We have changed this sentence as follows in the revised manuscript: This shows that our recombinantly produced SVMPs have no pro-coagulant activity, which was unknown before.
Author response:
The following is the authors’ response to the original reviews.
Public Reviews:
Reviewer #1 (Public review):
(1) The pathogenic mechanism of the E182STOP variant is unclear. The mutant protein does not appear to affect WT protein localization, arguing against a dominant-negative effect. Yet, overexpression of HSD17B7-E182* alone causes toxicity in zebrafish and mislocalizes cholesterol in HEI-OC1 cells, suggesting a gain-of-function or toxic effect. In addition, the variant mRNA is expressed at a low level, consistent with nonsense-mediated decay. This apparent complexity and inconsistency need clearer explanation.
We appreciate the reviewer’s careful evaluation of this mechanistic complexity. Based on our combined molecular, cellular, and in vivo data, we propose that the pathogenic effect of the HSD17B7-E182* variant reflects a composite mechanism, rather than a classical dominant-negative effect.
At the transcript level, the E182* variant introduces a premature termination codon and shows markedly reduced mRNA abundance, consistent with partial degradation by nonsense-mediated mRNA decay. This reduction is expected to decrease overall HSD17B7 dosage, contributing a loss-of-function component. Unlike HSD17B7, the truncated HSD17B7<sup>E182*</sup> mislocalizes cholesterol in HEI-OC1 cells, and overexpression alone reduces hair cell MET function and startle response in zebrafish embryos. We therefore propose that the truncated protein disturbing local cholesterol homeostasis, thereby exerts a toxic or ectopic gain-of-function.
We have revised the manuscript to clarify the dual-mechanism model.
(2) The link to human deafness is based on a single heterozygous patient with no syndromic features. Given that nearly all known cholesterol metabolism disorders are syndromic, this raises concerns about causality or specificity. The term "novel deafness gene" is premature without additional cases or segregation data.
We thank the reviewer for this important point. We fully agree that, based on a single heterozygous case without segregation data, it is premature to designate HSD17B7 as a novel deafness gene. Therefore, we have revised the manuscript to use the description of "candidate deafness genes".
(3) The localization of HSD17B7 should be clarified better: In HEI-OC1 cells, HSD17B7 localizes to the ER, as expected. In mouse hair cells, the staining pattern is cytosolic and almost perfectly overlaps with the hair cell marker used, Myo7a. This needs to be discussed. Without KO tissue, HSD17B7 antibody specificity remains uncertain.
We thank the reviewer for the constructive comments regarding HSD17B7 localization and antibody specificity.
Regarding subcellular localization, the original Figure 1K was intended to demonstrate the expression of HSD17B7 in mouse hair cells. To address this concern, we performed additional immunostaining on dissected organ of Corti sections at P1, P4, and P7 using higher magnification. Using parvalbumin as a hair cell marker, HSD17B7 displayed a partially punctate intracellular pattern in hair cells (revised Figure 1K). This pattern is consistent with localization to membrane-associated compartments, including the endoplasmic reticulum, and agrees with the ER-associated localization observed in HEI-OC1 cells and zebrafish hair cells. In mature hair cells, ER-associated signals may appear cytosolic and overlap with general hair cell markers such as Myo7a.
Regarding antibody specificity, although HSD17B7 knockout tissue was not available, we performed complementary validation experiments in HEI-OC1 cells. Cells were transfected with pCMV-Flag, pCMV-Flag-hHSD17B7WT, or pCMV-hHSD17B7WT-EGFP constructs and stained with anti-Flag, anti-EGFP, and anti-HSD17B7 antibodies. The HSD17B7 antibody signal showed strong co-localization with both FLAG- and EGFP-tagged HSD17B7 (revised Figure S1A and B), supporting its specificity.
Reviewer #2 (Public review):
(1) The statement that HSD17B7 is "highly" expressed in sensory hair cells in mice and zebrafish seems incorrect for zebrafish:
(a) The data do not support the notion that HSB17B7 is "highly expressed" in zebrafish. Compared to other genes (TMC1, TMIE, and others), the HSB17B7 level of expression in neuromast hair cells is low (Figure 1F), and by extension (Figure 1C), also in all hair cells. This interpretation is in line with the weak detection of an mRNA signal by ISH (Figure 1G I"). On this note, the staining reported in I" does not seem to label the cytoplasm of neuromast hair cells. An antisense probe control, along with a positive control (such as TMC1 or another), is necessary to interpret the ISH signal in the neuromast.
We thank the reviewer for this detailed evaluation and agree that the description of HSD17B7 expression in zebrafish hair cells requires clarification.
To address this, we performed a quantitative comparison of average expression levels within neuromast hair cells using log-normalized single-cell RNA-seq data. This analysis shows that hsd17b7 is expressed at a level comparable to several known MET-associated genes (e.g., tmc1 and lhfpl5a) (revised Figure 1D). Regarding the pseudotime heatmap (Figure 1F), we now state that this analysis illustrates temporal expression dynamics within neuromast hair cell development.
In addition, we have clarified the interpretation of the whole-mount in situ hybridization data by emphasizing that the signal indicates spatial enrichment rather than high transcript abundance.
We have updated the figure panels, legends, and corresponding text in the Results section to reflect these changes.
(b) However, this is correct for mouse cochlear hair cells, based on single-cell RNA-seq published databases and immunostaining performed in the study. However, the specificity of the anti-HSD17B7 antibody used in the study (in immunostaining and western blot) is not demonstrated. Additionally, it stains some supporting cells or nerve terminals. Was that expression expected?
To assess antibody specificity, we performed validation experiments using distinct epitopes. In HEI-OC1 cells transfected with pCMV-Flag-HSD17B7, or pCMV-HSD17B7-EGFP constructs, immunostaining with anti-HSD17B7 showed strong co-localization with both FLAG- and EGFP-tag (revised Figure S1B). In addition, western blot analyses using the same constructs confirmed the specific detection of HSD17B7 protein (revised Figure S1B). These validation data have now been included as supplementary figures in the revised manuscript and provide independent supporting evidence for the specificity of the anti-HSD17B7 antibody.
(2) A previous report showed that HSD17B7 is expressed in mouse vestibular hair cells by single-cell RNAseq and immunostaining in mice, but it is not cited: Spatiotemporal dynamics of inner ear sensory and non-sensory cells revealed by single-cell transcriptomics. Jan TA, Eltawil Y, Ling AH, Chen L, Ellwanger DC, Heller S, Cheng AG. Cell Rep. 2021 Jul 13;36(2):109358. doi: 10.1016/j.celrep.2021.109358.
We have now cited this reference in the revised manuscript.
(3) Overexpressed HSD17B7-EGFP C-terminal fusion in zebrafish hair cells shows a punctiform signal in the soma but apparently does not stain the hair bundles. One limitation is the consequence of the C-terminal EGFP fusion to HSD17B7 on its function, which is not discussed.
We thank the reviewer for raising this important technical point. The apparent absence of an HSD17B7-EGFP signal in hair bundles is primarily due to the imaging strategy and the selection of representative images. In zebrafish hair cells, the EGFP signal within hair bundles is extremely strong. To better visualize the intracellular distribution of HSD17B7 within the hair cell soma, we selected representative confocal optical sections that were focused on the cell body rather than on the apical hair bundle plane. As a result, the hair bundle signal is not visible in the images shown.
Importantly, we agree that C-terminal EGFP fusion may potentially influence protein localization or function. We have therefore revised the Discussion to discuss this limitation and to clarify that our central conclusions regarding HSD17B7 function are primarily supported by loss-of-function analyses, rescue experiments using untagged mRNA, and cholesterol perturbation phenotypes, rather than relying solely on EGFP-tagged overexpression constructs.
(4) A mutant Zebrafish CRISPR was generated, leading to a truncation after the first 96 aa out of the 340 aa total. It is unclear why the gene editing was not done closer to the ATG. This allele may conserve some function, which is not discussed.
Targeting regions close to the ATG is indeed a commonly used strategy for CRISPR-mediated gene disruption. In this study, sgRNA selection was guided by online CRISPR design tools (CRISPRscan), prioritizing predicted cutting efficiency and specificity. This strategy resulted in a frameshift mutation introducing a premature stop codon after amino acid 96 of the 340-aa Hsd17b7 protein.
Importantly, this truncation removes most of the conserved catalytic core required for 17β-hydroxysteroid dehydrogenase activity, including key motifs involved in NAD(P)-binding and substrate recognition. Therefore, although the mutation does not occur immediately adjacent to the ATG, the resulting allele is predicted to lack enzymatic function. We have clarified this rationale and discussed the functional consequences of the truncation in the revised manuscript.
(5) The hsd17b7 mutant allele has a slightly reduced number of genetically labeled hair cells (quantified as a 16% reduction, estimated at 1-2 HC of the 9 HC present per neuromast). On a note, it is unclear what criteria were used to select HC in the picture. Some Brn3C:mGFP positive cells are apparently not included in the quantifications (Figure 2F, Figure 5A).
Upon re-evaluation, we recognized that the original figure annotations were not sufficiently clear and may have led to confusion regarding hair cell selection. In the original images, the absence of dashed outlines around some Brn3c:mGFP<sup>+</sup> cells may have been misinterpreted as their exclusion from analysis. To address this issue, we have revised Figures 2F and 5A by updating the annotations to ensure that all Brn3c:mGFP<sup>+</sup> hair cells within each neuromast are clearly visible and unambiguously included (revised Figures 2F and 6A). Corresponding figure legends have also been revised to clarify the criteria used for hair cell identification and quantification.
(6) The authors used FM4-64 staining to evaluate the hair cell mechanotransduction activity indirectly. They found a 40% reduction in labeling intensity in the HCs of the lateral line neuromast. Because the reduction of hair cell number (16%) is inferior to the reduction of FM4-64 staining, the authors argue that it indicates that the defect is primarily affecting the mechanotransduction function rather than the number of HCs. This argument is insufficient. Indeed, a scenario could be that some HC cells died and have been eliminated, while others are also engaged in this path and no longer perform the MET function. The numbers would then match. If single-cell staining can be resolved, one could determine the FM4-64 intensity per cell. It would also be informative to evaluate the potential occurrence of cell death in this mutant. On another note, the current quantification of the FM4-64 fluorescence intensity and its normalization are not described in the methods. More importantly, an independent and more direct experimental assay is needed to confirm this point. For example, using a GCaMP6-T2A-RFP allele for Ca2+ imaging and signal normalization.
We have revised the FM4-64 quantification strategy. Instead of measuring fluorescence intensity at the neuromast level, FM4-64 uptake was re-quantified at the single hair cell level. Hair cells within each neuromast were identified based on mGFP labeling, and the mean FM4-64 fluorescence intensity was measured for each individual hair cell. The average FM4-64 intensity per hair cell was then calculated for each neuromast and used for group comparisons (revised Figures 2F, 6B, and 8B, Figure S5B). The updated quantification method, normalization procedure, and analysis pipeline have now been described in the revised Methods section.
As supportive evidence, we further analyzed single-cell RNA-seq data from control and hsd17b7 mutant hair cells (revised Figure 3). This analysis revealed dysregulation of multiple genes involved in the MET machinery, including reduced expression of tip-link–associated components and altered expression of other MET-related genes. While these transcriptional changes do not constitute a direct functional assay, they are consistent with perturbation of MET-associated pathways and complement the FM4-64 findings.
(7) The authors used an acoustic startle response to elicit a behavioral response from the larvae and evaluate the "auditory response". They found a significative decrease in the response (movement trajectory, swimming velocity, distance) in the hsd17b7 mutant. The authors conclude that this gene is crucial for the "auditory function in zebrafish".
This is an overstatement:
(a) First, this test is adequate as a screening tool to identify animals that have lost completely the behavioral response to this acoustic and vibrational stimulation, which also involves a motor response. However, additional tests are required to confirm an auditory origin of the defect, such as Auditory Evoked Potential recordings, or for the vestibular function, the Vestibulo-Ocular Reflex.
We thank the reviewer for highlighting the limitations in interpreting the acoustic startle assay. We have revised the manuscript to avoid overstatement and now describe the observed phenotype as a reduction in the behavioral response to acoustic and vibrational stimulation, rather than concluding a specific impairment of auditory function.
(b) Secondly, the behavioral defects observed in the mutant compared to the control are significantly different, but the differences are slight, contained within the Standard Deviation (20% for velocity, 25% for distance). To this point, the Figure 2 B and C plots are misleading because their y-axis do not start at 0.
We have corrected Figures 2B and 2C so that the y-axes start at zero, thereby providing a more transparent visualization of the behavioral differences. The figure legends have also been revised to clarify the presentation of the data.
(8) Overexpression of HSD17B7 in cell line HEI-OC1 apparently "significantly increases" the intensity of cholesterol-related signal using a genetically encoded fluorescent sensor (D4H-mCherry). However, the description of this quantification (per cell or per surface area) and the normalization of the fluorescent signal are not provided.
The quantification of the D4H-mCherry signal in HEI-OC1 cells was performed at the single-cell level. Specifically, individual cells were segmented based on morphology, and the mean fluorescence intensity of D4H-mCherry per cell was measured. To account for variability in cell size and imaging conditions, fluorescence intensity was normalized to the background signal measured from cell-free regions in the same field of view. We have now clarified the quantification strategy and normalization procedure in the revised Methods and Results sections.
(9) When this experiment is conducted in vivo in zebrafish, a reduction in the "DH4 relative intensity" is detected (same issue with the absence of a detailed method description). However, as the difference is smaller than the standard deviation, this raises questions about the biological relevance of this result.
We have now clarified the quantification strategy and normalization procedure in the revised Methods and Results sections.
(10) The authors identified a deaf child as a carrier of a nonsense mutation in HSB17B7, which is predicted to terminate the HSB17B7 protein before the transmembrane domain. However, as no genetic linkage is possible, the causality is not demonstrated.
We thank the reviewer for raising this important point. Unfortunately, we were unable to obtain the parents' genetic testing data to perform formal genetic and linkage analysis. To address this limitation, we have revised the manuscript to avoid causal overstatement and now describe the HSD17B7 E182* variant as a candidate pathogenic variant associated with hearing loss. Importantly, our functional analyses in zebrafish and cell-based systems demonstrate that the E182* truncation abolishes key biological activities of HSD17B7, including subcellular localization, cholesterol regulation, mechanotransduction-related activity, and behavioral responses. These convergent functional data provide biological support for the potential pathogenic relevance of this variant.
(11) Previous results obtained from mouse HSD17B7-KO (citation below) are not described in sufficient detail. This is critical because, in this paper, the mouse loss-of-function of HSD17B7 is embryonically lethal, whereas no apparent phenotype was reported in heterozygotes, which are viable and fertile. Therefore, it seems unlikely that heterozygous mice exhibit hearing loss or vestibular defects; however, it would be essential to verify this to support the notion that the truncated allele found in one patient is causal.
Hydroxysteroid (17beta) dehydrogenase 7 activity is essential for fetal de novo cholesterol synthesis and for neuroectodermal survival and cardiovascular differentiation in early mouse embryos.
Jokela H, Rantakari P, Lamminen T, Strauss L, Ola R, Mutka AL, Gylling H, Miettinen T,
Pakarinen P, Sainio K, Poutanen M. Endocrinology. 2010 Apr;151(4):1884-92. doi: 10.1210/en.2009-0928. Epub 2010 Feb 25.
We thank the reviewer for raising this important point. We acknowledge that previous work has shown that complete loss of Hsd17b7 in mice is embryonically lethal, whereas heterozygous animals are viable and fertile (Jokela et al., 2010). Notably, this study primarily focused on embryonic development, cholesterol metabolism, and cardiovascular and neuroectodermal survival, and auditory or vestibular functions were not specifically examined. Therefore, subtle or sensory organ–specific phenotypes in heterozygous mice cannot be excluded.
The human variant identified in this study (E182*) is a nonsense mutation predicted to truncate the HSD17B7 protein prior to the transmembrane and cytoplasmic domains. We therefore present it as a candidate loss-of-function variant, providing supportive human genetic evidence that is consistent with our functional analyses in zebrafish hair cells, rather than as definitive proof of causality. We have revised the manuscript to clarify these points and to acknowledge this limitation.
(12) The authors used this truncated protein in their startle response and FM4-64 assays. First, they show that contrary to the WT version, this truncated form cannot rescue their phenotypes when overexpressed. Secondly, they tested whether this truncated protein could recapitulate the startle reflex and FM4-64 phenotypes of the mutant allele. At the homozygous level (not mentioned by the way), it can apparently do so to a lesser degree than the previous mutant. Again, the differences are within the Standard Deviation of the averages. The authors conclude that this mutation found in humans has a "negative effect" on hearing, which is again not supported by the data.
We thank the reviewer for this important comment. We agree that the overexpression strategy employed in this study does not fully replicate the endogenous heterozygous state observed in patients, and that the magnitude of the observed effects varies across samples. Accordingly, our experiments were not intended to demonstrate a definitive causal role of the HSD17B7 <sup>E182*</sup> variant in hearing loss.
Instead, the overexpression assays were designed to assess whether the truncated HSD17B7 protein displays abnormal cellular properties and whether its presence can interfere with processes relevant to hair cell function. Under these conditions, HSD17B7<sup>E182*</sup> exhibited aberrant subcellular localization, altered intracellular cholesterol distribution, and was associated with reduced FM4-64 uptake and changes in startle-associated behaviors, whereas the wild-type protein did not.
We revised the manuscript to moderate our conclusions. Rather than claim that the E182* mutation has a definitive “negative effect on auditory function,” we now describe it as a functionally compromised allele that disrupts cholesterol distribution and MET-related activity under overexpression conditions, providing mechanistic support consistent with our zebrafish loss-of-function data and the identification of this variant in a patient with hearing loss. In addition, the "negative effect" statement was based on the result that overexpression of the E182* mutation in wild-type embryos caused the compromised MET function and startle response defect.
(13) The authors looked at the distribution of the HSB17B7 in a cell line. The WT version goes to the ER, while the truncated one forms aggregates. An interesting experiment consisted of co-expressing both constructs (Figure S6) to see whether the truncated version would mislocalize the WT version, which could be a mechanism for a dominant phenotype. However, this is not the case.
We thank the reviewer for raising this important point regarding a potential dominant-negative mechanism. Consistent with the reviewer’s interpretation, we found that HSD17B7<sup>WT</sup> predominantly localizes to the endoplasmic reticulum, whereas the truncated HSD17B7<sup>E182*</sup> protein forms intracellular aggregates. Importantly, we further observed that the E182* mutation markedly reduces the stability of both HSD17B7 mRNA and protein, resulting in substantially decreased abundance of the truncated protein (Figure S6B–E). As a consequence, the cellular levels of HSD17B7^E182* are abnormally low.
Based on these findings, we consider it unlikely that the E182* variant exerts its effect through interference with the wild-type protein. Our results suggest that the heterozygous c.544G>T (p.E182*) variant contributes to auditory dysfunction through potential pathogenic mechanisms: 1, haploinsufficiency caused by reduced HSD17B7 expression, 2, functional impairment due to altered protein subcellular localization and cholesterol distribution.
We have revised the Results and Discussion sections. Our conclusions now emphasize that the functional impact of this variant is attributable to decreased effective HSD17B7 dosage, consistent with the observed defects in cholesterol synthesis, MET-related activity, and auditory-associated phenotypes in our model.
(14) Through mass spectrometry of HSB17B7 proteins in the cell line, they identified a protein involved in ER retention, RER1. By biochemistry and in a cell line, they show that truncated HSB17B7 prevents the interaction with RER1, which would explain the subcellular localization.
Consistent with the reviewer’s interpretation, wild-type HSD17B7 interacts with RER1, a protein known to participate in ER retention, whereas this interaction is lost in the truncated HSD17B7 variant. We propose that RER1 is an interacting partner of HSD17B7, providing a mechanistic explanation for the protein's subcellular localization.
(15) Information and specificity validation of the HSB17B7 antibody are not presented. It seems that it is the same used on mice by IF and on zebrafish by Western. If so, the antibody could be used on zebrafish by IF to localize the endogenous protein (not overexpression as done here). Secondly, the specificity of the antibody should be verified on the mutant allele. That would bring confidence that the staining on the mouse is likely specific.
We thank the reviewer for raising this important point regarding antibody specificity and validation. Information on the HSD17B7 antibody and its validation has been provided in our response to comment 1, where we described the use of antibodies recognizing different epitopes and the experimental strategies employed to assess specificity (revised Figure S1A and B).
Although the same antibody was used for Western blot analysis in zebrafish samples, its performance in immunofluorescence staining of zebrafish tissues was suboptimal, with relatively high background. For this reason, we did not rely on this antibody for endogenous Hsd17b7 localization in zebrafish by immunofluorescence and instead employed tagged constructs for subcellular localization analyses. This approach provides more reliable and interpretable localization information under the current experimental conditions.
Recommendations for the authors:
Reviewing Editor Comments:
Suggested revisions to help improve the study and the eLife Assessment:
(1) FM4-64 uptake: Isolate the effect of hair cell loss and MET reduction.
(2) Clarify the mechanistic model: Is the mutant protein pathogenic due to toxicity, lack of expression or function, or both? Come up with a clearer causal chain of events.
(3) Mouse immunostaining: Validate the HSD17B7 antibody, and since mouse RNAseq data (gEAR database) suggest that HSD17B7 expression increases dramatically between P0-P5, show this developmental progression by immunostaining of the mouse organ of Corti at P0, P3, and P5.
(4) The HSD17B7-E182* expression disrupts cholesterol (D4H staining) in OC1 cells. This should also be demonstrated in the mutant zebrafish.
(5) Structural modeling of E182* is uninformative; half the protein is absent. This kind of analysis is better suited for missense variants. Suggest removing this analysis.
We thank the Reviewing Editor for these constructive suggestions. The major points raised here substantially overlap with the concerns raised in the public reviews. In response, we have:
(1) revised FM4-64 quantification and interpretation to better distinguish hair cell loss from MET impairment;
(2) Clarify the mechanistic mode. Mechanistically, the mutation decreases mRNA abundance and significantly reduces protein levels. Moreover, expression of the p.E182* mutation disrupted the interaction between HSD17B7 and the ER retention receptor RER1, leading to aberrant subcellular localization and altered cholesterol distribution, thereby exacerbating HC dysfunction.
(3) provided additional validation of the HSD17B7 antibody using antibodies targeting distinct epitopes, and extended mouse organ of Corti immunostaining to postnatal stages P1, P4, and P7 to demonstrate the developmental upregulation of HSD17B7 expression;
(4) added in vivo zebrafish experiments demonstrating that expression of HSD17B7<sup>E182*</sup> disrupts cholesterol distribution in hair cells, consistent with the effects observed in HEI-OC1 cells using D4H staining;
(5) removed the structural modeling of the E182* variant.
Recommendations for the authors:
The recommendations from Reviewer #1 and Reviewer #2 were carefully considered and addressed. Most of these points overlap with the public reviews and the Reviewing Editor's comments and have been addressed through a revised mechanistic interpretation, additional clarifications in the Methods, more moderate claims regarding auditory function and human genetics, and the removal or revision of potentially misleading analyses. In addition, a number of minor issues were corrected, including missing or incorrect references, repetitive or unclear statements in the Introduction, insufficient methodological details, imprecise terminology, and typographical or formatting errors. Collectively, these revisions improve the clarity, rigor, and transparency of the study without altering its central conclusions.
What strategies do you think might work to improve how social media platforms use recommendations?
Often, many social media sites have a "tag" system when it comes to posts and other content (these sites include YouTube). One way to improve recommendations would be if media sites allowed for users to essentially designate some tags with "not-interested" so that content with those tags are less likely to be recommended. This could help users avoid seeing upsetting content.
Reviewer #1 (Public review):
Summary:
This study examines the role of the long non-coding RNA Dreg1 in regulating Gata3 expression and ILC2 development. Using Dreg1 deficient mice, the authors show a selective loss of ILC2s but not T or NK cells, suggesting a lineage-specific requirement for Dreg1. By integrating public chromatin and TF-binding datasets, they propose a Tcf1-Dreg1-Gata3 regulatory axis. The topic is relevant for understanding epigenetic regulation of ILC differentiation.
Strengths:
(1) Clear in vivo evidence for a lineage-specific role of Dreg1.
(2) Comprehensive integration of genomic datasets.
(3) Cross-species comparison linking mouse and human regulatory regions.
Weaknesses:
(1) Mechanistic conclusions remain correlative, relying on public data.
(2) Lack of direct chromatin or transcriptional validation of Tcf1-mediated regulation.
(3) Human enhancer function is not experimentally confirmed.
(4) Insufficient methodological detail and limited mechanistic discussion.
Comments on revisions:
The authors have provided clear evidence that Dreg1 is necessary for ILC2 development, but their refusal to perform any mechanistic experiment remains a significant weakness. While their appeal to the 3Rs and the use of public datasets is noted, re-analyzing external data from heterogeneous sources cannot substitute for direct, internal validation of the Tcf1-Dreg1-Gata3 axis in their specific knockout model. This is particularly problematic because ILC2 progenitors, though rare, can be isolated from bone marrow, especially since assays like CUT&Tag and others are specifically designed for low cell numbers. By relying on public T-cell CRISPR screens to justify human ILC2 functions, the authors are substituting cross-cell-type correlation for definitive functional proof. Consequently, the manuscript currently describes a discovery of necessity without providing a verified molecular mechanism, which should be more explicitly reflected in the title and conclusions.
Author response:
The following is the authors’ response to the original reviews
Public Reviews:
Reviewer #1 (Public review):
Summary:
This study examines the role of the long non-coding RNA Dreg1 in regulating Gata3 expression and ILC2 development. Using Dreg1-deficient mice, the authors show a selective loss of ILC2s but not T or NK cells, suggesting a lineage-specific requirement for Dreg1. By integrating public chromatin and TF-binding datasets, they propose a Tcf1-Dreg1-Gata3 regulatory axis. The topic is relevant for understanding epigenetic regulation of ILC differentiation.
Strengths:
(1) Clear in vivo evidence for a lineage-specific role of Dreg1.
(2) Comprehensive integration of genomic datasets.
(3) Cross-species comparison linking mouse and human regulatory regions.
Weaknesses:
(1) Mechanistic conclusions remain correlative, relying on public data.
We agree that the mechanistic conclusions are of our study are indeed correlative and we mention this in the discussion. The primary work of the study is the discovery of Dreg1's necessity for ILC2 development via the new knockout mouse model. Re-analysing good quality publicly available data on rare cell populations is an appropriate approach and in line with DORA guidelines for ethical research.
(2) Lack of direct chromatin or transcriptional validation of Tcf1-mediated regulation.
The most appropriate way to examine direct Tcf1 target genes in primary cells is to examine the association of Tcf1 binding with the changes that occur in Tcf1-bound genes after Tcf7 knockout. By analysing publicly available data on ILC progenitors we indeed did this. We revealed that Tcf1 bound to Dreg1 and that Dreg1 was not expressed when Tcf1 was knocked out in ILC progenitors. In addition we examined H3K27ac at the Dreg1 locus in the same ILC progenitors to demonstrate that Tcf1 appears to be important for decorating the Dreg1 gene with this histone modification. We believe that this analysis is sufficient to conclude that Tcf1 is required for the expression of Dreg1 in ILC progenitors.
(3) Human enhancer function is not experimentally confirmed.
We agree that the potential human enhancer of GATA3 we identified has not been confirmed in human ILC. However, a previous study showed clear evidence that this region has GATA3 enhancer activity in human T cells. Therefore, while not specific to ILC2s the region where the DREG1 homologues lie does indeed harbour enhancer activity.
(4) Insufficient methodological detail and limited mechanistic discussion.
We have now made the changes suggested by the reviewer to both the methods/figure legends and also the discussion.
Reviewer #1 (Recommendations for the authors):
The authors generated Dreg1-deficient mice and demonstrated that loss of this locus selectively reduces ILC2s but not T or NK cells, indicating a lineage-specific requirement for Dreg1 in ILC development. By analyzing publicly available chromatin accessibility and transcription factor-binding datasets, they link Dreg1 expression to Tcf1-dependent chromatin activation and extend their findings to human data by identifying a syntenic GATA3 enhancer that produces homologous Dreg lncRNAs in ILC2s. While the study addresses an interesting question, most of the mechanistic interpretations rely heavily on publicly available datasets rather than the authors' own functional evidence. To establish causality and reinforce the overall conclusions, I provide below some comments and suggestions for additional experiments and clarifications that would considerably strengthen the manuscript.
(1) In Figure 3, the authors use public datasets to argue that Tcf1 regulates Dreg1 expression by modulating chromatin accessibility and H3K27ac at its locus. However, since these data are derived from heterogeneous external sources, the conclusions remain associative. To better support causality, the authors should generate matched datasets from their own sorted progenitor populations and perform CUT&Tag for Tcf1 and H3K27ac in wild-type and Tcf7 knockout progenitors to directly test whether Tcf1 binding establishes an active chromatin state at Dreg1. Also, complementing this with nascent RNA or pre-mRNA quantification would link chromatin activation to transcriptional output. These experiments are technically feasible in progenitors and would substantially strengthen the claim that Tcf1 directly drives Dreg1 activation during ILC development.
We believe that utilising publicly available data sufficiently answers this question while also adhering to ethical considerations. The ILC populations used to produce the publicly available data were akin to those we examined in our analyses, and the data was of sufficient quality. Moreover, they enable us to access data from Tcf1-deficient mice. Redoing large-scale chromatin profiling on rare cell types would require hundreds of mice to achieve sufficient cell numbers. Repeating this solely for “originality” contradicts the 3Rs principles (replacement, reduction, refinement) if high quality public data already exists and we feel will require years of redundant work. In addition, we believe the fact that the data derive from heterogenous external sources, yet align well, only strengthen our conclusions. We have now added mention to our use of publicly available data in the discussion.
(2) In Figure 4, the authors provide correlative evidence from public datasets suggesting that the human region syntenic to the murine Dreg1 locus acts as a distal enhancer of GATA3 and gives rise to two ILC2-specific lncRNAs. To substantiate this claim, the authors should perform CUT&Tag for H3K27ac in human ILC2s to confirm enhancer activation and use 3C or HiChIP to demonstrate physical interaction with the GATA3 promoter. These experiments should be doable by fusing pooled ILC2 samples and would provide more direct evidence that this region actively regulates GATA3 expression.
Assessing the activity of a distal enhancer region on its target gene in primary human cells is extremely difficult, due to a number of technical and biological complications such as enhancer redundancy. This is why we chose to reanalyse an extensive enhancer deletion screen performed in human T cells by Chen et al., AJHG 2023. This analysis clearly showed deletion of the region we identified as harbouring Dreg1 homologues affected GATA3 expression, thus confirming its enhancer activity. While we agree with the reviewer that specific profiling of human ILC populations for H3K27ac and 3D genome architecture would provide further correlative evidence this will be a time-consuming and costly endevour with human material and ultimately the definitive proof in ILCs would require specific deletion of this region in ILC2s. We have mentioned this caveat in the discussion.
(3) Several figure legends lack essential methodological details. Figure 1 should specify how NK and ILC populations were gated, including intermediate steps and markers used. The same applies to Supplementary Figure 1, and particularly to Supplementary Figure 2, where gating strategies for progenitors are shown but not explained. Figure 2 should also indicate that these analyses were performed in bone marrow. Clearer legends are crucial for interpreting and reproducing the data.
We have made the suggested changes.
(4) It is also unclear throughout the manuscript whether the authors performed any ATACseq experiments themselves or relied entirely on public datasets. This information should be stated explicitly in the main text and figure legends, not only in the Methods section. Similarly, the source of the ChIPseq or CUT&Run datasets should be clearly indicated alongside the relevant figures.
We apologise for not making this clearer and have now clearly articulated if the data was public in the text.
(5) As the authors themselves suggest, performing experiments that selectively suppress Dreg1 transcription using antisense oligonucleotides or CRISPR interference at the Dreg1 promoter would provide more valuable mechanistic insights. Conducting these experiments in their own system would allow them to determine whether Dreg1 functions through its RNA product or as a DNA enhancer element, thereby strengthening the causal link between Dreg1 activity and Gata3 regulation.
We agree with the reviewer, however, this, in our opinion is beyond the scope of this manuscript. The strength of this manuscript lies in the findings from the novel Dreg1 knockout mouse strain. Future studies will focus on understanding how Dreg1 influences Gata3 expression.
(6) The discussion would benefit from a clearer and more integrated explanation of how Dreg1 fits into the transcriptional network that controls ILC2 differentiation. The authors could elaborate on whether Dreg1 fine-tunes Gata3 expression or functions as part of a regulatory loop with Tcf1, and better explain how this mechanism might be conserved in humans. In addition, the authors should explicitly acknowledge the limitations of relying on publicly available datasets and emphasize the need for direct experimental validation to support their mechanistic interpretation.
We have now made these suggested inclusions.
Reviewer #2 (Public review):
The authors investigate the role of the long non-coding RNA Dreg1 for the development, differentiation, or maintenance of group 2 ILC (ILC2). Dreg1 is encoded close to the Gata3 locus, a transcription factor implicated in the differentiation of T cells and ILC, and in particular of type 2 immune cells (i.e., Th2 cells and ILC2). The center of the paper is the generation of a Dreg1-deficient mouse. While Dreg1-/- mice did not show any profound ab T or gd T cell, ILC1, ILC3, and NK cell phenotypes, ILC2 frequencies were reduced in various organs tested (small intestine, lung, visceral adipose tissue). In the bone marrow, immature ILC2 or ILC2 progenitors were reduced, whereas a common ILC progenitor was overrepresented, suggesting a differentiation block. Using ATAC-seq, the authors find that the promoter of Dreg1 is open in early lymphoid progenitors, and the acquisition of chromatin accessibility downstream correlates with increased Dreg1 expression in ILC2 progenitors. Examining publicly available Tcf1 CUT&Run data, they find that Tcf1 was specifically bound to the accessible sites of the Dreg1 locus in early innate lymphoid progenitors. Finally, the syntenic region in the human genome contains two non-coding RNA genes with an expression pattern resembling mouse Dreg1.
The topic of the manuscript is interesting. However, there are various limitations that are summarized below.
(1) The authors generated a new mouse model. The strategy should be better described, including the genetic background of the initially microinjected material. How many generations was the targeted offspring backcrossed to C57BL/6J?
The mice were backcrossed for at least 2 generations to C57BL/6. This information is now included in the methods section.
(2) The data is obtained from mice in which the Dreg1 gene is deleted in all cells. A cell-intrinsic role of Dreg1 in ILC2 has not been demonstrated. It should be shown that Dreg1 is required in ILC2 and their progenitors.
We now provide new mixed bone marrow irradiation chimera data that shows that the effect is intrinsic to Dreg1-deficient ILC2 cells (Figure 1F and Supplementary Figure 1E-G).
(3) The data on how Dreg1 contributes to the differentiation and or maintenance of ILC2 is not addressed at a very definitive level. Does Dreg1 affect Gata3 expression, mRNA stability, or turnover in ILC2? Previous work of the authors indicated that knockdown of Dreg1 does not affect Gata3 expression (PMID: 32970351).
We have indeed shown that Dreg1-deficient ILC2P have reduced levels of Gata3 (Figure 2H) however we have not determined the exact mechanisms by which Dreg1 controls ILC2 development.
(4) How Dreg1 exactly affects ILC2 differentiation remains unclear.
We agree with the reviewer, however, this article is focused on the first description of the Dreg1 knockout mice and the surprisingly specific effect on ILC2 development.
Reviewer #2 (Recommendations for the authors):
(1) Relating to point 2 of public review:
It should be shown that Dreg1 is required in ILC2 and their progenitors. Mixed bone marrow chimeras would be an adequate strategy.
We have now done this and clearly showed that the effect is intrinsic to Dreg1-deficient ILC2s.
(2) Relating to point 3 of public review:
Minimally, Gata3 expression should be analyzed in ILC2, ILC2P, and the ILC progenitors by qRT-PCR and antibody stain.
We have indeed shown reduced Gata3 levels by antibody stain in Figure 2H.
(3) Relating to point 4 of public review:
The manuscript would benefit from additional data studying ILC2 differentiation in (competitive) adoptive transfer experiments or using in vitro differentiation assays.
We have performed the mixed bone marrow chimera experiments which are testing the competitiveness of Dreg1-deficient bone barrow with control wildtype. In this case the WT ILC2s outcompeted the Dreg1-deficient ILC2s for the same niche.
Author response:
[These author responses are to reviews from another journal.]
Reviewer #1:
This manuscript investigates the behaviour of a variety of clock proteins in cultured cells when epitope tagged and transiently expressed and try to draw general implications for endogenous function of circadian clock proteins.
Clock proteins are expressed at low levels in most cells, and so the clock interacting proteins (other kinases, phosphatases, ubiquitin-conjugated enzymes, etc.) are likewise probably at low abundance. Over-expression of one or two or even three components of a multicomponent system is going to produce odd and obscure non-physiological imbalances. The authors do not extend detailed study of these imbalances to more physiologic levels so the importance of their observations to clock function is not clear, and importantly, they are not tested in more biologically relevant models.
To study the function of components within a system, the steady state must be perturbed in one way or another. This can be achieved through pharmacological treatment, mutagenesis, downregulation, or overexpression. Such interventions are inherently non-physiological, and the relevance of the resulting observations must therefore be carefully validated.
In our study, the purpose of PER2 overexpression was to investigate its subcellular dynamics in the absence and presence of CRYs, specifically CRY1. This is far less trivial than it might appear at first glance, because our data clearly show that PER2 overexpression triggers, within 24 h, the accumulation of endogenous CRY1 (Fig. 1A), due to PER2-mediated stabilization of CRY1 (Fig. 4). PER2 overexpression also induces the accumulation of endogenous PER1, CK1, and BMAL1 (Fig. 2).
This effect was not considered in previous studies, such as Yagita et al. (2002), in which PER2 subcellular localization was assessed at a single time point following transient transfection. Yagita et al. found roughly equal proportions of cells with PER2 exclusively in the nucleus, exclusively in the cytoplasm, or distributed between both compartments. Such extreme cell-to-cell variability cannot be explained solely by PER2’s shuttling dynamics, as that would imply synchronous export in one cell and synchronous import in another.
Our time-resolved analysis of DOX-induced PER2 expression strongly suggests that the variability reported by Yagita et al. reflects a heterogeneous population of unsynchronized cells at different temporal stages along a trajectory from cytoplasmic PER2 (unbound) to nuclear PER2 fully saturated with CRYs (bound), owing to stabilization of endogenous CRYs. Similarly, Öllinger et al. (2014) analyzed PER2 nuclear export in cells constitutively expressing PER2-Dendra. Under such steady-state conditions, PER2-Dendra is already in complex with endogenous CRYs. The slow export rate and lack of dependence on additional CRY1 expression therefore likely reflect export of the complex, which is intrinsically slow.
Thus, prior to our work, no data on the true shuttling dynamics of PER2 were available.
Importantly, our results show not only that CRY1 promotes nuclear accumulation of PER2 (as reported by Öllinger et al.) but also that, conversely, PER2 promotes cytosolic accumulation of CRY1, depending on their expression ratio. Since CRY1 is predominantly nuclear and PER2 predominantly cytosolic, and because a PER2 dimer can bind one or two CRY1 molecules, our data suggest that the shuttling equilibrium depends on PER2 saturation state: a PER2 dimer bound to one CRY1 remains cytosolic, whereas a dimer bound to two CRY1 is nuclear.
These observations are novel and have not been reported previously. They were only possible through time-resolved analysis of overexpressed proteins.
A number of the findings are confirmatory rather than novel - the phosphorylation-regulated nuclear-cytoplasmic shuttling of CK1 and PER proteins is long known, and it's not clearly stated what is novel here.
We acknowledge prior work by Milne et al. (2001), who showed that kinase-dead CK1 is predominantly nuclear and that prolonged treatment with leptomycin B (16 h) enhances its nuclear localization. We cite this study at the beginning of the relevant paragraph. While we confirm these earlier observations, our work extends them in several important and novel ways:
(1) Rapid dynamics of CK1 localization – We show that pharmacological inhibition of CK1 with PF670 induces rapid (within 1 h) depletion of CK1δ from the centrosome, accompanied by nuclear accumulation and elevated CK1δ levels. These kinetics have not previously been reported. We also show that proteasome inhibition with MG132 enhance centrosomal staining, indicating that centrosomal binding sites are not saturated. Together, the data show that CK1δ equilibrates rapidly between its binding partners.
(2) Integration of localization with protein stability – We relate the known localization patterns of WT CK1 and the kinase-dead mutant K38R to CK1 degradation dynamics and further compare them to the tau-like kinase mutant CK1δ-R1178Q. This integration of subcellular localization data with turnover mechanisms provides new mechanistic insight.
(3) Comprehensive regulatory model – In the revised manuscript, we now include a schematic summarizing how CK1δ is posttranslationally regulated via subcellular shuttling, nuclear degradation, and dynamic interactions with binding partners (Figure EV5C). To our knowledge, such a comprehensive view of CK1δ regulation, linking localization, stability, and partner association, has not been presented before.
We believe these additions clearly distinguish our findings from prior reports and highlight the novel aspects of our study.
The formation of PER and CRY and CK1 complexes likewise is well established. The finding that formation of multiprotein complexes stabilize otherwise unstable over-expressed proteins is interesting but not novel.
We fully agree that the existence of PER–CRY–CK1 complexes is well established. It is also known that PER2 stabilizes CRY1 by occupying the FBXL3 binding site and that CRY1 promotes the nuclear accumulation of PER2. We do not present these established interactions as novel findings.
Our novel contribution, as outlined above, is the discovery that the shuttling and subcellular localization of PER2 and CRY1 are mutually dependent on their expression ratio. Specifically, we show for the first time that the steady-state shuttling distribution PER2 alone is cytosolic due to its rapid nuclear export wherease CRY1 is predominantly nuclear (known). Given that CRY1 facilitates the nuclear import of PER2 (known) and that a PER2 dimer can bind either one or two CRY1 molecules, our data showing that cytoplasmic PER2-CRY1 foci contain less CRY1 than nuclear foci lead us to conclude that cytoplasmic PER2 complexes contain one CRY1 molecule, while nuclear complexes contain two.
This model provides a mechanistic explanation for the distribution of PER2 between the cytosol and nucleus and for the relatively lower cytosolic CRY1 levels. Moost importantly, we further show (for the first time) that CK1-mediated phosphorylation of PER2 displaces CRY1. This phosphorylation event would produce PER2 dimers with one or no CRY1 bound, promoting their export to the cytosol. We believe this represents a novel and potentially important mechanism for regulating circadian clock function.
The results from many of the imaging assays are not quantitated, and the figures often show single cells. It's hard to draw statistical significance from these.
The phenotypes we report here are result of multiple technical and biological replicates (n >3). Image analysis and statistical analysis was performed when required. We show additional examples in the EVs.
There are a number of phenomena seen whose physiological relevance is unclear. In figure 1, forced over-expression of CRY1 and PER2 leads to formation of nuclear foci. It is unlikely these foci form at non-overexpressed levels, and so the general interest and relevance is not high nor investigated. This reduces the impact of the finding.
It has been shown that PERs and CRYs do not form thermodynamically stable, large (detectable) foci under physiological conditions, as we have stated in the manuscript. Whether these proteins have the propensity to form smaller, more dynamic structures of physiological relevance is an interesting question that could be explored elsewhere, but it is not relevant to our study. In our work, these foci are simply convenient markers for analyzing the interaction and subcellular (co)localization of clock proteins under investigation. In the revised version, we have kept the analysis of these foci and the discussion of their potential relevance to a minimum in order to avoid confusion and unnecessary discussions.
The finding that CK1δ is keep in the dephosphorylated state by binding to PER has been established previously by Johnson and colleagues and should perhaps be mentioned (Qin JBR 2015 (doi: 10.1177/0748730415582127).
There is clearly a misunderstanding here. Qin et al.’s data show that, in a cell-free system, CK1ε phosphorylates PER2 and also autophosphorylates its C-terminal tail (autoradiograph, Fig. 1E).
However, because PER2 phosphorylation is carried out by CK1ε that is tightly anchored to PER2, there is competition between PER2 phosphorylation and tail autophosphorylation. As a result, the kinetics of tail phosphorylation are slower (Fig. 3B and quantification in C) than those observed with free CK1ε (as seen in the presence of the p53 substrate, Fig. 3A,C). We believe that his is also happening in the cell.
Author response image 1.
Our data, in contrast, address a different point. It has been known from the Virshup lab for decades that CK1δ/ε undergo futile cycles of (auto)phosphorylation and dephosphorylation, resulting in an active, dephosphorylated kinase in cells because cellular phosphatases are more efficient than CK1 autophosphorylation. We now show that CK1δ is also efficiently dephosphorylated when bound to PER2 (Fig. 3). Nevertheless, despite dephosphorylation of PER2-bound CK1δ, PER2 itself becomes hyperphosphorylated, indicating that cellular phosphatases act differently on these two substrates. To clarify this point, we inhibited phosphatases with calyculin A (CalA). Under these conditions, both PER2 and PER2-bound CK1δ became efficiently hyperphosphorylated (new Fig. 3).
The degradation of kinase-active but not inactive CK1 is only shown here with 50-fold overexpressed protein so it's interesting, but the relevance to circadian biology is not made clear. The fact that over-expressed CK1 is degraded primarily in the nucleus is interesting, but needs further characterization - is this affected by the epitope tag? Is it true of endogenous CK1 or only over-expressed CK1? Is this not seen with e.g. other forms of CK1, e.g. lacking the C-terminus?
The observation that unassembled kinase is rapidly degraded is most clearly demonstrated by overexpression experiments. However, Fig. 3 shows that overexpression of CRY1 and PER2 leads to the accumulation of elevated levels of endogenous CK1δ (untagged), indicating that endogenous kinase is likewise degraded in the absence of a stabilizing binding partner. In addition, we present data showing that overexpression of tagged CK1δ reduces the levels of endogenous, untagged CK1δ, further supporting the conclusion that unassembled endogenous CK1δ is unstable and subject to degradation.
Further characterization of the CK1 degradation pathway is of considerable interest and could form the basis of a separate study, particularly to identify the components that mediate activity-dependent nuclear export and activity-dependent nuclear degradation. The Δ-tail kinase is expressed at very low levels, although interpretation is complicated by the possibility that this reflects pleiotropic effects.
The final figure, showing that nuclear CK1 is the form responsible for shortening rhythms, is interesting. Is this because massive increases in nuclear CK1 alter PER, or BMAL/CLOCK, or proteasome activity?
Our data show that cells expressing either nuclear or cytosolic CK1 are viable, proliferate normally, and maintain a functional circadian clock. Therefore, overexpression of the kinase does not produce pleiotropic effects.
To assume it's due to PER phosphorylation is in disagreement with the studies of Meng et al. Neuron 2008 DOI 10.1016/j.neuron.2008.01.019.
The data are not in disagreement with Meng et al.; in fact, they align quite well. Meng et al. showed that CK1ε-tau shortens the circadian period, which we had also previously reported for CK1δ-tau-like (Marzoll et al., 2022). We now demonstrate that CK1δtau-like is enriched in the nucleus, contributing to its period-shortening phenotype. Furthermore, we show that active CK1δ (but not CK1δ-K38R) promotes cytoplasmic accumulation of PER:CRY complexes, consistent with PER2 degradation in the cytosol as described by Meng et al.
Taken together, these findings suggest that PER proteins acquire their CK1 in the nucleus, and this interaction determines the circadian period length. Following a time delay—set by the kinetics of PER2 phosphorylation—PER2:CRY complexes are exported to the cytosol along with their bound CK1, where they are subsequently degraded.
Reviewer #2:
Interactions between the circadian clock proteins PER1/2 with CK1d/e and CRY1/2 influence each of their stability, subcellular localization, and activity, as countless studies over the last two decades have shown. However, many questions still remain, especially in light of newer models of the transcription-translation feedback loop (TTFL) in which the repression phase relies on two distinct mechanisms, a phosphorylation-dependent displacement of the transcription factor by CK1-PER-CRY complexes from DNA early in repression, and a CRY1dependent sequestration of the transcription factor activation domain later in repression. In particular, questions remain about mechanisms triggering nuclear entry/export and activity of these proteins in the cytoplasm and nucleus.
Here, the authors utilize a system of induced and/or transient overexpression of proteins with or without with fluorophores to track subcellular localization, stability, and interactions. As the authors point out throughout the manuscript, the overexpression of these clock proteins often causes them to behave differently from the endogenous proteins. It looks as though the authors have done their best to account for these changes, and they have certainly been rigorous in pointing them out, but there is concern that some of the conclusions may be influenced by this overexpression. For example, the relevance of work related to the overexpression-dependent foci is unclear.
Same answer as to Reviewer 1: It has been shown that PERs and CRYs do not form thermodynamically stable, large (detectable) foci under physiological conditions, as we have stated in the manuscript. Whether these proteins have the propensity to form smaller, more dynamic structures of physiological relevance is an interesting question that could be explored elsewhere, but it is not relevant to our study. In our work, these foci are simply convenient markers for analyzing the interaction and subcellular (co)localization of the clock proteins under investigation. In the revised version, we have kept the analysis of these foci and the discussion of their potential relevance to a minimum in order to avoid confusion.
The findings that the stability of the kinase depend on localization, its intrinsic activity, and interaction with PER2 are interesting and important. Use of the CKBD deletion to show that CK1 stabilization depends on its anchoring interaction with PER2 is a nice touch. The authors bring up an excellent point that most of the potential phosphorylation sites on PER1 and PER2 have not been functionally characterized aside from the phosphoswitch mechanism. Their observation that CK1 eventually induces cytoplasmic localization of the CK1-PER-CRY1 complex and the release of CRY1 is intriguing. In particular, the finding that pretreatment of PER2 with CK1 in vitro blocked its ability to interact with CRY1 is very interesting. However, the absence of mechanistic data to explore this in more detail limits the impact of this conclusion. Using the system they have established here to identify the site(s) on PER2 and/or CRY1 that lead to this would help to solidify this work and increase the impact of this work. Overall, there are some interesting findings here but the inclusion of some competing viewpoints and mechanistic data would strengthen the impact of the work.
Major
(1) The characterization of the tau-like CK1 mutant R178C as less active than the wild type enzyme is not entirely correct-it is less active on the FASP region as described, but it has increased activity on S478 in the phosphodegron that is independent of inhibition from the FASP region (Gallego et al. PNAS, 2007 and Philpott et al. eLife, 2020). It is still possible that some of the period shortening effects of the mutant could arise from enhanced nuclear accumulation, but the oversimplified description of the mutant as less active should be corrected.
In the revised version, we discuss that the enhanced nuclear localization of the Tau-like kinase may contribute, at least in part, to period shortening, similar to how forced nuclear overexpression of wild-type kinase also shortens the period. We emphasize, however, that CK1 Tau is compromised in its priming-dependent activity, whereas its priming-independent activity is context-specific and enhanced toward the β-TrCP site.
(2) One of main conclusions from the paper, that CK1 induces cytoplasmic localization of the CK1-PER2-CRY1 complex and subsequent release of CRY1 would be strengthened significantly by identifying the phosphorylation site(s) responsible for the cytoplasmic localization of the complex and the release of CRY1. The system they have developed here seems ideal to identify these sites.
We fully agree with the reviewer. We substituted the known phosphorylation sites in PER2 surrounding the CRY-binding domain, but this had no effect on the phosphorylationdependent release of CRY1. Therefore, a more systematic analysis will be required, including the possibility that phosphorylations in CRY1 itself may contribute. To this end, we are generating PER2 and CRY1 variants in which all Ser/Thr residues are replaced by Ala. Using these constructs alongside the wild-type versions, we will by PCR systematically create hybrids in which specific regions containing phosphorylation sites are exchanged.
Nevertheless, this will require considerable time and effort, and we believe this investigation exceeds the scope of the present manuscript and will address it in future work.
(3) The concept of delayed release of CRY1 presented here is an interesting one. It's unclear why the authors have also not incorporated prior findings (Ukai-Tadenuma et al. Cell, 2012, Koike et al. Science, 2012) that peak levels of CRY1 are expressed in a later phase than CRY2, PER1, and PER2. It seems like figure EV6 should reflect the observation that CRY2 is the predominant cryptochrome present during early repression (Koike et al. Science, 2012).
The reviewer is absolutely right: the expression phases of CRY1, CRY2, PER1, and PER2 are important. I have recently discussed these issues in detail in a News & Views article in The EMBO Journal, commenting on a paper by Smyllie et al. In this News & Views article, I discuss that the presently available data suggest that CRY1 is always present throughout the circadian cycle and keeps circadian transcription partially repressed even at peak phases of expression. In the revised version, I refer to these publications, including those mentioned by the reviewer. However, I would like to keep the model presented in the supplementary figure as simple as possible and specifically focused on the work presented in this manuscript, rather than presenting a comprehensive conceptual model of the circadian clock.
(4) The model presented in figure EV6 and described throughout the text shows that PER-CRY complexes interact with CK1 in the nucleus, and not in the cytoplasm prior to nuclear entry. Prior work on endogenous protein complexes has shown that CK1-PER-CRY complexes exist in the cytoplasm very early on in the repression phase (Aryal et al. Mol Cell, 2017-ref. 14 in the manuscript). Work by Sancar and colleagues (Cao et al. PNAS, 2020) also shows with endogenous proteins that CK1d has a circadian pattern of nuclear entry (or possibly retention) concomitant with PER2 that is dependent on the presence of PERs and CRYs. Together, these data seem to be inconsistent with your model.
We think the data are not inconsistent. The recent Smyllie et al. paper in EMBO Journal shows that PER2 is present in both the cytosol and the nucleus at all times when it is expressed, but cytosolic PER2 is not saturated with CRY, which is more nuclear. Our data demonstrate that PER2 shuttles between the cytosol and the nucleus depending on its occupancy with CRYs (see schematic Fig. 1). Occupancy, in turn, depends on expression levels and binding affinities, including those of CRY2 and PER1. Consequently, PER2 complexes could shuttle continuously throughout the circadian cycle—either because they are not saturated with CRYs due to the balance between expression levels, freely available CRY, and binding affinity, or later in the cycle because CRYs are displaced by phosphorylation. If PER2 acquires casein kinase in the nucleus early in the cycle, it will shuttle out to the cytosol together with the bound CK1. We believe this does occur, but early in the circadian cycle the saturation of PER2 with casein kinase is likely to be very low due to the limited availability of CK1 in the nucleus. I am aware that not everyone will share this interpretation point by point, but discussing it in greater length and detail exceeds the scope of the present manuscript.
Reviewer #3:
This manuscript by Serrano and co-workers is a tight body of work that provides much needed insights into the regulation of clock proteins by CK1D, and into the regulation of CK1D itself. While the whole paper relies on artificial overexpression of chimeric/tagged proteins that may have significant differences in the function, the stability and subcellular distribution of the endogenous proteins they are suppose to model, this limitation was been clearly stated by the authors, and nevertheless their study still provides important insights.
While the authors have specified which Ck1d isoform (Ck1d1) they are overexpressing in their model cell lines, they may have thought to consider that the overexpression of one Ck1 homologue may affect the endogenous expression of the other homologues and their isoforms, e.g. ck1d1 overexpression may cause an increase in Ck1d2 or Ck1e, which would in turn affect the conclusions.
We show in revised Fig. 3 that overexpression of CK1δ1 reduces the expression of endogenous CK1δ1/2. This is consistent with our prediction that overexpressed and endogenous CK1 (including CK1ε) compete for the same stabilizing binding partners, leading to rapid degradation of unassembled kinases.
Moreover, the antibody they used for endogenous Ck1d (which is ab85320, also mentioned as AF12G4 but that is the clone number, not the catalogue number) is discontinued and its specificity against Ck1d1, Ck1d2 or even the highly identical Ck1e, has not been clearly demonstrated. We know from Fig 3 that it can detect Ck1d1 but it would be great if the authors would provide additional evidence for the specificity of this antibody, for example by overexpressing Ck1d1/Ck1d2/Ck1e to see really which "endogenous" Ck1 we are seeing.
Are the three bands for example seen in Fig 4A corresponding to the different isoforms? This simple experiment would reinforce the conclusions.
We show in the revised figure that the antibody recognizes CK1δ1 and CK1δ2, but not CK1ε. In U2OS cells, the antibody detects a single band (Figure); we do not know whether this represents predominantly one splice isoform or both, which are not resolved. However, this distinction is not relevant for our interpretation, because overexpression of tagged CK1δ1 reduces the expression of whichever endogenous kinase is present.
There are no minor comments, as the figures, the figure legends and main text are all of good quality and ready for publication.
Reviewers’ Responses to Point-by-Point Response to Peer Review
Referee #1:
I appreciated the additional efforts by the authors to improve the manuscript. Unfortunately, the underlying approach of forced over-expression remains artifact-prone, and has been largely supplanted by readily available knockin and targeted mutagenesis methods. Over-expression may give clues, but I think more rigorous mechanistic validation is needed to make this compelling. I cannot support publication of this manuscript.
Referee #2:
In their response to reviewers, the authors make the valid point that the steady state of a system is usually perturbed to study it. In this study, they have used overexpression of the clock proteins PER2, CRY1 and CK1 to study their effects on subcellular dynamics and stability. In justifying this choice, they refer to several papers that similarly overexpressed at least one of these components, stating that their time-resolved approach brings novel insights. However, there is a missed opportunity here to translate any lessons learned from overexpression studies to a system where the proteins are expressed at physiological levels and stoichiometry.
The authors reply to reviewer 1 stating that they conclude PER proteins acquire CK1 in the nucleus, but this does not account for other studies showing an apparent PER-CK1 complex in the cytoplasm during the early phases of repression and/or a pattern of PER-dependent nuclear entry of CK1 (Lee et al. 2001, Cell; Aryal et al. 2017 Mol Cell; Cao et al. 2021 PNAS). Given that all 3 of these studies were done with native expression levels, it seems incumbent upon the authors to demonstrate that their conclusions from the overexpression study are physiologically relevant by translating them in some way to a more native system. This also addresses a point made by reviewer 2, major concern 4 that was not satisfactorily addressed by the authors. Perhaps they could validate their hypothesis of PER shuttling and interactions with CK1 or CRY1 that alter this in a native system similar to Aryal or Cao et al. with the use of nuclear export inhibitors?
The response to reviewer 2, major concern 1 is thoughtful and much appreciated. However, simplifying the effects of the tau mutation on CK1 as having a decreased rate on priming-dependent phosphorylation but not priming-independent is not quite true-the tau mutation also decreases the rate of priming-independent phosphorylation of S662 (in humans) (Philpott et al. 2020, eLife).
Other papers appearing in this journal seem to all include at least one major new mechanistic insight. Although the authors do a diligent job in characterizing the overexpressed proteins in this system, some of their conclusions are at odds with prior studies of the system in more native conditions, so the potential impact of this work is unclear. To verify these conclusions or test new ones (ie, that CK1 disrupts PER-CRY1 interactions), they should use their insights to generate mutations or make perturbations in a native system and demonstrate that they still hold.
Referee #3:
The authors have adequately addressed the reviewers' comments, and it is my opinion that the manuscript is ready for publication. It is true, as previously mentioned by other reviewers, that the evidence presented rely on overexpression, which for the other reviewers seem to preclude publication. However, I find this to be a too strict opinion.
If the authors had indeed provided evidence using crispr-cas9-mediated genetic manipulation and tagging/mutating endogenous genes for all their experiments, thereby providing more physiological evidence of how clock proteins interact, they would probably have submitted their manuscript to an alternative journal with a higher impact.
As it stands, it is my opinion that, considering the evidence and limitations of the study, this manuscript is a good match for the journal.
Author Rebuttal:
Apologies for the delayed reply regarding our manuscript. In the meantime, we have added several new experiments which address the comments of the reviewers and more. These are now included as Figures 1C, EV3, 4D, 6E, 6F, EV6D, and EV7.
Figure 1C reinforces our observations from Figure 1B showing that induction of stably-integrated PER2 also results in accumulation of endogenous CRY1 at a timescale that is compatible with the gradual localization of overexpressed PER2 into the nucleus.
Figure EV3 addresses several technical comments from Reviewers #3 and #1, respectively: Figure EV3A shows that our CK1δ antibody recognizes CK1δ1 and CK1δ2, but not CK1ε. Figures EV 3B and C clearly show how overexpression of our transgenic CK1δ results in decreased endogenous CK1δ which further demonstrates the rapid turnover of active kinase.
Figure 4D addresses the comment from Reviewer #2. We clearly show that CK1δ is not kept in a dephosphorylated state by binding to PER. In addition to our direct comment to this point, Figure 4D shows that CK1δ regardless if it is expressed alone or in complex with PER2 is phosphorylated to a similar extent when the cells are treated with the phosphatase inhibitor CalA. As indicated in our direct response, we are rather more interested in the observation that cellular phosphatases act differently on PER2 compared to CK1δ despite being in the same PER:CK1δ complex (as shown by the clear stabilization of overexpressed CK1δ by co-expression of PER2).
Figures 6E, 6F, and EV6D demonstrate that our observations from overexpression systems are also observed in a more physiological context, addressing comments from Reviewers #1 and #2. Figure 6E shows that dephosphorylation of PER2 leads to its relocalization from the cytosol to the nucleus, while Figure 6F analyzes the subcellular localization of PER2 in the context of a functional circadian clock in U2OS cells. The latter demonstrates that PER2 is predominantly nuclear early in the circadian cycle, but redistributes to the cytosol at later time points. We included these experiments in response to the reviewer’s request for a more physiological context. Since we are not a mouse lab, this cell-based system represents the most physiological model we can provide. Figure 6F show the dynamics of endogenous PER2 from DEX-synchronized cells. At early timepoints, PER2 is predominantly nuclear likely due to the incorporation of CRY1 forming the PER:CRY complex. At later timepoints PER2 is redistributed between the cytoplasm and nucleus due to PER2 phosphorylation. Importantly, these results are consistent with and recontextualize the results from Liu et al. (Xie et al., PNAS, 2023) showing the hypophosphorylated PER2 at early timepoints post-DEX is predominantly nuclear and hyperphosphoryated PER2, that appear later post-DEX is predominantly cytoplasmic.
Finally, Figure EV7 provides a model how the subcellular distribution of CK1δ affects its assembly into the PER:CRY complex emphasizing how nuclear kinase enacts its role in the circadian clock.
Response to Reviewers:
We were disappointed by the categorical rejection of overexpression experiments. Without a specific discussion of why they would be inappropriate or not sufficient in the context of the work presented here, the blanket assertion that overexpression inevitably produces artifacts functions more as a rhetorical device than as a substantiated scientific argument. The fact that the term ‘physiological’ generally carries a positive connotation, whereas ‘overexpression’ is often perceived negatively, does not in itself justify the categorical rejection of experiments.
While we appreciate that some reviewers may personally prefer alternative strategies, we believe that the suitability of any approach must be evaluated in light of the specific biological questions being addressed. I cannot see a single specific point in the reviewers’ responses indicating that any of our experiments yielded artificial results. It is true that targeted knock-in and mutagenesis methods are available, however, these approaches are simply not suited to the questions raised in this manuscript. We also fully agree that, whenever possible, insights from overexpression studies should be validated in systems with a functional clock where proteins are expressed at physiological levels, which we did using U2OS cells, and noting the compatibility of our results with those in the literature using endogenously-tagged constructs. We have cited several recent studies that have investigated the subcellular distribution and circadian dynamics of endogenous or endogenously-tagged clock proteins in mice (Cao et al, 2021; Smyllie et al, 2022, 2016, 2025) and U2OS cells (Öllinger et al, 2014; Gabriel et al, 2021; Xie et al, 2023). While we cannot substantially expand on these previous observations, we confirm them in the revised version by demonstrating the nuclear-to-cytoplasmic relocalization of PER2 in U2OS cells over the course of a circadian cycle. In addition, we show that this process is, in principle, reversible: when CK1 is inhibited with PF670, overexpressed hyperphosphorylated cytosolic PER2 becomes dephosphorylated and accumulates in the nucleus.
Overall, we consider our approach not only complementary but also essential, as it enables us to address two key questions that would otherwise be difficult or even impossible to resolve:
(1) Mutual impact of PER2 and CRY1 on subcellular dynamics and the role of PER2 phosphorylation
Evidence from mouse liver (Cao et al, 2021), mouse SCN (Smyllie et al, 2022, 2025), and U2OS cells (Xie et al, 2023) indicates that a substantial fraction of PER2 remains cytoplasmic throughout its expression cycle, even in the presence of CRY1, which promotes PER’s nuclear import. The mechanisms underlying this cytoplasmic retention remain unclear, and no circadian function has yet been attributed to the cytosolic PER2 pool. Our study addresses how PER2 abundance, phosphorylation state, and stoichiometry relative to CRY1 govern their interaction and subcellular dynamics. This is physiologically relevant because PER1/2 and CRY1/2 proteins oscillate in expression and degradation out of phase, such that their concentrations, stoichiometry, and phosphorylation state vary systematically over the circadian cycle. Transient transfection and inducible overexpression combined with time-lapse microscopy are essential here, as they uniquely allow modulation of protein ratios and CK1δ levels and to resolve their dynamics.
Previous work established that CRY1 is nuclear and promotes PER2 nuclear accumulation (Smyllie et al, 2022). Our data extend this by showing that subcellular distribution is determined by the CRY1:PER2 ratio. While CRY1 alone is nuclear we show that PER2 alone is cytoplasmic due to rapid nuclear export. Mixed conditions reveal ratio-dependent shifts: at low CRY1-to-PER2 ratios, CRY1 relocalizes to the cytoplasm, whereas at high ratios, PER2 is retained in the nucleus. We explain this behavior by PER2 dimerization: dimers bound to two CRY1 molecules remain nuclear, while dimers bound to a single CRY1 localize to the cytosol. Such species can be expected to form in a physiological context depending on binding affinities and rhythmic expression levels and ratios across circadian time. Importantly, we show that CK1δ-mediated phosphorylation destabilizes PER2 and CRY1 interactions. From this, we infer that PER2 dimers with only a single bound CRY1 transiently form and accumulate in the cytosol, consistent with the lower CRY1-to-PER2 ratio we observe in the cytosol and that has also been reported in the SCN (Smyllie et al, 2025). With continued phosphorylation, PER2 dimers lose CRY1 altogether, while the released CRY1 accumulates in the nucleus. We suggest that this mechanism supports and extends the late repressive phase of the circadian cycle. Recent data show that hypophosphorylated PER2 is predominantly nuclear, whereas hyperphosphorylated PER2 is largely cytoplasmic in mouse liver (Cao et al, 2021; Xie et al, 2023), linking our data to a physiological context.
Taken together, these findings suggest a mechanism whereby stoichiometry, subunit composition, and CK1δ phosphorylation determine PER:CRY complex composition and localization. Crucially, these complexes and their dynamic relocalization could only be observed using inducible overexpression; knock-in strategies at endogenous levels would not be able to capture such states.
(2) Posttranslational regulation and subcellular homeostasis of CK1δ and impact on the clock
Previous work has shown that nuclear export of CK1δ depends on its kinase activity (Milne et al, 2001). Here, we further demonstrate that unassembled CK1δ is subject to degradation, with nuclear turnover accelerated by its catalytic activity. Thus, when evaluating the impact of CK1δ mutants on the circadian clock, one must consider not only kinase activity but also protein stability and subcellular distribution. We find that CK1δ availability for PER2 differs between cytosol and nucleus. In particular, nuclear CK1δ is limiting, and its abundance directly determines circadian period length. This is significant because subcellular CK1δ availability and posttranslational regulation have not previously been examined or incorporated into circadian clock models, as the kinase has been assumed to be non-limiting given its constant expression throughout the circadian cycle. Complex formation between CK1δ and PER is a well-established determinant of circadian timing, with CK1δ overexpression known to shorten period length. Our data explain why: the binding equilibrium between CK1δ and PER must be finely tuned. Previous studies suggested that PER associates with CK1δ in the cytosol and enters the nucleus as a PER:CRY:CK1δ complex (Lee et al, 2001; Aryal et al, 2017). Our data suggest that nuclear PER is not saturated with CK1δ. This is because levels of free, active CK1δ in the nucleus are low, owing to its rapid export or degradation by the nuclear proteasome, which limits its availability for PER binding.
Our overexpression studies support this mechanism. NES-tagged CK1δ overexpression does not alter circadian period length, because it fails to increase nuclear CK1δ levels: Each PER molecule can coimport only one kinase, a process already occurring in wild-type cells, and the few co-imported molecules rapidly equilibrate with the nuclear pool, where they are subject to export or degradation. In contrast, NLS-tagged CK1δ overexpression directly increases nuclear kinase abundance by antagonizing export, thereby enhancing PER binding and shortening circadian period. This multilayered regulation of CK1δ stability and localization and its consequences for PER2 availability would not have been revealed without targeted overexpression. Our findings therefore fill a key knowledge gap and remain fully consistent with previous studies (Lee et al, 2001; Aryal et al, 2017; Cao et al, 2021).
Conclusion: In sum, our findings are novel and physiologically relevant, aligning with data from mouse liver and SCN. While studies at strictly endogenous protein levels are important and necessary, perturbation of steady state is a standard strategy to uncover and observe novel mechanisms. Endogenous-level experiments would demand technically unrealistic systems (for example, even the simplest case, analyzing the subcellular dynamics of PER2 alone, would require cells lacking PER1, CRY1/2, and CK1δ/ε). Moreover, adjustment of PER2-to-CRY1 ratios cannot be achieved with stably integrated genes and of course not at physiological expression levels. Thus, inducible overexpression is not merely practical but currently the most feasible approach to dissect these dynamics. We complement our findings with data from U2OS cells with a functional clock, showing that the availability of nuclear CK1δ directly determines circadian period length. Although specific aspects of our extended model require further experimental validation, no published evidence contradicts it to date. Mechanistic discussions of the circadian clock have so far focused primarily on PER protein degradation. Our model broadens this perspective by incorporating CK1δ homeostasis, PER:CRY complex composition, subcellular localization, and their regulation by phosphorylation. In doing so, it provides a detailed framework to be critically tested and refined in future studies.
Author response:
The following is the authors’ response to the previous reviews
Public Reviews:
Reviewer #1 (Public review):
This manuscript investigates how dentate gyrus (DG) granule cell subregions, specifically suprapyramidal (SB) and infrapyramidal (IB) blades, are differentially recruited during a high cognitive demand pattern separation task. The authors combine TRAP2 activity labeling, touchscreen-based TUNL behavior, and chemogenetic inhibition of adult-born dentate granule cells (abDGCs) or mature granule cells (mGCs) to dissect circuit contributions.
This manuscript presents an interesting and well-designed investigation into DG activity patterns under varying cognitive demands and the role of abDGCs in shaping mGC activity. The integration of TRAP2-based activity labeling, chemogenetic manipulation, and behavioral assays provides valuable insight into DG subregional organization and functional recruitment. However, several methodological and quantitative issues limit the interpretability of the findings. Addressing the concerns below will greatly strengthen the rigor and clarity of the study.
Major points:
(1) Quantification methods for TRAP+ cells are not applied consistently across panels in Figure 1, making interpretation difficult. Specifically, Figure 1F reports TRAP+ mGCs as density, whereas Figure 1G reports TRAP+ abDGCs as a percentage, hindering direct comparison. Additionally, Figure 1H presents reactivation analysis only for mGCs; a parallel analysis for abDGCs is needed for comparison across cell types.
In Figure 1G and 1H we report TRAP+ abDGCs as a percentage rather than density because we are analyzing colocalization of the two markers, which are very sparse in this population. Given the very low number of double-labeled abDGCs, calculating density would not be practical. In the revised manuscript we have clarified the rationale for using these measures. As noted in the current text, we did not observe abDGCs co-expressing TRAP and c-Fos; we have made this point more explicit to guide interpretation of these data.
(2) The anatomical distribution of TRAP+ cells is different between low- and high-cognitive demand conditions (Figure 2). Are these sections from dorsal or ventral DG? Is this specific to dorsal DG, as itis preferentially involved in cognitive function? What happens in ventral DG?
The sections shown in Figure 2 were obtained from the dorsal dentate gyrus (see Methods, “Histology and imaging”: stereotaxic coordinates −1.20 to −2.30 mm relative to bregma, Paxinos atlas). From a feasibility standpoint, it is not possible to analyze the entire longitudinal extent of the hippocampus with these low-throughput histological approaches. We therefore focused on the dorsal DG, for which there is a strong functional rationale. A large body of work indicates that the dorsal hippocampus, and specifically the dorsal DG, is preferentially involved in spatial memory and in the fine contextual discrimination that underlies pattern separation. The dorsal hippocampus is critical for encoding and distinguishing similar spatial representations, a core component of the high-cognitive demand task used here. In contrast, the ventral DG is more strongly associated with emotional regulation and affective memory processing and is less implicated in high-resolution spatial encoding. For these reasons, the present study was designed to assess TRAP+ cell distributions specifically in the dorsal DG.
(3) The activity manipulation using chemogenetic inhibition of abDGCs in AsclCreER; hM4 mice was performed; however, because tamoxifen chow was administered for 4 or 7 weeks, the labeled abDGC population was not properly birth-dated. Instead, it consisted of a heterogeneous cohort of cells ranging from 0 to 5-7 weeks old. Thus, caution should be taken when interpreting these results, and the limitations of this approach should be acknowledged.
We agree that prolonged tamoxifen administration results in labeling a heterogeneous population of abDGCs spanning approximately 0 to 5–7 weeks of age, rather than a precisely birth-dated cohort. This is a limitation of this approach and we have included discussion of this in more detail in the revised manuscript.
(4) There is a major issue related to the quantification of the DREADD experiments in Figure 4, Figure 5, Figure 6, and Figure 7. The hM4 mouse line used in this study should be quantified using HA, rather than mCitrine, to reliably identify cells derived from the Ascl lineage. mCitrine expression in this mouse line is not specific to adult-born neurons (off-targets), and its expression does not accurately reflect hM4 expression.
We agree that mCitrine is not a marker that allows localization of hM4Di as it is well known that the mCitrine can be independently expressed in a Cre independent manner in this mouse. As suggested, we have removed the figure that showed the mCitrine and have performed immunohistochemical localization of the DREADD with an antibody against the HA tag. This is now shown in Figure 5.
(5) Key markers needed to assess the maturation state of abDGCs are missing from the quantification. Incorporating DCX and NeuN into the analysis would provide essential information about the developmental stage of these cells.
The goal of this study was to examine activity patterns of adult-born versus mature granule cells, rather than to assess maturation state. The adult-born neurons analyzed were 25–39 days old, an age at which point most cells have progressed beyond the DCX<sup>+</sup> stage and are expected to express NeuN based on prior work. We therefore do not think that including DCX or NeuN quantification would provide additional information relevant to the aims or interpretation of this study.
Minor points:
(1) The labeling (Distance from the hilus) in Figure 2B is misleading. Is that the same location as the subgranular zone (SGZ)? If so, it's better to use the term SGZ to avoid confusion.
We have updated Figure 2B, the Methods, and the main text to more explicitly localize this which it the boundary between the subgranular zone (SGZ) and the hilus.
(2) Cell number information is missing from Figures 2B and 2C; please include this data.
We have now added the cell number information to the figure legends. In Figures 2B and 2C, each point corresponds to a single cell, with an equal number of mice per group. The total number of TRAP<sup>+</sup> cells per mouse is shown in Figure 1F, which reports TRAP<sup>+</sup> cell densities by group.
(3) Sample DG images should clearly delineate the borders between the dentate gyrus and the hilus. In several images, this boundary is difficult to discern.
We made the DG-hilus boundaries clearer in the sample images to improve visualization and interpretation.
(4) In Figure 6, it is not clear how tamoxifen was administered to selectively inhibit the more mature 6-7-week-old abDGC population, nor how this paradigm differs from the chow-based approach. Please clarify the tamoxifen administration protocol and the rationale for its specificity.
We apologize for the confusion here. The protocol used in Figure 6 is the same tamoxifen chow–based approach as in Figure 5, differing only in the duration of tamoxifen exposure. Mice in Figure 5 received tamoxifen chow for 7 weeks, whereas mice in Figure 6 received it for 4 weeks, restricting labeling to a younger and narrower cohort of adult-born DGCs. Thus, the population targeted in Figure 6 is younger than that in Figure 5 and does not correspond to mature 6–7-week-old neurons. By contrast, the experiment in Figure 4 targets a more mature population, consisting predominantly of ~5-week-old adult-born neurons as well as mature granule cells, which are Dock10-positive and express Cre endogenously, allowing selective manipulation of this later-stage population.
We have corrected the paragraph accordingly and clarified the age range of the labeled populations in the revised manuscript.
Comments on revisions:
I appreciate the authors' careful and thorough revisions. They have addressed all of my previous concerns satisfactorily, and the manuscript is now significantly strengthened. I have no further concerns.
Reviewer #2 (Public review):
In this study, the authors investigate how increasing cognitive demand shapes activity patterns in the dorsal dentate gyrus (DG). Using a touchscreen-based TUNL task combined with TRAP/c-Fos tagging, birth-dating of adult-born granule cells (abDGCs), and chemogenetic inhibition, they show that higher task demand increases mature granule cell (mGC) recruitment and enhances suprapyramidal (SB) versus infrapyramidal (IB) blade bias. Functionally, mGC inhibition reduces overall activity and impairs performance without disrupting blade bias, whereas inhibition of {less than or equal to}7-week-old abDGCs increases mGC activity, abolishes blade bias, and impairs discrimination under high-demand conditions. These findings suggest that effective pattern separation depends not only on overall DG activity levels but also on the spatial organization of recruited ensembles.
The integration of touchscreen TUNL with temporally controlled activity tagging and birth-dated cohorts is technically strong. Quantification of SB-IB bias and radial/apical distributions adds anatomical precision beyond bulk activity measures. The comparison between mGC and abDGC inhibition is conceptually compelling and supports dissociable functional roles. Overall, the data convincingly demonstrate that increasing cognitive demand amplifies blade-biased DG recruitment and that mGCs and abDGCs differentially contribute to both behavioral performance and network organization.
However, how abDGCs are integrated into the mGC network under high cognitive demand remains unresolved. Additional experiments are needed to clarify how abDGCs shape spatial recruitment patterns and whether they directly inhibit or indirectly regulate mGC activity to maintain high performance.
Furthermore, the authors frame "high cognitive demand" as a multidimensional construct encompassing broad behavioral challenge. It would strengthen the work to delineate how local abDGC-mGC circuit interactions regulate specific task components in real time. This will require higher temporal resolution approaches, as TRAP and c-Fos labeling integrate activity over prolonged windows and primarily reflect sustained engagement rather than moment-to-moment computations.
The central conclusion that dentate function depends on coordinated spatial recruitment rather than total activity magnitude is supported by the data, although mechanistic interpretations should be tempered given methodological limitations.
Overall, this work advances models of adult neurogenesis by emphasizing a critical-period modulatory role of abDGCs in organizing DG network activity during high-demand discrimination. The combined behavioral and circuit-level framework is likely to be influential in the field.
Reviewer #3 (Public review):
This study examines the role of dentate gyrus neuronal populations, reflecting neurogenesis and anatomical location (suprapyramidal vs infrapyramidal blade), in a mnemonic discrimination task that taxes the pattern separation functions of the dentate. The authors measure dentate gyrus activity resulting from cognitive training and test whether adult neurogenesis is required for both the anatomical patterns of activity and performance in the cognitive task. The authors find that more cognitively challenging variants of the task evoked more dentate activity, but also distinct patterns of activity (more activity in the suprapyramidal blade, less in the infdrapyramidal blade). Using chemogenetic approaches they silence mature vs immature dentate gyrus neurons and find that only mature neurons (either the general population or specifically mature adult-born neurons), and not immature adult-born neurons, are required for the difficult version of the task. Inhibition of mature adult-born neurons furthermore increased overall activity in the dentate and reduced the biased pattern of activity across the blades, consistent with evidence that adult-born neurons broadly regulate dentate gyrus activity.
Comments on revisions:
I appreciate the efforts the authors have taken to revise this manuscript. I have only minor concerns with this revised version of the manuscript:
Methods state that significance is defined as P<0.05 but some results are interpreted as significant when P=0.05. Either the alpha value needs to change or the interpretation needs to change.
We have corrected the statement in the Methods section to define statistical significance as P ≤ 0.05, which aligns with how significance was interpreted throughout the manuscript.
I believe the statistical results for group and blade effects for the ANOVAs, in Figs 2,3 & 4, appear to be switched (blade should be significant, not group).
We thank the reviewer for pointing out this mistake. We have corrected the reported statistical results for the group and blade effects in the manuscript accordingly.
I appreciate that sometimes there is not a perfect overlap between immunohistochemical signals, but I continue to believe that the spatially-non-overlapping TRAP and EDU signals in Fig 3 is caused by these 2 markers being in different cells. A Z-stack or orthogonal projection could verify/disprove this concern.
We agree that limited overlap in single optical sections can raise the possibility that TRAP and EdU signals originate from different cells. However, based on our imaging conditions and inspection across focal planes, the signals are consistent with being present within the same cells, with partial spatial separation likely reflecting subcellular localization and/or sectioning effects.
Note: This response was posted by the corresponding author to Review Commons. The content has not been altered except for formatting.
Learn more at Review Commons
Response to the Reviewers
We thank three anonymous Reviewers for their careful examination of our manuscript. Below, we provide a point-by-point response.
Reviewer #1 (Evidence, reproducibility and clarity (Required)):
- EVIDENCE, REPRODUCIBILITY AND CLARITY Summary
Hubbert and colleagues describe ExTaSy, a CRISPR-Cas9-based platform for the endogenous tagging of proteins in Drosophila melanogaster. The system combines several established molecular tools into a single-vector framework: homology-directed repair (HDR) for the insertion of a 3XHA tag at the endogenous locus, piggyBac transposase-mediated near-scarless removal of a transgenic selection marker, and φC31 integrase-mediated recombination-mediated cassette exchange (RMCE) for subsequent tag swapping. The authors demonstrate the system across a set of 65 genomic loci and provide a bioinformatic pipeline to automate guide RNA and homology arm design.
Major Comments
- Validation of knock-in lines is inadequate and does not reflect current standards in the field. The authors state that correct insertions were confirmed using "two PCRs per inserted fragment done with primers binding to the 5' and 3' ends of the inserted DNA and corresponding gene-specific validation primers." This strategy is well known to produce false positives, as it cannot distinguish correctly targeted single-copy integrants from concatemeric insertions at the target locus (e.g. Skryabin et al., 2020). The current standard for validating CRISPR-mediated knock-ins requires PCR amplification using primers that anneal outside the homology arms and span the entire inserted cassette. These reactions must be performed under conditions that minimise the formation of PCR chimeras, specifically low cycle numbers and use of a high-processivity polymerase. The authors should either provide data from such experiments for their characterised lines, or clearly acknowledge this limitation and qualify their efficiency estimates accordingly (see related point 2 below).
__Response: __We originally opted for using primers that span a fragment from the inserted DNA into the genomic locus for ease of amplification, which is currently standard in the field (e.g., Kanca et al. 2022). We usually run these PCRs in a heterozygous background (before homozygous stocks are established or because tagged lines remain balanced), and the unmodified locus preferentially amplifies in a whole-fragment PCR. However, we have recently started running whole-fragment PCRs and plan to repeat them for all loci and will report the results in a revised version of the manuscript. We are also revising the manuscript to reflect the necessity (or at least preference) to perform insert-spanning PCRs.
Reported efficiency metrics do not adequately distinguish correctly targeted integrants from marker-positive flies.
A related concern is that many of the efficiency parameters reported in the manuscript appear to be based solely on the detection of the marker cassette. The 63.1% overall success rate, for example, seemingly reflects the recovery of DsRed-positive flies rather than of sequence validated, single-copy, on-target integrants. These are fundamentally different quantities, with only the latter being of practical value for the users of the described technique. The authors should either provide data that properly accounts for correct integration, or more carefully define what each reported metric represents and explicitly acknowledge the limitations of using marker presence as a proxy for successful knock-in.
__Response: __The reviewer is correct that the numbers we report are DsRed-positive flies. However, most have been confirmed with end-of-fragment/locus spanning PCRs, so are on-target (although not necessarily single-copy; see comment #1). While we cannot categorically exclude off-target insertions, we have not observed any cases where the DsRed segregates independently of the targeted chromosome, which at least makes off-target insertions on other chromosomes highly unlikely. We will clarify in the text that the 63.1 % success rate relates to DsRed marker expression and insertion site-spanning PCR and acknowledge the limitations as suggested by the reviewer.
The characterisation of tag exchange requires expansion or more careful framing of its scope.
The possibility of exchanging tags through fly crosses rather than repeated microinjections is, in the view of this reviewer, the most practically useful feature of ExTaSy and the aspect most likely to drive community adoption. It is therefore important that this feature is characterised with sufficient rigour to allow prospective users to assess its reliability. In the current manuscript, tag exchange has been demonstrated at only five loci using a single replacement tag (sfGFP). The dataset includes one outright failure (the Met C-terminus) and one instance of an unexpected 9 bp insertion at the recombination site, leaving the success rates and failure modes across a broader range of loci and tags uncharacterised. The authors should either expand the tag exchange experiments to cover a more representative set of conditions, or frame the current data explicitly as a proof of concept and limit their conclusions about the practical utility of tag exchange accordingly. In either case, the value of this work to the community would be substantially increased if a collection of donor lines carrying the most commonly used tags for different applications, as the authors themselves enumerate in the Discussion, were generated and deposited at a public stock centre such as the VDRC concurrent with publication. On this note, it is also worth flagging that at present the plasmids described in this study have not yet been deposited at Addgene or the European Plasmid Repository, and that fly lines are available only on request. For a methods paper aimed at community adoption, deposition of reagents in publicly accessible repositories at the time of publication is the expected standard.
__Response: __We are in the process of increasing the number of fly stocks for which tags have been exchanged and will be able to provide a more rigorous characterization with an updated version of the manuscript. We are also working on additional swap lines (for example T2A-GAL4). Regarding submission of the materials to relevant databases, we are in the process of depositing the plasmids on Addgene. We plan to deposit the swap lines and other toolkit stocks (new hs-Flp, vas-int lines as well as pBac transposase lines) at the VDRC or BDSC. To make the tagged fly lines viable for distribution via the VDRC, we are working to increase their numbers, and we plan to publish them separately as a resource, where we also plan to characterize the expression of more transcription factors and their isoforms in greater detail.
The Introduction should better reflect the current state of the field, including explicit comparison with MiMIC and CRIMIC.
The introduction would benefit from a clearer distinction between transgene-based approaches that introduce additional gene copies and true CRISPR-mediated knock-ins at the endogenous locus. As it stands, the discussion of prior methods does not sufficiently acknowledge that CRISPR-based knock-in is already the standard approach in Drosophila, and that the individual techniques employed in ExTaSy are well established. Notably, the MiMIC and CRIMIC systems (Nagarkar-Jaiswal et al., 2015; Li-Kroeger et al., 2018), which also support RMCE-based tag exchange at endogenous loci and for which large collections of lines are already publicly available, are not adequately discussed. These are arguably the closest comparators to ExTaSy, and the authors should explicitly address how their approach differs from and offers advantages over this existing framework, particularly given that MiMIC/CRIMIC insertions can also tag internal sites and thus avoid some of the terminus-specific complications described here.
__Response: __We will expand the introduction and the discussion to give more reference to other resources for endogenously and exogenously tagged genes in Drosophila and compare ExTaSy in greater detail with other methods, highlighting advantages and disadvantages of each and making clear that RMCE-based tag exchange and marker removal are not novel inventions.
Minor Comment
The labelling of sgRNA target sites in Figure 1 is inaccurate and should be corrected.
In Figure 1, the sgRNA target sites are annotated with triangles labelled "PAM synth." The presence of a PAM is necessary but not sufficient to define a target site; the label should therefore be changed to "target site" or an equivalent term. Additionally, the Methods section incorrectly expands PAM as "primary adjacent motif"; the correct expansion is "protospacer adjacent motif."
__Response: __The labelling in Figure 1 will be changed and the PAM abbreviation corrected.
Could the fly crossing scheme in Figure S3 be simplified?
In the scheme in Fig. S3 the second step seems to be intended to introduce the hs-Flp and vase-Int transgenes. Would it not be possible to already incorporate the Integrase into the swap fly line when it is made and the hs-Flp into the ExTaSy line, thereby saving one generation?
__Response: __This would in principle be possible; however, we prefer to keep the lines “clean” in case a tag exchange is not desired, and so this would require an initial crossing step. We therefore prefer the crossing scheme as it is.
Figure 1F has no call out in the main text.
__Response: __This will be corrected.
Line 155: What was the reason for the low survival rate? Is this likely to be indicative of a problem during marker removal, or a stochastic event as not all fly crosses are always productive (bad food, early death of flies, etc.)?
__Response: __This was a stochastic event. The fly line we used for expression of piggyBac transposase (BDSC_8285) is generally not growing well, and we could only use one eighth of all offspring to ensure correct segregation. We will make this clear in the text.
Line 160: What is the N number of "all cases"?
__Response: __This will be changed to “We performed Sanger sequencing for one established line for each of the 17 loci and confirmed clean excision of the piggyBac sites in all cases.”
Scale bars are missing in Fig. 3g,h.
__Response: __These will be included.
Line 219: The labeling of the panels got mixed up. Panel F does not show an immunostaining.
__Response: __The labeling will be corrected.
Line 226 and Fig. 3h: It is unclear what area is shown in the inlay. The overview image highlights three POIs, but none seem to fit the inlay.
__Response: __The images were indeed misleading as the inlay did not show a magnification of the same focal plane. We will show the inlay together with the overview of the corresponding focal plane as part of Supplementary Figure 5 and will amend the text accordingly.
Line 233: Why was the transgenic marker not removed? The authors want to highlight the easy and advantage of marker removal, so leaving in the marker is an odd choice.
__Response: __In this case, we observed that flies become homozygous even with the marker, so we assumed that a marker removal would not be necessary. We are currently performing additional experiments to remove the marker and repeat the staining, which we will submit with a revised version of the manuscript.
Line 250: Why was only one isoform of hth tagged? Without a rational this seems to be an odd choice, in particular since the authors seem to suggest in the introduction (Line 38) that a disadvantage of previous technologies is the tagging of only selected isoforms.
__Response: __While expanding the introduction (see comment #4), we will also rephrase it to highlight that current CRISPR-based methods (MiMIC and CRIMIC) are designed to tag all isoforms simultaneously or select isoforms, whereas overexpression constructs are limited to one isoform. In contrast, ExTaSy allows tagging of all isoforms that share a terminus. We will emphasize advantages and disadvantages in the discussion. In the case of hth, three different C-termini are annotated, and we are currently performing experiments to also tag the other termini and co-stain them with Ubx. We will submit the results in a revised version of the manuscript.
Reviewer #1 (Significance (Required)):
SIGNIFICANCE
ExTaSy assembles a set of well-established tools, namely CRISPR-mediated HDR, piggyBac-based marker excision, and φC31-mediated RMCE, into a unified, single-vector framework for endogenous protein tagging in Drosophila. The individual components have all been described and are in routine use in the field; the conceptual advance is therefore limited. Nevertheless, the integration of these features into a streamlined platform with accompanying automated design software represents a practical contribution that is likely to be of genuine utility to the Drosophila community, particularly for laboratories without specialist transgenesis infrastructure.
The possibility of tag exchange by fly crossing is the most distinctive feature of the system. However, as discussed above, this is currently demonstrated at only five loci with a single replacement tag, which limits the conclusions that can be drawn about its generality. More broadly, ExTaSy employs well-proven strategies throughout, which is a source of reliability but also means that the study does not incorporate more recent developments in the field. For example, approaches based on single-strand annealing, such as the recently described Seed/Harvest system (Aguilar et al., 2024), can achieve entirely scarless marker removal and thus circumvent the TTAA scar left by piggyBac excision, a limitation the authors themselves acknowledge may reduce expression at modified N-terminal loci. Similarly, the current system is restricted to N- and C-terminal tagging. Given that the goal of endogenous tagging is to minimally perturb protein function, and given the now widespread availability of high-quality protein structure predictions for the Drosophila proteome, a modern tagging platform might be expected to use structural modelling to identify optimal insertion sites irrespective of their location. These are not oversights that diminish the practical value of the current work, but highlight that this study does not always operate at the cutting edge of method development in this area. A brief discussion of these more recent developments in the context of ExTaSy's design choices would usefully situate the work within the broader landscape and help readers understand both what the system offers today and where improvements are likely to come from.
__Responses: __
Reviewer #2 (Evidence, reproducibility and clarity (Required)):
Summary
Hubbert et al. describes ExTaSy (Exchangeable Tagging System), a method for endogenous protein tagging in fruitflies. The technique attempts to address some limitations of current tagging strategies, such as non-physiological expression from transgenes, disruption of the target gene, and limited usefulness of a single tag type. The basic approach is not novel, rather it effectively incorporates ideas from several previously published methods:
- Crispr-based release of the HDR donor from the backbone in vivo (Kanca et al., 2019 and 2021).
- PBac scarless tagging (flycrisprdesign)
- In vivo RMCE to swap out tags (Nagarkar-Jaiswal et al., 2015) Although not novel, the authors show the completeness and effectiveness of the approach. They were able to tag genes across multiple chromosomes, with knock-in rates comparable to other approaches, and demonstrate tag swapping through RMCE. Overall, this work introduces a versatile and modular platform that combines several previous innovations into a single effective package.
Major comments
1.The manuscript would benefit from a more upfront discussion of how ExTaSy relates to existing methods. As currently written, the implies a higher degree of novelty than is warranted, since ExTaSy combine several previously established approaches, including, as already noted. While this is valuable, the authors should more clearly acknowledge in the abstract and introduction that the primary advance is the unification and streamlining of these existing technologies into a single platform, rather than the introduction of fundamentally new components.
__Response: __While we did cite most of the publications mentioned by the reviewer, we will make clearer that our system combines several previously established Drosophila systems and is not per se a novel invention. We will expand the introduction and discussion to reflect this and cite additional publications.
- *
2.Comparison to prior systems. The manuscript should include a direct comparison to existing tagging pipelines. For example: What practical steps are eliminated relative to prior approaches? Does ExTaSy reduce the number of injections or constructs required? How does the workflow differ in terms of time, cost, or technical expertise? This is vaguely addressed in the discussion, but more specific and clear comparisons would improve things for the reader who is trying to decide which method to use. For example, how does this strategy directly compare with the protein trap alleles described in Kanca et al., 2022? This could be done as a supplemental table.
__Response: __A similar concern has been raised by reviewer #1 (comment #4). We will expand the introduction and the discussion to compare ExTaSy in more detail with other methods, highlighting advantages and disadvantages of each.
3.Only 4 successful RMCE swaps are presented. This is too few to make a confident conclusion about the efficiency. The authors should do at least 4 more and include negative data.
__Response: __A similar point has been made by reviewer #1 (comment #3). We are in the process of expanding the number of fly stocks for which tags have been exchanged and will be able to provide a more rigorous characterization with an updated version of the manuscript.
4.Some discussion of the potential limitations of the linker from the residual att sites is needed.
__Response: __We will include this in the discussion.
Minor comments
1.It would be helpful to include a workflow overview figure summarizing the full pipeline.
__Response: __We will include such a figure in the supplement.
2.Line 124: Most genes we tagged at the C-terminus were homozygous viable, indicating limited detrimental effects. Need to include the numbers? What is "most genes."
__Response: __We will include these numbers in the text.
3.Briefly explain how the tested genes were selected (e.g., random, representative, biased toward certain classes), as this could affect interpretation of generalizability. If most of the genes are essential for viability, this makes the viability of tagged lines more impressive.
__Response: __This is an excellent suggestion, and we thank the reviewer for pointing this out. We have mainly tagged genes that are relevant for work in our labs and for collaborators, focusing almost entirely on transcription factor-encoding genes that are largely essential for normal development. We will include a brief discussion of this.
Reviewer #2 (Significance (Required)):
Significance
1.General assessment: This study presents ExTaSy, a practical and well-executed platform for endogenous protein tagging in Drosophila. Its main strength is the integration of multiple existing technologies into a streamlined workflow that enables tagging, marker removal, and tag swapping. The system is clearly functional and broadly applicable. However, the conceptual novelty is limited, and the manuscript should more explicitly frame the work as an engineering advance. Tagging and RMCE efficiencies are moderate.
2.Advance: ExTaSy represents a technical advance that combines CRISPR HDR tagging, piggyBac scarless editing, and RMCE into a single platform. The biggest improvement is the ability to tag once and flexibly swap tags via crosses, reducing the need for repeated genome engineering. This extends existing methods by improving experimental flexibility.
3.Audience: This work will primarily interest a specialized audience in Drosophila genetics, CRISPR technologies, and functional genomics, with broader relevance to researchers developing tagging systems in other model organisms.
4.Field of expertise: CRISPR screening, Drosophila genetics, functional genomics. No limitations on my ability to evaluate.
Reviewer #3 (Evidence, reproducibility and clarity (Required)):
This methods paper is targeting the long-standing ambition of how to most efficiently tag proteins at the endogenous gene locus in Drosophila. Since the invention of CRISPR-Cas9 many genes have been successfully modified in Drosophila, but the community is still lacking a large collection of tagged proteins under endogenous control made with the same method.
This manuscript is using a small tag, 3xHA, which supposedly is easier to integrate, and the design allows to then swap the tag with larger fluorescent tags, solely by fly crossing. Then, the dsRed or white markers, allowing identification, can be removed with a biggybac recombinase leaving only a small scar. However, attP/B/R scars do remain. Design and cloning appear straightforward. Overall, this is an interesting strategy.
However, the manuscript falls short in really describing the resource, apart from the cloning design. A more rigorous analysis of a number of lines should be presented to better judge if the strategy practically works. It is quite disappointing to see that only 2 or 3 genes/proteins were analysed here in a bit more detail. This does not sound like a very straightforward resource that aims to go large scale.
Major comments:
The important novelty here is not only the design that allows high-throughput cloning but more importantly that the tagged lines are actually correct and functional. To present this better, I suggest to rearrange Figure 1 to show the flow: 65 constructs cloned, 41 "successfully" inserted. Of how many the dsRed marker was removed, of how many expression or function was tested? Hence the reader knows about the current state of the resource. These numbers would be informative to have in the abstract, too.
__Response: __We will include these numbers in the abstract. Reviewer 2 asked for an overview figure of the workflow, which we will include as a supplementary figure, where we can also include numbers as suggested by this reviewer.
The 41 tagged gene insertions need at least some basic characterisation to verify that they are at the correct place or make a functional protein. Which genes were chosen? I do not see 41 genes tagged in the table provided. I supposed the N-terminal tags should initially be loss of function. Are the N-term lines lethal when inserted in an essential gene? Again, this could be shown in an overview, instead by a non-quantitative statement in the text.
__Response: __We have verified the insertion site of the lines with genotyping PCR. We will include a table to show in more detail which genes were tagged at which terminus, and which protein isoforms are captured by the respective tag.
- *
How many of the 41 tagged proteins are functional? The authors only provide information on Ubx-3xHA (functional) and Mef2-3xHA (non-functional), which I find weak.
__Response: __We will include this information in the table mentioned in the above comment.
Stainings are only shown for 2 proteins, Ubx-GFP and Exd-3xHA. How about the others?
__Response: __We are currently in the process of using ExTaSy to establish a library of tagged fly lines, which we intend to characterize in more detail and publish separately. For the current manuscript, we prefer to focus on the methodology of the tagging system itself.
I am not sure about how to calculate the transgenesis rates, but strictly speaking to ones that did not result in an insertion should also be counted for the statistics, I guess.
__Response: __There is indeed no commonly agreed upon way to calculate these rates, and it is done differently in different publications. We felt that metrics that discriminate between the overall success rate (i.e., all those injections that lead to transgenics) and the success rate within successful injections would be most useful. We will try to make clear in the text where we refer to all attempts and where we exclusively refer to the successful ones.
Minor comments:
The introduction states that ExTaSy would tag all isoforms of genes. However, I find this an overstatement, as for complex genes tagging at the one place cannot always label all isoforms, see the Hth line generated here (Iso E).
__Response: __This was indeed badly phrased and we will correct the wording also in response to reviewer #1 comment #14 to reflect that overexpression constructs are limited to a specific isoform, whereas ExTaSy enables simultaneous tagging of all isoforms that share a terminus.
Why does it matter on which chromosome the target gene is? This can be moved to supplement. I would rather like to know what the genes are.
__Response: __We presume that the reviewer refers to Figure 1, where we show the success rates for individual chromosomes. We felt that the lower success rate for injections targeting gene on chr3 (which is, as we describe, due to lower survival of the injection line) warranted this separation by chromosome. As stated above, we will include a list of tagged genes as a table.
**Referees cross-commenting**
I agree with the 2 other reviewer's points. In particular that the knock-in lines need better verifications. This was also my major point.
__Response: __As also stated for reviewer #1 comment #1, we have now begun to run whole-fragment PCRs for all loci to investigate this further and will report the results in a revised version of the manuscript.
Reviewer #3 (Significance (Required)):
The methodology presented here is per se not really new. The 3xP3-dsRed eye marker is standard, its removal by biggbac transposase has been done before and RMCE to change the tagging cassettes with attP/B is done since many years. The latter has the disadvantage to not be seamless, as one attR site remains, which is translated, the other attR site remains in the 5'- or 3'-UTR, which can have an effect. U6-driven sgRNA expression is also standard.
__Response: __We will make clearer that our system combines several previously established Drosophila systems and is not per se a novel invention. We will expand the introduction and discussion to reflect this and cite additional publications.
The design includes the sgRNA and the HDR template cassette in a single vector, which is smart and makes cloning straight forward. Again, the paper would be stronger if the list of all cloned clones would be listed (are 65 all that were clones or all that were injected?
__Response: __We will include this as a table.
As the authors do not rigorously test the function of the tagged genes, it is hard to judge how valuable the pipeline is. This can be easily solved by providing more data that support the easy, high-throughput exchange tagging pipeline that produces tagged Drosophila lines that are useful to the community.
__Response: __As stated above, we plan to publish a more detailed analysis of tagged lines as a separate resource paper. We will state in the manuscript which lines were homozygous viable before and after marker removal, which gives at least an indication of whether the tagged protein is functional.
Note: This preprint has been reviewed by subject experts for Review Commons. Content has not been altered except for formatting.
Learn more at Review Commons
This methods paper is targeting the long-standing ambition of how to most efficiently tag proteins at the endogenous gene locus in Drosophila. Since the invention of CRISPR-Cas9 many genes have been successfully modified in Drosophila, but the community is still lacking a large collection of tagged proteins under endogenous control made with the same method. This manuscript is using a small tag, 3xHA, which supposedly is easier to integrate, and the design allows to then swap the tag with larger fluorescent tags, solely by fly crossing. Then, the dsRed or white markers, allowing identification, can be removed with a biggybac recombinase leaving only a small scar. However, attP/B/R scars do remain. Design and cloning appear straightforward. Overall, this is an interesting strategy. However, the manuscript falls short in really describing the resource, apart from the cloning design. A more rigorous analysis of a number of lines should be presented to better judge if the strategy practically works. It is quite disappointing to see that only 2 or 3 genes/proteins were analysed here in a bit more detail. This does not sound like a very straightforward resource that aims to go large scale.
Major comments:
Minor comments:
Referees cross-commenting
I agree with the 2 other reviewer's points. In particular that the knock-in lines need better verifications. This was also my major point.
The methodology presented here is per se not really new. The 3xP3-dsRed eye marker is standard, its removal by biggbac transposase has been done before and RMCE to change the tagging cassettes with attP/B is done since many years. The latter has the disadvantage to not be seamless, as one attR site remains, which is translated, the other attR site remains in the 5'- or 3'-UTR, which can have an effect. U6-driven sgRNA expression is also standard. The design includes the sgRNA and the HDR template cassette in a single vector, which is smart and makes cloning straight forward. Again, the paper would be stronger if the list of all cloned clones would be listed (are 65 all that were clones or all that were injected?
As the authors do not rigorously test the function of the tagged genes, it is hard to judge how valuable the pipeline is. This can be easily solved by providing more data that support the easy, high-throughput exchange tagging pipeline that produces tagged Drosophila lines that are useful to the community.
Note: This preprint has been reviewed by subject experts for Review Commons. Content has not been altered except for formatting.
Learn more at Review Commons
Summary
Hubbert et al. describes ExTaSy (Exchangeable Tagging System), a method for endogenous protein tagging in fruitflies. The technique attempts to address some limitations of current tagging strategies, such as non-physiological expression from transgenes, disruption of the target gene, and limited usefulness of a single tag type. The basic approach is not novel, rather it effectively incorporates ideas from several previously published methods:
Major comments
1.The manuscript would benefit from a more upfront discussion of how ExTaSy relates to existing methods. As currently written, the implies a higher degree of novelty than is warranted, since ExTaSy combine several previously established approaches, including, as already noted. While this is valuable, the authors should more clearly acknowledge in the abstract and introduction that the primary advance is the unification and streamlining of these existing technologies into a single platform, rather than the introduction of fundamentally new components. 2.Comparison to prior systems. The manuscript should include a direct comparison to existing tagging pipelines. For example: What practical steps are eliminated relative to prior approaches? Does ExTaSy reduce the number of injections or constructs required? How does the workflow differ in terms of time, cost, or technical expertise? This is vaguely addressed in the discussion, but more specific and clear comparisons would improve things for the reader who is trying to decide which method to use. For example, how does this strategy directly compare with the protein trap alleles described in Kanca et al., 2022? This could be done as a supplemental table. 3.Only 4 successful RMCE swaps are presented. This is too few to make a confident conclusion about the efficiency. The authors should do at least 4 more and include negative data. 4.Some discussion of the potential limitations of the linker from the residual att sites is needed.
Minor comments
1.It would be helpful to include a workflow overview figure summarizing the full pipeline. 2.Line 124: Most genes we tagged at the C-terminus were homozygous viable, indicating limited detrimental effects. Need to include the numbers? What is "most genes." 3.Briefly explain how the tested genes were selected (e.g., random, representative, biased toward certain classes), as this could affect interpretation of generalizability. If most of the genes are essential for viability, this makes the viability of tagged lines more impressive.
1.General assessment: This study presents ExTaSy, a practical and well-executed platform for endogenous protein tagging in Drosophila. Its main strength is the integration of multiple existing technologies into a streamlined workflow that enables tagging, marker removal, and tag swapping. The system is clearly functional and broadly applicable. However, the conceptual novelty is limited, and the manuscript should more explicitly frame the work as an engineering advance. Tagging and RMCE efficiencies are moderate. 2.Advance: ExTaSy represents a technical advance that combines CRISPR HDR tagging, piggyBac scarless editing, and RMCE into a single platform. The biggest improvement is the ability to tag once and flexibly swap tags via crosses, reducing the need for repeated genome engineering. This extends existing methods by improving experimental flexibility. 3.Audience: This work will primarily interest a specialized audience in Drosophila genetics, CRISPR technologies, and functional genomics, with broader relevance to researchers developing tagging systems in other model organisms. 4.Field of expertise: CRISPR screening, Drosophila genetics, functional genomics. No limitations on my ability to evaluate.
Note: This preprint has been reviewed by subject experts for Review Commons. Content has not been altered except for formatting.
Learn more at Review Commons
Summary
Hubbert and colleagues describe ExTaSy, a CRISPR-Cas9-based platform for the endogenous tagging of proteins in Drosophila melanogaster. The system combines several established molecular tools into a single-vector framework: homology-directed repair (HDR) for the insertion of a 3XHA tag at the endogenous locus, piggyBac transposase-mediated near-scarless removal of a transgenic selection marker, and φC31 integrase-mediated recombination-mediated cassette exchange (RMCE) for subsequent tag swapping. The authors demonstrate the system across a set of 65 genomic loci and provide a bioinformatic pipeline to automate guide RNA and homology arm design.
Major Comments
The authors state that correct insertions were confirmed using "two PCRs per inserted fragment done with primers binding to the 5' and 3' ends of the inserted DNA and corresponding gene-specific validation primers." This strategy is well known to produce false positives, as it cannot distinguish correctly targeted single-copy integrants from concatemeric insertions at the target locus (e.g. Skryabin et al., 2020). The current standard for validating CRISPR-mediated knock-ins requires PCR amplification using primers that anneal outside the homology arms and span the entire inserted cassette. These reactions must be performed under conditions that minimise the formation of PCR chimeras, specifically low cycle numbers and use of a high-processivity polymerase. The authors should either provide data from such experiments for their characterised lines, or clearly acknowledge this limitation and qualify their efficiency estimates accordingly (see related point 2 below). 2. Reported efficiency metrics do not adequately distinguish correctly targeted integrants from marker-positive flies.
A related concern is that many of the efficiency parameters reported in the manuscript appear to be based solely on the detection of the marker cassette. The 63.1% overall success rate, for example, seemingly reflects the recovery of DsRed-positive flies rather than of sequence validated, single-copy, on-target integrants. These are fundamentally different quantities, with only the latter being of practical value for the users of the described technique. The authors should either provide data that properly accounts for correct integration, or more carefully define what each reported metric represents and explicitly acknowledge the limitations of using marker presence as a proxy for successful knock-in. 3. The characterisation of tag exchange requires expansion or more careful framing of its scope.
The possibility of exchanging tags through fly crosses rather than repeated microinjections is, in the view of this reviewer, the most practically useful feature of ExTaSy and the aspect most likely to drive community adoption. It is therefore important that this feature is characterised with sufficient rigour to allow prospective users to assess its reliability. In the current manuscript, tag exchange has been demonstrated at only five loci using a single replacement tag (sfGFP). The dataset includes one outright failure (the Met C-terminus) and one instance of an unexpected 9 bp insertion at the recombination site, leaving the success rates and failure modes across a broader range of loci and tags uncharacterised. The authors should either expand the tag exchange experiments to cover a more representative set of conditions, or frame the current data explicitly as a proof of concept and limit their conclusions about the practical utility of tag exchange accordingly. In either case, the value of this work to the community would be substantially increased if a collection of donor lines carrying the most commonly used tags for different applications, as the authors themselves enumerate in the Discussion, were generated and deposited at a public stock centre such as the VDRC concurrent with publication. On this note, it is also worth flagging that at present the plasmids described in this study have not yet been deposited at Addgene or the European Plasmid Repository, and that fly lines are available only on request. For a methods paper aimed at community adoption, deposition of reagents in publicly accessible repositories at the time of publication is the expected standard. 4. The Introduction should better reflect the current state of the field, including explicit comparison with MiMIC and CRIMIC.
The introduction would benefit from a clearer distinction between transgene-based approaches that introduce additional gene copies and true CRISPR-mediated knock-ins at the endogenous locus. As it stands, the discussion of prior methods does not sufficiently acknowledge that CRISPR-based knock-in is already the standard approach in Drosophila, and that the individual techniques employed in ExTaSy are well established. Notably, the MiMIC and CRIMIC systems (Nagarkar-Jaiswal et al., 2015; Li-Kroeger et al., 2018), which also support RMCE-based tag exchange at endogenous loci and for which large collections of lines are already publicly available, are not adequately discussed. These are arguably the closest comparators to ExTaSy, and the authors should explicitly address how their approach differs from and offers advantages over this existing framework, particularly given that MiMIC/CRIMIC insertions can also tag internal sites and thus avoid some of the terminus-specific complications described here.
Minor Comment
In Figure 1, the sgRNA target sites are annotated with triangles labelled "PAM synth." The presence of a PAM is necessary but not sufficient to define a target site; the label should therefore be changed to "target site" or an equivalent term. Additionally, the Methods section incorrectly expands PAM as "primary adjacent motif"; the correct expansion is "protospacer adjacent motif." 6. Could the fly crossing scheme in Figure S3 be simplified?
In the scheme in Fig. S3 the second step seems to be intended to introduce the hs-Flp and vase-Int transgenes. Would it not be possible to already incorporate the Integrase into the swap fly line when it is made and the hs-Flp into the ExTaSy line, thereby saving one generation? 7. Figure 1F has no call out in the main text. 8. Line 155: What was the reason for the low survival rate? Is this likely to be indicative of a problem during marker removal, or a stochastic event as not all fly crosses are always productive (bad food, early death of flies, etc.)? 9. Line 160: What is the N number of "all cases"? 10. Scale bars are missing in Fig. 3g,h. 11. Line 219: The labeling of the panels got mixed up. Panel F does not show an immunostaining. 12. Line 226 and Fig. 3h: It is unclear what area is shown in the inlay. The overview image highlights three POIs, but none seem to fit the inlay. 13. Line 233: Why was the transgenic marker not removed? The authors want to highlight the easy and advantage of marker removal, so leaving in the marker is an odd choice. 14. Line 250: Why was only one isoform of hth tagged? Without a rational this seems to be an odd choice, in particular since the authors seem to suggest in the introduction (Line 38) that a disadvantage of previous technologies is the tagging of only selected isoforms.
ExTaSy assembles a set of well-established tools, namely CRISPR-mediated HDR, piggyBac-based marker excision, and φC31-mediated RMCE, into a unified, single-vector framework for endogenous protein tagging in Drosophila. The individual components have all been described and are in routine use in the field; the conceptual advance is therefore limited. Nevertheless, the integration of these features into a streamlined platform with accompanying automated design software represents a practical contribution that is likely to be of genuine utility to the Drosophila community, particularly for laboratories without specialist transgenesis infrastructure.
The possibility of tag exchange by fly crossing is the most distinctive feature of the system. However, as discussed above, this is currently demonstrated at only five loci with a single replacement tag, which limits the conclusions that can be drawn about its generality. More broadly, ExTaSy employs well-proven strategies throughout, which is a source of reliability but also means that the study does not incorporate more recent developments in the field. For example, approaches based on single-strand annealing, such as the recently described Seed/Harvest system (Aguilar et al., 2024), can achieve entirely scarless marker removal and thus circumvent the TTAA scar left by piggyBac excision, a limitation the authors themselves acknowledge may reduce expression at modified N-terminal loci. Similarly, the current system is restricted to N- and C-terminal tagging. Given that the goal of endogenous tagging is to minimally perturb protein function, and given the now widespread availability of high-quality protein structure predictions for the Drosophila proteome, a modern tagging platform might be expected to use structural modelling to identify optimal insertion sites irrespective of their location. These are not oversights that diminish the practical value of the current work, but highlight that this study does not always operate at the cutting edge of method development in this area. A brief discussion of these more recent developments in the context of ExTaSy's design choices would usefully situate the work within the broader landscape and help readers understand both what the system offers today and where improvements are likely to come from.
Note: This response was posted by the corresponding author to Review Commons. The content has not been altered except for formatting.
Learn more at Review Commons
Reviewer #1 (Evidence, reproducibility and clarity (Required)):
This paper describes the localisation of DNA repair proteins, which carry out their DNA repair function in the nucleus, to the cytoplasmic Golgi apparatus. Using the Human Protein Atlas to identify candidates, the authors use antibody localisation to show that a significant number of DNA repair proteins also localise at the Golgi. It appears that proteins involved in common DNA repair pathways localise to common regions of the Golgi. The Golgi-nucleus distribution of the DNA repairs proteins changes upon DNA damage, indicating a dynamic relationship. The authors focus on the DNA repair protein RAD51C and show that its loss from the Golgi and translocation to the nucleus upon DNA damage is mediated by the ATM kinase. Anchoring at the Golgi is shown to be mediated by the golgin giantin. A functional role for giantin in DNA repair is shown in knockdown studies, supporting a mechanism whereby Golgi anchoring of RAD51C, and possibly other DNA repair proteins, by giantin, is required to maintain proper control of DNA repair. The data are clear and support the authors' conclusions. The data are carefully quantified throughout. I found the text easy to read.
Major points:*
1.) To validate the Golgi localisation, KD using siRNA was used. It was deemed that a signal reduction of 25% was enough to indicate specific antibody labelling. This seems like a low number, and not very stringent. For some of the hits, expressing tagged versions of the proteins would greatly strengthen the Golgi assignment. This may not be possible for all, but for RAD51C would seem an important experiment. *
Response: We thank the reviewer for raising the important issue of antibody validation stringency. We agree that for a single-candidate study, a larger reduction after knockdown would generally be preferable. In our case, the 25% cutoff was used only in the primary high-content screening step as part of an intentionally inclusive two-stage workflow, for the following reasons:
First, because this dataset is generated in a screening format across hundreds of targets, knockdown-efficiency, protein turnover, and the relative size of the Golgi associated pool are unknown and highly variable between genes. For many proteins the Golgi pool represents a small fraction of total cellular signal, and a modest change in total abundance can translate into a smaller absolute change in the Golgi ROI after segmentation, background subtraction, and imaging noise. We therefore selected a permissive cutoff to reduce false negatives and ensure we did not systematically miss candidates with slower turnover, partial knockdown, or small Golgi pools. This strategy is consistent with large scale subcellular mapping efforts, including the Human Protein Atlas, where genetic depletion by siRNA is used as a key validation pillar for immunofluorescence localization and is combined with additional validation strategies when deeper confidence is required (Stadler et al, 2012). Furthermore, it is important to note that this validation was performed in a high-content screening format in which fixation, permeabilisation, antibody concentration, and blocking conditions were kept uniform across all candidates rather than optimised for each individual antibody. In standard single-target immunofluorescence experiments, these parameters would be titrated to maximise signal-to-noise for the specific antibody and antigen in question. Under non-optimised screening conditions, the absolute magnitude of signal change upon knockdown is inherently attenuated compared to what would be expected from a purpose-optimised assay. We therefore consider a 25% reduction threshold under these uniform, non-optimised screening conditions to be a meaningful and appropriately calibrated criterion.
Second, we wish to clarify that the primary intent of our screen was not to validate the Golgi-nuclear localisation of any single protein in isolation, but rather to identify whether entire functional pathways are represented at the two organelles. This is precisely why the bioinformatic network analysis was performed as an integral part of the workflow, and not as an afterthought. The finding that the validated hit list is significantly enriched for coherent functional clusters, most notably a network spanning multiple core DNA repair pathways (HR, MMR, BER, MMEJ) serves as an in silico validation of the dataset as a whole. The emergence of pathway-level organisation, with proteins from the same repair pathways co-associating, localising to the same Golgi sub-compartments, and redistributing in the same direction upon genotoxic stimuli, provides biological coherence that goes beyond what individual antibody validation can offer, and substantially reduces the likelihood that the Golgi signal represents a collection of unrelated false positives.
Third, our mechanistic conclusions do not rely on the 25% screening threshold. For RAD51C, we used multiple orthogonal validation approaches, including independent antibodies recognizing distinct RAD51C epitopes and genetic depletion, supported by biochemical evidence.
In response to this comment, we have provided the full screening validation dataset as source data (Supplementary____Table S1), including intensity changes for the candidates, so that readers can inspect the distributions and apply their own thresholds. We have also clarified in the Results section the rationale behind our screening strategy (lines 128-139) and the role of the bioinformatic network analysis as an integral validation step (lines 141-156).
Turning to the specific suggestion of tagged RAD51C, we fully agree that tagged proteins can provide valuable orthogonal validation. We attempted endogenous tagging using CRISPR-mediated homologous recombination but were unable to obtain viable colonies following editing, consistent with the essential role of RAD51C in homologous recombination. We also attempted ectopic expression of tagged RAD51C but were unable to obtain constructs that preserved physiological expression levels, maintained robust cell viability or produced interpretable localization. This difficulty is not unique to our laboratory: colleagues working on RAD51 paralog complexes have reported that tagging or overexpression of RAD51C perturbs both its localisation and its ability to form functional paralog complexes (Greenhough et al, 2023; Rawal et al, 2023; Somyajit et al, 2015; Berti et al, 2020) all use purified complexes or untagged proteins for functional assays. We discussed these challenges extensively with experts in the DNA damage repair field at several international meetings (EMBO Sounio, Keystone Symposia, German DNA Repair Society). For these reasons, we relied on orthogonal approaches that do not require tagging (genetic depletion plus independent antibodies, and biochemical fractionation) to support the Golgi localization claim. We agree with the reviewer that this represents a limitation of this study, and we addressed these concerns in the discussion of our revised manuscript (lines 630-641).
*2.) The total signal should be quantified for each DNA repair protein upon genotoxic stress, in addition to the Golgi to nucleus ratio. For many of the proteins it looks like the total signal goes down, which could influence interpretation. *
Response: __We thank the reviewer for this important point. We wish to clarify that our imaging pipeline uses marker-based segmentation throughout, the Golgi compartment is segmented using GM130 and the nucleus using Hoechst, as unsegmented whole-cell masks without organelle markers yield unreliable intensity measurements in this experimental setup. True total cellular signal is therefore not directly accessible in this dataset. In the revised manuscript we provide the absolute fluorescence intensities for both the Golgi and nuclear compartments separately. In addition, we now include total (Golgi + nuclear) intensity measurements for each protein (__Supplementary Figures 3D, 4D, __and 5E__) as the most reliable proxy for overall protein distribution. These data are presented alongside the redistribution ratio to enable comprehensive interpretation.
As the reviewer correctly notes, a subset of proteins shows a reduction in total signal after treatment, particularly with doxorubicin. This is consistent with known effects of doxorubicin-induced DNA damage on cellular proteostasis, including widespread ubiquitination and suppression of protein translation (Halim et al, 2018). Several DDR regulators are subject to ubiquitin-dependent turnover following genotoxic stress, such as CHK1 (Zhang et al, 2005). More broadly, ubiquitin and proteasome mediated regulation is an integral component of the DNA damage response and can affect the abundance and detectability of DDR factors (Brinkmann et al, 2015). Changes in abundance are therefore an expected biological feature of the response. For this reason, we used the Golgi-to-nucleus ratio as the primary redistribution readout, as it captures relative compartmental partitioning independently of changes in total protein levels.
*3.) The study would benefit from live imaging of the Golgi to nucleus translocation of RAD51C. This would give a better indication of dynamics. *
__Response: __We agree that live imaging would directly visualize the dynamics of RAD51C redistribution between the Golgi and the nucleus. This was indeed one of our initial goals following the identification of the Golgi-associated RAD51C pool. However, as described above in our response to Major Comment 1, live imaging requires a fluorescently tagged RAD51C construct, and all tagging strategies we attempted, both endogenous CRISPR-mediated tagging and ectopic expression, failed to yield cell lines with robust signal while preserving physiological behaviour. This appears to be a broader challenge for highly conserved and functionally constrained DNA repair proteins, and is not unique to our laboratory.
Given these constraints, we focused on tag-independent approaches: multiple independent RAD51C antibodies combined with genetic depletion controls, quantitative fixed-cell time courses, and biochemical fractionation. These orthogonal datasets together support compartment-specific changes over time in a manner consistent with redistribution. We have clarified this limitation explicitly in the manuscript and avoided any wording that could be interpreted as implying direct single-molecule tracking in live cells. We present this as an important avenue for future work, contingent on the development of viable RAD51C-expressing cell lines (lines 630-641).
*4.) The double depletion experiments suggest a functional relationship between giantin and RAD51C. But they do not formally show it. Experiments to more directly address the functional role of the interaction between these two proteins would strengthen the study. *
Response: We agree with the reviewer that double depletion alone cannot formally prove that the physical Giantin-RAD51C interaction is the sole determinant of the observed DDR phenotypes. However, we would like to highlight the breadth of evidence we have assembled in support of this functional relationship:
Nonetheless, we fully agree that the most direct proof of the functional relevance of the physical Giantin-RAD51C interaction would come from separation-of-function experiments, ideally using an interaction-deficient Giantin mutant or an RAD51C variant unable to bind Giantin. We wish to be transparent that both approaches face substantial technical barriers in this system. RAD51C tagging consistently compromised cell viability and protein function, precluding the generation of interaction-deficient variants at physiological expression levels. Engineering an interaction-deficient Giantin mutant presents an independent challenge: Giantin is one of the largest Golgi matrix proteins (~376 kDa), composed almost entirely of extended coiled-coil domains that are resistant to structural prediction, and identifying a discrete RAD51C interaction interface without disrupting broader scaffolding function would require a dedicated structural and biochemical programme. We have framed these explicitly as the most important future priorities in the Discussion (lines 555-564), rather than over-interpreting the current data.
*5.) The Kaplan-Meier plots in Fig S9 seems to be quite selective in that only breast cancer is shown. Does giantin reduction correlate with poor prognosis in other cancers? *
__Response: __We thank the reviewer for this suggestion. We initially focused on breast cancer because RAD51C is a clinically established hereditary breast and ovarian cancer susceptibility gene (Meindl et al, 2010; Ghannoum et al, 2023), providing direct clinical context for a study centred on RAD51C dynamics and genome stability. We agree however that restricting the survival analysis to a single cancer type can appear selective.
To address this directly, we expanded the in-silico survival analysis of Giantin (GOLGB1) using GEPIA2 (Tang et al, 2019) across all available TCGA cohorts (overall survival, median cutoff, FDR correction). In the pooled pan-cancer analysis, higher GOLGB1 expression is significantly associated with improved overall survival (HR(high) = 0.75, p = 6.6 × 10⁻¹⁵). When stratified by tumour type, the majority of individual associations do not reach statistical significance. The two most robust statistically significant associations are kidney renal clear cell carcinoma (KIRC; HR(high) = 0.57, p = 3.4 × 10⁻⁴), where high GOLGB1 expression is associated with improved survival, and lower-grade glioma (LGG; HR(high) = 1.5, p = 0.036), where the association is in the opposite direction. A significant association is also observed in thymoma (THYM; HR(high) = 7.3, p = 0.031), though this should be interpreted with caution given the small cohort size (n = 59). Notably, the breast cancer association observed in the KM Plotter analysis (HR = 0.71, p = 1.8 × 10⁻¹¹; n = 4,929) does not reach significance in the TCGA BRCA cohort (HR = 1.1, p = 0.68; n = 1,070), most likely reflecting the substantially smaller sample size of the TCGA cohort, which is approximately 4.6-fold smaller and therefore underpowered to detect a modest effect. These context-dependent associations are consistent with the tumour-type-specific roles of Golgi scaffolding proteins and are discussed accordingly in the revised manuscript.
In the revised manuscript we have retained the original breast cancer Kaplan-Meier plots and supplemented them with a pan-cancer survival map across all TCGA cohorts (lines 611-625; Figure S9G) and a summary table (Supplementary Table 3) reporting hazard ratios, sample sizes, and p-values for each tumour type, allowing readers to assess the clinical relevance of GOLGB1 expression.
*Minor points: There are a few grammatical errors here and there. The figures do not appear in the correct order in the text, which makes the early parts of the paper a bit difficult to follow. Some of the figures don't seem to clearly match the text. For example, it is mentioned that RAD51C labelling was done with 3 different antibodies. I could not find this data. *
Response: __We thank the reviewer for these helpful observations. In the revised manuscript we have (i) carefully proofread the text and corrected grammatical errors throughout; (ii) revised the Results section to ensure that figures and supplementary figures are cited in sequential order and that each panel is explicitly introduced before being discussed, improving readability in the early sections. and (iii) corrected figure callouts to ensure they match the text. In particular, the statement that RAD51C labeling was performed with three different antibodies has been linked to the corresponding figure panels in the Results section. Antibody identifiers, sources, and dilutions are clearly reported in the Methods and in the table in __Supplementary Table S1.
__ Reviewer #1 (Significance (Required)):__
*This paper is novel and should be of significant interest to the field. It has important implications for how we think about the Golgi apparatus, and for how DNA repair pathways may be controlled. The pattern is clearly complex, with many DNA repair proteins localising to the Golgi, and some showing opposite dynamics. However, by focussing on RAD51C and giantin, the paper nicely demonstrates a novel mechanism for controlling DNA repair by these proteins. *
Reviewer #2 (Evidence, reproducibility and clarity (Required)):
Background - Eukaryotic cells rely on tightly regulated DNA repair pathways to preserve genome stability under the constant threat of both endogenous and exogenous genotoxic stress. While the nucleus, and to a lesser extent the mitochondria, is the primary site where DNA damage is detected and repaired, accumulating evidence indicates that extranuclear organelles, particularly the Golgi apparatus, play a surprisingly important role in modulating stress signaling, proteostasis, and the trafficking/activation of key DNA repair factors.
- Emerging evidence has shown that genotoxic stress can result in a major remodeling of the Golgi apparatus; however, the crosstalk between the Golgi and the nucleus, and its contribution to the DNA damage response, remains poorly defined. The present study offers timely insight by examining the spatiotemporal behavior of DNA repair proteins that shuttle between the Golgi and the nucleus, and how this trafficking contributes to the maintenance of genomic stability.*
Main findings - The authors employed the Human Protein Atlas (HPA) project to shortlist proteins that might link Golgi-nuclear function and validated each candidate using an siRNA-mediated antibody-validation pipeline, thereby identifying 163 proteins that localize to both the Golgi and the nucleus. Bioinformatic analysis of these candidates revealed a significant enrichment for DNA damage response (DDR) regulators, including multiple factors from core DNA repair pathways, suggesting that a portion of the DDR machinery may reside in the Golgi at steady state. Interestingly, the authors observed that dual-localizing DDR proteins undergo lesion-specific redistribution between the Golgi and the nucleus in response to specific types of DNA injuries. For instance, BER and MMEJ proteins shifted from nucleus to Golgi in response to doxorubicin, whereas MMR and HR proteins redistributed from Golgi to nucleus. This trend was reversed with H2O2 or KBrO3 treatments.
- To gain further insight into the link between the DDR and Golgi-nuclear communication, the authors focused on the HR factor RAD51C, which also plays a key role during the replicative stress response. The authors noticed that RAD51 is significantly associated with the Golgi, in addition to its known nuclear pool. Interestingly, they demonstrated that doxorubicin triggers the ATM-dependent release of this Golgi-tethered RAD51C pool and its Importin-β-mediated import into the nucleus, where it forms repair-associated foci. They further identified Giantin as the Golgi scaffold that anchors RAD51C at steady state in this subcellular compartment and showed that its depletion leads to premature nuclear accumulation of RAD51C, formation of aberrant RAD51C foci lacking canonical HR markers, reduced ATM activation, elevated genomic instability, and increased cell proliferation. *
Together, this study revealed an underappreciated and functionally meaningful spatiotemporal level of regulation within the DDR, suggesting that the Golgi, rather than functioning solely as a trafficking organelle, acts as a platform that anchors, releases, and temporally controls the availability of key DNA repair factors in response to genotoxic stress. In particular, the authors demonstrated that the timely and regulated release of RAD51C from the Golgi is essential for maintaining genome stability and is dependent on canonical DDR signaling pathways, including ATM activation and Importin-β-mediated nuclear import.
- Overall Critique - This manuscript offers a novel and compelling perspective on the regulation of the DDR by positioning the Golgi as an active participant in the spatiotemporal control of DNA repair factors. By integrating multiple experimental layers, including a systematic localization screening, a sub-Golgi mapping, several dynamic redistribution assays, and functional perturbation read-outs, the authors built a strong and coherent case for a biologically meaningful Golgi-nucleus communication axis during the DDR. Therefore, the study is timely and highly relevant for the DNA repair field, with broader implications for our understanding of how subcellular organelles coordinate genome maintenance and cellular homeostasis.
While the manuscript is clearly written and the figures are coherent and supportive of the main findings of the study, several issues should be addressed to ensure full interpretability and reproducibility.
Major Comments*
*1. Limited use of agents causing genotoxic stress - The authors report intriguing lesion-specific shifts in Golgi-nuclear redistribution, yet much of the mechanistic work relies heavily on doxorubicin, a pleiotropic drug that induces diverse forms of DNA damage beyond DSBs. Expanding the core analysis of the study to include a broader panel of mechanistically defined genotoxins (e.g., etoposide, camptothecin, neocarzinostatin, or ionizing radiation) would substantially strengthen the conclusion that the trafficking patterns reflect damage-type specificity rather than drug-specific off-target effects. Such broader analysis would also clarify whether Golgi-nucleus communication responds differentially to replication-associated breaks, Topo II-dependent lesions, oxidative stress, or crosslinks. *
__Response: __We thank the reviewer for this important point. We would first note that while doxorubicin is indeed pleiotropic, its primary and best-established mechanism of action is the poisoning of Topoisomerase II, leading to DNA double-strand breaks, a mechanism it shares with etoposide (van der Zanden et al, 2021; Thorn et al, 2011). The additional effects of doxorubicin, including reactive oxygen species generation and chromatin remodelling, are well-documented but secondary to this DSB-inducing activity, as we note in the revised manuscript. Nonetheless the goal of this study was not to comprehensively map lesion-specific trafficking for every DDR protein, but rather to establish the existence of a dynamic Golgi-nucleus redistribution axis and then focus mechanistically on the validated targets, in this case RAD51C. The lesion-dependent redistribution patterns are therefore presented as an initial, hypothesis-generating observation emerging from our screening and characterisation framework. A systematic, lesion-by-lesion dissection of redistribution kinetics across the broader DDR network would represent a substantial additional study and is beyond the scope of the present work.
Importantly, our key mechanistic observations for RAD51C are not restricted to doxorubicin. We tested a panel of genotoxic agents covering mechanistically distinct lesion classes: camptothecin (CPT; Topoisomerase I-associated replication breaks), etoposide (ETO; Topoisomerase II-dependent DSBs), and mitomycin C (MMC; interstrand crosslinks) (Figures S8A-S8I). Across all DSB-inducing agents, RAD51C consistently redistributed from the Golgi to the nucleus, demonstrating that this response is not a doxorubicin-specific off-target effect. Notably, RAD51C did not redistribute in response to oxidative lesions induced by hydrogen peroxide or potassium bromate, consistent with its established role in homologous recombination and DSB repair rather than oxidative damage pathways, as discussed in the manuscript. This lesion-type selectivity provides additional evidence that the Golgi-nuclear redistribution we observe is a biologically specific response rather than a non-selective stress effect.
*2. Functional implications of RAD51C redistribution for HR efficiency - Although the study convincingly demonstrates a release of RAD51C from the Golgi and its subsequent nuclear foci formation, it remains unclear how this redistribution influences HR efficiency. Incorporating a functional HR assay (e.g., DR-GFP reporter, RAD51 filament assembly, or fork protection assays) would help determine whether Golgi-anchored RAD51C release is directly required for HR or instead primarily modulates upstream DDR signaling. *
Response: __We thank the reviewer for this important suggestion. We have performed DR-GFP reporter assays to directly assess HR efficiency following Giantin and RAD51C depletion. Depletion of Giantin reduced HR efficiency to approximately 60% of control levels, and RAD51C depletion to approximately 40%, consistent with the HR reduction previously reported in the genome-wide HR screen (Adamson et al, 2012). Co-depletion of Giantin and RAD51C reduced HR to levels comparable to RAD51C depletion alone, suggesting that the effect of Giantin on HR is mediated primarily through RAD51C, consistent with RAD51C being the key effector of the Giantin-dependent spatial regulatory mechanism we describe. These data are included in the revised manuscript (__lines 455-465; Figure 5L).
*In addition, the manuscript does not fully reconcile how Golgi-tethering of RAD51C fits with its well-established nuclear roles during replication stress, where timely availability of RAD51C is essential for fork stabilization and restart. *
Response: __We agree that the nuclear function of RAD51C during replication stress is well established and important to reconcile with our findings. Our imaging data consistently show a detectable nuclear RAD51C population at steady state across all cell lines examined, and we do not propose that RAD51C is exclusively Golgi-localised. We suggest that the two pools serve distinct functional purposes: the constitutive nuclear pool supports ongoing replication fork stabilisation and restart, processes that require RAD51C availability independently of acute DNA damage, while the Golgi-tethered fraction represents a damage-responsive reserve that is released acutely upon DSB induction in an ATM-dependent manner. We wish to be transparent that this two-pool model is speculative at present, formally distinguishing the contributions of each pool would require direct labelling of the Golgi-anchored fraction, which was not technically feasible in this system as discussed above. Nonetheless, this model is consistent with established principles of signal-responsive protein sequestration in cell biology, and is directly supported by our Giantin depletion data: premature release of the Golgi pool leads to aberrant nuclear RAD51C foci lacking canonical HR markers and impaired ATM signalling, demonstrating that unscheduled nuclear accumulation is actively detrimental rather than simply redundant. We have added a paragraph to the revised Discussion explicitly framing the two-pool distinction as a working model and identifying direct pool-identity tracking as an important future direction (__lines 566-587).
*3. Specificity of Giantin-related phenotypes - The phenotypes observed upon Giantin depletion (e.g., increased micronuclei, comet tail moments, impaired ATM signaling, and elevated proliferation) could partially reflect a global dysfunction of the Golgi rather than RAD51C-specific tethering defects. Although co-depletion of RAD51C provides partial rescue, additional controls examining Golgi integrity, trafficking competence, or rescue with siRNA-resistant Giantin would help confirm specificity and distinguish direct from indirect effects. *
__Response: __We thank the reviewer for raising this important concern, which was a central consideration throughout our investigation. We address it through three complementary lines of evidence.
First, regarding Golgi structural integrity and trafficking competence: as previously reported, Giantin depletion has not been associated with strong Golgi fragmentation or major morphological alterations (Koreishi et al, 2013; Bergen et al, 2017; Stevenson et al, 2021), and we observed no significant Golgi fragmentation upon Giantin knockdown in our system. Consistent with the literature, Giantin has been implicated in specific cargo trafficking, most notably collagen secretion, rather than general secretory pathway function (Stevenson et al, 2021). To directly confirm that general Golgi trafficking competence was preserved in our experimental system, we performed the VSV-G-YFP trafficking assay (Presley et al, 1997), a well-established functional readout of general secretory trafficking. Giantin depletion did not result in a significant change in trafficking efficiency compared to control siRNA (Rebuttal Figure 1), consistent with the literature and arguing against a general collapse of Golgi function as the basis for the phenotypes observed.
Rebuttal ____Figure 1. VSV-G-YFP trafficking assay.
(A) Representative images of cells treated with control siRNA or giantin siRNA. Nuclei are stained with Hoechst. Total VSV-G-YFP (YFP-tsO45G) signal is shown together with antibody staining against VSV-G in non-permeabilized cells to assess cell surface levels. Scale bars, 10 μm.
(B) Quantification of VSV-G trafficking from two independent biological replicates.
Second, the phenotypes are RAD51C-dependent and not a generic Golgi dysfunction: the genomic instability and DDR signalling defects we observe upon Giantin depletion are not phenocopied by GMAP210 depletion, another Golgin family member, indicating that the phenotypes are not a generic consequence of Golgin loss. Critically, we now directly demonstrate using the DR-GFP reporter assay that Giantin depletion reduces HR efficiency to approximately 60% of control, and that co-depletion of RAD51C produces no further reduction beyond RAD51C depletion alone, consistent with RAD51C epistasis over Giantin for HR capacity (Figure 5L). This functional epistasis, together with the physical interaction between Giantin and RAD51C by co-immunoprecipitation, their co-localisation within the same Golgi sub-compartment, and the partial rescue of ATM phosphorylation, micronuclei formation and proliferation phenotypes upon RAD51C co-depletion, provides a coherent mechanistic chain linking Giantin specifically to RAD51C-dependent DDR outcomes. While we cannot formally exclude indirect contributions from other Giantin-associated factors, none of our observations are consistent with the phenotype arising from non-specific Golgi perturbation.
Third, Giantin may play a broader role in connecting DDR signalling to cytoplasmic and Golgi-resident processes, beyond RAD51C tethering alone: we consider this a feature of the biology rather than a confound. Golgins are well established as multi-cargo scaffolding platforms, and Giantin in particular occupies a strategic position where several processes converge: the tethering of DDR factors, the regulation of damage-induced signalling cascades, and the directional trafficking of repair factors between compartments. This would explain why Giantin depletion produces a phenotype that extends beyond what RAD51C co-depletion alone can fully rescue, and is consistent with the pathway-level coherence we observe across our screen. Understanding the full complement of Giantin-associated DDR interactions represents one of the most compelling directions emerging from this work.
In response to this comment, we have expanded the Discussion (lines 545-565) to explicitly propose that Giantin functions as a broader organisational node coordinating multiple DDR factors, while our data specifically and consistently implicate RAD51C as a primary conduit.
*4. Positioning of ATM in the Golgi-nuclear signaling - While ATM inhibition prevents RAD51C release, its spatial and mechanistic basis of this regulation remains obscure. It is not clear whether ATM acts locally at the Golgi, through cytoplasmic pools, or indirectly via nuclear feedback signaling. Clarifying or discussing this point in more depth would improve the mechanistic coherence of the proposed model. *
__Response: __We thank the reviewer for raising this important mechanistic question. The spatial basis of ATM action at the Golgi is indeed an emerging and exciting area of cell biology. A growing body of evidence demonstrates that ATM associates with the Golgi membrane through binding to phosphatidylinositol-4-phosphate (PI4P), and that this Golgi-resident pool modulates the magnitude and kinetics of the nuclear DDR (Ovejero et al, 2023). Importantly, the most recent work in this area demonstrates that Golgi-associated ATM is not merely a passive reservoir but is enzymatically active and capable of phosphorylating Golgi-resident substrates (Soulet et al, 2026), providing a compelling mechanistic basis for how damage-induced ATM signalling could reach the Golgi to license RAD51C release.
To directly examine whether ATM localises to the Golgi in our system and whether its activation state changes upon DNA damage, we performed a biochemical Golgi enrichment assay using the Minute{trade mark, serif} Golgi Apparatus EnrichmentKit (Cat #: GO-037) to examine ATM distribution across cis- and trans-Golgi fractions. Fraction purity was validated using GM130 (cis-Golgi), TGN46 (trans-Golgi), and HSP60 (membrane fraction) (Rebuttal Figure 2A). This analysis revealed that ATM is detectable in the total membrane fraction and enriched in the cis-Golgi fraction under basal conditions (Rebuttal Figure 2A). Under normal physiological conditions, activated ATM (pATM) was absent from Golgi-enriched fractions (Rebuttal Figure 2B), but was detectable in the cis-Golgi fraction following doxorubicin-induced genotoxic stress (Rebuttal Figure 2C). While these observations are preliminary and require further validation, they are consistent with the emerging literature and raise the intriguing possibility that ATM is recruited to and activated at the Golgi in a damage-dependent manner, where it could act locally to license RAD51C release.
Rebuttal Figure 2. Biochemical Golgi fractionation confirms ATM enrichment in cis-Golgi compartments.
*Western blot of HeLa-K fractions enriched for cis- and trans-Golgi membranes, probing for (A) ATM under basal conditions, and (B and C) pATM under basal conditions and (B) pATM (C) after treatment with DOX (40 μM) (markers: GM130 for cis-Golgi, TGN46 for trans-Golgi, HSP60 for membrane fraction (MEM). *
We consider the precise spatial and mechanistic dissection of ATM signalling at the Golgi and its relationship to nuclear feedback, one of the most exciting directions to emerge from this work, and one that we hope our study has helped to open. We have expanded the Discussion (lines 525-543) accordingly to place our findings in the context of the emerging Golgi-ATM literature and to frame this as an important unresolved question for future investigation.
*5. RAD51C is examined in silo, without consideration for the BCDX2 complex - RAD51C is exclusively analyzed in isolation, despite its well-established function as part of the BCDX2 paralog complex (RAD51B-RAD51C-RAD51D-XRCC2). Because RAD51C does not normally operate as a standalone factor, it is unclear why only RAD51C, among all paralogs, would be subjected to Golgi tethering, ATM-dependent release, and Importin-β-driven nuclear import. This raises important mechanistic questions: Are other BCDX2 members also Golgi-associated? Do they undergo similar trafficking dynamics? Does Golgi tethering selectively regulate RAD51C, or does the complex translocate together? Addressing these points would greatly strengthen the biological plausibility and mechanistic coherence of the proposed model. *
Response: We thank the reviewer for raising this important point. We fully agree that RAD51C functions as a core component of the BCDX2 (RAD51B-RAD51C-RAD51D-XRCC2) and CX3 (RAD51C-XRCC3) paralog complexes, and that its canonical roles in HR and replication fork protection occur within these assemblies. Our decision to focus on RAD51C was driven by the screening data: of the DDR proteins identified, RAD51C displayed the most robust Golgi-associated pool, the clearest damage-induced redistribution dynamics, and a tractable anchoring interaction with Giantin that could be interrogated biochemically.
We would also note that extending this analysis to other RAD51 paralogs is not straightforward with current tools. The available commercial antibodies against RAD51B, RAD51D and XRCC2 perform poorly in immunofluorescence applications, and most localisation studies for these proteins have relied on overexpression of tagged constructs, a strategy that, as discussed above, risks perturbing both localisation and complex assembly. The lack of reliable antibodies for endogenous paralog detection at the resolution required for Golgi localisation analysis represents a genuine technical barrier that we encountered directly during this study.
Whether Golgi association and ATM-dependent release involve RAD51C alone or extend to other BCDX2 or CX3 members is therefore a genuinely open and important question. We note that our co-immunoprecipitation data were performed on total cell lysate and cannot distinguish whether the Golgi-associated RAD51C is complexed with other paralogs or represents a monomeric subpopulation. Golgins are well established as multi-cargo scaffolding platforms, and it is entirely plausible that Giantin organises a broader paralog module rather than tethering RAD51C as an isolated subunit. A systematic analysis of RAD51 paralogs for Golgi localisation and lesion-dependent trafficking enabled by improved reagents such as proximity labelling or endogenous tagging approaches compatible with essential proteins would determine whether the BCDX2 complex translocates as a unit or whether individual subunits are differentially regulated, with potentially distinct consequences for HR fidelity. We have revised the manuscript accordingly and identify this as an explicit priority for future work in the revised Discussion (lines 583-602).
Minor Comments
1. Pathway-specific sub-Golgi localization patterns - The finding that DDR proteins map to distinct cis/trans Golgi subdomains is an interesting and potentially important observation. However, the dataset is limited to 15 proteins, making the proposed pathway-level trends (e.g., HR factors enriched in cis-Golgi; BER/MMEJ factors enriched in trans-Golgi) preliminary. Strengthening this conclusion by increasing the number of DDR proteins analyzed would help determine whether sub-Golgi compartmentalization contributes meaningfully to DNA repair pathway regulation.
Response: We thank the reviewer for this constructive suggestion. We agree that extending sub-Golgi mapping to a larger number of DDR proteins would be valuable, and we present the current dataset explicitly as a first, hypothesis-generating map rather than a definitive pathway atlas.
We would like to highlight, however, that the value of this observation lies not simply in the number of proteins mapped, but in the biological coherence of the patterns that emerge. The finding that proteins from the same repair pathway tend to occupy the same Golgi sub-compartment: BER and MMEJ factors enriching in the trans-Golgi, HR factors in the medial/cis-Golgi, and that this sub-compartmental positioning correlates with the direction of their redistribution upon genotoxic stress, is a pattern that would be unlikely to arise by chance across 15 independently validated proteins. This internal consistency argues that the sub-Golgi organisation reflects genuine pathway-level biology rather than noise, even if the dataset is not yet exhaustive. Together with the bioinformatic network analysis, which independently supports pathway-level clustering across the broader validated hit list, these observations reinforce each other as complementary layers of evidence.
2. Is the Golgi-released RAD51C indeed the pool that enters the nucleus? The major assumption of the study is that the RAD51C population released from the Golgi upon DNA damage is the same pool that subsequently accumulates in the nucleus to form repair foci. While the imaging and fractionation data are consistent with this model, the study does not directly track or distinguish Golgi-derived RAD51C from cytoplasmic or pre-existing nuclear pools. Without a method to specifically label, pulse-chase, or track the Golgi-anchored fraction, it remains formally possible that nuclear RAD51C originates from other subcellular reservoirs.
__Response: __We thank the reviewer for highlighting this important mechanistic point, which we agree cannot be fully resolved with the current dataset. Several independent lines of evidence are nonetheless consistent with a model in which the Golgi-associated pool contributes directly to damage-induced nuclear accumulation.
Reviewer #2 (Significance (Required)):
General assessment - This study presents a novel and conceptually compelling view of the DNA damage response (DDR) by positioning the Golgi apparatus as an active regulator of the spatiotemporal availability of DNA repair factors. The strongest aspects of the work include its integration of a systematic immune-localization screening, a sub-Golgi compartment mapping, dynamic redistribution assays, and functional perturbations to build a coherent model of Golgi-nucleus communication during genotoxic stress. The mechanistic focus on RAD51C provides a clear case study linking organelle-level regulation to genome stability.
Advance - To my knowledge, this is the first comprehensive demonstration that the Golgi can serve as a spatiotemporal coordination node for DDR proteins, including those involved in HR. The identification of a substantial pool of RAD51C, and reportedly other DDR factors, anchored within specific Golgi subdomains represents a significant conceptual advance. The demonstration that Golgi-tethered RAD51C is released in an ATM-dependent manner and subsequently participates in nuclear foci formation suggests a previously unrecognized organelle-level regulatory checkpoint in genome maintenance. This work therefore extends current models of the DDR by revealing a layer of intracellular coordination that bridges classical nuclear pathways with cytoplasmic organelle function.*
Audience - This study will be of strong interest to a specialized audience in the fields of DNA repair, genome stability, and cell biology, particularly those studying the spatial organization of repair pathways and intracellular stress signaling. It will also appeal to researchers investigating organelle biology, intracellular trafficking, and the broader coordination of cytoplasmic and nuclear responses to stress. Beyond these communities, the work may be relevant to cancer, as it suggests new mechanisms by which organelle perturbations or Golgi-associated scaffolding proteins could influence therapeutic responses or genomic instability.
Reviewer expertise - Field of expertise: DNA repair, genome stability, organelle biology, cancer cell biology.*
Reviewer #3 (Evidence, reproducibility and clarity (Required)):
*This study investigates the communication between the Golgi complex and the nucleus of the cell, which remains a largely unexplored field. The authors used publicly available siRNA and antibody data from the Human Protein Atlas as a basis for finding overlap between the proteomes of the two cellular compartments. In validating the data from the HPA, the study finds a novel cluster of DNA repair proteins present in the Golgi, which they validate and resolve to sub-compartmental localization. To do so they use immunofluorescence (IF) localization on ¬cis- and trans-Golgi cisternae marked by GM130 and TGN46, respectively. The authors find that many of the fully validated proteins present in both the nucleus and Golgi redistribute between the Golgi and the nucleus dependent on the protein and the type of DNA lesion. They focused on RAD51C, a recombination factor. They show that RAD51C resides in both the ¬cis- and trans- subsections prior to damage and responds to DNA damage in an ATM-dependent manner via release of a Golgi-based pool bound to Giantin, which is then imported into the nucleus via Importin-β. Knockdown experiments showed that Giantin regulates RAD51C spatially and temporally. The work reveals a dynamic interchange of proteins between the Golgi and nucleus that controls cell functions beyond the classic secretory, membrane trafficking, and PTM roles of the Golgi. The authors build on prior work on Golgi impacts on DDR, offering an alternative cellular compartment for storage of DDR factors prior to damage. Overall, the data is timely and relevant, as it finds new roles for the Golgi in DNA damage response (DDR) regulation. The data is largely convincing and well controlled. The IF data is presented in black and white single channels and merged in color, which allows good comparison of the different protein stains. The scope of the initial screen of HPA antibodies and Golgi/Nuclear dual proteomes is impressive, and the overlap of DDR proteins is characterized for fifteen different proteins at a sub-compartmental level. The focus on RAD51C as a member of the HR pathway was a strong choice, and the study presents interesting information on its regulation by Golgi complex members, as well as a feedback look with pATM. The possibility of the Golgi storing specific DDR factors in specific compartments is well-supported and intriguing. There are a few major and minor points that should strengthen the paper and improve clarity prior to publication. *
Major Comments:
*1. Much of the strength of the IF data is lost in the choice of scale for presentation of the data. In almost all cases, enlarged sections should be shown of the areas currently indicated by arrow, in all channels. This is done well in Figure 3A, where an area of the Golgi is enlarged and the overlap of RAD51C in the GM130-marked Golgi is clearly visible in the merged channel, even when printed out. I would highly recommend including the white box and enlarged in all images and channels, while keeping the representative fields as is (e.g. if the image is 40mm, draw a 7mm box around representative cells/Golgi, and enlarge to 15mm in the bottom left). This change should be made to F1E, F2F, F3E, F3J, and F3M, as well as having enlarged figures in the corners in all supplementary data IF figures. Where possible, a fully enlarged image of the bounding box could also be included. Some of the IF data would be strengthened by using the nuclei stain to draw a masking outline to include in the black and white channels, to clearly delaminate what is Golgi-localized and what is nuclear. *
Response: We thank the reviewer for this helpful suggestion and fully agree that enlarged insets substantially improve the visibility of Golgi-localised signal, particularly when figures are printed. We share the reviewer's view that alternative display formats with larger insets would be preferable, and we have implemented enlarged boxed regions wherever space constraints permitted.
Specifically, we have added boxed regions with enlarged insets to Figure 1E, all panels of Figure 3. For Figure 2, the number of conditions and proteins displayed simultaneously within the constraints of standard journal figure dimensions made it impractical to include enlarged insets for all panels without reducing the overall field size to the point of losing contextual information. We have nonetheless improved the visibility of the Golgi signal in Figure 2 as much as possible within these constraints, and note that the final figure layout will be further optimised in line with the journal's specific formatting guidelines. In addition, all figures have been provided as high-resolution image files to allow electronic magnification, enabling readers to inspect the Golgi-localised signal in detail beyond what is visible in the printed version.
Regarding the use of nuclear outline masks in single-channel images, we tested this approach but found that given the number of structures present within each field, including Golgi stacks, nuclear foci, and cytoplasmic signal, overlaying nuclear outlines on individual channels added visual complexity that made the images harder rather than easier to interpret. As an alternative, we have included a full-colour merged panel, when possible, which we consider a cleaner way to delineate nuclear versus Golgi-localised signal and allows the reader to directly compare compartment-specific distributions across channels.
- *There is a lack of consistency in the representative images shown by IF. For example, Figure 1 gives the impression of very little RAD51C in the nucleus but this is rightly shown to not be the case in Supp. Fig 2A. The same is true of the various images of LIG1. The authors should use representative data that better reflects the distribution of the proteins being studied and maintain consistency across images. If there is a lot of variation in staining patterns, the authors should show images and percentages corresponding to the variations especially for the key gene studied, RAD51C.
Response: We agree and have replaced the representative IF panels for RAD51C and LIG1 with images that better reflect the quantified distributions across biological replicates. The revised panels were selected to match the quantified compartment intensities shown in the accompanying graphs rather than representing outlier cells. We would also note that the apparent discrepancy between Figure 1E and Supplementary Figure S2A partly reflects a difference in imaging conditions: Supplementary Figure S2A __and __Figure 2F were acquired directly from the high-content screening pipeline under uniform, non-optimised antibody and fixation conditions at widefield resolution, whereas Figure 1E shows representative single optical section confocal images acquired after candidate identification with antibody conditions optimised for each individual protein. The improved signal-to-noise in the optimised confocal images more faithfully captures the dual Golgi and nuclear localisation of RAD51C, and the apparent difference between the two image sets is therefore expected rather than inconsistent. We have updated the figure legends to clarify the imaging modality and conditions for each panel. Furthermore, the quantified distribution of RAD51C across Golgi, nuclear and cytoplasmic compartments across multiple cell lines is shown in Figure 3B and 3D, providing a population-level representation of the dual localisation that complements the representative images shown in Figure 1E.
- *The initial screening by siRNA-mediated knockdown pipeline that validated and confirmed dual Golgi and nuclear localization of 163 of the 329 dual-localization HPA proteins does not have any data included. This seems like a very large amount of data to gloss over and not include even as supplementary data. This should be included as source data, and discussion of the in-text information should be strengthened. The data included with the networking of these validated proteins is strong, but the process of elimination and validation has not been shown. In addition, the antibody information included in the supplementary data does not include dilution factors or blocking factors is not included, which would be beneficial to future studies to include.
Response: We agree and have addressed this in full. We note that the HPA antibody validation data, including immunofluorescence images and siRNA knockdown results, are publicly available for inspection on the Human Protein Atlas website (www.proteinatlas.org) for the majority of candidates, providing an independent layer of verification. In the revised submission, we additionally provide the complete siRNA-mediated validation dataset generated in our laboratory as source data (Table S1; lines 1025-1041), including for each candidate the HPA antibody identifier, gene symbol, Ensembl ID, antibody staining pattern, siRNA identifier, cell number per replicate, and normalised Golgi and nuclear signal ratios for both experimental replicates. This allows readers to inspect the validation metrics directly and apply alternative thresholds if desired. We have also expanded the antibody information to include diluent conditions (4% FBS in 0.1% Triton-X100 for all HPA antibodies used at 2 μg/ml in the screening pipeline), enabling reproducibility and reuse of the dataset by the community.
- *The authors should expand upon the paragraph lines 155-162 to include more discussion on Figure S2A and S2B. The expanse of this data is some of the strongest in the paper, and it should be further discussed in-text. Also, the rationale behind the choice in the specific proteins that are included in these analysis / figures is not always clear in -text, and more attention should be spent on the narrowing down of the analysis to the final proteins. This is also especially important as many of the DDR proteins chosen are not the most common DDR proteins. Also note in text that the Golgi marker GM130 (presumably) was used for the screening, which means that some proteins which are only localizing to the TGN46 trans Golgi might have been lost in the validation step (or, explain why this is not the case).
Response: __We expanded the Results text (__lines 141-163) to discuss Figures S2A and S2B in more depth and clarified the rationale for selecting the final set of DDR proteins taken forward, including considerations of pathway representation, bioinformatic annotations, literature-described roles in DNA repair. We would also note that the identity of the DDR proteins identified in this screen was determined by the HPA dataset and the unbiased validation pipeline rather than by prior assumptions about which repair factors would be present at the Golgi. The presence of less commonly studied DDR factors is therefore a direct reflection of the screen output, and we consider this one of the strengths of the approach.
We would also like to address the reviewer's concern about potential GM130-based bias directly: at the widefield or confocal resolution used in the high-content screening pipeline, the Golgi apparatus appears as a single perinuclear structure and cis- and trans-Golgi subdomains cannot be resolved. GM130 was therefore used purely as a segmentation marker to define the Golgi compartment as a whole rather than to selectively label the cis-Golgi cisternae. The resulting Golgi mask captures signals from the entire Golgi ribbon, including trans-Golgi regions, meaning that proteins with exclusively trans-Golgi localisation would not have been systematically excluded at the screening stage. Sub-compartmental resolution of cis versus trans localisation was only possible in subsequent analyses using nocodazole-dispersed mini-stacks imaged by confocal microscopy with co-staining for both GM130 and TGN46.
*5. The relationship between Giantin loss, increased cell proliferation, and elevated endogenous DNA damage as it relates to RAD51C remains insufficiently resolved and requires further clarification. Several of the proliferation assays used are not optimal for addressing changes in cell growth. For example, Figure 5O appears to quantify cell numbers by counting fields from IF images, which is an unconventional approach. This should be done by growth curves, luminescent viability or colony formation assays. In addition, this point will be greatly strengthened by performing rescue experiments for Giantin directly (instead of co-depletion as a means of rescue) and/or using a mutant of RAD51C that does not bind to Giantin. If these additional experiments are beyond the current scope, the conclusions should be softened in the discussion. *
Response: We thank the reviewer for raising these important points, which we address in turn:
Giantin-RAD51C relationship and mechanistic interpretation. __We acknowledge that establishing the full causal chain between Giantin loss, RAD51C mislocalisation, elevated endogenous DNA damage and increased cell proliferation is challenging within the scope of a single study, and we discuss this openly in the Discussion (__lines 555-564). Our evidence collectively includes: physical interaction between endogenous Giantin and RAD51C by co-immunoprecipitation (Figures 4H and 4I), premature nuclear accumulation of RAD51C upon Giantin depletion (Figures 4B-4E and 4J-4M), new additional experiment showing direct reduction of HR efficiency in the DR-GFP assay (Figure 5L), impaired ATM signalling (Figures 5J and 5M), elevated genomic instability (Figures 5A-5E), and epistatic rescue by RAD51C co-depletion (Figures 5M-5P). These observations are further contextualised by the established literature on RAD51C function: RAD51C is known to regulate CHK2 phosphorylation and cell cycle checkpoint signalling (Badie et al, 2009), stabilise replication forks (Somyajit et al, 2015), and promote RAD51 filament formation required for DSB repair (Prakash et al, 2015). Dysregulation of these functions through Giantin-dependent mislocalisation provides a mechanistically coherent explanation for the elevated genomic instability and altered proliferation we observe, and is entirely consistent with our model. Together, the experimental evidence and the published biology of RAD51C support a model in which Giantin spatially regulates RAD51C to maintain proper DDR signalling and HR capacity.
We agree that separation-of-function tools would further strengthen this model and identify these as important future priorities. We wish to note however that both approaches face substantial technical barriers in this system. As described in our response to Reviewer 1 Major Comment 1, RAD51C tagging, whether by CRISPR-mediated endogenous editing or ectopic expression, consistently compromised cell viability and protein function, precluding the generation of interaction-deficient variants at physiological expression levels. Engineering an interaction-deficient Giantin mutant presents an independent and considerable challenge: Giantin is one of the largest Golgi matrix proteins (~376 kDa), composed almost entirely of extended coiled-coil domains that are intrinsically difficult to model structurally, and identifying a discrete interaction interface with RAD51C without disrupting the broader scaffolding function of the protein would require a dedicated structural and biochemical programme. We therefore consider these important but substantial future directions rather than straightforward experimental additions to the current study.
Proliferation assays. Colony formation assays provide a rigorous readout of long-term proliferative capacity, and these data are presented for single knockdown conditions in Figures 5F-5I. The cell number quantification in Figure 5P was specifically included to assess the double knockdown of Giantin and RAD51C simultaneously, a condition not covered by the colony formation assay. We respectfully note that automated fluorescence microscopy-based nuclear counting is a well-established approach for measuring cell proliferation in siRNA screening contexts. Nuclear counting from high-content imaging has been used as a direct readout of cell growth and proliferation in RNAi screens (Boutros et al, 2004; Martin et al, 2014; Garvey et al, 2016; Mikheeva et al, 2024), and has been shown to produce results comparable to or superior to conventional viability assays including MTT and flow cytometry-based methods (Mikheeva et al, 2024). We have nonetheless clarified in the revised figure legend that Figure 5P reports relative cell number quantified by automated nuclear counting from high-content imaging fields as a secondary concordant measure alongside the colony formation data, rather than a standalone proliferation assay.
*6. It is unclear from the discussion and from presented data whether proteins are directly transported between the Golgi and the nucleus, or whether they go into the cytoplasm for a transient period, presumably when they could interact with Importin β. There is also some data where cytoplasm signal could be quantified to address this (Figure 3E-I). *
Response: We thank the reviewer for this mechanistic point. In the revised manuscript we have included cytoplasmic RAD51C signal quantification alongside Golgi and nuclear measurements for the doxorubicin time course (lines 297-305; Figure 3H). The cytoplasmic signal shows a moderate and gradual reduction distinct in both magnitude and kinetics from the sharp Golgi decrease, consistent with a transient cytoplasmic intermediate rather than a stable pool. Regarding the identity of the translocating pool, two observations directly support a Golgi origin. First, Importazole treatment prevents RAD51C release from the Golgi following genotoxic stress and simultaneously reduces nuclear RAD51C foci formation, demonstrating that Importin-β-mediated import is required both for Golgi clearance and for productive nuclear accumulation. Second, Giantin depletion which prematurely releases the Golgi-tethered pool, leads to aberrant nuclear RAD51C foci, directly linking the Golgi-anchored fraction to nuclear accumulation. Together these data support a model in which Golgi-resident RAD51C transits through the cytoplasm for Importin-β-mediated nuclear import. We acknowledge that without direct labelling of the Golgi-anchored fraction, the precise contribution of each subcellular pool to the nuclear accumulation cannot be fully resolved with the current dataset. We discuss the development of appropriate tagging strategies as an important future direction to dissect the dynamics of this process in further detail.
*7. Statistical analysis on experiments with more than two samples need to be performed with ANOVA and a follow up post-hoc test, not with two-tailed unpaired Student's t-test, which only compares the control and each individual sample. This type of analysis inflates the Type 1 error rates (false positives) in your datasets. For example, the two-tailed unpaired Student's t-test is appropriate in Figure 2F-H, but not in Figure 3 when the samples are timepoints. In this case, a One-way ANOVA with Tukey's post-hoc test (if you want to show all coparisons), or Bonferroni/Sidak if you only need to compare several samples). *
Response: We agree with the reviewer and thank them for highlighting this important statistical issue. We have revised the statistical analysis for all experiments involving more than two groups to avoid inflation of Type I error rates caused by multiple pairwise Student's t tests. Specifically, for Figures 3F-I, 4C-E, and Figure 5, the data were reanalysed using one way ANOVA followed by the appropriate multiple comparisons post hoc test. The Methods section and corresponding figure legends have been updated to clearly state the statistical tests used for each dataset.
Minor Comments: General 1. Throughout the text, the reference to many figures and supplementary figures in the same sentence, with little discussion of the data therein makes it hard to follow. In-text referencing is particularly confusing in the section "Dual-localising DDR proteins dynamically redistribute between the Golgi and nucleus in response to specific types of DNA injuries," where the reader is switching between multiple figures and supplementary figures.
__Response: __We thank the reviewer for this helpful comment. In the revised manuscript, we have improved the readability of the text and revised the figure references to make them clearer. We hope these revisions make the manuscript easier to follow and allow readers to better inspect the figures.
- In figures that display technical replicates as individual data points, consider distinguishing each replicate by using different marker shapes (e.g., repeat 1 = upright triangle; repeat 2 = inverted triangle; repeat 3 = diamond). This would provide additional clarity regarding the consistency and repeatability of each technical repeat.
__Response: __We thank the reviewer for this suggestion. We have updated the data presentation to distinguish biological replicates using different marker shapes in datasets where replicate tracking is of particular relevance to the interpretation. For datasets where individual replicate values are already clearly separable, we have maintained the existing presentation to avoid unnecessary visual complexity.
- Make sure all western blot data includes the marker size (F3C and F5L has none, F4H/I have size of proteins not size of markers).
__Response: __We added missing marker sizes to our western blot data in the revised manuscript.
- Be consistent with use of capitalization in figure legends and graph/figure labels.
__Response: __We made sure that the capitalisation is consistent in figure legends, graph and figure legends in the revised manuscript.
Figure 2
In Figure 2A, please include in the figure itself that GM130 is the cis Golgi, and TGN46 is the trans Golgi (Figures should not be dependent on the text for full understanding).
__Response: __We revised Figure 2A and 2C to label GM130 as cis-Golgi and TGN46 as trans-Golgi within the figure, making it self-explanatory.
- Why are LRIG2 and LRRIQ3 not included in the 2E cis vs trans Golgi data, when all other proteins from F1D are included? Include, or comment on in-text.
__Response: __Both LRIG2 and LRRIQ3 are included in 2E in both the original and revised manuscript.
- Be sure to include scale bar data in each figure legend (F2A-E is currently missing it), and include updated scales included in the enlarged data.
__Response: __Scale bar data is now included in each figure legend in the revised manuscript.
- In Figure 2F, make sure that the merged green channel is presented at the same intensity as it is in the single black and white channel, as the green looks very overexposed in several of the merged (CCAR1 DMSO merged is the most noticeable).
__Response: __We agree and thank you for pointing this out. We have now revised the images and corrected the issue by updating all image panels in the figure.
- In Figure 2G, include the grey label in the figure legend.
__Response: __We thank the reviewer for this comment. The grey label has now been included in the figure legend in the revised manuscript.
- In Figure 2G-H, the method of data presentation in the graphs coupled with the statistical analysis is confusing and should be expanded upon in the legend.
__Response: __We agree that the amount of data presented may appear overwhelming. In the revised figure, we have adjusted the placement of the statistical annotations to improve clarity. Also, we improved the figure legend, to make the figure easier to read and interpret.
Figure 3
Figure E/F/G: Is there cytoplasmic quantification as well? Your rationale is that the Golgi RAD51C goes into the nucleus, but via the cytoplasm (due to Importin β import); do you see the cytoplasmic levels increase? Or is it too dilute to notice a difference? At least, this omission needs to be mentioned in-text.
Figure H/I also include the quantification of the cytoplasmic fraction. It is mentioned in-text on line 272, but not quantified. This comes up as a big question: Do the proteins go directly between the Golgi and nucleus, or do they go through the cytoplasm?
__Response: __We thank the reviewer for both of these related points. As described in our response to Major Comment 6 above, we have added cytoplasmic RAD51C signal quantification to the doxorubicin time course in the revised manuscript (Figure 3H) and discuss the implications for the proposed translocation route.
Figure 3A, 3E, and if the data is present for 3J and 3M, could all benefit from using the nuclei staining as a mask to draw an outline around the nucleus in the other channels, and then show a merge in full color instead of a nuclei-only channel. Also note from the major comments, that this data especially is so small to see without enlarged images.
__Response: __We thank the reviewer for this suggestion. Regarding nuclear outline masks, we tested this approach but found that the number of structures present in each field, including Golgi stacks, nuclear foci and cytoplasmic signal, made overlaid outlines visually confusing rather than clarifying. We have instead included a full-colour merged panel in Figure 3E, which we consider a cleaner way to distinguish nuclear from Golgi-localised signal while preserving the spatial context of the data.
Regarding image size, we have added enlarged insets to Figures 3E, 3J and 3M in the revised manuscript. We have chosen to display multiple cells per panel rather than a single enlarged cell in order to capture the heterogeneity of the cell population, which we consider important for an accurate representation of the data. All figures have been provided as high-resolution image files to allow electronic magnification, enabling detailed inspection of the signal beyond what is visible in the printed version. We acknowledge that the constraints of standard journal figure dimensions limit how large individual panels can be, and the final layout will be optimised in line with the journal's formatting guidelines.
*In-text discussion of the results from Figure 3 has an in-depth discussion of the NLS and NES in RAD51C, but this is not followed up on with site-directed mutagenesis or any data; perhaps move this to the discussion instead of results section. *
__Response: __We have removed the discussion of the NLS and NES from the Results section.
Figure 4
Comments from earlier figures hold, with size of enlarged events and using the nuclei as an outline in the single channels. E.g. Figure 4F arrows appear to point to nothing at the chosen scale. The zoom in 4G is insufficient, as the chosen feature is so small it is not even visible in full fields.
__Response: __We thank the reviewer for this comment. The arrows in Figure 4F indicate individual nocodazole-dispersed Golgi mini-stacks, which are displayed at higher magnification in Figure 4G. The full field in Figure 4F is intentionally shown to illustrate the degree of Golgi dispersion achieved by nocodazole treatment, a context that may be unfamiliar to readers outside the Golgi field, before zooming into a single representative mini-stack in Figure 4G for the cisternal localisation analysis.
- Figure 4H and 4I need to show the size of the markers *
__Response: __The size of the markers are now included in the revised manuscript.
*The representative image in 4L for siGiantin pATM has no pATM foci, while the quantification in 4M has a reduction from ~50% to ~25%, so this image is not representative of this data, or the data quantification is not as strong as the actual data. *
__Response: __We thank the reviewer for this observation. We wish to clarify that the quantification in Figure 4M reports the mean percentage of RAD51C foci co-localising with pATM across the entire cell population from three independent biological replicates. A reduction from ~50% to ~25% therefore reflects a population-level shift in co-localisation frequency, not that every individual cell shows exactly 25% co-localisation. Given the inherent cell-to-cell variability in foci number and co-localisation, individual cells will span a range of values around this mean, and the representative image shown in Figure 4L reflects one such cell.
Figure 5
*Figure 5A has overexposure of the nuclei stain in order to visualize micronuclei. Readjust the levels, and enlarge the images for better visualization. (is this DAPI-stained? Please label). *
__Response: __The display levels of the nuclear stain in Figure 5A are intentionally set to allow visualisation of micronuclei, which are significantly dimmer than the main nucleus and would not be detectable at display settings optimised for the primary nuclear signal. This is standard practice in micronuclei quantification studies and is necessary to accurately identify and score these structures. The nuclear stain is Hoechst 33342, and this has been explicitly labelled in the revised figure legend.
*Figure 5A-C: Figure 5A does not show siRAD51, but it is included in the DMSO only graph. Please either show RAD51 data in 5A and 5C, or do not include in 5B. If the DMSO and ETO experiments were performed separately and that accounts for this discrepancy, then show separately. *
__Response: __We thank the reviewer for this observation. The siRAD51C condition is included in Figure 5B as an internal positive control, consistent with its well-established role in genome stability. RAD51C depletion combined with etoposide treatment resulted in severe cellular toxicity and insufficient cell numbers for reliable quantification, and this condition was therefore excluded from Figure 5C. This has been clarified in the revised figure legend.
*Figure 5M the white label is difficult to see in the green box. *
__Response: __We have updated the label colour in Figure 5M to improve visibility against the green background in the revised manuscript.
* Supplementary Figures*
Consider reordering/ subdividing supplementary figures for ease of reference during reading.
Response: We thank the reviewer for this suggestion. The current supplementary figure structure was intentionally designed to minimise the total number of supplementary figures and maintain a logical correspondence with the main figures, avoiding a situation where readers need to navigate an extensive supplementary section, a concern the reviewer raised regarding figure presentation. We believe the current organisation achieves a reasonable balance between completeness and accessibility.
SF1 and SF2A: Include enlarged boxes or full images so that data is visible.
__Response: __As described in our response to Major Comment 1, all figures have been provided as high-resolution image files to allow electronic magnification. Space constraints within standard journal figure dimensions preclude the addition of enlarged insets to all supplementary panels without substantially reducing the contextual field of view.
*SF3A, SF4A, and SF5A: Include enlarged images, include nuclei marker if possible (otherwise, the nuclear intensity is not proven nuclear). *
Response: We appreciate the suggestion, but adding enlarged insets and nuclei markers to all panels in Figures S3A, S4A and S5A would disproportionately increase the length and complexity of the supplementary section, making it harder rather than easier to navigate. The nuclear intensity measurements are derived from automated segmentation of the Hoechst channel using CellProfiler, which reliably defines nuclear boundaries independently of the antibody channel, and are therefore not dependent on visual confirmation of nuclear localisation in each representative image.
*SF3B-C, SF4B-C, and SF5 B-D: Change the data presentation in the same method as changed for F2G-H. *
Response: We have updated the figure legends for Figures S3B-C, S4B-C and S5B-D to improve readability.
SF3D: List proteins in the same order as in B and C.
Response: The proteins in Figure S3D are listed in the same order as in Figures S3B and S3C.
SF6D: Label M N and C more clearly. Include size labels.
Response: We have added clearer labels for the membrane (M), nuclear (N) and cytoplasmic (C) fractions and included molecular weight size markers in the revised Figure S6D.
*SF7A-B: Include enlarged. *
Response: We respectfully note that the purpose of Figures S7A-B is to display the overall cellular response to inhibitor treatments across the cell population, rather than to highlight specific subcellular structures. Enlarged insets would reduce the number of cells visible per panel and would not add scientific value in this context. The Golgi and nuclear signals are clearly visible at the chosen magnification.
*SF8: Include arrows as in previous experiments, include enlarge. *
Response: Arrows have been added to Figure S8 to indicate Golgi and nuclear RAD51C signal, consistent with the annotation style used in the main figures. The images already show two representative cells per condition to maximise the visible detail at the chosen scale.
*SF9G: G is labelled, but not included. *
Response: Figure S9G has been added in the revised manuscript, showing the pan-cancer overall survival map for GOLGB1 expression across all TCGA cohorts generated using GEPIA2. The figure legend has been updated accordingly.
*Reviewer #3 (Significance (Required)): *
* The work finds new roles for the Golgi in regulation of DNA damage responses and the screen could be an important dataset (but results need to be made available) for the DNA repair community. The scope of the initial screen of HPA antibodies and Golgi/Nuclear dual proteomes is impressive, and the overlap of DDR proteins is characterized for fifteen different proteins at a sub-compartmental level. The work provides important insights into RAD51C regulation, however, there are key mechanistic insights and control experiments missing from the studies involving RAD51C and Giantin, dampening its impact. The idea of an alternative cellular compartment for storage of DDR factors prior to damage is interesting, and suggests the spatial regulation of specific lesion responses are stored in specific sub-compartments of the Golgi, which could contribute to repair regulation.*
References:
Adamson B, Smogorzewska A, Sigoillot FD, King RW & Elledge SJ (2012) A genome-wide homologous recombination screen identifies the RNA-binding protein RBMX as a component of the DNA-damage response. Nat Cell Biol 14: 318-328
Badie S, Liao C, Thanasoula M, Barber P, Hill MA & Tarsounas M (2009) RAD51C facilitates checkpoint signaling by promoting CHK2 phosphorylation. J Cell Biol 185: 587-600
Bergen DJM, Stevenson NL, Skinner REH, Stephens DJ & Hammond CL (2017) The Golgi matrix protein giantin is required for normal cilia function in zebrafish. Biol Open 6: 1180-1189
Berti M, Teloni F, Mijic S, Ursich S, Fuchs J, Palumbieri MD, Krietsch J, Schmid JA, Garcin EB, Gon S, et al (2020) Sequential role of RAD51 paralog complexes in replication fork remodeling and restart. Nat Commun 11: 3531
Boutros M, Kiger AA, Armknecht S, Kerr K, Hild M, Koch B, Haas SA, Paro R, Perrimon N & Heidelberg Fly Array Consortium (2004) Genome-wide RNAi analysis of growth and viability in Drosophila cells. Science 303: 832-835
Brinkmann K, Schell M, Hoppe T & Kashkar H (2015) Regulation of the DNA damage response by ubiquitin conjugation. Front Genet 6: 98
Garvey CM, Spiller E, Lindsay D, Chiang C-T, Choi NC, Agus DB, Mallick P, Foo J & Mumenthaler SM (2016) A high-content image-based method for quantitatively studying context-dependent cell population dynamics. Sci Rep 6: 29752
Ghannoum S, Fantini D, Zahoor M, Reiterer V, Phuyal S, Leoncio Netto W, Sørensen Ø, Iyer A, Sengupta D, Prasmickaite L, et al (2023) A combined experimental-computational approach uncovers a role for the Golgi matrix protein Giantin in breast cancer progression. PLoS Comput Biol 19: e1010995
Greenhough LA, Liang C-C, Belan O, Kunzelmann S, Maslen S, Rodrigo-Brenni MC, Anand R, Skehel M, Boulton SJ & West SC (2023) Structure and function of the RAD51B-RAD51C-RAD51D-XRCC2 tumour suppressor. Nature619: 650-657
Halim VA, García-Santisteban I, Warmerdam DO, van den Broek B, Heck AJR, Mohammed S & Medema RH (2018) Doxorubicin-induced DNA damage causes extensive ubiquitination of ribosomal proteins associated with a decrease in protein translation. Mol Cell Proteomics 17: 2297-2308
Koreishi M, Gniadek TJ, Yu S, Masuda J, Honjo Y & Satoh A (2013) The golgin tether giantin regulates the secretory pathway by controlling stack organization within Golgi apparatus. PLoS One 8: e59821
Martin HL, Adams M, Higgins J, Bond J, Morrison EE, Bell SM, Warriner S, Nelson A & Tomlinson DC (2014) High-content, high-throughput screening for the identification of cytotoxic compounds based on cell morphology and cell proliferation markers. PLoS One 9: e88338
Meindl A, Hellebrand H, Wiek C, Erven V, Wappenschmidt B, Niederacher D, Freund M, Lichtner P, Hartmann L, Schaal H, et al (2010) Germline mutations in breast and ovarian cancer pedigrees establish RAD51C as a human cancer susceptibility gene. Nat Genet 42: 410-414
Mikheeva AM, Bogomolov MA, Gasca VA, Sementsov MV, Spirin PV, Prassolov VS & Lebedev TD (2024) Improving the power of drug toxicity measurements by quantitative nuclei imaging. Cell Death Discov 10: 181
Ovejero S, Kumanski S, Soulet C, Azarli J, Pardo B, Santt O, Constantinou A, Pasero P & Moriel-Carretero M (2023) A sterol-PI(4)P exchanger modulates the Tel1/ATM axis of the DNA damage response. EMBO J 42: e112684
Prakash R, Rawal Y, Sullivan MR, Grundy MK, Bret H, Mihalevic MJ, Rein HL, Baird JM, Darrah K, Zhang F, et al(2022) Homologous recombination-deficient mutation cluster in tumor suppressor RAD51C identified by comprehensive analysis of cancer variants. Proc Natl Acad Sci U S A 119: e2202727119
Prakash R, Zhang Y, Feng W & Jasin M (2015) Homologous recombination and human health: the roles of BRCA1, BRCA2, and associated proteins. Cold Spring Harb Perspect Biol 7: a016600
Presley JF, Cole NB, Schroer TA, Hirschberg K, Zaal KJM & Lippincott-Schwartz J (1997) ER-to-Golgi transport visualized in living cells. Nature 389: 81-85
Rawal Y, Jia L, Meir A, Zhou S, Kaur H, Ruben EA, Kwon Y, Bernstein KA, Jasin M, Taylor AB, et al (2023) Structural insights into BCDX2 complex function in homologous recombination. Nature 619: 640-649
Somyajit K, Saxena S, Babu S, Mishra A & Nagaraju G (2015) Mammalian RAD51 paralogs protect nascent DNA at stalled forks and mediate replication restart. Nucleic Acids Res 43: 9835-9855
Soulet C, Catalan J & Moriel-Carretero M (2026) The DNA Damage Response kinase ATM restricts Golgi extension. bioRxiv
Stadler C, Hjelmare M, Neumann B, Jonasson K, Pepperkok R, Uhlén M & Lundberg E (2012) Systematic validation of antibody binding and protein subcellular localization using siRNA and confocal microscopy. J Proteomics 75: 2236-2251
Stevenson NL, Bergen DJM, Lu Y, Prada-Sanchez ME, Kadler KE, Hammond CL & Stephens DJ (2021) Correction: Giantin is required for intracellular N-terminal processing of type I procollagen. J Cell Biol 220
Tang Z, Kang B, Li C, Chen T & Zhang Z (2019) GEPIA2: an enhanced web server for large-scale expression profiling and interactive analysis. Nucleic Acids Res 47: W556-W560
Thorn CF, Oshiro C, Marsh S, Hernandez-Boussard T, McLeod H, Klein TE & Altman RB (2011) Doxorubicin pathways: pharmacodynamics and adverse effects. Pharmacogenet Genomics 21: 440-446
van der Zanden SY, Qiao X & Neefjes J (2021) New insights into the activities and toxicities of the old anticancer drug doxorubicin. FEBS J 288: 6095-6111
Zhang Y-W, Otterness DM, Chiang GG, Xie W, Liu Y-C, Mercurio F & Abraham RT (2005) Genotoxic stress targets human Chk1 for degradation by the ubiquitin-proteasome pathway. Mol Cell 19: 607-618
Author response:
The following is the authors’ response to the original reviews.
Reviewer #1 (Public review):
Summary:
This work demonstrates that MORC2 undergoes phase separation (PS) in cells to form nuclear condensates, and the authors demonstrate convincingly the interactions responsible for this phase separation. Specifically, the authors make good use of crystallography and NMR to identify multiple protein: protein interactions and use EMSA to confirm protein: DNA interactions. These interactions work together to promote in vitro and in cell phase separation and boost ATPase activity by the catalytic domain of MORC2.
However, the authors have very weak evidence supporting their potentially valuable claim that MORC2 PS is important for the appropriate gene regulatory role of MORC2 in cells. Exploring causal links between PS and function is an important need in the phase separation field, particularly as regards the role of condensates in gene regulation, and is a non-trivial matter. Any study with convincing data on this matter will be very important. For this reason, it is crucial to properly explore the alternative possibility that soluble complexes, existing in the same conditions as phase-separated condensates, are the functional species. It is also critical to keep in mind that, while a specific protein domain may be essential for PS, this does not mean its only important function pertains to PS.
In this study, the authors do not sufficiently explore the role that soluble MORC2 complexes may play alongside MORC2 condensates. Neither do they include enough data to solidly show that domain deletion leads to phenotypes via a loss of phase separation per se, rather than the loss of phase separation being a microscopically visible result, not cause, of an underlying shift in protein function. For these reasons, the authors' conclusions regarding the functional role of MORC2 condensates are based on incomplete data. This also dampens the utility of this work as a whole, since the very nice work detailing the mechanism of MORC2 PS is not paired with strong data showing the importance of this observation.
We thank the reviewer for this thoughtful and constructive critique. We agree that establishing a causal link between phase separation (PS) and biological function—particularly in transcriptional regulation—is a central and non-trivial challenge in the condensate field. We also appreciate the reviewer’s emphasis on two critical alternative interpretations: (i) that soluble MORC2 complexes, rather than condensates, may represent the primary functional species, and (ii) that loss of phase separation upon domain deletion could reflect a downstream consequence of altered protein function rather than its cause.
To address these concerns, we have performed a series of new experiments specifically designed to decouple condensate formation, and condensate dynamics, thereby allowing us to more rigorously interrogate the functional relevance of MORC2 condensates.
First, to overcome the limitation of domain deletions which may affect MORC2 function beyond phase separation we introduced a micropeptide-based kill switch (KS) to the C terminus of MORC2. This strategy has recently emerged as a powerful approach to selectively reduce condensate dynamics without disrupting protein expression, folding, or domain architecture [1]. Importantly, unlike CC3 or IDRa deletions, MORC2+KS robustly form nuclear condensates but exhibits markedly reduced internal dynamics, as demonstrated by FRAP analyses showing minimal fluorescence recovery after photo bleaching (Fig. 6a-c). This strategy therefore allows us to perturb condensate material properties independently of MORC2 domain integrity.
Second, we systematically compared the transcriptional consequences of rescuing MORC2-knockout HeLa cells with MORC2FL, condensation-deficient mutants (ΔCC3 and ΔIDRa), and the dynamics-defective MORC2+KS (Fig. 6d). Despite being expressed at substantially higher levels than MORC2FL (Fig. 6e), all three mutants showed a striking and consistent failure to restore MORC2-dependent transcriptional regulation (Fig. 6f-h). This effect was particularly pronounced for transcriptionally repressed genes, including two sets of high-confidence MORC2 targets reported in prior studies (Fig. 6i and Fig.S10). These findings demonstrate that neither increased protein abundance nor the mere presence of condensate-like structures alone is sufficient to restore MORC2 function.
Third, our data instead support a model in which both soluble MORC2 complexes and dynamic MORC2 condensates are required for full transcriptional regulation activity. While soluble MORC2 is likely involved in target recognition and complex assembly, our results indicate that proper condensate formation—and critically, condensate dynamics—are essential for effective transcriptional repression and activation. The inability of the MORC2+KS mutant to rescue transcriptional defects, despite intact condensate formation, points away from a model in which MORC2 condensates represent only microscopically visible byproducts of MORC2 activity.
We believe these new data strengthen the manuscript by pairing the detailed mechanistic dissection of MORC2 phase separation with direct functional evidence, enhancing the conceptual impact and biological significance of the study.
Strengths:
Static light scattering and crystallography are nicely used to demonstrate the dimerization of MORC2FL and to discover the structure of the CC3 domain dimer, presumably responsible for the dimerization of MORC2FL (Figure 1).
Extensive use of deletion mutants in multiple cell lines is used to identify regions of MORC2 that are important for forming condensates in the nucleus: the IBD, IDR, and CC3 domains are found to be essential for condensate formation, while the CW domain plays an unknown role in condensate morphology (Figure 3). The authors use NMR to further identify that the IBD domain seems to interact with the first third of the centrally located IDR, termed IDRa, but not with the latter two-thirds of the IDR domain (Figure 4). This leads them to propose that phase separation is the product of IDB:IDRa interaction, CC3 dimerization, and an unknown but important role for the CW domain.
Based on the observation that removal of the NLS resulted in diffuse cytoplasmic localization, they hypothesized that DNA may play an important role in MORC2 PS. EMSA was used to demonstrate interaction between DNA and several MORC2 domains: CC1, CC2, IDR, and TCD-CC3-IBD. Further in vitro microscopy with purified MORC2 showed that DNA addition significantly reduces MORC2 saturation concentration (Figure 5).
These assays convincingly demonstrate that MORC2 phase separates in cells, and identify the protein domains and interactions responsible for this phenomenon, with the notable caveat that the role of the CW domain here is left unexplored.
We appreciate the reviewer for their positive and detailed assessment of the strengths of our study. Our understanding of the CW domain’s function remains preliminary. Although we observed that the CW domain can influence condensate size, the IDR, IBD, and CC3 domains constitute the core structural elements driving phase separation. Consequently, the CW domain was not a primary focus of the current study. Nonetheless, investigating its functional contributions represents an interesting avenue for future work.
Weaknesses:
Although the authors demonstrated phase separation of MORC2FL, their evidence that this plays a functional role in the cell is incomplete.
Firstly, looking at differentially upregulated genes under MORC2FL overexpression, the authors acknowledge that only 10% are shared with differentially regulated genes identified in other MORC2FL overexpression studies (Figure 6c, d). No explanation is given for why this overlap is so low, making it difficult to trust conclusions from this data set.
We thank the reviewer for raising this important concern. In response, we have improved the quality and robustness of our RNA-seq analysis by repeating the experiments with optimized sample handling and increased sequencing depth. Using this updated dataset, we identified a considerably higher overlap between MORC2-regulated genes in our study and those reported previously.
Specifically, we observed 84 overlapping genes with the study by Nikole L. Fendler et al. [2], corresponding to approximately 32% of the MORC2-regulated genes reported in that work (Fig. 6i). In addition, we identified 102 overlapping genes with the dataset reported by Iva A. Tchasovnikarova et al. [3], representing approximately 22% of the genes identified in that study (Fig. S10b).
We note that complete concordance with previous reports is not expected, given substantial differences in experimental design. For example, Fendler et al. employed a doxycycline-inducible MORC2 expression system [2], whereas our study relies on transient overexpression in MORC2-knockout HeLa cells. In contrast, Tchasovnikarova et al. compared transcriptomes between MORC2 knockout and wild-type cells [3], rather than MORC2 rescue conditions. Moreover, RNA-seq results are inherently influenced by cell line batch variability, sequencing depth, and analysis pipelines, all of which differ across studies.
Taken together, we consider an overlap in the range of ~20–30% to be reasonable and biologically meaningful in the context of these experimental differences, and we believe that the revised RNA-seq data provide a more reliable foundation for our conclusions regarding MORC2-dependent transcriptional regulation.
Secondly, of the 21 genes shared in this study and in earlier studies, the authors note that the differential regulation is less pronounced when a phase-separation-deficient MORC2 mutant is overexpressed, rather than MORC2FL (Figure 6e). This is taken as evidence that phase separation is important for the proper function of MORC2. However, no consideration is made for the alternative possibility that the mutant, lacking the CC3 dimerization domain, may result in non-functional complexes involving MORC2, eliminating the need for a PS-centric conclusion. To take the overexpression data as solid evidence for a functional role of MORC2 PS, the authors would need to test the alternative, soluble complex hypothesis. Furthermore, there seems to be low replicate consistency for the MORC2 mutant condition (Figure S6a), with replicate 3 being markedly upregulated when compared to replicates 1 and 2.
We thank the reviewer for raising these important concerns. In the revised manuscript, we have substantially strengthened both the experimental evidence and the data presentation to directly address the alternative “soluble complex” interpretation as well as the issue of replicate consistency. Specifically, we now provide data that clarify the functional impact of phase-separation-deficient MORC2 mutants and explicitly show replicate-level RNA-seq analyses. The Fig. 6 and Fig. S10support these improvements and enhance both the robustness and transparency of our transcriptional analyses. Collectively, these revisions directly address the reviewer’s concerns regarding the functional interpretation of MORC2 phase separation.
Thirdly, the authors close by examining the in-cell PS capabilities and ATPase activity of several disease-associated mutants of MORC2 (Figure 7). However, the relevance of these mutants to the past 6 figures is unclear. None of these mutations is in regions identified as important for PS. Two of the mutations result in a higher percentage of the cell population being condensate-positive, but this is not seemingly connected to ATPase activity, as only one of these two mutants has increased ATPase activity. Figure 7 does not add any support to the main hypotheses in the paper, and nowhere in the paper do the authors investigate the protein regions where the mutations in Figure 7 are found.
We thank the reviewer for raising this point regarding Fig. 7. At the current stage, the results for disease-associated mutations are primarily descriptive. While we observed that certain mutations clustered at the N-terminus can affect MORC2 condensate formation, ATPase activity, and DNA binding, we did not identify a mechanistic explanation for these correlations. Notably, the T424R mutation, previously reported to significantly enhance ATPase activity [4], also increased both intracellular condensate formation and in vitro DNA binding in our experiments. In contrast, other mutations did not show such consistent effects. Previous studies have established that MORC2’s ATP-binding and DNA-binding activities are independent [4]. Our results further suggest that MORC2’s phase separation behavior is independent of both ATP and DNA binding affinity, although existing evidence hints at potential cross-regulatory interactions among these three functions.
We would also like to emphasize an additional observation that may help contextualize the relevance of N-terminal mutations. Although deletion of the MORC2 N-terminus does not prevent the remaining C-terminal region from forming nuclear condensates, these C-terminal condensates exhibit a marked loss of fluorescence recovery in FRAP assays (Fig. S11). This finding suggests that while the N-terminus is not strictly required for condensate assembly, it plays an important role in regulating condensate fluidity. Accordingly, disease-associated mutations distributed across the N-terminal region may influence MORC2 function by modulating condensate material properties rather than condensate formation per se. Based on this hypothesis, we evaluated the fluidity of condensates formed by the E236G and T424R mutants. FRAP measurements indicated substantially reduced fluorescence recovery in E236G, whereas T424R exerted minimal effects (Fig. 7e, f).
Overall, our interpretation of the results in Fig. 7 is still at a preliminary stage. Nevertheless, the role of the MORC2 N-terminus in modulating condensate fluidity, together with the observed impairment caused by the E236G mutation, appears to be robust, although the underlying mechanism remains to be elucidated. We have incorporated additional discussion on this point and consider it an important direction for future study.
Reviewer #1 (Recommendations for the authors):
(1) Why does MORC2 overexpression lead to changes in gene regulation that are so different from past MORC2 overexpression studies? This is unsettling to me.
(2) Likewise, why is replicate 3 for the MORC2ΔCC3 variant so different from replicates 1 and 2? Perhaps repeating this experiment would be helpful, both for showing better repeatability and perhaps as regards pulling out a stronger phenotype.
We have repeated the experiments and obtained improved data quality.
(3) A better explanation of the relevance of Figure 7 to the story of the rest of the paper, especially the phase-separation of MORC2, would be important to improving this paper.
We thank the reviewer for this suggestion. We have performed additional experiments and expanded the discussion.
(4) Are expression levels of mutant proteins in Figure 7 uniform between mutants? If not, is it possible that expression levels might account for the difference in condensate-positive cells between mutants?
We cannot fully exclude the possibility that differences in expression levels may contribute to the observed differences among mutants. In our experiments, equal amounts of plasmid DNA were used for transfection across all conditions. Although we did not directly quantify post-transfection protein expression levels by immunoblotting or similar approaches, even if certain mutations were to affect protein expression, it would be technically challenging to further optimize the strategy to fully normalize expression levels across mutants.
Importantly, we note that MORC2 does not form condensates in all transfected cells, even when EGFP fluorescence indicates robust expression levels that are comparable to, or even exceed, those observed in condensate-positive cells. This observation suggests that high expression alone is not sufficient to drive MORC2 phase separation in cells. Therefore, we do not favor the interpretation that the E236K and T424R mutations enhance MORC2 condensation simply by increasing MORC2 protein expression levels.
Minor:
(1) I would suggest considering using the term "dynamic" rather than "liquid-like", as FRAP is technically a measurement of the dynamicity of a protein within a volume, rather than a measurement of the actual fluidity of that volume.
We thank the reviewer for this helpful suggestion. We agree that FRAP measurements primarily report protein mobility and condensate dynamics rather than the physical fluidity of the condensates. We have therefore revised the manuscript to replace “liquid-like” with “dynamic” where conclusions are based on FRAP analyses.
(2) A further investigation of the role of the CW domain would be very interesting, since it clearly has a major role in condensate morphology. Perhaps CW confers important heterotypic interactions which contribute to compositional control of the MORC2 condensates, and thus function and morphology? However, due to the complexity of this specific question and the potentially marginal improvement offered by this paper, I do not think this is a critical addition.
We thank the reviewer for this insightful suggestion. We have noted this possibility in the Discussion as an important avenue for future investigation.
(3) Why is TCD not tested alone by EMSA for affinity to DNA in Figure 5?
Our inference regarding the DNA-binding capacity of the TCD domain was based on comparative EMSA analyses. Specifically, we found that the TCD–CC3–IBD fragment was able to bind DNA, whereas the CC3–IBD fragment alone showed no detectable DNA binding. From this comparison, we inferred that the TCD domain is responsible for the observed DNA-binding activity.
Because the TCD domain does not affect MORC2 condensate formation, it was not a central focus of the present study, which primarily aims to elucidate the mechanisms underlying MORC2 phase separation and its functional relevance. For this reason, we did not further test TCD alone by EMSA in Figure 5.
Reviewer #2 (Public review):
Summary:
The study by Zhang et al. focuses on how phase separation of a chromatin-associated protein MORC2, could regulate gene expression. Their study shows that MORC2 forms dynamic nuclear condensates in cells. In vitro, MORC2 phase separation is driven by dimerization and multivalent interactions involving the C-terminal domain. A key finding is that the intrinsically disordered region (IDR) of MORC2 exhibits strong DNA binding. They report that DNA binding enhances MORC2's phase separation and its ATPase activity, offering new insights into how MORC2 contributes to chromatin organization and gene regulation. The authors try to correlate MORC2's condensate-forming ability with its gene silencing function, but this warrants additional controls and validation. Moreover, they investigate the effect of disease-linked mutations in the N-terminal domain of MORC2 on its ability to form cellular condensates, ATPase activity, and DNA-binding, though the findings appear inconclusive in the manuscript's current form.
Thank you for your thorough and constructive review of our manuscript. In response to the concerns raised regarding the functional relevance of MORC2 condensate formation, we have redesigned and expanded the experiments presented in Fig. 6 and Fig. S6 to directly link MORC2’s condensate-forming capacity with its transcriptional regulatory function. These new experiments provide additional controls and validation, strengthening the causal relationship between MORC2 condensate dynamics and gene regulation.
At the current stage, the results for disease-associated mutations are descriptive. While we observed that certain mutations clustered at the N-terminus can affect MORC2 condensate formation, ATPase activity, and DNA binding, we did not identify a mechanistic explanation for these correlations. Notably, the T424R mutation, previously reported to significantly enhance ATPase activity [4], also increased both intracellular condensate formation and in vitro DNA binding in our experiments. In contrast, other mutations did not show such consistent effects. Previous studies have established that MORC2’s ATP-binding and DNA-binding activities are independent [4]. Our results further suggest that MORC2’s phase separation behavior is also independent of both ATP and DNA binding, although existing evidence hints at potential cross-regulatory interactions among these three functions.
Strengths:
The authors determined a 3.1 Å resolution crystal structure of the dimeric coiled-coil 3 (CC3) domain of MORC2, revealing a hydrophobic interface that stabilizes dimer formation. They present extensive evidence that MORC2 undergoes liquid-liquid phase separation (LLPS) across multiple contexts, including in vitro, in cellulo, and in vivo. Through systematic cellular screening, they identified the C-terminal domain of MORC2 as a key driver of condensate formation. Biophysical and biochemical analyses further show that the IDR within the C-terminal domain interacts with the C-terminal end region (IBD) and also exhibits strong DNA-binding capacity, both of which promote MORC2 phase separation. Together, this study emphasizes that interactions mediated by multiple domains-CC3, IDR, and IBD- drives MORC2 phase separation. Finally, the authors quantified the effect of removing the CC3 on the upregulation and downregulation of target gene expression.
We thank the reviewer for their appreciation of the key findings presented in this manuscript.
Weaknesses:
Though the findings appear compelling in isolation, the study lacks discussion on how its findings compare with previous studies. Particularly in the context of MORC2-DNA binding, there are previous studies extensively exploring MORC2-DNA binding (Tan, W., Park, J., Venugopal, H. et al. Nat Commun 2025), and its effect on ATPase activity (ref 22). The contradictory results in ref 22 about the impact of DNA-binding on ATPase activity, and ATPase activity on transcriptional repression, warrant proper discussion. The authors performed extensive in-cellulo screening for the investigation of domain contribution in MORC2 condensate formation, but the study does not consider/discuss the possibility of some indirect contributions from the complex cellular environment. Alternatively, the domain-specific contributions could be quantified in vitro by comparing phase diagrams for their variants. While the basis of this study is to investigate the mechanism of MORC2 condensate-mediated gene silencing, the findings in Figure 6 appear incomplete because the CC3 deletion not only affects phase separation of MORC2 but also dimerization. Furthermore, their investigation on disease-linked MORC2 mutations appears very preliminary and inconclusive because there are no obvious trends from the data. Overall, the discussion appears weak as it is missing references to previous studies and, most importantly, how their findings compare to others'.
We thank the reviewer for their careful assessment of MORC2’s DNA-binding properties and its relationship with ATPase and transcriptional activities. We would like to offer the following clarifications to address these concerns, which will also be incorporated into the Discussion section of the revised manuscript.
First, recent work by Tan et al. [5] similarly identified multiple DNA-binding sites in MORC2, consistent with our findings, though there are discrepancies in the precise binding regions. In particular, they reported that isolated CC1 and CC2 domains do not bind 60 bp dsDNA, which contrasts with our observations. We attribute this difference to the types of DNA used in the assays. In our study, we employed 601 DNA, a defined nucleosome-positioning sequence, which differs substantially from randomly designed short dsDNA. For instance, prior work by Christopher H. Douse et al. [54] also confirmed that MORC2’s CC1 domain can bind 601 DNA.
Second, in the study by Fendler et al. [2], DNA binding was reported to reduce MORC2’s ATPase activity—an observation that appears inconsistent with the results presented in our Fig. 5j. A critical distinction between the two studies lies in the experimental systems used: Fendler et al. [2] employed MORC2 constructs and 35 bp double-stranded DNA (dsDNA), whereas our experiments utilized full-length MORC2 and 601 bp DNA (a sequence with high nucleosome assembly potential). These differences including the absence of potentially regulatory C-terminal regions in the truncated construct and the varying length/structural properties of the DNA substrates introduce variables that substantially complicate direct comparative analysis of ATPase activity outcomes.
Separately, Douse et al. [4] demonstrated that the efficiency of HUSH complex-dependent epigenetic silencing decreases as MORC2’s ATP hydrolysis rate increases, implying an inverse relationship between ATPase activity and silencing function. Notably, our current work has not established a direct mechanistic link between MORC2 phase separation and its ATPase activity. Thus, we refrain from inferring that the effect of MORC2 phase separation on transcriptional repression is mediated through modulation of its ATPase function this remains an important question to address in future studies.
Finally, we have redesigned and expanded the experiments presented in Fig. 6 and Fig. S6 to directly link MORC2’s condensate-forming capacity with its transcriptional regulatory function.
Reviewer #2 (Recommendations for the authors):
Major concerns:
(1) Unaddressed discrepancies with the previous study:
(a) Inadequate discussion of Reference 22 and apparent contradictions. Notably, Reference 22 provides evidence for reduced ATPase activity upon DNA binding, in contrast to the current study's observations. Moreover, Reference 22 demonstrates that ATP hydrolysis (ATPase activity) is inversely associated with MORC2-mediated gene silencing, whereas this study concludes that 'the silencing function of MORC2 requires its ATPase activity'. These apparent contradictions warrant a more thorough discussion to reconcile the differences, including potential mechanistic explanations and experimental context that could account for the discrepancies. Additionally, the authors should discuss potential reasons why Ref. 22 may not have observed phase separation during MORC2 biophysical analysis. For instance, in Ref. 22, SEC-MALS was performed at 2 mg/mL (~16 µM) MORC2 FL in the presence of 150 mM NaCl, conditions that could influence phase behavior based on the current manuscript's results. Addressing whether differences in protein construct, buffer composition, or experimental design might account for this discrepancy would strengthen the discussion.
We thank the reviewer for pointing out the apparent discrepancies between our results and those reported in Ref. 22. We agree that these differences warrant explicit discussion, and we have revised the Discussion accordingly to clarify the experimental and conceptual distinctions between the two studies.
First, regarding the effect of DNA binding on ATPase activity, Ref. 22 examined MORC2 ATPase activity under conditions where MORC2 does not undergo detectable phase separation, whereas our ATPase assays were performed under conditions in which MORC2 readily forms condensates in the presence of DNA. We therefore propose that the observed increase in ATPase activity in our study may reflect a distinct biochemical regime in which phase separation and/or high local protein concentration modulates enzymatic activity. Importantly, our data do not exclude the possibility that DNA binding per se can inhibit ATPase activity under non-condensing conditions, as reported in Ref. 22.
Second, with respect to transcriptional repression, Ref. 22 reported an inverse correlation between ATP hydrolysis and MORC2-mediated silencing, whereas our study finds that ATPase activity is required for efficient repression. We suggest that these observations are not necessarily contradictory but may reflect different regulatory layers of MORC2 function. Specifically, ATP binding and hydrolysis may be required for MORC2 structural remodeling and chromatin engagement, while excessive or dysregulated ATP hydrolysis could impair stable silencing complexes, as suggested previously [4]. We now explicitly discuss this possibility in the revised manuscript.
Finally, we appreciate the reviewer’s suggestion regarding the absence of phase separation in Ref. 22. Indeed, SEC-MALS experiments in Ref. 22 were conducted at ~16 µM MORC2 in the presence of 150 mM NaCl (the purification condition is 500 mM NaCl, 10% glycerol), conditions that based on our phase diagrams—are close to or above the saturation concentration but also strongly influenced by ionic strength. This combination of factors explains why the UV peak from SEC-MALS is not indicative of a homogeneous sample [3].
(b) The DNA binding capacity of individual MORC2 domains was tested in Fig. 5. IDR appears to be the strongest DNA binder among others. Is this the effect of IDR being isolated from the rest of the protein? A recent paper (Tan, W., Park, J., Venugopal, H. et al. Nat Commun 2025) also investigated DNA binding capacity of different regions of MORC2 using hydrogen-deuterium exchange experiments and EMSA. Interestingly, it can be seen in Figure S9 that the DNA binding capacity of different regions changes when compared together to when in isolation (MORC2 1-603 vs 1-265; 1-495; 496-603). In line with the above, MORC2 IDR's interaction with DNA warrants additional investigation, taking the system as a whole to avoid misinterpretation arising from non-specific interactions.
We appreciate the reviewer’s insightful comments regarding domain-specific DNA binding and the potential caveats of studying isolated regions. In Figure 5, our EMSA analyses show that the isolated IDR exhibits the strongest DNA-binding signal among the tested fragments. We agree that this observation may, at least in part, reflect the removal of structural or regulatory constraints imposed by the full-length protein.
Consistent with the reviewer’s point, Tan et al. [5] demonstrated that DNA-binding behavior of MORC2 regions differs when analyzed in isolation versus in the context of larger constructs. We have now incorporated this comparison into the Discussion and explicitly note that DNA binding by the IDR should be interpreted as a contextual and potentially cooperative property rather than an autonomous function.
Importantly, our conclusions do not rely on the IDR acting as an independent DNA-binding module in vivo. Rather, we propose that the IDR contributes to DNA engagement and phase behavior within the architectural framework of full-length MORC2. We now emphasize this limitation and highlight the need for future studies that probe DNA binding in the context of intact MORC2 or minimally perturbed constructs.
(2) MORC2 DNA binding impacting phase separation and ATPase activity:
While it is clear that MORC2: DNA interaction facilitates MORC2 phase separation, the impact on ATPase activity is not conclusive. First, they observe an opposite trend (compared to ref. 22) for DNA binding on MORC2's ATPase activity. Secondly, it is not clear if the increase in ATPase activity is mediated by DNA binding or phase separation. The ATPase activity was measured at 1 µM MORC2 protein concentration in the presence of DNA, where MORC2 appears to phase separate. To draw more definitive conclusions, additional controls are necessary. Specifically, a phase separation-deficient mutant (from this study) and a DNA-binding-deficient mutant (see ref. 22) should be included to disentangle the contributions of DNA binding and phase separation to ATPase activity. The choice of ATP-binding-deficient mutant N39A as a negative control seems inconclusive in this regard. Additionally, why is there an increase in ATP hydrolysis rate for the ATP-binding-deficient mutant in the presence of DNA, resulting in ATP hydrolysis rates similar to WT MORC2? This raises further questions about the underlying mechanism.
We agree with the reviewer that disentangling the contributions of DNA binding and phase separation to ATPase activity is challenging and that our current data do not fully resolve this issue. As noted, ATPase assays were performed at protein concentrations (1 µM) where MORC2 undergoes DNA-induced phase separation, making it difficult to distinguish whether enhanced ATP hydrolysis arises directly from DNA binding or indirectly from condensate formation.
We acknowledge that inclusion of additional mutants such as phase separation deficient or DNA-binding deficient variants would provide a more definitive mechanistic separation of these effects. However, generating and validating such mutants in a manner that preserves overall protein integrity is beyond the scope of the current study. Accordingly, we have revised the text to present our findings more cautiously and to frame the observed ATPase enhancement as a correlation rather than a causal mechanism.
Regarding the ATP-binding–deficient N39A mutant, we agree that its behavior in the presence of DNA raises interesting mechanistic questions. We now explicitly note this unexpected observation and discuss possible explanations, including partial ATP binding, altered oligomeric states, or indirect effects mediated by condensate formation.
(3) Dissecting the domain-specific contribution in MORC2 phase separation:
(a) While in cellulo data indicate that the presence of IDR, NLS, CC3, and IBD is all essential for MORC2 condensate formation, it is not clear if this is the effect of the complex cellular environment or whether it is intrinsic for MORC2 phase separation ability. In lines 256-259, the authors suggest IDRa interaction with IBD may serve as a nucleation mechanism for LLPS. In other places, it has been mentioned that CC3 dimerization acts as a scaffold for condensate formation. It is not clear if all of these are essential for MORC2 phase separation, or one of them is essential while the other domain(s) facilitates the phase separation. Though Figure 3 provides a qualitative overview of the contribution of different regions in MORC2 phase separation in cellulo-influenced by the complex cellular environment and substrate interactions, the absolute domain contribution in phase separation would be better studied in vitro by quantitatively comparing phase diagrams (for example, c-sat vs temperature) of different domain deletion constructs.
We thank the reviewer for highlighting the distinction between intrinsic phase separation propensity and cellular context dependent effects. Our in cellular screening was designed to identify regions required for condensate formation under physiological conditions, where chromatin, binding partners, and macromolecular crowding are present. We agree that this approach does not directly quantify the intrinsic phase separation contribution of individual domains.
While CC3 dimerization, IDR–IBD interactions, and nuclear localization all contribute to condensate formation, our data do not imply that these elements are mechanistically equivalent. Rather, we propose that CC3 provides a structural scaffold, while IDR-mediated interactions lower the energetic barrier for condensation. We have revised the manuscript to clarify this hierarchical model and to avoid implying that all domains contribute equally or independently.
We agree that quantitative in vitro phase diagrams would provide valuable insight into intrinsic domain contributions. Whereas the MORC2ΔCC3-IBD (1–900) and CC3-IBD (900-1032) fragment fails to induce phase separation, the IDR mix CC3–IBD fragment drives robust phase separation; additionally, phase separation is entirely abrogated in the absence of domain–domain interactions. These observations collectively verify that phase separation is contingent on specific domain combinations and their interactions.
(b) Similarly, for line 228-231: 'Notably, condensates formed exclusively in the nucleus and not in the cytoplasm of transfected HeLa cells, suggesting that chromatin-associated nuclear factors, such as DNA, may contribute to the nucleation or stabilization of MORC2 condensates.' This is an important observation made by the authors. Since MORC2 readily phase separates in vitro under physiological conditions, it is important to discuss why MORC2 does not make condensates in the cytoplasm (in the case of MORC2deltaNLS). In this regard, how does the concentration of overexpressed EGFP-MORC2 constructs compare with in vitro tested droplets of MORC2?
We thank the reviewer for highlighting this important conceptual point. Although MORC2 readily undergoes phase separation in vitro under physiological buffer conditions, the absence of condensate formation in the cytoplasm of cells expressing MORC2ΔNLS underscores the importance of the nuclear environment in promoting MORC2 assembly.
The cytoplasm differs fundamentally from the nucleus not only in overall molecular composition but also in the availability of high-valency scaffolds such as chromatin. We propose that chromatin-associated components, particularly DNA, provide a platform that locally concentrates MORC2 and increases its effective valency, thereby facilitating nucleation or stabilization of condensates in the nucleus. In contrast, the cytoplasm lacks such scaffolds, even when MORC2 is expressed at appreciable levels. In cultured cells, MORC2 is seldom observed in the cytoplasm. While specific experimental contexts may facilitate its cytoplasmic localization, such observations are rarely reported [6]. In transfection-based systems, MORC2 predominantly displays droplet-like behavior in the nucleus. Notably, in endogenous EGFP–MORC2 chimeric mice, we detected punctate MORC2 structures in the neuronal cytoplasm of the brain and spinal cord. The functional significance and biophysical state of cytoplasmic MORC2 remain largely unexplored.
With respect to protein concentration, while EGFP-MORC2 is robustly expressed in cells, direct comparison between cellular expression levels and the protein concentrations used in vitro is inherently challenging. Importantly, in vitro phase separation is driven by bulk protein concentration under defined conditions, whereas in cells, effective local concentration and interaction valency are strongly shaped by spatial confinement and chromatin association. We have revised the manuscript text to emphasize this distinction and to avoid interpreting nuclear specificity as a purely concentration-dependent phenomenon.
(c) Lines 227-228: '... CW domain restricts condensate overgrowth or fusion', this inference is based on CTDdeltaCW puncta being larger in size (Figure 3a). However, in Figure 4h MORC2deltaIDRb and MORC2deltaIDRc also result in larger puncta. Making a final conclusion that the CW domain restricts condensate overgrowth or fusion warrants additional investigation.
We thank the reviewer for pointing out the limitation of our original conclusion. We agree that the enlarged puncta in both CTDΔCW (Figure 3a) indicate that condensate size regulation involves the CW domain was insufficiently rigorous.
Re-analysis of existing data identifies clear phenotypic disparities between the mutants: MORC2ΔIDRb/ΔIDRc mutants show two distinct phenotypes (reduced puncta number with enlarged size, or unchanged puncta number with uniform enlargement), and their total puncta area per cell is comparable to the WT. By contrast, CTDΔCW mutants display markedly larger puncta relative to the WT. Based on this distinction, we have revised our conclusion to a more cautious formulation: "These observations suggest that the CW domain may participate in regulating initial nucleation size and the exact molecular mechanisms require further investigation."
(4) MORC2 condensate-mediated gene silencing:
This is one of the key investigations of this study where the authors evaluate the ability of MORC2 condensates to regulate gene silencing (transcriptional repression). The major concern here is that the authors are drawing their conclusion based on a CC3 domain deletion mutant of MORC2 and comparing it with wild-type MORC2. Notably, the CC3 domain is responsible for MORC2 dimerization, and as the authors quote, 'The dimeric assembly of CC3 is essential for maintaining the structural integrity of the protein', the absence of CC3 would have a direct impact on its function (such as ATPase activity). With these considerations, it is not clear whether the effect of CC3 domain deletion on gene regulation is an effect of no phase separation or a consequence of loss of function. This necessitates additional validation by including other controls, such as IBD domain deletion mutant, IDRa domain deletion mutant, where the phase separation is impeded without affecting dimerization.
We appreciate the reviewer’s concern regarding the interpretation of CC3 deletion experiments. We agree that CC3 deletion affects both dimerization and phase separation, complicating attribution of gene regulatory effects solely to condensate formation. Our intention was not to claim that loss of repression arises exclusively from impaired phase separation, but rather to demonstrate that disrupting condensate-dynamic capacity correlates with impaired silencing.
To directly address these concerns, we have performed a series of new experiments specifically designed to decouple condensate formation, condensate dynamics, and protein abundance, thereby allowing us to more rigorously interrogate the functional relevance of MORC2 condensates.
First, to overcome the limitation of domain deletions which may affect MORC2 function beyond phase separation we introduced a micropeptide-based kill switch (KS) to the C terminus of MORC2. This strategy has recently emerged as a powerful approach to selectively reduce condensate dynamics without disrupting protein expression, folding, or domain architecture [1]. Importantly, unlike CC3 or IDRa deletions, MORC2+KS robustly form nuclear condensates but exhibits markedly reduced internal dynamics, as demonstrated by FRAP analyses showing minimal fluorescence recovery after photo bleaching (Fig. 6a-c). This strategy therefore allows us to perturb condensate material properties independently of MORC2 domain integrity.
Second, we systematically compared the transcriptional consequences of rescuing MORC2-knockout HeLa cells with MORC2FL, condensation-deficient mutants (ΔCC3 and ΔIDRa), and the dynamics-defective MORC2+KS (Fig. 6d). Despite being expressed at substantially higher levels than MORC2FL (Fig. 6e), all three mutants showed a striking and consistent failure to restore MORC2-dependent transcriptional regulation (Fig. 6f-h). This effect was particularly pronounced for transcriptionally repressed genes, including two sets of high-confidence MORC2 targets reported in prior studies (Fig. 6i and Fig. S10). These findings demonstrate that neither increased protein abundance nor the mere presence of condensate-like structures alone is sufficient to restore MORC2 function.
Third, our data instead support a model in which both soluble MORC2 complexes and dynamic MORC2 condensates are required for full transcriptional activity. While soluble MORC2 is likely involved in target recognition and complex assembly, our results indicate that proper condensate formation and critically, condensate dynamics are essential for effective transcriptional repression and activation. The inability of the MORC2+KS mutant to rescue transcriptional defects, despite intact condensate formation, points away from a model in which MORC2 condensates represent only microscopically visible byproducts of MORC2 activity.
We believe these new data strengthen the manuscript by pairing the detailed mechanistic dissection of MORC2 phase separation with direct functional evidence, enhancing the conceptual impact and biological significance of the study.
(5) Uncertain impact of pathogenic MORC2 mutations:
Line 356-365: While the statements such as "disease-associated mutations primarily affect enzymatic and phase behaviors rather than DNA affinity" and "these findings provide mechanistic insight into how specific mutations may contribute to distinct pathological outcomes" are conceptually compelling, the data presented in Figure 7b-d do not appear to fully support these conclusions. For many of the mutants, the differences from WT across key parameters-condensation, ATPase activity, and DNA binding-are either modest or statistically insignificant. As such, drawing a unified mechanistic conclusion from these datasets may overstate what the data actually support.
We agree that the effects of disease-associated MORC2 mutations described in Fig. 7 are modest and, in some cases, statistically insignificant. Our intention was to document observable trends rather than to propose a unified mechanistic framework. We have revised the manuscript to temper these conclusions and to emphasize the descriptive nature of these data.
(6) Important conceptual clarifications:
(a) Intrinsically disordered regions (IDRs) are not synonymous with phase separation. As the authors show, it is a combination of IDR-mediated interactions and CC3 dimerization that contributes towards the phase separation of MORC2. While IDRs can act as scaffolds for multivalent weak interactions that may promote biomolecular condensate formation, many IDRs serve other roles-such as mediating transient interactions, signaling, or regulatory functions-without undergoing phase separation. Researchers should avoid generalizing the assumption that the mere presence of IDRs in a protein implies its ability for phase separation. In this regard, authors should consider restructuring some of their generalized statements: Line 87-88: 'Recent studies suggest that intrinsically disordered regions (IDRs) can drive liquid-liquid phase separation (LLPS)' and Line 159-161: 'we noticed a long unstructured region at its C-terminus (Fig. S1b), a characteristic often associated with proteins capable of phase separation'.
We agree that IDRs are not synonymous with phase separation and have revised the Introduction to avoid generalized statements. The revised text now emphasizes that IDRs can contribute to phase separation in a context-dependent manner and act in concert with structured oligomerization domains such as CC3-IBD.
(b) Liquid-liquid phase separation: I would suggest switching the phrase to just phase separation. The rationale is that the in vitro studies of MORC2 (FRAP, droplet imaging) do not show liquid-like behavior, but perhaps liquid-solid. The FRAP studies suggest liquid-like behavior for some of the constructs. Given the differences in viscoelastic properties across the in vitro and in cellulo studies, it is better to generalize to "phase separation". Movies for droplet fusion and FRAP, wherever applicable, would be much appreciated. As the nature of in vitro MORC2 droplets appears different than in cells, movie representations of the above would enable readers to better assess the viscoelastic nature of the droplets (whether liquid, gel, etc).
We appreciate the reviewer’s insight regarding the viscoelastic properties of MORC2. Our experimental data indeed show a disparity in dynamics between the two environments: while in vitro MORC2-FL condensates exhibit relatively low internal mobility, the in cellulo MORC2-FL puncta display high dynamics, characterized by rapid internal recovery in FRAP assays and droplet fusion events (Fig. S2f).
This contrast suggests that the intracellular microenvironment plays a critical role in regulating the material state of MORC2 condensates. Consequently, we have focused on providing in vivo fusion data, as we believe in vitro characterizations (such as fusion or FRAP under various artificial conditions) may not faithfully represent the physiological behavior of MORC2. We have revised the manuscript to use the more general term “phase separation” or “condensation” and have added a discussion on these limitations to avoid overinterpreting the material properties observed in vitro.
(7) Methods:
(a) Figure 6 S2b: If phase separation occurs at, say, 1.8 µM protein concentration, this indicates that the protein has reached its saturation concentration (c-sat). Beyond c-sat, any additional protein should partition into the dense phase, while the concentration of the dilute phase remains constant. However, in this figure, the dilute phase concentration appears to increase with increasing total protein concentration, which is inconsistent with expected phase separation behavior. As the methods section does not have any sub-section for the sedimentation assay, it becomes difficult to understand how this experiment was performed, whether there is any technical discrepancy in the way soluble and pellet fractions were handled and processed for loading onto the gels. This is also the case with Figure 3d.
We thank the reviewer for carefully examining the sedimentation assay and for raising this important conceptual point. We agree that, for an ideal two-phase system at thermodynamic equilibrium, the concentration of the dilute phase is expected to remain constant once the saturation concentration (c-sat) is reached.
In our study, the sedimentation assay was used as an operational readout to assess concentration-dependent partitioning rather than to quantitatively define equilibrium phase boundaries. The assay involves centrifugation-based separation of supernatant and pellet fractions followed by SDS–PAGE analysis, and therefore does not necessarily report the equilibrium concentrations of coexisting dilute and dense phases. In particular, this approach can be influenced by incomplete physical separation of phases, kinetic trapping, and redistribution of material during handling, especially in systems where condensate maturation or internal reorganization occurs on longer timescales.
Consequently, the apparent increase in the supernatant fraction with increasing total protein concentration likely stems from kinetic limitations and inherent technical constraints of the sedimentation assay, rather than a genuine deviation from classical phase separation behavior. These caveats are now explicitly clarified in the Methods section, with similar limitations of centrifugation-based assays for defining equilibrium phase behavior of biomolecular condensates reported previously.
(b) Figure 4: The NMR comparisons appear to be primarily qualitative, lacking quantitative analyses such as chemical shift perturbation (CSP) and intensity ratio plots, which would offer deeper mechanistic insights. The NMR spectra detailing interactions among the IDR domains need to be quantified.
We thank the reviewer for the suggestion. We have now performed quantitative CSP analyses for the NMR data shown in Fig. 4, and the corresponding CSP plots have been added to the revised manuscript (Fig. S7).
As expected for interactions mediated by intrinsically disordered regions involved in phase separation, the observed CSPs are generally small. Notably, the CSP profile of IDRa closely matches that observed for the full-length IDR, whereas IDRb and IDRc show minimal perturbations. These results indicate that the interaction is primarily mediated by IDRa, with little contribution from the remaining regions.
Peak intensity analyses were also examined but did not reveal additional residue-specific trends. Together, the quantitative CSP data support our conclusion that the interaction is weak, dynamic, and region-specific, consistent with an IDR-driven, phase-separation-related mechanism. We add this statement in method: CSPs were calculated in Hz at 600 MHz using the following equation:

Minor comments:
(1) Line 59-60: The Authors mention the HUSH-complex and then the MORC protein family, but do not discuss the relation between the two.
We thank the reviewer for this comment. We have revised the Introduction to explicitly state that MORC2 may serve as a component of the HUSH complex and to clarify the functional relationship between MORC family proteins and HUSH-mediated transcriptional repression.
(2) Line 74: 'Despite their structural similarities...', similarities between what all?
We agree that this statement was ambiguous. We have revised the text to explicitly specify that the comparison refers to structural similarities among MORC family members.
(3) Line 75: 'MORC-mediated repression remains...', this is the first time the word 'repression' is mentioned in the text and directly as an outstanding question.
We have revised the Introduction to introduce the concept of transcriptional repression earlier and to provide appropriate context before posing it as an outstanding question.
(4) The third paragraph does address issues in comments 1 and 3 to some extent, but the introduction needs some restructuring to provide a proper flow of information.
We agree that the Introduction required restructuring. We have revised this section to improve logical flow, better integrate prior studies, and more clearly articulate the motivation and scope of the present work.
(5) Line 83-85: How does the presence of IDRs suggest potential regulatory mechanisms?
We have revised this sentence to clarify that IDRs may contribute to regulatory mechanisms by enabling multivalent and dynamic interactions, rather than implying that IDRs inherently confer regulatory function or phase separation capability.
(6) Line 106-107: 'To determine whether MORC2 has N- and C-terminal dimerization interfaces similar to those...', reference 14 has already established that CC3 (denoted as CC4 in ref 14) is responsible for dimerization. Consider acknowledging their work in this regard?
We thank the reviewer for this reminder. We have now explicitly acknowledged Ref. 14, which previously established the role of CC3 (denoted CC4 in that study) in MORC2 dimerization.
(7) Lines 117-122: Are the authors comparing morphology from negative stain EM with AlphaFold predicted structure (Figure S1a and S1b)? If so, providing a zoomed-in inset from Figure S1a would be helpful.
Yes, the comparison was intended to relate the negative-stain EM morphology to the AlphaFold-predicted architecture. We have added a zoomed-in inset in Fig. S1a to facilitate clearer comparison.
(8) Line 152-153: '...even under varying physiological conditions', what are these varying conditions? Are the authors trying to point towards any of their specific results?
We have revised this phrase to explicitly refer to variations in salt concentration and protein concentration tested in our in vitro assays.
(9) Line 154-155: 'The dimeric assembly of CC3 is essential for maintaining the structural integrity of the protein', if it has been established, then please provide a reference.
We thank the reviewer for this suggestion. For MORC family proteins, C-terminal coiled-coil–mediated dimerization is necessary for correct homodimer formation and functional stability (Xie et al., 2019, Cell Commun Signal. 17:160, Ref 14 in the revised manuscript).
(10) Line 159-161: 'we noticed a long unstructured region at its C-terminus (Figure S1b), a characteristic often associated with proteins capable of phase separation25.', again authors are generalizing a statement which is, in most cases, context-dependent. For example, ref 25 mentions that unstructured regions or IDRs serve as a scaffold for multivalent interactions.
We agree with the reviewer and have revised this sentence to avoid generalization. The revised text now emphasizes that IDRs may facilitate multivalent interactions in a context-dependent manner, rather than being intrinsically indicative of phase separation. Additionally, we have explicitly cited the mechanistic insight from Reference 25 that IDRs serve as scaffolds for multivalent interactions, to strengthen the logical link between the structural feature and its potential functional relevance.
(11) Methods section for NMR (Line 665-667) mentions that nucleotides were added to a final concentration of 10 mM. There is no figure or section for MORC2 NMR with added nucleotides/DNA.
We thank the reviewer for pointing this out. The nucleotide (ATP) addition was part of preliminary NMR trials and is not directly associated with the figures presented. We have deleted this in the Methods section to avoid confusion.
(12) Line 285-294: Authors compare the effect of DNA binding on the phase separation of both MORC2FL and MORC2 CTDdeltaCW and conclude that DNA-induced condensation is primarily mediated through interactions with the IDR-NLS region. This appears not to be backed by proper control experiments. The authors do not show whether DNA binding mediates any phase separation for the isolated NTD or not? Similarly, what is the effect of DNA binding on MORC2 deltaIDR?
We thank the reviewer for this insightful comment and agree that additional controls are essential for rigorously dissecting the contribution of DNA binding to MORC2 phase separation. Our interpretation that DNA-enhanced condensation is primarily mediated through the IDR–NLS region was based on comparative analyses of MORC2FL and MORC2 CTDΔCW, together with EMSA results demonstrating that DNA binding activity is conferred by the IDR–NLS–containing region. We acknowledge, however, that DNA binding alone is not sufficient to infer phase separation behavior.
To address this point, we have performed additional analyses using the isolated NTD’ (residues 1–536) and MORC2 ΔIDR–NLS mutants (Fig. S6). The isolated NTD’ exhibited detectable DNA binding [4] but did not undergo DNA-induced condensation under conditions while MORC2FL or MORC2 CTDΔCW (residues 537-1032) readily formed condensates, indicating that DNA binding by itself is insufficient to drive phase separation. In parallel, MORC2 ΔIDR–NLS mutants showed severely compromised solubility and stability in vitro, which limited their quantitative characterization in phase separation assays. Nevertheless, under the conditions tested, these mutants did not display DNA-enhanced condensation comparable to MORC2FL.
Taken together, these observations support a model in which the IDR–NLS region plays a critical role in coupling DNA binding to condensation, while additional domains are required to sustain robust phase separation. We have revised the manuscript text to clarify the experimental scope and to avoid overinterpreting the contribution of DNA binding in the absence of fully reconstituted control systems.
(13) How did the authors assign the backbone amide NMR chemical shifts for MORC2?
Backbone assignments of MORC2 IBD (1004-1032) were obtained using SOFAST versions of standard triple-resonance experiments, including HNCACB and CBCACONH, recorded at 298 K. Residual assignment ambiguities were resolved using [15] N-edited HMQC-NOESY-HMQC spectra.
(14) Line 256: 'The partial compaction of IDRa...', what does the author mean here with 'partial compaction'? How did they measure compaction here?
Regarding the term “partial compaction” mentioned previously, we apologize for the typographical error this phrase was erroneously used in place of “key component”.
(15) Line 312-315: Why is there even a MORC2 readout for MORC2 KO cells with only EGFP? Also, the authors suggest that IDR deletion may impair mRNA stability or transcription; however, the expression levels of MORC2 deltaIDR and MORC2 deltaCC3 do not appear drastically different in Figure 3a.
We thank the reviewer for raising these points. The apparent MORC2 signal in MORC2 knockout cells transfected with EGFP alone is due to the presence of residual MORC2 mRNA. Although CRISPR–Cas9–mediated knockout introduces a frameshift that prevents MORC2 protein expression, the mRNA can still be detected by RNA-seq. This is because nonsense-mediated decay (NMD), which targets transcripts with premature stop codons for degradation, is not always 100% efficient. Therefore, some MORC2 transcripts remain and produce detectable RNA-seq reads, even though no functional protein is expressed.
Regarding the apparent discrepancy in expression levels, Fig. 3a displays only EGFP-positive cells, within which the fluorescence intensity of MORC2ΔIDR and MORC2ΔCC3 appears comparable to that of WT MORC2. However, the overall fraction of EGFP-positive cells is markedly reduced for these mutants compared to WT. Thus, while expression levels among successfully transfected cells are similar, fewer cells express detectable levels of the ΔIDR or ΔCC3 constructs across the total population. We therefore interpret this reduction in EGFP-positive cell fraction as reflecting impaired expression efficiency of these mutants, potentially arising from altered transcriptional output, mRNA stability, or protein stability. We have revised the manuscript text to clarify this distinction and to avoid overinterpreting the underlying mechanism in the absence of direct measurements.
Author response image 1.
EGFP, EGFP–MORC2 (FL), EGFP–MORC2 (ΔCC3), and EGFP–MORC2 (ΔIDR) were re-expressed in MORC2-knockout HeLa cells. Confocal imaging revealed that full-length MORC2 formed condensates in the nucleus, whereas mutants lacking either the CC3 or IDR domain failed to exhibit such behavior. Notably, under identical experimental conditions, we observed a marked reduction in the transfection efficiency of the EGFP-MORC2 (ΔIDR) construct. In contrast to the other variants, EGFP signals for ΔIDR were detectable in only a small fraction of the total cell population, despite consistent DNA loading and protocol synchronization. This observation suggests that the IDR might be required not only for biomolecular condensation but also for maintaining the steady-state levels of the MORC2 mRNA/protein or overall cellular fitness.
(16) Line 330: 'MORC2 deltaCC3 failed to repress any of the 18 downregulated targets...'. This does not appear to be entirely true as repression of some targets (LBH, TGFB2, GADD45A) are closer to MORC2 FL than the EGFP control.
We thank the reviewer for pointing out this inconsistency and for highlighting the need for precise wording. We have updated the dataset and revised the text to describe the results more accurately. We now describe that the mutants impair MORC2FL-mediated transcriptional regulation, consistent with the overall trend observed across these target genes.
(17) Line 347-350: Based on the percent of cells with condensates, the authors conclude that CMT2Z-linked E236G and SMA-linked T424R mutants promote MORC2 phase separation. Again, the effect of these mutations on MORC2 condensation in cells may be direct or indirect. This can be investigated by comparing the in vitro effect of these mutations on MORC2 phase separation.
We thank the reviewer for raising this important point and fully agree that the effects of disease-associated MORC2 mutations on condensate formation in cells may arise from either direct alteration in intrinsic phase separation propensity or indirect influences mediated by the cellular environment.
In our study, disease-associated MORC2 mutants were assessed for condensate formation in HEK293F cells. Attempts were made to characterize these mutants in vitro; however, the E236G mutant exhibited markedly reduced solubility and stability upon purification, which precluded reliable in vitro phase separation analysis. We therefore evaluated the impact of E236G in cells and found that this mutation significantly impaired the dynamics of nuclear MORC2 condensates. For the T424R mutant, we note that its intracellular condensates displayed FRAP recovery kinetics comparable to those of WT MORC2, suggesting broadly similar dynamic properties of the assemblies formed in cells, but not necessarily implying a direct enhancement of intrinsic phase separation.
In light of these considerations, we have revised the text in Lines 347–350 to avoid attributing a direct causal role of these mutations in promoting MORC2 phase separation. Instead, we now describe the observed increase in the fraction of cells containing condensates as a descriptive cellular correlation. We further emphasize that systematic in vitro characterization of disease-associated MORC2 mutants will be required to distinguish direct from indirect effects and represents an important direction for future investigation.
(18) The discussion section lacks referencing to individual figures in the results section as well as previous literature.
We agree with the reviewer that the Discussion would benefit from clearer integration with both the Results figures and prior literature. In the revised manuscript, we have substantially restructured the Discussion to explicitly reference key figures when interpreting experimental findings and to more clearly distinguish conclusions drawn from specific datasets. In addition, we have expanded citations to previous studies where relevant, particularly in the context of MORC2 DNA binding, ATPase regulation, chromatin association, and disease-linked mutations. These revisions aim to better situate our findings within the existing literature and to guide readers more clearly between experimental observations and their interpretation.
Reviewer #3 (Public review):
Summary:
The manuscript by Zhang et al. demonstrates that MORC2 undergoes liquid-liquid phase separation (LLPS) to form nuclear condensates critical for transcriptional repression. Using a combination of in vitro LLPS assays, cellular studies, NMR spectroscopy, and crystallography, the authors show that a dimeric scaffold formed by CC3 drives phase separation, while multivalent interactions between an intrinsically disordered region (IDR) and a newly defined IDR-binding domain (IBD) further promote condensate formation. Notably, LLPS enhances MORC2 ATPase activity in a DNA-dependent manner and contributes to transcriptional regulation, establishing a functional link between phase separation, DNA binding, and transcriptional control. Overall, the manuscript is well-organized and logically structured, offering mechanistic insights into MORC2 function, and most conclusions are supported by the presented data. Nevertheless, some of the claims are not sufficiently supported by the current data and would benefit from additional evidence to strengthen the conclusions.
Thank you for your insightful review and constructive suggestions, which have been invaluable in refining our manuscript.
The following suggestions may help strengthen the manuscript:
Major comments:
(1) The central model proposes that multivalent interactions between the IDR and IBD promote MORC2 LLPS. However, the characterization of these interactions is currently limited. It is recommended that the authors perform more systematic analyses to investigate the contribution of these interactions to LLPS, for example, by in vitro assays assessing how the IDR or IBD individually influence MORC2 phase separation.
We appreciate the reviewer’s insightful comment regarding the characterization of IDR–IBD interactions. In this study, we combined NMR spectroscopy, domain deletion analysis (in vivo), and in vitro phase separation assays to demonstrate that interactions between the IDR and IBD contribute to MORC2 condensate formation. To systematically assess the individual contributions of the IDR and IBD to MORC2 phase separation, we performed in vitro reconstitution assays using purified domain constructs (Fig. S6). Neither the isolated IDR nor the IBD alone exhibited phase separation under buffer conditions approximating the physiological environment, indicating that each domain is individually insufficient to drive condensation. Upon the addition of 10% PEG8000, phase separation was selectively observed for the IDR but not for the IBD, suggesting that the IDR possesses an intrinsic propensity for phase separation that can be enhanced by crowding molecular. Importantly, when the IDR and IBD were mixed, phase separation was robustly induced, supporting a model in which cooperative inter-domain interactions between the IDR and IBD promote MORC2 condensation. In the absence of PEG, no phase separation was observed for the IDR–IBD mixture. These observations imply that IDR–IBD interactions cannot drive phase separation on their own, but require cooperation with CC3-mediated dimerization to achieve this process, which is the central point we wish to emphasize.
(2) The authors mention that DNA binding can promote MORC2 LLPS. It is recommended that they generate a phase diagram to systematically assess how DNA influences phase separation.
We agree that constructing a full phase diagram would provide a more systematic evaluation of the effect of DNA on MORC2 phase separation. In the current study, we assessed DNA-dependent condensation across multiple protein and DNA concentrations, which consistently showed that DNA enhances MORC2 phase separation. At low protein concentration (0.5 µM), phase separation requires sufficient DNA, whereas increasing either DNA or protein concentration promotes liquid droplet formation. At high DNA and protein concentrations, amorphous structures dominate, indicating a transition away from dynamic assemblies. We have clarified this point in the Results and Discussion sections and now note that a comprehensive phase diagram analysis represents an important direction for future work.
(3) The authors use the N39A mutant as a negative control to study the effect of DNA binding on ATP hydrolysis. Given that N39A is defective in DNA binding, it could also be employed to directly test whether DNA binding influences MORC2 phase separation.
We thank you for your constructive suggestions. The purified wild-type MORC2(1–603) exhibited weak but detectable ATPase activity, whereas the N39A mutant was completely inactive [5]. Based on this characteristic, the N39A mutant was used as a negative control for the ATP-binding-deficient mutant in this study [3]. However, no evidence has been provided to demonstrate that the N39A mutant is defective in DNA binding. Importantly, both our results and previous studies [5-6] indicate that MORC2 engages DNA via multiple domains, suggesting that a single-point mutation is unlikely to significantly compromise its overall DNA-binding capacity.
(4) Many of the cellular and in vitro LLPS experiments employ EGFP fusions. The authors should evaluate whether the EGFP tag influences MORC2 phase separation behavior.
We appreciate the reviewer’s concern regarding the potential influence of the EGFP tag. The use of EGFP fusions in our study was primarily to maintain consistency with the in-cell experiments. Importantly, we confirmed that EGFP alone does not undergo phase separation in cells, and this observation is consistent with previous studies [7]. Additionally, in vitro phase separation of MORC2 was independently validated using Cy3–labeled CTD (Fig. S5), which recapitulated the condensate formation seen with EGFP-fused protein. Together, these results indicate that the EGFP tag does not significantly influence MORC2 phase separation, supporting the validity of our conclusions.
Reviewer #3 (Recommendations for the authors):
(1) The authors claim to have obtained nucleic acid-free protein, but no data are provided to support this assertion. It is recommended that they include appropriate validation to confirm the absence of nucleic acids.
We thank the reviewer for highlighting this point. To validate that the purified MORC2 protein is indeed free of nucleic acid contamination, we have additional experimental evidence (e.g., A260/280 measurements, agarose gel analysis, or EMSA in Fig. 5), which has been added to the Methods section and Table S2.
Note: Agarose gel analysis for MORC2 constructs to confirm the absence of nucleic acids. The pET32 vector as the positive control, the protein preparation for analysis is 0.05 mg. E means E. coli and H means HEK293F.
(2) The FRAP recovery curves are not normalized to 0, making comparison difficult. The authors should normalize the post-bleach intensity to 0 and re-plot the curves to allow a more standard interpretation of mobile fractions.
We agree with the reviewer and have now normalized the FRAP recovery curves by setting the post-bleach intensity to 0. The revised plots are presented in the Figures (2f, j, l; 6c, 7f), allowing for more direct comparison of mobile fractions across different conditions.
(3) The HSQC spectra for IBD appear inconsistent: the peak positions in Fig. 4C do not align with those shown in panels D-F. The authors should verify the spectral assignments and ensure consistency across figures.
We thank the reviewer for pointing this out. The apparent inconsistency arose from the fact that different spectral regions were displayed in Fig. 4c versus Fig. 4d-f for visualization purposes, which may have given the impression of mismatched peak positions. The spectral assignments themselves are consistent across all panels.
To avoid confusion, we have now adjusted the spectral window shown in Fig. 4c to match that used in Fig. 4d-f. The revised figure ensures consistent presentation of the same spectral region across all panels.
Reference:
(1) Zhang, Y., Stöppelkamp, I., Fernandez-Pernas, P. et al. Probing condensate microenvironments with a micropeptide killswitch. Nature 643, 1107–1116 (2025).
(2) Fendler NL, Ly J, Welp L, et al. Identification and characterization of a human MORC2 DNA binding region that is required for gene silencing. Nucleic Acids Res.53(4):gkae1273 (2025).
(3) Tchasovnikarova, I., Timms, R., Douse, C. et al. Hyperactivation of HUSH complex function by Charcot–Marie–Tooth disease mutation in MORC2. Nat Genet 49, 1035–1044 (2017).
(4) Douse, C. H. et al. Neuropathic MORC2 mutations perturb GHKL ATPase dimerization dynamics and epigenetic silencing by multiple structural mechanisms. Nat Commun 9, 651 (2018).
(5) Tan, W., Park, J., Venugopal, H. et al. MORC2 is a phosphorylation-dependent DNA compaction machine. Nat Commun 16, 5606 (2025).
(6) Sánchez-Solana B, Li DQ, Kumar R. Cytosolic functions of MORC2 in lipogenesis and adipogenesis. Biochim Biophys Acta. 1843(2):316-326 (2014).
(7) Li, C.H., Coffey, E.L., Dall’Agnese, A. et al. MeCP2 links heterochromatin condensates and neurodevelopmental disease. Nature 586, 440–444 (2020).
Open Access and Fair Principles ccafs.cgiar.org
💻/thinkpad/🧊/me/📓/2026/04/28
personal.web.archiv-hypothes.is~faceted.search-gyuri-open+interoperable

AbstractBackground Downloading and reanalyzing the existing single-cell RNA sequencing (scRNA-seq) data provides an efficient choice to gain clues and new insights. However, no tool can fetch the diverse scRNA-seq data types (raw data, count matrix, and processed object) distributed in various repositories, process and load the downloaded data to R, convert formats between scRNA-seq objects, and benchmark the format conversion tools.Findings Here, we present GEfetch2R, an R package with Docker image to (i) download diverse scRNA-seq data types, including raw data (SRA and ENA), count matrices (GEO, UCSC Cell Browser, and PanglaoDB), and processed objects (Zenodo, CELLxGENE, and HCA); (ii) process the downloaded data, load output/downloaded count matrices and annotations to R (SeuratObject/DESeqDataSet), filter the SeuratObject based on cell metadata and genes, and merge multiple SeuratObjects if applicable; (iii) convert formats between the widely used scRNA-seq objects, including SeuratObject, AnnData, SingleCellExperiment, CellDataSet/cell_data_set, and loom, and benchmark format conversion tools in terms of information kept, usability, running time, and scalability to guide the tool selection. Furthermore, GEfetch2R can also download, process, and load bulk RNA-seq raw data (SRA and ENA) and count matrices (GEO) to R (DESeqDataSet).Conclusions GEfetch2R is an R package dedicated to facilitating researchers to access and explore the existing gene expression data from various public repositories. It can function as a data downloader (supports all three scRNA-seq and two bulk RNA-seq data types), a data processor (processes and loads the output/downloaded count matrices and annotations to R), and an object format converter (between the widely used scRNA-seq objects).
This work has been peer reviewed in GigaScience (see https://doi.org/10.1093/gigascience/giag039), which carries out open, named peer-review. These reviews are published under a CC-BY 4.0 license and were as follows:
Reviewer 2:
General Comments This manuscript introduces a tool named HVRLocator, designed to address the issue of missing or non-standard metadata in 16S rRNA sequencing data found in public databases such as the SRA. The tool identifies amplicon regions by aligning sequences to a reference genome and attempts to detect the presence of primers using a machine learning model. This is a subject with significant practical value, particularly for conducting large-scale meta-analyses. However, there are still many issues regarding methodological rigor, the depth of validation, and comparisons with existing tools that require further clarification by the authors. Major Comments 1. Concerns regarding the singularity of the reference sequence The authors mention aligning sequences to a single Escherichia coli (J01859.1) reference genome to determine start and end positions. Is a single E. coli reference sufficient to cover Archaea or bacterial phyla that are distantly related to Proteobacteria, which may be present in environmental samples (e.g., soil, ocean)? For taxa with significant length variations or insertions/deletions (Indels), could forced alignment to the E. coli reference lead to misjudgment of start/end positions? Have the authors evaluated the impact on accuracy if a more universal reference database (such as representative sequences from SILVA or Greengenes) were used? 2. Rationality of the primer detection model (Random Forest based on Quality Scores) The authors developed a Random Forest model to predict primer presence by analyzing the quality score distribution of the first 1,000 reads. Primer detection is typically based on the sequence itself rather than quality scores. Can the authors explain why quality scores were chosen as features? Sequencing quality scores are influenced by technical factors such as sequencer status, reagent batches, and run cycles, which have no direct biological correlation with the presence of primers. Is there a risk that this model is "overfitting" specific sequencing platforms or datasets? Since the reads are already downloaded, why not directly use degenerate primer sequence matching (e.g., using Cutadapt or SeqKit logic) to determine primer presence? This seems to be a more direct and accurate method. 3. Verification of accuracy claims In the validation section, the authors claim to achieve 100% accuracy on certain datasets. In bioinformatics tool development, a claim of 100% accuracy is often a red flag. Have the authors manually checked those samples marked as "correct" by the model that might suffer from edge effects or borderline cases? 4. Dataset imbalance in the Random Forest model For the Random Forest model, the authors used 882 samples with primers and 8,940 samples without primers for training. Such an extremely imbalanced dataset, even with stratified sampling, may cause the model to be biased towards the majority class. 5. Comparison with existing tools The manuscript mentions that no tool has been designed for this specific purpose, but this may overlook some existing general-purpose tools or scripts. Many pipelines (such as certain plugins in QIIME 2, USEARCH, etc.) possess functionalities to identify primers or evaluate amplicon regions. The authors should discuss how their tool compares to these existing workflows. Minor Comments 1. Confusion regarding processing speed metrics The abstract mentions a processing speed of "0.147 samples per minute", but later the text mentions "6.5 samples per minute" and "one sample every 0.147 minutes". There is confusion regarding units and values in these three descriptions (is it samples per minute or minutes per sample?). Please unify and correct these data to ensure consistency. 2. Usage of fastq-dump The use of fastq-dump is mentioned. The SRA Toolkit's fastq-dump is relatively slow and has largely been superseded by fasterq-dump for efficiency. Why did the authors not use the more efficient fasterq-dump? 3. Definition of "Standardized metadata" The term "standardized metadata" is used frequently. Please explicitly define what constitutes "standard" metadata in the context of this tool within the text. 4. Robustness and error handling The results section mentions that some samples failed due to "NCBI portal-related issues". Does this imply the tool lacks breakpoint resumption or retry mechanisms? Given that network fluctuations are common during large-scale downloads, how is the tool's robustness demonstrated? 5. Output confidence intervals The output file contains "TRUE/FALSE" and a probability score. For samples where the probability score is at a critical threshold (e.g., around 0.5), does the tool provide an "uncertain" tag, or does it force a classification? It is suggested to add an indicator for ambiguous ranges.
AbstractBackground Amplicon sequencing of the 16S rRNA gene is widely used to assess microbial diversity due to its cost-effectiveness and efficiency. However, public 16S rRNA datasets often lack standardized metadata, particularly information on the sequenced hypervariable regions or primers used, which are critical for accurate analysis and data reuse. To address this, we present the HVRLocator, a computational tool that reliably identifies sequenced hypervariable regions, enhancing metadata quality and enabling more robust large-scale microbiome studies.Results The HVRLocator tool processed samples at an average rate of 0.147 per minute. Validation confirmed 100% accuracy in predicting alignment positions, correctly matching sequences to the expected primer regions based on literature. We demonstrated how to use the tool to select appropriate and comparable sequences for building a global bacterial database from V4 region amplicons of the 16S rRNA gene. Using HVRLocator, we selected 36,217 valid samples out of 45,882 runs, enabling us to identify cases where metadata incorrectly labeled sequences as targeting the V4 region.Conclusion Even when metadata is available, it can be inaccurate or misleading. HVRLocator offers a reliable and efficient method to identify the exact hypervariable sequenced region, ensuring accurate processing of large-scale 16S rRNA amplicon data. By bypassing inconsistent metadata and literature, it streamlines data curation and enhances the reliability of microbial studies, syntheses, and meta-analyses. Its use is essential for critically evaluating published data and enabling accurate and reproducible research in microbial ecology.
This work has been peer reviewed in GigaScience (see https://doi.org/10.1093/gigascience/giag040), which carries out open, named peer-review. These reviews are published under a CC-BY 4.0 license and were as follows:
Reviewer 2:
General Comments This manuscript introduces a tool named HVRLocator, designed to address the issue of missing or non-standard metadata in 16S rRNA sequencing data found in public databases such as the SRA. The tool identifies amplicon regions by aligning sequences to a reference genome and attempts to detect the presence of primers using a machine learning model. This is a subject with significant practical value, particularly for conducting large-scale meta-analyses. However, there are still many issues regarding methodological rigor, the depth of validation, and comparisons with existing tools that require further clarification by the authors. Major Comments 1. Concerns regarding the singularity of the reference sequence The authors mention aligning sequences to a single Escherichia coli (J01859.1) reference genome to determine start and end positions. Is a single E. coli reference sufficient to cover Archaea or bacterial phyla that are distantly related to Proteobacteria, which may be present in environmental samples (e.g., soil, ocean)? For taxa with significant length variations or insertions/deletions (Indels), could forced alignment to the E. coli reference lead to misjudgment of start/end positions? Have the authors evaluated the impact on accuracy if a more universal reference database (such as representative sequences from SILVA or Greengenes) were used? 2. Rationality of the primer detection model (Random Forest based on Quality Scores) The authors developed a Random Forest model to predict primer presence by analyzing the quality score distribution of the first 1,000 reads. Primer detection is typically based on the sequence itself rather than quality scores. Can the authors explain why quality scores were chosen as features? Sequencing quality scores are influenced by technical factors such as sequencer status, reagent batches, and run cycles, which have no direct biological correlation with the presence of primers. Is there a risk that this model is "overfitting" specific sequencing platforms or datasets? Since the reads are already downloaded, why not directly use degenerate primer sequence matching (e.g., using Cutadapt or SeqKit logic) to determine primer presence? This seems to be a more direct and accurate method. 3. Verification of accuracy claims In the validation section, the authors claim to achieve 100% accuracy on certain datasets. In bioinformatics tool development, a claim of 100% accuracy is often a red flag. Have the authors manually checked those samples marked as "correct" by the model that might suffer from edge effects or borderline cases? 4. Dataset imbalance in the Random Forest model For the Random Forest model, the authors used 882 samples with primers and 8,940 samples without primers for training. Such an extremely imbalanced dataset, even with stratified sampling, may cause the model to be biased towards the majority class. 5. Comparison with existing tools The manuscript mentions that no tool has been designed for this specific purpose, but this may overlook some existing general-purpose tools or scripts. Many pipelines (such as certain plugins in QIIME 2, USEARCH, etc.) possess functionalities to identify primers or evaluate amplicon regions. The authors should discuss how their tool compares to these existing workflows. Minor Comments 1. Confusion regarding processing speed metrics The abstract mentions a processing speed of "0.147 samples per minute", but later the text mentions "6.5 samples per minute" and "one sample every 0.147 minutes". There is confusion regarding units and values in these three descriptions (is it samples per minute or minutes per sample?). Please unify and correct these data to ensure consistency. 2. Usage of fastq-dump The use of fastq-dump is mentioned. The SRA Toolkit's fastq-dump is relatively slow and has largely been superseded by fasterq-dump for efficiency. Why did the authors not use the more efficient fasterq-dump? 3. Definition of "Standardized metadata" The term "standardized metadata" is used frequently. Please explicitly define what constitutes "standard" metadata in the context of this tool within the text. 4. Robustness and error handling The results section mentions that some samples failed due to "NCBI portal-related issues". Does this imply the tool lacks breakpoint resumption or retry mechanisms? Given that network fluctuations are common during large-scale downloads, how is the tool's robustness demonstrated? 5. Output confidence intervals The output file contains "TRUE/FALSE" and a probability score. For samples where the probability score is at a critical threshold (e.g., around 0.5), does the tool provide an "uncertain" tag, or does it force a classification? It is suggested to add an indicator for ambiguous ranges.
AB_3720449
DOI: 10.1111/bph.70443
Resource: RRID:AB_3720449
Curator: @scibot
SciCrunch record: RRID:AB_3720449
On 2026-04-09 21:38:21, user Alizée Malnoë wrote:
The manuscript by Fridman et al. explores the unexpected finding that Aeromonas jandaei antagonistically employs a Type VI secretion system (T6SS) in a liquid environment. While researching the effector protein Awe1, which forms part of the T6SS apparatus, the authors observed T6SS-dependent intoxication of susceptible bacteria. Using a novel fluorescence-based screening method (named LiQuoR for liquid quantification of rivalry), the authors further determine that this intoxication is contact-dependent, and that contact between kin and non-kin Aeromonas bacteria in liquid is mediated by specific adhesins. Fridman et al. also identify additional marine bacteria capable of inflicting T6SS-mediated intoxication in liquid media, suggesting a mechanism for specific and contact-dependent bacterial competition and positing that such competition in liquid media may be more common in marine bacteria than previously documented. These findings have exciting implications for bacterial antagonism, potentially shifting the paradigm of how we view bacterial interactions in marine environments. We found this study to be well-written, containing high-quality data. Overall, the data presented in this manuscript are done well and support the claims made by the authors. We outline some major and minor adjustments aimed at aiding the clarity of reporting and presentation, strengthening the findings, as well as providing additional context for a broader audience.
Major Comments<br /> - We are interested in the broader implications of the LiQuoR assay, particularly pertaining to this workflow’s application to different bacteria. The observation that the amount of prey luminescence in WT on solid media grew/increased after 4 h seemed counterintuitive to us (Figure 1E). It seems as if this result could make the workflow less sensitive for experiments done solely on solid media, further explanation of this finding would clarify on the workflows applicability to other solid surface experiments. Is this related to surface area? While this does not change the findings that inhibition is occurring in both liquid and in solid, it would enhance the clarity of these results to provide speculation on why this was seen.<br /> - We are curious about your perspective on the observation that kin-kin aggregation facilitated by CaCl2 supplementation does not increase kin intoxication but does increase non-kin intoxication (Figure 2A). Please speculate on this result in the discussion. Is the concentration used physiological? <br /> - While the images shown in Figure 2B make it clear that aggregates are forming in liquid media, we have a suggestion to improve the strength of these results and account for the images not shown. For instance, quantification of the % of prey cells displaying Sytox staining would more strongly demonstrate the presence of permeabilized E. coli in multiple aggregates. This quantification could substitute Figure 2C (which can be moved into the supplemental): it was not totally clear to us why an orthogonal view was included here. If this is significant for the findings, it would increase clarity to include an explanation for an audience less familiar with this system.<br /> -Lines 192-214: From a genomics perspective, we think further explaining how potential adhesins were identified would be helpful to increase the clarity and reproducibility of the experimental design. Please explain how you narrowed down these adhesins and located them in the genome, and why adhesins were targeted for this analysis over other proteins that could facilitate a physical interaction between predator and prey species. Define the acronyms and provide rationale for naming. <br /> -Figure 6B nicely demonstrates that intoxication takes place in liquid between certain marine bacteria but not in Vpara. However, please include a control showing that V. para does intoxicate prey in solid media to strengthen these findings and confirm that this strain of V. para is capable of intoxicating prey under typical conditions.<br /> -Given the significance of the TssB deletion for the core message of this work that type VI intoxication occurs in liquid media, please consider including data that confirm the TssB deletion e.g. sanger sequencing in supplemental or as source data. A complementation assay of TssB to show that regaining TssB restores the awe1 toxicity would be valuable.<br /> - Lines 224-225/Figure 5: We are curious and excited about the implications of the balance between kin-aggregation and non-kin aggregation and how this may aid our understanding of bacterial interactions in marine environments. Based on our understanding of these results, the observation that deletion of CraAj (responsible for kin-kin aggregation) increased non-kin intoxication (mediated by LapAj) could suggest that aggregation between two kin cells, who both contain the needed immunity proteins, could dampen the intoxication of nearby non-kin cells. This result is implied by the data but not specifically speculated on or addressed. Though it may not be within the scope of this experimental design, our group was intrigued by these findings. Given your expertise in this area, consider discussing how these bacterial interactions may play out and/or include these observations as part of Figure 5.
Minor Comments<br /> -All figures: In the legends, it is stated “these experiments were repeated three times with similar results”. Please define what is meant by an experiment e.g. technical or biological replicate.<br /> -All figures: We felt that having the exact p-values indicating statistical significance is not necessary. For instance, in Figure 3B and 3D, we found it distracting that all of the values were significant by a factor of <1E-4, even when they appear different from each other. If this is simply a cutoff value, it would be helpful to keep that consistent between figures. Also, Figure 6A/B: The p-values presented, specifically the comparison between WT and T6SS – supplemented with 1 mM CaCl2 (6A) and the two left hand panels of 6B, do not appear to match the differences shown between the experimental groups. By eye, these groups do not appear different from one another but are shown to be either highly statistically significant or not statistically significant at all.<br /> - Figure 1A: To increase readability, we suggest that the colors could be more intuitive here- put WT in grey and then mix colors for double mutants. Bringing the light pink line (Δawei1 ΔtssB + pAwe1) to the front of the graph would further increase clarity.<br /> -Figure 1B/F: Making color scheme consistent between 1B and 1F would increase clarity.<br /> -LiQuoR assay: As there is often some level of variation in expression levels when working with a transformed population, confirmation that all prey strains luminesce to a similar level would provide further validation of this novel assay (similarly to what is done in FigS3B). <br /> -Figure 2A: The colored box legends showing whether CaCl2 is present or absent are inverted relative to one another, which we found to be confusing. To increase readability, please make them on the same side.<br /> -Figure 3B,C,D,E: To help guide the eye on the graphs, we suggest adding dashed lines between each new mutation group (+/- TssB).<br /> - Figure S1: Please include a loading control to verify assay input. <br /> - Table S1: Clarify the gene and strain for each mutation.<br /> - Line 112-113: It serves as an excellent control that the action of the T6SS apparatus is required for intoxication, however, since the T6SS apparatus is contained within the bacterium, would spent media contain free-floating T6SS proteins, or are these proteins only ejected from the bacterium in the presence of prey species? Please clarify. Direct evidence, such as immunoblotting, that effectors are present in the spent media from WT would make this claim more compelling.<br /> - Line 35: While this part of the introduction provides excellent background regarding the role of T6SS in interactions with eukaryotic cells, it would be helpful to also specifically mention the role of T6SS in prokaryotic communities, as much of the later work focuses on competition between bacteria.<br /> -Lines 70-71: A more thorough background on Aeromonas (lifestyle, importance, etc) is warranted.<br /> -Line 84: Please provide the exact genotype when first introducing this mutant, it would improve clarity for the reader to explicitly state that this is a double mutant.<br /> -Line 97: Clarify here that “Aj prey” in this paragraph refers to Aj which do not possess the cognate immunity protein, as the current phrasing could be interpreted to mean “prey of Aj”.<br /> -Line 138: “Desired conditions for competition” is vague. Is solid media also incubated with shaking or is it static?<br /> -Lines 156-157: The statement that all three effectors are injected into prey cells is broad and not necessarily supported within these findings. The injection of one effector could be favored, but other effectors could compensate in its absence.<br /> -Line 189: Describes Aj as stably binding to other competing bacteria. To this point, imaged aggregates have been fixed so stability of aggregates may not be known.<br /> -Line 248: Here, it is mentioned that there was a switch from using the Lux operon to using the RFP mCherry for improved cell detection. It might be helpful to clarify which fluorescent tag was used for each assay, as multiple different fluorescent tags are used.<br /> -Line 317: As the choice to test CaCl2 and the biological relevance of calcium for Aeromonas hosts is explained earlier in the manuscript, it would be interesting to include a brief explanation about the choice to include sodium chloride when assessing Vibrio intoxication rates. Presumably, sodium chloride was picked because Vibrio is commonly found in brackish water, but someone from outside the field may not be familiar with this biology. Additionally, since Aeromonas can be found in both fresh and brackish water, an interesting follow-up experiment would be to test the Aeromonas strains under different salinities.<br /> -Line 375-377: Needs citation.<br /> -Line 385: Clarify “under specific conditions not addressed within the scope of this study”.
Carter Collins and Lily Pumphrey (Indiana University Bloomington) - not prompted by a journal; this review was written within a Peer Review in Life Sciences graduate course led by Alizée Malnoë with input from group discussion including Camy Guenther, Josy Joseph and Tahreem Zaheer. We are part of the Dept. of Biology where Julia Van Kessel’s group is located, Julia is a collaborator of the corresponding author and did not influence the choice of this preprint for our class.
On 2026-04-07 08:39:09, user Guest wrote:
I must confess, on first reading I found the manuscript quite exciting, but having gone through the earlier comments, I now see rather more clearly the gulf between what the data actually show and what the authors claim.
One thing I would add to what has already been said: there is, quite remarkably, no protein localisation of KCNT1: not by GFP tag, not by antibody, in the multiciliated epidermis of Xenopus, mouse, or indeed human tissue. That is a rather glaring omission, to put it mildly. I would also agree that the proposed connection between KCNT1 and Piezo is tenuous at best.
On 2025-11-19 21:19:50, user Daniel Vásquez-Restrepo wrote:
This preprint already received a “major revision” decision. Unfortunately, the original reviewers were not available to evaluate it again, and the process stalled. Despite sending 15 additional peer-review invitations, no one agreed to take it on. Although the manuscript has now entered a new review process, I am attaching the previous reviewers’ comments.
Reviewer 1
This isn’t a finding as not only is it already available information, the use of the available IUCN maps and statuses was part of the methodology.
R/ We rephrased the sentence to clarify that it refers to the underlying data itself and not to our results.
I like the approach they’ve taken, but none of this is novel information or unexpected.
R/ Although it is well known that mountains promote diversity and endemism at a global macroevolutionary scale, this information has not been explicitly tested in Colombian squamates in conjunction with threat categories. We consider that clearly stating the result of hotspots of diversity and endemism in Colombian squamates can help local environmental policies. Therefore, while our results are consistent with theoretical expectations, this alignment does not diminish the novelty of our findings, as we provide the first quantitative analysis supporting these patterns in the local context.
This is the main novel finding of the work and I’d recommend reorganising the text to stress this.
R/ We modified several sections of the text to emphasize the finding highlighted by the reviewer, also in accordance with comments made by the other reviewer.
Unclear what this means in the context of this paper.<br /> R/ We rephrased the section for clarity.
This is just the existing EDGE list, so I’m not sure it warrants mentioning as an output here.
R/ In accordance with a comment from Reviewer 2, we acknowledge that this is a local rather than a global list, and that species rankings may differ between the two. Therefore, we believe it is an output worth highlighting. Nevertheless, we have clarified in the text the differences between the local and global scores and their implications.
This entire paragraph seems superfluous, and this work has nothing to do with the latitudinal gradient so it’s a strange thing to focus discussion on.
R/ While we briefly mention the latitudinal gradient, the main purpose of this introductory paragraph is to provide general context on biodiversity, leading into the key argument of the subsequent sections: the need to understand biodiversity and extinction risk as multidimensional phenomena. We have made minor adjustments to better integrate the role of the latitudinal gradient in promoting tropical diversity, thereby reinforcing the importance of prioritizing conservation efforts in regions of exceptionally high biodiversity.
Suggested added context as this was unclear as worded.
R/ We accepted the reviewer’s suggestion and revised the text accordingly.
I’m not sure this follows - more that, as the paragraph goes onto say, it results in a lack of understanding of the impacts and vulnerability of the species.
R/ We rephrased the idea to make it clearer.
This seems to be an inappropriate reference, as Paez et al. 2006 focused on turtles rather than squamates. Please check and reword as needed.
R/ We double-checked the reference and confirmed that it is correct, as it covers not only turtles but all Colombian reptiles (including squamates, crocodiles, and turtles).
This seems inconsistent with the earlier statement that “a local assessment is lacking” - should this rather say a recent local assessment? Though as the paper goes on to reference a 2015 ‘local assessment’, it’s unclear what this section means.
R/ We agree with the reviewer and revised the text to clarify that we refer to a recent assessment that also considers different facets of biodiversity, not just species richness (i.e., taxonomic diversity).
The figure given later is 597, and that was used as the basis for the analysis. This may be a discrepancy due to a later update, but the same Reptile Database update should be cited throughout the paper for consistency.<br /> R/ In the Introduction, we refer to the most recent estimate of 620 reptile species for Colombia, based on the latest update of the Reptile Database (2024). However, the analyses in this study were based on the 2023 version of the database, which listed 597 species at that time. Given that the analyses were conducted using the 2023 data, and a complete reanalysis would be required to incorporate the updated figures, we chose to retain the original dataset to ensure consistency and reproducibility. We have clarified this point in the text to avoid confusion.
Better to use the term ‘squamates’ rather than ‘reptiles’ if crocs and turtles are to be excluded.
R/ Done, we have consistently replaced "reptiles" with "squamates" throughout the text where appropriate.
Once again, this could benefit from clarity. The data in the Reptile Database should be reviewed with reference to available material and literature to be used as a formal checklist, but it should be ‘complete’ - it’s more likely to erroneously list species from a country than to miss ones that actually occur there.
R/ We agree with the reviewer and rephrased the sentence to make the idea clearer.
Are the authors able to explain the discrepancy between this figure and the maps (which represented 81% of the dataset)? Most IUCN assessments will have maps, but no IUCN maps will be associated with species that don’t have assessments.
R/ The figures were validated against the information provided in Table S1. As the reviewer correctly points out, there are more assessments than polygons, consistent with the supplementary material. The figure of 77% corresponds to 461 species (excluding DD and NE categories) out of 597 species in our dataset (461/597 = 0.77). Meanwhile, the figure of 81% refers to 481 species with available geographic information, including species categorized as DD (481/597 = 0.81). The discrepancy arises because DD species were included when considering geographic data but excluded from threat category analyses. We have revised the Methods and Results sections to clarify this distinction explicitly. Also, we updated the previous 77% figure to include DD species too, increasing it to 92%.
This is not a sufficient way to evaluate whether the assessments are likely to need updating - the Criteria take account of the distribution and extent of threats to each species, not simply its distribution. The ‘needs update’ tag is applied by the Red List only to assessments more than 10 years old, which is all that should be mentioned here.
R/ We understand the reviewer’s concern and acknowledge that a mismatch between EOO and threat classification is not sufficient by itself to determine if an update is needed. We have separated these ideas in the text: first, we highlight species whose assessments are formally tagged as “needs update” after 10 years; second, we discuss species whose EOO does not align with their current threat classification. We moved the second point to the 3.2 Geographic patterns section, and expanded the Discussion to better explain these observations.
See above. The authors didn’t ‘show’ this, they interpreted the Criteria incorrectly.
R/ See previous answer. We further expanded the Discussion section to better frame this point.
I would consider it suitable for the manuscript to be more fully revised as a shorter paper, as the region-scale analysis within Colombia and the phylogenetic results are of more interest than the well-trodden path of identifying the Andes as an area of greater endemism than Amazonia and the additional analyses included in the paper render its main findings somewhat opaque in places.
R/ We consider that highlighting the Andes as an area of high endemism is necessary to provide context for interpreting the patterns of phylogenetic diversity. While it may be a well-known topic, not all readers will have the same background. Although the manuscript is extensive because it covers taxonomic, geographic, and phylogenetic patterns, its current length (ca. 6,300 words, excluding references) is well within the 9,000-word limit for Original Research articles in Biodiversity and Conservation and only slightly above the typical 5,000-word range. Nevertheless, we made an effort to shorten unnecessary sections to improve focus and clarity. For example, we removed some analysis related to diversification rates and extinction risk, since as the Reviewer 2 pointed out, some metrics depending on branch lengths may be biased.<br /> <br /> Reviewer 2
L393-405: it is important to acknowledge the phylogenetic incompleteness of a national-level analysis, and how that might be affecting these results – divergence times are influenced by phylogenetic coverage and structure, removing >90% of squamate species from the phylogeny will give you divergence times between Colombian species, not true lineage age/divergence time information. This could be addressed with sensitivity analyses to explore how lineage age varies between pruned and complete trees, or with stronger discussion of the pitfalls of this approach in the methods and discussion, with clearer wording in the results.
R/ We appreciate the reviewer’s insightful comment and fully agree. We performed additional calculations to assess sensitivity, and indeed, the age of some lineages can be severely affected, while others remain largely unchanged. Following the reviewer’s recommendation, we revised the Methods and Discussion sections to place greater emphasis on the limitations of using evolutionary metrics derived from pruned trees and on the considerations needed when interpreting these results. As the reviewer also notes, these results are not necessarily incorrect, since global conservation priorities do not always align with local ones. Additionally, we introduced local and global subscripts to our metrics to explicitly distinguish between them.
407-418: Distinction is needed between EDGE scores and national EDGE scores (literally just saying ‘national EDGE scores’ would suffice). It may also be useful to identify national-specific priorities – i.e. high ranking national EDGE species that are not highly ranked in global context. There are EDGE scores available for all vertebrates at the global level here ( https://www.nature.com/articles/s41467-024-45119-z) . There are endemic Colombian squamates that are high EDGE in this study and also high EDGE at the global scale (e.g. Lepidoblepharis miyatai) but also species that are high EDGE nationally because of the phylogenetic diversity they are solely responsible for in Colombia, but the responsibility for which is shared beyond Colombia’s borders. These key cases can be instrumental in ensuring species that are globally ‘safe’ but locally important do not fall through the cracks.
R/ Please refer to the previous response. We now explicitly distinguish between national EDGE scores and global EDGE scores throughout the text and highlight cases where species are locally important but not necessarily globally prioritized.
L41 and throughout: “threatenedness” = “extinction risk” or “level of threat”.
R/ Done.
Throughout: It’s the IUCN Red List, not IUCN, particularly when referring to versions of the Red List database.
R/ Done.
L145: make it clear you’re referring to national endemics.
R/ The Resolución 0126/2024 from Colombia’s Ministry of Environment (MADS) covers not only national endemics but all species occurring within the country’s administrative boundaries.
L167: ensure it’s clear that its imputation based on taxonomy alone.
R/ Done.
L182: check references.
R/ We reviewed the references cited at this point and confirm they are correct.
L222-224 and throughout: phylogenetic diversity == Faith’s PD – the other measures are indices of phylogenetic distance/relatedness that are calculated in same units as PD, but are not phylogenetic diversity – that should be clarified.
R/ Done. We clarified that Faith’s PD refers specifically to phylogenetic diversity, while the other metrics represent measures of phylogenetic relatedness or distance.
L393: extinction risk should not be though of as a trait evolving but as the manifestation of extrinsic and intrinsic factors.
R/ Agreed. We rewrote the sentence.<br /> L393-397: unclear what the relationships discussed are, and what they infer.
R/ We have removed this section from both the Methods and Results. Given that the correlations discussed involved metrics dependent on branch length — and, as the reviewer previously pointed out, branch lengths can be affected by pruning the phylogenetic trees — we decided to eliminate this section. Overall, it did not substantially contribute to the text or to the discussion.
L428-429: This is higher than, or at least comparable to, the global % of DD/NE squamates I think, so might not be considered relatively low for squamates.
R/ We rewrote the sentence to clarify that it is comparable to or higher than the global percentage, as the reviewer correctly pointed out.
L429-432: it might be worth highlighting how taxonomists and others can contribute to rapid reassessment of species with basic information in ecological publications see: https://doi.org/10.1016/j.biocon.2018.01.022
R/ Done. We incorporated the reviewer’s suggestion.
L442-444: Unclear what is meant here? A species can be assessed as CR with a wide range if its under population decline criteria, and a small-ranged species can be assessed as not-threatened if there is no evidence of decline/ongoing degradation.
R/ This comment was also raised by Reviewer 1. We addressed it accordingly by revising the text to clarify that species can indeed have wide distributions and still qualify as Critically Endangered if facing significant threats, and vice versa. Please refer to our responses to Reviewer 1.
On 2025-08-27 07:16:38, user YY Xie wrote:
We are thrilled to announce the first release of DeepHalo, a groundbreaking deep learning-integrated workflow for high-throughput discovery of halogenated metabolites from HRMS data!<br /> A user friendly Standalone Executable (for Windows Users) is available at: https://github.com/xieyying/deephalo/releases/tag/DeepHalo_V1.0.0) and https://pan.baidu.com/s/1fzHqWDY6FNK0lzy6AnHoTw?pwd=deep
On 2025-07-23 15:35:02, user Kate Nyhan wrote:
Interesting analysis. <br /> In light of the reliance on MeSH subject indexing, I draw your attention to NLM's own data on the performance of machine indexing approaches in different categories, documented in the NLM Technical Bulletin: https://www.nlm.nih.gov/pubs/techbull/ma24/ma24_mtix.html . The check tag category (which includes the species labels on which the OPA iCite tool relies) F1 score (combining precision and recall) for MTIX (introduced in 2024) was 87% versus the original (human) indexing approach -- that is, significantly lower performance. And for a period of time before the introduction of MTIX, NLM was using a different machine indexing system, MTIA, whose F1 score for the check tag category was only 62% compared with human indexing. So, depending on when MTIA started to be used, and the proportion of records that were indexed with MTIA versus human indexers, I wonder how confident we can be that the relative proportions of different categories of MeSH terms truly reflect the prevalence of different categories of research over time. <br /> I also note, in the same source, that the performance of MTIA and MTIX at appropriately labeling Medline articles with supplementary concept terms was even worse than their performance with check tags: 39% and 71% versus human indexing. Supplementary concept terms are especially relevant to innovative, novel science (including basic science) -- terms that may in the future become MeSH terms. It's perhaps not surprising that tools trained on historical data are not great at handling novel concepts, but poor performance by machine indexing tools at applying appropriate supplementary concept records may be another factor in the apparent decline in basic science research. <br /> I'd also like to comment on the iCite Translation Module (of which the Human/Animal/MCB category assignment is part). I'm not really clear on how many PubMed records get such category labels. On the one hand, iCite includes all PubMed records. On the other hand, presumably only articles with MeSH terms can be assigned in the Triangle of Biomedicine -- that is, articles in journals that are indexed in PMC but not Medline are not included in the human/animal/MCB analysis. I assume that the proportion of PubMed records with Medline indexing has gone down, as NIH-funded authors publish more papers in journals that aren't indexed in Medline (many of which didn't exist at the start of this longitudinal analysis). Indeed, thanks to Ed Sperr's handy tool PubMed-By-Year, we can see that Medline records (ie, records with MeSH terms that can be analyzed by the human/animal/MCB categories in iCite) as a proportion of PubMed records was above 90% until (I am eyeballing the figure at https://esperr.github.io/pubmed-by-year/?q1=medline [sb]&startyear=1990) around 2011, at which point Medline coverage started declining quite precipitously. So, any analysis that relies so heavily on MeSH indexing is going to be leaving out a large number (and an increasing proportion) of recent papers.
On 2025-05-17 03:57:12, user thegradstudent wrote:
Summary<br /> This study introduces a novel computational pipeline for the de novo design of peptides that localize preferentially at the interface of biomolecular condensates. These condensates are membrane-less compartments created by protein and RNA molecules that form ‘dense’ and ‘dilute’ phases. The interface between these phases has been shown to promote the aggregation of the proteins that are part of the condensates and the formation of disease-associated fibrils of hnRPNA1. Previous literature has demonstrated preferential interfacial partitioning of a few proteins, but not of small molecules or peptides.
This technique combines coarse-grained molecular simulations, mixed-integer linear programming (MILP), and machine learning. The authors use this workflow to design peptides that localize at the interface of biological condensates, hnRNPA1, LAX-1, and DDX4, which are formed by intrinsically disordered proteins. They test these designed peptides in vitro and show that they exhibit their intended surfactant-like activities using confocal microscopy. They also identify how the charge of these peptides is a crucial element of their physicochemical features.
Overall, this study successfully shows that these short peptides preferentially distribute between the interface of the biomolecule condensate and the surrounding environment, showing surfactant-like properties. They also show that the net charge and the amino acid composition of these peptides in relation to their biomolecular condensate are crucial to determining whether they will preferentially partition at the interface.
The authors have opened the potential to study more complex condensates using this rigorous strategy. This paper is exceptionally well written and thorough. I recommend this paper for publication with minor revisions.
Major Point<br /> To experimentally validate this computational pipeline, you fluorescently label the selected peptides. This may show my lack of knowledge on this subject, but my one concern is regarding the potential effects of the fluorescent tag on the condensate system. This JBC paper from 2023 shows that fluorescently tagging a protein can promote phase separation , in this paper specifically huntingtin exon-1 with red fluorescent protein ( https://pmc.ncbi.nlm.nih.gov/articles/PMC10825056/ ). So, what is to say that the Cy5- fluorophore isn’t playing a role in creating these surfactant-like properties of the designed peptide?
Minor Points<br /> - Figure 1: Placing the label descriptors of the figure in front of the written text makes it clearer when reading, instead of having them at the end.<br /> - Figure 1C: The grey color used for the box is a little dark, making it slightly hard to read the words and it is very close to the grey coloring within the figure. Maybe switch this box into an outline or go with a lighter shade of grey.<br /> - Figure 1A and the figure in the abstract: The question marks are a little confusing to me. There may be a better way to describe what you mean without them.<br /> - Figure 5C & D: There is green text next to red text, which can be confusing to the color impaired.
On 2025-05-16 23:27:04, user Andie Souder wrote:
Summary: <br /> The major goal of this paper was to understand FAD binding to Cry4b isoform in vitro. This was done by in vitro binding assays, simulations of FAD binding to Cry4b and solvent accessibility, and mRNA transcription levels of in vivo and immunoprecipitation. The major success of this paper is establishing protocols for optimization and finding new methods to work with the Cry4b isoform. The major weaknesses stem from a lack of reliable experimental data. But this paper brings to attention the need for thorough and rigorous protocols. It also highlights how little is known about these proteins and sheds light on areas that need to be explored.
Major Issues:<br /> Perhaps I am misunderstanding the conclusion of this paper, but it seems like the results of your experiments do not support your conclusion. In the introduction, it states that genome analysis of Cry4b exon has stop codons in the intrinsic region and asks if the mRNA is translated into function protein in vivo. How do we know that the samples collected didn’t have a nonfunctioning version of mRNA being translated?
https://pubmed.ncbi.nlm.nih.gov/32978454/ This paper states that the Cry4b is expressed only at night, were the specimens harvested during the day vs night to compare Cry4 isoform expression? Could that be the reason for the discrepancy in the MS results? As stated in the paper: “...the latest avian genome analyses showed that the CRY4b-specific exon carries loss-of-function mutations (e.g., stop codons), a pattern characteristic for intronic regions [29]This poses the question whether the ErCRY4b mRNA isoform is translated into a functional protein product in vivo.” Is this a factor that impacts the results of the experiments done?
Considering that the major goal of this paper is to understand FAD binding in vitro, why weren’t those experiments thought out more carefully? It seems as if the inclusion of the vivo studies as well as the simulations were done in an attempt to reinforce the weak results of the experimental data. But the experimental data is hard to draw concrete conclusions from. In the paper, it states that the Cry4b might be misfolded, is there an experiment that verifies the fold of the protein? That is an important thing to consider, especially because these experiments are the basis of the paper. Does the solubility tag block FAD binding? What about the chaperone?
Minor Issues:<br /> Resolution quality of figure 1 does not match the other figures<br /> Please add the confidence of the alpha fold generated structure<br /> Add to the figure 1 caption that the structures were generated using alpha fold<br /> Please clarify if there are competing interests as the bioRXIV webpage states that there is not but paper states that competing interest is present
On 2024-07-21 00:09:37, user Meet Zandawala wrote:
Manuscript title: TRPγ regulates lipid metabolism through Dh44 neuroendocrine cells
Summary: This manuscript from Youngseok Lee lab examines the role of TRP gamma channel in regulating metabolic physiology. Specifically, it focuses on the regulation of lipid metabolism via DH44 neuroendocrine cells. It is a follow-up on the work from the same lab where they showcased the importance of TRP gamma in DH44 cells in regulating post-ingestive food selection (Dhakal et al 2022: https://doi.org/10.7554/eLife.56726 ). Overall, this work adds to the growing body of work on DH44 neuroendocrine cells which appear to be crucial internal metabolic sensors. We have a few major comments and suggestions on the preprint which could help clarify the mechanisms by which TRP gamma regulates lipid metabolism.
Minor comment:<br /> 1. Stock numbers for fly strains have not been provided.
Signed by,<br /> Meet Zandawala <br /> Jayati Gera<br /> (Zandawala lab members)
On 2023-07-09 14:02:36, user Bianca Migliori wrote:
The repository associated with this work can be found here: https://github.com/NYSCF/NY...
On 2022-11-28 00:06:07, user Shyam Bhakta wrote:
Rather than predict the folding energy of the entire mRNA, it makes more sense to predict the folding energy of just the 5' UTR through first 10 codons, with and without the SKIK tag, as it is only this region that primarily controls the translation initiation rate by RNA structure. Even better would be to predict the translation initiation rates by inputting the mRNA sequence into the Salis Lab RBS Calculator (denovodna.com). This would better show how much the SKIK codon sequence alone can be expected to affect the protein production rates.
On 2022-10-29 08:23:12, user Karen Lange wrote:
This study investigates the autoproteolytic cleavage of polycystin1/PC1 in the C. elegans ortholog LOV-1. Walsh et al used CRISPR genome editing to tag the endogenous LOV-1 protein at both the N-terminus (mScarlet) and C-terminus (mNeonGreen).
Figure 1 clearly shows that the N and C tagged fragments have different localisation patterns. The N and C terminal tagged fragments also displayed different transport dynamics (Figure 4). When a point mutation that is predicted to prevent cleavage (C2181S) was introduced in the mScarlet::LOV-1::mNeonGreen strain the localisation of LOV-1 was severely disrupted. Interestingly the the N-termini of LOV-1 was enriched in the cilia of three ray neurons suggesting that some cleavage can still occur in this mutant. Taken together this body of work presents strong evidence that LOV-1 is processed in C. elegans.
The mScarlet::LOV-1::mNeonGreen strain will be a very useful tool for use in future studies to model conserved ciliopathy variants. I would predict that missense variants in the N or C terminal fragment do not affect the function of the other. Modelling these variants will help to elucidate disease mechanisms.
One concern I have is whether or not the double tagged LOV-1 protein is fully functional. I can see in Figure 3D/F that the mating efficiency with unc-52 and the response behaviour is not significantly different from wild-type. However, I do not see the comparison to wild-type in the dpy-17 mating efficiency assay (Figure 3E). I would have appreciated a supplemental figure when the double tagged LOV-1 allele is first introduced to immediately address whether or not it is functional.
On 2022-10-17 09:00:34, user Iratxe Puebla wrote:
Review coordinated via ASAPbio’s crowd preprint review
This review reflects comments and contributions by Ruchika Bajaj, Sree Rama Chaitanya Sridhara and Sara El Zahed. Review synthesized by Ruchika Bajaj.
This study has developed a novel one-step methodology for the incorporation of membrane proteins from cells to lipid Salipro nanoparticles for structure-function studies using surface plasmon resonance (SPR) and single-particle cryoelectron microscopy (cryo-EM), which is a profound technology in the field of membrane protein structural biology. We raise some points that may strengthen the manuscript below:
Main section, 4th paragraph “resuspended in digitoxin-containing buffer”- Does the sentence mean that membrane proteins were solubilized by detergent before reconstitution into salipro particles? Are salipro and digitoxin added at the same step? If this is the case, it is unclear how one can distinguish between the step wise solubilization and reconstitution or direct reconstitution into salipro particles. Further discussion on the mechanism of reconstitution would be helpful. In the same paragraph, the fragment “to increase membrane fluidity and render lipids” raises the question of whether the concentration of digitonin was optimized to balance the increase in membrane fluidity but not rendering the solubilization of membrane proteins.
Main section, 4th paragraph, “the formation of saponin-containing mPANX1-GFP particles was assessed by analytical size exclusion chromatography using fluorescence detector” - It is assumed that fluorescence is detected from GFP. As the construct expressed is PANX1-GFP, GFP fluorescence signal will be received from reconstituted as well as not reconstituted PANX1. Is saponin specific signal being used as a signal for measuring the reconstitution of PANX1-GFP? In the same paragraph, “PreScission protease for on-column cleavage” is mentioned. Is GFP still intact in the expressed PANX-1 or is it cleaved? A diagram of these procedures showing the various steps will be helpful for readers.
Main section, 4th paragraph “SDS-PAGE revealed the formation of pure and homogeneous Salipro-mPANX1 nanoparticles”- However, extra bands are present above the major band in Figure 1E, can some comment be provided on this point. Possible explanations for the additional bands could be post translational modifications or degradation of mPANX1.
Methodology section, “membrane protein reconstitution screening using fluorescence-detection size exclusion chromatography (FSEC)” -The amount of salipro is given in ug. A comment on the ratio of protein to salipro particles would be important to decide the concentration of salipro with respect to the mass of the cell pellet.
Figure 1G: The molecular weight of Salipro-mPANX1 particles is mentioned to be approximately 466kD. mPANX1 weighs about 48kD and heptamer will be 336kDa. A discussion on comparison of experimental and actual molecular weight would be interesting.
hPANX1 was expressed in sf9 insect cells. A description regarding trials of expression of this construct in expi293 cells would be informative.
Supplemental Figure 1B: The gel is overloaded and shows multiple bands for hPANX1, recommend selecting an alternative image for hPANX.
Paragraph 6A phrase, “challenged with bezoylbenzoyl-ATP(bzATP), spironolactone and cabenoxolone” - Please explain the meaning of ‘challenged’ here.
Supplementary Figure 2: Paragraph 6 mentions “binding constant could not be determined”. Please provide an explanation for this. Is it about the saturation phase not being approachable because of the feasibility of the binding experiment at higher concentration of cabenoxolone?
The last summary sentence in Paragraph 6 is not clear, recommend rephrasing it.
Figure 2A shows that Salipro particles have His tag. This suggests that an additional step of affinity purification with His tag could have been used to distinguish or separate reconstituted and un-reconstituted PANX1.
Supplementary figure 4: Please explain whether the datasets for samples in the presence and absence of fluorinated lipids were combined together.
Paragraph 8, “intracellular helices were not well resolved” - Please comment on a possible explanation. Does the Salipro scaffold contribute to the resolution? Please mention any future possibilities regarding improving the resolution by modifying the salipro scaffold or alternative scaffold. In the same paragraph, rmsd is mentioned at promoter level, please comment on how this value changes at heptamer level and why is it important to report the rmdd value to appreciate the direct reconstitution methodology.
Last paragraph 10, “future membrane protein research” - Please comment on the utility of this methodology on prokaryotic membrane proteins, bacterial outer or inner membrane proteins or eukaryotic membrane proteins. Some more examples of reconstitution with the same method will support the applicability of this methodology on diverse kinds of membrane proteins. A discussion section comparing this methodology to other methods would also be useful for readers.
On 2022-10-13 19:16:01, user BacillusBaRosh wrote:
Author responses to feedback posted on hypothes.is - cut and paste because could not figure out how to respond there https://hypothes.is/a/5fVcAEaSEe2k4CPVTDZz7Q
AtanasRadkov<br /> Oct 7<br /> on "Magnesium modulates Bacillus s…"<br /> (www.biorxiv.org)<br /> General comments:
This study carefully delineates the role of magnesium in cell division versus cell elongation. The results are really important specifically for rod-shaped bacteria and also an important contribution to the broader field of understanding cell shape. Specifically, I love that they are distinguishing between labile and non-labile intracellular magnesium pools, as well as extracellular magnesium! These three pools are really challenging to separate but I commend them on engaging with this topic and using it to provide alternative explanations for their observations!
A major contribution to prior findings on the effects of magnesium is the author’s ability to visualize the number of septa in the elongating cells in the absence of magnesium. This is novel information and I think the field will benefit from the microscopy data shown here.
I completely agree with the authors that we need to be more careful when using rich media such as LB. It is particularly sad that we may be missing really interesting biology because of that! It’s worth moving away from such media or at least being more careful about batch to batch variability. Batch to batch variability is not as well appreciated in microbiology as it is for growing other cell types (for example, mammalian cells and insect cells).
For me, the most exciting finding was that a large part of the cell length changes within the first 10min after adding magnesium. The authors do speculate in the discussion that this is likely happening because of biophysical or enzymatic effects, and I hope they explore this further in the future!
I love how the paper reads like a novel! Congratulations on a very well-written paper!
Kudos to the authors for providing many alternative explanations for their results. It demonstrates critical thinking and an open-mind to finding the truth.
Comment<br /> Figure 2C → please include indication of statistical significance<br /> Figure 3C → please include indication of statistical significance<br /> Figure 6A → please include indication of statistical significance<br /> Figure 8B → please include indication of statistical significance<br /> Figure S1B → please include indication of statistical significance<br /> Figure S3B → please include indication of statistical significance
Response<br /> Easy to add
Comment<br /> For your overexpression experiments, do the overexpressed proteins have a tag? It would be helpful to have Western blot data showing that the particular proteins are actually being overexpressed. I think the phenotypes that you observe are very compelling, so I don’t doubt the conclusions. Western blot data would just provide some additional confirmation that you are actually achieving overexpression of UppS, MraY, and BcrC.
Response<br /> The proteins are untagged. For the UppS and BcrC the cell shortening occurs with addition of inducer, , so strong indication expression is occurring. A western would provide information about degree of overexpression, but we don’t think is necessary to support conclusion drawn. Do you think there is an alternative possibility that needs to be excluded? We note that in another preprint (https://www.biorxiv.org/con... the authors delete the native uppS in their inducible Phy-uppS strain (Fig S4) and at 100 uM IPTG (10X less than what we used in experiment) the cells have wt growth on LB plates, so we at least know the Phy-uppS is functional and made (or they would die!). We are introducing the uppS deletion into our strain to see if we can identify a concentration of IPTG that doesn’t affect cell growth but still induces shortening.
For MraY, the result is negative, so you are spot on – it is impossible to tell if due to lack of overexpression from data shown. We only know the strain is correctly made from sequencing. We will investigate if there is an antibody or functional fusion available. The reason we were not sure was worth doing is because the MraY reaction is reversible (15131133). This means that without a phenotype, there is no simple way to know the reaction can even be pushed forward even if the overexpression is confirmed (more negative data). We actually overexpressed some other proteins that act downstream (MraY, MurJ, AmJ) and they were also negative for shortening. Probably we should remove the negative data or reword to make the caveats of the negative result clear.
Question<br /> Based on your data, there are definitely differences in gene expression when you compare cells grown in media with and without magnesium. Because the majority in cell length increase occurs in such a short time though (the first 10min), I was wondering if you think that some or most of it is not due to gene expression?
Response<br /> The shortening is even faster than 10 min (not only statistically significant, but also obvious qualitatively if we mount immediately after adding Mg2+ ). We did not include the first timepoint because original purpose was to check everything was ready with microscope – did not expect shortening so fast! We can definitely add that data in. When we saw, we tried to capture the transition on pads, but going from culture to pad seems to stress the cells too much in the small window where the cool stuff happens. Since growth rate doesn’t appear to be a big factor in those initial divisions, we might be able to grow at lower temp and shift to pads for adjustment period before adding Mg2+. Did not play with it much due to lack of resources atm, but a flowcell setup would probably be best.<br /> In short, we think rapid divisions right after transition do not require transcription or translation. It really “smells” more like a biophysical thing.
Question<br /> Do you have any hypotheses what is most likely to be affected by magnesium? Do you think if the membrane may be affected?
Response<br /> We have a lot of hypotheses – all of which are speculative. There could be an extracytoplasmic enzyme involved in envelope synthesis is sensitive to Mg2+ availability, and that at lower concentrations, it’s activity is affected. There is some old literature with membrane preps that suggests PG synthesis requires higher Mg2+ than teichoic acid synthesis. If Und-P is limiting, higher Mg2+ may shift make the pool more available to make the septum. Tingfeng initially hypothesized there might be a receptor/signal mechanism but has not been able to identify one. Und-P seems to be important, but “availability” is not just pool, but how fast (and where!) the flipping across the membrane occurs. If Und-PP needs to be dephosphorylated to Und-P before being flipped back to cytoplasmic side, anything that effects the PPi equilibrium would be predicted to affect the reaction rate, with lower Pi (in periplasm or pseudoperiplasm in case of G+) favoring the dephosphorylation. Cell wall associated Mg2+ could shift equilibrium to be more favorable for a Und-PP phosphatase more closely associated with the divisome. I could go all day… In short, we don’t know enough!
Question<br /> Why do you think less magnesium activates this program of less division and more elongation? Additionally why is abundant magnesium activating a program of increased cell division and less elongation? Do you think there is some evolutionary advantage, especially considering how important magnesium is for ATP production?
Response<br /> In the window we looked at, the elongation rate is constant (not less or more) and only the division frequency changes. Some bacteria (like Caulobacter and to lesser extent E. coli) clearly elongate and divide simultaneously, so there is some competition for substrate (like Lipid II). Septators like Bacillus seem to delineate the two processes more, but we have found conditions where even Bacillus invaginates during division, so it’s not absolute. Like eukaryotic cells, bacterial undoubtedly have mechanisms not only commit to a round of DNA replication when there is some signal that resources are sufficient. Clearly with some bugs, this is not the case with cell division. The alternative possibility is that every cell cycle there is an opportunity to divide if some threshold of *something(s)* is reached. There is a hypothesis from Mtb literature that it may be GTP, but it’s not at all clear that is sufficient. In yeast, size at cell division is affected by perturbing 1-C pool.
Question<br /> Related to this previous question, I also wonder if this magnesium-dependent phenotype would extend to other unicellular organisms, may be protists or algae? That would be a really exciting direction to explore!
Response<br /> It’s a great question – lots to do! We didn’t even look at another Gram-positive, but we plan to. It’s trickier to limit Mg2+ in Gram-negatives (see 27471053 – we tried Bsub homolog for those wondering – it’s not responsible for phenotype we see).
Question<br /> Regarding the zinc and manganese experiments, why do you think they lead to additional phenotypes compared to magnesium? Do you have any hypotheses?
Response<br /> We have hypotheses, but if my (Jen’s) twitter engagement is any indication, way too speculative for public consumption at present. Need grant to acquire preliminary data to write grant.
Question<br /> Regarding your results that Lipid I availability may be a major a problem for the cell division in the absence of magnesium, do you think that is due to effects magnesium has on the enzymes directly, or do you think magnesium affects the substrate availability/conformation by coordinating the phosphate groups? Or something else, may be membrane conformation?
Response<br /> Several proteins involved in envelope synthesis (like UppS) are Mg2+ dependent enzymes. But at least for any intracellular players, levels of Mg2+ should be more than high enough to support enzyme activity even when levels are low (0.8 – 3.0 mM is Bsub range I recall off top of head). Could have impact extracytoplasmically by lowering pool sponged into the cell wall, but intuition (for what that is worth) is that it is not the coordination of an enzyme with a metal that is impacted rather the equilibrium with other ions like Pi and H+ and that this impacts net ATP synthesis. Lots to think about and do, and no simple answers. When Tingfeng started project idea was to find mechanism – didn’t realize we were asking “how does the cell work?” Turned out to be a bit much for a dissertation project :)
-Jen Herman and Tingfeng Guo
On 2022-10-07 09:04:58, user Iratxe Puebla wrote:
Review coordinated via ASAPbio’s crowd preprint review
This review reflects comments and contributions by Ruchika Bajaj, Gary McDowell, Sree Rama Chaitanya Sridhara. Review synthesized by Iratxe Puebla.
The preprint studies the process for mitochondrial targeting of mitochondrial precursor proteins. Using a yeast model, experiments show that the cytosol transiently stores matrix-destined precursors in dedicated granules which the authors name MitoStores. The formation of MitoStores is controlled by the heat shock proteins Hsp42 and Hsp104, and suppresses the toxicity arising from non-imported accumulated mitochondrial precursor proteins.
The manuscript is clear and well-written. The reviewers raised a few comments and suggestions as outlined below:
The introduction was extremely clear and provides a good summary of the protein homeostasis dimension of the problem in question. However, there could be a clearer discussion of the processes of import, in particular with respect to the results discussing “clogging”. It is suggested to add a penultimate transitional paragraph in the introduction that facilitates this transition e.g. this could be expansion of the first paragraph in the Results section, moved into the introduction to provide more context about the cloggers, PACE, and the Rpn4-mediated proteasomal regulation.
Figure 2E and Figure S2 - Can some further explanation be provided about what data belongs to delta-rpn otr WT, or whether the associated fold change is reported - delta-rpn/WT.
Results ‘while the levels of most chaperones were unaffected or even reduced in Δrpn4 cells, the disaggregase Hsp104 and the small heat shock protein Hsp42 were considerably upregulated (Fig. 2F, G)’ - Suggest adding some further clarification as to why Hsp104 and Hsp42 are selected despite perturbations in other protein partners. Are there other proteins than proteosomes and chaperones which are significantly up- or down-regulated? STRING or cytoscape tools may help with the interactome analysis.
Figure 3
Results ‘protein accumulated at similar levels as Hsp104-GFP in the yeast cytosol (Fig. S4B)’ - Please clarify whether the image reports qualitative or quantitative data, and how the levels of DHFR-GFP and Hsp104-GFP are compared based on S4B.
‘Owing to the striking acquisition of nuclear encoded mitochondrial proteins in these structures, we termed them MitoStores’ - Suggest providing some discussion about the fraction of Hsp104 that is part of the MitoStores? Does a major portion of Hsp104 in the absence of Rpn4 form MitoStore structures?
Figure S5 C ‘Quantification of the colocalization of Hsp104-GFP with Pdb1-RFP after clogger expression for 4.5 h.’ - Suggest normalizing the intensity with one another.
Results ‘Upon clogger induction, the RFP signal formed defined punctae that colocalized with Hsp104-GFP’ - The Hsp104-GFP pattern seems different between Fig 3A, 5, and S5. In some cases, clear punctae are seen and in others, a diffused pattern. Can some comment be provided on this? This might be important to score the colocalization between Hsp104-GFP and other protein partners tagged with RFP. If different conditions were used in the figures, recommend specifying this in the figure legends.
Discussion ‘We observed that MitoStores are transient in nature and dissolve…’ - Suggest adding some discussion about the half-life of MitoStores, and about what the different stressors that can trigger MitoStores may be.
On 2022-10-03 09:55:42, user Iratxe Puebla wrote:
Review coordinated via ASAPbio’s crowd preprint review
This review reflects comments and contributions by Luciana Gallo, Claudia Molina Pelayo, Sónia Gomes Pereira, Asli Sadli. Review synthesized by Iratxe Puebla.
The preprint examines the meiotic recombination co-factor MND1 and its role in the repair of double-strand breaks (DSBs) in somatic cells. The paper reports that MND1 stimulates DNA repair through homologous recombination (HR) but is not involved in the response to replication-associated DSBs. MND1 localization to DSBs occurs through direct binding to RAD51-coated ssDNA. MND1 loss potentiates the G2 DNA damage checkpoint and the toxicity of IR-induced damage, opening avenues for therapeutic intervention, particularly in HR-proficient tumors.
The reviewers raised some minor comments and suggestions on the work:
Results ‘Therefore, we conclude that MND1-HOP2 are ubiquitously expressed proteins’ - we understand that the study looked at the transcript's expression level and not protein levels, consider revising this sentence.
Figure 1F - Due to the differences in intensity for the loading control, recommend quantifying the normalized level of MND1.
‘we used live-cell imaging of RPE1 cells’ - Are these cells p53 KO? In Suppl. Figure 1K, RPE Delpta-p53 cells are used , but the HALO tag was introduced in the normal (WT) RPE cells. Could some clarification be provided for this difference, and report what's the level of MND1 and the effects of its loss in WT RPE cells?
‘Analysis of 53BP1 foci formation and resolution in asynchronously growing RPE1 cells revealed that MND1 depletion leads to slower repair and retention of DSBs after IR (Figure 2A, Suppl. Figure 2F&G)’ - While the quantification shown in Figure 2A is explicit, the foci in the raw images displayed in Suppl. Figure 2G appears to be more frequent in the siNT, especially in the last 2 time points. It may be worth making the images bigger and maybe clearer?
‘our data show that the role of MND1 in DNA repair is most prominent in G2 phase cells and restricted to repair of two-ended DSBs’ - Can some further context be provided for the last part of this claim. Is this due to the different modes of action of the different drugs used? If so, it would be nice to clarify in the text which drugs induce the two-ended DSBs.
‘These data show that MND1 is recruited to sites of DSBs’ - The data shows that there is an increase in MND1 foci, but whether these are or not the sites of DSBs is not clear. Recommend co-staining with a known DSBs marker.
Methods
On 2022-08-28 09:00:20, user Iratxe Puebla wrote:
Review coordinated via ASAPbio’s crowd preprint review
This review reflects comments and contributions by Ruchika Bajaj and Gary McDowell. Review synthesized by Bianca Melo Trovò.
This study demonstrates the utility of an L-Methionine analog - ProSeMet - to tag and enrich proteins which have residues that are methylated in vivo, ex vivo and in vitro. Furthermore, the study demonstrates that this can be used in combination with mass spectrometry to identify these sites. Overall this is a useful, well-verified and well-described approach that will be helpful for future identification and investigation of methylation sites.
Major comments
It would be helpful if the manuscript could additionally discuss the reversibility of methylation generally, and the reversibility of the modification of protein residues by the alkyne group specifically, in the discussion, and whether that has any implications for their results. It may be that the dynamics of methylation and demethylation vary between the two; or it may be that they are the same - either way, that may affect how they suggest others use this method and interpret its results.
Perhaps related to the question of reversibility, it would be helpful if the manuscript would comment on whether these are “true” methylation sites or not; i.e. whether they consider all these methylation sites to be functional. Trying to determine this would be an interesting direction for future work, but for this study a reflection on whether these novel functional methylation sites are simply capable of being methylated, or are likely to be methylation sites that are meaningful biologically, would be helpful.
Results, ProSeMet competes with L-Met to pseudo methylate protein in the cytoplasm and nucleus: the manuscript claims that ProSeMet is not incorporated into newly synthesized proteins but rather converted to ProSeAM and used by native methyltransferases. There does appear to be some reduction in the labeling with ProSeMet on cycloheximide treatment in Figure 2D - could this suggest that it is incorporated into newly synthesized proteins as well as being converted to ProSeAM? If not, could the manuscript explain why not? This experiment clearly shows that in contrast to AHA labeling, there is still use of ProSeMet as a substrate when translation is inhibited; however, it is not clear how this demonstrates that it is not incorporated at all into newly synthesized proteins. If methyl has been incorporated in previously present proteins, perhaps this can be clarified in the text.
Results, ProSeMet competes with L-Met to pseudomethylate protein in the cytoplasm and nucleus: the conclusion that “Cell fractionation of the cytosolic and nuclear compartments followed by SDS-PAGE fluorescent analysis revealed no fluorescent labeling of the L-Met control” is correct but may be overstated as there appears to be some background in the cytosolic fraction.
Minor comments
Introduction: Recommend including a mention to ProSeMet's permeability.
Introduction, Figure 1: the last step with CuAAC and N3 labeling in the description of the Chemoenzymatic approach for metabolic MTase labeling is not clear. Please, add the description in the legend.
Results, Figure 2D: the image suggests an overloaded gel, consider using an alternative gel image.
Supplementary Material, Fig. S1: the data with L-met is only shown with T47D stacks.
Supplementary Material, Fig. S3: please add the control for the no treatment condition.
Results, Fig. 2A ‘ incubating for 30 m in L-Met free media’: Please confirm that the length of incubation was 30 minutes.
Results, Enrichment of pseudo methylated proteins used to determine breadth of methyl proteome: Please provide some description for the SMARB1-deficient G401 cell line. Why smarb1 deficient?
Results, Figure 3: Please define BP, MF, HP, NES, and label the x and y axes in panel D.
Results, ProSeMet-directed pseudo methylation is detectable in vivo: Please, clarify if the administration was oral.
Comments on reporting
Results, ProSeMet competes with L-Met to pseudo methylate protein in the cytoplasm and nucleus: Please verify the quantity reported: 5µg on SDS-PAGE gel seems low.
Results, ProSeMet-directed pseudo methylation is detectable in vivo: the manuscript reports that “mice starved prior to ProSeMet injection had increased ProSeMet labeling in the heart, whereas mice fed prior to ProSeMet administration had increased labeling in the brain and lungs”. The error bars are large, it would be helpful to show the individual real data points for the graphs in Figure 4.
Results, Figure 4C: please report the mathematical expression used to calculate the relative fluorescence.
Supplementary Material, Fig. S7: please provide more details on the antibody employed.
Suggestions for future studies
Future studies could investigate the biological functionality of the novel methylation sites - but this is a great proof of principle.
On 2022-07-13 13:46:46, user Iratxe Puebla wrote:
Review coordinated via ASAPbio’s crowd preprint review
This review reflects comments and contributions by Oana Nicoleta Antonescu, Ruchika Bajaj, Sree Rama Chaitanya and Akihito Inoue. Review synthesized by Ruchika Bajaj.
This study has characterized the function of Hero proteins in improving the recombinant expression of TAR DNA-binding protein in E. coli and restoration of enzymatic activity of firefly luciferase during heat and stress conditions. This study may be useful for future applications of Hero proteins in life sciences research. Please see below a few points offered as suggestions to help improve the study.
Introduction - A paragraph describing the origin of Hero proteins and the differences between the types of Hero proteins in the introduction section would be helpful for readers to understand the background on these proteins. For example, please explain the background on naming these proteins as Hero 7, 9, 11 etc. The genes SERF2, C9orf16, C19orf53, etc are mentioned in the plasmid construction section in the Material and methods. Please provide a brief explanation for the relationship between these genes and Hero proteins.
Please add more details in the Material and methods section, especifically in western blotting and the luciferase assay, to support the reproducibility of these experiments.
On 2021-11-03 14:33:03, user antibodies-online wrote:
ABIN101961 used for CUT&Tag/MulTI-Tag in this preprint
On 2021-11-02 09:56:52, user David Bhella wrote:
To help readers understand the path to publication, I am adding an account of the peer review process to each preprint.
This article was initially rejected without peer-review by PLOS Pathogens. We then submitted to Scientific Reports, where the paper was accepted following review:
Reviewer comments:
Reviewer #1 (Technical Comments to the Author):
In this manuscript, Ho et al. reported a 7-Å resolution cryoEM reconstruction model of MrNV VLP expressed in insect cells. MrNV could cause white tail disease in the giant freshwater prawn with high mortality rate, therefore is a serious threat to aquaculture. Together with PvNV infecting marine shrimp, MrNV may represent a new genus in the Nodaviridae family. The structure presented here shows a different arrangement of protruding spikes on the icosahedral capsid surface, compared to other nodaviruses, supporting this classification. The most significant difference is that the protrusions are dimeric, instead of trimeric as in other nodaviruses.
This manuscript is well written. The methodology from VLP expression, purification, to imaging and 3D reconstruction is standard and clearly explained. The conclusions are logical based on the results. Some discussions could be better elaborated:
1.The authors devoted a lot of space (especially figures) to the homology modeling which did not provide much information besides that the P domain of MrNV capsid protein is different from the input homologous models. It would be more helpful to instead show figures of the models fitted in the MrNV map, to directly show the discrepancies and suggest possible location of the MrNV P domain.
2.Given the current information, there is not sufficient evidence to say whether the fuzzy density beneath 5-fold symmetry axis is RNA. The authors could discuss the possibility of it being protein, such as the N-terminal region of capsid, which is usually disordered in other nodaviral structures.
3.Literature (ref. 14 &15) has shown two different assembly states of MrNV VLP expressed in E. coli and sf9 cells respectively. Could the structural information reported here help to explain the differences?
4.Structural characterization of MrNV is in need due to the threat from white tail disease. Now with the 7-Å resolution available, the authors could discuss more about followup studies and/or downstream applications leading to potential intervention against white tail disease.
Some minor points:
1.Has the final map been deposited to the EMDataBank?
2.With the current figures, the comparison between AB and CC dimers is a little hard to follow. It would help to label the A, B, C subunits. It is fine to label the dimers with colored arrows, but it would be more clear if the coloring is consistent between Figures 2 and 3. Please also consider including the measurements of angles and lengths in the figures, and labeling the supporting legs of CC dimer with an arrow or asterisk.
Reviewer #2 (Technical Comments to the Author):
The authors present work showing a cryo-EM 3D reconstruction of MrNV virus-like particles with the finding that “pronounced dimeric blade-shaped spikes" protruding above the surface of the particle are arranged differently than canonical structures of Alphanodaviruses. Thus the authors believe the new structure supports the prior assertion that MrNV belongs to a new genus of Nodaviridae designated Gammanadovirus.
The authors use a generally accepted approach during the reconstruction process although the use of a crystal structure as an initial model rather than using an initial model generated from their experimental 2D class averages could possibly confound the interpretation. Whenever a known structure is used it can lead to potential model bias. It is this reviewer’s assumption that the authors used FHV for the initial model since FHV doesn’t have significant spikes on the surface. The authors also used a low-pass filter of 60 angstroms to the FHV initial model to partially mitigate model bias. In both of these cases this is typically an ok approach if significant homology exists. However the authors force icosahedral symmetry during reconstruction and they themselves highlight the fact that MrNV and FHV share only 20% homology. The manuscript could therefore be greatly strengthened by a reference-free 3D reconstruction where the initial model is created from the experimental 2D class averages rather than the FHV crystal structure. If the final reconstruction for the reference-free approach remains similar/identical to the current reconstruction, then the authors will have demonstrated conclusively that the interpretation is sound. Therefore it is suggested that the authors incorporate the results of a reference-free reconstruction into the manuscript (a supplemental figure will be fine). As this requires a rerun of only the 3D refinement image processing step and not new data acquisition, this should not be considered a major modification and if this is successfully implemented then this reviewer recommends publication.
A few other minor comments to be addressed:
According to Reference #9 (NaveenKumar et al. 2013) the capsid protein of MrNV and PvNV only share 44.6% homology but that drops to 22% for the last 115 amino acids at the C-terminus which is the region the author attribute to forming the protruding spikes. Thus, it seems possible that the structure of PvNV may be different. It is this reviewer’s suggestion that the authors refrain from extending their interpretation towards PvNV and simply focus on MrNV throughout the manuscript.
Please define “VLPs” as “virus-like particles” in the abstract rather than just using the acronym.
There appears to be a 6xHis-tag on the capsid protein but it is not used for purification scheme. A sentence should be added to describe why it is included and whether the additional amino acids are anticipated to be present within the dimeric spikes or otherwise impact the interpretation.
During the post-processing steps, a b-factor of -890 square angstroms was applied. Was this calculated automatically using Relion or was it manually chosen?
Figure 1, it would be helpful to see a sampling of the refined 2D class averages in addition to the central slice of the reconstruction.
On line 120, suggest deleting “sharply resolved” to leave sentence as “Inspection of figure 1(b) reveals a capsid shell measuring between 2 and…” since “sharply resolved” is a qualitative term that others may feel is only appropriate for truly atomic resolution structures.
Finally, the homology modelling is an interesting addition to the paper. However, since no conclusive results can really be drawn from the models at this time, it seems more appropriate for figure 4 to move to a supplemental figure.
On 2021-10-26 23:22:30, user Xin Chen wrote:
We appreciate that the authors tested our previous results using new reagents and methods. However, we have to point out that there is a big misunderstanding of our published work. First of all, asymmetric histones do NOT imply the existence of “immortal histones” as the authors hypothesized and used to make predictions in their experimental design. In fact, distinguishing old versus new canonical histone must be in the context of cell cycle progression: Old refers to the pre-existing histones before S phase and new refers to newly incorporated ones during S phase. These two populations can be distinguished by the tag-switch or photoconversion methods only after the switched or converted cell goes through one complete S phase and enters the subsequent M phase. Moreover, the new histones with switched or converted labels will mature over time during cell cycle and gain old histone features, and thus there are no “immortal” histones. However, we are not seeing any labels in this work that indicate active cell cycle progression, which is very concerning given these tissues are ex vivo for more than 40 hours.<br /> Second, it would be highly appreciated if the authors include germline versus somatic cell markers in their figures. As of now, it is impossible to tell whether the weak H3 signals in Figure 1C and 1E come from germ cells or somatic gonadal cells. The bright spot in Figure 3E was interpreted as hub cells, which are quiescent somatic cells. If this is the case, it would be very strange that such a quick old to new H3 turn-over occurs in these cells, as indicated in Figure 3E legend.<br /> Finally, we have to point out that our previous results were entirely misinterpreted in the “Alternative Hypothesis 2” in Figure 2, because we are not assigning random stem cells (GSC) and progenitor cells (SG) together as pairs — all GSC-GB pairs we analyzed are still connected by the spectrosome structure (Tran et al., 2012; Xie et al., 2015; Wooten et al., 2019), indicating that they are daughter cells derived from one GSC division. Furthermore, our previous conclusions were not solely based on the post-mitotic GSC-GB pairs, but also on stem cells undergoing asymmetric cell divisions, based on fixed and live cell imaging.<br /> In summary, this work is based on both misunderstanding and misinterpretation of our work, leading to an incorrect hypothesis. Additionally, there is no single dividing stem cell or a pair of daughter cells derived from stem cell division shown in this work that can lead to the conclusion of “Symmetric Inheritance of Histones H3 in Drosophila Male Germline Stem Cell Divisions”. We hope these comments clarify several critical points for both the authors and the readers of this preprint. Thank you for your attention!<br /> Xin Chen<br /> Johns Hopkins University
On 2021-08-19 14:35:18, user Meng Wang wrote:
We have recently reported that the Tn5-based epigenomic profiling methods, especially Stacc-seq and CoBATCH, are prone to open chromatin bias (https://www.biorxiv.org/content/10.1101/2021.07.09.451758v1). Rather than directly address this bias issue, the authors of Stacc-seq argued in this preprint that FC-I normalization (normalizing by input/IgG control) was better than FC-C (normalizing by background) for Stacc-seq etc. data analysis. Based on this, they claimed that our results had “a major analysis issue”. However, the truth is that we had already used both FC-I and FC-C normalization methods and both showed clear open chromatin bias for Stacc-seq and CoBATCH. The fact that our analyses demonstrating that CUT&Tag (5% FPR) showed much lower FPR than Stacc-seq (30% FPR) or CoBATCH (50% FPR) indicated that the high FPRs were not due to “artificially enhanced the relative enrichment of potential open chromatin bias”, but an intrinsic problem of Stacc-seq and CoBATCH. In our opinion, the preprint has several problems, which are detailed below.
The preprint ignored the fact that we had already used both FC-I and FC-C normalization methods. The authors assumed that we only used FC-C for Stacc-seq etc. (Fig. 1A in Liu et al.). However, in fact we used both FC-C and FC-I in our analyses. In Fig. 1c, d and Fig. S2 of our manuscript (Wang et al.), methods labeled with “with IgG” were results from FC-I normalization, and methods without such label were results from FC-C normalization. Importantly, results from both normalizing methods showed clear open chromatin bias for Stacc-seq and CoBATCH (Fig. 1c,d and Fig. S2 in Wang et al.).
The results of global H3K27me3 enrichment at the Polycomb targets in this preprint (Fig. 1C) was contradictory to their claim that using FC-C would cause “complete loss or dramatic reduction of enrichment at true targets for datasets generated by Tn5-based methods”. Fig. 1C of this preprint showed a clear H3K27me3 enrichment around the TSS of Polycomb targets compared to adjacent regions when using FC-C. The difference between results from FC-I and FC-C is caused by the y-scale. The fold change is a relative measurement, so the y-scale of different normalization methods is not directly comparable. If they set the y-scale of FC-C to 0~2, the enrichment pattern would be highly similar to that using FC-I.
The genome browser snapshots of several loci in a large scale (low resolution) could not demonstrate that the results from FC-I and FC-C normalization are globally different. This preprint provided several example loci (Fig. 1B and Fig. 2 in Liu et al.) to show that using FC-C would cause “complete loss or dramatic reduction of enrichment at true targets for datasets generated by Tn5-based methods”. However, showing browser view of very large regions are misleading as the resolution is too low. For genome browser display, the look of the signal track patterns depends on y-scale, x-scale and windowing and smoothing function. When viewing a very large region, the signals are sampled and aggregated by genome browser and are not the raw signals. Thus, the patterns may not reflect the real situation. Indeed, when zoomed-in to check these regions, we found the peak patterns from FC-I and FC-C normalization are highly similar. In addition, examples from several loci could not reflect the global pattern. The global enrichment shown in Fig. 1C of this preprint did not support their conclusion, as discussed in point 2.
In summary, our original analysis has already included the normalization method suggested by the authors of this preprint. Results from both normalization methods supported that Stacc-seq and CoBATCH had high open chromatin bias. In fact, the results from this preprint also support our conclusions. In Fig. 2 of this preprint, regardless whether FC-I, FC-C or RPKM were used, the discrete peaks from Stacc-seq etc. were more similar to ATAC-seq peaks, but were totally different from ChIP-seq peaks.
Meng Wang and Yi Zhang<br /> Howard Hughes Medical Institute, Boston Children’s Hospital, Boston, Massachusetts 02115, USA
On 2021-05-04 15:06:24, user AAAAAAAAAA wrote:
I noticed that you did the high salt tagmentation (300mM NaCl) for PBMC mixing experiments, which I think is the "right" way to avoid the open chromatin bias but for other experiments, you did the tagmentation in 10X ATAC buffer (10mM NaCl). Is there a particular reason for this? I thought the low salt would have serious ATAC signals, which is demonstrated in the original CUT&Tag paper.....
On 2021-01-18 08:53:01, user The_Zman wrote:
There's an error in the liganddock.xml protocol file, there's a missing closing tag for <scorefxns>
On 2020-12-04 18:31:34, user Jordan Berg wrote:
https://github.com/Metabove...
See https://metaboverse.readthe... for a full list of updates.
And thank you to all who have helped track down bugs and suggested new features! More to come!
On 2020-09-21 17:20:33, user Jordan Berg wrote:
Metaboverse v0.3.0b is live!<br /> https://github.com/Metabove...
See https://metaboverse.readthe... for a full description of updates.
On 2020-08-26 16:46:04, user Jordan Berg wrote:
Metaboverse v0.2.0b is live!<br /> https://github.com/Metabove...
See https://metaboverse.readthe... for a full description of updates.
On 2020-07-29 18:00:44, user Jordan Berg wrote:
Metaboverse v0.1.4b released:<br /> - Fixes minor/non-critical dependency issues<br /> - Adds error log output file for error messages that do not fit in alert pop-up box for easy troubleshooting
On 2020-07-01 19:10:35, user Jordan Berg wrote:
Metaboverse v0.1.3b released:<br /> - Allows for spaces in file names and folders<br /> - Allows to be run in Windows in non-admin mode
https://github.com/Metabove...
Let us know if you have any feedback! https://forms.gle/4z51DMnag...
On 2020-11-16 23:18:09, user Fraser Lab wrote:
This manuscript details the efforts of a team of structural biology computational experts to cross-validate the proliferating SARS-CoV-2 structures emerging during the COVID-19 pandemic. Over the past five months, as soon as each new SARS-CoV-2 structure is made publicly available, the authors have subjected it to a barrage of validation metrics as well as residue-by-residue manual inspection. When they were able to get a hold of the raw data, they analyzed that as well for several of the most commonly occurring pathologies. Re-refined structures were sent back to the structures' original authors for reupload to the PDB via the recently available versioning option that preserves the PDB code (although it would be nice to quantify how many authors were contacted and what the “re-versioning” rate is after contact). In this manner, the structural biology community has simultaneously benefitted from an increased number of experimentalists' single-minded focus on the coronavirus (even where these efforts fall partly outside their areas of expertise) and these experts' careful curation of the resulting structures.
The manuscript represents an incredible effort. As the authors call attention to in a few places, the errors in data processing and modeling are not only inevitable (especially under the circumstances) but tolerable, as long as they can be identified and corrected in a timely manner — the goal is not to gatekeep so that only experts are permitted to do this work, but to tag-team as effectively and efficiently as possible. Furthermore, there is the separate issue of pathologies resulting from decisions during data collection that cannot be corrected after the fact. It is critical that fixable and unfixable issues are extremely clearly distinguished from each other. We suggest the authors rewrite some of these narratives with the deliberate aim of identifying the origins of pathologies that can be mitigated or corrected in full, again differentiating between these, and taking care that the wording is as charitable as possible toward the researchers responsible.
There are a few cases of oversimplified concepts that we believe can be succinctly expressed more accurately. For example, where the authors describe data as being "incomplete due to radiation damage," they could instead take the time to explain the difference between incompleteness resulting from a poorly chosen collection strategy, incompleteness in higher resolution bins, and radiation-induced damage that renders some reflections (and some real-space features) self-consistent but inaccurate. The "lower quality" of datasets suffering from these pathologies could be separated into uniformly low resolution datasets, which are more easily recognizable, and seemingly high-resolution datasets with serious systematic errors.
The authors could also be more clear with a couple choices of wording around concepts of correctness. They write, "While the deposited structures are often improved by PDB-REDO, they need to be checked and should not be viewed as 'more correct' purely on [the] basis of a lower R value." In this and several other instances, we challenge the authors to replace any terms assigning value (improved, correct, error, bad, misidentified) with descriptions of what metrics they are examining and what they mean for the model and data. This publication is an opportunity to instill readers with a stronger sense of how to use the existing validation tools, and what to do when they turn up serious issues. It would be highly useful to go into some explanation of what constitutes model bias and how this is detected in crystallographic and EM data, what metrics we traditionally use to detect it, what happens when we refine against those metrics (!), and how the tradeoff between agreement with priors (geometry, clashscore) and agreement with data (real space CC, FSC) should vary with map quality. If the authors are willing to go as deep as explaining how the available validation metrics were devised, the average reader might learn quite a bit!
A separate but closely related issue is the identification of real features that conflict with prior knowledge. Under what circumstances do we accept "bad" geometry is actually the right way to model something? These are often information-rich and functionally relevant discoveries, such as Hoogsteen base pairing or very strained geometries at a catalytic site. This is worth calling attention to.
We read the opening of the "manual evaluation" section as a framing of structure solution as tedium that should be automated as much as possible, but whose results nevertheless fall short in the absence of an expert's intervention. This is unfortunate. We would rather laud both the amazing efficiency (and thereby throughput) that automating routine steps has made possible and the important role of the researcher in guiding the process and interpreting the results.
On the topic of data not deposited in the PDB, the authors describe a case of a severely radiation damaged dataset and how it was necessary to reprocess the raw data to improve it. We strongly agree that raw data should be made publicly available for exactly these sorts of reasons. Once again, separating this administrative barrier from the researchers' decisions during data collection would be helpful in setting a positive tone. The authors point out the amazing proteindiffraction.org resource and should call for more deposition there (or to SBGrid DataGrid). In EM, the EMPIAR database plays a similar role (with greater proportional adoption) and the reprocessing potential of datasets deposited there should be highlighted and celebrated.
The "supplying context", "summary" and especially "outlook" sections bring up some extremely important points that could bear to be repeated at the beginning of the manuscript to help frame this work. The tradeoff necessary under the present circumstances in particular — the fact that imperfect "first draft" structures are still useful, and much more useful when they can be quickly updated with any corrections — deserves greater emphasis, and perhaps further discussion of how the field should go about addressing and documenting problems with models and data after the pandemic. We are overall very excited to see this work in print alongside the resources already publicly available at insidecorona.net. Collectively, that resource and this manuscript represent an exciting development in peer review away from gatekeeping and toward continuous improvement!
Finally, we note a handful of points that we suggest would improve readability:<br /> SARS-CoV is now also known as SARS-CoV-1. We strongly suggest using this term throughout the manuscript to differentiate it from SARS-CoV-2.<br /> The phrase "not by experimentalists, but scientists from other fields" suggests a false dichotomy. We recommend rewording so as to recognize the existence of experimentalists in other fields. <br /> The rationale for annotating secondary structures with the Haruspex neural network is not yet clear.<br /> The COVID-19 pandemic is "unprecedented" in very recent history, but arguably not unique even in recorded history — we would favor a different term here.<br /> The abbreviation RdRp is not defined.<br /> "fulfil" is a typo.<br /> “Structures solved in a hurry to address a pressing medical and societal need _are_ even more prone to mistakes.” - suggest "may be"
James Fraser and Iris Young (UCSF)
On 2020-09-30 10:20:45, user Emilian Stoynov wrote:
Interesting article. Can you provide information how long was kept in captivity the captive bred individual with the patagial tag prior to be released again with leg-mount tag replacing the patagial one? Frequently, captive bred birds perform better when re-released after sometime of refueling/rehabilitation following the original release. This fact may bias the data from switching between different type of tags. The best would have been if this result was obtained by marking wild experienced bird first tagged with patagial and afterwards switched to leg-mount tag.
On 2020-09-18 02:09:42, user Maria Ingaramo wrote:
Summary: for now, we recommend using the S11 tag at the N-terminus of target proteins.
Details:<br /> We'd like to thank Dr. Abby Dernburg for pointing out that our S11 fragment, which ends in two glycines, might act as a C-terminal degron signal (doi.org/10.1016/j.cell.2018...:DdzbmEETvEUkkesPwEqFKBomMYw "doi.org/10.1016/j.cell.2018.04.028)"). We've successfully tagged proteins at both the N-terminus and the C-terminus, but we have not established that these yield similar expression levels. We take this concern very seriously, and we're checking this now. Results will be posted here and at andrewgyork.github.io/split_wrmscarlet. In the meantime, we recommend avoiding the potential issue by attaching the S11 fragment at the N-terminus. If C-terminus tagging is required, we suggest the alternative S11 sequence YTVVEQYEKSVARHCTGGMDELYK.
-Maria Ingaramo
On 2020-07-06 15:50:28, user OxImmuno Literature Initiative wrote:
On 2020-06-26 10:15:50, user Ersa Flavinkins wrote:
Major issue with the article: the vector, the pcDNA3.1-N-myc/C-C9 vector, is not found nor availible from catalogue in anywhere. All the ACE2 proteins are stained with anti-C9 antibodies--indicating that the cloned part is not the entire mRNA.
The original specification of the c-myc/c9 vector was stained by the anti-c-myc antibodies on the cell surface--so there is an additiona signal peptide in fromt of the c-myc tag in the vector.
no pcDNA3.1 vector have an AgeI site and XM_017650263.1 is not cut by either AgeI or Acc65I. As the human, civet and rat ACE2 gene is specified to have their signal peptide removed before cloning into their vector, the vector must carry it's own signal peptide--which is before the c-myc tag as the original thesis at ref.55https://www.ncbi.nlm.nih.gov/pmc/ar... and ref.34 https://www.ncbi.nlm.nih.go...
specified the staining of the cells via antibodies targeting the c-myc tag on the N terminii of the ACE2 receptors.
This leave all the receptors--the Human,Civet and the Rat--with an N-terminal C-myc tag. and the Ferret badger, Rhesus, Raccoon dog, Hog badger, Free-tailed bat, Rabbit, cat and dog ACE2 receptors may potentially contain parts of the signal peptides themselves or even the entire signal peptide. The Rs bat and pangolin ACE2 receptors were cloned into an unknown vector and there is no way of telling whether the Signal peptide, c-myc tag or other AAs were retained or not. However, as these were all marked as C9 tagged on the C-terminus, the exact cloned part must not include the C-terminal stop codon or other parts of the mRNA since the natural Stop codon will prevent C9 tag expression.
There is no indication of the N-terminal clone site for the 2 ACE2 proteins, but the Human, Civet and Rat ACE2 is specified to have the signal peptide sequence removed. and therefore an additional signal sequence must be included before the C-myc tag in the vector to enable cell surface display.
As the article specifies that the ACE2 proteins expressed from such vectors have a "N-terminal c-myc tag and a c-terminal C9 tag", the tage expressed as specified have serious issue with steric clashing with the other S1 RBD monomer and therefore downplaying the Human, Rat and Civet ACE2--this may be even more severe with the other ACE2 and the exact N-terminal status of the Rs and pangolin ACE2 receptor is impossible to tell. Over all, this experiment is heavily contaminated and there is no way to actually deduce the results by just their method section alone. As no published vector available offers simultaneousy the N-myc and C-C9 tagging capability in the protein product, it may or may not be the same vector as specified before.
At best, it may downplay the ability of hACE2 to mediate entry with the PP assay by steric clash with the Tag and potential AAs in front of them--indicating an intentional overplay of Rs bat and pangolin ACE2 receptor by handicapping the rest with a bulky protein tag and a potential antibody binding to the tag, all of which clashes with the rest of the S glycoprotein and significantly decreases the entry efficiency, at worst--if the specified N-myc/C-c9 vector is the same as the vector described before, it mean that none of the PP assays are trustable as actual, unbiased data.
Notably, the PP assay result described here is in conflict with another paper https://www.biorxiv.org/con... using the exact same protocol but specified a different N-terminal tag--the HA tag, again on the N terminus of their ACE2 proteins. Notably, the Rs bat and Rat receptor affinities, as well as the Feline and pangolin receptor affinities, as by PP assay, were inverted in the 2 publications. As well as the Feline and Rabbit receptor affinities--despite the feline and rabbit are specified as being tagged using the same protocol in both publications--c-myc in this and HA in the other.
Unless the exact cloning sequences of the vectors and the inserts are published, neither publications can be used as an exact indicator of the true affinities of the ACE2 to the S glycoprotein, and none of the publications may be used as a true indicator, in isolation or in tandem, of the true affinities of animal ACE2 to the SARS-CoV-2 Spike glycoprotein.
On 2020-06-16 21:57:53, user Fraser Lab wrote:
I am posting this review on behalf of a student from a class at UCSF on peer review: https://fraserlab.com/peer_... . The student wishes to remain anonymous. I will be happy to act as an intermediary for any correspondence.
In this manuscript Moti et. al., propose a novel way of visualizing Wnt transport from the ER to the membrane using the Retention Using Selective Hook (RUSH) system. Through use of this system, they also provide insight on the involvement of filopodia used for signaling by Wnt3A.
Overall, the authors provide a very promising system for live visualization of Wnt transport inside of a producing cell. Wnts are known to be particularly difficult to tag and visualize in a live model, and this lab was able to show that their tagged Wnt3A not only transports as expected but also is still capable of signaling.
Aside from the tool they developed, the authors state that Wnt transfer between cells via actin-based filopodia. Though they do show that Wnt-positive vesicles are seen in projections, they make the strong claim that it is being transferred to a receiving cell. The images and videos show movement in the projections, but the experiments do not show that the projections are touching the neighboring cell or transferring the vesicles. In supplemental video 5B, the Wnt-positive vesicles appear to actually be migrating into the cell body as opposed to the neighboring cell, which was not discussed.
The major success of this paper is the creation of a functional RUSH-Wnt3A construct that can be used to visualize Wnt transport in the producing cell. As Wnts are very difficult to tag or manipulate, this is a great achievement and its use will strongly help further our understanding of Wnt transport.
Minor points:<br /> The authors switched between HeLa, 293T and RKO cells for different conditions. As the RKO cells were engineered with WLS knockouts, the WT RKO cells could serve as the cell line to test for RUSH-Wnt3A alone and with the Porcupine inhibitor. If this was done intentionally, the authors should state why this was done. Otherwise, using the same cells for each condition would eliminate other factors that could affect the transport of RUSH-Wnt3A. <br /> Transfection of reporter cells (STF reporter) cells with RUSH-Wnt3A for signaling assay. These results would show self-activation of Wnt signaling. Could the STF reporter cells be co-cultured with a different cell line transfected with RUSH-Wnt3A to see the activity levels of the receiving cell? This could further support filopodia, or at least cell contact, as a way of activating cell signaling.<br /> Figure 6a is missing a label for what I suspect is LGR5834DEL.<br /> Figure 6c – would like to see filopodia quantification for LGR5(FL) and a non-transfected cell.
On 2020-05-19 00:55:54, user Fraser Lab wrote:
I am posting this review on behalf of a student from a class at UCSF on peer review: https://fraserlab.com/peer_... . The student wishes to remain anonymous. I will be happy to act as an intermediary for any correspondence.
This manuscript by Wang et al., uses tagged PKD-2 extracellular vesicles (EVs) in C. Elegans to explore the potential role of EVs in directional transfer from one organism to another.
Overall, they identify a mechanoresponsive nature of certain male sensory cilia to release EVs, which are then found to be specifically located on the vulva of his mating partner.
The authors provide compelling evidence that the male tail sensory cilia can respond to global pressure to release EVs, in that the usage of agarose-coated coverslips and slides was a robust way to perturb the forces that a male nematode feels when mounted.
Separately, they also provided evidence of directional transfer of EV cargo from male to hermaphrodite C. elegans during mating. Specifically, showing that in inseminated hermaphrodites, there was highly localized deposition of the male-specific PKD-2-carrying EVs along the hermaphrodite vulva. Though, this study was limited by the inability to perturb EV budding and determine causality between EVs and presence of PKD-2 on hermaphrodite vulvas.
The major success of this paper was in their ability to tag and visualize EVs, and use this technique to identify a candidate mechanism of release for extracellular vesicles. All in all, this paper opens a door for determining potential biological functions for extracellular vesicles, which has been largely elusive in the field.
Minor points:<br /> Figure 1B could benefit from having an inseminated control image, to visualize which signals are present as autofluorescence<br /> It was unclear how many worms were imaged in the directional transfer experiment, but having that number would be important in establishing reproducibility
On 2020-05-05 20:42:00, user Taekjip Ha wrote:
Thank you very much for sharing your interesting manuscript!<br /> We used your preprint as one of the journal club papers in the Single<br /> Molecule & Single Cell Biophysics course for graduate students of Johns<br /> Hopkins University during the Covid-19 lockdown. Students also practiced peer<br /> reviews as the final assignment. I am submitting their formal reviews here <br /> and hope you find them useful.
Taekjip Ha
Reviewer 1.
The authors develop an ?-hemolysin nanopore-based sequencing by synthesis assay<br /> which can be used to interrogate the kinetic properties of single DNA<br /> polymerases. Their method is novel and addresses the problem of increasing the<br /> throughput of polymerase screening methods. Previous techniques only allowed<br /> kinetics of polymerases to be screened one at a time. This new method is a<br /> clever integration of existing nanopore sequencing technologies that addresses a<br /> longstanding problem in development of specialized polymerases in biotechnology.<br /> The paper is interesting to read and not especially difficult for someone<br /> outside of the field to understand.
Each polymerase-pore complex could be uniquely tagged with a circular barcode<br /> template, allowing the assay to be multiplexed and scaled up to accommodate 96<br /> complexes at once. Convincing proof of concept data is shown highlighting the<br /> ability of the method to distinguish between barcodes, as well as the stability<br /> of the circular template. The title and abstract are appropriate, concise, and<br /> clearly lay out the aims of the paper. Introductory figures showing assay design<br /> and low throughput tests are very well presented and easy for the reader to<br /> follow. Low throughput tests show clear clustering, in both two-dimensional<br /> plots and PCA, of data obtained from each tested polymerase which could be used<br /> to distinguish and characterize them. Later in the paper, however, there are<br /> confusing inconsistencies between what is stated and what is shown in the data.
Figure 3a shows how each kinetic parameter is defined by the voltage trace. Only<br /> four of the five kinetic parameters are shown: dwell time, tag release rate, tag<br /> capture rate, and full catalytic rate. Tag capture dwell time (TCD) is not<br /> shown, yet it is featured in the principle components analysis and is shown to<br /> have a relatively high coefficient for some polymerases. How this parameter is<br /> defined by the trace and how it differs from dwell time is not clearly addressed<br /> in the main text of the paper. This figure (3a) and the subsequent analysis<br /> could be improved by explaining how each parameter is calculated and how they<br /> differ to clear up any ambiguity. Explanations of how each parameter correlates<br /> to polymerase fidelity, processivity, speed, etc. may also help convince the<br /> reader of the utility of their method. This is done well for some but not all of<br /> the described parameters.
Figure 5 shows the distribution of counts associated with each of 96 unique<br /> circular barcodes over three polymerases. RPol1 is associated with relatively<br /> few read counts which are not much higher from background off-target signal from<br /> RPol33. The uneven distribution of barcode counts is attributed to the low<br /> processivity of polymerase 1. Later (figure 6), in the 96-plex screen of<br /> polymerase mutants, less than twenty mutants in the screen have detectable<br /> barcode counts and those that do have few counts. This observation is again<br /> thought to be due to poor processivity of the polymerases. Polymerase fidelity<br /> very likely also plays a role in the ability of the assay to identify<br /> polymerases. Since barcode assignment is alignment based, and nanopore<br /> sequencing platforms are known to have a relatively high error rate as well, one<br /> can imagine that a more error-prone polymerase will also escape detection. There<br /> is no benchmarking data to define a polymerase detection threshold. It is clear<br /> that the efficacy of the method decreases for polymerases with lower fidelity<br /> and processivity, but what might be designated as ‘low’ is never defined. What<br /> subset of polymerases make it through this new screening process and what are<br /> their defining kinetic characteristics? How widely applicable would this method<br /> be for identifying desired features in polymerase variants? What kinds of<br /> polymerases would be expected to be missed by the screen?
There are some minor inconsistencies in the data that should be addressed.<br /> Supplemental table 5 shows the calculation of the proportion of mapped reads in<br /> the low throughput 3-plex experiments. The number of total raw reads used to<br /> calculate the 67% CBT mapping as described by the main text is 418, the value<br /> for RPol1 alone rather than a sum of the total read values for all three<br /> columns. Similarly, the text states that 20 polymerase variants were identified<br /> in the screen while figure 6a shows only 17 polymerases were associated with<br /> barcode counts.
The method described in the paper is conceptually strong and should be very<br /> helpful in identifying polymerases with desirable kinetic properties when<br /> coupled to mutagenesis screens. It has the potential to be improved upon as<br /> nanopore sequencing technology is further developed and the error rate that is<br /> currently innate to the platform is decreased. It is likely that general<br /> improvements to nanopore sequencing itself would greatly decrease false positive<br /> rates in the described method. This technique could also be more applicable if<br /> its points of failure were addressed and proper thresholds defined. The higher<br /> false positive rate observed in RPol2 (supplemental figure 11a) is more likely<br /> to be a fault of the polymerase fidelity rather than a characteristic of the<br /> barcode set. What kind of polymerase misincorporation rate is permissible to<br /> still allow confident barcode assignment? At what point does polymerase<br /> processivity become an issue and cause ambiguity in barcode identification?<br /> There appears to be a set of kinetic parameters that must be met in order for<br /> differences in polymerases to be resolved by this assay. Clearly defining what<br /> it is good at and what it is going to miss is essential before it can be used<br /> reliably for screening.
Reviewer 2.
Summary<br /> In this article, the authors expand upon their previously published system of singlemolecule<br /> nanopore sequencing-by-synthesis and investigate whether it can be scaled-up to be<br /> used as a screening method downstream of polymerase directed evolution experiments. The<br /> major advancement in this paper is that as a screening tool for polymerases, it also has the<br /> capability to provide detailed kinetic information on each of the polymerases, something that<br /> prior methods struggled to do. As a proof-of-principle, the authors simultaneously screen 96<br /> polymerases with 96 barcodes and extract kinetic data from their single-molecule profiling.<br /> This work has multiple merits. Notably, although the general framework is the same, the<br /> authors have made a series of changes to improve their system since their previously published<br /> work, that played a role in allowing them to make multiplexed measurements. The authors also<br /> creatively pull a variety of kinetic parameters from their single-molecule voltage traces that<br /> allow them to easily separate different polymerases after principle component analysis.<br /> On the other hand, the work has a couple of issues, detailed below, with regards to<br /> controls and clarity that would be helpful if addressed.<br /> Major Issues<br /> 1. The authors utilize DNA bases that are tagged to generate unique signals for recognition<br /> when captured and blocking the nanopore. From the principle component analysis<br /> tables (Supplementary Table 4a-c), it appears that the polymerases vary quite a bit with<br /> regards to processing different bases. At present, it is unclear whether these kinetic<br /> differences are being caused by differences between structures of the bases, or whether<br /> they are caused by differences between structures of the tags. One control would be to<br /> repeat one set of experiments with the tags shuffled between the bases and observe<br /> how reproducible the results are. This would give the reader a sense of how much<br /> measurements are being affected by the tags used for this technique.<br /> 2. For the experiment in Fig. 5, the authors end up showing that barcodes can be identified<br /> with a false positive rate of 13%. This is with a pilot experiment of 96 barcodes. From<br /> this data, it suggests that this technique would be difficult to scale-up any further, which<br /> may limit its usefulness – in fact even 96 barcodes may already be pushing the limit.<br /> From reading the paper, it is unclear if what is dominating this problem is the length of<br /> the barcode (i.e. limited sequence divergence due to 32-nt), or if nanopore sequencing<br /> accuracy is still a limiting factor. It would be great to see a small pilot experiment with<br /> longer barcodes to see if this could allow for improved accuracy, or some in silico<br /> statistical modeling extrapolating from their current data (e.g. length of barcode x<br /> required to accurately separate number of polymerases y with a false positive rate of z).
quite flexible, it still is unaddressed whether this repeated jostling of the tag<br /> (linked directly to the base) would affect kinetic measurements. Overall, it would be nice<br /> to see some measurements compared or benchmarked against a more well-established<br /> technique side-by-side (e.g. single-molecule optical trap), just to see if the data matches<br /> up or not. Notably with a parallel technique, you can also do the control of tagged vs.<br /> untagged nucleotides, thus unambiguously determining the potential effect of a tag on<br /> polymerase kinetics.<br /> Minor Issues<br /> 1. In the abstract the authors mention they “develop a robust classification algorithm that<br /> discriminates kinetic characteristics of the different polymerase variants.” It is unclear<br /> what this is referring to in the paper. If it is simply the principle component analysis then<br /> saying “develop” may be a bit overreaching.<br /> 2. Rather than referring to prior publications this publication should have in the<br /> supplement and/or methods the exact nucleotide + tag combinations used in this paper.<br /> 3. It is unclear after reading the methods why there are three separate PCA tables per<br /> polymerase in the supplement.<br /> 4. It is unclear what is the difference between tdwell and tag capture dwell from the written<br /> descriptions in the paper. Highlighting the difference visually in Fig. 3a (as was done<br /> with the rest of the kinetic variables) would help the reader clearly understand exactly<br /> what is being measured.<br /> 5. A table of the 96 barcodes used for Fig. 5/6 should be added to the supplementary<br /> materials.<br /> 6. The numbers in Supplementary Table 5 do not add up correctly – the authors should<br /> take a look again and make sure the correct numbers are present.<br /> 7. In Fig. 2 the authors experimentally calculate BMPI cut-offs for 3 different barcodes and<br /> get 0.8, whereas in Supplementary Fig. 8 the authors do an in-silico calculation for BMPI<br /> cut-off and still get 0.8. One would imagine that increasing the number of barcodes<br /> would require a stricter BMPI cut-off. Some sort of commentary on this, or perhaps<br /> reanalysis of the multiplexed data with a stricter BMPI cut-off could be helpful.<br /> 8. In Supplementary Fig. 12 the authors show a protein gel of their pore-polymerase<br /> conjugates. The bands show that post-linking, there is still a decent amount of nonlinked<br /> polymerase. In the methods there is no mention of a size exclusion purification<br /> step post-conjugation. Are the authors loading a mixed population onto their chips? This<br /> needs to be clarified.<br /> 9. In Supplementary Table 7 the tag capture dwell (TCD) variable missing.
Reviewer 3.
In the study titled Multiplex single-molecule kinetics of nanopore-coupled<br /> polymerases, Palla et al. developed and demonstrated the use of a<br /> single-molecule sequencing technology for the high-throughput identification of<br /> DNA polymerases with desired kinetic properties. Nanopore sequencing reactions<br /> were carried out on complementary metal-oxide-semiconductor (CMOS) chips, each<br /> of which contains over 30,000 individually addressable electrodes, thereby<br /> allowing sequencing reactions to be carried out on each chip in a multiplex<br /> fashion. Each DNA polymerase was coupled to an ?-hemolysin pore and bound to a<br /> 51 bp circular barcoded ssDNA template (CBT). The template is bound to a primer,<br /> thus enabling the incorporation of the appropriate nucleotides by the polymerase<br /> into the ssDNA template. Since each ssDNA template is circular, multiple<br /> iterations of the barcoded region can be observed during the sequencing of each<br /> template. Furthermore, each of the four nucleotides are uniquely tagged. When a<br /> nucleotide is being incorporated into the template ssDNA, the tag attached to<br /> the nucleotide is captured in the nanopore, thereby decreasing the conductance<br /> through the pore. Such a decrease in conductance is measured by an analog to<br /> digital converter (ADC) placed parallel to the sequencing circuit, and the<br /> recorded ADC values are then converted into a fraction of open channel signal<br /> (FOCS). Because the four tags are different from each other, the corresponding<br /> FOCS generated differ from each other as well, and can thus be used to<br /> distinguish the nucleotides from each other. Using a software, the FOCS is<br /> converted into raw reads. Then, using a barcode classification algorithm, each<br /> qualified raw read is compared to any template of the experimenter’s choice.<br /> Aligning a raw read to the correct template will more likely generate a higher<br /> barcode match probability index (BMPI) value for that read, while aligning a raw<br /> read to an incorrect template will more likely generate a lower BMPI value for<br /> that read. As such, for each sequencing experiment, the average BMPI value<br /> (derived from comparing raw reads to a template) can be used to identify the<br /> template to which the polymerase is bound. And if each polymerase-template pair<br /> is unique, the average BMPI value can then be used to identify the polymerase as<br /> well. Lastly, the authors defined a set of five kinetic parameters that can be<br /> measured during the course of a sequencing reaction. Because different<br /> polymerases are likely to differ from each other with respect to these kinetic<br /> parameters, comparison of the parameters between polymerases can help identify a<br /> polymerase with the desired properties.
To develop their nanopore sequencing technology, the authors first showed that<br /> the BMPI value can be used to identify a CBT. Thereafter, the authors showed<br /> that, after a polymerase is loaded with a particular CBT, the loaded CBT will<br /> not get replaced by another CBT that is present in the same reaction volume,<br /> thereby demonstrating the potential for multiplexing this sequencing platform.<br /> Then, as stated above, the authors defined five kinetic parameters that can be<br /> measured during sequencing. Using Principle component analysis (PCA), the<br /> authors showed that these kinetic parameters differ between polymerases, thus<br /> indicating the ability of this platform to distinguish polymerases based on<br /> these parameters. To demonstrate the multiplex potential of their platform, the<br /> authors conducted multiplex experiments in which different sets of CBTs were<br /> loaded onto three different polymerases. These pore-polymerase-CBT conjugates<br /> were then pooled prior to loading onto the CMOS chip. Notably, these experiments<br /> showed that CBTs can be identified in a pooled format. Finally, as a practical<br /> demonstration of the capability of the platform to identify, in a multiplex<br /> format, polymerases with properties of interest, the authors generated 96<br /> polymerases, each of which was then loaded with a unique CBT. In this multiplex<br /> reaction, the authors identified four polymerases that are potential candidates<br /> for further development for use in DNA amplification methods.
Here are some thoughts I had while going through the preprint:
The authors state that, in their pooled 3-plex sequencing experiment, about<br /> 67% of the raw reads (n = 418) were identified as any of the three barcodes used<br /> in the experiment. In Supplementary Table 5, it can be seen that, for total<br /> RPol-CBT, [the percent of raw reads with BMPI > 0.8] = [the number of raw reads<br /> with BMPI > 0.8] / [the total number of raw reads]. That is, 66.9% = 280 / 418.<br /> However, the table shows that the total number of raw reads for the RPol1-CBT1<br /> alone is 418. If this is the case, it is unclear to me how the total number of<br /> raw reads for all three RPol-CBTs (RPol1-CBT1, RPol2-CBT2, and RPol3-CBT3) can<br /> be 418 if that of RPol1-CBT1 alone is already 418.
On p19, line 1, I believe that “Experiments 1 and 3” should say “experiments<br /> 1 through 3”, since in all three of these experiments, the raw reads were<br /> compared to the correct template, as noted in the legend below the figure<br /> (Supplementary Figure 6b).
In Supplementary Figure 6a, the color-coding legend indicates that the<br /> barcode region of the ssDNA template is highlighted in grey. However, nothing in<br /> the ssDNA sequence was highlighted in grey.
The data presentation for Supplementary Figure 6b along with the associated<br /> text description are a bit confusing too me. It is stated that, in experiments<br /> 1-3, the reads were compared to the correct templates, while the reads in<br /> experiment 4-5 were compared to the incorrect templates shown in Supplementary<br /> figure 6a. In this part of the study, the three pore-polymerase-CBT conjugates<br /> (RPol1:CBT1, RPol2:CBT2, and RPol3:CBT3) were first individually assembled, and<br /> then pooled and loaded onto the CMOS chip. Assuming that this has been done for<br /> each of the five experiments indicated in Supplementary Figure 6, then there is<br /> really no universally correct template (e.g., comparing CBT1 to the raw reads of<br /> a pooled experiment would only yield higher BMPI values for a third of the reads<br /> (i.e., only for RPol1:CBT1-derived raw reads). Are the raw reads from experiment<br /> 1, 2, and 3 compared to CBT1, CBT2, and CBT3, respectively? This wasn’t<br /> specified anywhere in the text.
Regarding Figure 6a, the authors stated that, out of all of the 96<br /> polymerases screened in this multiplex experiment, 20 polymerases were<br /> identified as having detectable activity (p23, bottom). However, as depicted in<br /> Figure 6a, there are only 17 polymerases for which the associated barcodes were<br /> counted (i.e., there are only 17 yellow bars). Thus, it is unclear to me where<br /> the number “20” is derived from.
In the PCA analysis in Supplementary Figure 11, the authors tried to map the<br /> sequencing data derived from the multiplex experiment back to those derived from<br /> the singleplex experiments involving the same three polymerases. The sequencing<br /> data set for the second barcode set (CBT33-64) could not be mapped back well,<br /> and it was stated that this might be due to the high false positive rate of<br /> barcode identification for that barcode set. That being said, as indicated in<br /> Supplementary Table 6, the false positive rate for RPol1:CBT1-32 and<br /> RPol2:CBT33-64 are 11.94% and 16.06%, respectively. Thus, if the author’s claim<br /> is true, the inability to map back is due to a 16.06% – 11.94% = 4.12%<br /> difference in the false positive rate. It is unclear to me if a 4.12% difference<br /> in false positive rate would really lead to such a dramatic difference in the<br /> ability to map back. Also, it is unclear if this higher false positive rate<br /> arose due to polymerase (RPol2), the templates (CBT33-64), both, or neither.<br /> Logically, it seems unlikely that the rate would be due to the CBTs since it is<br /> unlikely that the middle third of the set of 96 CBTs would just happen to give<br /> higher false positive rates in comparison to the other two thirds. An easily<br /> accomplished comparison between two polymerases would be to load both<br /> polymerases with the exact same set of CBTs, and then compare the derived false<br /> positive rate for each polymerase. Then, one can repeat the experiment but using<br /> a different CBT set. This will help narrow down whether the observed false<br /> positive rate is due to the polymerase or the CBTs themselves.
Regarding Figure 5, it is unclear to me the exact differences between 5a and<br /> 5b. I see that the data presentation is a little different, but I’m not sure if<br /> both figures are necessary here given that both deal with the same three<br /> polymerases as well as the same set of 96 CBTs.
It is stated that the surface of each individual CMOS chip contains 32,768<br /> electrodes (p30) and that the chip contains thousands of pores (p4). Now, as<br /> mentioned in the measurement setup (Figure 1a legend), the measurement setup<br /> requires two electrodes (a counter electrode and a working electrode). Given<br /> this, it is unclear to me what proportion of those 30,000-some electrodes are<br /> working or counter electrodes. I believe that clarification on this would help<br /> the reader get a better sense of the number of pore-polymerase-CBT conjugates on<br /> each individual CMOS chip, and thus, a better sense and appreciation of the<br /> multiplex scale.
On p30, under the section Pore-polymerase-template complex formation,<br /> “SpyCather” should say “SpyCatcher” (i.e., a “c” is missing).
On 2020-05-05 18:33:30, user Taekjip Ha wrote:
Thank you very much for sharing your interesting manuscript!<br /> We used your preprint as one of the journal club papers in the Single<br /> Molecule & Single Cell Biophysics course for graduate students of Johns<br /> Hopkins University during the Covid-19 lockdown. Students also practiced peer<br /> reviews as the final assignment. I am submitting their formal reviews here <br /> and hope you find them useful.
Taekjip Ha
Reviewer 1.
Summary:<br /> In this study, the authors describe the development of a tool that can be used<br /> to observe and measure single-moleculeCap-dependent and Cap-independent<br /> translation, concurrently, in live cells. The authors spend a considerable<br /> portion of themanuscript on controls to rule out ribosome run-through from the<br /> first ORF to the second, swapping tags, and addressingfluorescent bleed through,<br /> which is appreciated. They also present novel measurements including translation<br /> site localizationand diffusion, ribosome occupancy, and elongation rates. The<br /> translation elongation measurements are particular striking giventhat an<br /> analogous single-molecule experiment has not been demonstrated previously.<br /> Overall, this study is elegant in its useof the bicistronic construct and has<br /> potential applications in studying endogenous eukaryotic IRES elements, such as<br /> incircRNAs.
Given that, there are certain points of clarification that should be addressed<br /> or expanded upon in the manuscript.
Major comments:
Minor comments:<br /> 1. Under stress conditions, Figure 6D shows that Cap-only translation sites<br /> decrease in intensity while IRES-only translationsites increase in intensity.<br /> Presumably, the following analysis should be obtainable with the same data set.<br /> What is the“stretching” measurement at these sites? Given statements by the<br /> authors, Cap-only translation sites should be more compactunder stress<br /> conditions compared to Cap-only translation sites without stress. The inverse<br /> should be true for the IRES-onlytranslation sites. <br /> 2. There is no description of the method used to measure the distance for RNA<br /> stretching. From the illustration in Figure 3A,it appears that the measurement<br /> is made from the center of each fluorescent spot to the center of the other, but<br /> an explicitdescription of the method would be appreciated.
Reviewer 2
Peer review of the preprint, “Quantifying the spatiotemporal dynamics of IRES<br /> versus Cap translation with single-molecule resolution in living cells”<br /> Koch, A. et al. investigate the unknown single molecule dynamics of viruses<br /> hijacking host cells using internal ribosome entry sites (IRES). In order to<br /> determine the dynamics between IRES and Cap mediated translation, Koch, A. et<br /> al. developed a novel method in which the kinetics of IRES and Cap mediated<br /> translation can be visualized in real-time. They developed a bicistronic<br /> biosensor containing two separate open reading frames with repeated epitopes.<br /> Each of these open reading frames are differentially translated either in a Cap<br /> or IRES mediated manner. Depending on which open reading frame is translated,<br /> different fluorophore labeled antibodies will bind to the epitope<br /> co-translationally and on the emerging nascent chain. As a result, the biosensor<br /> will be decorated with different fluorophores depending on which open reading<br /> frame is being translated. From this data, Koch, A. et al. determined the mode<br /> of translation depending on which fluorophores are observed to colocalize with<br /> the transcript. Using this new technique, the authors demonstrated that two open<br /> reading frames can be simultaneously translated, and two different manners of<br /> translations can be visualized on a mRNA. Normally, two to three times more<br /> ribosomes are recruited to Cap mediated translation sites as compared to IRES<br /> mediated translation sites; however, during oxidative and ER stress, IRES<br /> mediated translation is favored. Both Cap and IRES mediated translation sites<br /> are stretched out with increasing ribosome load and both sites have similar<br /> mobilities, spatial distributions and elongation rates. Additionally, the<br /> authors also suggest that upstream translation can positively impact downstream<br /> translation. <br /> The authors ingeniously combine common techniques used in ensemble experiments,<br /> such as bicistronic transcript, with nascent chain tracking to develop a method<br /> to visualize different modes of translation in real-time in vivo with single<br /> molecule resolution. This technique was used to understand the dynamics of IRES<br /> mediated translation, but this method also has broad applications. The technique<br /> developed by Koch, A. et al. seems promising and exciting. In general, the<br /> article is well written, and I recommend this work to be published; however, a<br /> few clarifications and improvements are needed to enhance the clarity and<br /> development of the text before the work can be published. <br /> The abstract concisely explains the importance, goals, methods and conclusions<br /> of the work. The introduction nicely explains the aims of the paper and<br /> importance of the novel technique developed as well as the importance of<br /> determining the mechanism by which viruses use IRES to hijack the cell’s<br /> translational machinery. Koch, A. et al. also provide context for which the work<br /> has been done, such as previous ensemble experiments. The ensemble experiments<br /> lacked the spatial temporal resolution needed to determine the kinetics and<br /> dynamics of IRES translation in real-time; yet, the authors satisfy this gap in<br /> knowledge using a new method. However, the authors did not provide a comparison<br /> of the data collected in the ensemble experiments and the data collected in this<br /> work using the new technique. It would be important to understand if the<br /> previous ensemble experiments support the data collected using this new<br /> technique. This could provide further support and verification for the new<br /> technique. <br /> The authors provide an adequate amount of background needed to understand the<br /> importance and context of an experiment. The experiments and results are clearly<br /> described. However, there are a few points that need clarification or further<br /> explanation to determine the validity and reasoning of the experiments and<br /> conclusions, including why were lysine demethylase KDM5B or kinesin like protein<br /> Kif18b used in the open reading frame as opposed to other proteins or why did<br /> the open reading frames not encode for the same protein, but with different<br /> tags? It would have been better for both open reading frames to encode for the<br /> same protein with different tags, so that the length of open reading frame from<br /> the 5’ Cap to the first stop codon would be roughly the same size as the length<br /> of the open reading frame from the IRES site to last stop codon. This may have<br /> helped clarify and provide a fair comparison between the amount of stretching on<br /> the different translational sites and the number of ribosomes at each<br /> translation site. This would also eliminate the open reading frame size as a<br /> possible contaminating factor. This may also explain the different ratio of<br /> ribosomes recruited to the Cap and IRES translation sites when the original tag<br /> and switch tag were used in Figure 5. When the switch tag was used, the ratio of<br /> ribosomes recruited to the Cap versus IRES translation sites was 2.8, but when<br /> the original tag was used, the ratio of ribosomes recruited to the Cap versus<br /> IRES translation sites was 2.1. This could be due to the different open reading<br /> frame lengths including the 24X SunTag-Kif18b being longer at 8kb and thus<br /> allowing more space on the translation site for ribosomes as compared to the 10x<br /> flag-KDM5B’s translation site length at 5kb. Additionally, in Figure 3, the<br /> authors try to answer a difficult question by measuring the distance from<br /> actively translating ribosomes to the 3’ end of the transcript to determine how<br /> the translation sites stretch with increasing ribosome load; however, the<br /> authors do not account for the different lengths of the translation sites.<br /> Understandably, it’s difficult to measure the distance of translation site<br /> stretching. It could be useful to place stem loops labeled with fluorophore<br /> tagged antibodies or a dCas9 labeled with a fluorophore before the IRES site, so<br /> that more precise measurements of the translation site stretching can be<br /> obtained, if feasible. <br /> The authors suggest that IRES and Cap mediated translation sites stretch out<br /> with increasing ribosomal load as shown in Figure 3D. Yet, there is an outlier<br /> in the general trend when the Cap translation site is examined on Cap + IRES<br /> translation sites in Figure 3C (top plot). As the ribosome load increases, the<br /> Cap translation site stretches from 130 nm to 150 nm, but then retracts to 144<br /> nm. It is true that the general trend is that as the ribosome load increases,<br /> the translation site stretches, but this outlier should be acknowledged.<br /> Additionally, clarification or an explanation should be provided to explain why<br /> single mode translation sites, shown in Figure 3D are stretched out longer than<br /> the translation sites in the IRES + Cap translation sites, shown in Figure 3C.<br /> Additionally, the authors should address possible reasons why the Cap<br /> translation site is not two to three times more stretched than the IRES<br /> translation site given that two to three times more ribosomes are recruited to<br /> the Cap translation site.<br /> Additionally, the authors should address the precision of the technique and<br /> data, meaning how they analyzed the data when more than one ribosome was on a<br /> translation site. The authors should address how they analyzed the data when<br /> more than one fluorophore was present at single location. Did the authors<br /> measure the photobleaching steps at that location or did the authors take the<br /> average distance from a group of nearby fluorophores to measure the distance<br /> from the actively translating ribosomes to the 3’end of the transcript? It may<br /> be the case that a group of fluorophores or ribosomes may not be resolved at one<br /> location, if so, how did the authors analyze this data. The authors should<br /> acknowledge or address a limitation in the experimental design that the<br /> technique relies on upon measuring the intensity of the fluorophore labeled<br /> antibodies binding to a nascent chain that has potentially many epitope binding<br /> sites as the ribosome translates the transcripts. The longer time the ribosome<br /> translates the transcript, the more epitopes appear on the nascent chain. As a<br /> result, a higher intensity on a translation site does not always mean more<br /> ribosomes. It could mean that a ribosome has translated more of the transcript<br /> resulting in a longer nascent chain with more epitopes and possible fluorophore<br /> labeled antibodies binding to the nascent chain resulting in an increase in<br /> signal intensity. <br /> Koch, A. et al. provide proper controls to determine the total amount of<br /> transcripts in the cell by labeling transcripts at the 3’ end. However, it would<br /> behoove the authors to provide a few additional control experiments or<br /> explanations. It would be beneficial for the authors to provide an explanation<br /> of the choice and amount of tags. SunTags, specifically v1 SunTag, are known to<br /> aggregate1 which may negatively impact the data or the conclusions drawn from<br /> the data. Similar experiments can be performed with different tags as a negative<br /> control to verify that the choice of tags does not influence the data. The<br /> number of tags in each open reading frame are different, which may affect the<br /> amount of fluorophore labeled antibodies that bind to the nascent chain and<br /> could affect the observed intensity. A control experiment should be performed to<br /> account for the number of epitope tags in each reading frame and the resulting<br /> intensity, before the amount of translation or ribosomes can be determined and<br /> compared at the different translation sites. The authors do address this concern<br /> in Figure 5 by using the original and switch tag. Additionally, the authors<br /> should verify that adding MS2 stem loops to the 3’ end of transcript does not<br /> affect the stability, localization or translation of the transcript. The authors<br /> provide a control experiment to determine that ribosome is not continually<br /> translating through two open reading frames and that IRES can independently<br /> recruit ribosomes. The authors also suggest that upstream translation can<br /> enhance downstream translation of non-overlapping open reading frames. This is<br /> explained though simulations, but it would improve the authors’ credibility if<br /> this conclusion can also be verified experimentally by using a negative control,<br /> such as removing the 5’ Cap from the transcript and determining the number of<br /> ribosomes recruited or translated on the transcript, if feasible and the<br /> transcript is stable. <br /> Finally, the authors beautifully explained how physiological conditions, such as<br /> oxidative or ER stresses, during a viral infection could affect IRES and Cap<br /> mediated translation. The authors determined that IRES mediated translation was<br /> enhanced as compared to Cap mediated translation. If feasible, it would be<br /> beneficial to conduct the same stretching experiments under oxidative and ER<br /> stress conditions to further support the conclusion and provide a fair<br /> comparison to the data under normal conditions.<br /> Overall, the article is well written; however, the article’s layout can be<br /> improved to further clarity and develop main points in the paper. Initially, the<br /> authors suggest that that are three times more Cap mediated translation events<br /> as compared to IRES mediated translation events. Then the authors explain the<br /> biophysical properties of the translation sites as well as the elongation rate<br /> at these sites. Next, the authors suggest that two to three times more ribosomes<br /> are recruited to the Cap mediated translation site as compared to the IRES<br /> mediated translation site as shown in Figure 5. However, the authors reference<br /> this last point throughout the beginning of the paper. I suggest that the<br /> authors discuss and present the data in Figure 5 earlier in the paper such as<br /> after Figure 1. This would improve the flow and logical progression of a key<br /> point in the paper and would also provide an explanation as to why the authors<br /> chose to present the data in Figures 3 and 4. Additionally, Figure 5 would also<br /> support the data provided in Figure 1. <br /> In general, the authors elegantly describe a novel technique and its application<br /> in this article. This novel technique has potential to advance the field by<br /> providing single molecule analysis in real-time in living cells. The conclusions<br /> and findings of Koch, A. et al. are significant and important for determining<br /> the dynamics between IRES and Cap mediated translation. I look forward to<br /> reading the work when its published.
Reference <br /> 1. Tanenbaum, M. E.; Gilbert, L. A.; Qi, L. S.; Weissman, J. S.; Vale, R.<br /> D., A protein-tagging system for signal amplification in gene expression and<br /> fluorescence imaging. Cell 2014, 159 (3), 635-646.
On 2020-03-11 17:23:16, user Debra Hansen wrote:
Terrific paper, great work. Since obtaining structures of membrane proteins is much more difficult than most soluble proteins, including the following technical details in the final publication will be helpful to the research community. (1)How membrane proteins migrate in gels and how well they transfer in Westerns are affected by the compositions of loading buffer, running buffers, transfer buffer; acrylamide concentration (stacking & separating gel). These details seem trivial for most papers, but are important for working with membrane proteins. (2)Exact location of the His-tag in the sequence. His-tags are often not included in the FASTA sequence when the structure is entered into the Protein Data Bank. The His-tag was placed at the "N-terminus", but it can't be at the very N-terminus, since the signal peptide is cleaved in PilQ.
On 2019-12-31 18:11:21, user Paul Schanda wrote:
This is a very interesting work on the plasticity of the SurA chaperone in its apo state and binding outer-membrane proteins (OmpX, OmpF). The paper has a couple of nice experiments, and in particular the combination of techniques (smFRET, cross-linking mass spectrometry (XL-MS), mass-spec-detected hydrogen-deuterium exchange, a bit of MD simulations) is appealing.
Detecting and localizing chaperone-client protein contacts is a difficult endeavor and the authors primarily use mass-spec methods to this end. As I am not an expert with mass spectrometry I have questions, as some of the data are not entirely convincing to me.
Should one basically drop the results from the Lys-cross linking (with DSBU) altogether, as it seems to me that it may contain quite a number of false positives ?
the HDX-MS results are also a bit unclear to me. The mass uptake in D2O are fairly small, and the differences with/without client protein appear very small. For the shown peptide fragments (about 20 residues long) the differences in mass uptake with/without OMP are well below 1 Da (i.e. well below one hydrogen atom) over 100 minutes. In some cases, the difference is essentially zero in Figure S10 (e.g. first line second plot, or second line, plots 1 and 3, where there is even a cross-over, suggesting that the error bars are underestimated?).<br /> I do not have much experience with mass-spec detected HDX. How reliable are such data?
I was curious why the authors have not tried to detect FRET effects between the chaperone and the OMP, i.e. having one dye on each of these two proteins. Such an experiment may allow them to further localize the binding site.
Congratulations to this interesting paper.
On 2019-08-05 09:25:37, user Rajendra wrote:
DiExM, the next big leap in ExM development and application. Nice blog by NIH Director: https://directorsblog.nih.g.... DiExM will greatly progress nanoscale imaging and diagnostic pathology.
On 2019-08-02 17:36:17, user Kathleen wrote:
WOW! Differential Expansion Microscopy-Machine Learning (DiExM). Nice work!! Anisotropic expansion of up to 8-fold linear and >500-fold volumetric. Important study utilizing expansion microscopy (ExM) for precise nano scale imaging of cellular structures. Opinion on ExM posted by Francis Collins https://directorsblog.nih.g.... DiExM will greatly progress nanoscale imaging and greatly progress diagnostic pathology.
On 2019-07-30 15:40:13, user Ranya wrote:
WOW! Differential Expansion Microscopy-Machine Learning (DiExM). Nice work demonstrating anisotropic expansion of up to 8-fold linear expansion. Important study utilizing expansion microscopy (ExM) for precise nano scale imaging of cellular structures. DiExM will greatly progress diagnostic pathology. The scope of ExM is highlighted by NIH Director Francis Collins in his recent blog https://directorsblog.nih.g...
On 2019-06-24 21:29:29, user ThePatrickWatsonLab wrote:
Hello! Very nice paper-- we are also interested in post-translational modification of SR proteins. I am wondering if you could provide more clarity regarding your phos-tag gels. They way they are currently labeled, they are difficult to interpret. Is it possible to include size markers?
On 2018-12-10 17:29:30, user Christopher Ryan Douglas wrote:
The research goal of the manuscript: ‘CRISPR/Cas12a-assisted PCR tagging of mammalian genes’, is to demonstrate the efficiency of a CRISPR/Cas12a endonuclease system using PCR cassettes and endogenous homologous recombination mechanisms for readily tagging genes in mammalian cell lines. Previous methods often use extensive cloning techniques that are expensive and/or laborious, while the pursued method incorporates pre-designed plasmids with tags that can then be used with unique M1 and M2 oligos for easy PCR cassette development and CRISPR/Cas12a, gene-specific tag integration. In the paper they hypothesize that (1) successful, on-target integration is equivalent to current models in yeast using the CRISPR/Cas9 system, (2) is dependent on homology dependent repair mechanisms, (3) that efficiency can be further improved through the use of different modifications, including: removing the ATG start codon of the fluorescent tag (i.e. mNeonGreen), increasing the length of the homology arms, adding bulky protein modifications at the 5’ end of M1 and M2 oligos; and (4) the tested system can obtain human genomic coverage of 98.1% by including different species-specific CRISPR/Cas12a variants. They used tag-specific immunofluorescence localization and Anchor-Seq to assess on-target integration success; and they utilized PCR and PAGE to create and purify the PCR cassettes used for integration. <br /> (1) The findings state that for the tested genes there was an observed 0.2-13 % with correct tag-specific localization as imaged using the tag fluorescence. This could be further increased up to 60% using previously established antibiotic selection with Zeocin (Puromycin also tested). The authors used a restriction digest approach utilizing DpnI or FspEI to target and eliminate Dam methylated plasmids, which is assumed to be those plasmids existing prior to amplification. It would be useful if they provided some reference demonstrating that the non-methylated site isn’t targeted. If it was targeted to some extent, this could result in significantly more fragments of the selection marker plasmid being present. It is possible that these could ligate together and form plasmids that could confer resistance without the target gene sequence being present. Further information clarifying the purification procedure of these samples would eliminate this concern. <br /> Another criticism is that it is never directly stated how it compares to the current CRISPR/Cas9 system used in yeast. What are the comparable efficiencies both compared to the CRISPR/Cas9 system in yeast and mammalian systems? The use of resistance tags helps with amplification and population percentages expressing correctly is relatively high, but if the paper could provide some more context for comparing the relative efficiency of the system compared to other approaches in yeast and mammalian systems, it would elevate the impact of the paper.<br /> (2) The role of HDR is demonstrated by first removing the homology arms of the M1 and M2 oligos and then altering them to include 5’ overhangs compatible with CRISPR/Cas12a integration. Only residual amounts of non-homologous end-joining (NHEJ) or other DNA repair mechanisms were observed, indicating the importance of HDR. It was also observed that the homology arms would work for 30nt and optimally greater than 60nt.<br /> By removing the ATG start codon for the mNeonGreen protein, the diffuse non-specific cytoplasmic fluorescence could be reduced significantly. The residual amount of expression observed is explained as coming from start codons in the homology arms or the crRNA within the open reading frame of the mNeonGreen. It could also be possible that the system is promiscuous and targeting multiple dependent sites dependent on the crRNA, which has been reported to a limited extent for certain targets in the CRISPR/Cas9a system1. Despite abounding evidence of the kinetic specificity of the alternative CRISPR/Cas12a system employed here, there may be residual off-target effects that persist for specific sequences2. While not relevant for creating new cell lines using this system, it may be worth discussion for future work and in more complex systems, such as, in vivo.<br /> (3) With further modifications of the nucleotides using phosphorothioate bonds and biotinylating 5’ ends of the M1/M2 oligos, they assessed the efficiency of tagging of several genes, including: CLTC, and DDX21. They observed a 2-3x fold increase in efficiency and a decrease of observed diffuse cytoplasmic, non-specific fluorescence. Based on the data presented in Figure 3C, it appears that the phosphorothioate bonds were far more important for both increasing the on-target integration efficiency and reducing the non-specific diffuse, cytoplasmic fluorescence. While omitted, it may be worth including data for the phosphorothioate bond (i.e. 10S) and Biotin combination, as it might have provided some idea about the limitation of such modifications to increase the efficiency of the system. <br /> (4) In most tagging systems, C-terminal tagging is used and the CRISPR/Cas12a system needs to cut a protospacer associated motif (PAM) within a potentially short 17nt sequence on either side of the gene stop codon in humans. Given that the authors used a Lachnospiraceae bacterium ND2006 (i.e. TTTV) for all previous experiments, they confirmed that it could only obtain 43.2% genomic coverage. When adding the genomic coverage of AsCas12a_TATV and the AsCas12a_TYCV/LbCas12a_TYCV combination, only 71.6% was collectively covered. Upon using an extended search space in the 3’-UTR region, 98.1% coverage was observed. To compensate for this extended search, the authors noted the need to adjust the M2 oligo so that a small deletion occurs at the cleavage site to prevent additional cleavage events at the site by the CRISPR/Cas12a. For future studies, it would be worth considering the relative efficiency and specificity of these different species-specific CRISPR/Cas12a variants to create a rule for differing to one of the variants in the case overlapping genomic coverage by two or more. Another criticism would be that the expanded search into the 3’-UTR does not necessarily account for the possibility of disrupting post-transcriptional regulatory units within the region. This could provide the need for additional variants that provide more collective coverage using the limited search space provided by the PAM.<br /> Overall, the paper carries significant impact and capably demonstrates the applicably of this PCR-based CRISPR/Cas12a system to mammalian systems, in vitro. Despite some small, potential issues with the specificity of the observed efficiency, the only major area of concern would be the possibility that the expansive genomic coverage obtained by including sites in the 3’-UTR could in practice compromise key post-transcriptional regulatory units in this region. This can be easily avoided through additional experiments demonstrating the lack of an effect on overall expression with the use of some or all observed PAM sites, and/or using additional Cas12a variants to obtain more genomic coverage without using the 3’-UTR regions.
References<br /> 1. Henriette O’Geen, Abigail S Yu, David J Segal. ‘How specific is CRISPR/Cas9 really?’. Current Opinion in Chemical Biology, Volume 29, 2015, Pages 72-78, ISSN 1367-5931, https://doi.org/10.1016/j.c....<br /> 2. Isabel Strohkendl, Fatema A. Saifuddin, James R. Rybarski, Ilya J. Finkelstein, Rick Russell. ‘Kinetic Basis for DNA Target Specificity of CRISPR-Cas12a’. Molecular Cell, Volume 71, Issue 5, 2018, Pages 816-824.e3, ISSN 1097-2765. https://doi.org/10.1016/j.m....
On 2018-07-05 14:19:41, user Scott Scholz wrote:
Fascinating. Aside from the tag effect on any particular protein, do you have any ideas about why N-terminally tagged proteins are more likely to be punctate in general? Or why C-terminally tagged are more likely to be vacuolar...etc?
On 2018-05-29 17:57:50, user TeresitaMPorter wrote:
CO1 reference sets have been updated to version 3:<br /> https://github.com/terrimpo...
Contains more species, more sequences, and more outgroup taxa including eukaryotes and bacteria.
On 2018-03-30 13:00:18, user Markku Varjosalo wrote:
This preprint was published in Nature Communications on 22th of March titled as “An AP-MS- and BioID-compatible MAC-tag enables comprehensive mapping of protein interactions and subcellular localizations”
On 2018-01-27 01:19:32, user Casey Greene wrote:
I reviewed this paper at a journal. I thought that the journal in question would make the review public, but perhaps that is only after the paper is accepted. In the interests of improving the discussion of papers before they become published, I'm posting my review here as well.
Confidential Competing Interests (required):<br /> None
Reveal reviewer identity to authors (required): Yes
General assessment and major comments (Required):<br /> The authors describe HAWK, a k-mer based approach to association analysis. The idea is certainly clever, and I can imagine this work as a jumping off point for other approaches to the analysis of genetic variants that differ between groups.
I have some concerns about how the work is presented. The method discusses k-mer association analysis as a technique for "sequencing data." Within the manuscript, the method is applied to simulated E. coli genomic data and to the 1k genomes dataset.<br /> - If the authors want to suggest that this works for E. coli, or other bacterial, data they should apply the method to real genome sequencing data from these organisms. It seems like plasmids that vary with the test condition could make the approach somewhat computationally expensive (they would need to be built from k-mers). It'd be nice to see A) if this works in practice; and B) how scaling is affected. If this is not intended to be used for real microbial data, then perhaps the authors should note this.<br /> - The only application in the manuscript is to whole genome data. It seems like this approach would be a relatively inefficient way to deal with RNA-Seq data. Should the domain be refined?<br /> - Is the approach expected to work with exome sequencing data? If so, it would be nice to see an example showing that the capture process doesn't introduce any systematic biases that affect the method's false positive rate.
I downloaded the software and it compiled successfully. It is a bit difficult to use. The documentation is also sparse. It would be helpful to have a wrapper script that would handle the most common workflow as well as documentation with one fully worked example. The version of the source code associated with the published paper should be archived to figshare, zenodo, or a similar service.
Some assertions are made with regard to computational cost of competing methods in the intro. It would be helpful to me to see some benchmarking of HAWK.
"We provide scripts to lookup number... as future work." This is fine to leave for the future, but can you at least provide some documentation of these scripts in the repository's README?
Lines 277-280: is it possible that certain samples have different contamination? I'm not disputing that this is one possible explanation, but it doesn't seem like other possibilities (contamination, etc) have been ruled out to this point.
Minor Comments:<br /> In "Counting k-mers", what is a sample for "appear once in a sample." Is this once in a condition, or is there a first stage of sample filtering before the k-mers are aggregated?
The github repo contains DS_Store files. This should be added to .gitignore
Both the GPL v2 and v3 licenses appear to be included with the CPP source code.
The source code on the website has a version number, but there are no tags in the github repository. Please tag with the version number.
In "verification with 1k genomes data": I think line #169 is referring to significant differences between the YRI and TSI samples using the standard calling algorithm. This paragraph could be reworded for clarity.
typo: "While upto 20%"
On 2017-10-28 16:51:14, user Lionel Christiaen wrote:
Student #4<br /> 1. Genetic design: Homie-dependent long-distance regulation<br /> a. What is the background knowledge?<br /> Homie-homie self-pairing interactions can orchestrate enhancer activation of a reporter<br /> b. What is the question or hypothesis addressed?<br /> Is physical proximity central to enhancer-promoter communication?<br /> c. What is the approach? Which methods does it employ?<br /> A transgene consisting of the eve promoter and the lacZ coding sequence is inserted at an attP site located 142 kb upstream of the eve gene.<br /> d. What were the observations and analysis? (i.e the raw data and analyses)<br /> Sporadic expression of LacZ mRNA is observed solely within the limits of the endogenous eve stripes.<br /> e. What are the interpretations?<br /> Activation of the lacZ reporter depends on the enhancers in the eve locus 142 kb away.
Visualization of transcription and enhancer-promoter dynamics<br /> a. What is the background knowledge?<br /> b. What is the question or hypothesis addressed?<br /> What is the connection between enhancer action and physical enhancer-promoter proximity?<br /> c. What is the approach? Which methods does it employ?<br /> Insertion of tags. An MS2 stem loop cassette and MCP fused to a blue fluorescent protein to visualize nascent eve transcripts. A PP7 stem loop and PCP fused to a red fluorescent protein to visualize nascent transcripts of lacZ and ParS/ParB DNA labeling system to mark the position of the lacZ reporter whether it's active or not.<br /> d. What were the observations and analysis? (i.e the raw data and analyses)<br /> In the blue channel it can be observed the transcriptional dynamics of the eve gene in the characteristic seven-striped pattern. The green channel trace the movement of the lacZ reporter within the nucleus and in the red channel lacZ expression is observed as a subset of nuclei in the eve stripes<br /> e. What are the interpretations?<br /> LacZ expression is restricted to nuclei that reside within one of the seven eve stripes.<br /> f. What are the conclusions about the biological processes being studied?<br /> There is a close connection between transcription and physical proximity
Spatial proximity is necessary for enhancer action<br /> a. What is the background knowledge?<br /> b. What is the question or hypothesis addressed?<br /> How enhancer action is related to spatial proximity?<br /> c. What is the approach? Which methods does it employ?<br /> Analysis of live images and replacing the homie sequence with lambda DNA of the same length<br /> d. What were the observations and analysis? (i.e the raw data and analyses)<br /> For the parS-lambda-lacZ they observe a bimodal distribution for the time-averaged physical distance but when the homie sequenced is replaced with lambda the distribution of the RMS distance is unimodal. None of the nuclei in control parS-lambda-lacZ embryos express lacZ.<br /> e. What are the interpretations?<br /> Homie pairing creates a local chromatin conformation that is permissive to transcription events by ensuring physical proximity between the eve enhancers and the promoter of lacZ<br /> f. What are the conclusions about the biological processes being studied?<br /> Eve enhancers must be in close proximity to the lacZ promoter in order to activate transcription.
Necessity for sustained physical association<br /> a. What is the background knowledge?<br /> b. What is the question or hypothesis addressed?<br /> What is the temporal relationship between enhancer-promoter proximity and transcriptional activation?<br /> c. What is the approach? Which methods does it employ?<br /> Measure of the mean distance between the green parS tag and the eve gene as a function of time and alignment of the nuclei with respect of time point when nascent transcripts could first be detected.<br /> d. What were the observations and analysis? (i.e the raw data and analyses)<br /> There is a convergence until the onset of transcription at which point the mean distance corresponds to an average separation of about 340 nm. Also, a drop in transcriptional activity of the lacZ reporter is accompanied by an increase in the mean distance between the ParS transgene and the eve gene.<br /> e. What are the interpretations?<br /> There is a close connection between the establishment of enhancer-promoter proximity and enhancer activation of transcription. <br /> f. What are the conclusions about the biological processes being studied?
Physical enhancer-promoter engagement leads to distinct topological conformation<br /> a. What is the background knowledge?<br /> Independent eve enhancers regulate individual stripes of the eve pattern along the embryo<br /> b. What is the question or hypothesis addressed?<br /> Is transcriptional activation associated with an additional step that promotes physical enhancer-promoter engagement?<br /> c. What is the approach? Which methods does it employ?<br /> Examination of nuclei from different stripes separately to explore the topology of the locus under different activating enhancers.<br /> d. What were the observations and analysis? (i.e the raw data and analyses)<br /> Different distances in nuclei belonging to different stripes are observed. The distance between the eve gene and the parS tag of the inactive lacZ reporter in stripe 5 is shorter than the observed for nuclei in stripes 4/6 and 3/7 for which the enhancers are located farther away from the parS tag<br /> e. What are the interpretations?<br /> Eve enhancers directly engage the endogenous eve promoter to activate transcription and that in each eve stripe a distinct topological conformation is adopted<br /> f. What are the conclusions about the biological processes being studied?
Promoter compositions has phenotypic consequences<br /> a. What is the background knowledge?<br /> The eve stripe enhancer drives expression from two different eve promoters, one for the endogenous eve gene and the other for the lacZ reporter.<br /> b. What is the question or hypothesis addressed?<br /> Is promoter competition occurring in the genomic setup?<br /> Does the reduction in eve transcription have any phenotypic consequences?<br /> c. What is the approach? Which methods does it employ?<br /> Comparison of eve transcription in individual nuclei in which lacZ is active ann nuclei in which lacZ is silent<br /> Crossing males carrying a homie-lacZ transgene at -142 kb to females heterozygous for a wt eve gene and an eve deficiency.<br /> d. What were the observations and analysis? (i.e the raw data and analyses)<br /> When lacZ is also transcribed there is a 5-25% reduction in endogenous eve transcription <br /> The presence of the homie-LacZ transgene exacerbates eve haploinsufficiency<br /> e. What are the interpretations?<br /> Competition between two promoters at the transcriptional level in the early embryo has phenotypic consequences for patterning in the adult<br /> f. What are the conclusions about the biological processes being studied?<br /> Manipulating topological chromatin structures can interfere with developmental programs.
Review.<br /> By designing a transgene consisting of the eve promoter and the lacZ coding sequence located 142 kb upstream of the eve gene and taking advantage of the homie insulator, which self-pairing interactions can orchestrate enhancer activation of a reporter, the authors created a system where the activation of the lacZ reporter depend on the enhancer in the eve locus 142 kb away. By introducing tags using the MS2-MCP, PP7-PCP and the parS-parB systems and by measuring the mean distance between the green parS tag and the eve gene as a function of time and they found that there is a convergence until the onset of transcription at which point the mean distance corresponds to an average separation of about 340 nm. By modifying their construct (eliminating homie or reversing the homie sequence) they conclude that the eve enhancers must be in close proximity to the lacZ promoter to activate transcription; however, a possible explanation on why reversing the orientation of homie prevents lacZ expression while there is still close proximity between enhancer and promoter. Also, a drop in transcriptional activity of the lacZ reporter is accompanied by an increase in the mean distance between the ParS transgene and the eve gene, suggesting that there is a close connection between the establishment of enhancer-promoter proximity and enhancer activation of transcription. The authors provide evidence that suggests that manipulating topological structures can interfere with developmental programs; for this part (Figure 6, panel A) I would suggest to make a separate figure for measure of % eve activity reduction for each stripe since the way it is shown makes it harder to appreciate the figure.
On 2017-10-28 16:50:57, user Lionel Christiaen wrote:
Student #3<br /> • Summary of work presented<br /> o Introduction<br /> • Focus on the mechanism through which enhancers act over distance<br /> • 3C-based experiments have revealed enhancer-promoter interactions that are conserved among developmental stages, cell fates, or evolution, suggesting a permissive role of the physical enhancer-promoter interactions on transcriptional activity<br /> • Lineage specific enhancer-promoter interactions are found to be prevalent in many developmental contexts – instructive role?<br /> • Direct dynamic link between enhancer-promoter proximity and transcriptional activation is needed<br /> • Devised an assay that uses a combo of genome editing, genetics, and live single-cell imaging to visualize the relationship between enhancer activation of transcription and physical proximity in real time<br /> o Figure 1 – an endogenous genomic construct is designed to investigate long-distance enhancer-promoter interactions<br /> • Background knowledge<br /> • Enhancers act on promoters over distance<br /> • Hypothesis<br /> • Physical proximity is central to proper enhancer-promoter communication<br /> • Homie-homie self-pairing interactions can orchestrate enhancer activation of a reporter at distances of at least 2 Mb<br /> • Experimental approach<br /> • Constructed a transgene consisting of the eve promoter (no enhancers) with a LacZ reporter at an attP site 142 kb upstream of the eve gene<br /> o Homie is a boundary element (insulator) which marks the 3’ end of the eve locus<br /> o Needed to be able to be able to visualize the location of the promoter, the location of the enhancers, and monitor the transcriptional activity in living embryos<br /> • Observations, data<br /> • In fixed embryos expression of lacZ mRNA is seen only within the limits of endogenous eve stripes<br /> • Interpretations<br /> • The activation of the lacZ reporter depends on the enhancers in the eve locus 142 kb away<br /> • Conclusions<br /> • At this stage of development, the eve promoter has no spontaneous activity and does not respond to nearby enhancers
o Figure 2 – visualization of enhancer-promoter movements producing transcriptional activity using 3-color live imaging<br /> • Background knowledge<br /> • The preliminary construct in figure 1 works as expected<br /> • Hypothesis<br /> • Examining how spatial proximity relates to enhancer action<br /> • Experimental approach<br /> • Introduced tags into the initial transgene from figure 1<br /> • MS2 loops – in first eve intron, used to mark nascent eve transcripts and the nuclear location of the eve gene and the associated eve enhancers<br /> • PP7 stem loops – near 5’ end of the lacZ coding sequence to visualize transcriptional activity of the lacZ reporter<br /> • parS/parB DNA labeling system – mark the position of the lacZ reporter independent of whether the reporter is active<br /> o parS DNA sequences nucleate the binding of a ParB-GFP<br /> • Performed 3-color time-lapse confocal imaging on 2 hour old embryos carrying the tagged eve locus and the parS-homie-lacZ reporter<br /> • Observations, data<br /> • Individual fluorescent foci are observable in 70-100 nuclei simultaneously<br /> • lacZ expression is restricted to nuclei that reside within one of the eve stripes<br /> • In nuclei in which the reporter is active, the reporter is separated from the eve gene<br /> o In nuclei where the green focus (parS) and the blue focus (active eve gene) are far from each other, there is no red focus (lacZ reporter)<br /> o In nuclei where there is a red focus, the three colored foci appear to be attached together<br /> • Interpretations<br /> • The eve gene and the reporter come together to generate transcription<br /> • Conclusions<br /> o Figure 3 – physical proximity between enhancers and promoter is required to activate transcription<br /> • Background knowledge<br /> • The genetic constructs from figure 2 allow simultaneous visualization of the location of the promoter, the location of the enhancer, and transcriptional activity<br /> • Hypothesis<br /> • Needed more detailed quantification of how enhancer activity is related to spatial proximity<br /> • Experimental approach<br /> • Measured the physical separation between the eve gene and the lacZ reporter in embryos carrying the construct in embryos over a 30 min period in cycle 14<br /> • Replaced the homie sequence with lambda DNA of the same length to confirm that linkage of the reporter to eve is dependent on homie<br /> • Reversed the orientation of homie in the original transgene such that the lacZ reporter is downstream<br /> • Scored nuclei with respect to the transcriptional activity of the lacZ reporter<br /> • Observations, data<br /> • Normal construct<br /> o Bi-modal distribution for the time averaged physical distance that could be modeled as a mixture of two Gaussians<br /> • Homie replaced with lambda<br /> o The distribution of the MS2-parS RMS distance is unimodal with a mean at 743 nm<br /> o There is no instance in which there is sustained close proximity<br /> • Homie reversed<br /> o Pairing still occurs but the regulation of the reporter by the eve enhancers is disrupted<br /> o Bi-modal distribution resembling that of the regular transgene<br /> • Scored nuclei<br /> o All of the parS-homie-LacZ transgene nuclei showing lacZ transcription have a degree of physical separation that falls within the distribution corresponding to the bound conformation – there are no nuclei in the unbound conformation in which there is lacZ transcription<br /> • Interpretations<br /> • Homie pairing is responsible for creating the chromatin conformation needed for transcription events to occur by bringing the enhancers and the promoter together<br /> • Conclusions<br /> • Eve enhancers must be in close proximity to the lacZ promoter in order to activate transcription<br /> o Figure 4 – dynamics of chromatin movement underlies kinetics of enhancer-promoter interactions and transcriptional activation<br /> • Background knowledge<br /> • Previous experiments show the spatial requirements between enhancers and promoters for gene expression but not the temporal relationship<br /> • Hypothesis<br /> • Chromatin movement dynamics play a role in the interaction between enhancers and promoters<br /> • Experimental approach<br /> • All nuclei displaying a switch from off to on were aligned with respect to the time point when nascent transcripts could be detected<br /> • Measured the mean distance between the parS tag and the eve gene as a function of time<br /> • Did the above two steps but in nuclei that go from on to off
• Observations, data<br /> • Off to on<br /> o Sharp switch in activity state<br /> o There is a continuous spatial convergence until the onset of transcription when there is an average separation of 340 nm<br /> • On to off<br /> o A drop-off in transcription is accompanied by an increase in the distance between the enhancer and the promoter<br /> o There is a 4 min gap between the time when the enhancer and promoter separate and when transcriptional activity declines – this is largely due to the length of the reporter gene and how long RNAPII takes to clear it<br /> • Interpretations<br /> • There is a close connection between the establishment of enhancer-promoter proximity and the activation of transcription<br /> • Conclusions<br /> • Results fit with the idea that the enhancer and promoter must maintain close proximity to each other for continuous initiation of transcription<br /> o Figure 5 – activation from endogenous enhancers is governed by enhancer-promoter distances<br /> • Background knowledge<br /> • The pairing of homie is not sufficient to generate the sustained physical proximity between enhancer and promoter needed for transcription initiation<br /> • Different eve enhancers regulate individual stripes of the eve pattern in the embryo<br /> • Hypothesis<br /> • Additional compaction is needed (in addition to homie pairing) in order to cause initiation of transcription<br /> • Experimental approach<br /> • Examine nuclei from different stripes separately to explore the topology of the locus under different enhancers<br /> • Observations, data<br /> • Distance of the eve-MS2 gene relative to the parS tag in nuclei where homie pairing occurs but there is no lacZ transcription<br /> o Different distances in nuclei belonging to different stripes (different enhancers)<br /> o The distance to the homie pair should depend on the distance between the activating enhancer and the endogenous homie<br /> o The distance between the eve gene and the parS tag in stripe 5 is shorter than that observed in stripes 4/6 and 3/7 where the enhancers are located farther away<br /> • For the two enhancers that control stripes 4/6 and 3/7 the distance between the eve gene and the parS tag match within the stripe pairs<br /> • The nuclei with the active reporter show significant shortening of the distance between the eve enhancers and the promoter<br /> • The fraction of transcriptionally active reporters decreases with increasing distance between the stripe enhancer and the lacZ promoter<br /> • Interpretations<br /> • Eve enhancers directly engage the eve promoter to activate transcription – the chromatin in the nuclei in each eve stripe adopts a distinct conformation<br /> • The shortening of distance between enhancer and promoter in nuclei with active transcription support the idea of additional compaction of the locus for transcription<br /> • The activation probability of the promoter driving lacZ expression goes down as the distance between enhancer and promoter increases<br /> • Conclusions<br /> • Transcriptional activation requires direct physical engagement between the enhancer and the promoter – associated with topological compaction of the gene locus<br /> o Figure 6<br /> • Background knowledge<br /> • The eve enhancer drives expression from two different eve promoters (endogenous and lacZ reporter)<br /> • Hypothesis<br /> • The activity of the enhancers could be limiting, if that’s the case, the lacZ reporter will reduce transcription of the eve gene<br /> • Is promoter competition occurring?<br /> • Experimental approach<br /> • Compare eve transcription in individual nuclei in which lacZ is active and nuclei in which lacZ is silent<br /> • Cross males carrying a tagless homie-lacZ transgene with females heterozygous for wt eve and eve deficiency – weakly haploinsufficient<br /> o See if the lacZ transgene exacerbates eve haploinsufficiency<br /> • Observations, data<br /> • For each stripe there is a 5%-25% reduction in endogenous eve transcription in nuclei where the lacZ reporter is being expressed<br /> • The presence of the homie-lacZ transgene causes a 4-fold increase in eve defects in eve deficient flies<br /> o Having the homie-lacZ transgene exacerbates eve defects<br /> • Interpretations<br /> • Competition between two promoters in the early embryo has phenotypic consequences for patterning in the adult<br /> • Conclusions<br /> • Disrupting chromatin structures can interfere with developmental programs if doing so interferes with the interaction between enhancers and their promoters<br /> • Merits<br /> o Very clever system built to test hypotheses<br /> • Potential improvements<br /> o Figure 3<br /> • Schematics are a little misleading<br /> o Figure 4<br /> • Causality is not firmly established in this figure – what is the order of events between transcription termination and increase in distance?<br /> • See what happens when you inhibit polymerase or promoter?<br /> o May be beyond the scope of this figure<br /> • Minor problems<br /> o Language concerning the lacZ reporter may be misleading sometimes…they say lacZ is active when I think they mean lacZ is actively transcribed. At no point were they doing histochemical staining so they never tested lacZ activity
On 2017-10-28 16:50:25, user Lionel Christiaen wrote:
Student #1<br /> Chen et al. set out through to determine the dynamics of promoter enhancer interactions through a series of biochemical and genetic assays paired with confocal in vivo time lapse imaging. The authors developed an elegant system to tag genetic loci, enhancer-promotor dependent transcriptional activity of lacZ, and endogenous expression of eve mRNA. Additionally, they were able to provide quantitative data to accompany to support their claims. <br /> Highlights of the work<br /> - employed different well-established methods to interrogate an experimental question that is lacking experimental validation. <br /> - single cell data was obtained to account for population heterogeneity. <br /> -Time lapse live in-vivo assays that return a more complete scenario (both proximity and expression measured simultaneously) compared to prior studies that measured either transcriptional activity or chromatin dynamics independently providing only a static view.
Recommended improvements<br /> - The authors claim because that there is no expression of lacZ at the locus in which it was inserted means that it does not respond to nearby enhancers. “These findings indicate that the activation of the lacZ reporter depends on the enhancers in the eve locus 142 kb away, and that at this stage in development, the promoter of the reporter has no spontaneous activity nor does it respond to enhancers near the site of insertion.” I think I know what the author is trying to convey in the latter part of this statement however it can be interpreted as “in this developmental stage, even if you insert an enhancer at this locus it won’t activate lacZ “please clarify this sentence or add a reference. <br /> - Also, I would like the authors to address the threshold of molecules required to obtain fluorescent signal, this is important for the transcription on/off experiments. <br /> -The promoter competition experiments are missing p values that are mentioned in the figure legend.
On 2017-10-28 16:48:42, user Lionel Christiaen wrote:
Student #10<br /> 1- Enhancers are thought to act as static regulatory modules defined by their transcription factor binding sites that modulate their activity through space and time. However, not all binding sites are created equal, with multiple transcription factors showing weak binding activity at “degenerate” binding sites. To investigate the contribution of these weaker sequences, the authors looked at the activity of a well-known transcription factor, Ultrabithorax at the enhancer for shavenbaby. The authors theorize that the activity of these enhancers is modulated by their nuclear microenvironment, allowing a higher number of transient associations of weakly associated transcription factors in order to drive robust expression. <br /> 2- The imaging techniques in this paper are advanced, and may not be as sensational as light sheet microscopy, but each technique serves to answer the question that it seeks to answer. The first is the “expansion” technique, which physically enlarges the sample through the introduction of a polyacrylamide solution. This improves the effective resolution, but may be prone to artifacts. The second is using halo-tag fusion proteins with high intensity dyes to achieve single molecule resolution which allows the previous results to confirmed using the expansion technique, mainly that there are local increases in concentration of Ubx in nuclei. This effect disappears by mutagenesis of the Ubx DNA binding site, suggesting that Ubx’s association with DNA is driving the increase in local concentrations.<br /> One of the most impressive techniques is to use florescence in-situ hybridization with antibody co-stains to demonstrate that there is a high correlation of the Ubx transcription factor with gene expression. This is done using an intronic probe which will specifically localized to the locus of transcription.<br /> Finally, the authors use a synthetic enhancer network to test the hypothesis that low affinity binding sites at enhancers serve to increase the local concentration of the transcription factor that responds to that motif. <br /> 3- I don’t like the expansion technique, but the authors use live imaging to demonstrate their observations are valid. Although it may have been interesting to image transcription live in concert with their single molecule imaging, I understand that the authors had a set of defined questions that their experiments address sufficiently. I also think it would have been interesting to test a suite of genes in the in-situ assay instead of using only one probe. This could identify loci that may have varying degrees of transcriptional response to Ubx.<br /> 4- Showing the weakened enhancer binding sites in the final figure with red “X”s gives the impression that the binding site has been deleted, making it a bit hard to understand.
On 2017-10-28 16:48:02, user Lionel Christiaen wrote:
Student #7<br /> Prior to this paper, it was known that transcription factors (TFs) only stay bound for a few seconds before dissociating from DNA, and that low affinity binding sites are necessary for TFs to distinguish between binding sites with a similar sequence. The authors wanted to answer the question of how these brief TF contacts could allow for transcription from low affinity sites. They hypothesized that multiple low affinity sites could act together to “trap” TFs and create “microenvironments” with high TF concentration that would allow for transcription. To address this question, they used the svb locus in Drosophila which contains multiple distinct enhancers that have low affinity binding sites for Ubx. Techniques they used included: super-resolution confocal microscopy, FISH, immunofluorescence, and live imaging of specially prepped (~4x expanded) transgenic embryos.<br /> The authors first found that Ubx was localized to distinct regions of the nucleus that did not overlap with unrelated TFs, which suggested that Ubx is not localized by a general mechanism that limits the distribution of all TFs. They also showed that Ubx did no co-localize with repressive chromatin and it only partially overlapped with active transcription sites, providing evidence that Ubx has specificity in its localization and is not found at all active loci. Since these results were found in fixed embryos, the authors wanted to confirm it wasn’t just an artifact of the fixation process, so they performed live imaging of Ubx using a Halo tag and a fluorescent dye ligand, JF635. They found the same results, in which Ubx was localized to specific regions at high concentration, and they further showed that its localization was dependent on DNA binding by mutating the homeodomain. They next wanted to determine if the regions of high Ubx concentration co-localized with sites of active svb transcription using FISH. Indeed, they found that Ubx was enriched at sites of svb transcription, but it was not enriched at sites of active transcription driven by a synthetic enhancer, providing more evidence that its localization has specificity. They next wanted to determine if binding site affinity affected the localization of Ubx by either changing a low-affinity site to a high-affinity site, or by removing multiple low-affinity sites. They found that the switch to a high-affinity site led to decreased enrichment of Ubx microenvironments, and the removal of low-affinity sites resulted in active transcription only occurring in regions with high Ubx concentration. This inverse correlation between affinity and Ubx concentration led them to conclude that binding site affinity determines the enhancer’s response to local Ubx concentration. Lastly, they found that the Ubx co-factor, Hth, was co-enriched around active transcription sites, suggesting that high concentrations of TFs and their co-factors are required for transcription. The authors concluded that clustered binding sites for the same TF, cooperative interactions between TFs and their co-factors, and clustering of enhancers could all result in increased local concentration of TFs by acting as a “trap” to increase their time near low-affinity enhancer sites.
Technically innovative with their use of methods to expand embryos, as well as their use of Halo-tagged Ubx and the dye, JF635, for live imaging.
Major<br /> Fig. 2 A/B don’t seem to match up.
How did they quantify [Ubx] at svb loci in fig 3 f, h, j, l, n, p, r when they used lacZ reporters for the above images?<br /> Why use lacZ reporters rather than FISH of endogenous svb?<br /> There seems to be large variability in their results (i.e. enrichment of Ubx at TALEA driven enhancers of 0.02 ± 0.63), so how significant are any of these results?
Maybe check other Ubx regulated loci with FISH to see if the same concepts hold true.
On 2017-07-01 22:41:59, user David Galbraith wrote:
Hi Naomi:
Nice work! However, you indicate "To address this challenge, we3 and others4 developed single nucleus RNA-seq....". The first report of single nucleus RNA-seq was in fact a couple of years prior to these two references, by Grindberg et al. (2013). RNA-Seq from single nuclei. Proceedings of the National Academy of Sciences U.S.A. 110:19802-19807, and it would be very courteous if you would include that citation in your publication. Further, if you wish to comprehensively attribute analysis of polyadenylated RNA as a surrogate for total cellular polyadenylated RNA, you might consider citing: Macas, J., Lambert, G.M., Dolezel, D., and Galbraith, D.W. (1998). NEST (Nuclear Expressed Sequence Tag) analysis: a novel means to study transcription through amplification of nuclear RNA. Cytometry 33:460-468, and Zhang, C.Q., Barthelson, R.A., Lambert, G.M., and Galbraith, D.W. (2008). Characterization of cell-specific gene expression through fluorescence-activated sorting of nuclei. Plant Physiology 147:30-40.
Thanks for this consideration.
David
On 2017-04-03 01:43:01, user Juha Kere wrote:
This manuscript was first submitted to Nature Genetics 20 Sep 2012 and the same date returned to authors without review. We reanalyzed later the same RNA sequencing data referred to here using transcript 5' tag mapping to the genome, and it served as the basis for conclusions regarding new PRDL transcription factor genes upregulated at 4-cell and 8-cell stages (Töhönen, Katayama & al. Nature Communications 6:8207, 2015; DOI: 10.1038/ncomms9207). Our analysis and conclusions regarding DUX4 as an early regulator of human Embryo Genome Activation are published for the first time here. For correspondece, please contact juha.kere@ki.se.
On 2016-12-22 16:32:01, user Vijay Jayaraman wrote:
Does the order in which the DDD and the HA is placed after the gene matter? In the original construct of pGDB HA tag was 3' to the DDD unlike in the design mentioned in this paper.
On 2016-03-17 19:29:25, user Fabien Campagne wrote:
I disagree with the recommendation to use BioConductor as stated by the authors (section 3, page 11, frameworks). BioConductor is a great option in R, but it is not easy to obtain previous releases of BioConductor and the packages that it offers. If you need computational reproducibility, it is not trivial at all to obtain specific versions of a BioConductor environment. I recommend that the authors try to put their solutions to the test before recommending them. My group experienced many dependency installation issues with BioConductor, including the inability of the release servers to tag URLs with versions, so that even source code cannot be retrieved reliably in the future. <br /> We now routinely create docker images that contain R, BioConductor and a specific set of packages. This is the best way we found to achieve computational reproducibility with R.
On 2015-11-30 14:55:42, user Raphael Levy wrote:
PNAS rejected the letter: "After careful consideration, the Board has decided that your letter does not contribute significantly to the discussion of this paper." (https://raphazlab.wordpress...
More info on our work and analysis of SmartFlare can be found at my blog (https://raphazlab.wordpress....
Author response:
The following is the authors’ response to the original reviews
Public Reviews:
Reviewer 1 (Public review):
(1) "The timescales of the peptide recognition and unbinding process are much longer than what can be sampled from unbiased simulations. Therefore, the proposed mechanism of recognition should only be considered a hypothesis based on the results presented here. For example, peptides that do not dissociate within one one-microsecond MD simulation are considered to be stable binders. However, they may not have a viable way to bind to the narrow protein cleft in the first place."
We thank the Reviewer for this valuable feedback and we agree with the Reviewer. Our work on the IRE1 cLD activation mechanism is focused on generating a hypothesis of the binding mechanism driven by MD simulations. We recognize the limitations in defining a stable binder due to the time scales sampled. However, our primary focus was to sample and characterize a possible binding pose in the center of the cLD dimer. We contextualized our statements about stable binders and limited our claims to stating that the protein-peptide complex is stable within 1 µs-long simulations. However, we believe that our finding that the cLD dimer groove is not able to accommodate peptides is solid, as the steric impediment described is present in all our replicas, both with and without peptides, in a cumulative sampling time of 24 µs without peptides and 66 µs with peptides. Additionally, we included a plot showing the distribution of groove width across all replicas.
Addition to the text. (Results section: Unfolded polypeptides bind to hIRE1α cLD dimer surface) The title was changed from “Unfolded polypeptides can stably bind to hIRE1α cLD dimer” to “Unfolded polypeptides bind to hIRE1α cLD dimer surface”
Addition to the text. (Figure 15 A legend) “(A) Distributions of the groove width of peptide-bound cLD dimers throughout all simulations performed. The left column shows the values for the three replicas in TIP3P water, while the right column displays those for the three replicas in TIP4P-D water.”
(2) Oftentimes, representative structures sampled from MD simulation are used to draw conclusions (e.g., Figure 4 about the role of R161 mutation in binding affinity). This is not appropriate as one unbinding event being observed or not observed in a microsecond-long trajectory does not provide sufficient information about the binding strength of the free energy difference.
We thank the Reviewer for the insightful comment. As explained in the previous point, we believe that our simulations provide useful hypotheses. We are aware of the limitations due to the timescale and agree that these limitations cannot be overcome with standard equilibrium simulations. To address these limitations, used orthogonal methods, specifically MM/PB(GB)SA calculations, to calculate binding free energies from existing trajectories. We added predictions of all the peptides using AlphaFold 3, to confirm the binding region. Importantly, we now provide experimental results to assess the binding affinity of cLD dimer mutants E102R and Y161R.
Addition to the text. (Results section: Unfolded polypeptides bind to hIRE1α cLD dimer surface) “AlphaFold3 predictions of the complexes indicate that the peptides adopt the same preferred orientation, despite being predominantly helical (Supplementary Fig. 16A). We further assessed the MPZ-derived peptide complexes using MM/PBSA free energy calculations over the final 250 ns of each simulation replica (see Methods), finding binding enthalpies consistent with our observations (Supplementary Fig. 16B). In particular, MPZ1N-2X exhibited the lowest binding energy, whereas MPZ1N-2X-RD showed the highest.”
Addition to the text. (Figure 16 legend) “(A) Prediction of AlphaFold 3 for hIRE1α cLD dimer in complex with peptides. Colors represent the confidence of the prediction (plDDT). (B) Difference in enthalpy (enthalpy of binding, ∆H) as an estimate of the binding free energies of unfolded polypeptides to hIRE1α cLD dimer derived from MM/PBSA calculations of our peptide simulations.”
Addition to the text. (Figure 4 G legend) “(G) Fluorescence anisotropy measurements of labeled MPZ1N-2X binding to hIRE1α LD wild type and mutants E102R and Y161R.”
Addition to the text. (Results section: Point mutations destabilize unfolded peptide binding to cLD) “To experimentally test whether these residues are involved in hIRE1α LD’s interaction with peptides, we expressed and purified these mutants and conducted fluorescence anisotropy experiments using fluorescently labeled MPZ1N-2X peptide. We could purify both E102R and Y161R mutants to high purity (Supplementary Fig. 18C). They both behaved similarly to the wild type during purification. Notably, both E102R and Y161R mutants demonstrated around two-fold lower binding affinity (Fig. 4G, E102 K<sub>1/2</sub>= 6.35 µM and Y161R K<sub>1/2</sub>= 5.4 µM, Supplementary Table 3) compared to the wildtype (K<sub>1/2</sub>= 2.14 µM, Supplementary Table 3), revealing that the protein’s central area is crucial for binding unfolded proteins and that binding activity occurs within the pocket defined by E102 and Y161.”
Addition to the text. (Figure 4G legend) “(G) Fluorescence anisotropy measurements of labeled MPZ1N-2X binding to hIRE1α LD wild type and mutants E102R and Y161R.”
Addition to the text. (Supplementary Table 3)
Reviewer 2 (Public review):
(1) Improving presentation to include more computational details.
We thank the Reviewer for raising this critical point. We agree that the manuscript is tailored for a biology audience, as the data are particularly relevant for that community. Nevertheless, we also understand the importance of providing sufficient methodological detail for computational readers. We added more references to the methods for computational information in the main text.
(2) More quantitative analysis in addition to visual structures.
We added an uncertainty estimate for the HDX calculations using bootstrapping and included additional information on bond distances for E102 and Y161. We also incorporated time-series data showing the distance of the peptide from the groove across all replicas.
Addition to the text. (Figure 1C legend) “(C) The deuterated fraction obtained from experimental results (dashed line, shaded area indicates the error we calculated from bootstrapping) published by Amin-Wetzel et al. and the fraction computed from MD simulations (solid lines, blue for TIP3P water and orange for TIP4PD water) for the PDB and AF model at incubation time point 0.5 min. This time point corresponds to experimental incubation times, not MD simulation time. Each point represents the mean value derived from three replicas and two monomers per replica. The error bars were obtained from bootstrapping. Below each absolute value plot, we report the discrepancy, which is defined as the difference between the simulated and experimental deuterated fractions, with the shaded area indicating the corresponding error.”
Addition to the text. (Figure 15B legend) “(B) Minimum groove-peptide distance over time for all simulations of cLD dimer in complex with a peptide. The left column shows the values for the three replicas in TIP3P water, while the right column displays those for the three replicas in TIP4P-D water.”
Reviewer 3 (Public review):
A potential weakness of the study is the usage of equilibrium (unbiased) molecular dynamics simulations, so that processes and conformational changes on the microsecond time scale can be probed. Furthermore, there can be inaccuracies and biases in the description of unfolded peptides and protein segments due to the protein force fields. Here, it should be noted that the authors do acknowledge these possible limitations of their study in the conclusions.
We appreciate the Reviewer’s thoughtful comment. As noted in our response to Reviewer 1, we addressed the concern about sampling by applying orthogonal methods and experimental techniques. We agree with the Reviewer that some form of enhanced sampling is necessary if we want to assess binding in a more quantitative way, e.g., via free energy calculations. However, we also realize that applying any enhanced sampling scheme to our system is very challenging, given its large size and the complex peptide-protein interactions, which are not easily captured in a few collective variables. After a careful assessment and some preliminary tests, we decided that estimating free energies using enhanced sampling would necessitate a separate paper due to both the conceptual complexity of the project and the size of the necessary sampling campaign.
Recommendations for the authors:
Reviewer #1 (Recommendations for the authors):
(1) Some enhanced sampling or path sampling simulations may be carried out to identify the peptides’ binding and unbinding mechanisms to the protein. This can show whether the disordered peptides studied in this work do indeed bind to the protein.
We thank the Reviewer for this constructive criticism. We acknowledge the limitations associated with investigating binding and unbinding mechanisms of disordered peptides within the time scales accessible to our equilibrium simulations. However, the primary objective of our study was to sample and characterize a plausible binding pose at the center of the cLD dimer. We wanted to understand if unfolded model peptides require an open groove able to contain them to bind to IRE1’s core luminal domain or if binding also in the absence of an open groove.
Enhanced sampling is, of course, an important strategy to overcome the limits of equilibrium simulations. However, we note that implementing enhanced sampling approaches in this system poses significant challenges due to its large size and the complexity of peptide–protein interactions, which cannot be easily captured using a limited set of collective variables. We decided that a thorough application of enhanced sampling would therefore constitute a separate study. Instead, we decided to validate our simulations in two ways: 1) we ran a new set of free energy calculations, and 2) we tested key predictions in experiments, adding significant new data to strengthen the conclusions of our manuscript.
To evaluate whether the binding free energies of MPZ-derived peptides to human IRE1α cLD dimers are consistent with experimentally reported binding constants, we employed the MM/PBSA (Molecular Mechanics/Poisson–Boltzmann Surface Area) method. Calculations were performed over the final 250 ns of each simulation replica using the Single Trajectory Protocol (STP), which avoids the need for additional simulations. This approach provides an estimate of the effective binding free energy (i.e., enthalpy of binding) by accounting for bonded and non-bonded interactions, as well as solvation contributions. The entropic contribution, being computationally more demanding and subject to additional approximations, was not included. Binding enthalpies were obtained for MPZ1-N (in different initial orientations), MPZ1-C, MPZ1-N-2X, and MPZ1-N-2X-RD. The results indicated small differences in effective binding energies between the shorter peptides (MPZ1-N and MPZ1-C), whereas MPZ1-N-2X exhibited the lowest binding energy and MPZ1-N-2X-RD the highest, consistent with experimental trends. These findings support the reliability of our model and sampling strategy as a framework for analyzing peptide binding conformations to cLD.
We identified residues E102 and Y161 as key contributors to the binding of unfolded peptides in our simulations. Contact analysis revealed these residues as binding hotspots, centrally located within the observed interaction regions. To probe their relevance, we conducted simulations of cLD dimers with single arginine mutations in these residues, aimed at disrupting these hotspots through charge repulsion. These simulations revealed increased instability of the MPZ1N2X on the cLD dimer surface. We further validated these findings experimentally using fluorescence anisotropy assays. Fluorescently labeled MPZ1N-2X was titrated with purified cLD mutants (E102R and Y161R), and anisotropy measurements were fitted to derive K<sub>1/2</sub> values. Both mutations resulted in approximately a two-fold reduction in binding affinity relative to the wild-type cLD, confirming the importance of these residues in stabilizing peptide binding.
Addition to the text. (Results section title: Unfolded polypeptides bind to hIRE1α cLD dimer surface) “We further assessed the MPZ-derived peptide complexes using MM/PBSA free energy calculations over the final 250 ns of each simulation replica (see Methods), finding binding enthalpies consistent with our observations (Supplementary Fig. 16B). In particular, MPZ1N-2X exhibited the lowest binding energy, whereas MPZ1N-2X-RD showed the highest.”
Addition to the text. (Results section title: Unfolded polypeptides bind to hIRE1α cLD dimer surface) “Thus, we investigated how the point mutations of two key residues, E102R and Y161R, would affect peptide binding by simulating the cLD mutant in complex with MPZ1N-2X (Fig. 4C-E). We initialized the systems in the pose described for the other peptide-cLD systems described earlier (Fig. 3B, t = 0 µs). In simulations of the wild-type (WT) cLD dimer, the peptide generally remained near the center (Fig. 4C,F). By contrast, MPZ1N-2X displayed reduced binding to E102R, fully dissociating in one TIP4P-D replica (Fig. 4E,F). A similar trend was observed for Y161R, where one partial dissociation event occurred (Fig. 4D,F). Comparative analysis of MPZ1N-2X contact sites on the WT and mutant cLD dimers (Supplementary Fig. 17B-D) revealed that, in the presence of mutations, the peptide engages a broader surface region rather than remaining centrally localized, while forming fewer contacts with the specific residues (Supplementary Fig. 18A-B).”
Addition to the text. (Results section title: Unfolded polypeptides bind to hIRE1α cLD dimer surface) “To experimentally test whether these residues are involved in hIRE1α LD’s interaction with peptides, we expressed and purified these mutants and conducted fluorescence anisotropy experiments using fluorescently labeled MPZ1N-2X peptide. We could purify both E102R and Y161R mutants to high purity (Supplementary Fig. 18C). They both behaved similarly to the wild type during purification. Notably, both E102R and Y161R mutants demonstrated around two-fold lower binding affinity (Fig. 4G, E102 K<sub>1/2</sub>= 6.35 µM and Y161R K<sub>1/2</sub>= 5.4 µM, Supplementary Table 1) compared to the wildtype (K<sub>1/2</sub>= 2.14 µM, Supplementary Table 1), revealing that the protein’s central area is crucial for binding unfolded proteins and that binding activity occurs within the pocket defined by E102 and Y161.”
Addition to the text. (Figure 4 legend) “(E) Side view snapshot after 1 µs of simulation of E102R hIRE1α cLD dimer (gray) in complex with MPZ1N-2X (orange). The amino acid R102 on both monomers is represented in magenta sticks. (F) Time series of the minimum groove-peptide distance for MPZ1N-2X simulated in complex with wild-type, E102R, and Y161R hIRE1α cLD dimer in TIP3P (3 replicas) and TIP4P-D (3 replicas) water. The darker lines show the rolling average over 25 frames, while the shaded lines represent the raw data. (G) Fluorescence anisotropy measurements of labeled MPZ1N-2X binding to hIRE1α LD wild type and mutants E102R and Y161R.”
Addition to the text. (Methods section: Binding free energy calculations (MM/PBSA)) “The binding free energy of noncovalently bound complexes of human IRE1 cLD and peptides was calculated with MM/PBSA (Molecular mechanics/PoissonBoltzmann Surface Area) method via gmx_MMPBSA (version 1.6.4)[1, 2]. The Poisson-Boltzmann method was used to estimate the electrostatic contribution to solvation free energy as recommended for data obtained with the CHARMM force field. The contribution of the entropic term was omitted, obtaining effective binding free energy values, or enthalpy of binding (∆H). We used the Single Trajectory Protocol (STP), using the cLD-peptide simulations as input. The calculations were performed on the last 250 ns of each replica. Single-term total non-polar solvation free energy (inp = 1) was used. The charmm_radii (PBRadii= 7) was used to build amber topology files [3]. The default parameters were applied for other terms.”
Addition to the text. (Methods section: Protein purification) “To express hIRE1α LD (24-443) human cDNA sequences were cloned into pET47b(+) to create a coding sequence with N-terminal His6-tag. Mutations of hIRE1α LD were introduced by overlap extension PCR and restriction cloning into pET47b(+). For expression of the proteins, the plasmid of interest was transformed into Escherichia coli strain BL21DE3* RIPL (Agilent Technologies). Cells were grown in Luria Broth until OD600=0.6-0.8. Protein expression was induced with 0.6 mM IPTG, and cells were grown in 20°C overnight. For purification, cells after harvesting were resuspended in Lysis Buffer (50 mM HEPES pH 7.2, 400 mM NaCl, 20 mM imidazole, 5% glycerol, 5 mM β-mercaptoethanol) and were lysed in Constans Systems cell disruptor at 25 000 psi. The supernatant was collected after centrifugation for 45 minutes at 48000×g in 4°C. Supernatant was loaded onto Ni-NTA column (Cytiva) and the protein eluted with a linear gradient of imidazole from 20 to 500 mM. Fractions containing the protein were diluted 1:8 with anion exchange wash buffer (50 mM HEPES pH 7.2, 5 mM β-mercaptoethanol), loaded onto HiTRAP-Q ion exchange column (Cytiva) and eluted with a linear gradient from 50 mM to 1 M NaCl. Afterwards, the His6tag was removed by cleavage with Precission protease (GE Healthcare, 1 µg of enzyme per 100 µg of protein). The cleavage was performed overnight in 4°C. The protein sample after cleavage was loaded onto a Ni-NTA column, and the flow-through containing protein without the tag was collected. The protein was further purified on a Superdex 200 10/300 gel filtration column equilibrated with Buffer A (25 mM HEPES pH 7.2, 150 mM NaCl, 2 mM DTT). Protein concentrations were determined using extinction coefficient at 280 nm predicted by the Expasy ProtParam tool (http://web.expasy.org/protparam/).”
Addition to the text. (Methods section: Fluorescence anisotropy) “For fluorescence anisotropy measurements, the MPZ1-N-2X peptide attached to 5 carboxyfluorescein (5-FAM) at its N-terminus was obtained from GenScript at >95% purity. Binding affinities of hIRE1α LD mutants to FAM-labeled peptides were determined by measuring the change in fluorescence anisotropy on a Tecan CM Spark Micro Plate Reader with excitation at 485 nm and emission at 525 nm with increasing concentrations of hIRE1α LD variants. Measurements were performed in Buffer A supplemented with Tween 20 (25 mM HEPES pH 7.2, 150 mM NaCl, 2 mM DTT, 0.025% Tween 20). Fluorescently labeled peptides were used in a concentration of 90 nM. The reaction volume of each data point was 25 µL and the measurements were performed in 384-well, black flat-bottomed plates (Corning) after incubation of peptide with hIRE1α LD variants for 30 min at 25◦C. Binding curves were fitted using Prism Software (GraphPad) using the following equation: F<sub>bound</sub> = r<sub>free</sub> +( r<sub>max</sub> − r<sub>free</sub>)/(1+10((Log K<sub>1/2</sub> −x)·n<sub>H</sub>)), where F<sub>bound</sub> is the fraction of peptide bound, r<sub>max</sub> and r<sub>free</sub> are the anisotropy values at maximum and minimum plateaus, respectively. n<sub>H</sub> is the Hill coefficient and x is the concentration of the protein in log scale. Curve-fitting was performed with minimal constraints to obtain K<sub>1/2</sub> values with high R<sup>2</sup> values. However, as this equation does not consider the equilibria between hIRE1α LD dimers/oligomers, these apparent K<sub>1/2</sub> values do not reflect the dissociation constant.”
(2) Wherever possible, conclusions related to binding affinity should not be drawn from single unbinding events. For example, the title of Figure 4, "Single point mutation of cLD alters the binding affinity of unfolded peptide," should be softened. Similar changes should be made throughout the manuscript where such claims have been presented.
We thank the Reviewer for highlighting this important point. In the revised manuscript, we have adjusted the text to remove or soften conclusions related to binding affinity that were based on single unbinding events in the MD simulations.
Addition to the text. (Figure 4 title) “Single point mutations of cLD alter the binding of unfolded peptide MPZ1N-2X.”
Addition to the text. (Results section title: Unfolded polypeptides can stably bind to hIRE1α cLD dimer) “Unfolded polypeptides bind to hIRE1α cLD dimer surface.”
Addition to the text. (Results section: Unfolded polypeptides bind to hIRE1αα cLD dimer surface) “Our goal was to elucidate a potential binding pose and identify the relevant features of unfolded proteins and the cLD that affect the binding.”
Reviewer #2 (Recommendations for the authors):
(1) A table of all simulated trajectories, including simulation conditions, number of replicas, box size, number of atoms, equilibration length, recording time step, number of frames for further analysis.
We thank the Reviewer for this helpful suggestion. We have added a summary table of all simulations, including the requested details, to the Supplementary Information (Table 1).
Addition to the text. (Supplementary figures and tables: Table 2)
(2) The current NVT equilibration time was 0.125ns, and then no productive NPT simulations were mentioned as equilibration. Even though this is a simulation of mostly folded structures, it still takes some time for these amino acids to relax within the force field.
We thank the Reviewer for this constructive comment and acknowledge the validity of the concern. However, our simulations were extensively sampled, and equilibration was achieved within the first 50 ns of the production runs. Therefore, the segments of the trajectories from which we draw conclusions correspond to equilibrated states (see RMSD analysis, Figure 1). Additionally, binding free energy calculations (MM/PBSA) were carried out on the last 250 ns of the simulation replicas.
(3) At least three histograms were presented in Figure 2C, which I guess is from multiple simulations, and does not seem to be discussed.
We thank the Reviewer for pointing out the lack of reference to Figure 2C. We added the correct reference to the text where the groove width of luminal domains of human and yeast is discussed.
Author response image 1.
RMSD analysis of human IRE1_α_ cLD dimer simulated in complex with unfolded peptides.

Addition to the text. (Results section: The putative groove of human IREα cLD is dynamic but unable to contain peptides ) In simulations of the dimeric structures, the average groove width was 7.3 ± 0.1 Å for the human cLD and 8.9 ± 0.1 Å for the yeast cLD, averaged over three TIP3P and three TIP4P-D replicas per system (Fig. 2C).
(4) The comment regarding the CHARMM force field on Page 6 is not justified. Actually the force field the authors used (CHARMM36m, Jing et al Nat Methods 2016) did include scaling of TIP3P LJ parameters to correctly capture the dimensions of the intrinsically disordered proteins (IDPs). However, the authors cited a couple of examples of literature of previous versions of CHARMM force fields and commented that it cannot capture IDP dimensions with TIP3P.
We thank the Reviewer for pointing out this source of confusion. We cited the main papers of CHARMM as [4, 5], which were misleading, and following the Reviewer’s advice, we removed these citations.
Addition to the text. (Results section: The hIRE1α cLD forms a stable dimer) “Current all-atom force fields used in MD simulations are mainly designed to reproduce the dynamics of folded and globular proteins [6].”
(5) I am fine that the authors used TIP4PD with CHARMM36m, but caution should be taken for such a combination of protein and water force fields. Note that when optimizing force fields for IDPs, one often has to balance protein-water interactions by either enhancing protein-water interactions, enhancing water dispersions, or reducing protein-protein interactions. So, all such optimization is dependent on both protein and water force fields. TIP4PD was designed to pair with Amber99sb-ildn or, most recently, Amber99sb-disp instead of CHARMM36m. This could result in rescaling of LJ parameters.
We thank the Reviewer for raising this issue. We argue that the TIP4P-D water model has been used in combination with the CHARMM36m force field [7] and has been shown to yield satisfactory results for disordered regions.
Addition to the text. (Results section: The hIRE1α cLD forms a stable dimer) “The TIP4P-D water model was developed to address limitations of existing force fields in reproducing the structural ensembles of intrinsically disordered proteins and regions. It incorporates enhanced dispersion and moderately stronger electrostatic interactions to improve the balance between water dispersion and electrostatics [8]. Zapletal et al. [7] showed that for proteins containing both folded and disordered regions, the CHARMM36m force field [9] in combination with the TIP4P-D water model provides a robust framework, preventing collapse of disordered regions while preserving folded regions. Acknowledging that the behavior of disordered regions can be case-specific, we conducted molecular dynamics simulations of the two cLD dimer models using the CHARMM36m force field with both TIP3P and TIP4P-D water models.”
(6) I suggest referring to the methodology part for simulation details as much as possible when presenting the story.
We thank the Reviewer for this suggestion. In the revised manuscript, we now refer the reader to the Methodology section for detailed descriptions of the HDX-MS data analysis and the MM/PBSA free energy calculations.
Addition to the text. (Results section: Hydrogen-deuterium exchange experimental data validate the cLD dimer structure) “From our simulations, we calculated the theoretical deuterated fraction using the method by Bradshaw et al.[10] and compared it to the experimental data (Fig. 1C-D and Supplementary Fig. 10) (see Methods).”
Addition to the text. (Results section: Unfolded polypeptides bind to hIRE1α cLD dimer surface) “We further assessed the MPZ-derived peptide complexes using MM/PBSA free energy calculations over the final 250 ns of each simulation replica (see Methods), finding binding enthalpies consistent with our observations (Supplementary Fig. 16B). In particular, MPZ1N-2X exhibited the lowest binding energy, whereas MPZ1N-2X-RD showed the highest.”
(7) Error bars and methodology of error analysis should be provided for all cases of all-atom simulations if possible, since convergence is always an issue when considering these conformational changes within microseconds of all-atom simulations.
We thank the Reviewer for the important observation. We agree and added error methodology for the estimation of theoretical deuterated fractions (Fig. 1C).
Addition to the text. (Figure C legend) “Each point represents the mean value derived from three replicas and two monomers per replica. The error bars were obtained from bootstrapping.”
Addition to the text. (Methods section: Hydrogen-deuterium exchange fractions calculation from MD simulations) “To reproduce the time points after incubation in deuterium (D<sub>2</sub>O), we computed deuterated fractions separately for each of the two monomers constituting a dimer for the time points 0.5 min (30 s) and 5 min (300 s). Then, we computed the mean and standard deviation over the data coming from replicas of the same cLD dimer model (AF or PDB model) and the same water model (TIP3P or TIP4P-D). To estimate the uncertainty of the mean values obtained from our datasets and the dataset from Amin-Wetzel et al. ([11] Figure 3—source data 1), we applied a non-parametric bootstrap resampling procedure. For each sequence range from HDX-MS analysis, we treated the measurements from the N=6 independent datasets as independent samples, accounting for 3 replicas each with two monomers (6 monomers total). We then generated 10,000 bootstrap replicates by sampling the datasets with replacement, maintaining the same number of samples N in each resample. For each replicate, we calculated the mean at each sequence position. The resulting distribution of bootstrap means was used to compute the standard deviation as an estimate of the standard error. We computed the difference between simulation and experimental data (deuterated fraction discrepancy), and for each residue, we selected as the ‘best structure’ the model with the discrepancy closest to zero among PDB-TIP3P, PDB-TIP4P-D, AF-TIP3P, and AF-TIP4P-D systems.”
(8) Technically I would call DR1 and DR2 linker regions within a folded structure. Their motions are quite restrained by the fold part. I therefore, am not sure how much TIP4PD really helps in contrast to a scaled TIP3P. A plot of structures colored with PLDDT score or b-factor within the PDB should be provided. Quantitative metrics of these regions (e.g. chi chi-squared) might help justify the choice of the AF model against the PDB model. Currently, the two models look very similar in Figures 1c and 1d. Similarly, quantitative metrics as a function of different simulation time windows will help justify the convergence of the simulation and indicate the flexibility of these regions.
We thank the Reviewer for this thoughtful comment. In response, we analyzed the AlphaFold2 and AlphaFold3 predictions, which consistently assign very low pLDDT values (<50) to the DR2 region, while DR1, is predicted with higher but still low confidence (50 < pLDDT < 70). These scores indicate intrinsic uncertainty in the structural definition of both regions, supporting their flexibility despite being located within a folded context.
Addition to the text. (Results section: The hIRE1_α_ cLD forms a stable dimer) “All five AlphaFold 2 predictions closely resembled the top-ranked model used for our simulations (Supplementary Fig. 7C). In contrast, the five AlphaFold 3 predictions yielded greater variability in DR2 organization and longer helices in DR2, but still consistently maintain low pLDDT scores in this region, indicating disorder (Supplementary Fig. 7D).”
Addition to the text. (Figure 7 C-D legend) “(C) Superposition of the 5 structures predicted by AlphaFold 2 Multimer for the cLD dimer and colored by confidence prediction score (pLDDT). (D) Superposition of the 5 structures predicted by AlphaFold 3 for the cLD dimer and colored by confidence prediction score (pLDDT).”
(9) Fluorescence anisotropy seems to be an important set of experimental data to justify the binding of multiple unfolded peptides to IRE. I suggest the authors include a bar plot of binding affinity of different variants in Figure 3. The raw titration curves should also be included in SI.
We thank the Reviewer for this valuable suggestion. The binding affinities reported in previous studies are summarized in Table 2; the reader is referred to those works for the corresponding raw titration curves. The binding affinities for the cLD mutants analyzed in the present study are provided in Table 3, and the associated titration curves are shown in Figure 4G.
Addition to the text. (Figure 4G legend) “Fluorescence anisotropy measurements of labeled MPZ1N-2X binding to hIRE1α LD wild type and mutants E102R and Y161R.”
Addition to the text. (Supplementary figures and tables: Table 3) See Tab. 1
(10) The authors should discuss the dependence of initial orientations of unfolded peptides on the final results. The authors claimed that after 1 microsecond simulations, the orientation of these peptides to IRE changed. Quantitative metrics showing both the binding (e.g., number of contacts) and binding orientation (contact region or angles) should be provided to tell whether the simulation is converged. The comparison to the experimental data lacks quantitative metrics. The authors mentioned the dissociation of MPZ1N-2X-RD in half of the simulations; they might want to provide such a metric for all peptides. Technically, 1 microsecond brute-force simulation is quite short for observing such a binding event, and enhanced sampling methods (e.g. metadynamics) might be necessary for investigating binding. However, at least the presentation and interpretation of the current results should be improved for comparing simulations and experiments.
We thank the Reviewer for the insight. We expanded the discussion of the peptide orientation and added an analysis of the peptide angle with respect to the cLD central groove and contacts. Additionally, we inserted AlphaFold 3 predictions of all the simulated complexes.
Addition to the text. (Results section: Unfolded polypeptides bind to hIRE1_α_ cLD dimer surface) “In initial simulations with peptides valine8 and MPZ1-N, we positioned the polypeptides over the cLD, aligning them parallel to the principal axis of the central groove in accordance with the proposed binding mode. We refer to this pose as the "0◦ orientation", as the peptide forms a 0 ◦ angle with the principal axis of the groove. We observed that the peptides could rearrange into an orientation perpendicular to the central groove axis, while maintaining contact with the dimer (Fig. 3A, Supplementary Fig. 13A, valine8 TIP4P-D, and Supplementary Fig. 14). Conversely, when MPZ1-N was initially oriented perpendicularly to the groove, it did not transition to a parallel (0◦) orientation (Supplementary Fig. 14). We refer to these poses as the "90◦ orientation" and "270◦ orientation".”
Addition to the text. (Supplementary Figures and Tables Fig. 14) “(A) Peptide orientation with respect to the central groove principal axis. The angle was computed as the dihedral angle described by the Cα atoms of Y161 residues (groove principal axis) and the C_α_ atoms of residues L1 and A12 of the MPZ1N peptide. The dark lines indicate the rolling average of the fraction of native contacts over 10 frames, while the shaded lines indicate the value per frame. (B) Number of contacts between hIRE1α cLD dimer and MPZ1N peptide. The dark lines indicate the rolling average of the fraction of native contacts over 50 frames, while the shaded lines indicate the value per frame. The analysis were performed on three sets of simulations: "90 degrees" orientation, the peptide is initially placed perpendicular to the central groove principal axis; "270 degrees" orientation, the peptide is initially placed perpendicular to the central groove principal axis but flipped 180 degrees with respect to the 0 degree; "0 degrees" orientation, the peptide is placed parallel to the groove principal axis.”
Addition to the text. (Results section: Unfolded polypeptides bind to hIRE1α cLD dimer surface) “AlphaFold3 predictions of the complexes indicate that the peptides adopt the same preferred orientation, despite being predominantly helical (Supplementary Fig. ??A).”
Addition to the text. (Supplementary Figures and Tables Fig. 16A) “(A) Prediction of AlphaFold 3 for hIRE1α cLD dimer in complex with peptides. Colors represent the confidence of the prediction (plDDT).”
(11) I also have a couple of questions regarding the point mutant Y161R. a) The motivation of mutating Y161 to R is more speculative (Figures 4a,b) than quantitative. The authors might want to show an intermolecular contact map between IRE and unfolded peptides or IRE contact probability along residue indexes to show the interaction hotspots. Figure S11 only showed the structure instead of any metrics for such a purpose. b) It might be better to also show a histogram of the distances of Figure 4e and 4f. Figure 4f actually suggested 1 microsecond simulation is quite short to observe the dissociation event. c) Testing the mutation within the experiment, if possible, would clearly strengthen this part of the manuscript.
We thank the Reviewer for these constructive suggestions. We have added an analysis of intermolecular contacts for the Y161R and E102R mutants (Fig. 18A–B), which highlights the interaction hotspots between IRE1 residues and the unfolded peptides. To further characterize peptide–groove interactions, we now provide minimum peptide–groove distance time series for all peptides (Fig. 15B). Moreover, to experimentally support our simulations, we performed fluorescence anisotropy measurements on the MPZ1N-2X peptide with cLD WT and mutant constructs. These experiments confirm our computational observations (Fig. 4F–G and Fig. 18C).
Addition to the text. (Figure 18 legend) “(A) Number of contacts between residues 102 on both monomers and the MPZ1-N-2X peptide during simulations of WT hIREα LD and mutants E10R and Y161R. The dark lines indicate the rolling average of the fraction of native contacts over 25 frames, while the shaded lines indicate the value per frame. (B) Number of contacts between residues 161 on both monomers and the MPZ1-N-2X peptide during simulations of WT hIREα LD and mutants E10R and Y161R. The dark lines indicate the rolling average of the fraction of native contacts over 25 frames, while the shaded lines indicate the value per frame. (C) Protein purification of WT hIREα LD and mutants E10R and Y161R.”
Addition to the text. (Figure 4F-G legend) “(F) Time series of the minimum groove-peptide distance for MPZ1N-2X simulated in complex with wild-type, E102R, and Y161R hIRE1α cLD dimer in TIP3P (3 replicas) and TIP4P-D (3 replicas) water. The darker lines show the rolling average over 25 frames, while the shaded lines represent the raw data. (G) Fluorescence anisotropy measurements of labeled MPZ1N-2X binding to hIRE1α LD wild type and mutants E102R and Y161R.”
Addition to the text. (Figure 15B legend) “(B) Minimum groove-peptide distance over time for all simulations of cLD dimer in complex with a peptide. The left column shows the values for the three replicas in TIP3P water, while the right column displays those for the three replicas in TIP4P-D water.”
(12) Similar comments of quantitative analysis (e.g. contact map as a function of simulation time) apply to the last part of results when discussing the intermolecular interactions. Observations such as "the interface predicted by AlphaFold showed stability across MD simulation replicas lasting 200 ns" were provided, but there is no quantitative analysis. How consistent was this observation across multiple replicas of simulations, and how many replicas were used?
We thank the Reviewer for this valuable suggestion. To provide a quantitative assessment, we performed new triplicate simulations of the BiP–cLD monomer complex and plotted the fraction of native contacts over time. These results, which demonstrate the consistency of the interface across replicas, are now included in the Supplementary Material.
Addition to the text. (Figure 19 legend) “(A) Prediction of AlphaFold 3 for hIRE1α cLD monomer in complex with ATP-bound BiP. The colors are as in Fig. 5B. (B) Prediction of AlphaFold 3 for hIRE1α cLD monomer in complex with ADP-bound BiP. (C) Prediction of AlphaFold 3 for hIRE1α cLD monomer in complex with BiP not bound to any nucleotide. (D) Structure of hIRE1α cLDBiP-ATP after 2 µs of simulation. (E) Structure of hIRE1α cLD-BiP-ADP after 2 µs of simulation. (F) Structure of hIRE1α cLD-BiP after 2 µs of simulation.”
Addition to the text. (Figure 20 legend) “Fraction of native contacts between BiP and cLD monomer in simulations of the structures predicted by AlphaFold 3 without ligands or in complex with ADP or ATP. The dark lines indicate the rolling average of the fraction of native contacts over 100 frames, while the shaded lines indicate the value per frame. The fraction of native contacts (Q) was calculated according to the definition of Best et al. [12]:  . For N pairs of native contacts (i, j), where
  is the distance of the pair in the initial configuration (here the AlphaFold 3 prediction), r<sub>(i,j)</sub>(X) is the distance at frame X, β is a smoothing parameter (β = 50 nm<sup>−1</sup>), λ is the tolerance of the reference distance (λ \= 1.8) and the cutoff used to define a contact between heavy atoms was 0.45 nm.”
(13) The figure legends are noted using lowercase letters but are described using uppercase.
We thank the Reviewer for pointing that out, and we changed everything to capital letters.
Reviewer #3 (Recommendations for the authors):
(1) Figure 1: I am confused about the HDX-MS results shown in Figure 1. Here, I must also mention that I am not familiar with comparing HDX-MS experiments with MD simulations. The authors mention that they show the deuterated fraction computed from MD simulations for the PDB and AF model at time points 0.5 min and 5 min. However, this time certainly does not correspond to the MD simulation time, thus, it is unclear to me where the difference between the results comes from. Are the two time points some input parameters to the script used to calculate the deuterated fraction? Thus, I would ask the authors to better explain what is the difference in the results between the two time points. Especially, since the general reader might not be familiar with comparing HDX-MS experimental results to MD simulations. Furthermore, I would ask the authors to clarify in the Figure 1 caption that these time points do not correspond to the MD simulation time.
We thank the Reviewer for pointing us to this possible source of confusion. The time points are effectively input parameters to the calculations of theoretical deuterated fractions from MD simulations. We expanded the explanation of the method in the method section and clarified in the Figure 1 caption that these time points do not correspond to the MD simulation time.
Addition to the text. (Methods section: Hydrogen-deuterium exchange fractions calculation from MD simulations) “To determine the deuterated fraction of a peptide segment from simulations, the protection factor for each residue i, Pi, must be computed from the simulation snapshots, following the approach of Best and Vendruscolo [13]:  . Here, N<sub>C,i</sub> and N<sub>H,i</sub> are the number of H-bonds and heavy-atom contacts of the backbone amide of residue i, and the scaling factors β<sub>C</sub> and β<sub>H</sub> are set to 0.35 and 2.0, respectively. The simulated deuterated fraction of a peptide segment,
  , defined by residues m<sub>j</sub> +1 to n<sub>j</sub>, was then calculated at any exchange time point t as:
Where m<sub>j</sub> and n<sub>j</sub> are the first and last residue numbers of the j-th protein fragment, respectively. The intrinsic exchange rate constants for each residue type ( ) were obtained from Bai et al. with updated acidic residues and glycine [14, 15].”
Addition to the text. (Figure 1 legend: ) “This time point corresponds to experimental incubation times, not MD simulation time.”
Addition to the text. (Figure 10 legend: ) “Time points correspond to experimental incubation times, not MD simulation time.”
(2) For AlphaFold 2 Multimer prediction, the authors only considered the top predicted structure. However, AF2-M, one generally obtains 5 structures, and it is also possible to obtain more structures by using an additional random seed. Thus, it would be interesting if the authors would consider the difference between the 5 structures they obtained from the AF2-M prediction. Are they all very similar? (Especially considering the DR1 and DR2 segments, that is the main difference between the PDB and AF2 structures). Analyzing the different predicted AF2 structures would give more insight into the accuracy of the AF2-M predicted model.
We thank the Reviewer for this insightful suggestion. All AF2-M predicted structures were found to be highly similar, and we now include them in Figure 7E for comparison.
Addition to the text. (Figure 7E legend) “(E) Superposition of the 5 structures predicted by AlphaFold 2 Multimer for the cLD dimer and colored by confidence prediction score (pLDDT).”
(3) On Page 6, the authors talk about a "an early PDB model". First, I find the nomenclature "early" confusing here; perhaps it would be better to talk about "an initial PDB model", but I leave it up to the authors to think about if they want to change that. More importantly, reading the Comp. detail on Page 23, it is not so clear what the difference is between the "early" and "final" PDB models, and how the difference in their setups leads to different results. The information is somewhat there on Page 6 and Page 23, but it can be made much clearer. Thus, I would ask the authors to better explain the difference between the early and final PDB models.
We thank the Reviewer for this helpful comment. In the revised manuscript, we have clarified the terminology and provided a more explicit explanation of the differences between the two IRE1 models, both in the Results section and in the Methods.
Addition to the text. (Results section: The hIRE1α cLD forms a stable dimer) “An initial PDB model with modified side chain orientations in residues L116 and Y166 due to the modelling of neighbouring missing DR1, caused the dimer to dissociate in one-third of the replicas. [...] The final PDB model, with correctly oriented L116 and Y166 (Supplementary Fig. 9B), was stable in simulations in both TIP3P and TIP4P-D water (Supplementary Fig. 7B).”
Addition to the text. (Methods section: IRE1_α_ core Luminal Domain (cLD) structural models - Human PDB dimer) “An initial PDB model was briefly equilibrated in NPT, and a conformation with a groove width of approximately 0.6 nm was selected. This snapshot was used as the initial structure for the initial “PDB model” simulations, in which the dimer dissociates.”
(4) Page 12: "In early simulations", again, I find the nomenclature "early" confusing here. Perhaps it would be better to talk about "In initial simulations" or "In preliminary simulations", but I leave it up to authors to think about this.
We thank the Reviewer for pointing out this possible source of confusion. We improved the text by referring to these simulations based on the different orientations of the peptide on the cLD dimer in the modeled complex.
Addition to the text. (Results section: Unfolded polypeptides bind to hIRE1_α_ cLD dimer surface) “In initial simulations with peptides valine8 and MPZ1-N, we positioned the polypeptides over the cLD, aligning them parallel to the principal axis of the central groove in accordance with the proposed binding mode. We refer to this pose as the "0° orientation", as the peptide forms a 0° angle with the principal axis of the groove. We observed that the peptides could rearrange into an orientation perpendicular to the central groove axis, while maintaining contact with the dimer (Fig. 3A, Supplementary Fig. 13A, valine8 TIP4P-D, and Supplementary Fig. 14). Conversely, when MPZ1-N was initially oriented perpendicularly to the groove, it did not transition to a parallel (0°) orientation (Supplementary Fig. 14). We refer to these poses as the "90° orientation" and "270° orientation".”
Here, we provide a detailed description of the additional changes made to the manuscript.
Additional edits to the manuscript
Following discussions with Prof. Dr. David Ron, we refined our BiP model by removing the signal peptide (residues 1–18). Using AlphaFold 3, we predicted BiP–cLD heterodimeric complexes in the presence of ADP, ATP, or without nucleotide. Each of the three complexes was simulated in TIP3P water, in three independent replicas of 1 µs each.
Addition to the text. (Results section: hIRE1α cLD intermolecular interactions guide the activation process) “We used AlphaFold 3 to model the interaction between a cLD monomer and BiP (residues E19–L654) in the presence of ATP and ADP (Fig. 5B, Supplementary Fig. 19A). Prediction quality was limited in the apo and ADP-bound states (pTM = 0.48, ipTM = 0.59; pTM = 0.49, ipTM = 0.61, respectively), whereas ATP binding improved accuracy (pTM = 0.66, ipTM = 0.72). The predicted interfaces involved DR2, particularly residues 314PLLEG-318, forming a short parallel β-sheet with the substrate-binding domain (SBD) of BiP through two hydrogen bonds. All AlphaFold 3 models were stable across three 1-µs simulations (Supplementary Fig. 19B), with cLD–BiP interfaces retaining 60–80% of initial contacts (Supplementary Fig. 20). In the apo and ADP-bound states, the nucleotide-binding domain (NBD) showed high Predicted Aligned Error (PAE) relative to the cLD, indicating uncertain positioning of the two domains relative to each other. Notably, in the ADP-bound state, which is thought to interact with hIRE1α cLD, the NBD remained mobile but proximal to the αB-helices, thereby restricting access to this region. Together, the AlphaFold 3 predictions suggest that BiP engages hIRE1α cLD by sterically hindering the oligomerization interface defined by DR2 and the αB-helices [16].”
Addition to the text. (Figure 5 legend) “(B) BiP-cLD monomer complex as predicted by AlphaFold (BiP in shades of purple, cLD in orange) before the simulation (t = 0 µs) and at the end of the simulation (t = 1 µs). The SBD (residues E19-D408) is colored in light purple, and the NDB (residues C420-E650) in dark purple, and the interdomain linker (residues D409-V419) and KDEL motif (residues K651-L654) in light purple.”
Addition to the text. (Figure 19 legend) “(A) Prediction of AlphaFold 3 for hIRE1α cLD monomer in complex with ATP-bound BiP. The colors are as in Fig. 5B. (B) Prediction of AlphaFold 3 for hIRE1α cLD monomer in complex with ADP-bound BiP. (C) Prediction of AlphaFold 3 for hIRE1α cLD monomer in complex with BiP not bound to any nucleotide. (D) Structure of hIRE1α cLDBiP-ATP after 2 µs of simulation. (E) Structure of hIRE1α cLD-BiP-ADP after 2 µs of simulation. (F) Structure of hIRE1α cLD-BiP after 2 µs of simulation.”
Addition to the text. (Methods section: cLD monomer in complex with BiP) “The BiP-cLD heterodimer systems were predicted with AlphaFold 3 using the AlphaFold server[17] at https://alphafoldserver.com/. The hIRE1α cLD sequence used is the same used for predicting the dimer: the PDB 2HZ6 sequence, Uniprot identifier O75460 with mutations C127S and C311S, and residues P29-P368. The BiP sequence used is taken from UniProt identifier P11021, residues E19L654. We predicted three complexes: one without any nucleotide, one containing ADP, and another containing ATP. Simulations of the BiP-cLD complex were run in TIP3P water.”
We have updated the Zenodo repository with additional data and calculations, and the corresponding link is provided in the manuscript.
References
(1) Mario S. Valdés-Tresanco, Mario E. Valdés-Tresanco, Pedro A. Valiente, and Ernesto Moreno. gmx_mmpbsa: A New Tool to Perform End-State Free Energy Calculations with GROMACS. Journal of Chemical Theory and Computation, 17(10):6281–6291, October 2021. Publisher: American Chemical Society.
(2) Bill R. III Miller, T. Dwight Jr. McGee, Jason M. Swails, Nadine Homeyer, Holger Gohlke, and Adrian E. Roitberg. MMPBSA.py: An Efficient Program for End-State Free Energy Calculations. Journal of Chemical Theory and Computation, 8(9):3314–3321, September 2012. Publisher: American Chemical Society.
(3) Fanhao Wang, Yuzhe Wang, Laiyi Feng, Changsheng Zhang, and Luhua Lai. Target-Specific De Novo Peptide Binder Design with DiffPepBuilder. Journal of Chemical Information and Modeling, 64(24):9135–9149, December 2024. Publisher: American Chemical Society.
(4) Alexander D. MacKerell Jr., Bernard Brooks, Charles L. Brooks III, Lennart Nilsson, Benoit Roux, Youngdo Won, and Martin Karplus. CHARMM: The Energy Function and Its Parameterization. In Encyclopedia of Computational Chemistry. 2002.
(5) Bernard R. Brooks, Robert E. Bruccoleri, Barry D. Olafson, David J. States, S. Swaminathan, and Martin Karplus. CHARMM: A program for macromolecular energy, minimization, and dynamics calculations. Journal of Computational Chemistry, 4(2):187–217, 1983.
(6) Junxi Mu, Hao Liu, Jian Zhang, Ray Luo, and Hai-Feng Chen. Recent Force Field Strategies for Intrinsically Disordered Proteins. Journal of Chemical Information and Modeling, 61(3):1037–1047, March 2021.
(7) Vojtech Zapletal, Arnošt Mládek, Kateˇ ˇrina Melková, Petr Louša, Erik Nomilner, Zuzana Jasenáková, Vojtˇ ech Kubᡠn, Markéta Makovická, Alice Laníková, Lukᚡ Žídek, and Jozef Hritz. Choice of Force Field for Proteins Containing Structured and Intrinsically Disordered Regions. Biophysical Journal, 118(7):1621–1633, April 2020.
(8) Stefano Piana, Alexander G. Donchev, Paul Robustelli, and David E. Shaw. Water dispersion interactions strongly influence simulated structural properties of disordered protein states. Journal of Physical Chemistry B, 119(16):5113–5123, April 2015.
(9) Jing Huang, Sarah Rauscher, Grzegorz Nawrocki, Ting Ran, Michael Feig, Bert L. de Groot, Helmut Grubmüller, and Alexander D. MacKerell. CHARMM36m: an improved force field for folded and intrinsically disordered proteins. Nature Methods, 14(1):71–73, January 2017.
(10) Richard T. Bradshaw, Fabrizio Marinelli, José D. Faraldo-Gómez, and Lucy R. Forrest. Interpretation of HDX Data by Maximum-Entropy Reweighting of Simulated Structural Ensembles. Biophysical Journal, 118(7):1649–1664, April 2020.
(11) Niko Amin-Wetzel, Lisa Neidhardt, Yahui Yan, Matthias P. Mayer, and David Ron. Unstructured regions in IRE1 specify BiP-mediated destabilisation of the luminal domain dimer and repression of the UPR. eLife, 8, December 2019.
(12) Robert B. Best, Gerhard Hummer, and William A. Eaton. Native contacts determine protein folding mechanisms in atomistic simulations. Proceedings of the National Academy of Sciences, 110(44):17874–17879, October 2013. Publisher: Proceedings of the National Academy of Sciences.
(13) Robert B. Best and Michele Vendruscolo. Structural Interpretation of Hydrogen Exchange Protection Factors in Proteins: Characterization of the Native State Fluctuations of CI2. Structure, 14(1):97–106, January 2006.
(14) Yawen Bai, John S. Milne, Leland Mayne, and S. Walter Englander. Primary structure effects on peptide group hydrogen exchange. Proteins: Structure, Function, and Bioinformatics, 17(1):75–86, 1993. _eprint: https://onlinelibrary.wiley.com/doi/pdf/10.1002/prot.340170110.
(15) David Nguyen, Leland Mayne, Michael C. Phillips, and S. Walter Englander. Reference Parameters for Protein Hydrogen Exchange Rates. Journal of the American Society for Mass Spectrometry, 29(9):1936–1939, September 2018. Publisher: American Society for Mass Spectrometry. Published by the American Chemical Society. All rights reserved.
(16) G Elif Karagöz, Diego Acosta-Alvear, Hieu T Nguyen, Crystal P Lee, Feixia Chu, and Peter Walter. An unfolded protein-induced conformational switch activates mammalian IRE1. eLife, 6:e30700, 2017.
(17) Josh Abramson, Jonas Adler, Jack Dunger, Richard Evans, Tim Green, Alexander Pritzel, Olaf Ronneberger, Lindsay Willmore, Andrew J. Ballard, Joshua Bambrick, Sebastian W. Bodenstein, David A. Evans, Chia-Chun Hung, Michael O’Neill, David Reiman, Kathryn Tunyasuvunakool, Zachary Wu, Akvile Žemgu-˙ lyte, Eirini Arvaniti, Charles Beattie, Ottavia Bertolli, Alex Bridgland, Alexey˙ Cherepanov, Miles Congreve, Alexander I. Cowen-Rivers, Andrew Cowie, Michael Figurnov, Fabian B. Fuchs, Hannah Gladman, Rishub Jain, Yousuf A. Khan, Caroline M. R. Low, Kuba Perlin, Anna Potapenko, Pascal Savy, Sukhdeep Singh, Adrian Stecula, Ashok Thillaisundaram, Catherine Tong, Sergei Yakneen, Ellen D. Zhong, Michal Zielinski, Augustin Žídek, Victor Bapst, Pushmeet Kohli, Max Jaderberg, Demis Hassabis, and John M. Jumper. Accurate structure prediction of biomolecular interactions with AlphaFold 3. Nature, pages 1–3, May 2024.
documentation

<< from-pdweb.archive-github.eidetica
💻/thinkpad/🧊/me/📓/2026/04/22
eLife Assessment
This study characterizes several novel activities of SARS-CoV-2 helicase nsp13, providing valuable insights into potentially new functions of this essential RNA-processing enzyme in the virus life cycle. However, the experimental evidence to support the authors' claims is incomplete. In addition, the placement of the polyhistidine affinity tag on nsp13 may cause artifacts, raising concerns about the interpretation of the results.
Reviewer #2 (Public review):
Summary:
The authors are trying to broaden the understanding of SARS-CoV2 Nsp13 activity to show that a single viral protein can accomplish multiple functions. Additionally, they try to show that helicase function is not limited to ATP-driven, unidirectional unwinding.
Strengths:
The consistent application of statistics to triplicate experiments is a strength of the manuscript. The ToPif1 control in Figure S12 is a good control.
Weaknesses:
(1) All the experiments except the one in Figure S2 use N-terminally His-tagged Nsp13. Because the N-terminal tag is known to have large effects on Nsp13 activity, this calls into question virtually all of the results in this manuscript.
(2) The ATP-independent, bidirectional duplex unwinding shown for short duplex substrates is reminiscent of the trapping of thermal fraying intermediates that have been reported for other helicases. Because they are only observed on short duplexes, do not require ATP, and are bidirectional, this does not suggest strand displacement as suggested in the manuscript. Instead, it suggests trapping of partially melted intermediates.
(3) Results that may be artifacts of unusual in vitro conditions are interpreted as if similar results will occur in the cell, where ATP is likely always present. Along those same lines, SARS-CoV-2 replicates in compartments of the endoplasmic reticulum, which would limit the ability of Nsp13 to access DNA substrates.
(4) There is no evidence to support the conclusion that "Duplex DNA supports bidirectional remodeling via both ATP-dependent and ATP-independent mechanisms." 3'-5' duplex melting is limited to short duplexes and is ATP-independent, suggesting it may be due to trapping of thermal fraying intermediates by the ssDNA binding Nsp13. The ATP-dependent and ATP-independent melting on the substrates with the 3'-overhang are the same, suggesting that ATP-dependent melting does not occur on this substrate, which would indicate that bidirectional ATP-dependent translocation does not occur.
(5) The description of ATP-independent unwinding as having "limited processivity," is likely not accurate. These experiments were multiturnover reactions with very high Nsp13 concentrations and no protein trap to ensure single turnover conditions. Because the reactions were multi-turnover, no information about the processivity of Nsp13 can be obtained. On the contrary, it seems likely that the product formed over the 30-minute reaction with a vast excess of Nsp13 is due to binding and dissociation of multiple Nsp13 molecules instead of processive translocation by a single enzyme.
(6) G4s are much more stable at cellular K+ concentrations than they are at 20 mM K+. As such, Nsp13's ability to unfold a G4 in the absence of ATP may be diminished or eliminated at a physiological K+ concentration.
Although the authors show that His-tagged Nsp13 can melt DNA and RNA duplexes and G-quadruplexes in an ATP-dependent and independent manner, in addition to annealing single-stranded nucleic acids into duplexes, the use of His-tagged Nsp13, which is known to cause artifacts, makes their results difficult to draw conclusions from. As such, in the opinion of this reviewer, this manuscript is likely to have little impact on the field.
Author response:
Public Reviews:
Reviewer #1 (Public review):
In the manuscript by Li et al., the authors perform a comprehensive study on the template and cofactor determinants of the SARS-CoV-2 nsp13 protein. They find that, alongside the classical processive unwinding ability of helicases driven by ATP consumption, other chaperone-like and ATP-independent functions exist for this enzyme. By testing DNA and RNA oligos in several conformations, the authors show that these functions are highly dependent on template identity, but also on the ratio of ATP to divalent cations. Ultimately, it is suggested that these distinct mechanisms of action are employed by nsp13 to orchestrate viral replication.
Overall, this study provides some novel insights into the functionality of a central and conserved enzyme of a relevant human pathogenic virus. While the approach is important and adds to the field, particularly by characterizing the chaperoning activities and adding G-quadruplexes as templates, previous studies have already identified several determinants of nsp13 template binding and processing in vitro (Sommers et al., 2023, JBC; Park et al., 2025, JBC). In addition, some issues regarding experimental design need to be addressed to increase the cogency and biological relevance of the study.
We thank the reviewer for recognizing the novelty of our work, particularly the ATP-independent chaperone-like activities and G-quadruplex remodeling. We also appreciate the opportunity to clarify the conceptual distinction between our study and the prior work by Sommers et al. (2023) and Park et al. (2025). We fully agree that those studies systematically defined the canonical ATP-driven motor mechanism of Nsp13. Our results on 5′→3′ polarity, DNA preference, and tail/ATP/Mg<sup>2+</sup> dependence align with these benchmarks, confirming the reliability of our platform.
However, the core novelty of our work lies in revealing that Nsp13 functions as a multifaceted nucleic acid remodeler, integrating motor and non-motor activities within a single protein-a functional regime absent from the JBC papers. Specifically, we uncover three novel layers: 1. Mg<sup>2+</sup>-activated, ATP-independent remodeling of short duplexes and G-quadruplexes. 2. Bidirectional remodeling on duplexes in the Mg<sup>2+</sup>-primed state. 3. Intrinsic chaperone functions including strand annealing and stem-loop restructuring.
Thus, our work fundamentally expands the biochemical model of Nsp13 from a simple ATP-driven motor to a multifunctional, mode-switchable remodeler. We will highlight these distinctions in the revised Discussion. Below, we respond point-by-point to the specific experimental design issues.
(1) Generally, low concentrations of monovalent cations (20 mM), as used throughout this study, may influence helicase activity and artificially enhance protein binding/oligomerization, which could favor the observed chaperoning activity (Venus et al., 2022, Methods). In contrast, some helicases, such as HCV NS3, are inhibited by higher K+ concentrations (Gwack et al., 2004, FEBS). Thus, the influence of higher concentrations of monovalent cations should be tested in relevant assays, as intracellular K+ levels are usually >100 mM. Additionally, this could significantly affect template stability. For instance, in some G4 assays, the addition of the trap already leads to observable duplex formation (Figure 5), which may be due to low K+ conditions.
We thank the reviewer for this critical comment regarding the ionic environment. We agree that monovalent cation concentrations are pivotal for both helicase activity and the structural stability of templates like G4s.
First, we wish to clarify that the final NaCl concentration in our reaction is not 20 mM, as this refers only to the unwinding buffer. Our protein dilution buffer contains 200 mM NaCl, and each 10 μL reaction includes 2 μL of protein, contributing ~40 mM NaCl. With 20 mM from the reaction buffer, the final concentration reaches~60 mM. We will clarify this in the Methods.
Second, our choice of ionic strength is guided by established literature. A survey of 27 published nsp13 studies (Author response table 1) shows that the majority use 20–50 mM monovalent cations, with 20 mM being most common. Mickolajczyk et al. (2021) showed that nsp13 activity is highest at low salt and declines at higher concentrations. Thus, low salt conditions are routinely used to capture nsp13’s intrinsic catalytic activity. The intracellular environment is far more complex, with crowding and interacting proteins that likely modulate helicase behavior. The low-salt conditions are therefore a deliberate simplification to isolate and define enzyme function.
Planned experiments: We fully agree that higher salt concentrations should be tested. In the revision, we will perform key assays such as ATP-independent duplex unwinding and G4 unfolding at ≥100 mM NaCl or KCl to verify that the observed activities persist under more physiological ionic conditions
(2) As in most publications that focus strictly on helicase (or other enzymatic) functions, the activity of the isolated protein is examined. However, particularly in the case of nsp13, core functions rely on other factors, such as nsp7/8 and other components of the replication-transcription complex (RTC). The overall structure and oligomerization state of nsp13 are altered within the complex (Chen et al., 2022, NSMB). The inclusion of such factors in key experiments would greatly improve the biological relevance of the findings.
We agree that examining Nsp13 within the context of the RTC is essential for establishing the biological relevance of our findings. The structural reorganization of Nsp13 upon binding to Nsp12 and Nsp7/8 (Chen et al., 2022) suggests that its enzymatic "mode" may be regulated by its protein partners.
Planned experiments: To address this, we will include the following biochemical characterizations:
(1) Nsp13/12 and Nsp13/7/8 sub-complexes will be examined to dissect the individual contributions of the polymerase and the primase-like factors to Nsp13’s multifaceted activities.
(2) The core RTC (Nsp13/12/7/8) will be used to evaluate how the full assembly modulates the functions of Nsp13 particularly on complex templates like G4 and pseudoknots.
(3) In Figure 4, the authors claim that Mg2+ concentration inhibits RNA unwinding. While this is likely considering previous findings, it must be validated that duplex stabilization is not the primary cause for the observed lower dissociation rates. As the template is only 12 bp long with extensive overhangs, higher ion concentrations may significantly stabilize base pairing by reducing fraying effects. Similarly, in Figure 6, template-dependent effects of Mg2+/ATP should be ruled out.
We thank the reviewer for this insightful suggestion. We agree that it is critical to distinguish whether the observed inhibition of RNA unwinding at higher Mg<sup>2+</sup> concentrations is due to the physical stabilization of the RNA duplex.
Planned experiments: To address this, we will perform the following characterizations:
(1) We will measure the Tm of the RNA duplex used in Figure 4 across a range of Mg<sup>2+</sup> concentrations (0, 0.5, and 1.0 mM). This will allow us to quantify the extent to which divalent cations stabilize the duplex RNA. These data will provide a more rigorous interpretation of the Mg<sup>2+</sup>-dependent unwinding in Figure 4.
(2) Similarly, we will perform thermal melting analyses for the various DNA and RNA templates used in Figure 6 under different Mg<sup>2+</sup>/ATP conditions to rule out the template-dependent effects of Mg<sup>2+</sup>/ATP.
(4) It is not entirely clear to me by which principle the templates were chosen. In my opinion, it would improve the overall comparability of the experimental results if, for instance, the blunt-ended duplex had the same sequence as the oligos with overhangs, since factors such as length, G/C content, Tm, etc., may play a significant role in binding and unwinding. Similarly, the oligos for binding and unwinding should be kept somewhat comparable, e.g., the G4 for the binding assay has 3 stacks, whereas RG1 has only 2. This discrepancy could make a significant difference. Thus, key experiments should be repeated using comparable sequence pairs.
We fully agree with the reviewer that maintaining sequence consistency across different assays is essential for a rigorous comparison of nsp13 activities. We apologize for the ambiguity in the initial presentation of our sequences in Table S1.
Planned revisions and experiments:
(1) We wish to clarify that several key substrates were sequence-matched. For unwinding assays, the 12-bp 3′-overhang DNA and blunt-ended DNA share the identical duplex sequence, and the 16-bp 5′-overhang and 3′-overhang DNA substrates are also sequence-matched. For annealing assays, the duplex regions for all DNA substrates (3′, 5′, blunt, and fork) are identical, and the same internal consistency was maintained for all RNA annealing substrates. To make this clear, we will reorganize Table S1 to explicitly group these sequence-paired substrates.
(2) The reviewer also notes discrepancies between binding and unwinding substrates (e.g., the difference in G4 stacks). To ensure direct comparability, we will perform additional experiments: complete binding assays for RG-1 (the 2-stack G4 used in unwinding) to match the functional data, and systematically measure binding affinities for all key unwinding substrates, including 3′-overhang, 5′-overhang, blunt-ended DNA, and the RNA fork.
(5) Moreover, in the initial characterization of the binding abilities (Figure 1), the authors should include blunt-ended controls (duplex/hairpin) and, importantly, a pseudoknot (PK), as these structures are crucial for multiple steps in the viral life cycle (frameshifting, replication). Specifically, the PK in the 3'UTR (Sola et al., 2011, RNA Biology) may be an interesting target structure for unwinding assays, as it recruits the RTC, and, to my knowledge, no studies are available regarding nsp13 function at a PK. This would be particularly interesting in combination with nsp7/8 (Ohyama et al., 2024, JACS Au).
We thank the reviewer for this insightful and inspiring suggestion. Incorporating pseudoknot (PK) structures into our analysis—particularly the well-characterized PK in the 3'UTR (Sola et al., 2011)—represents a significant opportunity to bridge our biochemical findings with the viral life cycle. To address this, we have designed a 3'UTR PK substrate based on recently reported scaffolds (Ohyama et al., 2024).
Planned experiments:
(1) We will expand our initial binding assays (Figure 1) to include blunt-ended duplexes, hairpins, and the 3'UTR PK. This will establish a baseline for how Nsp13 recognizes these structurally distinct and physiologically critical templates.
(2) We will perform unwinding assays to determine whether Nsp13, in its isolated state, possesses the mechanical capability to resolve the complex tertiary interactions within a pseudoknot.
(3) Following the reviewer's insight, we will examine whether the addition of nsp7/8 is required to facilitate the unfolding of the 3'UTR PK.
Together, these experiments will allow us to assess whether Nsp13 is capable of managing one of the most challenging structural obstacles in the SARS-CoV-2 genome.
Reviewer #2 (Public review):
Summary:
The authors are trying to broaden the understanding of SARS-CoV2 Nsp13 activity to show that a single viral protein can accomplish multiple functions. Additionally, they try to show that helicase function is not limited to ATP-driven, unidirectional unwinding.
Strengths: The consistent application of statistics to triplicate experiments is a strength of the manuscript. The ToPif1 control in Figure S12 is a good control.
We thank the reviewer for the insightful assessment and for highlighting the rigor of our experimental design, particularly our reliance on triplicate data with robust statistical validation and the inclusion of the ToPif1 control.
We are especially grateful for the detailed comments provided by the reviewer. We fully recognize that addressing these specific points is essential for strengthening the cogency of our conclusions and improving the overall rigor of the manuscript. These suggestions have provided us with a clear roadmap for further refining our experimental evidence and clarifying our mechanistic interpretations. Below, we respond point-by-point to the specific issues.
Weaknesses:
(1) All the experiments except the one in Figure S2 use N-terminally His-tagged Nsp13. Because the N-terminal tag is known to have large effects on Nsp13 activity, this calls into question virtually all of the results in this manuscript.
We thank the reviewer for raising this important concern regarding the potential influence of the N-terminal His tag on nsp13 activity. We have carefully considered this issue and provide the following lines of evidence to address it.
(1) We have generated a tag-free nsp13 variant and our preliminary characterization (Author response image 1) shows that it retains all key activities: ATP hydrolysis (comparable to His-tagged nsp13), both ATP-independent (Mg<sup>2+</sup>-activated) and ATP-dependent unwinding, as well as chaperone activity to remodel stem-loops. These results demonstrate that while the His tag may modulate enzymatic efficiency, it does not create or abolish any specific biochemical function.
(2) We conducted a systematic survey of 27 published studies on SARS-CoV/SARS-CoV-2 nsp13 (Author response table 1). The results show that 17 out of 27 studies (63%) used affinity-tagged nsp13 without tag removal, including His, MBP, GST, and Strep tags.
(3) The only study that systematically compared different affinity tags (Adedeji et al., 2012) reported that GST-tagged nsp13 exhibited ~520-fold higher ATPase activity than His-tagged nsp13, demonstrating that the choice of affinity tag can affect enzymatic efficiency. However, both tagged versions retained all core enzymatic activities, including ATP hydrolysis and duplex unwinding. Importantly, no study has compared the full functional spectrum between His-tagged and tag-free nsp13. Our preliminary data suggest that the His tag may affect efficiency but does not alter the presence or absence of any specific activity.
Planned experiments:
We fully agree with the reviewer that a more systematic comparison would strengthen the conclusions. In the revision, we will include additional characterization of tag-free nsp13: (i) quantitative nucleic acid binding affinity, (ii) G4 unfolding efficiency, (iii) strand annealing activity. These experiments are currently underway.
In summary, while we acknowledge that the His tag may influence enzymatic efficiency, our key conclusions are supported by experiments with tag-free nsp13. We will add a discussion of these points and include additional tag-free nsp13 data in the revised manuscript.
(2) The ATP-independent, bidirectional duplex unwinding shown for short duplex substrates is reminiscent of the trapping of thermal fraying intermediates that have been reported for other helicases. Because they are only observed on short duplexes, do not require ATP, and are bidirectional, this does not suggest strand displacement as suggested in the manuscript. Instead, it suggests trapping of partially melted intermediates.
We thank the reviewer for this insightful perspective. While the passive trapping of thermal fraying intermediates is a well-established model for non-catalytic protein-nucleic acid interactions, several lines of evidence suggest that nsp13 employs a more active, allosteric mechanism for ATP-independent remodeling.
(1) If nsp13 were merely a passive trap, increasing duplex stability should decrease unwinding. However, as shown in Figure S3, raising Mg<sup>2+</sup> from 0 to 5 mM increases the DNA duplex Tm by ~10°C, yet nsp13’s remodeling activity is markedly enhanced under the same conditions (Figure 2). This positive correlation between cation-induced substrate stabilization and protein activation supports an active, protein-centered mechanism that overcomes the increased energetic barrier.
(2) The observed bidirectionality in ATP-independent remodeling does not simply imply a lack of polarity; rather, it can reflect nsp13’s intrinsic chaperone function. In the absence of ATP, nsp13 binds the ss/ds junction (Figure 2F) and, in a Mg<sup>2+</sup>-dependent manner, may use its binding energy to actively intercalate into the duplex. This mechanism is inherently symmetric for 3′ and 5′ overhangs, explaining bidirectional remodeling, while the absence of activity on blunt-ended substrates confirms the requirement for a pre-existing junction.
(3) The lack of activity on 24-bp substrates does not negate this remodeling mode but defines its energetic boundary. The binding energy released upon nsp13-nucleic acid interaction is sufficient to overcome the lower unwinding barrier of 12-16 bp duplexes, but insufficient to counteract the high stability and rapid re-annealing of a 24-bp duplex without the continuous mechanical power of ATP hydrolysis.
Planned Revision:
We thank the reviewer for prompting us to refine our mechanistic model. In the revision, we will add a dedicated discussion explicitly comparing the model of allosterically activated, binding-driven strand intrusion with the passive trapping model, incorporating the Tm data to strengthen our conclusions.
(3) Results that may be artifacts of unusual in vitro conditions are interpreted as if similar results will occur in the cell, where ATP is likely always present. Along those same lines, SARS-CoV-2 replicates in compartments of the endoplasmic reticulum, which would limit the ability of Nsp13 to access DNA substrates.
We thank the reviewer for raising this important concern regarding the physiological relevance. We fully agree that in vitro conditions do not entirely recapitulate the complex intracellular environment, and we have been careful not to over-interpret our findings. Below we address the two specific issues raised:
(1) Regarding the ATP-independent activity, we acknowledge that ATP is abundant in healthy, actively replicating cells. However, during rapid viral replication, local ATP concentrations can fluctuate due to the high energy demand of the RTC as the template contains extensive secondary structures, which may lead to transient ATP depletion. Under such energy-limited conditions, Yu et al. (2025) demonstrated that ADP-bound nsp13 exhibits chaperone activity that destabilizes nucleic acid structures without ATP hydrolysis, and Dumm et al. (2025) reported that SARS-CoV-2 nsp13 resolves RNA stem-loops in an ATP-independent manner.
Even when ATP is abundant, the ATP-independent mode may enable rapid, local structural adjustments that bypass the kinetic delay of ATP binding and hydrolysis. As shown in Figure 1D, nsp13 exhibits high binding affinity for structured nucleic acids. In this scenario, nsp13 functions not as a processive motor but through a binding-driven mechanism, using the free energy of protein-nucleic acid interaction to transiently destabilize short duplexes or resolve local secondary structures such as G4s and stem-loops in an energy-efficient manner.
(2) Regarding DNA substrates, we fully agree that RNA is the physiological substrate for nsp13. However, DNA is a validated and widely accepted surrogate for mechanistic studies because DNA is more stable and easier to manipulate than RNA to yield the mechanistic insights. A systematic survey of 27 published nsp13 studies (Author response table 1) shows that 20 out of 27 (74%) used DNA substrates for at least some of their experiments. In our study, we used DNA primarily as a mechanistic probe and a stable control, and we validated all key conclusions on physiological RNA substrates, as shown in Figures 4, 5, 6, S7, S8, S10, S11 and S12.
Planned revisions: To address the reviewer’s concerns more directly, we will revise the manuscript to include a discussion paragraph explicitly stating that the ATP-independent activity was observed under optimized in vitro conditions and may represent a latent remodeling capability that could be relevant under energy-limited conditions such as local ATP depletion during rapid replication. We will also clarify that DNA substrates were used as mechanistic probes and controls, and that all key findings were validated on physiological RNA substrates. We thank the reviewer for prompting us to strengthen the discussion of these important points.
(4) There is no evidence to support the conclusion that "Duplex DNA supports bidirectional remodeling via both ATP-dependent and ATP-independent mechanisms." 3'-5' duplex melting is limited to short duplexes and is ATP-independent, suggesting it may be due to trapping of thermal fraying intermediates by the ssDNA binding Nsp13. The ATP-dependent and ATP-independent melting on the substrates with the 3'-overhang are the same, suggesting that ATP-dependent melting does not occur on this substrate, which would indicate that bidirectional ATP-dependent translocation does not occur.
We are grateful to the reviewer for this critical evaluation of our mechanistic claims. We agree that our initial statement regarding bidirectional ATP-dependent remodeling was imprecise and not fully supported by the data. As the reviewer correctly notes, the similar unwinding efficiency on 3′-overhang substrates regardless of ATP presence indicates that ATP hydrolysis does not drive 3′→5′ translocation, which is consistent with nsp13’s known 5′→3′ motor polarity. The observed 3′→5′ activity is therefore more accurately described as an ATP-independent remodeling event, not ATP-dependent unwinding.
We will revise the Discussion and relevant Results sections to clarify the nature of this bidirectional activity. Specifically, the sentence:
"Duplex DNA supports bidirectional remodeling via both ATP-dependent and ATP-independent mechanisms..."will be corrected to: "Duplex DNA supports bidirectional remodeling via ATP-independent mechanisms."
We will also explicitly state that while nsp13 requires ATP for long-range, processive 5'→3' helicase activity, its remodeling/chaperone function is inherently bidirectional and powered by the free energy of binding to the ss/ds junction, rather than by ATP-driven mechanical work.
(5)-The description of ATP-independent unwinding as having "limited processivity," is likely not accurate. These experiments were multiturnover reactions with very high Nsp13 concentrations and no protein trap to ensure single turnover conditions. Because the reactions were multi-turnover, no information about the processivity of Nsp13 can be obtained. On the contrary, it seems likely that the product formed over the 30-minute reaction with a vast excess of Nsp13 is due to binding and dissociation of multiple Nsp13 molecules instead of processive translocation by a single enzyme.
We thank the reviewer for this important correction. We fully agree that our use of the term "processivity" was technically imprecise. Processivity strictly defines the distance a single enzyme translocates during one binding event, which our multi-turnover assays (with high nsp13 concentrations and no protein trap) were not designed to measure. Our results specifically demonstrate that the ATP-independent remodeling mode is highly sensitive to duplex length, with efficiency declining sharply as the duplex lengthens. To reflect the experimental data more faithfully, we have replaced "processivity" with more accurate descriptors throughout the manuscript.
Planned revisions:
(1) Original: "The ATP-independent unwinding mode, however, has limited processivity." Revised: "The ATP-independent unwinding mode, however, exhibits a steep decline in efficiency as the duplex length increases."
(2) Original: "...an ATP-independent, cation-activated mode with limited processivity." Revised: "...an ATP-independent, cation-activated mode specialized for localized structural remodeling"
(3) Original: "...primes Nsp13 for basal strand remodeling but supports only limited processivity." Revised: "...primes Nsp13 for basal strand remodeling but is insufficient for the sustained unwinding of extended duplexes."
(4) Original: "...primes Nsp13 for low-processivity strand displacement." Revised: "...primes Nsp13 for short-range strand displacement rather than long-range processive unwinding."
We believe these changes clarify that the ATP-independent mode acts as a molecular chaperone for local obstacles (like G4 or short stems) rather than a motor for long-range translocation. We thank the reviewer for helping us improve the precision of our description.
(6) G4s are much more stable at cellular K+ concentrations than they are at 20 mM K+. As such, Nsp13's ability to unfold a G4 in the absence of ATP may be diminished or eliminated at a physiological K+ concentration.
We thank the reviewer for this critical point regarding physiological ion concentrations. We agree that K<sup>+</sup> significantly stabilizes G4 structures, which may raise the energy barrier for ATP-independent remodeling.
Planned experiments:
To address this, we will perform salt titration assays (up to 150 mM KCl) to evaluate the robustness of nsp13’s G4 unfolding activity under more physiological ionic conditions. We will also measure the melting temperature of our G4 substrates across this K<sup>+</sup> range to correlate structural stability with enzymatic efficiency.
Author response image 1.
Preliminary characterization of tag-free Nsp13 enzymatic activities. (A) Comparison of ATPase activity between His-tagged and tag-free Nsp13 in the presence of ssRNA or RNA G4. (B) Raw fluorescence data from stopped-flow FRET analysis of ATP-dependent unwinding (16-bp fork DNA, 2 mM Mg<sup>2+</sup>, 2 mM ATP). F/F<sub>0</sub> represents FAM fluorescence normalized to initial DNA intensity. (C) ATP-independent DNA duplex remodeling (data reproduced from Figure S2). (D) Chaperone activity of tag-free Nsp13 on DNA and RNA stem-loops.
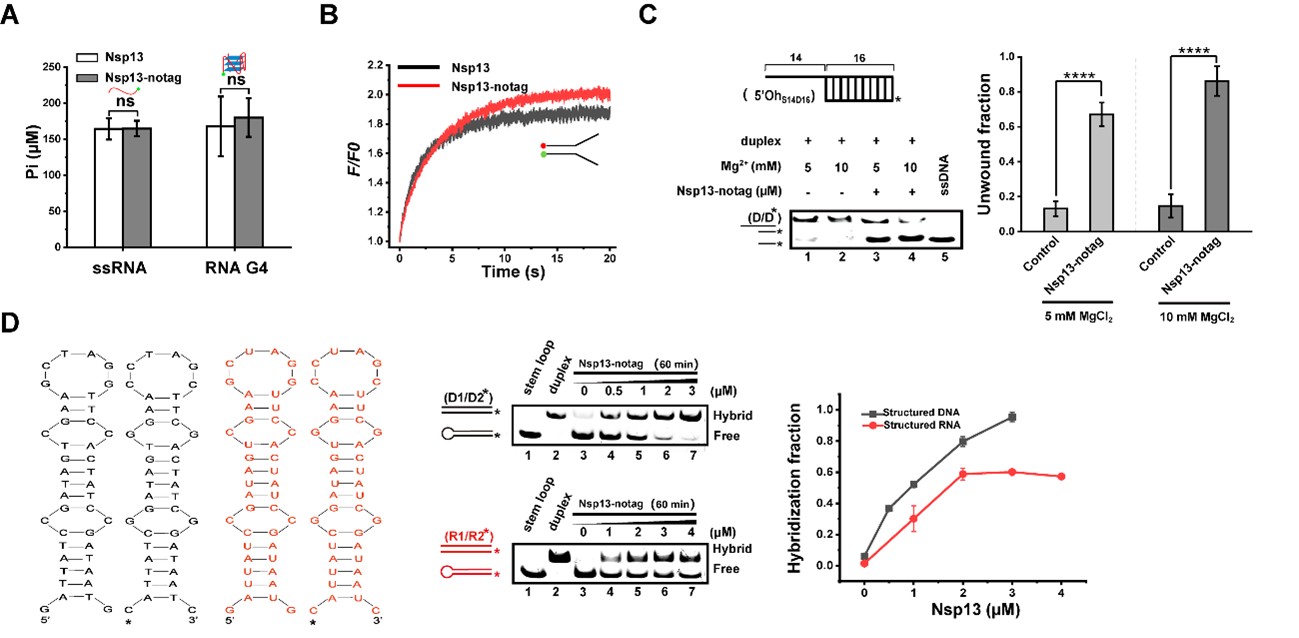
Author response table 1.
Summary of affinity tags, monovalent salt concentrations, and substrate types used in 27 published SARS-CoV/SARS-CoV-2 nsp13 studies
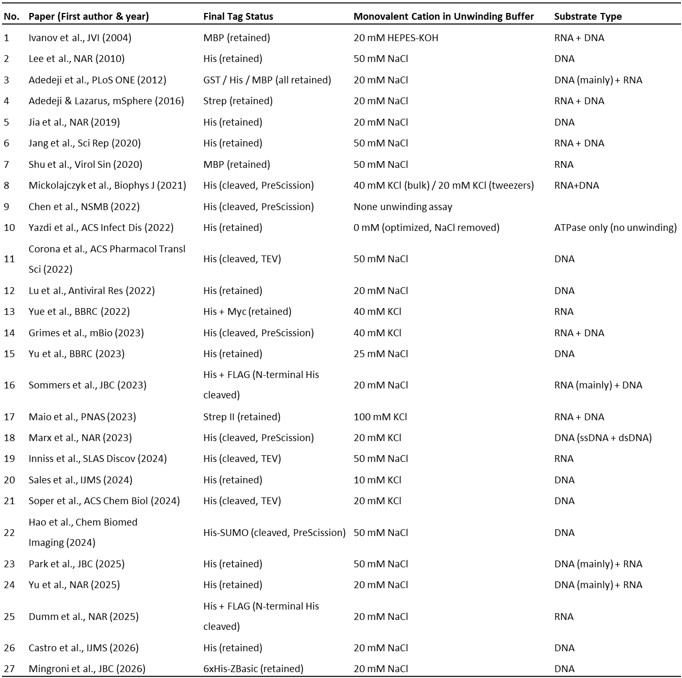
References:
(1) Ivanov KA, Thiel V, Dobbe JC, van der Meer Y, Snijder EJ, Ziebuhr J. Multiple enzymatic activities associated with severe acute respiratory syndrome coronavirus helicase. J Virol. 2004 Jun;78(11):5619-32.
(2) Lee NR, Kwon HM, Park K, Oh S, Jeong YJ, Kim DE. Cooperative translocation enhances the unwinding of duplex DNA by SARS coronavirus helicase nsP13. Nucleic Acids Res. 2010 Nov;38(21):7626-36.
(3) Adedeji AO, Marchand B, Te Velthuis AJ, Snijder EJ, Weiss S, Eoff RL, Singh K, Sarafianos SG. Mechanism of nucleic acid unwinding by SARS-CoV helicase. PLoS One. 2012;7(5):e36521. doi: 10.1371/journal.pone.0036521.
(4) Adedeji AO, Lazarus H. Biochemical Characterization of Middle East Respiratory Syndrome Coronavirus Helicase. mSphere. 2016 Sep 7;1(5):e00235-16.
(5) Jia Z, Yan L, Ren Z, Wu L, Wang J, Guo J, Zheng L, Ming Z, Zhang L, Lou Z, Rao Z. Delicate structural coordination of the Severe Acute Respiratory Syndrome coronavirus Nsp13 upon ATP hydrolysis. Nucleic Acids Res. 2019 Jul 9;47(12):6538-6550.
(4) Jang KJ, Jeong S, Kang DY, Sp N, Yang YM, Kim DE. A high ATP concentration enhances the cooperative translocation of the SARS coronavirus helicase nsP13 in the unwinding of duplex RNA. Sci Rep. 2020 Mar 11;10(1):4481.
(5) Shu T, Huang M, Wu D, Ren Y, Zhang X, Han Y, Mu J, Wang R, Qiu Y, Zhang DY, Zhou X. SARS-Coronavirus-2 Nsp13 Possesses NTPase and RNA Helicase Activities That Can Be Inhibited by Bismuth Salts. Virol Sin. 2020 Jun;35(3):321-329.
(6) Mickolajczyk KJ, Shelton PMM, Grasso M, Cao X, Warrington SE, Aher A, Liu S, Kapoor TM. Force-dependent stimulation of RNA unwinding by SARS-CoV-2 nsp13 helicase. Biophys J. 2021 Mar 16;120(6):1020-1030.
(7) Chen J, Wang Q, Malone B, Llewellyn E, Pechersky Y, Maruthi K, Eng ET, Perry JK, Campbell EA, Shaw DE, Darst SA. Ensemble cryo-EM reveals conformational states of the nsp13 helicase in the SARS-CoV-2 helicase replication-transcription complex. Nat Struct Mol Biol. 2022 Mar;29(3):250-260.
(8) Yazdi AK, Pakarian P, Perveen S, Hajian T, Santhakumar V, Bolotokova A, Li F, Vedadi M. Kinetic Characterization of SARS-CoV-2 nsp13 ATPase Activity and Discovery of Small-Molecule Inhibitors. ACS Infect Dis. 2022 Aug 12;8(8):1533-1542.
(9) Corona A, Wycisk K, Talarico C, Manelfi C, Milia J, Cannalire R, Esposito F, Gribbon P, Zaliani A, Iaconis D, Beccari AR, Summa V, Nowotny M, Tramontano E. Natural Compounds Inhibit SARS-CoV-2 nsp13 Unwinding and ATPase Enzyme Activities. ACS Pharmacol Transl Sci. 2022 Apr 1;5(4):226-239.
(10) Lu L, Peng Y, Yao H, Wang Y, Li J, Yang Y, Lin Z. Punicalagin as an allosteric NSP13 helicase inhibitor potently suppresses SARS-CoV-2 replication in vitro. Antiviral Res. 2022 Oct;206:105389.
(11) Yue K, Yao B, Shi Y, Yang Y, Qian Z, Ci Y, Shi L. The stalk domain of SARS-CoV-2 NSP13 is essential for its helicase activity. Biochem Biophys Res Commun. 2022 Apr 23;601:129-136.
(12) Grimes SL, Choi YJ, Banerjee A, Small G, Anderson-Daniels J, Gribble J, Pruijssers AJ, Agostini ML, Abu-Shmais A, Lu X, Darst SA, Campbell E, Denison MR. A mutation in the coronavirus nsp13-helicase impairs enzymatic activity and confers partial remdesivir resistance. mBio. 2023 Aug 31;14(4):e0106023.
(13) Yu J, Im H, Lee G. Unwinding mechanism of SARS-CoV helicase (nsp13) in the presence of Ca2+, elucidated by biochemical and single-molecular studies. Biochem Biophys Res Commun. 2023 Aug 6;668:35-41.
(14) Sommers JA, Loftus LN, Jones MP 3rd, Lee RA, Haren CE, Dumm AJ, Brosh RM Jr. Biochemical analysis of SARS-CoV-2 Nsp13 helicase implicated in COVID-19 and factors that regulate its catalytic functions. J Biol Chem. 2023 Mar;299(3):102980.
(15) Maio N, Raza MK, Li Y, Zhang DL, Bollinger JM Jr, Krebs C, Rouault TA. An iron-sulfur cluster in the zinc-binding domain of the SARS-CoV-2 helicase modulates its RNA-binding and -unwinding activities. Proc Natl Acad Sci U S A. 2023 Aug 15;120(33):e2303860120.
(16) Marx SK, Mickolajczyk KJ, Craig JM, Thomas CA, Pfeffer AM, Abell SJ, Carrasco JD, Franzi MC, Huang JR, Kim HC, Brinkerhoff H, Kapoor TM, Gundlach JH, Laszlo AH. Observing inhibition of the SARS-CoV-2 helicase at single-nucleotide resolution. Nucleic Acids Res. 2023 Sep 22;51(17):9266-9278.
(17) Inniss NL, Rzhetskaya M, Ling-Hu T, Lorenzo-Redondo R, Bachta KE, Satchell KJF, Hultquist JF. Activity and inhibition of the SARS-CoV-2 Omicron nsp13 R392C variant using RNA duplex unwinding assays. SLAS Discov. 2024 Apr;29(3):100145.
(18) Sales AH, Fu I, Durandin A, Ciervo S, Lupoli TJ, Shafirovich V, Broyde S, Geacintov NE. Variable Inhibition of DNA Unwinding Rates Catalyzed by the SARS-CoV-2 Helicase Nsp13 by Structurally Distinct Single DNA Lesions. Int J Mol Sci. 2024 Jul 19;25(14):7930.
(19) Soper N, Yardumian I, Chen E, Yang C, Ciervo S, Oom AL, Desvignes L, Mulligan MJ, Zhang Y, Lupoli TJ. A Repurposed Drug Interferes with Nucleic Acid to Inhibit the Dual Activities of Coronavirus Nsp13. ACS Chem Biol. 2024 Jul 19;19(7):1593-1603.
(20) Hao W, Hu X, Chen Q, Qin B, Tian Z, Li Z, Hou P, Zhao R, Balci H, Cui S, Diao J. Duplex Unwinding Mechanism of Coronavirus MERS-CoV nsp13 Helicase. Chem Biomed Imaging. 2024 Dec 19;3(2):111-122.
(21) Park J, Jeong YJ, Chauhan K, Koh HR, Kim DE. ATPase-dependent duplex nucleic acid unwinding by SARS-CoV-2 nsP13 relies on facile binding and translocation along single-stranded nucleic acid. J Biol Chem. 2025 Jul;301(7):110373.
(24) Yu J, Im H, Cho H, Jeon Y, Lee JB, Lee G. A novel ADP-directed chaperone function facilitates the ATP-driven motor activity of SARS-CoV helicase. Nucleic Acids Res. 2025 Jan 24;53(3):gkaf034.
(25) Dumm AJ, Zheng AY, Butler TJ, Kulikowicz T, George JC, Bombard PT, Sommers JA, Ding J, Brosh RM Jr. SARS-CoV-2 point mutations are over-represented in terminal loops of RNA stem-loop structures that can be resolved by Nsp13 helicase in a unique manner with respect to nucleotide dependence. Nucleic Acids Res. 2025 May 22;53(10):gkaf447.
(26) Castro JM, Slack RL, Ong YT, Zhang H, Gifford LB, Courouble VV, Aiken RM, Shankar V, O'Leary TR, Griffin PR, Lan S, Du Y, Fu H, Sarafianos SG. Stalling the Enemy: Targeting Nsp13 for Next-Generation SARS-CoV-2 Antivirals. Int J Mol Sci. 2026 Mar 11;27(6):2587.
(27) Mingroni MA, Enney BM, Malsick LE, Geiss BJ. Motif V is an allosteric couple between the SARS-CoV-2 nsp13 nucleotide triphosphatase and helicase active sites. J Biol Chem. 2026 Mar;302(3):111198.
Reviewer #2 (Public review):
Summary:
The authors have provided valuable and solid evidence for the hypothesis, of which Choder is an early advocate, that transcription facilitates the assembly of an mRNA-protein complex that can affect the expression of mRNA (e.g., translation or degradation) in the cytoplasm.
Strengths:
In this work the authors have used two orthogonal approaches: an IP of a Flag labeled Pol II and RNAse digestion to release nascent chain associated proteins followed by mass spectrometry to identify cotranscriptional-associated proteins and then verifying this association with the transcriptional apparatus by proximity labeling technology using biotinylation of a specific sequence (Avi-tag) by the bacterial enzyme, BirA fused to a subunit of Pol II. Many of the proteins identified are thought to be exclusively cytoplasmic, for instance, those important for translation, such as the components of initiation factor EF3. The work represents a significant advance in support of the model where specific mRNAs can assemble proteins needed for their function in the cytoplasm during their transcription.
They also discover that a mutant Pol II subunit, Rbp4, which does not bind certain Avi-tagged proteins, does not facilitate their biotinylation. These results lend credible support to the hypothesis.
Weaknesses:
While the proximity labeling provides strong evidence that is consistent with the hypothesis, a proof is still lacking because it is inferred that the enzymatic labeling occurs at the site of transcription (a reasonable assumption). More definitive evidence could be provided by imaging the presence of the cytoplasmic proteins at the transcription site, although this may not be within the expertise of the investigator, so it would require a collaboration.
While not necessarily a significant weakness, it is worth considering that a remote possibility is that the cytoplasmic proteins discovered in this way were not tagged with biotin in the nucleus, but rather in the cytoplasm, where the Pol II-complex, either Flag or BirA tagged, may come in contact with the substrate before it is imported to the nucleus. The authors presumably rule out that the tagging could occur during translation of the Avi-tag on polysomes by inhibiting translation and showing that the tagging of the target protein is not inhibited (the data here is not totally convincing). Whether the Pol II-(BirA or Flag) could react with Avi-tagged proteins, even while briefly in the cytoplasm before nuclear import, is not completely resolved by these experiments since the Avi-tagged proteins could reside in the cytoplasm, not associated with polysomes, but complexed with Pol II subunits. The mutant Rpb does not rule out this possibility since it would not bind its substrate in the cytoplasm. In order to get into the nucleus in the first place, the cytoplasmic proteins would need to be transported there by a complex, possibly involving Pol II subunits, Rpbs. Perhaps the authors could address this possibility in the text.
One confusing issue in the protocol is the efficacy of the biotin-depleted media in which the cells are grown. Biotin is an essential cofactor for many reactions, so there are still endogenous biotin and biotin ligase needed that may add a background level of promiscuous biotinylation of some cytoplasmic proteins, for instance, those containing a universal biotin binding site.
Reviewer #3 (Public review):
Summary:
Various groups over the last several decades have provided many examples of proteins associating with nascent mRNA co-transcriptionally to influence gene expression at subsequent stages, including in the cytoplasm. In this and previously published works, the Choder group has described these events as "mRNA imprinting", which we know as a field that reflects the differential association of proteins with mRNAs in a gene-specific or environmentally induced fashion to regulate gene expression.
In this study, the authors use a proteomics-based approach termed PROFIT to identify factors associated with RNA Pol II in an RNA-dependent manner. The identified interactors have the potential to be part of mRNA-protein complexes (mRNPs) being formed co-transcriptionally with an "mRNA imprinting" function. PROFIT employs a pulldown of RNA Pol II via a tagged Rpb3 subunit, followed by RNase I-mediated elution to isolate proteins associated in an RNA-dependent manner. Proteomics analyses identified known mRNA-associated proteins that have previously been reported as imprinting factors, as well as other proteins involved in gene expression, including factors functioning in the cytoplasm. The authors suggest, based on the RNA-dependence and assumed formation of these interactions with RNA Pol II co-transcriptionally, that these novel hits could be mRNA imprinting factors. Although for most of these factors, it has not been determined whether they associate with RNA-Pol II in the context of transcription with nascent transcripts to contribute to the downstream regulations of these transcripts.
Strengths:
PROFIT successfully identified nuclear factors known to engage mRNA co-transcriptionally. This suggests that the method has the potential to detect imprinting factors. By employing a proximity-labeling technique, termed BioPROFIT, further evidence is provided for some of the novel interactors being in proximity to RNA Pol II. The authors further demonstrate that one of the factors, the eIF3 component Rpg1, exists in two fractions, with a soluble fraction that matures into a ribosome fraction, which is suggestive of Rpg1 traveling along the gene expression pathway with an mRNP to be engaged in translation. In addition, the authors showed that PROFIT detects changes in RNA Pol II associated factors in response to heat shock, consistent with gene expression reprogramming during stress. As such, these methods and proteomics data provide a starting point for a more detailed characterization of mRNP compositions formed in the nucleus and their impact on gene expression at later stages.
Weaknesses:
The authors interpret the interaction data from PROFIT and BioPROFIT under the assumption that this reflects interactions happening co-transcriptionally. There is no discussion of other ways these data may result, or more importantly, controls to prove these assumptions are true. Overall, these assays lack important controls and experimental validations by independent methods to demonstrate that the identified interactions occur co-transcriptionally within the nucleus and do not represent interactions occurring in the cytoplasm or artifacts related to experimental design. For example, the authors focus on Rpg1 as a potential imprinting factor, which would require this protein to shuttle and be localized at transcribing genes. Yet no evidence is presented that Rpg1 enters the nucleus or can be found in association with a transcribed gene, which leaves open the possibility that this interaction is occurring in the cytoplasm or forming post-lysis.
To the possibility of in vitro interactions, in the PROFIT assay, yeast collected from a 3L culture is cryo-ground and resuspended in 7 mL of lysis buffer. This ratio of cell material to buffer will create a highly concentrated cell lysate that is subsequently used over ~6.5 hours, which is the time for centrifugation, DNase I digestion, and immunoprecipitation. These conditions have a very high probability of promoting new interactions between RNA, RNA Poll II, other proteins, and/or RNA Pol II-associated nascent RNA complexes in vitro. Notably, the PROFIT assay detects many highly expressed proteins but does not identify many of the factors known to be loaded into nuclear mRNPs (e.g., Yra1, THO complex, Sub2, or Nab2). The BioPROFIT assay is used to try to address this issue, but biotinylation may occur post-lysis because the desalting process to remove biotin is performed just before the immunoprecipitation, providing ~2 hours for the reaction to happen in vitro. In addition, even if the biotinylation occurs in cells, nothing about this assay indicates this is occurring in the context of transcribing RNA Pol II or nascent transcripts. To address this major issue, the authors should add a mixing control to show that the detected interactions between RNA Pol II and the identified factors are produced in cells, not in the cell lysate. Specifically, mixing cell grindates from two independent yeast strains (e.g., RPB3-FLAG strain mixed with a TIF4631-HA strain) with the lysate used in the PROFIT assay with western blotting. In this case, if the interaction is detected, the interaction is produced in the cell lysate. To verify PROFIT hits associated with transcribing RNA Pol II and nascent transcripts, BIOPROFIT should be performed in cells treated with a transcription inhibitor (e.g., thiolutin) or mutants blocking transcription by Pol II. These types of verifications should be performed for the multiple novel hits reported in the manuscript.
Another in vitro issue must also be addressed. In the PROFIT assay, elution of RNA-associated factors from the immunoprecipitated material is performed by RNase I digestion, but the reaction time is very long (3 hours) at room temperature. During such a long incubation time and at higher temperature (i.e., above 4 Celsius), it is possible that non-RNA-mediated interactors dissociate from the beads and/or protein binding partners. This possibility is made more problematic by the fact that the authors define interactors using fold change over an Rpb3 no tag sample, where the sample does not contain isolated RNA Pol II complexes and their associated protein-binding partners. As such, even a small amount of non-RNA-mediated RNA Poll II interactors that elute would appear significantly enriched. For this point, a comparison of +/- RNase I elution in the Rpb3-FLAG pulldown sample should be performed using PROFIT.
Other points to address:
(1) The cartoon in Figure 1A should be corrected to present the PROFIT experiment as described in the text. Specifically, in the cartoon, UV is shown to be applied to cells, but this is done with cell grindate.
(2) The cartoon in Figure 2A should be corrected. In the cartoon, it shows the biotin ligase biotinylating proximal proteins during DNase digestion as well as on the Sepharose beads, but in theory, the majority of the biotinylation reaction occurs in cells. In addition, the cartoon depicts biotinylation of proximal proteins, but the system described uses wild-type BirA to specifically biotinylate an Avi-tag. To perform non-specific labeling of proximal proteins, BirA* would need to be used. Finally, the cartoon indicates mass spectrometry analysis of labeled proteins, but this is not done in the manuscript.
(3) In the text, the sentence "However, no bio-Spt6-Avi was released from the complexes containing Pol II mutants (Fig. 5C)" appears to have two errors. "Pol II mutants" should likely be "rpb4 mutant" and "Fig. 5C" is probably "Fig. 6C".
(4) In the Figure 6 legend, the sentence "The bulk Spt6 was detected by anti-HIS Abs that bound to (HIS)x6, which was placed upstream of the FLAG" suggests that "FLAG" should be "Avi-tag." Please correct it if necessary and accurately describe it in the strain list.
(5) On page 18, Npl3 is listed and discussed, but never mentioned anywhere prior in the paper. For example, the paragraph states "...our observation that it binds nascent RNA in an Rpb4-dependent manner...", but Npl3 is not listed in the supplemental Table 4, which lists PROFIT hits affected by rpb4∆. If Npl3 is to be discussed, the associated data needs to be properly presented.
I’m here
If you are seeing this comment, you're on the public layer and everything you annotate or highlight can be seen by everyone else!
Try again and join the ELID group. https://hypothes.is/groups/Ne9JzJXY/elid-certificate
Note: This response was posted by the corresponding author to Review Commons. The content has not been altered except for formatting.
Learn more at Review Commons
This manuscript reports that undesired insertion of the plasmid backbone, including vector sequences not intended to be part of the genome edit, occurs at high frequency during CRISPR/Cas9-mediated HDR in Drosophila. We document this phenomenon across multiple independent genome editing projects, using three different plasmid backbones and targeting distinct genomic loci, demonstrating that it is not an isolated or project-specific artefact. We further introduce pVID, a new donor vector incorporating a ZsGreen negative selection marker that allows straightforward identification and exclusion of lines carrying undesired insertions, providing a practical solution to avoid this genome editing issue.
In response to the reviewers' comments, we have revised the manuscript to: (i) correct and contextualise prior descriptions of this problem, incorporating the references suggested by Reviewer 2; (ii) add a table summarising gRNA characteristics for all editing projects; (iii) expand the discussion of the underlying DNA repair mechanisms, the potential influence of Cas9 source choice, and the relevance of the findings beyond Drosophila; (iv) confirm the stability of problematic template vector insertions across multiple generations; and (v) improve figure clarity, correct typographical errors, and clarify several passages flagged by the reviewers. All responses are described in detail below.
Reviewer 1
Major Comment 1 — DNA repair pathways underlying backbone capture • I think the authors should discuss potential DNA repair pathways (e.g., NHEJ, MMEJ) underlying plasmid backbone capture in more detail. Did you check for knockouts within your screened transformants? That could provide insight into the underlying mechanisms.
Response: We screened humanized TDP-43 line for tbph knockouts, since our aim was to fully knock out the Drosophila gene and insert the human ortholog. However, we did not screen any of the other lines described in the manuscript for indels caused by NHEJ, since the dsRed selection we employed would not enable us to recover lines without insertion events. We hypothesise that one of the two gRNAs used being more inefficient than the other causes a single homologous recombination event and insertion of the vector template. However, the underlying mechanism is still unclear, and could be caused by NHEJ, HDR or a combination of these mechanisms as has previously observed (44). We have expanded on potential mechanisms inducing HDR template vector insertion events in the discussion of the revised manuscript.
Major Comment 2 — gRNA characteristics and design parameters • It would be important to describe gRNA characteristics and general design parameters (GC content, distance from cut to intended edit, homology arm length) and analyze whether these correlate with correct HDR vs. plasmid insertion. A table summarizing these details could help reveal potential trends.
Response: At the reviewers suggestion, we have added a table (Table 1) describing the all the characteristics of the gRNAs further in the material and method section. Unfortunately though, no commonality was immediately apparent to us.
Major Comment 3 — Single versus dual gRNA strategies • Did the authors consider exploring whether using a single gRNA reduces backbone insertion frequency compared to dual-gRNA strategies? I understand that two gRNAs are needed for your strategy, but it would be interesting to know whether these outcomes are linked to the dual-gRNA design.
Response: As stated in the discussion, we theorize that perhaps one of the two gRNAs used in our strategies cuts more efficiently and thereby causes a single homologous recombination event and insertion of the vector template. It is possible that originally using a strategy with only one gRNA could cause less insertion of the vector template, however this may be at the cost of gene editing efficiency. Indeed, when Ge et al (17) compared using one versus two gRNAs to induce HDR, they observed more reliable repair events when two gRNAs were used.
Major Comment 4 — Stability of backbone insertions across generations • Did you evaluate whether backbone insertions are stable across generations or prone to rearrangement?
Response: We did keep several of the lines reported in this paper stably across multiple generations, and we have added this observation to the manuscript
Major Comment 5 — Broader applicability in non-model organisms and therapeutic settings • A broader discussion of the potential applications of this approach in non-model insects, mammalian cells, or therapeutic settings where HDR is inefficient would be valuable.
Response: While we only investigated this effect in the creation of CRISPR/Cas9 Drosophila melanogaster models, it is very possible that this could also affect other model organisms or cells. We encourage the use of HDR template negative selection markers in all uses of HDR-mediated CRISPR/Cas9 genome editing.
Major Comment 6 — Cas9 promoter and expression level • The authors also mentioned using a validated Cas9 line (ref #23). What promoter drives Cas9 expression in this line? Did you consider testing different promoters? Since timing of Cas9 expression can be critical, promoter choice may have influenced the results and should be discussed.
Response: We used the nos promoter for the expression of Cas9, as this promoter is expressed in germ cells and is known to have better efficiency than the other germline promotor like vasa (Port et al 2014, Ref #23). However, it is conceivable that the high Cas9 concentration in this line could induce a higher rate of double stranded breaks and thus template vector insertion. We agree it would be interesting to test other Cas9 sources, though this would likely come at the cost of overall editing efficiency. As we describe, the use of pVID now allows negative selection against HDR template vector insertion even with this Cas9 source. We have expanded upon the potential use of other Cas9 sources in the revised discussion.
Reviewer 2
Major comments
None
Minor Comment 1 — Line 38: prior descriptions of backbone insertion in Drosophila Line 38: "this type of unwanted template vector insertion in the case of Drosophila genome editing has to our knowledge not been previously described." Insertion of vector sequences after CRISPR editing in Drosophila and strategies to mitigate such events have been previously described in multiple studies. The authors need to incorporate these into their manuscript. https://doi.org/10.1242/bio.20147682, https://doi.org/10.1080/19336934.2020.1832416, https://doi.org/10.1534/g3.116.032557.
Response: We are very grateful to the reviewer for pointing out these prior observations of vector insertion events of which we were not aware. This prior work has now been fully incorporated and referenced in the revised manuscript, and we have removed this erroneous statement. We feel this manuscript validates and quantifies the extent of HDR template insertion across multiple genome editing strategies and templates plus, with pVID, provides a solution to this vexing problem.
Minor Comment 2 — Line 79: PAM sequence sentence I have difficulties understanding the following sentence: Line 79: "At this location, on both sides of the insertion, the PAM sequence of the target region was edited to match the PAM sequence of the template donor plasmid." I assume what is meant here is that in the donor vector the PAM sequence was mutated to prevent recutting, but that means this sequence is no longer a PAM. Please rephrase for added clarity.
Response: The PAM sequence was indeed edited in the template donor plasmid to prevent re-cutting, and we are referring to this edited version of the PAM sequence in this sentence. We edited this sentence this to clarify that the PAM sequences have been edited.
Minor Comment 3 — Figure 2: panel D arrangement In Figure 2 panel D is arranged between panels E and F.
Response: Thank you for pointing this out. We have corrected this error.
Minor Comment 4 — Primer positions in figures In Figure 2 it would be useful to also indicate the position of the primers used in 2d in the schematic in 2e. The same applies to Fig. 3a and 4a.
Response: We have added the position of the primers in figure 2. Since the primers are targeting the backbone of the plasmid commonly in all projects included in this manuscript, we have chosen to only include one figure of this (figure 2).
Minor Comment 5 — Lines 89–90: duplicated sentence Lines 89, 90: Duplication of the same sentence.
Response: Thank you, we have corrected this mistake.
Minor Comment 6 — VGAT editing: consecutive editing and sgRNA placement Editing of the VGAT gene: In this case correct editing and plasmid insertions could be found on the same chromosomes. This might be caused by concatemer formation of repair intermediates (as has been described in multiple systems) or by consecutive editing events. Can you please specify whether the donor vector was designed to prevent consecutive editing? I'm also a bit confused about the locations of the sgRNA target sites according to Fig. 3a. It appears that part of the insertion (i.e. the ALFA tag) was encoded on the homology arm and not between the target sites. While such strategies have been described, they are often avoided as the efficiency of insertion decreases with increasing distance to the cut site. Was it not possible to us a sgRNA better matching the insertion cassette?
Response: For Vgat genome editing, we followed an existing strategy that has been proven effective, reusing the same gRNAs and overall approach to replace the 9×V5 tag with a 1×ALFA tag (Certel et al. 2022, Ref #28)
Minor Comment 7 — Line 133: mini-white marker unreliability Line 133: Please describe why the mini-white marker was unreliable.
Response: In our first design of the pVID vector, we used mini-white as the negative selection marker. However in a number of white eyed lines, we could still confirm the undesired insertion of the HDR template vector. We speculate that expression of mini-white (which we confirmed was not mutated) was repressed in these lines by an unknown mechanism. Since (Nyberg et al. 2020 , Ref #35) also proposed using mini-white as a negative vector selection marker, we wanted to mention this problem with mini-white negative selection, though we remain unsure of the exact cause. In any case, the use of exogenous ZsGreen in pVID as described in the manuscript fully resolved the issue allowing reliable detection of template vector insertion events as we describe.
Minor Comment 8 — Line 161: "varying frequency" Not sure I understand the sentence in line 161: If 54% of lines had vector insertion, what does the "varying frequency" refer to?
Response: We have edited this sentence to clarify that 54% of lines had vector insertion.
Minor Comment 9 — pVID availability in methods Consider highlighting the availability of pVID also in the methods section that described this plasmid.
Response: This has been added to the methods section.
Reviewer 3 No edits suggested.
We thank Reviewer 3 for their positive assessment of the manuscript and for confirming that no revisions are required.
Note: This preprint has been reviewed by subject experts for Review Commons. Content has not been altered except for formatting.
Learn more at Review Commons
The manuscript by Highly frequent undesired insertional mutagenesis during Drosophila genome editing by Kallstig et al. revolves around Homology-Directed Repair (HDR) and the surprisingly high frequency of plasmid backbone insertions into the genome.
In brief, the authors describe three independent experiments in which the intended homology regions were inserted together with plasmid backbone sequences into the Drosophila genome. Each experiment was designed with a slightly different setup: the first aimed to generate a humanized version of the TAR DNA-binding protein 43 (hTDP-43), while the second introduced an alpha tag into the Vesicular GABA transporter (VGAT) gene. In the first experiment, the pCR4 vector served as the backbone, whereas the second experiment relied on the pHSG298 vector. Both experiments resulted in relatively high frequencies of incorrectly edited genomes - 18% and even 66%, respectively. The authors hypothesized that the rate of undesired events could be even higher if the targeted gene is non-essential. To test this, the third experiment focused on mutagenesis of the Glutamate Receptor IIA (GluRIIA) gene, which is homozygous viable even in protein-null mutants. Indeed, the frequency of incorrect edits was approximately 11:1 (more than 90%). These findings suggest that plasmid backbone insertion is a common and important issue in HDR-based genome editing in Drosophila.
To address this problem, the authors designed a new vector. While the classical eye color marker (e.g., dsRED) serves for positive identification of HDR recombination, a second fluorescent marker (ZsGreen), encoded in the plasmid backbone and also expressed in the compound eye, enables clear detection of undesired plasmid backbone insertions.
The study is clearly written, and the plasmids are sufficiently well described in the figures. The reproducibility is somewhat limited by the use of different plasmids in combination with different target genes. Nevertheless, the number of analyzed insertions was high enough to convincingly illustrate the issue.
I find this manuscript to be a valuable description of an existing problem, together with a potentially efficient method for detecting undesired plasmid insertions. From an experimental perspective, I consider the comparison of three different vector backbones combined with different target genes to be rather difficult. On the other hand, as an experimental biologist, I completely understand the logic and the history of the problem-solving process. Undesired insertions were identified by different approaches (PCR and sequencing), and the authors clearly kept this issue in mind. When the problem persisted in the second experiment, and was even more pronounced in the third experiment (involving a non-lethal gene), they developed a vector that makes the screening process more efficient. Altogether this is a valuable technical study worth of reporting.
Note: This preprint has been reviewed by subject experts for Review Commons. Content has not been altered except for formatting.
Learn more at Review Commons
Summary In this manuscript Källstig, Ruchti, McCabe and colleagues report frequent undesired editing outcomes after CRISPR gene knock-ins in Drosophila. Using Cas9 for the targeted induction of DNA double strand breaks and plasmids with long homology arms as donor molecules, they find that the whole plasmid inserts with high frequency at multiple loci. To detect such events they generate a plasmid with a dominant marker encoded on the plasmid backbone, which can be used to enrich for correct insertions by negative selection.
Major comments
Minor comments
Line 38: "this type of unwanted template vector insertion in the case of Drosophila genome editing has to our knowledge not been previously described." Insertion of vector sequences after CRISPR editing in Drosophila and strategies to mitigate such events have been previously described in multiple studies: https://doi.org/10.1242/bio.20147682, https://doi.org/10.1080/19336934.2020.1832416, https://doi.org/10.1534/g3.116.032557. The authors need to incorporate these into their manuscript.
I have difficulties understanding the following sentence: Line 79: "At this location, on both sides of the insertion, the PAM sequence of the target region was edited to match the PAM sequence of the template donor plasmid." I assume what is meant here is that in the donor vector the PAM sequence was mutated to prevent recutting, but that means this sequence is no longer a PAM. Please rephrase for added clarity.
In Figure 2 panel D is arranged between panels E and F.
In Figure 2 it would be useful to also indicate the position of the primers used in 2d in the schematic in 2e. The same applies to Fig. 3a and 4a.
Lines 89, 90: Duplication of the same sentence.
Editing of the VGAT gene: In this case correct editing and plasmid insertions could be found on the same chromosomes. This might be caused by concatemer formation of repair intermediates (as has been described in multiple systems) or by consecutive editing events. Can you please specify whether the donor vector was designed to prevent consecutive editing? I'm also a bit confused about the locations of the sgRNA target sites according to Fig. 3a. It appears that part of the insertion (i.e. the ALFA tag) was encoded on the homology arm and not between the target sites. While such strategies have been described, they are often avoided as the efficiency of insertion decreases with increasing distance to the cut site. Was it not possible to us a sgRNA better matching the insertion cassette?
Line 133: Please describe why the mini-white marker was unreliable.
Not sure I understand the sentence in line 161: If 54% of lines had vector insertion, what does the "varying frequency" refer to?
Consider highlighting the availability of pVID also in the methods section that described this plasmid.
This manuscript describes vector backbone insertions as a frequent complication of CRISPR knock-in experiments in Drosophila and introduces a cloning vector with a selectable marker on the plasmid backbone that allows counter selection of such undesired events. The manuscript is very well written and the experiments are overall well designed.
Insertion of vector sequences during homologous recombination (often referred to as "ends-in" recombination events) has been described on multiple occasions in a wide variety of model systems. Also in Drosophila, the system used here, such events have been described by multiple groups (see comments above). Furthermore, plasmids designed to allow to counter select for such events have also been described previously (e.g. Addgene plasmids 157991, 80801).
In summary, this manuscript highlights once more an important complication in genome engineering experiments, but does not significantly advance the knowledge in the field beyond the existing literature and the described plasmid is largely redundant with preexisting plasmids designed for the same purpose. While this overall severely limits the significance of this work, it does provide important replication of previous work.
Reviewer #2 (Public review):
The revised manuscript offers little new information and fails to address the critical weaknesses identified in the original submission.
While we can agree that phosphorylation of Thr495 would likely affect Hsp70 function-given the known biochemistry of Hsp70s and the author's previous work on LegK4-the significance of this finding hinges on whether it is a regulated process. If a meaningful fraction of Hsp70 were phosphorylated in a regulated manner triggered by DNA damage or cell cycle progression, it would constitute an important discovery, regardless of its specific impact on fitness in a given context.
However, beyond highlighting the temporal profile of Hsp70 phosphorylation in MMS-treated cells (Figure 4e), the paper fails to rule out the possibility that this correlation is merely an irrelevant side reaction. This "bystander" phosphorylation could simply be caused by the activation of kinases during the experimental MMS treatment and subsequent washout. The authors' claim-that the fraction of phosphorylated Hsp70 increases in a "regulated, cell-cycle dependent manner"-does not sufficiently counter the possibility of it being a non-functional side effect.
This concern could be resolved if the authors had identified the specific kinase, demonstrated its specificity, and manipulated it either genetically or pharmacologically. While I acknowledge this is a "tall order," the lack of such data limits the paper's significance. Furthermore, the current data fails to meet a much lower bar: confirming that a substantial fraction of Hsp70 is actually phosphorylated under the tested conditions. Such a finding would at least suggest the event is capable of impacting the overall Hsp70 pool.
It is surprising that the authors have not provided a ratiometric assay to settle this, such as an immunoblot of total Hsp70 separated on a Phos-tag or IEF gel. Instead, they rely on indirect evidence and data subject to alternative interpretations. Specifically, they argue that the fitness cost of the Thr495Ala mutation (or the phosphomimetic mutation) is due to the loss of regulatory phosphorylation (or deregulated phosphorylation); however, it is equally plausible that the mutations create Hsp70 hypomorphs whose defects are only exposed under stressful experimental conditions.
Author response:
eLife Assessment
This manuscript reports an important study in which the authors apply smFRET imaging to probe HIV-1 Env conformational dynamics in the presence of antibodies. Previous implementations of smFRET imaging of HIV-1 Env, which focus on gp120 conformation, have yielded limited information on antibodies that target gp41. Through the cutting-edge application of smFRET imaging, the study provides convincing insights into the mechanisms of action of relevant antibodies.
We appreciate this positive assessment and thank the reviewers for their time and constructive comments. We will make the following changes in the revised manuscript.
(1) Clarify the distinction between suppression efficiency and functional cost.
(2) Add controls: smFRET experiments in the presence of monovalent 10E8.4 and iMab individually and compare results with the bivalent 10E8.4/iMab that we currently have.
(3) Increase the number of repeats in neutralization experiments to reduce variability and, where feasible, perform infectivity and neutralization assays after click chemistry labeling.
(4) Add discussion on conformational populations probed by smFRET versus structural analyses, Env conformational heterogeneity, ligand effects, and how these approaches complement each other.
(5) Further clarify the assignments of multiple conformational states by smFRET, the heterogeneity of Env spikes and virion morphology by cryoET, and the focus of the current smFRET-focused storyline.
Please find below our provisional responses to the public reviews. We will provide detailed point-by-point responses upon submission of the revised manuscript.
Public Reviews:
Reviewer #1 (Public review):
The authors have considered a panel of antibodies that target epitopes at the gp120/gp41 interface (8ANC195 and PGT151), the fusion peptide in the gp41 domain (VRC34), and the MPER region of gp41 (DH511.2_K3 and VRC42). They also investigate 10E8.4/iMab, which is an engineered bispecific antibody that targets the MPER and the CD4 receptor. On a technical note, they have applied a double amber codon-readthrough strategy to incorporate the non-natural TCO*A amino acid, which gets labeled through click chemistry. This approach should result in less disruption of the native Env structure as compared to the peptide insertion previously used for smFRET imaging of Env. Furthermore, previous implementations of smFRET imaging of HIV-1 Env, which focus on gp120 conformation, have yielded limited information on antibodies that target gp41. Altogether, through the cutting-edge application of smFRET imaging, the study provides novel insights into the mechanisms of action of interesting and clinically relevant antibodies.
Thank you for the positive comments!
In validating the functionality of the S401TAG/R542TAG Env, the authors performed infectivity assays and observed 20% infectivity as compared to wild-type (Figure S2A). However, the text equates this with "20% dual-amber suppression efficiency". This would benefit from some explanation. Why do the authors interpret infectivity as reporting on amber suppression efficiency, and not the functional cost of modifying Env, which is probably unavoidable? Or a combination of both? Is there data to suggest that 100% amber suppression would leave Env 100% functional? If so, this would be valuable to show. If not, the text should be clarified.
We acknowledge this concern and will clarify the distinction between suppression efficiency and functional cost in the revision. The observed reduction in infectivity does not translate into the functional loss; instead, it more reflects the efficiency of suppression (one of the critical limitations of applying genetic code expansion in mammalian cells), as evidenced by reduced Env expression and incorporation on virions (Fig. 1B). In support of the preservation of Env functionality, tag-free and dual-ncAA-incorporated Env virions exhibited similar dose-dependent neutralization sensitivity against trimer-specific neutralizing antibodies (Fig.1D). We have previously discussed several limitations of amber suppression in mammalian cells combined with smFRET viral systems (PMID: 38232732; PMID: 40716060). In brief, orthogonal tRNA/aaRS pair–mediated amber suppression (reassigning/repurposing amber stop codons to non-canonical amino acids) of the introduced ambers in the target protein (Env in our case) must compete with the cellular translation system, particularly release factors that recognize amber codons and terminate translation. Readthrough of endogenous amber codons in virus-producing cells (in our case, HEK293T) can disrupt normal protein expression and virus production. Similarly, readthrough of preexisting amber codons in HIV-1 ORFs other than the targeted ambers in Env can disrupt virus assembly, which we addressed by generating an amber-free provirus (PMID: 38232732). Introducing two amber codons into Env further reduces efficiency, as dual suppression requires two sequential successful suppression events within the same Env molecule.
The authors state that the contour plots in Figure 2E reveal "dynamic sampling" of the observed FRET states. Strictly speaking, as presented, the contour plots (and FRET histograms) provide no information on dynamics per se. They indicate only the relative thermodynamic stabilities of the FRET states; transitions between states are a matter of interpretation. The TDPs, shown later in Figure 5A, nicely display the dynamics. More importantly, interpretation of the contour plots is challenging, as some seem to suggest an evolution toward lower FRET states. This is especially evident in Figures 2F and 3D, which suggest that the system evolves into a stable 0.1-FRET state (CO) after about 3 sec. Unless the authors want to conclude something from this, I would suggest that they consider removing the contour plots, since their interpretations are fully supported by the FRET histograms alone.
We agree and will remove the contour plots, as they do not add meaningful information beyond what the histograms show.
The data indicating that Env conformation is manipulated by 10E8.4/iMab is interesting. If I understand correctly, 10E8.4/iMab is an engineered antibody with one Fab targeting MPER and the second Fab targeting CD4. In the absence of CD4, could the difference between 10E8.4/iMab and the other MPER antibodies be due to 10E8.4/iMab being monovalent with respect to MPER binding?
We appreciate this question. To answer this, we will perform smFRET experiments in the presence of 10E8.4 and iMab individually and compare those with the bivalent 10E8.4/iMab.
Reviewer #2 (Public review):
Summary:
In this paper, Xu and co-workers unveil two distinct modes of neutralisation by gp41-targeted broadly neutralizing antibodies on HIV-1 Env. So far, it was unclear as to how the mechanism of neutralisation occurred for this subset of neutralising antibodies (that can target the fusion peptide or the membrane proximal external region of the gp41 subunit). Thanks to single-molecule FRET, the authors show that the majority of broadly neutralizing antibodies stabilize the closed Env conformation (named State 1 since the original work by Munro and colleagues PMID: 25298114). Interestingly, the bivalent 10E8.4/iMab stabilized in turn a CD4-bound open state of Env. The two modes of neutralization described for these antibodies show previously unknown allosteric mechanisms that stabilize closed and open Env conformation, stressing the importance of Env conformational dynamics and its efficiency during the process of fusion.
Strengths:
The article is well-written, and the figures fully depict the data in a convincing way. The authors have used smFRET, which is now established in the field as a good tool to assess Env dynamics.
We appreciate these positive comments!
Weaknesses:
(1) The limited controls on how click chemistry affects Env (as labelled Env HIV virions were not evaluated).
We agree. Our validation focused on ncAA-incorporated Env HIV-1 virions, but not the fluorescently labeled virions. To address this, we will increase the number of repeats in neutralization experiments to reduce variability and, where feasible, perform infectivity and neutralization assays after click chemistry labeling. We will attempt to do it. However, we expect that the additional handling time required for labeling and the centrifugation steps needed to remove free dyes, which can deform/disrupt viral membranes and degrade virions, together with the low dual-amber suppression efficiency, will make these experiments technically challenging as an additional layer of functional validation in live cells. On a related note, we have previously performed real-time tracking of single click-labeled Env virion internalization and trafficking in live cells (PMID: 38232732), supporting the retained functionality of click-chemistry-labeled Env.
(2) Photobleaching of donor and acceptor molecules occurs right after 10sec exposure.
We acknowledge this limitation and will include it in the corresponding section.
(3) Other limitations are well described in the corresponding section.
We appreciate this comment.
Reviewer #1 (Public review):
Summary:
This manuscript investigates the degradation dynamics of extracellular DNA in soils and its impact on estimates of microbial abundance and diversity. By combining a broad geographic sampling design with a primer-labeling strategy, qPCR quantification, amplicon sequencing, and PMA treatment, the authors aim to disentangle total versus intracellular DNA signals and explore sequence-specific degradation patterns. The topic is relevant, particularly given the increasing awareness of relic DNA as a confounding factor in microbial ecology. The experimental design is ambitious and potentially impactful. However, several conceptual inconsistencies, methodological ambiguities, and statistical limitations currently weaken the robustness of the conclusions. These issues need to be addressed.
Strengths:
The manuscript addresses a timely and important question in microbial ecology, particularly given the growing recognition that relic DNA can bias interpretations of community composition derived from amplicon sequencing. The study is ambitious in scope, incorporating a broad geographic sampling design across multiple soil types, which enhances the generalizability of the findings. The use of a controlled microcosm experiment combined with a primer-labeling strategy to track extracellular DNA dynamics is conceptually innovative and provides a structured framework to investigate degradation processes.
In addition, the integration of multiple approaches, including qPCR for absolute quantification, high-throughput sequencing for community profiling, and PMA treatment to differentiate extracellular from intracellular DNA, represents a comprehensive attempt to disentangle complex sources of bias in soil microbiome analyses. The effort to link degradation dynamics with environmental variables and to explore sequence-level patterns further demonstrates the authors' intent to move beyond descriptive analyses toward a mechanistic understanding.
Weaknesses:
Several conceptual and methodological issues currently limit confidence in the study's conclusions. Key terms such as "sequence-specific degradation" are not clearly defined or supported by a mechanistic or structural hypothesis, making it difficult to interpret the biological meaning of the results. In addition, the bioinformatic workflow presents inconsistencies, particularly the use of ASVs followed by clustering at 97% similarity, which undermines the resolution required to support sequence-level inferences. Statistical analyses are also insufficiently described, including unclear definitions of "T values," a lack of detail on pairing structure, and no indication of multiple testing correction.
Furthermore, important methodological details are missing or unclear, including primer design (e.g., GAPDH tag vs ACTF), Illumina library preparation (e.g., adapter and indexing strategy), and validation of PMA treatment efficiency. The interpretation of PMA-treated samples as representing "living communities" is likely overstated, given the known limitations of the method in soil systems. Finally, typographical errors, inconsistent terminology, and unclear phrasing throughout the manuscript reduce readability and further complicate interpretation.
Author response:
Point-by-point description of the revisions
Reviewer #1:
Thank you very much for considering that our manuscript evaluates an important question and that the reagents used are well prepared and characterized. We also much appreciate that you consider the information generated as potentially useful for those studying HIV infection processes and strategies to prevent infection.
(1) While a single particle tracking routine was applied to the data, it's not clear how the signal from a single GFP was defined and if movement during the 100 ms acquisition time impacts this. My concern would be that the routine is tracking fluctuations, and these are related to single particle dynamics, it appears from the movies that the density or the GFP tagged receptors in the cells is too high to allow clear tracking of single molecules. SPT with GFP is very difficult due to bleaching and relatively low quantum yield. Current efforts in this direction that are more successful include using SNAP tags with very photostable organic fluorophores. The data likely does mean something is happening with the receptor, but they need to be more conservative about the interpretation.
Some of the paradoxical effects might be better understood through deeper analysis of the SPT data, particularly investigation of active transport and more detailed analysis of "immobile" objects. Comments on early figures illustrate how this could be approached. This would require selecting acquisitions where the GFP density is low enough for SPT and performing a more detailed analysis, but this may be difficult to do with GFP.
When the authors discuss clusters of <2 or >3, how do they calibrate the value of GFP and the impact of diffusion on the measurement. One way to approach this might be single molecules measurements of dilute samples on glass vs in a supported lipid bilayer to map the streams of true immobility to diffusion at >1 µm2/sec.
We fully understand the reviewer’s apprehensions regarding the application of these high-end biophysical techniques, in particular the associated complexity of the data analysis. We provide below extensive explanations on our methodology, which we hope will satisfactorily address all of the reviewer’s concerns.
We would first like to emphasize that the experimental conditions and the quantitative analysis used in our current experiments are similar to the established protocols and methodologies applied by our group previously (Martinez-Muñoz et al. Mol. Cell, 2018; García-Cuesta et al. PNAS, 2022; Gardeta et al. Frontiers in Immunol., 2022; García-Cuesta et al. eLife, 2024; Gardeta et al. Cell. Commun. Signal., 2025) and by others (Calebiro et al. PNAS, 2013; Jaqaman et al. Cell, 2011; Mattila et al. Immunity, 2013; Torreno-Pina et al. PNAS, 2014; Torreno-Pina et al. PNAS, 2016).
As SPT (single-particle tracking) experiments require low-expressing conditions in order to follow individual trajectories (Manzo & García-Parajo Rep. Prog. Phys., 2015), we transiently transfected Jurkat CD4<sup>+</sup> cells with CXCR4-AcGFP or CXCR4<sup>R334X</sup>-AcGFP. At 24 h post-transfection, cells expressing low CXCR4-AcGFP levels were selected by a MoFlo Astrios Cell Sorter (BeckmanCoulter) to ensure optimal conditions for SPT. Using Dako Qifikit (DakoCytomation), we quantified the number of CXCR4 receptors and found ~8,500 – 22,000 CXCR4-AcGFP receptors/cell, which correspond to a particle density ~2 – 4.5 particles/µm<sup>2</sup> (Author response image 1) and are similar to the expression levels found in primary human lymphocytes.
Author response image 1.
Purified AcGFP monomeric protein was immobilized on glass at various concentrations. Dependency of the distribution of particle components on particle density was calculated; >95% were monomeric single particles at 2.0-4.5 particles/µm<sup>2</sup>. This range of particle density was used to analyze the dynamics of CXCR4-AcGFP, or CXCR4<sup>R334X</sup>-AcGFP single particles on JKCD4 cells.
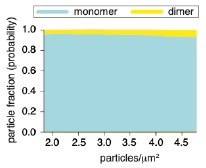
These cells were resuspended in RPMI supplemented with 2% FBS, NaPyr and L-glutamine and plated on 96-well plates for at least 2 h. Cells were centrifuged and resuspended in a buffer with HBSS, 25 mM HEPES, 2% FBS (pH 7.3) and plated on glass-bottomed microwell dishes (MatTek Corp.) coated with fibronectin (FN) (Sigma-Aldrich, 20 µg/ml, 1 h, 37°C). To observe the effect of the ligand, we coated dishes with FN + CXCL12; FN + X4-gp120 or FN + VLPs, as described in material and methods; cells were incubated (20 min, 37°C, 5% CO<sub>2</sub>) before image acquisition.
For SPT measurements, we use a total internal reflection fluorescence (TIRF) microscope (Leica AM TIRF inverted) equipped with an EM-CCD camera (Andor DU 885-CS0-#10-VP), a 100x oilimmersion objective (HCX PL APO 100x/1.46 NA) and a 488-nm diode laser. The microscope was equipped with incubator and temperature control units; experiments were performed at 37°C with 5% CO<sub>2</sub>. To minimize photobleaching effects before image acquisition, cells were located and focused using the bright field, and a fine focus adjustment in TIRF mode was made at 5% laser power, an intensity insufficient for single-particle detection that ensures negligible photobleaching. Image sequences of individual particles (500 frames) were acquired at 49% laser power with a frame rate of 10 Hz (100 ms/frame). The penetration depth of the evanescent field used was 90 nm.
We performed automatic tracking of individual particles using a very well established and common algorithm first described by Jaqaman (Jaqaman et al. Nat. Methods, 2008). Nevertheless, we would stress that we implemented this algorithm in a supervised fashion, i.e., we visually inspect each individual trajectory reconstruction in a separate window. Indeed, this algorithm is not able to quantify merging or splitting events.
We follow each individual fluorescence spot frame-by-frame using a three-by-three matrix around the centroid position of the spot, as it diffuses on the cell membrane. To minimize the effect of photon fluctuations, we averaged the intensity over 20 frames. Nevertheless, to assure the reviewer that most of the single molecule traces last for at least 50 frames (i.e., 5 seconds), we provide the following data and arguments. We currently measure the photobleaching times from individual CD86-AcGFP spots exclusively having one single photobleaching step to guarantee that we are looking at individual CD86-AcGFP molecules. The distribution of the photobleaching times is shown below (Author response image 2). Fitting of the distribution to a single exponential decay renders a t0 value of ~5 s. Thus, with 20 frames averaging, we are essentially measuring the whole population of monomers in our experiments. As the survival time of a molecule before photobleaching will strongly depend on the excitation conditions, we used low excitation conditions (2 mW laser power, which corresponds to an excitation power density of ~0.015 kW/cm<sup>2</sup> considering the illumination region) and longer integration times (100 ms/frame) to increase the signal-to-background for single GFP detection while minimizing photobleaching.
Author response image 2.
Single molecule photobleaching times measured directly from single molecule trajectories of CD86-AcGFP, considering only traces that exhibit single molecule photobleaching steps. The experimental data are shown in gray bars (n=273 trajectories over 3 independent experiments). The red line corresponds to a single exponential decay fitting of the experimental data, from where t<sub>o</sub> has been extracted.
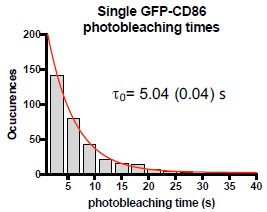
To infer the stoichiometry of receptor complexes, we also perform single-step photobleaching analysis of the TIRF trajectories to establish the existence of different populations of monomers, dimers, trimers and nanoclusters and extract their percentage. Some representative trajectories of CXCR4-AcGFP with the number of steps detected are shown in new Supplementary Figure 1.
The emitted fluorescence (arbitrary units, a.u.) of each spot in the cells is quantified and normalized to the intensity emitted by monomeric CD86-AcGFP spots that strictly showed a single photobleaching step (Dorsch et al. Nat. Methods, 2009). We have preferred to use CD86-AcGFP in cells rather than AcGFP on glass to exclude any potential effect on the different photodynamics exhibited by AcGFP when bound directly to glass. We have also previously shown pharmacological controls to exclude CXCL12-mediated receptor clustering due to internalization processes (Martinez-Muñoz et al. Mol. Cell, 2018) that, together with the evaluation of single photobleaching steps and intensity histograms, allow us to exclude the presence of vesicles in our data. Thus, the dimers, trimers and nanoclusters found in our data do correspond to CXCR4 molecules on the cell surface. Finally, distribution of monomeric particle intensities, obtained from the photobleaching analysis, was analyzed by Gaussian fitting, rendering a mean value of 980 ± 86 a.u. This value was then used as the monomer reference to estimate the number of receptors per particle in both cases, CXCR4-AcGFP and CXCR4<sup>R334X</sup>-AcGFP (new Supplementary Figure 1).
(2) I understand that the CXCL12 or gp120 are attached to the substrate with fibronectin for adhesion. I'm less clear how how that VLPs are integrated. Were these added to cells already attached to FN?
For TIRF-M experiments, cells were adhered to glass-bottomed microwell dishes coated with fibronectin, fibronectin + CXCL12, fibronectin + X4-gp120, or fibronectin + VLPs. As for CXCL12 and X4-gp120, the VLPs were attached to fibronectin taking advantage of electrostatic interactions. To clarify the integration of the VLPs in these assays, we have stained the microwell dishes coated with fibronectin and those coated with fibronectin + VLPs with wheat germ agglutinin (WGA) coupled to Alexa647 (Author response image 3) and evaluated the staining by confocal microscopy. These results indicate the presence of carbohydrates on the VLPs and are, therefore, indicative of the presence of VLPs on the fibronectin layer.
Author response image 3.
Representative confocal images of microwell dishes coated with fibronectin ((left panel) or fibronectin + VLPs (right panel)) and stained with wheat germ agglutinin (WGA) coupled to Alexa647. Bar scale 1µm.
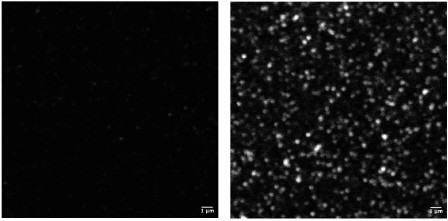
Moreover, it is important to remark that the effect of the VLPs on CXCR4 behavior at the cell surface observed by TIRF-M confirmed that the VLPs remained attached to the substrate during the experiment.
(3) Fig 1A - The classification of particle tracks into mobile and immobile is overly simplistic description that goes back to bulk FRAP measurements and it not really applicable to single molecule tracking data, where it's rare to see anything that is immobile and alive. An alternative classification strategy uses sub-diffusion, normal diffusion and active diffusion (or active transport) to descriptions and particles can transition between these classes over the tracking period. Fig 1B- this data might be better displayed as histograms showing distributions within the different movement classes.
In agreement with the reviewer’s commentary, the majority of the particles detected in our TIRFM experiments were indeed mobile. However, we also detected a variable, and biologically appreciable, percentage of immobile particles depending on the experimental condition analyzed (Figure 1A in the main manuscript). To establish a stringent threshold for identifying these immobile particles under our specific experimental conditions, we used purified monomeric AcGFP proteins immobilized on glass coverslips. Our analysis demonstrated that 95% of these immobilized proteins showed a diffusion coefficient £0.0015 µm<sup>2</sup>/s; consequently, this value was established as the cutoff to distinguish immobile from mobile trajectories. While the observation of truly immobile entities in a dynamic, living system is rare, the presence of these particles under our conditions is biologically significant. For instance, the detection of large, immobile receptor nanoclusters at the plasma membrane is entirely consistent with facilitating key cellular processes, such as enabling the robust signaling cascade triggered by ligand binding or promoting the crucial events required for efficient viral entry into the cells.
Regarding the mobile receptors (defined as those with D<sub>1-4</sub> values exceeding 0.0015 µm<sup>2</sup>/s), we observed distinct diffusion profiles derived from mean square displacement (MSD) plots (Figure V) (Manzo & García-Parajo Rep. Prog. Phys., 2015), which were further classified based on motion, using the moment scaling spectrum (MSS) (Ewers et al. PNAS, 2005). Under all experimental conditions, the majority of mobile particles, ~85%, showed confined diffusion: for example under basal conditions, without ligand addition, ~90% of mobile particles showed confined diffusion, ~8.5% showed Brownian-free diffusion and ~1.5% exhibited directed motion (new Supplementary Figure 5A in the main manuscript). These data have been also included in the revised manuscript to show, in detail, the dynamic parameters of CXCR4.
Due to the space constraints, it is very difficult to include all the figures generated. However, to ensure comprehensive assessment and transparency (for the purpose of this review), we have included below representative plots of the MSD values as a function of time from individual trajectories, showing different types of motion obtained in our experiments (Author response image 4).
Author response image 4.
Representative MSD plots from individual trajectories of CXCR4AcGFP detected by SPT-TIRF in resting JKCD4 cells showing different types of motion: A) confined, B) Brownian/Free, C) direct transport.
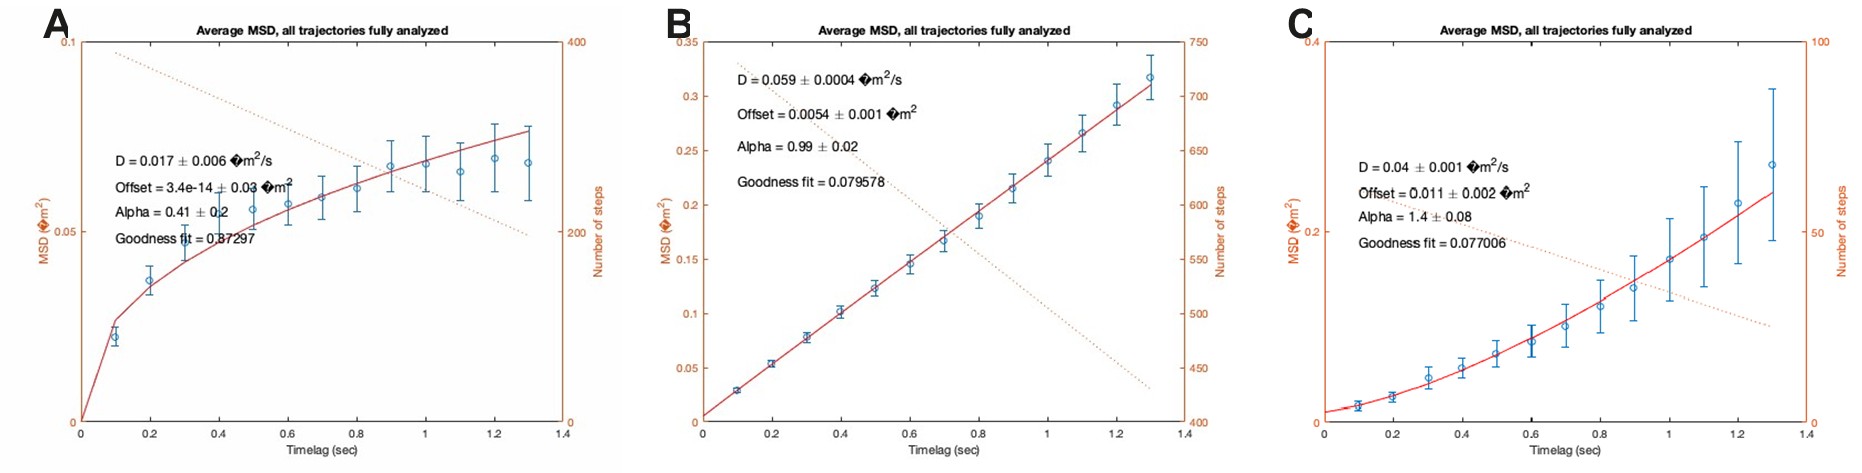
(4) Fig 1C,D - It would be helpful to see a plot of D vs MSI at a single particle level. In comparing C and D I'm surprised there is not a larger difference between CXCL12 and X4-gp120. It would also be very important to see the behaviour of X4-gp120 on the CXCR4 deficient Jurkat that would provide a picture of CD4 diffusion. The CXCR4 nanoclustering related to the X4-gp120 could be dominated by CD4 behaviour.
As previously described, all analyses were performed under SPT conditions (see previous response to point 1). Figure 1C details the percentage of oligomers (>3 receptors/particle) calibrated using Jurkat CD4<sup>+</sup> cells electroporated with monomeric CD86-AcGFP (Dorsch et al. Nat. Methods, 2009). The monomer value was determined by analyzing photobleaching steps as described in our previous response to point 1.
In our experiments, we observed a trend towards a higher number of oligomers upon activation with CXCL12 compared with X4-gp120. This trend was further supported by measurements of Mean Spot Intensity. However, the values are also influenced by the number of larger spots, which represents a minor fraction of the total spots detected.
The differences between the effect triggered by CXCL12 or X4-gp120 might also be attributed to a combination of factors related to differences in ligand concentration, their structure, and even to the technical requirements of TIRF-M. Both ligands are in contact with the substrate (fibronectin) and the specific nature of this interaction may differ between both ligands and influence their accessibility to CXCR4. Moreover, the requirement of the prior binding of gp120 to CD4 before CXCR4 engagement, in contrast to the direct binding of CXCL12 to CXCR4, might also contribute to the differences observed.
We previously reported that CXCL12-mediated CXCR4 dynamics are modulated by CD4 coexpression (Martinez-Muñoz et al. Mol. Cell, 2018). We have now detected the formation of CD4 heterodimers with both CXCR4 and CXCR4<sup>R334X</sup>, and found that these conformations are influenced by gp120-VLPs. In the present manuscript, we did not focus on CD4 clustering as it has been extensively characterized previously (Barrero-Villar et al. J. Cell Sci., 2009; JiménezBaranda et al. Nat. Cell. Biol., 2007; Yuan et al. Viruses, 2021). Regarding the investigation of the effects of X4-gp120 on CXCR4-deficient Jurkat cells, which would provide a picture of CD4 diffusion, we would note that a previous report has already addressed this issue using single molecule super-resolution imaging, and revealed that CD4 molecules on the cell membrane are predominantly found as individual molecules or small clusters of up to 4 molecules, and that the size and number of these clusters increases upon virus binding or gp120 activation (Yuan et al. Viruses, 2021).
(5) Fig S1D- This data is really interesting. However, if both the CD4 and the gp120 have his tags they need to be careful as poly-His tags can bind weakly to cells and increasing valency could generate some background. So, they should make the control is fair here. Ideally, using non-his tagged person of sCD4 and gp120 would be needed ideal or they need a His-tagged Fab binding to gp120 that doesn't induce CXCR4 binding.
New Supplementary Figure 2D shows that X4-gp120 does not bind Daudi cells (these cells do not express CD4) in the absence of soluble CD4. While the reviewer is correct to state that both proteins contain a Histidine Tag, cell binding is only detected if X4-gp120 binds sCD4. Nonetheless, we have included in the revised Supplementary Figure 2D a control showing the negative binding of sCD4 to Daudi cells in the absence of X4-gp120. Altogether, these results confirm that only sCD4/X4-gp120 complexes bind these cells.
(6) Fig S4- Panel D needs a scale bar. I can't figure out what I'm being shown without this.
Apologies. A scale bar has been included in this panel (new Supplementary Figure 6D).
Reviewer #2:
(1) This study is well described in both the main text and figures. Introduction provides adequate background and cites the literature appropriately. Materials and Methods are detailed. Authors are careful in their interpretations, statistical comparisons, and include necessary controls in each experiment. The Discussion presents a reasonable interpretation of the results. Overall, there are no major weaknesses with this manuscript.
We very much appreciate the positive comments of the reviewer regarding the broad interest and strength of our work.
(2) NL4-3deltaIN and immature HIV virions are found to have less associated gp120 relative to wild-type particles. It is not obvious why this is the case for the deltaIN particles or genetically immature particles. Can the authors provide possible explanations? (A prior paper was cited, Chojnacki et al Science, 2012 but can the current authors provide their own interpretation.)
Our conclusion from the data is actually exactly the opposite. As shown in Figure 2D, the gp120 staining intensity was higher for NL4-3DIN particles (1,786 a.u.) than for gp120-VLPs (1,223 a.u.), indicating lower expression of Env proteins in the latter. Furthermore, analysis of gp120 intensity per particle (Figure 2E) confirmed that gp120-VLPs contained fewer gp120 molecules per particle than NL4-3DIN virions. These levels were comparable with, or even lower than, those observed in primary HIV-1 viruses (Zhu et al. Nature, 2006). This reduction was a direct consequence of the method used to generate the VLPs, as our goal was to produce viral particles with minimal gp120 content to prevent artifacts in receptor clustering that might occur using high levels of Env proteins in the VLPs to activate the receptors.
This misunderstanding may arise from the fact that we also compared Gag condensation and Env distribution on the surface of gp120-VLPs with those observed in genetically immature particles and integrase-defective NL4-3ΔIN virions, which served as controls. STED microscopy data revealed differences in Env distribution between gp120-VLPs and NL4-3ΔIN virions, supporting the classification of gp120-VLPs as mature particles (Figure 2 A,B).
Reviewer #3:
We thank the reviewer for considering that our work offers new insights into the spatial organization of receptors during HIV-1 entry and infection and that the manuscript is well written, and the findings significant.
(1) For mechanistic basis of gp120-CXCR4 versus CXCL12-CXCR4 differences. Provide additional structural or biochemical evidence to support the claim that gp120 stabilises a distinct CXCR4 conformation compared to CXCL12. If feasible, include molecular modelling, mutagenesis, or crosslinking experiments to corroborate the proposed conformational differences.
We appreciate the opportunity to clarify this point. The specific claim that gp120 stabilizes a conformation of CXCR4 that is distinct from the CXCL12-bound state was not explicitly stated in our manuscript, although we agree that our data strongly support this possibility. It is important to consider that CXCL12 binds directly to CXCR4, whereas gp120 requires prior sequential binding to CD4, and its subsequent interaction is with a CXCR4 molecule that is already forming part of the CD4/CXCR4 complex, as demonstrated by our FRET experiments and supported by previous studies (Zaitseva et al. J. Leuk. Biol., 2005; Busillo & Benovic Biochim. Biophys. Acta, 2007; Martínez-Muñoz et al. PNAS, 2014). This difference makes it inherently complex to compare the conformational changes induced by gp120 and CXCL12 on CXCR4.
However, our findings show that both stimuli induce oligomerization of CXCR4, a phenomenon not observed when mutant CXCR4<sup>R334X</sup> was exposed to the chemokine CXCL12 (García-Cuesta et al. PNAS, 2022).
(1) CXCL12 induced oligomerization of CXCR4 but did not affect the dynamics of CXCR4<sup>R334X</sup> (Martinez-Muñoz et al. Mol. Cell, 2018; García-Cuesta et al. PNAS, 2022). By contrast, X4-gp120 and the corresponding VLPs—which require initial binding to CD4 to engage the chemokine receptor—stabilized oligomers of both CXCR4 and CXCR4<sup>R334X</sup>.
(2) FRET analysis revealed distinct FRET<sub>50</sub> values for CD4/CXCR4 (2.713) and CD4/CXCR4<sup>R334X</sup> (0.399) complexes, suggesting different conformations for each complex.
(3) Consistent with previous reports (Balabanian et al. Blood, 2005; Zmajkovicova et al. Front. Immunol., 2024; García-Cuesta et al. PNAS, 2022), the molecular mechanisms activated by CXCL12 are distinct when comparing CXCR4 with CXCR4<sup>R334X</sup>. For instance, CXCL12 induces internalization of CXCR4, but not of mutant CXCR4<sup>R334X</sup>. Conversely, X4-gp120 triggers approximately 25% internalization of both receptors. Similarly, CXCL12 does not promote CD4 internalization in cells co-expressing CXCR4 or CXCR4<sup>R334X</sup>, whereas X4-gp120 does, although CD4 internalization was significantly higher in cells co-expressing CXCR4.
These findings suggest that CD4 influences the conformation and the oligomerization state of both co-receptors. To further support this hypothesis, we have conducted new in silico molecular modeling of CD4 in complex with either CXCR4 or its mutant CXCR4<sup>R334X</sup> using AlphaFold 3.0 (Abramson et al. Nature, 2024). The server was provided with both sequences, and the interaction between the two molecules for each protein was requested. It produced a number of solutions, which were then analyzed using the software ChimeraX 1.10 (Meng et al. Protein Sci., 2023). CXCR4 and its mutant, CXCR4<sup>R334X</sup> bound to CD4, were superposed using one of the CD4 molecules from each complex, with the aim of comparing the spatial positioning of CD4 molecules when interacting with CXCR4.
Author response image 5.
CD4/CXCR4 complexes were superimposed with CD4/CXCR4 complexes (left panel) or CD4/CXCR4<sup>R334X</sup> complexes (right panels). Arrows indicate the CD4 molecule used as reference for the superimposing.
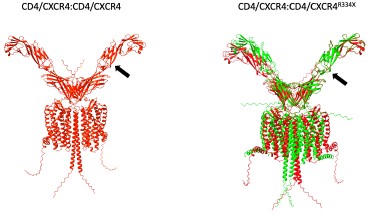
As illustrated in Author response image 5, the superposition of the CD4/CXCR4 complexes was complete. However, when CD4/CXCR4 complexes were superimposed with CD4/CXCR4<sup>R334X</sup> complexes using the same CD4 molecule as a reference, indicated by an arrow in the figure, a clear structural deviation became evident. The main structural difference detected was the positioning of the CD4 transmembrane domains when interacting with either the wild-type or mutant CXCR4. While in complexes with CXCR4, the angle formed by the lines connecting residues E416 at the C-terminus end of CD4 with N196 in CXCR4 was 12°, for the CXCR4<sup>R334X</sup> complex, this angle increased to 24°, resulting in a distinct orientation of the CD4 extracellular domain (Author response image 6).
Author response image 6.
Comparison of the angle between the transmembrane domains of CD4 in CXCR4 WT and WHIM complexes. The angle between residues N196 from one CXCR4 molecule and E416 from the two CD4 dimer molecules was calculated for the CXCR4 WT (12°) and WHIM (24°) complexes to demonstrate the difference in CD4 positioning.
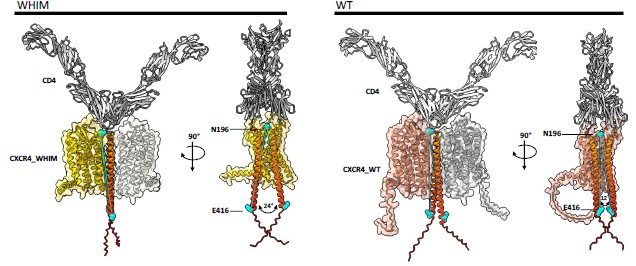
To further analyze the models obtained, we employed PDBsum software (Laskowski & Thornton Protein Sci., 2021) to predict the CD4/CXCR4 interface residues. Data indicated that at least 50% of the interaction residues differed when the CD4/CXCR4 interaction surface was compared with that of the CD4/CXCR4<sup>R334X</sup> complex (Author response image 7). It is important to note that while some hydrogen bonds were present in both complex models, others were exclusive to one of them. For instance, whereas Cys<sup>394</sup>(CD4)-Tyr<sup>139</sup> and Lys<sup>299</sup>(CD4)-Glu<sup>272</sup> were present in both CD4/CXCR4 and CD4/CXCR4<sup>R334X</sup> complexes, the pairs Asn<sup>337</sup>(CD4)-Ser<sup>27</sup>(CXCR4<sup>R334X</sup>) and Lys<sup>325</sup>(CD4)-Asp<sup>26</sup>(CXCR4<sup>R334X</sup>) were only found in CD4/CXCR4<sup>R334X</sup> complexes.
Author response image 7.
Interacting residues at the CD4/CXCR4 interface. The panel displays the interface residues from the CXCR4 and CD4 oligomer. CD4 residues labeled with a red sphere show the interacting residues present in both CXCR4-WT and –WHIM hetero- oligomers. The continuous red lines represent a saline bridge, while the blue lines indicate a hydrogen bond and the dashed red lines represent non-bonded interactions. As illustrated in the figure, half of the interacting residues differ between the WT and WHIM models, indicating that the interacting surfaces are also distinct.
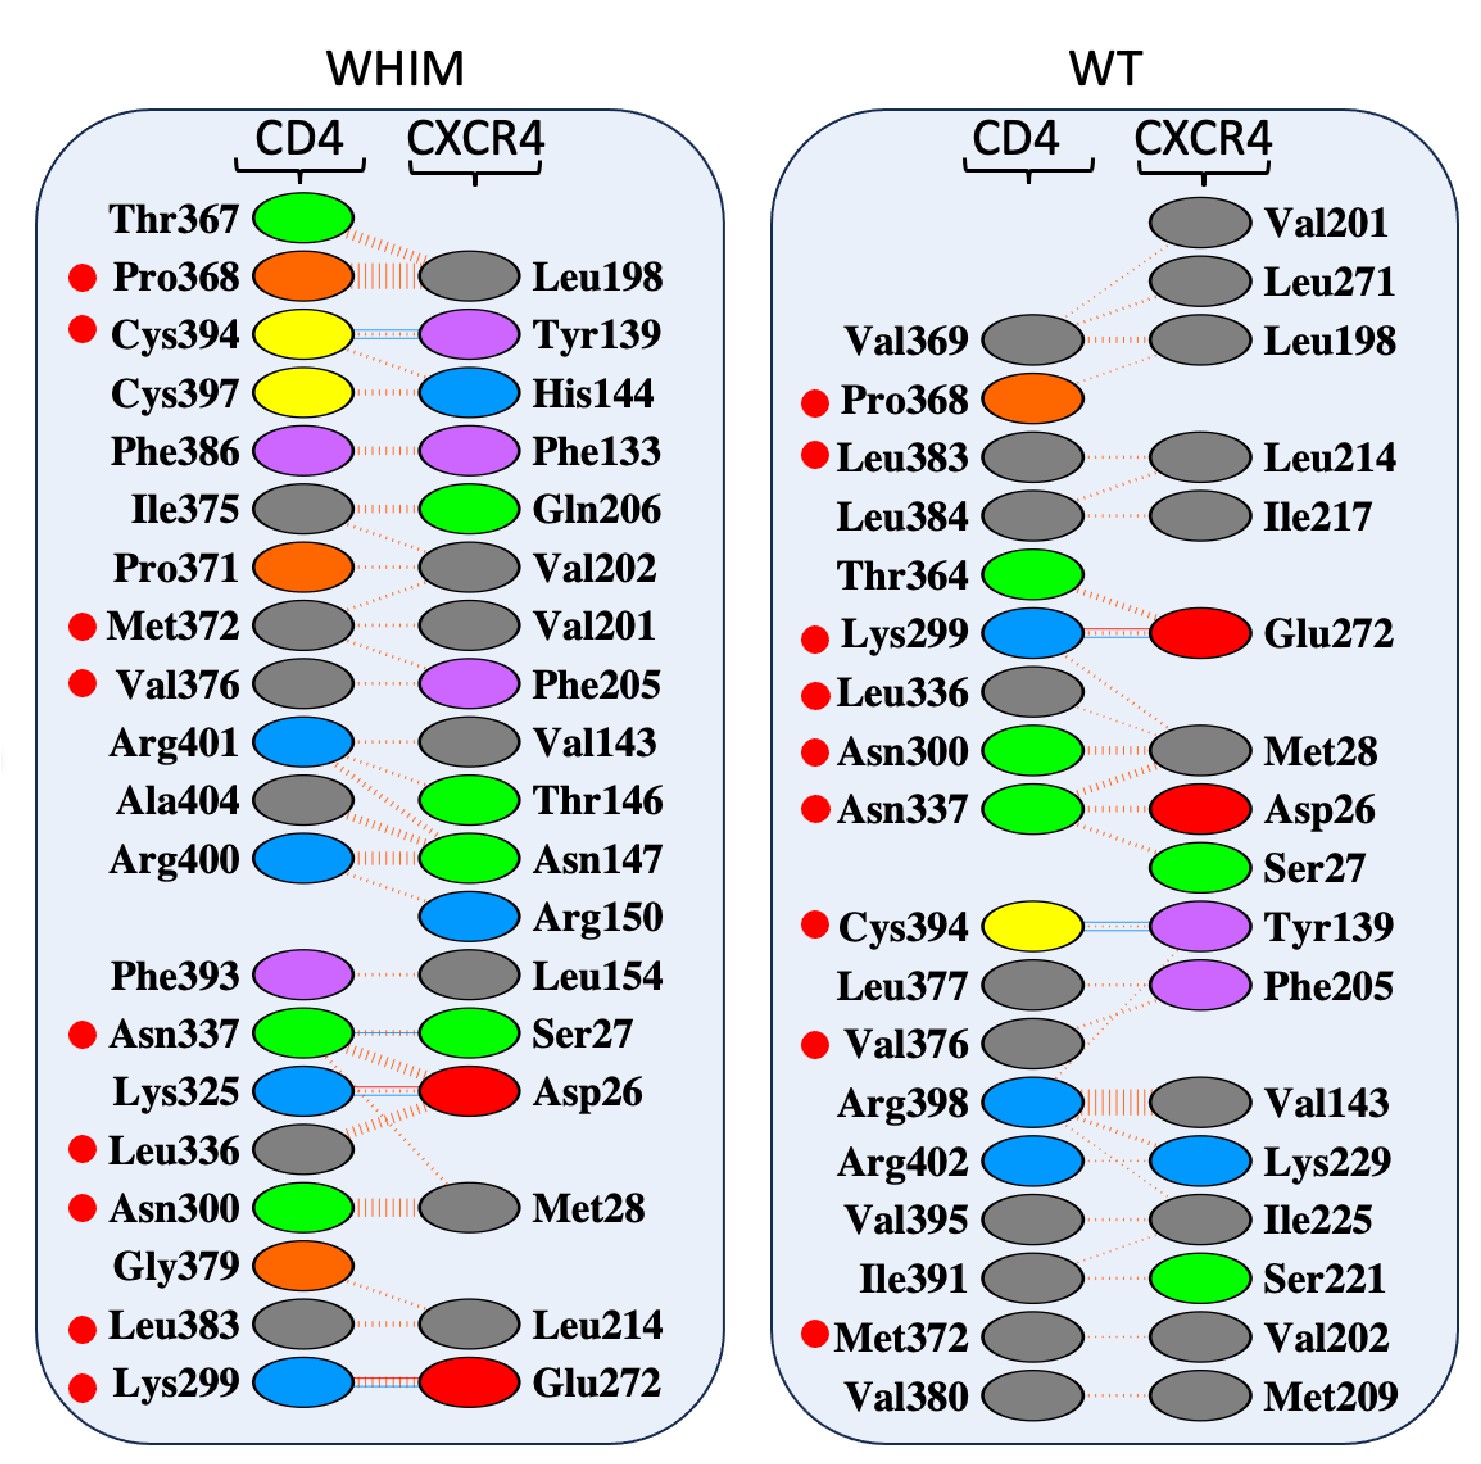
These findings, which are consistent with our FRET results, suggest distinct interaction surfaces between CD4 and the two chemokine receptors. Overall, these results are compatible with differences in the spatial conformation adopted by these complexes.
(2) For Empty VLP effects on CXCR4 dynamics: Explore potential causes for the observed effects of Envdeficient VLPs. It's valuable to include additional controls such as particles from non-producer cells, lipid composition analysis, or blocking experiments to assess nonspecific interactions.
As VLPs are complex entities, we thought that the relevant results should be obtained comparing the effects of Env(-) VLPs with gp120-VLPs. Therefore, we would first remark that regardless of the effect of Env(-) VLPs on CXCR4 dynamics, the most evident finding in this study is the strong effect of gp120-VLPs compared with control Env(-) VLPs. Nevertheless, regarding the effect of the Env(-) VLPs compared with medium, we propose several hypotheses. As several virions can be tethered to the cell surface via glycosaminoglycans (GAGs), we hypothesized that VLPs-GAGs interactions might indirectly influence the dynamics of CXCR4 and CXCR4<sup>R334X</sup> at the plasma membrane. Additionally, membrane fluidity is essential for receptor dynamics, therefore VLPs interactions with proteins, lipids or any other component of the cell membrane could also alter receptor behavior. It is well known that lipid rafts participate in the interaction of different viruses with target cells (Nayak & Hu Subcell. Biochem., 2004; Manes et al. Nat. Rev. Immunol., 2003; Rioethmullwer et al. Biochim. Biophys. Acta, 2006) and both the lipid composition and the presence of co-expressed proteins modulate ligand-mediated receptor oligomerization (Gardeta et al. Frontiers in Immunol., 2022; Gardeta et al. Cell. Commun. Signal., 2025). We have thus performed Raster Image Correlation Spectroscopy (RICS) analysis to assess membrane fluidity through membrane diffusion measurements on cells treated with Env(-) VLPs.
Jurkat cells were labeled with Di-4-ANEPPDHG and seeded on FN and on FN + VLPs prior to analysis by RICS on confocal microscopy. The results indicated no significant differences in membrane diffusion under the treatment tested, thereby discarding an effect of VLPs on overall membrane fluidity (Author response image 8).
Author response image 8.
VLPs treatment does not alter cell membrane fluidity. Diffusion values obtained by RICS from JKCD4X4 cells. (n = 3, with at least 10 cells analyzed per experiment and condition; n.s., not significant).
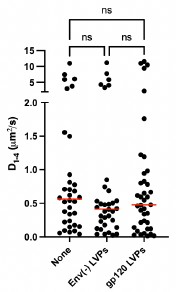
Nonetheless, these results do not rule out other non-specific interactions of Env(-) VLPs with membrane proteins that could affect receptor dynamics. For instance, it has been reported that Ctype lectin DC-SIGN acts as an efficient docking site for HIV-1 (Cambi et al. J. Cell. Biol., 2004; Wu & KewalRamani Nat. Rev. Immunol., 2006). However, a detailed investigation of these possible mechanisms is beyond the scope of this manuscript.
(3) For Direct link between clustering and infection efficiency - Test whether disruption of CXCR4 clustering (e.g., using actin cytoskeleton inhibitors, membrane lipid perturbants, or clustering-deficient mutants) alters HIV-1 fusion or infection efficiency.
Designing experiments using tools that disrupt receptor clustering by interacting with the receptors themselves is difficult and challenging, as these tools bind the receptor and can therefore alter parameters such as its conformation and/or its distribution at the cell membrane, as well as affect some cellular processes such as HIV-1 attachment and cell entry. Moreover, effects on actin polymerization or lipids dynamics can affect not only receptor clustering but also impact on other molecular mechanisms essential for efficient infection.
Many previous reports have, nonetheless, indirectly correlated receptor clustering with cell infection efficiency. Cholesterol plays a key role in the entry of several viruses. Its depletion in primary cells and cell lines has been shown to confer strong resistance to HIV-1-mediated syncytium formation and infection by both CXCR4- and CCR5-tropic viruses (Liao et al. AIDS Res. Hum. Retroviruses, 2021). Moderate cholesterol depletion also reduces CXCL12-induced CXCR4 oligomerization and alters receptor dynamics (Gardeta et al. Cell. Commun. Signal., 2025). By restricting the lateral diffusion of CD4, sphingomyelinase treatment inhibits HIV-1 fusion (Finnegan et al. J. Virol., 2007). Depletion of sphingomyelins also disrupts CXCL12mediated CXCR4 oligomerization and its lateral diffusion (Gardeta et al. Front Immunol., 2022). Additional reports highlight the role of actin polymerization at the viral entry site, which facilitates clustering of HIV-1 receptors, a crucial step for membrane fusion (Serrano et al. Biol. Cell., 2023). Blockade of actin dynamics by Latrunculin A treatment, a drug that sequesters actin monomers and prevents its polymerization, blocks CXCL12-induced CXCR4 dynamics and oligomerization (Martínez-Muñoz et al. Mol. Cell, 2018).
Altogether, these findings strongly support our hypothesis of a direct link between CXCR4 clustering and the efficiency of HIV-1 infection.
(4) CD4/CXCR4 co-endocytosis hypothesis - Support the proposed model with direct evidence from livecell imaging or co-localization experiments during viral entry. Clarification is needed on whether internalization is simultaneous or sequential for CD4 and CXCR4.
When referring to endocytosis of CD4 and CXCR4, we only hypothesized that HIV-1 might promote the internalization of both receptors either sequentially or simultaneously. The hypothesis was based in several findings:
a) Previous studies have suggested that HIV-1 glycoproteins can reduce CD4 and CXCR4 levels during HIV-1 entry (Choi et al. Virol. J., 2008; Geleziunas et al. FASEB J, 1994; Hubert et al. Eur. J. Immunol., 1995).
b) Receptor endocytosis has been proposed as a mechanism for HIV-1 entry (Daecke et al. J. Virol., 2005; Aggarwal et al. Traffick, 2017; Miyauchi et al. Cell, 2009; Carter et al. Virology, 2011).
c) Our data from cells activated with X4-gp120 demonstrated internalization of CD4 and chemokine receptors, which correlated with HIV-1 infection in PBMCs from WHIM patients and healthy donors.
d) CD4 and CXCR4 have been shown to co-localize in lipid rafts during HIV-1 infection (Manes et al. EMBO Rep., 2000; Popik et al. J. Virol., 2002)
e) Our FRET data demonstrated that CD4 and CXCR4 form heterocomplexes and that FRET efficiency increased after gp120-VLPs treatment.
We agree with the reviewer that further experiments are required to test this hypothesis, however, we believe that this is beyond the scope of the current manuscript.
Minor Comments:
(1) The conclusions rely solely on the HXB2 X4-tropic Env. It would strengthen the study to assess whether other X4 or dual-tropic strains induce similar receptor clustering and dynamics.
The primary goal of our current study was to investigate the dynamics of the co-receptor CXCR4 during HIV-1 infection, motivated by previous reports showing CD4 oligomerization upon HIV1 binding and gp120 stimulation (Yuan et al. Viruses, 2021). We initially used a recombinant X4gp120, a soluble protein that does not fully replicate the functional properties of the native HIV-1 Env. Previous studies have shown that Env consists of gp120 trimers, which redistribute and cluster on the surface of virions following proteolytic Gag cleavage during maturation (Chojnacki et al. Nat. Commun., 2017). An important consideration in receptor oligomerization studies is the concentration of recombinant gp120 used, as it does not accurately reflect the low number of Env trimers present on native HIV-1 particles (Hart et al. J. Histochem. Cytochem., 1993; Zhu et al. Nature, 2006). To address these limitations, we generated virus-like particles (VLPs) containing low levels of X4-gp120 and repeated the dynamic analysis of CXCR4. The use of primary HIV-1 isolates was limited, in this project, to confirm that PBMCs from both healthy donors and WHIM patients were equally susceptible to infection. This result using a primary HIV-1 virus supports the conclusion drawn from our in vitro approaches. We thus believe that although the use of other X4- and dual-tropic strains may complement and reinforce the analysis, it is far beyond the scope of the current manuscript.
(2) Given the observed clustering effects, it would be valuable to explore whether gp120-induced rearrangements alter epitope exposure to broadly neutralizing antibodies like 17b or 3BNC117. This would help connect the mechanistic insights to therapeutic relevance.
As 3BNC117, VRC01 and b12 are broadly neutralizing mAbs that recognize conformational epitopes on gp120 (Li et al. J. Virol., 2011; Mata-Fink et al. J. Mol. Biol., 2013), they will struggle to bind the gp120/CD4/CXCR4 complex and therefore may not be ideal for detecting changes within the CD4/CXCR4 complex. The experiment suggested by the reviewer is thus challenging but also very complex. It would require evaluating antibody binding in two experimental conditions, in the absence and in the presence of oligomers. However, our data indicate that receptor oligomerization is promoted by X4-gp120 binding, and the selected antibodies are neutralizing mAbs, so they should block or hinder the binding of gp120 and, consequently, receptor oligomerization. An alternative approach would be to study the neutralizing capacity of these mAbs on cells expressing CD4/CXCR4 or CD4/CXCR4<sup>R334X</sup> complexes. Variations in their neutralizing activity could be then extrapolated to distinct gp120 conformations, which in turn may reflect differences between CD4/CXCR4 and CD4/CXCR4<sup>R334X</sup> complexes.
We thus assessed the ability of the VRC01 and b12, anti-gp120 mAbs, which were available in our laboratory, to neutralize gp120 binding on cells expressing CD4/CXCR4 or CD4/CXCR4<sup>R334X</sup>. Specifically, increasing concentrations of each antibody were preincubated (60 min, 37ºC) with a fixed amount of X4-gp120 (0.05 µg/ml). The resulting complexes were then incubated with Jurkat cells expressing CD4/CXCR4 or CD4/CXCR4<sup>R334X</sup> (30 min, 37ºC) and, finally, their binding was analyzed by flow cytometry. Although we did not observe statistically significant differences in the neutralization capacity of b12 or VRC01 for the binding of X4-gp120 depending on the presence of CXCR4 or CXCR4<sup>334X</sup>, we observed a trend for greater concentrations of both mAbs to neutralize X4-gp120 binding in Jurkat CD4/CXCR4 cells than in Jurkat CD4/CXCR4<sup>R334X</sup> cells (Author response image 9).
Author response image 9.
Flow cytometry analysis of gp120 binding to Jurkat cells expressing CD4/CXCR4 or CD4/CXCR4<sup>R334X</sup> in the presence of different concentrations of the neutralizing anti-gp120 antibodies b12 (left panel) and VRC01 (right panel). AUC comparison by Welch’s t-test: pvalues 0.2950 and 0.2112 for b12 and VRC01 respectively (n = 2).
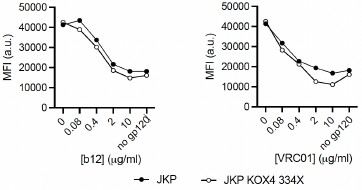
These slight alterations in the neutralizing capacity of b12 and VRC01 mAbs may thus suggest minimal differences in the conformations of gp120 depending of the coreceptor used. We also detected that X4-gp120 and VLPs expressing gp120, which require initial binding to CD4 to engage the chemokine receptor, stabilized oligomers of both CXCR4 and CXCR4<sup>R334X</sup>, but FRET data indicated distinct FRET<sub>50</sub> values between the partners, (2.713) for CD4/CXCR4 and (0.399) for CD4/CXCR4<sup>R334X</sup> (Figure 5A,B in the main manuscript). Moreover, we also detected significantly more CD4 internalization mediated by X4-gp120 in cells co-expressing CD4 and CXCR4 than in those co-expressing CD4 and CXCR4<sup>R334X</sup> (Figure 6 in the main manuscript). Overall these latter data and those included in Author response images 5,6 and 7 indicate distinct conformations within each receptor complexes.
(3) TIRF imaging limits analysis to the cell substrate interface. It would be useful to clarify whether CXCR4 receptor clustering occurs elsewhere, such as at immunological synapses or during cell-to-cell contact.
In recent years, chemokine receptor oligomerization has gained significant research interest due to its role in modulating the ability of cells to sense chemoattractant gradients. This molecular organization is now recognized as a critical factor in governing directed cell migration (Martínez-Muñoz et al. Mol. Cell, 2018; García-Cuesta et al. PNAS, 2022, Hauser et al. Immunity, 2016). In addition, advanced imaging techniques such as single-molecule and super-resolution microscopy have been used to investigate the spatial distribution and dynamic behaviour of CXCR4 within the immunological synapse in T cells (Felce et al. Front. Cell Dev. Biol., 2020). Building on these findings, we are currently conducting a project focused on characterizing CXCR4 clustering specifically within this specialized cellular region.
(4) In LVP experiments, it would be useful to report transduction efficiency (% GFP+ cells) alongside MSI data to relate VLP infectivity with receptor clustering functionally.
These experiments were designed to validate the functional integrity of the gp120 conformation on the LVPs, confirming their suitability for subsequent TIRF microscopy. Our objective was to establish a robust experimental tool rather than to perform a high-throughput quantification of transduction efficiency. It is for that reason that these experiments were included in new Supplementary Figure S6, which also contains the complete characterization of gp120-VLPs and LVPs. In such experimental conditions, quantifying the percentage of GFP-positive cells relative to the total number of cells plated in each well is very difficult. However, in line with the reviewer’s commentary and as we used the same number of cells in each experimental condition, we have included, in the revised manuscript, a complementary graph illustrating the GFP intensity (arbitrary units) detected in all the wells analyzed (new Supplementary Fig. 6E).
(5) To ensure that differences in fusion events (Figure 7B) are attributable to target cell receptor properties, consider confirming that effector cells express similar levels of HIV-1 Env. Quantifying gp120 expression by flow cytometry or western blot would rule out the confounding effects of variable Env surface density.
In these assays (Figure 7B), we used the same effector cells (cells expressing X4-gp120) in both experimental conditions, ensuring that any observed differences should be attributable solely to the target cells, either JKCD4X4 or JKCD4X4<sup>R334X</sup>. For this reason, in Figure 7A we included only the binding of X4-gp120 to the target cells which demonstrated similar levels of the receptors expressed by the cells.
(6) HIV-mediated receptor downregulation may occur more slowly than ligand-induced internalization. Including a 24-hour time point would help assess whether gp120 induces delayed CD4 or CXCR4 loss beyond the early effects shown and to better capture potential delayed downregulation induced by gp120.
The reviewer suggests using a 24-hour time point to facilitate detection of receptor internalization. However, such an extended incubation time may introduce some confounding factors, including receptor degradation, recycling and even de novo synthesis, which could affect the interpretation of the results. Under our experimental conditions, we observed that CXCL12 did not trigger CD4 internalization whereas X4-gp120 did. Interestingly, CD4 internalization depended on the coreceptor expressed by the cells.
(7) Increase label font size in microscopy panels for improved readability.
Of course; the font size of these panels has been increased in the revised version.
(8) Consider adding more references on ligand-induced co-endocytosis of CD4 and chemokine receptors during HIV-1 entry.
We have added more references to support this hypothesis (Toyoda et al. J. Virol., 2015; Venzke et al. J. Virol., 2006; Gobeil et al J. Virol., 2013).
(9) For Statistical analysis. Biological replicates are adequate, and statistical tests are generally appropriate. For transparency, report n values, exact p-values, and the statistical test used in every figure legend and discussed in the results.
Thank you for highlighting the importance of transparency in statistical reporting. We confirm that the n values for all experiments have been included in the figure legends. The statistical tests used for each analysis are also clearly indicated in the figure legends, and the interpretation of these results is discussed in detail in the Results section. Furthermore, the Methods section specifies the tests applied and the thresholds for significance, ensuring full transparency regarding our analytical approach.
In accordance with established conventions in the field, we have utilized categorical significance indicators (e.g., n.s., *, **, ***) within our figures to enhance readability and focus on biological trends. This approach is widely adopted in high-impact literature to prevent visual clutter. However, to ensure full transparency and reproducibility, we have ensured that the underlying statistical tests and thresholds are clearly defined in the respective figure legends and Methods section.
Reviewer #4:
We thank the reviewer for considering that this work is presented in a clear fashion, and the main findings are properly highlighted, and for remarking that the paper is of interest to the retrovirology community and possibly to the broader virology community.
We also agree on the interest that X4-gp120 clusters CXCR4<sup>R334X</sup> suggests a different binding mechanism for X4-gp120 from that of the natural ligand CXCL12, an aspect that we are now evaluating. These data also indicate that WHIM patients can be infected by HIV-1 similarly to healthy people.
(1) The observation that "empty VLPs" reduce CXCR4 diffusivity is potentially interesting. However, it is not supported by the data owing to insufficient controls. The authors correctly discuss the limitations of that observation in the Discussion section (lines 702-704). However, they overinterpret the observation in the Results section (lines 509-512), suggesting non-specific interactions between empty VLPs, CD4 and CXCR4. I suggest either removing the sentence from the Results section or replacing it with a sentence similar to the one in the Discussion section.
In accordance with the reviewer`s suggestion, the sentence in the result section has been replaced with one similar to that found in the discussion section. In addition, we have performed Raster Image Correlation Spectroscopy (RICS) analysis using the Di-4-ANEPPDHQ lipid probe to assess membrane fluidity by means of membrane diffusion, and compared the results with those of cells treated with Env(-) VLPs. The results indicated that VLPs did not modulate membrane fluidity (Author response image 8). Nonetheless, these results do not rule out other potential non-specific interactions of the Env(-) VLPs with other components of the cell membrane that might affect receptor dynamics (see our response to point 2 of reviewer #3).
(2) In the case of the WHIM mutant CXCR4-R334X, the addition of "empty VLPs" did not cause a significant change in the diffusivity of CXCR4-R334X (Figure 4B). This result is in contrast with the addition of empty VLPs to WT CXCR4. However, the authors neither mention nor comment on that result in the results section. Please mention the result in the paper and comment on it in relation to the addition of empty VLPs to WT CXCR4.
We would remark that the main observation in these experiments should focus on the effect of gp120-VLPs, and the results indicates that gp120-VLPs promoted clustering of CXCR4 and of CXCR4<sup>R334X</sup> and reduced their diffusion at the cell membrane. The Env(- ) VLPs were included as a negative control in the experiments, to compare the data with those obtained using gp120VLPs. However, once we observed some residual effect of the Env(-) VLPs, we decided to give a potential explanation, formulated as a hypothesis, that the Env(-) VLPs modulated membrane fluidity. We have now performed a RICS analysis using Di-4-ANEPPDHQ as a lipid probe (Author response image 9). The results suggest that Env(-) VLPs do not modulate cell membrane fluidity, although we do not rule out other potential interactions with membrane proteins that might alter receptor dynamics. We appreciate the reviewer’s observation and agree that this result can be noted. However, since the main purpose of Figure 4B is to show that gp120-VLPs modulate the dynamics of CXCR4<sup>R334X</sup> rather than to remark that the Env(-) VLPs also have some effects, we consider that a detailed discussion of this specific aspect would detract from the central finding and may dilute the primary narrative of the study.
Minor comments
(1) It would be helpful for the reader to combine thematically or experimentally linked figures, e.g., Figures 3 and 4.
(2) Figures 3 and 4 are very similar. Please unify the colours in them and the order of the panels (e.g. Figure 3 panel A shows diffusivity of CXCR4, while Figure 4 panel A shows MSI of CXCR4-R334X).
While we considered consolidating Figures 3 and 4, we believe that maintaining them as separate entities enhances conceptual clarity. Since Figure 3 establishes the baseline dynamics for wildtype CXCR4 and Figure 4 details the distinct behavior of the CXCR4<sup>R334X</sup> mutant, keeping them separate allows the reader to fully appreciate the specificities of each system before making a cross-comparison.
(3) Some parts of the Discussion section could be shortened, moved to the Introduction (e.g., lines 648651), or entirely removed (e.g., lines 633-635 about GPCRs).
In accordance, the Discussion section has been reorganized and shortened to improve clarity.
(4) I suggest renaming "empty VLPs" to "Env(−) VLPs" (or similar). The name empty VLPs can mislead the reader into thinking that these are empty vesicles.
The term empty VLPs has been renamed to Env(−) VLPs throughout the manuscript to more accurately reflect their composition. Many thanks for this suggestion.
(5) Line 492 - please rephrase "...lower expression of Env..." to "...lower expression of Env or its incorporation into the VLPs...".
The sentence has been rephrased
(6) Line 527 - The data on CXCL12 modulating CXCR4-R334X dynamics and clustering are not present in Figure 4 (or any other Figure). Please add them or rephrase the sentence with an appropriate reference. Make clear which results are yours.
(7) Line 532 - Do the data in the paper really support a model in which CXCL12 binds to CXCR4R334X? If not, please rephrase with an appropriate reference.
Previous studies support the association of CXCL12 with CXCR4<sup>R334X</sup> (Balabanian et al. Blood, 2005; Hernandez et al. Nat Genet., 2003; Busillo & Benovic Biochim. Biophys. Acta, 2007). In fact, this receptor has been characterized as a gain-of-function variant for this ligand (McDermott et al. J. Cell. Mol. Med., 2011). The revised manuscript now includes these bibliographic references to support this commentary. In any case, our previous data indicate that CXCL12 binding does not affect CXCR4<sup>R334X</sup> dynamics (García-Cuesta et al. PNAS, 2022).
(8) Line 695 - "...lipid rafts during HIV-1 (missing word?) and their ability to..." During what?
Many thanks for catching this mistake. The sentence now reads: “Although direct evidence for the internalization of CD4 and CXCR4 as complexes is lacking, their co-localization in lipid rafts during HIV-1 infection (97–99) and their ability to form heterocomplexes (22) strongly suggest they could be endocytosed together.”
Author Response:
The following is the authors’ response to the original reviews
Public Reviews:
Reviewer #1 (Public review):
Summary:
Age-related synaptic dysfunction can have detrimental effects on cognitive and locomotor function. Additionally, aging makes the nervous system vulnerable to late-onset neurodegenerative diseases. This manuscript by Marques et al. seeks to profile the cell surface proteomes of glia to uncover signaling pathways that are implicated in age-related neurodegeneration. They compared the glial cell-surface proteomes in the central brain of young (day 5) and old (day 50) flies and identified the most up- and down-regulated proteins during the aging process. 48 genes were selected for analysis in a lifespan screen, and interestingly, most sex-specific phenotypes. Among these, adult-specific pan-glial DIP-β overexpression (OE) significantly increased the lifespan of both males and females and improved their motor control ability. To investigate the effect of DIP-β in the aging brain, Marques et al. performed snRNA-seq on 50-day-old Drosophila brains with or without DIP-β OE in glia. Cortex and ensheathing glia showed the most differentially expressed genes. Computational analysis revealed that glial DIP-β OE increased cell-cell communication, particularly with neurons and fat cells.
Strengths:
(1) State-of-the-art methodology to reveal the cell surface proteomes of glia in young and old flies.
(2) Rigorous analyses to identify differentially expressed proteins.
(3) Examination of up- and down-regulated candidates and identification of glial-expressed mediators that impact fly lifespan.
(4) Intriguing sex-specific glial genes that regulate life span.
(5) Follow-up RNA-seq analysis to examine cellular transcriptomes upon overexpression of an identified candidate (DIP-β).
(6) A compelling dataset for the community that should generate extensive interest and spawn many projects.
Weaknesses:
(1) DIP-β OE using flySAM:
(a) These flies showed a larger increase in lifespan compared to using UAS-DIP-β (Figure 2 C, D). Do the authors think that flySAM is a more efficient way of OE than UAS? Also, the UAS construct would be specific to one DIP-β isoform, while flySAM would likely express all isoforms. Could this also contribute to the phenotypes observed?
We agree with the reviewer that both can contribute to the different lifespan effect. In the original paper presenting flySAM1.0 and flySAM 2.0 (Jia et al., 2018), the authors first tested how flySAM1.0 overexpression (OE) phenotypes compare to several VPR (CRISPRa) and UAS:cDNA OE lines. They found that flySAM1.0 reliably outperforms (i.e., produces stronger OE phenotypes) than VPR in most cases, and produces OE phenotypes that are comparable (i.e., generally equivalent) to UAS:cDNA (Jia et al., 2018). After determining how flySAM1.0 performance compares to VPR and UAS:cDNA, the authors next tested if flySAM2.0 also outperforms VPR; they found that like flySAM1.0, flySAM2.0 outperforms VPR in most cases (Jia et al., 2018). In general, the data suggest that we should expect comparable overexpression phenotypes for our flySAM2.0 and UAS:cDNA lines.
We chose to proceed with the DIP-β flySAM line for the climbing assays and snRNA-seq, as it gave a stronger lifespan effect and we thought it was likely to be the more robust OE line. While our glial cell-surface proteomics initially identified DIP-β isoform C as the candidate, it is possible that other DIP-β isoforms were also present (such as isoform F, which is identical in polypeptide sequence to isoform C) (FlyBase). Ultimately, we believe that the larger increases in lifespan observed for DIP-β flySAM are likely because flySAM targets all isoforms, whereas UAS:cDNA lines target only one isoform. Importantly, our UAS- DIP-β line was specific to DIP-β isoform C, which is the same isoform that was identified by our proteomics.
We have made clarifications in the manuscript to address these comments.
(b) The Glial-GS>DIP-β flySAM flies without RU-486 have significantly shorter lifespans (Figure 2C) than their UAS-DIP-β counterparts. flySAM is lethal when expressed under the control of tubulin-GAL4 (Jia et al. 2018), likely due to the toxicity of such high levels of overexpression. Is it possible that a larger increase in lifespan is due to the already reduced viability of these flies?
This is a good point. The flySAM lines do exhibit a shorter baseline lifespan compared to the traditional UAS lines. This is likely due to the specific genetic background of the flySAM transgenic insertions, or a low level of "leaky" expression, as previously noted in the literature (Jia et al., 2018).
However, we believe that the lifespan extensions we observed for DIP-β flySAM is a robust biological effect, rather than an artifact of reduced viability for the following reasons. First, by utilizing the GeneSwitch (GS) system, we can compare the lifespan of flies with the exact same genetic background (+/- RU-486). This ensures that the extension we report is specifically due to the induction of the transgene, rather than a comparison between disparate lines with different basal fitness levels. Second, if the lifespan extensions merely represented a recovery from lower baseline viability, we would expect to see similar improvements across other flySAM lines in our screen. However, DIP-β was the only candidate across our screen that significantly increased lifespan in both sexes (Extended Data Figs. 7 & 8). Third, the lifespan-extending effect of DIP-β was independently confirmed using a traditional UAS-cDNA line, which importantly does not share the same baseline viability issues as the flySAM lines.
(c) Statistics: It is stated in the Methods that "statistical methods used are described in the figure legend of each relevant panel." However, there is no description of the statistics or sample sizes used in Figure 2.
We have updated the figure legends for Figure 2 to include the missing statistical details and sample sizes.
Specifically, for Fig. 2A: The reviewer is correct that with only two replicates of each time point (5d vs. 50d) in the initial proteomic screen, traditional p-value calculations lack the necessary power for meaningful interpretation. We have revised the legend to clarify that this panel represents a discovery-based screen. Candidates were selected based on biological relevance and specific enrichment thresholds to narrow the 872 proteins down to the 48 top candidates for screening (we were initially aiming to identify approximately 50 candidate genes for screening). For Fig. 2B: We have updated the legend to detail the parameters used for the Gene Ontology (GO) enrichment analysis.
(2) Figure 3: The authors use a glial GeneSwitch (GS) to knock down and overexpress candidate genes. In Figure 3A, they look at glial-GS>UAS-GFP with and without RU. Without RU, there is no GFP expression, as expected. With RU, there is GFP expression. It is expected that all cell body GFP signal should colocalize with a glial nuclear marker (Repo). However, there is some signal that does not appear to be glia. Also, many glia do not express GFP, suggesting the glial GS driver does not label all glia. This could impact which glia are being targeted in several experiments.
We thank the reviewer for this careful observation regarding the expression pattern of the GSG3285-1 line and acknowledge that the overlap between this driver and the Repo-positive cells is not absolute.
Our selection of this specific GeneSwitch line was based on several critical experimental considerations: 1) To minimize background toxicity. We initially tested multiple Repo-GeneSwitch lines; however, we found they exhibited significant, genotype-dependent lifespan reductions upon RU486 administration, even in control crosses. This baseline toxicity confounded the interpretation of any potential lifespan effects. GSG3285-1 was chosen for this study, as it provided a robust control baseline and didn’t show lifespan effects with RU486 treatment in multiple control lines. This is essential for lifespan studies. 2) The driver breadth and specificity. As noted in its original characterization (Nicholson et al., 2008) and a later study (Catterson et al. 2023), GSG3285-1 is characterized as a pan-glial driver, though it may include a small population of sensory neurons. Furthermore, while Repo is a standard glial marker, its antibody does not label all glial subtypes with equal intensity. The "non-overlapping" signal observed in Figure 3A may reflect this staining bias. 3) The expression mosaicism. The fact that some glial cells do not show GFP expression suggests a degree of mosaicism, which is common to many GeneSwitch lines (Osterwalder et al., 2001). While we acknowledge this means our manipulations may target a broader subset — rather than every single glial cell — the fact that we still observed significant lifespan effects across two independent platforms (UAS and CRISPRa) suggests that the targeted population is sufficient to mediate these systemic effects.
We have added a clarifying statement to contextualize the choice of the GSG3285-1 driver and its relationship to the Repo population.
(3) It is interesting that sex-specific lifespan effects were observed in the candidate screen.
(a) The authors should provide a discussion about these sex-specific differences and their thoughts about why these were observed.
We agree that the sex-specific effects observed in our lifespan screen are one interesting aspect of this study. We have added a dedicated section to the Discussion exploring these differences from both a technical and biological perspective.
On the technical side, the GeneSwitch inducer, RU486, can have sex-specific effects on metabolism and lifespan, depending on the nutritional environment (Dos Santos & Cocheme, 2024). Specifically, RU486 has been shown to counteract the lifespan-shortening effects of mating in females, an effect that is less pronounced in males (Landis et al., 2015; Tower et al., 2017). While we optimized our media and used the GSG3285-1 line to minimize these baseline effects, it remains possible that certain genotypes exhibited a sex-specific sensitivity to the inducer itself. Beyond the technical considerations, sex differences in aging are well-documented in Drosophila and other organisms (Regan et al., 2016; Austad & Fischer, 2016). Male and female flies exhibit distinct transcriptional trajectories and metabolic shifts as they age. Furthermore, recent studies have highlighted that glial function and the neuroinflammatory landscape can differ significantly between sexes, which may dictate how a specific genetic manipulation impacts the aging process in a sex-dependent manner (PMID: 40951920). While our screen identifies DIP-β as a rare candidate that extends lifespan in both sexes, the prevalence of female-specific hits in our data suggests that the female "aging program" may be more plastic or responsive to the specific glial pathways we targeted. These observations provide a valuable foundation for future studies into the mechanisms of sex-specific neuroprotection.
(b) The authors should also provide information regarding the sex of the flies used in the glial cell surface proteome study.
It is a mixture of half male and half female flies. This information has been added to the main text, Fig. 1, and to the methods section.
(c) Also, beyond the scope of this study, examining sex-specific glial proteomes could reveal additional insights into age-related pathways affecting males and females differentially.
Agreed, this would be a great idea for future studies.
(4) The behavioral assay used in this study (climbing) tests locomotion driven by motor neurons. The proteomic analysis was performed with the adult brain, which does not include the nerve cord, where motor neurons reside. While likely beyond the scope of this study, it would be informative to test other behaviors, including learning, circadian rhythms, etc.
We thank the reviewer for this insightful point. While our initial proteomic screen focused on the adult central brain, our behavioral validation used a pan-glial driver, which targets glia throughout the entire nervous system, including the ventral nerve cord (VNC). We have addressed the reviewer's comment as below:
Additional behavioral data: As suggested, we performed Drosophila Activity Monitoring (DAM) assays to evaluate circadian locomotor rhythms in 50-day-old DIP-β overexpression flies compared to negative controls. Interestingly, we did not detect significant changes in circadian activity at this time point.
The difference between our climbing and circadian results highlights the complexity of age-related decline. In Drosophila, locomotor performance (i.e., climbing) and circadian coordination often decouple. For example, specific isoforms of human Tau (hTau) can induce severe cognitive and neurodegenerative deficits without affecting lifespan or motor coordination in the same manner (Sealey et al., 2017). Furthermore, motor-specific defects can emerge independently of systemic lifespan changes, as seen in certain SOD1 models of ALS (Hirth, 2010). It is possible that the 50-day timepoint represents a specific window where motor coordination is improved by DIP-β, while circadian circuits — governed by distinct glial-neuronal interactions — remain largely unaffected, or require a different temporal window for observation.
We agree that identifying the specific glial populations (central brain vs VNC) responsible for the improved climbing would be highly informative. While the current study establishes the pro-longevity effect of DIP-β, future work utilizing in-situ proteomics on the fully intact CNS (including the VNC) or specific VNC will be essential to map the stereotyped progression of these effects across the peripheral and central nervous systems.
(5) It is surprising that overexpressing a CAM in glia has such a broad impact on the transcriptomes of so many different cell types. Could this be due to DIP-β OE maintaining the brain in a "younger" state and indirectly influencing the transcriptomes? Instead of DIP-β OE in glia directly influencing cell-cell interactions? Can the authors comment on this?
We agree that the observed changes likely represent a combination of direct cell-cell interactions and a broader, more indirect maintenance of a "younger" physiological state.
Direct: Among the DIP family, DIP-β exhibits some of the strongest and most promiscuous binding affinities, interacting with a wide array of partners including Dpr6, 8, 9, 15, and 21 (Cosmanescu et al., 2018; Sergeeva et al., 2020). This biochemical flexibility allows DIP-β to potentially interface with a much broader range of neuronal subtypes than other DIP family members, such as DIP-δ, which exclusively binds Dpr12 and did not extend lifespan in our screen. It is possible that by overexpressing DIP-β, we may be partially compensating for the global downregulation of CAMs that typically occurs during aging, thereby preserving essential glial-neuronal communication integrity.
Indirect: By maintaining these primary glial functions and communication activities, DIP-β overexpression likely delays the overall "aging" of the brain. This preservation of neural health can have downstream effects on systemic physiology, such as the improved glia-fat body communication we observed in 50-day-old flies. In this model, the broad transcriptomic shifts are not necessarily all direct targets of DIP-β, but rather a signature of a brain that has successfully avoided the catastrophic breakdown of homeostasis typically seen in aged wild-type flies.
We have expanded the Discussion to clarify this distinction, adding that DIP-β likely acts as a "scaffold" or “bridge” for maintaining a younger brain state, which in turn preserves multi-organ communication.
Reviewer #2 (Public review):
This manuscript presents an ambitious and technically innovative study that combines in situ cell-surface proteomics, functional genetic screening, and single-nucleus RNA sequencing to uncover glial factors that influence aging in Drosophila. The authors identify DIP-β as a glial protein whose overexpression extends lifespan and report intriguing sex-specific differences in lifespan outcomes. Overall, the study is conceptually compelling and offers a valuable dataset that will be of considerable interest to researchers studying glia-neuron communication, aging biology, and proteomic profiling in vivo.
The in-situ proteomic labeling approach represents a notable methodological advance. If validated more extensively, it has the potential to become a widely used resource for probing glial aging mechanisms. The use of an inducible glial GeneSwitch driver is another strength, enabling the authors to carefully separate aging-relevant effects from developmental confounds. These technical choices meaningfully elevate the rigor of the study and support its central conclusions. The discovery of new candidate genes from the proteomics pipeline, including DIP-β, is intriguing and opens new avenues for understanding glial contributions to organismal lifespan. The observation of sex-specific lifespan effects is particularly interesting and warrants further exploration; the study sets the stage for future work in this direction.
At the same time, several areas would benefit from clarification or additional analysis to fully support the manuscript's claims:
(1) The manuscript frequently refers to "improved" or "increased" cell-cell communication following DIP-β overexpression, but the meaning of this term remains somewhat vague. Because the current analysis relies largely on transcriptomic predictions, it would be helpful to define precisely what metric is being used, e.g., increased numbers of predicted ligand-receptor interactions, enrichment of specific signaling pathways, or altered expression of communication-related components. Strengthening the mechanistic link between DIP-β, cell-cell communication, and lifespan extension, potentially through targeted validation of specific glial interactions, would substantially reinforce the interpretation.
We agree that a more precise description of “improved” or “increased” cell-cell communication is necessary.
Our conclusion that DIP-β overexpression is associated with “increased” cell-cell communication is based on the quantification of our CCC scores, which was performed using FlyPhoneDB2, a computational tool used to estimate cell-cell signaling from single-cell RNA-sequencing data (Liu et al., 2021; Qadiri et al., 2025). To infer cell-cell signaling, FlyPhoneDB2 and its predecessor, FlyPhoneDB, calculate “interaction scores,” comparing the expression levels of a curated list of ligand-receptor pairs between cell types (Liu et al., 2021; Qadiri et al., 2025). For example, if we detect a ligand in cell type A and its receptor in cell type B in DIP-β overexpression flies but didn’t detect both ligand and receptor in control flies, the CCC score is increased by 1. FlyPhoneDB2 additionally enables users to estimate signaling activity by also taking into consideration the expression of downstream reporter genes (Qadiri et al., 2025).
“Improved cell-cell communication” is our interpretation based on the CCC analysis. It is important to note that the metric being used here (increased CCCs) is the number of predicted ligand-receptor interactions, and that our CCC analysis was based entirely on inferences from snRNA-seq data. We have added further clarification to our manuscript, which now further expands on the results of our CCC analysis (i.e., the increased expression for 61% and decreased expression for 39% of ligand-receptor pairs we observed in our DIP-β overexpression group, compared to our negative control), which ultimately led us to conclude that DIP-β overexpression is associated with improved cell-cell communication.
(2) The lifespan screen is central to the paper, and clearer visualization and contextualization of these results would significantly improve the manuscript's impact. For example, Figure 3D is challenging to interpret in its current form. More explicit presentation of which manipulations extend lifespan in each sex, along with effect sizes and significance values, would provide clarity. Including positive controls for lifespan extension would also help contextualize the magnitude of the observed effects. The reported effects of DIP-β, while promising, are modest relative to baseline effects of RU feeding, and a discussion of this would help appropriately calibrate the conclusions.
We appreciate the reviewer’s suggestion to improve the clarity of the lifespan screen results. We have significantly revised Figures 3D, 3E, and 3F to provide a more intuitive summary of the candidate gene manipulations. Figures 3D and 3E now explicitly include the effect sizes and p-values for each candidate gene, broken down by sex. We also added a new Figure 3G with a visual layout that has been streamlined to allow for quick identification of manipulations that successfully extended lifespan.
The reviewer raises an important point regarding the use of positive controls to calibrate the magnitude of lifespan extension. We carefully considered adding a standard control (such as Rapamycin treatment); however, we opted against it for several methodological reasons:
As noted in the literature, the magnitude of lifespan extension from standard controls can vary drastically depending on genetic background and lab environment. For instance, Rapamycin-induced extension ranges from ~10% (Schinaman et al., 2019), to over 80% (Landis et al., 2024). We felt that adding a single positive control might provide a false sense of "calibration" rather than a true universal benchmark.
To ensure the robustness of our findings, we instead employed a dual-validation strategy. We confirmed the lifespan-extending effects of our candidates using both traditional UAS:cDNA and CRISPR-based overexpression. The fact that two independent genetic systems yielded consistent results provides strong internal evidence for the reported effects.
We acknowledge that the effects of DIP-β are modest when compared to the baseline impact of RU486 feeding. We have added a section to the Discussion addressing this. While the effects are subtle, their reproducibility across different overexpression platforms suggests they are biologically relevant, even if they do not reach the dramatic shifts seen in some caloric restriction or drug-based models.
We have further addressed this in the results section.
(3) Several figures would benefit from improved labeling or more detailed legends. For instance, the meaning of "N" and "C" in Figure 1D is unclear; Figure 3A should clarify that Repo is a glial marker; and Figure 5C appears to have truncated labels. Reordering certain panels (e.g., moving control data in Figure 4A-B) may also improve narrative flow. These refinements would greatly aid reader comprehension.
We have modified and improved the labeling of these figures to increase the clarity. For Fig. 1D, we added the explanation to the Figure legends. In brief, in the Tandem Mass Tag (TMT) isobaric labeling system, 128N is one of many channels (126, 127N, 127C, 128N, 128C, etc.) used to index and compare up to 18 samples simultaneously, improving throughput and reducing missing values.
Fig. 3A has been updated to clarify that Repo is the glial marker. Fig. 4A-D have been reordered so that the DIP- β lifespan results are presented before the control lifespan, which hopefully improves the narrative flow of this figure. The Fig. 4 references in the manuscript have also been updated to match these changes. Additionally, Fig. 5C has been updated to include the truncated x-axis and y-axis labels.
(4) A few claims would be strengthened by more specific references or acknowledgment of alternative interpretations. Examples include the phenoxy-radical labeling radius, the impact of H₂O₂ exposure, and the specificity of neutravidin. Additionally, downregulation of synapse-related GO terms may reflect age-related transcriptional changes rather than impaired glia-neuron communication per se, and this possibility should be recognized. The term "unbiased" to describe the screen may also be reconsidered, given the preselection of candidate genes.
These are good suggestions. We have added references for the phenoxy-radical labeling radius (Durojaye, 2021), the impact of H₂O₂ exposure (J. Li et al., 2021), and the binding specificity of neutravidin (J. Li et al., 2021). We have also removed the term “unbiased” from our manuscript.
Regarding the request to further address the downregulation of synapse-related GO terms, we believe this indicates a lack of clarity on our part. We did not intend to suggest that our GO analyses, which were based on our proteomics data, were necessarily indicative of impaired neuron-glia communication. Our conclusions regarding altered neuron-glia communication have come from our later snRNA-seq data and analyses. Inspired by this comment, we agree that our differential gene analysis may reflect transcriptional changes rather than impaired glia-neuron communication. We have added such alternative interpretation.
(5) Clarifying the rationale for focusing on central brain glia over optic-lobe glia would be useful.
Agreed! As the intended focus of this study was the more general changes occurring during normal brain aging, we chose to focus on the central brain for our glial cell-surface proteomics, which is responsible for most of the brain’s higher order functions, including learning and memory, signal integration, behavior, etc. As the optic lobes account for approximately half of all neurons in the adult Drosophila brain and are specialized to process visual stimuli (Robinson et al., 2025), we were concerned that including the optic lobes in our glial cell-surface proteomics could strongly bias our findings towards age-related changes in visual function, rather than the more general changes we intended to focus on. Such clarification has been added to the results section (Quantitative comparison of young and old proteomes).
Recommendations for the authors:
Reviewer #1 (Recommendations for the authors):
(1) Line 62: Can the authors expand on "several changes"?
We have added a sentence expanding upon this in the manuscript draft.
(2) Line 137: Can the authors provide a reference for the phenoxyl radical half-life?
Thanks for catching this. We’ve added our reference for the phenoxyl radical half-life.
(3) Figure 1B: The authors state that neutravidin stained glia; however, there is no glial marker (e.g., anti-Repo) in this panel.
We acknowledge the reviewer’s point. The lack of anti-Repo staining in Figure 1B is due to the requirements of the Neutravidin-Alexa 647 detection method. Because this procedure bypasses traditional primary and secondary antibody incubation to preserve the biotin signal, co-staining with Repo was not technically feasible. Nevertheless, we utilized the Repo-GAL4 driver to express UAS-CD2-HRP; since this driver is well-documented and specific to glial cells, the Neutravidin signal serves as a functional readout of the targeted glial population.
(4) Line 254: There is no Figure 2D.
We’ve corrected this to Fig. 2C.
(5) Lines 390-396: No reference to the respective figures.
We’ve made a couple corrections to reference all the respective figures.
(6) Figure 5C: The X-axis is cut off.
This has been corrected.
Reviewer #2 (Recommendations for the authors):
Minor inconsistencies (e.g., figure references-line 254 references "Figure 2D" where none exists) should be corrected.
We’ve corrected this to Fig. 2C.
The typical course on programming teaches a “tinker until it works” approach. When it works, students exclaim “It works!” and move on.
La verdadera dificultad en programación no está en lograr que el programa funcione, sino en que el estudiante comprenda la lógica detrás del código. Si modifica una sola línea y todo se rompe, sin saber cómo repararlo, es señal de que aún no domina los fundamentos ni los buenos hábitos de programación. La práctica profesional no consiste únicamente en resolver un rompecabezas, sino en escribir código que pueda ser entendido y modificado por otros o incluso por uno mismo meses después sin causar errores. En realidad, la programación comienza cuando el código ya funciona: es entonces cuando debemos refinarlo, probarlo y comprenderlo a fondo.
Note: This response was posted by the corresponding author to Review Commons. The content has not been altered except for formatting.
Learn more at Review Commons
Reviewer #1 (Evidence, reproducibility, and clarity (Required)):
Summary: In this manuscript, the authors examine how peripherin-2 (PRPH2) contributes to the localization of CNGβ1 within rod outer segment structures. PRPH2 and its homolog ROM1 are structural components of rod discs and are required for disc morphogenesis. In the absence of PRPH2, rod outer segments do not form, and various outer segment materials accumulate and are released as cilia-derived ectosomes. PRPH2 is thought to be transported through an unconventional secretory pathway, whereas cGMP-gated channels follow a conventional trafficking route. Although these components reach the outer segment through distinct pathways, PRPH2 is necessary for the proper delivery of CNGB1, a subunit of the cGMP-gated channel, to its correct destination. It was previously reported that a small fraction of PRPH2 reaches the outer segments through the conventional pathway when it forms a complex with Rom1 in mouse photoreceptors. Using Rom1 KO mice, the authors show that this conventionally trafficked PRPH2 fraction is not required for CNGB1 transport to the outer segment. Using various chimeric constructs, the authors verified that tetraspanin core of PRPH2, delivered to the OS, is sufficient to promote OS localization of CNGB1. Ct and Nt cytoplasmic regions of PRPH2 are dispensable for the role. Overall, the majority of the experiments are well-executed with statistical rigor, written in a way that others can reproduce, and support the major conclusion indicated in the title, "PRPH2 is essential for OS localization of CNGB1".
Major comments: I believe that the majority of the conclusions are well-supported in this manuscript. Below, I am listing the major points that may need additional experiments or clarifications: 1) CNGA1 subunit is transported to and enriched within ciliary exosomes or the outer segment in PRPH2 deficient mice (Figure 1). The reduced levels of CNGA1 and CNGB1 in rds-/- mice suggest limited stability of these proteins. Their diminished abundance is also influenced by decreased mRNA expression of the corresponding genes. These findings imply that CNGB1 may not be essential for outer segment delivery of cGMP-gated channels if CNGA1 alone contains adequate targeting information. Related to these points, it is unclear whether CNGB1 exhibits a trafficking defect or encounters other problems before leaving the endoplasmic reticulum. Such problems may involve deficiencies in folding, holo-channel assembly, or related quality control processes.
RESPONSE: We agree with this reviewer and have added additional data and interpretation to address this point. Our new data finds that in fact a low level of CNGB1 can reach ectosomes in rds-/- rods, which makes sense since we and others had observed CNGA1 was present and we know that channel assembly occurs in the ER. This suggests that the CNG channel can properly fold and assemble. Furthermore, overexpressing CNGB1 did not restore ciliary localization in Rds-/-, leading to our interpretation that in the absence of an outer segment membrane compartment, there is no place to deliver the CNG channel and it is subsequently degraded. Apart from perihperin’s binding partner, ROM1, this is unique to the CNG channel. CNG channel subunits are still significantly lower at P21 than other outer segment membrane proteins, such as ABCA4 (shown here), rhodopsin, and PCDH21(shown elsewhere).
2) CNGB1 overexpression in rds-/- mice does not result in outer segment localization of CNGB1 channels (Figure 2A). These findings do not clarify whether CNGB1 successfully transits through the Golgi apparatus or associates properly with CNGA1 subunits. Elevating expression levels alone would not compensate for problems in folding or assembly.
RESPONSE: We recognize that our previous submission lacked clarity on this point. Therefore, we have restructured the order of figures and provided additional controls to improve our manuscript. First, the fact that CNG channel is present at P21 and even increases over time suggests that in rds-/- rods channel processing (folding and assembly) is unaffected. Second, we recognize that channel stoichiometry is important for proper channel assembly, so we added a new supplementary figure that shows endogenous CNGA1 expression increases in rds-/- rods that are overexpressing myc-CNGB1 and FLAG-peripherin-2. This adds credence to our CNGB1 overexpression experiments and shows that CNGB1 being trapped is not due to inefficient channel assembly.
3) Claims related to Figure 6 (P45 rds-/-) need further evidence. It remains uncertain whether CNGA1 and CNGB1 are delivered to lamellar ciliary membranes or to a distinct plasma membrane compartment comparable to that observed in wild type rod outer segments, or whether they accumulate in ciliary ectosomes. Those lamellar structures could be a part of cone outer segments. The observed GARP signal may originate solely from soluble GARP proteins. It is also unclear if CNGA1 and ROM1 colocalize in P45 rds-/- mice. Clarifying these points would strengthen the conclusion that lamellar formation, rather than specific function of PRPH2, is sufficient for CNGB1 delivery to the cilium or outer segment plasma membrane.
RESPONSE: CNGA1/B1 are not expressed in cones, so the elevated outer segment localization observed at P45 must be coming from rods. In mouse retina, cones make up only 3% of the photoreceptor population. The SEM data clearly show that the lamellar ciliary protrusions are present on the majority of the photoreceptors. We now include CNGB1 staining from Rds-/- P45 sections that corroborate these data and show that CNGB1 is present at P45 and not P21 (Supplemental Figure 2).
Below are minor comments: 1) The study does not establish whether a direct interaction between PRPH2 and CNGB1 is required for CNGB1 delivery to rod outer segments. Prior work by the senior author (ref 13) suggests that this interaction is not essential, since the PRPH2 binding site within the GARP domain is distinct from outer segment transport signal of CNGB1. Including a discussion of the PRPH2-GARP (or CNGB1) interaction and its relevance to CNGB1 trafficking would help readers interpret the findings more fully.
RESPONSE: We have included this in our discussion.
2) The authors propose that the ROM1 core is sufficient for outer segment delivery of CNGB1 based on experiments with chimeric constructs. However, in Figure 1, ROM1 is present in the outer segments (or ciliary ectosomes) of rds-/- mice even though CNGB1 is not delivered to these structures.
RESPONSE: Our new data, including MS analysis and Western analysis from an enriched ectosome preparation, reveal that, along with ROM1, low levels of the CNG channel are delivered to ciliary ectosomes in Rds-/- mice. However, at this early timepoint photoreceptor cilia do not produce a membrane protrusion, which we observe is required to augment CNG delivery. We expressed a FLAG-ROM1 construct to try to drive earlier creation of these membrane protrusions, but this was unsuccessful, as we observed ROM1 was primarily localized to the inner segment. This suggests that overexpression of ROM1 did not increase ROM1 delivery to the cilia. Luckily, we were able to overcome this bottleneck with several of our chimeric ROM1/Prph2 constructs that did localize to the cilia and restore CNG localization. All of these new results have been included in the revised manuscript.
3) Line 80: "Theouter" A space shall be inserted between "The" and "outer".
RESPONSE: Done
**Referee cross-commenting**
Both reviewer #2 and reviewer #3 express views that align with mine. They clearly described the study's limitations, and their comments are highly valuable.
Reviewer #1 (Significance (Required)):
Prior studies showed that CNGB1 is not present in cilia-derived ectosomes of rds-/- mice, indicating that PRPH2 is necessary for ciliary or outer segment localization of CNGB1 in rods. Building on these earlier findings, I consider this study significant for the following reasons: 1) Using detailed analysis of different PRPH2 domains and chimeric constructs, it clarifies that PRPH2 core region, delivered to OSs, is essential and sufficient for OS localization of CNGB1. 2) PRPH2 and CNGB1 are thought to travel through different post-ER transport routes, with one pathway bypassing Golgi regions and the other passing through them. This study shows that CNGB1 depends on PRPH2, which suggests that these two routes may converge or interact at later stages and opens new directions for future investigation. 3) The study is relevant to basic scientists and biologists investigating how membrane structures acquire specialized functions in neurons, and its implications extend beyond photoreceptor biology.
Limitation of the study: I believe that clarifying these points will make the manuscript more significant. 1) Is it not clear, as mentioned above, how PRPH2 contributes to the delivery of CNGB1 to the OSs in the different secretory pathways.
RESPONSE: In the absence of ROM1, Prph2 only travels through the unconventional secretory pathway directly from the ER. By looking at CNG trafficking and localization in ROM1-/- mice, we rule out the possibility that the small portion of PRPH2/ROM1 complexes that traffic conventionally through the Golgi are required for channel localization (Figure 3). Further, our Rho-Prph2 chimera that includes the trafficking signal from Prprh2 did not rescue CNGB1 localization (Figure 4). These findings suggest that it is unlikely that these proteins engage during secretory transport to the outer segment.
2) The prior study using a fluorescence complementation approach (Ritter et al, 2011) suggests that PRPH2 and CNGB1 can associate within rod ISs, likely before their delivery to OSs. However, it remains unclear whether this interaction supports the potential cotransport of CNGB1 and PRPH2 or whether the authors view these proteins as being transported independently.
RESPONSE: As described above, our experiments rule out the notion that co-transport through the Golgi is driving CNG channel ciliary localization. We now note in our discussion that this data does not rule out the possibility of an earlier association between these proteins. However, the bulk of our data supports that any early interaction is not required for ciliary delivery.
3) At the end of the result section (Figure 6, rds-/- P45), the authors suggest that lamellar formation (evaginations?) is required for CNGB1 transport. However, CNGB1 is normally not seen in evaginations or lamellar structures, and thus the assumption is not consistent with prior findings.
RESPONSE: Absolutely, we agree that the CNG channel does not enter newly forming disc membranes, which has been shown by multiple groups. We included this in our discussion and have now added a clearer statement of our hypothesis: “Together, these data suggest that the partitioning of disc membranes from the plasma membrane by tetraspanin proteins is a key step for localizing the CNG channel and could play a role in segregating other proteins into the plasma membrane.”
Overall, the manuscript is insightful and has the potential to advance our field and related disciplines.
RESPONSE: Thanks!
Reviewer #2 (Evidence, reproducibility and clarity (Required)):
Cyclic nucleotide gated channels (CNG) localize to the plasma membrane of the rod photoreceptor outer segments, and are a key component of the phototransduction cascade. Understanding how outer segment proteins are trafficked and sequestered to the outer segments is an important field of investigation as it addresses both a fundamental aspect of cell biology and mechanism of disease, many of which have trafficking defects at the core of the pathogenic process. Using primarily IHC analysis of rodent models in combination with introduction of various expression constructs to the retina (through electroporation), this study finds that two rod outer segment structural proteins, peripheral-2 and ROM1, facilitate CNG channel localization to the outer segment.
While this conclusion is interesting, a major concern that tempers enthusiasm is that in peripherin-2 null photoreceptors, there are no outer bona fide segments. In lieu of outer segments, there are rudimentary membranous protrusions and vesicles distal to the connecting cilia where outer segments should be. So the basis for concluding that peripherin-2 is required for CNG localization to the outer segment seems a bit wobbly. It is understood that the authors assumed the membranous materials distal to cilia as proxy for outer segments in their analysis and narrative. This assumption may have some merits. However, it is well known that when outer segment morphogenesis is severely compromised, all normally outer segment-bound proteins are ectopically localized or largely absent due to increased degradation. This could be simply due to the loss of their destination compartment, among other things. It is not clear how the authors could distinguish between a direct causal relationship where loss of one protein leads to the mislocalization of another, from secondary outcomes due to loss of the outer segments. The last sentence of the Abstract is telling. "Interestingly, this notion is supported by endogenous staining of CNGB1, which reappears in aged Rds-/- rods that have produced ciliary membrane protrusions." So in aged mice CNGB1 did localize to the OS, but what changed? There was more OS like material to house the CNGB1 protein in the aged mice.
RESPONSE: We agree that the loss of the OS compartment is likely driving downregulation of all OS proteins and have included a statement as such in our manuscript. We also performed additional qRT-PCR analysis on ROM1 and ABCA4 to show global downregulation at the mRNA level – consistent with the notion that there are reduced outer segment proteins when morphogenesis is compromised. However, our Westerns and IHC (as well as published data) clearly find a specific decrease in the CNG channel at the protein level, suggesting that not all proteins behave similarly when the outer segment is not formed. We included additional discussion on this point as well. While not directly examined in our manuscript, previous reports have shown the reverse effect: some outer segment proteins (e.g. PCDH21, Prom1) are upregulated in rds-/- retinas (Rattner et al JBC 2004). Therefore, it is an oversimplification to state that all outer segment proteins behave the same when outer segments are not formed properly. Other models of outer segment dysmorphia (e.g. RhoKO, PCDH21KO, Prom1KO, or WASF3) localize the CNG channel properly. We have added this to the discussion and hope that by restructuring our manuscript, we clearly outline that we do think that membrane retention at the tip of the cilia is driving CNG channel localization and that molecularly the tetraspanin proteins play a role in organizing these membranes.
Reviewer #2 (Significance (Required)):
Trafficking of nascent proteins to the outer segment in support of its renewal is an important subject, which has significant impact in understanding the mechanisms of retinal degeneration. The conclusion from this study, that peripherin-2 and ROM1 have a direct role in supporting CNG subunit trafficking may well be meritorious. However the data presented are less than fully convincing, and specifically the question of a direct vs secondary effect needs to be better addressed.
RESPONSE: We appreciate this reviewer’s enthusiasm for investigating this process. The initial premise of our study was to investigate whether a direct effect of peripherin-2 on CNG delivery was possible, which was meritorious based on previously published data. However, we now find no direct trafficking link between CNG and peripherin-2; instead, our data largely find that CNG delivery is dependent on the presence of retained membranes at the ciliary tip – either through natural mechanisms or by driving “rudimentary” outer segment membrane lamination by overexpression of tetraspanin domains. We have restructured the manuscript to help guide the discussion.
The following quote underpins some of the reasoning in the study. Lines 139-144, "(Figure 2A). This localization pattern suggests that the CNGB1 subunit is trapped in the biosynthetic pathway. In contrast, when FLAG-tagged rhodopsin is overexpressed in Rds-/- rods it traffics properly to outer segment ectosomes (Figure 2B, (19)). We posit that without proper exit from the biosynthetic pathway, the endogenous CNGB1 protein is rapidly degraded to undetectable levels, which we circumvent through overexpression. These data suggest the localization defect of CNGB1 in Rds-/- rods is in the trafficking of CNGB1. " This in my view is an over- interpretation of limited data. The statement implies that rhodopsin and CNGB1 qualitatively differ in their fate but I would argue that both proteins are heavily degraded intracellularly except more of rhodopsin escaped to the "OS" and shows up in IHC. In many rhodopsin mutant transgenic mice, mutant rhodopsin appeared in OS even though intracellular degradation (gumming up the system) is a major factor in the disease process. The claim "rhodopsin trafficked properly to outer segment ectosomes" is not grounded in solid data.
RESPONSE: We do fundamentally agree that the endogenous CNG channel is heavily degraded, which we confirm by overexpressing an exogenous CNGB1-myc and finding it trapped in the biosynthetic pathway. As stated by the reviewer, this localization pattern is in contrast to what we and others have observed for endogenous rhodopsin, and now show for overexpressed FLAG-rhodopsin – that rhodopsin does traffic to the OS ectosomes. By comparing the localization of both endogenous and overexpressed constructs (using the same promoter), we feel that our conclusion is well supported. We appreciate that our wording of “rhodopsin trafficked properly to the outer segment” is misleading, as traffic of membrane proteins in Rds-/- rods is generally affected and not “proper”. Importantly, we follow up this “limited data” with additional experiments showing that at high expression levels, we are unable to drive CNGB1 localization to OS ectosomes unless we co-express with a tetraspanin domain.
A further minor comment is that the scope of the study appear limited, with no attempted experiments on how these proteins might interact to effect facilitation of trafficking.
RESPONSE: Our approach was to be agnostic to the outcome of our hypothesis that peripherin-2 was directly involved in CNG channel trafficking. The experiments we performed to test this (ROM1-/- analysis and Prph2 C-terminal chimeras) did not support a role for peripherin-2 in CNG trafficking. Instead, our data support a model in which membrane retention and organization at the ciliary tip drives CNG channel delivery. We feel that our approach was not limited.
Reviewer #3 (Evidence, reproducibility and clarity (Required)):
in the gene encoding tetraspanin protein peripherin 2 (Prph2), i.e., Rds-/-, examining the requirements for various portions of the Prph2 protein in the context of an assortment of chimeric constructs expressed via transfection into photoreceptor cells, to restore localization of the beta subunit of the cyclic nucleotide-gated channel (CNGbeta1) to photoreceptor outer segments (OS) (in a small number of experiments) or, in the majority of experiments, to do so for a recombinant tagged version of this protein also overexpressed by transfection.
The concluding sentences of the Discussion, which summarize the major conclusions are as follows: "Our data clearly show that localization of the CNG channel is dependent upon peripherin-2 after biosynthetic exit, further suggesting that the necessary action is at the ciliary base. Supporting evidence for this comes from analysis of Rhodopsin knockout outer segments which have internal disc-like structures and localize CNG channel properly. Therefore, in the absence of a fully elaborated outer segment, peripherin-2's ability to delineate a disc is sufficient to drive CNG channel delivery. Together, these data suggest that the partitioning of disc membranes from the plasma membrane by tetraspanin proteins is a key step for trafficking the CNG channel and could play a role in segregating other proteins into the plasma membrane.
The first sentence contains both reasonable conclusions and phrases whose meaning is unclear or not supported by the results presented. The statement: 'localization of the CNG channel is dependent upon peripherin-2 is supported by the data but, of course, has long been known from previous studies of Rds-/- mice. What is meant by "...after biosynthetic exit..." is unclear. If, by this term, apparently newly invented, the authors mean "after its synthesis of the protein is complete," the statement is accurate, but also a truism.
RESPONSE: The absence of CNGB1 was reported in previous studies, but the mechanism driving its absence has not been investigated. In our resubmission, we have added additional data that now shows CNGB1 is present at very low levels in Rds-/- ectosomes but remains undetectable by IHC, which is consistent with previous studies mentioned by the reviewer, but is also a novel finding. Importantly, we find specific downregulation of CNG channel subunits in Rds-/- retinas compared to ABCA4, supported by Western blot analysis (Figure 1), and we investigate the mechanism driving this result.
We appreciate the reviewer pointing out that “biosynthetic exit” is a niche term not broadly understood. We have removed this statement.
The statement, "the necessary action is at the ciliary base," is NOT supported by the data presented, as the effect of the "successful" Prph2 constructs on CNGbeta1 localization is primarily to increase its levels at the distal end of cilia and at the base of OS-related structures formed in response to the presence of the Prph2 constructs. The restoration of these membranes, which, as the authors note, has been previously reported, is overwhelmingly the biggest effect of these constructs, and it could be argued that the restored localization, rather than degradation, of CNGbeta1 is merely a downstream consequence of the formation of these structures, with perhaps, an element of stabilization of CNGbeta1 toward degradation from direct binding to Prph2, which has also been previously reported.
RESPONSE: We agree with the reviewer. Our interpretation of our data is that the presence of Prph2 (or its variants) at the distal end of the cilia localizes CNGB1, likely due to the formation of outer segment membrane structures. Previous to this work, there was a possibility that targeting information of Prph2 was required for CNGB1. That had never been explored. We definitively rule this possibility out when we express the C-terminal tail of Prph2, which is unable to rescue CNGB1 localization. Because the tetraspanin domain of Prph2 (or ROM1) can localize CNGB1, we do agree that the definition of an outer segment structure is the driving force for CNGB1 delivery – these are new findings. We’ve restructured and added additional discussion to the manuscript to clarify this point.
The next suggested conclusion is, "Therefore, in the absence of a fully elaborated outer segment, peripherin-2's ability to delineate a disc is sufficient to drive CNG channel delivery," is partly accurate and partly misleading. If the word "localization" were to replace the term, "delivery," concerning which there are no data (aside from those confirming that Prph2 and CNGbeta1 pass through distinct secretory pathways), this statement would be an accurate summary.
RESPONSE: We have updated to “localization”, but the fact that we confirm these two proteins do not traffic together through the Golgi would suggest that delivery is independent of trafficking.
The final sentence, "Together, these data suggest that the partitioning of disc membranes from the plasma membrane by tetraspanin proteins is a key step for trafficking the CNG channel and could play a role in segregating other proteins into the plasma membrane," sentence, would also be accurate if the word "localization," were to replace the term, "trafficking." The key point for these qualifications is that the experiments presented measure steady state levels of CNGbeta1 constructs at certain locations, which are determined not only by rates of trafficking, but also rates of synthesis and degradation, and the data presented confirm that total levels of CNGbeta1 are greatly diminished in the absence of functional Prph2, rendering any conclusions about the relative roles of trafficking kinetics and degradation kinetics speculative in nature.
RESPONSE: We agree and have revised.
Aside from these major conceptual issues, there is one overriding technical question: why are almost all the experiments presented carried out with a highly over-expressed engineered version of CNGb1 with a tag, which is clearly context far from the physiological one, as opposed to examining redistribution of the endogenous CNGbeta1, which is of much greater interest. In some results relegated to a Supplemental figure (Supp. Fig. 2), the authors clearly demonstrate that sufficient signal can be obtained from immunofluorescence staining the endogenous proteins for such experiments to be readily interpretable. If the concern was cross-reactivity with non-covalently attached GARP proteins, a few experiments showing that similar results are obtained for immunostaining of the endogenous protein or of the tagged construct would haver been sufficient, and the paper could have had more physiological relevance and impact.
RESPONSE: We agree that endogenous CNG staining is important and valuable, which is why we included it in our manuscript. We were able to confirm that overexpressed CNG recapitulated the endogenous staining. We proceeded with analyzing overexpressed, tagged CNG for the reasons stated by the reviewer. Yes, cross-reactivity with soluble GARP proteins was one consideration, as was the fact that the GARP antibody is a mouse monoclonal antibody. Increased IgG due to inflammation in the RDS-/- model can obscure the outer segment region in these retinas, confounding our quantification. The tagged versions of CNGB1 and corresponding quantification offered the most clarity and continuity for the reader; therefore, we relegate the endogenous staining to the supplement.
The remaining concerns are generally of less significance and mostly conceptual or quite minor technical concerns. Technically, the imaging data and their quantification are of good quality and analyzed with reasonable rigor.
RESPONSE: Thanks!
Abstract: "In this study, we investigate how peripherin-2 is engaged in CNG channel delivery to the outer segment. Might this not be more a question of how the absence of properly formed discs impacts the formation of outer segments with plasma membranes surrounding the disks? Is this really a question of "delivery" or "lack of address to make the delivery"?
RESPONSE: Our interpretation of this comment is that it boils down to semantics. Delivery is inclusive of both trafficking and localization, which we investigate in our manuscript.
Page 3, "fluorescence complementation between peripherin-2 and CNGb1 in the inner segment of transgenic Xenopus rods (23) ". The wording is unclear. It should be stated clearly that they are describing results of "bimolecular fluorescence complementation assays" of highly overexpressed recombinant proteins expressed from transgenes.
RESPONSE: We have revised.
Page 4, "...trapped in the biosynthetic pathway," It is unclear what the authors mean by this phrase. Obviously, "biosynthesis," i.e., translation is indeed complete, but biochemical pathways are not places. Is the intention to suggest that post-translational processing, such as addition and editing of carbohydrate chains or assembly with the alpha subunit has not been completed? If so, it would be better just to say so clearly. Or, is it meant to imply that it is physically "trapped" in the ER and/or Golgi apparatus? In any case the meaning should be made clear. Co-staining with ER and Golgi markers would have been very informative with respect to the compartments in which the highly overexpressed recombinant protein is trapped.
RESPONSE: We acknowledge that our phrasing here was indirect. We have revised. Co-staining with Calnexin (an ER-marker) was attempted, but proved to be uninformative.
It should also be noted that accumulation of highly overexpressed membrane proteins within internal membranes and membrane aggregates is a very commonly observed experimental phenomenon, and not restricted to the highly specialized trafficking routes in photoreceptors.
RESPONSE: We agree that exogenous expression of membrane proteins can lead to increased presence within internal membranes of the inner segment, which we routinely see in our experiments. Importantly, our analysis is restricted to the ability of these exogenously expressed proteins to reach the ciliary compartment in Rds mice. We also conduct these experiments in wild-type retinas to ensure that our constructs are expressed, and the proteins reach the ciliary outer segment under normal conditions.
Page 4, " peripherin-2 facilitates trafficking of the CNGb1 subunit to the outer segment " The data presented to this point do not demonstrate an enhancement of transport, but only of steady-state levels. There is nothing to rule out the possibility that some beta subunit is trafficked in Rds-/-, but is unstable to degradation in the region near the cilium when peripherin-2 and outer segments are not available. An increase in transport is certainly a possible explanation for the results, but should not be taken as an unambiguous conclusion.
RESPONSE: We have altered the description of these results to allow for more interpretation of our data, which show that CNGB1 delivery to the outer segment is reduced in Rds-/- mice and enhanced when peripherin-2 is re-expressed.
Page 4, " We confirmed that the fraction of peripherin-2 that traffics conventionally through the Golgi is indeed absent in Rom1-/- retinas and found that trafficking of the CNG channel via the conventional pathway is unaffected (Figure 3A) . This is one of the stronger and more interesting results in this manuscript, and tilts the argument against trafficking as being the mechanism for enhancement by overexpressed peripherin-2 of beta subunit levels in the distal region of the photoreceptor layer.
RESPONSE: We agree.
Page 5, " Our finding that secretory trafficking of peripherin-2 and CNGb1 is distinct . Clumsy syntax- needs to be rewritten for clarity.
RESPONSE: Revised
Page 5, "two previously characterized fusion proteins... have been shown to localize to the outer segment and build a rudimentary membrane structure (19) " This previous result, which is critical to interpretation of the results in this manuscript, should be introduced early, before any experimental results using related constructs are presented, in order to avoid confusion.
RESPONSE: Prior to these experiments, we used only full-length peripherin-2, rhodopsin, or CNGB1. This paragraph is the first introduction of any chimeric protein, and we explain these two constructs thoroughly. We believe this satisfies this reviewer’s request.
Page 5, " We confirmed these data by staining for endogenous CNGb1 in Rds-/- rods electroporated with each construct (Supplemental Figure 2B,C) " This is the most informative result in this manuscript with regard to the ability of these constructs to restore proper localization of CNGB1- it is not clear that the overexpression constructs for CNGB1 present any advantage beyond stronger signal and they may not be assumed, a priori, to be faithfully reporting on interactions of Prph2 with endogenous CNGB1, which is the biologically significant question. A big problem with Supp. Fig. 2 is that there is no real control, i.e., one without any Prph2 construct electroporated. Even the Rho-Prph2CT construct has some ROS-related structures and some CNGB1 localized to the one shown at higher magnification. The Prph2-RhoCT construct seems to lead to a substantial increase in endogenous CNGB1 in inner segment membranes. This looks like a phenomenon that is potentially very interesting, although it doesn't fit with any of the models put forth in the manuscript.
RESPONSE: We agree that endogenous staining (shown in Supplemental Figure 3 of our revised manuscript) is informative, but it was technically challenging. Once we verified that our overexpression system recapitulated results for endogenous CNGB1, we went forward with the epitope-tagged CNGB1, which was clearer when quantifying CNGB1 localization to rudimentary outer segments.
Our electroporation method provides an excellent internal control, as all of the non-electroporated cells show no endogenous CNGB1 localization without peripherin expression (Sup Fig 3A).
Page 5, " cytosolic N- and C-termini of peripherin-2 are dispensable for CNGb1 outer segment localization " No- if you could simply remove them and get proper localization, that would show they are "dispensable." In these experiments they are always replaced with the corresponding region of some other protein that is localized to OS, or in one case, with 3 copies of the FLAG tag at the N-terminus. There are also clear differences in the efficacy of the different "successful" constructs, but these results and their implications are not really discussed.
RESPONSE: We make this statement in the context of these termini being dispensable to CNGB1 localization, not to peripherin-2’s stability, function, or localization. A complete truncation of either domain results in a non-functioning protein. Our supplemental data shows reduced expression with a truncated N-terminus, preventing analysis (Sup Fig 5C). The 3X-FLAG has no known function in the cell, and we believe it serves as a proxy for removing the N-terminus altogether. Removing the C-terminus would prevent proper outer segment targeting, which is key to determining how peripherin-2 impacts CNGB1 ciliary delivery. Replacing this C-terminus with an outer segment targeting domain from another protein is an established method of investigation.
Page 6, " We then wanted to determine whether the ROM1 tetraspanin region was sufficient to facilitate CNGb1 delivery by further replacing ROM1's cytoplasmic N-terminus with that of peripherin-2 (Prph2NT/CT-ROM1) . " This experiment obviously does NOT test "sufficiency" of the TM segments, as the construct has the termini replaced with the corresponding regions of Prph2, which might functionally substitute for the missing ROM1 regions.
RESPONSE: Our previous results had already ruled out a role for these termini in CNGB1 localization.
Page 6, " We show a dramatic increase in GARP staining in the aged Rds-/- retinal sections " The age dependence of this phenomenon is quite interesting and puzzling. Any thoughts on the mechanism?
RESPONSE: We agree that this natural process is very interesting. We have restructured the order of our figures and provided additional controls to support this finding. We have added this to the discussion and hope that by restructuring our manuscript, we clearly outline that we do think that membrane retention at the tip of the cilia is driving CNG channel localization and that molecularly the tetraspanin proteins play a role in organizing these membranes.
Page 6, " Although CNGα1, known to form homotetramers, can localize to the extracellular vesicles released into the outer segment area. " Not a sentence.
RESPONSE: Revised
Page 6, " Our data now shows that the population of peripherin-2 in complex with ROM1 that travels through the conventional trafficking pathway does not play a role in CNGb1 localization to the outer segment. " This is an oddly accurate, albeit somewhat contradictory sentence. Yes, you have failed to answer the question you claim this work was designed to address. Apart from this negative result, nothing is learned about trafficking, per se, from the experiments in this manuscript.
RESPONSE: Please see our response to the reviewer’s comment above that clarifies our thinking regarding our results on trafficking.
Page 7, " anticipated " Hopefully, the authors mean to say, "hypothesized," here.
RESPONSE: Revised
**Referee cross-commenting**
My impression from reading the reviewers' comments is that there is general agreement on both the strengths and the limitations of this work. In my opinion, the issues raised by the reviewers could be addressed by editing the manuscript to be more circumspect in drawing definite conclusions from data that are not fully conclusive, without necessarily adding new experiments.
Reviewer #3 (Significance (Required)):
This study addresses a problem of great interest in the photoreceptor field and in cell biology more generally of trafficking and localization of specialized membrane proteins to specialized ciliary membranes. The strengths are technical quality of data with good controls, in most cases. The limitations are largely conceptual in nature and derive from the rather simplistic approach to the experimental design, as described above. The rather dated, "mix and match" approach based on chimeric construct with pieces of sequences removed and replaced at will does not properly account for the conclusion reached many times from many experiments, including some this manuscript, that the "roles" of stretches of amino acid sequence depend exquisitely on the multidimensional context in which they are tested, not simply on their position in the linear sequence. The paper presents interesting and convincing results with respect to functional requirements for formation disc-like membranes, but very little with respect to 'trafficking."
Note: This preprint has been reviewed by subject experts for Review Commons. Content has not been altered except for formatting.
Learn more at Review Commons
in the gene encoding tetraspanin protein peripherin 2 (Prph2), i.e., Rds-/-, examining the requirements for various portions of the Prph2 protein in the context of an assortment of chimeric constructs expressed via transfection into photoreceptor cells, to restore localization of the beta subunit of the cyclic nucleotide-gated channel (CNGbeta1) to photoreceptor outer segments (OS) (in a small number of experiments) or, in the majority of experiments, to do so for a recombinant tagged version of this protein also overexpressed by transfection.
The concluding sentences of the Discussion, which summarize the major conclusions are as follows: "Our data clearly show that localization of the CNG channel is dependent upon peripherin-2 after biosynthetic exit, further suggesting that the necessary action is at the ciliary base. Supporting evidence for this comes from analysis of Rhodopsin knockout outer segments which have internal disc-like structures and localize CNG channel properly. Therefore, in the absence of a fully elaborated outer segment, peripherin-2's ability to delineate a disc is sufficient to drive CNG channel delivery. Together, these data suggest that the partitioning of disc membranes from the plasma membrane by tetraspanin proteins is a key step for trafficking the CNG channel and could play a role in segregating other proteins into the plasma membrane.
The first sentence contains both reasonable conclusions and phrases whose meaning is unclear or not supported by the results presented. The statement: 'localization of the CNG channel is dependent upon peripherin-2 is supported by the data but, of course, has long been known from previous studies of Rds-/- mice. What is meant by "...after biosynthetic exit..." is unclear. If, by this term, apparently newly invented, the authors mean "after its synthesis of the protein is complete," the statement is accurate, but also a truism. The statement, "the necessary action is at the ciliary base," is NOT supported by the data presented, as the effect of the "successful" Prph2 constructs on CNGbeta1 localization is primarily to increase its levels at the distal end of cilia and at the base of OS-related structures formed in response to the presence of the Prph2 constructs. The restoration of these membranes, which, as the authors note, has been previously reported, is overwhelmingly the biggest effect of these constructs, and it could be argued that the restored localization, rather than degradation, of CNGbeta1 is merely a downstream consequence of the formation of these structures, with perhaps, an element of stabilization of CNGbeta1 toward degradation from direct binding to Prph2, which has also been previously reported.
The next suggested conclusion is, "Therefore, in the absence of a fully elaborated outer segment, peripherin-2's ability to delineate a disc is sufficient to drive CNG channel delivery," is partly accurate and partly misleading. If the word "localization" were to replace the term, "delivery," concerning which there are no data (aside from those confirming that Prph2 and CNGbeta1 pass through distinct secretory pathways), this statement would be an accurate summary. The final sentence, "Together, these data suggest that the partitioning of disc membranes from the plasma membrane by tetraspanin proteins is a key step for trafficking the CNG channel and could play a role in segregating other proteins into the plasma membrane," sentence, would also be accurate if the word "localization," were to replace the term, "trafficking." The key point for these qualifications is that the experiments presented measure steady state levels of CNGbeta1 constructs at certain locations, which are determined not only by rates of trafficking, but also rates of synthesis and degradation, and the data presented confirm that total levels of CNGbeta1 are greatly diminished in the absence of functional Prph2, rendering any conclusions about the relative roles of trafficking kinetics and degradation kinetics speculative in nature.
Aside from these major conceptual issues, there is one overriding technical question: why are almost all the experiments presented carried out with a highly over-expressed engineered version of CNGb1 with a tag, which is clearly context far from the physiological one, as opposed to examining redistribution of the endogenous CNGbeta1, which is of much greater interest. In some results relegated to a Supplemental figure (Supp. Fig. 2), the authors clearly demonstrate that sufficient signal can be obtained from immunofluorescence staining the endogenous proteins for such experiments to be readily interpretable. If the concern was cross-reactivity with non-covalently attached GARP proteins, a few experiments showing that similar results are obtained for immunostaining of the endogenous protein or of the tagged construct would haver been sufficient, and the paper could have had more physiological relevance and impact.
The remaining concerns are generally of less significance and mostly conceptual or quite minor technical concerns. Technically, the imaging data and their quantification are of good quality and analyzed with reasonable rigor.
Abstract: "In this study, we investigate how peripherin-2 is engaged in CNG channel delivery to the outer segment. Might this not be more a question of how the absence of properly formed discs impacts the formation of outer segments with plasma membranes surrounding the disks? Is this really a question of "delivery" or "lack of address to make the delivery"?
Page 3, "fluorescence complementation between peripherin-2 and CNG1 in the inner segment of transgenic Xenopus rods (23) ". The wording is unclear. It should be stated clearly that they are describing results of "bimolecular fluorescence complementation assays" of highly overexpressed recombinant proteins expressed from transgenes.
Page 4, "...trapped in the biosynthetic pathway," It is unclear what the authors mean by this phrase. Obviously, "biosynthesis," i.e., translation is indeed complete, but biochemical pathways are not places. Is the intention to suggest that post-translational processing, such as addition and editing of carbohydrate chains or assembly with the alpha subunit has not been completed? If so, it would be better just to say so clearly. Or, is it meant to imply that it is physically "trapped" in the ER and/or Golgi apparatus? In any case the meaning should be made clear. Co-staining with ER and Golgi markers would have been very informative with respect to the compartments in which the highly overexpressed recombinant protein is trapped. It should also be noted that accumulation of highly overexpressed membrane proteins within internal membranes and membrane aggregates is a very commonly observed experimental phenomenon, and not restricted to the highly specialized trafficking routes in photoreceptors.
Page 4, " peripherin-2 facilitates trafficking of the CNG1 subunit to the outer segment " The data presented to this point do not demonstrate an enhancement of transport, but only of steady-state levels. There is nothing to rule out the possibility that some beta subunit is trafficked in Rds-/-, but is unstable to degradation in the region near the cilium when peripherin-2 and outer segments are not available. An increase in transport is certainly a possible explanation for the results, but should not be taken as an unambiguous conclusion.
Page 4, " We confirmed that the fraction of peripherin-2 that traffics conventionally through the Golgi is indeed absent in Rom1-/- retinas and found that trafficking of the CNG channel via the conventional pathway is unaffected (Figure 3A) . This is one of the stronger and more interesting results in this manuscript, and tilts the argument against trafficking as being the mechanism for enhancement by overexpressed peripherin-2 of beta subunit levels in the distal region of the photoreceptor layer.
Page 5, " Our finding that secretory trafficking of peripherin-2 and CNG1 is distinct . Clumsy syntax- needs to be rewritten for clarity.
Page 5, "two previously characterized fusion proteins... have been shown to localize to the outer segment and build a rudimentary membrane structure (19) " This previous result, which is critical to interpretation of the results in this manuscript, should be introduced early, before any experimental results using related constructs are presented, in order to avoid confusion.
Page 5, " We confirmed these data by staining for endogenous CNG1 in Rds-/- rods electroporated with each construct (Supplemental Figure 2B,C) " This is the most informative result in this manuscript with regard to the ability of these constructs to restore proper localization of CNGB1- it is not clear that the overexpression constructs for CNGB1 present any advantage beyond stronger signal and they may not be assumed, a priori, to be faithfully reporting on interactions of Prph2 with endogenous CNGB1, which is the biologically significant question. A big problem with Supp. Fig. 2 is that there is no real control, i.e., one without any Prph2 construct electroporated. Even the Rho-Prph2CT construct has some ROS-related structures and some CNGB1 localized to the one shown at higher magnification. The Prph2-RhoCT construct seems to lead to a substantial increase in endogenous CNGB1 in inner segment membranes. This looks like a phenomenon that is potentially very interesting, although it doesn't fit with any of the models put forth in the manuscript.
Page 5, " cytosolic N- and C-termini of peripherin-2 are dispensable for CNG1 outer segment localization " No- if you could simply remove them and get proper localization, that would show they are "dispensable." In these experiments they are always replaced with the corresponding region of some other protein that is localized to OS, or in one case, with 3 copies of the FLAG tag at the N-terminus. There are also clear differences in the efficacy of the different "successful" constructs, but these results and their implications are not really discussed.
Page 6, " We then wanted to determine whether the ROM1 tetraspanin region was sufficient to facilitate CNG1 delivery by further replacing ROM1's cytoplasmic N-terminus with that of peripherin-2 (Prph2NT/CT-ROM1) . " This experiment obviously does NOT test "sufficiency" of the TM segments, as the construct has the termini replaced with the corresponding regions of Prph2, which might functionally substitute for the missing ROM1 regions.
Page 6, " We show a dramatic increase in GARP staining in the aged Rds-/- retinal sections " The age dependence of this phenomenon is quite interesting and puzzling. Any thoughts on the mechanism?
Page 6, " Although CNGα1, known to form homotetramers, can localize to the extracellular vesicles released into the outer segment area. " Not a sentence.
Page 6, " Our data now shows that the population of peripherin-2 in complex with ROM1 that travels through the conventional trafficking pathway does not play a role in CNG1 localization to the outer segment. " This is an oddly accurate, albeit somewhat contradictory sentence. Yes, you have failed to answer the question you claim this work was designed to address. Apart from this negative result, nothing is learned about trafficking, per se, from the experiments in this manuscript.
Page 7, " anticipated " Hopefully, the authors mean to say, "hypothesized," here.
Referee cross-commenting
My impression from reading the reviewers' comments is that there is general agreement on both the strengths and the limitations of this work. In my opinion, the issues raised by the reviewers could be addressed by editing the manuscript to be more circumspect in drawing definite conclusions from data that are not fully conclusive, without necessarily adding new experiments.
This study addresses a problem of great interest in the photoreceptor field and in cell biology more generally of trafficking and localization of specialized membrane proteins to specialized ciliary membranes. The strengths are technical quality of data with good controls, in most cases. The limitations are largely conceptual in nature and derive from the rather simplistic approach to the experimental design, as described above. The rather dated, "mix and match" approach based on chimeric construct with pieces of sequences removed and replaced at will does not properly account for the conclusion reached many times from many experiments, including some this manuscript, that the "roles" of stretches of amino acid sequence depend exquisitely on the multidimensional context in which they are tested, not simply on their position in the linear sequence. The paper presents interesting and convincing results with respect to functional requirements for formation disc-like membranes, but very little with respect to 'trafficking."
Section 3 — Scope (a) This Bylaw applies to playable canon races — species that members may use to create characters. (b) It does not apply to temporary NPC races created for plot purposes, which commanding officers may introduce at their discretion. Section 4 — Process (a) A proposal for a new race is submitted to the Captains Council with supporting documentation (species profile, biology, culture, etc.). (b) The CC votes under the standard procedures in Bylaw 1. The proposal passes by simple majority. (c) Approved races are added to the community’s official species registry.
I'd like some clarity around what happens with species when they are created as NPC races initially and then tagged with a TBD / Non-Reviewed Species tag for the ILI.
Is the process to go from a species introduced in our game's canon (for NPCs), to TBD / Non-Reviewed, to anything else (e.g. Permitted, Restricted, Forbidden) the one outlined here?
What about the process for a canon (from the shows) species to go from TBD / Non-Reviewed to, say, Restricted or Forbidden - does that go through this same voting process?
Finally, should we not perhaps codify in the bylaws our species review process (i.e. proposal, 7 day wait, if no veto it's approved, etc)?
On 2025-02-18 16:22:01, user Anonymous wrote:
Dear authors,<br /> as a part of a group activity in our lab we discussed your very interesting manuscript with the goal of reviewing it as well as improving our reviewing skills. The below review is the result of this exercise and reflects thoughts and comments of several people. We hope this helps you with your way forward to publish the paper in a good journal.
Summary<br /> The manuscript by Cresto et al. addresses an important question concerning the contribution of astrocytic defects in oligophrenin-1 (Ophn1) deficiency in intellectual disability. Ophn1 is highly present at synapses and regulates the RhoA/ROCK/MLC2 pathway through its RhoGAP domain, having an important role in cytoskeleton remodelling. Previous work from the authors of this manuscript reported that constitutive Ophn1 knockout mice show deficits in synaptic transmission and plasticity, due to pre-synaptic dysfunction. Moreover, Ophn1 deficient astrocytes from those mice also display altered morphology resulting from hyperactivation of the RhoA/ROCK/MLC2 pathway. <br /> This study examines the impact of astroglial Ophn1 deficiency on synaptic transmission, plasticity, and spatial memory using a conditional, localized, and AAV-inducible approach. The researchers selectively disrupt Ophn1 in adult hippocampal astrocytes and assess astrocyte morphology, synaptic coverage, and explore two key molecular mechanisms: adenosine A1 receptor signaling and the RhoA/ROCK signaling pathway.<br /> A strength of this study is the comparison between the conditional knockdown and the constitutive KO model, which helps to confirm that some of the observed effects are specifically due to the presence of the protein in astrocytes. However, a potential weakness is that in some cases, the targeting may not have been sufficient to fully isolate the astroglial pathway, leaving room for contributions from other cell types or compensatory mechanisms.<br /> Another strength of this study is the comprehensive approach taken to investigate the effects of oligophrenin deficiency in astrocytes, encompassing behavioral experiments, electrophysiology, cellular morphology, and molecular pathways. However, the molecular pathway analysis remains incomplete, leaving some mechanistic aspects unresolved.<br /> One limitation of this study is the exclusive use of adult mice and mature astrocytes to investigate a neurodevelopmental disorder, which may not fully capture the relevant developmental mechanisms. Additionally, all experiments were conducted in murine astrocytes, with no validation in human cell lines, raising questions about the translatability of the findings.
Major Comments<br /> 1. KDastro and KDneuro verification would benefit from additional protein-level quantifications in a Western Blot or immunostaining, e.g. by using directly an anti-oligophrenin antibody or an anti-FLAG-tag antibody.<br /> 2. The measurements of alternations in the Y maze test could be described in more detail. This specific test relies on the difference between entries into consecutive different arms (i.e. ABC) and into the same arm (i.e. ABB). In the methods section, it is not completely clear if the authors discriminate between these two parameters and how they defined the "ABB" alternation. Authors could also introduce the different percentages (consecutive vs. same) into the graph to give a clearer picture of the phenotype.<br /> 3. In addition, the statement that spatial working memory is abolished results a little extreme from only these experiments. It could be defined as impaired or reduced.<br /> 4. Authors claim a reduction in presynaptic release probability, yet the first peak in Fig. 1d is similar for both WT and KDastro. The authors should clarify in the text what they mean by this statement, and how they interpret it from the data. If they mean to imply that there are more presynaptic vesicles, which are released at a lower probability, it would be good to quantify presynaptic vesicle numbers, for instance using EM.<br /> 5. Authors conclude that KDastro neurons show an increase in the activation of adenosine A1 receptors yet they don't validate this phenotype. In Fig.2, it is not clear if the effect of 8-CPT is rescuing the phenotype in KDastro neurons or simply acting on receptor activation as for WT neurons. In the full Ophn1 KO model, neurons are lacking Ophn1, unlike KDastro neurons which still express the protein. Can the authors investigate deeper on the activation of the A1 receptors in KDastro? They could assess cAMP levels via cAMP sensors (i.e. FRET-based cAMP sensors) and PKA activation by immunoblotting for its phosphorylated substrates. In addition, they could also measure adenosine release from Ophn1-KD astrocytes. This could help to define the molecular mechanism supporting the electrophysiological observations.<br /> 6. ROCK inhibitor treatment in the slices is only 20 min. Is this timeframe sufficient to induce morphological changes in the astrocytes? It would be more convincing if a corresponding actin staining was provided.<br /> 7. When ROCK is inhibited, it affects both neurons and astrocytes. Can authors discriminate that the observed neuronal effects are specifically due to ROCK inhibition in astrocytes, rather than direct effects on neurons? This is particularly relevant since ROCK inhibition is expected to mimic the presence of Ophn1, potentially rescuing the astrocytic Ophn1 deficiency.<br /> 8. For both inhibitors (8CPT and Y27632) they don’t validate that in fact inhibition works effectively and that they only target their protein of interest. They could validate this by immunoblotting downstream targets of the adenosine A1 receptor and ROCK, but also potential other off-targets that could be inhibited, like PKC in the case of Y27632.<br /> 9. “Increased branching complexity” only occurs at one specific distance of 25 microns (Fig 3.d). Generalization of this one measurement seems an overstatement.<br /> 10. Assessment of true morphology of tripartite synapses in Ophn1 KDastro can be further investigated with electron microscopy. This can help to better evaluate changes in plasma membrane and cell boundary morphology on synapses.<br /> 11. Paper would greatly benefit from an illustration of a suggested molecular mechanism.
Minor Comments<br /> 1. What is “CD8” for on figure 1b.? <br /> 2. It is not clear what “py” stands for in Fig. 1 d and f.<br /> 3. In figure 1e and 1g it is unclear how the quantification was done.<br /> 4. Figure 3, 4 and 5a-d lack information on the # of mice that were assessed, only the # of astrocytes is reported.<br /> 5. Red and dark red colouring in Fig. 5 are very hard to discern. Authors should consider other colour schemes. <br /> 6. Manuscript would benefit from describing 8CPT and Y27632 functions in the results section.<br /> 7. WT control is missing in Fig. 5e.
On 2020-12-02 15:40:43, user Ryan wrote:
NE 598 Group 2<br /> Social isolation impairs the prefrontal-nucleus accumbens circuit subserving social recognition in mice. https://doi.org/10.1101/202...<br /> Ryan Senne, Evan Mackie, Patlapa Sompolpong, Anthony Khoudary
Introduction
We are a group of Boston University students enrolled in a course focused on understanding neural circuits, including cortical information processing, guided behavior and cognition. To further engage with current research in the field and to gain experience in the process of peer-review, we present the following critique of the currently unpublished manuscript from Park et al. posted on biorxiv.org on November 12, 2020.
Summary <br /> The medial prefrontal cortex (mPFC) has been shown to activate in response to social behaviors in both humans and rodents. Recent studies have revealed a corticothalamic circuit affected by social isolation; however, whether social isolation affects mPFC projections to other subcortical regions involved in social behaviors remains unclear. To this end, Park et al. investigate the role of projections from the mPFC to the nucleus accumbens shell (NAcSh) in the social recognition deficit observed in mice following social isolation. Through retrograde viral tracing, electrophysiological, chemogenetic and behavioral experiments they identified a novel circuit projecting from the prefrontal infralimbic cortex (IL) to the NAcSh affected by early social isolation. They found IL neurons to have decreased excitability in single housed (SH) mice compared to normally group housed (GH) mice. NAcSh-projecting IL neurons were activated when the GH mice interacted with a familiar mouse, but this activation was not observed in SH mice. Furthermore, inhibition of IL neurons in GH mice impaired social recognition without affecting social interaction in GH mice. Similarly, activation of IL neurons rescued social recognition in SH mice. These findings corroborate the social recognition defects observed in models of ASD and schizophrenia, which may reflect problems in human patients. Overall we recommend comparison of results to data collected before the re-socialization period, non-parametric data analysis and improved IHC imaging. Additionally, we recommend consistency between figures in the manuscript and the extended data, alternative anxiety measurements and in vivo electrophysiology recordings. We believe these recommendations will strengthen the argument for the role of this novel circuit subserving social recognition.
Figure 1 serves to establish the experimental timeline and demonstrate the social recognition deficit induced by social isolation. Mice were housed either singly or in groups for 8 weeks post weaning. SH mice were then regrouped for 4 weeks with their littermates. At the end of this 12-week period, experiments were conducted. Mice from both cohorts were subjected to three chamber tests assessing social preference and social recognition. Both GH and SH mice spent significantly more time with a novel mouse than an inanimate plastic mouse; indicating no change in social preference due to isolation (Fig. 1c). GH mice spent significantly more time with a novel mouse compared to a familiar one in the social recognition test. Constratingly, SH mice spent comparable time with both the novel and familiar mouse suggesting a deficit in social recognition (Fig. 1d). Both cohorts showed no significant deficits in general recognition memory or hippocampal dependent memory (Fig. 1e, f). SH and GH mice also showed similar body mass changes, basal locomotor activity and anxiety levels (Extended Data Fig. 1).
The authors hypothesized that projections from mPFC to NAcSh may be involved in social recognition. To test this the authors injected a retrograde enhanced green fluorescent protein (eGFP) virus into the NAcSh. Neurons in the deep layer of the IL were heavily labeled with eGFP. There was a significant difference in the number of eGFP+ cells in the IL compared to the PL (Fig. 2b). This observation led the authors to focus their study on mPFC-IL projections. Ex vivo brain slice whole cell patch clamp recordings revealed a significant decrease in excitability of NAcSh-projecting mPFC IL neurons in SH mice compared to GH mice (Fig. 2c). This decrease in excitability was not observed in mPFC PL projections to NAcSh, suggesting cell specific modulation of this circuit by social isolation (Fig. 2d). Other electrophysiological properties of NAcSh projecting IL/PL neurons were similar in both GH and SH mice (Extended Data Fig. 4).
The goal of the next experiment was to determine if IL-NAcSh projections were activated by familiar mice in a different behavioral paradigm. Mice from both cohorts were habituated to a target mouse (Fig 3a). Interestingly, both GH and SH mice spent significantly less time interacting with the target mouse on consecutive social habituation trials (Fig. 3b). In the social recognition test SH mice again spent comparable time interacting with both novel and familiar mice, indicating the social recognition deficit (Fig 3c). Post mortem slice histology was used to quantify the activity of IL-NAcSh projections in response to a familiar or novel mouse. A retrograde eGFP virus was injected into NAcSh in both GH and SH mice; eGFP+ cells co-labeled with c-Fos staining were used as a proxy for activation of this circuit (Fig. 3d, e). Quantification of this labeling revealed that GH mice had a significant increase in the ratio of c-Fos+/eGPF+ cells after interacting with a familiar mouse compared to a novel mouse (Fig. 3f). This increase in activity was not observed in SH mice, supporting the claim that this circuit is activated by a familiar conspecific.
To confirm the findings in Fig. 3, the authors conducted chemogenetic experiments in normal GH mice. A retrograde eGFP-Cre virus was injected into the NAcSh and a Cre dependent hM4Di receptor virus or mCherry control vector was injected into the IL (Fig. 4a, b). Intraperitoneal injection with CNO confirmed the inhibitory effect of hM4Di (Fig, 4d). Mice were then subjected to the social preference and social recognition tests following CNO injection. Inhibition of IL-NAcSh projections did not affect social preference, but did result in a significant decrease in social recognition (Fig. 4e, f). To further investigate this effect, mice were subjected to the social recognition test with the choice between a cage mate (in place of a target mouse) and a novel mouse. When IL neurons were inhibited, mice were unable to distinguish their cage mate (Extended Data Fig. 5). These findings support the claim that activation of this IL-NAcSh circuit is necessary for social recognition.
In an attempt to solidify this claim, further chemogenetic experiments were conducted in SH mice. The previously mentioned experimental approach was used; however, a Cre dependent hM3Dq or mCherry control vector injected into the IL (Fig. 4a, b, c). CNO injections confirmed the activation of IL neurons (Fig 4d). Activation of IL-NAcSh projections did not affect social preference but did rescue social recognition (Fig. 4e, f). These findings demonstrated that activation of this IL-NAcSh circuit is both necessary and sufficient for social recognition.
Major Criticisms
The authors claim that regrouping SH mice in the model is insufficient to rescue social recognition. White the first experiment showed that SH mice spent relatively similar time with both the novel and familiar mouse, suggesting a social recognition deficit, all behavior tests were done following resocialization of SH mice (Fig. 1d). Adding another SH cohort without resocialization prior to administering behavioral tests would be beneficial to determine whether there is a significant change between the performance of regrouped SH mice and non-regrouped SH mice.
In the second experiment, the authors found the projections from the prelimbic cortex (PL) to the NAcSh to have less neuronal density when compared to IL-NAcSh projections, therefore decided to conduct subsequent experiments only looking at the IL (Fig. 2b). Relatively less dense neuronal density in the PL does not equate to low activity in the PL and is not sufficient to rule out the role of the PL in social behavior, especially because previous papers have found projections from the PL to contribute to social behavior. There was no information on how eGFP-positive cells in the IL and PL were quantified. The cell numbers in the IL and PL were compared using an unpaired t-test, however, the IL cells appear to have a normal distribution while the PL cells do not. Using a parametric test may therefore be inappropriate for comparing the two populations. In Figure 2, there was also minimal physiological data to confidently conclude that excitability in the IL of SH mice is significantly reduced (Fig. 2c). Incorporating in vivo data would be beneficial.
In the third experiment, c-Fos immunohistochemistry was performed as a proxy of recent synaptic activity. The ratio of quantified c-Fos+ cells in the IL to GFP+ cells was used to prove that GH mice show a significant increase in c-Fos positive NAcSh-projecting IL neurons while encountering familiar conspecifics. The method behind quantifying the overlaps are unclear in the paper. The major issue with this approach is that separately quantifying c-Fos+ cells and comparing it to the quantified number of GFP+ cells is that there is a possibility that there are quantified neurons that are not co-labeled with c-Fos and GFP. A one-way ANOVA and Tukey's multiple comparisons test was used to analyze the data, however, all of the data does not appear to follow a normal distribution (Fig. 3f).
Apart from data in Figures 2 and 3 that are not appropriate for parametric statistical tests, data from other figures such as Figure 1 exhibit a binomial distribution and also do not fit the criteria for parametric tests (Fig. 1c). The distribution of the data in all experiments should be taken into consideration when running analyses <br /> While the viral stain in Figure 2 appears to be non-nuclear, the stains in Figures 4 and 5 appear to be nuclear (Fig. 2a; Fig. 4b; Fig.5b). It would be more standard to use the same virus for labeling throughout the experiments. The figures state that a retrograde adeno-associated virus (AAVrg) expressing eGFP was used, but the expression patterns are not consistent with this.
Minor Criticisms <br /> Many of the summary bar graphs in the figures have error bars that are obscured by the individual data points, specifically figures 3b and 3f, 4e and 4f, and 5e and 5f. Changing the color of the error bars would help with better visualization of the data and its distribution. Additionally, in figure 1b and all three chamber tests, it would be worth noting whether or not the tests were counterbalanced with the stimulus mice in different chambers. This would control for the SH mouse simply memorizing the location of a preferred stimulus rather than true social recognition or preference.
In the first experiment, it would have been worth titrating the length of juvenile isolation in order to find the critical period where its effect is strongest. The referenced paper determined 8 weeks to be effective, but an experiment to prove that 8 weeks is ideal would have been beneficial to the study as a whole. Another useful tool would have been in-vivo electrophysiology to selectively measure activity in IL-NAcSh projecting neurons during socialization and confirm the results shown by the c-Fos immunohistochemistry. Optogenetics also could have been used to measure social preference or recognition during the inhibition of these IL-NAcSh projections.
Merits <br /> The panels in Figure 1 are incredibly well made and very easily communicate the experiments and data. The heatplots used throughout the paper are incredibly parsimonious in their representation.The novel object and object place controls on the three-chamber test often get ignored so this experiment was very well controlled. <br /> The behavioral schedule in Figure 3 is incredibly erudite and can be recycled by other researchers for these types of experiments. <br /> One of the biggest mishaps in chemogenetic experiments is a lack of proper controls. The researchers were incredibly thorough in their DREADD’s experiemnts and included all the necessary control groups including CNO in WT mice and using a saline vehicle in a DREADD injected animal. This type of comprehensive experimental schedule ensures that the data has a considerable level of confidence attached to it.
In the supplemental figures the authors chose to include several controls which are necessary for the confidence of their results. Their inclusions of anxiety controls, often overlooked electrophysiology metrics, object controls, and cagemate controls inspires confidence in the results. Overall, a very well controlled paper.
Future Directions <br /> One of the most important future experiments could involve dissecting between cell subtypes within the IL. A recent paper has shown that somatostatin interneurons house social memory within the PL and such cells could be necessary and sufficient for proper memory expression. The authors coils also determine the receptor subtypes the pyramidal neurons they focused on contained. For example, a recent article showed that Pl neurons which projected to the NAc shell were D1R+ and it would be interesting to see if similar neurotransmitter systems were prevalent in both mPFC areas.
With respect to Figure 2, outside of the IL, the PL, and vCA1 have also been shown to be necessary for the expression of proper social cognition and behavior. These other areas have been shown to project tohe NAc shell. A follow up study that highlighted the unique contributions of these distinct areas and how possible neural circuitry links them together would be a valuable funding for the social neuroscience community. The electrophysiology in this figure is solid from a technical standpoint but whether this difference in excitability translates to meaningful behavioral phenotypes isn’t characterized. To this end, in vivo physiology during epochs of social interaction may more aptly furnish the narrative that Il cells are preferentially affected by social isolation.
With respect to Figure 3, one of the most crucial aspects of this paper is that socially isolated mice have functioning social recognition on a short time scale as shown in 3A and 3B. The authors supply two reasonable hypotheses that this then could be a deficit in consolidation or retrieval memory mechanisms. This would be a crucial discovery for the field of social and memory neuroscience. One possible set of experiments the authors could pursue in a future paper would be to use the TRAP2 or tet-tag viral system to tag cells active at the encoding of a social epoch with ChR2 and eYFP within vCA1 or the PL, two areas shown to be important for the social engram. The next day the researchers could perform a 90-minute transcardial perfusion and quantify overlap. If there is an above chance overlap between the “tagged” cells and endogenous c-Fos this would rule out consolidation as the faulty mechanism. In this hypothetical scenario the researchers could then use a subsequent cohort to see if chronic activation of this memory ensemble could be enough to rescue the behavior if it were a failure of retrieval.
Works Cited
1.)Yamamuro K, et al. A prefrontal–paraventricular thalamus circuit requires juvenile social experience to regulate adult sociability in mice. Nature Neuroscience, (2020).<br /> 2.)Murugan M, et al. (2017) Combined Social and Spatial Coding in a Descending Projection from the Prefrontal Cortex. Cell 171(7), 1663-1677.<br /> 3.)Cummings K. and Clem R. (2020) Prefrontal somatostatin interneurons encode fear memory. Nature Neuroscience 23(1):61-74<br /> 4.) Xing B. et al (2020) A subpopulation of Prefrontal Cortical Neurons Is Required for Social Memory. Biological Psychiatry in press.<br /> 5.) Okuyama T et al. (2016) Ventral CA1 neurons store social memory. Science. 129:17-23.
On 2019-11-06 20:42:01, user Gabriela Rodriguez wrote:
BI 598 Group 5: Stephanie Yemane, Alex Terzibachian & Gabriela A. Rodríguez-Morales
Review written by undergraduate and graduate students from Boston University as requirement from the BI598 class
Summary:
The complement system, pathway that works alongside the immune system, is activated by the deposition of C1q, a protein complex that binds antigen-antibody complexes tagging synapses for elimination by cleaving C3 into C3a, which recruits phagocytic cells, and C3b which facilitates phagocytosis via the microglia-specific complement receptor 3. The deposition of the complement system has been shown during disease, in this paper, Hammond et. al. tried to test whether there is excess production of the complement system in the hippocampus of a multiple sclerosis mouse model, EAE, and if complement-dependent synapse loss is a source of degeneration in EAE.
To answer this question, the authors first aimed to characterize the change in complement production through quantitative analysis of C1qa, C3, and mRNA in Figure 1. Using Western blot analysis, researchers found that EAE mice had significantly increased expression of C1q and uncleaved C3 protein compared to sham mice. Through qPCR analysis of mRNA expression in the hippocampus, EAE mice were found to have significantly increased C1qa and C3 expression. qPCR was also used to analyze the expression of complement proteins in CD11b+ microglia/myeloid cells, EAE mice displayed significantly increased C3 expression, but no difference for C1qa expression.
Afterwards, they wanted to localize the expression of C1q and C3 in the hippocampus of EAE mice using immunohistochemistry analysis of hippocampal sections. In Figure 2, EAE mice were found to have varied increases of fluorescence in the hippocampus compared to sham. EAE brains were identified to have C1q localized in high density punctate regions. Postsynaptic marker PSD95 was used, where it was found that both EAE and sham brains had co-localization of C1q to synapses and dendrites, but not all C1q had overlapping localization with PSD95. Next, they analyzed the expression of complement proteins in different hippocampal regions. EAE were found to have no insignificant changes in complement protein expression across the striatum radiatum, lacunosum moleculare, and dentate molecular layer.
To examine if loss of C1q or C3 could protect against the EAE-induced motor impairment, the authors used a pre-mixed emulsion containing MOG in CFA containing heat-activated mycobacterium tuberculosis H37RA in order to immunize WT, C1qKO and C3KO for EAE. Results showed a significant decrease in EAE-induced motor deficits on C3KO mice during the peak disease phase and chronic phase while the C1qKO showed no significant difference in motor deficits compared to WT mice. These results suggest that the alternative complement pathway plays an important role in EAE white matter.
The authors then tried to show that C1qa and C3 knockout mice have synapse loss that’s correlated with EAE in the CA1-SR region of the hippocampus. They only focused on the CA1-SR region because they were previously able to demonstrate that there was a significant synapse elimination in the CA1-SR layer. In figure 4, they look at how Homer1 and PSD95 puncta in the CA1-SR are affected in WT, C1q KO and C3 KO mice in both Sham and EAE transfected mice. They do so by immuno-staining both postsynaptic markers (Homer1 and PSD95). C1qa and C3 KO mice result in partial protection of against EAE-induced synaptic death. Data processed was a normalized amount of present PSD95 and Homer1 puncta. C1qa KO shows a larger loss of Homer1 in the EAE mice compared to sham mice. Whereas, C3 KO shows relatively no difference in loss of Homer1, when comparing EAE and sham mice. The same was seen when looking at PSD95 puncta density, as C1qa KO showed some protection against EAE-induced synaptic death, but C3 KO showed stronger protection. Hence, knockout of C3 proved to be a lot more efficient at preventing synapse loss.
Finally, they looked at decreased amount of microglia activation in C3 KO mice with EAE compared to WT EAE mice. Loss of C1qa had a slight effect on microglia activation induced by EAE. They did so by looking at morphometric parameters of microglial activation. To do so, they measure the surface area/volume ratio and the skeletal length/volume ratio in figure five. They immuno-stained the microglia protein IBA1. WT EAE mice displayed increased expression of IBA1 by microglia and thicker/shorter processes in microglial morphology, which is associated with a functional microglial phenotype. Both WT and C1qa KO EAE mice showed similar increases in IBA1 volume and intensity compared to their respective sham mice. Yet C3 KO EAE mice showed no significant increase in IBA1 volume or intensity when compared to the C3 KO sham mice. Similar results were obtained when looking at the surface value/volume ratio and skeletal length/volume ratio. C1qa KO and WT EAE mice showed similar decreases in microglial morphology measurements, when compared to their respective sham controls. However, C3 KO EAE mice showed an insignificant decrease in the two morphologies. In conclusion, this study provides evidence that may suggest that genetic loss of C1q and C3 provides protective effects against grey matter synapse loss and microglial activation, making the complement pathway a possible therapeutic target for MS.
Merits:
The authors were able to provide enough evidence to suggest that C3 might be a protein of interest when working with multiple sclerosis-related symptoms which opens a new door into possible therapeutic applications of C3 in multiple sclerosis. Another strength of the paper is the use of the EAE animal model, this model has been proven to replicate many of the clinical and pathophysiological features of multiple sclerosis, making it a better experimental design than a mouse model only exhibiting motor deficits.
Major Criticisms:
Figures 1B-D should include individual data points on the bar graphs as these figures all had an N that was 11 or less; error bars displayed are rather large, and it may give more information to also display individual data points.
There was no reference for how many mice had successful EAE immunization. How many mice were immunized? What percentage of immunized mice displayed this increase in complement expression?
In figure 2E there is no quantification of C1q or PSD95 puncta, or quantification of how many overlap; the panel displaying the merged fluorescence is quite unclear and without quantification is not supportive of the hypothesis. The panel showing an image of C1q KO mouse hippocampus is rather dark, doing a DAPI stain to show that the structural integrity is not compromised, and that the WT and KO brains are comparable.
Using the C3d antibody for figure 2G doesn’t quite make sense as it detects the active and inactive forms, the cleaved and full length forms of C3, respectively. Using a marker that identifies the inactive form of C3 doesn’t indicate a good marker for analyzing the activity of the complement pathway – as the protein must be cleaved in order to be active. Additionally, this figure should include DAPI staining as well to prove that the sections are comparable. Why were C3/C3d panels not magnified, but C1q were? Is there more significance in visualizing C1q fluorescence?For figures I and J, there is also no quantification of the individual puncta, and the percentage of overlapping puncta.
In figure 3, the authors failed to provide comparison of experimental EAE animals with the sham mice regarding the clinical score for motor deficits across days post immunization. Another major criticism for figure 3 is the fact that they failed to provide a measure for complement deposition levels, specially during the increase in motor deficits.
A major criticism for figure four is that their data only represents one time-point. This doesn’t allow for analysis of how Homer 1 and PSD95 are affected over a period of time. Another major error was that they only decided to look at SR. They had a reason to only look there, but it would have made it clearer that its only specific to SR if they also looked at other regions such as SP, SO and SLM of the hippocampus and noticed no difference. A third error was that the differences in Homer1 and PSD95 found were so minimal that they were basically insignificant. This makes their conclusions seem exaggerated, as the discovery barely had any evidence to back it up.
A major criticism for figure 5 is the fact that they only decided to tag IBA1 in order to measure microglia density. This would not be enough to measure microglia density, as EAE immunization is not the only thing that results in increased IBA1 expression by microglia.
Minor Criticisms:
Minor criticisms include some punctuation errors in addition to referring to protein C1q as “C1q” and C1qa”. As well as inconsistencies in test references (i.e. “t-test” v. “t test”). N sizes were rather small, and thus don’t hold enough power to display significant differences; include more mice in order to prove there is no difference – begin by doubling the N per gender group and see if significant differences arise. Otherwise, include in the manuscript that not enough mice were included in the study to determine if there was a significant effect.
In figure 3, the n values for all three experimental groups are quite different, C3KO EAE mouse cohort being the one with the least amount of subjects. In this experiment the C3KO EAE group have an approximate difference of 10 to 17 animals in comparison with the other two experimental groups. This difference begs the question if the robust decrease in motor deficits are actually due to the C3KO or to the power difference.
One minor criticism in figure 5 is the location of the figure. It would be better to put it before figure 2, as it would be good to look at the change in morphology prior to behavior. To do so, they could even integrate it with figure 1, as that’s where they first start looking into C1qa and C3.
Future Directions:
Using CD11b as a marker for microglia/myeloid cells is not necessarily the most accurate, as it is not specifically for microglia but it is also a marker for monocytes and macrophages. Use a different marker specific for microglia, like TM119, and see if the CD11b overlaps in order to determine that it is specifically microglia/myeloid that are being observed.
The results section mentions that the increased expression of complement proteins in EAE mice could be due to other proteins. But, no other markers were used in order to determine if they were different from microglia/myeloid cells. How do we know another inflammatory response had been upregulated, or a different mechanism was utilized in the absence of the complement proteins? Using markers like TNF-alpha, IL-2, and IL-6 – which are pro-inflammatory markers for microglia responses. Or markers Arg1 and Ym1 which are markers for maintained inflammation response, which can identify other response mechanisms. It would strengthen the hypothesis of the increased phagocytosis by microglia if general markers like Arg1 and Ym1 were used to identify if there were inflammatory responses that did not overlap with the CD11b+ microglia/myeloid cells. Additionally, analyzing complement levels in mice at more time points post-immunization would show the progression of degeneration.
Methods for this Figure 2 included confocal microscopy which has limitations in resolution, electron microscopy would provide the resolution needed to analyze the co-localization of these proteins. If complement protein levels at the synapse are to be analyzed, using synaptosome enrichment of both EAE and sham mouse hippocampi in order to selectively observe pre/post-synaptic cleft areas and the proteins expressed. Without quantification of the puncta in panels D-J, localization of proteins cannot be directly addressed or compared across brain regions, or across EAE and sham mice. For all experiments in figure 2 that examine co-localization of proteins, merged panels should be pixel shifted in order to confirm that the location of proteins is specific and ordered.
As a future direction for the experiment shown in figure 3, it would be useful to use a conditional C3KO on the brain areas related to motor activity, like the motor cortices, striatum and GP in order to better identify the area of interest for the C3-related protective effect that reduces motor deficits. Furthermore, providing a cognitive score curve for the different KO groups alongside the motor curve would provide further characterization of the possible protective effects of these conditions against MS-related symptomatology.
To strengthen the research shown in figure 4, the authors should have shown a progression of the synaptic density over the course of the 26 days post immunization. They could have done so by picking out three different dates and looked at how the density of Homer1 and PSD95 are in comparison to the previous days.
One way to build upon figure five is to use more markers other than just IBA1 to measure microglial density. This would have made their data be better supported. Another future direction that would allow for a better study of the morphological changes of microglia, they could have used done a sholl analysis. This would have allowed them to record the number of intersections at various distances from the cell body, which would look at how complex and arborized the microglia is.
On 2019-11-05 15:11:52, user Johan S. Martinez-Fuentes wrote:
NE598 GROUP 3<br /> We are students at Boston University focused on learning about neural circuits and how their structure and function relate to animal behavior. In an effort to promote constructive discourse of current research in this field, and to gain experience in the process of peer-review, we provide the following critique of the currently unpublished manuscript from Hammond et al. posted on biorxiv.org (version: September 05, 2019).
Summary: Multiple sclerosis (MS) is a neurodegenerative disease characterized by loss of white and grey matter leading to motor and cognitive disability. It remains unknown exactly what role the components of the immune system, including microglia and molecular complement factors (e.g., C3, C1q), play in disease progression of grey matter in MS. Hammond et al. use a mouse model of MS called experimental autoimmune encephalomyelitis (EAE) in combination with molecular, genetic, and immunohistochemical approaches to find that C3/C1q and microglial activation are implicated in different aspects of grey matter pathology in EAE. These results argue for complement signaling, and associated microglial activation, as important players in MS-related grey matter degeneration and disease severity. This research has promise of being impactful as it contributes to our general lack of knowledge surrounding lesions of MS independent of demyelination (Mandolesi et al., 2015), and potentially highlights new avenues for therapeutic treatments. Overall, we recommend improving the usage and presentation of some of the data as well as addressing complexities of cellular phenotypes, which appear to be understated.<br /> Figure 1 explored the potential functional relationship between the complement production, specifically that of C1q and C3 protein, and the EAE model. The authors used western blot to analyze C1q and C3 expression in hippocampal lysates comparing the sham and EAE mice and found an increase in both the levels of C1q and C3, 2.6-fold and 1.9-fold respectively as compared to the increase in the sham controls (Figure 1A). They normalized the band densities to the sham controls and quantified the C1q and C3 results (Figure 1B). Further, they explored mRNA expression in hippocampal tissue by isolating RNA from the sham and EAE (n=10 each) mice and analyzed using qPCR and quantified the fold change of C1qa and C3, with 2.1 fold and 8.4 fold above sham controls respectively which implicated a potential connection between local gene expression and increased protein production in the model (Figure 1C). Additionally, the group used qPCR to analyze sham and EAE (n=5 each) hippocampal CD11b+ microglia/myeloid cells and their C1qa and C3 gene expression finding no significant difference in the expression of C1qa in the EAE mice as compared to the control, but there was 54.5-fold increase for C3 (Figure 1D).<br /> Figure 2 provides visual affirmation of the upregulation of C3/C1q in the hippocampi of EAE-mice compared to sham controls. Immunohistochemsitry was used to shed light on the differential spatial patterns of C3/C1q expression across regionalized sections of the hippocampal formation. Specifically, EAE-mice showed an increase in C1q across the entire hippocampus and in some cases showed co-localization with PSD95 suggesting it may affect synaptic functionality. This phenomena extended to C3/C3d expression in the CA1 stratum-radiatum region of the hippocampus. <br /> In the third figure, the investigators display the results of an experiment developed to determine the effects of C1q or C3 loss on the motor impairment in EAE mice by comparing pathology in EAE immunized WT, C1qa KO, and C3 KO mice (n=24, 17, and 7 respectively) on a clinical scale over the course of approximately one-month post immunization. They found nearly identical results between the C1qa and WT mice groups, but lower clinical scores indicating less severe EAE related deficits in the C3 KO group. Notably, the timeline of symptom onset was consistent across the groups. To display the results, they used a graph of Days Post Immunization versus Clinical Score displaying all three of the groups’ mean scores (Figure 3).<br /> Because the authors had previously found a significant amount of synapse elimination in the CA1-stratum, in Figure 4 they looked further into the role of complement proteins in grey matter loss, specifically in Homer1 and PSD95+ puncta in the Figure 4. Using immunohistology the puncta were quantified using the “find spots” algorithm setting a threshold of brightness for the PDS95+. Compared to the WT EAE, which had a 13% decrease in Homer1 puncta, the C1qa KO EAE showed only a 7% decrease in puncta compared to the sham control. However, both C3 and C1qa showed no significant difference to the sham control. All data were normalized to the sham control and each measure was taken from an average of 6 image stacks per mouse. This could suggest that the alternate pathways of C3 is more important for grey matter pathogenesis due to increased protection from synapse elimination in C3-KO compared to wild type and C1q-KO.<br /> In Figure 5, to assess the role of C1q and C3 for activated microglia in EAE, the authors conducted morphometric quantitative image analysis of IBA1 immunostain signal in the hippocampus across control and KO animals. Activated microglia show shorter, thicker skeletal processes. Thus, an increase in activated microglia was measured through segmentation algorithm in Volocity by (i) increased IBA1 expression, (ii) increased IBA1 volume, and (iii) a decrease in the ratio of either IBA1+ skeletal length or surface area to volume compared to sham control. In both EAE WT and EAE C1q-KO conditions the authors observed a significant increase in the level of activated microglia across all measures, but no significant difference was seen in EAE C3-KO. Thus, C3-dependent activity appears to be important for EAE-related microglia activation, and taken with the previous results, this may suggest why synaptic protection in C1q-KO is insufficient for improvement in clinical score. This set of results is highly intriguing as it suggests microglia as a target for therapeutic intervention in order to potentially improve grey matter health and patient outcomes.
Major Issues:<br /> While Figure 1 supports the implication of the complement protein C1q and C3 expression in the deficits that characterize the EAE model fairly well, there are a few critical issues. Firstly, it includes both male and female mice, and it is well-known that MS has a higher prevalence among females and this could be a potential issue with the EAE model. The investigators claim that there is no sex difference, but their n of 7 and 11 is too small to confidently make this claim. They should include more mice and run the proper statistical tests or comment on this confluence. Further, they perform an experiment looking at hippocampal CD11b+ microglia/myeloid C1qa and C3 gene expression, but only use one marker. Figure 1 introduces the issue of isolating resident-brain macrophages (microglia) rather than those that pass cross the blood brain barrier, whereby CD11b+ is insufficient to distinguish because it is expressed across a variety of immune cell in adhesion-related associations. In Figure 5, the use of IBA1 is not strictly restricted to microglia but also includes monocyte-derived macrophages that may be crossing the blood-brain barrier, which poses issues in isolating a microglial phenotype (Satoh et al., 2016). For example, if the C3-KO condition results in increased numbers of IBA1+ macrophages then relying solely on IBA1 may mask a microglial phenotype. The authors may consider using a co-marker exclusive to microglia (e.g., TMEM119). Authors may consider analyzing protein expression in microglia.<br /> Regarding the issue of having insufficient n for comparison, the authors must seriously consider the risk of oversampling certain conditions so as to bias or skew results. Instances of this can be seen in Figures 3, 4, and 5. Generally in these figures, the WT n ~20, while C1q conditions have n ~ 15, and lastly C3 conditions are <10. The authors may consider increasing sampling in undersampled conditions, or re-run statistical analyses of subsets of oversampled groups to see if results are still significant.<br /> In Figure 2, although the sparse colocalization of C1q and PSD95 in figure 2 E-D somewhat implies that C1q is upregulated at synapses and thereby dendrites, the images do not provide the resolution necessary to resolve this colocalization or actual synapse itself. This criticism extends to 2I-J for the same reasons, and the issue of rigorously defining synapses is also apparent in Figure 4. The punctas that are being marked are post-synaptic, but there is no confirmation of association with dendrites or any other part of the neurons creating these synapses. The authors may consider sparsely labeling neurons with virally introduced, promoter-driven expression of fluorescent protein to visualize spine morphologies. Returning to Figure 2, there is no bar-graph quantifying the findings for these last panels. We acknowledge that 2F adequately resolves C1q expression and thereby confirms their antibodies’ efficacy, but this panel would benefit from providing a DAPI-stain that confirms the structural integrity of their mouse-model’s cytoarchitecture. In 2G, we feel that the images are not easily interpretable and could be improved by using a unique immunohistological marker to tag blood vessels and by normalizing the signal so that we can more clearly resolve the upregulation of C3/C3d puncta. The reader would also benefit from low-magnification insets to images 2D-J to confirm proper sub-region comparison.<br /> Conceptually, the major criticism of the experiment outlined in Figure 3 would be its inconsistency of focus compared to the rest of the study. While the vast majority of the experiments work to implicate the complement pathway in hippocampal degeneration, the clinical test that is chosen is a motor test. It may have been more useful to this study in particular to use a cognitive behavioral test for memory. Furthermore, they include no comparison with a sham mouse which is not suitable as there is no control point of reference for the clinical score.<br /> For Figure 4, the analysis could be done more in depth with a much clearer explanation of which sections are being studied and compared.The data is being normalized, but it is unclear from which sections exactly. Because of the way that the data is presented there is no way to check if there is just a concentrated population of these punctas in a certain section/hippocampal subregion, or if the spread of punctas is truly as uniform as the normalized data suggests it is.<br /> An essential piece of evidence missing from Figure 5 is a positive control for microglial activation in C3-KO mice. Are the microglia, under EAE conditions, capable of exhibiting activation characteristics? It is possible that there is large-scale defect on inflammatory processes related to the germline loss of C3, and not directly related to the functions of C3 itself. Considering the onset of motor symptoms across all mice is similar, one simple way to address this is to check if they all also share an activated microglial phenotype around day 6 and/or day 14 post-immunization. Another way may be direct intracerebroventricular (ICV) injection of LPS (here, the authors may also see if EAE is correspondingly accelerated).
Minor Issues:<br /> In Figure 1, it would be more conducive to show all the data points on the bar graphs so that a better representation of the spread of the data can be visualized. It would also be useful for the group to include what percentage of mice had an increase in C1q and C3. Furthermore, it would be useful for the group to include more on the condition of the animals and whether they used all the data they collected in the analysis or whether some was thrown away.<br /> The age of the mice should be presented in figure legends (see Fig. 2, 4, 5) to build upon the narrative established in Figure 1. Moreover, although the authors attempt to show the aforementioned co-localization of C1q and PSD95 we think figure 2 could be vastly improved by including an inset in 2D-E to contextualize where we are looking with respect to the hippocampal formation. <br /> Overall, the display of Figure 3 is well crafted and the legend does well at explaining the facts of import; however, there could be some potential corrections. On the graph two of the groups are in the same color, the readability may increase by choosing different colors for each of the mice groups—especially if a sham control is added as earlier recommended. Further, it may be useful to include more background, possibly in the results portion for this figure, of the clinical test utilized and what different scores indicate relatively in terms of severity of symptoms.<br /> In Figure 4, the authors should be more detailed in adding magnification and the scale bar scale to the images of the IHC, and they should explain why the different images use different or the same colors. While green is generally thought to be a more visible color, the authors must keep the presentation consistent across conditions, otherwise they risk biasing the perception and interpretation of their data. <br /> Please correct the following typos:’value’ to ‘area’ in “Similar results were obtained for the surface value/volume ratio…” (Page 16); ‘Qioptiq’ instead of ‘Quioptic’ in “IHC sections were imaged… with Quioptic Optigrid optical sectioning hardware” (Page 10).
Merits:<br /> In Figure 1, The group effectively uses the data presented in the first figure to begin the argument for the rest of their study. They are able to implicate the C1q and C3 proteins as having a relationship with EAE pathway. Furthermore, as it is well-known the relationship between protein production and mRNA is not 1:1 it was a good notion to include data on both. This figure also has a high level of readability, it is labelled well, and comprehensibility.<br /> Figure 2 successfully verifies the antibodies’ fidelity in visualizing C1q, PSD95, and C3/C3d in the mouse hippocampus. Importantly, this serves as a proof of principle figure because it validates the efficacy of their experimental mouse model and confirms that their antibodies function properly. Moreover, their approach is clever because it affords them with an opportunity to resolve region-specific expression of the aforementioned molecules of interest. <br /> The concept of integrating a behavioral experiment into this largely molecularly based study as seen in Figure 3 is commendable and certainly enhances this study’s findings by implicating the functionality of the complement pathway to the actual symptomology of the disease model course. It also allows for a look at the effects of the disease in a very readable and visual manner over the course of the progression.<br /> In Figure 4, the explanation of the way the data was collected and how it was analysed was quite clear. Using the same region as had been previously found to be affected by the changes done by this study is commendable. Notable in Figure 5, the measures for microglial activation shown here abide by the standards established in the field.
Future Directions<br /> From Figure 1, to more definitively determine whether the C1qa and C3 KO’s show other inflammatory responses rather than simply the deletion of the complement proteins the group could do separate inflammation tests for the complements. Perhaps the group could build off of their experiments in the first figure by utilizing an assay to isolate the microglia of the mice and characterize the movement with pro-inflammatory markers such as TNFa, IL-2, or IL-6 by testing in WT, C1q KO and C3 KO with and without inflammation. They could also consider running qPCR. Additionally, the group could consider running this experiment with a behavioral component, such as a cognitive deficit test concerning memory. <br /> From Figure 2, concerning future directions, we think these figure panels would benefit from higher resolution images; however, if the authors do not have access to super resolution microscopy or EM we suggest performing synaptosome enrichment to quantify differential protein expression between sham and EAE populations. We also think that the colocalization results would be bolstered by recapitulating these experiments using other synaptic markers than just PSD95.<br /> It could be a very interesting future study to look at the role of the complement system in regards to motor function on a molecular level given the clinically oriented results they obtained in Figure 3. Furthermore, it would be interesting if the group carried out a cognitive deficit behavioral with the respective groups that would align more with the rest of the given study. Further, it may be interesting to look at a knockdown of the complement pathway elements analyzed and to compare the progression of symptomology in that case.<br /> Based on the findings in Figure 4, it would be interesting to see what is the spatial distribution of populations of puncta that are, as well as aren't, being reduced. It is unknown whether the elimination is uniform or specific to a single layer or to a certain projection pathway of the hippocampus. Further analyzing the data that has already been collected and analyzing it as intact stack of images rather than simply averaging many layers together. In addition to this, it would be useful to see the synapses with synaptic markers such as CaMKII using an AAV to trace them and use a retrograde.<br /> Branching from the work in Figure 5, to further explore the importance of activated microglia in EAE, future experiments perturbing the population of microglia across different stages of EAE may be conducted to see whether this is sufficient to improve clinical scores. The CSF1 receptor inhibitor, PLX3397, has been previously used to efficiently eliminate microglia, with ~50% reduction by three days (Elmore et al., 2014); this drug may be incorporated into the EAE timing to examine the effects of microglia loss. As an alternative, antisense oligonucleotides (ASOs) against C3 or CSF1 for pan-microglia may also be considered, especially since some ASO drugs are already FDA approved.
Works CitedElmore, M. R., Najafi, A. R., Koike, M. A., Dagher, N. N., Spangenberg, E. E., Rice, R. A., … Green, K. N. (2014). Colony-stimulating factor 1 receptor signaling is necessary for microglia viability, unmasking a microglia progenitor cell in the adult brain. Neuron, 82(2), 380–397. doi:10.1016/j.neuron.2014.02.040
Mandolesi G, Gentile A, Musella A, Fresegna D, De Vito F, Bullitta S, Sepman H, Marfia GA, Centonze D. Synaptopathy connects inflammation and neurodegeneration in multiple sclerosis. Nat Rev Neurol. 2015 Dec;11(12):711-24. doi: 10.1038/nrneurol.2015.222.
Satoh J, Kino Y, Asahina N, Takitani M, Miyoshi J, Ishida T, Saito Y. TMEM119 marks a subset of microglia in the human brain. Neuropathology. 2016 Feb;36(1):39-49. doi: 10.1111/neup.12235.
On 2019-11-04 20:22:46, user Michael Melhem wrote:
The first author of this review is a graduate student at Boston University while the other three authors are senior undergraduate students at Boston University. This review was assigned as part of our Neural Circuits (NE598) course.
NE598 Group 4 - Rhushikesh Phadke, Michael Melhem, Tony Lopez, and Carly Langan
Complement-dependent synapse loss and microgliosis in a mouse model of multiple sclerosis<br /> Jennetta W. Hammond, Matthew J. Bellizzi, Caroline Ware, Wen Q. Qiu, Priyanka Saminathan, Herman Li, Shaopeiwen Luo, Yuanhao Li, and Harris A. Gelbard
Summary:<br /> Since multiple sclerosis involves microglial activation and a reduction in synaptic density, Hammond et. al used experimental autoimmune encephalomyelitis (EAE) to model these key features in the grey matter pathology of mice. The complement system, a set of proteins shown to upregulate immune responses, participates in opsonization of myelin and debris, and has been implicated in white matter pathology in MS patients. This system is initiated through the deposition of C1q, leading to a signalling cascade that cleaves protein C3 into sub subtructures. The goal of this paper sought to determine, through analysis of C1q and C3 protein levels, whether or not complement-dependent synapse loss contributed to the degeneration of grey matter in EAE.
In Figure 1, the authors provide a basic characterization of protein and mRNA levels in the hippocampus using both Western Blotting Techniques and data quantification. Western blot images show expression of both C1q and C3 proteins in the Sham and EAE mice with a stronger signal of both C1q and C3 in the EAE mice. In addition to this, C1qa and C3 with fold changes in mRNA expression were analyzed by qPCR. C1qa and C3 mRNA levels were found to be greater in hippocampus of EAE mice than in the sham control mice.
In Figure 2, researchers immunolabel C1q in EAE and WT, and quantify fluorescence across various parts of the HPC, showing increased overall C1q expression in EAE mice. IHC images show that C1q puncta somewhat overlap PSD95 puncta and that C3 expression is increased in CA1-SR. Researchers attempt to show where C3 expression is localized, finding it around blood vessels in sham and EAE mice. Lastly, researchers show occasional overlap between C3 puncta and PSD95.
In Figure 3, the authors depict the mean clinical scores of motor deficits from EAE immunized WT, C1qa KO, and C3 KO mice 0-26 days post immunization. C3 KO mice showed a significant decrease in the mean clinical score of motor deficits both 14-15 days post immunization and during the chronic phase, which was 20-30 days post immunization. When C1qa KO was tested, there was no change in the EAE disease course when compared with WT EAE mice. Both the C1qa and the C3 KO did not shift the timing of motor symptom onset. Overall, this figure demonstrated how the deletion of C3, but not C1qa, reduced the average EAE motor deficits.
In Figure 4, synaptic density was measured using Homer1 and PSD95 antibodies to tag and fluoresce synapses in CA1-SR cells of the hippocampus in SHAM and EAE mice. This figure showed that C1qa and C3 KO mice have less synaptic loss than EAE mice compared to WT mice. This change was not due to developmental change since the number of synapses was unchanged when comparing KO and WT mice.
In Figure 5, the authors looked at microglia activation induced by the EAE model. For this reason, they used antibodies against Iba1. Compared to SHAM injections, WT animals showed an increase in Iba1 intensity on EAE injections. This increase was seen in C1q KO but was absent in C3 KO. Along with an increase in Iba1 intensity, WT and C1q KO showed a decrease in skeletal length/volume, indicative of a change in morphology. This change was again absent in C3 KO mice.
Merits:<br /> Overall, this paper effectively demonstrates that the EAE model produced levels of both C1q and C3 that were significantly upregulated in the HPC. This trend was seen in both mRNA and proteins, but microglia contributed to C3 overexpression only. The increase in C1q was seen in many regions of the HPC (SR, SO, etc.) and both C1q and C3 overlapped with postsynaptic markers. Researchers showed the EAE model captured motor deficits found in MS as well as a progression in the EAE model that tends to affect motor deficits over time.
Regarding inflammation, researchers determined that the EAE model displayed increased Iba1 signals and indicated a difference in microglia morphology between SHAM and EAE mice. Finally, C3 was shown to be important for the level of Iba1 expression in microglia, while C1q had no such effects.
Specific Critiques:<br /> Overall, we felt that the sample sizes were low across all experiments and figures. The difference in sample size in Figure 1 between Wild Type and C3 KO may introduce an imbalance in the statistics of the study, and should thus be avoided. This can be done by increasing the sample size of other groups to match the wild type conditions. We felt as though the statement “no significant main effects of sex or significant interactions of sex with immunization status,”(pg. 6) was not able to be supported due to the smaller sample size used, and should therefore be emitted or supported with further data. It would be beneficial to see if all the mice administered with the EAE treatment show the same response or rather, if a subset of the population show it, therefore, outliers that show extreme results would not skew that data. Along with that, a baseline inflammation level for the KO would be helpful to see the inherent changes that occur when knocking out the complement genes.
In Figure 2, there was no quantification in figures D, E, I, or J. Without quantification, we’re left with subjective, unanalyzed images. As for the images used, Fig. 2E, I - J, which show putative overlap of synapses and complement proteins, are at such a low magnification that we are unable to properly see the morphology surrounding the synapses themselves. Other techniques, such as electron microscopy or super resolution microscopy (STED or SIM), could be used to help distinguish structures at a finer level. The figures which detailed synapses would be much more convincing if they were stained for cytoarchitecture. To prove that what we are analyzing is indeed a synapse, the use of both pre and postsynaptic markers, followed by co-localization studies, are recommended. In Fig 2G, we cannot definitively say that there is blood vessel colocalization with the complement proteins. This is true because there were no markers for blood vessels to show the C1q overlap.
In Figure 3, the sample size discrepancy can cause a major imbalance in data and may weigh it towards the control samples. Results from C3 KO mice (n=7), will not be as consistent or replicable as results from WT EAE mice (n=24). It would benefit the data greatly to use a consistent sample size across conditions. All the data shown here is only comparing EAE injected mice. It would be helpful to see a comparison made with SHAM mice to show the progression of the model throughout the age span referenced. Without that, a confirmed clinical score deficit cannot be claimed. In supplemental information, a video depicting the motor deficits examined would be useful in understanding the model better. This research study concluded a reduction in synaptic density in the hippocampus of EAE models, yet failed to demonstrate any cognitive or behavioral consequences of this loss. The inclusion of a change in cognition or behavior timescale would help to demonstrate some of the other deficits associated with MS. To compare the disease progression to complement protein expression, levels of C1q and C3 at different time points (such as P6, P18 and P28) would clearly relate the motor deficits to complement protein levels.
In Figure 4, it would be helpful to include more time points (such as P6, P18 and P28) which are critical to motor deficit progression as shown in Fig 3. Instead of just synaptic density, analysis of puncta size and shape of cells in SP, SO and SR would be beneficial. Since mean motor deficit scores have been shown to change in Fig 3, areas related to motor control, such as the spinal cord and motor cortex, would be good places to look for spine density. This is because they can directly correlate this to the disease progression in the model used. As suggested for Fig 2, a demonstration of cytoarchitecture with use of DiI crystals would make the image more comprehensible. Use of other markers, such as PSD95 (indicator of excitatory post-synapses), staining for synapsin (indicator of pre-synapse) and gephyrin (indicator of inhibitory post-synapses) would add more dimension to the study by distinguishing between the types of synapses pruned.
In Figure 5, only Iba1 was used to assess microglia activation. Iba1 has been linked to other physiological processes as well, but it cannot be considered the definite measure of microglia activation. Instead, other markers, such as CD68 and P2ry12 should be used to show phagocytosis. Use of different markers to analyze microglial states will give a more comprehensive measure of activation. The morphological change in Fig 5 D,E can be better represented by using Sholl Analysis. This would demonstrate dendrite intersections around the cell body. As a compact morphology has been shown to be indicative of activated microglia, this method gives an immediate representation of the state.
Minor Concerns:<br /> Regarding the writing of the paper, avoid the use of statements regarding the novelty of the experiment and review the paper for grammatical and syntactic errors (ex. “By western blot, found that…”, “Next,we”, “...provide insight into its role in MS..”).
When showing data in bar graphs, consider using the absolute value of data instead of normalized data for comparison between each condition. Also, please include the age of mice in all of the figure legends to assist the reader in understanding what time frame the data was extracted from.
In Figure 2, use insets for zoomed figures for ease of understanding. Here it would also be useful to pixel shift panels E and G to confirm co-localization.
Future Directions:<br /> Overall, the manuscript does not provide an explanation for if microglia are beneficial or harmful in the case of MS. For this purpose, it would benefit the study to target microglia in development (eg. using clodronate) and then analyze clinical scores over the same period of time. This data would be a good indication of the role of microglia in MS.
Furthermore, expand the scope of the experiment beyond the HPC. It might help to look at whether the PFC or AC (regions possibly implicated in MS) show similar microglial activation levels or possible synaptic loss.
The genes required for complement protein expression may be involved in developmental progression and, therefore, may affect regular synaptic density in a way not mediated by microglial activation. Does complement protein knockdown, potentially through the use of ASOs, result in the same affect? This would have important implications for MS treatments, as adult humans cannot have gene KOs, but could theoretically have ASO treatment.
Future studies should explore the cognitive deficits in the EAE mice during the time span post immunization. Multiple sclerosis is a disease characterized by more than just motor deficits, so seeing the effects of the EAE model in other aspects of the disease would be helpful. Some of the characteristics of this disease include behavior and cognitive changes. Considering that this study focused on the hippocampus, which is responsible for tasks related to memory and cognition, the demonstrated reduction in synaptic density would be expected to induce some type of cognitive effect. Behavioral changes could be analyzed by introducing the EAE mice to novel objects. Cognitive changes could be tracked over the time period by analyzing place cells in the hippocampus as the mouse runs through a maze.
To characterise spine density, whole cell patch clamping could be used as an addition to the density data. Frequency and amplitude of both mEPSCs and mIPSCs will be indicative of spine loss and any receptor changes that might be happening.
On 2026-01-07 12:56:34, user Andreas Eilersen wrote:
The transcribed hospitalisation records mentioned in the paper can be found on Github (collected and published by Søren K. Poder): https://github.com/basspoder/smallpox_post_honeymoon_phase_1824_1872/releases/tag/Dataset
Some bots are intended to be helpful, using automation to make tasks easier for others or to provide information, such as: Auto caption: https://twitter.com/headlinerclip [c3] Vaccine progress: https://twitter.com/vax_progress [c4] Blocking groups of people: https://twitter.com/blockpartyapp_ [c5] Social Media managing programs that help people schedule and coordinate posts Delete old tweets: https://tweetdelete.net/ [c6] See a new photo of a red panda every hour: https://twitter.com/RedPandaEveryHr [c7] Bots might have significant limits on how helpful they are, such as tech support bots you might have had frustrating experiences with on various websites.
Based on my experience, this is a example of the usefulness of using bots as I have been using Instagram for a long time and sometimes fake followers who tag my personal account in a few promotional posts, the bots clean up and block them. I often use auto captions for Tiktok to easily translate many languages to understand the message they are saying.
Author Response:
The following is the authors’ response to the original reviews.
Public Reviews:
Reviewer #1 (Public review):
This manuscript investigates how dentate gyrus (DG) granule cell subregions, specifically suprapyramidal (SB) and infrapyramidal (IB) blades, are differentially recruited during a high cognitive demand pattern separation task. The authors combine TRAP2 activity labeling, touchscreen-based TUNL behavior, and chemogenetic inhibition of adult-born dentate granule cells (abDGCs) or mature granule cells (mGCs) to dissect circuit contributions.
This manuscript presents an interesting and well-designed investigation into DG activity patterns under varying cognitive demands and the role of abDGCs in shaping mGC activity. The integration of TRAP2-based activity labeling, chemogenetic manipulation, and behavioral assays provides valuable insight into DG subregional organization and functional recruitment. However, several methodological and quantitative issues limit the interpretability of the findings. Addressing the concerns below will greatly strengthen the rigor and clarity of the study.
Major points:
(1) Quantification methods for TRAP+ cells are not applied consistently across panels in Figure 1, making interpretation difficult. Specifically, Figure 1F reports TRAP+ mGCs as density, whereas Figure 1G reports TRAP+ abDGCs as a percentage, hindering direct comparison. Additionally, Figure 1H presents reactivation analysis only for mGCs; a parallel analysis for abDGCs is needed for comparison across cell types.
In Figure 1G and 1H we report TRAP+ abDGCs as a percentage rather than density because we are analyzing colocalization of the two markers, which are very sparse in this population. Given the very low number of double-labeled abDGCs, calculating density would not be practical. In the revised manuscript we have clarified the rationale for using these measures. As noted in the current text, we did not observe abDGCs co-expressing TRAP and c-Fos; we have made this point more explicit to guide interpretation of these data.
(2) The anatomical distribution of TRAP+ cells is different between low- and high-cognitive demand conditions (Figure 2). Are these sections from dorsal or ventral DG? Is this specific to dorsal DG, as it is preferentially involved in cognitive function? What happens in ventral DG?
The sections shown in Figure 2 were obtained from the dorsal dentate gyrus (see Methods, “Histology and imaging”: stereotaxic coordinates −1.20 to −2.30 mm relative to bregma, Paxinos atlas). From a feasibility standpoint, it is not possible to analyze the entire longitudinal extent of the hippocampus with these low-throughput histological approaches. We therefore focused on the dorsal DG, for which there is a strong functional rationale. A large body of work indicates that the dorsal hippocampus, and specifically the dorsal DG, is preferentially involved in spatial memory and in the fine contextual discrimination that underlies pattern separation. The dorsal hippocampus is critical for encoding and distinguishing similar spatial representations, a core component of the high-cognitive demand task used here. In contrast, the ventral DG is more strongly associated with emotional regulation and affective memory processing and is less implicated in high-resolution spatial encoding. For these reasons, the present study was designed to assess TRAP+ cell distributions specifically in the dorsal DG.
(3) The activity manipulation using chemogenetic inhibition of abDGCs in AsclCreER; hM4 mice was performed; however, because tamoxifen chow was administered for 4 or 7 weeks, the labeled abDGC population was not properly birth-dated. Instead, it consisted of a heterogeneous cohort of cells ranging from 0 to 5-7 weeks old. Thus, caution should be taken when interpreting these results, and the limitations of this approach should be acknowledged.
We agree that prolonged tamoxifen administration results in labeling a heterogeneous population of abDGCs spanning approximately 0 to 5–7 weeks of age, rather than a precisely birth-dated cohort. This is a limitation of this approach and we have included discussion of this in more detail in the revised manuscript.
(4) There is a major issue related to the quantification of the DREADD experiments in Figure 4, Figure 5, Figure 6, and Figure 7. The hM4 mouse line used in this study should be quantified using HA, rather than mCitrine, to reliably identify cells derived from the Ascl lineage. mCitrine expression in this mouse line is not specific to adult-born neurons (off-targets), and its expression does not accurately reflect hM4 expression.
We agree that mCitrine is not a marker that allows localization of hM4Di as it is well known that the mCitrine can be independently expressed in a Cre independent manner in this mouse. As suggested, we have removed the figure that showed the mCitrine and have performed immunohistochemical localization of the DREADD with an antibody against the HA tag. This is now shown in Figure 5.
(5) Key markers needed to assess the maturation state of abDGCs are missing from the quantification. Incorporating DCX and NeuN into the analysis would provide essential information about the developmental stage of these cells.
The goal of this study was to examine activity patterns of adult-born versus mature granule cells, rather than to assess maturation state. The adult-born neurons analyzed were 25–39 days old, an age at which point most cells have progressed beyond the DCX⁺ stage and are expected to express NeuN based on prior work. We therefore do not think that including DCX or NeuN quantification would provide additional information relevant to the aims or interpretation of this study.
Minor points:
(1) The labeling (Distance from the hilus) in Figure 2B is misleading. Is that the same location as the subgranular zone (SGZ)? If so, it's better to use the term SGZ to avoid confusion.
We have updated Figure 2B, the Methods, and the main text to more explicitly localize this which it the boundary between the subgranular zone (SGZ) and the hilus.
(2) Cell number information is missing from Figures 2B and 2C; please include this data.
We have now added the cell number information to the figure legends. In Figures 2B and 2C, each point corresponds to a single cell, with an equal number of mice per group. The total number of TRAP⁺ cells per mouse is shown in Figure 1F, which reports TRAP⁺ cell densities by group.
(3) Sample DG images should clearly delineate the borders between the dentate gyrus and the hilus. In several images, this boundary is difficult to discern.
We made the DG-hilus boundaries clearer in the sample images to improve visualization and interpretation.
(4) In Figure 6, it is not clear how tamoxifen was administered to selectively inhibit the more mature 6-7-week-old abDGC population, nor how this paradigm differs from the chow-based approach. Please clarify the tamoxifen administration protocol and the rationale for its specificity.
We apologize for the confusion here. The protocol used in Figure 6 is the same tamoxifen chow–based approach as in Figure 5, differing only in the duration of tamoxifen exposure. Mice in Figure 5 received tamoxifen chow for 7 weeks, whereas mice in Figure 6 received it for 4 weeks, restricting labeling to a younger and narrower cohort of adult-born DGCs. Thus, the population targeted in Figure 6 is younger than that in Figure 5 and does not correspond to mature 6–7-week-old neurons. By contrast, the experiment in Figure 4 targets a more mature population, consisting predominantly of ~5-week-old adult-born neurons as well as mature granule cells, which are Dock10-positive and express Cre endogenously, allowing selective manipulation of this later-stage population.
We have corrected the paragraph accordingly and clarified the age range of the labeled populations in the revised manuscript.
Reviewer #2 (Public review):
Summary
In this manuscript, the authors combine an automated touchscreen-based trial-unique nonmatching-to-location (TUNL) task with activity-dependent labeling (TRAP/c-Fos) and birth-dating of adult-born dentate granule cells (abDGCs) to examine how cognitive demand modulates dentate gyrus (DG) activity patterns. By varying spatial separation between sample and choice locations, the authors operationally increase task difficulty and show that higher demand is associated with increased mature granule cell (mGC) activity and an amplified suprapyramidal (SB) versus infrapyramidal (IB) blade bias. Using chemogenetic inhibition, they further demonstrate dissociable contributions of abDGCs and mGCs to task performance and DG activation patterns.
The combination of behavioral manipulation, spatially resolved activity tagging, and temporally defined abDGC perturbations is a strength of the study and provides a novel circuit-level perspective on how adult neurogenesis modulates DG function. In particular, the comparison across different abDGC maturation windows is well designed and narrows the functionally relevant population to neurons within the critical period (~4-7 weeks). The finding that overall mGC activity levels, in addition to spatially biased activation patterns, are required for successful performance under high cognitive demand is intriguing.
Major Comments
(1) Individual variability and the relationship between performance and DG activation.
The manuscript reports substantial inter-animal variability in the number of days required to reach the criterion, particularly during large-separation training. Given this variability, it would be informative to examine whether individual differences in performance correlate with TRAP+ or c-Fos+ density and/or spatial bias metrics. While the authors report no correlation between success and TRAP+ density in some analyses, a more systematic correlation across learning rate, final performance, and DG activation patterns (mGC vs abDGC, SB vs IB) could strengthen the interpretation that DG activity reflects task engagement rather than performance only.
As mentioned, we previously reported no correlation between task success and TRAP+ density. We have now performed additional analyses examining correlations with learning rate, final performance, and DG activation patterns (mGC vs abDGC, SB vs IB), and found no significant relationships. Therefore, as we did not find any positive correlations the original interpretation that DG activity primarily reflects task engagement rather than performance level seems the most parsimonious.
(2) Operational definition of "cognitive demand".
The distinction between low (large separation) and high (small separation) cognitive demand is central to the manuscript, yet the definition remains somewhat broad. Reduced spatial separation likely alters multiple behavioral variables beyond cognitive load, including reward expectation, attentional demands, confidence, engagement, and potentially motivation. The authors should more explicitly acknowledge these alternative interpretations and clarify whether "cognitive demand" is intended as a composite construct rather than a strictly defined cognitive operation.
We agree that reducing spatial separation between stimuli likely engages multiple behavioral and cognitive processes beyond a single, strictly defined operation. We have now clarified this point in the manuscript and explicitly state that our use of the term “cognitive demand” reflects a multidimensional behavioral challenge rather than a singular cognitive process (see Discussion).
(3) Potential effects of task engagement on neurogenesis.
Given the extensive behavioral training and known effects of experience on adult neurogenesis, it remains unclear whether the task itself alters the size or maturation state of the abDGC population. Although the focus is on activity and function rather than cell number, it would be useful to clarify whether neurogenesis rates were assessed or controlled for, or to explicitly state this as a limitation.
While the primary goal of this study was to examine activity and functional recruitment of adult-born granule cells, we also quantified the survival of birth-dated neurons at the end of behavioral training. Density measurements of BrdU⁺ and EdU⁺ cells revealed no differences across experimental groups, indicating that engagement in the pattern separation task, across low to high cognitive demand conditions, did not significantly alter survival of adult-born neurons. In addition, we examined the spatial distribution of BrdU⁺ and EdU⁺ neurons between the suprapyramidal and infrapyramidal blades of the dentate gyrus. The proportion of newborn neurons was consistent across all groups, with approximately 60% located in the suprapyramidal blade and 40% in the infrapyramidal blade. These findings indicate that behavioral training did not alter the baseline distribution of adult-born neurons. We have now clarified these points in the manuscript (See Results).
(4) Temporal resolution of activity tagging.
TRAP and c-Fos labeling provide a snapshot of neural activity integrated over a temporal window, making it difficult to determine which task epochs or trial types drive the observed activation patterns. This limitation is partially acknowledged, but the conclusions occasionally imply trial-specific or demand-specific encoding. The authors should more clearly distinguish between sustained task engagement and moment-to-moment trial processing, and temper interpretations accordingly. While beyond the scope of the current study, this also motivates future experiments using in vivo recording approaches.
We agree and have made changes to the manuscript to discuss these points (see Discussion and Limitations).
(5) Interpretation of altered spatial patterns following abDGC inhibition.
In the abDGC inhibition experiments, Cre+ DCZ animals show delayed learning relative to controls. As a result, when animals are sacrificed, they may be at an intermediate learning stage rather than at an equivalent behavioral endpoint. This raises the possibility that altered DG activation patterns reflect the learning stage rather than a direct circuit effect of abDGC inhibition. Additional clarification or analysis controlling for the learning stage would strengthen the causal interpretation.
We agree that differences in learning stage could in principle confound the interpretation of DG activation patterns. However, although Cre+ DCZ-treated mice exhibited delayed learning, they ultimately reached the same performance criterion as control animals. Thus, adult-born DGC inhibition did not prevent learning but increased the time required to reach criterion, indicating that these neurons are beneficial for learning efficiency rather than strictly necessary for task acquisition. Importantly, all animals were sacrificed only after reaching the predefined success criterion. Therefore, the immunohistochemical analyses were performed at the same behavioral endpoint for Cre+ DCZ and control groups, even though the number of training days differed. Consequently, the observed differences in DG activation reflect circuit recruitment at equivalent task mastery rather than differences in learning stage.
(6) Relationship between c-Fos density and behavioral performance.
The study reports that abDGC inhibition increases c-Fos density while impairing performance, whereas mGC inhibition decreases c-Fos density and also impairs performance. This raises an important conceptual question regarding the relationship between overall activity levels and task success. The authors suggest that both sufficient activity and appropriate spatial patterning are required, but the manuscript would benefit from a more explicit discussion of how different perturbations may shift the identity, composition, or coordination of the active neuronal ensemble rather than simply altering total activity levels.
We agree that our findings highlight that successful performance is not determined solely by the overall level of dentate gyrus activity, but rather by the composition and spatial organization of the active neuronal ensemble. In our study, inhibition of abDGCs increased overall mGC activity while disrupting the spatially organized, blade-biased activation pattern and impaired performance. In contrast, direct inhibition of mGCs reduced global excitability but preserved the relative spatial organization of active neurons in animals that continued to perform the task. These findings suggest that different perturbations alter task performance by shifting the identity and coordination of the active neuronal ensemble, rather than simply increasing or decreasing total activity levels. We have now expanded the Discussion to more explicitly address how dentate gyrus computations may depend on the structured recruitment of granule cell ensembles and how distinct manipulations differentially disrupt this organization.
Reviewer #3 (Public review):
Summary:
The authors used genetic models and immunohistochemistry to identify how training in a spatial discrimination working memory task influences activity in the dentate gyrus subregion of the hippocampus. Finding that more cognitively challenging variants of the task evoked more and distinct patterns of activity, they then investigated whether newborn neurons in particular were important for learning this task and regulating the spatial activity patterns.
Strengths:
The focus on precise anatomical locations of activity is relatively novel and potentially important, given that little is known about how DG subregions contribute to behavior. The authors also use a task that is known to depend on this memory-related part of the brain.
Weaknesses:
Statistical rigor is insufficient. Many statistical results are not stated, inappropriate tests are used, and sample sizes differ across experiments (which appear to potentially underlie null results). The chemogenetic approach to inhibit adult-born neurons also does not appear to be targeting these neurons, as judged by their location in the DG.
Please refer to the updated statistical analyses in response to the recommendations below.
Recommendations for the authors:
Reviewing Editor Comments
Please note that reviewers agreed that appropriate revisions are needed to increase the strength of evidence for the paper's claims. Concerns were raised about a lack of statistical rigor in the statistical analyses used. Results of statistical tests were not consistently provided (i.e., statistic applied, value of statistic, degrees of freedom, p-value), and seemingly inappropriate statistical tests were used in some instances. Also, some comparisons had lower statistical power than others. When clarifying the statistical approaches used in the manuscript, we also encourage you to consider reading this article that outlines common statistical mistakes (Makin TR, Orban de Xivry JJ. Ten common statistical mistakes to watch out for when writing or reviewing a manuscript. Elife. 2019 Oct 9;8:e48175. doi: 10.7554/eLife.48175.), such as the importance of not basing conclusions on a significant p-value for one pair-wise comparison vs a non-significant p-value for another pairwise comparison (i.e., groups that are being compared should be included in the same statistical analysis, and interaction effects should be reported when appropriate). We hope that you find this information to be helpful should you decide to submit a revised manuscript to eLife.
Reviewer #1 (Recommendations for the authors):
(1) Standardize TRAP+ quantification across Figure 1.
Please report TRAP+ cell numbers using consistent metrics (e.g., density or percentage) to enable comparison across cell types. In addition, extend the TRAP+ reactivation analysis in Figure 1H to include abDGCs so that reactivation dynamics can be compared directly between mGCs and abDGCs.
Reply in Public Review
(2) Clarify whether dorsal or ventral DG was analyzed in Figure 2.
The differing anatomical distributions of TRAP+ cells under low- and high-demand conditions raise important questions about DG axis specificity. Please indicate whether analyses were performed in dorsal DG, ventral DG, or both, and provide data or justification accordingly.
Reply in Public Review
(3) Acknowledge limitations of the tamoxifen-chow labeling strategy in AsclCreER; hM4 experiments.
Since tamoxifen chow administered over 4-7 weeks labels a heterogeneous abDGC population spanning a broad age range, this approach does not generate birth-dated cohorts. This limitation should be clearly addressed in the text and interpretations, particularly related to cell age-dependent effects, should be tempered.
Reply in Public Review
(4) Revise DREADD quantification using HA rather than mCitrine.
The hM4 mouse line requires HA immunostaining to accurately identify Ascl-lineage cells expressing the DREADD receptor. Because mCitrine is not specific to adult-born neurons and does not reliably reflect hM4 expression, quantification based on mCitrine should be revised.
Reply in Public Review
(5) Include markers to assess abDGC maturation state.
Adding quantification of DCX and NeuN would help define the developmental stage of abDGCs in key experiments and improve the interpretation of cell-age-dependent effects.
Reply in Public Review
(6) Clarify DG layer boundaries and terminology in Figure 2.
If the metric labeled "Distance from the hilus" corresponds to the subgranular zone (SGZ), using SGZ terminology would prevent confusion. Additionally, please provide clearer delineation of DG and hilus borders in sample images.
Reply in Public Review
(7) Provide missing cell number data for Figures 2B and 2C.
Reply in Public Review
(8) Clarify the tamoxifen administration protocol in Figure 6.
Please describe how the protocol selectively targets 6-7-week-old abDGCs and how it differs from the chow-based approach. This will help readers understand the intended specificity of the manipulation.
Reply in Public Review
Reviewer #2 (Recommendations for the authors):
(1) EdU birth-dating timeline
The manuscript would benefit from a clearer description of the EdU birth-dating timeline, ideally with a schematic similar to that provided for BrdU in Supplementary Figure 1.
We appreciate the suggestion. However, we did not include a separate schematic for EdU because its use and birth-dating logic are identical to BrdU (both are thymidine analogs administered systemically and incorporated during S-phase). Therefore, the timeline shown in Supplementary Figure 1 applies equally to both markers. We have clarified this point in the Methods section to avoid confusion.
(2) Clarity of TUNL task description.
The description of the TUNL task, particularly for readers unfamiliar with touchscreen-based paradigms, is difficult to follow without consulting prior literature. A simplified schematic or a clearer step-by-step explanation in the main text or supplementary material would improve accessibility.
We note that the main steps of the TUNL protocol are illustrated in Figure 1A, Supplementary Figure 2A and 2B. Nevertheless, we agree that the description in the text can be made clearer for readers less familiar with touchscreen-based tasks. Thus , we have now revised the Methods section to provide a clearer step-by-step description of the TUNL.
(3) Influence of outliers in Figure 1G.
In Figure 1G, the reported trend that ~1% of 25-39-day-old abDGCs are TRAP+ during LS trials appears to be driven by a small number of outliers. This should be acknowledged, and the wording of the conclusion moderated to reflect the variability in the data.
We agree with the reviewer that the apparent outliers reflect the inherent sparsity of TRAP labeling in this population. In absolute terms, this corresponds to between 0 and 2 TRAP⁺ 25–39-day-old abDGCs per mouse, such that the presence or absence of a small number of labeled cells can appear as outliers when expressed as a percentage. We have revised the text to acknowledge this (see Results).
(4) Presentation of learning curves.
Rather than focusing primarily on "days before criterion" (DBC), it would be helpful to show full learning curves across the entire training period. This would provide a clearer picture of acquisition dynamics and inter-animal variability.
We agree that learning curves can be informative in many behavioral paradigms. However, in our protocol, mice do not undergo the same number of training days because training stops individually once each animal reaches criterion. As a result, plotting full learning curves would produce trajectories of different lengths, making group comparisons difficult and visually cluttered. For this reason, we aligned animals based on days before criterion (DBC), which allows direct comparison of learning dynamics relative to task acquisition. We also consider the cumulative probability representation to be the most appropriate way to summarize learning progression across animals in this context which are also included in the figures.
(5) Clarification of Figure 3B labeling
In Figure 3B, the identity of the orange-labeled group above the LS condition is unclear. Clarification in the figure legend would improve interoperability.
Figure 3B includes two experimental groups. One group performed both the large- and small-separation conditions; this group is shown in orange and labeled LS. Within this group, the upper orange trace corresponds to performance in the large-separation condition, while the lower orange trace corresponds to performance in the small-separation condition. The second group is a control group that performed only the large-separation configuration, and therefore only a single green trace is shown. We agree that this distinction was not sufficiently clear and have revised the figure legend and text to clarify the identity of each trace.
Reviewer #3 (Recommendations for the authors):
(1) Please label figures and, even better, put the legends on the same page.
(2) Just to confirm, in establishing the task, mice performed above 70% for the small separation trials in one of the sessions on 2 consecutive days, for each criterion? Performance seems to be below 70%.
Yes. To meet the criterion, each mouse had to reach ≥70% correct performance in at least one of the two daily sessions on two consecutive days. We then averaged the performance across both sessions for each of those days. As a result, if one session was ≥70% but the other was lower, the daily average could fall below 70%. The values shown in the figure correspond to these daily averages, further averaged across mice.
(3) mGC needs to be explicitly defined. Am I assuming any non-birthdated GC is an mGC according to the authors? (which means it is unknown whether they are in fact mature, though likely most of them are).
In this study, “mature granule cells” (mGCs) refer operationally to granule cells that are not birth-dated with BrdU or EdU and therefore are not classified as adult-born neurons within the defined labeling window. We agree that this population is not directly age-defined, and that while the majority are expected to be mature based on their birth timing relative to the labeling period, we cannot exclude the possibility that a small fraction may include younger, unlabeled neurons. We have now explicitly defined this usage of mGCs in the Methods and clarified this point in the text to avoid ambiguity.
(4) Methods state that Kruskal-Wallis tests were used when more than 3 groups were compared, but I don't see these stats presented (e.g., for trap data in Figure 1, blade x task TRAP expt in Figure 3 (should be 2-way RM anova here and elsewhere), etc) or any corrections for multiple comparisons. I appreciate that the mean rates of TRAPed abGCs are higher in the S and LS groups than in the shaping group, but most mice do not have any BrdU+ cells that are also TRAPed, and there are no statistics here to support the claim. I don't think there is enough sampling to accurately quantify activation of abGCs. Also, no stats to support the claim that TRAPing increases at the "tip of the SB after the more demanding LS task".
We agree with this comment. We have now systematically tested all datasets for normality (by group) and applied parametric tests when the data met normality assumptions, and non-parametric tests otherwise. The statistical analyses have been revised accordingly. We added the appropriate tests (including two-way ANOVA where relevant, such as for blade × group comparisons) and now report full statistics in the figure legends and results sections. For the TRAP analyses in adult-born DGCs, we explicitly acknowledge the very low number of BrdU⁺/TRAP⁺ cells, which limits statistical power and, in some cases, precludes robust statistical testing. These limitations are now clearly stated in the Results and Discussion, and the corresponding interpretations have been tempered. For all Kruskal–Wallis tests, post hoc pairwise comparisons were performed using Dunn’s test, with Bonferroni correction for multiple comparisons, as now specified in the Methods section. We also expanded the Methods to describe the statistical workflow in detail. In addition, we have added the previously missing statistical analysis for Figure 2C. Comparisons were performed between the 0–50% and 50–100% portions of the blade, where 0% corresponds to the apex and 100% corresponds to the distal tip of the blade.
(5) Figure 3I: I can't figure out which effect is statistically significant here (what does the asterisk signify?). Why no individual data points in this graph?
We agree that the absence of individual data points reduced interpretability, and we have now updated the figure to include individual data points to better illustrate data distribution and variability.
(6) The gradient of activity (shap < S < LS) could be due to how long they've been trained on a given stage (e.g. less activity during shaping because they have habituated, and neurons encoding that task phase have already been selected)
We agree that task duration and habituation could, in principle, influence activity levels. Under this interpretation, higher activity would primarily reflect task novelty rather than cognitive demand. However, our data do not support this explanation. Specifically, we found no correlation between the number of training days required to reach criterion and c-Fos–positive or TRAP-positive cell density within a given stage. Thus, animals that reached criterion rapidly did not show higher activity levels than animals that required more days of training and were presumably more habituated to the task demands. This suggests that the observed activity gradient (shaping < S < LS) is not driven by exposure duration or habituation, but rather reflects differences in cognitive demand across task stages.
(7) The TRAP+ EDU+ cell in Figure 3 looks odd because the BrdU signal is (a lot) larger than the TRAP signal, but BrdU is in the nucleus and should be smaller.
We agree that the example in Figure 3 is not optimal. In dividing cells, BrdU/EdU signals can sometimes appear broader or closely apposed, which may affect their apparent size.
(8) For the Ascl-HM4Di experiment, HM4Di appears to be expressed in all of the areas of the granule cell layer where abGCs are NOT located (i.e. no expression in the deep cell layer, near the sgz). This is problematic because it suggests perhaps abGCs are not inhibited as expected.
As noted in our response to Reviewer #1, we did not use the mCitrine to localize the DREADD receptor as it has been demonstrated that mCitrine expression is expressed in a Cre-independent manner and not correlated with hM4Di expression. In the revised manuscript we include a representative image were we performed immunostaining using an HA antibody to directly visualize hM4Di and confirm its expression in adult-born granule cells (Figure 5).
(9) Line 267: "6-7 week old neurons by themselves do not influence either the performance of mice in the task". I don't think this is fair because this experiment wasn't designed with as much power to detect an effect. The group trends are in the same direction, but there are many fewer mice in this experiment (n=6/group) than in the =<7w experiment (n=11/group), where the effect just reached statistical significance.
We are sorry for this confusion which came from an incorrect version. The experiment shown in Figure 6 does not target 6–7-week-old neurons specifically. It uses the same tamoxifen chow–based protocol as Figure 5, but with a shorter exposure (4 weeks vs. 7 weeks), thereby labeling a younger and more restricted cohort of adult-born DGCs. By contrast, Figure 4 targets a more mature population, consisting predominantly of ~5-week-old adult-born neurons as well as mature granule cells (Dock10+).
We have corrected the paragraph accordingly and clarified the age range of the labeled populations in the revised manuscript.
Reviewer #2 (Public review):
Summary:
Prior work identified TMEM30B (knockout mice) as well as ATP8B1 (human genetics and mouse model), ATP8A2 (knockout mice), and ATP811A (human genetics) as relevant for hearing. The authors also reasoned that, given the recent discovery of TMC1 and TMC2's dual function as mechanotransduction channels of the inner ear and as lipid scramblases, a counterpart flippase should be in the sensory hair-cell stereocilia bundle where mechanotransduction happens. They use CRISPR/CAS to modify the endogenous mouse genes and add an HA tag at the N-terminus of the ATP8B1, ATP8A1, ATP8A2, and ATP11A proteins. Their experiments with these mice unambiguously localized ATP8B1 at the base of outer hair cell stereocilia bundles. Knockout of ATP8B1 results in loss of outer hair cells, deficient auditory function (ABR), and degeneration of outer hair cell stereocilia bundles. Similarly, hair cells from genetically modified mice with endogenous HA-tagged TMEM30B proteins show localization of this protein to outer hair cell stereocilia bundles. TMEM30B knock-out mice phenocopy the ATP8B1 knock-out model. Interestingly, the authors show that annexing V staining precedes hair cell loss in ATP8B1 and TMEM30B knockout mice and that proper localization of these proteins is lost in mice that lack CIB2, a protein essential for hair cell mechanotransduction.
Strengths:
(1) Use of knock-in HA-tagged proteins, rather than antibody staining, to unambiguously localize ATP8B1 and TMEM30B.
(2) Systematic characterization of auditory function (ABR), hair cell loss, and hair-cell stereocilia bundle morphology.
(3) Advances our understanding of the role played by lipid homeostasis in auditory function.
(4) Reports on mouse models that will be helpful to further understand the mechanistic role played by ATP8B1 and TMEM30B in normal hearing and hereditary deafness.
Weaknesses:
(1) Are the HA tags causing any functional issues? Function and localization of tagged proteins can sometimes be compromised. It would be good to know, for each knock-in model (TMEM30B, ATP8B1, ATP8A1, ATP8A2, and ATP11A ), whether the HA-tagged protein is causing any issues with the mice and particularly with hearing (ABRs). Are these mice normal? Can they hear? These data are missing.
(2) Following on the point above, is it possible that ATP8B1-HA is well localized, but localization for the other three flippases (ATP8A1-HA, ATP8A2-HA, and ATP11A-HA) is compromised by the tag? Is this potential mislocalization causing any functional phenotypes? (ABRs of point 1). I find it surprising that there are flippases only in outer hair cells, and only formed by ATP8B1. A possible explanation is that the tag is interfering with trafficking. If so, there should be a phenotype (ABRs), although this might be masked by redundancy among these flippases or caused by systemic issues (admittedly difficult to sort out). Given that this manuscript will likely become foundational, and that there is evidence that at least two of the other flippases are involved in hearing loss, it would be good to provide more information about the mice and HA-tagged proteins in the other knock-ins (ATP8A1-HA, ATP8A2-HA, and ATP11A-HA). Depending on the data available for the knock-ins, the authors may want to discuss these scenarios and soften the statement indicating that inner-hair cells may lack flippase activity altogether.
(3) Expression of ATP8B1 at P0 (Figure 1D), when there should not be protein in outer hair cells yet, seems high. Does this mean that other cells in the cochlea also express ATP8B1? Is this a concern?
(4) Fluorescence scales in Figure 6 B and D and Figure 7 B and D are very different. So are the values for WT. One would expect that the WT would be similar in all cases (at least within the same compartments), given that the methods section indicates that "All images were collected using identical acquisition parameters, including zoom and laser power, across genotypes". If WT shows such variability, how can we compare?
Author Response:
Summary of Planned Revisions:
We will clarify the qPCR methodology and interpretation to address potential misunderstandings.
We will assess hearing in the generated HA-tagged mouse lines and, where appropriate, include a properly powered ABR analysis in the revised manuscript.
We will address concerns regarding the z-stack in Figure 1f.
We will include additional quantification for Figure 7B to strengthen the analysis.
We will revise the relevant statement to read: “No IHC stereocilia-enriched P4-ATPases were detected under the conditions examined.”
While we appreciate the suggestion to examine TMEM30B localization on the ATP8B1 KO background, this is not feasible within a reasonable timeframe; we will clarify this limitation in the manuscript.
We will incorporate relevant prior work (e.g., George and Ricci, 2026) demonstrating minimal Annexin V labeling prior to P6 and lack of PS externalization in TMC1/2 double knockout models.
We will clarify that hearing thresholds for TMEM30B-HA and ATP8B1-HA lines will be addressed in this study, while additional HA-tagged flippase lines (ATP8A1, ATP8A2, ATP11A) are part of ongoing work to be reported separately.
We will soften statements regarding HA-tag insertion and clarify that, to our knowledge, localization and function are not disrupted, while acknowledging this as a potential limitation.
We will revise the Methods section to clarify differences in fluorescence measurements across experiments.
In addition to the experiments in response to reviewer’s suggestions, we will add the following data that we have generated while the paper was in review:
Distortion product otoacoustic emission (DPOAEs) of the Atp8b1 KO and Tmem30b KO mice. Consistent with OHC function, their DPOAEs thresholds were elevated.
Public Reviews:
Reviewer #1 (Public review):
(1) Figure1D.
The authors should clarify how the qPCR data were normalized and specify the reference (housekeeping) genes used. This information is necessary to evaluate the robustness and comparability of the gene expression data.
We thank the reviewer for this comment. qPCR data were normalized to GAPDH as the reference (housekeeping) gene. We will clarify this in the Methods section to ensure transparency and reproducibility.
(2) Figure 1F.
The lack of F-actin staining at the hair cell base raises the possibility that the permeabilization conditions may have limited antibody access to certain membrane regions. This is especially important given that the authors used a gentle permeabilization agent such as saponin to preserve membrane integrity. Because the authors conclude that ATP8B1 and TMEM30B are localized "almost exclusively to OHC bundles and the apical membrane, with minimal staining in the remaining plasma membrane," (line 128). Including co-labeling with a plasma membrane marker or more comprehensive F-actin visualization of lateral and basal regions would help ensure that the restricted localization is biological rather than technical. In the absence of such controls, the localization claim may be somewhat overstated and should be tempered accordingly.
We appreciate this important point. The image shown represents a single z-slice from a larger stack, and the hair cell body lies outside the plane of this section. To clarify this, we will revise the figure presentation. Specifically, we can provide the full z-stack (already available via OSF) and/or replace the image with a resliced whole-mount view to better visualize the full cellular context.
In terms of the possibility that the lack of staining in the hair cell’s plasma membrane might be due to insufficient antibody penetrance, we routinely perform Prestin (located in OHC plasma membrane) staining after saponin-mediated permeabilization and have never experienced antibody accessibility issues. Nevertheless, we will perform co-labeling for Prestin and include in the new submission.
(3) Figure 7B.
Although quantification of ATP8B1-HA intensity at the bundle appears similar between WT and Cib2 KO samples, the representative image suggests that some bundles lack detectable labeling. To better capture phenotype variability, it would be helpful to include an additional quantification showing the fraction or number of bundles with detectable ATP8B1-HA signal in Cib2 KO mice.
We thank the reviewer for this suggestion. To better capture variability, we will include an additional quantification measuring the fraction of hair cell bundles with detectable ATP8B1-HA and TMEM30B-HA signal per field of view. This analysis will complement the existing intensity-based quantification.
(4) Lines 346-349
The manuscript suggests that IHCs lack stereocilia-enriched P4-ATPases. However, this conclusion is not directly supported by the presented data. The authors should either provide supporting localization or expression data for other P4-ATPases or soften the statement to indicate that no stereocilia-enriched P4-ATPases were detected under the conditions examined.
We agree with the reviewer and will revise this statement to read: “No IHC stereocilia-enriched P4-ATPases were detected under the conditions examined.”
Recommendations:
(5) The authors convincingly demonstrate that TMEM30B loss results in ATP8B1 mislocalization. While not essential to the central conclusions, examining TMEM30B localization in ATP8B1 KO hair cells would clarify whether this interdependence is reciprocal, as described for other P4-ATPase-CDC50 complexes.
We appreciate this insightful suggestion. However, performing this experiment would require generating a compound mouse line (crossing TMEM30B-HA into the ATP8B1 knockout background), which is not feasible within the revision timeframe. Additionally, the lack of a robust commercial antibody for TMEM30B further complicates this approach. We will note this as a future direction in the revised manuscript.
(6) Lines 359-374.
The discussion of Annexin V labeling is careful and balanced. This paragraph would benefit from referencing other studies that showed minimal Annexin V labeling in healthy P6 organ of Corti, reinforcing that robust PS externalization in the present study is pathological rather than developmental.
We thank the reviewer for this suggestion and will incorporate relevant prior work, including George and Ricci (2026), which demonstrates minimal Annexin V labeling prior to P6, and further supports our interpretation.
(7) Lines 392-399.
The proposed feedback model linking MET activity and ATP8B1-TMEM30B localization is compelling. The discussion could be strengthened by noting that in TMC1/2 double knockout hair cells, PS externalization is not observed, consistent with the idea that flippase activity becomes critical specifically when scrambling occurs. The mislocalization observed in Cib2 KO hair cells further supports the coupling between TMC-mediated scrambling and flippase-mediated membrane restoration.
We agree and will expand the discussion to include that TMC1/2 double knockout hair cells do not exhibit phosphatidylserine externalization, supporting the idea that flippase activity becomes critical in the context of scrambling.
Reviewer #2 (Public review):
Weaknesses:
(1) Are the HA tags causing any functional issues? Function and localization of tagged proteins can sometimes be compromised. It would be good to know, for each knock-in model (TMEM30B, ATP8B1, ATP8A1, ATP8A2, and ATP11A), whether the HA-tagged protein is causing any issues with the mice and particularly with hearing (ABRs). Are these mice normal? Can they hear? These data are missing.
We thank the reviewer for raising this important point. In this study, we will focus on TMEM30B-HA and ATP8B1-HA mouse lines, while additional HA-tagged flippase lines (ATP8A1, ATP8A2, ATP11A) are part of ongoing work to be reported separately.
Both TMEM30B-HA and ATP8B1-HA mice are viable and exhibit normal breeding and aging. Preliminary (pilot) ABR measurements indicate wild-type–like hearing thresholds. We agree that this is important and will attempt to raise sufficient mouse numbers (in the time given) for a properly powered ABR analysis in the revised manuscript.
(2) Following on the point above, is it possible that ATP8B1-HA is well localized, but localization for the other three flippases (ATP8A1-HA, ATP8A2-HA, and ATP11A-HA) is compromised by the tag? Is this potential mislocalization causing any functional phenotypes? (ABRs of point 1). I find it surprising that there are flippases only in outer hair cells and only formed by ATP8B1. A possible explanation is that the tag is interfering with trafficking. If so, there should be a phenotype (ABRs), although this might be masked by redundancy among these flippases or caused by systemic issues (admittedly difficult to sort out). Given that this manuscript will likely become foundational, and that there is evidence that at least two of the other flippases are involved in hearing loss, it would be good to provide more information about the mice and HA-tagged proteins in the other knock-ins (ATP8A1-HA, ATP8A2-HA, and ATP11A-HA). Depending on the data available for the knock-ins, the authors may want to discuss these scenarios and soften the statement indicating that inner-hair cells may lack flippase activity altogether.
We appreciate this concern. To our knowledge, the HA tag does not appear to disrupt localization or function of the tagged proteins. However, we agree that this cannot be fully excluded. We will therefore soften our conclusions about IHC flippases and clarify that additional flippases (ATP8A1, ATP8A2, ATP11A) are under investigation and will be described in a separate study.
(3) Expression of ATP8B1 at P0 (Figure 1D), when there should not be protein in outer hair cells yet seems high. Does this mean that other cells in the cochlea also express ATP8B1? Is this a concern?
We thank the reviewer for this observation. We interpret the elevated signal at P0 as reflecting transcription preceding detectable protein expression. While expression in other cochlear cell types is possible, we have not observed detectable ATP8B1 localization outside hair cells using the HA-tagged model. We will clarify this point in the manuscript.
(4) Fluorescence scales in Figure 6 B and D and Figure 7 B and D are very different. So are the values for WT. One would expect that the WT would be similar in all cases (at least within the same compartments), given that the methods section indicates that "All images were collected using identical acquisition parameters, including zoom and laser power, across genotypes". If WT shows such variability, how can we compare?
We appreciate the need for clarification. Identical acquisition parameters were maintained within each experiment used for direct comparison (e.g., within a given panel). However, different panels (e.g., Figures 6B vs. 6D) were acquired on different days using different imaging settings.
We will revise the Methods section to explicitly state this and clarify that comparisons are intended only within panels, not across experiments.
On 2020-03-25 11:59:06, user Ned wrote:
Can you share the sequence of the modified spike protein? The stabilized soluble protein with the his tag. I could not find it. Thanks
On 2021-09-15 03:48:48, user David Epperly wrote:
PART1<br /> While mRNA and other vaccines may create a very diverse polyclonal antibody response, encountering the virus often results in more diverse immune response because the mRNA usually does not create proteins for all aspects of the virus to include all of the S/RBD, N, E proteins. Most mRNA vaccines are designed to create a currently-thought best set of proteins to stimulate immune response. For example, the Moderna and Pfizer vaccines approved in December 2020 encode the entire spike that includes the highly important S/RBD proteins. These mRNA vaccines do not encode the Envelope or Nucleocapsid proteins and thus antibodies to those are not developed. With antigen level and all other things being equal, the RBD neutralizing effectiveness would likely be equal between natural infection and vaccine response. However, all other things being equal, the natural infection response would tend to be more protective because the more diverse immune response would be more likely to "tag" the virus for phagocytosis and other complement immune response..
PART2<br /> If the antigen level profile over time was held identical between vaccine and natural infection, natural infection would have a more diverse and thus more protective result. For natural infections where more antigen developed during exponential replication before adaptive immune response than is the case with vaccine, it is likely that a stronger immune response and better protection would develop as a result of natural infection. In the case of a natural infection exposure with lower antigen levels than that provided by vaccine, the greater natural infection immune response diversity would be offset by a lower overall level of antigen providing activation of adaptive immune response, and would likely result in lower protection than the vaccine response.
PART3<br /> Said another way, it is likely that asymptomatic or lightly symptomatic natural infections that have symptoms more mild than the typical 1 day dose 2 side effects of myalgia, fatigue, chills/fever, etc., will result in lower protection than the vaccine. Natural infections with greater symptoms than the dose 2 side-effects are likely to have stronger protection than the vaccine. And, with all of this, there is also some bias in favor of natural infection due to the more diverse immune response. This will not always be the individual case, but over a broad population, this correlation would likely exist.
The finding in this epidemiological study is consistent with what would be expected given immunological understandings.. Given the typical symptoms that follow a personally observed and/or clinically diagnosed mild infection, most asymptomatic infections, which may result in less protection than vaccine, are typically not observed / diagnosed and therefore the individual is unlikely to make a claim of natural infection, which further strengthens the case that observed / diagnosed natural infections would most often lead to better protection than the vaccine.
On 2020-02-14 11:34:58, user Igor Nesteruk wrote:
Dear friends,
On February 13 I have found tree different values of the cumulative number of confirmed cases (number of victims Vin my paper) on the official site Chinese National Health<br /> Commission:
46551; 59805 ; 59493
and the communications that they have changed the principle of cases
registration:
1) As of 12 February 2020, numbers
include clinically diagnosed
people not previously included in official counts. The definition of a
confirmed case changed to include clinically diagnosed people who had not yet
been tested for SARS-CoV-2.
2) Starting from February 12th, confirmed cases are now considered by officials as both tested confirmed cases as well as clinically diagnosed cases. All
percentage values that have this note tag, are calculated using the confirmed
cases values which are the sum of both the tested and clinically diagnosed
values. Thus any very large percentage value changes seen from the marked
percentage when compared to previous percentage values are caused by this.
I have put the new points (crosses) on the plot see attached file. I
think further statistical analysis is impossible. Please let me now, if you
have some recommendations.
Best regards,<br /> Igor
PS. Unfortunately, I cannot put any plots here. You can fint it on Research gate
On 2021-10-10 10:09:22, user kdrl nakle wrote:
Factors that drive that disparity? Obviously rag-tag American healthcare system that has little to offer to anybody outside urban areas unless they belong to elites.
5. HLS ABR (CDN, Transcoder Node)
Замечания те же, что и к 1 и 2 HLS.
За основу просьба взять WebRTC ABR, показать что транскодинг на Транскодер - ноде, Edge пулит стрим с Транскодер, на Edge происходит конвертация HLS ABR.
4. HLS ABR (CDN, Edge Transcoding)
Замечания те же что и к диаграммам 1 и 2 HLS.
Также просьба взять за пример WebRTC ABR, где показано что вначале идет транскодинг по профилям, и далее конвертация в ABR.
Author Response:
The following is the authors’ response to the original reviews.
Reviewer #1 (Public review):
The presentation and especially main-text illustrative material seem to focus disproportionately on MacAB-TolC-YbjP complex, and the AcrABZ-TolC-YbjP is relegated to supplementary data which is somewhat confusing. There is no high-resolution side view of the AcrABZ-TolC-YbjP side-by-side to MacAB-TolC-YbjP which may be helpful to spot parallels and differences in the organisation of the two systems.
This was previously presented in Supplementary Figure S2. However, because the models were shown at a small scale, we have now included the comparison in a main manuscript (Figure 4). This figure presents AcrABZ-TolC-YbjP and MacAB-TolC-YbjP side-by-side, a structural alignment of TolC-YbjP in the two pumps, and close-up views of the interaction interface.
Supplementary Figure 2 may also be better presented in the main text, as it shows specific displacements of residues upon binding of the YbjP relative to the apo-complexes, although this can be left at the authors' discretion.
We added more text to describe the displacements of residues upon YbjP binding: ‘Nonetheless, the side chains of a few residues in TolC, which mainly correspond to positively charged amino acids (R18, R24, K214, R227, R234), reorient to interact with the YbjP lipoprotein partner (Figure 2B).’
Reviewer #1 (Recommendations for the authors):
The work is of high quality and requires minimal modifications, which are mentioned as suggestions above and are mostly connected to the illustrative material.
One additional suggestion, which is connected to the earlier BioRxiv preprint, the data seen in Fig 6 of the preprint seems to have been edited out from the current version, and perhaps can be included in a revised version, as it seems to support the "rapid adaptation under stress" role for YbjP, which currently is only speculatively mentioned in p.11, line 365 of the manuscript.
We acknowledge that the BioRxiv preprint Figure 6 can support the rapid adaptation under stress role for YbjP. However, upon sequencing the ΔybjP strain from the Keio collection used in the preprint, we identified a large deletion in the yecT-flhD region. We therefore generated a new ΔybjP strain without the yecT-flhD deletion and repeated the experiment. However, the results with the corrected strain did not support the previous conclusion, and these data were consequently removed in the current manuscript.
Reviewer #2 (Public review):
In Figure 3C, the experiment performed with AcrA is clear and the extra band appears at the proper size. On the right panel, it is clear that the crosslink doesn't work when pBPA is placed on residues too far from TolC. Only when introduced on N113 or T110 does a band appear.
This is in accordance with an interaction in vivo. Nevertheless, 17 + 54 = 71kDa, which is more than the two bands appearing on the gel. This difference in size migration can occur, but it is not clear when looking at Figure S3. In Figure S3a, the purified proteins are highlighted at approximately the expected size (≈20kDa instead of 17 for YbjP and between 56 and 60kDa in two bands for TolC instead of 54kDa). On the right panel, it seems that the bands are present exactly at the same position, instead of an upper band as expected for the crosslinked YbjP-TolC (at 71kDa). It would be clearer if having the control of the same sample without illumination, revealed by anti-TolC, to see the difference.
We thank the reviewer for pointing out this discrepancy. We identified an error in the molecular weight ladder, as one band was missing. This has now been corrected: YbjP migrates just below 17 kDa, consistent with Figure 3C. In addition, we previously reported a size of 54 kDa for TolC, whereas matured TolC, after signal peptide cleavage, is actually 52 kDa.
We believe that the differences in the apparent molecular weight observed in Figures 3A, 3C and S3 (now S2) mainly result from tagging and post-translation modifications.
In Figure 3A, we used the soluble construct His-YbjP<sub>28-1711</sub> (theoretical M<sub>w</sub> ~18 kDa), as also done for the controls in Figures 3C and S3 (now S2). However, for the crosslinking samples, we used full-length His-tagged YbjP, which carries a post-translational lipid modification (theoretical M<sub>w</sub> ~19 kDa, considering the protein lipidation). The presence of the lipid chains alters the migration as this species migrates at ~15 kDa (Fig 3A). Increased hydrophobicity, due here to YbjP lipidation, could accelerate the migration (Emmanuel et al. 2025 FEBS Open Bio).
In Figure 3A, we used the TolC-FLAG whose apparent M<sub>w</sub> is ~52 kDa, as previously reported (Fig S3, Fitzpatrick et al. 2017). In Figure S3 (now S2), we used His-tagged TolC (theoretical M<sub>w</sub> 55 kDa) for the control, which migrates above 56 kDa. In the crosslinking samples, however, we detect tag-free, endogenous TolC, with a theoretical M<sub>w</sub> of ~51 kDa.
In conclusion, the crosslinked complex composed of lipidated FL YbjP (~15 kDa) and endogenous TolC (~51 kDa) would be expected to migrate at ~66 kDa, which is consistent with what is observed in Figures 3C and S3 (now S2).
A second point that could be discussed further is the comparison of the structure of the pump in the presence of the peptidoglycan with the images previously obtained by tomography. It is not totally clear to me if YbjP could have been positioned in these maps.
There is density corresponding to YbjP in the map obtained in the presence of peptidoglycan. To improve clarity, we have specified the location of the peptidoglycan relative to the pumps in the revised Figure 4, and Supplementary Figure S4, together with the position of YbjP. In both figures, the lipoprotein appears distant from the peptidoglycan density.
Reviewer #2 (Recommendations for the authors):
In addition, please add explanations in the legend of Figure 3C concerning the structures.
We added the following description of the structures: ‘As shown underneath, AcrA residues Q136 and Y137, proximal to TolC in the structure of the AcrABZ-TolC pump (PDB 5NG5), were replaced by pBPA. For YbjP, the two residues N113 and T110 proximal to TolC in the MacAB-TolC-YbjP complex (PDB 9QGY) and the three residues N43, N90 and H104 distal to TolC were mutated.’
It would be clearer if having the control of the same sample without illumination, revealed by anti-TolC, to see the difference.
As the amount of crosslinked material is low, samples were enriched via His-tag purification of YbjP prior to Western blotting. In the absence of illumination (see sample N113, UV-), no crosslink would be formed, and therefore TolC would not be co-purified.
In addition, some typo errors have been noted.
Table S1 minus is missing for the defocus range for AcrABZ-TolC-YbjP.
Thank you for noting the typo. We have added the minus sign.
Table S3, please specify what is N in the legend.
N is the stoichiometry parameter, which is now specified in the table legend.
Line 237, I suppose it has to refer to Figure S6, not S5.
Thank you for noting the error. We have verified the text matches the figures here and in the entire manuscript.
Several errors are present in the legend of Figure 6.
No letters are indicated for the different panels; line 841 must be C, F and I; the indicated colors for the differentially expressed proteins do not correspond to the volcano plots.
Thank you for suggesting the improvements for the labels. We have modified the plot accordingly.
Reference Glavier 2020 has been cited as Glacier on line 72.
We have modified the writing accordingly and checked the reference.
to identify and store VHF signal from a known or unknown tag
"to identify VHF tags and record detection data"
Current wording reads as if the receiver is directly storing the VHF signal, rather than converting it into detection data
Décryptage du porno mainstream et exploration du porno alternatif : L'industrie, les normes et l'impact sur la perception de la sexualité
I. Datagueule #85 : "Datagaule et clitodonnées : le plaisir à la chaîne"
A. L'industrie du porno en ligne : Une domination par les "tubes"
Présentation des données clés de l'industrie du porno en ligne: Trafic, téléchargements, évolution depuis l'arrivée de l'internet haut débit.
Focus sur Pornhub, un des géants du secteur, illustrant l'ampleur du phénomène et la rapidité de consommation.
Ascension de la société MGeek, qui a racheté des studios historiques du X fragilisés par la crise de 2008.
Fonctionnement des "tubes" qui offrent un accès gratuit aux vidéos, impactant les revenus des studios.
B. Le porno mainstream : Des normes et des dérives
Le porno mainstream, majoritairement produit pour un public masculin hétérosexuel et blanc, impose ses normes.
Illustration de ces normes à travers la popularité du tag "lesbien" et la stigmatisation des scènes gays pour les acteurs.
L'émergence du "pro-am" (productions professionnelles d'amateurs) et ses conditions de tournage précaires et parfois dangereuses.
Problèmes liés aux contrats, au consentement et à la difficulté de faire retirer des contenus des plateformes.
Conditions de travail des acteurs masculins : Salaires faibles, recours à des médicaments pour la performance sexuelle et risques associés.
C. Addictivité et tabou : Des idées reçues à déconstruire
L'argument de l'addictivité du porno, souvent utilisé pour la censure, est démenti scientifiquement.
L'Organisation Mondiale de la Santé a rejeté l'ajout du visionnage de pornographie dans sa liste des troubles addictifs.
Le porno, érigé en tabou, échappe aux questionnements légitimes qui entourent les autres productions culturelles.
II. Interview de Camille Emmanuel, journaliste et auteur de "Sex Power"
A. Le regard masculin dominant dans le porno mainstream
L'industrie du porno traditionnellement dominée par une vision masculine, centrée sur le plaisir masculin et la pénétration.
Le porno mainstream reproduit les schémas traditionnels de la sexualité, ignorant le plaisir féminin et la diversité des pratiques.
Le discours dominant sur la sexualité féminine est déconstruit par des études scientifiques sur le clitoris et l'orgasme féminin.
B. L'émergence du porno alternatif : Un contre-pouvoir nécessaire
Le mouvement du porno alternatif initié par des femmes dans les années 80, pour proposer une vision différente de la sexualité.
Ce mouvement, encore niche, met en avant la diversité des pratiques, des corps et des sexualités.
Le porno alternatif se distingue par ses modes de production éthiques, respectueux du consentement et du droit du travail.
C. L'impact du porno sur la perception de la sexualité
Le porno mainstream véhicule une vision normée et limitée de la sexualité, pouvant influencer négativement la perception du public.
Le porno alternatif, en proposant une vision plus diverse et inclusive, permet de questionner les normes et de s'ouvrir à d'autres possibilités.
L'importance de se questionner sur sa propre consommation de porno et de réfléchir à l'imaginaire pornographique proposé aux générations futures.
Résumé de la vidéo [00:00:00][^1^][1] - [00:10:23][^2^][2]:
Cette vidéo explore comment les adolescentes YouTubeuses mettent en scène leur féminité en ligne. Elle présente les recherches de Claire Balle, sociologue, sur les pratiques numériques des jeunes filles sur YouTube.
Points forts : + [00:00:00][^3^][3] Développement de l'identité féminine * Affirmation identitaire en ligne * Étude des vidéos de filles et garçons * Importance des vidéos "je suis bizarre" et "anti-boyfriend tag" + [00:02:47][^4^][4] Proximité et sociabilité * Partage d'expériences personnelles * Attente de soutien des abonnés * Mention fréquente d'autres YouTubeuses + [00:04:46][^5^][5] Utilisation de l'intimité * Validation de l'identité par les pairs * Différences de genre dans l'expression de l'intimité * Sexualité et honte corporelle chez les filles + [00:06:30][^6^][6] Caractéristiques féminines involontaires * Manies et habitudes perçues comme féminines * Exigences dans le domaine amoureux * Perfectionnisme et propreté + [00:07:52][^7^][7] Dramatisation et standardisation * Effets de dramatisation pour représenter la féminité * Standardisation des modes de présentation * Influence des médias et réseaux sociaux
HTML spec forbids putting anything into closing tags (anything after </tag). Yet… everyone parses it just fine.
It would be useful to reference specific parts of the HTML5 parsing algorithm here.